Embed Size (px)
Citation preview

Article
Retinal Conformation Changes Rhodopsin’s Dynamic Ensemble
Nicholas Leioatts,1 Tod D. Romo,1 Shairy Azmy Danial,1 and Alan Grossfield1,*1Department of Biochemistry & Biophysics, University of Rochester Medical Center, Rochester, New York
ABSTRACT G protein-coupled receptors are vital membrane proteins that allosterically transduce biomolecular signals acrossthe cell membrane. However, the process by which ligand binding induces protein conformation changes is not well understoodbiophysically. Rhodopsin, the mammalian dim-light receptor, is a unique test case for understanding these processes becauseof its switch-like activity; the ligand, retinal, is bound throughout the activation cycle, switching from inverse agonist to agonistafter absorbing a photon. By contrast, the ligand-free opsin is outside the activation cycle and may behave differently. We findthat retinal influences rhodopsin dynamics using an ensemble of all-atom molecular dynamics simulations that in aggregatecontain 100 ms of sampling. Active retinal destabilizes the inactive state of the receptor, whereas the active ensemble wasmore structurally homogenous. By contrast, simulations of an active-like receptor without retinal present were much more het-erogeneous than those containing retinal. These results suggest allosteric processes are more complicated than a ligandinducing protein conformational changes or simply capturing a shifted ensemble as outlined in classic models of allostery.
INTRODUCTION
G protein-coupled receptors (GPCRs) are integral mem-brane proteins that serve wide-ranging functions from olfac-tion (1,2) to modulating cardiac response (3). There aremore than 800 GPCRs in humans (4), and they are targetedby a remarkable number of drugs (5–7). These proteinstransmit signals across the cell membrane using an allostericmechanism; ligands binding in the canonical orthosteric sitemodulate receptor conformations such that G proteins insidethe cell can bind the cytoplasmic face of the GPCR.Rhodopsin, the mammalian dim-light receptor, was the firstGPCR to be reported at high resolution (8) and has served asa useful model for understanding the dynamics and functionof other proteins. However, the process by which ligandconformational change is communicated to the protein’sactive site remains poorly understood despite vast biochem-ical and biophysical efforts (9,10). Some hypotheses suggestthat highly conserved motifs in the protein may serve asfunctional microswitches, making concerted transitionsupon ligand binding (10–17), but the details of any such pro-cess remain elusive (15,18,19).
Early discussions of GPCR dynamics were generallyframed in terms of two states (active and inactive) connectedby a single path. Although this view has yielded to a morecomplex understanding of GPCR dynamics, a simplified sin-gle pathway description is still prevalent, despite mountingevidence that suggests this idea is flawed (20–22). The
complexity of GPCR activation is only beginning to beunderstood (20–24). Experimental evidence suggests thatmultiple states and multiple activation pathways may exist(10,20,21,25,26). Additionally, GPCR activity may bemodulated by external factors, such as dimerization (27),membrane environment (28–31), and pH (16,32–34). Evenligands that evoke a functionally similar response mayhave a varied impact on specific residues (21). For example,the b2 adrenergic receptor (b2AR) can sample a diverse rangeof conformational states with variable populations and life-time shifts that depend on the environment and presence ofligands (25).
The subtlety of GPCRs’ functional dynamics presents amajor opportunity for contribution from computationalmethods. Although experimental techniques can probe asmall subset of interesting degrees of freedom, moleculardynamics (MD) simulations capture atomistic-resolutiondetails of the system. As a result, MD simulations can unam-biguously characterize the structural ensemble accessible toGPCRs under different conditions, without the perturbationsof adding probes such as fluorescent dyes.
However, all-atom simulations are so computationallycostly that supercomputers or specialized hardware are oftenneeded, and even then acquiring sufficient statistical samplingis a serious problem. This problem is often underestimated,because even degrees of freedom that interconvert rapidlycan be linked to the much slower dynamics of the entireprotein (35–37). Enhanced sampling methods can improvethe situation, but most advanced methods require the choiceof an informative reaction coordinate, which can be verydifficult to obtain. On the other hand simplified models canbe quite useful (19), but often lack the resolution to answervery specific scientific questions. Because of the large
Submitted February 23, 2015, and accepted for publication June 19, 2015.
*Correspondence: [email protected]
Nicholas Leioatts’s present address is Department of Theoretical andComputational Biophysics, Max Planck Institute for Biophysical Chemis-try, Am Fassberg 11, 37077 Gottingen, Germany.
Editor: Nathan Baker
! 2015 by the Biophysical Society0006-3495/15/08/0608/10 http://dx.doi.org/10.1016/j.bpj.2015.06.046
608 Biophysical Journal Volume 109 August 2015 608–617

datasets and their biomedical relevance, understanding allo-stery in the activation of GPCRs is a topic of intense interest.
In this study, we use rhodopsin as a platform to better un-derstand allostery, exploring the effects of the presence orabsence of retinal on its conformational ensemble.Rhodopsinis unique among GPCRs because of its switch-like behavior;retinal undergoes an 11-cis to all-trans bond isomerizationupon absorption of a photon, making an in situ switch frominverse agonist to agonist and allowing protein activation toproceed. Rhodopsin, togetherwith its apo-form, opsin,makesan effective case for ligand effects on protein dynamicsbecause, unlike most ligand-binding proteins, the apo formlies outside of this functional cycle (Fig. 1).
Crystal structures of opsin show a very active-like confor-mation (38,39), in distinct contrast to functional experi-ments showing that opsin does not efficiently inducedownstream G protein signaling (40). To rationalize thisapparent contradiction, we used MD simulations to produceensembles of conformations for both opsin and rhodopsinusing active-like and inactive-like starting structures. Spe-cifically, we simulated the Metarhodopsin-I (Meta-I) andMetarhodopsin-II (Meta-II) states of rhodopsin, and opsinin both its active-like crystal structure and a hypothesizedinactive-like dark opsin (see Fig. 1 and Table 1). Our resultssuggest that opsin is able to sample a superset of those con-formations accessible to Meta-II rhodopsin. Remarkably,these simulations capture ligand-dependent changes to the
structural ensemble. In Meta-I simulations, both the ligandand the protein are more dynamic.
In the context of allostery, the results are quite nuanced;whereas an active-like apo-protein is more conformationallyheterogeneous, an inactive protein bound to activatingligand is destabilized. In rhodopsin, it appears that theligand has a role beyond that outlined by the conformationalequilibrium model of allostery: it can stabilize one ensembleof conformations and destabilize another, as suggested bymore recent allosteric hypotheses (41–44).
MATERIALS AND METHODS
Simulation details
Four different protein starting structureswere used in the current study. Threewere obtained from x-ray crystal structure data; opsin andMeta-II were usedas is, whereas dark opsin was built by removing the retinal from a crystalstructure of dark-state rhodopsin. The fourth (Meta-I) was taken from thefinal coordinates of the complex-counterion simulation conducted in a previ-ous study (45–47); we assert that this structure resembles the Meta-I state ofthe protein based on the behavior of the Schiff base, as well as the match be-tween the theoretical NMR spectra calculated from this trajectory and exper-iment (46). Six independent systems were then built for each structure, fora total of 24 trajectories (see Table 1). Each structure was embedded in arandomized lipid bilayer containing 123 SDPE (1-stearoyl-2-docosahexae-noyl-phosphatidylethanolamine) molecules, 8200 waters, and 100 mMNaCl (beyond that needed to neutralize the system). SDPE lipids werechosen because polyunsaturated fatty acids and phosphatidylethanolamineheadgroups were experimentally shown to favor the active Meta-II confor-mation (28–31,48,49). We also simulated low-pH conditions, protonatingGlu1343.49 and Glu181EL2. This decision was based on the work of multipleinvestigators (16,32–34,50,51), which suggested such conditions favor acti-vation. Six replicates were run for each protein starting structure, rangingfrom 3 to 4 ms each. Each replicate for a given starting state was assembledusing the same protein structure, but the lipid and water coordinates weregenerated independently using a previously published protocol (52).
The system was simulated in the NPgTensemble using the CHARMM36lipid parameters (53) and CHARMM22 protein parameters (54) withCMAP corrections (55,56). These simulations were begun before SDPEwas specifically parametrized (see 57), and we found that a lateral tensionof 30 dyn/cm was needed to obtain the correct area per lipid (data notshown). Retinal parameters were obtained from Scott Feller (see 58).
This systemwas then subjected toMD using NAMD 2.8 (59), with the Ve-locity Verlet integrator and a 2 fs timestep (60). Bonds to hydrogen were con-strained using theRATTLE algorithm (61). The Langevin piston barostat wascombinedwithLangevin dynamics to produce the correct isothermal-isobaricensemble at 310 K (62,63). The nonbonded cutoff was set to 10 A, whereaslong-range electrostatics were calculated using smooth particle-mesh Ewaldsummation (64) with a 75 ! 75 ! 96 cubic grid (z 1 A/grid point). Thesesimulations were run on the University of Rochester’s BlueGene/P and Blue-Gene/Q computers. The trajectory details can be found in Table 1.
FIGURE 1 Rhodopsin activation cycle. 11-cis retinal is prebound in theinactive dark-state. Absorption of a photon causes 11-cis to all-trans photo-isomerization, and changes retinal from an inverse agonist to agonist. Acti-vation then proceeds through several trappable nonequilibriumintermediates (not all shown) before reaching Metarhodopsin-I (Meta-I).Meta-I exists in equilibrium with the fully active Metarhodopsin-II(Meta-II). The retinal-rhodopsin bond is cleaved and retinal is able to leave,resulting in the apo-protein opsin. Upon rebinding of an 11-cis retinal thiscycle is then ready to be repeated. To see this figure in color, go online.
TABLE 1 Simulation details
System PDB ID Notes Simulation Time (ns)
Dark opsin 1U19 retinal removed 1 !z 3,000, 5 !z 4,000Opsin 3CAP 3 !z 4,000, 3 !z 4,200Meta-I Meta-I (from 45) 6 !z 4,800Meta-II 3PXO 3 !z 4,000, 3 !z 4,200
Total z 101,000 ns
An exhaustive list is available in Table S1.
Biophysical Journal 109(3) 608–617
Retinal Alters Rhodopsin Dynamics 609

Simulation analysis
All simulation analyses were implemented in LOOS (version 2.0.5, loos.sourceforge.net), an open-source simulation development library main-tained by the Grossfield lab (65). Images were rendered using PyMol(version 1.6, www.pymol.org), and data was plotted with gnuplot (version4.6, www.gnuplot.info).
RESULTS
We computed an ensemble of conformations that representdifferent functional states of rhodopsin, finding that retinalplays an important role in modulating the protein’s behavior.Somewhat surprisingly, the ligand’s interaction with theprotein was quite promiscuous. These results provide evi-dence that the rhodopsin system behaves in a manner thatcannot be explained by the classic allosteric model ofconformational selection (66).
Dynamics of experimentally interesting degreesof freedom
Retinal
To understand how retinal impacts rhodopsin’s conforma-tional ensemble, we first investigated how the protein’sstarting state correlated with ligand dynamics. Our previous
work showed that after the 11-cis to all-trans isomerizationretinal became more flexible (46,47,67). Here we extendthat view to understand how all-trans retinal behaves inthe active Meta-II state versus the preactive Meta-I state(Fig. 2) using the new ensemble of simulations outlinedin Table 1.
Previous efforts by several labs have shown that retinalmakes state-specific protein-ligand interactions (68–72).We monitored retinal using three regions of the ligandequivalent to those identified by Brown and coworkers,the orientations of the C5-, C9-, and C13-methyl groups(46,47,73–76). In this analysis, the vectors denoted by thethree arrows in Fig. 2 b (see caption for details) werecompared with the membrane normal (black vector inFig. 2 a) using a simple dot product. (Retinal orientationsfor individual trajectories are available in Figs. S1–S6 inthe Supporting Material.)
The ligand-binding pocket
Because the orientation of retinal’s b-ionone ring wasquite varied whereas the dynamics closer to the covalentlybound Lys2967.43 depended on the protein’s state, it islogical to examine the behavior of nearby aromatic side-chains that interact with retinal, coupling it to the restof the protein. These particularly include Phe2616.44,
FIGURE 2 Retinal dynamics distinguish theMeta-I and Meta-II ensembles. (a) Illustrationshowing rhodopsin in a lipid bilayer. The proteinis shown as a rainbow colored cartoon with theN-terminus colored blue. Lipids are shown in ablack/white ball-and-stick representation (noteseveral lipids are removed for clarity). The blackarrow denotes the membrane normal. The insetshows a close-up view of retinal (purple ball-and-sticks) in the binding pocket. It is covalentlyattached to Lys2967.43 (orange) by a Schiff-base linked nitrogen. (b) Retinal orientations. Amorphed retinal is shown colored as in (a). Itsorientation was monitored using the three vectorsillustrated by yellow, gray, and green arrows. Spe-cifically, we computed the dot-product between avector drawn from either: the C1–C5 atoms(yellow), the C9–C19 atoms (gray), or the C13–C20 atoms (green) and the membrane normal(black arrow in a). This angle was histogrammedover the entire Meta-I (blue data) or Meta-II (reddata) ensemble of trajectories. The average histo-grams are shown below, with error bars represent-ing the standard error. To see this figure in color, goonline.
Biophysical Journal 109(3) 608–617
610 Leioatts et al.

Trp2656.48, and Tyr2686.51, the rotamer toggle switch res-idues. Phe2616.44 shows no discernible trend, but in theMeta-II ensemble the gauche- rotamer had a much smallerpopulation than in the other simulations (Fig. 3 b), whichmay be an impact of the stable ligand conformation (seethe previous section). In Trp2656.48 and Tyr2686.51 theactive-like ensembles (opsin and Meta-II) showed adifferent preferred orientation to the inactive-like ensem-bles (dark opsin and Meta-I). Trp2656.48 (Fig. 3 b, middle)showed a stronger preference for the gauche- rotamer inopsin and Meta-II, whereas dark opsin and Meta-I occu-pied a primarily trans rotamer. As we will show below(see also Fig. 4) this same population ordering—darkopsin, Meta-I, opsin, Meta-II—was seen in measures ofwhole-protein activity. Tyr2686.51 (Fig. 3 b, bottom) alsoshowed a distinction between active-like and inactive-like ensembles.
Cytoplasmic regions
We also monitored the dynamics of two conserved cyto-plasmic motifs: the ionic lock (a salt bridge betweenGlu2476.30 and Arg1353.50) and the NPxxY sequence inTM7 (Fig. 3, c and d). Interresidue distances for the ioniclock are plotted as a function of simulation time inFig. S7. There was only a single transition in this coordinate,in one of the opsin simulations, although there was oneshort-lived opening event in one of the dark opsin runs. Ifwe monitor the ionic lock distance versus the NPxxY motifroot mean square deviation (RMSD) from the inactivestructure, as in previous work (18,77), the picture is very
different. We found that the NPxxY region is quite flexible,especially in the Meta-I ensemble, even though there areno transitions in the ionic lock (Fig. 3 e). By contrast, thelock flickers in dark opsin simulations, but the NPxxYregion is not as flexible. In opsin, there was a single lockclosing event, which did coincide with a decrease in NPxxYRMSD, but the Meta-II ensemble produced NPxxY confor-mations just as close to the inactive structure even thoughthe lock never transitioned.
Whole protein dynamics reveal heterogeneity inopsin and Meta-I
We found that probing only experimentally motivated de-grees of freedom gave an incomplete picture of rhodopsin’sdynamics and thus also explored protein dynamics usingdata-derived methods. First, we introduced a reaction coor-dinate based on the interresidue contacts formed and brokenin our simulations. Instead of analyzing all contacts, welimit this analysis only to those contacts present in eitherthe inactive and active crystal structures, but not both.A smooth tanh function was used to define connectivitybetween two residues, i and j, as uij in the following:
uijðtÞ ¼ 1
2tanh
!rijðtÞ % rc
"þ 1
2; (1)
where rc is a switching distance of 8 A and rij is the distancebetween the two side chains. The contact values were thensummed and normalized such that a value of 1 is obtained
a
b
c
d
e
FIGURE 3 Dynamics of biologically distin-guished structural motifs. (Center) Rhodopsin isshown as a rainbow cartoon embedded in a lipidbilayer. The bottom view shows the protein’s cyto-plasmic face. (a) Illustration showing retinal (whitespheres) in its binding pocket and rotamer toggleresidues: Phe2616.44 (pale yellow), Trp2656.48
(pale violet), and Tyr2686.51 (dark red). (b) Histo-grams of the population of c1 torsion angles foreach of the three toggle switch residues. Data iscolored by the simulation ensemble. (Note: aversion of this figure with error bars is depicted inFig. S8.) (c) Close-up view of the NPxxY motif.(d) The ionic lock. Arg1353.50 and Glu2476.30 areshown forming a salt bridge (left) as in the inactivecrystal structure (PDB ID: 1U19) or in an openconformation (right) as in the active crystal struc-ture (PDB ID: 3PXO). (e) NPxxY motif versusionic lock dynamics. The NPxxY RMSD from theinactive crystal structure (y axis) is shown versusthe ionic lock distance (x axis). Every frame(sampled at a rate of 1 ns) is shown colored ac-cording to ensemble. To see this figure in color,go online.
Biophysical Journal 109(3) 608–617
Retinal Alters Rhodopsin Dynamics 611

when the contacts are exactly those found in the inactivecrystal, and 0 when they are those found in the activestructure. This quantity, the transition value, was monitoredas a function of simulation time, t, as depicted in Fig. 4.Because of thermal fluctuations, values near 1 or 0 are rarelysampled.
Fig. 4 contains data from a previously published (45) con-trol simulation of inactive rhodopsin (black curve); because11-cis retinal totally deactivates rhodopsin, this serves asa base level of conformational heterogeneity. By the timethis control system was equilibrated it had already madean z 0.3 transition along the reaction coordinate (from1.0 to 0.7) simply because of thermal fluctuations.
Considering the two active-like starting structures—opsinand Meta-II—opsin appears to progress to a slightly moreinactive-like state than Meta-II, only in part because of thesingle trajectory that underwent a deactivation event. Thismakes sense given that a range of experimental evidence sug-gests that opsin shows much lower activity than Meta-IIrhodopsin.
Opsin samples a superset of Meta-II conformations
To better understand the conformational heterogeneity inour simulations, we next calculated the principal compo-nents of motion using only the transmembrane a-carbons.(Fig. 5). For this calculation we grouped all 24 trajectoriestogether, so that the resulting eigenvectors form a commonbasis set describing the fluctuations across all four ensem-bles. Fig. 5 a shows the average projection of each simula-tion onto the first principal component. Each curve depicts
FIGURE 4 Contact-based reaction coordinate shows opsin and Meta-Iensembles are more heterogeneous. The average transition is shown forall 24 trajectories as a function of simulation time. This value is calculatedusing Eq. 1, where contacts are computed on a per-residue basis using side-chain centers of mass. Data is averaged over the six independent simula-tions in each of the four ensembles with error bars representing the standarddeviation. The single dark-state simulation from Grossfield et al. (45) isshown for reference. To see this figure in color, go online.
a
b
c
FIGURE 5 Ensemble-based principal component analysis was con-ducted on the transmembrane a-carbons of all 24 trajectories in aggregate,so the results depict how each simulation is projected onto the same basisset. Each of the trajectories used in this analysis is labeled according toits ensemble as shown in the key at the bottom of the figure. (a) Averageprojection of trajectory time course onto principal component one. Simula-tions are grouped by the four starting structures outlined in Table 1. Curvesshow the average across all six trajectories for each ensemble, with errorbars showing the average of the standard deviations in each dataset, toemphasize which trajectories are more heterogeneous. (b and c) Projectiononto the first two principal components. Each data point represents a struc-ture from the ensemble of trajectories (sampled at 1 ns a piece) and coloredaccording to ensemble. The x axis represents displacement along PC1, they axis displacement along PC2. (b) Each ensemble is shown separately onthe same scale. (c) Merged view of the result from (b). Opacity of the pointsshows the time evolution of each independent trajectory. To see this figurein color, go online.
Biophysical Journal 109(3) 608–617
612 Leioatts et al.

the average of all six trajectories from the four differentstarting states.
Principal component 1 (Fig. 5 a) distinguished the activeand inactive structures: the active-like opsin and Meta-IIensembles have similar average displacements, as do theinactive-like dark opsin and Meta-I. However, the opsinensemble had a much larger standard deviation thanMeta-II, indicating more disparity of structures in that data-set, driven at least in part by the simulation where the ioniclock closed. Along the same lines, dark opsin shows smallerfluctuations in this dimension than Meta-I, again consistentwith Fig. 4. Meta-II trajectories also sampled a narrowerrange of conformations. In Fig. 5, b and c we expandedthis analysis to the first two principal components. Everyframe (sample rate ¼ 1 ns) from the 24 simulations wasplotted. Opsin (Fig. 5 b, lower left) sampled a superset ofthose conformations accessible to the fully active Meta-II(Fig. 5 b, lower right). Moreover, opsin had more dynamicrange in PC1 and PC2 and some structures produced byopsin simulations overlapped with the inactive ensembles(Meta-I and dark opsin). Meta-I was also very dynamic—it accounted for the largest displacement in PC2, and pro-duced conformations with displacements that adjoin theactive-like ensembles. These results are also corroboratedby projections onto the first three principal components(see Movie S1).
Although this analysis provided an intuitive way to under-stand the structural variation in our dataset, the biologicalmeaning of these reduced coordinates was less clear. There-fore, we mapped the first two principal component eigen-vectors back onto the structures themselves (Fig. 6). Thedark-state (marine) and Meta-II (dark red) crystal structuresare also shown for reference. The largest contribution toPC1 (Fig. 6 a) comes from the cytoplasmic portion ofTM5 and TM6. The vectors around TM6 in particularappear to connect the inactive and active structures. Bycontrast, PC2 (Fig. 6 b) captures motion reminiscent ofTM5 unwinding and the large variation in the NPxxYregion. In contrast to b2 AR, the motions of TM6 and theNPxxY region may be decoupled in rhodopsin activation.
Opsin and Meta-I explore conformations more rapidly
Visual inspection of Movie S1 shows that opsin and Meta-Iwere not only filling larger volumes in conformationalspace, but at the end of the simulations they were stillspreading out, whereas dark opsin and Meta-II were morecontained. This would suggest that our opsin and Meta-Isimulations were not only more heterogeneous, but werealso expanding more rapidly. To better understand this sub-tle difference, we used a structural clustering algorithm(Fig. 7), where the simulations were separated into k clustersbased on RMSD of the transmembrane a-carbons. Resultsare shown using k ¼ 10 clusters, but were robust whenvarying k from 5 to 50. We included our whole dataset of24 trajectories, with two additional previously published
simulations: the dark-state simulation and a transition simu-lation covering dark-state to Meta-I (referred to as the com-plex counterion trajectory in Grossfield et al. (45)).
Fig. 7 a shows a histogram of the population of eachcluster, color-coded by the starting protein structure. Onceagain, this analysis identifies opsin and Meta-I as very het-erogeneous. Structures produced by the opsin simulations(orange) occupy seven different bins, and those producedin the Meta-I simulations (blue) occupy five bins. Bycontrast, Meta-II and dark opsin occupy four and two clus-ters, respectively; they produced a more homogeneousensemble of structures.
The time course of these conformational changes waseven more revealing (Fig. 7, b–e). Here cluster populationis shown as a function of simulation time, with each ofthe four ensembles depicted separately, but summed overthe six replicas of each system. Because all simulationswithin an ensemble had the same starting structure, weexpect them to occupy the same initial cluster and divergefrom there, as can be seen in all four panels. Dark opsin(Fig. 7 b) occupied three bins, (nominally clusters 0, 1,and 2). The simulations began producing structuresthat fell into cluster 0, but very quickly there was some
FIGURE 6 Mapping principal components back onto structures. (a)Illustration showing PC1. The first eigenvector is projected back onto acartoon representation of the average structure from all 24 simulations.Rhodopsin is shown as a rainbow, with blue indicating the N-terminus.Black sticks project from the ca position in the direction of the first prin-cipal component, with a length proportional to their contribution to themotion. Transparent overlays show the Meta-II (78) (dark red) and dark-state (72) (marine) crystal structures. The top view shows rhodopsin in theplane of the membrane, the bottom view is normal to the membrane fromthe cytoplasmic side. (b) As in (a), except with sticks representing the secondprincipal component of motion. To see this figure in color, go online.
Biophysical Journal 109(3) 608–617
Retinal Alters Rhodopsin Dynamics 613
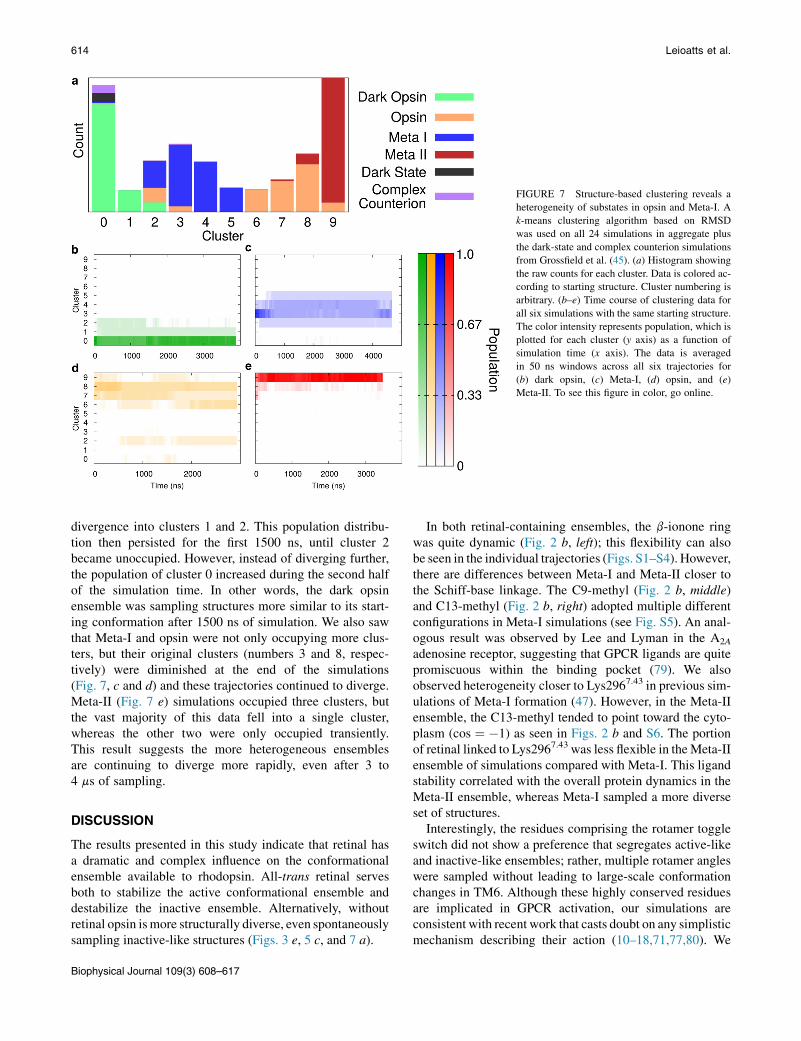
divergence into clusters 1 and 2. This population distribu-tion then persisted for the first 1500 ns, until cluster 2became unoccupied. However, instead of diverging further,the population of cluster 0 increased during the second halfof the simulation time. In other words, the dark opsinensemble was sampling structures more similar to its start-ing conformation after 1500 ns of simulation. We also sawthat Meta-I and opsin were not only occupying more clus-ters, but their original clusters (numbers 3 and 8, respec-tively) were diminished at the end of the simulations(Fig. 7, c and d) and these trajectories continued to diverge.Meta-II (Fig. 7 e) simulations occupied three clusters, butthe vast majority of this data fell into a single cluster,whereas the other two were only occupied transiently.This result suggests the more heterogeneous ensemblesare continuing to diverge more rapidly, even after 3 to4 ms of sampling.
DISCUSSION
The results presented in this study indicate that retinal hasa dramatic and complex influence on the conformationalensemble available to rhodopsin. All-trans retinal servesboth to stabilize the active conformational ensemble anddestabilize the inactive ensemble. Alternatively, withoutretinal opsin ismore structurally diverse, even spontaneouslysampling inactive-like structures (Figs. 3 e, 5 c, and 7 a).
In both retinal-containing ensembles, the b-ionone ringwas quite dynamic (Fig. 2 b, left); this flexibility can alsobe seen in the individual trajectories (Figs. S1–S4). However,there are differences between Meta-I and Meta-II closer tothe Schiff-base linkage. The C9-methyl (Fig. 2 b, middle)and C13-methyl (Fig. 2 b, right) adopted multiple differentconfigurations in Meta-I simulations (see Fig. S5). An anal-ogous result was observed by Lee and Lyman in the A2A
adenosine receptor, suggesting that GPCR ligands are quitepromiscuous within the binding pocket (79). We alsoobserved heterogeneity closer to Lys2967.43 in previous sim-ulations of Meta-I formation (47). However, in the Meta-IIensemble, the C13-methyl tended to point toward the cyto-plasm (cos ¼ %1) as seen in Figs. 2 b and S6. The portionof retinal linked to Lys2967.43 was less flexible in theMeta-IIensemble of simulations compared with Meta-I. This ligandstability correlated with the overall protein dynamics in theMeta-II ensemble, whereas Meta-I sampled a more diverseset of structures.
Interestingly, the residues comprising the rotamer toggleswitch did not show a preference that segregates active-likeand inactive-like ensembles; rather, multiple rotamer angleswere sampled without leading to large-scale conformationchanges in TM6. Although these highly conserved residuesare implicated in GPCR activation, our simulations areconsistent with recent work that casts doubt on any simplisticmechanism describing their action (10–18,71,77,80). We
FIGURE 7 Structure-based clustering reveals aheterogeneity of substates in opsin and Meta-I. Ak-means clustering algorithm based on RMSDwas used on all 24 simulations in aggregate plusthe dark-state and complex counterion simulationsfrom Grossfield et al. (45). (a) Histogram showingthe raw counts for each cluster. Data is colored ac-cording to starting structure. Cluster numbering isarbitrary. (b–e) Time course of clustering data forall six simulations with the same starting structure.The color intensity represents population, which isplotted for each cluster (y axis) as a function ofsimulation time (x axis). The data is averagedin 50 ns windows across all six trajectories for(b) dark opsin, (c) Meta-I, (d) opsin, and (e)Meta-II. To see this figure in color, go online.
Biophysical Journal 109(3) 608–617
614 Leioatts et al.

speculate that these residues may act through clutches as ina car’s transmission: when engaged, the clutches link theseresidues to a larger network that facilitates conformationalchange. When not engaged—the far more probable sce-nario from our limited data—rotameric transitions are notcoupled to large-scale motions. Our present dataset is notsufficient to support this idea beyond speculation. Futurework will be required to substantiate this claim and deter-mine what precisely these clutches are, and how they areengaged.
The simulations presented here represents one of thelarger collections of all-atom GPCR trajectories published,but it is clear these simulations have not converged to thefull ensemble of conformations accessible to rhodopsin;the two opsin setups are chemically identical, as are theMeta-II and Meta-I simulations, and yet the different start-ing protein structures are enough to yield dramaticallydifferent ensembles. In essence, the simulations are longenough to sample well within a given state, but not longenough to explore transitions between states in a statisticallysignificant way. This means that our efforts are more pro-ductively focused on understanding the dynamics of eachstate, so that we can connect the differences between statesto protein function. The results suggest that the presence ofretinal stabilizes the protein in a more active-like ensembleof conformations, which may be because of the specificretinal orientation discussed earlier (Figs. 2 b and S6, band c). In effect, all-trans retinal may discourage rhodopsinfrom taking inactive structures—selecting for these activeconformations. By contrast, Meta-I is consistently moreactive-like than dark opsin. Because all-trans retinal appearsin situ within the binding pocket, it may serve a dual role,destabilizing the Meta-I ensemble as well as stabilizingMeta-II, playing a role similar to that suggested previously(41,42).
This is evident in the heterogeneity of Meta-I and the rela-tive homogeneity of Meta-II (Figs. 4, 5, and 7). The oppositetrend was seen when retinal was absent: inactive-like con-formations were preferred. Interestingly, opsin was able totransition from an active-like conformation to an inactiveone. Rather than thinking in terms of retinal inducing thisconformational change or selecting/capturing a preferredconformation, we suggest thinking in terms of the underly-ing energy landscape. The presence (and state) of retinal issimply shifting the free energy minima. After all, we knowthat all conformations are possible—some just have vanish-ingly small probabilities.
From this data, it appears the ligand is not only chang-ing the conformational ensemble accessible to the protein,but also how rapidly the protein explores the free energylandscape. It may be that ligand presence is altering thelandscape, in this case effectively smoothing barriers(or increasing the attempt rate) to activation. This resultargues in favor of the more recent views of allostery(e.g., 41–44).
CONCLUSIONS
Our results suggest that retinal has a substantial impact onrhodopsin dynamics—even this functionally switch-likeprotein is quite plastic at the molecular level. This is consis-tent with single-molecule experiments on b2AR, suggestingthat there are diverse states sampled along the activation-deactivation continuum (21,25).
Rather than thinking in terms of a discrete set of sub-states, the emerging view is that proteins are more dy-namic and sample a diverse ensemble of configurations.Although some of the biologically important motifs stud-ied coincided with overall protein dynamics, others didnot appear to correlate with any functionally relatedmotion. One analogy to describe how allosteric informa-tion might be communicated is to think of these regionsas a series of gears that are connected by (dis)engageableclutches. In this view, a motif can move freely—samplingmany conformations without affecting the functionalstate—so long as the clutch connecting it to the proteinat large is disengaged. Once engaged, that same motifhas a vital impact on the overall structure of the protein.In this view, the purpose of the ligand would be to influ-ence the position of these clutches. Understanding howthese gears interconnect in the context of the protein’sfree energy landscape will be a topic for much futurework. This will need to be understood in the realm of sta-tistical mechanics, going beyond the early phenomenolog-ical models of allostery. However, the picture of allosteryis more complicated than solely selecting one conforma-tion or directly inducing a conformation switch; the ligandcan serve both functions.
SUPPORTING MATERIAL
Eight figures, one table, and one movie are available at http://www.biophysj.org/biophysj/supplemental/S0006-3495(15)00655-4.
AUTHOR CONTRIBUTIONS
N.L. and A.G. designed the research, N.L., T.D.R., and S.A.D. performedthe research, N.L. and A.G. wrote the article.
ACKNOWLEDGMENTS
The authors thank Dejun Lin, Mark Dumont, and Jessi Leioatts for theircritical review and suggestions to the manuscript. We also thank the Univer-sity of Rochester Center for Integrated Research Computing and HealthSciences Center for Computational Innovation for the computationalresources to run these simulations. This work was supported by NIH projectnumber R01GM095496 (A.G.) and T32GM068411 (N.L.).
REFERENCES
1. Mombaerts, P. 1999. Seven-transmembrane proteins as odorant andchemosensory receptors. Science. 286:707–711.
Biophysical Journal 109(3) 608–617
Retinal Alters Rhodopsin Dynamics 615

2. Firestein, S. 2000. The good taste of genomics. Nature. 404:552–553.
3. Granier, S., and B. Kobilka. 2012. A new era of GPCR structural andchemical biology. Nat. Chem. Biol. 8:670–673.
4. Fredriksson, R., M. C. Lagerstrom, ., H. B. Schioth. 2003. The G-protein-coupled receptors in the human genome form five main fam-ilies. Phylogenetic analysis, paralogon groups, and fingerprints. Mol.Pharmacol. 63:1256–1272.
5. Bahar, I., T. R. Lezon, ., I. H. Shrivastava. 2010. Normal mode anal-ysis of biomolecular structures: functional mechanisms of membraneproteins. Chem. Rev. 110:1463–1497.
6. Overington, J. P., B. Al-Lazikani, and A. L. Hopkins. 2006. How manydrug targets are there? Nat. Rev. Drug Discov. 5:993–996.
7. Lagerstrom, M. C., and H. B. Schioth. 2008. Structural diversity ofG protein-coupled receptors and significance for drug discovery. Nat.Rev. Drug Discov. 7:339–357.
8. Palczewski, K., T. Kumasaka, ., M. Miyano. 2000. Crystal structureof rhodopsin: a G protein-coupled receptor. Science. 289:739–745.
9. Lefkowitz, R. J. 2004. Historical review: a brief history and personalretrospective of seven-transmembrane receptors. Trends Pharmacol.Sci. 25:413–422.
10. Nygaard, R., T. M. Frimurer,., T. W. Schwartz. 2009. Ligand bindingand micro-switches in 7TM receptor structures. Trends Pharmacol. Sci.30:249–259.
11. Crocker, E., M. Eilers, ., S. O. Smith. 2006. Location of Trp265 inmetarhodopsin II: implications for the activation mechanism of thevisual receptor rhodopsin. J. Mol. Biol. 357:163–172.
12. Elling, C. E., T. M. Frimurer, ., T. W. Schwartz. 2006. Metal ion siteengineering indicates a global toggle switch model for seven-trans-membrane receptor activation. J. Biol. Chem. 281:17337–17346.
13. Schwartz, T. W., T. M. Frimurer, ., C. E. Elling. 2006. Molecularmechanism of 7TM receptor activation—a global toggle switch model.Annu. Rev. Pharmacol. Toxicol. 46:481–519.
14. Valentin-Hansen, L., M. Groenen, ., T. W. Schwartz. 2012. The argi-nine of the DRY motif in transmembrane segment III functions as abalancing micro-switch in the activation of the b2-adrenergic receptor.J. Biol. Chem. 287:31973–31982.
15. Trzaskowski, B., D. Latek, ., S. Filipek. 2012. Action of molecularswitches in GPCRs—theoretical and experimental studies. Curr.Med. Chem. 19:1090–1109.
16. Mahalingam, M., K. Martınez-Mayorga, ., R. Vogel. 2008. Twoprotonation switches control rhodopsin activation in membranes.Proc. Natl. Acad. Sci. USA. 105:17795–17800.
17. Shi, L., G. Liapakis, ., J. A. Javitch. 2002. Beta2 adrenergic receptoractivation. Modulation of the proline kink in transmembrane 6 by arotamer toggle switch. J. Biol. Chem. 277:40989–40996.
18. Dror, R. O., D. H. Arlow,., D. E. Shaw. 2011. Activation mechanismof the b2-adrenergic receptor. Proc. Natl. Acad. Sci. USA. 108:18684–18689.
19. Leioatts, N., P. Suresh, ., A. Grossfield. 2014. Structure-based simu-lations reveal concerted dynamics of GPCR activation. Proteins.82:2538–2551.
20. Park, P. S.-H., D. T. Lodowski, and K. Palczewski. 2008. Activation ofG protein-coupled receptors: beyond two-state models and tertiaryconformational changes. Annu. Rev. Pharmacol. Toxicol. 48:107–141.
21. Kahsai, A. W., K. Xiao,., R. J. Lefkowitz. 2011. Multiple ligand-spe-cific conformations of the b2-adrenergic receptor. Nat. Chem. Biol.7:692–700.
22. Nygaard, R., Y. Zou,., B. K. Kobilka. 2013. The dynamic process ofb(2)-adrenergic receptor activation. Cell. 152:532–542.
23. Onaran, H. O., and T. Costa. 2012. Where have all the active receptorstates gone? Nat. Chem. Biol. 8:674–677.
24. Perez, D. M., and S. S. Karnik. 2005. Multiple signaling states ofG-protein-coupled receptors. Pharmacol. Rev. 57:147–161.
25. Bockenhauer, S., A. Furstenberg,., W. E. Moerner. 2011. Conforma-tional dynamics of single G protein-coupled receptors in solution.J. Phys. Chem. B. 115:13328–13338.
26. Zocher, M., J. J. Fung, ., D. J. Muller. 2012. Ligand-specific interac-tions modulate kinetic, energetic, and mechanical properties of thehuman b2 adrenergic receptor. Structure. 20:1391–1402.
27. Bouvier, M. 2001. Oligomerization of G-protein-coupled transmitterreceptors. Nat. Rev. Neurosci. 2:274–286.
28. Soubias, O., and K. Gawrisch. 2011. The role of the lipid matrix forstructure and function of the GPCR rhodopsin. Biochim. Biophys.Acta. 1818:234–240.
29. Soubias, O., W. E. Teague, Jr., ., K. Gawrisch. 2010. Contributionof membrane elastic energy to rhodopsin function. Biophys. J.99:817–824.
30. Feller, S. E., K. Gawrisch, and T. B. Woolf. 2003. Rhodopsin exhibits apreference for solvation by polyunsaturated docosohexaenoic acid.J. Am. Chem. Soc. 125:4434–4435.
31. Brown, M. F. 1994. Modulation of rhodopsin function by properties ofthe membrane bilayer. Chem. Phys. Lipids. 73:159–180.
32. Ludeke, S., M. Beck, ., R. Vogel. 2005. The role of Glu181 in thephotoactivation of rhodopsin. J. Mol. Biol. 353:345–356.
33. Vogel, R., F. Siebert, ., M. Sheves. 2006. Modulating rhodopsinreceptor activation by altering the pKa of the retinal Schiff base.J. Am. Chem. Soc. 128:10503–10512.
34. Sato, K., T. Morizumi,., Y. Shichida. 2010. Direct observation of thepH-dependent equilibrium between metarhodopsins I and II and thepH-independent interaction of metarhodopsin II with transducin C-ter-minal peptide. Biochemistry. 49:736–741.
35. Lyman, E., and D. M. Zuckerman. 2006. Ensemble-based convergenceanalysis of biomolecular trajectories. Biophys. J. 91:164–172.
36. Grossfield, A., and D. M. Zuckerman. 2009. Quantifying uncertaintyand sampling quality in biomolecular simulations. Annu. Rep. Comput.Chem. 5:23–48.
37. Neale, C., J. C. Y. Hsu,., R. Pomes. 2014. Indolicidin binding inducesthinning of a lipid bilayer. Biophys. J. 106:L29–L31.
38. Park, J. H., P. Scheerer, ., O. P. Ernst. 2008. Crystal structure of theligand-free G-protein-coupled receptor opsin. Nature. 454:183–187.
39. Scheerer, P., J. H. Park,., O. P. Ernst. 2008. Crystal structure of opsinin its G-protein-interacting conformation. Nature. 455:497–502.
40. Kono, M., and R. K. Crouch. 2010. In vitro assays of rod and coneopsin activity: retinoid analogs as agonists and inverse agonists.Methods Mol. Biol. 652:85–94.
41. Nussinov, R., and C.-J. Tsai. 2013. Allostery in disease and in drug dis-covery. Cell. 153:293–305.
42. Tsai, C.-J., and R. Nussinov. 2014. A unified view of ‘‘how allosteryworks.’’. PLOS Comput. Biol. 10:e1003394.
43. Motlagh, H. N., J. O.Wrabl,., V. J. Hilser. 2014. The ensemble natureof allostery. Nature. 508:331–339.
44. Motlagh, H. N., and V. J. Hilser. 2012. Agonism/antagonism switchingin allosteric ensembles. Proc. Natl. Acad. Sci. USA. 109:4134–4139.
45. Grossfield, A., M. C. Pitman,., K. Gawrisch. 2008. Internal hydrationincreases during activation of the G-protein-coupled receptorrhodopsin. J. Mol. Biol. 381:478–486.
46. Martınez-Mayorga, K., M. C. Pitman, ., M. F. Brown. 2006. Retinalcounterion switch mechanism in vision evaluated by molecular simula-tions. J. Am. Chem. Soc. 128:16502–16503.
47. Leioatts, N., B. Mertz, ., M. F. Brown. 2014. Retinal ligand mobilityexplains internal hydration and reconciles active rhodopsin structures.Biochemistry. 53:376–385.
48. Baldwin, P. A., and W. L. Hubbell. 1985. Effects of lipid environmenton the light-induced conformational changes of rhodopsin. 2. Roles oflipid chain length, unsaturation, and phase state. Biochemistry.24:2633–2639.
Biophysical Journal 109(3) 608–617
616 Leioatts et al.

49. Feller, S. E., and K. Gawrisch. 2005. Properties of docosahexaenoic-acid-containing lipids and their influence on the function of rhodopsin.Curr. Opin. Struct. Biol. 15:416–422.
50. Yan, E. C. Y., M. A. Kazmi, ., R. A. Mathies. 2003. Retinal coun-terion switch in the photoactivation of the G protein-coupled receptorrhodopsin. Proc. Natl. Acad. Sci. USA. 100:9262–9267.
51. Kim, J.-M., C. Altenbach, ., H. G. Khorana. 2004. Structural originsof constitutive activation in rhodopsin: role of the K296/E113 saltbridge. Proc. Natl. Acad. Sci. USA. 101:12508–12513.
52. Grossfield, A., S. E. Feller, and M. C. Pitman. 2006. A role for directinteractions in the modulation of rhodopsin by omega-3 polyunsatu-rated lipids. Proc. Natl. Acad. Sci. USA. 103:4888–4893.
53. Klauda, J. B., R. M. Venable, ., R. W. Pastor. 2010. Update of theCHARMM all-atom additive force field for lipids: validation on sixlipid types. J. Phys. Chem. B. 114:7830–7843.
54. MacKerell, Jr., A. D., D. Bashford, ., M. Karplus. 1998. All-atomempirical potential for molecular modeling and dynamics studies ofproteins. J. Phys. Chem. B. 102:3586–3616.
55. Mackerell, Jr., A. D., M. Feig, and C. L. Brooks, 3rd. 2004. Extendingthe treatment of backbone energetics in protein force fields: limitationsof gas-phase quantum mechanics in reproducing protein conforma-tional distributions in molecular dynamics simulations. J. Comput.Chem. 25:1400–1415.
56. MacKerell, Jr., A. D., M. Feig, and C. L. Brooks, 3rd. 2004. Improvedtreatment of the protein backbone in empirical force fields. J. Am.Chem. Soc. 126:698–699.
57. Huang, J., and A. D. MacKerell, Jr. 2013. CHARMM36 all-atomadditive protein force field: validation based on comparison to NMRdata. J. Comput. Chem. 34:2135–2145.
58. Zhu, S., M. F. Brown, and S. E. Feller. 2013. Retinal conformationgoverns pKa of protonated Schiff base in rhodopsin activation.J. Am. Chem. Soc. 135:9391–9398.
59. Phillips, J. C., R. Braun, ., K. Schulten. 2005. Scalable moleculardynamics with NAMD. J. Comput. Chem. 26:1781–1802.
60. Voet, D., and J. Voet. 2004. Biochemistry, 3rd ed. Wiley, Hoboken, NJ.
61. Ryckaert, J.-P., G. Ciccotti, and H. J. Berendsen. 1977. Numericalintegration of the cartesian equations of motion of a system withconstraints: molecular dynamics of n-alkanes. J. Comput. Phys.23:327–341.
62. Feller, S. E., Y. Zhang, ., B. R. Brooks. 1995. Constant pressuremolecular dynamics simulation: the Langevin piston method.J. Chem. Phys. 103:4613–4621.
63. Schneider, T., and E. Stoll. 1978. Molecular-dynamics study of a three-dimensional one-component model for distortive phase transitions.Phys. Rev. B. 17:1302–1322.
64. Essmann, U., L. Perera, ., L. G. Pedersen. 1995. A smooth particlemesh Ewald method. J. Chem. Phys. 103:8577–8593.
65. Romo, T. D., N. Leioatts, and A. Grossfield. 2014. Lightweight objectoriented structure analysis: tools for building tools to analyze molecu-lar dynamics simulations. J. Comput. Chem. 35:2305–2318.
66. Changeux, J.-P. 1961. The feedback control mechanisms of biosyn-thetic L-threonine deaminase by L-isoleucine. Cold Spring Harb.Symp. Quant. Biol. 26:313–318.
67. Lau, P.-W., A. Grossfield,., M. F. Brown. 2007. Dynamic structure ofretinylidene ligand of rhodopsin probed by molecular simulations.J. Mol. Biol. 372:906–917.
68. Fukada, Y., T. Okano, ., R. S. Liu. 1990. Comparative study on thechromophore binding sites of rod and red-sensitive cone visual pig-ments by use of synthetic retinal isomers and analogues. Biochemistry.29:3133–3140.
69. Srinivasan, S., E. Ramon, ., P. Garriga. 2014. Binding specificity ofretinal analogs to photoactivated visual pigments suggest mechanismfor fine-tuning GPCR-ligand interactions. Chem. Biol. 21:369–378.
70. Ahuja, S., E. Crocker, ., S. O. Smith. 2009. Location of the retinalchromophore in the activated state of rhodopsin*. J. Biol. Chem.284:10190–10201.
71. Hornak, V., S. Ahuja, ., S. O. Smith. 2010. Light activation ofrhodopsin: insights from molecular dynamics simulations guided bysolid-state NMR distance restraints. J. Mol. Biol. 396:510–527.
72. Okada, T., M. Sugihara, ., V. Buss. 2004. The retinal conformationand its environment in rhodopsin in light of a new 2.2 A crystal struc-ture. J. Mol. Biol. 342:571–583.
73. Struts, A. V., G. F. J. Salgado, ., M. F. Brown. 2007. Structuralanalysis and dynamics of retinal chromophore in dark and meta I statesof rhodopsin from 2H NMR of aligned membranes. J. Mol. Biol.372:50–66.
74. Salgado, G. F. J., A. V. Struts,., M. F. Brown. 2004. Deuterium NMRstructure of retinal in the ground state of rhodopsin. Biochemistry.43:12819–12828.
75. Struts, A. V., G. F. J. Salgado, and M. F. Brown. 2011. Solid-state 2HNMR relaxation illuminates functional dynamics of retinal cofactor inmembrane activation of rhodopsin. Proc. Natl. Acad. Sci. USA.108:8263–8268.
76. Salgado, G. F. J., A. V. Struts, ., M. F. Brown. 2006. Solid-state 2HNMR structure of retinal in metarhodopsin I. J. Am. Chem. Soc.128:11067–11071.
77. Miao, Y., S. E. Nichols, ., J. A. McCammon. 2013. Activation anddynamic network of the M2 muscarinic receptor. Proc. Natl. Acad.Sci. USA. 110:10982–10987.
78. Choe, H.-W., Y. J. Kim,., O. P. Ernst. 2011. Crystal structure of meta-rhodopsin II. Nature. 471:651–655.
79. Lee, J. Y., and E. Lyman. 2012. Agonist dynamics and conformationalselection during microsecond simulations of the A(2A) adenosinereceptor. Biophys. J. 102:2114–2120.
80. Holst, B., R. Nygaard,., T. W. Schwartz. 2010. A conserved aromaticlock for the tryptophan rotameric switch in TM-VI of seven-transmem-brane receptors. J. Biol. Chem. 285:3973–3985.
Biophysical Journal 109(3) 608–617
Retinal Alters Rhodopsin Dynamics 617