Embed Size (px)
Citation preview
9/27/2017
1
Retirement Answers and Insights:
Five questions you should
answer before you retire.Jamie M. Waldren, CFP®
Managing Director - Investments
Wells Fargo Advisors
NCEO Conference
Tampa, FL
October 4, 2017
11
Important
This presentation is being provided for informational purposes only, is
not all encompassing and is not a solicitation or an offer to buy any
security or instrument or to participate in any trading or withdrawal
strategy. Investing involves risk including the possible loss of principal.
Since each person’s situation is different you should review your specific
investment objectives, risk tolerance and liquidity needs with your
financial professional before selecting a suitable savings, investment or
withdrawal strategy. Any examples presented in this material are
hypothetical and have been provided for informational purposes only.
Our firm is not a legal or tax advisor. Be sure to consult with your own
tax and legal advisors before taking any action that may have tax or legal
consequences and to see how this information may apply to your own
situation.
9/27/2017
2
22
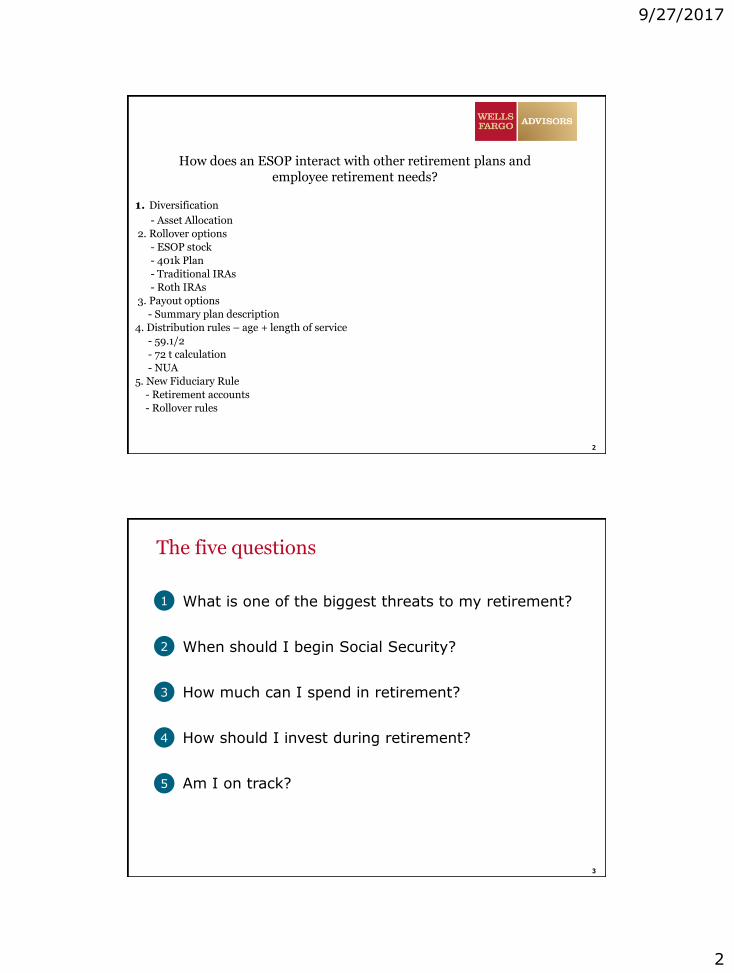
1. Diversification
- Asset Allocation
2. Rollover options
- ESOP stock
- 401k Plan
- Traditional IRAs
- Roth IRAs
3. Payout options
- Summary plan description
4. Distribution rules – age + length of service
- 59.1/2
- 72 t calculation
- NUA
5. New Fiduciary Rule
- Retirement accounts
- Rollover rules
How does an ESOP interact with other retirement plans and employee retirement needs?
33
The five questions
What is one of the biggest threats to my retirement?
When should I begin Social Security?
How much can I spend in retirement?
How should I invest during retirement?
Am I on track?
1
2
3
4
5

9/27/2017
3
44
What is one of the biggest threats to my retirement?
Question
1
55
The retirement income challenges
9/27/2017
4
66
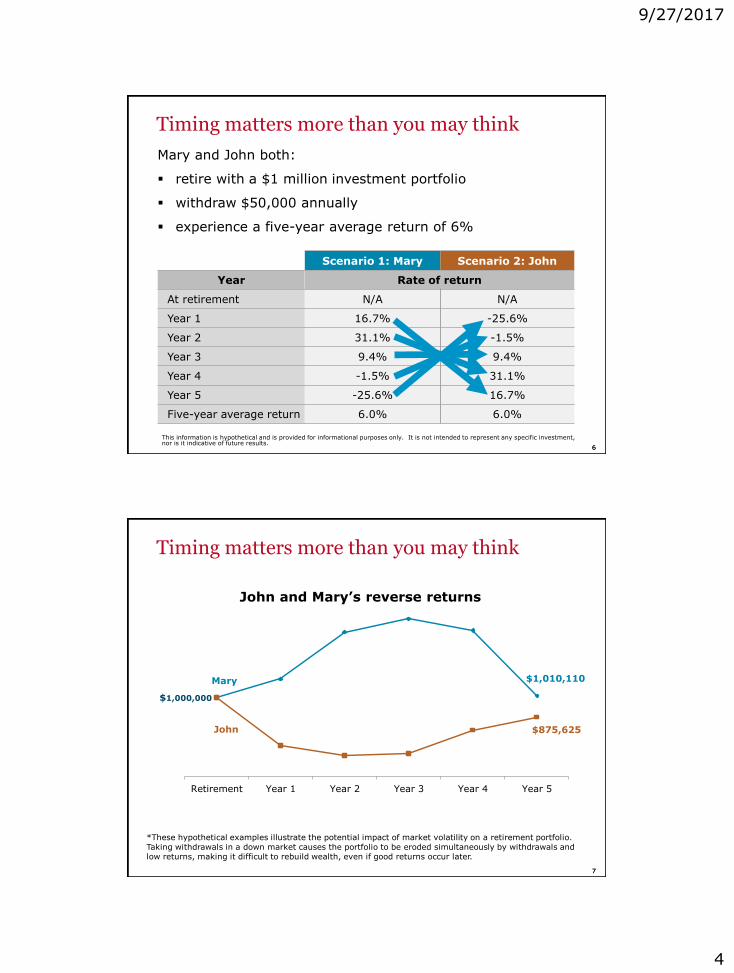
Timing matters more than you may think
Mary and John both:
▪ retire with a $1 million investment portfolio
▪ withdraw $50,000 annually
▪ experience a five-year average return of 6%
Scenario 1: Mary Scenario 2: John
Year Rate of return
At retirement N/A N/A
Year 1 16.7% -25.6%
Year 2 31.1% -1.5%
Year 3 9.4% 9.4%
Year 4 -1.5% 31.1%
Year 5 -25.6% 16.7%
Five-year average return 6.0% 6.0%
This information is hypothetical and is provided for informational purposes only. It is not intended to represent any specific investment, nor is it indicative of future results.
77
Timing matters more than you may think
Mary $1,010,110
John $875,625
Retirement Year 1 Year 2 Year 3 Year 4 Year 5
$1,000,000
John and Mary’s reverse returns
*These hypothetical examples illustrate the potential impact of market volatility on a retirement portfolio. Taking withdrawals in a down market causes the portfolio to be eroded simultaneously by withdrawals and low returns, making it difficult to rebuild wealth, even if good returns occur later.
9/27/2017
5
88
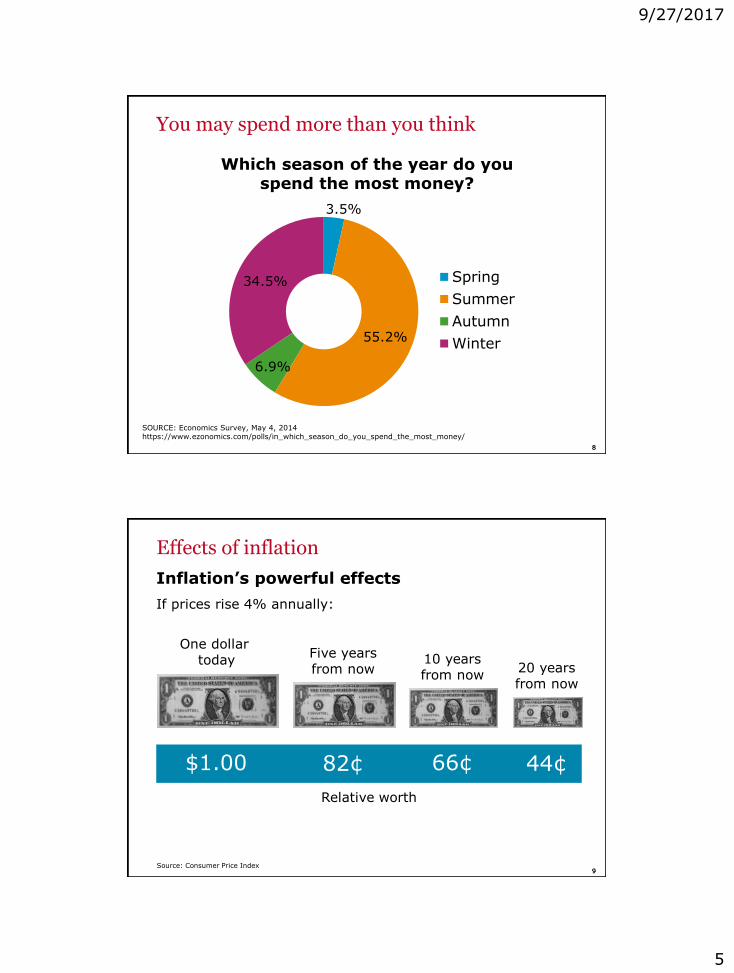
You may spend more than you think
Which season of the year do you spend the most money?
3.5%
55.2%
6.9%
34.5% Spring
Summer
Autumn
Winter
SOURCE: Economics Survey, May 4, 2014https://www.ezonomics.com/polls/in_which_season_do_you_spend_the_most_money/
99
Effects of inflation
$1.00 82¢ 66¢ 44¢
One dollar today
Five yearsfrom now
10 yearsfrom now
20 yearsfrom now
Source: Consumer Price Index
Relative worth
Inflation’s powerful effects
If prices rise 4% annually:

9/27/2017
6
1010
Health care costs continue to rise
10
10
Have you considered the
estimated cost of health
care in retirement?
$376,000
$224,000
$196,000
Source: EBRI Issue Brief No. 317. The amounts shown give retirees a 90% chance of having enough savings to cover health care costs. This assumes retirees have employment-based retiree health benefits to supplement Medicare, and their former employer does not subsidize premiums.
For a man
For a woman
For a couple
1111
You may live longer than you think
Probability of a 65-year old in good health living to various ages
83 years old
50% chance
91 years old
20% chance
MALE
86 years old
50% chance
94 years old
20% chance
FEMALE
90 years old
50% chance
95 years old
25% chance
COUPLE*
Source: Social Security 2010 tables with 1% mortality improvement.
*Longevity of one member of a couple
9/27/2017
7
1212
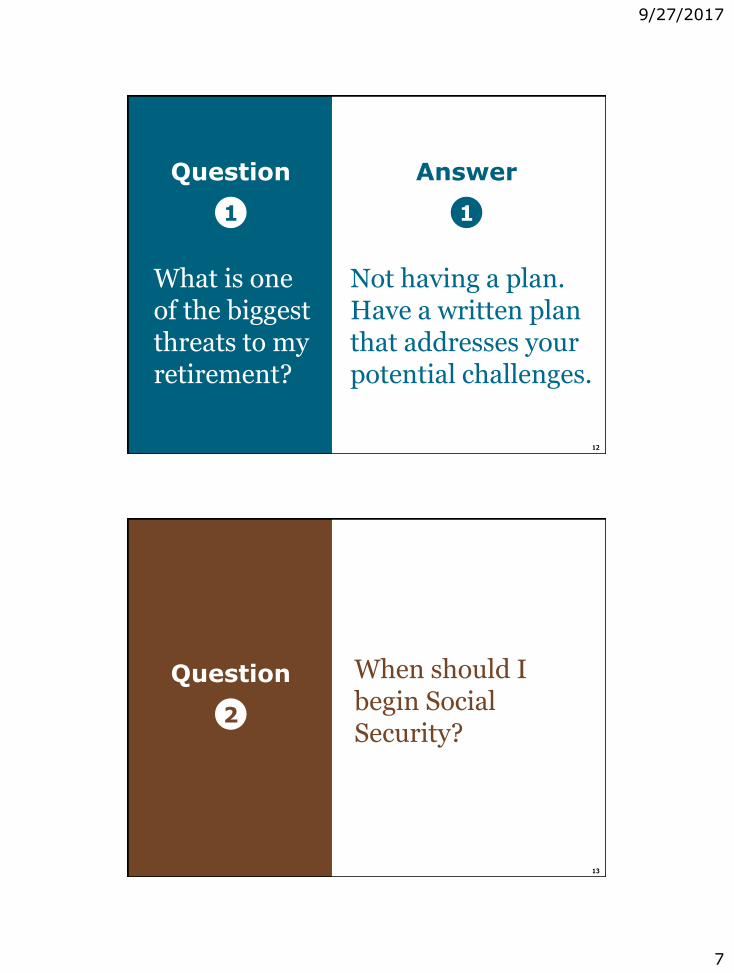
Not having a plan. Have a written plan that addresses your potential challenges.
Question
1
What is one of the biggest threats to my retirement?
Answer
1
1313
When should I begin Social Security?
Question
2
9/27/2017
8
1414
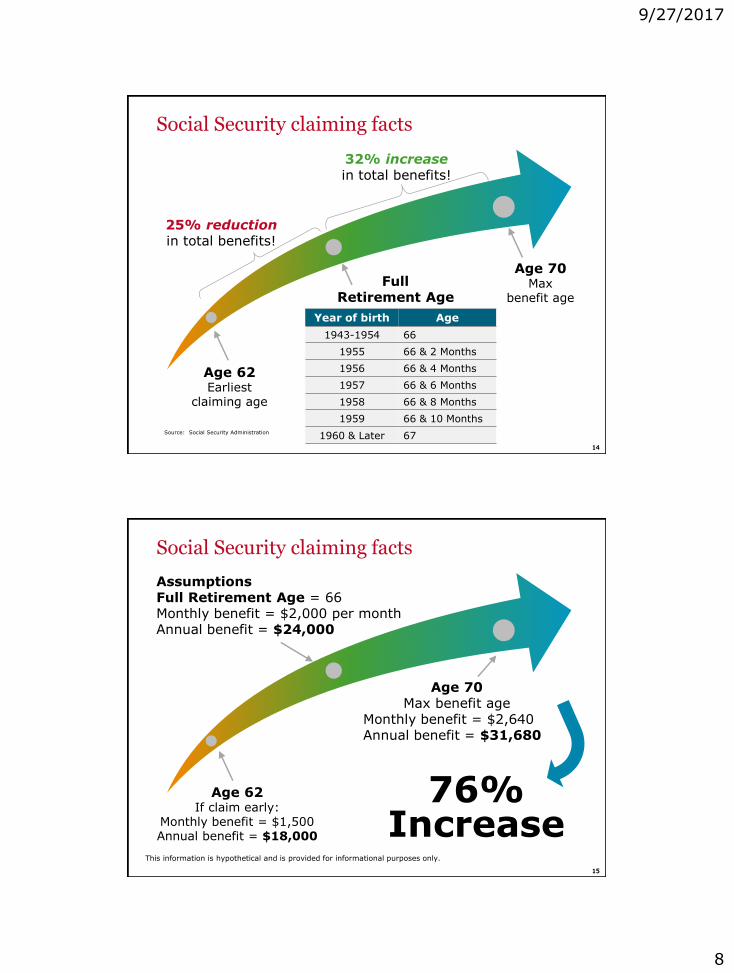
Social Security claiming facts
25% reduction in total benefits!
32% increasein total benefits!
Age 62Earliest
claiming age
Year of birth Age
1943-1954 66
1955 66 & 2 Months
1956 66 & 4 Months
1957 66 & 6 Months
1958 66 & 8 Months
1959 66 & 10 Months
1960 & Later 67
Age 70Max
benefit age
Full Retirement Age
Source: Social Security Administration
1515
Social Security claiming facts
Age 62If claim early:
Monthly benefit = $1,500Annual benefit = $18,000
Age 70Max benefit age
Monthly benefit = $2,640Annual benefit = $31,680
AssumptionsFull Retirement Age = 66Monthly benefit = $2,000 per monthAnnual benefit = $24,000
76% Increase
This information is hypothetical and is provided for informational purposes only.
9/27/2017
9
1616
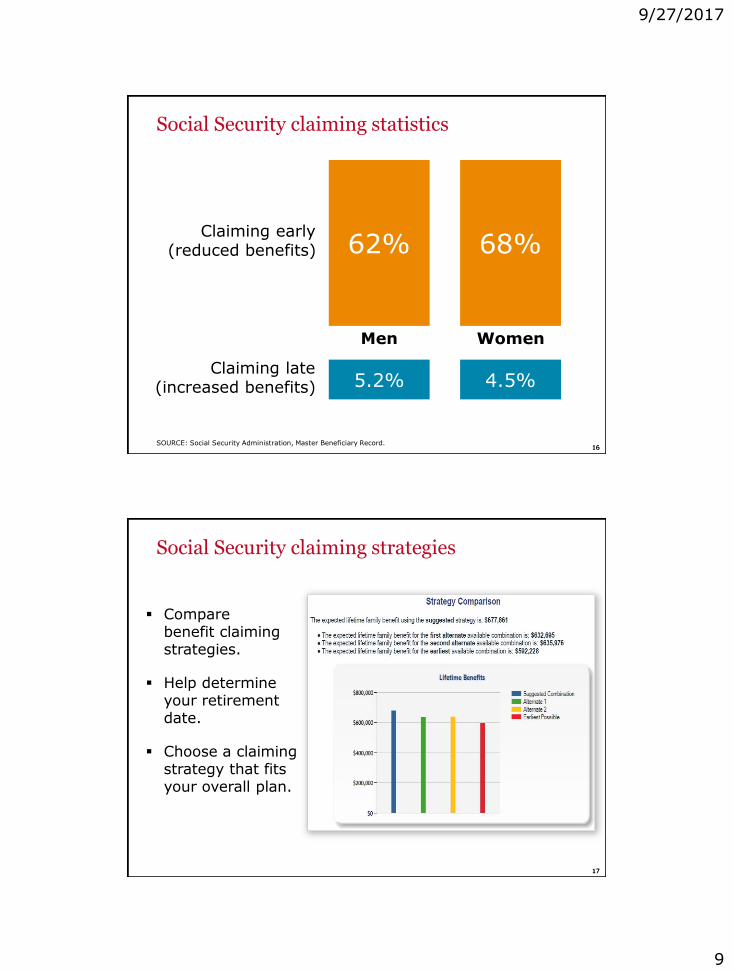
Social Security claiming statistics
62% 68%Claiming early
(reduced benefits)
Men Women
5.2% 4.5%Claiming late
(increased benefits)
SOURCE: Social Security Administration, Master Beneficiary Record.
1717
Social Security claiming strategies
▪ Compare benefit claiming strategies.
▪ Help determine your retirement date.
▪ Choose a claiming strategy that fits your overall plan.
9/27/2017
10
1818
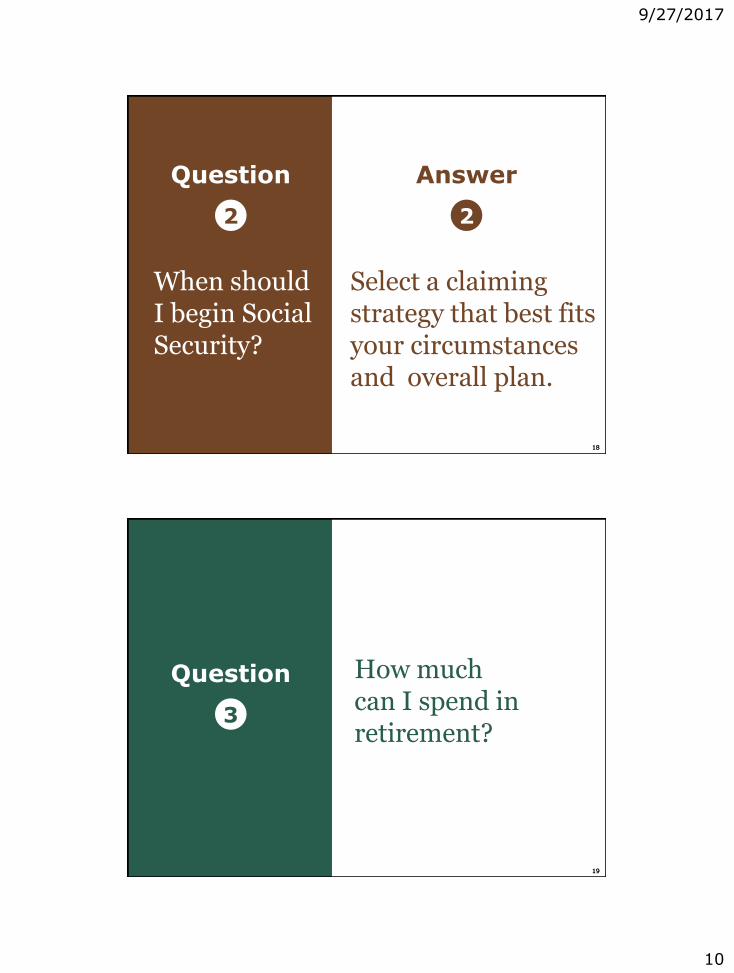
Select a claiming strategy that best fits your circumstances and overall plan.
Question
2
When should I begin Social Security?
Answer
2
1919
How much can I spend in retirement?
Question
3

9/27/2017
11
2020
Divide and conquer your expenses
Types of retirement expenses
1. Essential – basic necessities
▪ Food
▪ Mortgage
▪ Healthcare
2. Discretionary – luxuries
▪ Travel
▪ Entertainment
▪ Recreation
Essential
Discretionary
2121
Write down your expenses
▪ A controllable part of your retirement plan
▪ Helps differentiate the “need-to-haves” from the “nice-to-haves”
▪ Creates a plan that is unique to your retirement
9/27/2017
12
2222
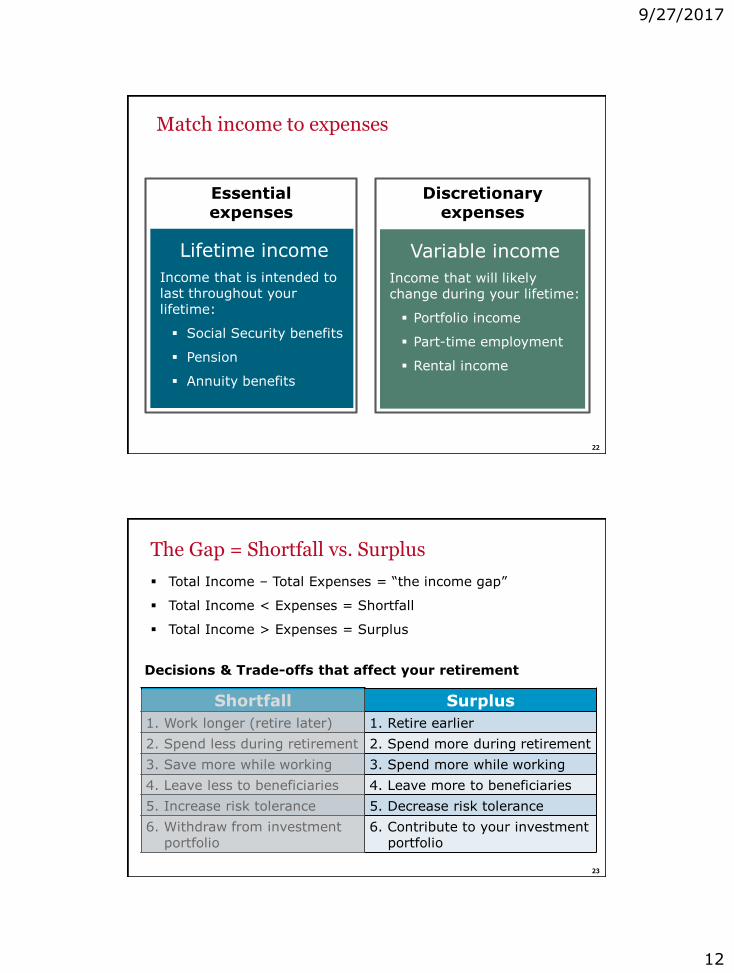
Match income to expenses
Lifetime income
Income that is intended to last throughout your lifetime:
▪ Social Security benefits
▪ Pension
▪ Annuity benefits
Variable income
Income that will likely change during your lifetime:
▪ Portfolio income
▪ Part-time employment
▪ Rental income
Essential expenses
Discretionary expenses
2323
The Gap = Shortfall vs. Surplus
▪ Total Income – Total Expenses = “the income gap”
▪ Total Income < Expenses = Shortfall
▪ Total Income > Expenses = Surplus
Shortfall
1. Work longer (retire later)
2. Spend less during retirement
3. Save more while working
4. Leave less to beneficiaries
5. Increase risk tolerance
6. Withdraw from investment portfolio
Decisions & Trade-offs that affect your retirement
Surplus
1. Retire earlier
2. Spend more during retirement
3. Spend more while working
4. Leave more to beneficiaries
5. Decrease risk tolerance
6. Contribute to your investment portfolio
9/27/2017
13
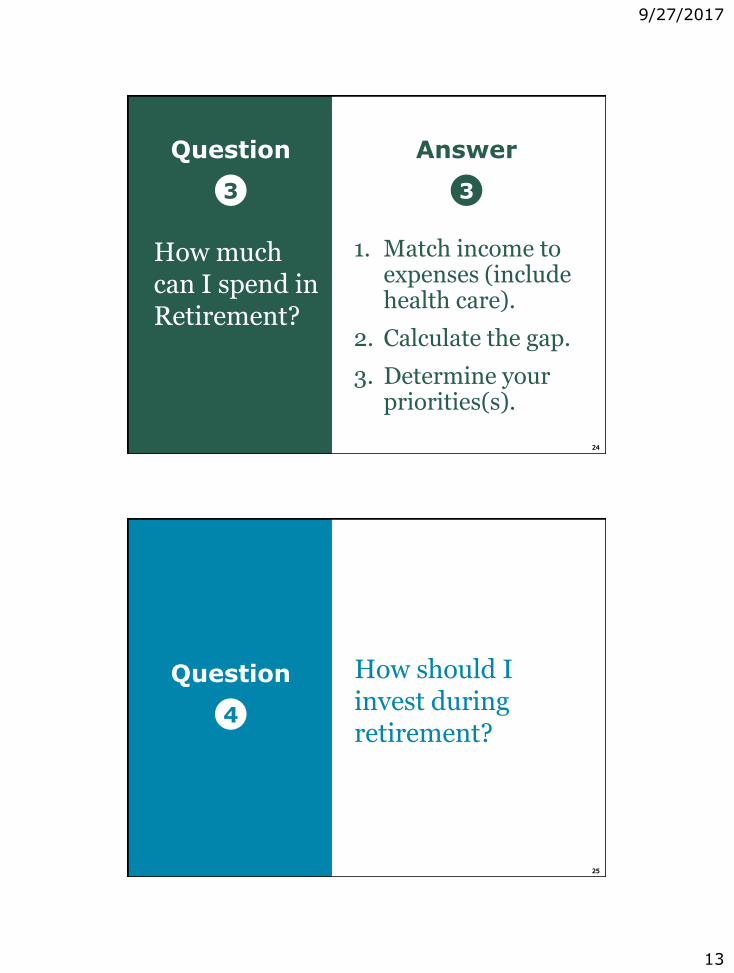
2424
Question
3
How much can I spend in Retirement?
Answer
3
1. Match income to expenses (include health care).
2. Calculate the gap.
3. Determine your priorities(s).
2525
How should I invest during retirement?
Question
4
9/27/2017
14
2626
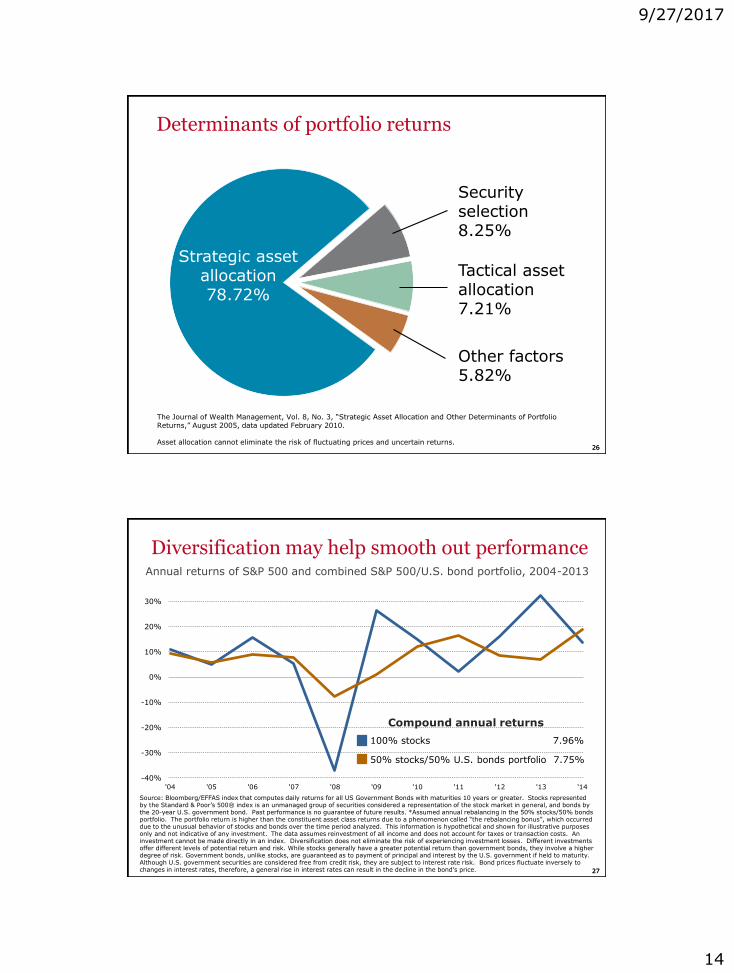
Determinants of portfolio returns
The Journal of Wealth Management, Vol. 8, No. 3, “Strategic Asset Allocation and Other Determinants of Portfolio Returns,” August 2005, data updated February 2010.
Asset allocation cannot eliminate the risk of fluctuating prices and uncertain returns.
Strategic asset allocation78.72%
Security selection8.25%
Tactical asset allocation7.21%
Other factors5.82%
2727
Diversification may help smooth out performance
Source: Bloomberg/EFFAS index that computes daily returns for all US Government Bonds with maturities 10 years or greater. Stocks represented by the Standard & Poor’s 500® index is an unmanaged group of securities considered a representation of the stock market in general, and bonds by the 20-year U.S. government bond. Past performance is no guarantee of future results. *Assumed annual rebalancing in the 50% stocks/50% bonds portfolio. The portfolio return is higher than the constituent asset class returns due to a phenomenon called “the rebalancing bonus”, which occurred due to the unusual behavior of stocks and bonds over the time period analyzed. This information is hypothetical and shown for illustrative purposes only and not indicative of any investment. The data assumes reinvestment of all income and does not account for taxes or transaction costs. An investment cannot be made directly in an index. Diversification does not eliminate the risk of experiencing investment losses. Different investments offer different levels of potential return and risk. While stocks generally have a greater potential return than government bonds, they involve a higher degree of risk. Government bonds, unlike stocks, are guaranteed as to payment of principal and interest by the U.S. government if held to maturity. Although U.S. government securities are considered free from credit risk, they are subject to interest rate risk. Bond prices fluctuate inversely to changes in interest rates, therefore, a general rise in interest rates can result in the decline in the bond’s price.
Annual returns of S&P 500 and combined S&P 500/U.S. bond portfolio, 2004-2013
-40%
-30%
-20%
-10%
0%
10%
20%
30%
'04 '05 '06 '07 '08 '09 '10 '11 '12 '13 '14
Compound annual returns
100% stocks 7.96%
50% stocks/50% U.S. bonds portfolio 7.75%
9/27/2017
15
2828
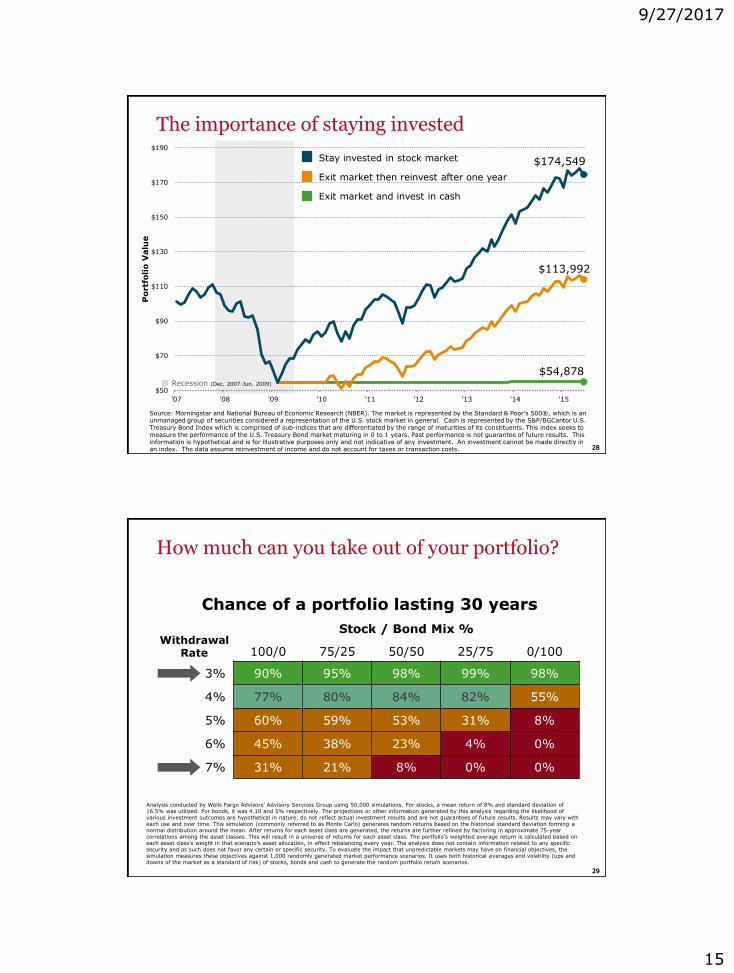
The importance of staying invested
Source: Morningstar and National Bureau of Economic Research (NBER). The market is represented by the Standard & Poor’s 500®, which is an unmanaged group of securities considered a representation of the U.S. stock market in general. Cash is represented by the S&P/BGCantor U.S. Treasury Bond Index which is comprised of sub-indices that are differentiated by the range of maturities of its constituents. This index seeks to measure the performance of the U.S. Treasury Bond market maturing in 0 to 1 years. Past performance is not guarantee of future results. This information is hypothetical and is for illustrative purposes only and not indicative of any investment. An investment cannot be made directly in an index. The data assume reinvestment of income and do not account for taxes or transaction costs.
$54,878
$113,992
$174,549
$50
$70
$90
$110
$130
$150
$170
$190
'07 '08 '09 '10 '11 '12 '13 '14 '15
Portf
olio V
alu
e
Recession (Dec. 2007-Jun. 2009)
Stay invested in stock market
Exit market then reinvest after one year
Exit market and invest in cash
2929
How much can you take out of your portfolio?
WithdrawalRate
Stock / Bond Mix %
100/0 75/25 50/50 25/75 0/100
3% 90% 95% 98% 99% 98%
4% 77% 80% 84% 82% 55%
5% 60% 59% 53% 31% 8%
6% 45% 38% 23% 4% 0%
7% 31% 21% 8% 0% 0%
Chance of a portfolio lasting 30 years
Analysis conducted by Wells Fargo Advisors’ Advisory Services Group using 50,000 simulations. For stocks, a mean return of 8% and standard deviation of 16.5% was utilized. For bonds, it was 4.10 and 5% respectively. The projections or other information generated by this analysis regarding the likelihood of various investment outcomes are hypothetical in nature, do not reflect actual investment results and are not guarantees of future results. Results may vary with each use and over time. This simulation (commonly referred to as Monte Carlo) generates random returns based on the historical standard deviation forming a normal distribution around the mean. After returns for each asset class are generated, the returns are further refined by factoring in approximate 75-year correlations among the asset classes. This will result in a universe of returns for each asset class. The portfolio’s weighted average return is calculated based on each asset class’s weight in that scenario’s asset allocation, in effect rebalancing every year. The analysis does not contain information related to any specific security and as such does not favor any certain or specific security. To evaluate the impact that unpredictable markets may have on financial objectives, the simulation measures these objectives against 1,000 randomly generated market performance scenarios. It uses both historical averages and volatility (ups and downs of the market as a standard of risk) of stocks, bonds and cash to generate the random portfolio return scenarios.
9/27/2017
16
3030
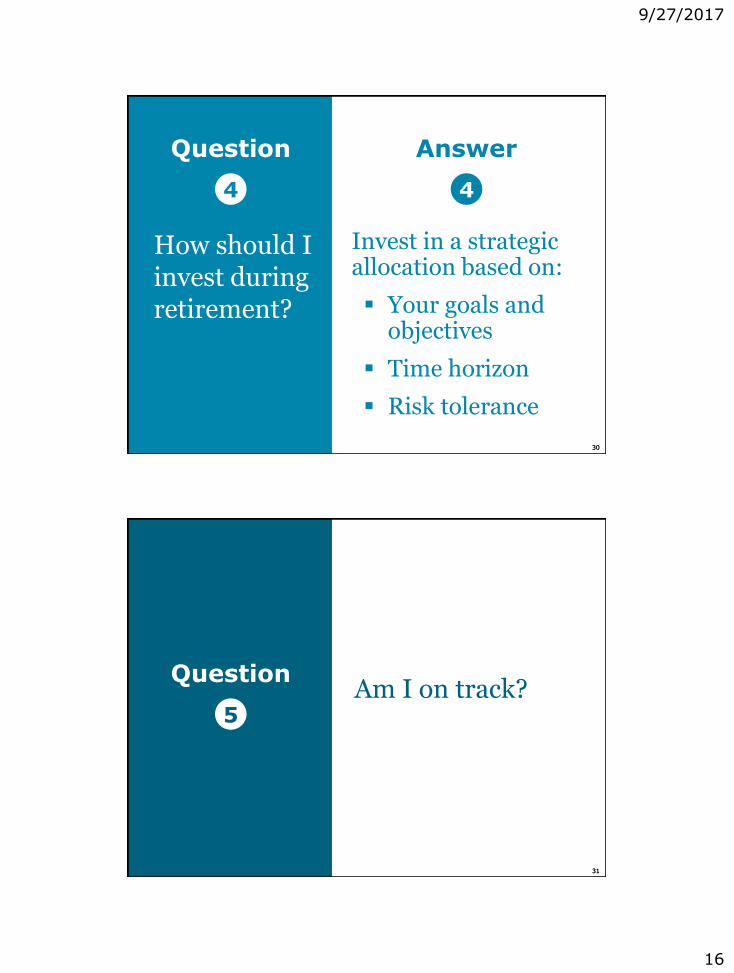
Question
4
How should I invest during retirement?
Answer
4
Invest in a strategic allocation based on:
▪ Your goals and objectives
▪ Time horizon
▪ Risk tolerance
3131
Am I on track?Question
5
9/27/2017
17
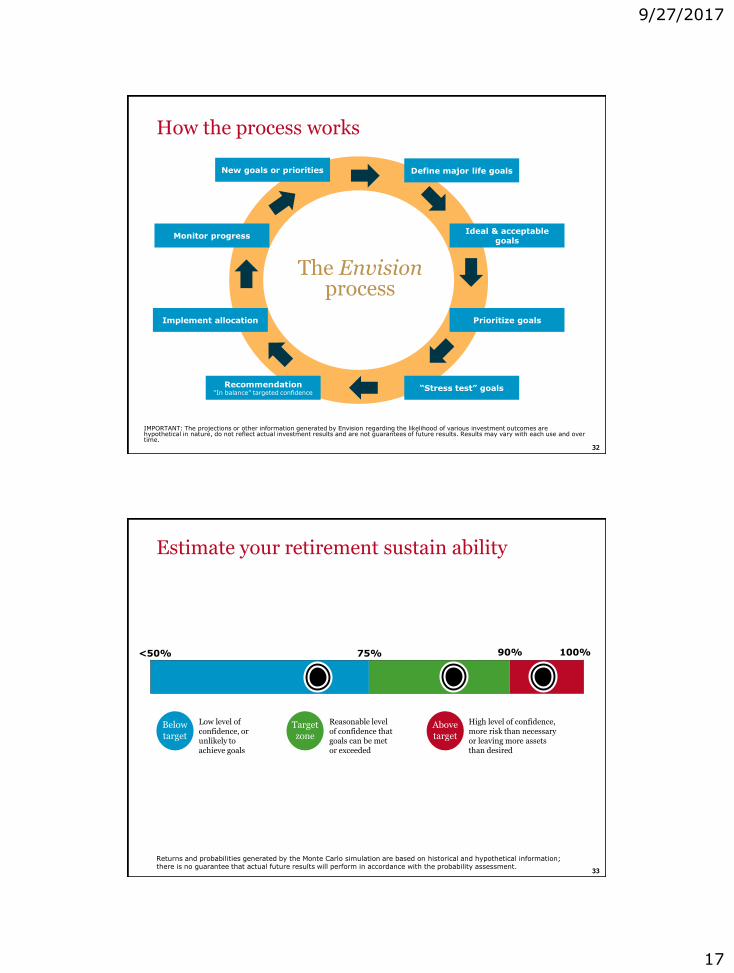
3232
How the process works
The Envisionprocess
Recommendation“In balance” targeted confidence
Implement allocation
Monitor progress
New goals or priorities Define major life goals
Prioritize goals
Ideal & acceptable goals
“Stress test” goals
IMPORTANT: The projections or other information generated by Envision regarding the likelihood of various investment outcomes are hypothetical in nature, do not reflect actual investment results and are not guarantees of future results. Results may vary with each use and over time.
3333
Returns and probabilities generated by the Monte Carlo simulation are based on historical and hypothetical information; there is no guarantee that actual future results will perform in accordance with the probability assessment.
<50% 75% 90% 100%
Estimate your retirement sustain ability
Belowtarget
Targetzone
Abovetarget
Low level of confidence, or unlikely to achieve goals
Reasonable level of confidence that goals can be met or exceeded
High level of confidence, more risk than necessary or leaving more assets than desired
9/27/2017
18
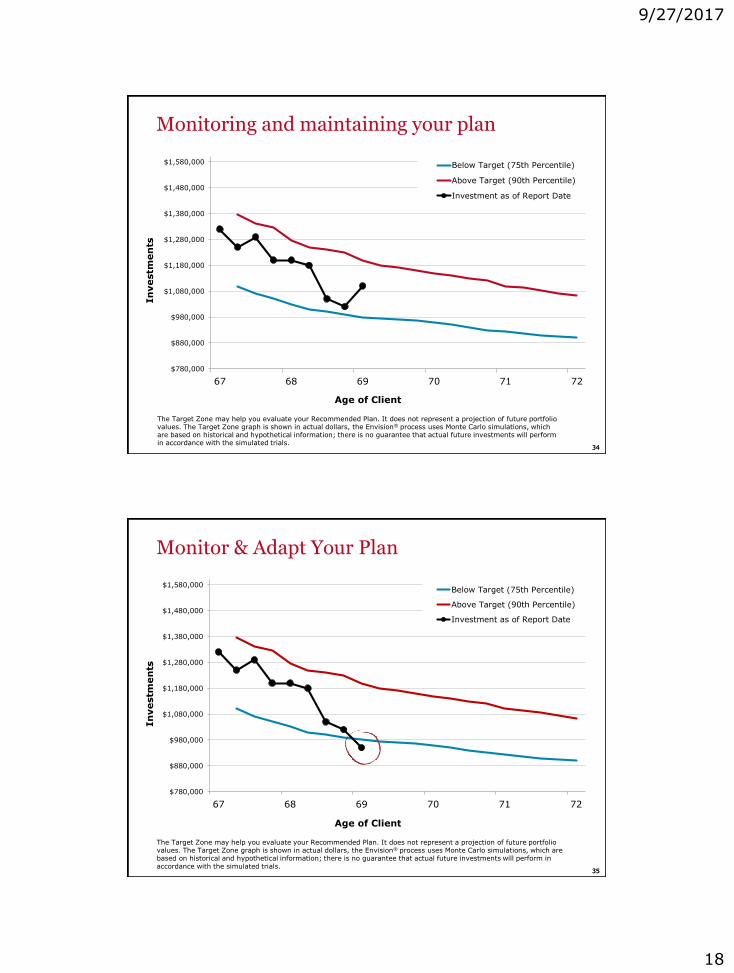
3434
Monitoring and maintaining your plan
The Target Zone may help you evaluate your Recommended Plan. It does not represent a projection of future portfolio values. The Target Zone graph is shown in actual dollars, the Envision® process uses Monte Carlo simulations, which are based on historical and hypothetical information; there is no guarantee that actual future investments will perform in accordance with the simulated trials.
$780,000
$880,000
$980,000
$1,080,000
$1,180,000
$1,280,000
$1,380,000
$1,480,000
$1,580,000
67 68 69 70 71 72
In
vestm
en
ts
Age of Client
Below Target (75th Percentile)
Above Target (90th Percentile)
Investment as of Report Date
3535
Monitor & Adapt Your Plan
The Target Zone may help you evaluate your Recommended Plan. It does not represent a projection of future portfolio values. The Target Zone graph is shown in actual dollars, the Envision® process uses Monte Carlo simulations, which are based on historical and hypothetical information; there is no guarantee that actual future investments will perform in accordance with the simulated trials.
$780,000
$880,000
$980,000
$1,080,000
$1,180,000
$1,280,000
$1,380,000
$1,480,000
$1,580,000
67 68 69 70 71 72
In
vestm
en
ts
Age of Client
Below Target (75th Percentile)
Above Target (90th Percentile)
Investment as of Report Date
9/27/2017
19
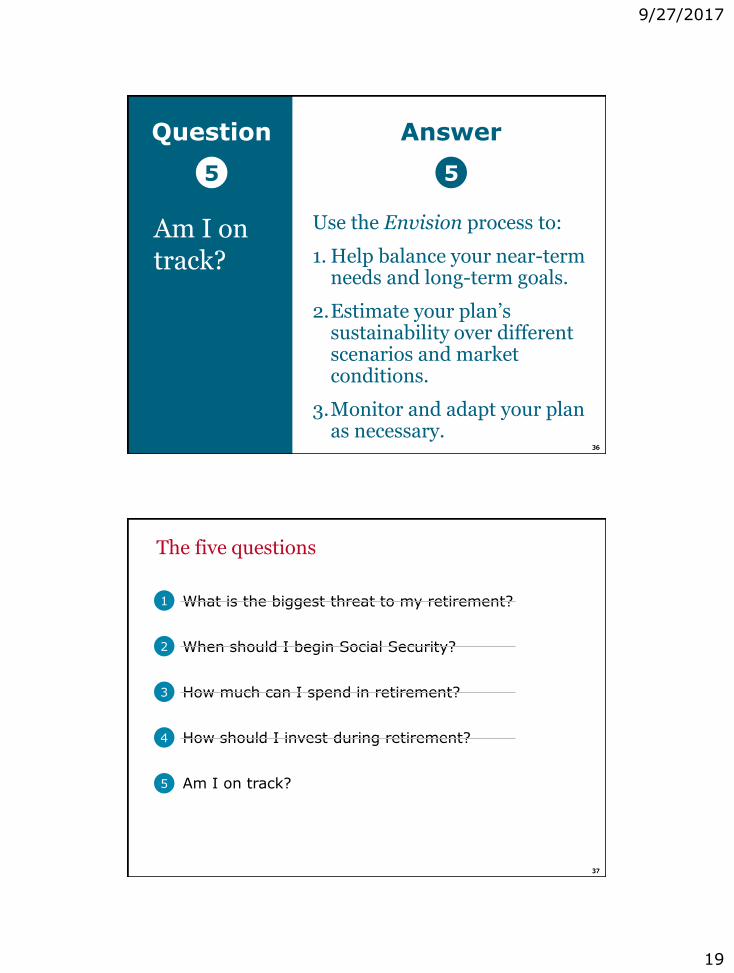
3636
Question
5
Am I on track?
Answer
5
Use the Envision process to:
1. Help balance your near-term needs and long-term goals.
2.Estimate your plan’s sustainability over different scenarios and market conditions.
3.Monitor and adapt your plan as necessary.
3737
The five questions
What is the biggest threat to my retirement?
When should I begin Social Security?
How much can I spend in retirement?
How should I invest during retirement?
Am I on track?
1
2
3
4
5

9/27/2017
20
Do you have the right Financial
Advisor for retirement?
3939
Working together
39
39
How we can help
▪ The Envision Process
▪ The Retirement Income Planning Process
▪ Expense & Budget Analysis
▪ Healthcare Expense Estimate
▪ Social Security Calculator
▪ Retirement Income Analysis
▪ Investment Review & Analysis
▪ Withdrawal Monitoring
9/27/2017
21
4040
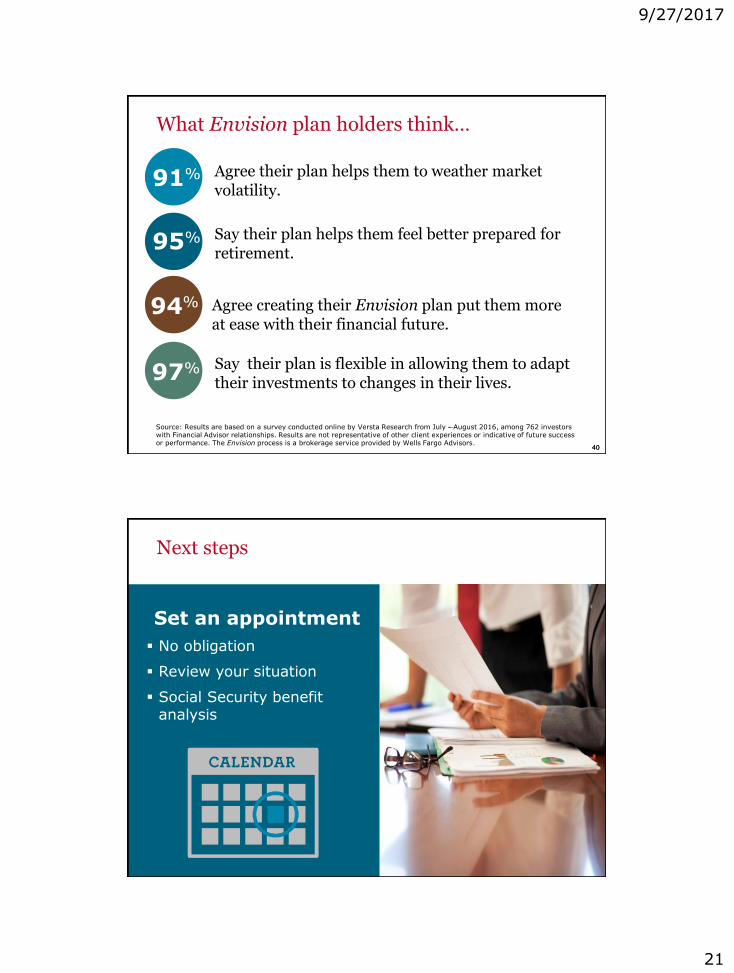
What Envision plan holders think…
97% Say their plan is flexible in allowing them to adapt their investments to changes in their lives.
Source: Results are based on a survey conducted online by Versta Research from July - August 2016, among 762 investors with Financial Advisor relationships. Results are not representative of other client experiences or indicative of future successor performance. The Envision process is a brokerage service provided by Wells Fargo Advisors.
91% Agree their plan helps them to weather market volatility.
94% Agree creating their Envision plan put them more at ease with their financial future.
95% Say their plan helps them feel better prepared for retirement.
4141
Next steps
Set an appointment
▪ No obligation
▪ Review your situation
▪ Social Security benefit analysis

9/27/2017
22
4242
Thank you
4343
IMPORTANT:The projections or other information generated by Envision regarding the likelihood of various investment outcomes are hypothetical in nature, do not reflect actual investment results and are not guarantees of future results. Results may vary with each use and over time.
Envision methodology: Based on accepted statistical methods, the Envision tool uses a simulation model to test your Ideal, Acceptable and Recommended Investment Plans. The simulation model uses assumptions about inflation, financial market returns and the relationships among these variables. These assumptions were derived from analysis of historical data. Using Monte Carlo simulation the Envision tool simulates 1,000 different potential outcomes over a lifetime of investing varying historical risk, return, and correlation amongst the assets. Some of these scenarios will assume strong financial market returns, similar to the best periods of history for investors. Other will be similar to the worst periods in investing history. Most scenarios will fall somewhere in between.
Elements of the Envision presentations and simulation results are under license from Wealthcare Capital Management LLC © 2005-2016 Wealthcare Capital Management LLC. All Rights Reserved. Wealthcare Capital Management LLC is a separate entity and not directly affiliated with Wells Fargo Advisors.

9/27/2017
23
4444
Wells Fargo Advisors is a trade name used by Wells Fargo Clearing Services, LLC, Member SIPC, a registered broker-dealer and non-bank affiliate of Wells Fargo & Company.
© 2017 Wells Fargo Clearing Services, LLC. All rights reserved. 0117-00705