Embed Size (px)
Citation preview
Retransmission and Backoff Strategies for
Wireless Broadcasting
Jesus Arango a Alon Efrat c,∗ Srinivasan Ramasubramanian d
Stephen Pink b Marwan Krunz d
aCisco Systems, San Jose, CA, USAbComputing Department, Lancaster University, UK
cDepartment of Computer Science, University of Arizona, USAdDepartment of Electrical and Computer Engineering, The University of Arizona,
USA
Abstract
This article defines a wireless broadcasting algorithm as having two components:A retransmission strategy and a backoff strategy. Several strategies are proposedin this article and a comparative analysis is presented between existing algorithmsand the strategies proposed herein. Simulation experiments and analysis are usedto study or demonstrate the properties and performance of specific strategies or toobtain results of a more general nature. Strategies are also evaluated with respectto their impact on routing protocols that rely on broadcasting to perform pathdiscovery. The purpose of this evaluation is to determine which strategies result inmore stable routes.
The second part of this article analyzes the problem of broadcasting when nodesare assumed to be arranged on a strip. Such arrangement occurs in vehicular broad-casting applications. We present the Strip Broadcasting retransmission strategy thatcan be modeled as a one-dimensional problem to significantly reduce the numberof retransmissions. Analysis and simulation results are presented to analyze theproperties of the algorithm.
Key words: broadcasting, flooding
∗ Corresponding author: Department of Computer Science, The University of Ari-zona, USA, [email protected]
Preprint submitted to Elsevier 25 February 2010
1 Introduction
1 One way of performing network-wide broadcasting is by “flooding” the net-work with the broadcast message. Flooding is carried out by having each noderetransmit the broadcasted message after receiving it for the first time.
Flooding is important because it is the basis for performing route discoveryin mobile ad-hoc networks (MANETs). Link-state routing protocols also relyon flooding for distribution of link-state information. There are other broad-casting techniques that send out-of-band messages to build distribution trees.However, schemes that do not require out-of-band messages continue to bethe best general-purpose solution for path discovery and link-state routingas their performance does rely on assumptions about mobility or broadcastfrequency 2 .
Flooding is an unreliable operation with no acknowledgment mechanism inplace; this is not a major concern for path discovery or link-state routingas %100 reliability is not required. Flooding is able to distribute broadcastmessages to as many nodes as possible using very little effort. Analysis ofsome of the broadcasting strategies presented in this article show that underreasonable assumptions that reliability can be at least as good as in flooding.If such analysis is not possible for a particular case, then simulations will beused to show that their reliability is comparable to that of flooding.
This article only considers broadcasting algorithms that do not require out-of-band transmissions such as hello messages. The cost of transmitting “hello”messages often cannot be justified. Thus, out-of-band overhead narrows theapplication scope and make it challenging to conclusive compare other broad-casting algorithms that do not use out-of-band messages.
Flooding generates more overhead than necessary because, depending on thenode density, many or most retransmissions are redundant. A retransmission issaid to be redundant if all the neighbors of the transmitting node have alreadyreceived the message. If a transmission is non-redundant then its additionalcoverage is not null 3 , and in this case the additional coverage of a retransmis-sion is the percentage of the transmission range that has not been covered byneighbor nodes.
Redundancy can be reduced (resp. eliminated) when retransmitting occursonly if the additional coverage of the retransmission is large enough (respnon-zero) to warrant the additional overhead . This can be achieved if each
1 This paper extends our preliminary works that were published in [1–3]2 How often broadcast operations are performed3 This is not necessarily true in the opposite direction
2
node knows exactly the locations of many of the other nodes — e.g. its neigh-bors, but in a dynamic network it is quite beneficial to avoid maintaining thisinformation. Instead, each node u receiving the first duplicate of the broad-cast message would postpone its retransmission for a short backoff time, andwould drop this message completely if within this backoff time other retrans-mission made by other nodes made u’s retransmission redundant. Otherwiseu would retransmit once the backoff time has elapses. In this paper we studydifferent method by which partial information information “sensed” by u cansuggest that this retransmission is redundant. For example, if the location ofthe transmitting neighbors is known, then the additional coverage can be de-terministically computed. If the precise location is unknown, then other infor-mation such as distance or angles between neighbors or number of duplicatesreceived can be used to estimate the expected additional coverage. Differenttechnologies such as GPS, angle of arrival (AOA) and received signal strength(RSS) can be used to gather such information.
This hold and suppress approach to broadcasting is by no means novel. How-ever, this article makes several contributions in the area of wireless broadcast-ing. Namely, we redefine a broadcasting algorithm as being composed of twostrategies. The retransmission strategy refers to how it is decided if a sched-uled retransmission is canceled. The backoff strategy determines the mannerin which the backoff time is chosen. Most of the previous work implicitly fallsonly under the category of retransmission strategy. We also propose severalretransmission and backoff strategies and a comparative analysis is presentedbetween existing algorithms and the strategies proposed herein. Simulationexperiments and analysis are used throughout this work to study or demon-strate the properties and performance of specific strategies or to obtain resultsof a more general nature. Strategies are also evaluated with respect to theirimpact on routing protocols that rely on broadcasting to perform path dis-covery. The purpose of this evaluation is to determine which strategies resultin more stable routes.
By considering the distribution of nodes in specific applications it is possible todesign more efficient retransmission strategies. The second part of this paperanalyzes the problem of broadcasting when nodes are assumed to be arrangedon a strip. Such arrangement occurs in vehicular broadcasting applications.We present the Strip Broadcasting (SB) retransmission strategy that can bemodeled as a one-dimensional problem to significantly reduce the number ofretransmissions. A whole new range of vehicular information services can bemade possible by relaying information using vehicle-to-vehicle communications(V2VCOM). The first class of services that comes to mind is traffic alerts aboutdifferent upcoming situations such as accidents, construction zones, or trafficjams.
With the exception of some cases such caravans or convoys, communication
3

between specific vehicles is rarely an issue. Broadcasting is a more naturalcommunication primitive for this type of environment. Accordingly, the goalis to relay information between vehicles for a certain distance or for a givennumber of relay hops. Omnidirectional transmissions are used because theroad and the vehicles it contains can have an arbitrary direction with respectto the transmitter’s frame of reference.
Previous algorithms are suboptimal in vehicular environments because theyperform considerably more retransmissions than necessary. For example, ve-hicle b shown in Figure 1 has received duplicates from both a and c. Existingbroadcast algorithms would require a retransmission by b because the shadedareas in its range of transmission have not been covered. However, the stripof road in the figure is entirely covered by previous retransmissions.
Fig. 1. Redundant retransmission.
The rest of this article is organized as follows. Section 2 presents a sum-mary of the related work. Section 2 describes the simulation environmentused to obtain the experimental results presented throughout this article .Section 3 presents flooding as a combination of retransmission and backoffstrategies, and provides interesting experimental results about the relationshipbetween backoff, collisions and reliability. Section 3 proposes new retransmis-sion strategies, and Section 3.7 provides a comparative simulation analysis.Backoff strategies are studied in Section 4. Section 5 presents an interestingstudy on the effect that retransmission and backoff strategies have on the per-formance of path discovery. Section 6 presents the SB algorithm and providesdetailed analysis of its performance. Section 7 presents the simulation resultsof the SB algorithm and Section 8 offers some concluding remarks.
4

2 Related Work
Sze-Yao et al. [4] observed that serious redundancy, contention, and collisioncould exist if flooding is done blindly. Collectively, they refer to these prob-lems as the broadcast storm problem. As a solution, they introduce several re-transmission strategies, including the counter-based, distance-based, location-based, and cluster-based schemes. Williams and Camp [5] present an analysisof existing broadcasting schemes and is an excellent reference on the topic ofwireless broadcasting.
Paruchuri [6] introduced a retransmission strategy that uses a hexagonal lat-tice to determine which nodes have to retransmit. Cartigny, et al. [7] presentedseveral stochastic algorithms where nodes forward messages with a certainprobability. These probabilities are calculated differently for each algorithmusing information such as node density and distance between nodes.
Pagani and Rossi [8] presented the reliable broadcast protocol designed formobile ad-hoc networks. It ensures that all the hosts in the network receivethe same messages and provides an exactly once message delivery semantics.Minimum connected dominating sets (MCDS) can be used to build distribu-tion backbones and several distributed approximation algorithms have beenproposed [9,10].
Zhang and Jiang presented one-dimensional analytical results [11] for twobroadcasting algorithms originally intended for two-dimensional or three-dimensionalarrangement of nodes. While their analysis is interesting, our simulation andtheoretical analysis shows that the algorithm presented in this article is moreefficient for environments that lend themselves to be modeled in one-dimension.
Michael and Nakagawa [12] propose a MAC-based broadcast protocol thatfocuses on channel allocation by implementing a slot reservation scheme. Sunet.al. proposed a broadcasting protocol [13] which reduces the number ofretransmissions in vehicular environments but requires GPS. Wu et.al. [14]present analytical models to study the spatial propagation of information in ahighly mobile vehicle-to-vehicle ad-hoc network. They show that informationpropagation depends on vehicle density, average vehicle speed and relativespeed among vehicles.
Simulation Environment
All simulations were written in ns-2 [15] version 2.28, a discrete event simulatorwith extensive support for wireless networks. Unless otherwise specified in eachsection, the simulation environment is as follows. All simulations conform tothe 802.11 standard. The data rate and the basic rate are both set to 11 Mbps.
5
The transmission range is 250 meters and the default network size is 2500×750square meters. All broadcast messages have a payload of 128 bytes.
Nodes are randomly distributed with uniform probability. All node densitiesfor two-dimensional models are expressed as number of nodes per range unit,where the range unit is defined as the area of a circumference whose radiusis equal to the range of transmission R. For a one-dimensional model, thedensity is the average number of nodes in a segment of length R. With afew exceptions noted such as Section 5, there is no mobility, as the type ofbroadcasting protocols studied in this article are not adversely affected bymobility.
3 Backoff Strategies for Flooding
Flooding is often enhanced by waiting for a short and uniformly distributedrandom backoff time before forwarding a message in an effort to reduce thenumber of collisions. As such, flooding can be expressed as a typical hold-and-suppress broadcast with a very simple retransmission strategy where messagesare never suppressed. Consequently, if the distribution is uniform, this algo-rithm only has one possible parameter: The maximum backoff time.
The purpose of the timer at the MAC for pure flooding is to reduce col-lisions. However, hold-and-suppress broadcasting algorithms employ backofftimers at the application layer primarily as a mechanism to realize a givenretransmission strategy. Note also that in transport-level or application-levelimplementations of flooding and broadcasting strategies the backoff time isseparate from and additional to whatever backoff mechanisms are in place atthe medium access control layer. That being said, one could surely considerthe possibility of implementing network-wide broadcasting at the MAC layer.Our simulations in particular deal with application-level broadcasting on topof an 802.11 network. Therefore there are two independent backoff mechanismsin place. The backoff intervals in the broadcasting algorithm are much longerthan the backoff times in 802.11.
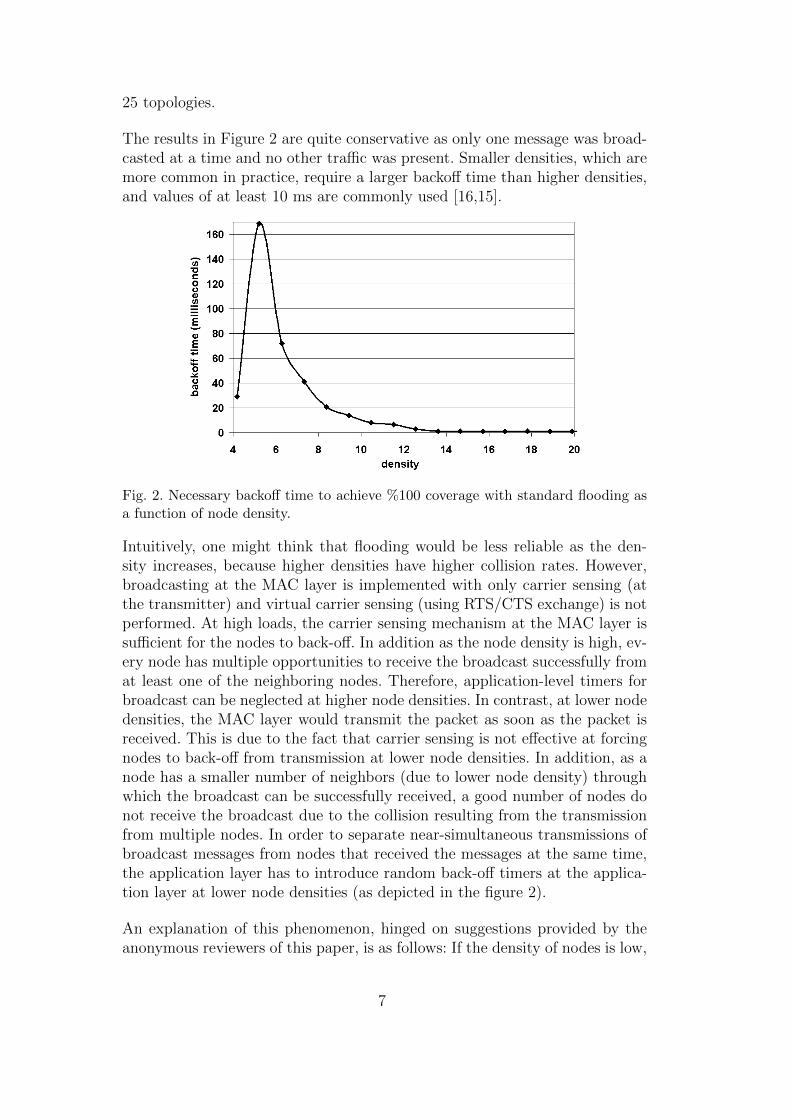
Figure 2 plots the backoff time at the application layer necessary to achieve%100 coverage using pure flooding, as a function of the node density. Cover-age is a reliability measurement defined as the fraction of nodes that receivethe broadcasted message. To conduct this experiment 25 connected topolo-gies were generated for each simulated node density using random uniformnode distribution. Each generated topology was checked for connectivity anddisconnected topologies were discarded. The process was repeated until 25connected topologies were gathered for each density. Starting with a value ofzero, the backoff time is incremented until %100 coverage is obtained for all
6
25 topologies.
The results in Figure 2 are quite conservative as only one message was broad-casted at a time and no other traffic was present. Smaller densities, which aremore common in practice, require a larger backoff time than higher densities,and values of at least 10 ms are commonly used [16,15].
Fig. 2. Necessary backoff time to achieve %100 coverage with standard flooding asa function of node density.
Intuitively, one might think that flooding would be less reliable as the den-sity increases, because higher densities have higher collision rates. However,broadcasting at the MAC layer is implemented with only carrier sensing (atthe transmitter) and virtual carrier sensing (using RTS/CTS exchange) is notperformed. At high loads, the carrier sensing mechanism at the MAC layer issufficient for the nodes to back-off. In addition as the node density is high, ev-ery node has multiple opportunities to receive the broadcast successfully fromat least one of the neighboring nodes. Therefore, application-level timers forbroadcast can be neglected at higher node densities. In contrast, at lower nodedensities, the MAC layer would transmit the packet as soon as the packet isreceived. This is due to the fact that carrier sensing is not effective at forcingnodes to back-off from transmission at lower node densities. In addition, as anode has a smaller number of neighbors (due to lower node density) throughwhich the broadcast can be successfully received, a good number of nodes donot receive the broadcast due to the collision resulting from the transmissionfrom multiple nodes. In order to separate near-simultaneous transmissions ofbroadcast messages from nodes that received the messages at the same time,the application layer has to introduce random back-off timers at the applica-tion layer at lower node densities (as depicted in the figure 2).
An explanation of this phenomenon, hinged on suggestions provided by theanonymous reviewers of this paper, is as follows: If the density of nodes is low,
7
the probability of a collision is rather small and may be partially neglected.On the other extreme, in a very dense environment, enough many nodes canreceive the message, despite the large number of collisions. However, for inter-mediate density values, we expect to find clusters of many nodes occupying asmall region, and connected to other clusters with small “bridges”, with onlya few nodes in each bridge. If many transmissions occur within the clusterin a short period of time, the collisions that they would cause will not suf-fice to jeopardize connectivity within the cluster itself (as indicated in thehigh-density scenario just discussed). Thus these transmissions might cause alarge enough number collisions with the transmissions of the few nodes in thebridges, hence leaving the cluster disconnected from the remaining nodes. Weare leaving it for future study to validate this explanation.
Proposed Forwarding Strategies for Static Nodes
This section presents new forwarding strategies that we are proposing. Forthe ones we were able to, we also prove analytical certain algorithmic prop-erties. Ideal network conditions are usually assumed, meaning that there areno collisions or transmission errors. This simplified model is appropriate sincethe purpose of our analysis is to highlight certain intrinsic properties of thealgorithms, rather than to accurately reflect simulation or real life results.However, the simulation results in Section 3.7 provide a comparative analysisof all these strategies.
The expected additional coverage of a node is small when the duplicates itreceives come from transmitting nodes that are sufficiently distant from eachother and/or very close to the receiving node. The goal of a retransmissionstrategy is to avoid transmitting when these node configurations occur. Severalmeasurement technologies have been proposed to detect these scenarios. Theseinclude GPS, received signal strength (RSS) and angle of arrival (AOA). Evenwhen All these techniques have either serious restrictions or accuracy issues.But the major problem is that they are simply not readily available in mostoff-the-shelf laptop and hand-held devices. Many wireless adapters have hard-ware support for reading the RSS, but there is usually no device-independentinterface provided by the operating system. The different strategies we proposeare tailored to the availabilities, or lack of availabilities of these devices.
3.1 Adjacency Strategy
This heuristic addresses the case at which we cannot measure positions, dis-tances, or angles. Instead once a node u that (after a backoff period) transmita duplicate of the message, append to to the duplicates the i.d.’s of all thenodes that also have transmitted the message while u was in its backoff pe-
8
riod, and were heard by u. Once another node v receive the duplicate, itschedule a retransmission, wait for a backoff period, but it would canceled theretransmission if duplicates have been received from at least k neighbors thatdid not hear each other. This is obtained by building an neighbor adjacencygraph. Assume two duplicates are received from neighbors u and v, in thatorder. If the duplicate from v reports that v heard the message from u thenan undirected edge between u and v is added to the graph. Then we checkthe cardinality k of the maximally independent set in this graph. This goalis computationally intractable for large graphs, but is be handled relativelyefficiently in our setting. Using standard packing arguments, one can showthat k ≤ 5. Moreover, Our simulations for uniformly distributed nodes showthat with an independent set of size 3 the average coverage is at least 99.7%for all densities.
In order to reduce the computational overhead of our algorithm, we also pro-pose a modified strategy called Adjacency-2.5. Scheduled retransmissions arecanceled if there exists an independent set of size two and at least one addi-tional node that is adjacent to only one (but not both) of the nodes in theindependent set. Simulation results indicate that the average coverage is atleast 97.5% for all densities, while providing overhead savings that are com-parable with other algorithms that rely on location information.
3.2 Angular Strategy
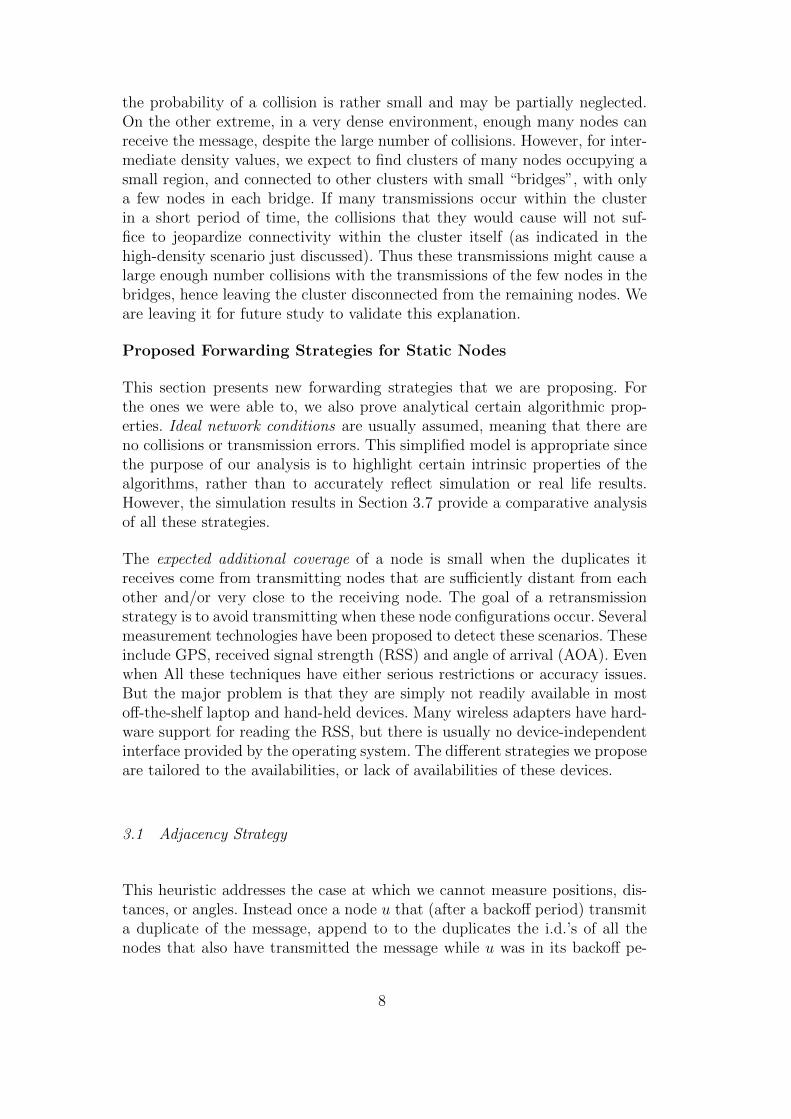
Next we propose a retransmission strategy where nodes use angle of arrival(AOA) information to make forwarding decisions. Assume that nodes candetermine the angle of arrival of incoming messages with respect to somelocal frame of reference. Such angular measurements will in most likelihoodbe subject to a certain degree of noise or error. One can show that If theclockwise angle distance between every pair of adjacent duplicates received bya node u is at most θthr then the additional coverage of u is bounded fromabove by a function of θthr, and approaches zero as θthr approaches π/6.
Figure 3 illustrates the coverage of the angular strategy as a function of nodedensity for several values of θthr. The idea is to give an insight into how toparameterize θthr in order to achieve a given threshold of reliability. Fiftyconnected topologies were generated for each node density using a uniformrandom node distribution. The values shown for each density corresponds tothe average of all fifty executions.
9
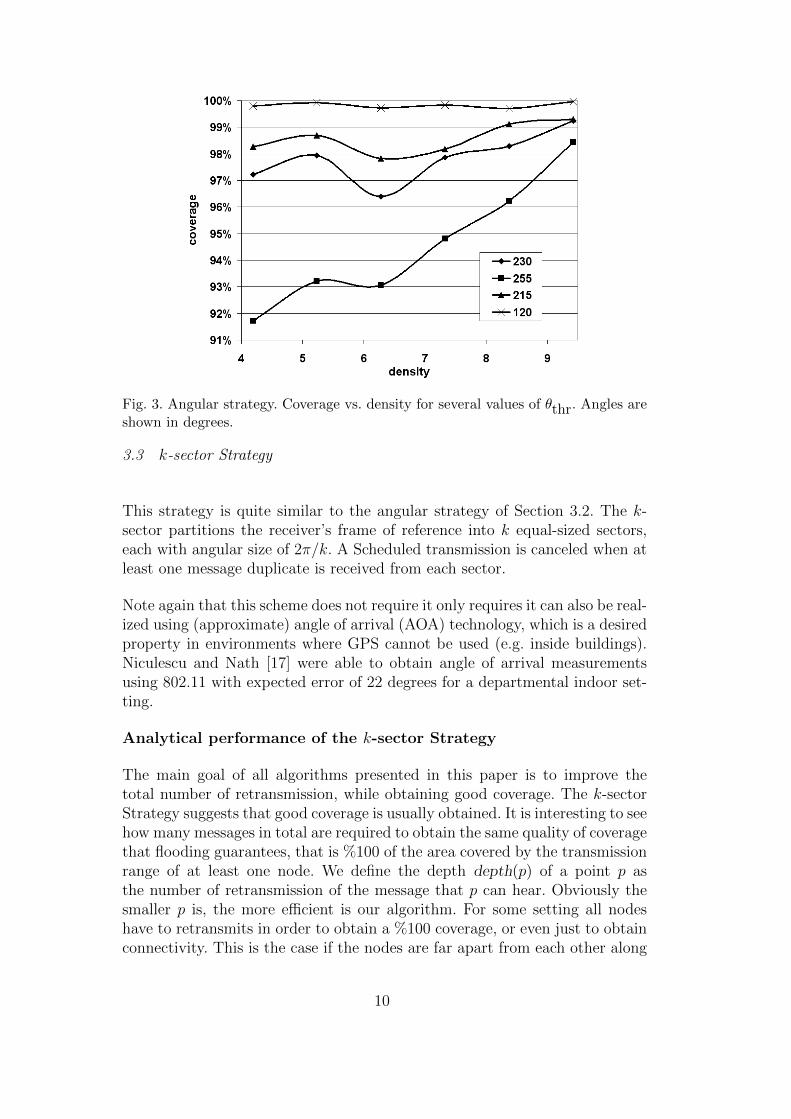
Fig. 3. Angular strategy. Coverage vs. density for several values of θthr. Angles areshown in degrees.
3.3 k-sector Strategy
This strategy is quite similar to the angular strategy of Section 3.2. The k-sector partitions the receiver’s frame of reference into k equal-sized sectors,each with angular size of 2π/k. A Scheduled transmission is canceled when atleast one message duplicate is received from each sector.
Note again that this scheme does not require it only requires it can also be real-ized using (approximate) angle of arrival (AOA) technology, which is a desiredproperty in environments where GPS cannot be used (e.g. inside buildings).Niculescu and Nath [17] were able to obtain angle of arrival measurementsusing 802.11 with expected error of 22 degrees for a departmental indoor set-ting.
Analytical performance of the k-sector Strategy
The main goal of all algorithms presented in this paper is to improve thetotal number of retransmission, while obtaining good coverage. The k-sectorStrategy suggests that good coverage is usually obtained. It is interesting to seehow many messages in total are required to obtain the same quality of coveragethat flooding guarantees, that is %100 of the area covered by the transmissionrange of at least one node. We define the depth depth(p) of a point p asthe number of retransmission of the message that p can hear. Obviously thesmaller p is, the more efficient is our algorithm. For some setting all nodeshave to retransmits in order to obtain a %100 coverage, or even just to obtainconnectivity. This is the case if the nodes are far apart from each other along
10
a line. Yet in this case depth(p) is probably a small constant, independentof which algorithm is used. More interesting is the case that a large numberm of nodes all lie inside a small area D, say a disk of radius R, where R isthe transmission range of a node. Now redundancy is significant. Even in thiscase an adversary might place all m nodes along a line but very close to eachother, so if %100 coverage is required, than each node must retransmit, anddepth(p) = m for some point p ∈ D.
Let depth(D) = maxp∈D depth(p). We next show that the 4-sector broadcastscheme, under quite wide assumptions (defined formally below), yields a %100coverage, but with very hight probability depth(p) = O(log2m).
Assume R = 1. We approximate the unit disk with an axis-parallel square(the analysis can be extended to convex n-gon for better approximation). The4-sector scheme partitions the receiver’s frame of reference into 4 quadrants,NW, NE, SE, SW. A scheduled retransmission of a node u is canceled only ifu has receive at least one node in each quadrant. Note that in this case thecoverage region of u must be contained inside the union of the coverage regionsof these nodes, hence %100 converge is always guaranteed. Thus we are leftwith bounding the number of nodes that actually retransmits, and boundingdepth(D).
Consider a single message M that is simultaneously heard by all m nodes inD. We label these nodes s1 . . . sn, according to their vertical position (y-axis)such that the lowest one is labeled s1 and the highest sm. Ties are assignedarbitrarily. The order of the nodes along the x-axis defines a permutation of(1, 2, . . . n). We denote this permutation as (si1 , . . . sim).
Theorem 1 If every permutation is equally likely, then the expected numberof copies of M transmitted inside D is ≤ 4 ln2m.
Proof: For simplicity we assume the range of transmission is an axis-parallelunit square. We say that si is SE-dominator if among all the nodes below itand to its right, si has the shortest backoff time. SW-dominator, NE-dominatorand NW-dominator are symmetrically defined. Note that si will transmit onlyif it is a dominator with respect to one or more directions.
We now bound the probably that si is not SE-dominator. Note that si hasi−1 nodes below it (i.e. their y-coordinate is smaller than the y-coordinate ofsi). Consider the projections of (s1...sn) on the x-axis. Since all permutationsof the projected points are equably likely, the probability that exactly j of thepoints of {s1 . . . si−1} are to the right of si (for 0 ≤ j < i) is 1/(i− 1). In thiscase the probability that si is SE-dominator is 1/(j + 1). To see why this iscorrect, recall that all nodes pick their backoff time simultaneously. Consideronly si and the j points below it and to its right. The probability that si pickedthe smallest backoff time in this subset of j + 1 nodes is therefor 1/(j + 1).
11
Hence the probability that si is SE-dominator is:
1
i− 1
i∑j=1
1
j + 1(1)
Accordingly, the probability that si is dominator in one or more directions istherefore at most 4 times expression (1):
≤ 4
i− 1
i∑j=1
1
j + 1≤ 4
i− 1lnm (2)
Finally, the expected number of messages sent is obtained by summing ex-pression (2) of all si:
≤ 4m∑i=1
lnm
i≤ 4 ln2m
Finally, the O(log2m) bound on depth can be derived from the number ofretransmissions occurring in D, and the number of retransmissions occurringin a constant number of neighboring unit disks, so their sum gives the desiredbound.
3.4 Counter-Based Scheme
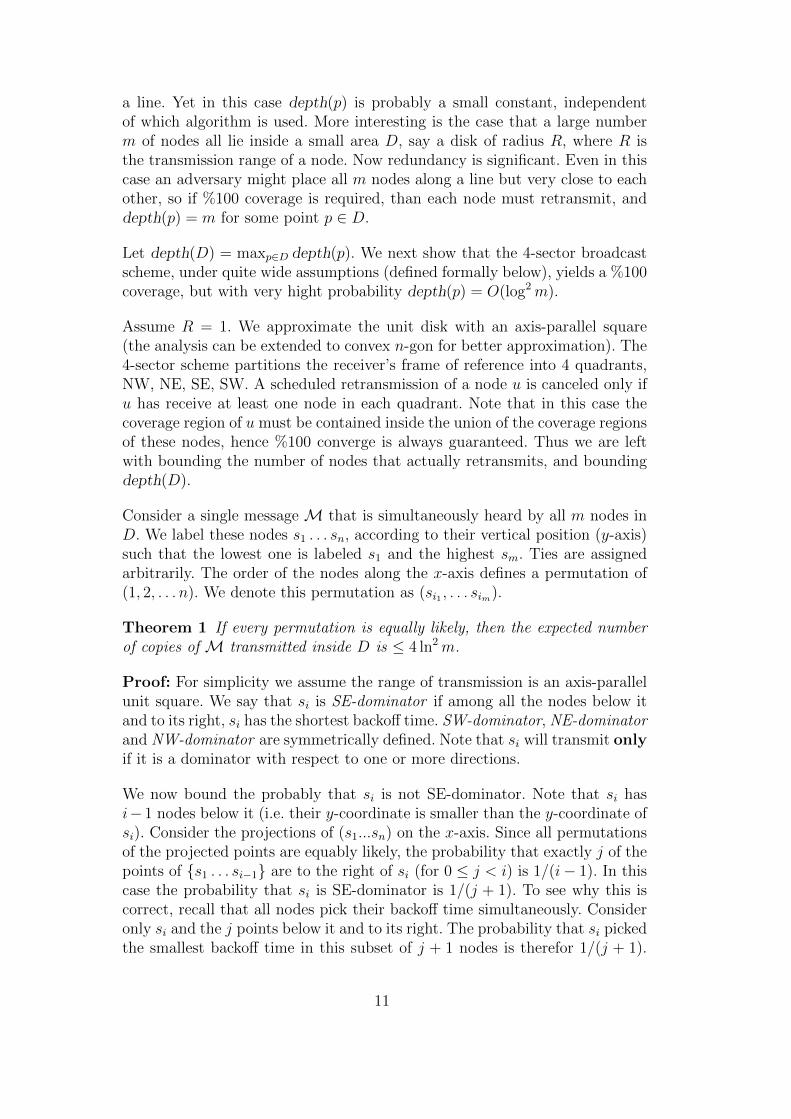
In this scheme, nodes may cancel a scheduled message retransmission of abroadcast packet p whenever the number of message duplicates dups(p) reachesa threshold k. The adventurous of this method is that it does not require anyknowledge of the distance or direction retransmitting nodes. Figure 4 showsthe coverage vs. density for several values of k. Fifty connected topologies weregenerated for each node density using a uniform random node distribution.The values shown for each density corresponds to the average of all fifty ex-ecutions. Note that k needs to be at least 5 to obtain a coverage of at least98% for all densities.
3.5 Distance-Based Scheme
Again assume that the transmission range R = 1. This scheme is design toaddress the scenario where a node u receiving a message from a node v canprovide a rough estimate of the distance d(u, v) between them. In particular, itcan estimate only whether d(u, v) is smaller than some threshold α (it is always
12
Fig. 4. Counter-based scheme. Coverage vs. density for various values of k.
assumed that d(u, v) ≤ 1). This scheme can be used solely, or with combinationwith other one, e.g. the counter-based scheme. a scheduled retransmission iscanceled if a node receives a message duplicate from another node that is lessthan α distance apart. This algorithm is based on the observation that theexpected additional coverage is very small when a duplicate is received froma neighbor that is very close. This algorithm has the nice property that aresimilar to the algorithm of Section 3.3, i.e. coverage of %100 is guaranteed,while a simple packing argument shows that the maximum depth (number ofduplicates heard by a point) can be bounded.
Theorem 2 Let D be a unit disk. Then the number of nodes inside D thattransmit a duplicate is at most 1
6π√
3(1 + α2)2.
Proof: Refer to Figure 5.Let p be a point, and consider the unit disk Dcentered at p, and let m be the number of transmitting nodes in D. We needto bound the number of nodes in D that transmit a duplicate. Consider twosuch nodes s1 and s2. Assume WLOG that s1 has transmitted first. Since s2also transmitted, then d(s1, s2) > α. Placing two disks of radius centered ats1, s2 and having radii α/2, there disks must be disjoint. In general, all diskscentered at transmitting nodes in D and having radii α/2 must be pairwisedisjoint. On the other hand, they are all contained in a disk D′ of radius1 + α/2 centered at p, Hence their total area is bounded by the area of D′,and m · π(α/2)2 ≤ π1 + α
2)2, or
m ≤ (1 + 2/α)2. (3)
To improve this bound, we use previous results on the packing density. Theproblem of packing congruent disjoint disks in a disk is an old and diffi-cult problem and [18] is a good reference. It was shown that the limit of
13
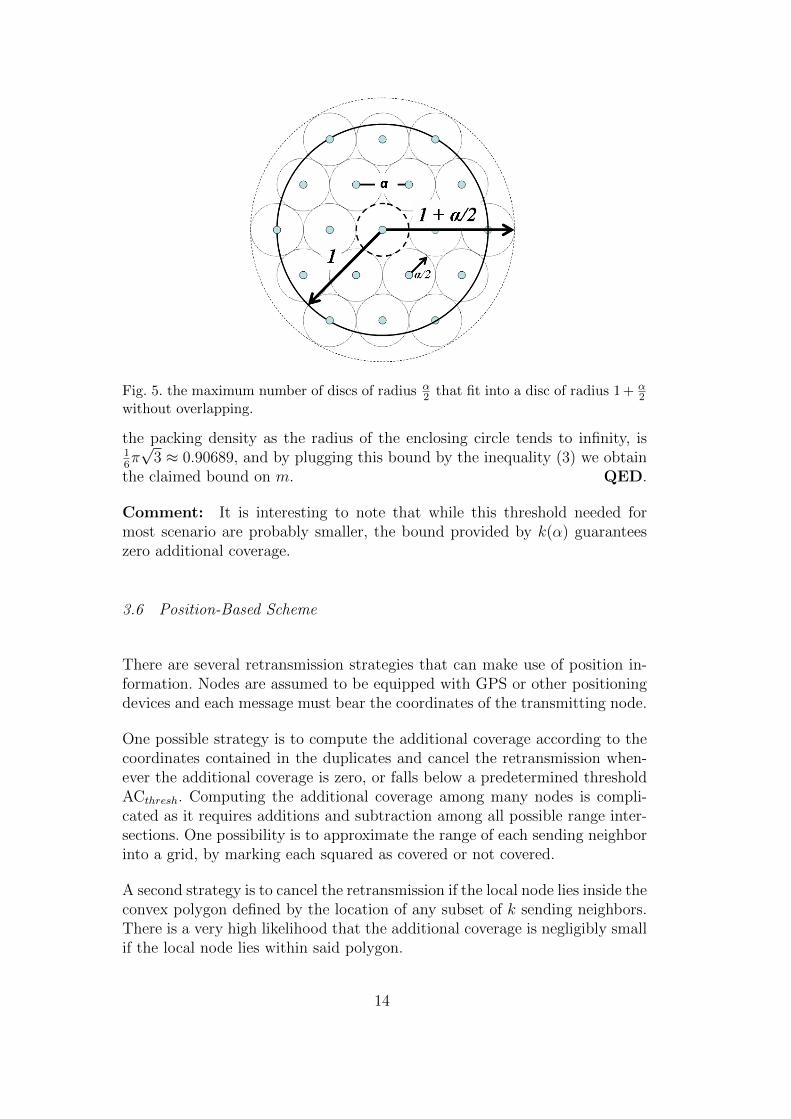
Fig. 5. the maximum number of discs of radius α2 that fit into a disc of radius 1 + α
2without overlapping.
the packing density as the radius of the enclosing circle tends to infinity, is16π√
3 ≈ 0.90689, and by plugging this bound by the inequality (3) we obtainthe claimed bound on m. QED.
Comment: It is interesting to note that while this threshold needed formost scenario are probably smaller, the bound provided by k(α) guaranteeszero additional coverage.
3.6 Position-Based Scheme
There are several retransmission strategies that can make use of position in-formation. Nodes are assumed to be equipped with GPS or other positioningdevices and each message must bear the coordinates of the transmitting node.
One possible strategy is to compute the additional coverage according to thecoordinates contained in the duplicates and cancel the retransmission when-ever the additional coverage is zero, or falls below a predetermined thresholdACthresh. Computing the additional coverage among many nodes is compli-cated as it requires additions and subtraction among all possible range inter-sections. One possibility is to approximate the range of each sending neighborinto a grid, by marking each squared as covered or not covered.
A second strategy is to cancel the retransmission if the local node lies inside theconvex polygon defined by the location of any subset of k sending neighbors.There is a very high likelihood that the additional coverage is negligibly smallif the local node lies within said polygon.
14
3.7 Comparative Simulation Analysis
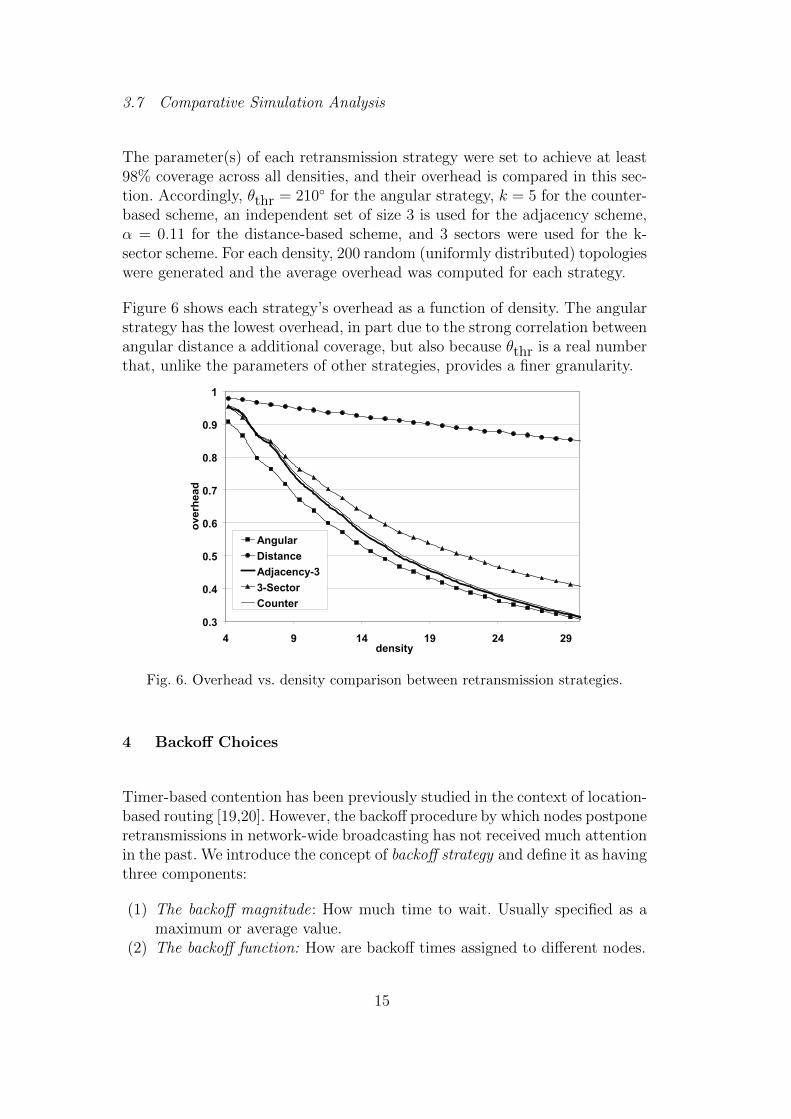
The parameter(s) of each retransmission strategy were set to achieve at least98% coverage across all densities, and their overhead is compared in this sec-tion. Accordingly, θthr = 210◦ for the angular strategy, k = 5 for the counter-based scheme, an independent set of size 3 is used for the adjacency scheme,α = 0.11 for the distance-based scheme, and 3 sectors were used for the k-sector scheme. For each density, 200 random (uniformly distributed) topologieswere generated and the average overhead was computed for each strategy.
Figure 6 shows each strategy’s overhead as a function of density. The angularstrategy has the lowest overhead, in part due to the strong correlation betweenangular distance a additional coverage, but also because θthr is a real numberthat, unlike the parameters of other strategies, provides a finer granularity.
0.3
0.4
0.5
0.6
0.7
0.8
0.9
1
4 9 14 19 24 29density
over
head
AngularDistanceAdjacency-33-SectorCounter
Fig. 6. Overhead vs. density comparison between retransmission strategies.
4 Backoff Choices
Timer-based contention has been previously studied in the context of location-based routing [19,20]. However, the backoff procedure by which nodes postponeretransmissions in network-wide broadcasting has not received much attentionin the past. We introduce the concept of backoff strategy and define it as havingthree components:
(1) The backoff magnitude: How much time to wait. Usually specified as amaximum or average value.
(2) The backoff function: How are backoff times assigned to different nodes.
15

(3) Reset strategy : Nodes that have significantly reduced their additional cov-erage during the last backoff period could be rewarded with additionalbackoff time.
The backoff function could be as simple as a uniform random distribution ofbackoff times, but other alternatives could be considered. For example, backofftimes could be assigned as a function of receive power where the functionapproximates a linear backoff decrease with respect to distance. The advantageof this backoff function is that it significantly reduces the average deliverylatency. The message travels as concentric waves or rings emanating from thesource and rapidly reaching the entire network. Messages are then deliveredby the nodes on these rings to their local neighborhood.
Figure 7 compares the latency of a random backoff time distribution to abackoff function that assigns shorter times to weaker signals (distant nodes).We call this function inv-linear because the backoff times change with receivepower in a way that approximates a linear decrease in backoff time with respectto distance. See section 5 for details of how this and other functions are defined.Also shown is the latency for the symmetrically opposite function (linear)where receive power is used to approximate a linear increase in backoff timeswith respect to distance.
Five different retransmission strategies are used to compare the backoff func-tions. 200 connected topologies were generated using a fixed node density.Each combination of retransmission and backoff function was executed on the200 topologies and the averages are reported in the figure. The results of allthe retransmission strategies were then averaged together to get an overallaverage for each backoff function.
The inv-linear function cuts the average delivery latency for all strategies bymore than half with respect to a random distribution. In contrast the linearfunction results in an excessive increase in latency. One last observation isthat the strategy chosen does not seem to have any effect on latency.
An interesting finding is that the choice of backoff function affects the overheadand that such effect varies with each retransmission strategy. This is due toan effect we call directional diversity. Think of a broadcast operation as theripples formed when dropping a small rock into a pool of water and emanatingfrom a single point. If the backoff function is such that the broadcast message(the ripples) travels slowly, then the nodes will only receive duplicates fromthe direction of the source, resulting in a reduced number of messages received.If the message travels faster, then (similar to the ripples), they will bounceoff objects (the nodes) and travel in the opposite direction before the backoffperiod of inner nodes is over. The number of duplicates received is increasedbecause the now arrive from all directions.
16
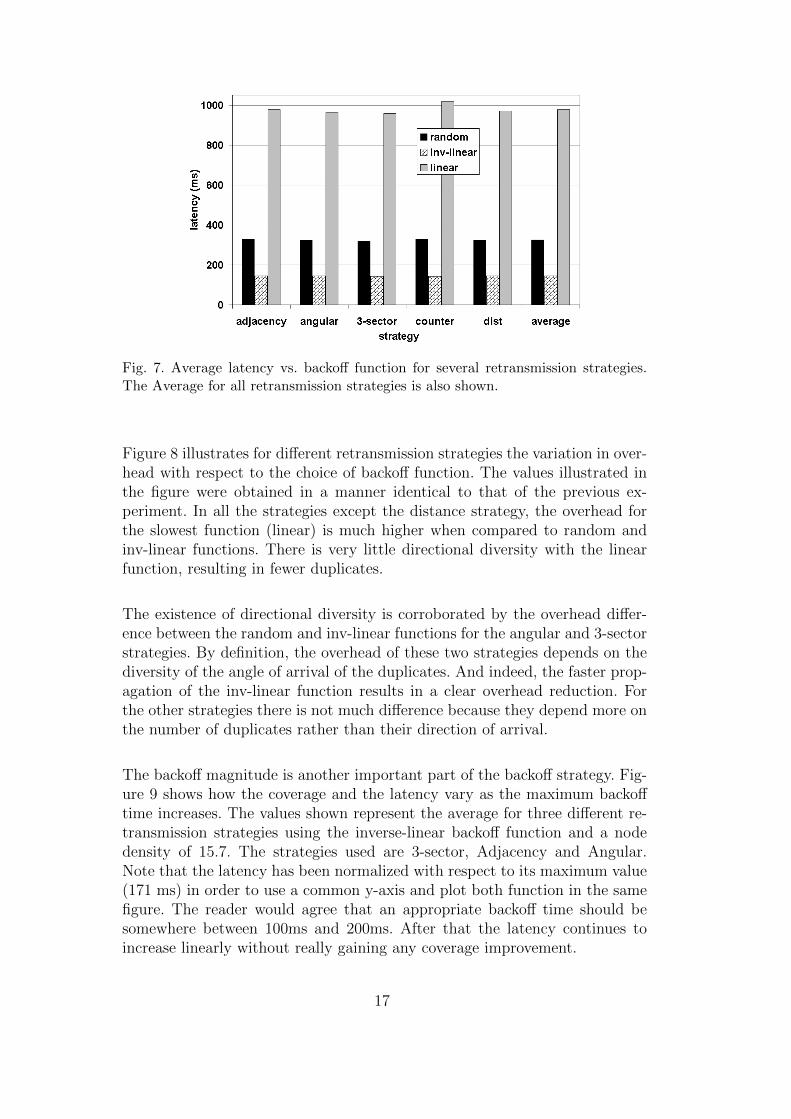
Fig. 7. Average latency vs. backoff function for several retransmission strategies.The Average for all retransmission strategies is also shown.
Figure 8 illustrates for different retransmission strategies the variation in over-head with respect to the choice of backoff function. The values illustrated inthe figure were obtained in a manner identical to that of the previous ex-periment. In all the strategies except the distance strategy, the overhead forthe slowest function (linear) is much higher when compared to random andinv-linear functions. There is very little directional diversity with the linearfunction, resulting in fewer duplicates.
The existence of directional diversity is corroborated by the overhead differ-ence between the random and inv-linear functions for the angular and 3-sectorstrategies. By definition, the overhead of these two strategies depends on thediversity of the angle of arrival of the duplicates. And indeed, the faster prop-agation of the inv-linear function results in a clear overhead reduction. Forthe other strategies there is not much difference because they depend more onthe number of duplicates rather than their direction of arrival.
The backoff magnitude is another important part of the backoff strategy. Fig-ure 9 shows how the coverage and the latency vary as the maximum backofftime increases. The values shown represent the average for three different re-transmission strategies using the inverse-linear backoff function and a nodedensity of 15.7. The strategies used are 3-sector, Adjacency and Angular.Note that the latency has been normalized with respect to its maximum value(171 ms) in order to use a common y-axis and plot both function in the samefigure. The reader would agree that an appropriate backoff time should besomewhere between 100ms and 200ms. After that the latency continues toincrease linearly without really gaining any coverage improvement.
17
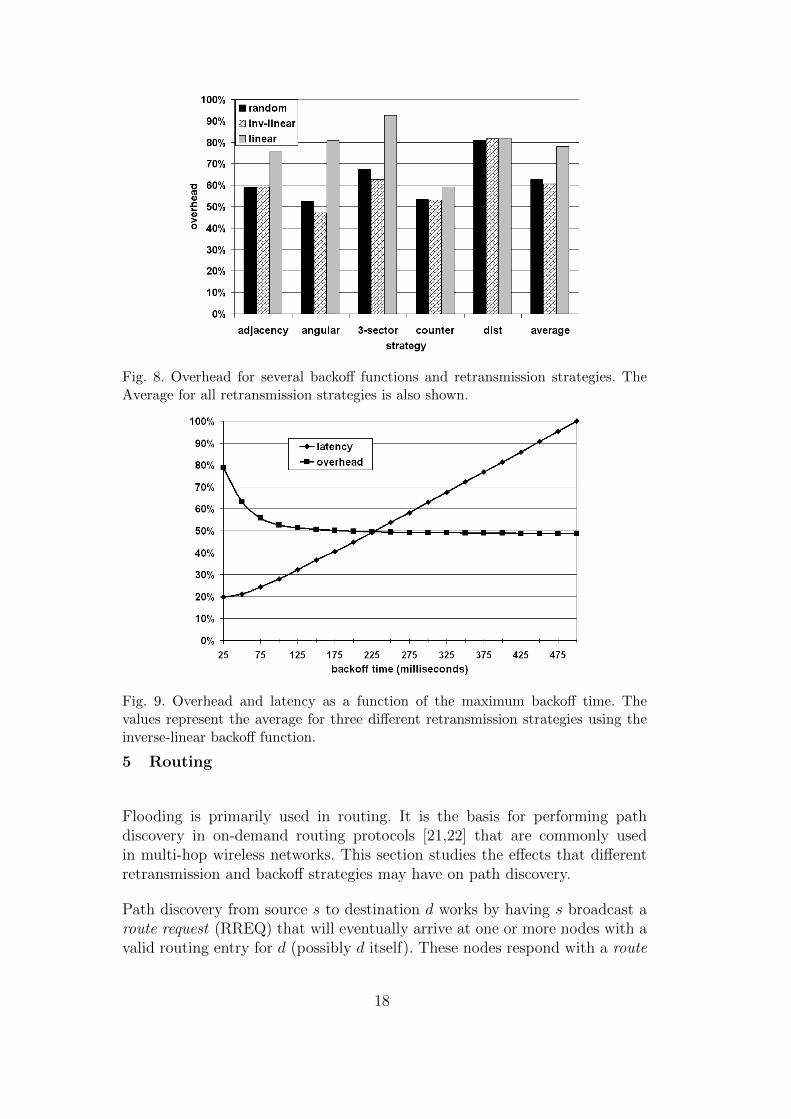
Fig. 8. Overhead for several backoff functions and retransmission strategies. TheAverage for all retransmission strategies is also shown.
Fig. 9. Overhead and latency as a function of the maximum backoff time. Thevalues represent the average for three different retransmission strategies using theinverse-linear backoff function.
5 Routing
Flooding is primarily used in routing. It is the basis for performing pathdiscovery in on-demand routing protocols [21,22] that are commonly usedin multi-hop wireless networks. This section studies the effects that differentretransmission and backoff strategies may have on path discovery.
Path discovery from source s to destination d works by having s broadcast aroute request (RREQ) that will eventually arrive at one or more nodes with avalid routing entry for d (possibly d itself). These nodes respond with a route
18
reply (RREP) that follows the reverse path of the RREQ. Node s will choosethe RREP with the smallest hop count and create the corresponding routingentry for d.
Note that an intermediate node i with a routing entry for d would only respondto the first RREQ duplicate it receives. Accordingly, the resulting path is(s, i, d) for some intermediate node i, where the sub-path (s, i) is determinedby the first RREQ duplicate received by i. The first RREQ to arrive at i willtravel on a path that is either shorter than that of other duplicates, or a pathwhose nodes collectively and coincidentally selected shorter backoff times.
In section 4 we proposed a backoff strategy where nodes that are furtheraway from the transmitter select a smaller backoff time. From the broadcastprotocol’s point of view, such strategy reduces the delivery latency as well asthe overhead. From the routing protocol’s point of view, our initial hypothesisis that this backoff strategy could lead to fragile routes that have a shortduration. The first RREQ to arrive at i will travel through a path that hasfewer nodes spread further apart but weaker links (power-wise). The slightestmovement of nodes in the opposite direction could break a link and affectthe lifetime of the route. We performed simulation experiments to test thishypothesis and the results are presented in this section.
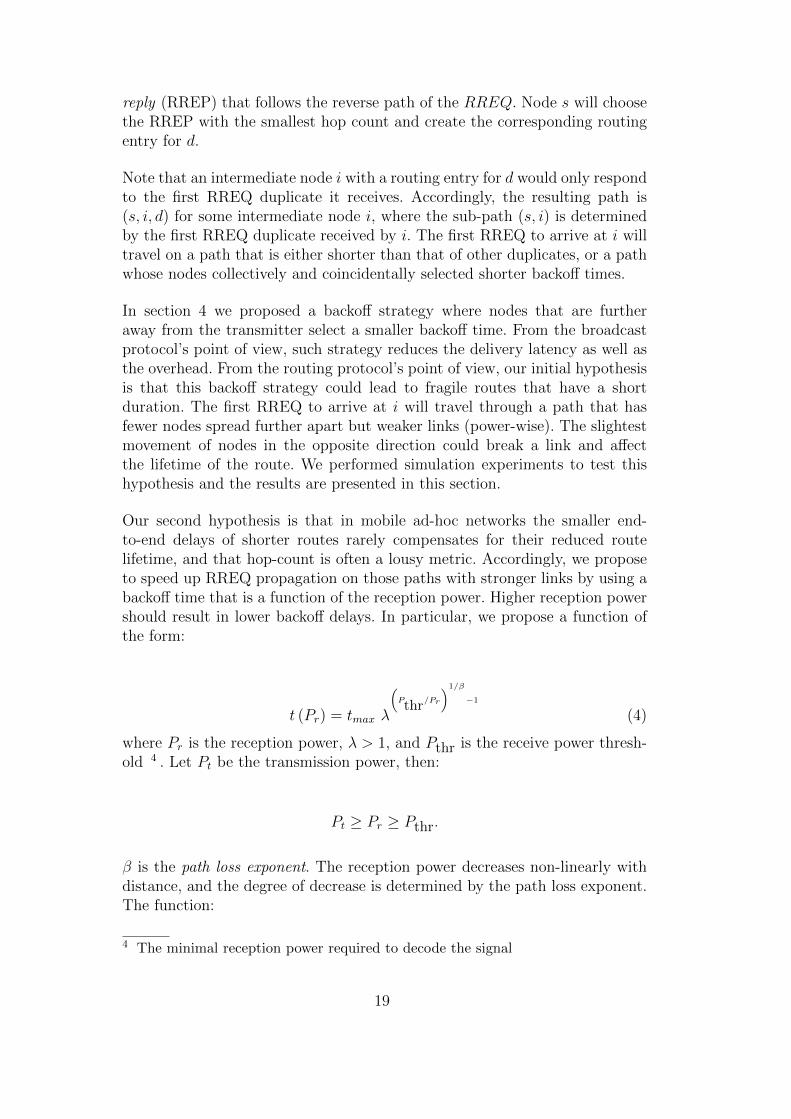
Our second hypothesis is that in mobile ad-hoc networks the smaller end-to-end delays of shorter routes rarely compensates for their reduced routelifetime, and that hop-count is often a lousy metric. Accordingly, we proposeto speed up RREQ propagation on those paths with stronger links by using abackoff time that is a function of the reception power. Higher reception powershould result in lower backoff delays. In particular, we propose a function ofthe form:
t (Pr) = tmax λ
(Pthr
/Pr
)1/β
−1
(4)
where Pr is the reception power, λ > 1, and Pthr is the receive power thresh-old 4 . Let Pt be the transmission power, then:
Pt ≥ Pr ≥ Pthr.
β is the path loss exponent. The reception power decreases non-linearly withdistance, and the degree of decrease is determined by the path loss exponent.The function:
4 The minimal reception power required to decode the signal
19
µ(Pr) =(PthrPr
)1/β
(5)
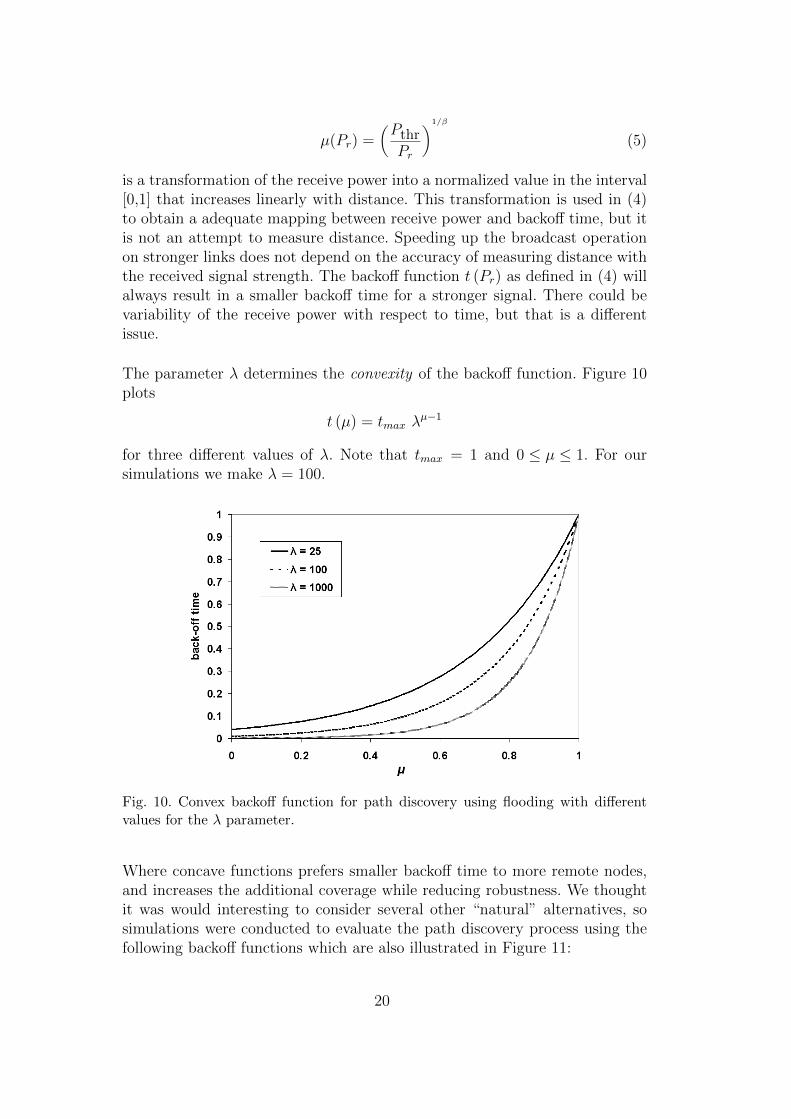
is a transformation of the receive power into a normalized value in the interval[0,1] that increases linearly with distance. This transformation is used in (4)to obtain a adequate mapping between receive power and backoff time, but itis not an attempt to measure distance. Speeding up the broadcast operationon stronger links does not depend on the accuracy of measuring distance withthe received signal strength. The backoff function t (Pr) as defined in (4) willalways result in a smaller backoff time for a stronger signal. There could bevariability of the receive power with respect to time, but that is a differentissue.
The parameter λ determines the convexity of the backoff function. Figure 10plots
t (µ) = tmax λµ−1
for three different values of λ. Note that tmax = 1 and 0 ≤ µ ≤ 1. For oursimulations we make λ = 100.
Fig. 10. Convex backoff function for path discovery using flooding with differentvalues for the λ parameter.
Where concave functions prefers smaller backoff time to more remote nodes,and increases the additional coverage while reducing robustness. We thoughtit was would interesting to consider several other “natural” alternatives, sosimulations were conducted to evaluate the path discovery process using thefollowing backoff functions which are also illustrated in Figure 11:
20

t(µ(Pr)) ≤
[0, tmax] random
tmax λµ(Pr)−1 convex
tmax − tmax λ−µ(Pr) concave
tmax µ(Pr) linear
tmax − tmax µ(Pr) inv. linear
(6)
Fig. 11. Backoff functions for path discovery.
Figure 12 shows the average path duration for each backoff function in (6)under five different retransmission strategies. The figure also shows the averagepath duration for each backoff function, obtained by averaging the results ofall five retransmission strategies. Each retransmission and backoff strategy wassimulated on 200 connected topologies that were generated for this experiment.Each individual run was 300 seconds of simulation time.
The results indicate that the longer lasting paths are always obtained with theconvex backoff function. The concave and linear backoff functions also resultin longer path durations than the random and inv-linear backoff functions.However, an important observation is that in most cases the inv-linear backofffunction performs better than the random backoff function. This is a signifi-cant result because it means we can reduce the latency and overhead withoutsacrificing path-duration beyond what can be achieved with random backoff.
21
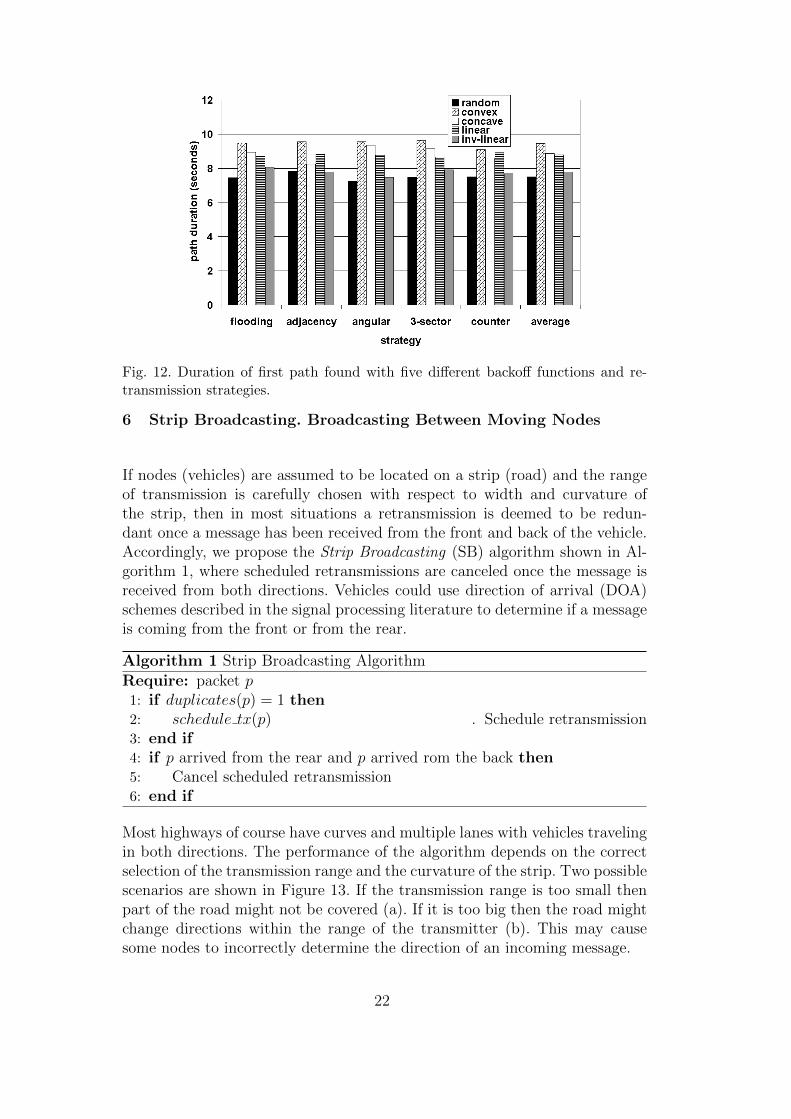
Fig. 12. Duration of first path found with five different backoff functions and re-transmission strategies.
6 Strip Broadcasting. Broadcasting Between Moving Nodes
If nodes (vehicles) are assumed to be located on a strip (road) and the rangeof transmission is carefully chosen with respect to width and curvature ofthe strip, then in most situations a retransmission is deemed to be redun-dant once a message has been received from the front and back of the vehicle.Accordingly, we propose the Strip Broadcasting (SB) algorithm shown in Al-gorithm 1, where scheduled retransmissions are canceled once the message isreceived from both directions. Vehicles could use direction of arrival (DOA)schemes described in the signal processing literature to determine if a messageis coming from the front or from the rear.
Algorithm 1 Strip Broadcasting Algorithm
Require: packet p1: if duplicates(p) = 1 then2: schedule tx(p) . Schedule retransmission3: end if4: if p arrived from the rear and p arrived rom the back then5: Cancel scheduled retransmission6: end if
Most highways of course have curves and multiple lanes with vehicles travelingin both directions. The performance of the algorithm depends on the correctselection of the transmission range and the curvature of the strip. Two possiblescenarios are shown in Figure 13. If the transmission range is too small thenpart of the road might not be covered (a). If it is too big then the road mightchange directions within the range of the transmitter (b). This may causesome nodes to incorrectly determine the direction of an incoming message.
22
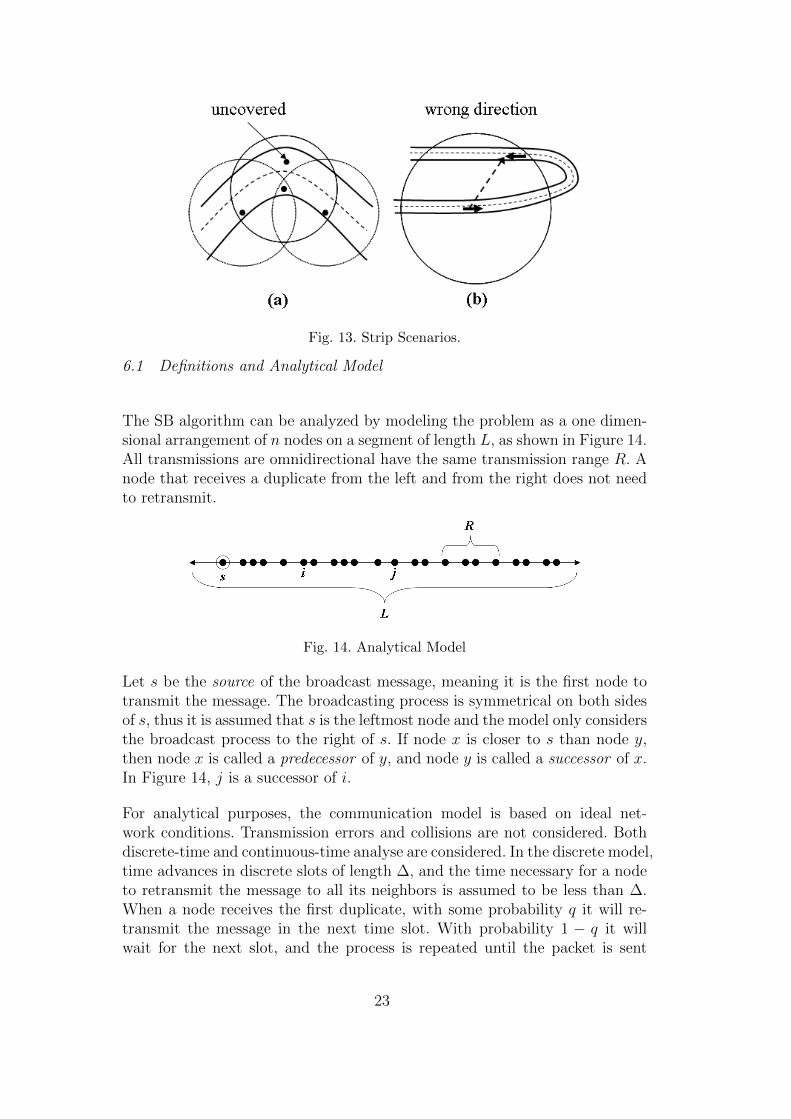
Fig. 13. Strip Scenarios.
6.1 Definitions and Analytical Model
The SB algorithm can be analyzed by modeling the problem as a one dimen-sional arrangement of n nodes on a segment of length L, as shown in Figure 14.All transmissions are omnidirectional have the same transmission range R. Anode that receives a duplicate from the left and from the right does not needto retransmit.
Fig. 14. Analytical Model
Let s be the source of the broadcast message, meaning it is the first node totransmit the message. The broadcasting process is symmetrical on both sidesof s, thus it is assumed that s is the leftmost node and the model only considersthe broadcast process to the right of s. If node x is closer to s than node y,then node x is called a predecessor of y, and node y is called a successor of x.In Figure 14, j is a successor of i.
For analytical purposes, the communication model is based on ideal net-work conditions. Transmission errors and collisions are not considered. Bothdiscrete-time and continuous-time analyse are considered. In the discrete model,time advances in discrete slots of length ∆, and the time necessary for a nodeto retransmit the message to all its neighbors is assumed to be less than ∆.When a node receives the first duplicate, with some probability q it will re-transmit the message in the next time slot. With probability 1 − q it willwait for the next slot, and the process is repeated until the packet is sent
23
or the scheduled retransmission is canceled. In the continuous time model,the backoff period is exponentially distributed, and the transmission delay isassumed to be short enough such that there is a negligible probability thattwo retransmissions overlap in time. This assumption is relaxed later on andanalytical results are provided for overlapping retransmissions. Because of thememoryless property of both time models, the waiting time for all nodes isequally distributed regardless of how long ago they received the first duplicate.As before, we define the depth at a point p (depth(p)) as the number of du-plicates of the message heard at p. Again we seek to obtain a 100% coverage,as long as connectivity is preserved.
6.2 Retransmission Analysis
This section presents analytical results about the number of retransmissionsperformed in a broadcast operation by the SB algorithm under the modeldefined in Section 6.1. The following lemma is similar to Theorem 1, but incontrast to this Theorem, no assumptions are needed about the locations ofthe nodes.
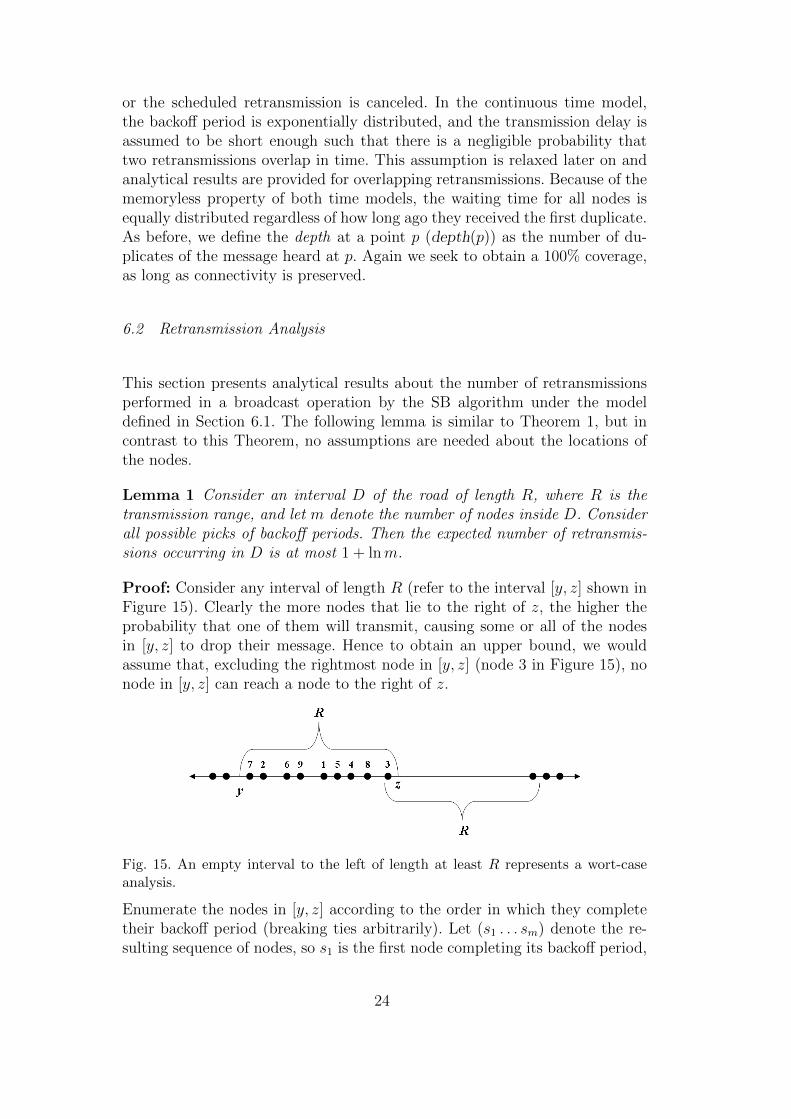
Lemma 1 Consider an interval D of the road of length R, where R is thetransmission range, and let m denote the number of nodes inside D. Considerall possible picks of backoff periods. Then the expected number of retransmis-sions occurring in D is at most 1 + lnm.
Proof: Consider any interval of length R (refer to the interval [y, z] shown inFigure 15). Clearly the more nodes that lie to the right of z, the higher theprobability that one of them will transmit, causing some or all of the nodesin [y, z] to drop their message. Hence to obtain an upper bound, we wouldassume that, excluding the rightmost node in [y, z] (node 3 in Figure 15), nonode in [y, z] can reach a node to the right of z.
Fig. 15. An empty interval to the left of length at least R represents a wort-caseanalysis.
Enumerate the nodes in [y, z] according to the order in which they completetheir backoff period (breaking ties arbitrarily). Let (s1 . . . sm) denote the re-sulting sequence of nodes, so s1 is the first node completing its backoff period,
24
and sm the last. Let Xi be a random variable associated with si. We set Xi = 0if si cancels its retransmission since it received a message from both directions.Otherwise (if si retransmit) we set Xi = 1.
Note that si retransmit if and only if its location is the rightmost amongthe nodes (s1 . . . si). Otherwise, there is a node to its right, which transmitsbefore si’s backoff period has expired, causing si to cancel its retransmission.Since every permutation of s1 . . . si is equally likely, si has equal probability1/i of being in any of the possible i locations occupied by {s1 . . . si}. Thisis because the memoryless property of either the discrete time or continuoustime models makes all node permutations equally possible. As a result, theprobability Pr(Xi = 1) that si retransmits is 1/i. Thus E[Xi] = Pr(Xi =0) · 0 + Pr(Xi = 1) · 1 = 1
i. The number of retransmissions is
∑m1 Xi, and its
expectation is and the expected value of Xi is
E
[m∑i=1
Xi
]=
m∑i=1
E [Xi] =m∑i=1
1
i≤ 1 + lnm
QED.
The reason that 1 + lnm is only an upper bound, is that messages can bereceived also from the right of y, and reaching some of the nodes in [x, y].Next we show that for some scenario, the bound is tight.
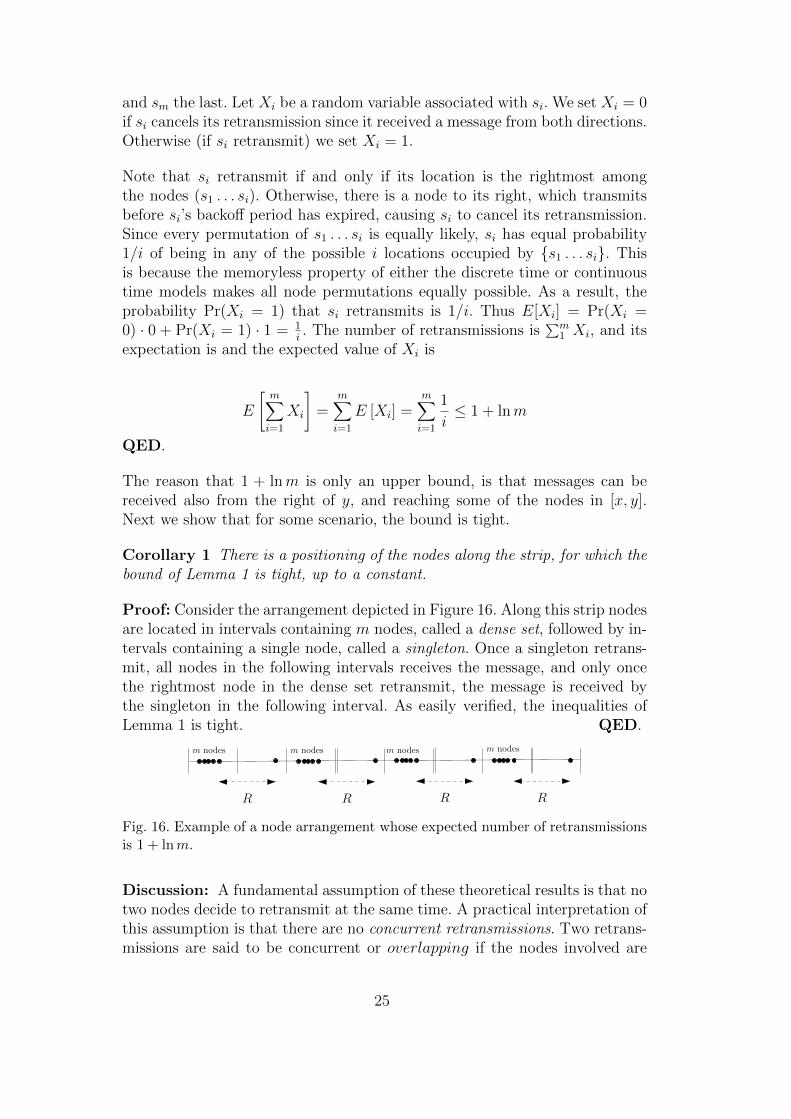
Corollary 1 There is a positioning of the nodes along the strip, for which thebound of Lemma 1 is tight, up to a constant.
Proof: Consider the arrangement depicted in Figure 16. Along this strip nodesare located in intervals containing m nodes, called a dense set, followed by in-tervals containing a single node, called a singleton. Once a singleton retrans-mit, all nodes in the following intervals receives the message, and only oncethe rightmost node in the dense set retransmit, the message is received bythe singleton in the following interval. As easily verified, the inequalities ofLemma 1 is tight. QED.
R R R R
m nodes m nodes m nodes m nodes
Fig. 16. Example of a node arrangement whose expected number of retransmissionsis 1 + lnm.
Discussion: A fundamental assumption of these theoretical results is that notwo nodes decide to retransmit at the same time. A practical interpretation ofthis assumption is that there are no concurrent retransmissions. Two retrans-missions are said to be concurrent or overlapping if the nodes involved are
25
within range of each other and if the difference between their backoff times isless than the retransmission delay. The retransmission delay is the time inter-val from the moment the sender completes the backoff period to the momentthe receiver determines it can cancel its own scheduled retransmission.
Concurrency increases the overhead significantly. Note that n concurrent re-transmissions can increase the overhead by up to n − 1 additional retrans-missions. Consider a set n nodes within range of each other where n − 1nodes complete their backoff period while a retransmission from their right-most neighbor is taking place. There are n− 1 nodes that will not be able tocancel their retransmission even though they all have a neighbor on the rightthat started transmitting first.
Retransmissions can be concurrent without being physically transmitted atsame time, which would amount to having a collision on a shared channel.This happens when the broadcast algorithm is implemented above the MAClayer. There can be nodes that have decided to retransmit the message, butthese packets are still on the system, perhaps traveling down the protocolstack.
The problem with collisions is that the number of retransmissions is not onlyincreased by the concurrency but also because there is a potentially large setof nodes that will not be able to receive some or all of these messages. Thisdisrupts the dynamics of the broadcast operation, resulting in an even largernumber of retransmissions.
7 Simulation Results
The experimental results presented in this section evaluate the performanceproperties of the algorithm. Such properties include retransmission overhead,coverage (reliability), scalability and latency. The SB algorithm was imple-mented at the application level, meaning that the backoff period of the SBalgorithm takes place outside of the MAC layer. Once the backoff period iscomplete, the packet travels down the protocol stack and is handed to theMAC layer, where an additional backoff period is used as a collision avoid-ance mechanism. The MAC protocol used in our simulations is 802.11. Forbroadcast messages, 802.11 is reduced to a simple slotted CSMA protocol.
26
7.1 Comparison with the counter-based algorithm
We first show that in one-dimensional arrangements the SB algorithm per-forms better than algorithms originally designed for two-dimensional arrange-ments. We perform a comparison with the counter based algorithm becausea retransmission strategy based on a counter is not intrinsically related tothe dimensionality of the problem and because the counter-based algorithmperforms very well in two dimensions.
Both algorithms were evaluated for nodes randomly arranged in a one dimen-sional segment whose length is 20 times the transmission range. Fifty nodedistributions were generated for each density and an average was obtainedamong the 50 results. Backoff times are uniformly distributed between 0 and200 milliseconds for both algorithms. In each run, a message is broadcastedfrom the leftmost node.
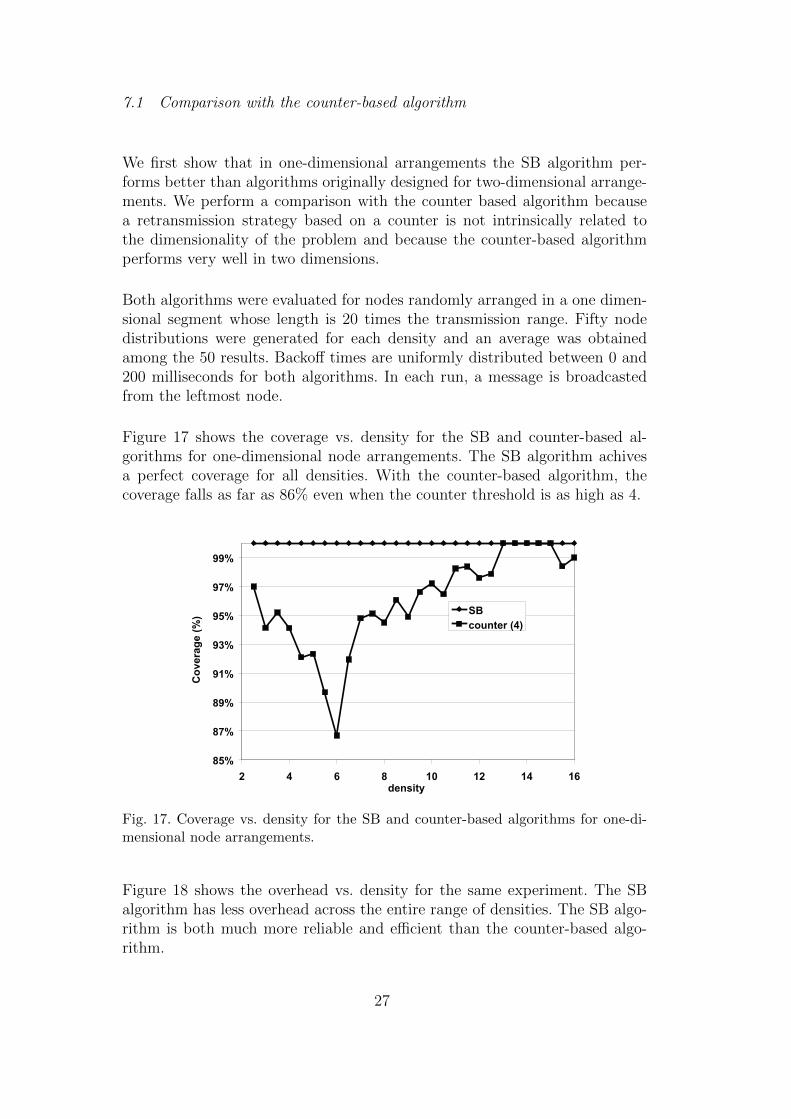
Figure 17 shows the coverage vs. density for the SB and counter-based al-gorithms for one-dimensional node arrangements. The SB algorithm achivesa perfect coverage for all densities. With the counter-based algorithm, thecoverage falls as far as 86% even when the counter threshold is as high as 4.
85%
87%
89%
91%
93%
95%
97%
99%
2 4 6 8 10 12 14 16density
Cov
erag
e (%
) SBcounter (4)
Fig. 17. Coverage vs. density for the SB and counter-based algorithms for one-di-mensional node arrangements.
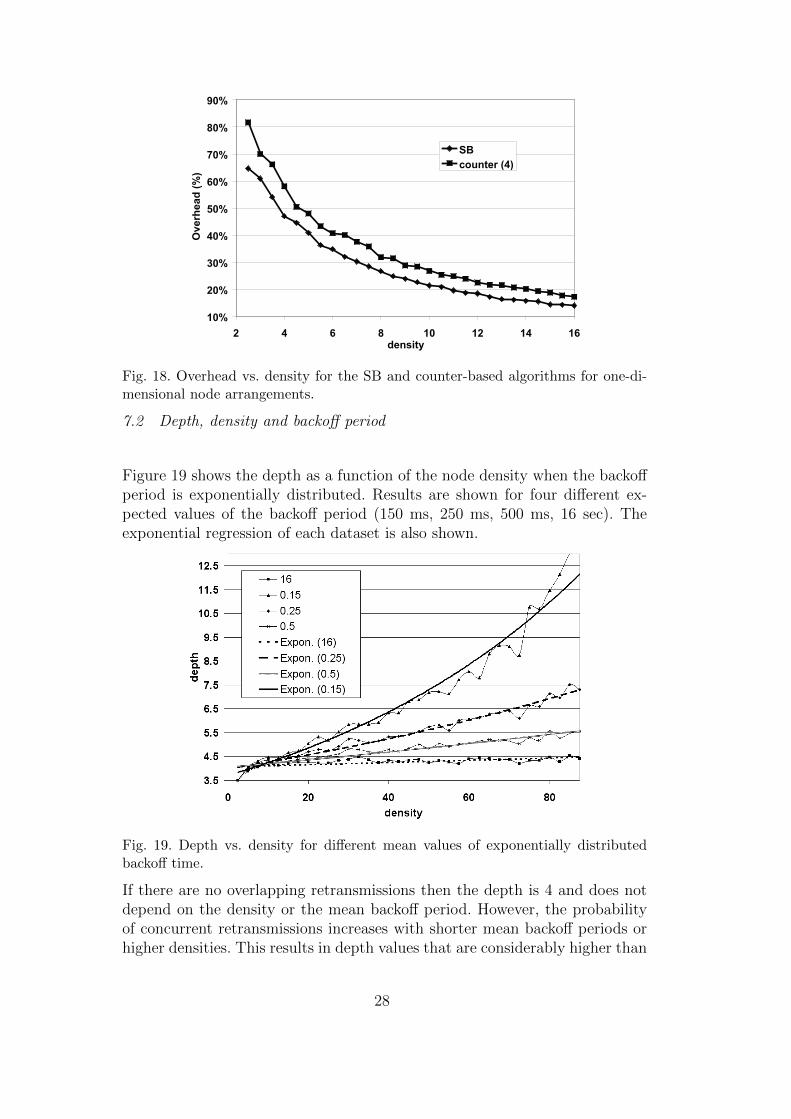
Figure 18 shows the overhead vs. density for the same experiment. The SBalgorithm has less overhead across the entire range of densities. The SB algo-rithm is both much more reliable and efficient than the counter-based algo-rithm.
27
10%
20%
30%
40%
50%
60%
70%
80%
90%
2 4 6 8 10 12 14 16density
Ove
rhea
d (%
)
SBcounter (4)
Fig. 18. Overhead vs. density for the SB and counter-based algorithms for one-di-mensional node arrangements.
7.2 Depth, density and backoff period
Figure 19 shows the depth as a function of the node density when the backoffperiod is exponentially distributed. Results are shown for four different ex-pected values of the backoff period (150 ms, 250 ms, 500 ms, 16 sec). Theexponential regression of each dataset is also shown.
Fig. 19. Depth vs. density for different mean values of exponentially distributedbackoff time.
If there are no overlapping retransmissions then the depth is 4 and does notdepend on the density or the mean backoff period. However, the probabilityof concurrent retransmissions increases with shorter mean backoff periods orhigher densities. This results in depth values that are considerably higher than
28
our theoretical result of 4. Note that the results for the mean backoff periodof 16 seconds confirms that the depth approaches four when the probabilityof concurrent retransmissions is small.
7.3 Latency and Scalability
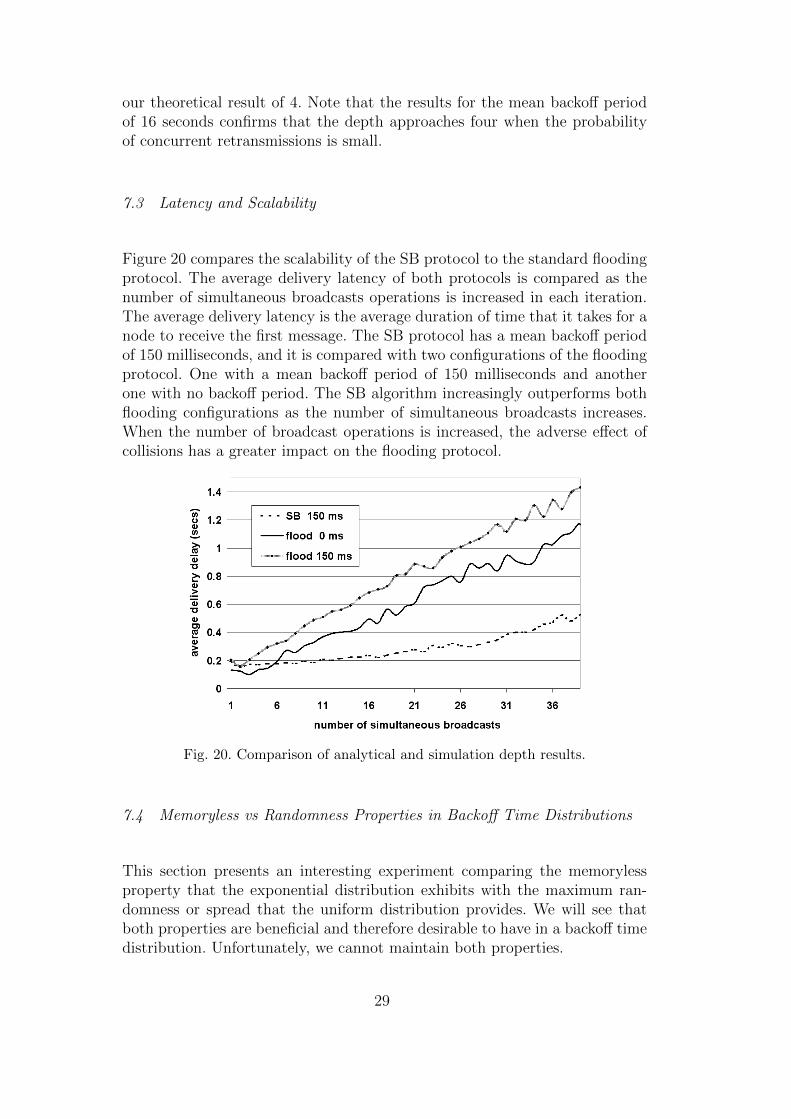
Figure 20 compares the scalability of the SB protocol to the standard floodingprotocol. The average delivery latency of both protocols is compared as thenumber of simultaneous broadcasts operations is increased in each iteration.The average delivery latency is the average duration of time that it takes for anode to receive the first message. The SB protocol has a mean backoff periodof 150 milliseconds, and it is compared with two configurations of the floodingprotocol. One with a mean backoff period of 150 milliseconds and anotherone with no backoff period. The SB algorithm increasingly outperforms bothflooding configurations as the number of simultaneous broadcasts increases.When the number of broadcast operations is increased, the adverse effect ofcollisions has a greater impact on the flooding protocol.
Fig. 20. Comparison of analytical and simulation depth results.
7.4 Memoryless vs Randomness Properties in Backoff Time Distributions
This section presents an interesting experiment comparing the memorylessproperty that the exponential distribution exhibits with the maximum ran-domness or spread that the uniform distribution provides. We will see thatboth properties are beneficial and therefore desirable to have in a backoff timedistribution. Unfortunately, we cannot maintain both properties.
29
Note first that all nodes currently waiting to retransmit did not necessarilystart waiting at the same time since they could have received the first dupli-cate from different nodes at different times. The memoryless property gives allnodes equal probability of being the first one to retransmit because the dura-tion a node backoff is independent the duration it has already waited. This hasa favorable effect on the number of retransmissions. Without the memorylessproperty nodes closer to the source would have a tendency to retransmit firstas they have waited longer. The retransmissions would then be closer to eachother, less nodes are silenced and the broadcast operation propagates slowly.
On the other hand, a uniform discrete distribution has less propensity forcollisions because its probability density function is more evenly spread acrossthe range of values. In other words, a uniform distribution is as random as itgets. This too has a favorable effect on the number of retransmissions. Morerandomness means fewer collisions between duplicates that will potentiallysilence more nodes.
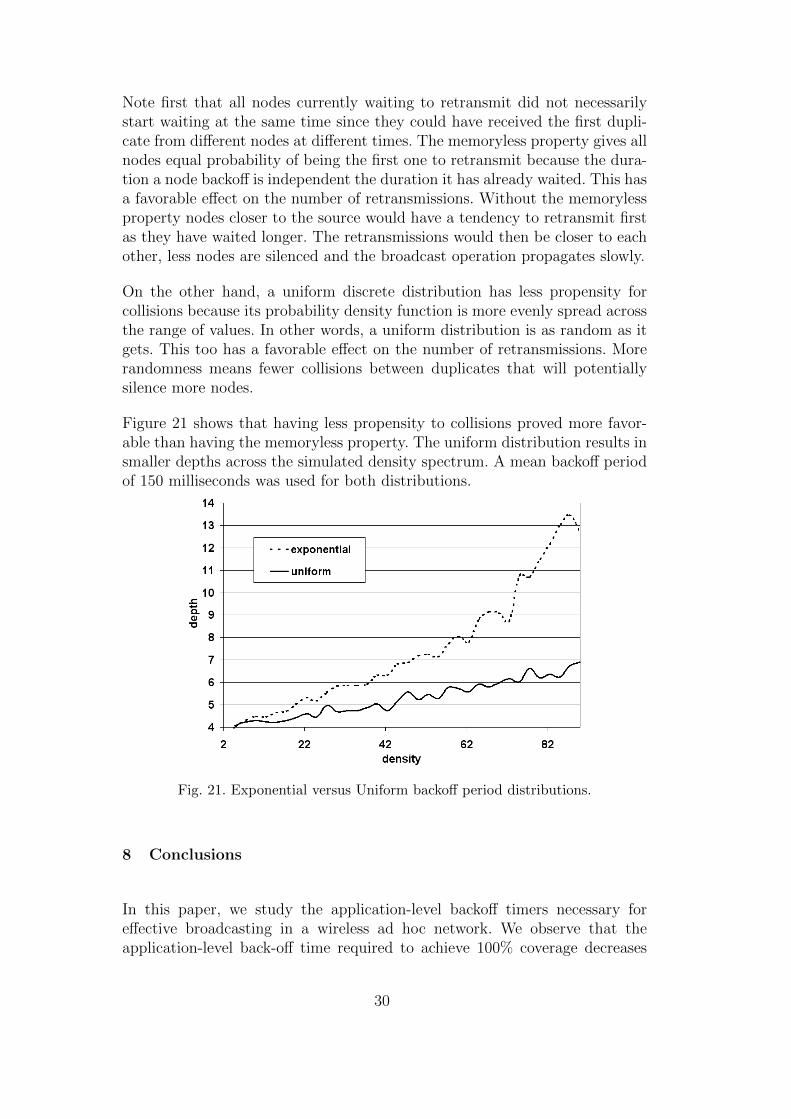
Figure 21 shows that having less propensity to collisions proved more favor-able than having the memoryless property. The uniform distribution results insmaller depths across the simulated density spectrum. A mean backoff periodof 150 milliseconds was used for both distributions.
Fig. 21. Exponential versus Uniform backoff period distributions.
8 Conclusions
In this paper, we study the application-level backoff timers necessary foreffective broadcasting in a wireless ad hoc network. We observe that theapplication-level back-off time required to achieve 100% coverage decreases
30
with increasing node density. At low node densities, smaller application-levelbackoff timers lead to collisions at the MAC layer, achieving less than 100%coverage. Thus, application-level backoff timers are critical at lower node den-sities. With this observation, we studied different strategies for setting theapplication-level backoff timers, and how to use information from the node’sneighbors to determine whether the node should participate in the forwardingprocess.
The Angular retransmission strategy presented in this article has the leastoverhead among all compared strategies. It is a simpler way to implementa retransmission strategy based on location information. Another advantageof the angular strategy is that it can either be implemented with GPS orangle of arrival (AOA) technology. When reliance on these technologies is notpossible, the simplicity and efficiency of the counter-based scheme makes itthe best choice.
A good backoff strategy is important for minimizing the latency and takingadvantage of directional diversity to reduce the overhead. For path discovery,the backoff strategy must also consider the impact on route lifetime. The inv-linear backoff function reduces the latency and overhead without sacrificingpath-duration beyond what can be achieved with random backoff.
This article has presented a broadcasting algorithm for applications such asvehicular broadcasting that can be modeled as a set of nodes arranged ona strip and analyzed as a 1-dimensional arrangement of nodes. Under idealnetwork conditions, the algorithm exhibits a constant overhead independentof the density and therefore scales better than flooding.
The article also analyzes which properties of backoff distributions affect thebroadcasting overhead and show that uniformly distributed backoff times isthe better choice. Another key finding is that waiting for additional duplicatesbefore deciding to retransmit actually decreases the delivery latency becausereducing overhead reduces collisions and speeds up message propagation.
Acknowledgment We would like to thank the anonymous reviewers for theirvaluable comments. We also wish to thank Mikael Degermark for introducingus to the problem. Alon Efrat and Jesus Arango we partially supported byNSF CAREER grant 0348000.
References
[1] J. Arango, M. Degermark, A. Efrat, and S. Pink, “An Efficient FloodingAlgorithm for Ad-hoc Networks,” Proceedings of the Second Workshop on
31
Modeling and Optimizations in Mobile Ad Hoc and Wireless Networks (WiOpt2004), 2004.
[2] J. Arango, A. Efrat, S. Ramasubramanian, M. Krunz, and S. Pink,“Retransmission and Backoff Strategies for Broadcasting in Multi-hopWireless Networks,” Broadband Communications, Networks and Systems, 2006.BROADNETS 2006. 3rd International Conference on, pp. 1–10, 2006.
[3] J. Arango, A. Efrat, S. Ramasubramanian, and M. Krunz, “Onroad VehicularBroadcasting,” Computer Communications and Networks, Proceedings-15thInternational Conference on, pp. 49–55, 2006.
[4] S.-Y. Ni, Y.-C. Tseng, Y.-S. Chen, and J.-P. Sheu, “The Broadcast StormProblem in a Mobile Ad-Hoc Network,” in MobiCom ’99: Proceedings of the5th annual ACM/IEEE international conference on Mobile computing andnetworking. New York, NY, USA: ACM Press, 1999, pp. 151–162.
[5] B. Williams and T. Camp, “Comparison of Broadcasting Techniques for MobileAd Hoc Networks,” in Proceedings of the ACM International Symposium onMobile Ad Hoc Networking and Computing (MOBIHOC), 2002, pp. 194–205.[Online]. Available: citeseer.ist.psu.edu/williams02comparison.html
[6] V. K. Paruchuri, A. Durresi, D. S. Dash, and R. Jain, “Optimal FloodingProtocol for Routing in Ad-hoc Networks,” in IEEE Wireless Communicationsand Networking Conference, March 2003.
[7] J. Cartigny, D. Simplot, and J. Carle, “Stochastic flooding broadcast protocolsin mobile wireless networks,” Technical Report LIFL Univ. Lille 1 2002-03, May2002.
[8] E. Pagani and G. P. Rossi, “Providing Reliable and Fault Tolerant BroadcastDelivery in Mobile Ad-hoc Networks.” MONET, vol. 4, no. 3, pp. 175–192, 1999.
[9] I. Stojmenovic, M. Seddigh, and J. Zunic, “Dominating Sets and NeighborElimination-Based Broadcasting Algorithms in Wireless Networks,” IEEETransactions on Parallel and Distributed Systems, vol. 13, no. 1, pp. 14–25,2002. [Online]. Available: citeseer.ist.psu.edu/stojmenovic01dominating.html
[10] J. Wu and H. Li, “A Dominating-Set-Based Routing Scheme in Ad HocWireless Networks,” Telecommunication Systems, vol. 18, no. 1-3, pp. 13–36,2001. [Online]. Available: citeseer.csail.mit.edu/wu99dominatingsetbased.html
[11] H. Zhang and Z.-P. Jiang, “Analysis of two ad hoc broadcasting protocols,”in IEEE Wireless Communications and Networking Conference, Atlanta, GA,March 2004, pp. 21–25.
[12] L. B. Michael and M. Nakagawa, “Non-Platoon Inter-Vehicle CommunicationUsing Multiple Hops,” IEICE Trans. Commun, vol. E82-B, no. 10, October1999.
[13] M. T. Sun, W. C. Feng, T. H. Lai, K. Yamada, and H. Okada, “GPS-BasedMessage Broadcast for Adaptive Inter-Vehicle Communications,” in IEEE VTC,2000.
32
[14] H. Wu, R. Fijimoto, and G. Riley, “Analytical Models for InformationPropagation in Vehicle-to Vehicle Networks,” in IEEE VTC, 2004.
[15] T. V. Project, “The ns Manual,” Available in html, postscript and PDF,December 2003.
[16] K. Obraczka, K. Viswanath, and G. Tsudik, “Flooding for reliable multicast inmulti-hop ad hoc networks,” Wirel. Netw., vol. 7, no. 6, pp. 627–634, 2001.
[17] D. Niculescu and B. Nath, “VOR Base Stations For Indoor 802.11 Positioning,”in MobiCom ’04: Proceedings of the 10th annual international conference onMobile computing and networking. New York, NY, USA: ACM Press, 2004,pp. 58–69.
[18] R. Graham, B. Lubachevsky, K. Nurmela, and P. Ostergard, “Dense packingsof congruent circles in a circle,” Discrete Mathematics, vol. 181, no. 1, pp. 139–15, February 1998, a good reference to what is known about packing congruentcircles in a circle.
[19] H. Fußler, J. Widmer, M. Kasemann, M. Mauve, and H. Hartenstein,“Contention-based forwarding for mobile ad hoc networks,” Ad-Hoc Networks,vol. 1, no. 4, pp. 351–369, 2003.
[20] H. Fler, J. Widmer, M. Ksemann, M. Mauve, and H. Hartenstein, “BeaconlessPosition-Based Routing for Mobile Ad-Hoc Networks,” Department ofComputer Science, University of Mannheim, Tech. Rep. TR-03-001, Feb 2003.
[21] D. B. Johnson, D. A. Maltz, and J. Broch, DSR: The Dynamic Source RoutingProtocol for Multi-Hop Wireless Ad Hoc Networks. Addison-Wesley, 2001,ch. 5, pp. 139–172.
[22] C. E. Perkins and E. M. Royer, “Ad-hoc On-Demand Distance Vector Routing,”in 2nd IEEE Workshop on Mobile Computing Systems and Applications,WMCSA. New Orleans, Lousiana, USA: IEEE, February 1999, pp. 90–100.
33


![Monte Carlo Strength Evaluation: Fast and Reliable ... · of a backo technique to improve n-gram models [19] and amending PCFGs to include semantic patterns [28] and to better suit](https://img.pdfslide.net/doc/110x75/5e871e397d3acd78e66864d3/monte-carlo-strength-evaluation-fast-and-reliable-of-a-backo-technique-to-improve.jpg)