Embed Size (px)
Citation preview
Technical Report Documentation Page 1. Report No. FHWA/TX-05/0-4419-5
2. Government Accession No.
3. Recipient's Catalog No. 5. Report Date May 2004 Resubmitted: October 2004 Resubmitted: July 2005 Resubmitted: October 2005
4. Title and Subtitle R ETROFIT RAILINGS FOR TRUSS BRIDGES
6. Performing Organization Code
7. Author(s) C. Eugene Buth, William F. Williams, Wanda L. Menges, and Rebecca R. Haug
8. Performing Organization Report No. Report 0-4419-5
10. Work Unit No. (TRAIS)
9. Performing Organization Name and Address Texas Transportation Institute The Texas A&M University System College Station, Texas 77843-3135
11. Contract or Grant No. Project 0-4419 13. Type of Report and Period Covered Technical Report: September 2001 – April 2004
1 2. Sponsoring Agency Name and Address
Texas Department of Transportation Research and Technology Implementation Office P.O. Box 5080 A ustin, Texas 78763-5080
14. Sponsoring Agency Code
15. Supplementary Notes Project performed in cooperation with the Texas Department of Transportation and the Federal Highway Administration. Project Title: Retrofit Railing for Existing Truss Bridges URL: http//tti.tamu.edu/documents/0-4419-5.pdf 16. Abstract
In 2003, there were 38 metal truss bridges 50 years of age or older remaining on the State of Texas
highway system. Of these 38 bridges, 33 are listed in the National Register of Historic Places. Many of these bridges do not meet current design criteria for rehabilitation due to narrow deck widths, low vertical clearance, and substandard load capacity. In addition, the existing bridge railing systems on these bridges have not been shown to meet the current requirements for safety and strength. This project addressed the design and performance of acceptable traffic railings for existing and new truss bridges in Texas. Specific objectives were to:
• design/develop a retrofit railing for low-speed application on the Roy B. Inks Bridge in Llano, Texas;
• design/develop a retrofit railing for high-speed application on the U.S. 281 Bridge over the Brazos River in Palo Pinto County, Texas;
• identify criteria that can serve as a basis for design exceptions; and design/develop a traffic railing for new truss bridges.
17. Key Words Bridge Rail, Crash Test, Longitudinal Barriers, Roadside Safety, Truss Bridge
18. Distribution Statement No restrictions. This document is available to the public through NTIS: National Technical Information Service Springfield, Virginia 22161 http://www.ntis.gov
19. Security Classif.(of this report) Unclassified
20. Security Classif.(of this page) Unclassified
21. No. of Pages
272
22. Price
Form DOT F 1700.7 (8-72) Reproduction of completed page authorized


RETROFIT RAILINGS FOR TRUSS BRIDGES
by
C. Eugene Buth, P.E. Senior Research Engineer
Texas Transportation Institute
William F. Williams, P.E. Assistant Research Engineer
Texas Transportation Institute
Wanda L. Menges Associate Research Specialist Texas Transportation Institute
and
Rebecca R. Haug
Assistant Research Specialist Texas Transportation Institute
Report 0-4419-5 Project 0-4419
Project Title: Retrofit Railing for Existing Truss Bridges
Performed in Cooperation with Texas Department of Transportation
and the Federal Highway Administration
May 2004 Resubmitted: October 2004
Resubmitted: July 2005 Resubmitted: October 2005
TEXAS TRANSPORTATION INSTITUTE The Texas A&M University System College Station, Texas 77843-3135

DISCLAIMER
The contents of this report reflect the views of the authors, who are responsible for the facts and the accuracy of the data, opinions, findings, and conclusions presented herein. The contents do not necessarily reflect the official view or policies of the Texas Department of Transportation (TxDOT), Federal Highway Administration (FHWA), The Texas A&M University System, or the Texas Transportation Institute. This report does not constitute a standard, specification, or regulation, and its contents are not intended for construction, bidding, or permit purposes. In addition, the above listed agencies assume no liability for its contents or use thereof. The names of specific products or manufacturers listed herein do not imply endorsement of those products or manufacturers. The engineer in charge was C. Eugene Buth, P.E. (Texas, #27579).
v
ACKNOWLEDGMENTS
This research project was conducted under a cooperative program between the Texas Transportation Institute, the Texas Department of Transportation, and the U.S. Department of Transportation, Federal Highway Administration. The TxDOT program coordinator for this research was David P. Hohmann, P.E.; the project director was Charles E. Walker, P.E.; and the project monitor was Mark J. Bloschock, P.E. The valuable guidance and assistance of Mr. Hohmann, Mr. Walker, and Mr. Bloschock throughout the course of this project are acknowledged and appreciated.
vi
TABLE OF CONTENTS
Page LIST OF FIGURES ....................................................................................................................... ix LIST OF TABLES........................................................................................................................ xii CHAPTER 1. INTRODUCTION ................................................................................................... 1
BACKGROUND ........................................................................................................................ 1 OBJECTIVES/SCOPE OF RESEARCH ................................................................................... 1
CHAPTER 2. TESTING AND EVALUATION............................................................................ 5
TEST FACILITY........................................................................................................................ 5 CRASH TEST CONDITIONS ................................................................................................... 5 EVALUATION CRITERIA ....................................................................................................... 6
CHAPTER 3. LLANO TRUSS BRIDGE RAIL ............................................................................ 7
ANALYSIS AND DESIGN ....................................................................................................... 7 TEST INSTALLATION PROTOTYPE..................................................................................... 9 TEST NO. 444193-1 (NCHRP REPORT 350 TEST NO. 2-11) .............................................. 33
Test Vehicle .......................................................................................................................... 33 Soil and Weather Conditions ................................................................................................ 37 Test Description .................................................................................................................... 37 Damage to Test Installation .................................................................................................. 37 Vehicle Damage.................................................................................................................... 40 Occupant Risk Factors .......................................................................................................... 40
ASSESSMENT OF TEST RESULTS...................................................................................... 40 CHAPTER 4. U.S. 281 TRUSS BRIDGE RAIL ......................................................................... 47
ANALYSIS AND DESIGN ..................................................................................................... 47 TEST INSTALLATION PROTOTYPE................................................................................... 48 TEST NO. 444193-2 (NCHRP REPORT 350 TEST NO. 3-11) .............................................. 53
Test Vehicle .......................................................................................................................... 53 Soil and Weather Conditions ................................................................................................ 53 Test Description .................................................................................................................... 57 Damage to Test Installation .................................................................................................. 57 Vehicle Damage.................................................................................................................... 57 Occupant Risk Factors .......................................................................................................... 62
ASSESSMENT OF TEST RESULTS...................................................................................... 62 CHAPTER 5. DESIGN EXCEPTIONS ....................................................................................... 67
BACKGROUND ...................................................................................................................... 67 ANALYSIS............................................................................................................................... 68 CONCLUSION......................................................................................................................... 71
vii
TABLE OF CONTENTS (CONTINUED)
Page CHAPTER 6. TRAFFIC RAIL FOR NEW TRUSS BRIDGES ................................................. 73
BACKGROUND ...................................................................................................................... 73 DEVELOPMENT OF THE DESIGN ...................................................................................... 73
SUMMARY OF THE DESIGN ........................................................................................... 74 EVALUATION OF NEW RAILING DESIGN FOR DEER CREEK TRUSS BRIDGE........ 81
Details of 98-ft (29.9 m) Deer Creek Truss Bridge .............................................................. 81 Analyses of 98-ft (29.9 m) Deer Creek Truss Bridge........................................................... 81
CHAPTER 7. SUMMARY OF FINDINGS................................................................................ 83
LLANO TRUSS BRIDGE RAIL ............................................................................................. 83 U.S. 281 TRUSS BRIDGE RAIL............................................................................................. 83 DESIGN EXCEPTIONS .......................................................................................................... 84 TRAFFIC RAIL FOR NEW TRUSS BRIDGES ..................................................................... 84
CHAPTER 8. IMPLEMENTATION........................................................................................... 87 REFERENCES ............................................................................................................................. 91 APPENDIX A. CRASH TEST PROCEDURES AND DATA ANALYSIS ............................... 93
ELECTRONIC INSTRUMENTATION AND DATA PROCESSING ................................... 93 ANTHROPOMORPHIC DUMMY INSTRUMENTATION................................................... 94 PHOTOGRAPHIC INSTRUMENTATION AND DATA PROCESSING ............................. 94 TEST VEHICLE PROPULSION AND GUIDANCE.............................................................. 94
APPENDIX B. DESIGN OF RETROFIT RAIL FOR ROY B. INKS BRIDGE OVER LLANO RIVER, LLANO, TEXAS.............................................................................. 95 APPENDIX C. ANALYSES OF BRIDGE TRUSS MEMBERS SUPPORTING RETROFIT RAIL, ROY B. INKS BRIDGE OVER LLANO RIVER, LLANO, TEXAS....................... 117 APPENDIX D. TEST VEHICLE PROPERTIES AND INFORMATION............................... 189 APPENDIX E. SEQUENTIAL PHOTOGRAPHS ................................................................... 189 APPENDIX F. VEHICLE ANGULAR DISPLACEMENTS AND ACCELERATIONS........ 201 APPENDIX G. DESIGN OF RETROFIT RAIL, U.S. 281 BRIDGE OVER BRAZOS RIVER, PALO PINTO COUNTY, TEXAS.......................................................... 215 APPENDIX H. ANALYSES OF BRIDGE RAIL DESIGN FOR NEW TRUSS BRIDGES.. 241
viii
LIST OF FIGURES Figure Page 1 Overall Layout of the Llano Truss Bridge Installation......................................................10 2 Layout of the Foundation for Llano Truss Bridge Installation. .........................................11 3 Rebar Details of the Foundation for Llano Truss Bridge Installation. ..............................12 4 Cross Section of Post 2. .....................................................................................................13 5 Cross Section of Posts 3, 4, 6, 7, 10, and 11......................................................................14 6 Cross Section of Post 5. .....................................................................................................15 7 Cross Section of Posts 8 and 12.........................................................................................16 8 Cross Section of Posts 1, 9, and 13....................................................................................17 9 Details of Concrete Curb and Deck. ..................................................................................18 10 Rebar Details for Concrete Curb and Bridge Rail Posts....................................................19 11 Rebar Details for Concrete Curb and Deck. ......................................................................20 12 Details of Connecting Angles. ...........................................................................................21 13 Stringer Details for Posts 3 and 4. .....................................................................................22 14 Stringer Details for Posts 6 and 7. .....................................................................................23 15 Stringer Details for Posts 10 and 11. .................................................................................24 16 Details of Girder and Interior Stringer...............................................................................25 17 Details of Bridge Rail Posts. ..............................................................................................26 18 Details of Bridge Rail Posts, Baseplate, Blockouts, and Crushable Steel Pipe Tube. .........................................................................................27 19 Details of C12x20.7 Bridge Rail........................................................................................28 20 Details of TS 4x8x1/2 Splice. ............................................................................................29 21 Details of 8x8x3/8 Tube and C12x20.7 Splice. .................................................................30 22 Details of C12x20.7 and TS 4x8x1/2 Bridge Rail. ............................................................31 23 Details of TS 4x8x1/2 Bridge Rail.....................................................................................32 24 Llano Truss Bridge Installation before Test 444193-1. .....................................................34 25 Vehicle/Installation Geometrics for Test 444193-1...........................................................35 26 Vehicle before Test 444193-1............................................................................................36 27 After Impact Trajectory Path for Test 444193-1. ..............................................................38 28 Installation after Test 444193-1. ........................................................................................39 29 Vehicle after Test 444193-1...............................................................................................41 30 Interior of Vehicle for Test 444193-1................................................................................42 31 Summary of Results for NCHRP Report 350 Test 2-11 on the Llano Truss Bridge Rail..........................................................................................43 32 Overall Details of the U.S. 281 Truss Bridge Installation. ................................................49 33 Fabrication and Assembly Details for U.S. 281 Truss Bridge Installation........................50 34 C-Channel and W-Beam Details for U.S. 281 Truss Bridge Installation. .........................51 35 W-Beam and Rebar Details for U.S. 281 Truss Bridge Installation..................................52 36 U.S. 281 Truss Bridge Installation before Test 444193-2. ................................................54 37 Vehicle/Installation Geometrics for Test 444193-2...........................................................55 38 Vehicle before Test 444193-2............................................................................................56 39 After Impact Trajectory Path for Test 444193-2. ..............................................................58 40 Installation after Test 444193-2. ........................................................................................59
ix
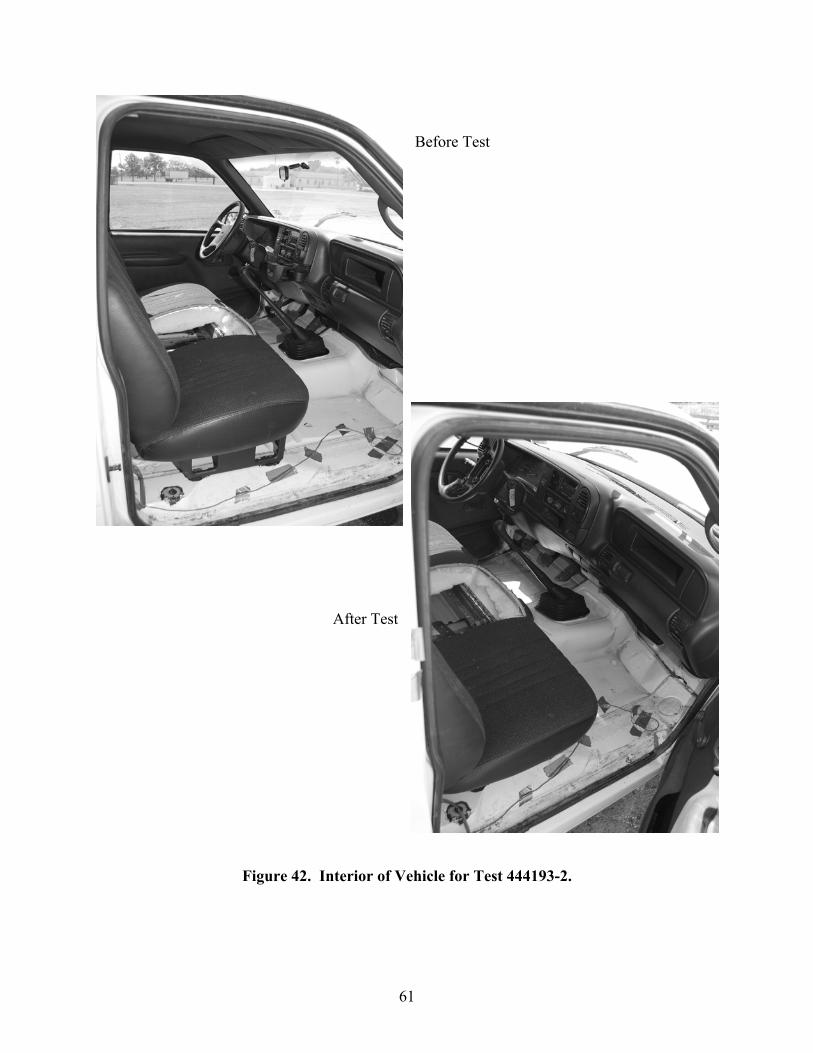
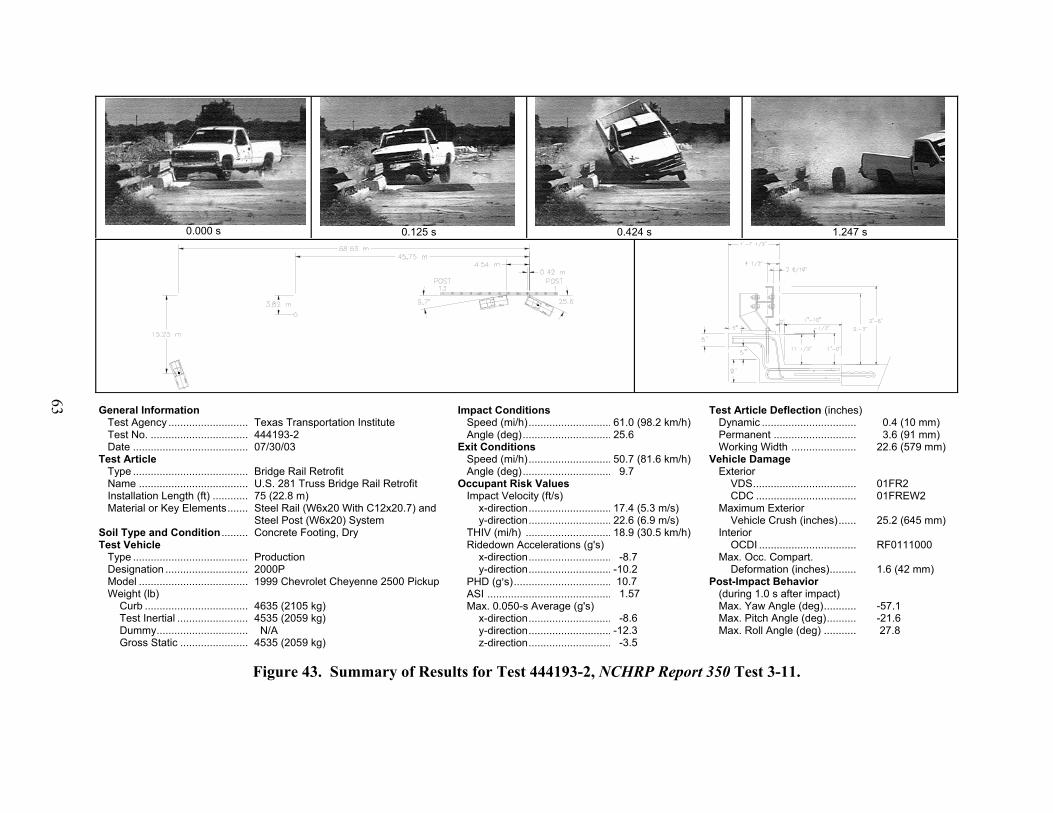
LIST OF FIGURES (CONTINUED) Figure Page 41 Vehicle after Test 444193-2...............................................................................................60 42 Interior of Vehicle for Test 444193-2................................................................................61 43 Summary of Results for Test 444193-2, NCHRP Report 350 Test 3-11...........................63 44 Geometrics for Point-Mass Model.....................................................................................69 45 Encroachment Angle Versus Speed...................................................................................69 46 Mathematical Model of Vehicle-Barrier Railing Collision. ..............................................70
47 Details of the Recommended Crushable Pipe Blockout .....................................................75 48 Details of Recommended New Bridge Rail Design. ..........................................................76 49 Plot of Force (kips) Versus Crush Distance (inches) for 10-inch (254 mm)
Schedule 80, A53 Grade B Pipe BlockOut, 6 inches (152 mm) in Length. .......................77 50 Crash Loads at Intermediate Truss Members. ....................................................................79 51 Crash Loads at End Truss Members. ..................................................................................80 52 Superimposed Crash Loads from New Truss-Mounted Bridge Rail
for Deer Creek Bridge Analysis..........................................................................................82 53 Configuration of Design Crash Loads at Intermediate Truss Members. ............................88 54 Configuration of Design Crash Loads at End Truss Members. ..........................................89 55 Vehicle Properties for Test 444193-1. ..............................................................................189 56 Vehicle Properties for Test 444193-2. ..............................................................................192 57 Sequential Photographs for Test 444193-1
(Overhead and Frontal Views)..........................................................................................195 58 Sequential Photographs for Test 444193-1
(Rear View).......................................................................................................................197 59 Sequential Photographs for Test 444193-2
(Overhead and Frontal Views)..........................................................................................198 60 Sequential Photographs for Test 444193-2
(Rear View).......................................................................................................................200 61 Vehicular Angular Displacements for Test 444193-1. .....................................................201 62 Vehicle Longitudinal Accelerometer Trace for Test 444193-1
(Accelerometer Located at Center of Gravity [CG]). .......................................................202 63 Vehicle Lateral Accelerometer Trace for Test 444193-1
(Accelerometer Located at Center of Gravity [CG]). .......................................................203 64 Vehicle Vertical Accelerometer Trace for Test 444193-1
(Accelerometer Located at Center of Gravity [CG]). .......................................................204 65 Vehicle Longitudinal Accelerometer Trace for Test 444193-1 (Accelerometer Located over Rear Axle). ........................................................................205 66 Vehicle Lateral Accelerometer Trace for Test 444193-1 (Accelerometer Located over Rear Axle). ........................................................................206 67 Vehicle Vertical Accelerometer Trace for Test 444193-1 (Accelerometer Located over Rear Axle). ........................................................................207 68 Vehicular Angular Displacements for Test 444193-2. .....................................................208 69 Vehicle Longitudinal Accelerometer Trace for Test 444193-2 (Accelerometer Located at Center of Gravity [CG]). .......................................................209
x
LIST OF FIGURES (CONTINUED) Figure Page
70 Vehicle Lateral Accelerometer Trace for Test 444193-2 (Accelerometer Located at Center of Gravity [CG]). .......................................................210 71 Vehicle Vertical Accelerometer Trace for Test 444193-2 (Accelerometer Located at Center of Gravity [CG]). .......................................................211 72 Vehicle Longitudinal Accelerometer Trace for Test 444193-2 (Accelerometer Located over Rear Axle). ........................................................................212 73 Vehicle Lateral Accelerometer Trace for Test 444193-2 (Accelerometer Located over Rear Axle). ........................................................................213 74 Vehicle Vertical Accelerometer Trace for Test 444193-2 (Accelerometer Located over Rear Axle). ........................................................................214
xi
LIST OF TABLES Table Page 1 Recommended Lateral Design Loads for Intermediate Steel Truss Members. .................79 2 Recommended Lateral Design Loads at End Steel Truss Member
and Adjacent Member........................................................................................................80 3 Performance Evaluation Summary for NCHRP Report 350 Test 2-11
on the Llano Truss Bridge Rail..........................................................................................85 4 Performance Evaluation Summary for NCHRP Report 350 Test 3-11
on the U.S. 281 Truss Bridge Rail. ....................................................................................86 5 Design Transverse Crash Loads for Intermediate Steel Truss Members...........................88 6 Design Transverse Crash Loads at End Steel Truss Member and Adjacent Member. ......89 7 Exterior Crush Measurements for Test 444193-1............................................................190 8 Occupant Compartment Measurements for Test 444193-1. ............................................191 9 Exterior Crush Measurements for Test 444193-2............................................................193 10 Occupant Compartment Measurements for Test 444193-2. ............................................194
xii
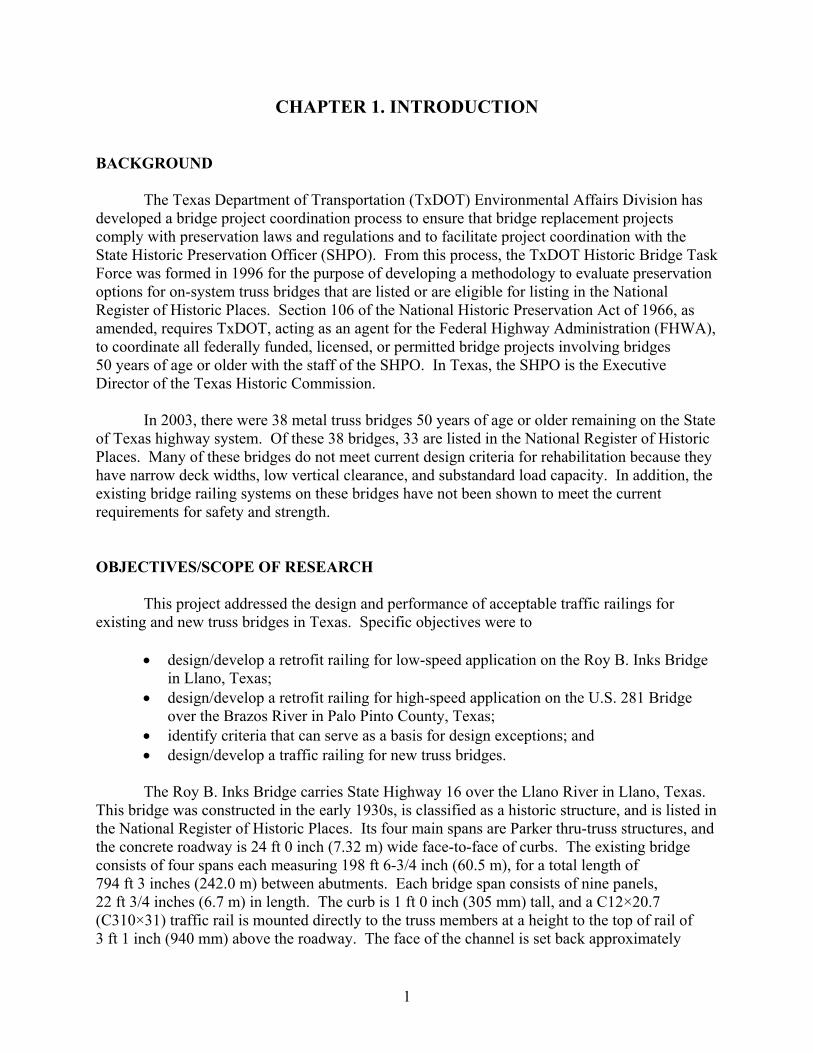
CHAPTER 1. INTRODUCTION BACKGROUND The Texas Department of Transportation (TxDOT) Environmental Affairs Division has developed a bridge project coordination process to ensure that bridge replacement projects comply with preservation laws and regulations and to facilitate project coordination with the State Historic Preservation Officer (SHPO). From this process, the TxDOT Historic Bridge Task Force was formed in 1996 for the purpose of developing a methodology to evaluate preservation options for on-system truss bridges that are listed or are eligible for listing in the National Register of Historic Places. Section 106 of the National Historic Preservation Act of 1966, as amended, requires TxDOT, acting as an agent for the Federal Highway Administration (FHWA), to coordinate all federally funded, licensed, or permitted bridge projects involving bridges 50 years of age or older with the staff of the SHPO. In Texas, the SHPO is the Executive Director of the Texas Historic Commission.
In 2003, there were 38 metal truss bridges 50 years of age or older remaining on the State of Texas highway system. Of these 38 bridges, 33 are listed in the National Register of Historic Places. Many of these bridges do not meet current design criteria for rehabilitation because they have narrow deck widths, low vertical clearance, and substandard load capacity. In addition, the existing bridge railing systems on these bridges have not been shown to meet the current requirements for safety and strength. OBJECTIVES/SCOPE OF RESEARCH This project addressed the design and performance of acceptable traffic railings for existing and new truss bridges in Texas. Specific objectives were to
• design/develop a retrofit railing for low-speed application on the Roy B. Inks Bridge in Llano, Texas;
• design/develop a retrofit railing for high-speed application on the U.S. 281 Bridge over the Brazos River in Palo Pinto County, Texas;
• identify criteria that can serve as a basis for design exceptions; and • design/develop a traffic railing for new truss bridges.
The Roy B. Inks Bridge carries State Highway 16 over the Llano River in Llano, Texas. This bridge was constructed in the early 1930s, is classified as a historic structure, and is listed in the National Register of Historic Places. Its four main spans are Parker thru-truss structures, and the concrete roadway is 24 ft 0 inch (7.32 m) wide face-to-face of curbs. The existing bridge consists of four spans each measuring 198 ft 6-3/4 inch (60.5 m), for a total length of 794 ft 3 inches (242.0 m) between abutments. Each bridge span consists of nine panels, 22 ft 3/4 inches (6.7 m) in length. The curb is 1 ft 0 inch (305 mm) tall, and a C12×20.7 (C310×31) traffic rail is mounted directly to the truss members at a height to the top of rail of 3 ft 1 inch (940 mm) above the roadway. The face of the channel is set back approximately
1
6 inches (152 mm) behind the top face of the curb. The existing configuration does not provide a high level of protection to the truss members from errant vehicular impacts. The bridge is to be rehabilitated by TxDOT, and the crashworthiness of the existing traffic railing is considered inadequate by current standards. The posted speed limit on the bridge is 40 mi/h (64 km/h). National Cooperative Highway Research Program (NCHRP) Report 350 Test Level 2 (TL-2) is appropriate for this posted speed limit (1).The bridge needed a TL-2 retrofit railing that would be compatible with the appearance of the existing bridge and require minimum structural modifications to the existing bridge superstructure.
The U.S. 281 Bridge over the Brazos River in Palo Pinto County, Texas, is a three-span, steel Warren-type truss bridge with verticals. This bridge was constructed in the early 1930s, is classified as a historic structure, and is listed in the National Register of Historic Places. Two of the three spans measure 202 ft (61.6 m), and the longer middle span measures 252 ft 6 inches (77 m). The total length of the truss bridge is 656 ft 6 inches (200 m). The 202-ft spans have eight 25 ft 3 inch (7.7 m) panels, and the middle span, which is 252 ft 6 inches (77.0 m) in length, has ten 25 ft 3 inch (7.7 m) panels. The clear roadway width is 24 ft 0 inch (7.3 m) between the top faces of the curbs. The total length of the bridge including the approach spans is 1138 ft 4 inches (347 m). The existing curb is 1 ft 0 in (305 mm) tall and 1 ft 7-1/2 inches (495 mm) in width. A C12×20.7 (C310×31) traffic rail is mounted directly to the truss members; height to the top of rail from the roadway is 3 ft 1 inch (940 mm). The face of the channel is set back approximately 1 ft 6 inches (457 mm) behind the top face of the curb. The existing configuration does not provide a high level of protection to the truss members from errant vehicular impacts. The bridge is to be rehabilitated by TxDOT, and the crashworthiness of the existing traffic railing is considered inadequate by current standards. The posted speed limit on the bridge is 60 mi/h (97 km/h). NCHRP Report 350 Test Level 3 (TL-3) is appropriate for this posted speed limit. The bridge needed a TL-3 retrofit railing that would be compatible with the appearance of the existing bridge and require minimum structural modifications. Many existing historic through-truss bridges are located on highways with posted speed limits greater than 45 mi/h (72 km/h), and a TL-3 bridge railing would be indicated. Some of these bridges are narrow, and the impact speed and angle combination for TL-3 might not be appropriate. For these bridges, direct application of design loads for a TL-3 condition may lead to extensive and unnecessary alteration of original truss members. The objective of this portion of the project was to investigate methods for evaluating the response of existing truss bridge members to impact forces resulting from mounting a TL-3 retrofit rail directly to an existing historic truss. TxDOT plans several new truss bridges throughout the state. The typical new truss is assumed to be a Warren-type or Pratt-type pony truss with vertical truss web members at each panel point. Currently, the bridge railing proposed for these structures is a standard TxDOT railing, the T101, which is supported by a cast-in-place concrete deck. TxDOT would prefer to have the option to support a bridge rail system from the truss members in lieu of supporting the railing from the concrete deck. The primary advantage of using a truss-supported bridge rail is to allow alternate types of deck. One disadvantage to using a truss-supported bridge rail is that the bridge structure must be adequately designed to resist the crash loads imparted from the bridge rail directly to the truss members. A truss-mounted bridge railing system provides the
2

bridge designer with more options and greater flexibility in designing steel truss bridges. The objective of this phase of the project was to design a truss-mounted bridge rail system for new Pratt-type or Warren-type trusses that have vertical truss members rigidly connected to transverse floorbeams. The railing was to be designed for installation by bolted connection to vertical members spaced 20 ft (6.1 m) or less apart.
3

..
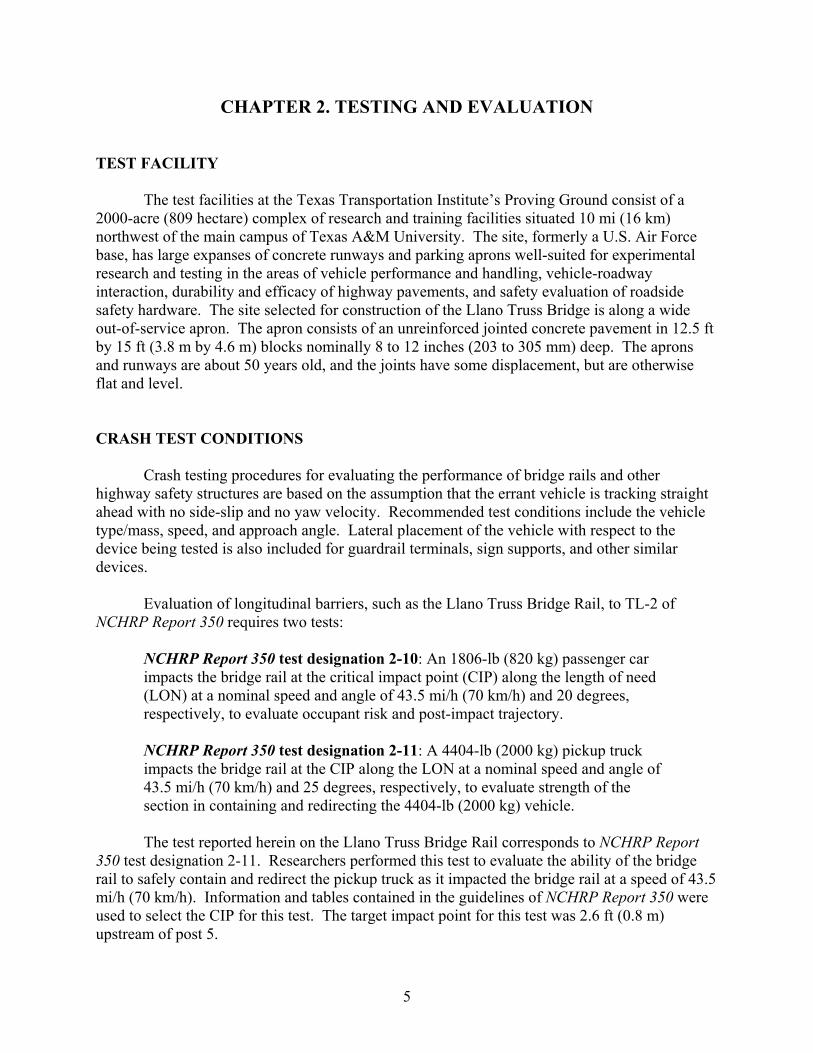
CHAPTER 2. TESTING AND EVALUATION TEST FACILITY The test facilities at the Texas Transportation Institute’s Proving Ground consist of a 2000-acre (809 hectare) complex of research and training facilities situated 10 mi (16 km) northwest of the main campus of Texas A&M University. The site, formerly a U.S. Air Force base, has large expanses of concrete runways and parking aprons well-suited for experimental research and testing in the areas of vehicle performance and handling, vehicle-roadway interaction, durability and efficacy of highway pavements, and safety evaluation of roadside safety hardware. The site selected for construction of the Llano Truss Bridge is along a wide out-of-service apron. The apron consists of an unreinforced jointed concrete pavement in 12.5 ft by 15 ft (3.8 m by 4.6 m) blocks nominally 8 to 12 inches (203 to 305 mm) deep. The aprons and runways are about 50 years old, and the joints have some displacement, but are otherwise flat and level. CRASH TEST CONDITIONS Crash testing procedures for evaluating the performance of bridge rails and other highway safety structures are based on the assumption that the errant vehicle is tracking straight ahead with no side-slip and no yaw velocity. Recommended test conditions include the vehicle type/mass, speed, and approach angle. Lateral placement of the vehicle with respect to the device being tested is also included for guardrail terminals, sign supports, and other similar devices.
Evaluation of longitudinal barriers, such as the Llano Truss Bridge Rail, to TL-2 of NCHRP Report 350 requires two tests:
NCHRP Report 350 test designation 2-10: An 1806-lb (820 kg) passenger car impacts the bridge rail at the critical impact point (CIP) along the length of need (LON) at a nominal speed and angle of 43.5 mi/h (70 km/h) and 20 degrees, respectively, to evaluate occupant risk and post-impact trajectory.
NCHRP Report 350 test designation 2-11: A 4404-lb (2000 kg) pickup truck impacts the bridge rail at the CIP along the LON at a nominal speed and angle of 43.5 mi/h (70 km/h) and 25 degrees, respectively, to evaluate strength of the section in containing and redirecting the 4404-lb (2000 kg) vehicle.
The test reported herein on the Llano Truss Bridge Rail corresponds to NCHRP Report 350 test designation 2-11. Researchers performed this test to evaluate the ability of the bridge rail to safely contain and redirect the pickup truck as it impacted the bridge rail at a speed of 43.5 mi/h (70 km/h). Information and tables contained in the guidelines of NCHRP Report 350 were used to select the CIP for this test. The target impact point for this test was 2.6 ft (0.8 m) upstream of post 5.
5
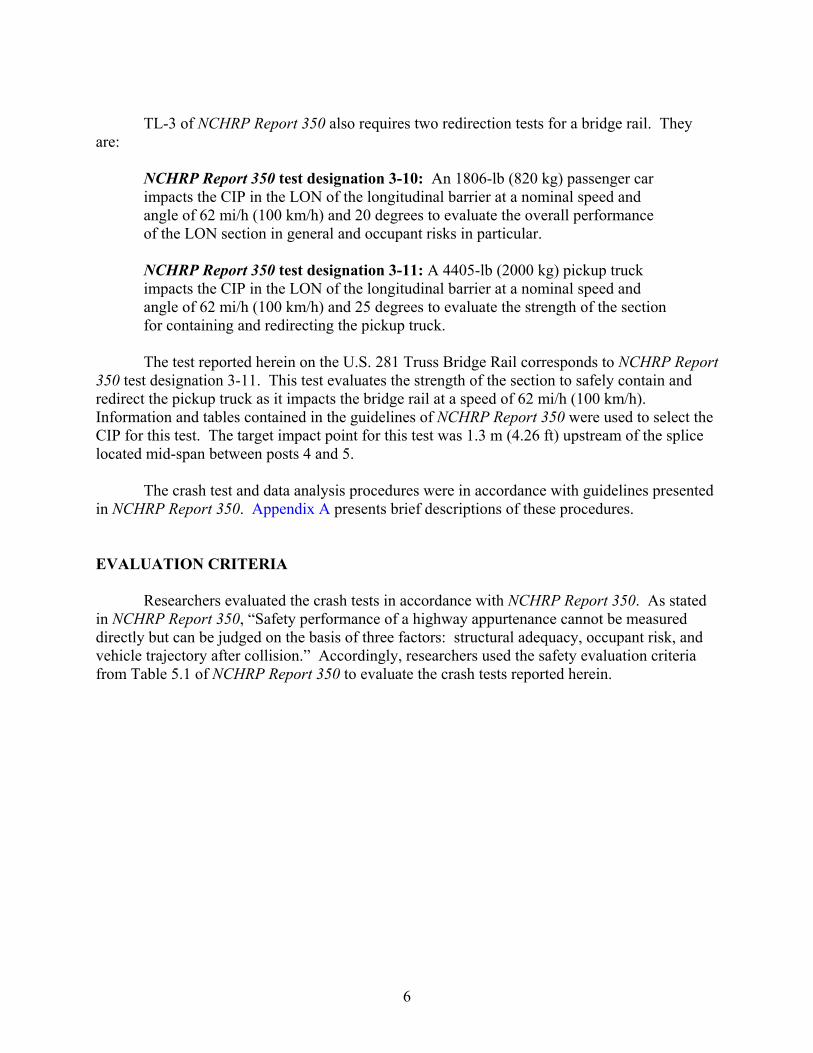
TL-3 of NCHRP Report 350 also requires two redirection tests for a bridge rail. They
are:
NCHRP Report 350 test designation 3-10: An 1806-lb (820 kg) passenger car impacts the CIP in the LON of the longitudinal barrier at a nominal speed and angle of 62 mi/h (100 km/h) and 20 degrees to evaluate the overall performance of the LON section in general and occupant risks in particular.
NCHRP Report 350 test designation 3-11: A 4405-lb (2000 kg) pickup truck impacts the CIP in the LON of the longitudinal barrier at a nominal speed and angle of 62 mi/h (100 km/h) and 25 degrees to evaluate the strength of the section for containing and redirecting the pickup truck.
The test reported herein on the U.S. 281 Truss Bridge Rail corresponds to NCHRP Report 350 test designation 3-11. This test evaluates the strength of the section to safely contain and redirect the pickup truck as it impacts the bridge rail at a speed of 62 mi/h (100 km/h). Information and tables contained in the guidelines of NCHRP Report 350 were used to select the CIP for this test. The target impact point for this test was 1.3 m (4.26 ft) upstream of the splice located mid-span between posts 4 and 5. The crash test and data analysis procedures were in accordance with guidelines presented in NCHRP Report 350. Appendix A presents brief descriptions of these procedures. EVALUATION CRITERIA Researchers evaluated the crash tests in accordance with NCHRP Report 350. As stated in NCHRP Report 350, “Safety performance of a highway appurtenance cannot be measured directly but can be judged on the basis of three factors: structural adequacy, occupant risk, and vehicle trajectory after collision.” Accordingly, researchers used the safety evaluation criteria from Table 5.1 of NCHRP Report 350 to evaluate the crash tests reported herein.
6
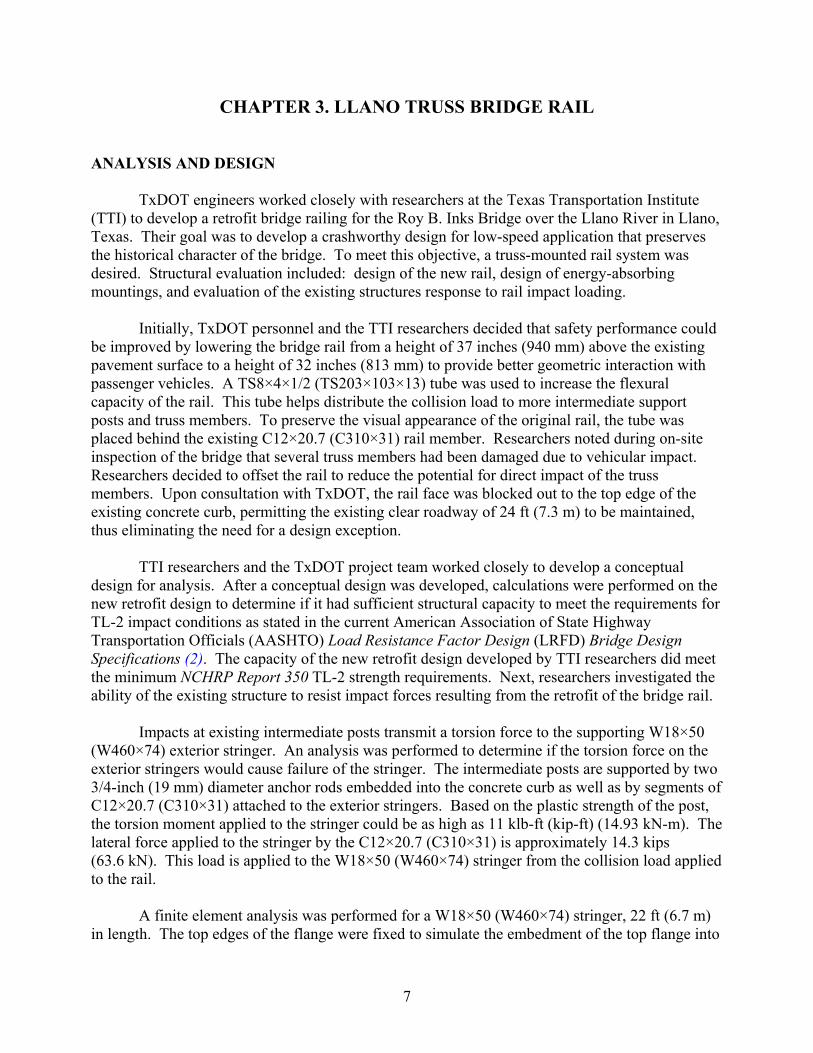
CHAPTER 3. LLANO TRUSS BRIDGE RAIL ANALYSIS AND DESIGN
TxDOT engineers worked closely with researchers at the Texas Transportation Institute (TTI) to develop a retrofit bridge railing for the Roy B. Inks Bridge over the Llano River in Llano, Texas. Their goal was to develop a crashworthy design for low-speed application that preserves the historical character of the bridge. To meet this objective, a truss-mounted rail system was desired. Structural evaluation included: design of the new rail, design of energy-absorbing mountings, and evaluation of the existing structures response to rail impact loading.
Initially, TxDOT personnel and the TTI researchers decided that safety performance could
be improved by lowering the bridge rail from a height of 37 inches (940 mm) above the existing pavement surface to a height of 32 inches (813 mm) to provide better geometric interaction with passenger vehicles. A TS8×4×1/2 (TS203×103×13) tube was used to increase the flexural capacity of the rail. This tube helps distribute the collision load to more intermediate support posts and truss members. To preserve the visual appearance of the original rail, the tube was placed behind the existing C12×20.7 (C310×31) rail member. Researchers noted during on-site inspection of the bridge that several truss members had been damaged due to vehicular impact. Researchers decided to offset the rail to reduce the potential for direct impact of the truss members. Upon consultation with TxDOT, the rail face was blocked out to the top edge of the existing concrete curb, permitting the existing clear roadway of 24 ft (7.3 m) to be maintained, thus eliminating the need for a design exception.
TTI researchers and the TxDOT project team worked closely to develop a conceptual
design for analysis. After a conceptual design was developed, calculations were performed on the new retrofit design to determine if it had sufficient structural capacity to meet the requirements for TL-2 impact conditions as stated in the current American Association of State Highway Transportation Officials (AASHTO) Load Resistance Factor Design (LRFD) Bridge Design Specifications (2). The capacity of the new retrofit design developed by TTI researchers did meet the minimum NCHRP Report 350 TL-2 strength requirements. Next, researchers investigated the ability of the existing structure to resist impact forces resulting from the retrofit of the bridge rail.
Impacts at existing intermediate posts transmit a torsion force to the supporting W18×50 (W460×74) exterior stringer. An analysis was performed to determine if the torsion force on the exterior stringers would cause failure of the stringer. The intermediate posts are supported by two 3/4-inch (19 mm) diameter anchor rods embedded into the concrete curb as well as by segments of C12×20.7 (C310×31) attached to the exterior stringers. Based on the plastic strength of the post, the torsion moment applied to the stringer could be as high as 11 klb-ft (kip-ft) (14.93 kN-m). The lateral force applied to the stringer by the C12×20.7 (C310×31) is approximately 14.3 kips (63.6 kN). This load is applied to the W18×50 (W460×74) stringer from the collision load applied to the rail.
A finite element analysis was performed for a W18×50 (W460×74) stringer, 22 ft (6.7 m) in length. The top edges of the flange were fixed to simulate the embedment of the top flange into
7
the deck concrete. Based on this analysis, some localized stresses exceeded 36 kips/in2 (ksi) (248 MPa) near the applied load from the C12×20.7 (C310×31). These stresses might cause localized yielding of the stringer but should not cause a catastrophic failure of the stringer. Loads and torsion stresses in the exterior stringers were within acceptable limits from the TL-2 collision loads applied to the posts. No additional modifications were required for the exterior stringers.
The test installation constructed for this project included a simulated portion of the actual
bridge superstructure supporting the concrete deck and bridge rail. Since the bridge rail is supported by the exterior W18×50 (W460×74) stringers, the effect of the collision load into the W18×50 (W460×74) stringer was included in the testing. No structural distress was observed in the simulated exterior stringers after the crash test. Researchers performed an analysis of the pullout capacity of the 3/4-inch (19 mm) diameter rods that are anchored in the curb concrete and used to support the intermediate posts. This analysis included the magnitude of the tension force in the 3/4-inch (19 mm) anchor rods from the ultimate strength of the intermediate post used in the strength analysis of the retrofit design. In summary, for an AASHTO LRFD TL-2 crash load applied directly at a post, the maximum applied force to the rods is approximately 28 kips (125 kN) based on the plastic strength of the post. Based on the tensile strength of the concrete and the assumed mode of failure, the calculated force to fail the concrete around the rods is approximately 57 kips (254 kN). Based on this analysis, some localized yielding would likely occur during a TL-2 collision along with some spalling of concrete. Bearing force between the rods and the concrete would be very high in the area where the upper end of the rod projects into the concrete curb. However, a global failure of concrete supporting the anchors is not likely and was not observed in the crash test.
The retrofit rail is supported by the truss members and intermediate posts located between the truss members. The new retrofit rail incorporated W8×18 (W200×27) steel blockouts at the intermediate posts. Blockouts (of some type) are required at the truss members. To limit the magnitude of the impact force transmitted from the rail to the truss members, crushable steel pipe blockouts were used for the blockouts at the truss members. Analyses were performed to determine the crush strength of 12-inch (305 mm) long lengths of 5-inch (127 mm) and 6 inch (152 mm) schedule 40 steel pipe loaded transverse to the longitudinal axis of the pipe. These sizes closely matched the blockout distances required for the various sizes and shapes of truss members. Based on the analyses for a 5-inch (127 mm) and 6-inch (152 mm) schedule 40 pipe, the crush strength for 12-inch (305 mm) long pieces of each pipe size was approximately 8 kips (36 kN) for each pipe size. Thus, provided the pipe blockout does not completely collapse, the force transmitted from the rail to the truss members was limited to approximately 8 kips (36 kN). Researchers incorporated these pipe blockouts into the retrofit rail.
In summary, TTI researchers recommended that the prototype bridge rail be 32 inches (813 mm) in height. They also recommended using TS8×4×1/2 (TS203×102×13) tube behind the C12×20.7 (C310×31) rail, W8×18 (W200×27) blockouts at the intermediate posts, and 5-inch (127 mm) and 6-inch (152 mm) schedule 40 pipe blockouts at the truss members. This prototype bridge rail was constructed and subjected to full-scale crash testing. The retrofit bridge rail strength calculations are presented in Appendix B, and strength analyses of bridge truss members and additional information on the crush strength for the pipe blockouts is provided in Appendix C.
8

9
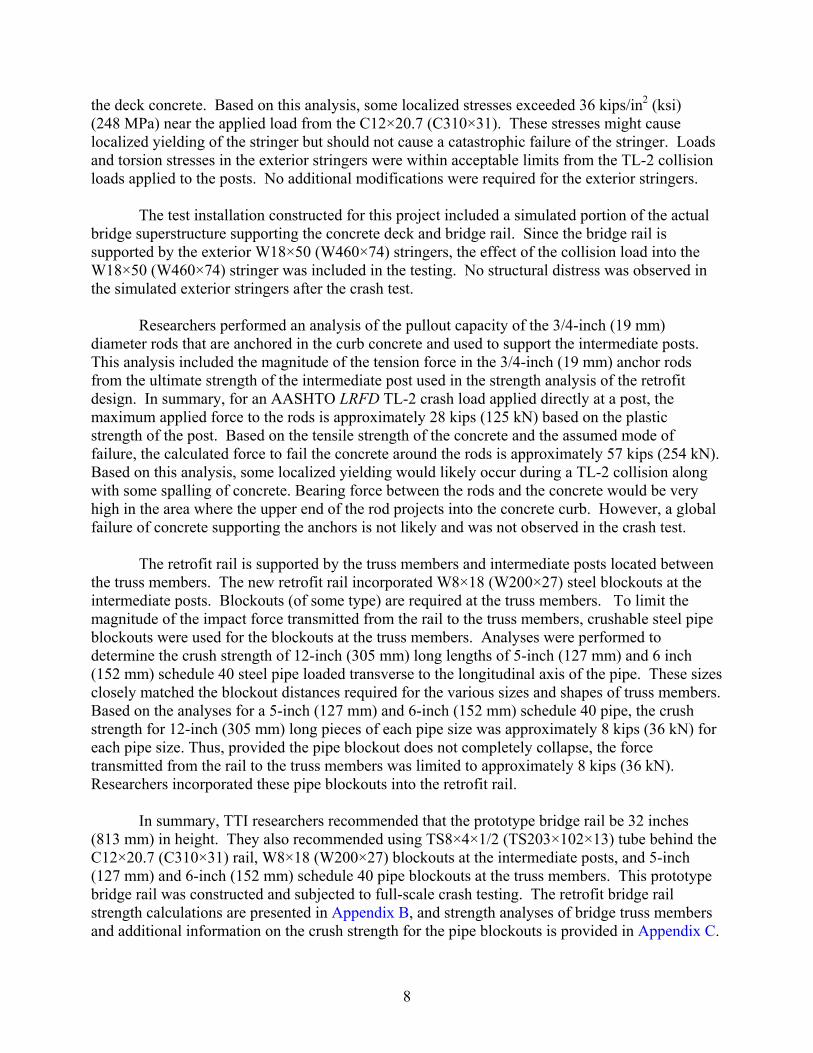
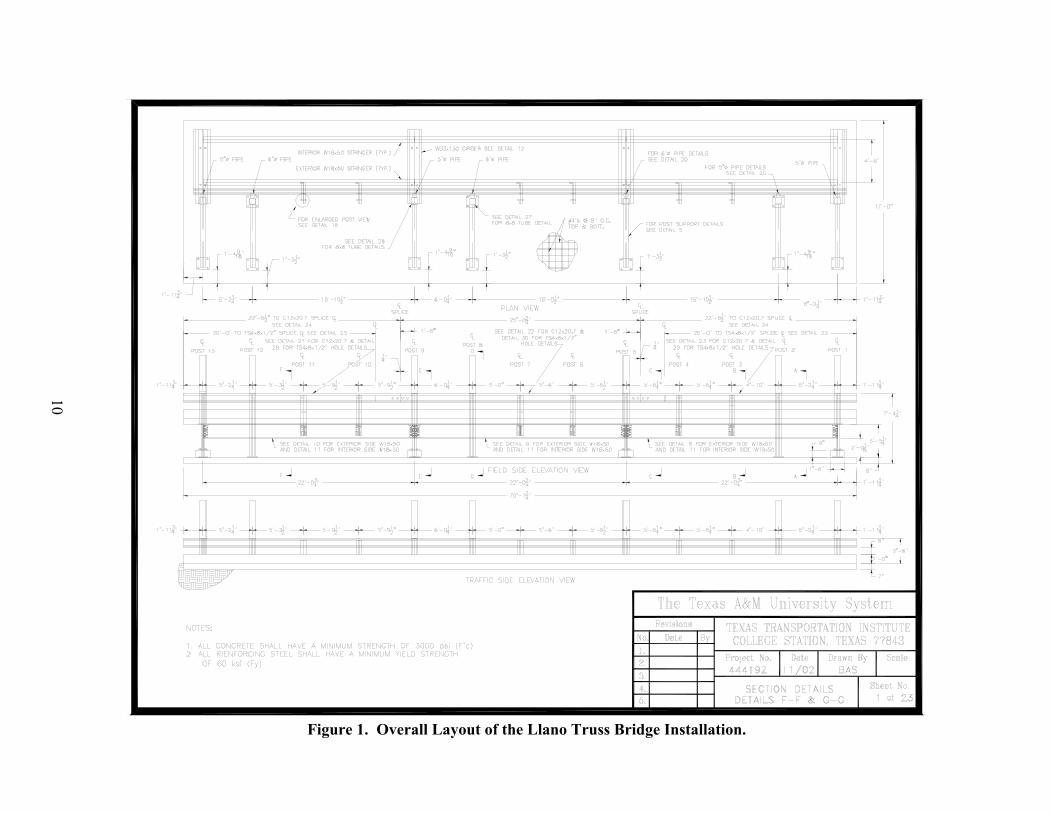
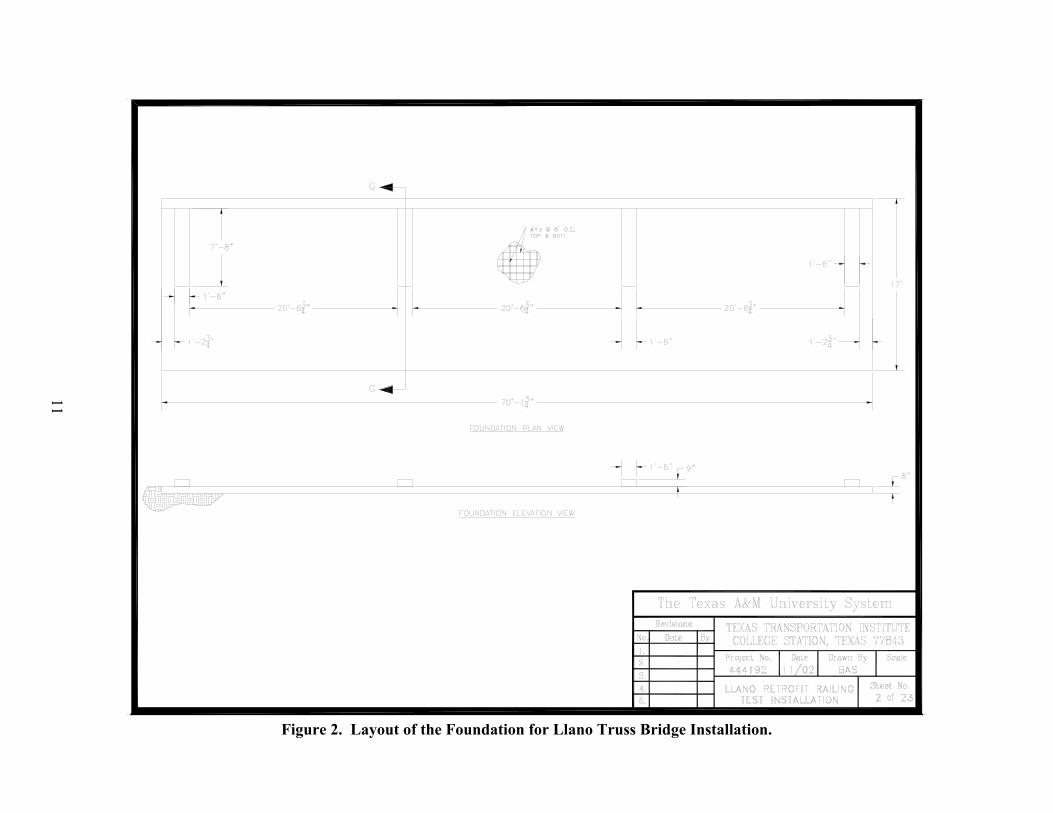
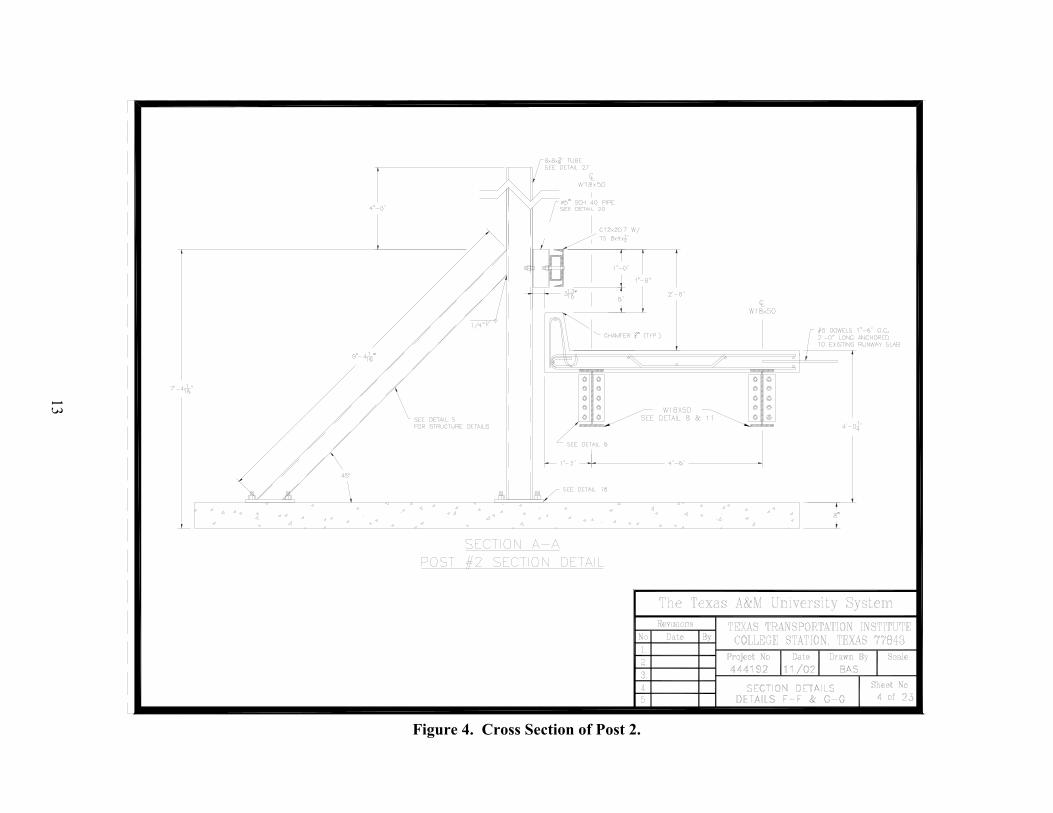
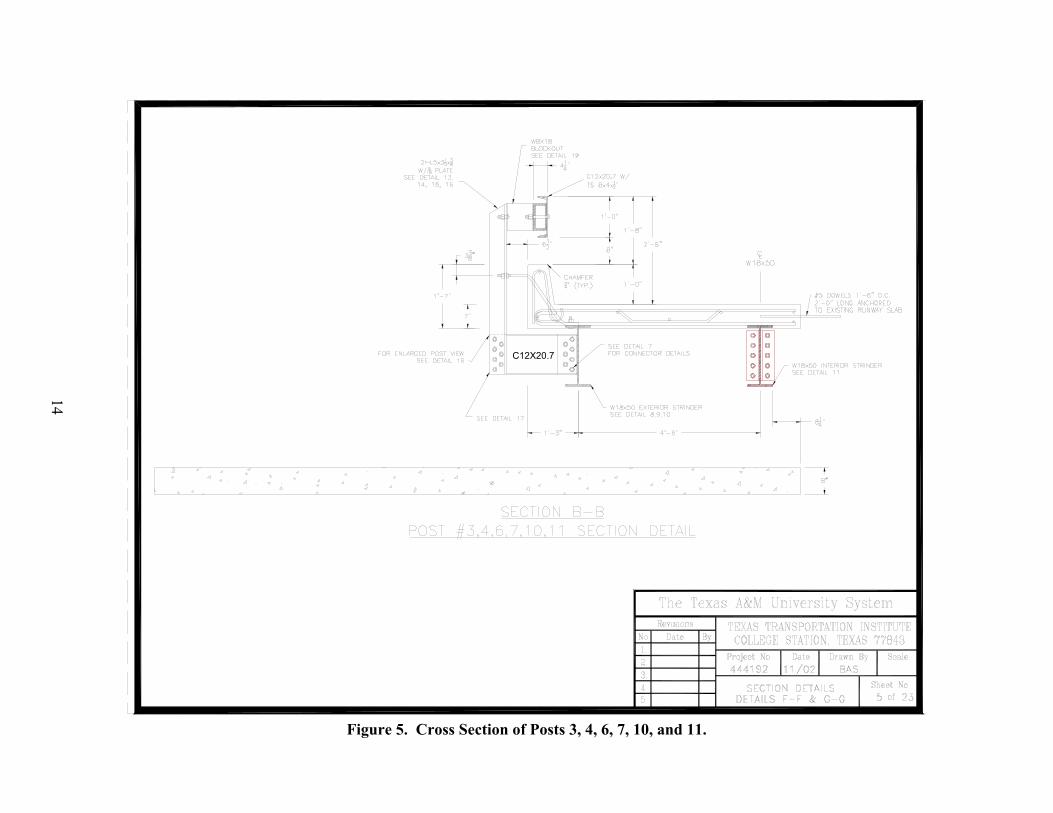
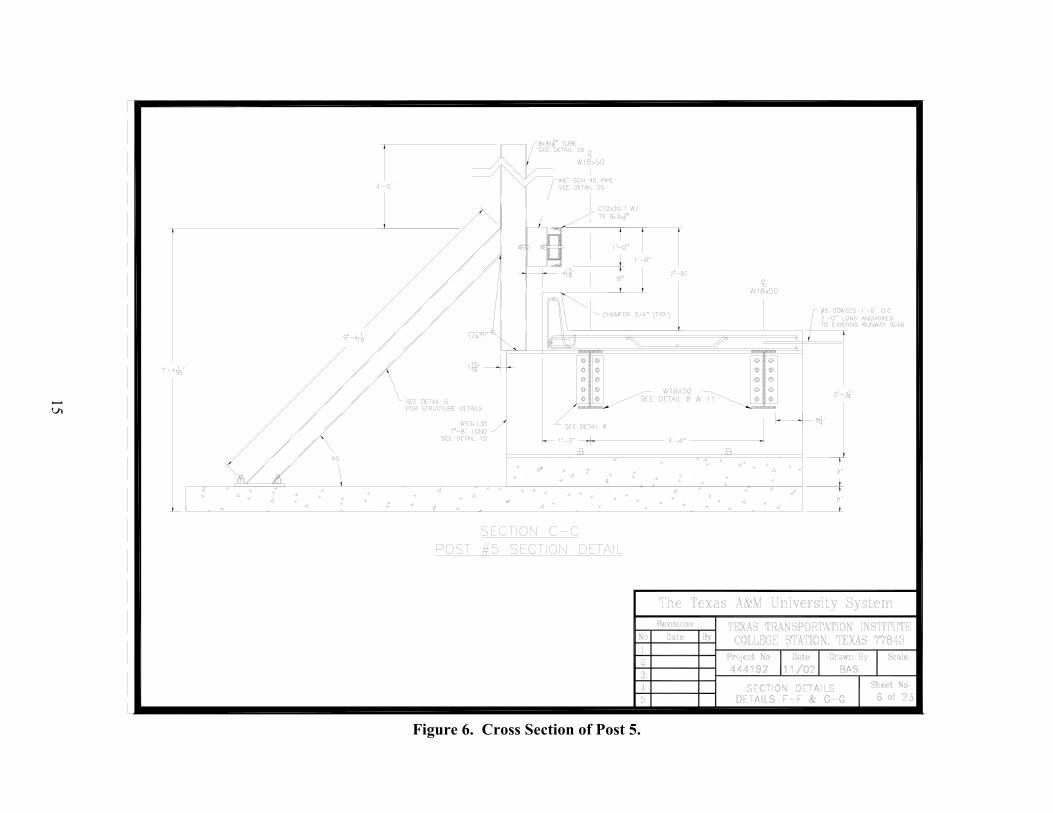
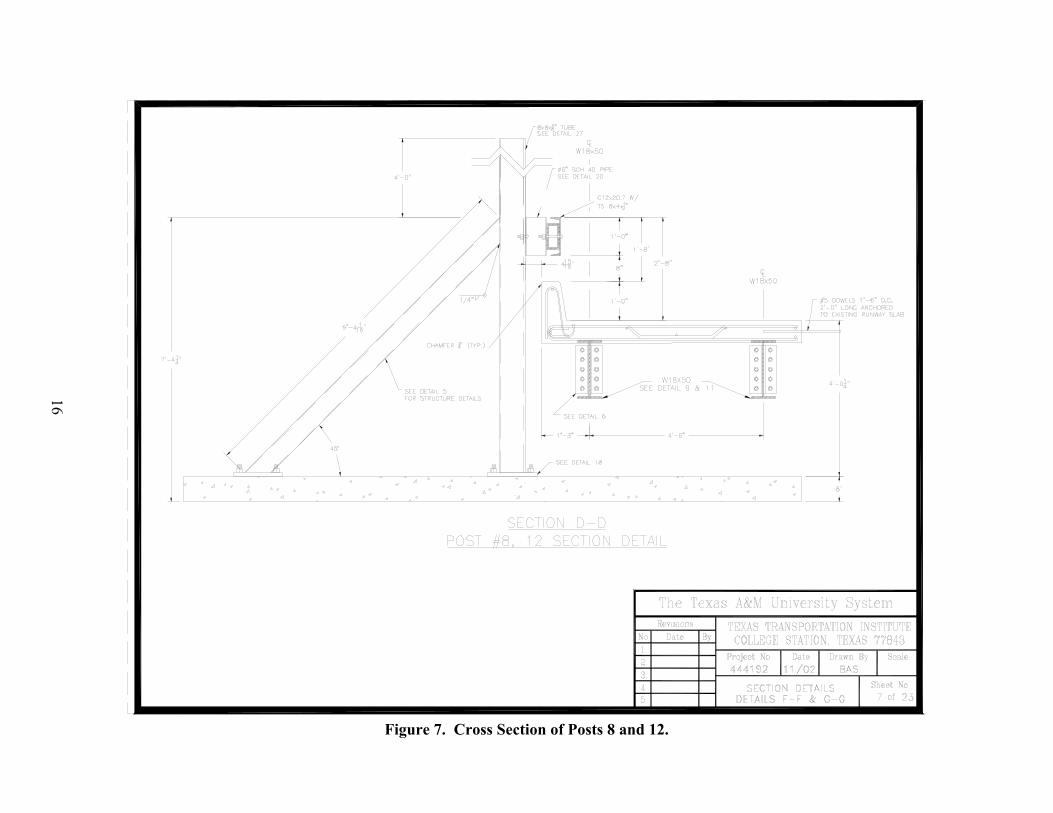
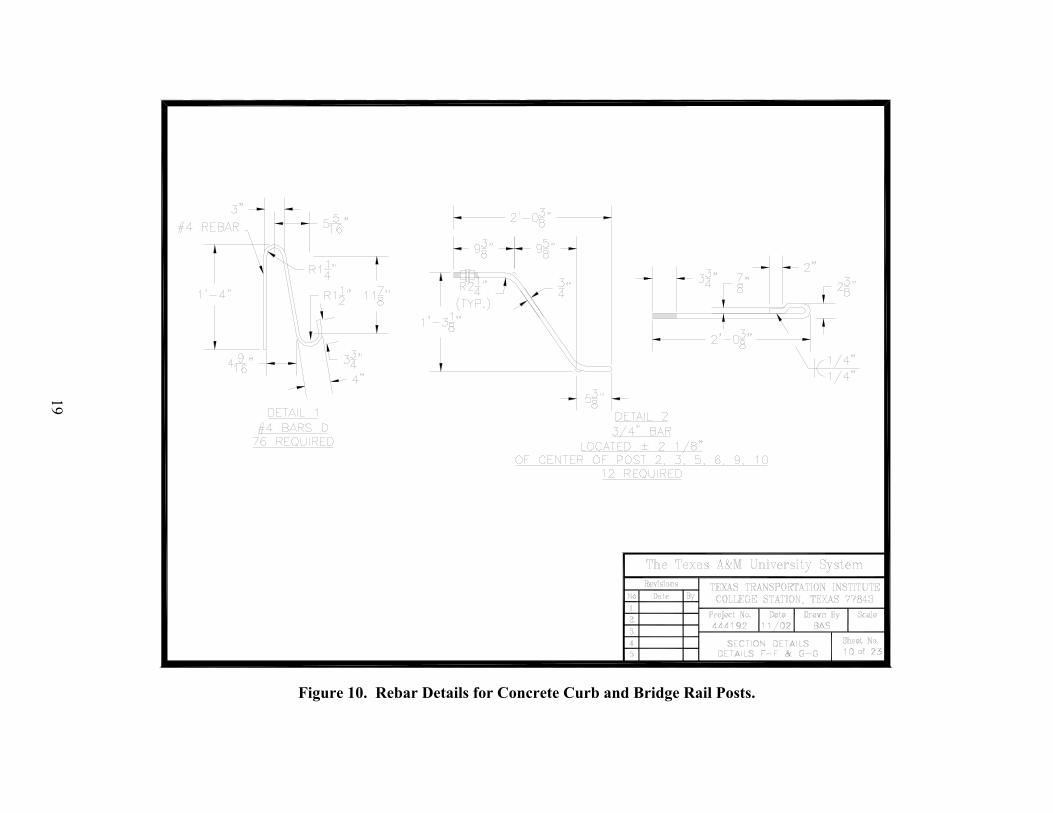
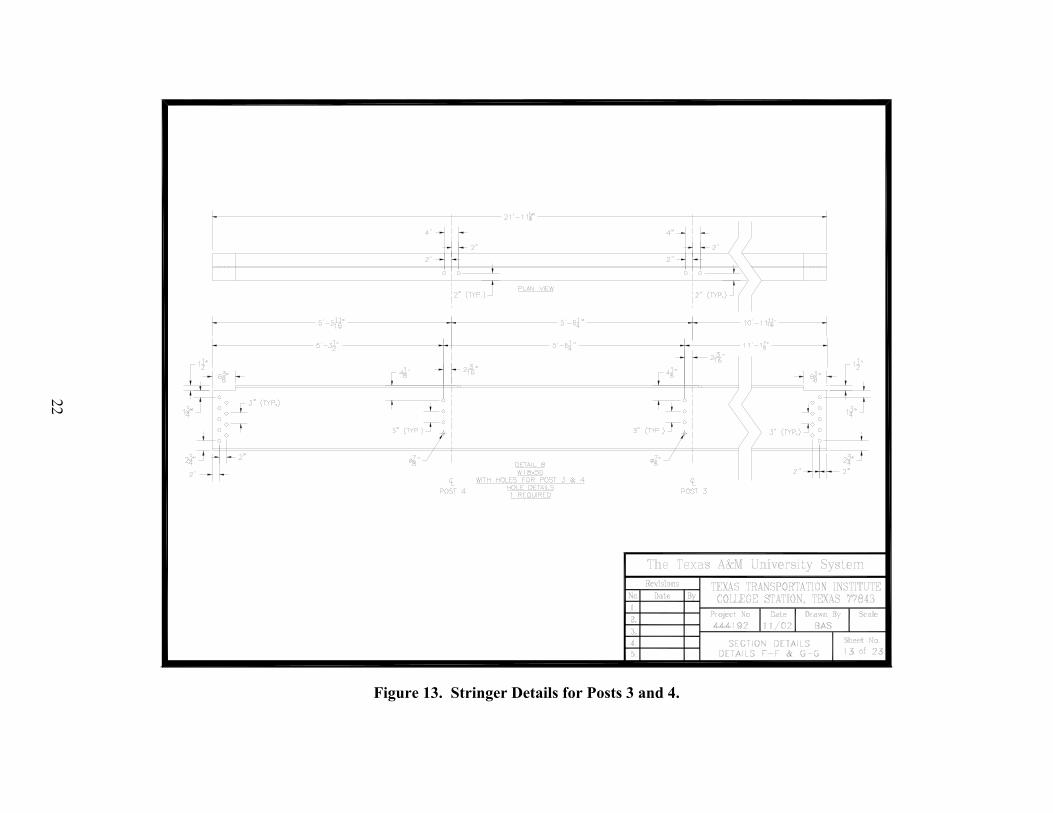
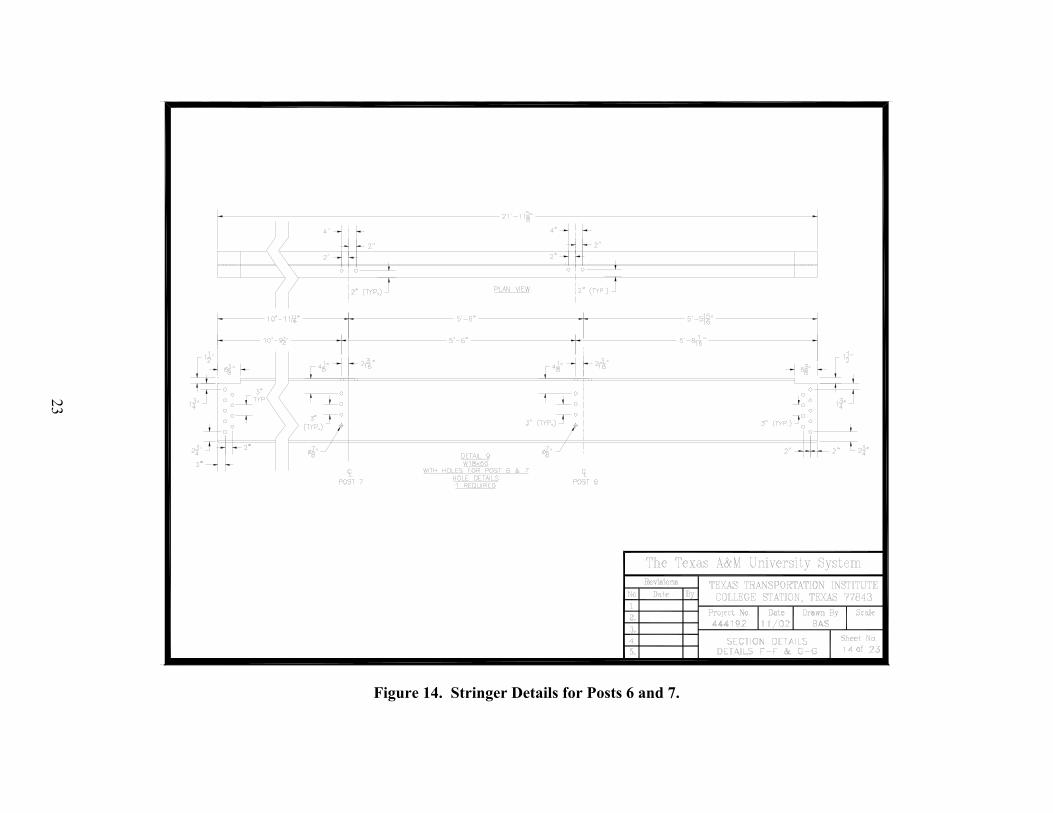
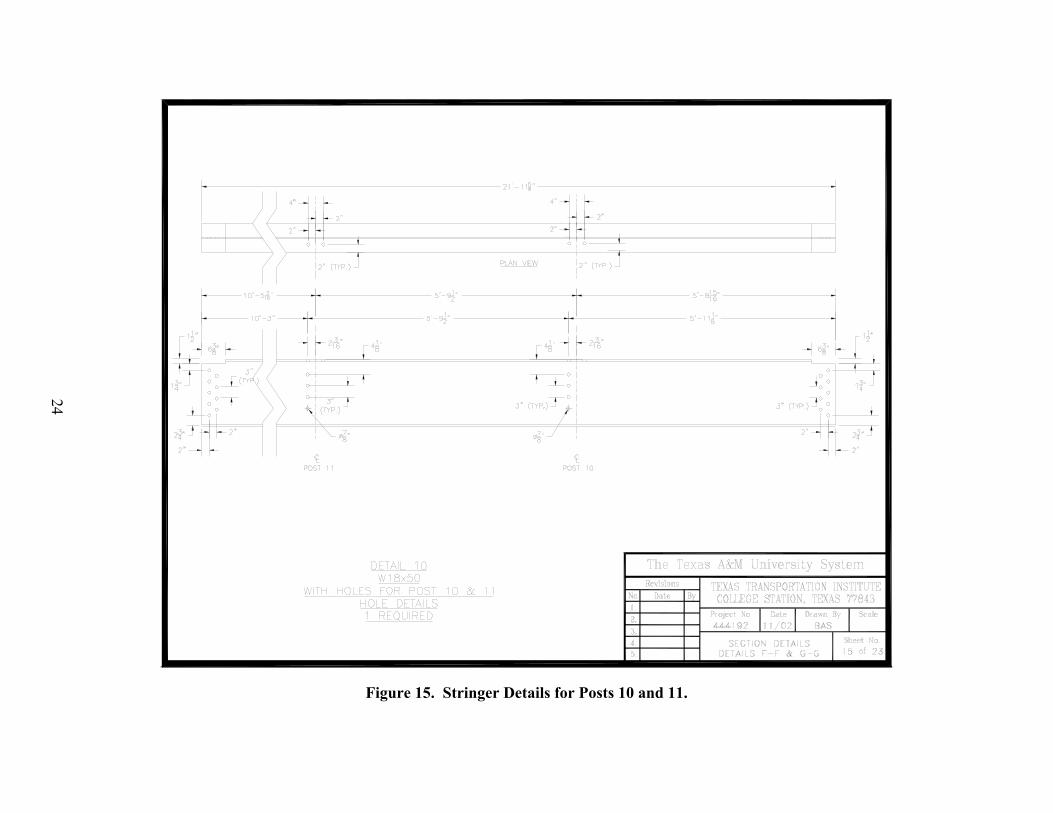
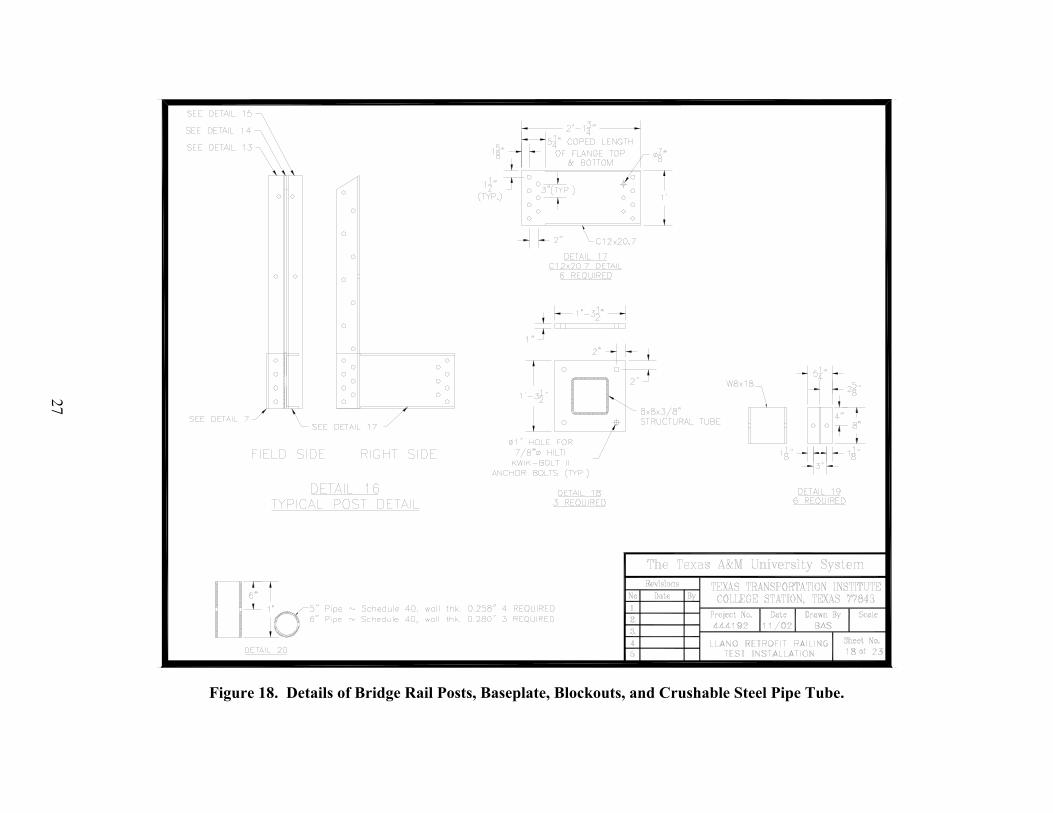
TEST INSTALLATION PROTOTYPE TTI received detailed drawings from TxDOT entitled “198 [ft] 6-3/4 [inches] Steel Truss Span, Llano River Bridge Hwy. 29 Llano County,” dated October 1935. Details from these drawings were used to prepare construction and fabrication drawings for the project test installation, shown in Figures 1 through 23. The existing State Highway 16 bridge over the Llano River consists of four spans each measuring 198 ft 6-3/4 inches (60.5 m), for a total length of 794 ft 3 inches (242.0 m) between abutments. Each bridge span consists of nine panels, 22 ft 3/4 inches (6.7 m) in length. For this project TTI constructed a full-scale test installation consisting of three panels, each measuring approximately 22 ft 3/4 inches (6.7 m). The total length of the installation was approximately 70 ft (21.3 m). The post spacing in the installation closely matched a segment of the actual bridge structure. The bridge superstructure supporting the concrete deck and curb consisted of two rows of W18×50 (W460×74) stringers spaced 4 ft 6 inches (1.4 m) apart (see Figures 13 through 16). These stringers were supported by W33×130 (W840×193) support beams spaced 22 ft 3/4 inches (6.7 m) on center (see Figure 16). The stringers attached to the support beams with two L6×4×3/8 (L152×102×9) clip angles, 1 ft 3 inches (0.38 m) in length, and connected with ten 3/4-inch (19 mm) diameter A325 bolts, 2-1/2 inches (64 mm) in length (see Figure 12). The stringers were constructed at the same top-of-steel elevation as the top of the W33×130 (W840×193) support beams. The W33×130 (W840×193) support beams were supported by an 8-inch (203 mm) thick concrete slab constructed adjacent to the concrete apron at our testing facility (see Figures 2 and 3). All remaining features, with the exception of the truss members, were constructed similarly to the actual details used in the bridge. The bridge rail posts were constructed from two L5×3-1/2×3/8 (L127×89×9) angles (long legs back-to-back) with a 5/16-inch (8 mm) thick steel plate (sandwich plate) located between the angles (see Figures 17 and 18). Several 3/4-inch (19 mm) diameter A325 bolts connected the post angles and sandwich plate together. The posts were supported by segments of C12×20.7 (C310×31) channel (see Figure 18), which connected to the exterior W18×50 (W460×74) stringers with a single L6×4×3/8 (L152×102×9) clip angle, bolted to the W18×50 (W460×74) stringer with four 3/4-inch (19 mm) diameter A325 bolts (see Figure 12). These posts were also supported by two 3/4-inch (19 mm) diameter A36 threaded rods, embedded into the concrete curb and deck and also connected to the top of the W18×50 (W460×74) stringers (see Figure 10). Cross sections of the posts are shown in Figures 4 through 8.
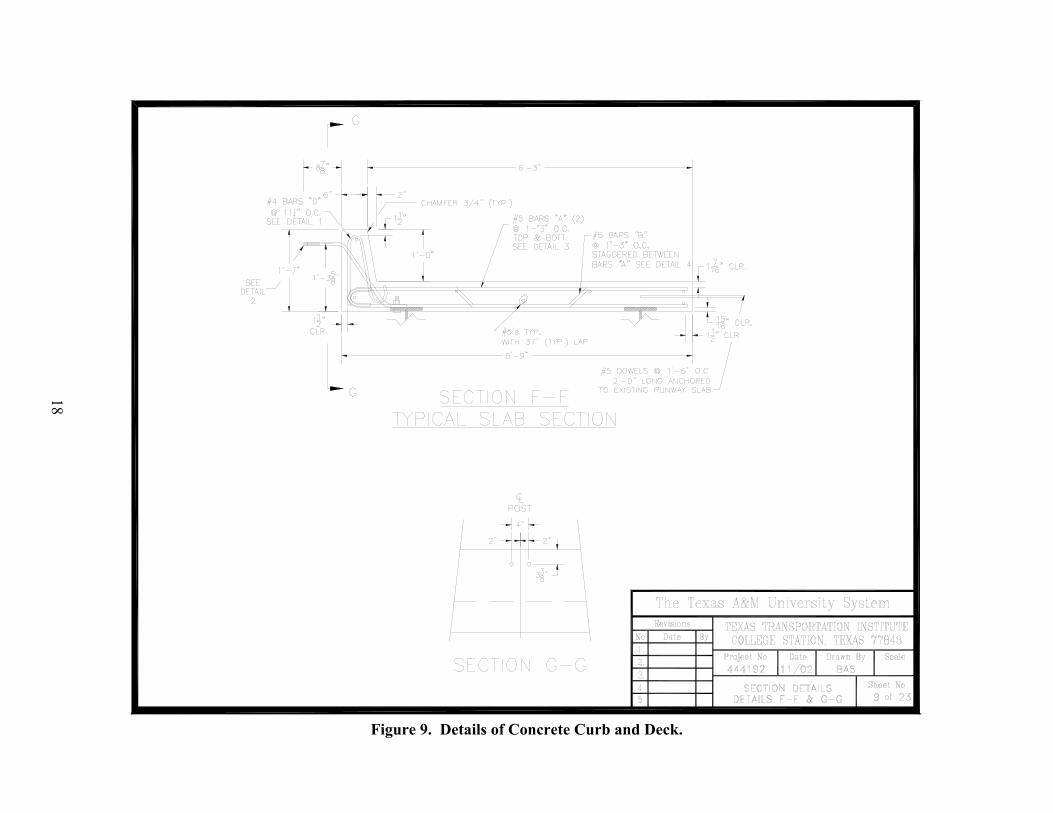
The concrete curb and deck were cast on top of the support beams and stringers with the tops of the stringers and support beams extending into the deck concrete approximately 1 inch (25 mm). The concrete curb was 12 inches (305 mm) high and 6 inches (152.4 mm) wide at the top and sloped on the traffic side face to a thickness of 8 inches (203 mm) at the gutter line. The concrete deck was 7-1/2 inches (191 mm) thick and extended beyond the centerline of the exterior stringer 1 ft 3 inches (0.38 m) (see Figure 9). Transverse reinforcement in the deck consisted of #5 (#16) hooked bars “A” on 1 ft 3 inch (0.38 m) centers and #5 (#16) hooked bars “B” on 1 ft 3 inch (0.38 m) centers (see Figure 11). In the top layer of reinforcement in the deck, the effective transverse bar spacing was approximately 7-1/2 inches (191 mm). At the time the bridge was constructed, the yield strength of concrete reinforcing steel was typically
10
Figure 1. Overall Layout of the Llano Truss Bridge Installation.
11
Figure 2. Layout of the Foundation for Llano Truss Bridge Installation.

12
Figure 3. Rebar Details of the Foundation for Llano Truss Bridge Installation.
13
Figure 4. Cross Section of Post 2.
C12X20.7
14
Figure 5. Cross Section of Posts 3, 4, 6, 7, 10, and 11.
15
Figure 6. Cross Section of Post 5.
16
Figure 7. Cross Section of Posts 8 and 12.

17
Figure 8. Cross Section of Posts 1, 9, and 13.
18
Figure 9. Details of Concrete Curb and Deck.
19
Figure 10. Rebar Details for Concrete Curb and Bridge Rail Posts.

20
Figure 11. Rebar Details for Concrete Curb and Deck.

21
Figure 12. Details of Connecting Angles.
22
Figure 13. Stringer Details for Posts 3 and 4.
23
Figure 14. Stringer Details for Posts 6 and 7.
24
Figure 15. Stringer Details for Posts 10 and 11.
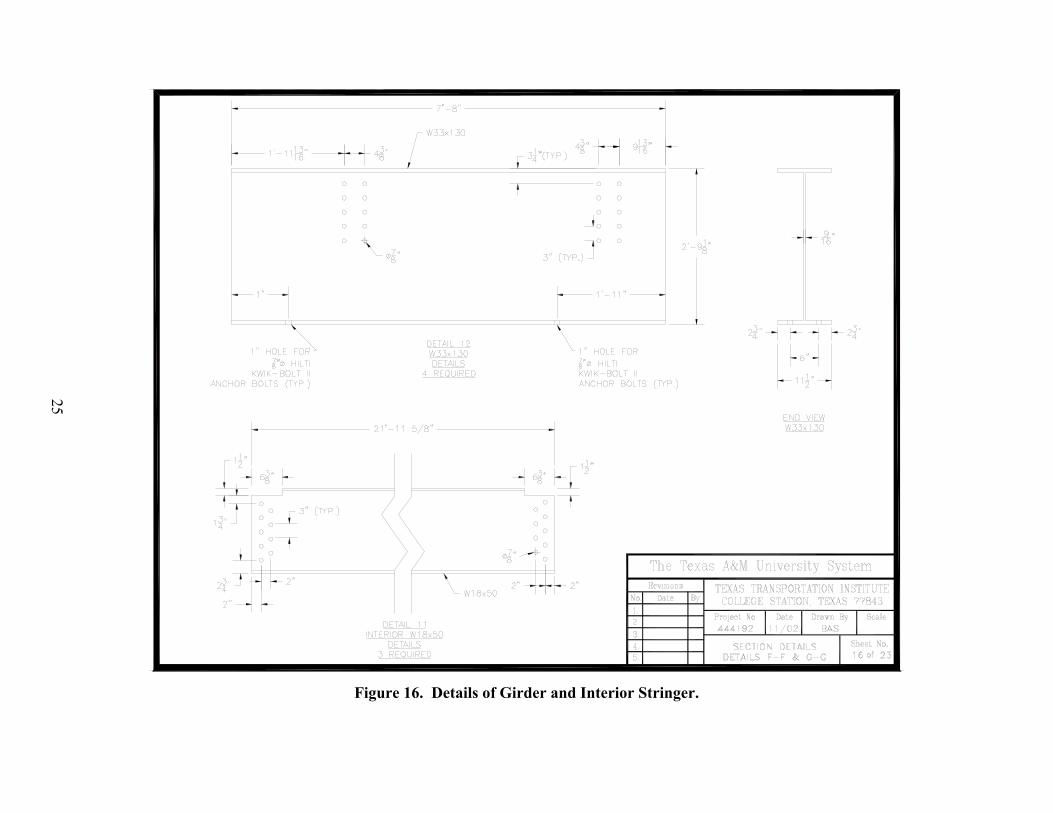
25
Figure 16. Details of Girder and Interior Stringer.

26
Figure 17. Details of Bridge Rail Posts.
27
Figure 18. Details of Bridge Rail Posts, Baseplate, Blockouts, and Crushable Steel Pipe Tube.
28
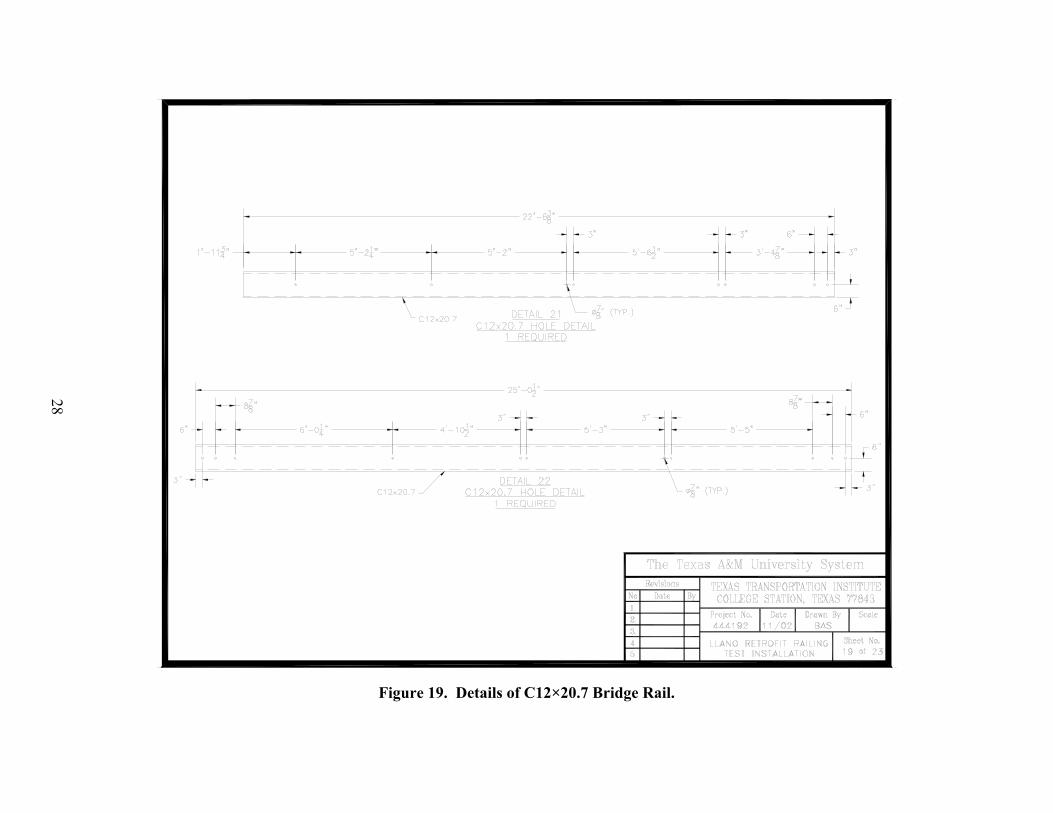
Figure 19. Details of C12×20.7 Bridge Rail.
29
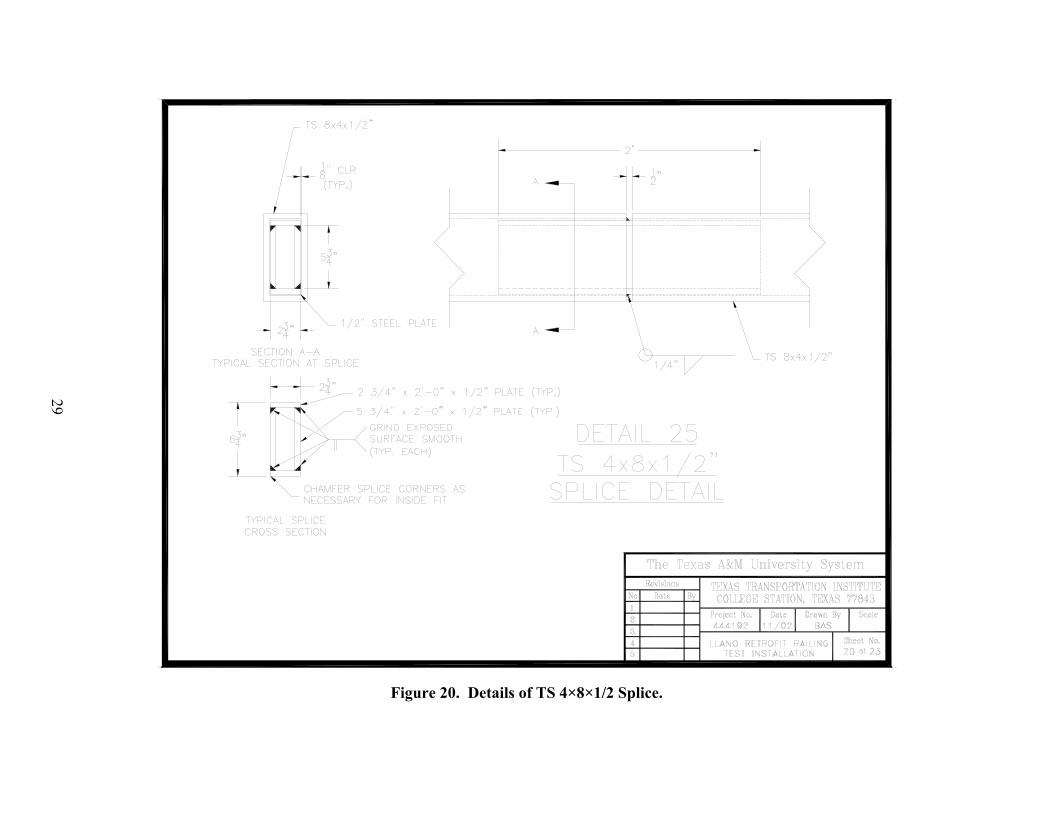
Figure 20. Details of TS 4×8×1/2 Splice.
30
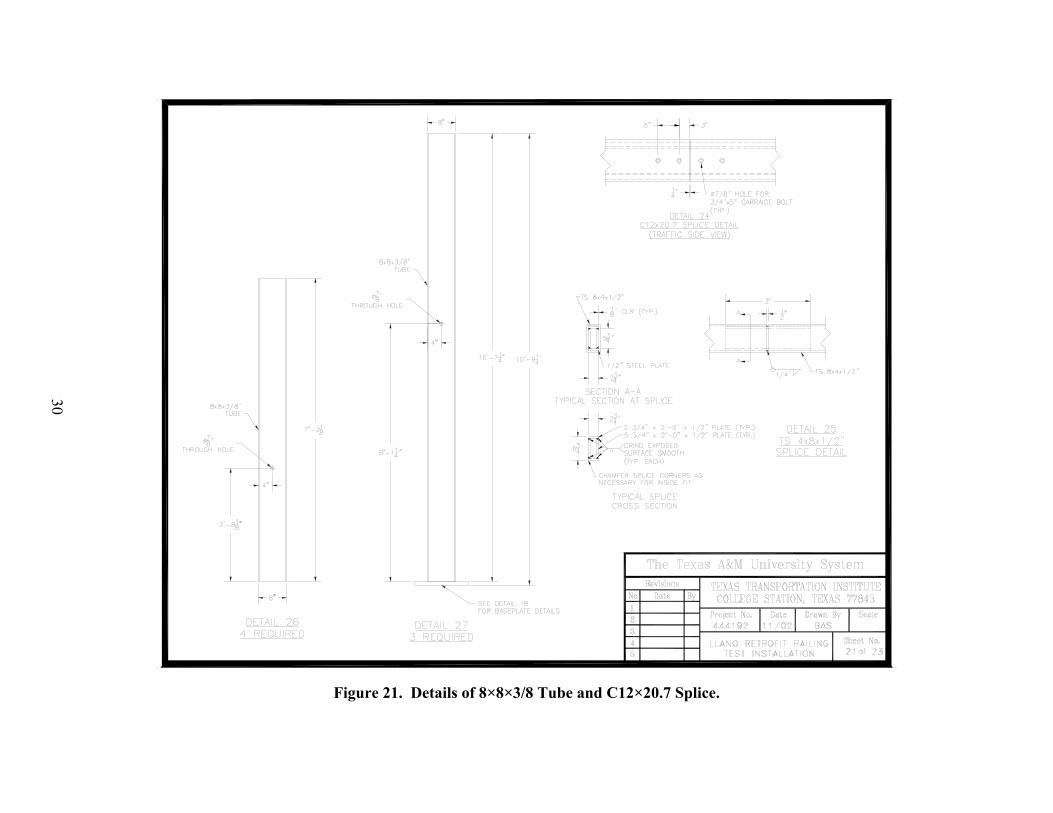
Figure 21. Details of 8×8×3/8 Tube and C12×20.7 Splice.
31
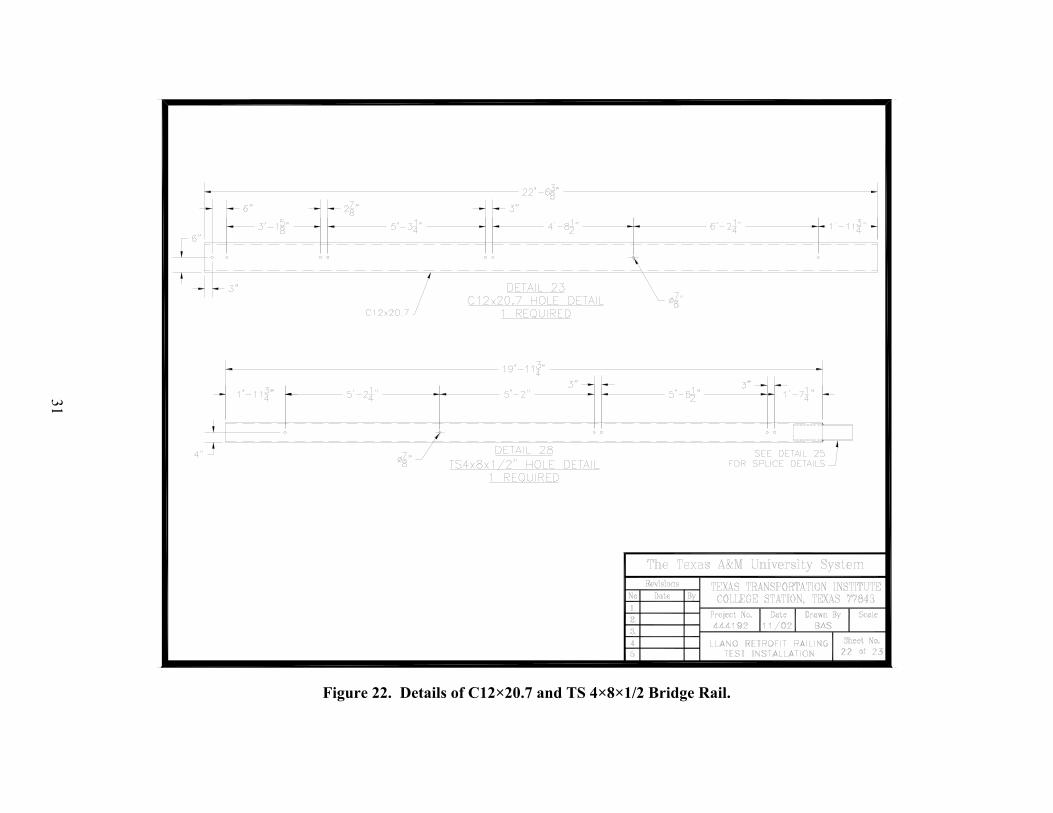
Figure 22. Details of C12×20.7 and TS 4×8×1/2 Bridge Rail.
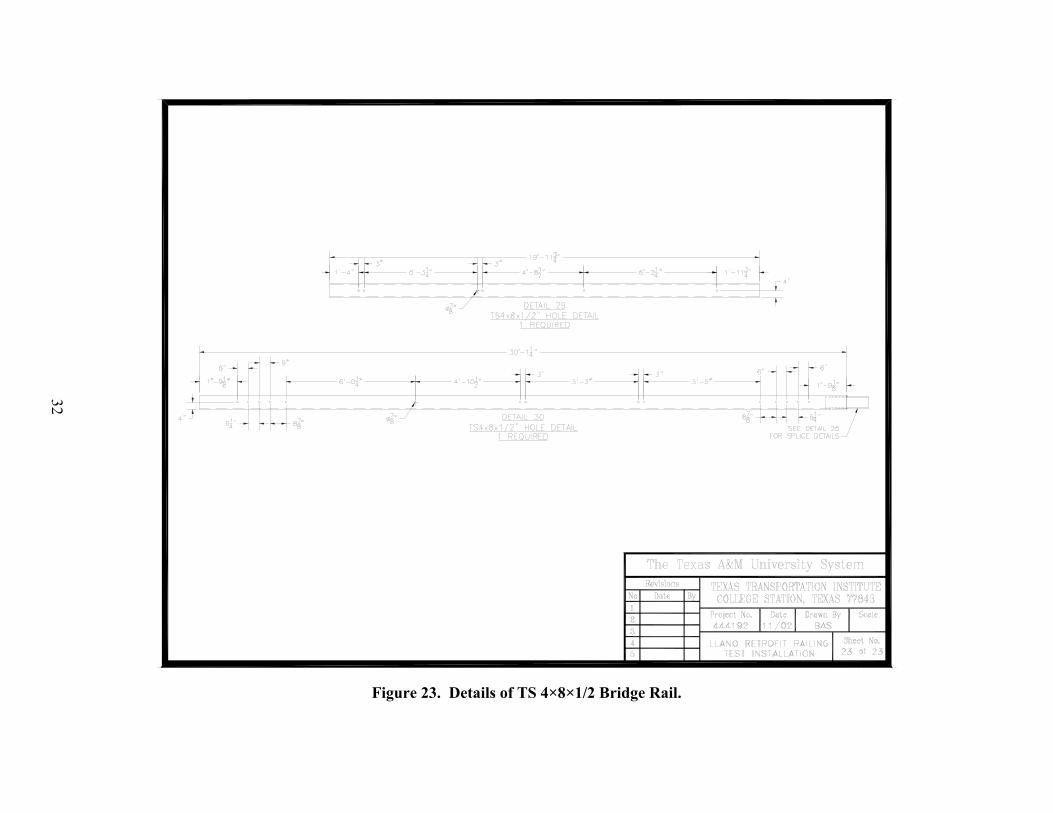
Figure 23. Details of TS 4×8×1/2 Bridge Rail.
32
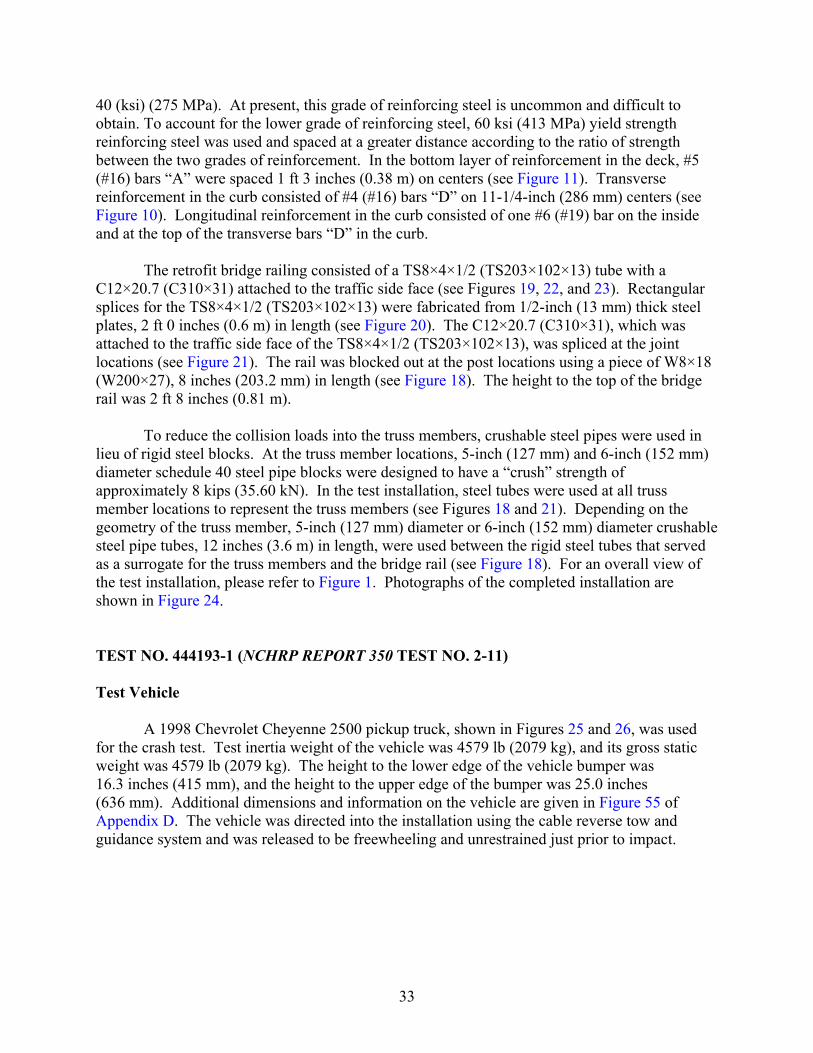
40 (ksi) (275 MPa). At present, this grade of reinforcing steel is uncommon and difficult to obtain. To account for the lower grade of reinforcing steel, 60 ksi (413 MPa) yield strength reinforcing steel was used and spaced at a greater distance according to the ratio of strength between the two grades of reinforcement. In the bottom layer of reinforcement in the deck, #5 (#16) bars “A” were spaced 1 ft 3 inches (0.38 m) on centers (see Figure 11). Transverse reinforcement in the curb consisted of #4 (#16) bars “D” on 11-1/4-inch (286 mm) centers (see Figure 10). Longitudinal reinforcement in the curb consisted of one #6 (#19) bar on the inside and at the top of the transverse bars “D” in the curb. The retrofit bridge railing consisted of a TS8×4×1/2 (TS203×102×13) tube with a C12×20.7 (C310×31) attached to the traffic side face (see Figures 19, 22, and 23). Rectangular splices for the TS8×4×1/2 (TS203×102×13) were fabricated from 1/2-inch (13 mm) thick steel plates, 2 ft 0 inches (0.6 m) in length (see Figure 20). The C12×20.7 (C310×31), which was attached to the traffic side face of the TS8×4×1/2 (TS203×102×13), was spliced at the joint locations (see Figure 21). The rail was blocked out at the post locations using a piece of W8×18 (W200×27), 8 inches (203.2 mm) in length (see Figure 18). The height to the top of the bridge rail was 2 ft 8 inches (0.81 m).
To reduce the collision loads into the truss members, crushable steel pipes were used in lieu of rigid steel blocks. At the truss member locations, 5-inch (127 mm) and 6-inch (152 mm) diameter schedule 40 steel pipe blocks were designed to have a “crush” strength of approximately 8 kips (35.60 kN). In the test installation, steel tubes were used at all truss member locations to represent the truss members (see Figures 18 and 21). Depending on the geometry of the truss member, 5-inch (127 mm) diameter or 6-inch (152 mm) diameter crushable steel pipe tubes, 12 inches (3.6 m) in length, were used between the rigid steel tubes that served as a surrogate for the truss members and the bridge rail (see Figure 18). For an overall view of the test installation, please refer to Figure 1. Photographs of the completed installation are shown in Figure 24.
TEST NO. 444193-1 (NCHRP REPORT 350 TEST NO. 2-11) Test Vehicle A 1998 Chevrolet Cheyenne 2500 pickup truck, shown in Figures 25 and 26, was used for the crash test. Test inertia weight of the vehicle was 4579 lb (2079 kg), and its gross static weight was 4579 lb (2079 kg). The height to the lower edge of the vehicle bumper was 16.3 inches (415 mm), and the height to the upper edge of the bumper was 25.0 inches (636 mm). Additional dimensions and information on the vehicle are given in Figure 55 of Appendix D. The vehicle was directed into the installation using the cable reverse tow and guidance system and was released to be freewheeling and unrestrained just prior to impact.
33
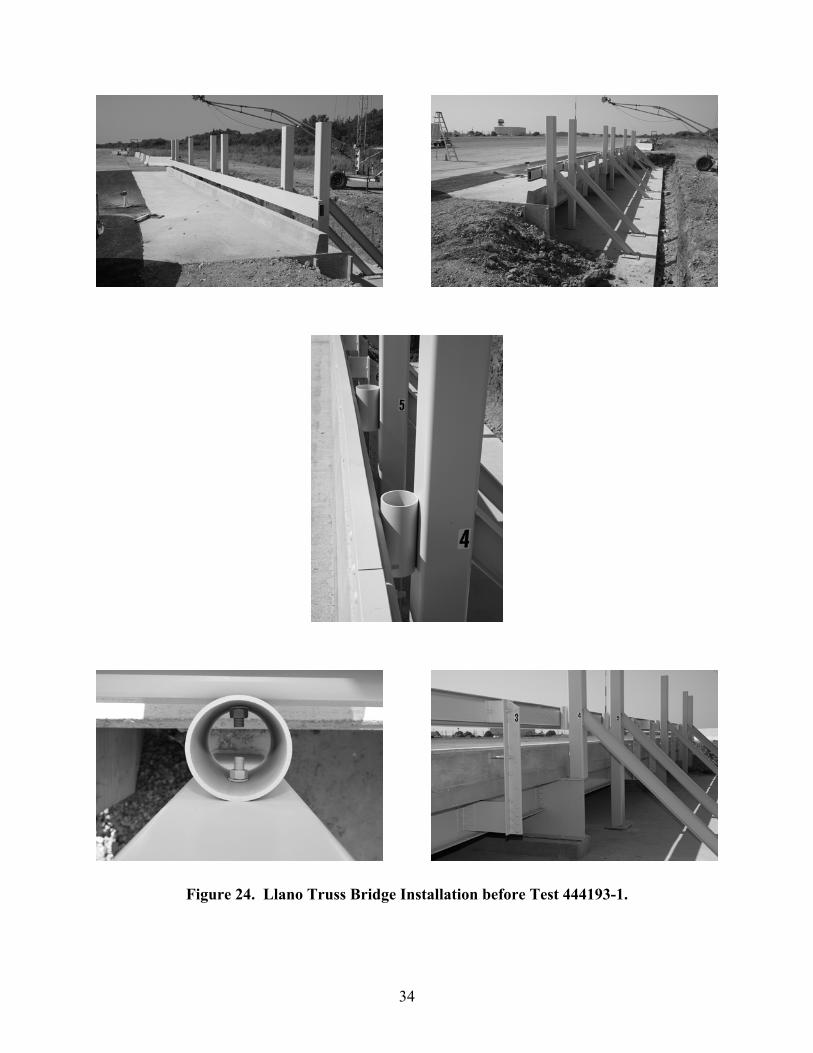
Figure 24. Llano Truss Bridge Installation before Test 444193-1.
34
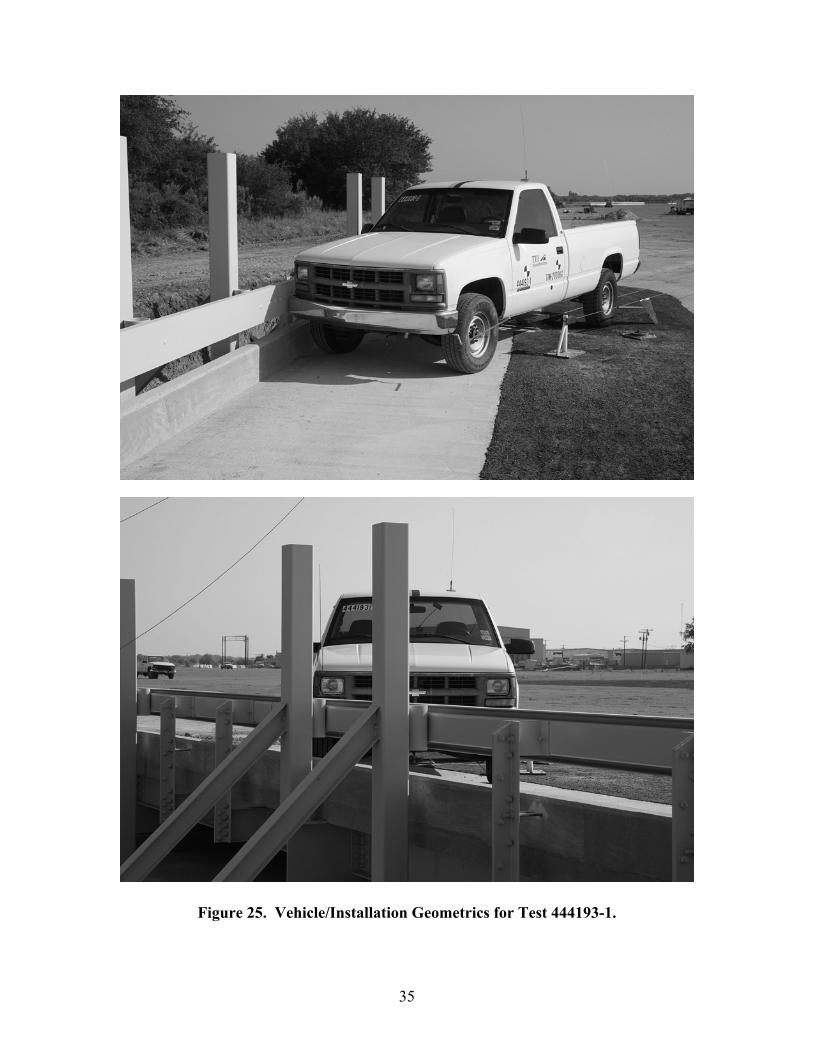
Figure 25. Vehicle/Installation Geometrics for Test 444193-1.
35
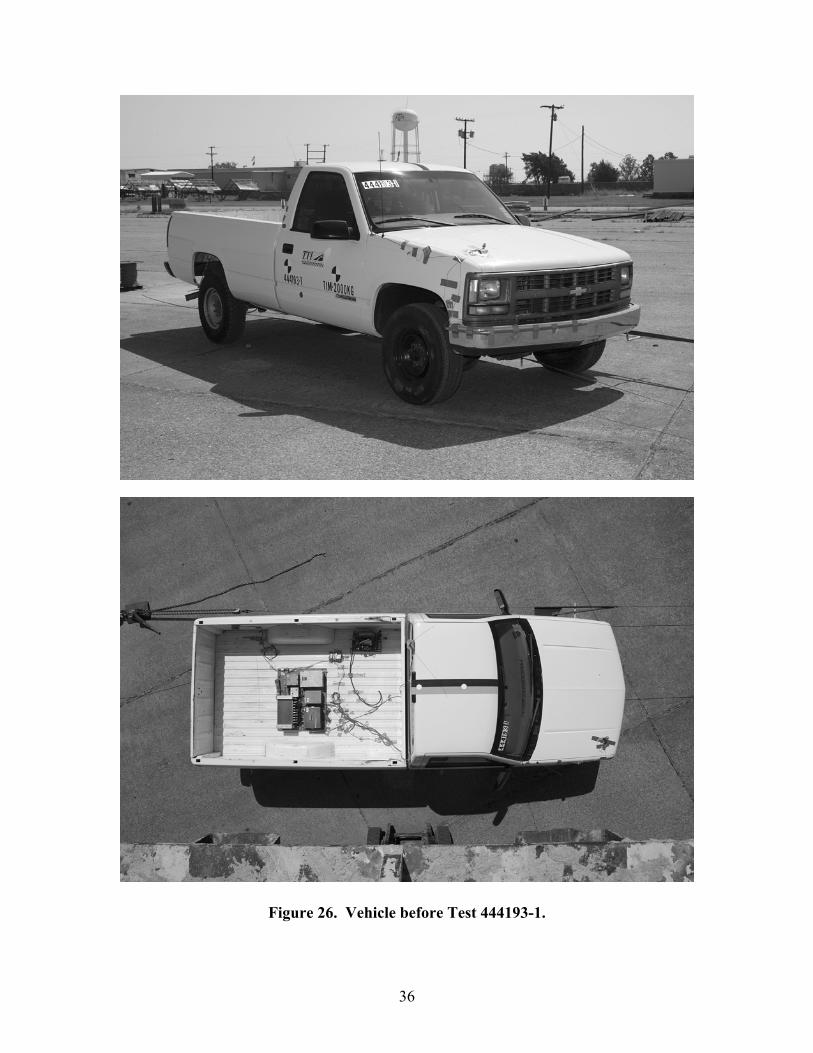
Figure 26. Vehicle before Test 444193-1.
36
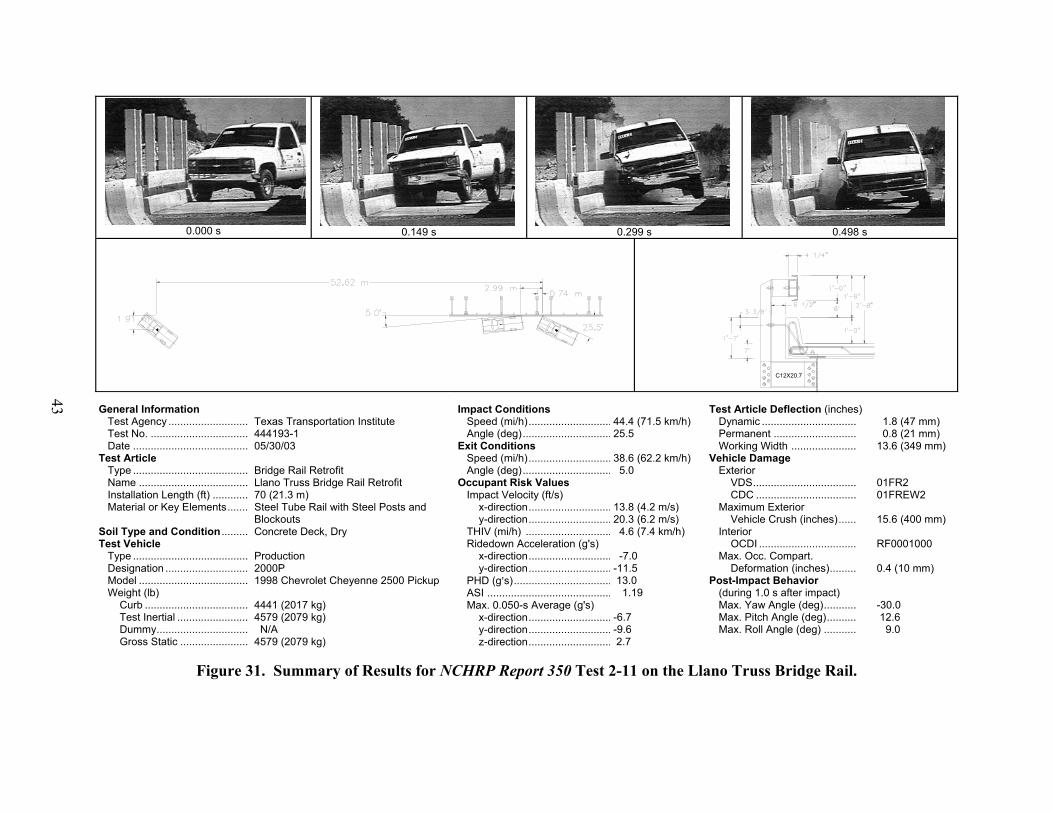
Soil and Weather Conditions The test was performed on the morning of May 30, 2003. Rainfall of 2 mm (0.078 inches) was recorded nine days prior to the test. Weather conditions at the time of testing were as follows: wind speed: 6 mi/h (9 km/h); wind direction: 350 degrees with respect to the vehicle (vehicle was traveling in a southwesterly direction); temperature: 91ºF (33ºC); and relative humidity: 46 percent. Test Description The vehicle, traveling at 44.4 mi/h (71.5 km/h), impacted the Llano Truss Bridge Rail 0.74 m (2.43 ft) upstream of post 5 at an impact angle of 25.5 degrees. Shortly after impact, the right front tire contacted the curb, and by 0.032 s, the right front tire reached the rail element. The steel tube blockout at post 5 began to deform at 0.035 s, and the right front tire blew out at 0.045 s. The vehicle began to redirect at 0.048 s, and a fine crack on the rear of the deck at post 4 began to form at 0.055 s. At 0.221 s, the vehicle was traveling parallel with the bridge rail at a speed of 39.9 mi/h (64.2 km/h). The rear of the vehicle contacted the rail element at 0.242 s, and post 4 began to deflect toward the field side at 0.247 s. The concrete around the anchor bolts at post 4 began to spall at 0.254 s, and post 6 began to deflect toward the field side at 0.264 s. At 0.372 s, the vehicle lost contact with the bridge rail while traveling at a speed of 38.6 mi/h (62.2 km/h) and an exit angle of 5.0 degrees. Brakes on the vehicle were applied 3.5 s after impact, and the vehicle subsequently yawed clockwise, contacted a protective barrier, and came to rest adjacent to this barrier 172.6 ft (52.6 m) downstream of impact and 6.2 ft (1.9 m) forward of the traffic face of the bridge rail. Figures 57 and 58 in Appendix E present sequential photographs of the test period. Damage to Test Installation Damage to the Truss Bridge Rail is shown in Figures 27 and 28. There were tire marks on the face of the rail and the curb beginning 28.8 inches (740 mm) upstream of post 5 and continuing for a distance of 9.8 ft (2.99 m), which was the length of contact of the vehicle with the bridge rail. Post 4 deflected toward field side 0.4 inches (11 mm), and the concrete around the anchor bolts on the rear side of the deck spalled. The steel tube blockout at post 5 was crushed 0.8 inches (21 mm), and the blockout at post 6 was crushed 0.2 inches (6 mm). Maximum dynamic deflection during the test was 1.8 inches (47 mm).
37

Figure 27. After Impact Trajectory Path for Test 444193-1.
38
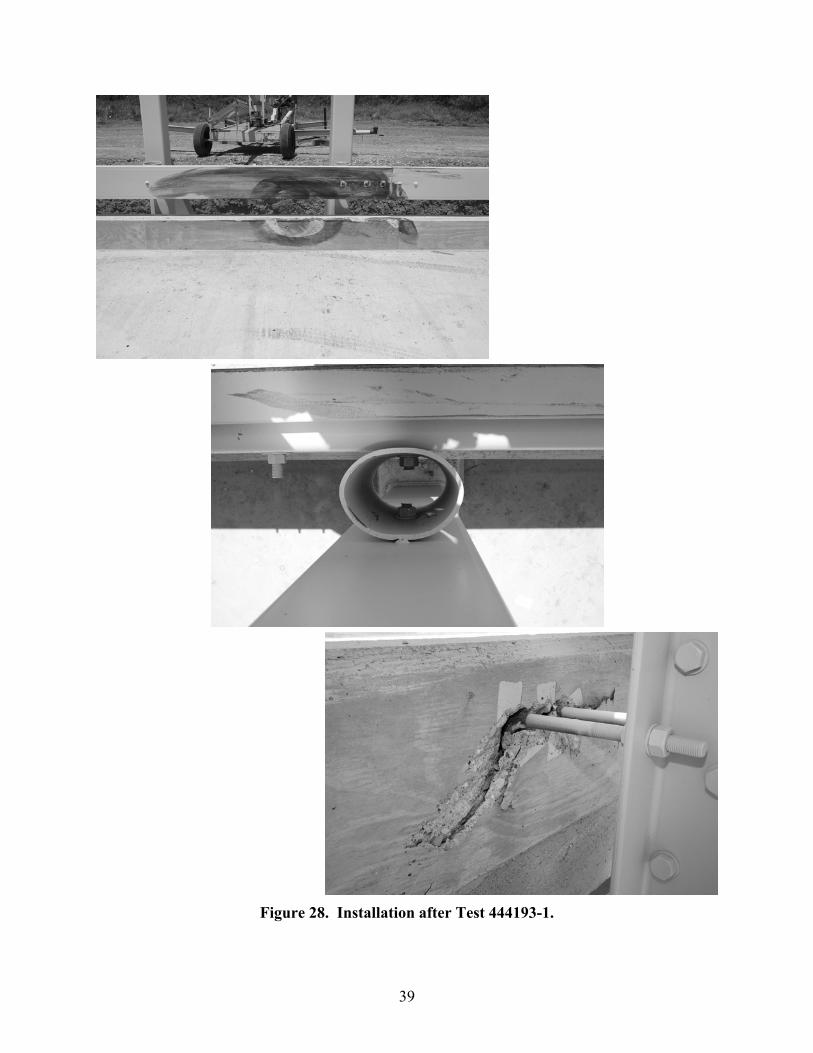
Figure 28. Installation after Test 444193-1.
39
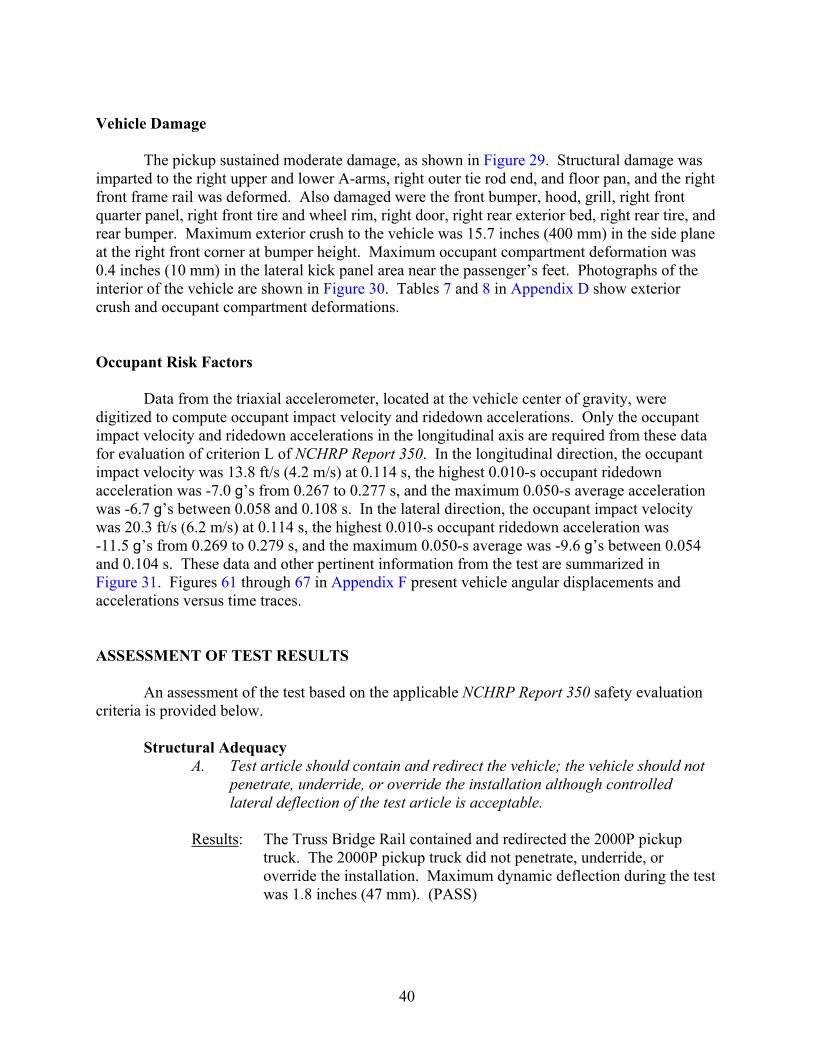
Vehicle Damage The pickup sustained moderate damage, as shown in Figure 29. Structural damage was imparted to the right upper and lower A-arms, right outer tie rod end, and floor pan, and the right front frame rail was deformed. Also damaged were the front bumper, hood, grill, right front quarter panel, right front tire and wheel rim, right door, right rear exterior bed, right rear tire, and rear bumper. Maximum exterior crush to the vehicle was 15.7 inches (400 mm) in the side plane at the right front corner at bumper height. Maximum occupant compartment deformation was 0.4 inches (10 mm) in the lateral kick panel area near the passenger’s feet. Photographs of the interior of the vehicle are shown in Figure 30. Tables 7 and 8 in Appendix D show exterior crush and occupant compartment deformations. Occupant Risk Factors Data from the triaxial accelerometer, located at the vehicle center of gravity, were digitized to compute occupant impact velocity and ridedown accelerations. Only the occupant impact velocity and ridedown accelerations in the longitudinal axis are required from these data for evaluation of criterion L of NCHRP Report 350. In the longitudinal direction, the occupant impact velocity was 13.8 ft/s (4.2 m/s) at 0.114 s, the highest 0.010-s occupant ridedown acceleration was -7.0 g’s from 0.267 to 0.277 s, and the maximum 0.050-s average acceleration was -6.7 g’s between 0.058 and 0.108 s. In the lateral direction, the occupant impact velocity was 20.3 ft/s (6.2 m/s) at 0.114 s, the highest 0.010-s occupant ridedown acceleration was -11.5 g’s from 0.269 to 0.279 s, and the maximum 0.050-s average was -9.6 g’s between 0.054 and 0.104 s. These data and other pertinent information from the test are summarized in Figure 31. Figures 61 through 67 in Appendix F present vehicle angular displacements and accelerations versus time traces. ASSESSMENT OF TEST RESULTS An assessment of the test based on the applicable NCHRP Report 350 safety evaluation criteria is provided below.
Structural Adequacy A. Test article should contain and redirect the vehicle; the vehicle should not
penetrate, underride, or override the installation although controlled lateral deflection of the test article is acceptable.
Results: The Truss Bridge Rail contained and redirected the 2000P pickup
truck. The 2000P pickup truck did not penetrate, underride, or override the installation. Maximum dynamic deflection during the test was 1.8 inches (47 mm). (PASS)
40
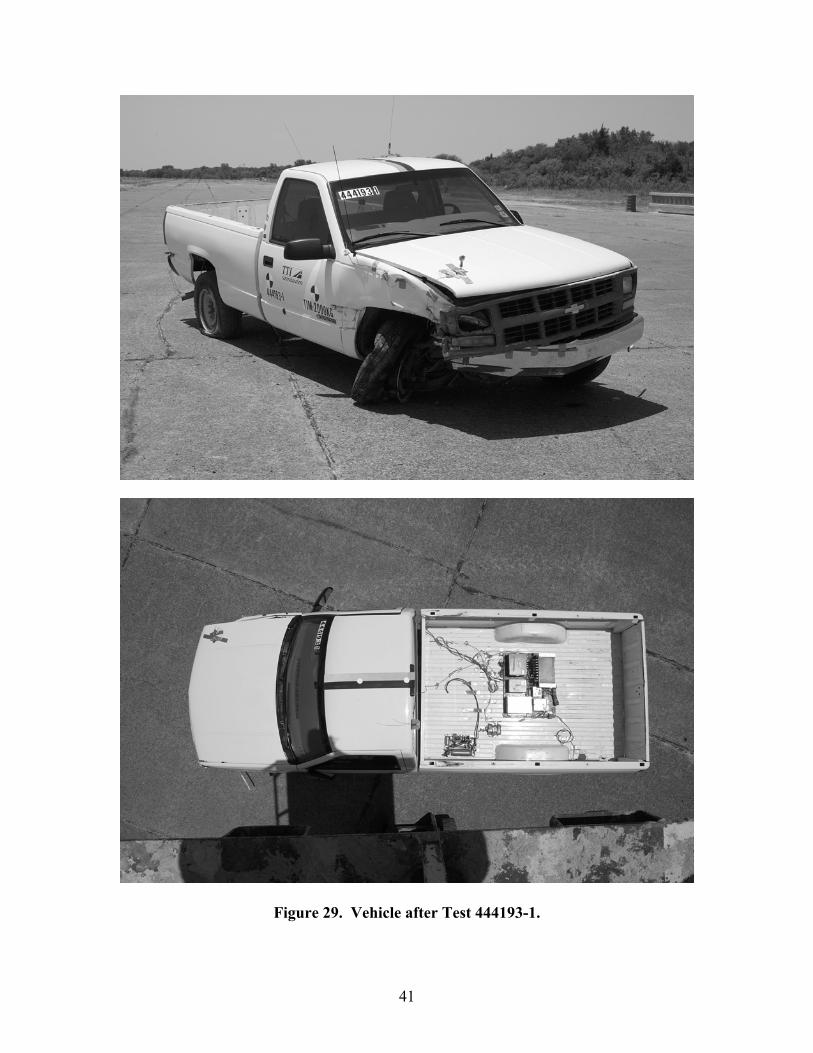
Figure 29. Vehicle after Test 444193-1.
41
42
Before Test
After Test
Figure 30. Interior of Vehicle for Test 444193-1.
0.000 s
0.149 s
0.299 s
0.498 s
C12X20.7
General Information
Test Agency ........................... Test No. ................................. Date .......................................
Test Article Type ....................................... Name ..................................... Installation Length (ft) ............ Material or Key Elements.......
Soil Type and Condition ......... Test Vehicle
Type ....................................... Designation ............................ Model ..................................... Weight (lb)
Curb ................................... Test Inertial ........................ Dummy............................... Gross Static .......................
Texas Transportation Institute 444193-1 05/30/03 Bridge Rail Retrofit Llano Truss Bridge Rail Retrofit 70 (21.3 m) Steel Tube Rail with Steel Posts and Blockouts Concrete Deck, Dry Production 2000P 1998 Chevrolet Cheyenne 2500 Pickup 4441 (2017 kg) 4579 (2079 kg) N/A 4579 (2079 kg)
Impact Conditions
Speed (mi/h)............................Angle (deg)..............................
Exit Conditions Speed (mi/h)............................Angle (deg)..............................
Occupant Risk Values Impact Velocity (ft/s)
x-direction............................y-direction............................
THIV (mi/h) .............................Ridedown Acceleration (g's)
x-direction............................y-direction............................
PHD (g=s).................................ASI ..........................................Max. 0.050-s Average (g's)
x-direction............................y-direction............................z-direction............................
44.4 (71.5 km/h) 25.5 38.6 (62.2 km/h) 5.0 13.8 (4.2 m/s) 20.3 (6.2 m/s) 4.6 (7.4 km/h) -7.0 -11.5 13.0 1.19 -6.7 -9.6 2.7
Test Article Deflection (inches)
Dynamic ................................ Permanent ............................ Working Width ......................
Vehicle Damage Exterior
VDS................................... CDC ..................................
Maximum Exterior Vehicle Crush (inches)......
Interior OCDI .................................
Max. Occ. Compart. Deformation (inches).........
Post-Impact Behavior (during 1.0 s after impact) Max. Yaw Angle (deg)........... Max. Pitch Angle (deg).......... Max. Roll Angle (deg) ...........
1.8 (47 mm) 0.8 (21 mm) 13.6 (349 mm) 01FR2 01FREW2 15.6 (400 mm) RF0001000 0.4 (10 mm) -30.0 12.6 9.0
Figure 31. Summary of Results for NCHRP Report 350 Test 2-11 on the Llano Truss Bridge Rail.
43
Occupant Risk
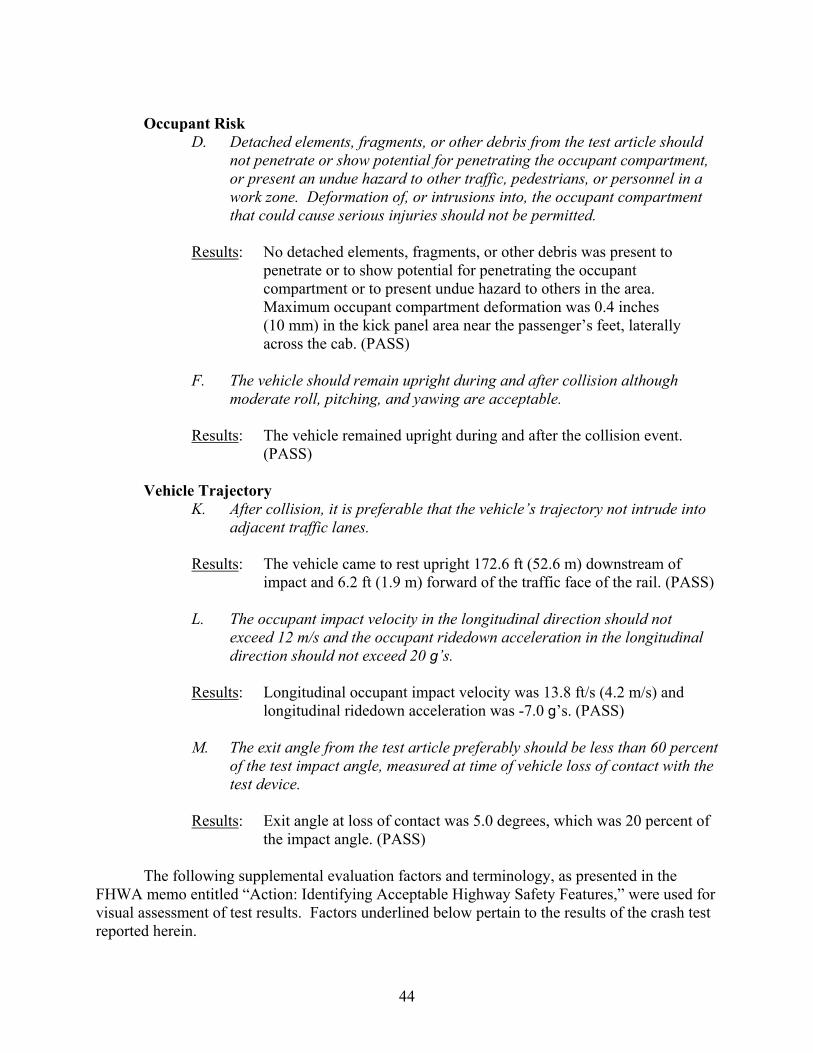
D. Detached elements, fragments, or other debris from the test article should not penetrate or show potential for penetrating the occupant compartment, or present an undue hazard to other traffic, pedestrians, or personnel in a work zone. Deformation of, or intrusions into, the occupant compartment that could cause serious injuries should not be permitted.
Results: No detached elements, fragments, or other debris was present to
penetrate or to show potential for penetrating the occupant compartment or to present undue hazard to others in the area. Maximum occupant compartment deformation was 0.4 inches (10 mm) in the kick panel area near the passenger’s feet, laterally across the cab. (PASS)
F. The vehicle should remain upright during and after collision although
moderate roll, pitching, and yawing are acceptable. Results: The vehicle remained upright during and after the collision event.
(PASS)
Vehicle Trajectory K. After collision, it is preferable that the vehicle’s trajectory not intrude into
adjacent traffic lanes. Results: The vehicle came to rest upright 172.6 ft (52.6 m) downstream of
impact and 6.2 ft (1.9 m) forward of the traffic face of the rail. (PASS) L. The occupant impact velocity in the longitudinal direction should not
exceed 12 m/s and the occupant ridedown acceleration in the longitudinal direction should not exceed 20 g’s.
Results: Longitudinal occupant impact velocity was 13.8 ft/s (4.2 m/s) and
longitudinal ridedown acceleration was -7.0 g’s. (PASS) M. The exit angle from the test article preferably should be less than 60 percent
of the test impact angle, measured at time of vehicle loss of contact with the test device.
Results: Exit angle at loss of contact was 5.0 degrees, which was 20 percent of
the impact angle. (PASS) The following supplemental evaluation factors and terminology, as presented in the FHWA memo entitled “Action: Identifying Acceptable Highway Safety Features,” were used for visual assessment of test results. Factors underlined below pertain to the results of the crash test reported herein.
44

Passenger Compartment Intrusion
1. Windshield Intrusion a. No windshield contact e. Complete intrusion into b. Windshield contact, no damage passenger compartment c. Windshield contact, no intrusion f. Partial intrusion into d. Device embedded in windshield, no
significant intrusion passenger compartment
2. Body Panel Intrusion yes or no
Loss of Vehicle Control 1. Physical loss of control 3. Perceived threat to other vehicles 2. Loss of windshield visibility 4. Debris on pavement
Physical Threat to Workers or Other Vehicles
1. Harmful debris that could injure workers or others in the area 2. Harmful debris that could injure occupants in other vehicles
No debris was present.
Vehicle and Device Condition 1. Vehicle Damage
a. None d. Major dents to grill and body panels b. Minor scrapes, scratches or dents e. Major structural damage c. Significant cosmetic dents
2. Windshield Damage a. None e. Shattered, remained intact but b. Minor chip or crack partially dislodged c. Broken, no interference with visibility f. Large portion removed d. Broken or shattered, visibility
restricted but remained intact g. Completely removed
3. Device Damage a. None d. Substantial, replacement parts b. Superficial needed for repair c. Substantial, but can be straightened e. Cannot be repaired
45

mm
CHAPTER 4. U.S. 281 TRUSS BRIDGE RAIL ANALYSIS AND DESIGN
TxDOT engineers worked closely with researchers at TTI to develop a retrofit bridge railing for the U.S 281 Bridge over the Brazos River in Palo Pinto County, Texas. Their goal was to develop a crashworthy design for high-speed application that preserves the historical character of the bridge. Initially, TxDOT personnel and the TTI researchers decided to improve safety performance by lowering the bridge rail from a height of 37 inches (940 mm) above the existing pavement surface to a height of 30 inches (762 mm). Maintaining the visual appearance of the existing C12×20.7 (C310×31) bridge rail by adding another rail element behind this rail was also preferred. Researchers decided to maintain the clear roadway width of 24 ft (7.3 m). Several truss members on existing truss bridges have been damaged by vehicular collision. The goal of this research was to develop a crashworthy design with sufficient structural capacity to meet the NCHRP Report 350 TL-3 requirements. Several different conceptual designs were developed for this project and are presented in Appendix G. A variation of Option #4 was selected by the TxDOT project team. TTI researchers and the TxDOT project team worked closely to develop a conceptual design for analysis. After a conceptual design was developed, calculations were performed on the new retrofit design to determine if it had sufficient structural capacity to meet the requirements for TL-3 impact conditions as stated in the current AASHTO LRFD Bridge Design Specifications. The capacity of the new retrofit design developed by TTI researchers did meet the minimum AASHTO TL-3 strength requirements.
The conceptual design selected for testing utilized a new rail system mounted on top of the existing concrete curb. This design relocates the bridge rail away from the truss members and provides a clear space between the bridge rail and the truss members. An analysis was performed to determine the structural adequacy of the curb to support a new rail system. The test installation constructed for this project included a simulated portion of the actual bridge superstructure supporting the concrete deck and curb. The new retrofit rail was attached directly to the top of the curb using chemical epoxy anchor bolts, which were also incorporated into the design of the new rail system. Finite element analyses were performed on the post to determine stresses in the post and baseplate and to determine forces in the bolts. Based on these analyses, TTI researchers recommended that the prototype bridge rail be 30 inches (762 mm) in height and be supported separately from the truss members by the concrete curb. To maintain the existing structural appearance of the bridge, the existing C12×20.7 (C310×31) rail was mounted in front of a W6×20 (W150×30) rail in the new retrofit design. The new rail is supported by fabricated W6×20 (W150×30) steel posts anchored into the existing concrete curb using adhesive anchors. The retrofit bridge railing strength calculations are presented in Appendix G.
47
48
TEST INSTALLATION PROTOTYPE
TTI received drawings from TxDOT entitled “Brazos River Bridge, U.S. Highway No. 281, Palo Pinto County” dated July 13, 1937. Details from these drawings were used to prepare construction and fabrication drawings for the test installation for this project, shown as Figures 32 through 35. The existing U.S. 281 Bridge consists of three steel spans with two spans measuring 202 ft 0 inches (61.6 m) and the third middle span measuring 253 ft 6 inches (77.3 m). The shorter spans have eight panels, each measuring 25 ft 3 inches (7.7 m), and the longer middle span has 10 panels, each measuring also 25 ft 3 inches (7.7 m). The total length of the bridge including the approach structures is 1138 ft 4 inches (347 m). For this project, TTI constructed approximately 75 ft (22.8 m) of concrete curb and deck similar to the actual deck and curb on the existing bridge structure. The width of the concrete deck constructed for this project was 2 ft 0 inches (610 mm). The existing concrete curb and deck is supported by five longitudinal stringers spaced 6 ft (1.8 m) on centers spanning between the W36×150 (W920×223) panel beams. The exterior stringers are W18×55 (W460×82) and the interior stringers are W21×68 (W530×101). In lieu of constructing W18×55 (W460×82) exterior stringers to support the deck and curb, a 7-1/2-inch (191 mm) wide concrete wall was constructed and used to support the simulated concrete deck and curb.
The simulated concrete deck constructed for this project was 7-1/2 inches (191 mm)
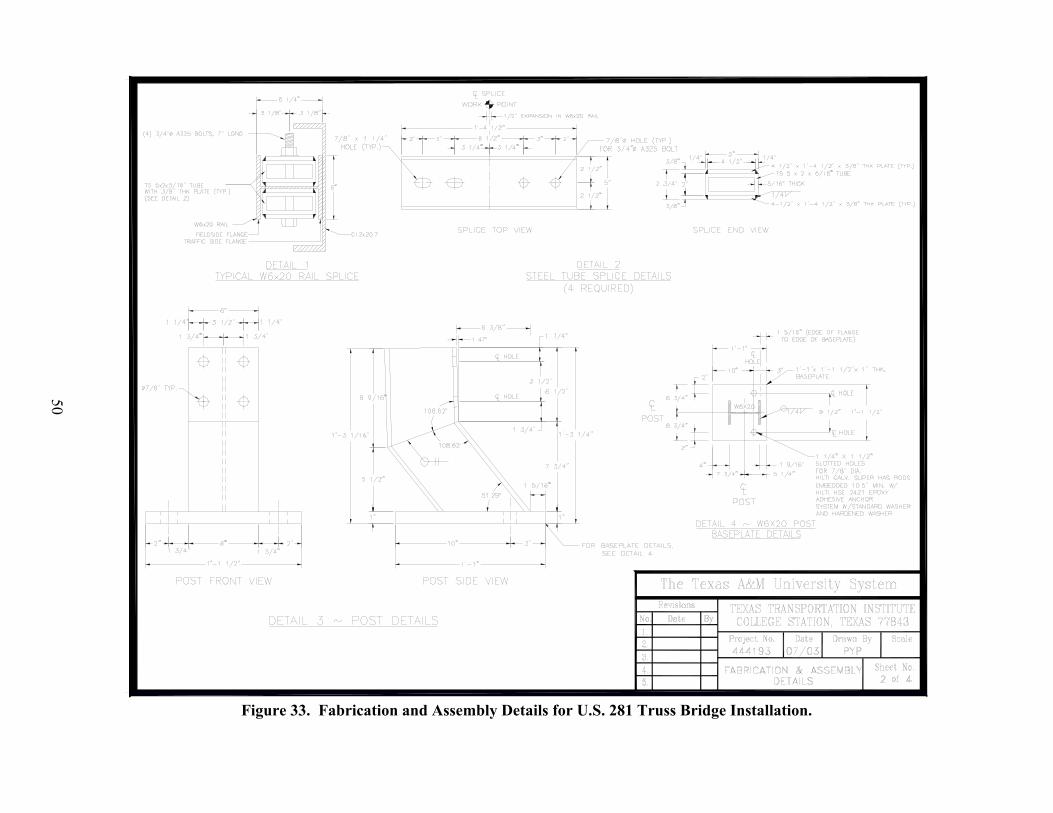
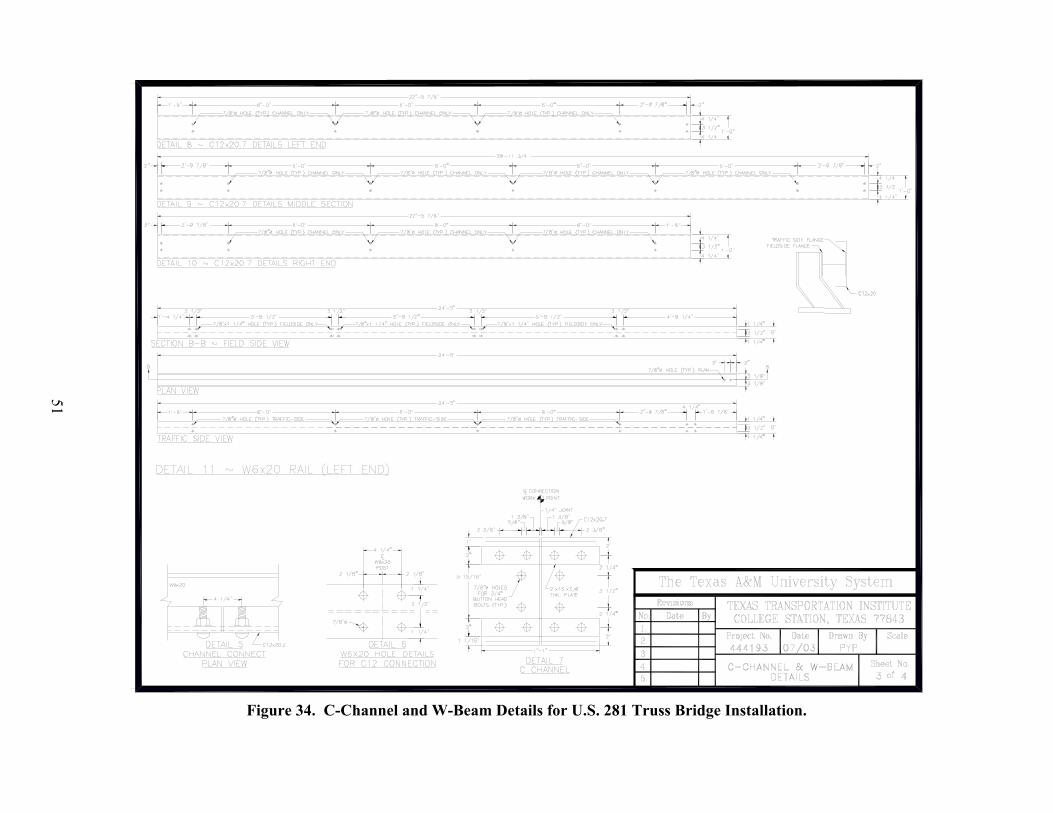
thick. The curb was 12 inches (305 mm) high, 1 ft 7-1/2 inches (495 mm) wide at the top, and 9-1/2 inches (241 mm) wide at the gutter line. The top of the curb sloped downward 1/2 inch (12 mm) over the full top width of the curb. Transverse reinforcement in the deck consisted of #5 (#16) “hooked” bars at 6-1/2 inches (165 mm) on centers. Transverse reinforcement in the curb consisted of #5 (#16) “Z”-shaped bars at 13 inches (330 mm) on centers on both the traffic and field faces of the curb. Longitudinal reinforcement in the deck and curb consisted of #4 (#12) bars spaced within the transverse “hooked” bars, at bends in the curb reinforcement, and at representative locations within the actual deck. Concrete compressive strength tests were performed on representative samples of the deck and curb concrete just prior to testing. The concrete compressive strength on the deck and curb concrete was 3908 psi (27 MPa) and 4158 psi (29 MPa), respectively. A new retrofit steel bridge rail was designed and constructed for the U.S. 281 Bridge over the Brazos River in Palo Pinto County, Texas. The bridge rail consisted of W6×20 (W150×30) steel posts and bridge railing with a C12×20.7 (C310×31) attached to the face of the W6 (W150) bridge rail. The C12×20.7 (C310×31) was attached to the flange of the W6×20 (W150×30) to maintain the historical appearance of the new retrofit design. The W6×20 (W150×30) steel posts were 1 ft 3-1/4 inches (387 mm) in height and spaced 6 ft 0 inches (1.83 m) on centers. The posts were attached to 1 ft 1-1/2 inch (343 mm) × 1 ft 1 inch (330 mm) × 1 inch (25 mm) thick steel baseplates. The posts were fabricated such that the top of the post was offset 6-3/8 inches from the base of the post to provide additional roadway clearance for traffic. The C12×20.7 (C310×31) was attached to the front flange of the W6×20 (W150×30) rail using 3/4-inch (19 mm) diameter Grade 8, “button-head” machine bolts, 3 inches (75 mm) in length.
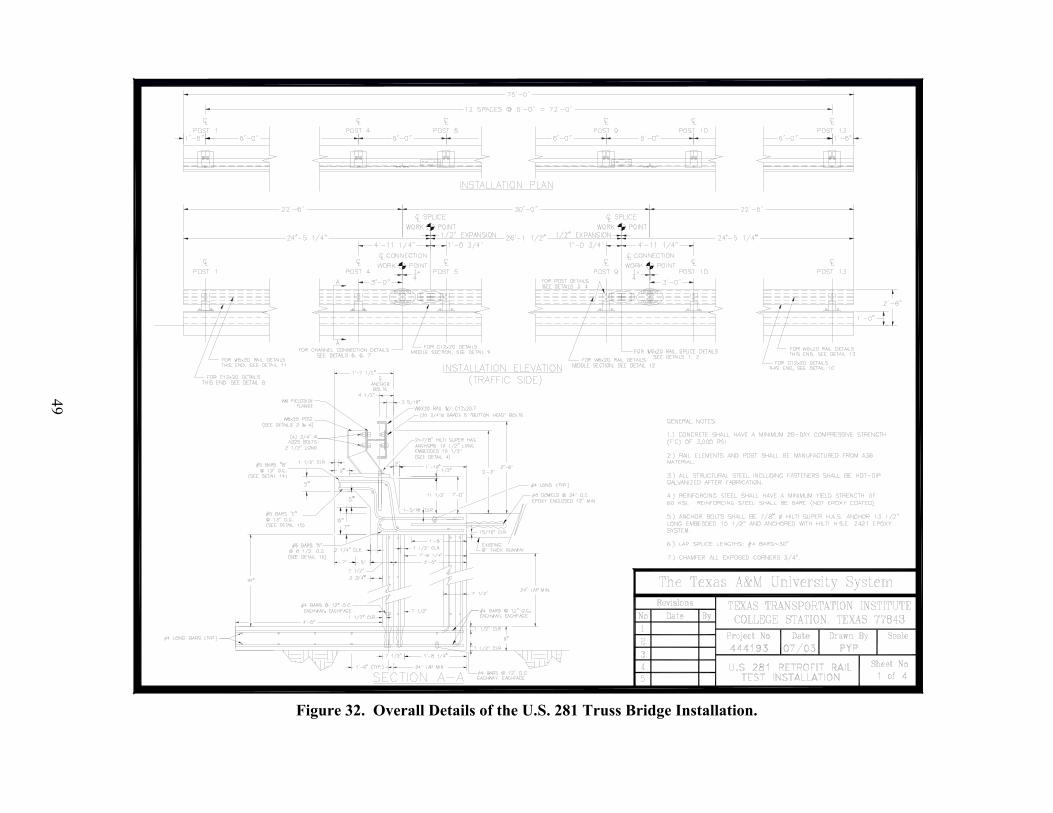
49
Figure 32. Overall Details of the U.S. 281 Truss Bridge Installation.
50
Figure 33. Fabrication and Assembly Details for U.S. 281 Truss Bridge Installation.
51
Figure 34. C-Channel and W-Beam Details for U.S. 281 Truss Bridge Installation.

Figure 35. W-Beam and Rebar Details for U.S. 281 Truss Bridge Installation.
52
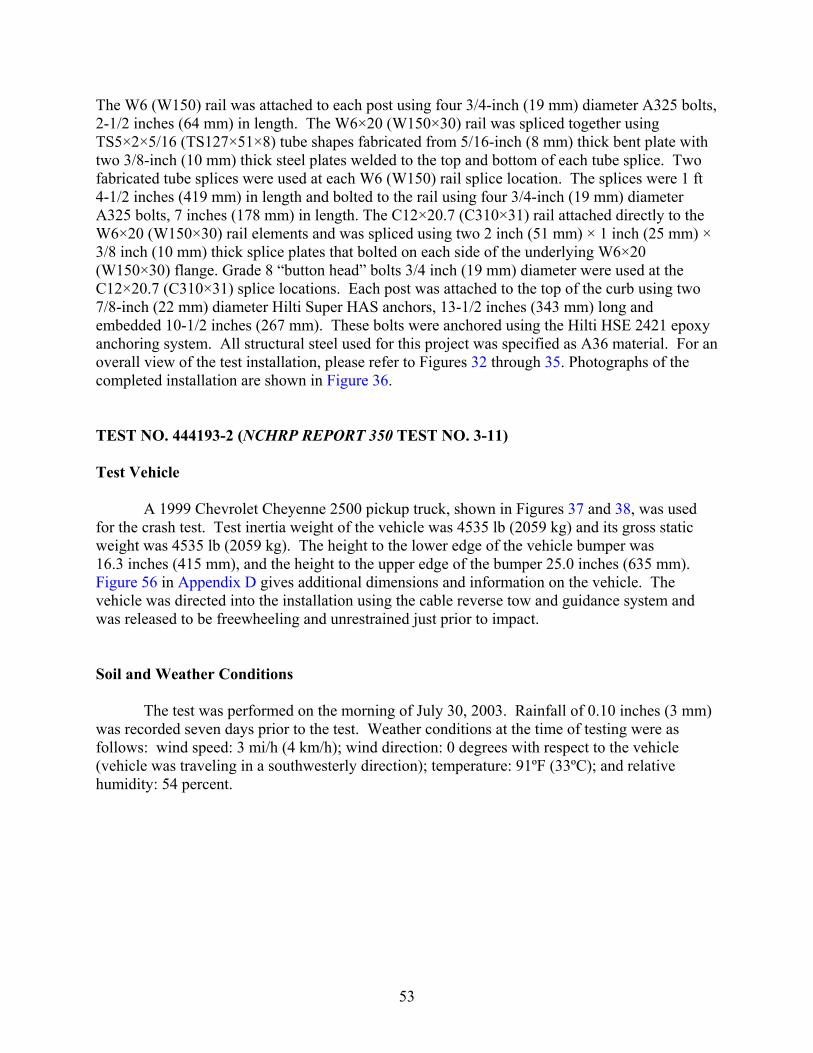
The W6 (W150) rail was attached to each post using four 3/4-inch (19 mm) diameter A325 bolts, 2-1/2 inches (64 mm) in length. The W6×20 (W150×30) rail was spliced together using TS5×2×5/16 (TS127×51×8) tube shapes fabricated from 5/16-inch (8 mm) thick bent plate with two 3/8-inch (10 mm) thick steel plates welded to the top and bottom of each tube splice. Two fabricated tube splices were used at each W6 (W150) rail splice location. The splices were 1 ft 4-1/2 inches (419 mm) in length and bolted to the rail using four 3/4-inch (19 mm) diameter A325 bolts, 7 inches (178 mm) in length. The C12×20.7 (C310×31) rail attached directly to the W6×20 (W150×30) rail elements and was spliced using two 2 inch (51 mm) × 1 inch (25 mm) × 3/8 inch (10 mm) thick splice plates that bolted on each side of the underlying W6×20 (W150×30) flange. Grade 8 “button head” bolts 3/4 inch (19 mm) diameter were used at the C12×20.7 (C310×31) splice locations. Each post was attached to the top of the curb using two 7/8-inch (22 mm) diameter Hilti Super HAS anchors, 13-1/2 inches (343 mm) long and embedded 10-1/2 inches (267 mm). These bolts were anchored using the Hilti HSE 2421 epoxy anchoring system. All structural steel used for this project was specified as A36 material. For an overall view of the test installation, please refer to Figures 32 through 35. Photographs of the completed installation are shown in Figure 36. TEST NO. 444193-2 (NCHRP REPORT 350 TEST NO. 3-11) Test Vehicle A 1999 Chevrolet Cheyenne 2500 pickup truck, shown in Figures 37 and 38, was used for the crash test. Test inertia weight of the vehicle was 4535 lb (2059 kg) and its gross static weight was 4535 lb (2059 kg). The height to the lower edge of the vehicle bumper was 16.3 inches (415 mm), and the height to the upper edge of the bumper 25.0 inches (635 mm). Figure 56 in Appendix D gives additional dimensions and information on the vehicle. The vehicle was directed into the installation using the cable reverse tow and guidance system and was released to be freewheeling and unrestrained just prior to impact. Soil and Weather Conditions The test was performed on the morning of July 30, 2003. Rainfall of 0.10 inches (3 mm) was recorded seven days prior to the test. Weather conditions at the time of testing were as follows: wind speed: 3 mi/h (4 km/h); wind direction: 0 degrees with respect to the vehicle (vehicle was traveling in a southwesterly direction); temperature: 91ºF (33ºC); and relative humidity: 54 percent.
53
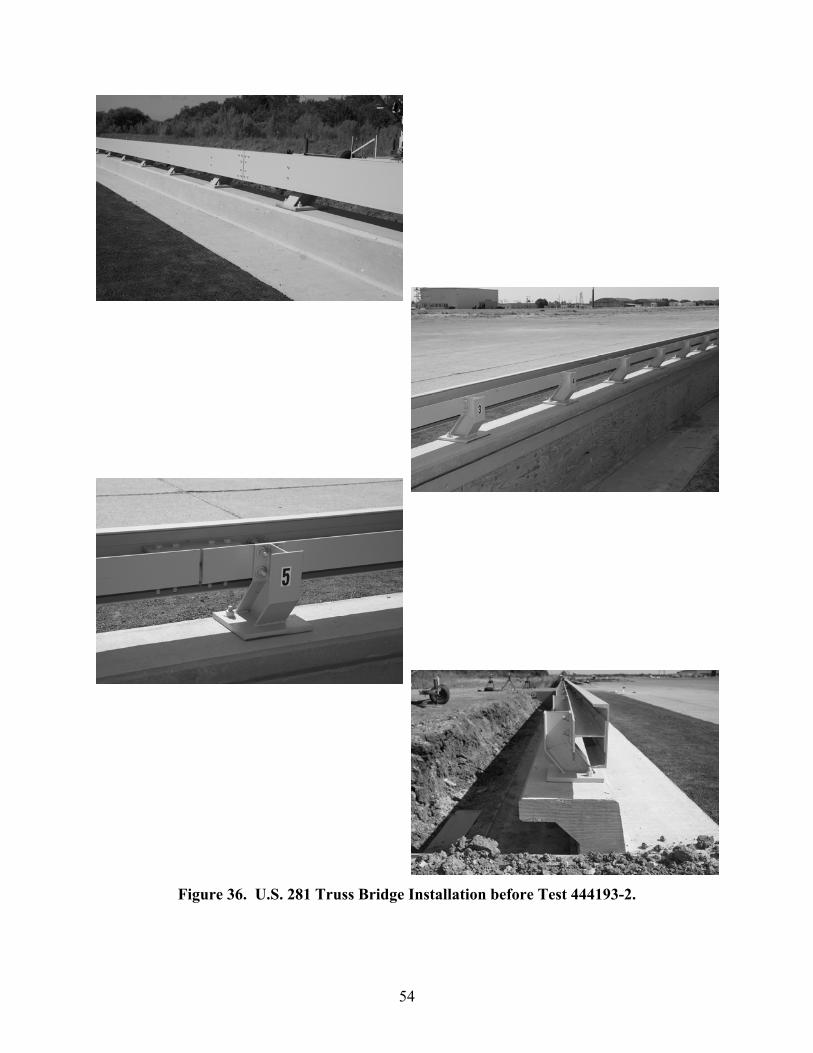
Figure 36. U.S. 281 Truss Bridge Installation before Test 444193-2.
54
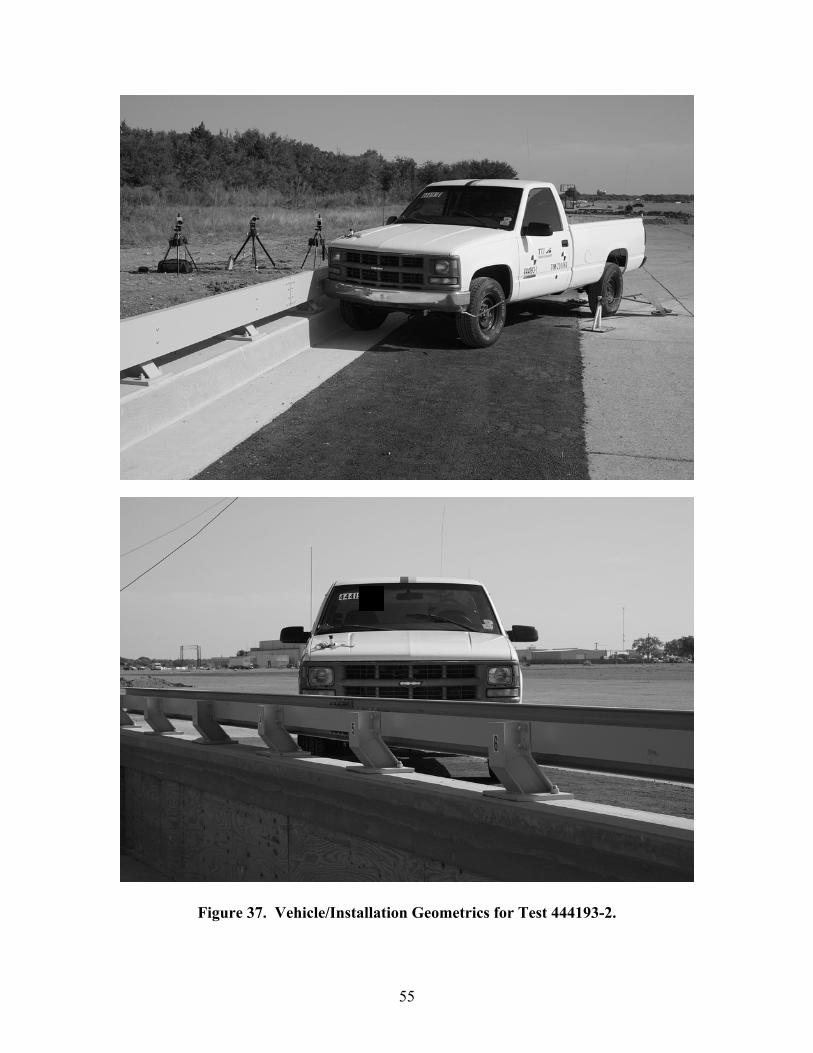
Figure 37. Vehicle/Insta
llation Geometrics for Test 444193-2.55
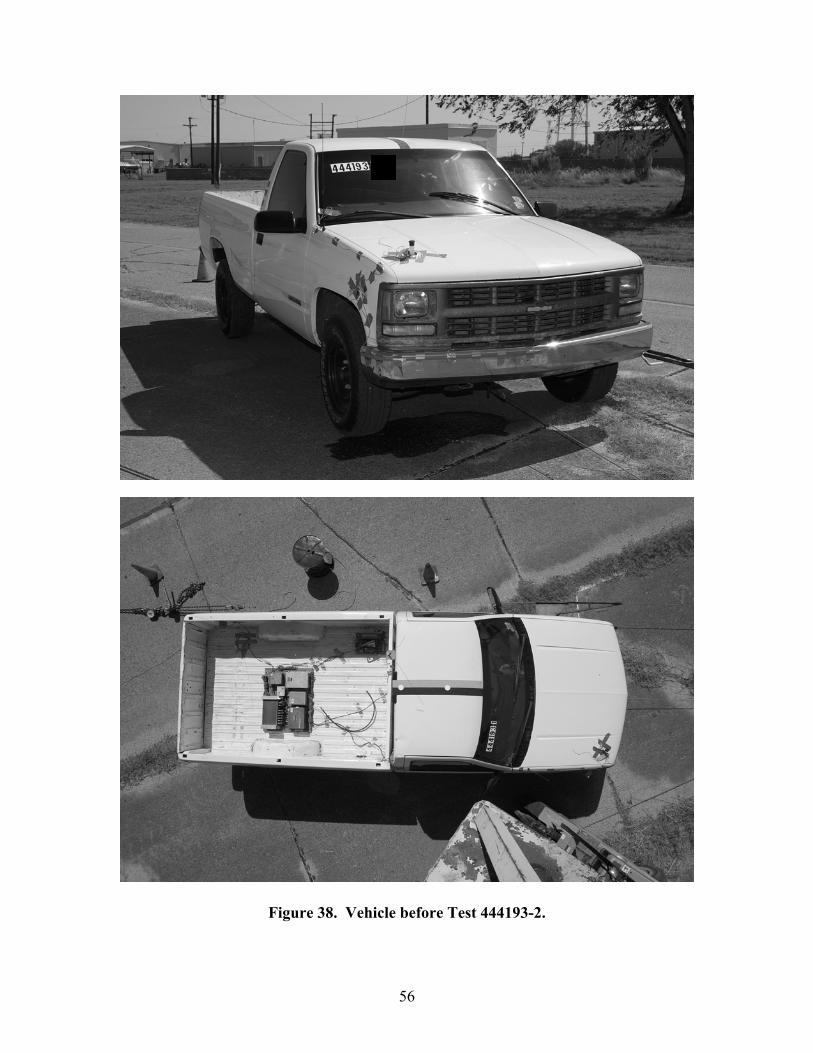
Figure 38. Veh
icle before Test 444193-2.56
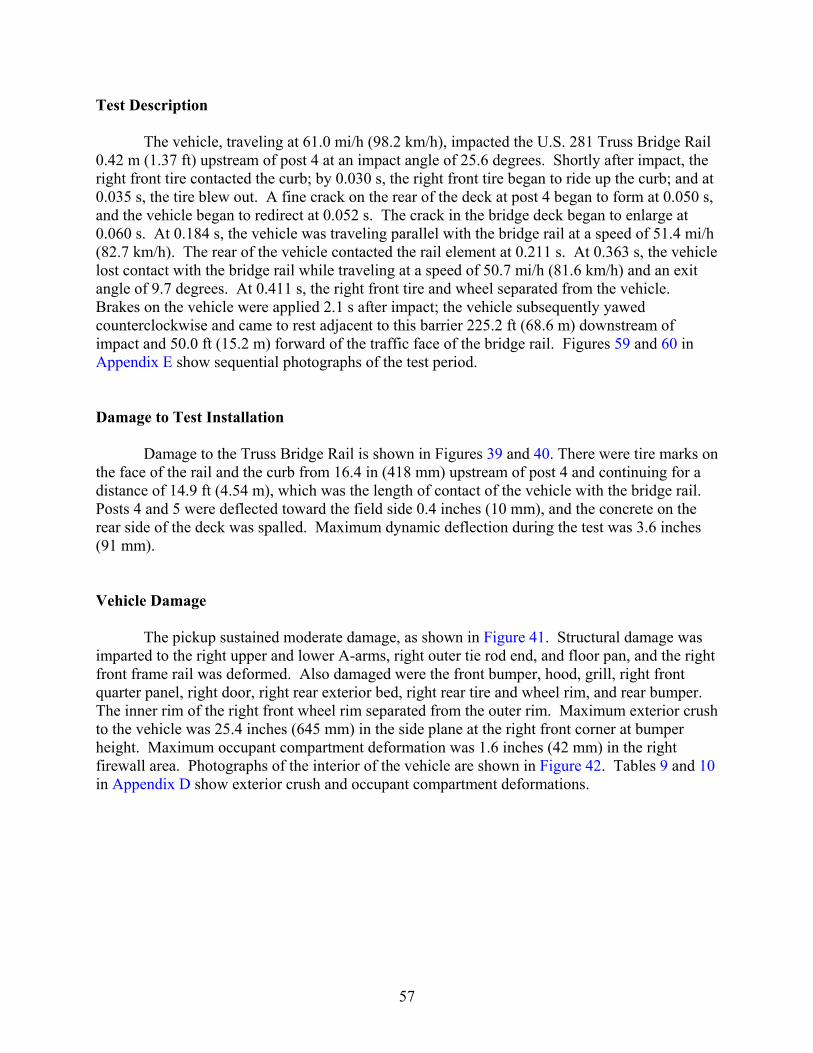
Test Description The vehicle, traveling at 61.0 mi/h (98.2 km/h), impacted the U.S. 281 Truss Bridge Rail 0.42 m (1.37 ft) upstream of post 4 at an impact angle of 25.6 degrees. Shortly after impact, the right front tire contacted the curb; by 0.030 s, the right front tire began to ride up the curb; and at 0.035 s, the tire blew out. A fine crack on the rear of the deck at post 4 began to form at 0.050 s, and the vehicle began to redirect at 0.052 s. The crack in the bridge deck began to enlarge at 0.060 s. At 0.184 s, the vehicle was traveling parallel with the bridge rail at a speed of 51.4 mi/h (82.7 km/h). The rear of the vehicle contacted the rail element at 0.211 s. At 0.363 s, the vehicle lost contact with the bridge rail while traveling at a speed of 50.7 mi/h (81.6 km/h) and an exit angle of 9.7 degrees. At 0.411 s, the right front tire and wheel separated from the vehicle. Brakes on the vehicle were applied 2.1 s after impact; the vehicle subsequently yawed counterclockwise and came to rest adjacent to this barrier 225.2 ft (68.6 m) downstream of impact and 50.0 ft (15.2 m) forward of the traffic face of the bridge rail. Figures 59 and 60 in Appendix E show sequential photographs of the test period. Damage to Test Installation Damage to the Truss Bridge Rail is shown in Figures 39 and 40. There were tire marks on the face of the rail and the curb from 16.4 in (418 mm) upstream of post 4 and continuing for a distance of 14.9 ft (4.54 m), which was the length of contact of the vehicle with the bridge rail. Posts 4 and 5 were deflected toward the field side 0.4 inches (10 mm), and the concrete on the rear side of the deck was spalled. Maximum dynamic deflection during the test was 3.6 inches (91 mm). Vehicle Damage The pickup sustained moderate damage, as shown in Figure 41. Structural damage was imparted to the right upper and lower A-arms, right outer tie rod end, and floor pan, and the right front frame rail was deformed. Also damaged were the front bumper, hood, grill, right front quarter panel, right door, right rear exterior bed, right rear tire and wheel rim, and rear bumper. The inner rim of the right front wheel rim separated from the outer rim. Maximum exterior crush to the vehicle was 25.4 inches (645 mm) in the side plane at the right front corner at bumper height. Maximum occupant compartment deformation was 1.6 inches (42 mm) in the right firewall area. Photographs of the interior of the vehicle are shown in Figure 42. Tables 9 and 10 in Appendix D show exterior crush and occupant compartment deformations.
57
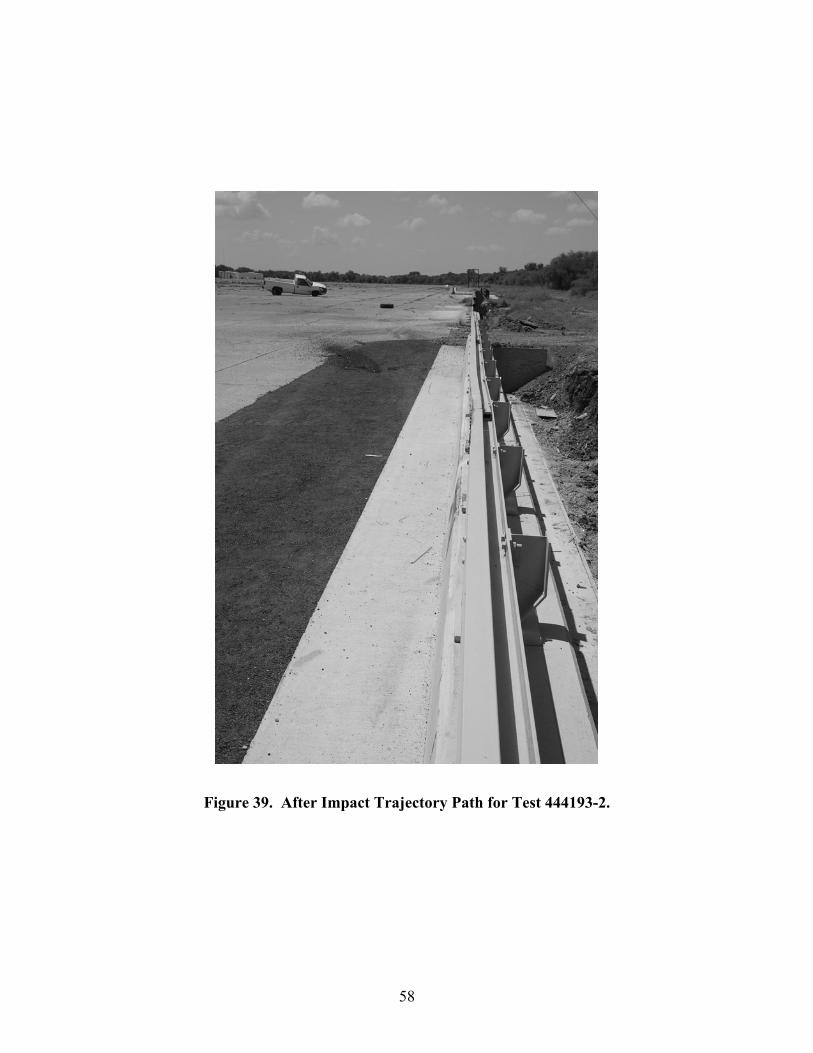
Figure 39. After Impact Trajectory Path for Test 444193-2.
58
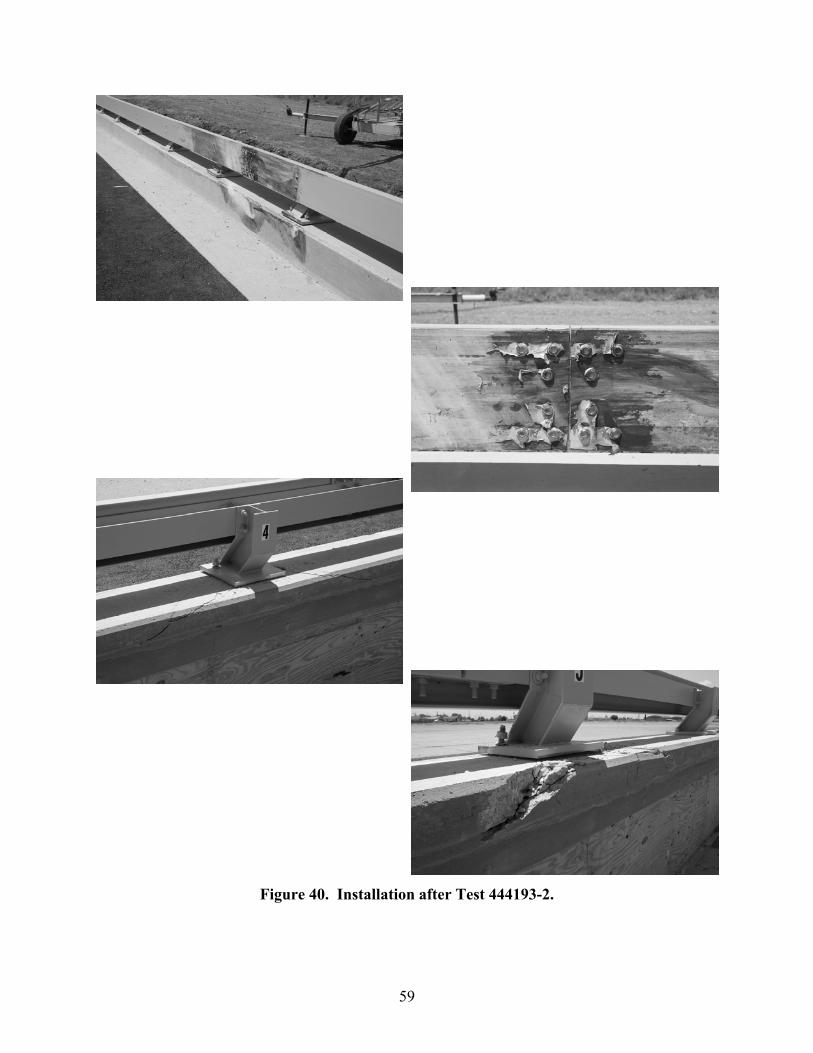
Figure 40. Installation after Test 444193-2.
59

Figure 41. Vehicle after Test 444193-2.
60
Before Test
After Test
Figure 42. Interior of Vehicle for Test 444193-2.
61
62
Occupant Risk Factors Data from the triaxial accelerometer, located at the vehicle’s center of gravity, were digitized to compute occupant impact velocity and ridedown accelerations. Only the occupant impact velocity and ridedown accelerations in the longitudinal axis are required from these data for evaluation of criterion L of NCHRP Report 350. In the longitudinal direction, the occupant impact velocity was 17.4 ft/s (5.3 m/s) at 0.095 s, the highest 0.010-s occupant ridedown acceleration was -8.7 g’s from 0.095 to 0.105 s, and the maximum 0.050-s average acceleration was -8.6 g’s between 0.017 and 0.067 s. In the lateral direction, the occupant impact velocity was 22.6 ft/s (6.9 m/s) at 0.095 s, the highest 0.010-s occupant ridedown acceleration was -10.2 g’s from 0.226 to 0.236 s, and the maximum 0.050-s average was -12.3 g’s between 0.018 and 0.068 s. These data and other pertinent information from the test are summarized in Figure 43. Figures 68 through 74 in Appendix F present vehicle angular displacements and acceleration versus time traces. ASSESSMENT OF TEST RESULTS An assessment of the test based on the applicable NCHRP Report 350 safety evaluation criteria is provided below.
Structural Adequacy A. Test article should contain and redirect the vehicle; the vehicle should not
penetrate, underride, or override the installation although controlled lateral deflection of the test article is acceptable.
Results: The Truss Bridge Rail contained and redirected the 2000P pickup
truck. The 2000P pickup truck did not penetrate, underride, or override the installation. Maximum dynamic deflection during the test was 3.6 inches (91 mm). (PASS)
Occupant Risk
D. Detached elements, fragments, or other debris from the test article should not penetrate or show potential for penetrating the occupant compartment, or present an undue hazard to other traffic, pedestrians, or personnel in a work zone. Deformation of, or intrusions into, the occupant compartment that could cause serious injuries should not be permitted.
Results: No detached elements, fragments, or other debris was present to
penetrate or to show potential for penetrating the occupant compartment or to present undue hazard to others in the area. Maximum occupant compartment deformation was 1.6 inches (42 mm) in the kick panel area near the passenger’s feet, laterally across the cab. (PASS)
0.000 s
0.125 s
0.424 s
1.247 s
General Information
Test Agency ........................... Test No. ................................. Date .......................................
Test Article Type ....................................... Name ..................................... Installation Length (ft) ............ Material or Key Elements.......
Soil Type and Condition ......... Test Vehicle
Type ....................................... Designation ............................ Model ..................................... Weight (lb)
Curb ................................... Test Inertial ........................ Dummy............................... Gross Static .......................
Texas Transportation Institute 444193-2 07/30/03 Bridge Rail Retrofit U.S. 281 Truss Bridge Rail Retrofit 75 (22.8 m) Steel Rail (W6x20 With C12x20.7) and Steel Post (W6x20) System Concrete Footing, Dry Production 2000P 1999 Chevrolet Cheyenne 2500 Pickup 4635 (2105 kg) 4535 (2059 kg) N/A 4535 (2059 kg)
Impact Conditions
Speed (mi/h)............................Angle (deg)..............................
Exit Conditions Speed (mi/h)............................Angle (deg)..............................
Occupant Risk Values Impact Velocity (ft/s)
x-direction............................y-direction............................
THIV (mi/h) .............................Ridedown Accelerations (g's)
x-direction............................y-direction............................
PHD (g=s).................................ASI ..........................................Max. 0.050-s Average (g's)
x-direction............................y-direction............................z-direction............................
61.0 (98.2 km/h) 25.6 50.7 (81.6 km/h) 9.7 17.4 (5.3 m/s) 22.6 (6.9 m/s) 18.9 (30.5 km/h) -8.7 -10.2 10.7 1.57 -8.6 -12.3 -3.5
Test Article Deflection (inches)
Dynamic ................................ Permanent ............................ Working Width ......................
Vehicle Damage Exterior
VDS................................... CDC ..................................
Maximum Exterior Vehicle Crush (inches)......
Interior OCDI .................................
Max. Occ. Compart. Deformation (inches).........
Post-Impact Behavior (during 1.0 s after impact) Max. Yaw Angle (deg)........... Max. Pitch Angle (deg).......... Max. Roll Angle (deg) ...........
0.4 (10 mm) 3.6 (91 mm) 22.6 (579 mm) 01FR2 01FREW2 25.2 (645 mm) RF0111000 1.6 (42 mm) -57.1 -21.6 27.8
Figure 43. Summary of Results for Test 444193-2, NCHRP Report 350 Test 3-11.
63
F. The vehicle should remain upright during and after collision although
moderate roll, pitching, and yawing are acceptable. Results: The vehicle remained upright during and after the collision event.
(PASS)
Vehicle Trajectory K. After collision, it is preferable that the vehicle’s trajectory not intrude into
adjacent traffic lanes. Results: The vehicle came to rest upright 225.2 ft (68.6 m) downstream of
impact and 50.0 ft (15.2 m) forward of the traffic face of the rail. (FAIL)
L. The occupant impact velocity in the longitudinal direction should not
exceed 12 m/s and the occupant ridedown acceleration in the longitudinal direction should not exceed 20 g’s.
Results: Longitudinal occupant impact velocity was 17.4 ft/s (5.3 m/s), and
longitudinal ridedown acceleration was -8.7 g’s. (PASS) M. The exit angle from the test article preferably should be less than 60 percent
of the test impact angle, measured at time of vehicle loss of contact with the test device.
Results: Exit angle at loss of contact was 9.7 degrees, which was 38 percent of
the impact angle. (PASS) The following supplemental evaluation factors and terminology, as presented in the FHWA memo entitled “Action: Identifying Acceptable Highway Safety Features,” were used for visual assessment of test results. Factors underlined below pertain to the results of the crash test reported herein.
Passenger Compartment Intrusion 1. Windshield Intrusion
a. No windshield contact e. Complete intrusion into b. Windshield contact, no damage passenger compartment c. Windshield contact, no intrusion f. Partial intrusion into d. Device embedded in windshield, no
significant intrusion passenger compartment
2. Body Panel Intrusion yes or no
Loss of Vehicle Control 1. Physical loss of control 3. Perceived threat to other vehicles 2. Loss of windshield visibility 4. Debris on pavement
64
Physical Threat to Workers or Other Vehicles
1. Harmful debris that could injure workers or others in the area 2. Harmful debris that could injure occupants in other vehicles
No debris was present.
Vehicle and Device Condition 1. Vehicle Damage
a. None d. Major dents to grill and body panels b. Minor scrapes, scratches or dents e. Major structural damage c. Significant cosmetic dents
2. Windshield Damage a. None e. Shattered, remained intact but b. Minor chip or crack partially dislodged c. Broken, no interference with visibility f. Large portion removed d. Broken or shattered, visibility
restricted but remained intact g. Completely removed
3. Device Damage a. None d. Substantial, replacement parts b. Superficial needed for repair c. Substantial, but can be straightened e. Cannot be repaired
65

mm
CHAPTER 5. DESIGN EXCEPTIONS BACKGROUND Many existing historic through-truss bridges are located on highways with posted speed limits greater than 45 mi/h (72 km/h), and a TL-3 bridge rail would be indicated. These bridges typically have narrow roadways (<28 ft [<8.5 m]), and many have narrow curbs that would not accommodate the curb-mounted TL-3 rail retrofit described in the previous chapter. TxDOT seeks methods for evaluating the response of existing truss bridge members to impact forces resulting from mounting a TL-3 retrofit rail directly to an existing historic truss. This chapter evaluates the magnitude of design impact forces appropriate for evaluating the response of typical existing historic truss bridges. Crash testing procedures for evaluating performance of bridge rails and other highway safety structures are based on the assumption that the errant vehicle is tracking straight ahead with no side-slip and no yaw velocity. Recommended test conditions include the vehicle type/mass, speed, and approach angle. Lateral placement of the vehicle with respect to the device being tested is also included for guardrail terminals, sign supports, and other similar devices. For tests wherein a bridge rail is expected to contain and redirect the colliding vehicle, the vehicle type/mass, speed, and approach angle are the parameters addressed. TL-3 of NCHRP Report 350 includes two redirection tests for a bridge rail. They are:
NCHRP Report 350 test designation 3-10: An 1806-lb (820 kg) passenger car impacts the CIP in the LON of the longitudinal barrier at a nominal speed and angle of 62 mi/h (100 km/h) and 20 degrees. The purpose of this test is to evaluate the overall performance of the LON section in general and occupant risks in particular.
NCHRP Report 350 test designation 3-11: A 4405-lb (2000 kg) pickup truck impacts the CIP in the LON of the longitudinal barrier at a nominal speed and angle of 62 mi/h (100 km/h) and 25 degrees. The test is intended to evaluate the strength of the section for containing and redirecting the pickup truck.
TL-3 is generally used for high-speed highways (posted speed limit above 45 mi/h [72 km/h]) regardless of the width or other characteristics of the highway. NCHRP Report 350 also includes recommended test conditions for TL-2. They are:
NCHRP Report 350 test designation 2-10: An 1806-lb (820 kg) passenger car impacts the CIP in the LON of the longitudinal barrier at a nominal speed and angle of 43.5 mi/h (70 km/h) and 20 degrees. The purpose of this test is to evaluate the overall performance of the LON section in general and occupant risks in particular.
67
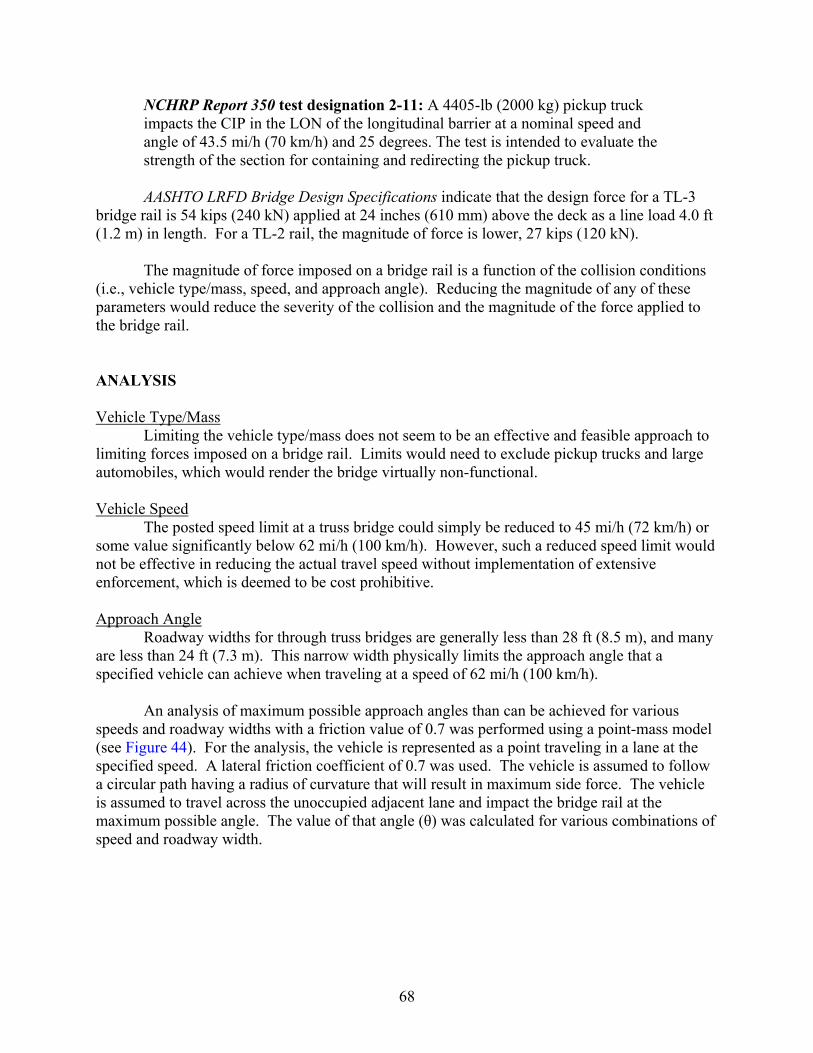
NCHRP Report 350 test designation 2-11: A 4405-lb (2000 kg) pickup truck impacts the CIP in the LON of the longitudinal barrier at a nominal speed and angle of 43.5 mi/h (70 km/h) and 25 degrees. The test is intended to evaluate the strength of the section for containing and redirecting the pickup truck.
AASHTO LRFD Bridge Design Specifications indicate that the design force for a TL-3 bridge rail is 54 kips (240 kN) applied at 24 inches (610 mm) above the deck as a line load 4.0 ft (1.2 m) in length. For a TL-2 rail, the magnitude of force is lower, 27 kips (120 kN). The magnitude of force imposed on a bridge rail is a function of the collision conditions (i.e., vehicle type/mass, speed, and approach angle). Reducing the magnitude of any of these parameters would reduce the severity of the collision and the magnitude of the force applied to the bridge rail. ANALYSIS Vehicle Type/Mass Limiting the vehicle type/mass does not seem to be an effective and feasible approach to limiting forces imposed on a bridge rail. Limits would need to exclude pickup trucks and large automobiles, which would render the bridge virtually non-functional. Vehicle Speed The posted speed limit at a truss bridge could simply be reduced to 45 mi/h (72 km/h) or some value significantly below 62 mi/h (100 km/h). However, such a reduced speed limit would not be effective in reducing the actual travel speed without implementation of extensive enforcement, which is deemed to be cost prohibitive. Approach Angle Roadway widths for through truss bridges are generally less than 28 ft (8.5 m), and many are less than 24 ft (7.3 m). This narrow width physically limits the approach angle that a specified vehicle can achieve when traveling at a speed of 62 mi/h (100 km/h). An analysis of maximum possible approach angles than can be achieved for various speeds and roadway widths with a friction value of 0.7 was performed using a point-mass model (see Figure 44). For the analysis, the vehicle is represented as a point traveling in a lane at the specified speed. A lateral friction coefficient of 0.7 was used. The vehicle is assumed to follow a circular path having a radius of curvature that will result in maximum side force. The vehicle is assumed to travel across the unoccupied adjacent lane and impact the bridge rail at the maximum possible angle. The value of that angle (θ) was calculated for various combinations of speed and roadway width.
68
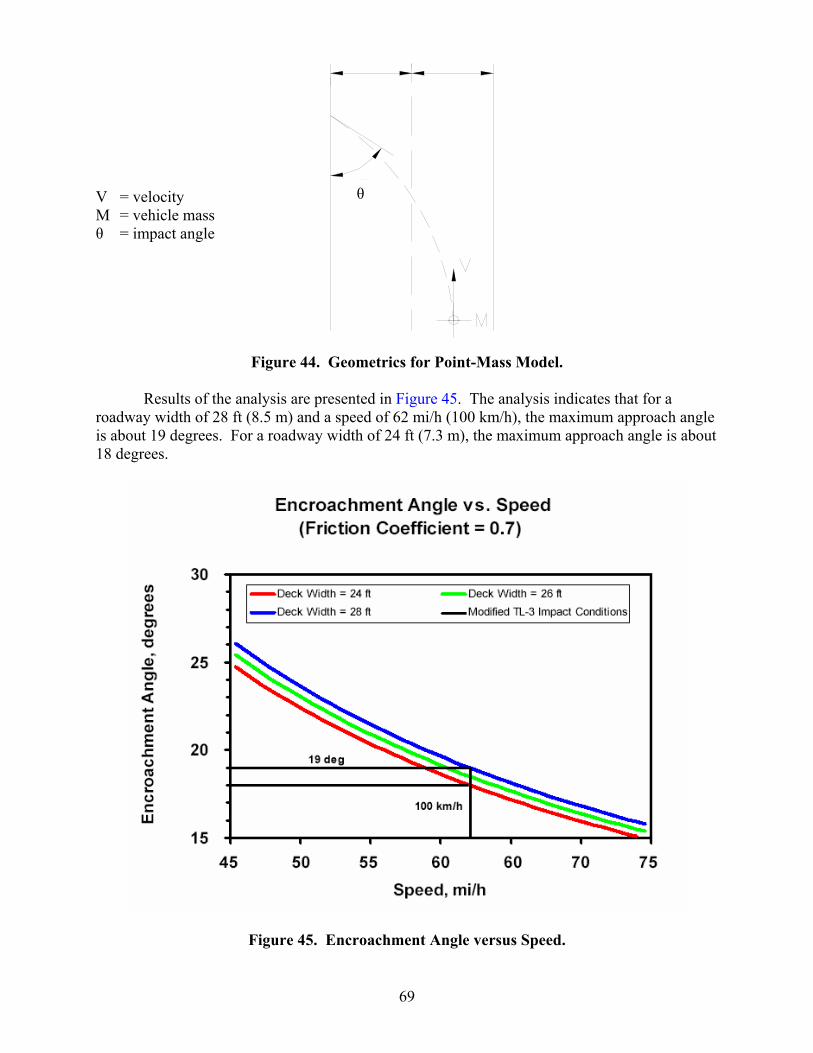
V = velocity M = vehicle mass θ = impact angle
Figure 44. Geo
Results of the analysis are presenroadway width of 28 ft (8.5 m) and a spis about 19 degrees. For a roadway wid18 degrees.
Figure 45. Enc
θ
metrics for Point-Mass Model.
ted in Figure 45. The analysis indicates that for a eed of 62 mi/h (100 km/h), the maximum approach angle th of 24 ft (7.3 m), the maximum approach angle is about
roachment Angle versus Speed.
69

This analysis leads to the conclusion that test conditions (and design loads) of reduced severity would be appropriate for truss bridge rails on structures 28 ft (8.5 m) or less in width. The data indicate that the test conditions of 62 mi/h (100 km/h) and 20 degrees for a 4405-lb (2000 kg) pickup is appropriate. For those test conditions, the transverse force applied to the bridge rail is less than 54 kips (240 kN) and can be quantified as follows. A procedure for computing average lateral (transverse) force imposed on a longitudinal barrier as presented in NCHRP Report 86 is as follows (3).
Figure 46. Mathematical Model of Vehicle-Barrier Railing Collision.
[ ]{ }DBALVG I
lat
+−−=
)θcos(1)θsin(2)θ(sin22
g
)( latlat GWF =
in which:
2
C
t) AL nd to center of mass (ft) VV
g = Acceleration due to gravity (ft/s2) W = Vehicle weight (lb)
L = Vehicle length (ft)B = Vehicle width (ft) G = Center of gravity D = Lateral displacement of barrier railing (ft) ∆S = Movement of the vehicle (f
= Distance from vehicle’s front eE = Vehicle exit velocity (ft/s) I = Vehicle impact velocity (ft/s) θ = Vehicle impact angle (deg)
70

If it is assumed that the magnitude of force versus time has the shape of a sine wave, the maximum force applied to the bridge rail is:
avgmax FF π2
=
The equations above can be combined to yield:
[ ]{ }DBALWVF I
max +−−
=)θcos(1)θsin(4
)θ(sinπ 22
g
.9 ft/s) [100 km/h (27.8 m/s)]
mm = 1.88 m)
D
The maximum force, is com
ign Specifications is n average over 0.050 s and is based on measured forces from full-scale crash tests. If the
approach angle is reduced to 20 degree um force is:
Thus, one could reduce the design load to 42 kips (187 kN).
0 kg) W = 4405 lb (200
(90VI = 62 mi/hθ = 25 degrees A = 0.409
5 in = 17.9 ft (5461 mm = 5.46 m)L = 21B =
= 0 74 in = 7.17 ft (1880
g = 32.2 ft/s2 (9.8 m/s2)
maxF , puted to be:
maxF = 63 kips (280 kN)
The design value of 54 kips (240 kN) in AASHTO LRFD Bridge Desa
s, the computed maxim
maxF = 48.7 kips (217 kN)
63
7.48 (54 kips) = 42 kips (187 kN)
reduced from 25 degrees to 20 degrees for a roadway width of 28 ft (8.5 m) or less. The resulting transverse force imposed on the rail can be reduced from 54 kips (240 kN) to 42 kips (187 kN).
CONCLUSION The relatively narrow roadway widths of some truss bridges located on high-speed highways justify modification of the design crash test conditions and design loads for bridge railsfor those structures. The analysis presented herein shows that the approach angle for TL-3 conditions can be
71

CHAPTER 6. TRAFFIC RAIL FOR NEW TRUSS BRIDGES BACKGROUND
TxDOT plans several new truss bridges throughout the state. Currently, the bridge railing proposed for these structures consists of a standard TxDOT railing, the T101, which is supported by a cast-in-place concrete deck. TxDOT would prefer to have the option to support a bridge rail system from the truss members in lieu of supporting the railing from the concrete deck. The primary advantage of using a truss-supported bridge rail is to allow alternate types of deck. One disadvantage to using a truss-supported bridge rail is that the bridge structure must be adequately designed to resist the crash loads imparted from the bridge rail directly to the truss members. A truss-mounted bridge railing system will provide the bridge designer with more options and greater flexibility in designing steel truss bridges.
The purpose of this task was to develop a truss-mounted bridge railing design that meets
the strength requirements of NCHRP Report 350 TL-3. The railing system should minimize the force imparted to supporting truss members and be acceptable for varying span lengths up to 20 ft (6.1 m) between supporting truss members. Forces imposed on the truss members from the railing system for TL-3 conditions were quantified. DEVELOPMENT OF THE DESIGN
On February 23, 2004, TTI and TxDOT personnel met to discuss and establish requirements and guidelines for the design of a truss-mounted bridge rail for new truss bridges. The typical new truss is assumed to be a Warren-type or Pratt-type pony truss with vertical truss web members at each panel point. The new bridge rail design should meet the requirements of NCHRP Report 350 TL-3 and be supported by vertical truss web members and end posts only. The loading conditions for TL-3 consist of a 54-kip (240 kN) force distributed over 4 ft (1.2 m) along the railing system. For a two-rail bridge rail system, this 54-kip (240 kN) force is divided evenly for each rail element, or 27-kip (120 kN) force distributed over 4 ft (1.2 m) per rail element. The new design should also incorporate the use of crushable blockouts that limit concentrated forces applied to supporting truss members. Magnitude of the reactions applied to the truss members from the crushable blockouts were to be defined and will be used by the bridge designer to design the bridge truss members. The new design should be suitable for attachment to vertical truss members spaced up to 20 ft (6.1 m).
For this project, finite element modeling was performed on several sizes of crushable
pipe blockouts using the computer modeling program LS-DYNA. The blocks were loaded with diametrically opposing plate loads. The crushable pipe blockouts analyzed for this project ranged in size from 6-inch (152 mm) diameter Schedule 40 pipe to 10-inch (254 mm) diameter Schedule 80 pipe. Seven different crushable pipe blockouts were analyzed. Five of the seven blockouts were 6 inches (152 mm) in length and the remaining two were 8 inches (203 mm) in length. A summary of the force versus crush distance for each pipe blockout type is shown in the calculations in Appendix H.
73
Structural analyses of several different rails using the results obtained from the crushable
pipe blockouts were performed using STAAD Pro. TL-3 conditions require that the bridge rail system resist 54 kips (240 kN) of transverse load distributed over a 4-ft (1.2 m) longitudinal distance. For the two-rail system considered, the load was divided equally between the two rail elements, i.e., 27 kips (120 kN) applied to each rail element. Analyses were performed on several different combinations of rail sizes and crushable pipe blockout types using five continuous spans with span lengths ranging from 10 ft to 20 ft (3.0 m to 6.1 m). The crushable pipe blockouts were modeled as multi-linear springs with spring constants, “k” (force/crush), used to approximate the graphs shown on page seven of the calculations in Appendix H. Analyses were performed on each rail/crushable pipe combination with the 27 kips (120 kN) distributed over 4 ft (1.2 m) located at:
• mid-span, • centered over a crushable pipe support (vertical truss member support), and • at the end of the rail element.
A summary of the data obtained from the analyses on the different rail/crushable pipe
blockout combinations is presented in the calculations in Appendix H. SUMMARY OF THE DESIGN
A new bridge rail design was selected based on the results from the analyses. This new
bridge rail design consists of two railing members fabricated from HSS8×8×6 (HSS203×203×152) tubular members. The recommended height of the top and bottom rail members is 30 inches (762 mm) and 16 inches (406 mm), respectively. Researchers recommend 10-inch (254 mm) diameter Schedule 80 (extra strong) A53, grade B pipe blockouts, 6 inches (152 mm) in length be used to support the rail at all vertical truss member locations. Considering the height and geometry of the rail elements, there is a low potential of vehicular interaction with the truss members based on Figures A13.1.1-2 and A13.1.1-3 in Section 13 of the AASHTO LRFD Bridge Design Specifications. Details of the recommended design are shown as Figures 47 and 48. A graph of the force versus crush displacement of the selected 10-inch (254 mm) Schedule 80 pipe blockout is shown as Figure 49.
The new bridge rail design developed from this project meets the strength requirements
of NCHRP Report 350, TL-3. This railing is designed for mounting directly to Pratt-type or Warren-type trusses that have vertical truss members spaced 20 ft (6.1 m) or less and rigidly connected to the transverse floorbeams. A minimum clear space of 3 inches (76 mm) is recommended between the railing and any diagonal truss members that do not support the rail. The railing is designed for installation by bolted connection to vertical members. The railing will meet NCHRP Report 350 TL-3 requirements provided that:
74
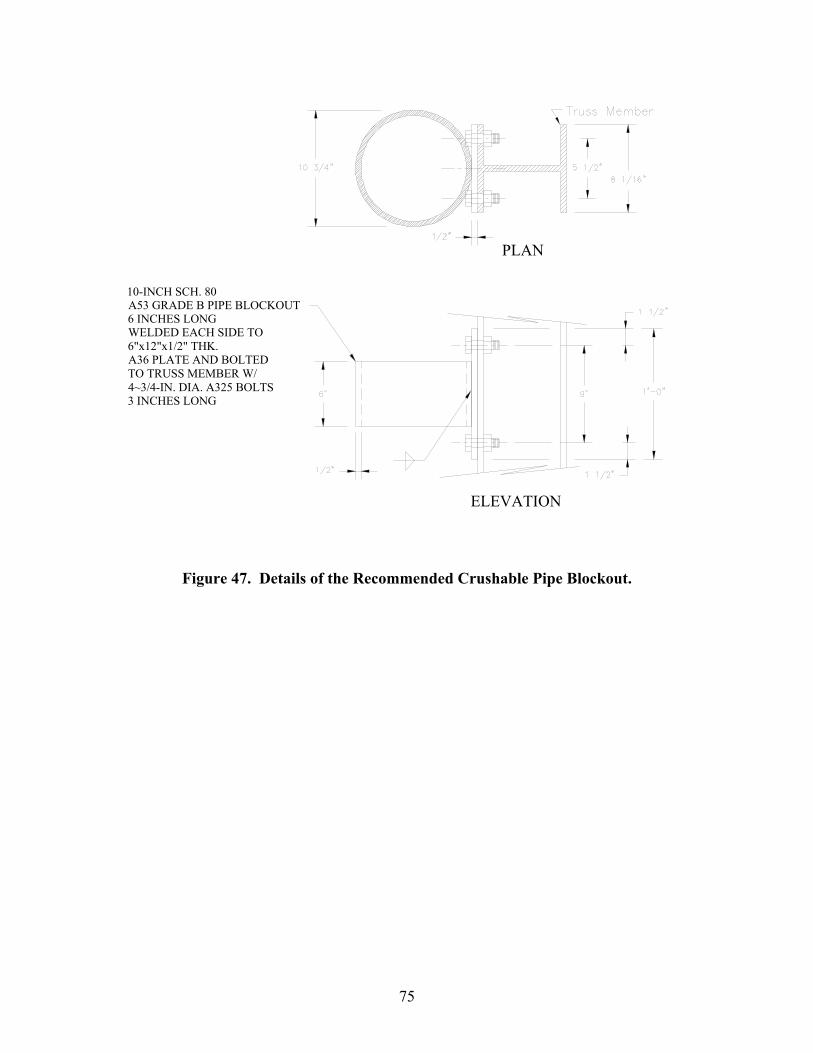
ELEVATION
PLAN
10-INCH SCH. 80 A53 GRADE B PIPE BLOCKOUT6 INCHES LONGWELDED EACH SIDE TO6"x12"x1/2" THK.A36 PLATE AND BOLTEDTO TRUSS MEMBER W/4~3/4-IN. DIA. A325 BOLTS3 INCHES LONG
Figure 47. Details of the Recommended Crushable Pipe Blockout.
75
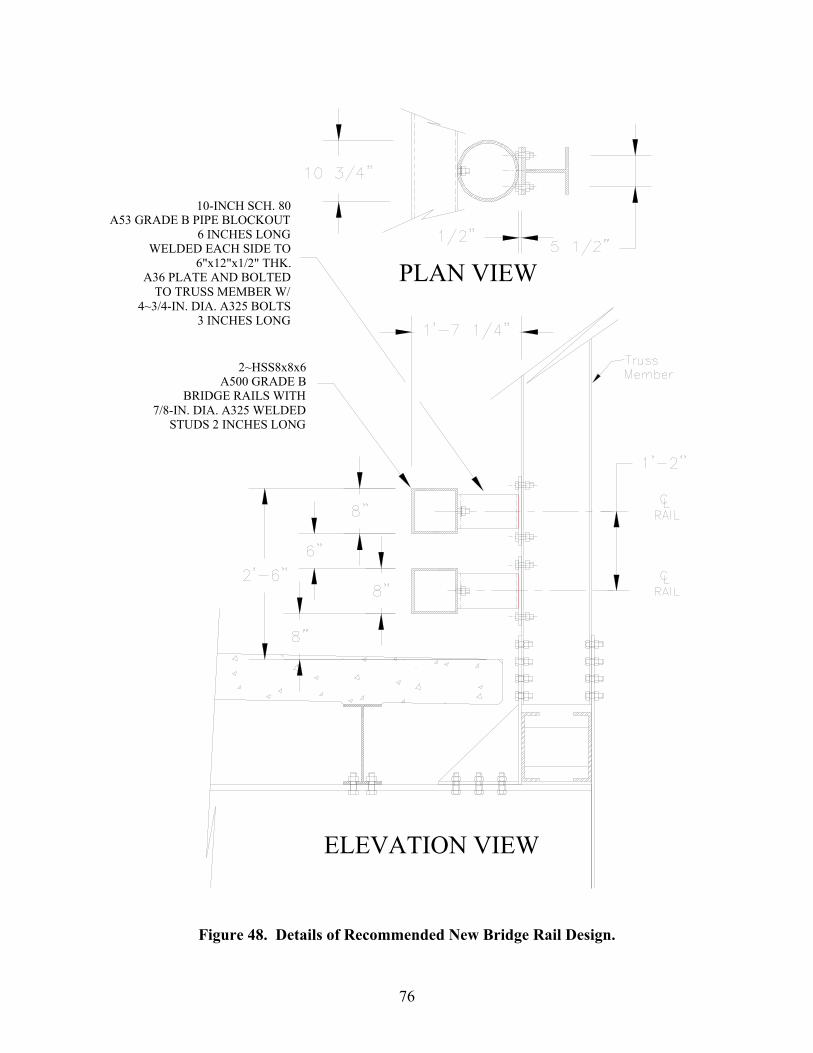
10-INCH SCH. 80 A53 GRADE B PIPE BLOCKOUT
6 INCHES LONGWELDED EACH SIDE TO
6"x12"x1/2" THK.A36 PLATE AND BOLTED
TO TRUSS MEMBER W/4~3/4-IN. DIA. A325 BOLTS
3 INCHES LONG
ELEVATION VIEW
2~HSS8x8x6A500 GRADE B
BRIDGE RAILS WITH7/8-IN. DIA. A325 WELDED
STUDS 2 INCHES LONG
PLAN VIEW
Figure 48. Details of Recommended New Bridge Rail Design.
76
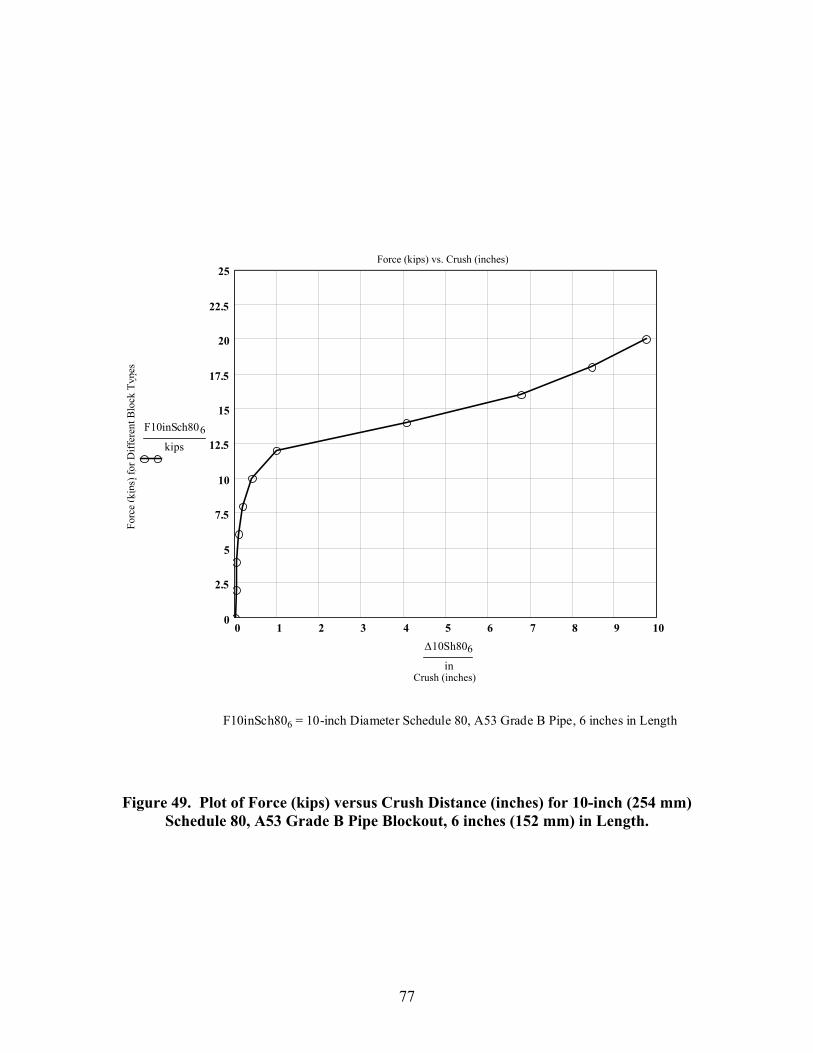
0 1 2 3 4 5 6 7 8 9 100
2.5
5
7.5
10
12.5
15
17.5
20
22.5
25Force (kips) vs. Crush (in.)
Crush, (inches)
Forc
e, (K
ips)
for D
iffer
ent B
lock
Typ
es
F10inSch806kips
∆10Sh806in
F10inSch80 6 = 10-inch Diameter Schedule 80, A53 Grade B Pipe, 6 inches in Length
Crush (inches)
Forc
e (k
ips)
for D
iffer
ent B
lock
Typ
es
Force (kips) vs. Crush (inches)
Figure 49. Plot of Force (kips) versus Crush Distance (inches) for 10-inch (254 mm) Schedule 80, A53 Grade B Pipe Blockout, 6 inches (152 mm) in Length.
77
1. the spacing between vertical members does not exceed 20 ft (6.1 m), and 2. the truss members and all associated components are designed for the theoretical
crash loads transmitted to the truss through the rail plus all dead load including the rail weight.
The following tables provide recommended crash loads to be used in the design of the
bridge structure. Table 1 refers to crash loads applied to intermediate truss members (see Figure 50). Table 2 refers to the situation where crash loads are applied to the end of the bridge railing system connected to the end truss members. These loads are applicable where the bridge railing system does not extend beyond the end of the truss (see Figure 51). The loads presented in these tables should be used to analyze a 3-D model of the truss bridge and connections in conjunction with the dead load of the structure. The bridge designer should consider the application of these loads at the various locations along the truss to produce the highest stress in the truss members. The designer should confirm that the capacities of the members exceed the maximum member force due to the loading. For additional information, please refer to the calculations included in the Appendix H. TxDOT anticipates that most new truss construction will be of the pre-fabricated, fabricator-designed type. Implementation of the new rail system with this type of truss would require that the fabricator/designer could demonstrate that the truss has been designed for the crash rail impact load case.
78
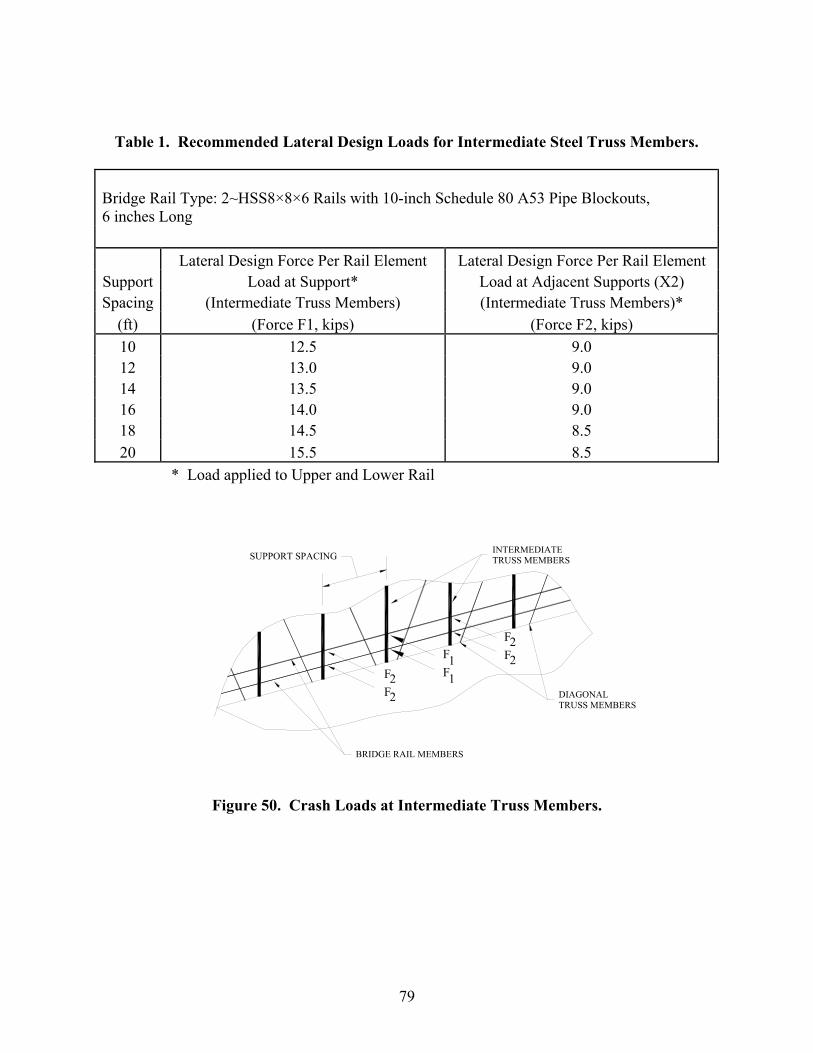
Table 1. Recommended Lateral Design Loads for Intermediate Steel Truss Members. Bridge Rail Type: 2~HSS8×8×6 Rails with 10-inch Schedule 80 A53 Pipe Blockouts, 6 inches Long
Lateral Design Force Per Rail Element Lateral Design Force Per Rail Element Support Load at Support* Load at Adjacent Supports (X2) Spacing (Intermediate Truss Members) (Intermediate Truss Members)*
(ft) (Force F1, kips) (Force F2, kips) 10 12.5 9.0 12 13.0 9.0 14 13.5 9.0 16 14.0 9.0 18 14.5 8.5 20 15.5 8.5
* Load applied to Upper and Lower Rail
Figure 50. Crash Loads at Intermediate Truss Members.
F2
BRIDGE RAIL MEMBERS
2F
F22F
1
F1F
INTERMEDIATE TRUSS MEMBERS
DIAGONAL TRUSS MEMBERS
SUPPORT SPACING
79
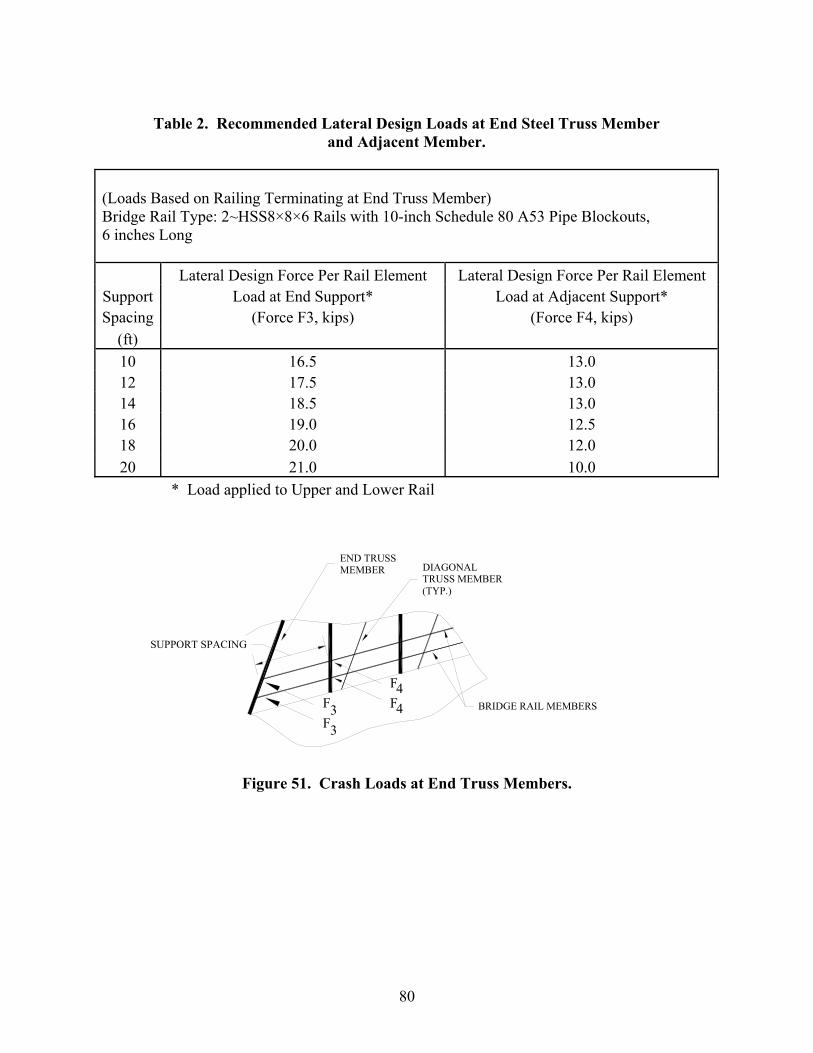
Table 2. Recommended Lateral Design Loads at End Steel Truss Member
and Adjacent Member. (Loads Based on Railing Terminating at End Truss Member) Bridge Rail Type: 2~HSS8×8×6 Rails with 10-inch Schedule 80 A53 Pipe Blockouts, 6 inches Long
Lateral Design Force Per Rail Element Lateral Design Force Per Rail Element Support Load at End Support* Load at Adjacent Support* Spacing (Force F3, kips) (Force F4, kips)
(ft) 10 16.5 13.0 12 17.5 13.0 14 18.5 13.0 16 19.0 12.5 18 20.0 12.0 20 21.0 10.0
* Load applied to Upper and Lower Rail
Figure 51. Crash Loads at End Truss Members.
BRIDGE RAIL MEMBERS
SUPPORT SPACING
END TRUSS MEMBER DIAGONAL
TRUSS MEMBER(TYP.)
44
FF
F33F
80
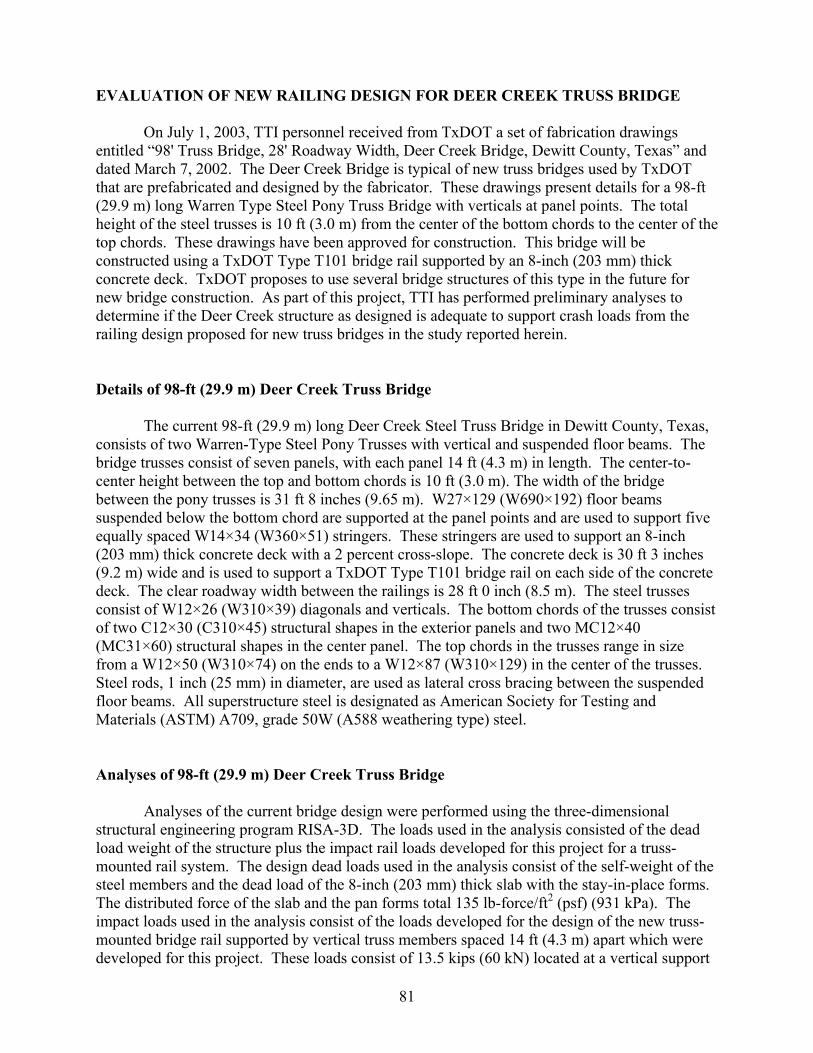
EVALUATION OF NEW RAILING DESIGN FOR DEER CREEK TRUSS BRIDGE
On July 1, 2003, TTI personnel received from TxDOT a set of fabrication drawings entitled “98' Truss Bridge, 28' Roadway Width, Deer Creek Bridge, Dewitt County, Texas” and dated March 7, 2002. The Deer Creek Bridge is typical of new truss bridges used by TxDOT that are prefabricated and designed by the fabricator. These drawings present details for a 98-ft (29.9 m) long Warren Type Steel Pony Truss Bridge with verticals at panel points. The total height of the steel trusses is 10 ft (3.0 m) from the center of the bottom chords to the center of the top chords. These drawings have been approved for construction. This bridge will be constructed using a TxDOT Type T101 bridge rail supported by an 8-inch (203 mm) thick concrete deck. TxDOT proposes to use several bridge structures of this type in the future for new bridge construction. As part of this project, TTI has performed preliminary analyses to determine if the Deer Creek structure as designed is adequate to support crash loads from the railing design proposed for new truss bridges in the study reported herein.
Details of 98-ft (29.9 m) Deer Creek Truss Bridge The current 98-ft (29.9 m) long Deer Creek Steel Truss Bridge in Dewitt County, Texas, consists of two Warren-Type Steel Pony Trusses with vertical and suspended floor beams. The bridge trusses consist of seven panels, with each panel 14 ft (4.3 m) in length. The center-to-center height between the top and bottom chords is 10 ft (3.0 m). The width of the bridge between the pony trusses is 31 ft 8 inches (9.65 m). W27×129 (W690×192) floor beams suspended below the bottom chord are supported at the panel points and are used to support five equally spaced W14×34 (W360×51) stringers. These stringers are used to support an 8-inch (203 mm) thick concrete deck with a 2 percent cross-slope. The concrete deck is 30 ft 3 inches (9.2 m) wide and is used to support a TxDOT Type T101 bridge rail on each side of the concrete deck. The clear roadway width between the railings is 28 ft 0 inch (8.5 m). The steel trusses consist of W12×26 (W310×39) diagonals and verticals. The bottom chords of the trusses consist of two C12×30 (C310×45) structural shapes in the exterior panels and two MC12×40 (MC31×60) structural shapes in the center panel. The top chords in the trusses range in size from a W12×50 (W310×74) on the ends to a W12×87 (W310×129) in the center of the trusses. Steel rods, 1 inch (25 mm) in diameter, are used as lateral cross bracing between the suspended floor beams. All superstructure steel is designated as American Society for Testing and Materials (ASTM) A709, grade 50W (A588 weathering type) steel. Analyses of 98-ft (29.9 m) Deer Creek Truss Bridge
Analyses of the current bridge design were performed using the three-dimensional structural engineering program RISA-3D. The loads used in the analysis consisted of the dead load weight of the structure plus the impact rail loads developed for this project for a truss-mounted rail system. The design dead loads used in the analysis consist of the self-weight of the steel members and the dead load of the 8-inch (203 mm) thick slab with the stay-in-place forms. The distributed force of the slab and the pan forms total 135 lb-force/ft2 (psf) (931 kPa). The impact loads used in the analysis consist of the loads developed for the design of the new truss-mounted bridge rail supported by vertical truss members spaced 14 ft (4.3 m) apart which were developed for this project. These loads consist of 13.5 kips (60 kN) located at a vertical support
81
with 9.0 kips (40 kN) on the adjacent vertical truss members per rail element. A brief sketch of the imposed crash loads from the new truss-mounted rail is shown in Figure 52.
14 ft14 ft
14 ft14 ft
Figure 52. Superimposed Crash Loads from New Truss-Mounted Bridge Rail for Deer Creek Bridge Analysis.
The bridge railing members used in the analysis consist of two HSS8×8×6
(HSS203×203×152) tubes similar to the design shown in Figure 48. The bridge rails were connected to the vertical truss members and extended beyond the exterior members and connected to a simple pin-type connection beyond the exterior members to simulate the connection to a concrete parapet. The height of the bridge rail above the pavement surface was approximately 30 inches (762 mm).
Based on the results from the analysis of the existing Deer Creek Bridge with the proposed rail loads shown in Figure 50, several design modifications are required. The primary modifications required for the structure are increased moment resisting connections between the floor beams and the vertical truss members to resist the lateral crash loads. Moment resisting connections are also required at the exterior truss members (chords). If adequate moment resisting connections are provided at exterior chord members and at all connections between vertical truss members and bottom floor beams, some resizing of the truss members will be required to meet the strength requirements of AASHTO’s LRFD Bridge Design Specifications. In addition, other changes will likely be required, such as resizing of gusset plates in the top chord member connections to adequately resist the crash loads. The modifications presented in this report pertain to the 98-ft (29.9 m) Deer Creek Bridge structure and may or may not apply to other bridge structures similar in type, length, size, and geometry.
82
CHAPTER 7. SUMMARY OF FINDINGS LLANO TRUSS BRIDGE RAIL A retrofit bridge railing was designed for the Llano Truss Bridge. The design reuses the existing C12×20.7 (C310×31) rail element and provides a TS8×4×1/2 (TS203×103×13) backup rail element to distribute longitudinal load. Short lengths of 5-inch (127 mm) and 6-inch (152 mm) diameter schedule 40 pipe form crushable blockouts to limit forces imposed on the truss members. A prototype of this railing was constructed and subjected to a full-scale crash test for TL-2 conditions.
The Llano Truss Bridge Rail contained and redirected the 2000P pickup truck. The 2000P pickup truck did not penetrate, underride, or override the installation. Maximum dynamic deflection during the test was 1.8 inches (47 mm). No detached elements, fragments, or other debris was present to penetrate or to show potential for penetrating the occupant compartment or to present undue hazard to others in the area. Maximum occupant compartment deformation was 0.4 inch (10 mm) in the kick panel area near the passenger’s feet, laterally across the cab. The vehicle remained upright during and after the collision event. The vehicle came to rest upright 172.6 ft (52.6 m) downstream of impact and 6.2 ft (1.9 m) forward of the traffic face of the rail. Longitudinal occupant impact velocity was 13.8 ft/s (4.2 m/s) and longitudinal ridedown acceleration was -7.0 g’s. Exit angle at loss of contact was 5.0 degrees, which was 20 percent of the impact angle. The prototype for the retrofit of the Llano Truss Bridge performed acceptably according to the criteria specified for NCHRP Report 350 Test 2-11, as shown in Table 3. U.S. 281 TRUSS BRIDGE RAIL A retrofit bridge railing was designed for the U.S. 281/Brazos River Bridge. The existing railing consists of a C12×20.7 (C310×31) mounted on truss members and intermediate posts. The channel rail element was reused and a W6×20 (W150×30) rail element backed up and stiffened the channel. New posts were designed to mount on the concrete safety walk. This design distributes loads through the concrete deck rather than applying them directly to the truss members. A prototype of the railing was constructed and subjected to a full-scale crash test for TL-3 conditions.
The U.S. 281Truss Bridge Rail contained and redirected the 2000P pickup truck. The 2000P pickup truck did not penetrate, underride, or override the installation. Maximum dynamic deflection during the test was 3.6 inches (91 mm). No detached elements, fragments, or other debris was present to penetrate or to show potential for penetrating the occupant compartment or to present undue hazard to others in the area. Maximum occupant compartment deformation was 1.6 inches (42 mm) in the kick panel area near the passenger’s feet, laterally across the cab. The vehicle remained upright during and after the collision event. The vehicle came to rest upright 225.2 ft (68.6 m) downstream of impact and 50.0 ft (15.2 m) forward of the traffic face
83

84
of the rail. Longitudinal occupant impact velocity was 17.4 ft/s (5.3 m/s) and longitudinal ridedown acceleration was -8.7 g’s. Exit angle at loss of contact was 9.7 degrees, which was 38 percent of the impact angle. The prototype for the retrofit of the U.S. 281 Truss Bridge performed acceptably according to the criteria specified for NCHRP Report 350 Test 3-11, as shown in Table 4. DESIGN EXCEPTIONS The relatively narrow roadway widths of some existing historic truss bridges located on high-speed highways justify modification of the design crash test conditions and design loads for bridge rails for those structures. The analysis presented herein shows that the approach angle for TL-3 conditions can be reduced from 25 degrees to 20 degrees for a roadway width of 28 ft (8.5 m) or less. The resulting transverse force imposed on the rail can be reduced from 54 kips (240 kN) to 42 kips (187 kN). TRAFFIC RAIL FOR NEW TRUSS BRIDGES A new railing design for TL-3 was developed and is proposed for use on new truss bridges. It provides two tubular steel rail elements mounted on crushable blockouts made from 10-inch (254 mm) diameter schedule 80 pipe. Total height of the railing above the top of the deck is 2 ft 6 inches (0.8 m), and the traffic face presents suitable geometry. The railing is adequate for spans up to 20 ft (6.1 m) between supporting truss members. The crushable blockouts limit the lateral force applied to truss members to 15 kips (67 kN) or less, if the blockout is not crushed more than 5-1/2 inches (140 mm). Since TxDOT anticipates that most new truss construction will be of the pre-fabricated, fabricator-designed type, implementation of the new rail system would require that the fabricator/designer demonstrate that the truss has been designed for the rail crash loading.
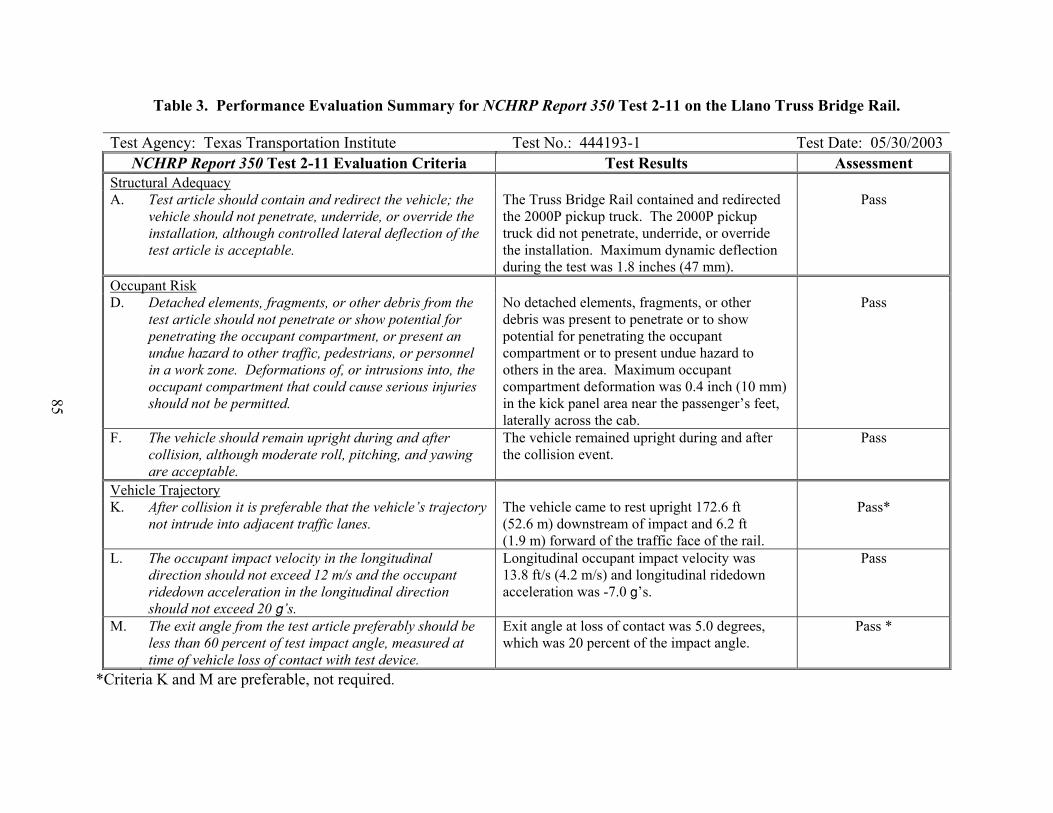
Table 3. Performance Evaluation Summary for NCHRP Report 350 Test 2-11 on the Llano Truss Bridge Rail.
Test Agency: Texas Transportation Institute Test No.: 444193-1 Test Date: 05/30/2003NCHRP Report 350 Test 2-11 Evaluation Criteria Test Results Assessment
Structural Adequacy A. Test article should contain and redirect the vehicle; the
vehicle should not penetrate, underride, or override the installation, although controlled lateral deflection of the test article is acceptable.
The Truss Bridge Rail contained and redirected the 2000P pickup truck. The 2000P pickup truck did not penetrate, underride, or override the installation. Maximum dynamic deflection during the test was 1.8 inches (47 mm).
Pass
Occupant Risk D. Detached elements, fragments, or other debris from the
test article should not penetrate or show potential for penetrating the occupant compartment, or present an undue hazard to other traffic, pedestrians, or personnel in a work zone. Deformations of, or intrusions into, the occupant compartment that could cause serious injuries should not be permitted.
No detached elements, fragments, or other debris was present to penetrate or to show potential for penetrating the occupant compartment or to present undue hazard to others in the area. Maximum occupant compartment deformation was 0.4 inch (10 mm) in the kick panel area near the passenger’s feet, laterally across the cab.
Pass
F. The vehicle should remain upright during and after collision, although moderate roll, pitching, and yawing are acceptable.
The vehicle remained upright during and after the collision event.
Pass
Vehicle Trajectory
85
K. After collision it is preferable that the vehicle’s trajectory
not intrude into adjacent traffic lanes. The vehicle came to rest upright 172.6 ft (52.6 m) downstream of impact and 6.2 ft (1.9 m) forward of the traffic face of the rail.
Pass*
L. The occupant impact velocity in the longitudinal direction should not exceed 12 m/s and the occupant ridedown acceleration in the longitudinal direction should not exceed 20 g’s.
Longitudinal occupant impact velocity was 13.8 ft/s (4.2 m/s) and longitudinal ridedown acceleration was -7.0 g’s.
Pass
M. The exit angle from the test article preferably should be less than 60 percent of test impact angle, measured at time of vehicle loss of contact with test device.
Exit angle at loss of contact was 5.0 degrees, which was 20 percent of the impact angle.
Pass *
*Criteria K and M are preferable, not required.

Table 4. Performance Evaluation Summary for NCHRP Report 350 Test 3-11 on the U.S. 281 Truss Bridge Rail.
Test Agency: Texas Transportation Institute Test No.: 444193-2 Test Date: 07/30/2003NCHRP Report 350 Test 3-11 Evaluation Criteria Test Results Assessment
Structural Adequacy A. Test article should contain and redirect the vehicle; the
vehicle should not penetrate, underride, or override the installation, although controlled lateral deflection of the test article is acceptable.
The Truss Bridge Rail contained and redirected the 2000P pickup truck. The 2000P pickup truck did not penetrate, underride, or override the installation. Maximum dynamic deflection during the test was 3.6 inches (91 mm).
Pass
Occupant Risk D. Detached elements, fragments, or other debris from the
test article should not penetrate or show potential for penetrating the occupant compartment, or present an undue hazard to other traffic, pedestrians, or personnel in a work zone. Deformations of, or intrusions into, the occupant compartment that could cause serious injuries should not be permitted.
No detached elements, fragments, or other debris was present to penetrate or to show potential for penetrating the occupant compartment or to present undue hazard to others in the area. Maximum occupant compartment deformation was 1.6 inches (42 mm) in the kick panel area near the passenger’s feet, laterally across the cab.
Pass
F. The vehicle should remain upright during and after collision, although moderate roll, pitching, and yawing are acceptable.
The vehicle remained upright during and after the collision event.
Pass
Vehicle Trajectory K. After collision it is preferable that the vehicle’s trajectory
not intrude into adjacent traffic lanes. The vehicle came to rest upright 225.2 ft (68.6 ) downstream of impact and 50.0 ft (15.2 m) forward of the traffic face of the rail.
Fail*
L. The occupant impact velocity in the longitudinal direction should not exceed 12 m/s and the occupant ridedown acceleration in the longitudinal direction should not exceed 20 g’s.
Longitudinal occupant impact velocity was 17.4 ft/s (5.3 m/s) and longitudinal ridedown acceleration was -8.7 g’s.
Pass
M. The exit angle from the test article preferably should be less than 60 percent of test impact angle, measured at time of vehicle loss of contact with test device.
Exit angle at loss of contact was 9.7 degrees, which was 38 percent of the impact angle.
Pass *
86
*Criteria K and M are preferable, not required.
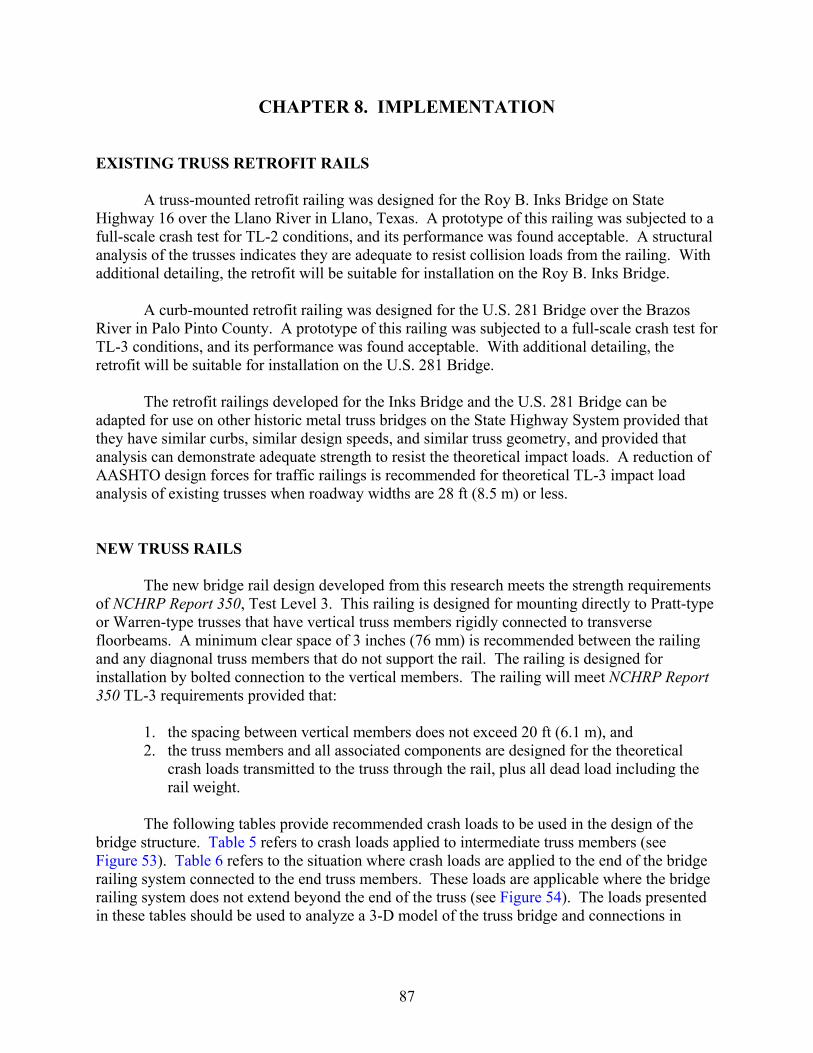
CHAPTER 8. IMPLEMENTATION EXISTING TRUSS RETROFIT RAILS A truss-mounted retrofit railing was designed for the Roy B. Inks Bridge on State Highway 16 over the Llano River in Llano, Texas. A prototype of this railing was subjected to a full-scale crash test for TL-2 conditions, and its performance was found acceptable. A structural analysis of the trusses indicates they are adequate to resist collision loads from the railing. With additional detailing, the retrofit will be suitable for installation on the Roy B. Inks Bridge. A curb-mounted retrofit railing was designed for the U.S. 281 Bridge over the Brazos River in Palo Pinto County. A prototype of this railing was subjected to a full-scale crash test for TL-3 conditions, and its performance was found acceptable. With additional detailing, the retrofit will be suitable for installation on the U.S. 281 Bridge. The retrofit railings developed for the Inks Bridge and the U.S. 281 Bridge can be adapted for use on other historic metal truss bridges on the State Highway System provided that they have similar curbs, similar design speeds, and similar truss geometry, and provided that analysis can demonstrate adequate strength to resist the theoretical impact loads. A reduction of AASHTO design forces for traffic railings is recommended for theoretical TL-3 impact load analysis of existing trusses when roadway widths are 28 ft (8.5 m) or less. NEW TRUSS RAILS
The new bridge rail design developed from this research meets the strength requirements of NCHRP Report 350, Test Level 3. This railing is designed for mounting directly to Pratt-type or Warren-type trusses that have vertical truss members rigidly connected to transverse floorbeams. A minimum clear space of 3 inches (76 mm) is recommended between the railing and any diagnonal truss members that do not support the rail. The railing is designed for installation by bolted connection to the vertical members. The railing will meet NCHRP Report 350 TL-3 requirements provided that:
1. the spacing between vertical members does not exceed 20 ft (6.1 m), and 2. the truss members and all associated components are designed for the theoretical
crash loads transmitted to the truss through the rail, plus all dead load including the rail weight.
The following tables provide recommended crash loads to be used in the design of the
bridge structure. Table 5 refers to crash loads applied to intermediate truss members (see Figure 53). Table 6 refers to the situation where crash loads are applied to the end of the bridge railing system connected to the end truss members. These loads are applicable where the bridge railing system does not extend beyond the end of the truss (see Figure 54). The loads presented in these tables should be used to analyze a 3-D model of the truss bridge and connections in
87
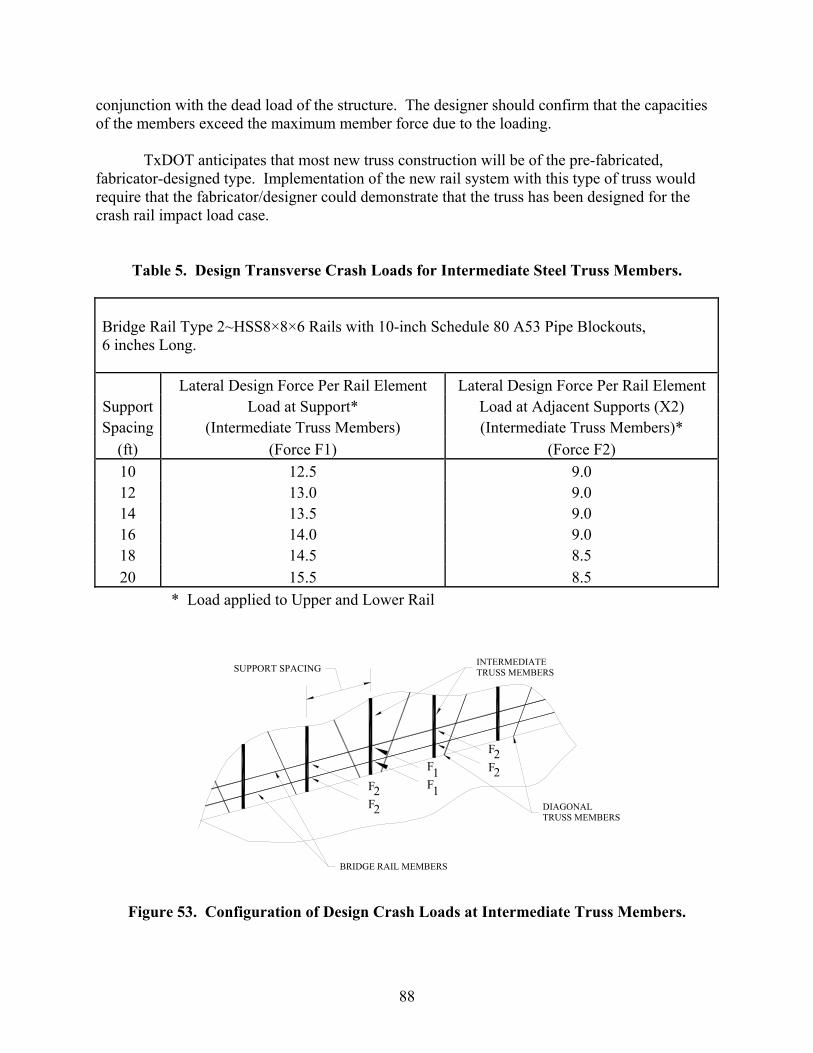
conjunction with the dead load of the structure. The designer should confirm that the capacities of the members exceed the maximum member force due to the loading.
TxDOT anticipates that most new truss construction will be of the pre-fabricated, fabricator-designed type. Implementation of the new rail system with this type of truss would require that the fabricator/designer could demonstrate that the truss has been designed for the crash rail impact load case.
Table 5. Design Transverse Crash Loads for Intermediate Steel Truss Members.
Bridge Rail Type 2~HSS8×8×6 Rails with 10-inch Schedule 80 A53 Pipe Blockouts, 6 inches Long.
Lateral Design Force Per Rail Element Lateral Design Force Per Rail Element Support Load at Support* Load at Adjacent Supports (X2) Spacing (Intermediate Truss Members) (Intermediate Truss Members)*
(ft) (Force F1) (Force F2) 10 12.5 9.0 12 13.0 9.0 14 13.5 9.0 16 14.0 9.0 18 14.5 8.5 20 15.5 8.5
* Load applied to Upper and Lower Rail
Figure 53. Configuration of Design Crash Loads at Intermediate Truss Members.
F2
BRIDGE RAIL MEMBERS
2F
F22F
1
F1F
INTERMEDIATE TRUSS MEMBERS
DIAGONAL TRUSS MEMBERS
SUPPORT SPACING
88
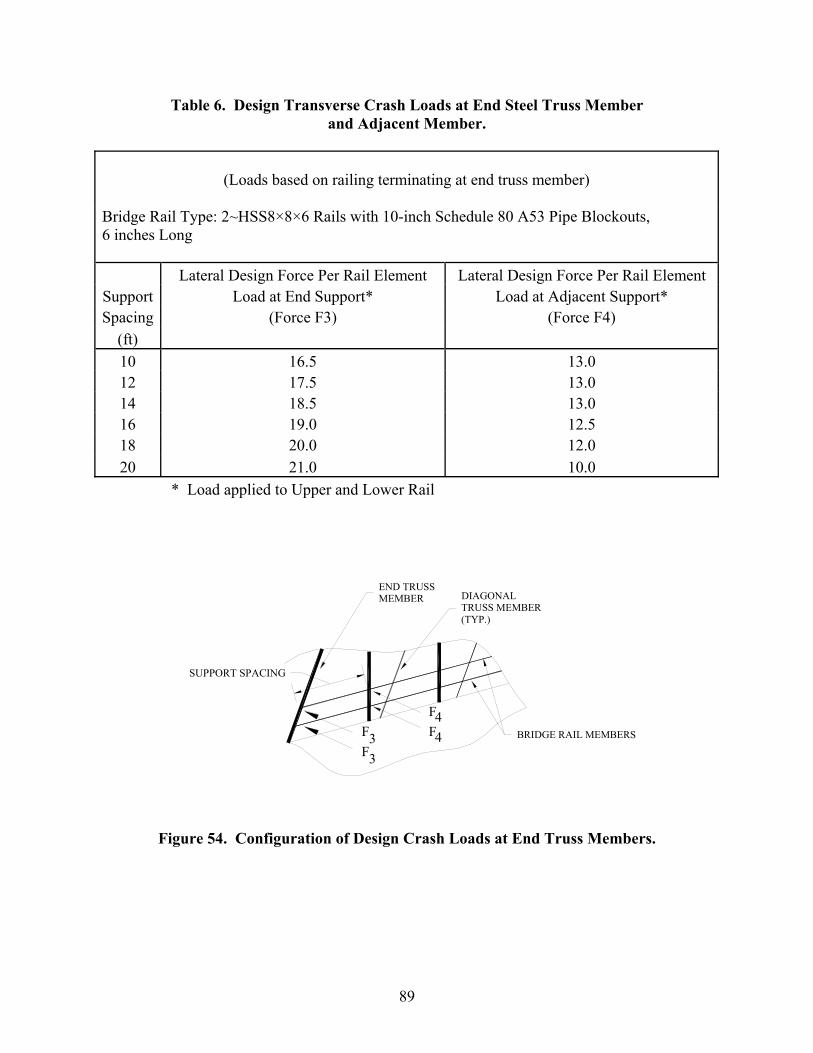
Table 6. Design Transverse Crash Loads at End Steel Truss Member and Adjacent Member.
(Loads based on railing terminating at end truss member)
Bridge Rail Type: 2~HSS8×8×6 Rails with 10-inch Schedule 80 A53 Pipe Blockouts, 6 inches Long
Lateral Design Force Per Rail Element Lateral Design Force Per Rail Element Support Load at End Support* Load at Adjacent Support* Spacing (Force F3) (Force F4)
(ft) 10 16.5 13.0 12 17.5 13.0 14 18.5 13.0 16 19.0 12.5 18 20.0 12.0 20 21.0 10.0
* Load applied to Upper and Lower Rail
Figure 54. Configuration of Design Crash Loads at End Truss Members.
BRIDGE RAIL MEMBERS
SUPPORT SPACING
END TRUSS MEMBER DIAGONAL
TRUSS MEMBER(TYP.)
44
FF
F33F
89

MM
REFERENCES 1. H.E. Ross, Jr., D.L. Sicking, R.A. Zimmer, and J.D. Michie, Recommended Procedures
for the Safety Performance Evaluation of Highway Features, National Cooperative Highway Research Program Report 350, Transportation Research Board, National Research Council, Washington, D.C., 1993.
2. 2000 Interim AASHTO LRFD Bridge Design Specifications, Customary U.S. Units,
Second Edition, American Association of State Highway and Transportation Officials, Washington, D.C., 1998.
3. R.M. Olson, E.R. Post, and W.F. McFarland, Tentative Service Requirements for Bridge
Rail Systems, National Cooperative Highway Research Program Report 86, Transportation Research Board, National Research Council, Washington, D.C., 1970.
91

MM
APPENDIX A. CRASH TEST PROCEDURES AND DATA ANALYSIS The crash test and data analysis procedures were performed in accordance with guidelines presented in NCHRP Report 350. Brief descriptions of these procedures are presented below. ELECTRONIC INSTRUMENTATION AND DATA PROCESSING The test vehicle was instrumented with three solid-state angular rate transducers to measure roll, pitch, and yaw rates; a triaxial accelerometer near the vehicle center of gravity to measure longitudinal, lateral, and vertical acceleration levels; and a backup biaxial accelerometer in the rear of the vehicle to measure longitudinal and lateral acceleration levels. These accelerometers were Endevco Model 2262CA piezoresistive accelerometers with a ±100 g range. The accelerometers are strain gage type with a linear millivolt output proportional to acceleration. Angular rate transducers are solid-state gas flow units designed for high-“g” service. Signal conditioners and amplifiers in the test vehicle increase the low-level signals to a ±2.5 volt maximum level. The signal conditioners also provide the capability of an R-cal or shunt calibration for the accelerometers and a precision voltage calibration for the rate transducers. The electronic signals from the accelerometers and rate transducers are transmitted to a base station by a 15-channel, constant bandwidth, Inter-Range Instrumentation Group (IRIG) FM/FM telemetry link for recording on magnetic tape and display on a real-time strip chart. Calibration signals from the test vehicle are recorded before the test and immediately afterward. A crystal-controlled time reference signal is recorded simultaneously with the data. Wooden dowels actuate pressure-sensitive switches on the bumper of the impacting vehicle prior to impact to indicate the elapsed time over a known distance and provide a measurement of impact velocity. The initial contact also produces an “event” mark on the data record to establish the instant of contact with the installation. The multiplex of data channels, transmitted on one radio frequency, is received and demultiplexed onto separate tracks of a 28-track IRIG tape recorder. After the test, the data are played back from the tape machine and digitized. A proprietary software program (WinDigit) converts the analog data from each transducer into engineering units using the R-cal and pre-zero values at 10,000 samples per second per channel. WinDigit also provides Society of Automotive Engineers (SAE) J211 class 180 phaseless digital filtering and vehicle impact velocity. All accelerometers are calibrated annually according to SAE J211 4.6.1 with an Endevco 2901 precision primary vibration standard. This device and its support instruments are returned to the factory annually for a National Institute of Standards Technology (NIST) traceable calibration. The subsystems of each data channel are also evaluated annually, using instruments with current NIST traceability, and the results are factored into the accuracy of the total data channel, per SAE J211. Calibrations and evaluations are repeated any time data are suspect. The Test Risk Assessment Program (TRAP) uses the data from WinDigit to compute occupant/compartment impact velocities, time of occupant/compartment impact after vehicle
93
impact, and the highest 10-ms average ridedown acceleration. WinDigit calculates change in vehicle velocity at the end of a given impulse period. In addition, it computes maximum average accelerations over 50-ms intervals in each of the three directions. For reporting purposes, the data from the vehicle-mounted accelerometers are filtered with a 60-Hz digital filter, and acceleration versus time curves for the longitudinal, lateral, and vertical directions are plotted using TRAP. TRAP uses the data from the yaw, pitch, and roll rate transducers to compute angular displacement in degrees at 0.0001-s intervals and then plots yaw, pitch, and roll versus time. These displacements are in reference to the vehicle-fixed coordinate system with the initial position and orientation of the vehicle-fixed coordinate systems being initial impact. ANTHROPOMORPHIC DUMMY INSTRUMENTATION Use of a dummy in the 2000P vehicle is optional according to NCHRP Report 350, and there was no dummy used in the test. PHOTOGRAPHIC INSTRUMENTATION AND DATA PROCESSING Photographic coverage of the test included three high-speed cameras: one overhead with a field of view perpendicular to the ground and directly over the impact point, one placed behind the installation at an angle, and a third placed to have a field of view parallel to and aligned with the installation at the downstream end. A flashbulb activated by pressure-sensitive tape switches was positioned on the impacting vehicle to indicate the instant of contact with the installation and was visible from each camera. The films from these high-speed cameras were analyzed to observe phenomena occurring during the collision and to obtain time-event, displacement, and angular data. A BetaCam, a VHS-format video camera and recorder, and still cameras recorded and documented conditions of the test vehicle and installation before and after the test. TEST VEHICLE PROPULSION AND GUIDANCE The test vehicle was towed into the test installation using a steel cable guidance and reverse tow system. A steel cable for guiding the test vehicle was tensioned along the path, anchored at each end, and threaded through an attachment to the front wheel of the test vehicle. An additional steel cable was connected to the test vehicle, passed around a pulley near the impact point, through a pulley on the tow vehicle, and then anchored to the ground such that the tow vehicle moved away from the test site. A 2:1 speed ratio between the test and tow vehicle existed with this system. Just prior to impact with the installation, the test vehicle was released to be freewheeling and unrestrained. The vehicle remained freewheeling (i.e., no steering or braking inputs) until the vehicle cleared the immediate area of the test site, at which time brakes on the vehicle were activated to bring it to a safe and controlled stop.
94
APPENDIX B. DESIGN OF RETROFIT RAIL FOR ROY B. INKS BRIDGE OVER LLANO RIVER, LLANO, TEXAS
The calculations contained in this appendix pertain to the design of a retrofit bridge rail for the Roy B. Inks Bridge over the Llano River in Llano, Texas. Analyses performed on the existing design revealed that it did not meet the current Test Level 2 strength requirements as specified in AASHTO LRFD Bridge Design Specifications. The existing design utilized a single steel rail fabricated from C12×20.7 (C310×31) channel attached to all bridge truss members with riveted clip angles. The clip angles attach to the flanges of the channel and connect to the truss members. Intermediate posts between the truss members support the rail. For this project, the researchers considered several different options to strengthen the existing design to meet the current strength requirements. Adding a structural tube behind the channel rail and reducing the height of the rail was selected as the best option by the researchers and TxDOT personnel.
The retrofit rail design consists of blocking out the existing C12×20.7 (C310×31) rail
approximately 6 inches (152 mm) from its current location and lowering the rail height from 37 inches (940 mm) to 32 inches (813 mm) above the pavement surface. To maintain the clear roadway width of 24 ft (7.3 m), the researchers selected a TS8×4×1/2 (TS203×102×12.7) steel tube located behind the channel. Several different blockout types were considered at the post locations. Steel blockouts fabricated from W8×18 (W200×27) shape were selected for the intermediate post locations. These blockouts serve to move the rail near the face of the curb. Blockouts are also required where the rail attaches to the truss members. The researchers considered several different blockout types for use at the truss members. Considering the geometry of all the different truss members, 5-inch (127 mm) diameter and 6-inch (152 mm) diameter steel pipe blockouts were selected and analyzed for this project. These blockouts serve to support the rail at the truss member locations as well as limit the crash loads imparted to the truss members due to the crush characteristics of the pipe. Strength analyses were performed on the retrofit rail, and the results of these analyses indicate that it satisfies the strength requirements specified in AASHTO LRFD Design Specifications for TL-2. Analyses of the crush characteristics of the pipe blockouts were performed separately. The calculations considering the performance of these pipe blockouts and the strength of the truss members are presented in Appendix C of this report.
95

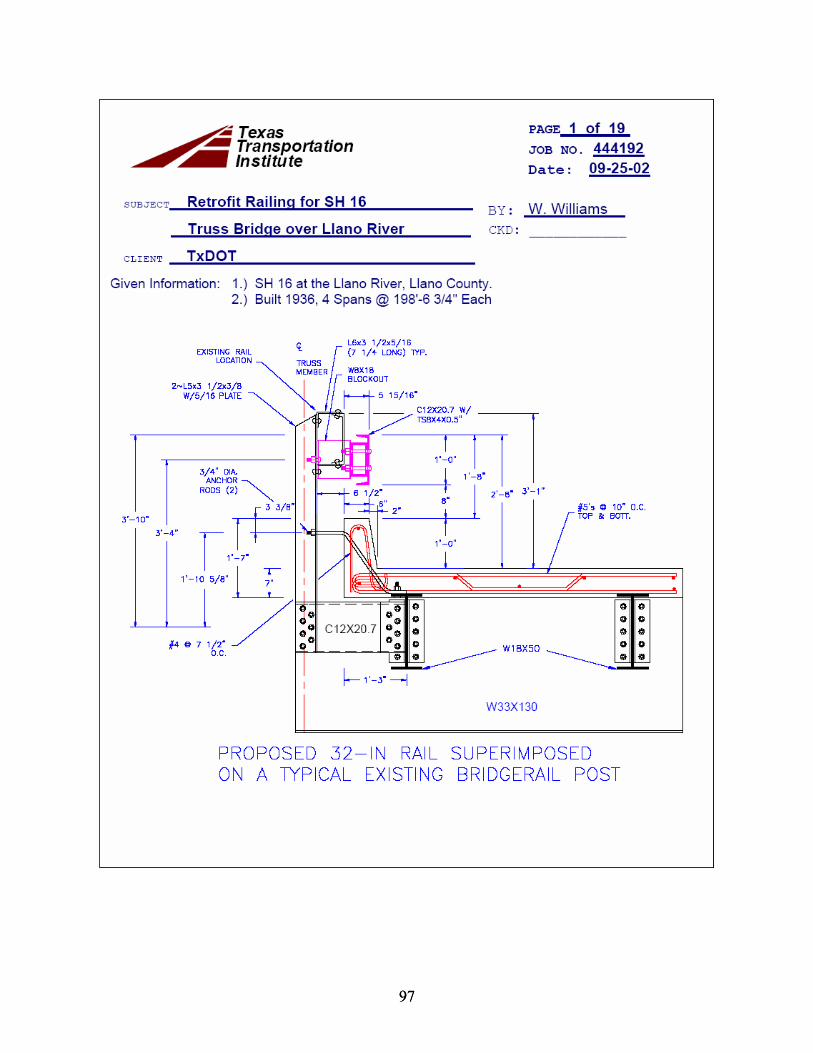
97 97
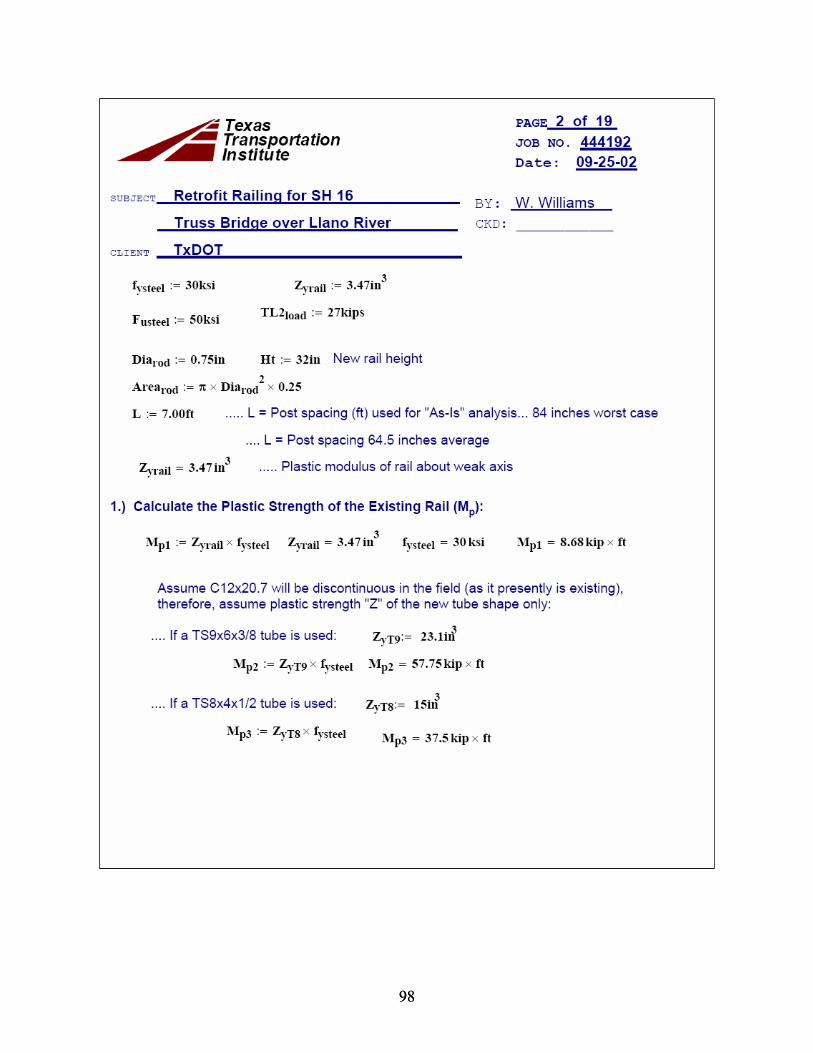
98 98
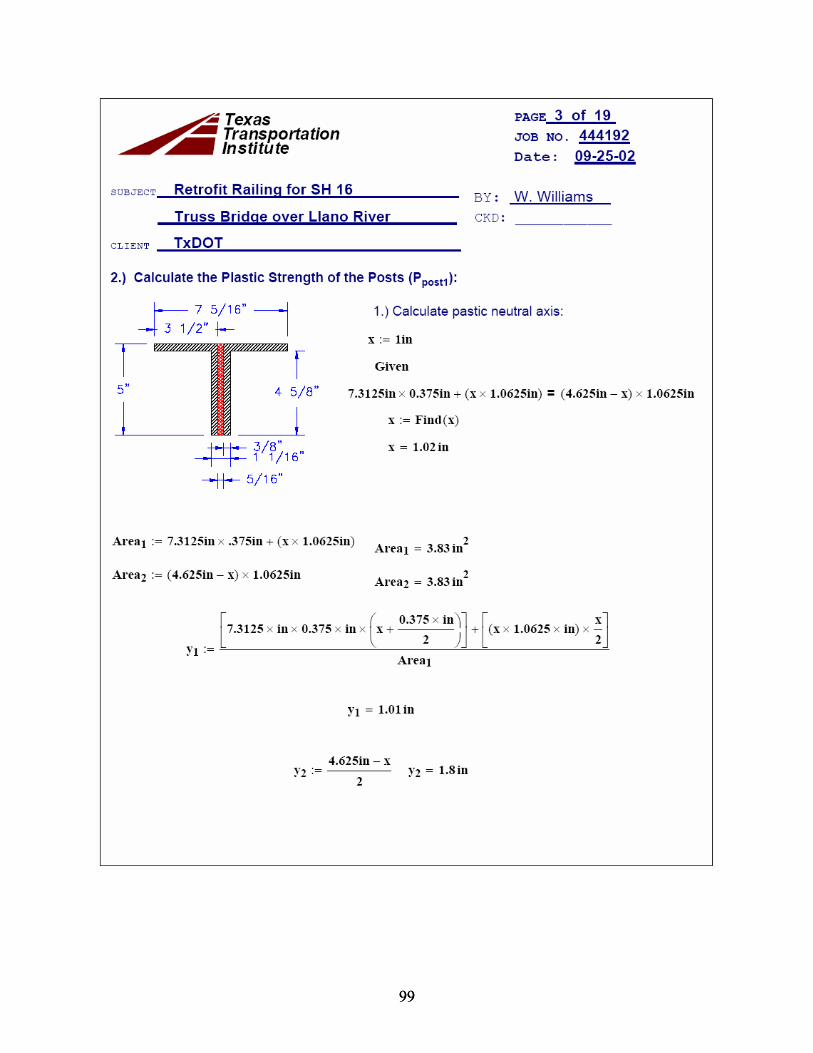
99 99
100 100
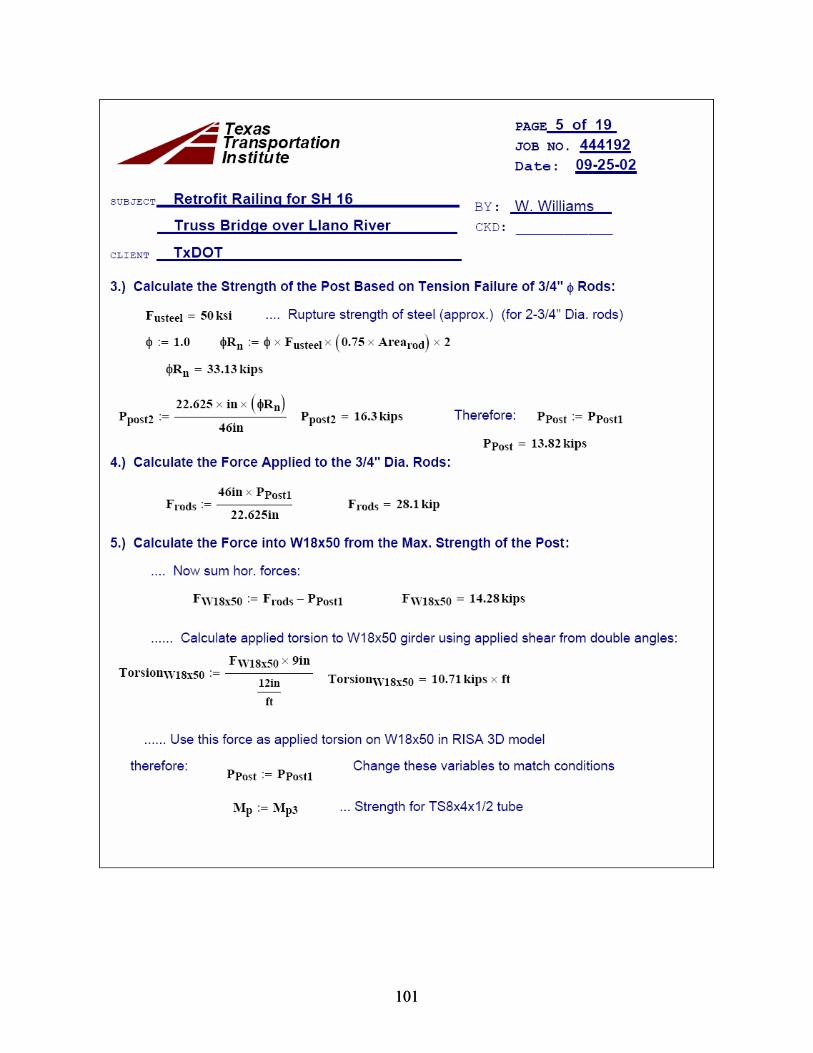
101 101
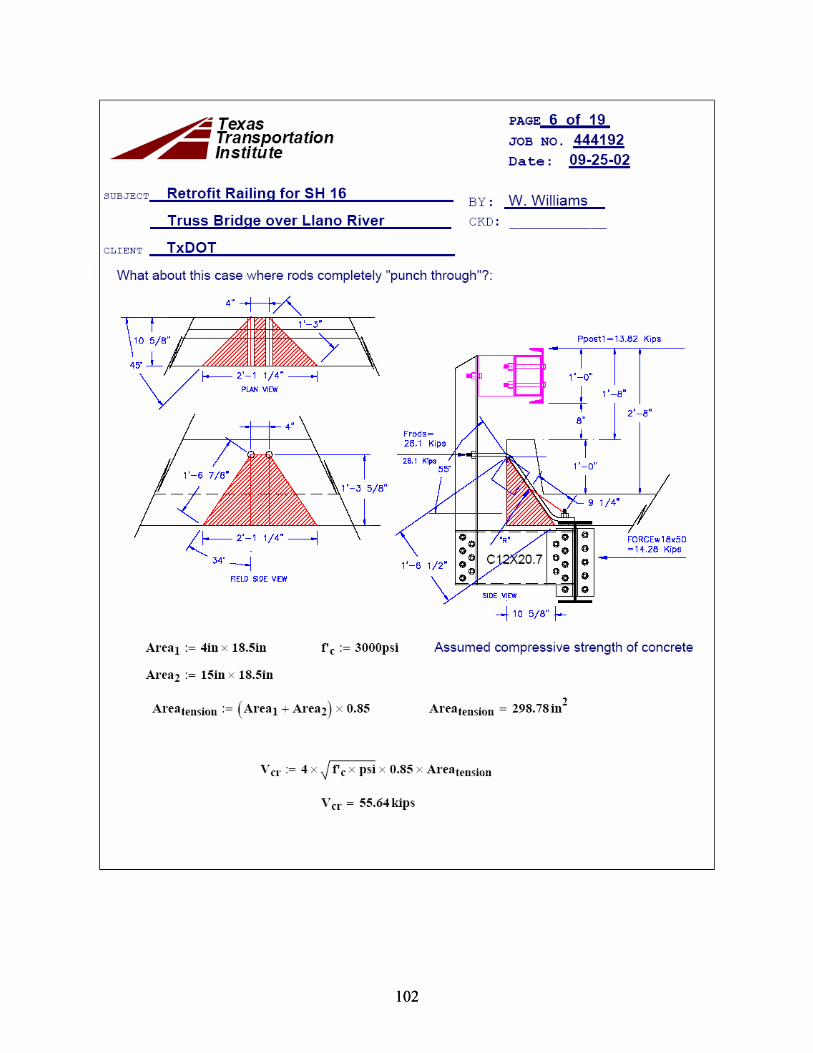
102 102
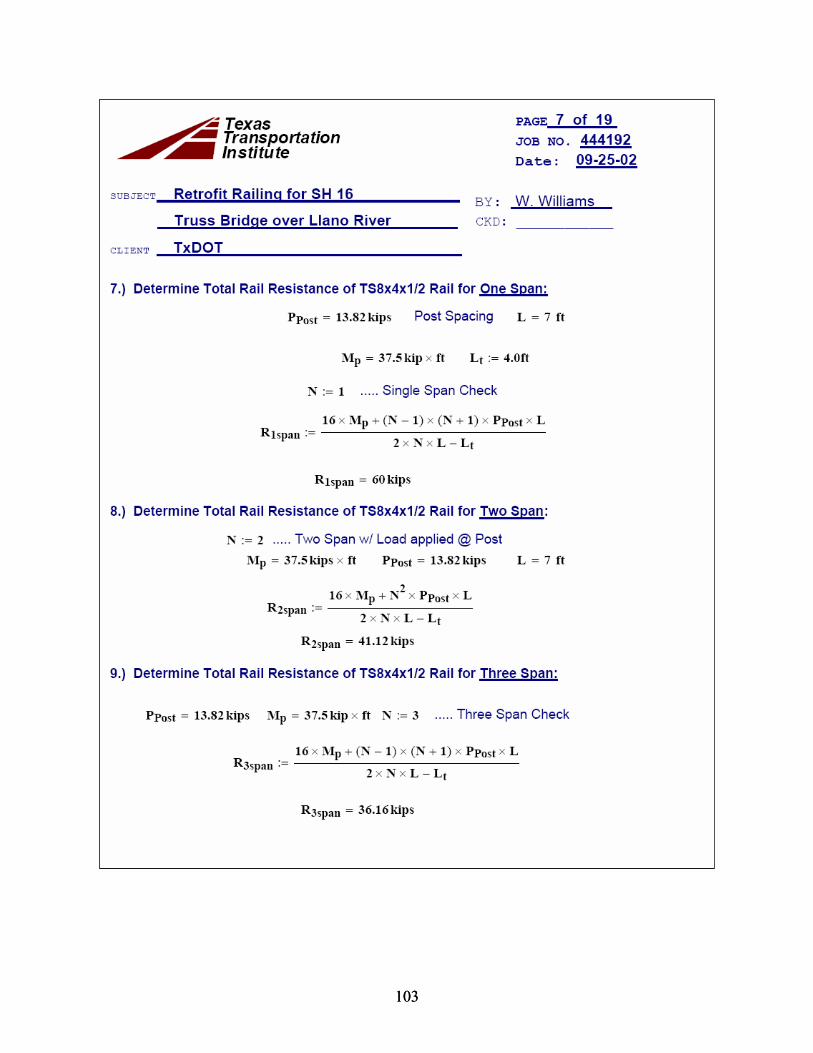
103 103
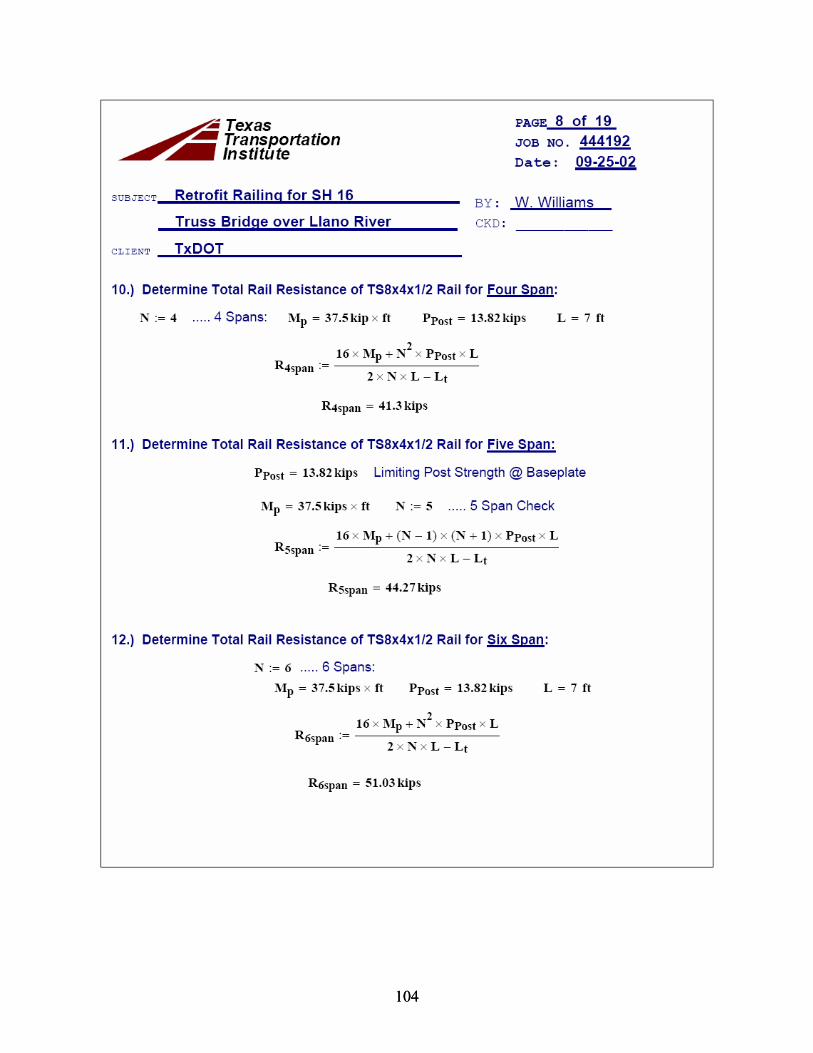
104 104
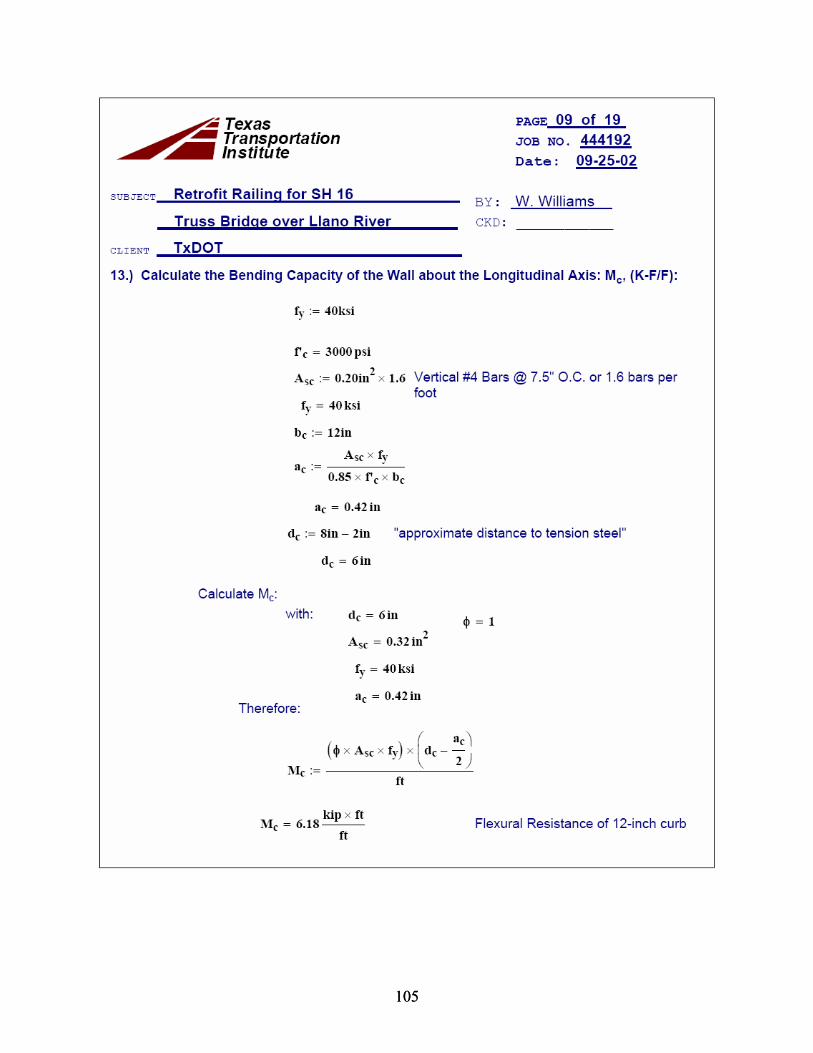
105 105
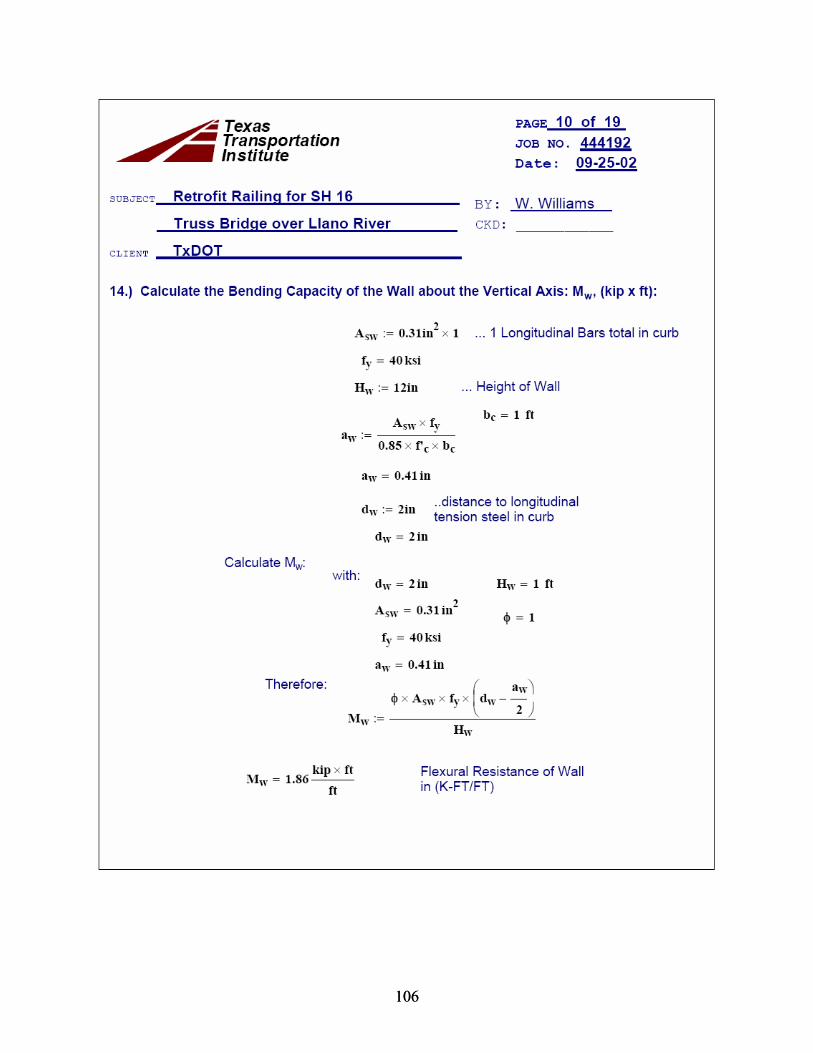
106 106
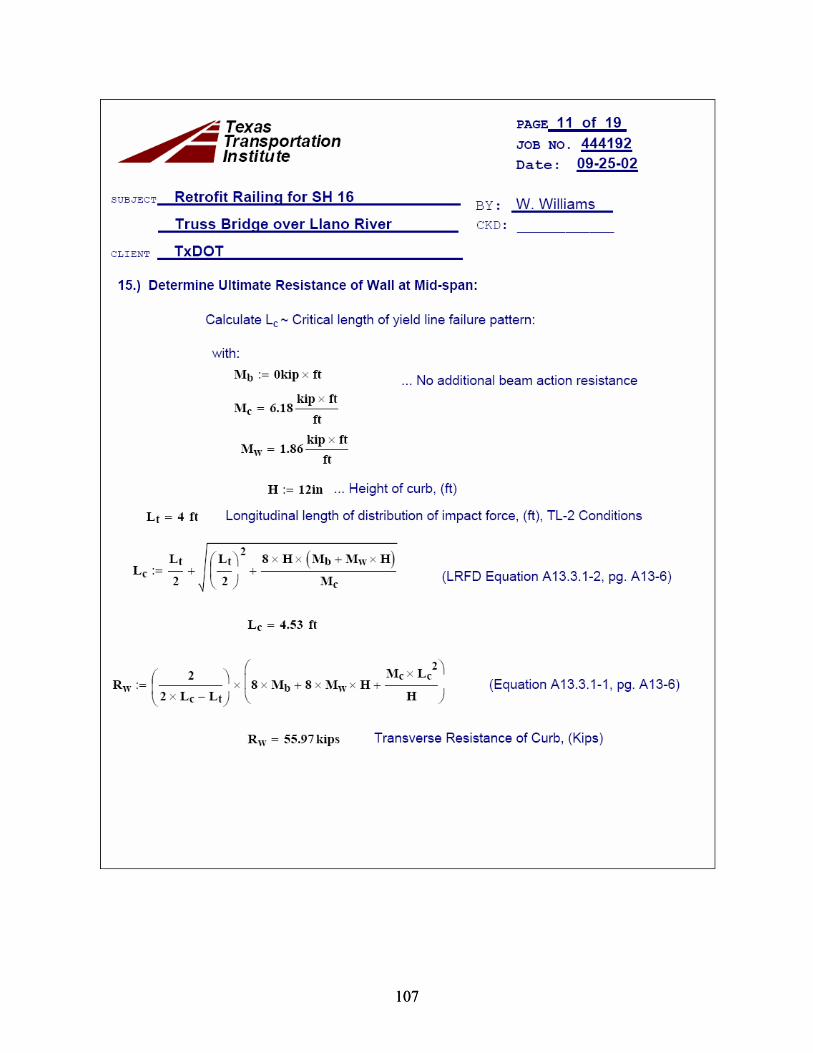
107 107
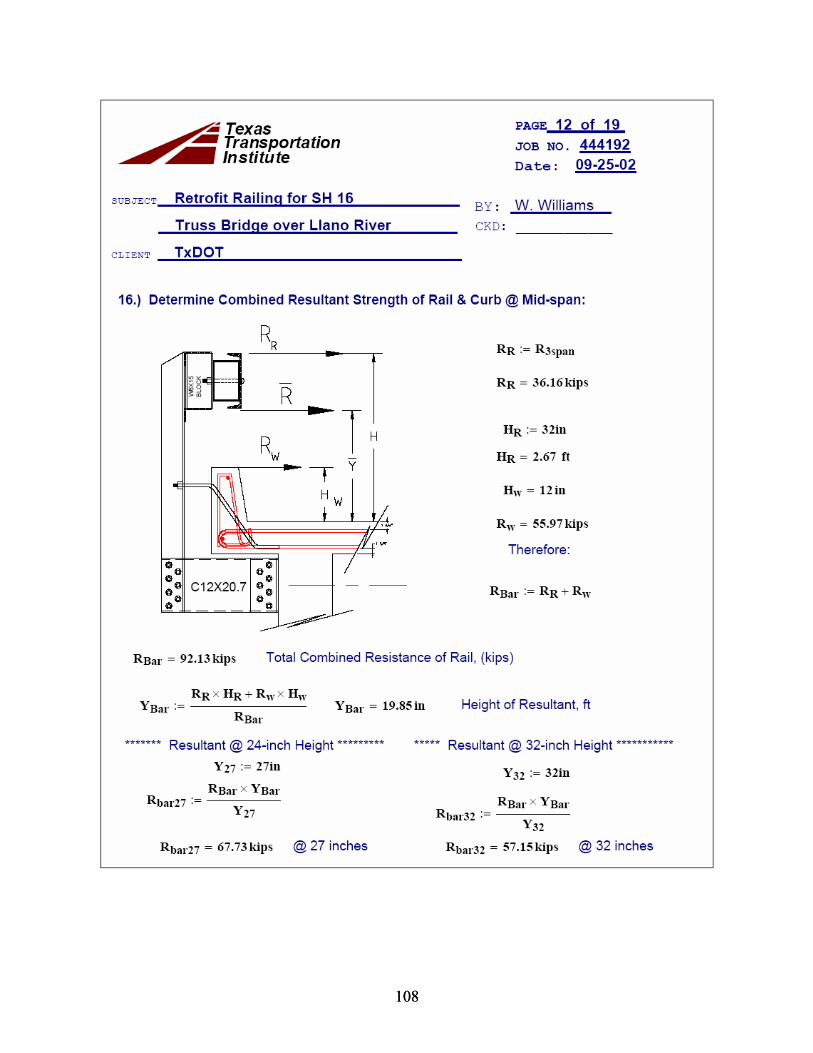
108 108
109 109

110 110
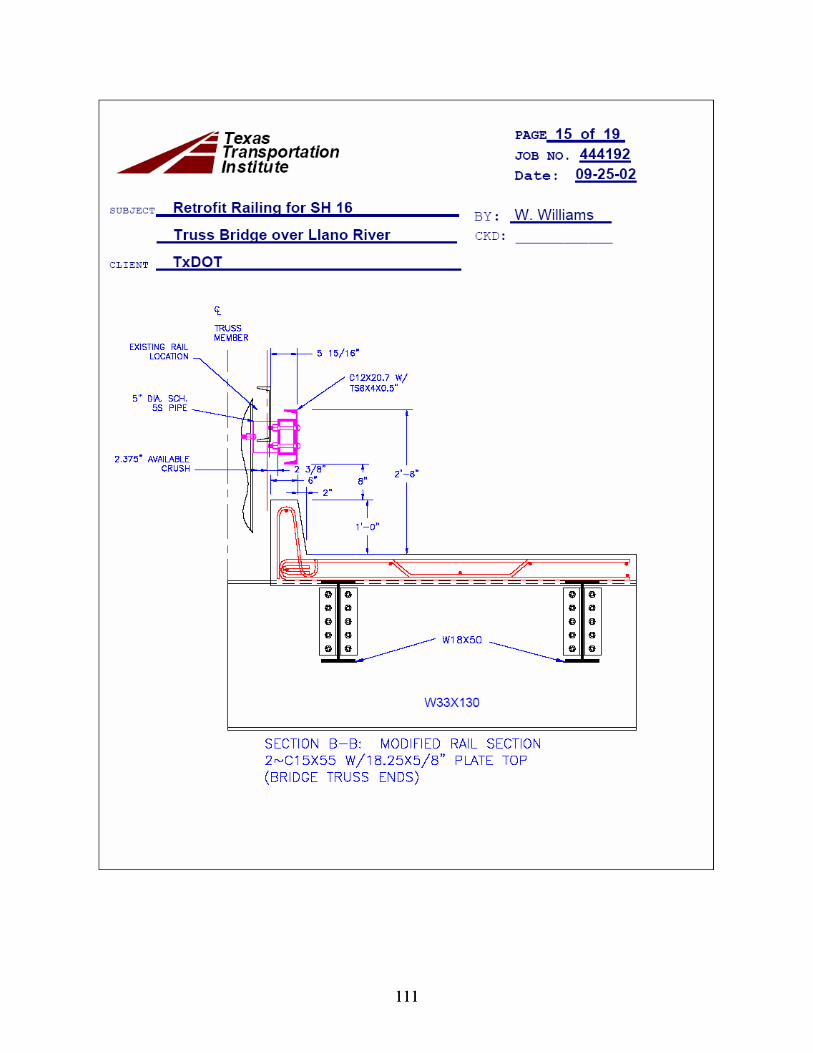
111 111
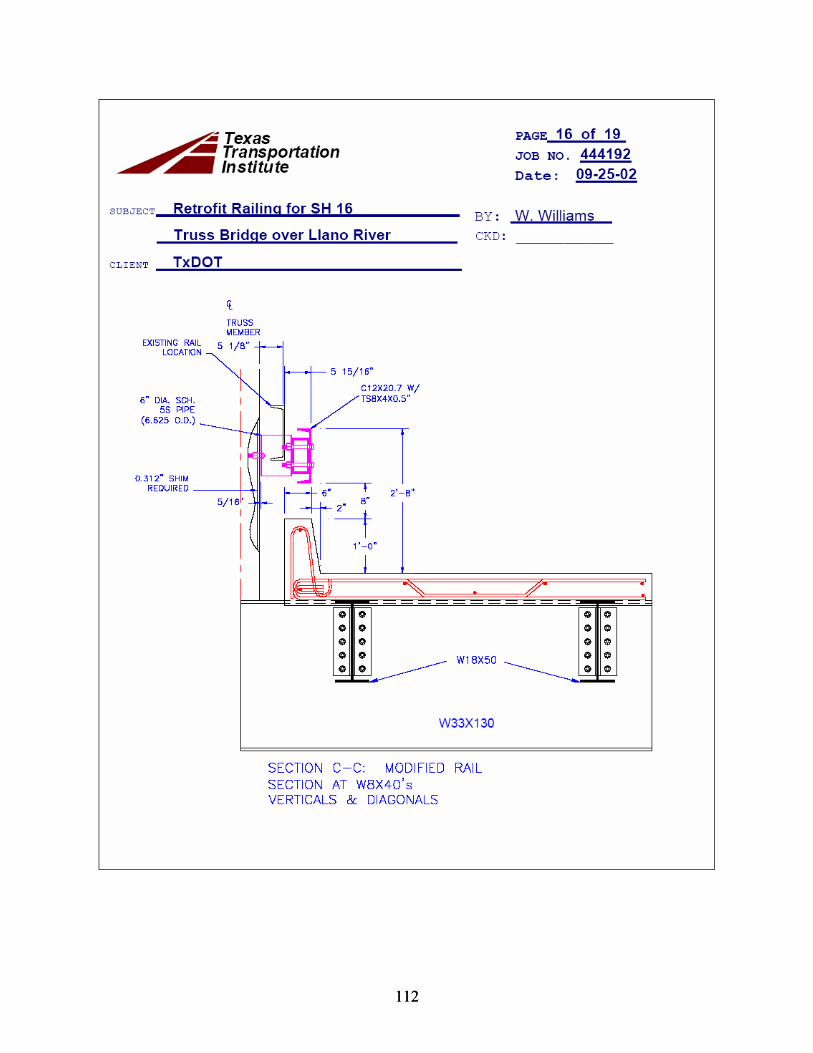
112 112
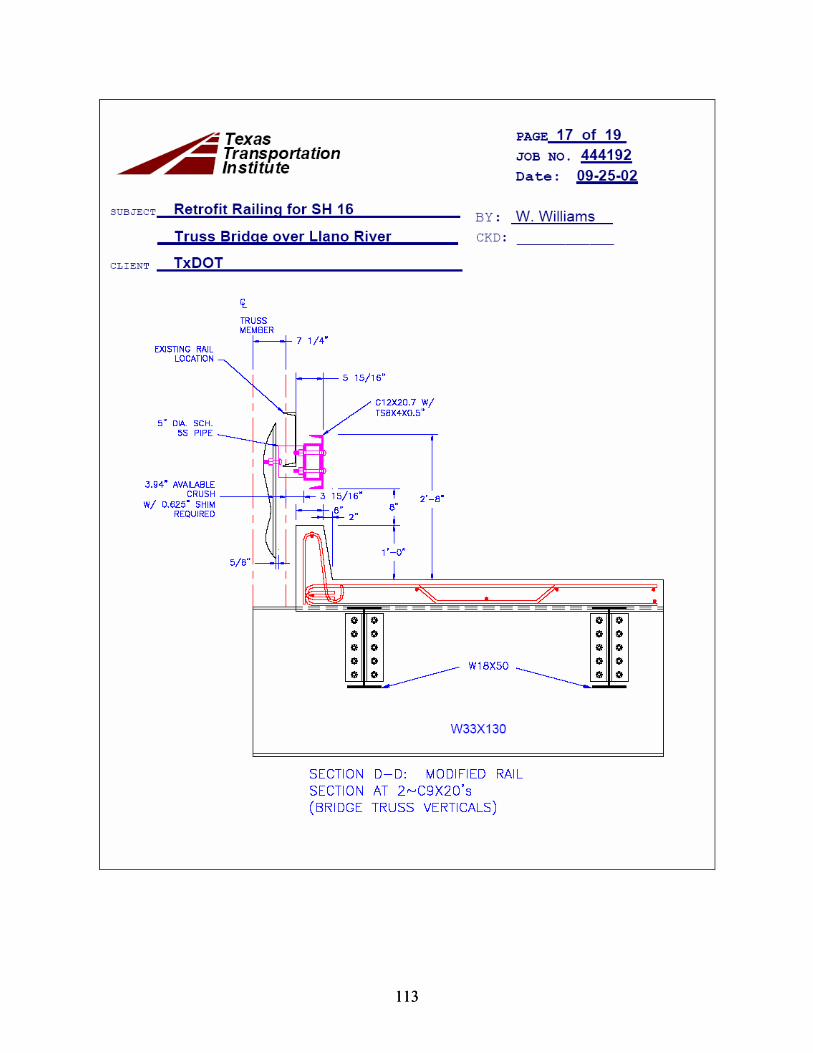
113 113

114 114
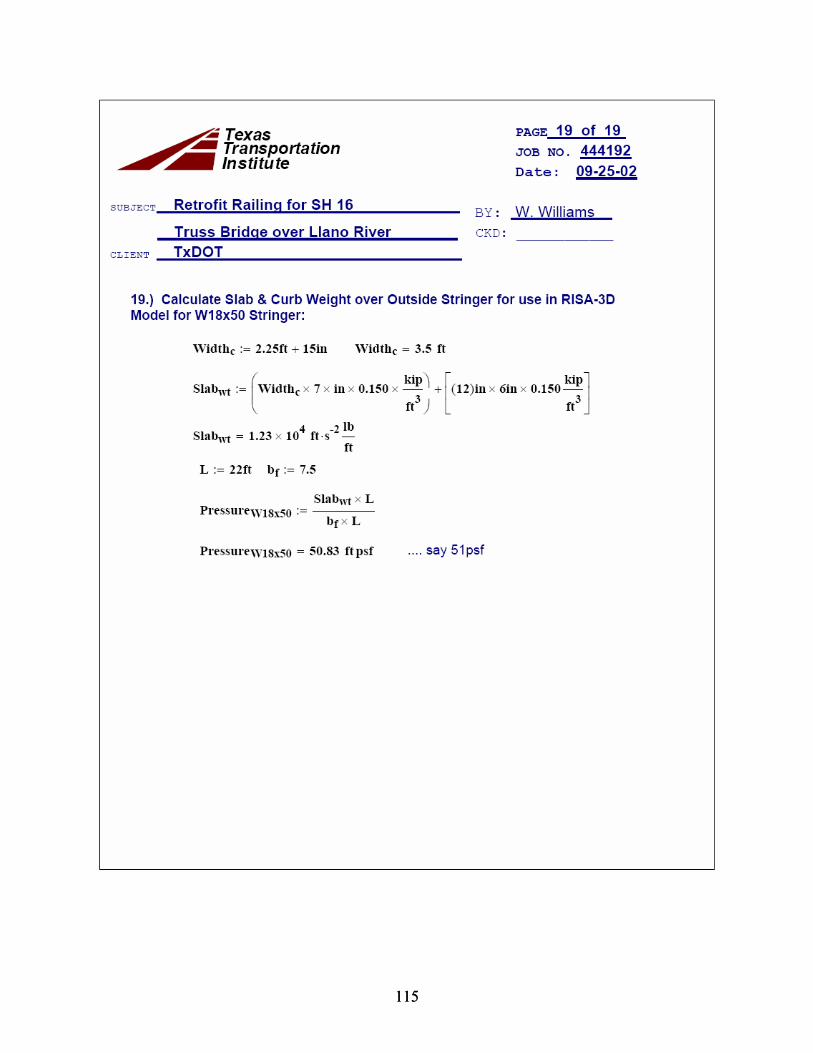
115 115

mm
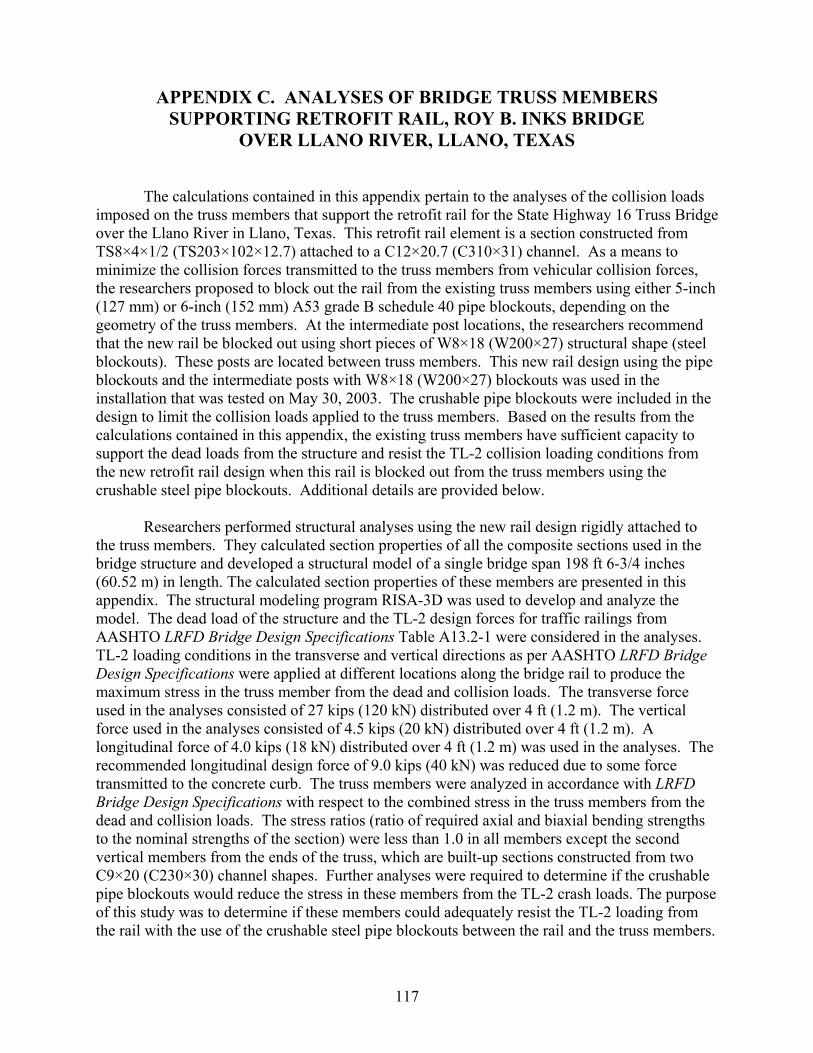
APPENDIX C. ANALYSES OF BRIDGE TRUSS MEMBERS SUPPORTING RETROFIT RAIL, ROY B. INKS BRIDGE
OVER LLANO RIVER, LLANO, TEXAS
The calculations contained in this appendix pertain to the analyses of the collision loads imposed on the truss members that support the retrofit rail for the State Highway 16 Truss Bridge over the Llano River in Llano, Texas. This retrofit rail element is a section constructed from TS8×4×1/2 (TS203×102×12.7) attached to a C12×20.7 (C310×31) channel. As a means to minimize the collision forces transmitted to the truss members from vehicular collision forces, the researchers proposed to block out the rail from the existing truss members using either 5-inch (127 mm) or 6-inch (152 mm) A53 grade B schedule 40 pipe blockouts, depending on the geometry of the truss members. At the intermediate post locations, the researchers recommend that the new rail be blocked out using short pieces of W8×18 (W200×27) structural shape (steel blockouts). These posts are located between truss members. This new rail design using the pipe blockouts and the intermediate posts with W8×18 (W200×27) blockouts was used in the installation that was tested on May 30, 2003. The crushable pipe blockouts were included in the design to limit the collision loads applied to the truss members. Based on the results from the calculations contained in this appendix, the existing truss members have sufficient capacity to support the dead loads from the structure and resist the TL-2 collision loading conditions from the new retrofit rail design when this rail is blocked out from the truss members using the crushable steel pipe blockouts. Additional details are provided below.
Researchers performed structural analyses using the new rail design rigidly attached to
the truss members. They calculated section properties of all the composite sections used in the bridge structure and developed a structural model of a single bridge span 198 ft 6-3/4 inches (60.52 m) in length. The calculated section properties of these members are presented in this appendix. The structural modeling program RISA-3D was used to develop and analyze the model. The dead load of the structure and the TL-2 design forces for traffic railings from AASHTO LRFD Bridge Design Specifications Table A13.2-1 were considered in the analyses. TL-2 loading conditions in the transverse and vertical directions as per AASHTO LRFD Bridge Design Specifications were applied at different locations along the bridge rail to produce the maximum stress in the truss member from the dead and collision loads. The transverse force used in the analyses consisted of 27 kips (120 kN) distributed over 4 ft (1.2 m). The vertical force used in the analyses consisted of 4.5 kips (20 kN) distributed over 4 ft (1.2 m). A longitudinal force of 4.0 kips (18 kN) distributed over 4 ft (1.2 m) was used in the analyses. The recommended longitudinal design force of 9.0 kips (40 kN) was reduced due to some force transmitted to the concrete curb. The truss members were analyzed in accordance with LRFD Bridge Design Specifications with respect to the combined stress in the truss members from the dead and collision loads. The stress ratios (ratio of required axial and biaxial bending strengths to the nominal strengths of the section) were less than 1.0 in all members except the second vertical members from the ends of the truss, which are built-up sections constructed from two C9×20 (C230×30) channel shapes. Further analyses were required to determine if the crushable pipe blockouts would reduce the stress in these members from the TL-2 crash loads. The purpose of this study was to determine if these members could adequately resist the TL-2 loading from the rail with the use of the crushable steel pipe blockouts between the rail and the truss members.
117
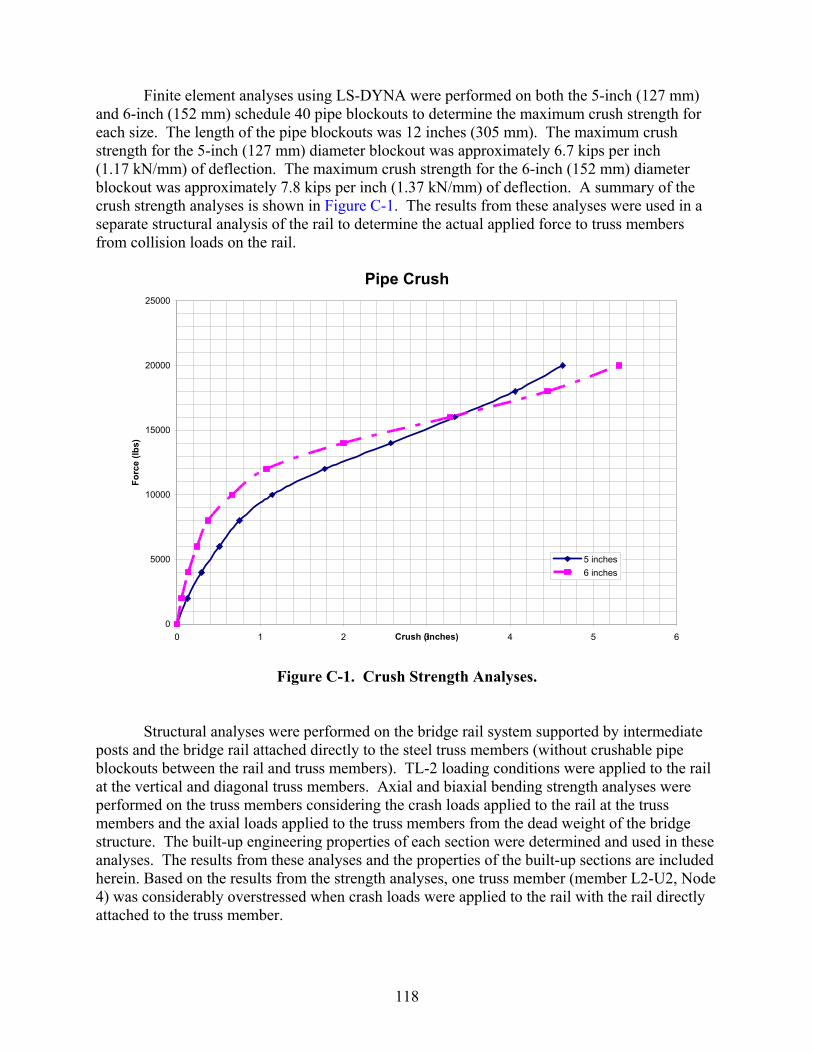
Finite element analyses using LS-DYNA were performed on both the 5-inch (127 mm) and 6-inch (152 mm) schedule 40 pipe blockouts to determine the maximum crush strength for each size. The length of the pipe blockouts was 12 inches (305 mm). The maximum crush strength for the 5-inch (127 mm) diameter blockout was approximately 6.7 kips per inch (1.17 kN/mm) of deflection. The maximum crush strength for the 6-inch (152 mm) diameter blockout was approximately 7.8 kips per inch (1.37 kN/mm) of deflection. A summary of the crush strength analyses is shown in Figure C-1. The results from these analyses were used in a separate structural analysis of the rail to determine the actual applied force to truss members from collision loads on the rail.
Pipe Crush
0
5000
10000
15000
20000
25000
0 1 2 3 4 5 6Crush (inches)
Forc
e (lb
s)
5 inches6 inches
Figure C-1. Crush Strength Analyses.
Structural analyses were performed on the bridge rail system supported by intermediate posts and the bridge rail attached directly to the steel truss members (without crushable pipe blockouts between the rail and truss members). TL-2 loading conditions were applied to the rail at the vertical and diagonal truss members. Axial and biaxial bending strength analyses were performed on the truss members considering the crash loads applied to the rail at the truss members and the axial loads applied to the truss members from the dead weight of the bridge structure. The built-up engineering properties of each section were determined and used in these analyses. The results from these analyses and the properties of the built-up sections are included herein. Based on the results from the strength analyses, one truss member (member L2-U2, Node 4) was considerably overstressed when crash loads were applied to the rail with the rail directly attached to the truss member.
118
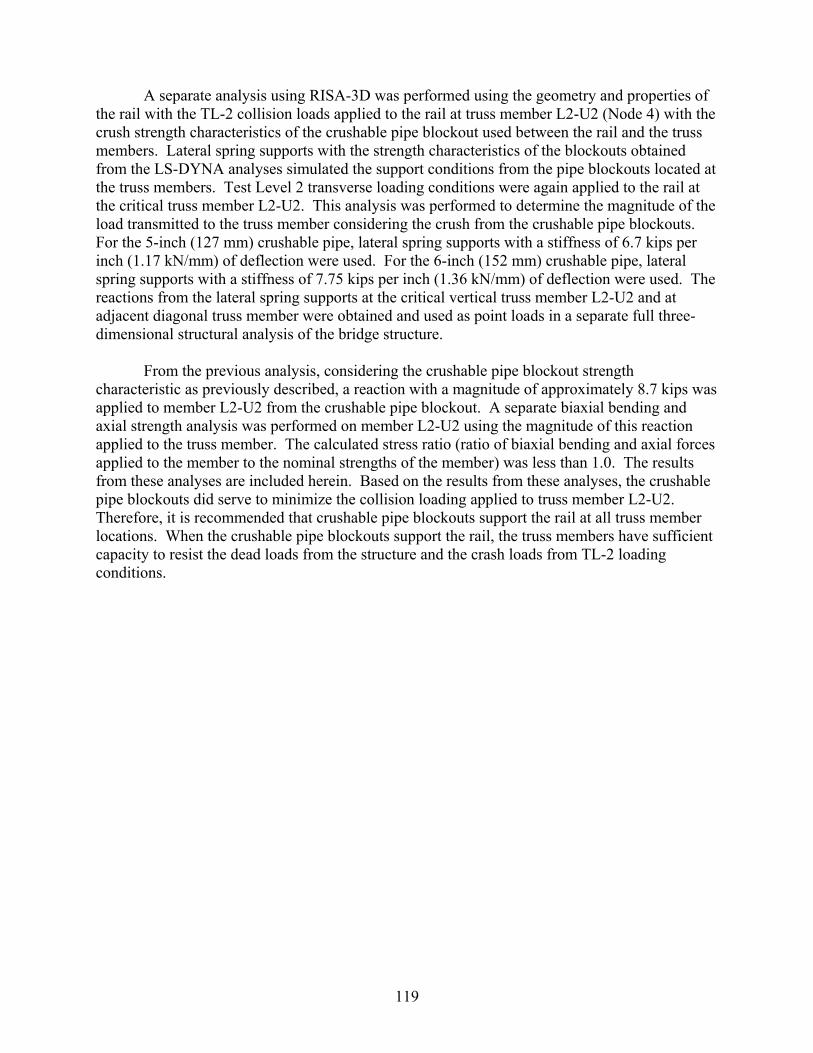
A separate analysis using RISA-3D was performed using the geometry and properties of the rail with the TL-2 collision loads applied to the rail at truss member L2-U2 (Node 4) with the crush strength characteristics of the crushable pipe blockout used between the rail and the truss members. Lateral spring supports with the strength characteristics of the blockouts obtained from the LS-DYNA analyses simulated the support conditions from the pipe blockouts located at the truss members. Test Level 2 transverse loading conditions were again applied to the rail at the critical truss member L2-U2. This analysis was performed to determine the magnitude of the load transmitted to the truss member considering the crush from the crushable pipe blockouts. For the 5-inch (127 mm) crushable pipe, lateral spring supports with a stiffness of 6.7 kips per inch (1.17 kN/mm) of deflection were used. For the 6-inch (152 mm) crushable pipe, lateral spring supports with a stiffness of 7.75 kips per inch (1.36 kN/mm) of deflection were used. The reactions from the lateral spring supports at the critical vertical truss member L2-U2 and at adjacent diagonal truss member were obtained and used as point loads in a separate full three-dimensional structural analysis of the bridge structure. From the previous analysis, considering the crushable pipe blockout strength characteristic as previously described, a reaction with a magnitude of approximately 8.7 kips was applied to member L2-U2 from the crushable pipe blockout. A separate biaxial bending and axial strength analysis was performed on member L2-U2 using the magnitude of this reaction applied to the truss member. The calculated stress ratio (ratio of biaxial bending and axial forces applied to the member to the nominal strengths of the member) was less than 1.0. The results from these analyses are included herein. Based on the results from these analyses, the crushable pipe blockouts did serve to minimize the collision loading applied to truss member L2-U2. Therefore, it is recommended that crushable pipe blockouts support the rail at all truss member locations. When the crushable pipe blockouts support the rail, the truss members have sufficient capacity to resist the dead loads from the structure and the crash loads from TL-2 loading conditions.
119

State Highway 16, Roy B. Inks Bridge over Llano River
Truss Member Section Properties
for
Three-Dimensional RISA-3D Structural Model
120
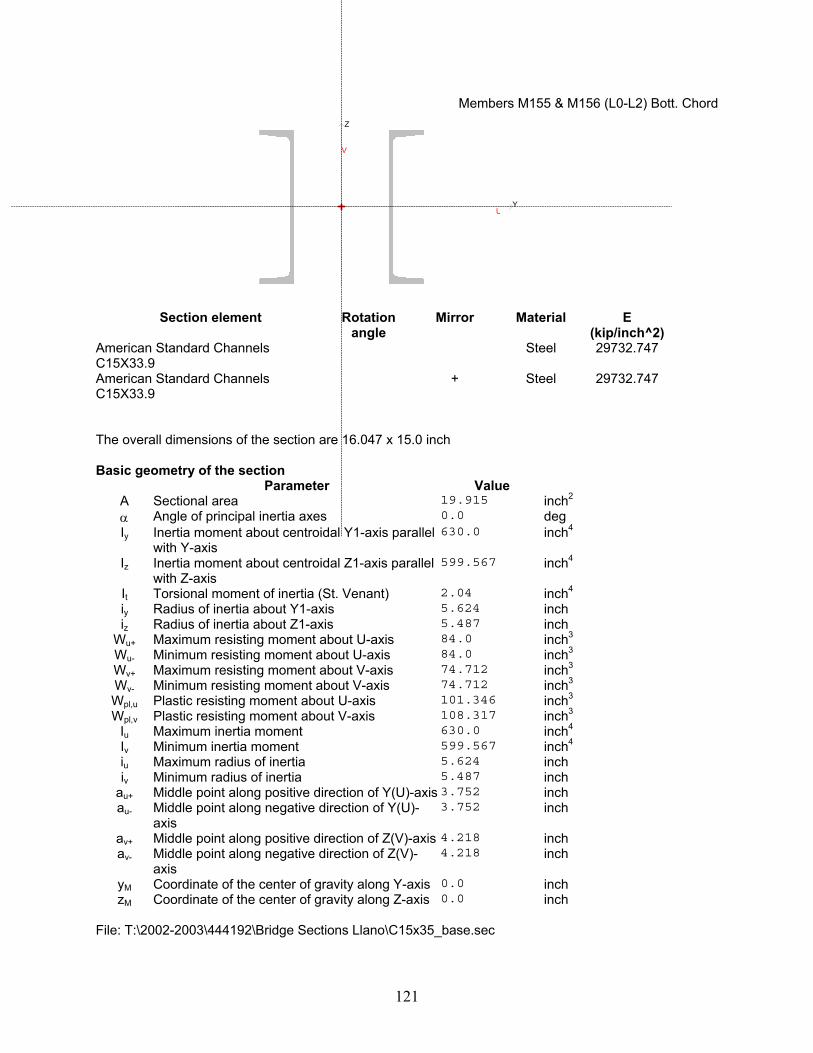
Members M155 & M156 (L0-L2) Bott. Chord
Section element Rotation angle
Mirror Material E (kip/inch^2)
American Standard Channels C15X33.9
Steel 29732.747
American Standard Channels C15X33.9
+ Steel 29732.747
The overall dimensions of the section are 16.047 x 15.0 inch Basic geometry of the section
Parameter Value A Sectional area 19.915 inch2
α Angle of principal inertia axes 0.0 deg
Iy Inertia moment about centroidal Y1-axis parallel with Y-axis
630.0 inch4
Iz Inertia moment about centroidal Z1-axis parallel with Z-axis
599.567 inch4
It Torsional moment of inertia (St. Venant) 2.04 inch4
iy Radius of inertia about Y1-axis 5.624 inch
iz Radius of inertia about Z1-axis 5.487 inch
Wu+ Maximum resisting moment about U-axis 84.0 inch3
Wu- Minimum resisting moment about U-axis 84.0 inch3
Wv+ Maximum resisting moment about V-axis 74.712 inch3
Wv- Minimum resisting moment about V-axis 74.712 inch3
Wpl,u Plastic resisting moment about U-axis 101.346 inch3
Wpl,v Plastic resisting moment about V-axis 108.317 inch3
Iu Maximum inertia moment 630.0 inch4
Iv Minimum inertia moment 599.567 inch4
iu Maximum radius of inertia 5.624 inch
iv Minimum radius of inertia 5.487 inch
au+ Middle point along positive direction of Y(U)-axis 3.752 inch
au- Middle point along negative direction of Y(U)-axis
3.752 inch
av+ Middle point along positive direction of Z(V)-axis 4.218 inch
av- Middle point along negative direction of Z(V)-axis
4.218 inch
yM Coordinate of the center of gravity along Y-axis 0.0 inch
zM Coordinate of the center of gravity along Z-axis 0.0 inch
U
V
Z
Y
File: T:\2002-2003\444192\Bridge Sections Llano\C15x35_base.sec
121

Member M187 (L2-L3) Bott. Chord
Section element Rotation
angle Mirror Material E
(kip/inch^2)American Standard Channels C15X50 + Steel 29732.747 American Standard Channels C15X50 Steel 29732.747 The overall dimensions of the section are 16.646 x 15.0 inch Basic geometry of the section
Parameter Value A Sectional area 29.393 inch2
α Angle of principal inertia axes -90.0 deg
Iy Inertia moment about centroidal Y1-axis parallel with Y-axis
808.0 inch4
Iz Inertia moment about centroidal Z1-axis parallel with Z-axis
881.313 inch4
It Torsional moment of inertia (St. Venant) 5.34 inch4
iy Radius of inertia about Y1-axis 5.243 inch
iz Radius of inertia about Z1-axis 5.476 inch
Wu+ Maximum resisting moment about U-axis 105.863 inch3
Wu- Minimum resisting moment about U-axis 105.863 inch3
Wv+ Maximum resisting moment about V-axis 107.733 inch3
Wv- Minimum resisting moment about V-axis 107.733 inch3
Wpl,u Plastic resisting moment about U-axis 158.459 inch3
Wpl,v Plastic resisting moment about V-axis 135.936 inch3
Iu Maximum inertia moment 881.313 inch4
Iv Minimum inertia moment 808.0 inch4
iu Maximum radius of inertia 5.476 inch
iv Minimum radius of inertia 5.243 inch
au+ Middle point along positive direction of Y(U)-axis 3.665 inch
au- Middle point along negative direction of Y(U)-axis
3.665 inch
av+ Middle point along positive direction of Z(V)-axis 3.602 inch
av- Middle point along negative direction of Z(V)-axis
3.602 inch
yM Coordinate of the center of gravity along Y-axis 1.35058e-015
zM Coordinate of the center of gravity along Z-axis 0.0 inch
U
V
Z
Y
File: T:\2002-2003\444192\Bridge Sections Llano\C15x50_base.sec
122
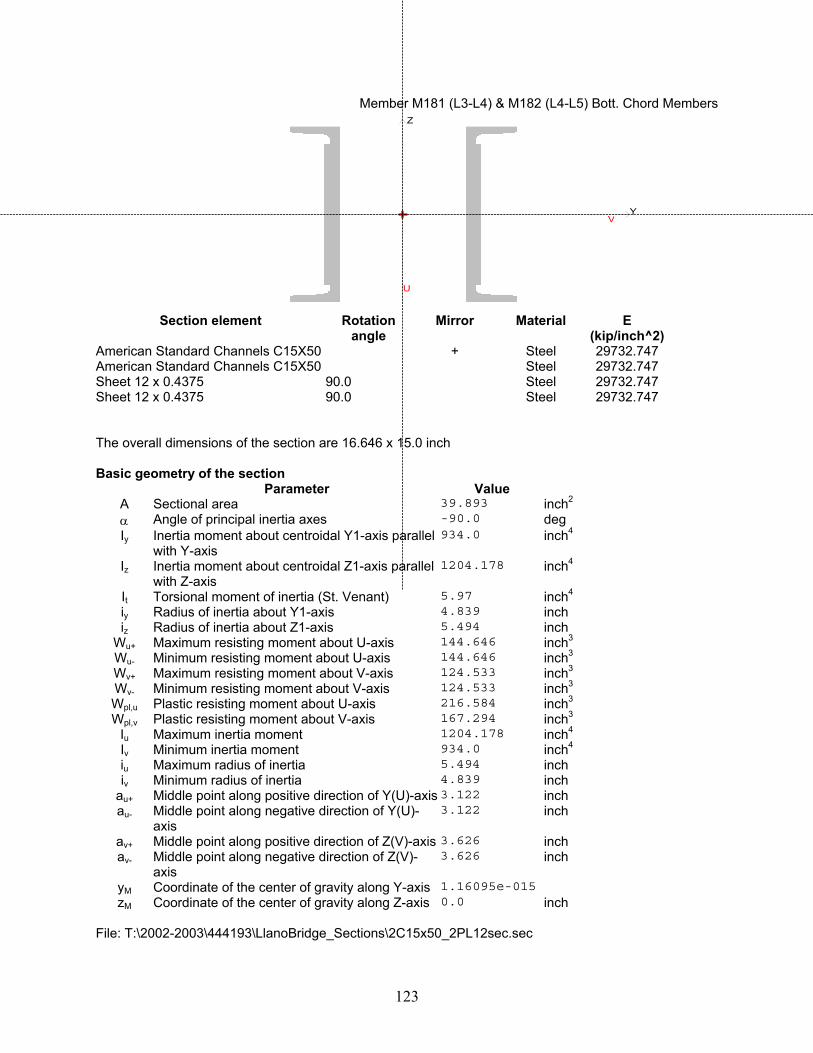
Member M181 (L3-L4) & M182 (L4-L5) Bott. Chord Members
123
U
V
Z
Y
Section element Rotation angle
Mirror Material E (kip/inch^2)
American Standard Channels C15X50 + Steel 29732.747 American Standard Channels C15X50 Steel 29732.747 Sheet 12 x 0.4375 90.0 Steel 29732.747 Sheet 12 x 0.4375 90.0 Steel 29732.747 The overall dimensions of the section are 16.646 x 15.0 inch Basic geometry of the section
Parameter Value A Sectional area 39.893 inch2
α Angle of principal inertia axes -90.0 deg
Iy Inertia moment about centroidal Y1-axis parallel with Y-axis
934.0 inch4
Iz Inertia moment about centroidal Z1-axis parallel with Z-axis
1204.178 inch4
It Torsional moment of inertia (St. Venant) 5.97 inch4
iy Radius of inertia about Y1-axis 4.839 inch
iz Radius of inertia about Z1-axis 5.494 inch
Wu+ Maximum resisting moment about U-axis 144.646 inch3
Wu- Minimum resisting moment about U-axis 144.646 inch3
Wv+ Maximum resisting moment about V-axis 124.533 inch3
Wv- Minimum resisting moment about V-axis 124.533 inch3
Wpl,u Plastic resisting moment about U-axis 216.584 inch3
Wpl,v Plastic resisting moment about V-axis 167.294 inch3
Iu Maximum inertia moment 1204.178 inch4
Iv Minimum inertia moment 934.0 inch4
iu Maximum radius of inertia 5.494 inch
iv Minimum radius of inertia 4.839 inch
au+ Middle point along positive direction of Y(U)-axis 3.122 inch
au- Middle point along negative direction of Y(U)-axis
3.122 inch
av+ Middle point along positive direction of Z(V)-axis 3.626 inch
av- Middle point along negative direction of Z(V)-axis
3.626 inch
yM Coordinate of the center of gravity along Y-axis 1.16095e-015
zM Coordinate of the center of gravity along Z-axis 0.0 inch
File: T:\2002-2003\444193\LlanoBridge_Sections\2C15x50_2PL12sec.sec
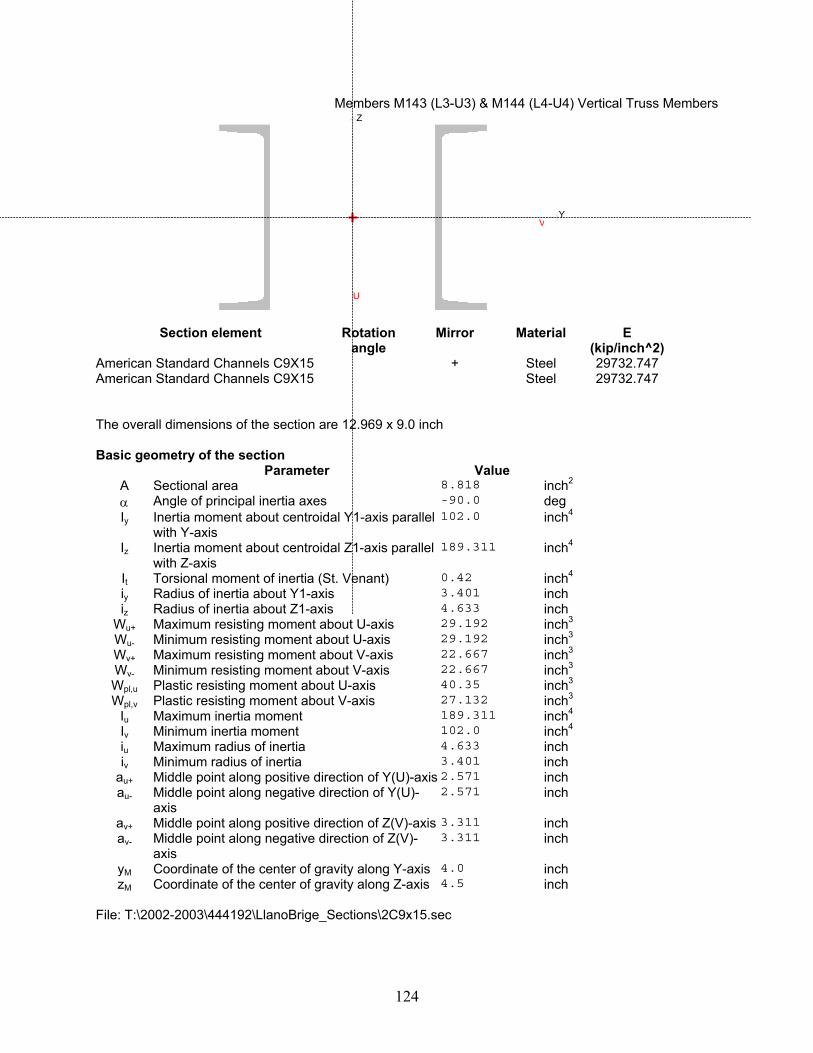
Members M143 (L3-U3) & M144 (L4-U4) Vertical Truss Members
Section element Rotation angle
Mirror Material E (kip/inch^2)
American Standard Channels C9X15 + Steel 29732.747 American Standard Channels C9X15 Steel 29732.747 The overall dimensions of the section are 12.969 x 9.0 inch Basic geometry of the section
Parameter Value A Sectional area 8.818 inch2
α Angle of principal inertia axes -90.0 deg
Iy Inertia moment about centroidal Y1-axis parallel with Y-axis
102.0 inch4
Iz Inertia moment about centroidal Z1-axis parallel with Z-axis
189.311 inch4
It Torsional moment of inertia (St. Venant) 0.42 inch4
iy Radius of inertia about Y1-axis 3.401 inch
iz Radius of inertia about Z1-axis 4.633 inch
Wu+ Maximum resisting moment about U-axis 29.192 inch3
Wu- Minimum resisting moment about U-axis 29.192 inch3
Wv+ Maximum resisting moment about V-axis 22.667 inch3
Wv- Minimum resisting moment about V-axis 22.667 inch3
Wpl,u Plastic resisting moment about U-axis 40.35 inch3
Wpl,v Plastic resisting moment about V-axis 27.132 inch3
Iu Maximum inertia moment 189.311 inch4
Iv Minimum inertia moment 102.0 inch4
iu Maximum radius of inertia 4.633 inch
iv Minimum radius of inertia 3.401 inch
au+ Middle point along positive direction of Y(U)-axis 2.571 inch
au- Middle point along negative direction of Y(U)-axis
2.571 inch
av+ Middle point along positive direction of Z(V)-axis 3.311 inch
av- Middle point along negative direction of Z(V)-axis
3.311 inch
yM Coordinate of the center of gravity along Y-axis 4.0 inch
zM Coordinate of the center of gravity along Z-axis 4.5 inch
U
V
Z
Y
File: T:\2002-2003\444192\LlanoBrige_Sections\2C9x15.sec
124
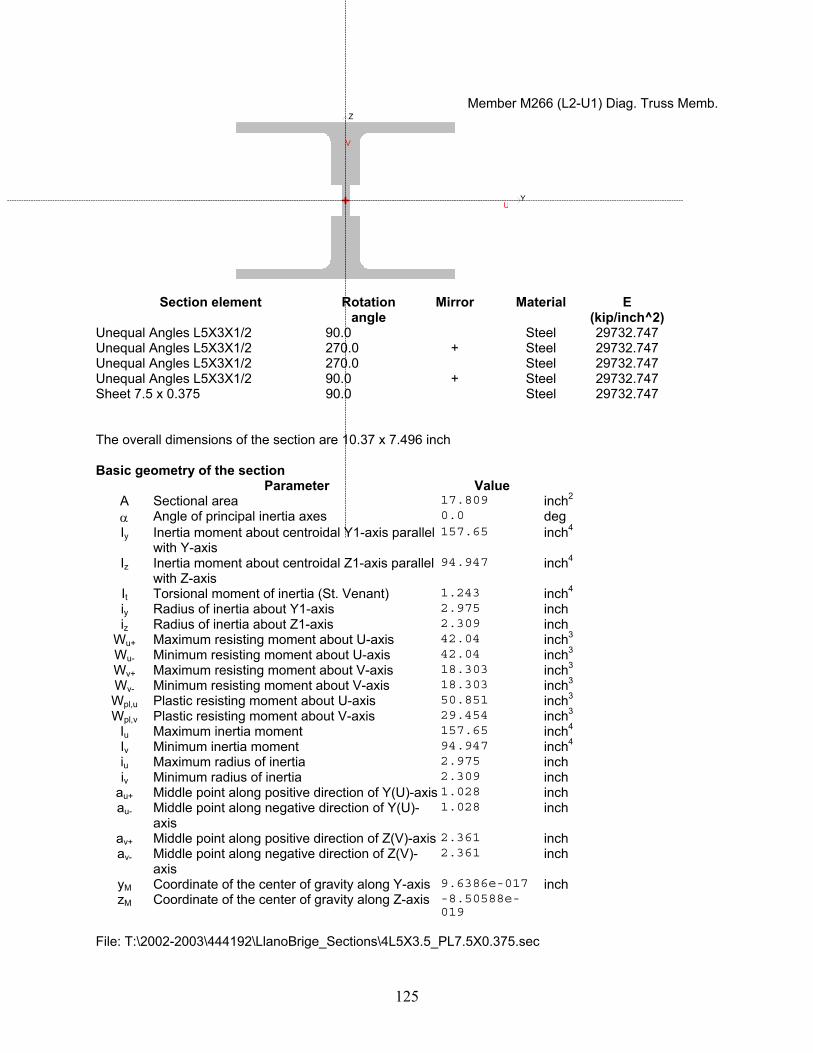
Member M266 (L2-U1) Diag. Truss Memb.
Section element Rotation angle
Mirror Material E (kip/inch^2)
Unequal Angles L5X3X1/2 90.0 Steel 29732.747 Unequal Angles L5X3X1/2 270.0 + Steel 29732.747 Unequal Angles L5X3X1/2 270.0 Steel 29732.747 Unequal Angles L5X3X1/2 90.0 + Steel 29732.747 Sheet 7.5 x 0.375 90.0 Steel 29732.747 The overall dimensions of the section are 10.37 x 7.496 inch Basic geometry of the section
Parameter Value A Sectional area 17.809 inch2
α Angle of principal inertia axes 0.0 deg
Iy Inertia moment about centroidal Y1-axis parallel with Y-axis
157.65 inch4
Iz Inertia moment about centroidal Z1-axis parallel with Z-axis
94.947 inch4
It Torsional moment of inertia (St. Venant) 1.243 inch4
iy Radius of inertia about Y1-axis 2.975 inch
iz Radius of inertia about Z1-axis 2.309 inch
Wu+ Maximum resisting moment about U-axis 42.04 inch3
Wu- Minimum resisting moment about U-axis 42.04 inch3
Wv+ Maximum resisting moment about V-axis 18.303 inch3
Wv- Minimum resisting moment about V-axis 18.303 inch3
Wpl,u Plastic resisting moment about U-axis 50.851 inch3
Wpl,v Plastic resisting moment about V-axis 29.454 inch3
Iu Maximum inertia moment 157.65 inch4
Iv Minimum inertia moment
U
V
Z
Y
inch494.947 inch 2.975 iu Maximum radius of inertia inch 2.309 iv Minimum radius of inertia inch 1.028 au+ Middle point along positive direction of Y(U)-axisinch 1.028 au- Middle point along negative direction of Y(U)-
axis inch 2.361 av+ Middle point along positive direction of Z(V)-axis
av- Middle point along negative direction of Z(V)-axis
2.361 inch
yM Coordinate of the center of gravity along Y-axis inch 9.6386e-017 zM Coordinate of the center of gravity along Z-axis -8.50588e-
019 File: T:\2002-2003\444192\LlanoBrige_Sections\4L5X3.5_PL7.5X0.375.sec
125
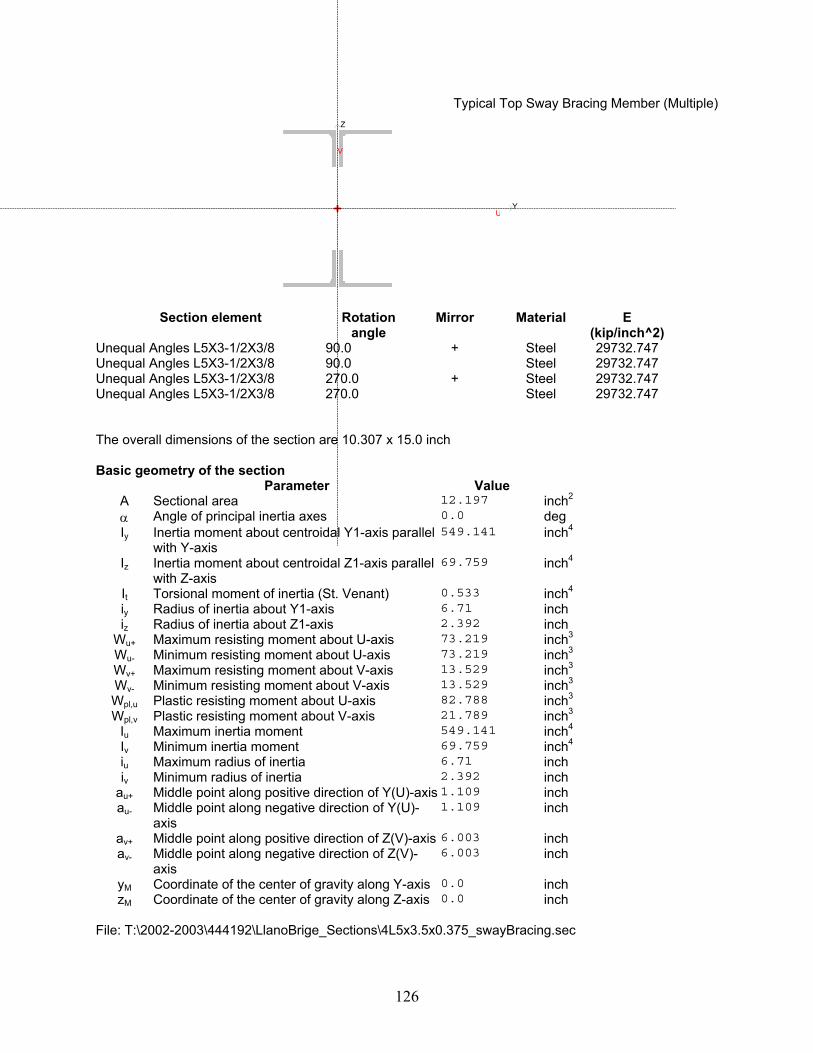
Typical Top Sway Bracing Member (Multiple)
Section element Rotation angle
Mirror Material E (kip/inch^2)
Unequal Angles L5X3-1/2X3/8 90.0 + Steel 29732.747 Unequal Angles L5X3-1/2X3/8 90.0 Steel 29732.747 Unequal Angles L5X3-1/2X3/8 270.0 + Steel 29732.747 Unequal Angles L5X3-1/2X3/8 270.0 Steel 29732.747 The overall dimensions of the section are 10.307 x 15.0 inch Basic geometry of the section
Parameter Value A Sectional area 12.197 inch2
α Angle of principal inertia axes 0.0 deg
Iy Inertia moment about centroidal Y1-axis parallel with Y-axis
549.141 inch4
Iz Inertia moment about centroidal Z1-axis parallel with Z-axis
U
V
Z
Y
inch469.759
inch40.533 It Torsional moment of inertia (St. Venant) inch 6.71 iy Radius of inertia about Y1-axis inch 2.392 iz Radius of inertia about Z1-axis inch373.219 Wu+ Maximum resisting moment about U-axis inch373.219 Wu- Minimum resisting moment about U-axis inch313.529 Wv+ Maximum resisting moment about V-axis inch313.529 Wv- Minimum resisting moment about V-axis inch382.788 Wpl,u Plastic resisting moment about U-axis inch321.789 Wpl,v Plastic resisting moment about V-axis inch4549.141 Iu Maximum inertia moment inch469.759 Iv Minimum inertia moment inch 6.71 iu Maximum radius of inertia inch 2.392 iv Minimum radius of inertia inch 1.109 au+ Middle point along positive direction of Y(U)-axisinch 1.109 au- Middle point along negative direction of Y(U)-
axis inch 6.003 av+ Middle point along positive direction of Z(V)-axisinch 6.003 av- Middle point along negative direction of Z(V)-
axis inch 0.0 yM Coordinate of the center of gravity along Y-axis inch 0.0 zM Coordinate of the center of gravity along Z-axis
File: T:\2002-2003\444192\LlanoBrige_Sections\4L5x3.5x0.375_swayBracing.sec
126
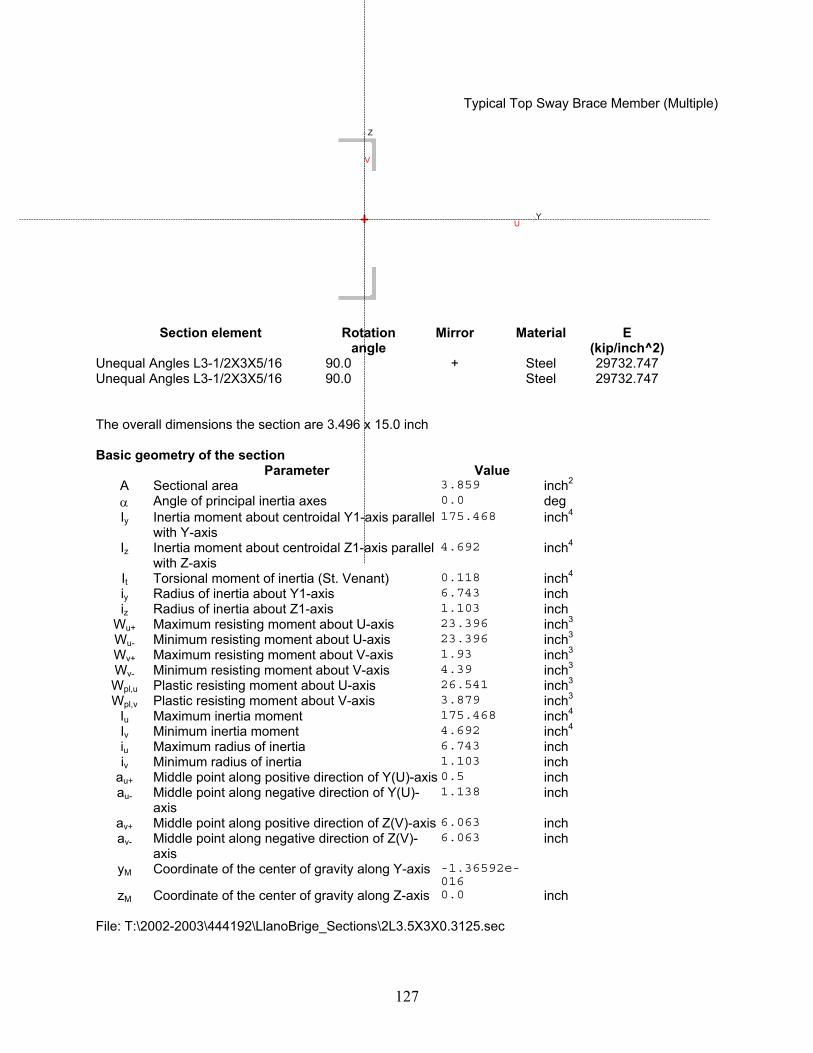
Typical Top Sway Brace Member (Multiple)
Section element Rotation angle
Mirror Material E (kip/inch^2)
Unequal Angles L3-1/2X3X5/16 90.0 + Steel 29732.747 Unequal Angles L3-1/2X3X5/16 90.0 Steel 29732.747 The overall dimensions the section are 3.496 x 15.0 inch Basic geometry of the section
Parameter Value A Sectional area 3.859 inch2
α Angle of principal inertia axes 0.0 deg
Iy Inertia moment about centroidal Y1-axis parallel with Y-axis
175.468 inch4
Iz Inertia moment about centroidal Z1-axis parallel with Z-axis
4.692 inch4
U
V
Z
Y
inch40.118 It Torsional moment of inertia (St. Venant) inch 6.743 iy Radius of inertia about Y1-axis inch 1.103 iz Radius of inertia about Z1-axis inch323.396 Wu+ Maximum resisting moment about U-axis inch323.396 Wu- Minimum resisting moment about U-axis inch31.93 Wv+ Maximum resisting moment about V-axis inch34.39 Wv- Minimum resisting moment about V-axis inch326.541 Wpl,u Plastic resisting moment about U-axis inch33.879 Wpl,v Plastic resisting moment about V-axis inch4175.468 Iu Maximum inertia moment inch44.692 Iv Minimum inertia moment inch 6.743 iu Maximum radius of inertia inch 1.103 iv Minimum radius of inertia inch 0.5 au+ Middle point along positive direction of Y(U)-axisinch 1.138 au- Middle point along negative direction of Y(U)-
axis inch 6.063 av+ Middle point along positive direction of Z(V)-axisinch 6.063 av- Middle point along negative direction of Z(V)-
axis yM Coordinate of the center of gravity along Y-axis -1.36592e-
016 inch 0.0 zM Coordinate of the center of gravity along Z-axis
File: T:\2002-2003\444192\LlanoBrige_Sections\2L3.5X3X0.3125.sec
127
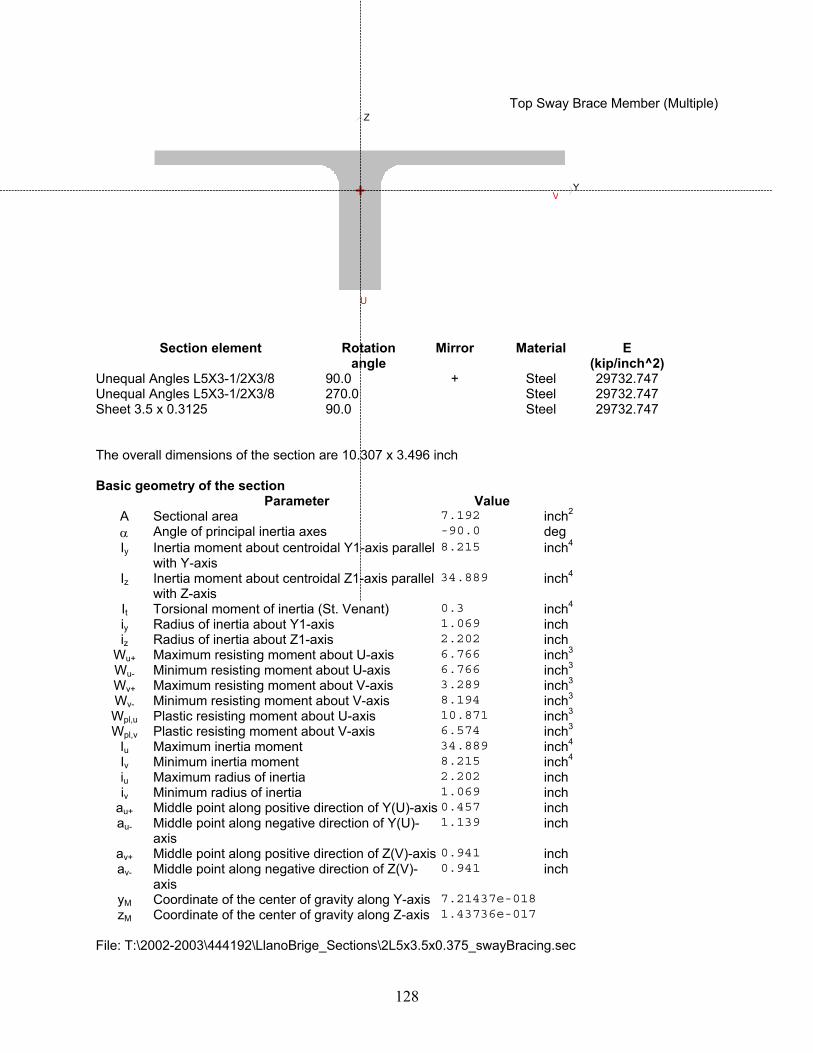
Top Sway Brace Member (Multiple)
Section element Rotation angle
Mirror Material E (kip/inch^2)
Unequal Angles L5X3-1/2X3/8 90.0 + Steel 29732.747 Unequal Angles L5X3-1/2X3/8 270.0 Steel 29732.747 Sheet 3.5 x 0.3125 90.0 Steel 29732.747 The overall dimensions of the section are 10.307 x 3.496 inch Basic geometry of the section
Parameter Value A Sectional area 7.192 inch2
α Angle of principal inertia axes -90.0 deg
Iy Inertia moment about centroidal Y1-axis parallel with Y-axis
8.215 inch4
Iz Inertia moment about centroidal Z1-axis parallel with Z-axis
34.889 inch4
It Torsional moment of inertia (St. Venant) 0.3 inch4
U
V
Z
Y
inch 1.069 iy Radius of inertia about Y1-axis inch 2.202 iz Radius of inertia about Z1-axis inch36.766 Wu+ Maximum resisting moment about U-axis inch36.766 Wu- Minimum resisting moment about U-axis inch33.289 Wv+ Maximum resisting moment about V-axis inch38.194 Wv- Minimum resisting moment about V-axis inch310.871 Wpl,u Plastic resisting moment about U-axis inch36.574 Wpl,v Plastic resisting moment about V-axis inch434.889 Iu Maximum inertia moment inch48.215 Iv Minimum inertia moment inch 2.202 iu Maximum radius of inertia inch 1.069 iv Minimum radius of inertia inch 0.457 au+ Middle point along positive direction of Y(U)-axisinch 1.139 au- Middle point along negative direction of Y(U)-
axis inch 0.941 av+ Middle point along positive direction of Z(V)-axisinch 0.941 av- Middle point along negative direction of Z(V)-
axis 7.21437e-018 yM Coordinate of the center of gravity along Y-axis 1.43736e-017 zM Coordinate of the center of gravity along Z-axis
File: T:\2002-2003\444192\LlanoBrige_Sections\2L5x3.5x0.375_swayBracing.sec
128
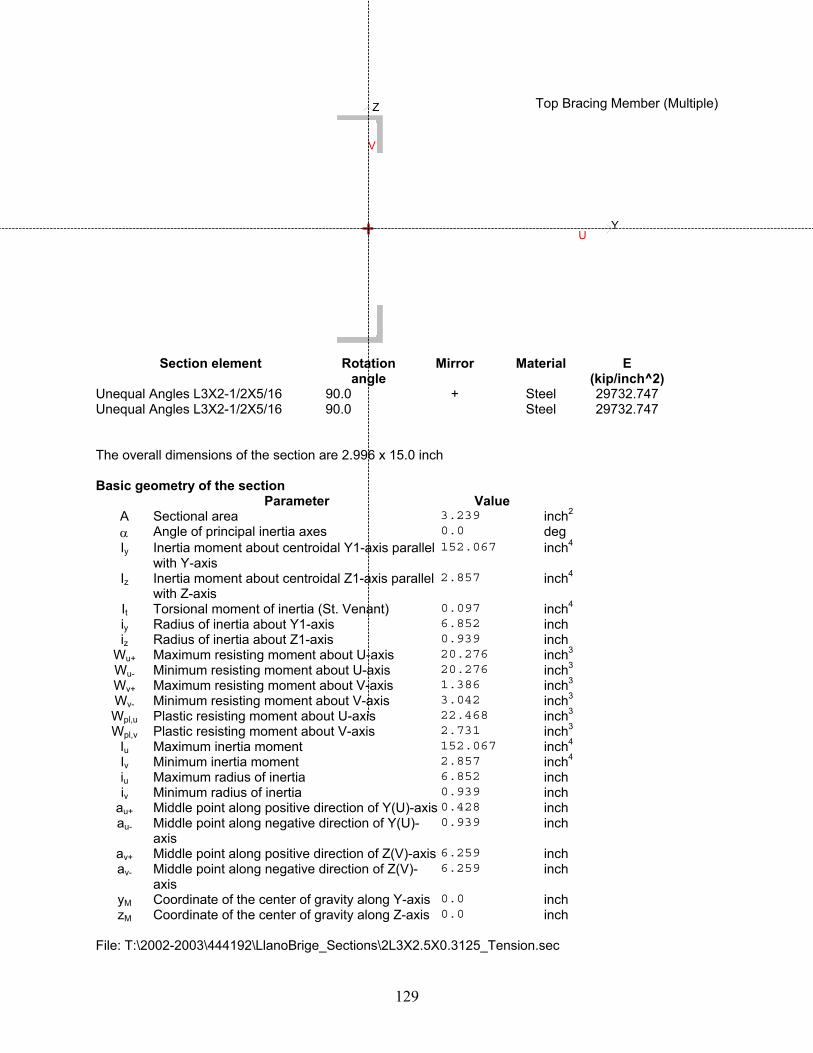
129
U
V
Z
Y
Top Bracing Member (Multiple)
Section element Rotation angle
Mirror Material E (kip/inch^2)
Unequal Angles L3X2-1/2X5/16 90.0 + Steel 29732.747 Unequal Angles L3X2-1/2X5/16 90.0 Steel 29732.747 The overall dimensions of the section are 2.996 x 15.0 inch Basic geometry of the section
Parameter Value inch23.239 A Sectional area deg 0.0 Angle of principal inertia axes α inch4152.067 Iy Inertia moment about centroidal Y1-axis parallel
with Y-axis inch42.857 Iz Inertia moment about centroidal Z1-axis parallel
with Z-axis inch40.097 It Torsional moment of inertia (St. Venant) inch 6.852 iy Radius of inertia about Y1-axis inch 0.939 iz Radius of inertia about Z1-axis
Wu+ Maximum resisting moment about U-axis 20.276 inch3
Wu- Minimum resisting moment about U-axis 20.276 inch3
Wv+ Maximum resisting moment about V-axis 1.386 inch3
Wv- Minimum resisting moment about V-axis 3.042 inch3
Wpl,u Plastic resisting moment about U-axis 22.468 inch3
Wpl,v Plastic resisting moment about V-axis 2.731 inch3
Iu Maximum inertia moment 152.067 inch4
Iv Minimum inertia moment 2.857 inch4
iu Maximum radius of inertia 6.852 inch
iv Minimum radius of inertia 0.939 inch
au+ Middle point along positive direction of Y(U)-axis 0.428 inch
au- Middle point along negative direction of Y(U)-axis
0.939 inch
av+ Middle point along positive direction of Z(V)-axis 6.259 inch
av- Middle point along negative direction of Z(V)-axis
6.259 inch
yM Coordinate of the center of gravity along Y-axis 0.0 inch
zM Coordinate of the center of gravity along Z-axis 0.0 inch
File: T:\2002-2003\444192\LlanoBrige_Sections\2L3X2.5X0.3125_Tension.sec
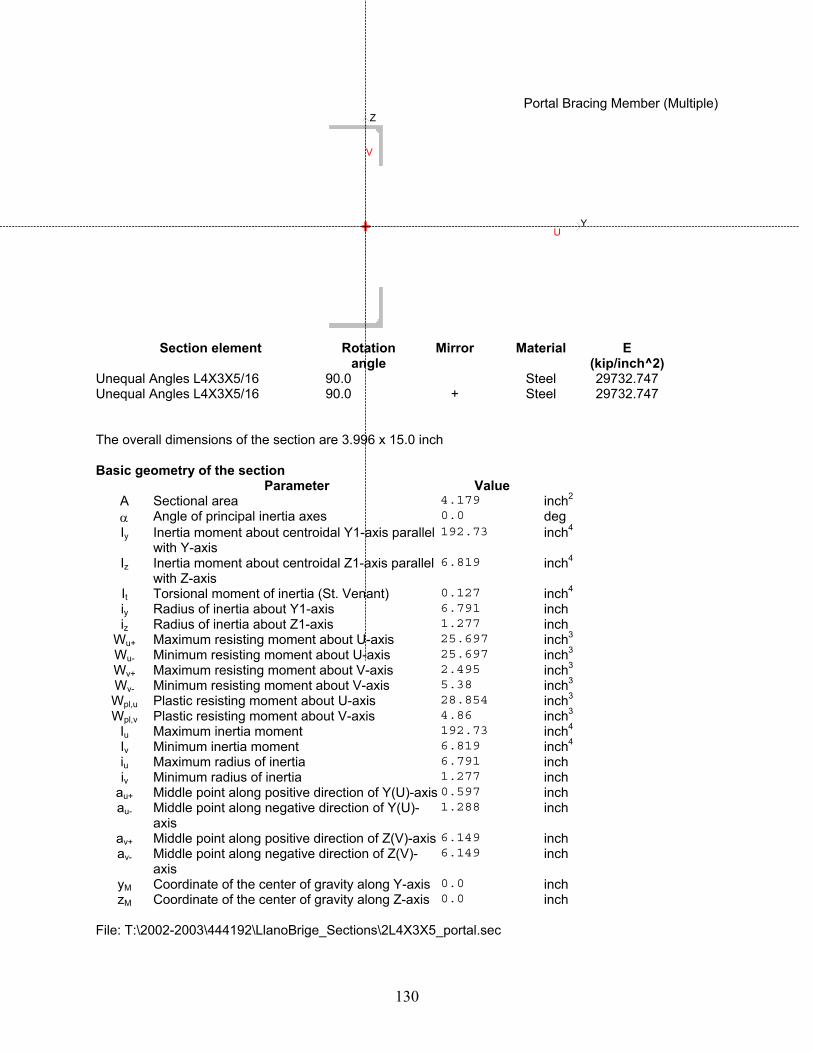
Portal Bracing Member (Multiple)
Section element Rotation angle
Mirror Material E (kip/inch^2)
Unequal Angles L4X3X5/16 90.0 Steel 29732.747 Unequal Angles L4X3X5/16 90.0 + Steel 29732.747 The overall dimensions of the section are 3.996 x 15.0 inch Basic geometry of the section
Parameter Value A Sectional area 4.179 inch2
α Angle of principal inertia axes 0.0 deg
Iy Inertia moment about centroidal Y1-axis parallel with Y-axis
192.73 inch4
Iz Inertia moment about centroidal Z1-axis parallel with Z-axis
6.819 inch4
It Torsional moment of inertia (St. Venant) 0.127 inch4
iy Radius of inertia about Y1-axis 6.791 inch
iz Radius of inertia about Z1-axis 1.277 inch
Wu+ Maximum resisting moment about U-axis 25.697 inch3
Wu- Minimum resisting moment about U-axis 25.697 inch3
Wv+ Maximum resisting moment about V-axis 2.495 inch3
Wv- Minimum resisting moment about V-axis 5.38 inch3
Wpl,u Plastic resisting moment about U-axis 28.854 inch3
Wpl,v Plastic resisting moment about V-axis 4.86 inch3
Iu Maximum inertia moment 192.73 inch4
Iv Minimum inertia moment 6.819 inch4
iu Maximum radius of inertia 6.791 inch
iv Minimum radius of inertia 1.277 inch
au+ Middle point along positive direction of Y(U)-axis 0.597 inch
au- Middle point along negative direction of Y(U)-axis
1.288 inch
av+ Middle point along positive direction of Z(V)-axis 6.149 inch
av- Middle point along negative direction of Z(V)-axis
6.149 inch
yM Coordinate of the center of gravity along Y-axis 0.0 inch
zM Coordinate of the center of gravity along Z-axis 0.0 inch
U
V
Z
Y
File: T:\2002-2003\444192\LlanoBrige_Sections\2L4X3X5_portal.sec
130
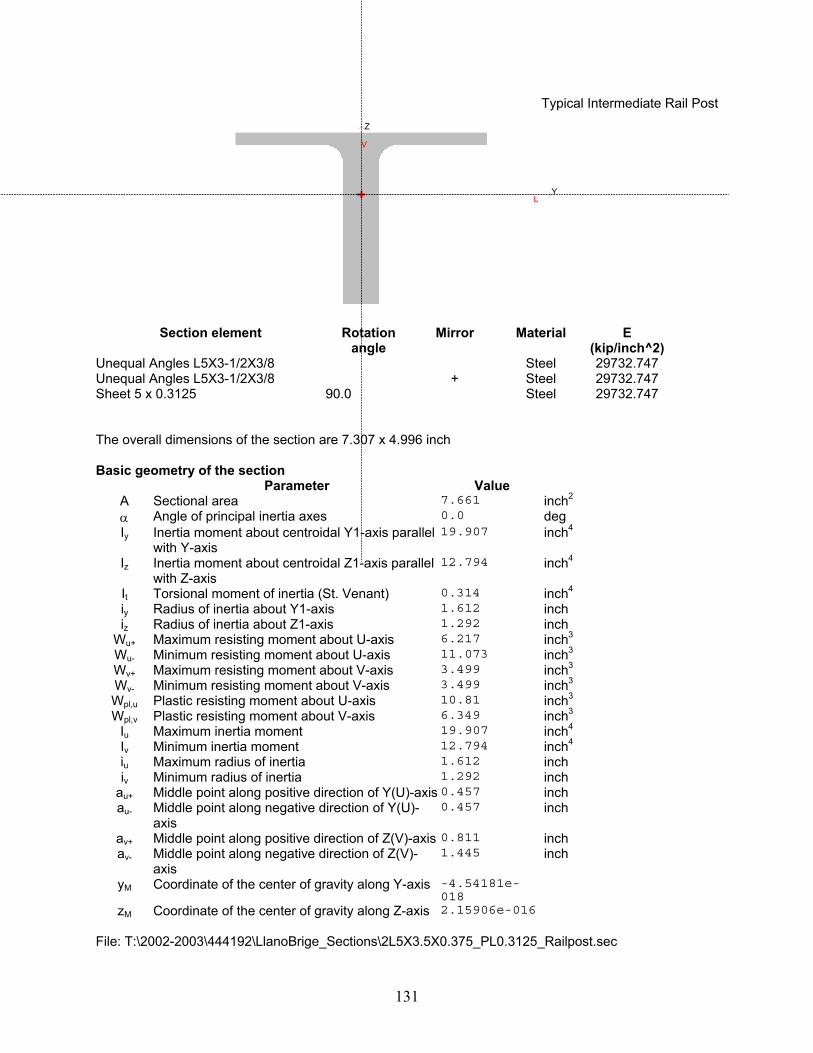
Typical Intermediate Rail Post
Section element Rotation angle
Mirror Material E (kip/inch^2)
Unequal Angles L5X3-1/2X3/8 Steel 29732.747 Unequal Angles L5X3-1/2X3/8 + Steel 29732.747 Sheet 5 x 0.3125 90.0 Steel 29732.747 The overall dimensions of the section are 7.307 x 4.996 inch Basic geometry of the section
Parameter Value A Sectional area 7.661 inch2
α Angle of principal inertia axes 0.0 deg
Iy Inertia moment about centroidal Y1-axis parallel with Y-axis
19.907 inch4
Iz Inertia moment about centroidal Z1-axis parallel with Z-axis
12.794 inch4
It Torsional moment of inertia (St. Venant) 0.314 inch4
iy Radius of inertia about Y1-axis 1.612 inch
iz Radius of inertia about Z1-axis 1.292 inch
Wu+ Maximum resisting moment about U-axis 6.217 inch3
Wu- Minimum resisting moment about U-axis 11.073 inch3
Wv+ Maximum resisting moment about V-axis 3.499 inch3
Wv- Minimum resisting moment about V-axis 3.499 inch3
Wpl,u Plastic resisting moment about U-axis 10.81 inch3
Wpl,v Plastic resisting moment about V-axis 6.349 inch3
Iu Maximum inertia moment 19.907 inch4
Iv Minimum inertia moment 12.794 inch4
iu Maximum radius of inertia 1.612 inch
iv Minimum radius of inertia 1.292 inch
au+ Middle point along positive direction of Y(U)-axis 0.457 inch
au- Middle point along negative direction of Y(U)-axis
0.457 inch
av+ Middle point along positive direction of Z(V)-axis 0.811 inch
av- Middle point along negative direction of Z(V)-axis
1.445 inch
yM Coordinate of the center of gravity along Y-axis -4.54181e-018
zM Coordinate of the center of gravity along Z-axis 2.15906e-016
U
V
Z
Y
File: T:\2002-2003\444192\LlanoBrige_Sections\2L5X3.5X0.375_PL0.3125_Railpost.sec
131
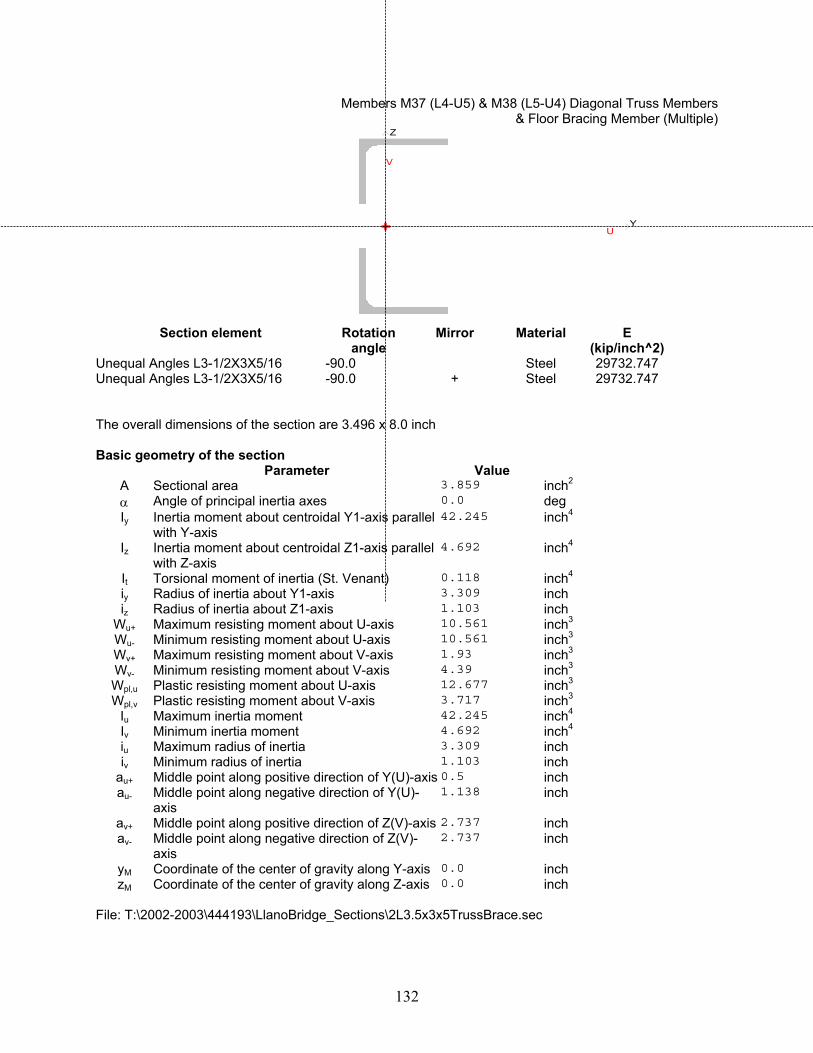
132
U
V
Z
Y
Members M37 (L4-U5) & M38 (L5-U4) Diagonal Truss Members & Floor Bracing Member (Multiple)
Section element Rotation angle
Mirror Material E (kip/inch^2)
Unequal Angles L3-1/2X3X5/16 -90.0 Steel 29732.747 Unequal Angles L3-1/2X3X5/16 -90.0 + Steel 29732.747 The overall dimensions of the section are 3.496 x 8.0 inch Basic geometry of the section
Parameter Value A Sectional area 3.859 inch2
α Angle of principal inertia axes 0.0 deg
Iy Inertia moment about centroidal Y1-axis parallel with Y-axis
42.245 inch4
Iz Inertia moment about centroidal Z1-axis parallel with Z-axis
4.692 inch4
It Torsional moment of inertia (St. Venant) 0.118 inch4
iy Radius of inertia about Y1-axis 3.309 inch
iz Radius of inertia about Z1-axis 1.103 inch
Wu+ Maximum resisting moment about U-axis 10.561 inch3
Wu- Minimum resisting moment about U-axis 10.561 inch3
Wv+ Maximum resisting moment about V-axis 1.93 inch3
Wv- Minimum resisting moment about V-axis 4.39 inch3
Wpl,u Plastic resisting moment about U-axis 12.677 inch3
Wpl,v Plastic resisting moment about V-axis 3.717 inch3
Iu Maximum inertia moment 42.245 inch4
Iv Minimum inertia moment 4.692 inch4
iu Maximum radius of inertia 3.309 inch
iv Minimum radius of inertia 1.103 inch
au+ Middle point along positive direction of Y(U)-axis 0.5 inch
au- Middle point along negative direction of Y(U)-axis
1.138 inch
av+ Middle point along positive direction of Z(V)-axis 2.737 inch
av- Middle point along negative direction of Z(V)-axis
2.737 inch
yM Coordinate of the center of gravity along Y-axis 0.0 inch
zM Coordinate of the center of gravity along Z-axis 0.0 inch
File: T:\2002-2003\444193\LlanoBridge_Sections\2L3.5x3x5TrussBrace.sec
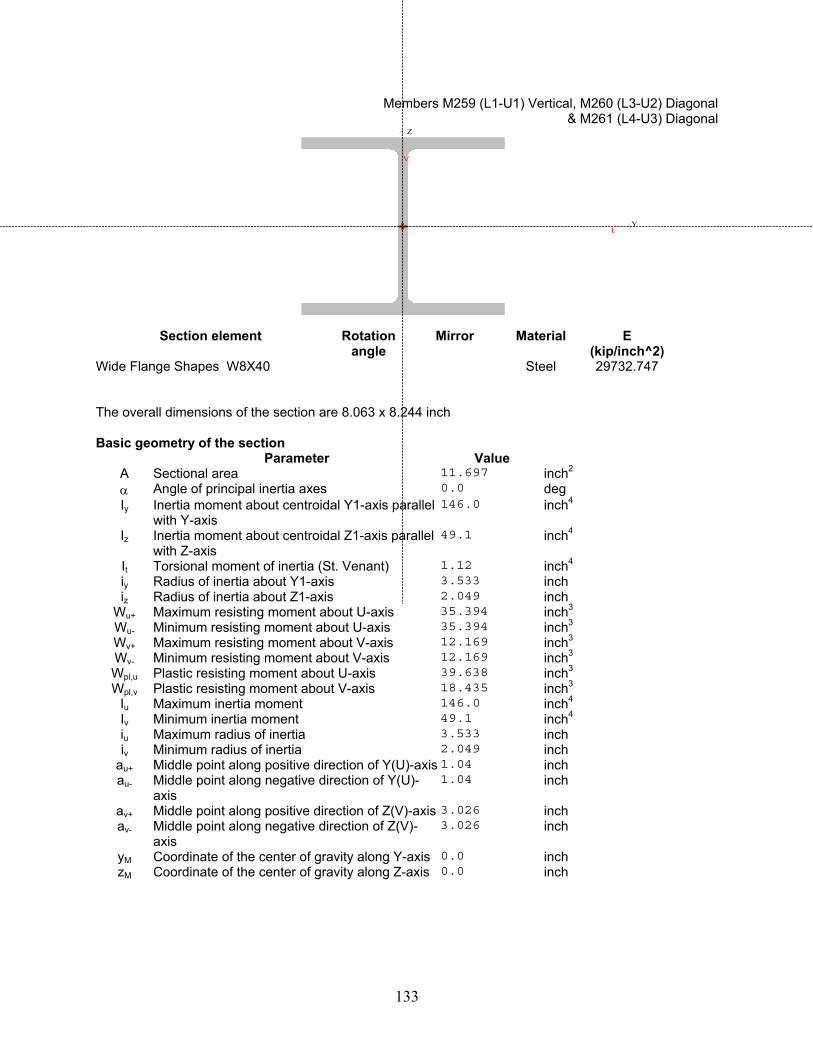
Members M259 (L1-U1) Vertical, M260 (L3-U2) Diagonal
133
U
V
Z
Y
inch3
Wu- Minimum resisting moment about U-axis 35.394 inch3
Wv+ Maximum resisting moment about V-axis 12.169 inch3
Wv- Minimum resisting moment about V-axis 12.169 inch3
Wpl,u 39.638 inch3
Wpl,v Plastic resisting moment about V-axis 18.435 inch3
Iu Maximum inertia moment 146.0 inch4
Iv 49.1 inch4
iu Maximum radius of inertia inch
iv inch
au+ Middle point along positive direction of Y(U)-axis inch
au- Middle point along negative direction of Y(U)-axis
inch
av+ 3.026 inch
av- inch
yM 0.0 zM Coordinate of the center of gravity along Z-axis
& M261 (L4-U3) Diagonal
Section element Rotation angle
Mirror Material E (kip/inch^2)
Wide Flange Shapes W8X40 Steel 29732.747 The overall dimensions of the section are 8.063 x 8.244 inch Basic geometry of the section
Parameter Value A Sectional area 11.697 inch2
α Angle of principal inertia axes 0.0 deg
Iy Inertia moment about centroidal Y1-axis parallel with Y-axis
146.0 inch4
Iz Inertia moment about centroidal Z1-axis parallel with Z-axis
49.1 inch4
It Torsional moment of inertia (St. Venant) 1.12 inch4
iy Radius of inertia about Y1-axis 3.533 inch
iz Radius of inertia about Z1-axis 2.049 inch
Wu+ Maximum resisting moment about U-axis 35.394
Plastic resisting moment about U-axis
Minimum inertia moment 3.533
Minimum radius of inertia 2.049 1.04 1.04
Middle point along positive direction of Z(V)-axisMiddle point along negative direction of Z(V)-axis
3.026
Coordinate of the center of gravity along Y-axis inch
0.0 inch
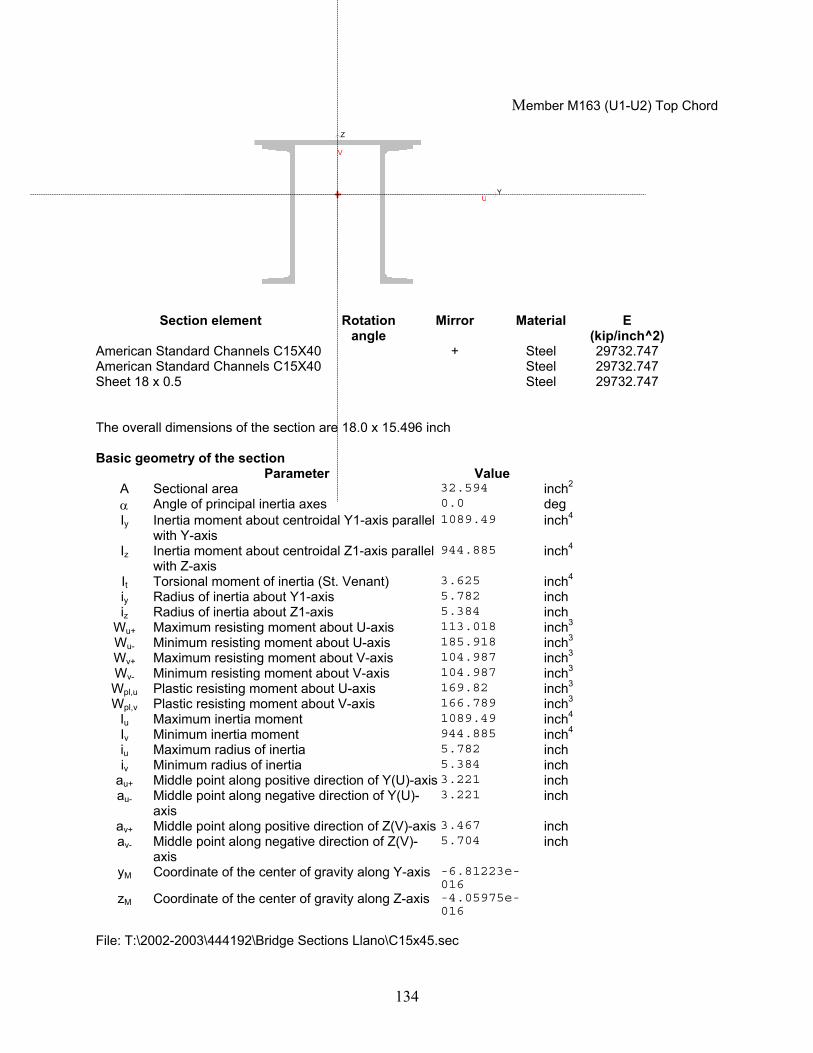
Member M163 (U1-U2) Top Chord
Section element Mirror Material E (kip/inch^2)
Steel
29732.747
Value 32.594 inch2
Angle of principal inertia axes 0.0 deg
Iy 1089.49 inch4
Iz 944.885 inch4
It Torsional moment of inertia (St. Venant) 3.625 inch4
iy 5.782 i 5.384
Wpl,v 166.789 inch3
Iu Maximum inertia moment 1089.49 inch4
Iv 944.885 inch4
iu inch
iv 5.384 au+ Middle point along positive direction of Y(U)-axisau-
av+av- 5.704
yM Coordinate of the center of gravity along Y-axis
zM Coordinate of the center of gravity along Z-axis
Rotation
angle American Standard Channels C15X40 + 29732.747 American Standard Channels C15X40 Steel 29732.747 Sheet 18 x 0.5 Steel
The overall dimensions of the section are 18.0 x 15.496 inch Basic geometry of the section
Parameter A Sectional area α
Inertia moment about centroidal Y1-axis parallel with Y-axis Inertia moment about centroidal Z1-axis parallel with Z-axis
Radius of inertia about Y1-axis inch
zW
Radius of inertia about Z1-axis inch
u+ Maximum resisting moment about U-axis 113.018 inch3
Wu- Minimum resisting moment about U-axis 185.918 inch3
Wv+ Maximum resisting moment about V-axis 104.987 inch3
Wv- Minimum resisting moment about V-axis 104.987 inch3
Wpl,u Plastic resisting moment about U-axis 169.82 inch3
Plastic resisting moment about V-axis
Minimum inertia moment Maximum radius of inertia 5.782 Minimum radius of inertia inch
3.221 inch
Middle point along negative direction of Y(U)-axis
3.221 inch
Middle point along positive direction of Z(V)-axis 3.467 inch
Middle point along negative direction of Z(V)-axis
inch
-6.81223e-016
-4.05975e-016
U
V
Z
Y
File: T:\2002-2003\444192\Bridge Sections Llano\C15x45.sec
134
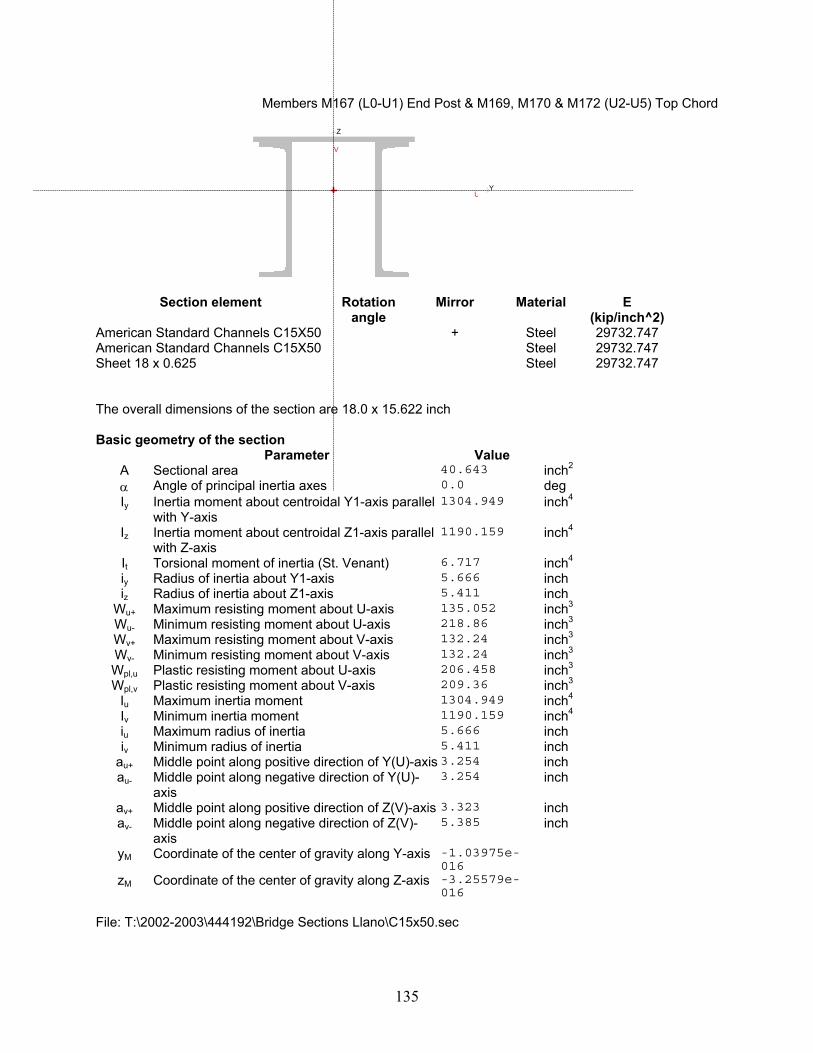
Members M167 (L0-U1) End Post & M169, M170 & M172 (U2-U5) Top Chord
Section element E (kip/inch^2)
+ American Standard Channels C15X50 29732.747
Basic geometry of the section
40.643 inch2
Angle of principal inertia axes Iy 1304.949 inch4
Iz 1190.159 inch4
It Torsional moment of inertia (St. Venant) 6.717 inch4
iy Radius of inertia about Y1-axis 5.666 inch
iz Radius of inertia about Z1-axis 5.411 inch
Wu+ Maximum resisting moment about U-axis 135.052 inch3
Wu- 218.86 inch3
Wv+ Maximum resisting moment about V-axis 132.24 inch3
Wv- 132.24 inch3
Wpl,u Plastic resisting moment about U-axis 206.458 inch3
Wpl,v Plastic resisting moment about V-axis 209.36 inch3
Iu 1304.949 inch4
Iv 1190.159 inch4
iu Maximum radius of inertia inch
iv Minimum radius of inertia inch
au+ Middle point along positive direction of Y(U)-axis inch
au- Middle point along negative direction of Y(U)-axis
inch
av+ Middle point along positive direction of Z(V)-axisav- Middle point along negative direction of Z(V)-
axis yM
zM
Rotation angle
Mirror Material
American Standard Channels C15X50 Steel 29732.747 Steel
Sheet 18 x 0.625 Steel 29732.747
The overall dimensions of the section are 18.0 x 15.622 inch
Parameter Value A Sectional area α 0.0 deg
Inertia moment about centroidal Y1-axis parallel with Y-axis Inertia moment about centroidal Z1-axis parallel with Z-axis
Minimum resisting moment about U-axis
Minimum resisting moment about V-axis
Maximum inertia moment Minimum inertia moment
5.666 5.411 3.254 3.254
3.323 inch
5.385 inch
Coordinate of the center of gravity along Y-axis -1.03975e-016
Coordinate of the center of gravity along Z-axis -3.25579e-016
U
V
Z
Y
File: T:\2002-2003\444192\Bridge Sections Llano\C15x50.sec
135
136
and Analysis Results
State Highway 16, Roy B. Inks Bridge over Llano River
Three-Dimensional RISA-3D Structural Model

137
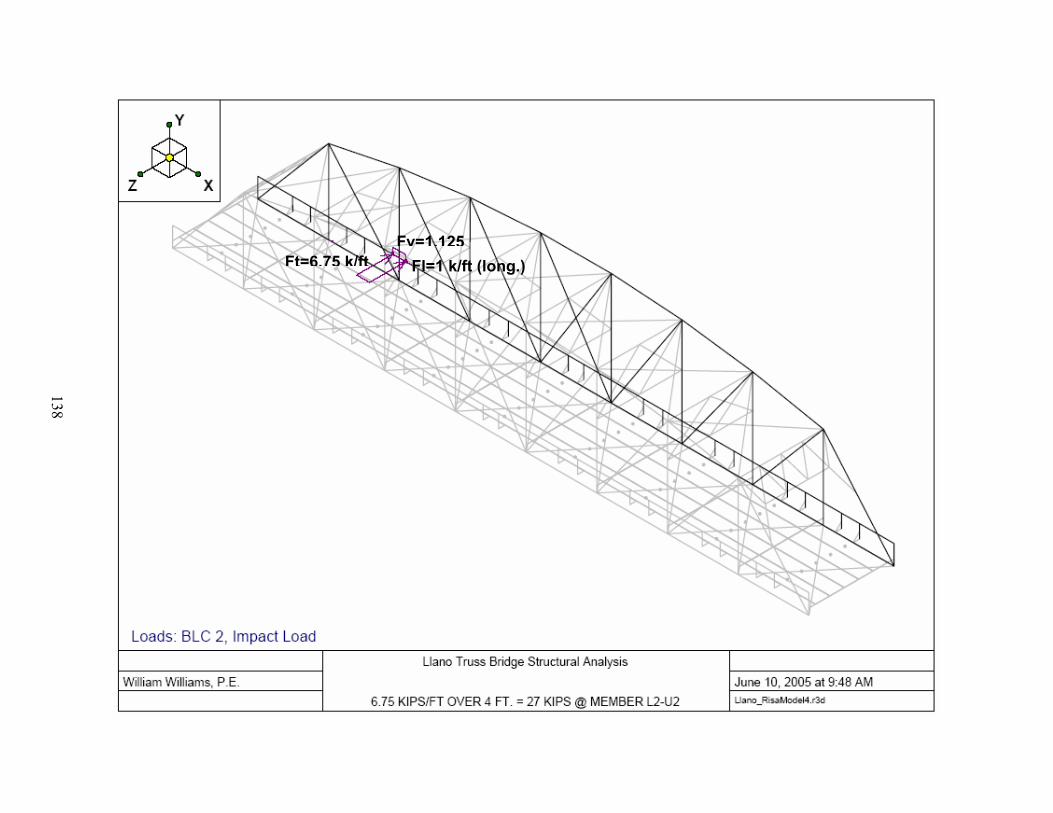
Fv=1.125Ft=6.75 k/ft Fl=1 k/ft (long.)
138

139
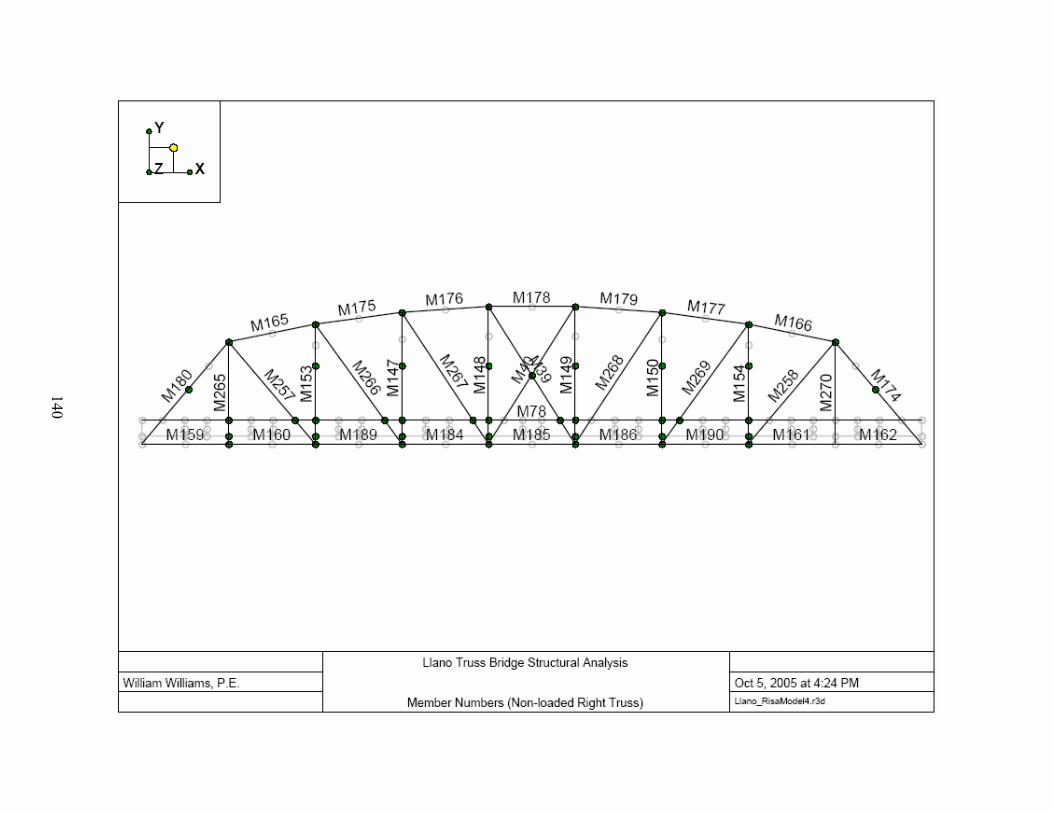
140

State Highway 16, Roy B. Inks Bridge over Llano River
and Analysis Results
Load Applied at First Truss Member (Node 1)
Three-Dimensional RISA-3D Structural Model
141
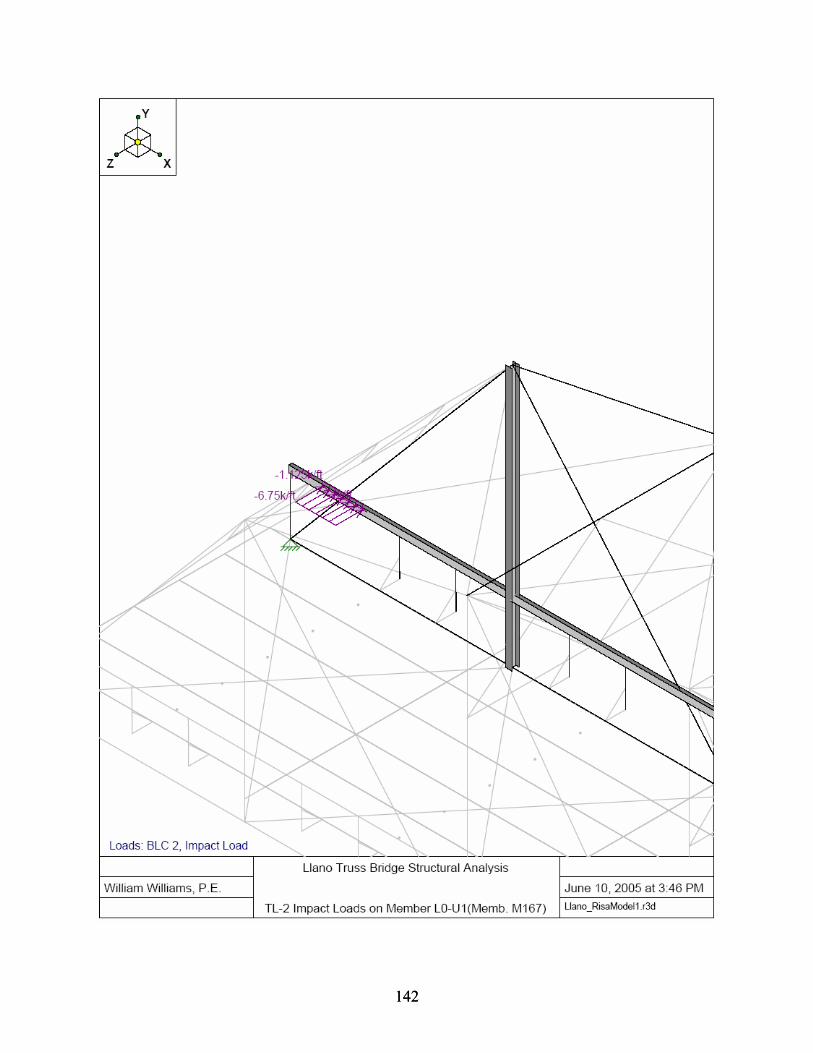
142 142
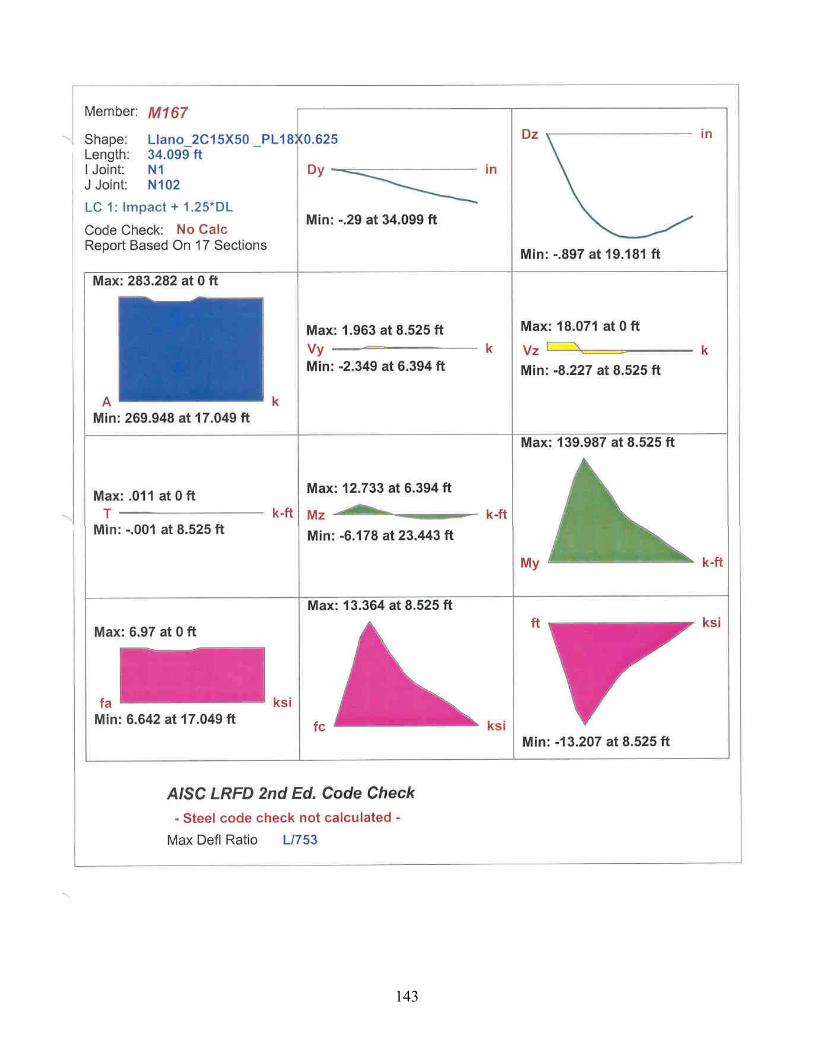
143
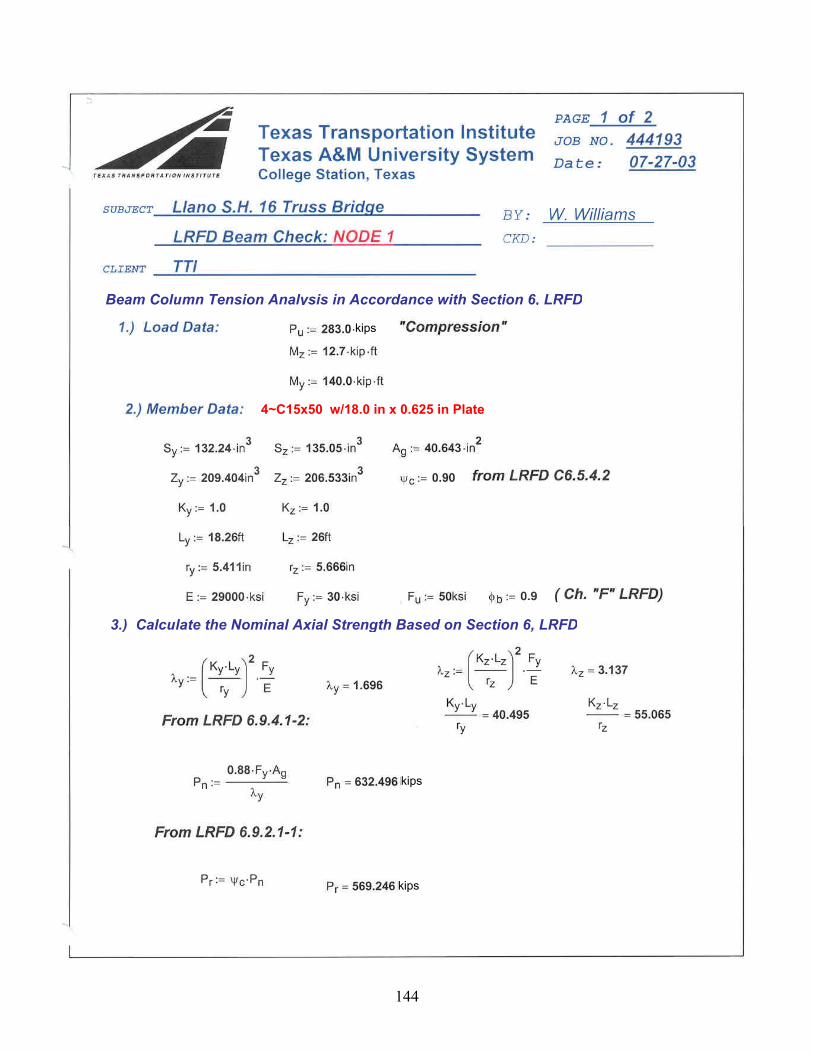
kips
4~C15x50 w/18.0 in x 0.625 in Plate
Beam Column Tension Analysis in Accordance with Section 6, LRFD
3.) Calculate the Nominal Axial Strength Based on Section 6, LRFDkips
kips
144
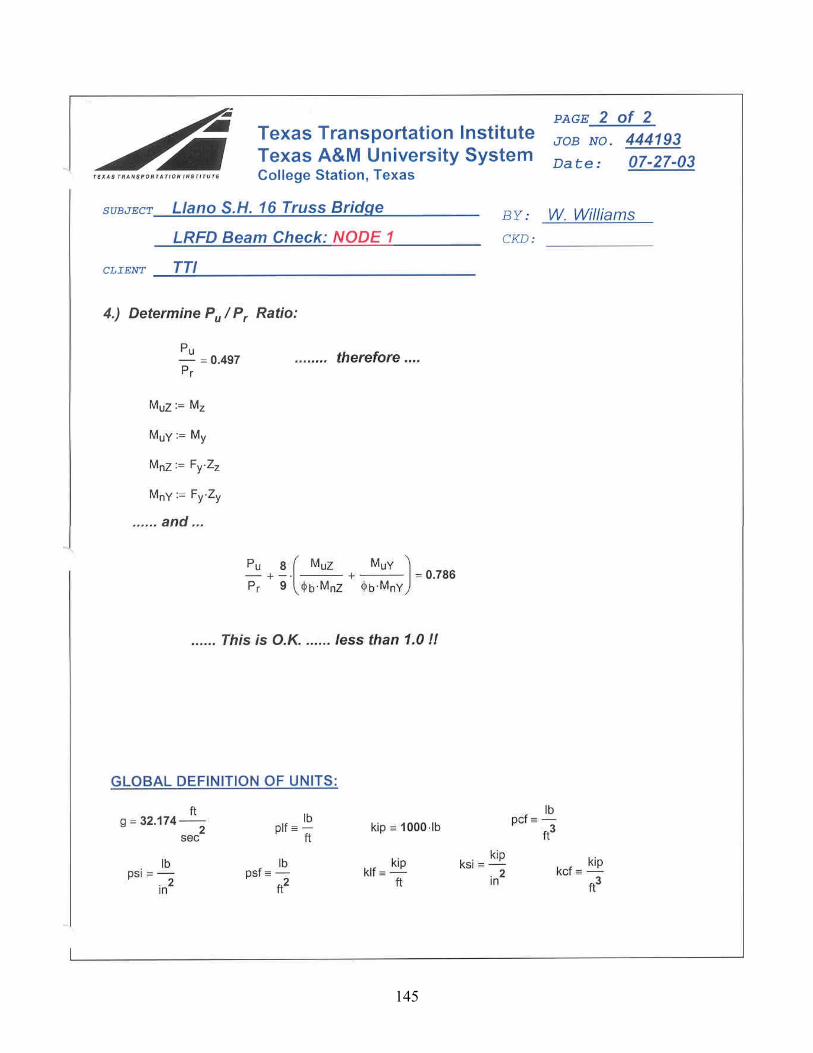
145
Load Applied at Second Truss Member (Node 2)
State Highway 16, Roy B. Inks Bridge over Llano River
Three-Dimensional RISA-3D Structural Model and Analysis Results
146
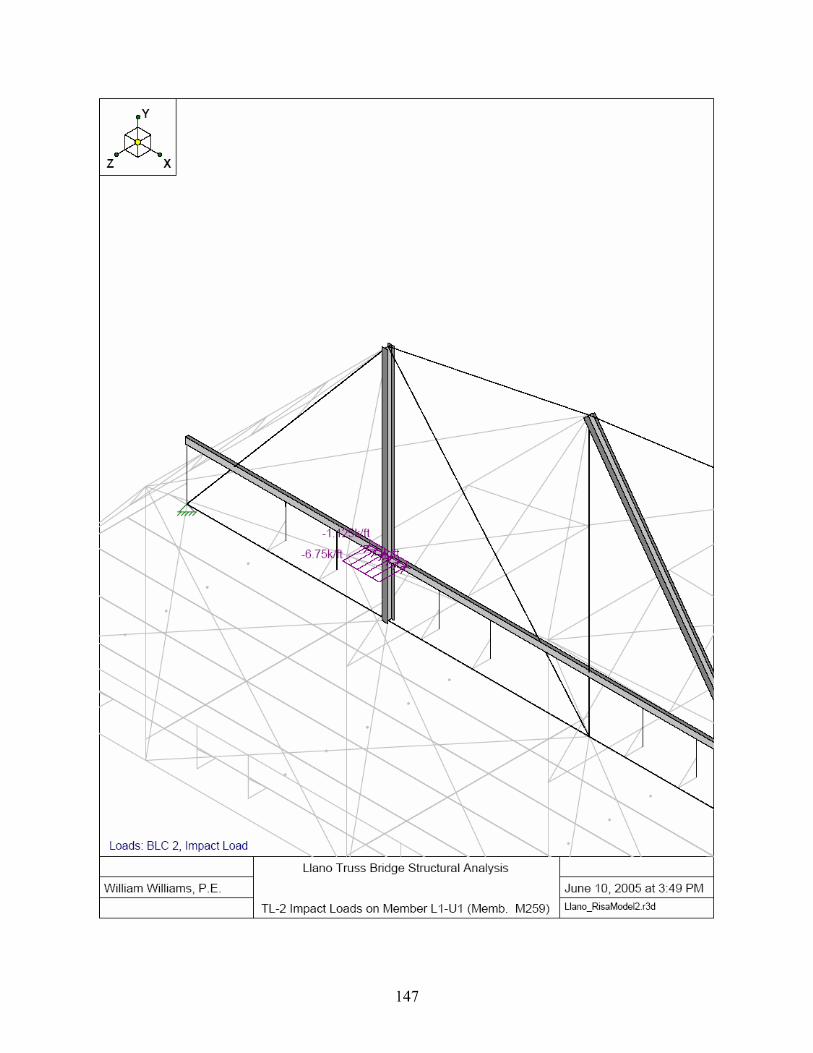
147
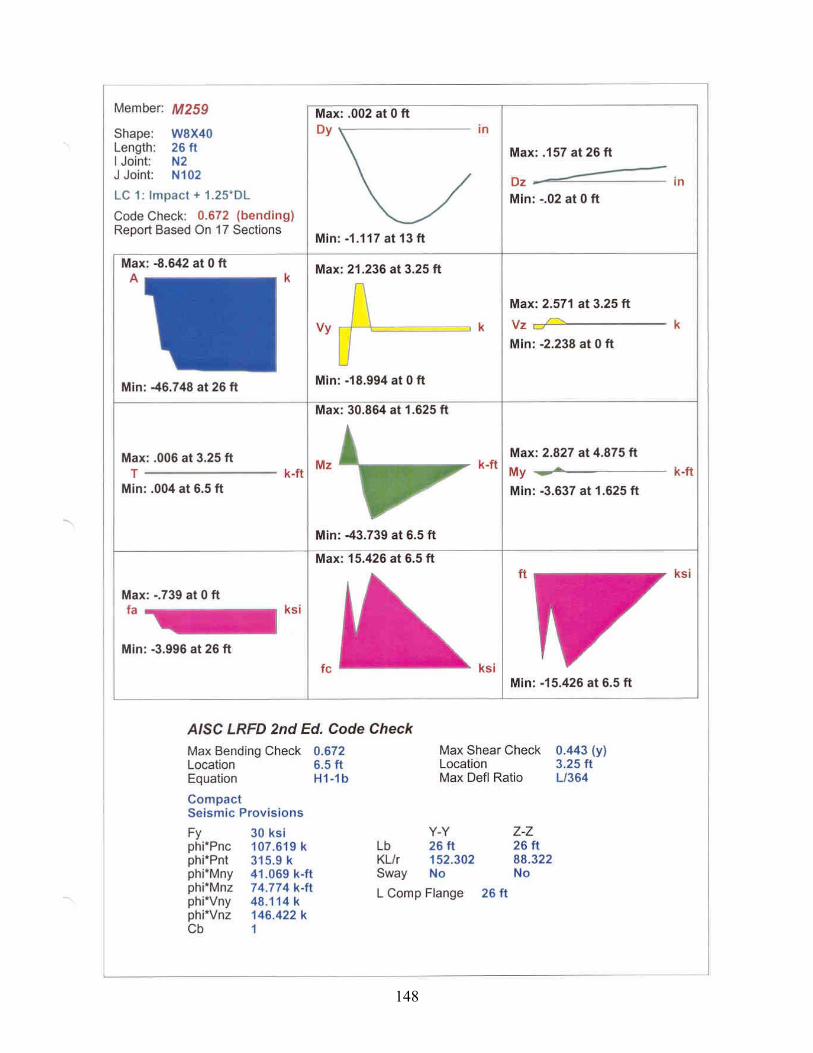
148
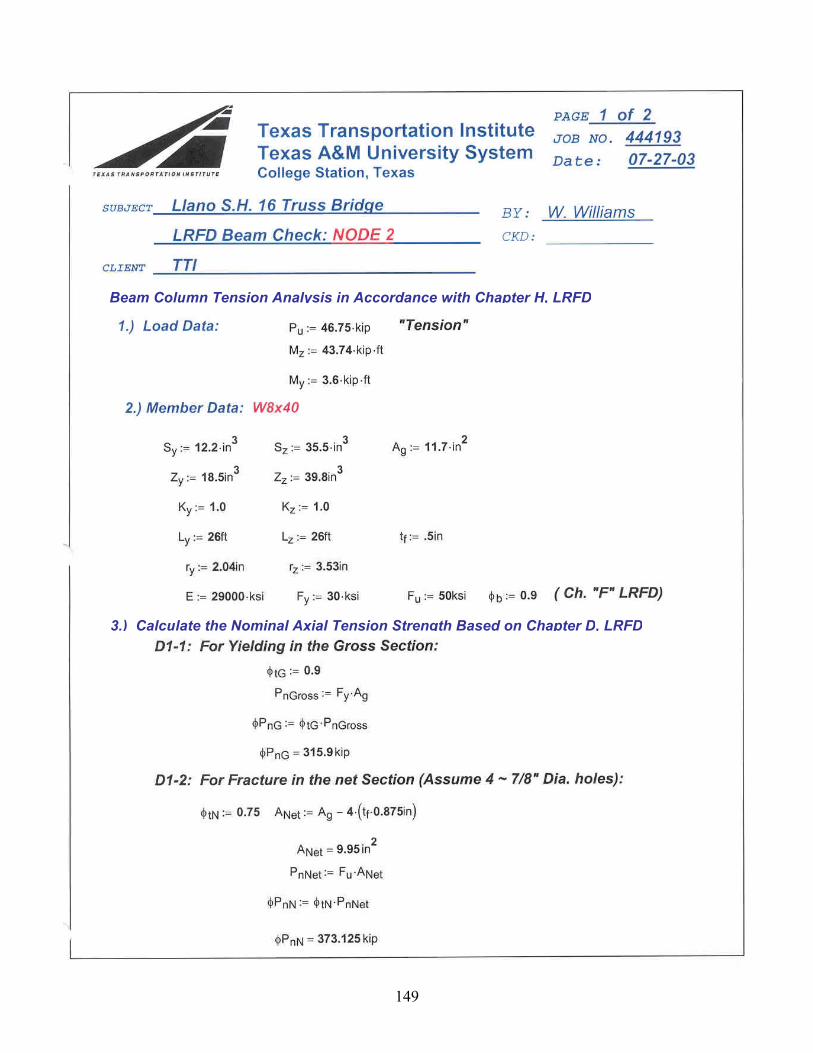
Beam Column Tension Analysis in Accordance with Chapter H, LRFD
3.) Calculate the Nominal Axial Tension Strength Based on Chapter D, LRFD149
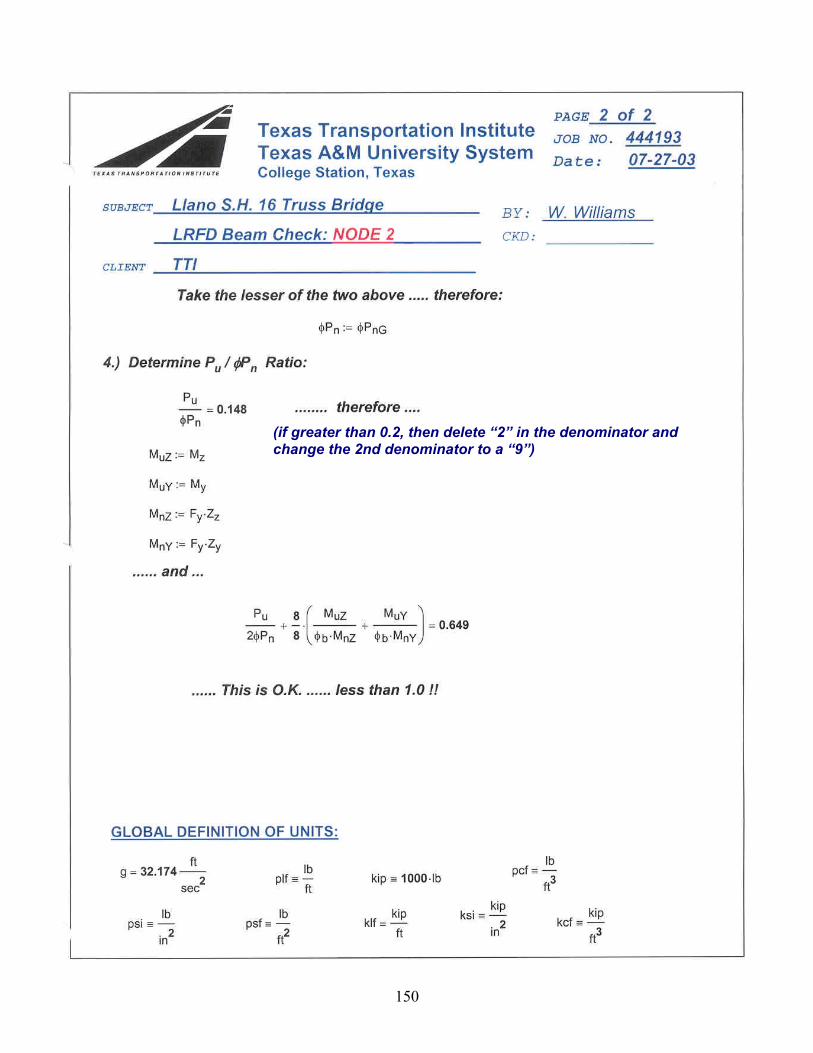
(if greater than 0.2, then delete “2” in the denominator and change the 2nd denominator to a “9”)
150
State Highway 16, Roy B. Inks Bridge over Llano River
Load Applied at Third Truss Member (Node 3)
Three-Dimensional RISA-3D Structural Model
and Analysis Results
151
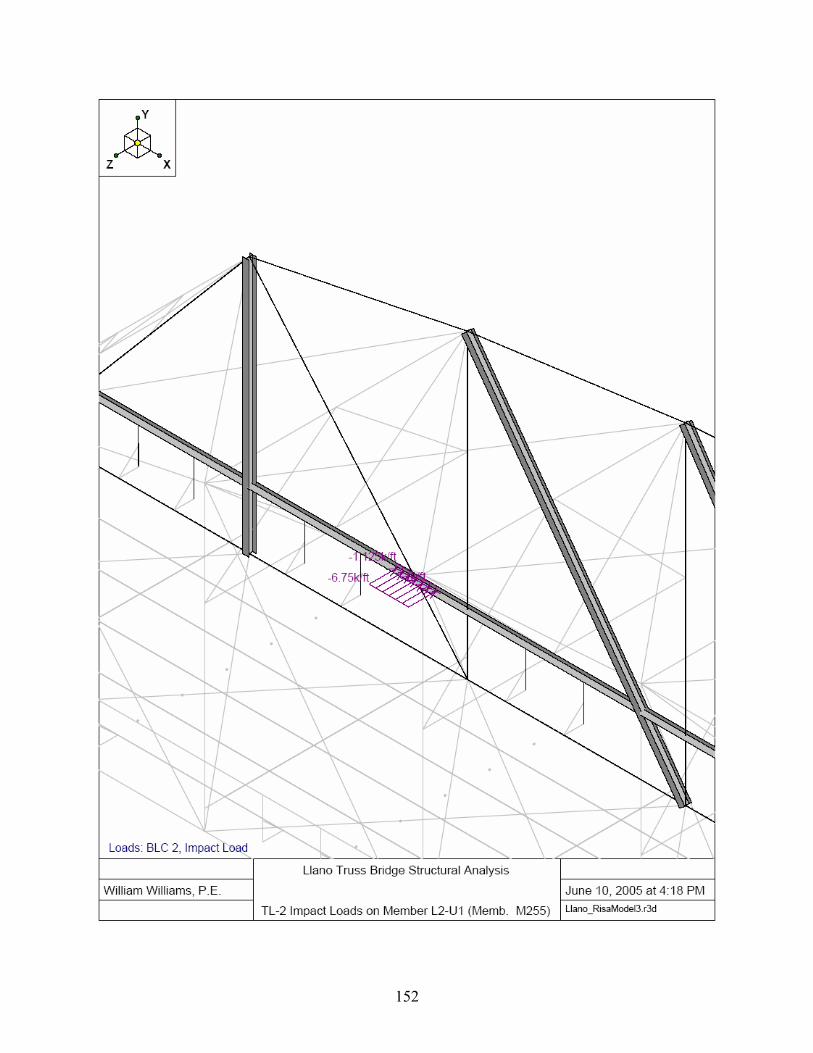
152
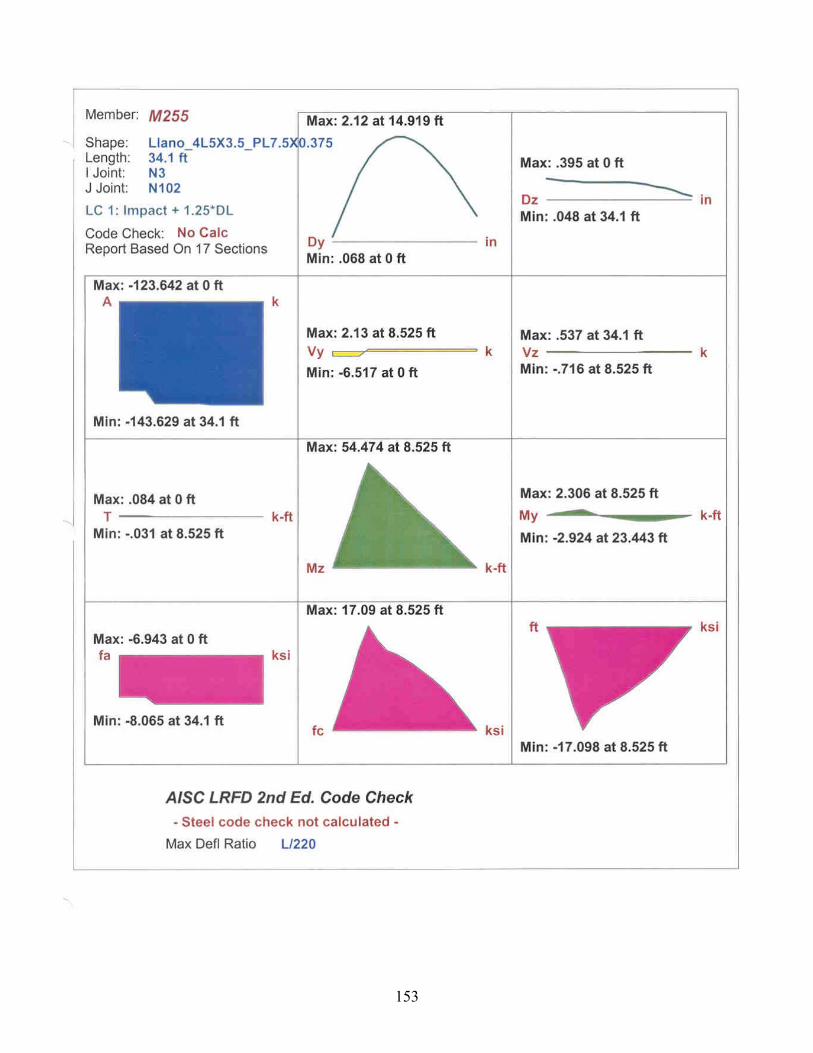
153

Beam Column Tension Analysis in Accordance with Chapter H, LRFD
3.) Calculate the Nominal Axial Tension Strength Based on Chapter D, LRFD
154
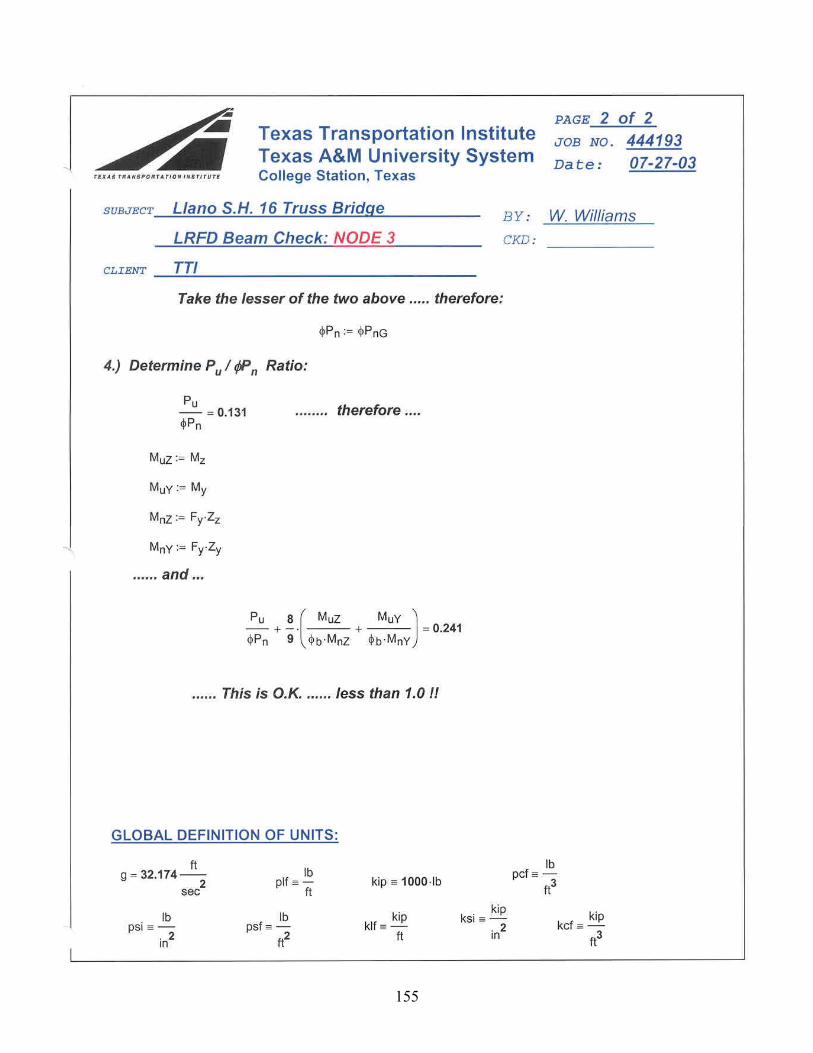
155
State Highway 16, Roy B. Inks Bridge over Llano River
Load Applied at Fourth Truss Member (Node 4)
Three-Dimensional RISA-3D Structural Model
and Analysis Results
156
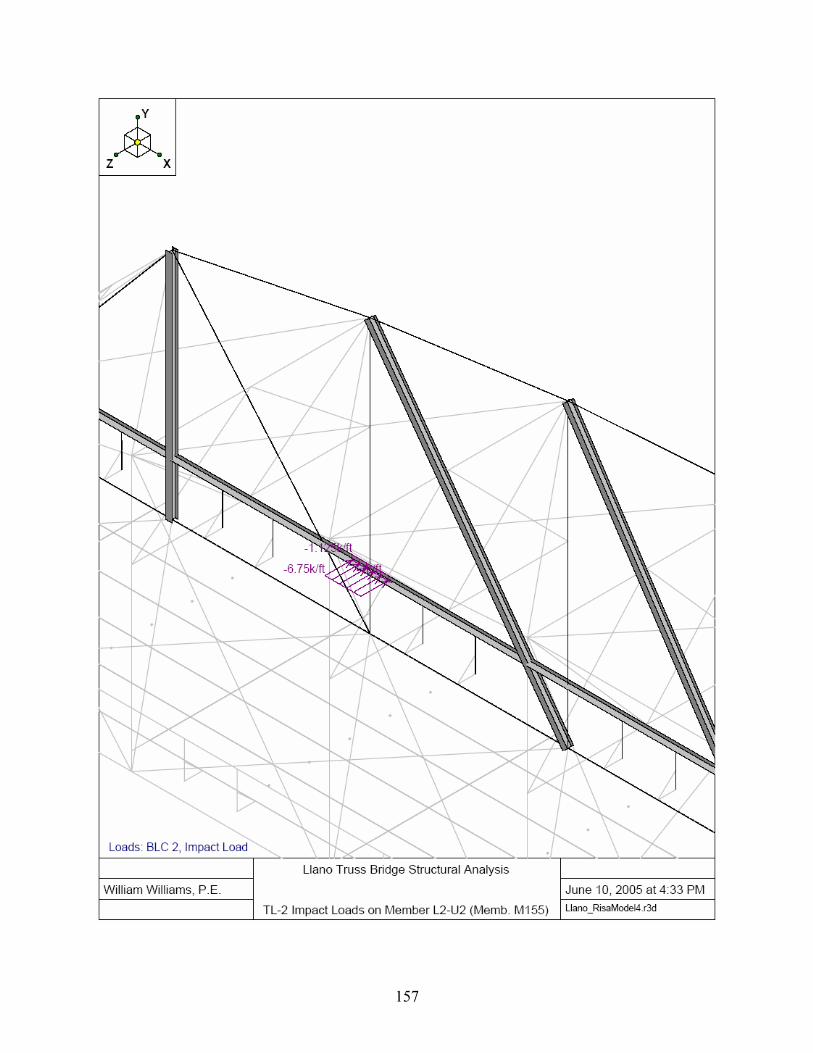
157
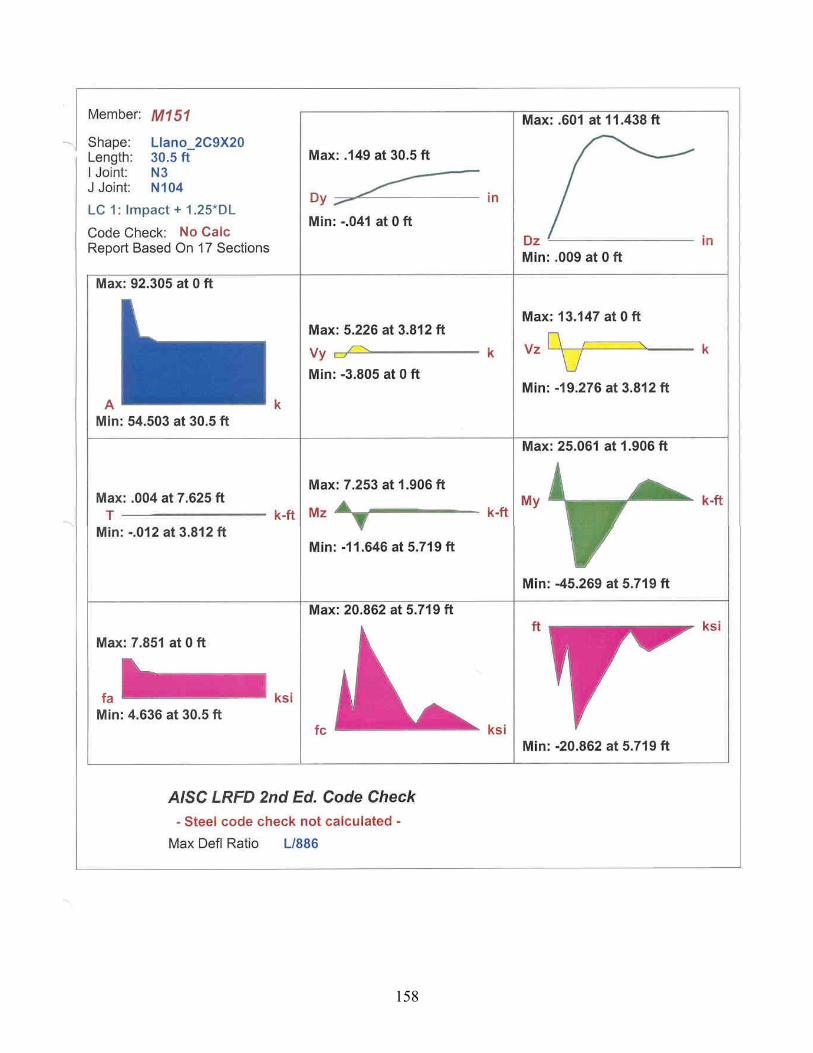
158

Beam Column Tension Analysis in Accordance with Section 6, LRFD
3.) Calculate the Nominal Axial Strength Based on Section 6, LRFD
159

160
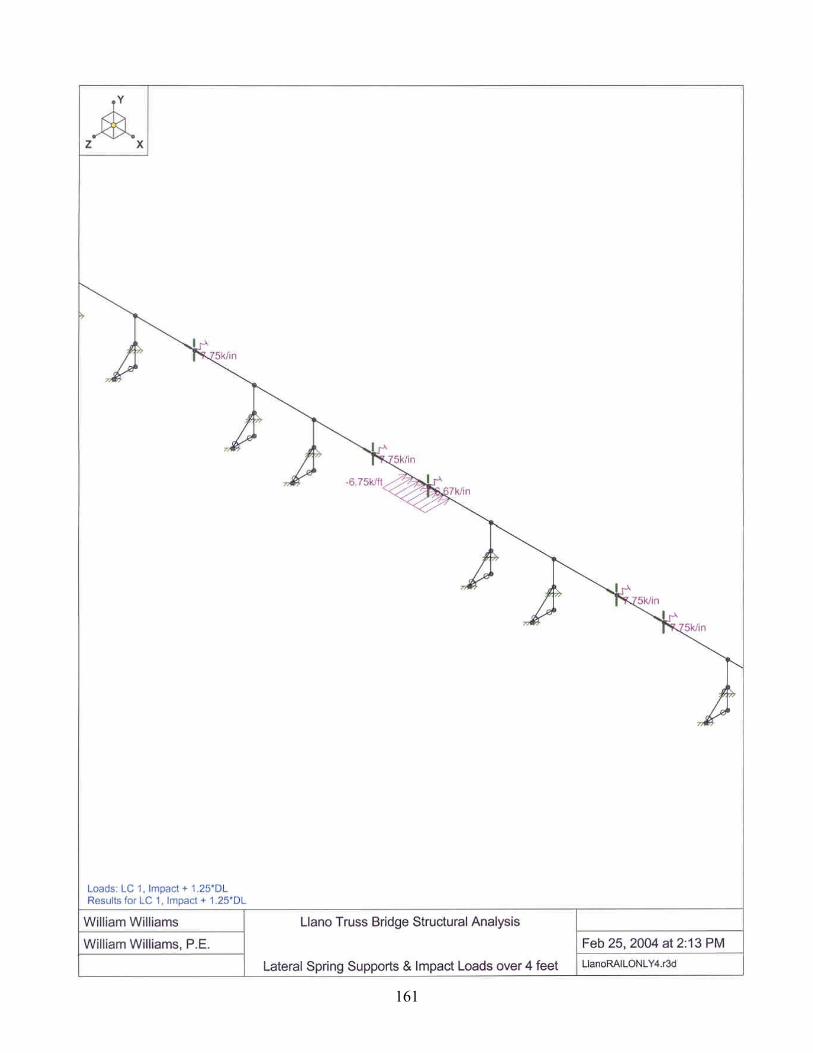
161
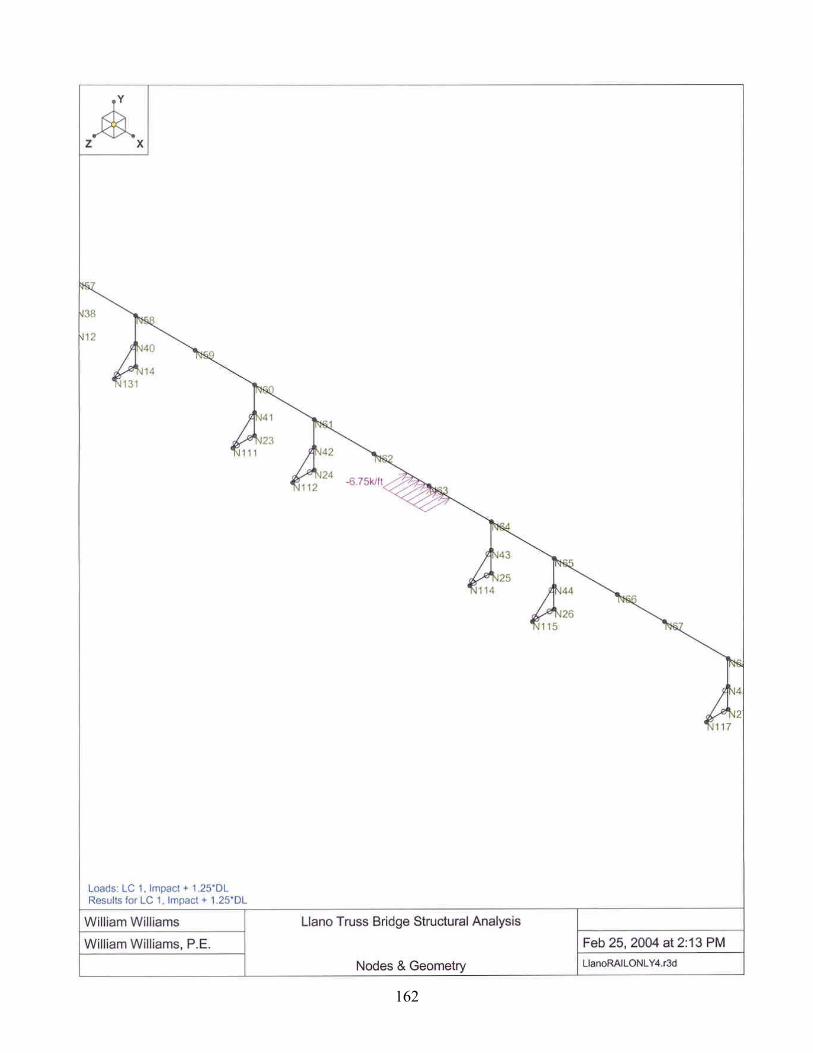
162
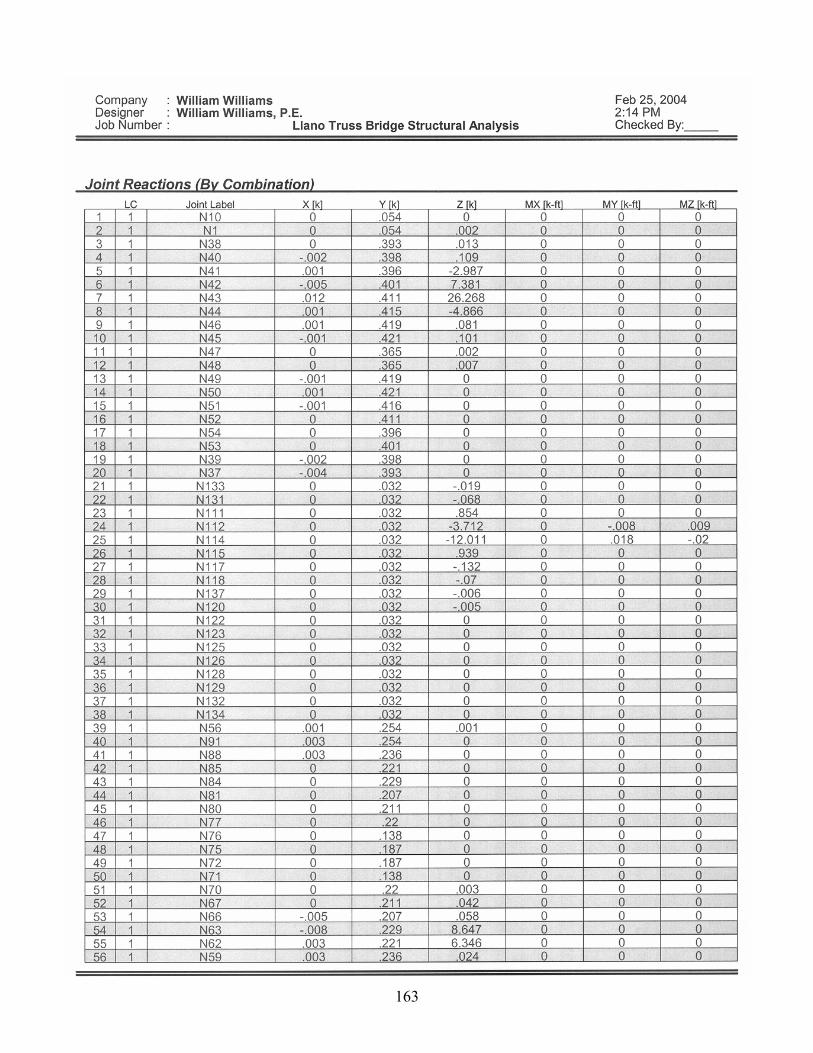
163
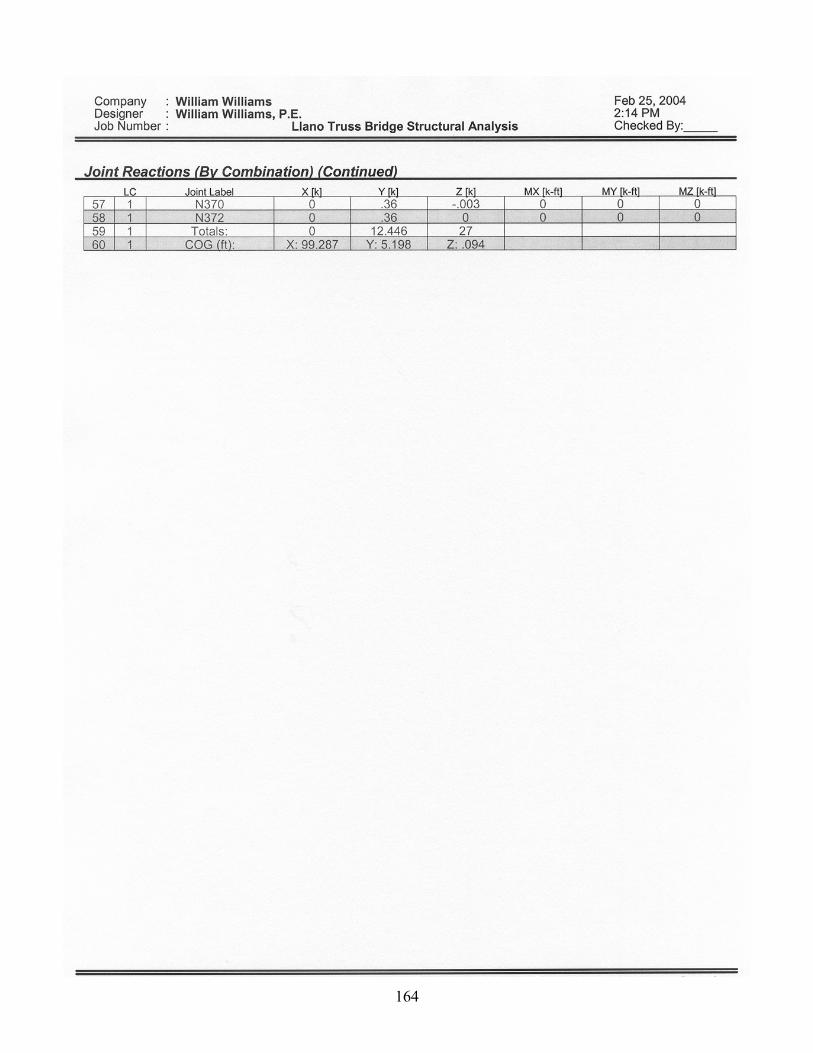
164
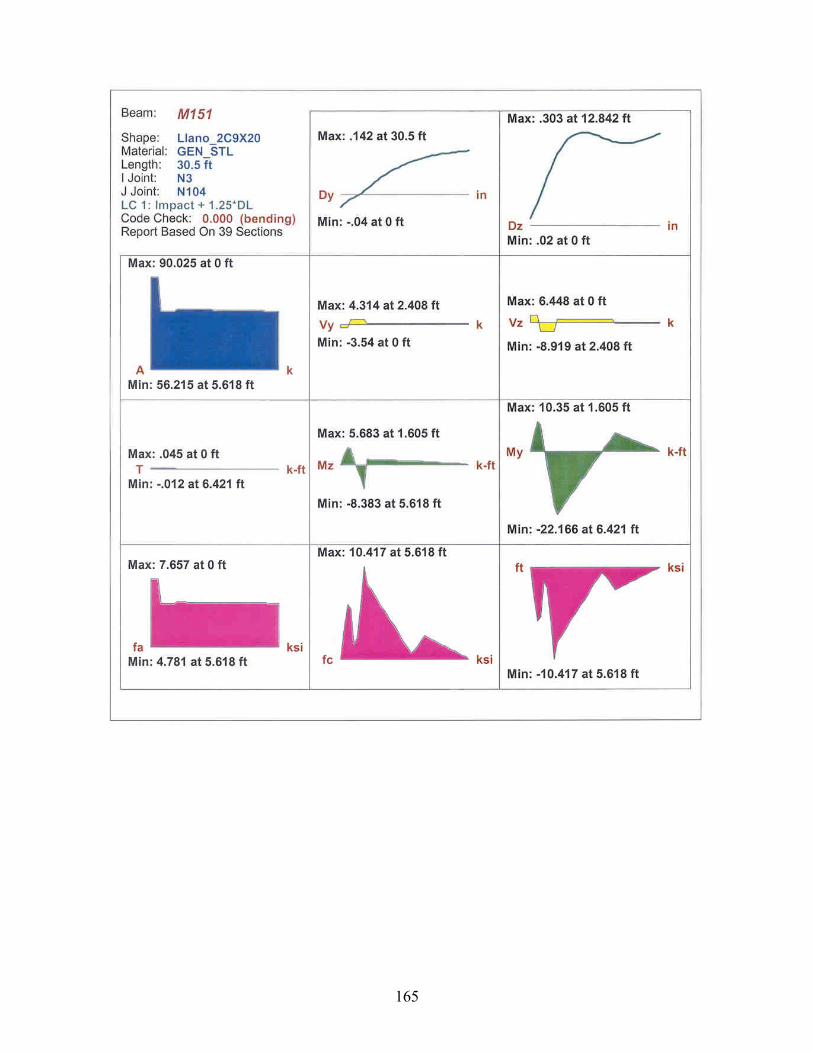
165
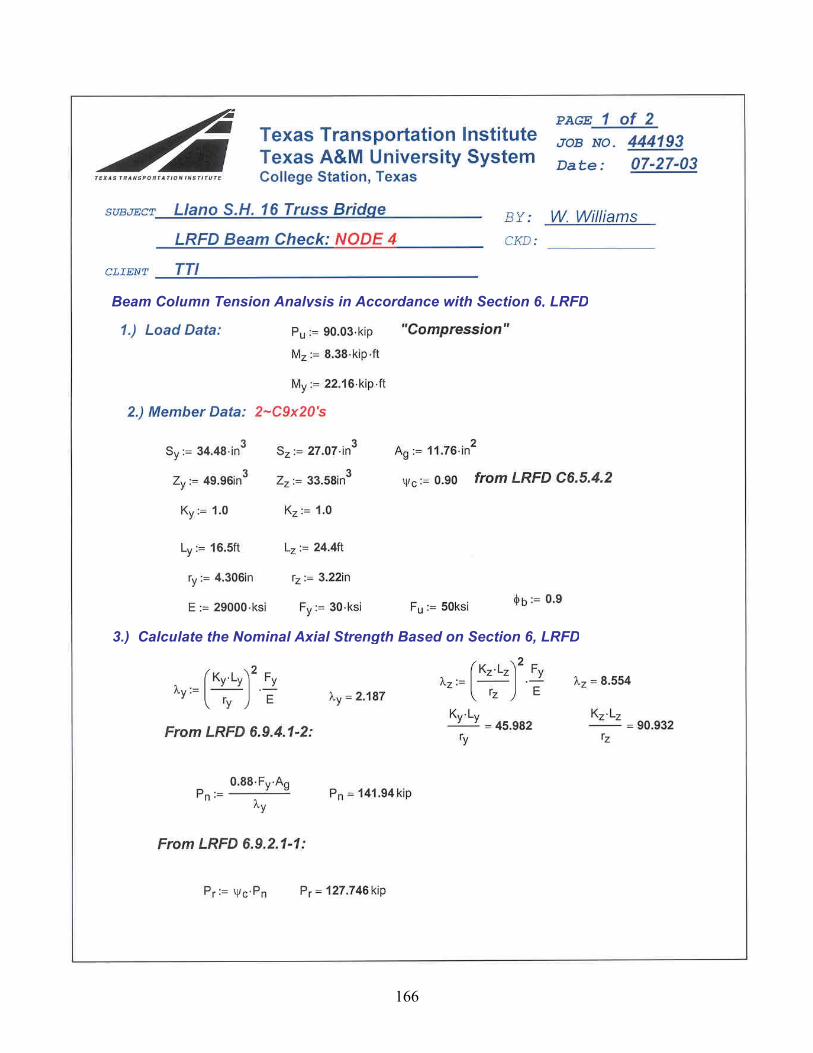
3.) Calculate the Nominal Axial Strength Based on Section 6, LRFD
Beam Column Tension Analysis in Accordance with Section 6, LRFD
166

167
State Highway 16, Roy B. Inks Bridge over Llano River
Three-Dimensional RISA-3D Structural Model and Analysis Results
Load Applied at Fifth Truss Member (Node 5)
168
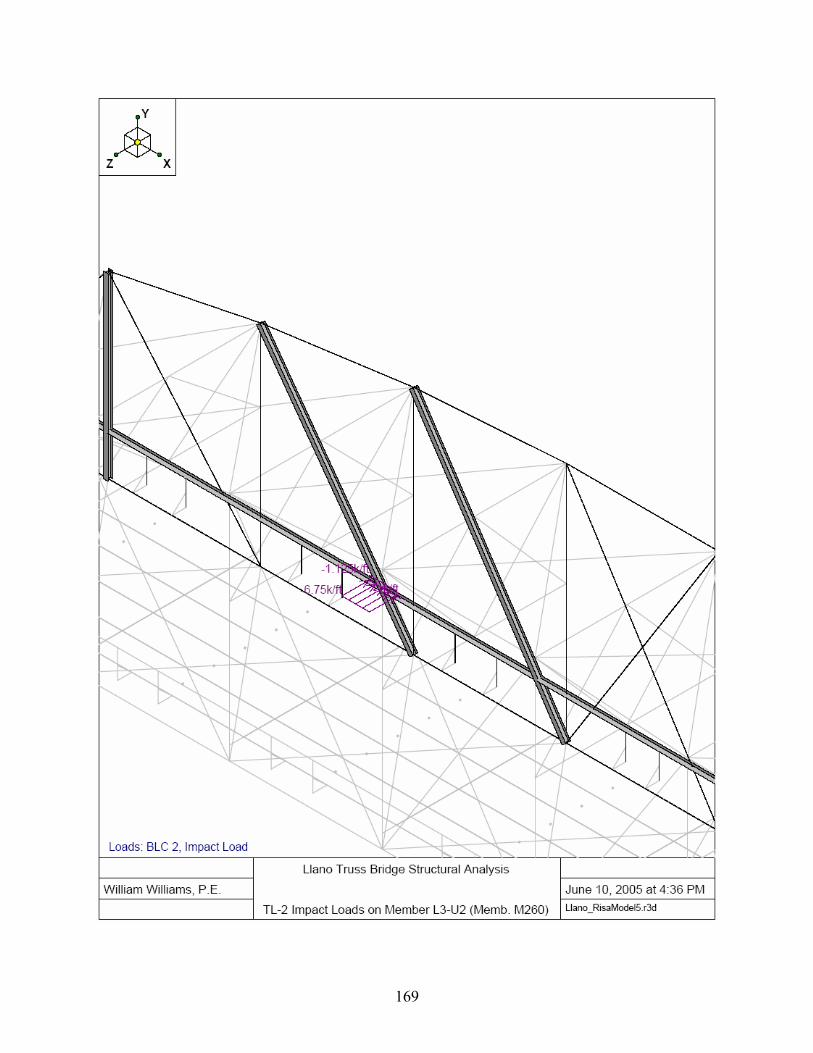
169
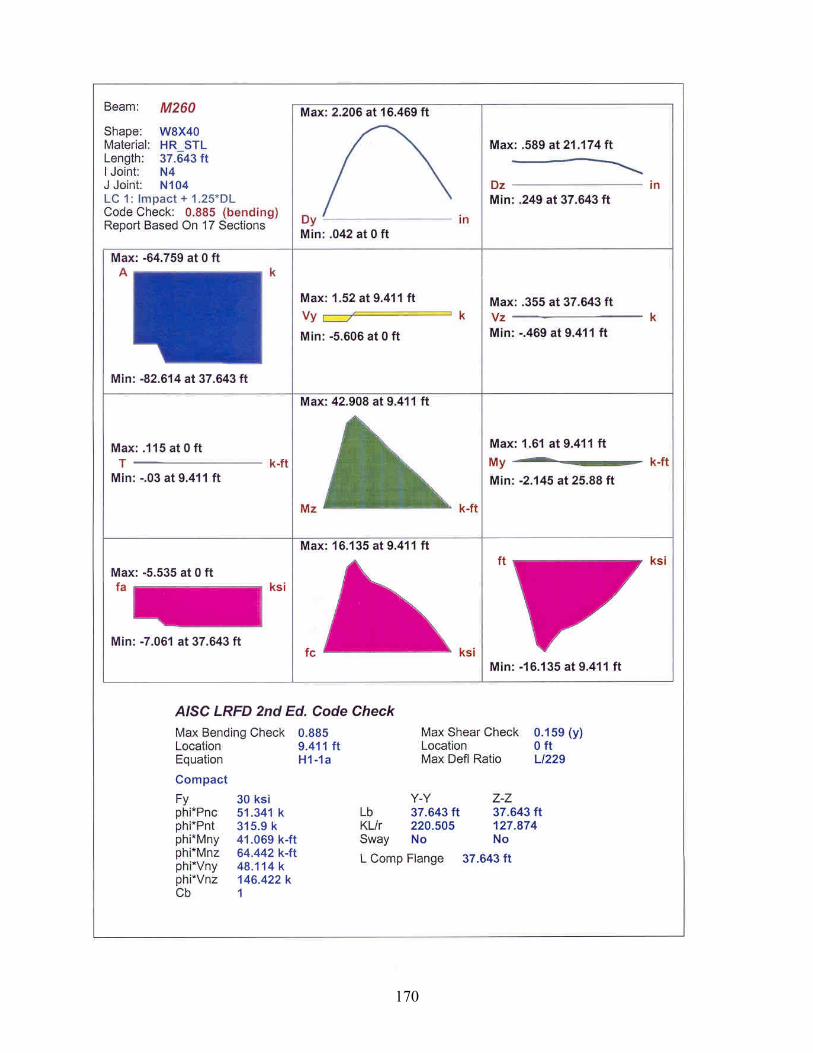
170
and Analysis Results
State Highway 16, Roy B. Inks Bridge over Llano River
Three-Dimensional RISA-3D Structural Model
Load Applied at Sixth Truss Member (Node 6)
171
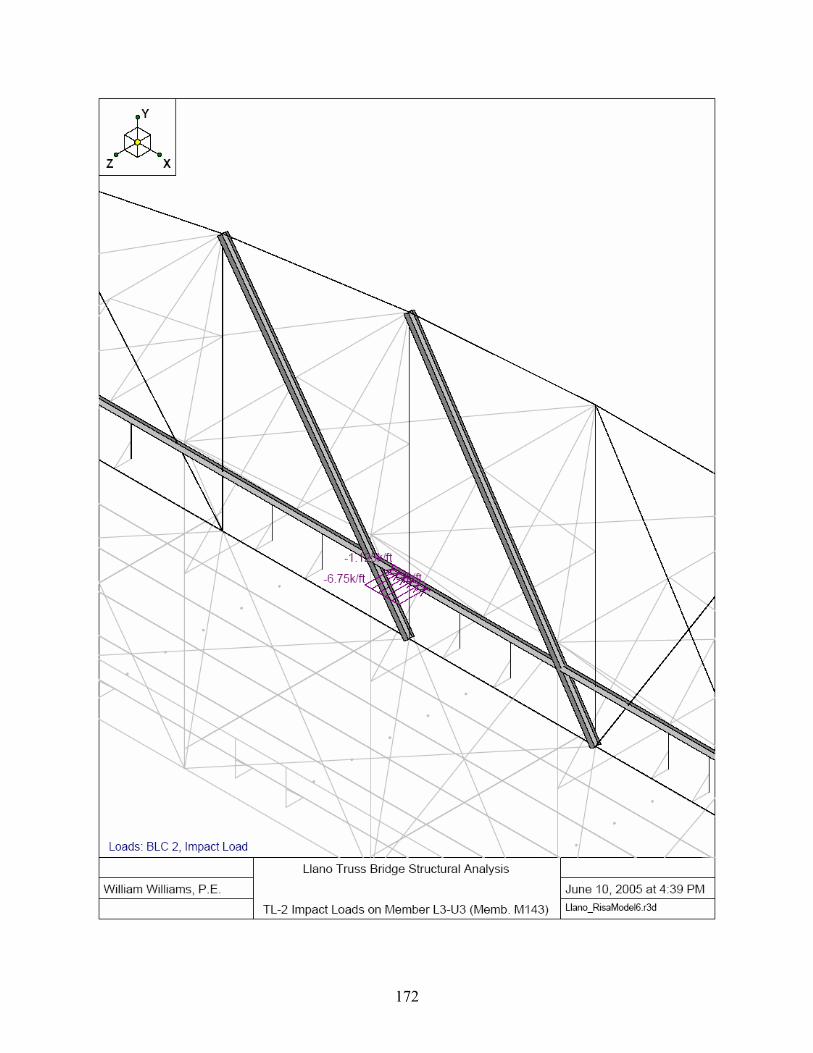
172
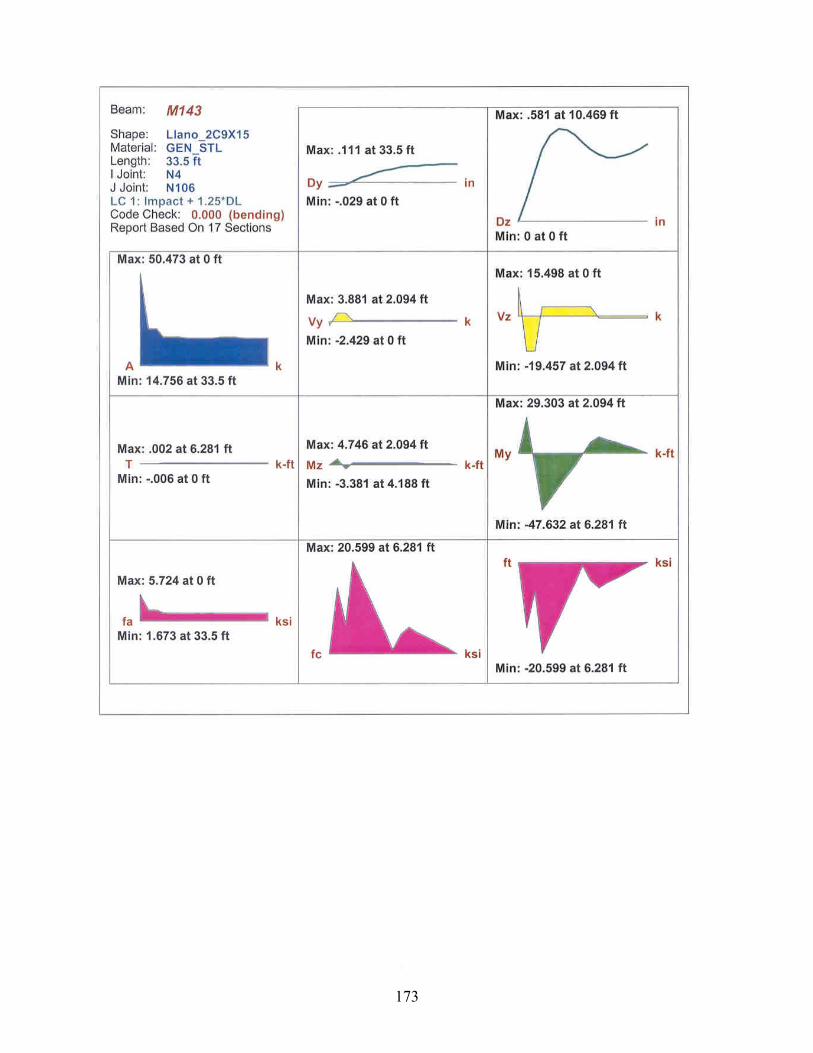
173
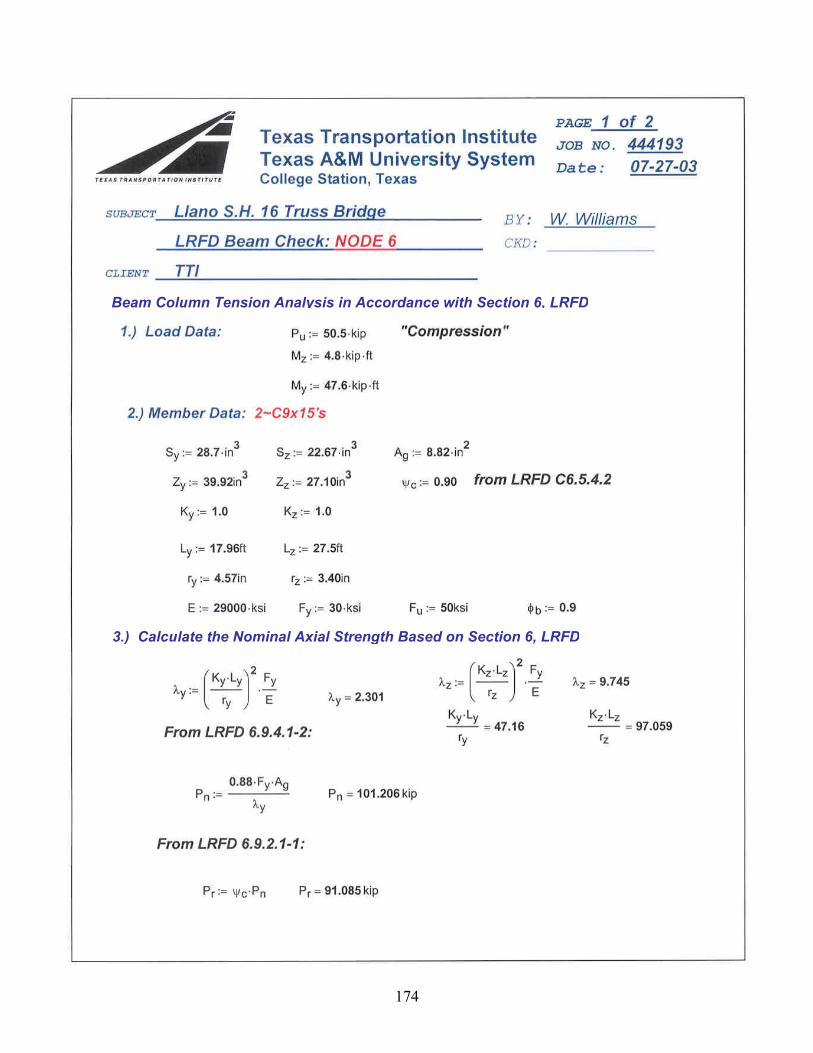
Beam Column Tension Analysis in Accordance with Section 6, LRFD
3.) Calculate the Nominal Axial Strength Based on Section 6, LRFD
174
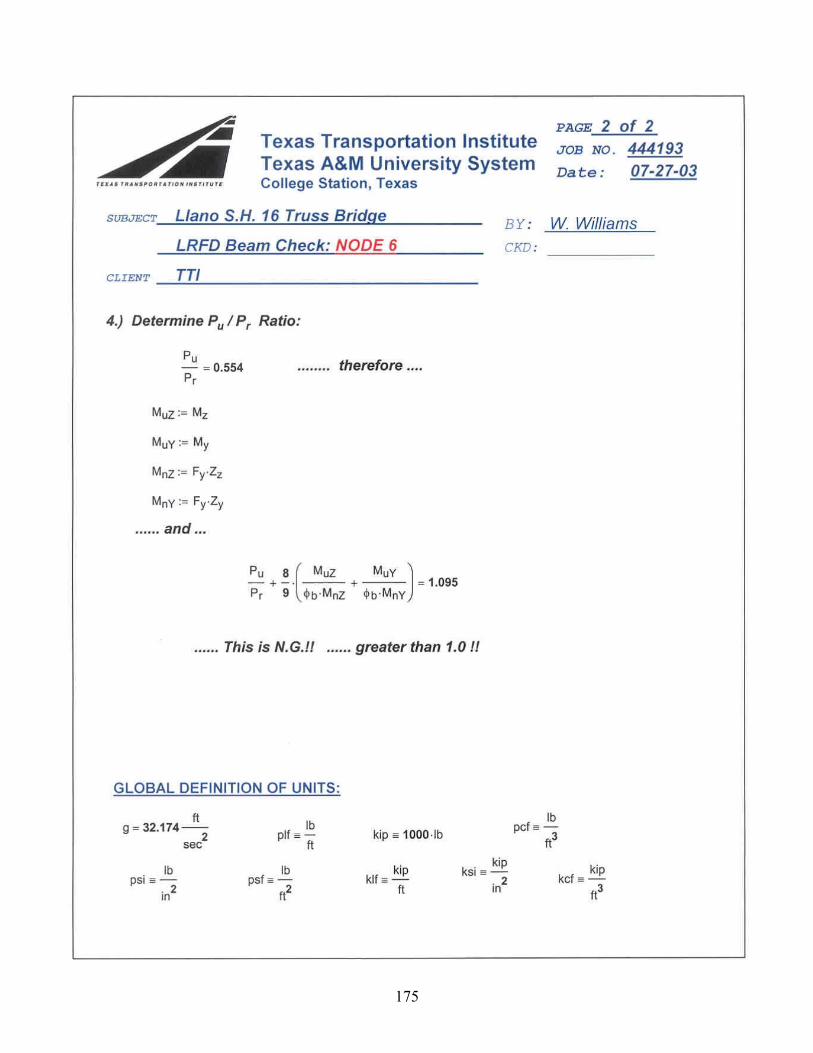
175
Three-Dimensional RISA-3D Structural Model
State Highway 16, Roy B. Inks Bridge over Llano River
and Analysis Results
Load Applied at Seventh Truss Member (Node 7)
176
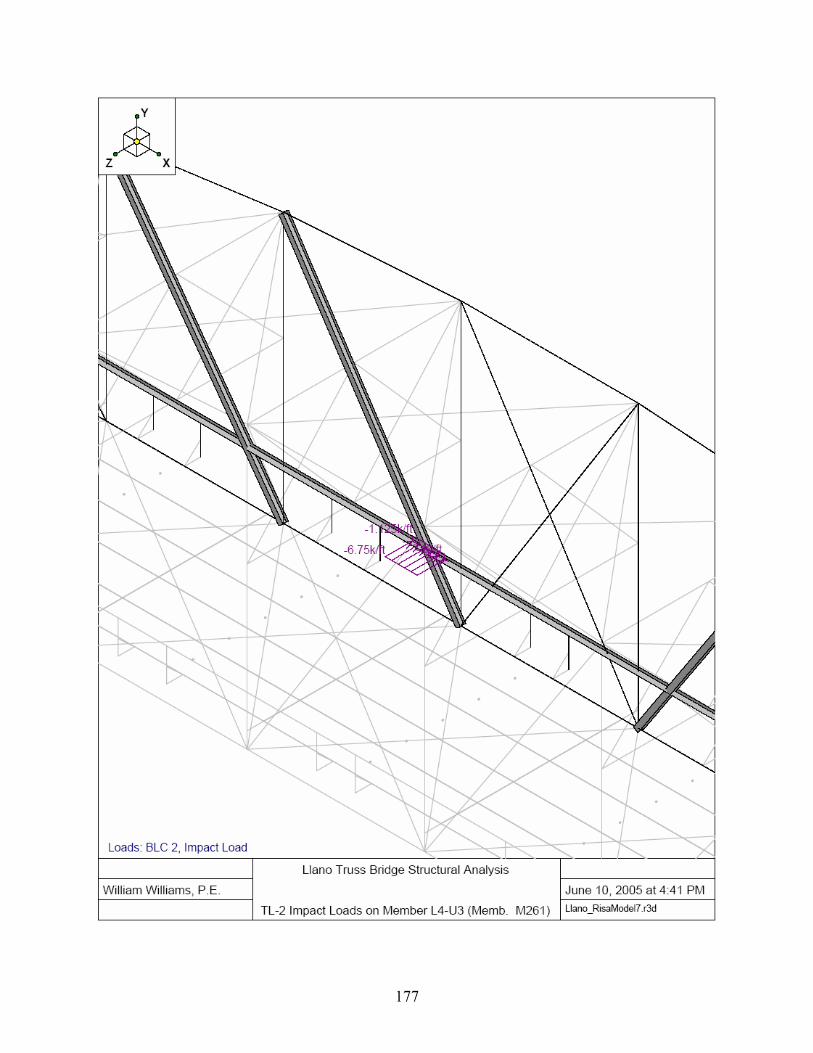
177
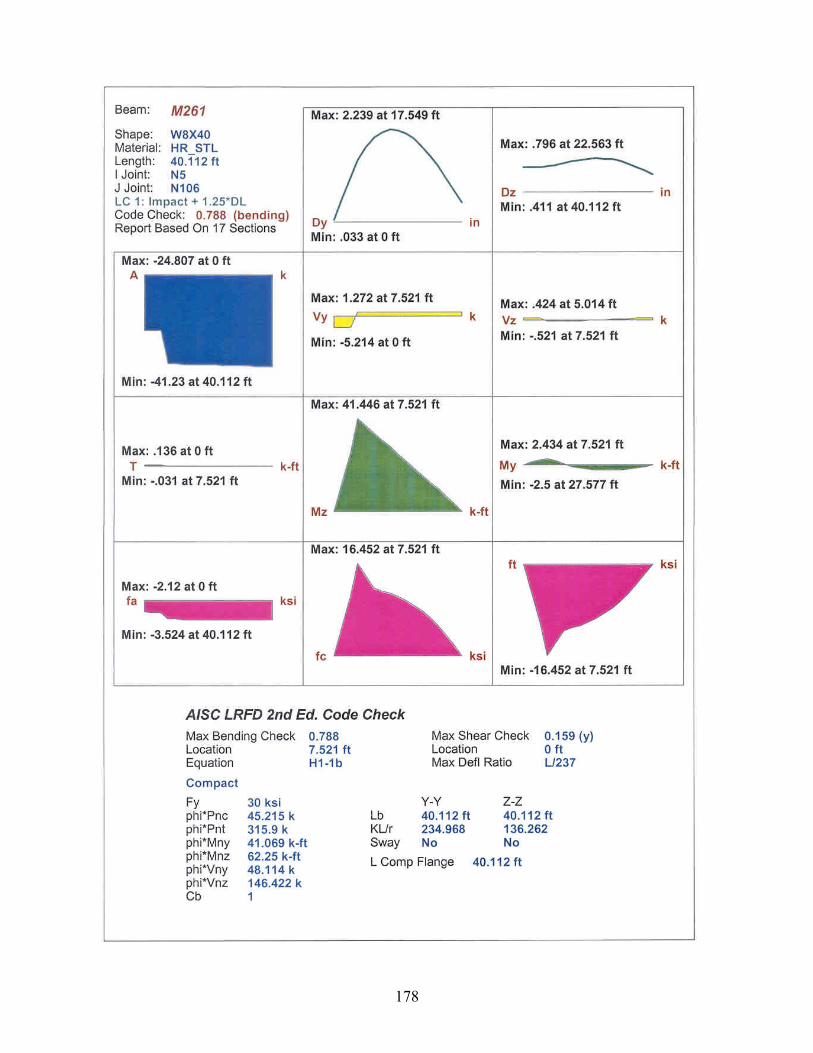
178

State Highway 16, Roy B. Inks Bridge over Llano River
Three-Dimensional RISA-3D Structural Model and Analysis Results
Load Applied at Eighth Truss Member (Node 8)
179
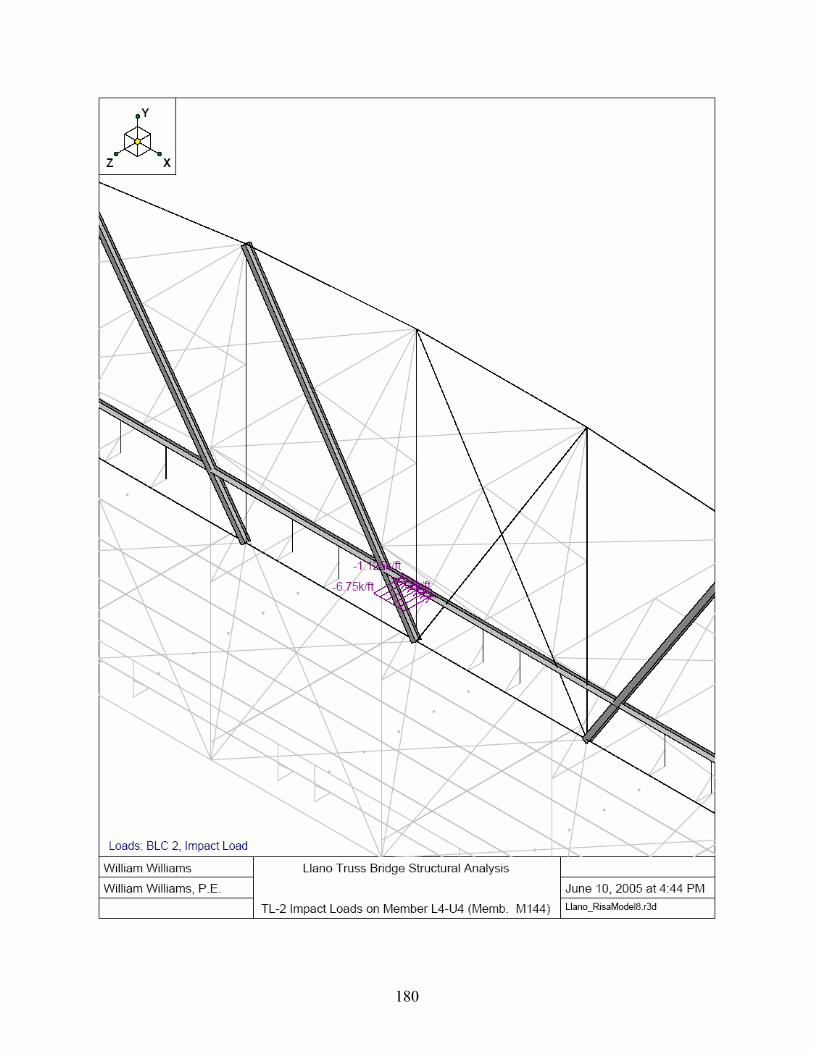
180
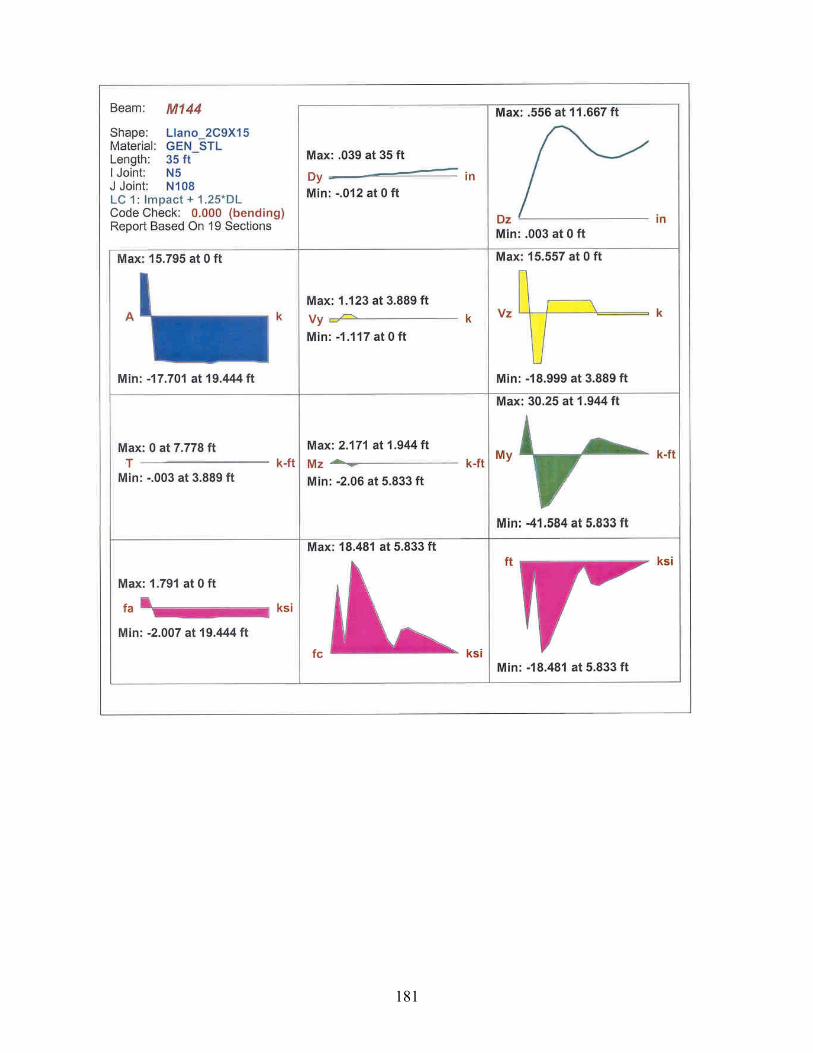
181

3.) Calculate the Nominal Axial Strength Based on Section 6, LRFD
Beam Column Tension Analysis in Accordance with Section 6, LRFD
182
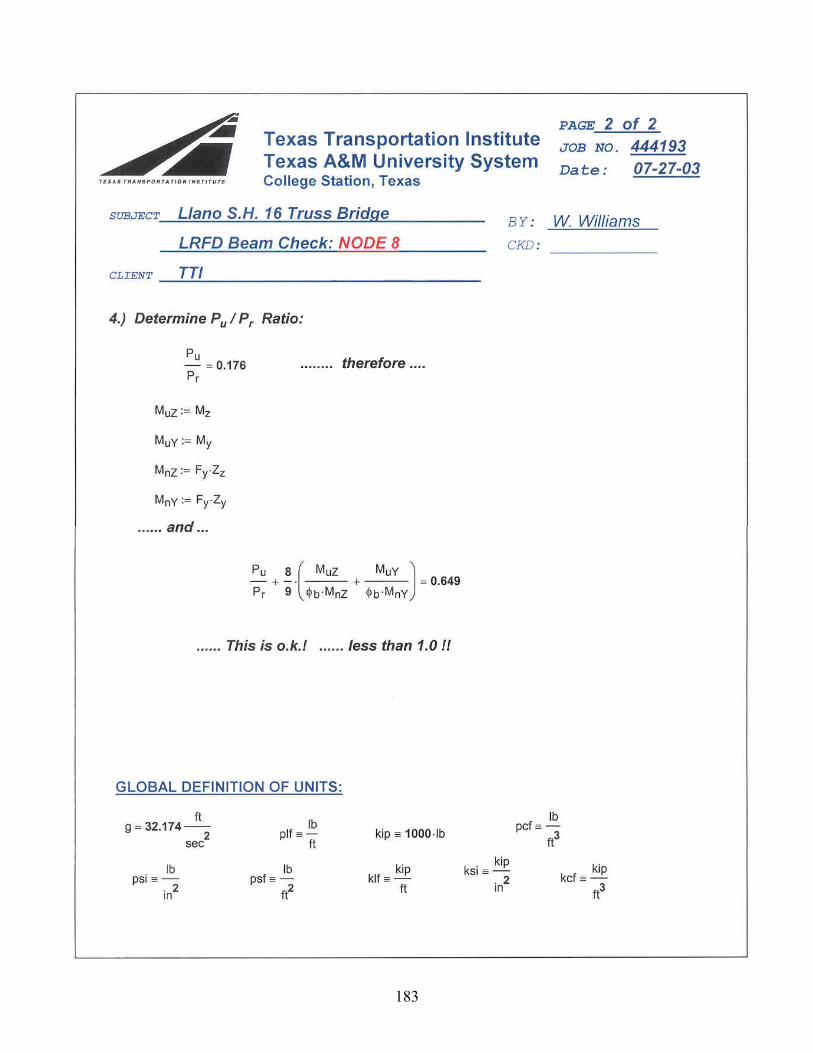
183
State Highway 16, Roy B. Inks Bridge over Llano River
Three-Dimensional RISA-3D Structural Model and Analysis Results
Load Applied at Ninth Truss Member (Node 9)
184
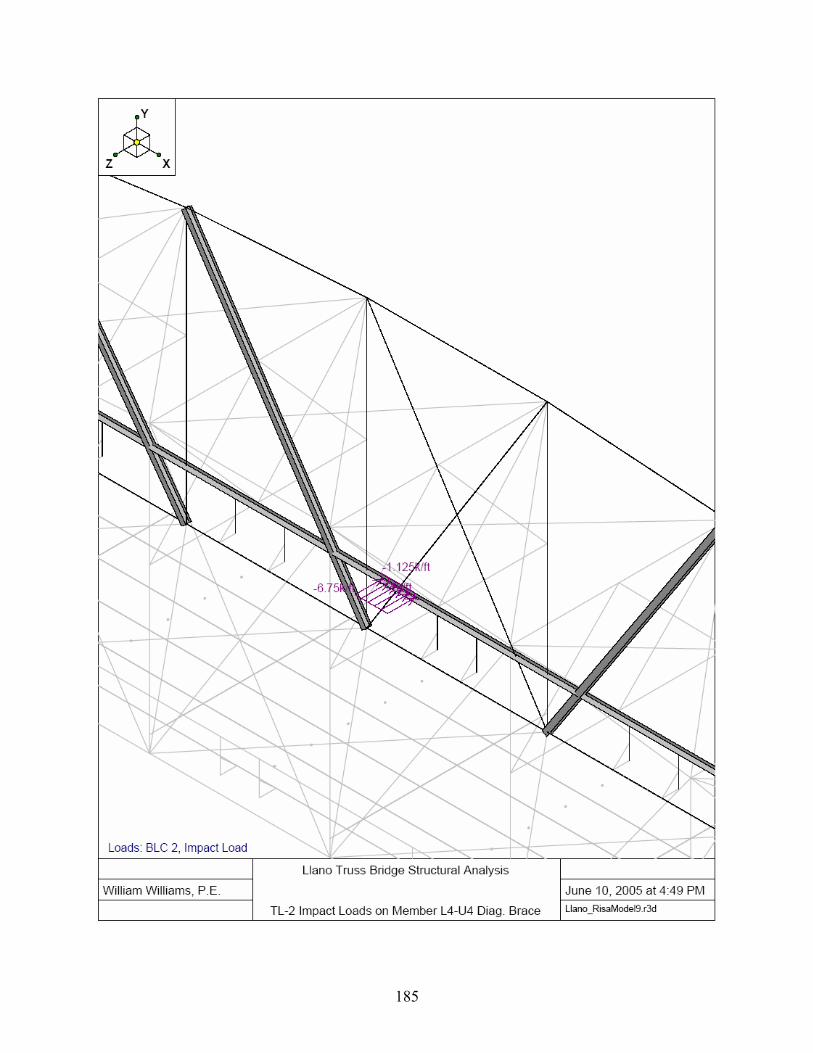
185
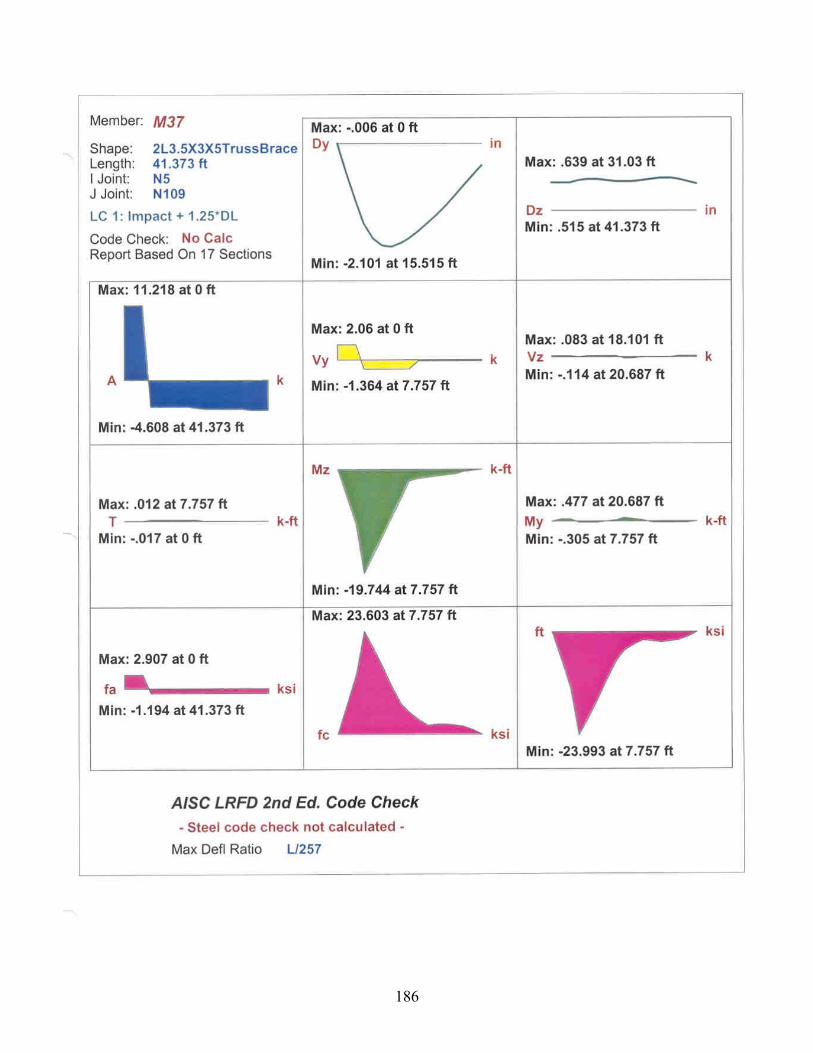
186

Beam Column Tension Analysis in Accordance with Chapter H, LRFD
3.) Calculate the Nominal Axial Tension Strength Based on Chapter D, LRFD
187
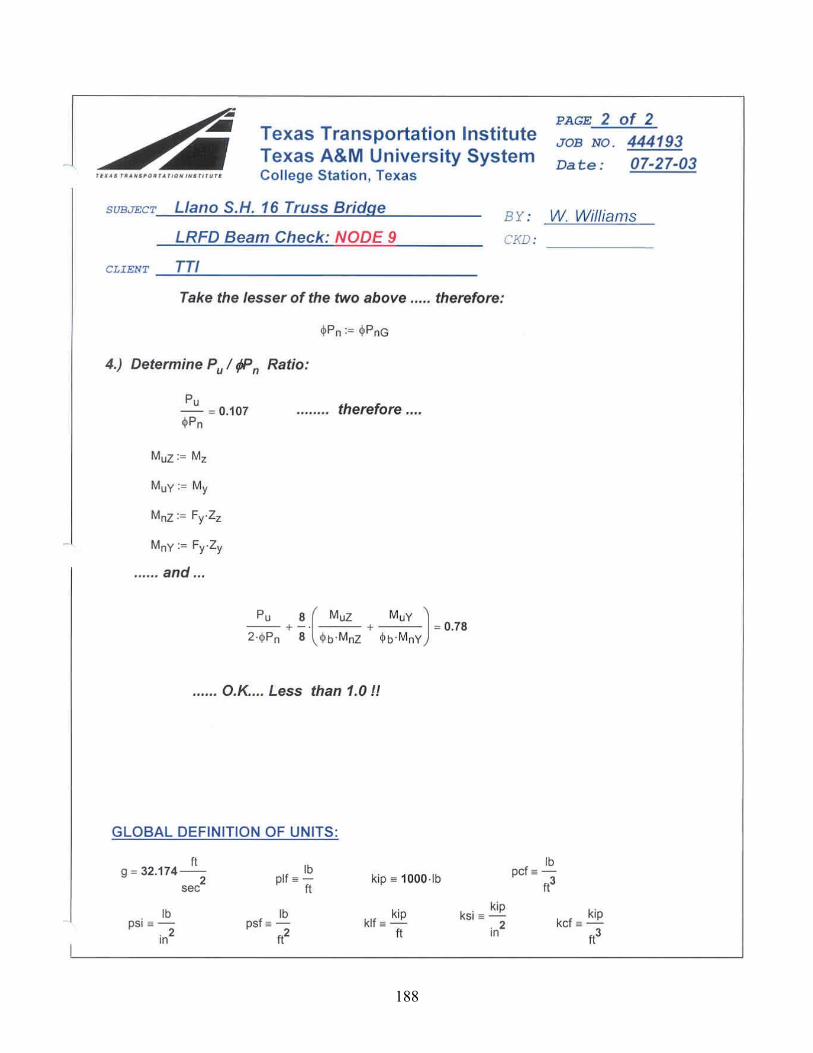
188
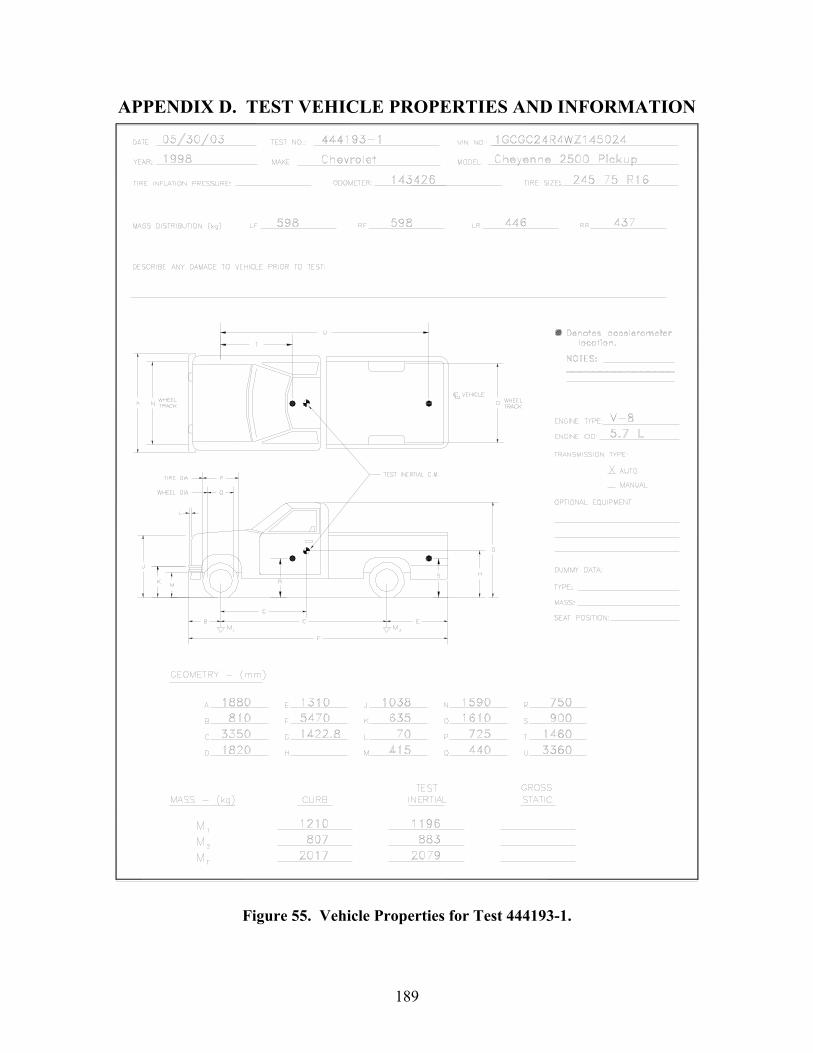
APPENDIX D. TEST VEHICLE PROPERTIES AND INFORMATION
Figure 55. Vehicle Properties for Test 444193-1.
189

Table 7. Exterior Crush Measurements for Test 444193-1.
VEHICLE CRUSH MEASUREMENT SHEET1
Complete When Applicable End Damage Side Damage
Undeformed end width ________
< 4 inches ________
Corner shift: A1 ________
A2 ________
End shift at frame (CDC)
(check one)
> 4 inches ________
Bowing: B1 _____ X1 _____
B2 _____ X2 _____
Bowing constant
22X1X + = ______
Note: Measure C1 to C6 from Driver to Passenger side in Front or Rear impacts – Rear to Front in Side Impacts.
Direct Damage Specific Impact Number
Plane* of (CDC)
Field L**
C1 C2 C3 C4 C5 C6 ±D
C-Measurements Width** Max***
Crush 1 At front bumper 1000 360 240 300 360 720 0 50 130 -360
2 At front bumper 1000 400 1270 0 85 N/A 330 400 +1660
1Table taken from National Accident Sampling System (NASS).
Free space value is defined as the distance between the baseline and the original body contour taken at the individual C locations. This may include the following: bumper lead, bumper taper, side protrusion, side taper, etc.
***Measure and document on the vehicle diagram the location of the maximum crush.
*Identify the plane at which the C-measurements are taken (e.g., at bumper, above bumper, at sill, above sill, at beltline, etc.) or label adjustments (e.g., free space).
Record the value for each C-measurement and maximum crush. **Measure and document on the vehicle diagram the beginning or end of the direct damage width and field L (e.g., side damage with respect to undamaged axle).
Note: Use as many lines/columns as necessary to describe each damage profile.
190
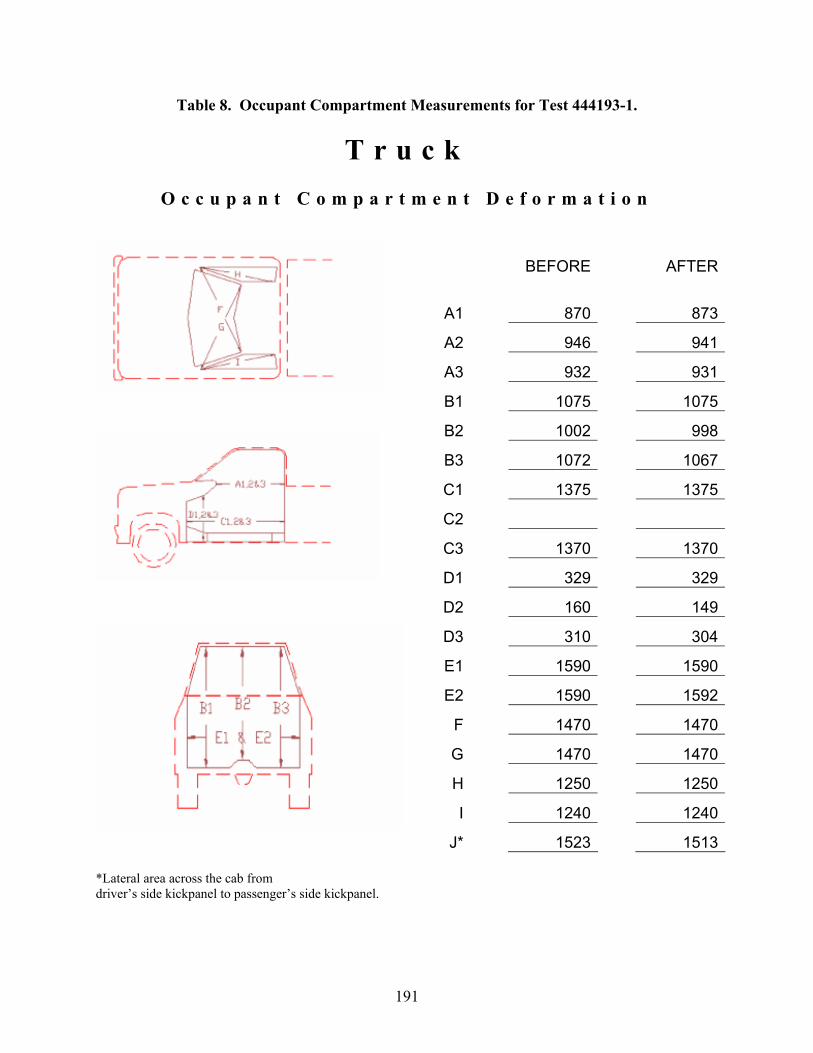
Table 8. Occupant Compartment Measurements for Test 444193-1.
T r u c k
O c c u p a n t C o m p a r t m e n t D e f o r m a t i o n
BEFORE AFTER
A1 870
946
873
A2 941
A3 932 931
B1 1075 1075
B2 1002 998
B3 1072 1067
C1 1375 1375
C2
C3 1370 1370
D1 329 329
D2 160 149
D3 310 304
E1 1590 1590
E2 1590 1592
F 14701470
G 1470 1470
H 1250 1250
I 1240 1240
J* 1523 1513 *Lateral area across the cab from driver’s side kickpanel to passenger’s side kickpanel.
191

Figure 56. Vehicle Properties for Test 444193-2.
192
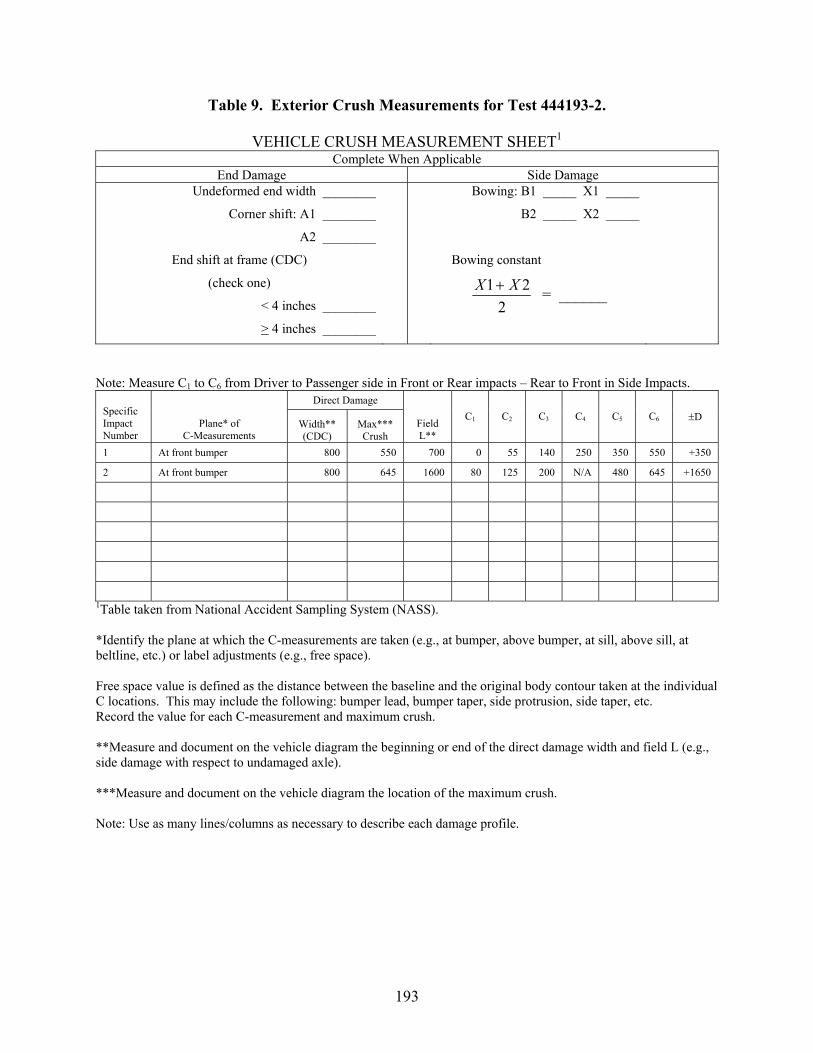
Table 9. Exterior Crush Measurements for Test 444193-2.
VEHICLE CRUSH MEASUREMENT SHEET1
Complete When Applicable End Damage Side Damage
Undeformed end width ________
< 4 inches ________
>
Corner shift: A1 ________
A2 ________
End shift at frame (CDC)
(check one)
4 inches ________
Bowing: B1 _____ X1 _____
B2 _____ X2 _____
Bowing constant
221 XX + = ______
Note: Measure C1 to C6 from Driver to Passenger side in Front or Rear impacts – Rear to Front in Side Impacts.
Direct Damage Specific Impact Number
Plane* of (CDC)
Field L**
C1 C2 C3 C4 C5 C6 ±D
C-Measurements Width** Max***
Crush 1 At front bumper 800 550 250 350 550 700 0 55 140 +350
2 80 125 200 645 +1650 At front bumper 800 645 1600 N/A 480
1Table taken from National Accident Sampling System (NASS). *Identify the plane at which the C-measurements are taken (e.g., at bumper, above bumper, at sill, above sill, at beltline, etc.) or label adjustments (e.g., free space). Free space value is defined as the distance between the baseline and the original body contour taken at the individual C locations. This may include the following: bumper lead, bumper taper, side protrusion, side taper, etc. Record the value for each C-measurement and maximum crush. **Measure and document on the vehicle diagram the beginning or end of the direct damage width and field L (e.g., side damage with respect to undamaged axle). ***Measure and document on the vehicle diagram the location of the maximum crush. Note: Use as many lines/columns as necessary to describe each damage profile.
193
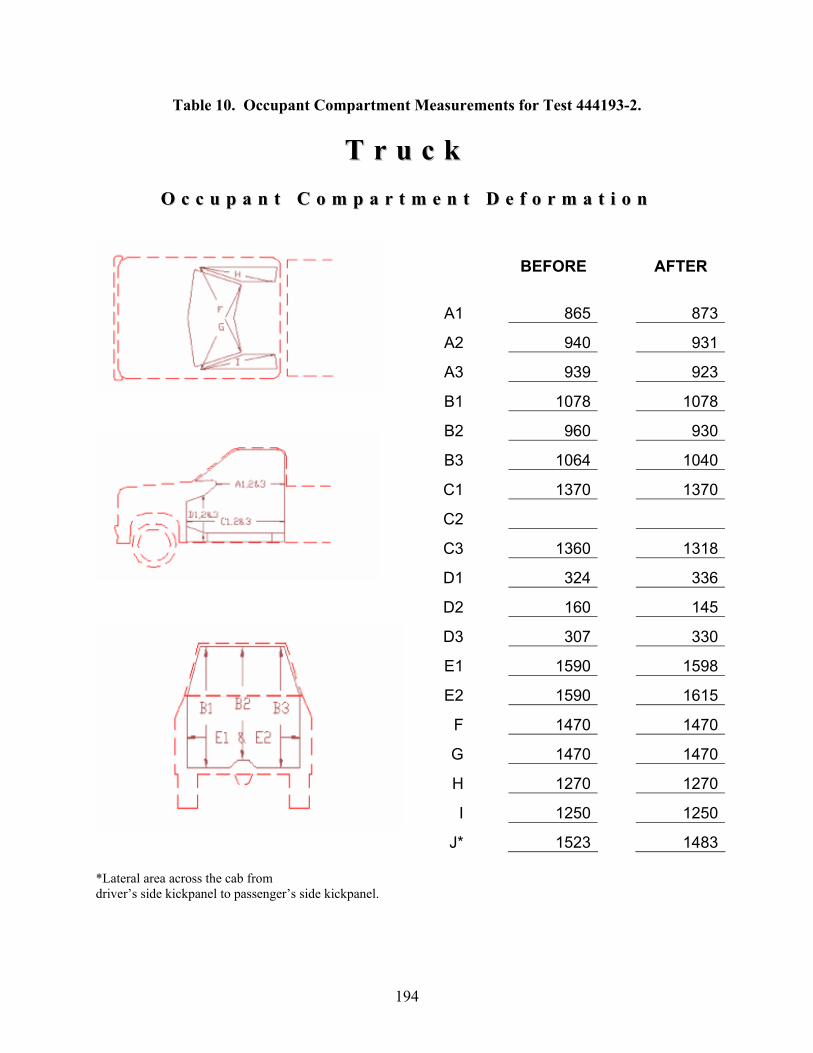
Table 10. Occupant Compartment Measurements for Test 444193-2.
TT rr uu cc kk
OO cc cc uu pp aa nn tt CC oo mm pp aa rr tt mm ee nn tt DD ee ff oo rr mm aa tt ii oo nn
BEFORE AFTER
A1 865 873
A2 940 931
A3 939 923
B1 1078 1078
B2 960 930
B3 1064 1040
C1 1370 1370
C2
C3 1360 1318
D1 324 336
D2 160 145
D3 307 330
E1 1590 1598
E2 1590 1615
F 1470 1470
G 1470 1470
H 1270 1270
I 1250 1250
J* 1523 1483 *Lateral area across the cab from driver’s side kickpanel to passenger’s side kickpanel.
194

APPENDIX E. SEQUENTIAL PHOTOGRAPHS
0.000 s
0.050 s
0.149 s
0.299 s Figure 57. Sequential Photographs for Test 444193-1
(Overhead and Frontal Views).
195
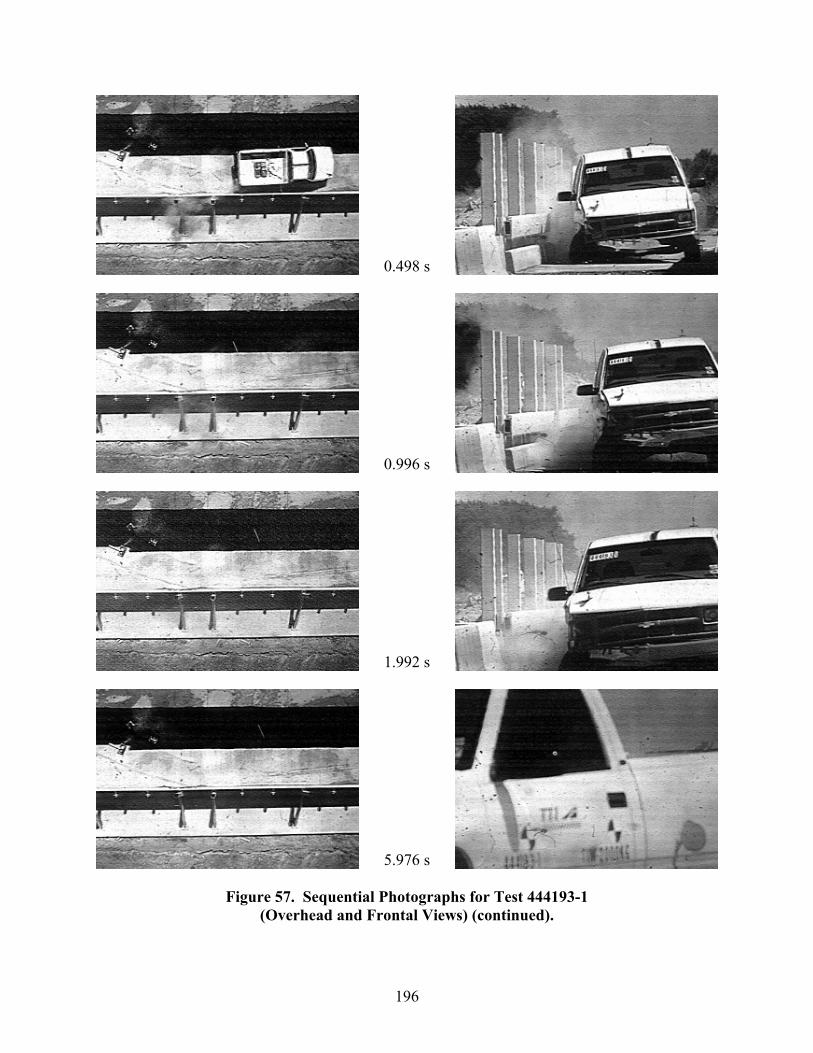
0.498 s
0.996 s
1.992 s
5.976 s
(Overhead and Frontal Views) (continued). Figure 57. Sequential Photographs for Test 444193-1
196
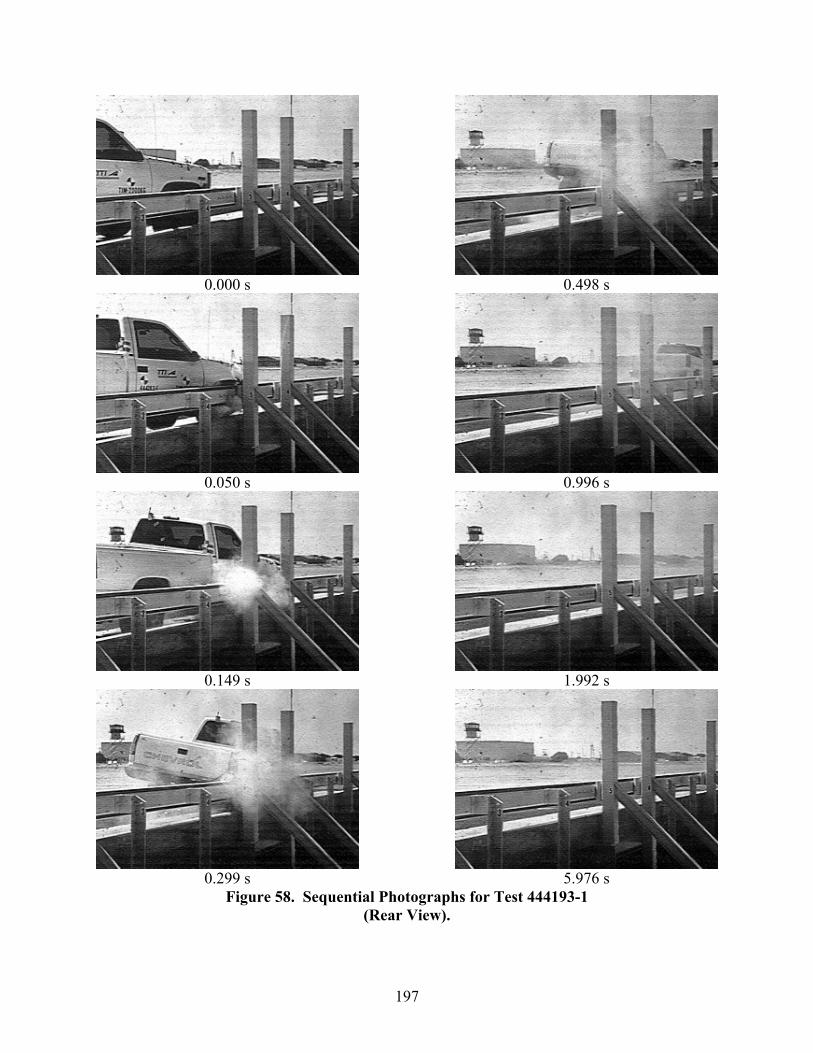
0.000 s 0.498 s
0.050 s 0.996 s
0.149 s 1.992 s
0.299 s 5.976 s
Figure 58. Sequential Photographs for Test 444193-1 (Rear View).
197
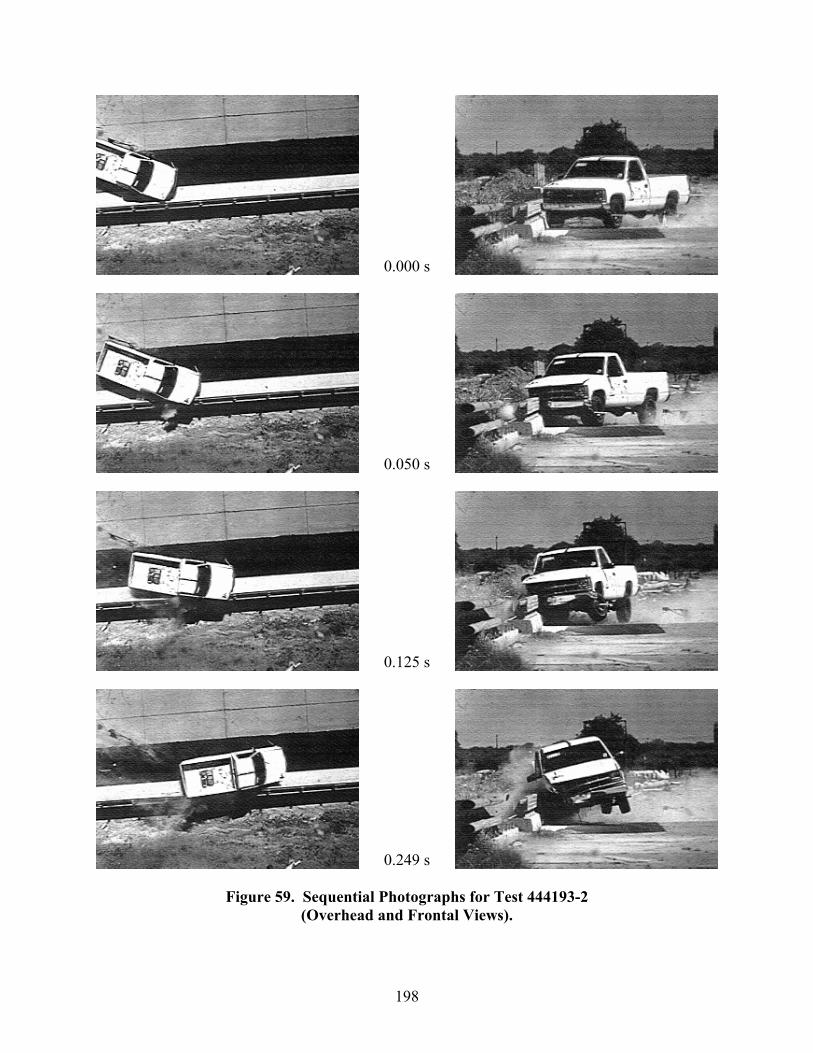
0.000 s
0.050 s
0.125 s
0.249 s Figure 59. Sequential Photographs for Test 444193-2
(Overhead and Frontal Views).
198
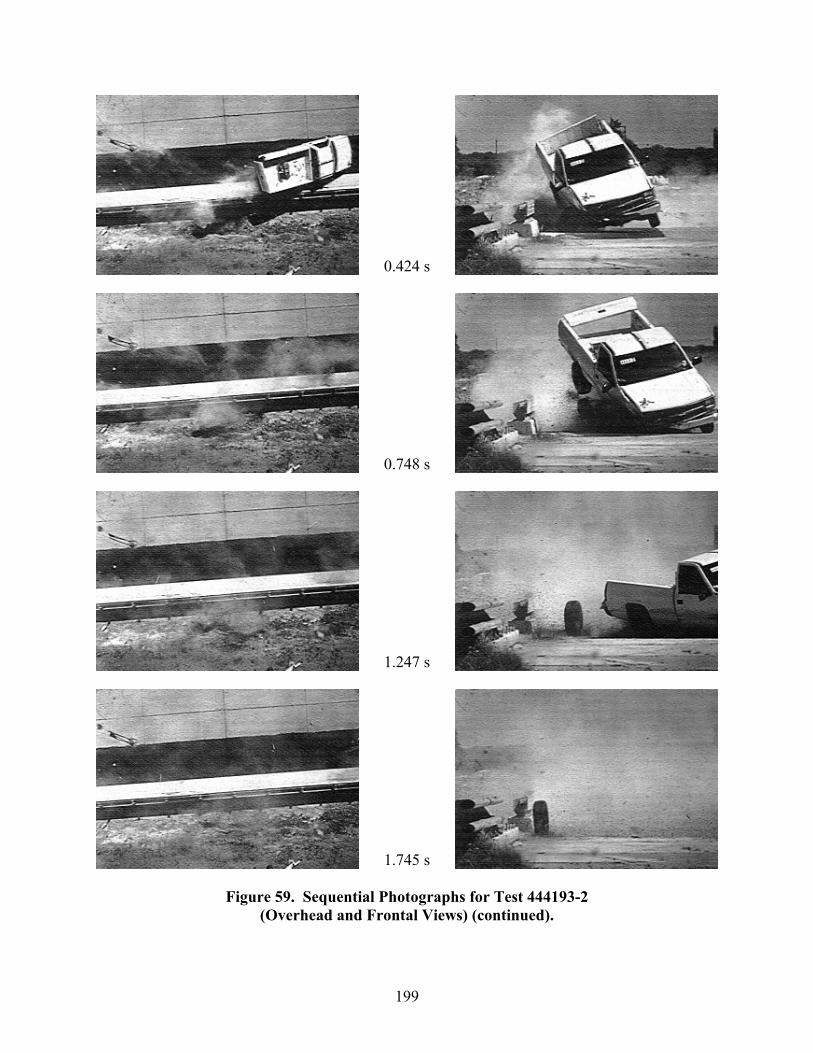
0.424 s
0.748 s
1.247 s
1.745 s Figure 59. Sequential Photographs for Test 444193-2
(Overhead and Frontal Views) (continued).
199
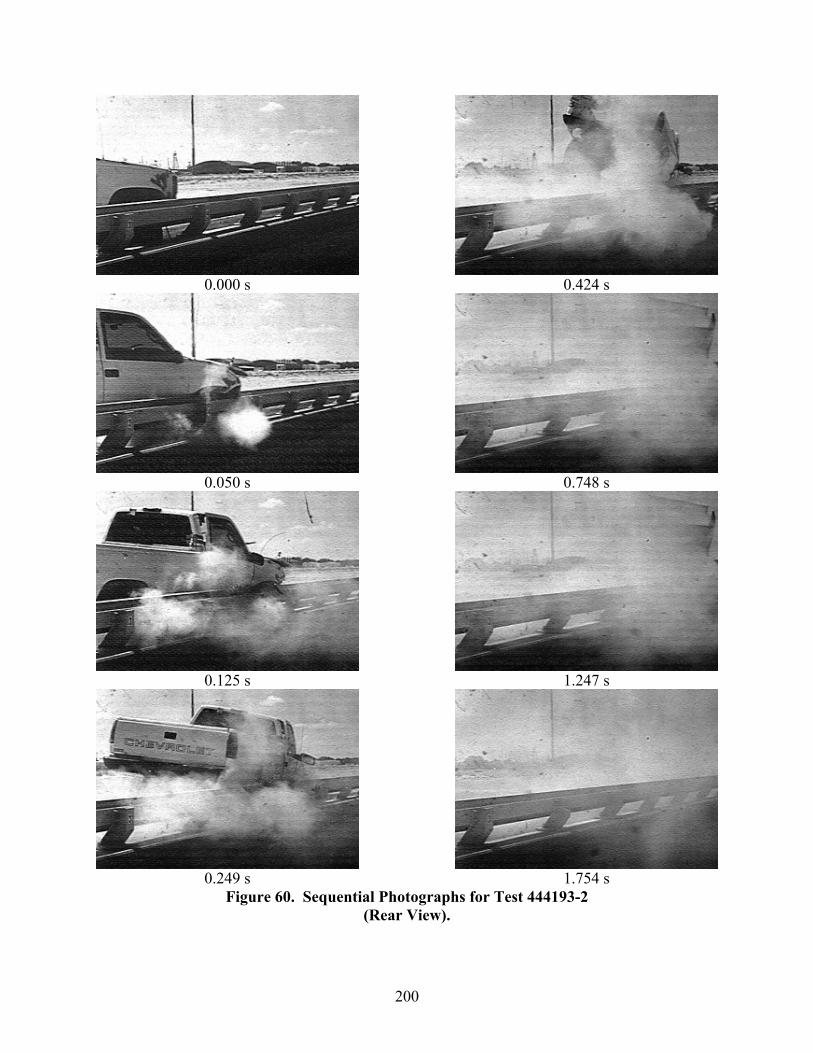
200
0.000 s 0.424 s
0.050 s 0.748 s
0.125 s 1.247 s
0.249 s 1.754
Figure 60. Sequential Photographs for Test 444193-2 (Rear View).
s
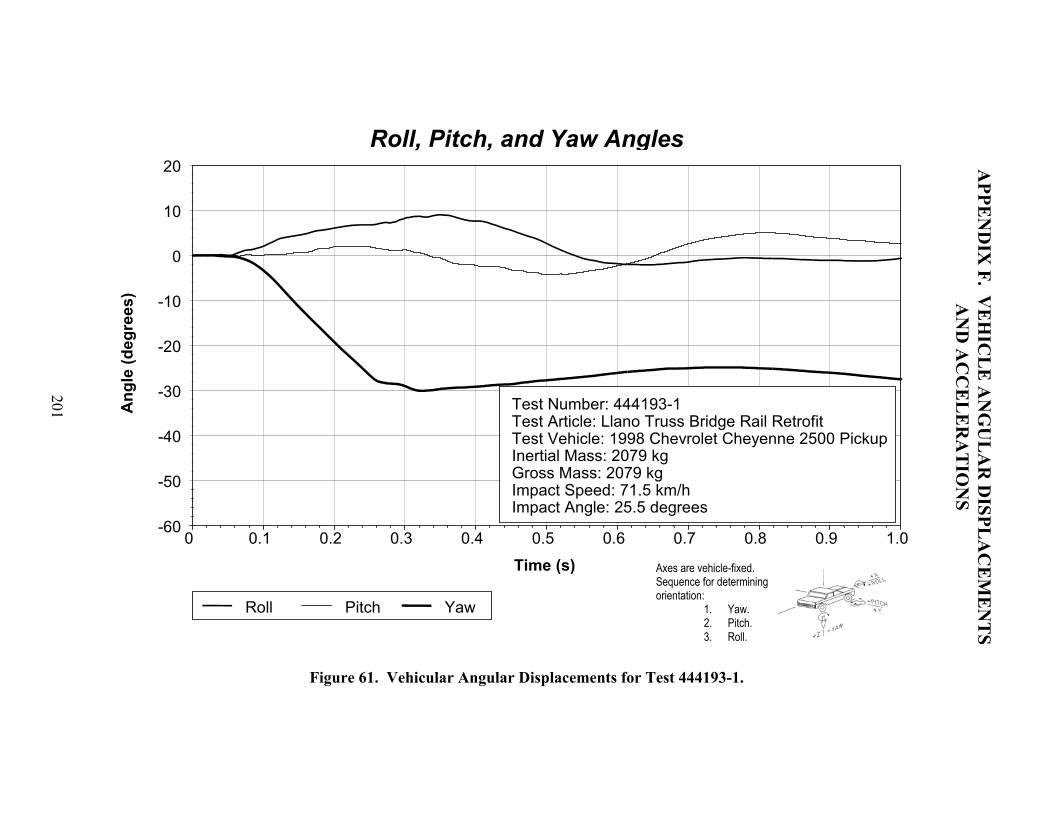
201
APPE
ND
IX F. V
EH
ICL
E A
NG
UL
AR
DISPL
AC
EM
EN
TS
AN
D A
CC
EL
ER
AT
ION
S
Roll, Pitch and Yaw Angles
0 0.1 0.2 0.3 0.4 0.5 0.6 0.7 0.8 0.9 1.0-60
-50
-40
-30
-20
-10
0
10
20
Time (sec)
Ang
les
(deg
rees
)
Test Number: 444193-1Test Article: Llano Truss Bridge Rail RetrofitTest Vehicle: 1998 Chevrolet Cheyenne 2500 PickupInertial Mass: 2079 kgGross Mass: 2079 kgImpact Speed: 71.5 km/hImpact Angle: 25.5 degrees
Roll Pitch Yaw
Axes are vehicle-fixed. Sequence for determining orientation:
1. Yaw. 2. Pitch. 3. Roll.
Ang
le (d
egre
es)
Time (s)
Roll, Pitch, and Yaw Angles
Figure 61. Vehicular Angular Displacements for Test 444193-1.

X Acceleration at CG
0 0.1 0.2 0.3 0.4 0.5 0.6 0.7 0.8 0.9 1.0-30
-20
-10
0
10
20
30
Time (sec)
Long
itudi
nal A
ccel
erat
ion
(g's
)
Test Number: 444193-1Test Article: Llano Truss Bridge Rail RetrofitTest Vehicle: 1998 Chevrolet Cheyenne 2500 PickupInertial Mass: 2079 kgGross Mass: 2079 kgImpact Speed: 71.5 km/hImpact Angle: 25.5 degrees
SAE Class 60 Filter
202
Time (s)
Figure 62. Vehicle Longitudinal Accelerometer Trace for Test 444193-1 (Accelerometer Located at Center of Gravity [CG]).
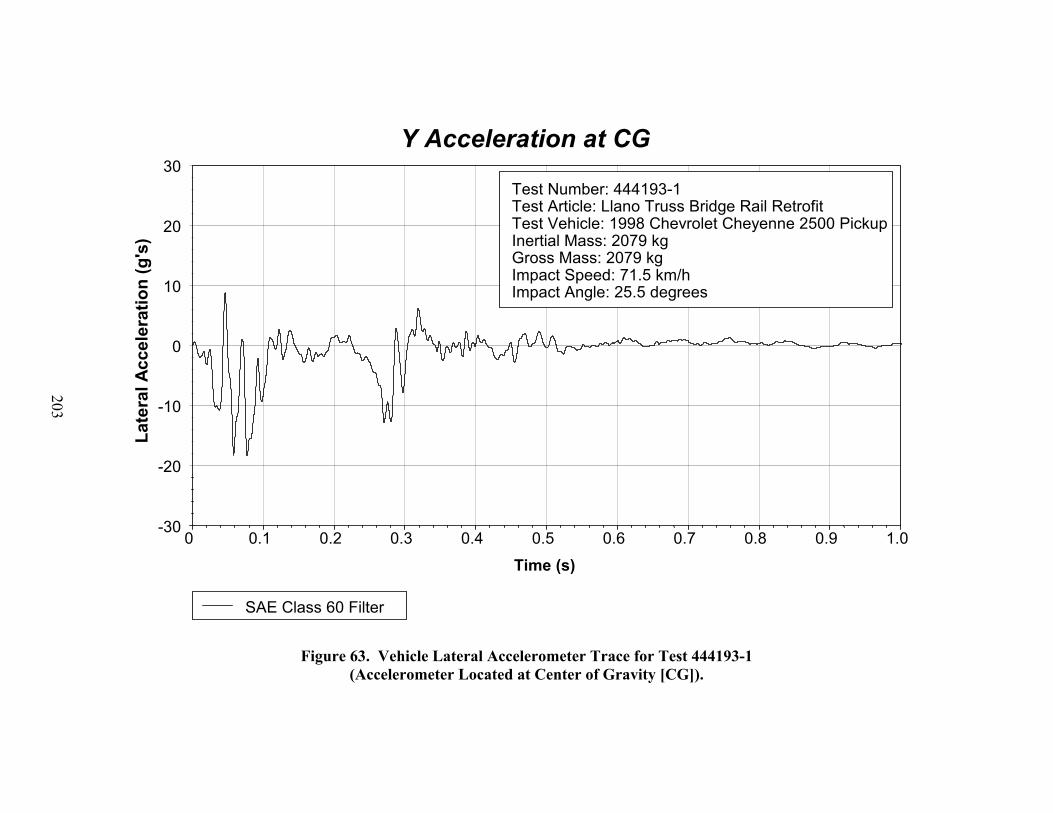
Y Acceleration at CG
0 0.1 0.2 0.3 0.4 0.5 0.6 0.7 0.8 0.9 1.0-30
-20
-10
0
10
20
30
Time (sec)
Late
ral A
ccel
erat
ion
(g's
)
Test Number: 444193-1Test Article: Llano Truss Bridge Rail RetrofitTest Vehicle: 1998 Chevrolet Cheyenne 2500 PickupInertial Mass: 2079 kgGross Mass: 2079 kgImpact Speed: 71.5 km/hImpact Angle: 25.5 degrees
SAE Class 60 Filter
203 Time (s)
Figure 63. Vehicle Lateral Accelerometer Trace for Test 444193-1 (Accelerometer Located at Center of Gravity [CG]).

Z Acceleration at CG
0 0.1 0.2 0.3 0.4 0.5 0.6 0.7 0.8 0.9 1.0-30
-20
-10
0
10
20
30
Time (sec)
Vert
ical
Acc
eler
atio
n (g
's)
Test Number: 444193-1Test Article: Llano Truss Bridge Rail RetrofitTest Vehicle: 1998 Chevrolet Cheyenne 2500 PickupInertial Mass: 2079 kgGross Mass: 2079 kgImpact Speed: 71.5 km/hImpact Angle: 25.5 degrees
SAE Class 60 Filter
204
Time (s)
Figure 64. Vehicle Vertical Accelerometer Trace for Test 444193-1 (Accelerometer Located at Center of Gravity [CG]).

205
X Acceleration Over Rear Axle
0 0.1 0.2 0.3 0.4 0.5 0.6 0.7 0.8 0.9 1.0-20
-10
0
10
20
Time (sec)
Long
itudi
nal A
ccel
erat
ion
(g's
)
Test Number: 444193-1Test Article: Llano Truss Bridge Rail RetrofitTest Vehicle: 1998 Chevrolet Cheyenne 2500 PickupInertial Mass: 2079 kgGross Mass: 2079 kgImpact Speed: 71.5 km/hImpact Angle: 25.5 degrees
SAE Class 60 Filter
Figure 65. Vehicle Longitudinal Accelerometer Trace for Test 444193-1 (Accelerometer Located over Rear Axle).
Time (s)
X Acceleration over Rear Axle
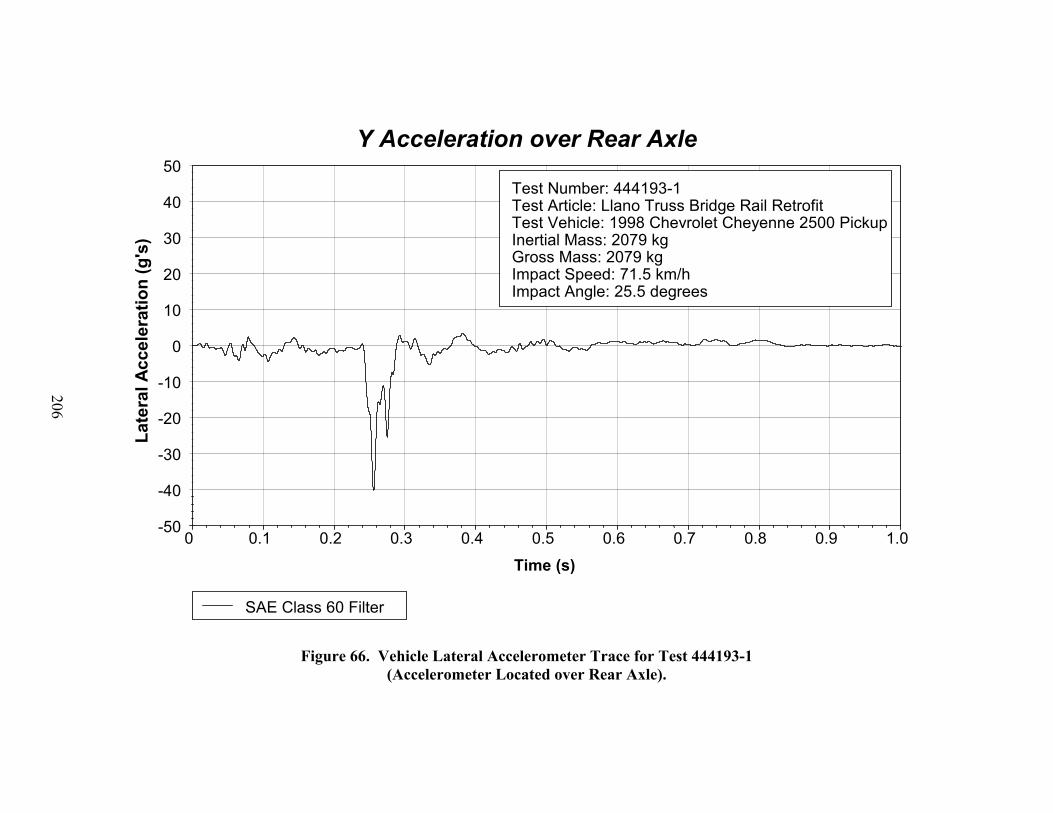
Y Acceleration Over Rear Axle
0 0.1 0.2 0.3 0.4 0.5 0.6 0.7 0.8 0.9 1.0-50
-40
-30
-20
-10
0
10
20
30
40
50
Time (sec)
Late
ral A
ccel
erat
ion
(g's
)
Test Number: 444193-1Test Article: Llano Truss Bridge Rail RetrofitTest Vehicle: 1998 Chevrolet Cheyenne 2500 PickupInertial Mass: 2079 kgGross Mass: 2079 kgImpact Speed: 71.5 km/hImpact Angle: 25.5 degrees
SAE Class 60 Filter
Time (s)
Y Acceleration over Rear Axle
206
Figure 66. Vehicle Lateral Accelerometer Trace for Test 444193-1 (Accelerometer Located over Rear Axle).
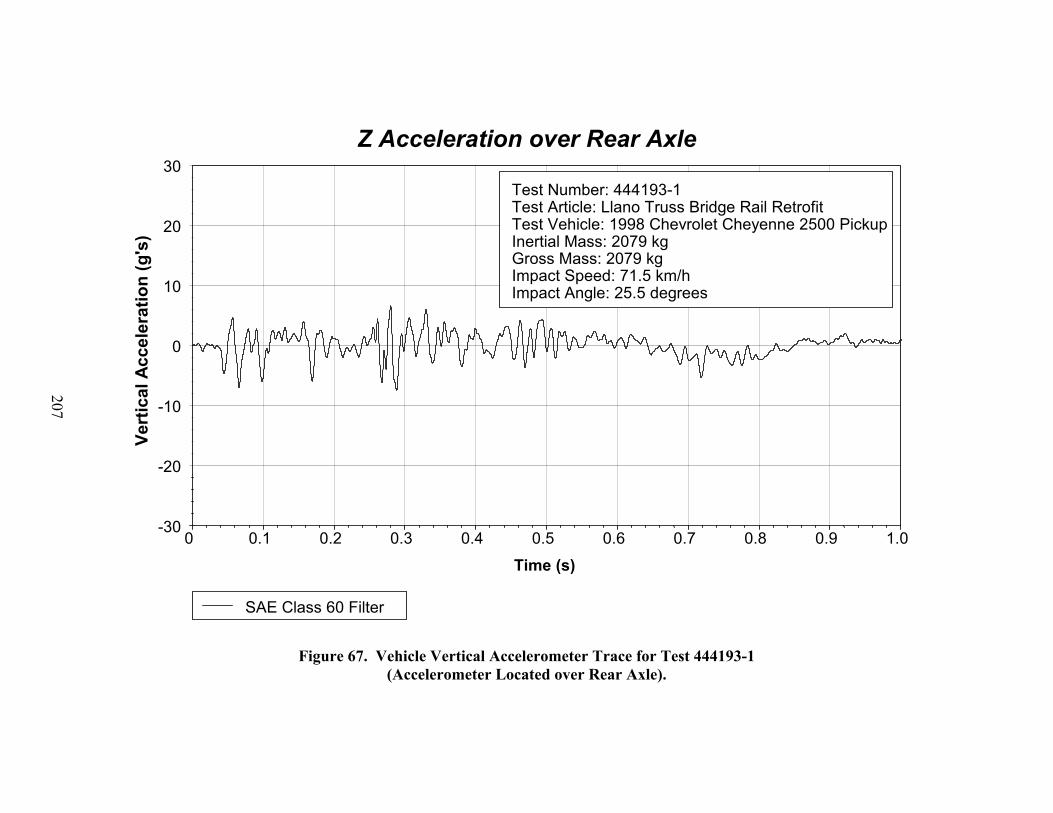
Z Acceleration Over Rear Axle
0 0.1 0.2 0.3 0.4 0.5 0.6 0.7 0.8 0.9 1.0-30
-20
-10
0
10
20
30
Time (sec)
Vert
ical
Acc
eler
atio
n (g
's)
Test Number: 444193-1Test Article: Llano Truss Bridge Rail RetrofitTest Vehicle: 1998 Chevrolet Cheyenne 2500 PickupInertial Mass: 2079 kgGross Mass: 2079 kgImpact Speed: 71.5 km/hImpact Angle: 25.5 degrees
SAE Class 60 Filter
Time (s)
Z Acceleration over Rear Axle
207
Figure 67. Vehicle Vertical Accelerometer Trace for Test 444193-1 (Accelerometer Located over Rear Axle).
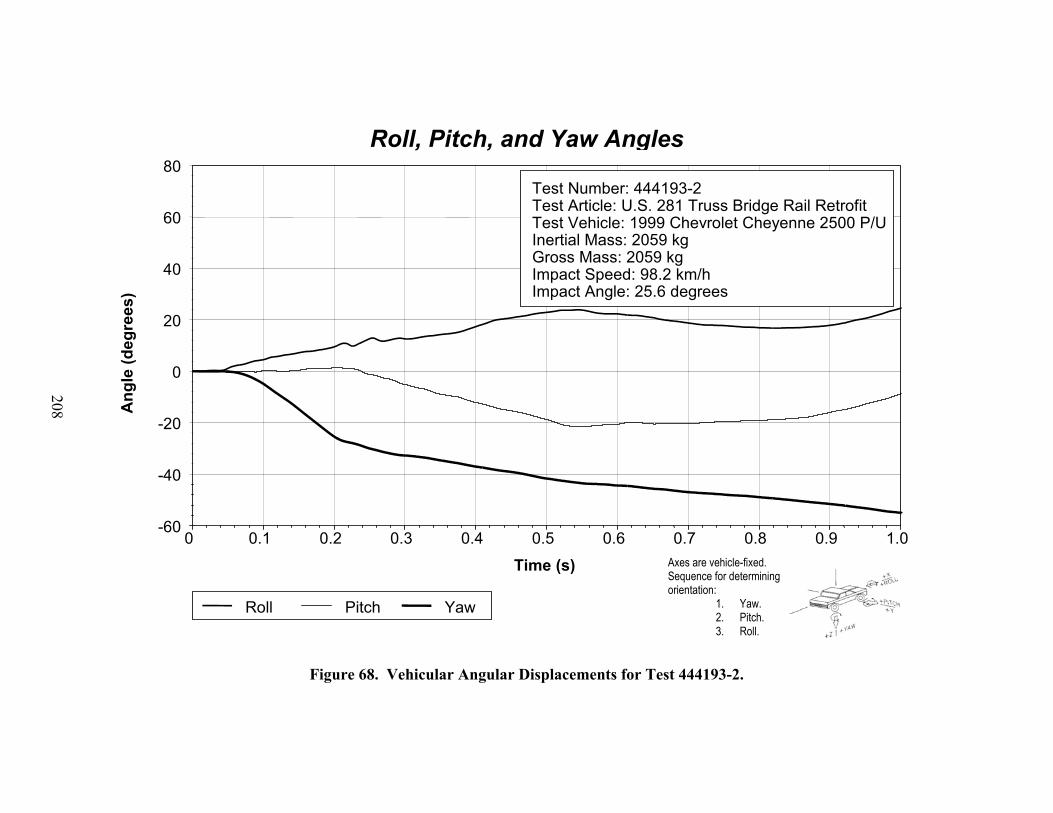
208
Roll, Pitch and Yaw Angles
0 0.1 0.2 0.3 0.4 0.5 0.6 0.7 0.8 0.9 1.0 -60
-40
-20
0
20
40
60
80
Time (sec)
Ang
les
(deg
rees
)
Test Number: 444193-2 Test Article: U.S. 281 Truss Bridge Rail Retrofit Test Vehicle: 1999 Chevrolet Cheyenne 2500 P/U Inertial Mass: 2059 kg Gross Mass: 2059 kg Impact Speed: 98.2 km/h Impact Angle: 25.6 degrees
Roll Pitch Yaw
Axes are vehicle-fixed. Sequence for determining orientation:
1. Yaw. 2. Pitch. 3. Roll.
Time (s)
Roll, Pitch, and Yaw AnglesA
ngle
(deg
rees
)
Figure 68. Vehicular Angular Displacements for Test 444193-2.
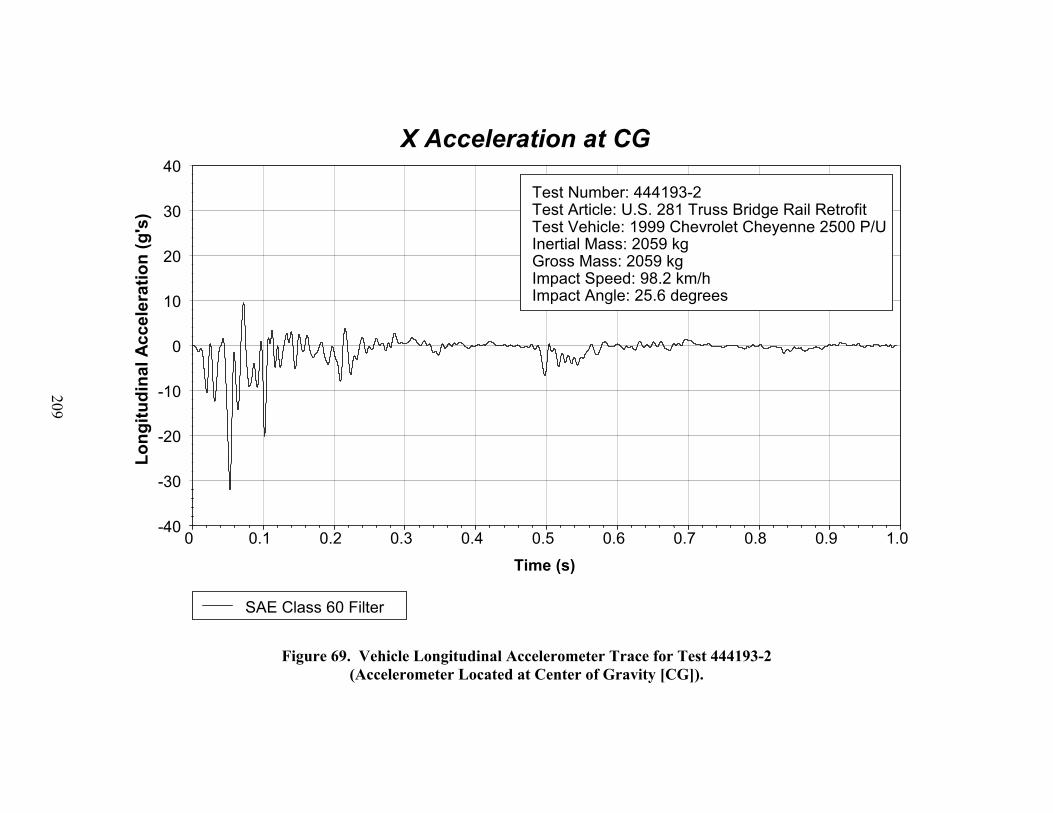
X Acceleration at CG
0 0.1 0.2 0.3 0.4 0.5 0.6 0.7 0.8 0.9 1.0 -40
-30
-20
-10
0
10
20
30
40
Time (sec)
Long
itudi
nal A
ccel
erat
ion
(g's
)
Test Number: 444193-2 Test Article: U.S. 281 Truss Bridge Rail Retrofit Test Vehicle: 1999 Chevrolet Cheyenne 2500 P/U Inertial Mass: 2059 kg Gross Mass: 2059 kg Impact Speed: 98.2 km/h Impact Angle: 25.6 degrees
SAE Class 60 Filter
209
Time (s)
Figure 69. Vehicle Longitudinal Accelerometer Trace for Test 444193-2 (Accelerometer Located at Center of Gravity [CG]).

Y Acceleration at CG
0 0.1 0.2 0.3 0.4 0.5 0.6 0.7 0.8 0.9 1.0 -40
-30
-20
-10
0
10
20
30
40
Time (sec)
Late
ral A
ccel
erat
ion
(g's
)
Test Number: 444193-2 Test Article: U.S. 281 Truss Bridge Rail Retrofit Test Vehicle: 1999 Chevrolet Cheyenne 2500 P/U Inertial Mass: 2059 kg Gross Mass: 2059 kg Impact Speed: 98.2 km/h Impact Angle: 25.6 degrees
SAE Class 60 Filter
210
Time (s)
Figure 70. Vehicle Lateral Accelerometer Trace for Test 444193-2 (Accelerometer Located at Center of Gravity [CG]).
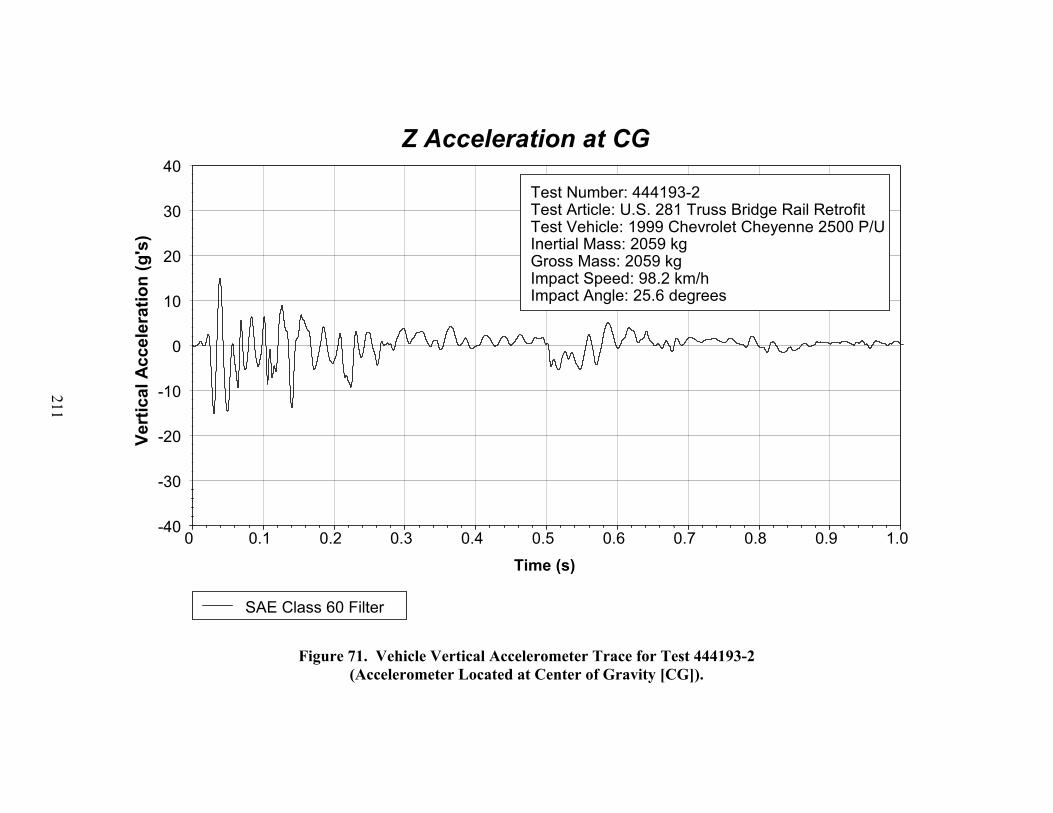
211
Z Acceleration at CG
0 0.1 0.2 0.3 0.4 0.5 0.6 0.7 0.8 0.9 1.0 -40
-30
-20
-10
0
10
20
30
40
Time (sec)
Vert
ical
Acc
eler
atio
n (g
's)
Test Number: 444193-2 Test Article: U.S. 281 Truss Bridge Rail Retrofit Test Vehicle: 1999 Chevrolet Cheyenne 2500 P/U Inertial Mass: 2059 kg Gross Mass: 2059 kg Impact Speed: 98.2 km/h Impact Angle: 25.6 degrees
SAE Class 60 Filter
Figure 71. Vehicle Vertical Accelerometer Trace for Test 444193-2 (Accelerometer Located at Center of Gravity [CG]).
Time (s)
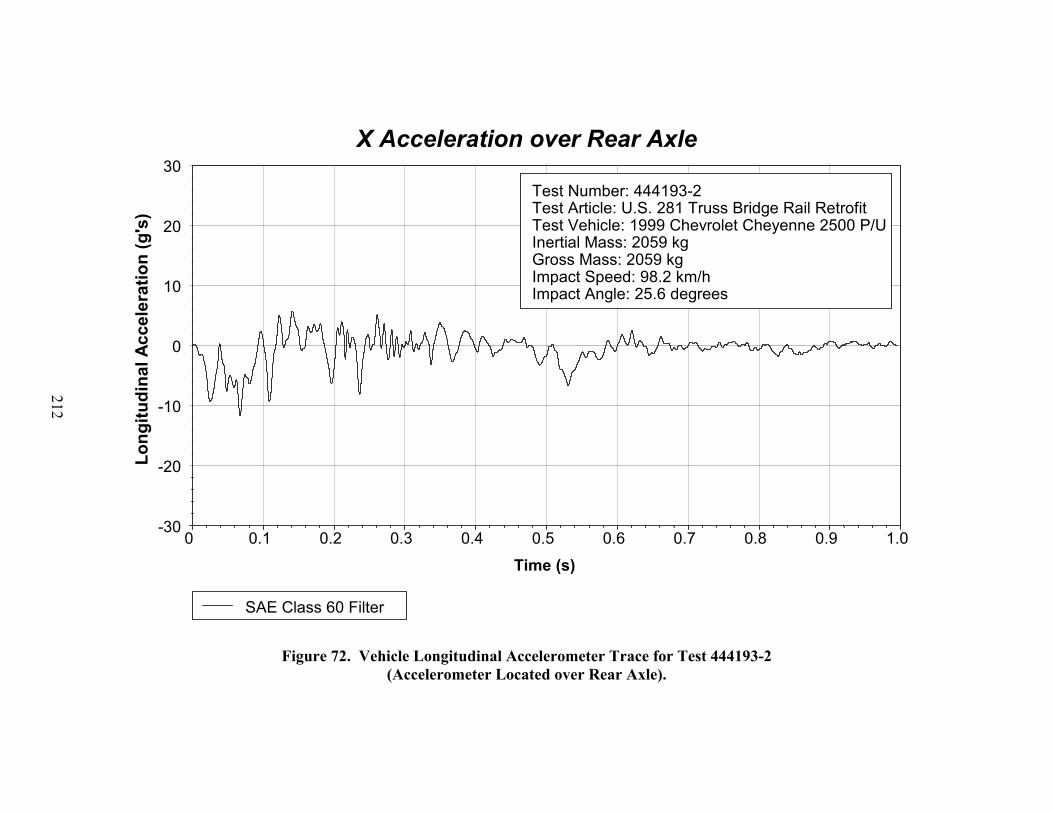
X Acceleration Over Rear Axle
0 0.1 0.2 0.3 0.4 0.5 0.6 0.7 0.8 0.9 1.0 -30
-20
-10
0
10
20
30
Time (sec)
Long
itudi
nal A
ccel
erat
ion
(g's
)
Test Number: 444193-2 Test Article: U.S. 281 Truss Bridge Rail Retrofit Test Vehicle: 1999 Chevrolet Cheyenne 2500 P/U Inertial Mass: 2059 kg Gross Mass: 2059 kg Impact Speed: 98.2 km/h Impact Angle: 25.6 degrees
SAE Class 60 Filter
Time (s)
X Acceleration over Rear Axle
212
Figure 72. Vehicle Longitudinal Accelerometer Trace for Test 444193-2 (Accelerometer Located over Rear Axle).
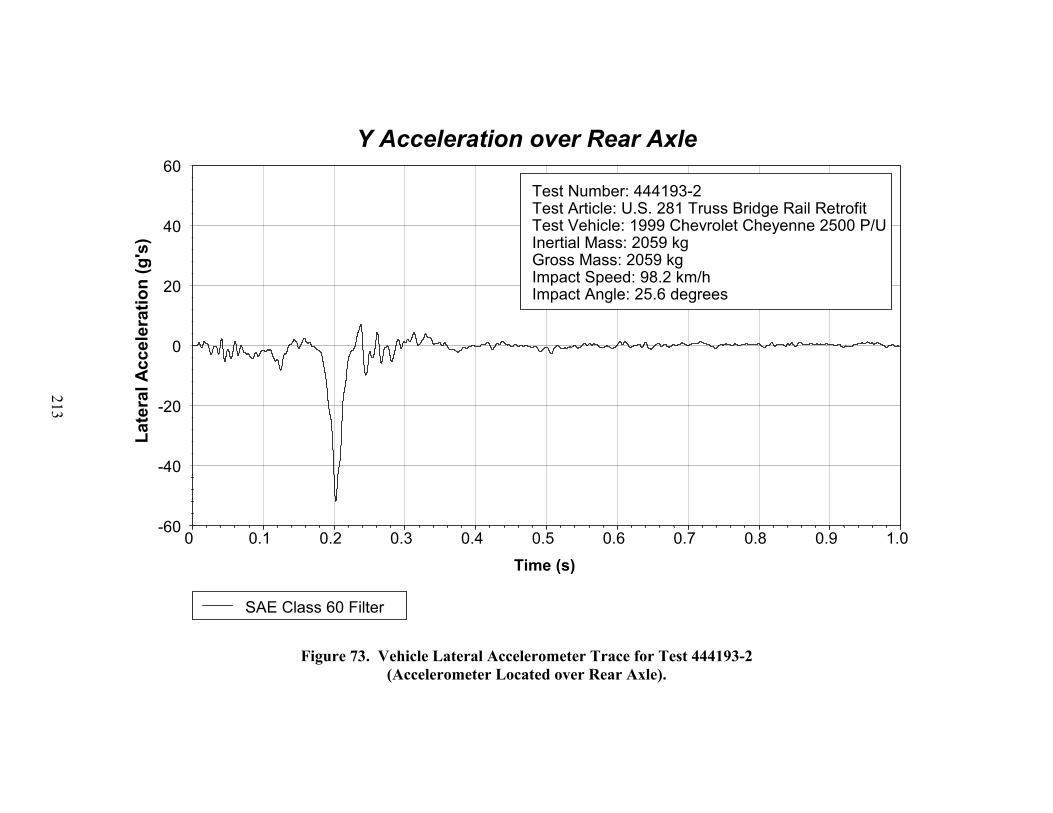
Y Acceleration Over Rear Axle
0 0.1 0.2 0.3 0.4 0.5 0.6 0.7 0.8 0.9 1.0 -60
-40
-20
0
20
40
60
Time (sec)
Late
ral A
ccel
erat
ion
(g's
)
Test Number: 444193-2 Test Article: U.S. 281 Truss Bridge Rail Retrofit Test Vehicle: 1999 Chevrolet Cheyenne 2500 P/U Inertial Mass: 2059 kg Gross Mass: 2059 kg Impact Speed: 98.2 km/h Impact Angle: 25.6 degrees
SAE Class 60 Filter
Time (s)
Y Acceleration over Rear Axle
213
Figure 73. Vehicle Lateral Accelerometer Trace for Test 444193-2 (Accelerometer Located over Rear Axle).
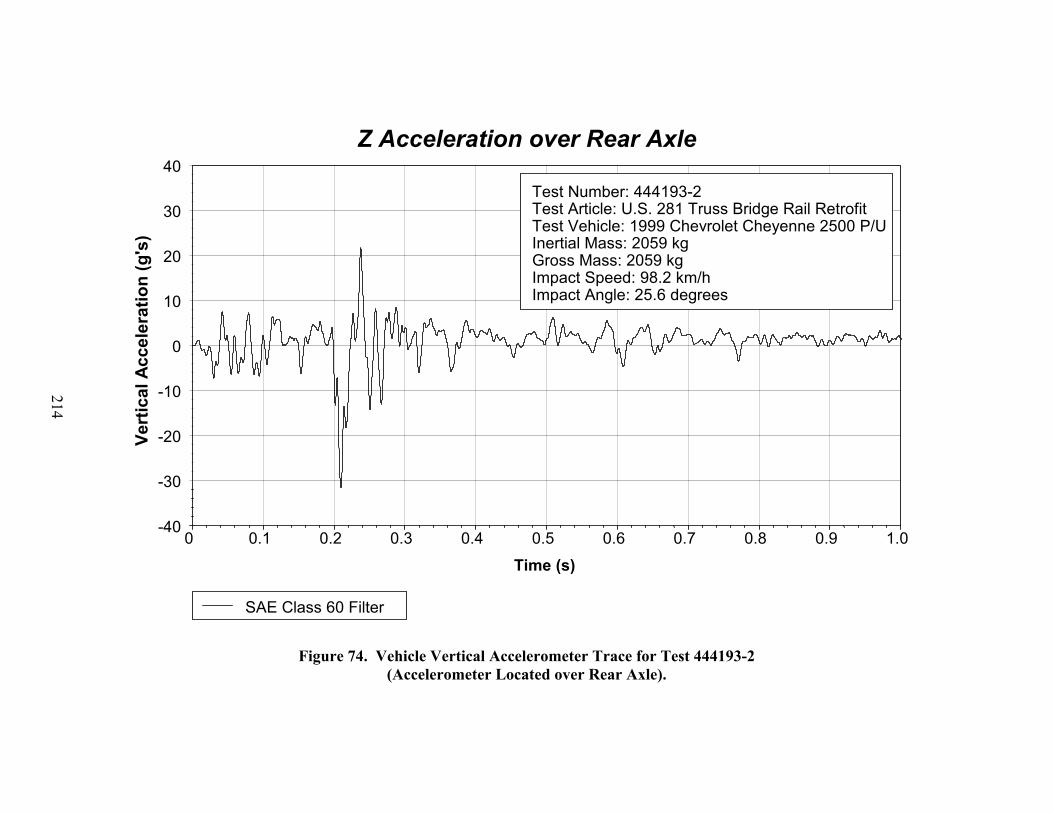
214
Z Acceleration Over Rear Axle
0 0.1 0.2 0.3 0.4 0.5 0.6 0.7 0.8 0.9 1.0 -40
-30
-20
-10
0
10
20
30
40
Time (sec)
Vert
ical
Acc
eler
atio
n (g
's)
Test Number: 444193-2 Test Article: U.S. 281 Truss Bridge Rail Retrofit Test Vehicle: 1999 Chevrolet Cheyenne 2500 P/U Inertial Mass: 2059 kg Gross Mass: 2059 kg Impact Speed: 98.2 km/h Impact Angle: 25.6 degrees
SAE Class 60 Filter
Figure 74. Vehicle Vertical Accelerometer Trace for Test 444193-2 (Accelerometer Located over Rear Axle).
Time (s)
Z Acceleration over Rear Axle
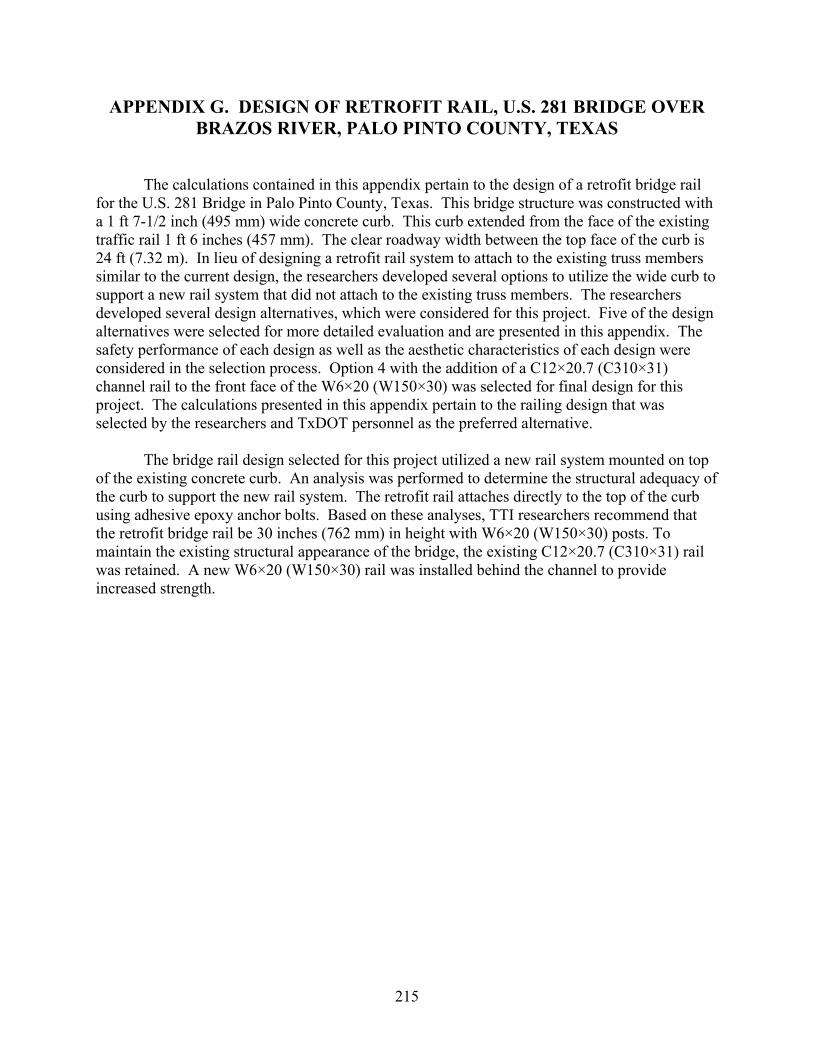
APPENDIX G. DESIGN OF RETROFIT RAIL, U.S. 281 BRIDGE OVER BRAZOS RIVER, PALO PINTO COUNTY, TEXAS
The calculations contained in this appendix pertain to the design of a retrofit bridge rail for the U.S. 281 Bridge in Palo Pinto County, Texas. This bridge structure was constructed with a 1 ft 7-1/2 inch (495 mm) wide concrete curb. This curb extended from the face of the existing traffic rail 1 ft 6 inches (457 mm). The clear roadway width between the top face of the curb is 24 ft (7.32 m). In lieu of designing a retrofit rail system to attach to the existing truss members similar to the current design, the researchers developed several options to utilize the wide curb to support a new rail system that did not attach to the existing truss members. The researchers developed several design alternatives, which were considered for this project. Five of the design alternatives were selected for more detailed evaluation and are presented in this appendix. The safety performance of each design as well as the aesthetic characteristics of each design were considered in the selection process. Option 4 with the addition of a C12×20.7 (C310×31) channel rail to the front face of the W6×20 (W150×30) was selected for final design for this project. The calculations presented in this appendix pertain to the railing design that was selected by the researchers and TxDOT personnel as the preferred alternative.
The bridge rail design selected for this project utilized a new rail system mounted on top
of the existing concrete curb. An analysis was performed to determine the structural adequacy of the curb to support the new rail system. The retrofit rail attaches directly to the top of the curb using adhesive epoxy anchor bolts. Based on these analyses, TTI researchers recommend that the retrofit bridge rail be 30 inches (762 mm) in height with W6×20 (W150×30) posts. To maintain the existing structural appearance of the bridge, the existing C12×20.7 (C310×31) rail was retained. A new W6×20 (W150×30) rail was installed behind the channel to provide increased strength.
215


217 217
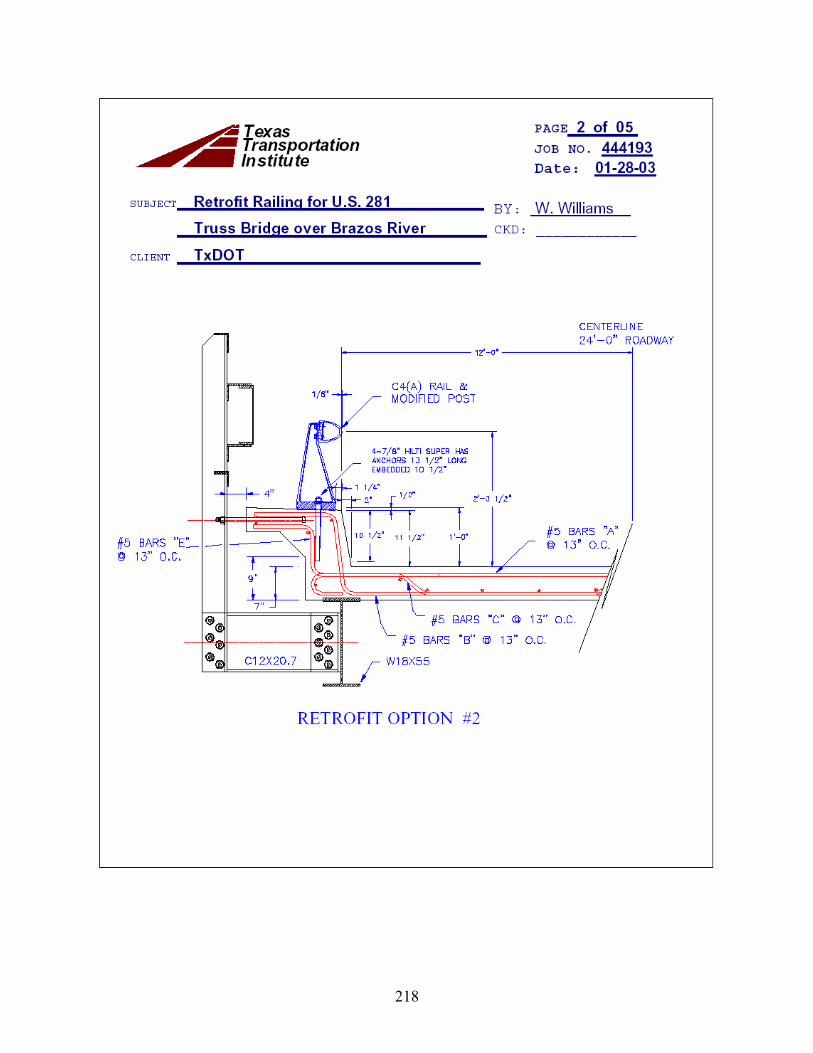
218
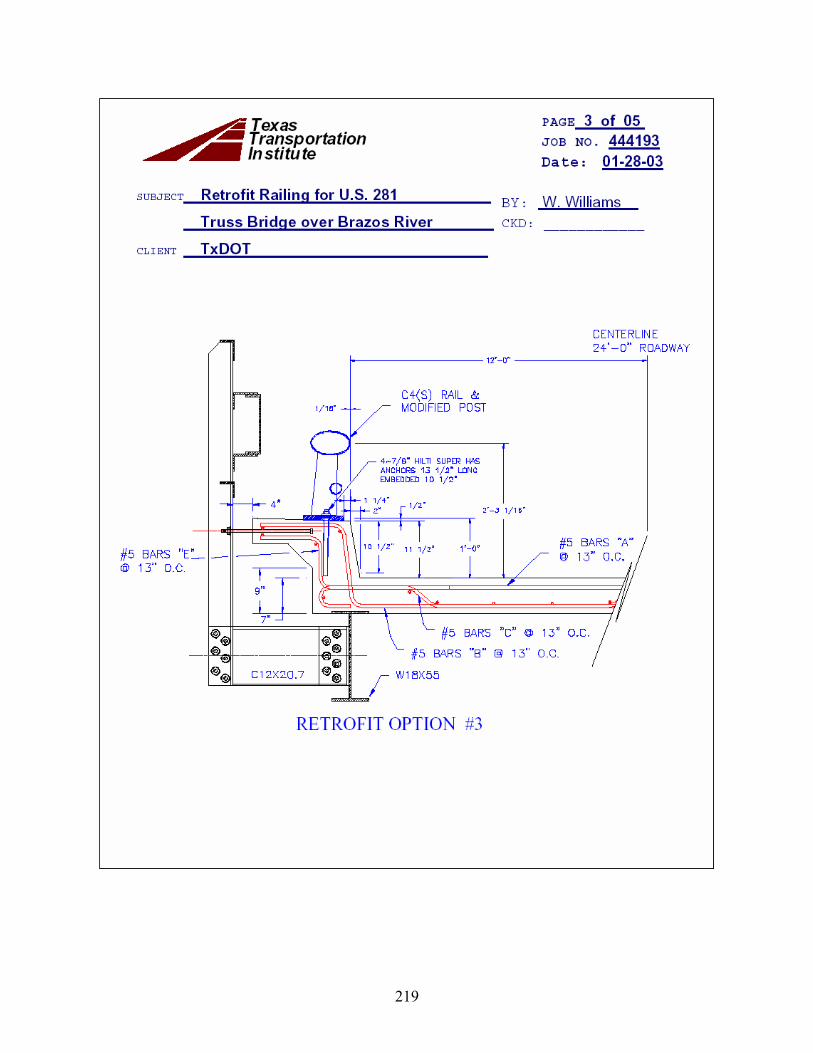
219
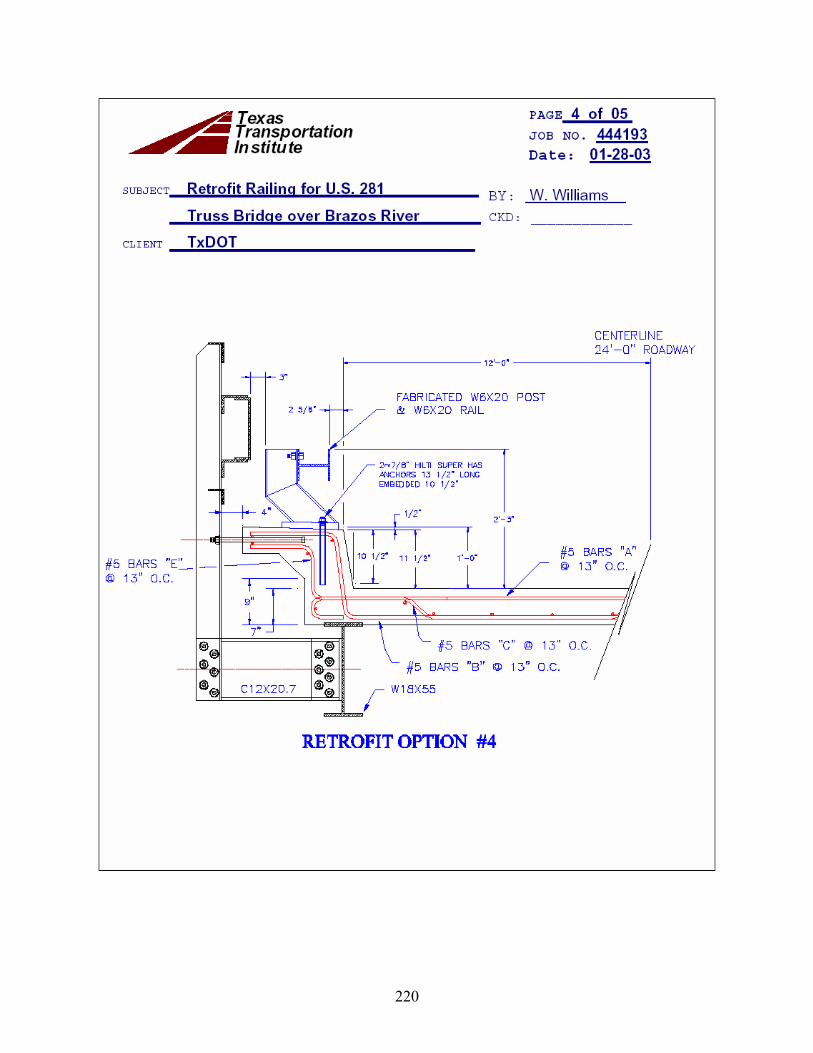
220
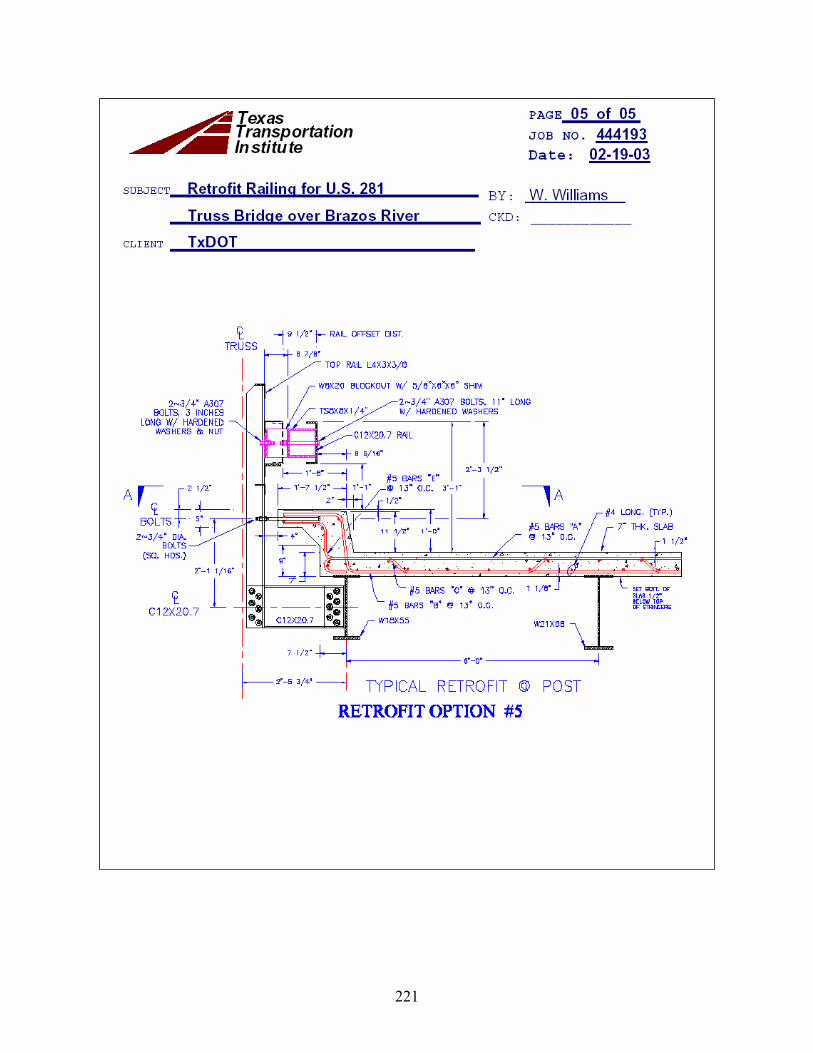
221
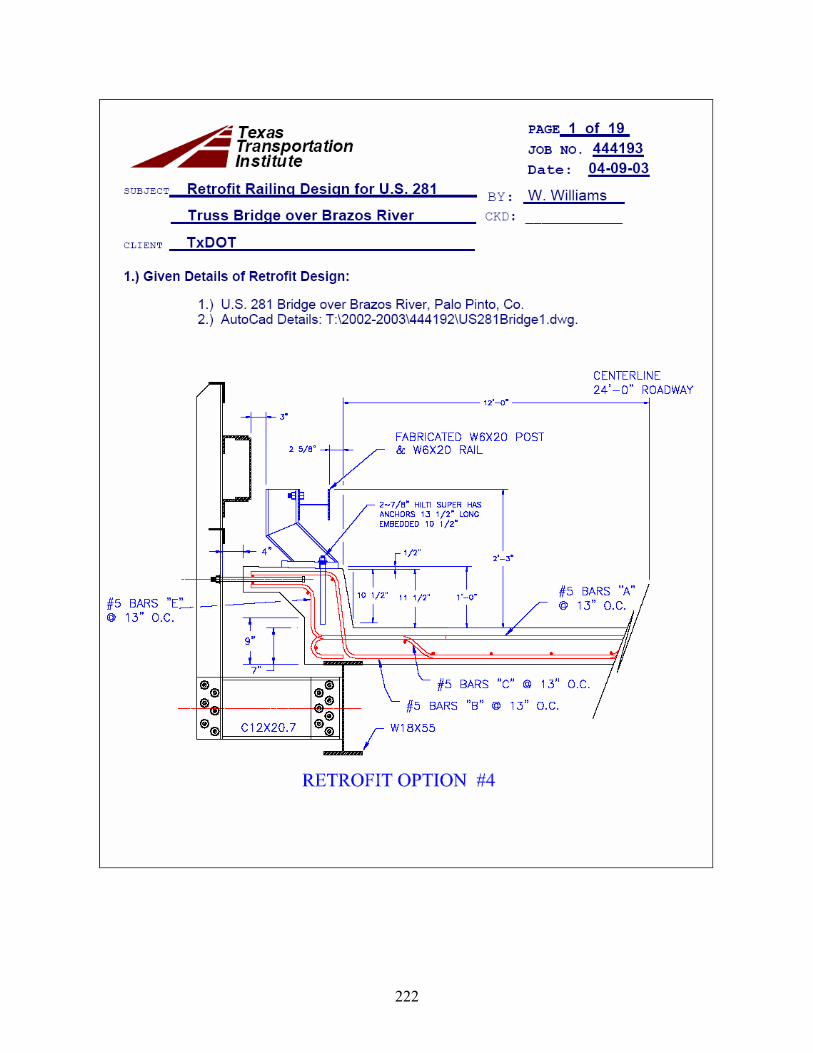
222
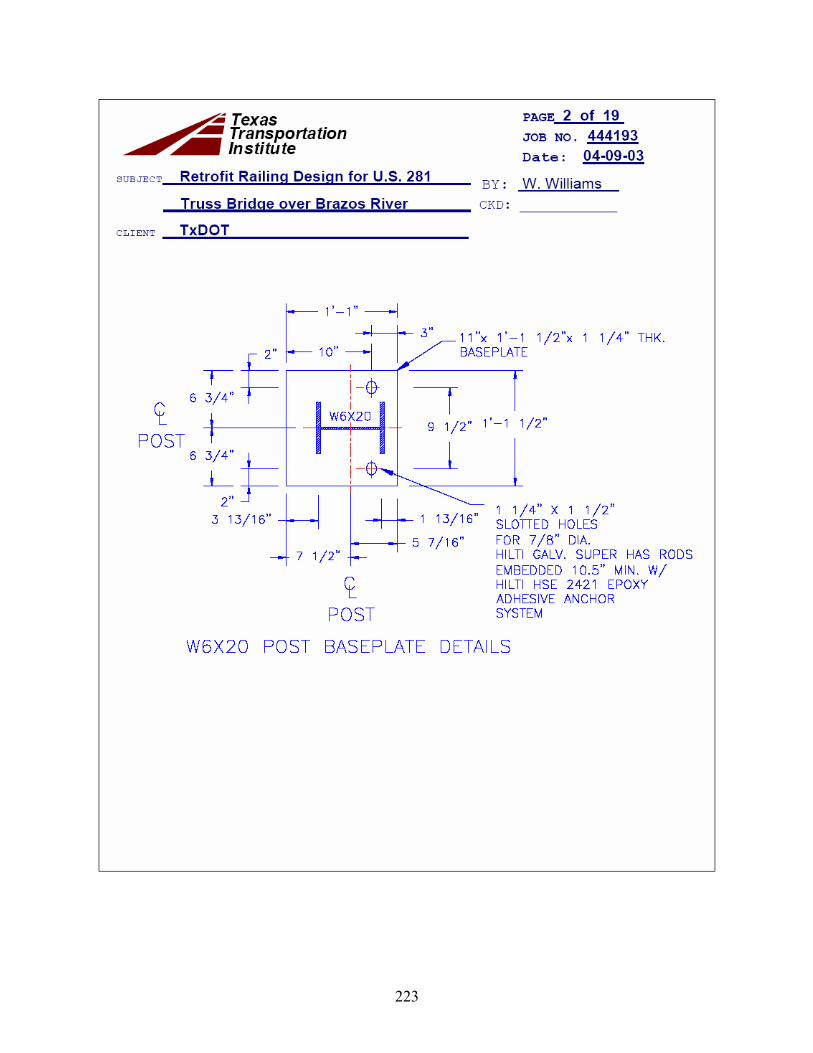
223
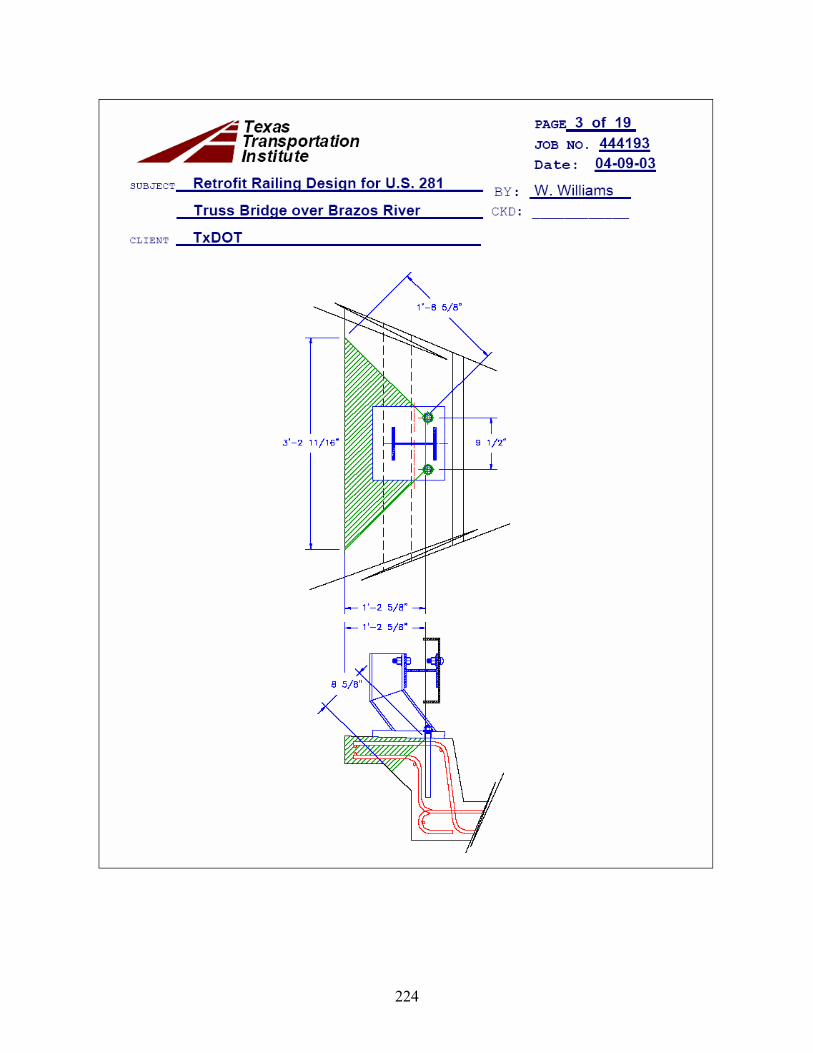
224

225
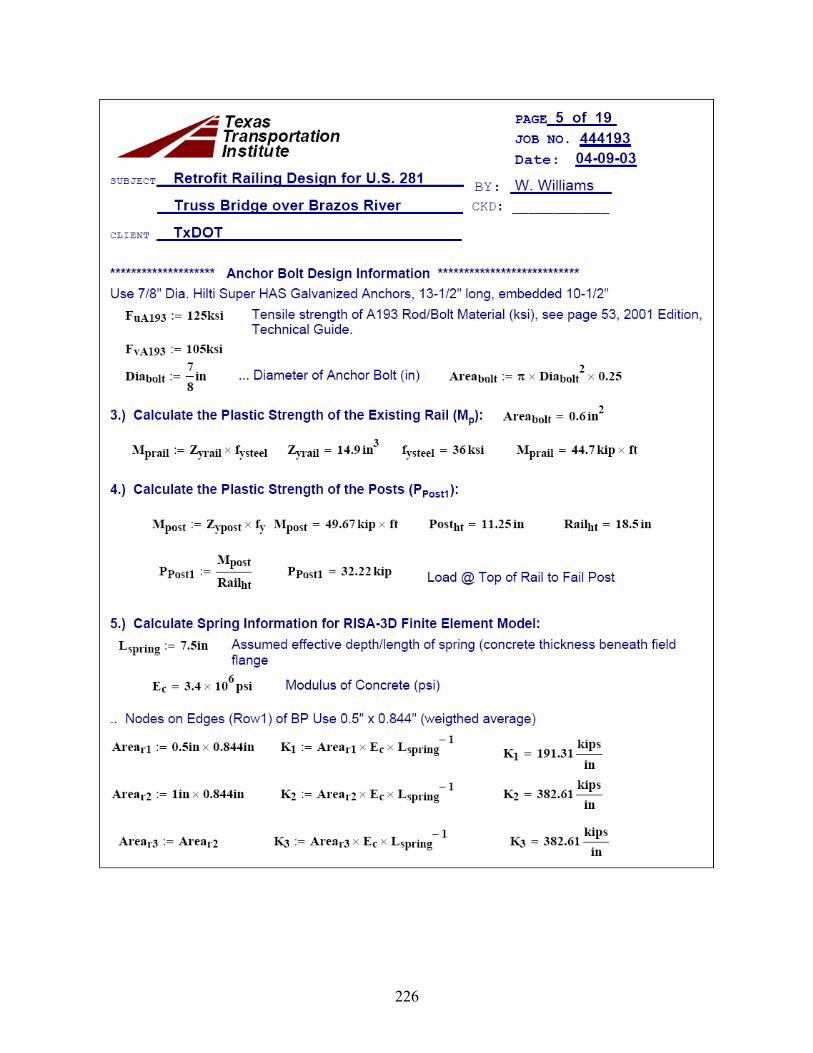
226
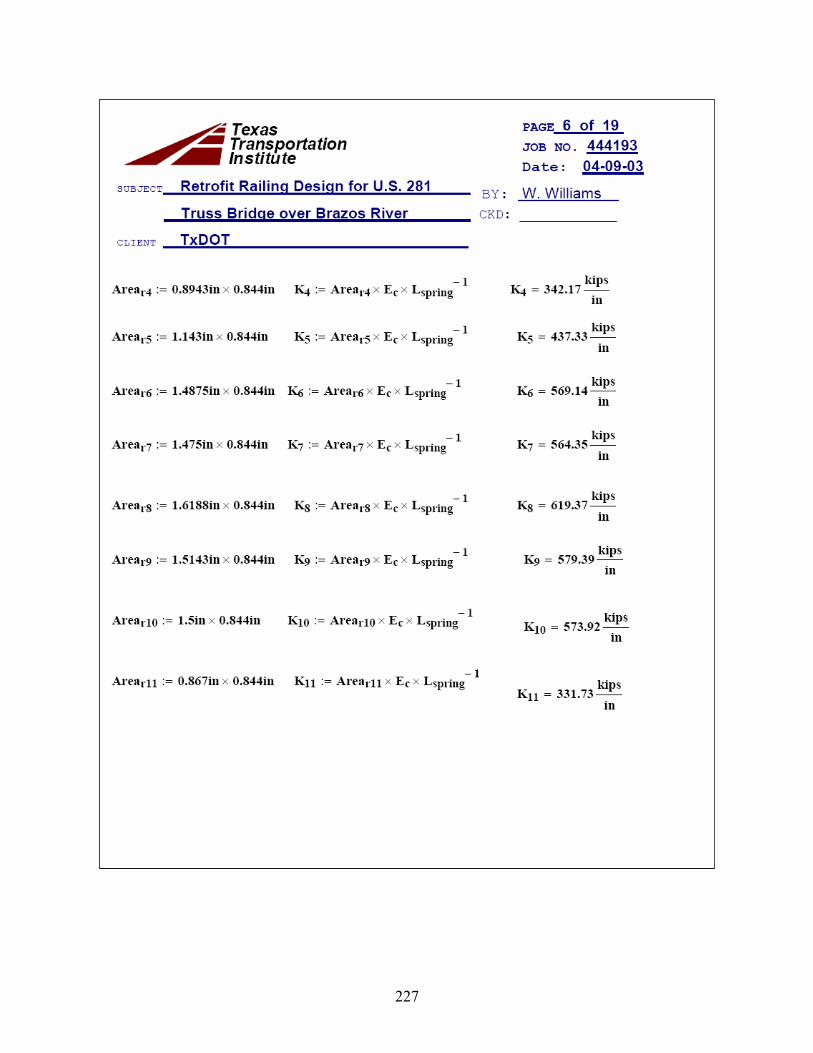
227
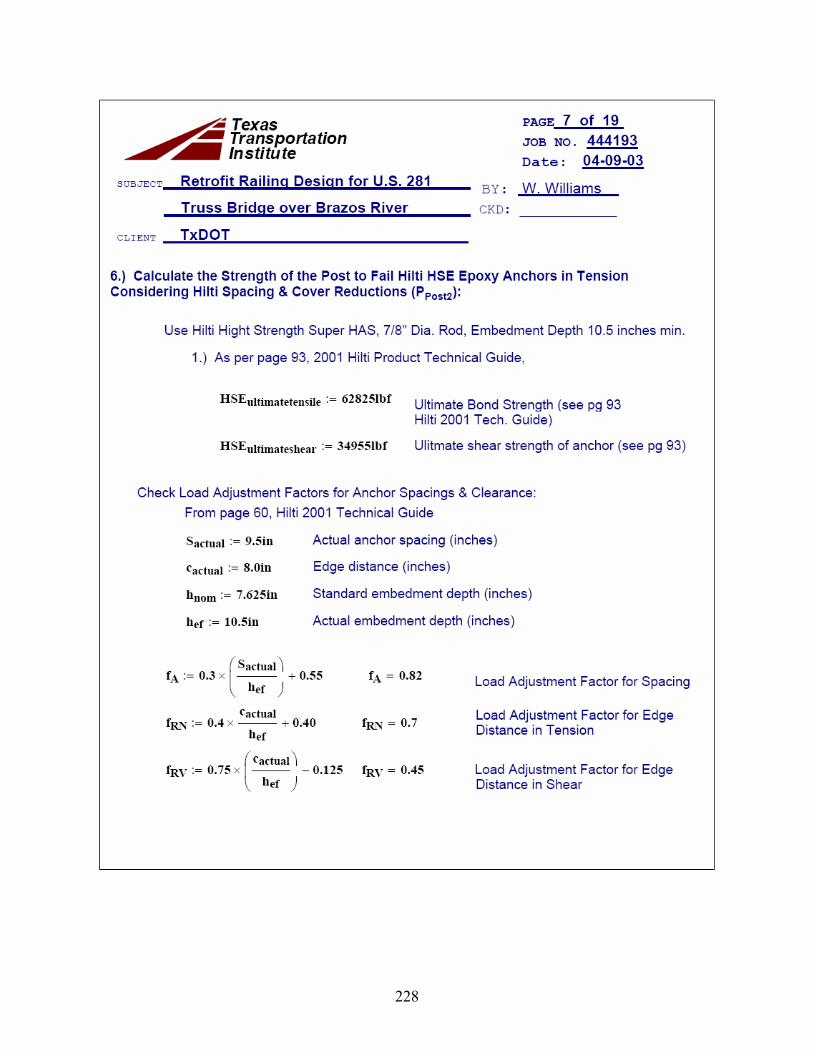
228
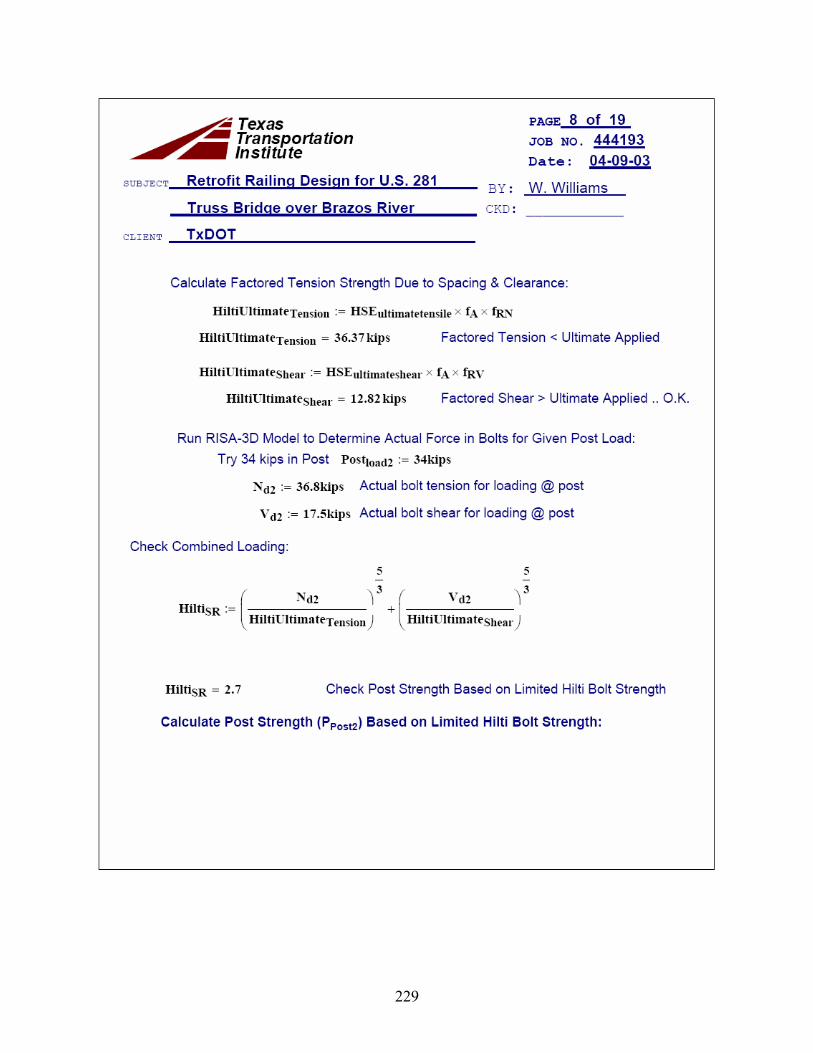
229
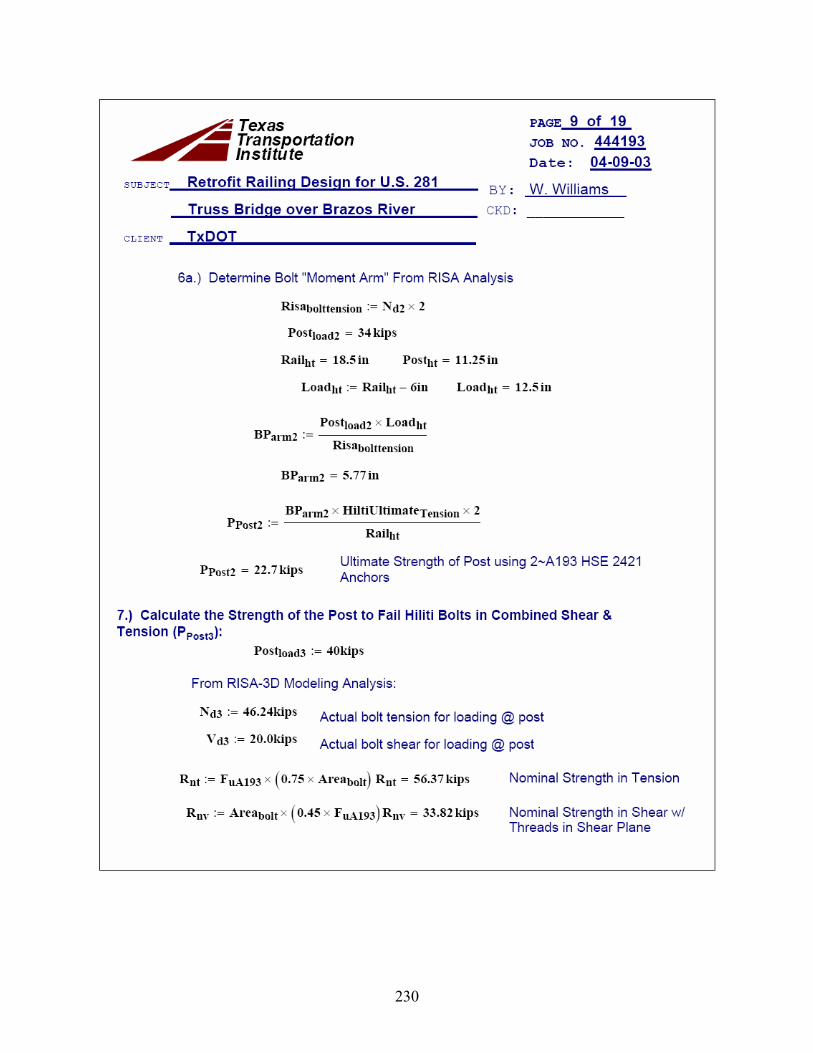
230
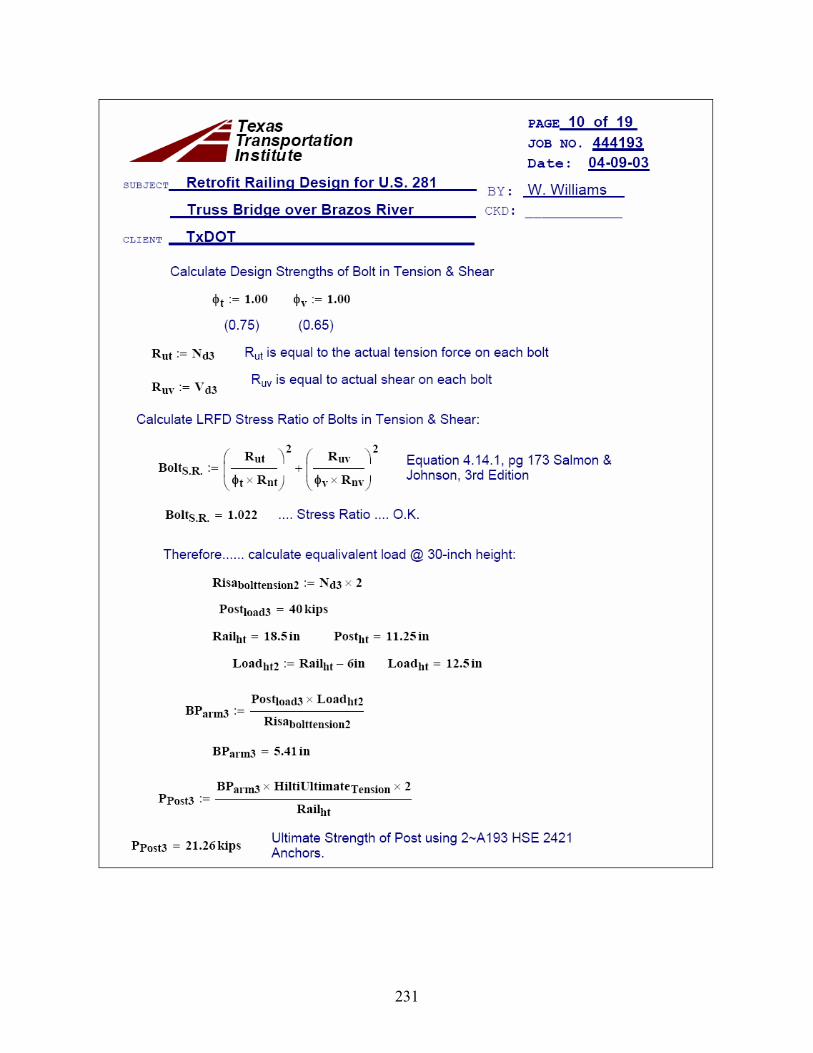
231
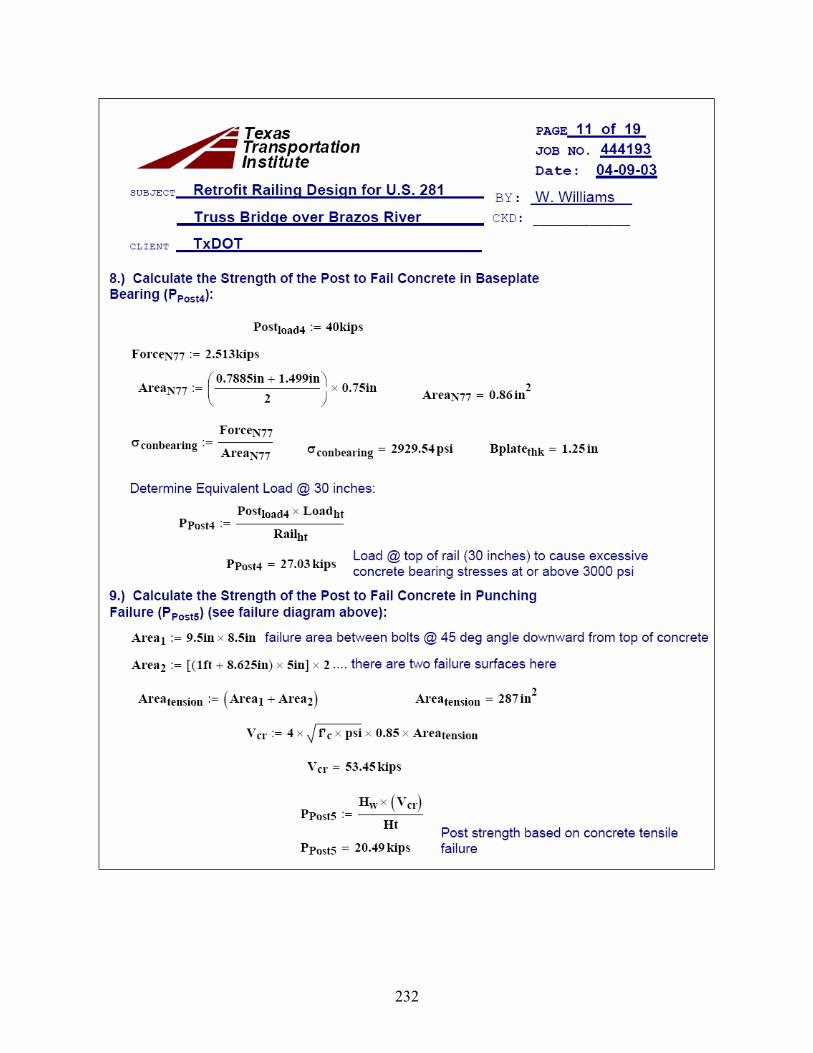
232
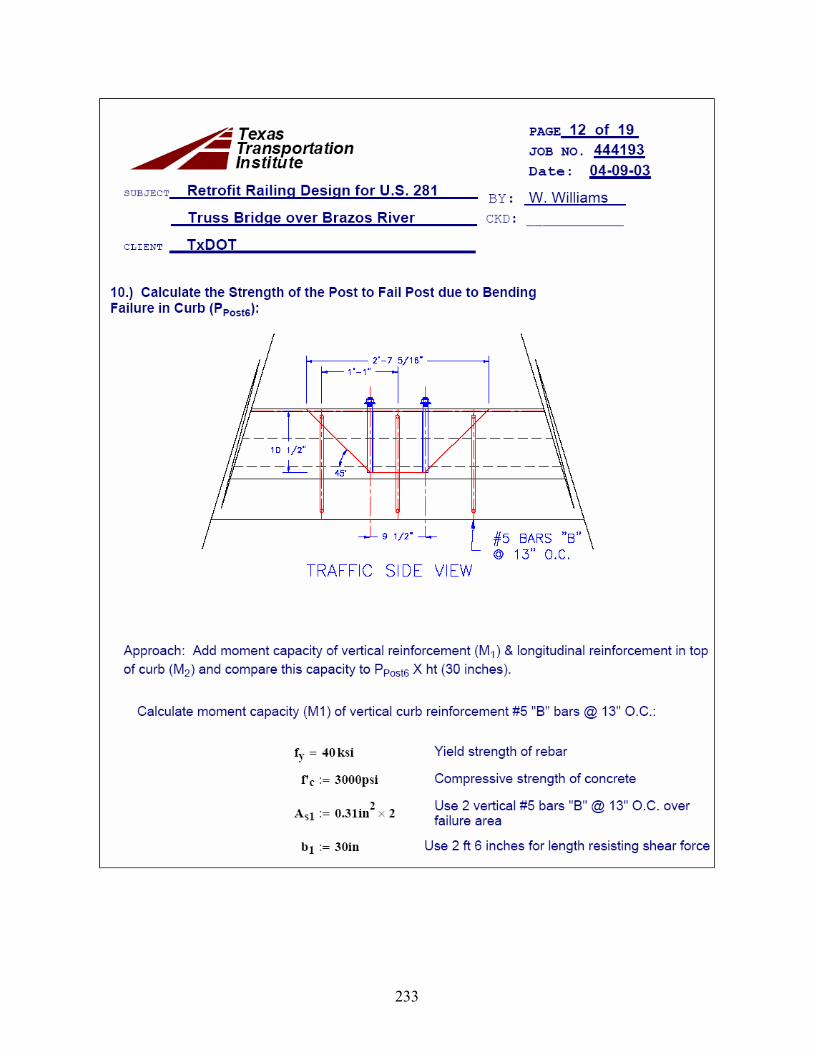
233
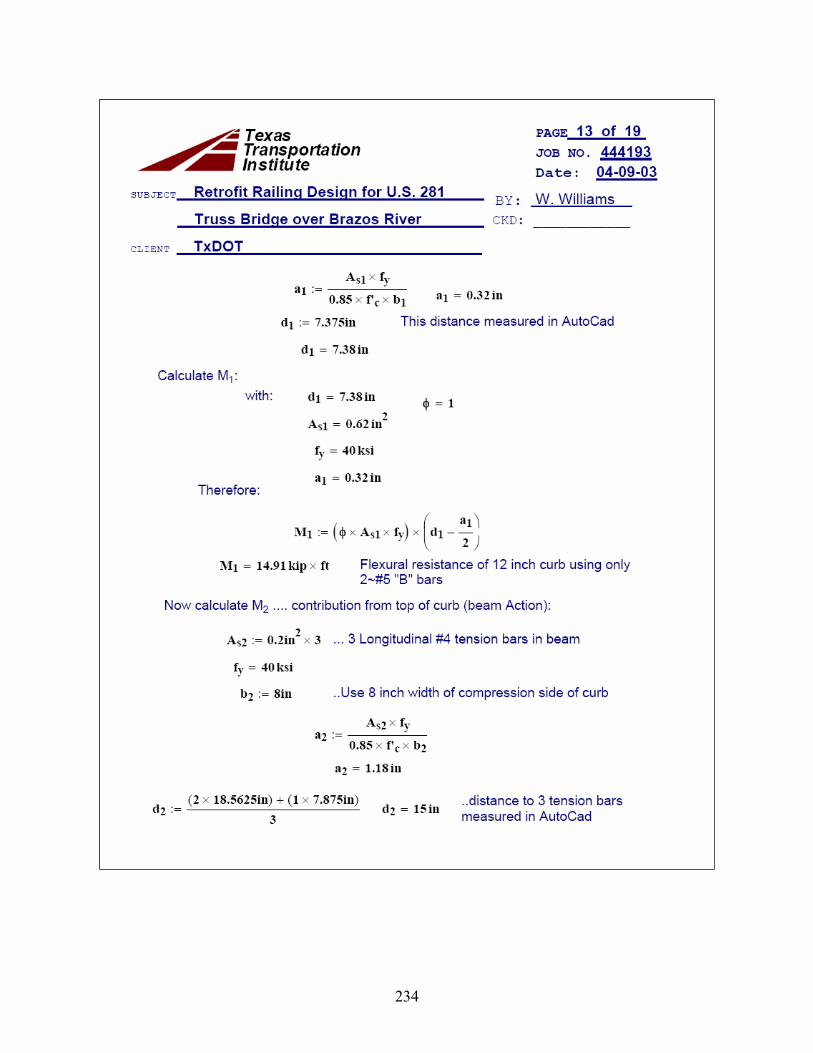
234
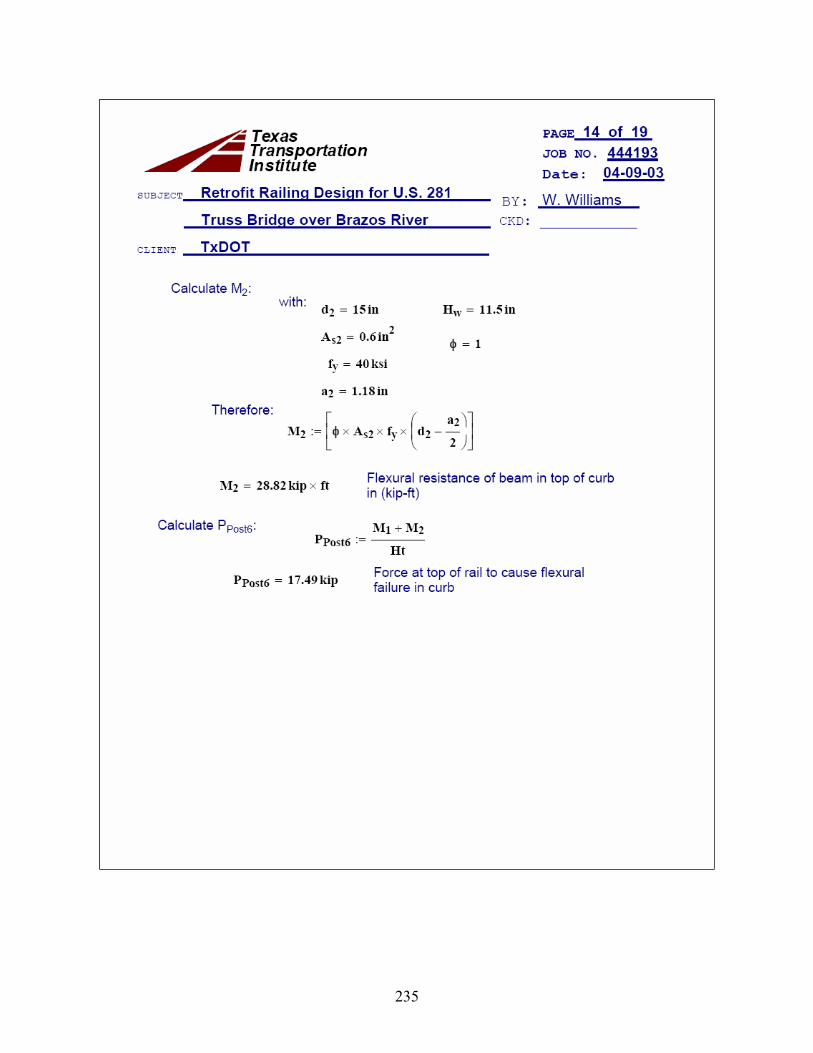
235
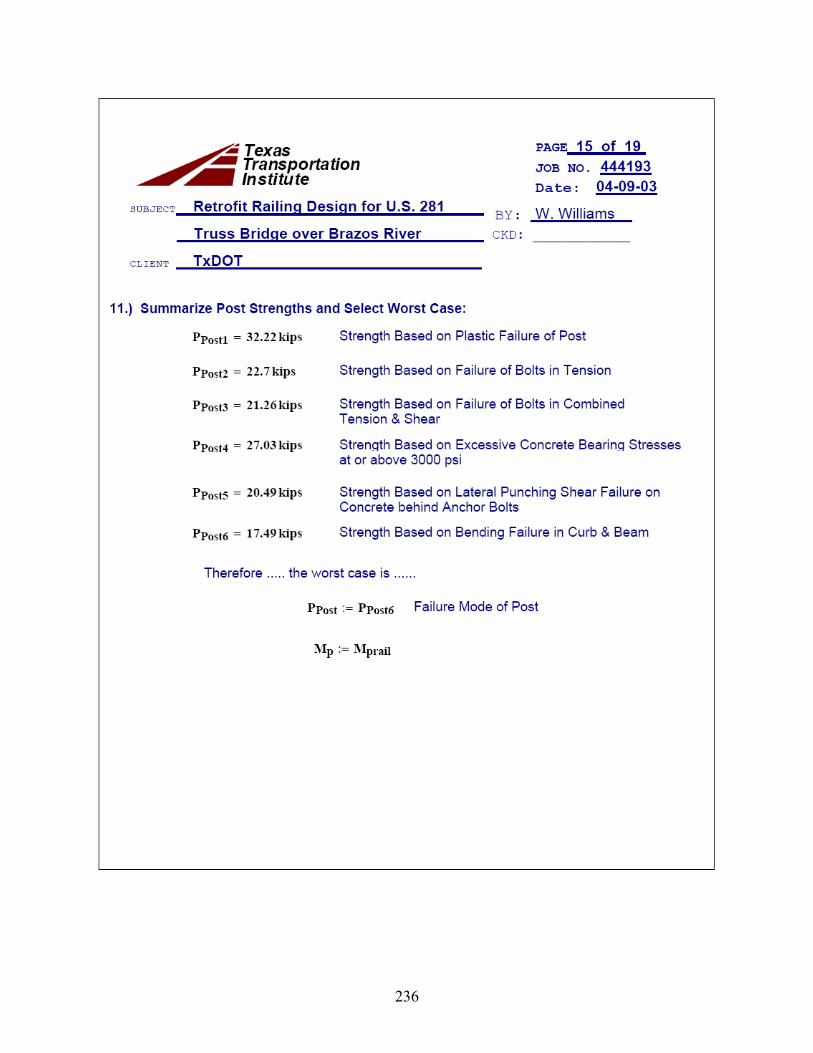
236
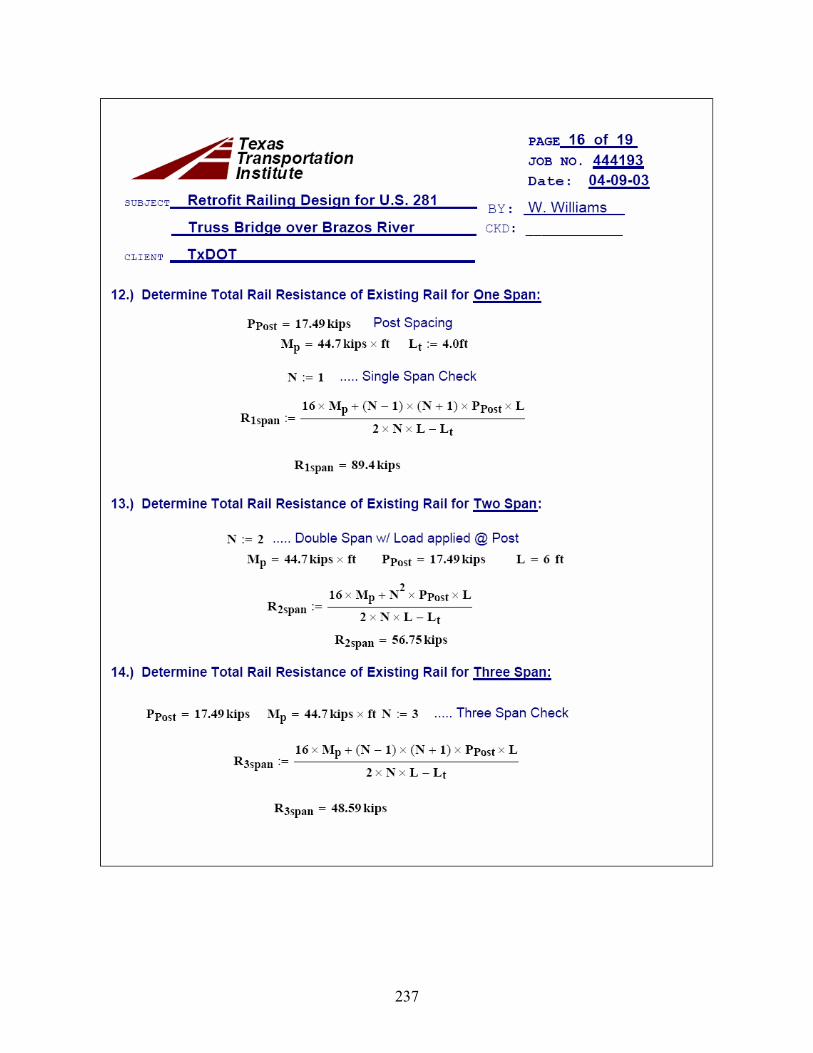
237
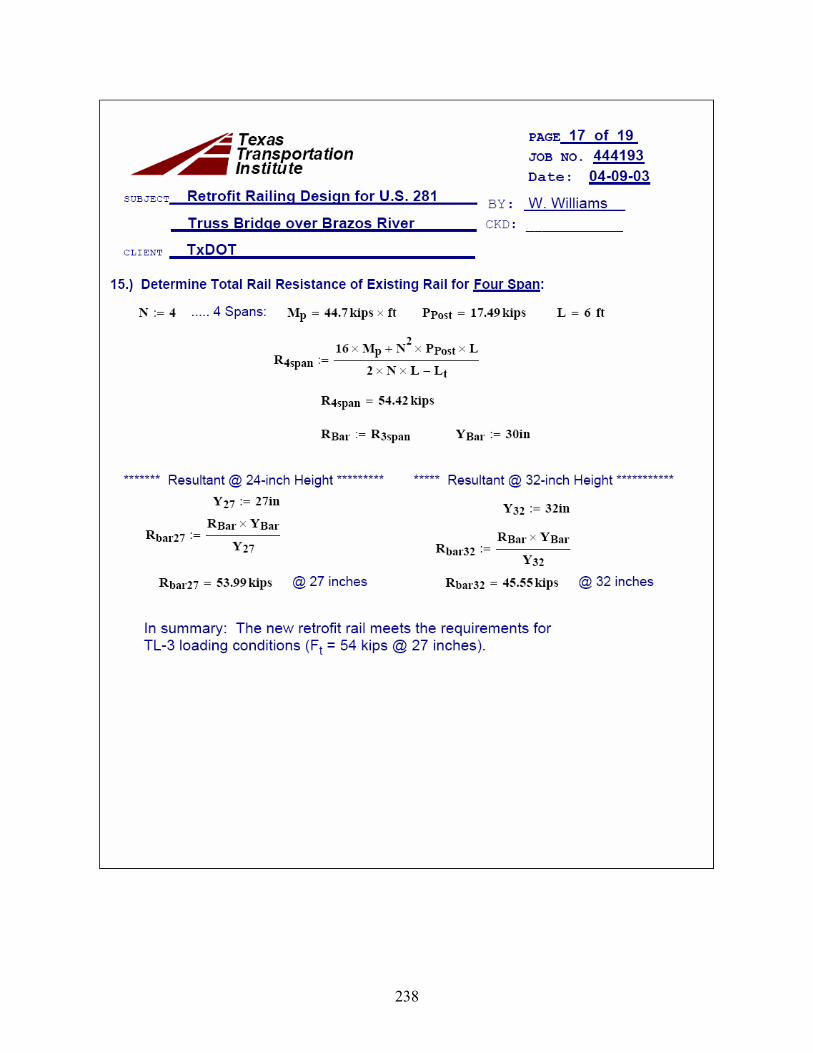
238
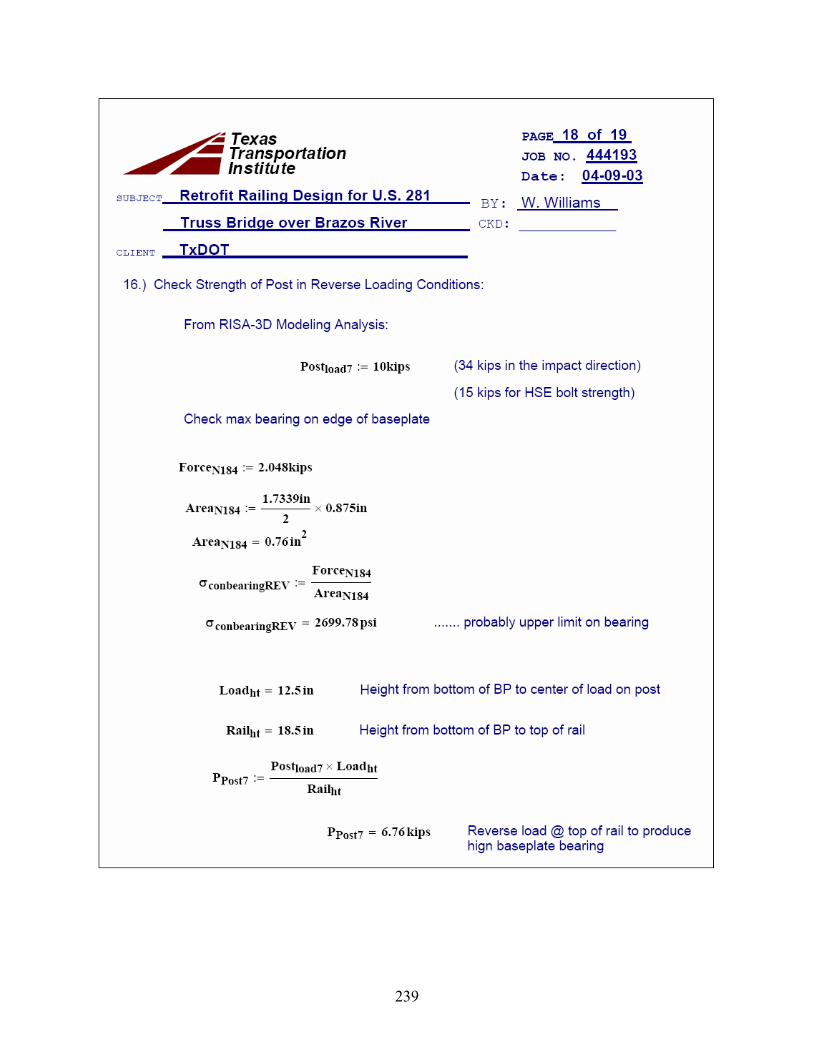
239
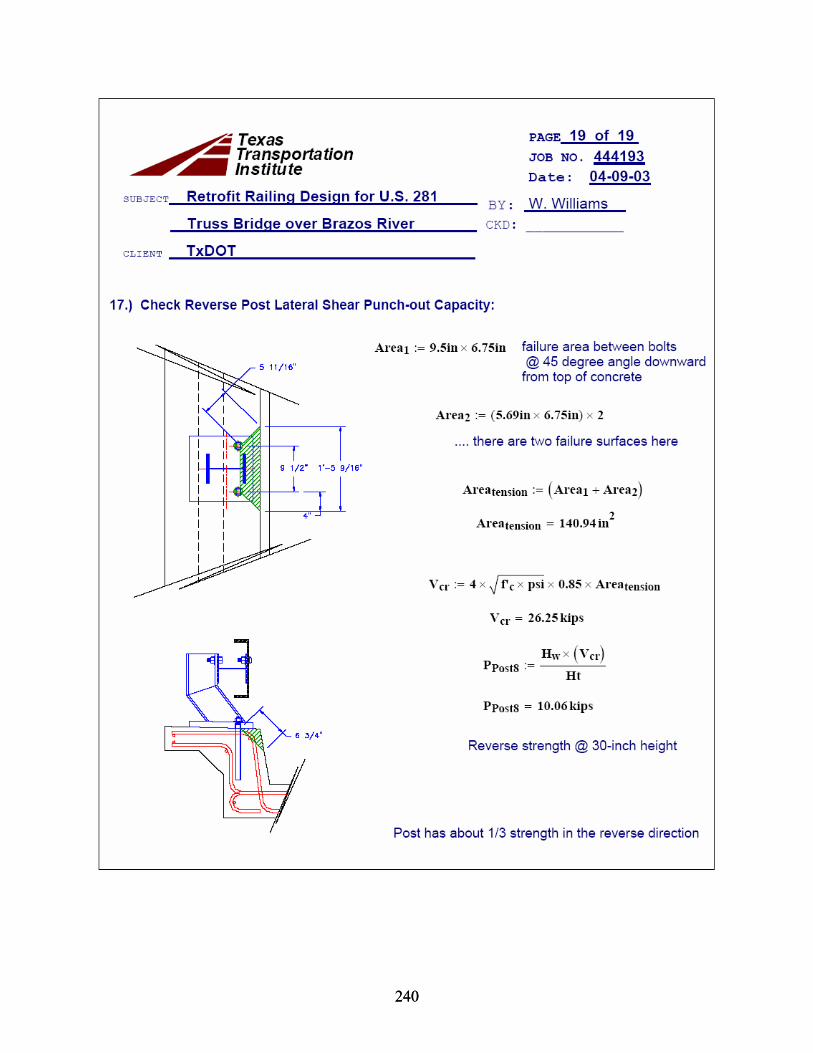
240 240
APPENDIX H. ANALYSES OF BRIDGE RAIL DESIGN FOR NEW TRUSS BRIDGES
Results of the analyses performed to develop a bridge rail design for new truss bridges are presented in this appendix.
A cross section and other details of the proposed railing are shown on pages 1 of 16 and 2
of 16 of the following calculations. The railing design provides two tubular steel rail elements mounted on crushable blockouts made from 10-inch (254 mm) diameter schedule 80 pipe. Total height of the railing above the top of the deck is 2 ft 6 inches (0.8 m), and the traffic face presents suitable geometry.
Finite element modeling was performed on several sizes of crushable pipe blockouts
using the computer modeling program LS-DYNA. The blocks were loaded with diametrically opposing plates. The crushable pipe blockouts ranged in size from 6-inch (152 mm) diameter schedule 40 pipe to 10-inch (254 mm) diameter schedule 80 pipe. Five of the seven blockouts were 6 inches (152 mm) in length and the remaining two were 8 inches (203 mm) in length. Tabulations of force versus crush data for the various blockouts are presented on page 3 of 16 through 6 of 16 and are plotted on page 7 of 16.
A 10-inch (254 mm) diameter schedule 80 blockout was selected for the new railing
design, and the plot for that blockout is shown on page 8 of 16. For further calculations of the behavior of the proposed railing, the crush characteristics of the blockout were idealized as two straight lines having slopes of 12 kips/inch (2.1 kN/mm) and 0.8 kips/inch (0.14 kN/mm).
Structural analyses of several different railing designs using the results obtained from the
crushable pipe blockouts were performed using STAAD.Pro. Considering TL-3 conditions and using a two-rail bridge rail system, the analyses performed for each design consisted of 27 kips (120 kN) distributed over a length of 4 ft (1.2 m) at different locations along the rail. Analyses were performed on several different combinations of rail and crushable pipe blockout types using five continuous spans with span lengths ranging from 10 to 20 ft (3.0 to 6.1 m). Analyses were performed on each rail/crushable pipe combination with the 27 kips (120 kN) distributed over 4 ft (1.2 m) located at the following:
• mid-span, • centered over a crushable pipe support located within the length of the rail
(vertical truss member support), and • over a crushable pipe support located at the end of the rail element.
Results of these analyses are presented on pages 9 of 16 through 16 of 16 of the following calculations.
241

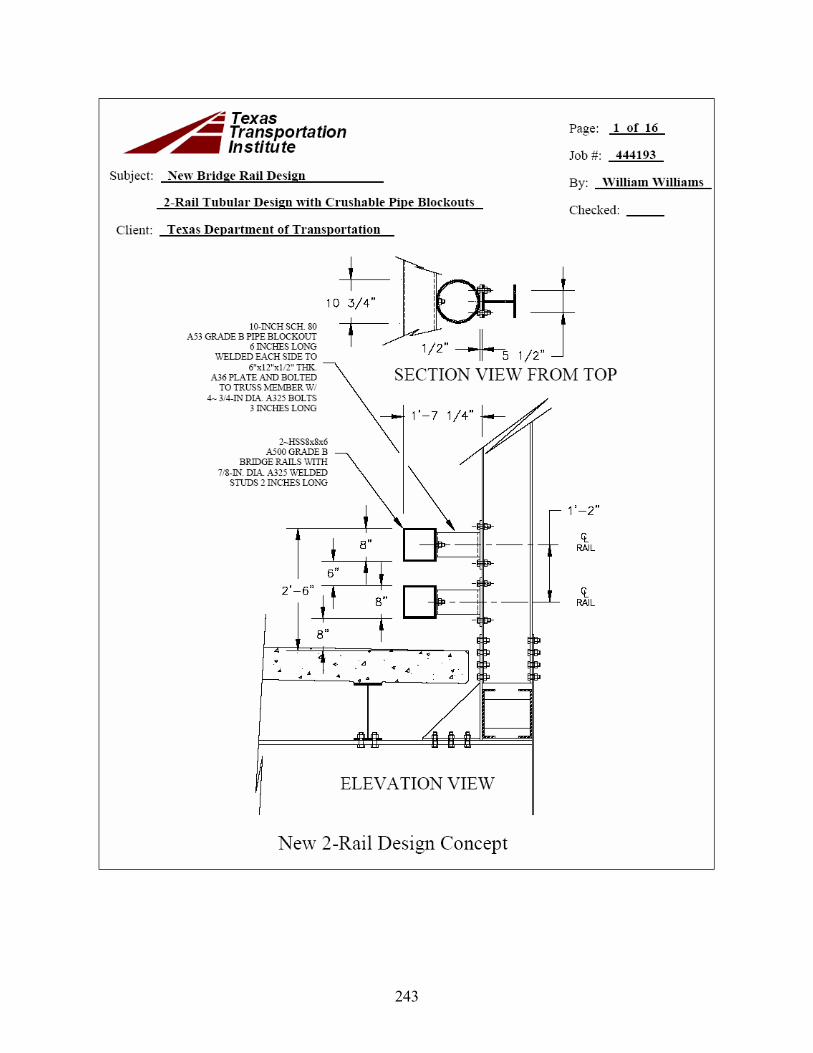
243
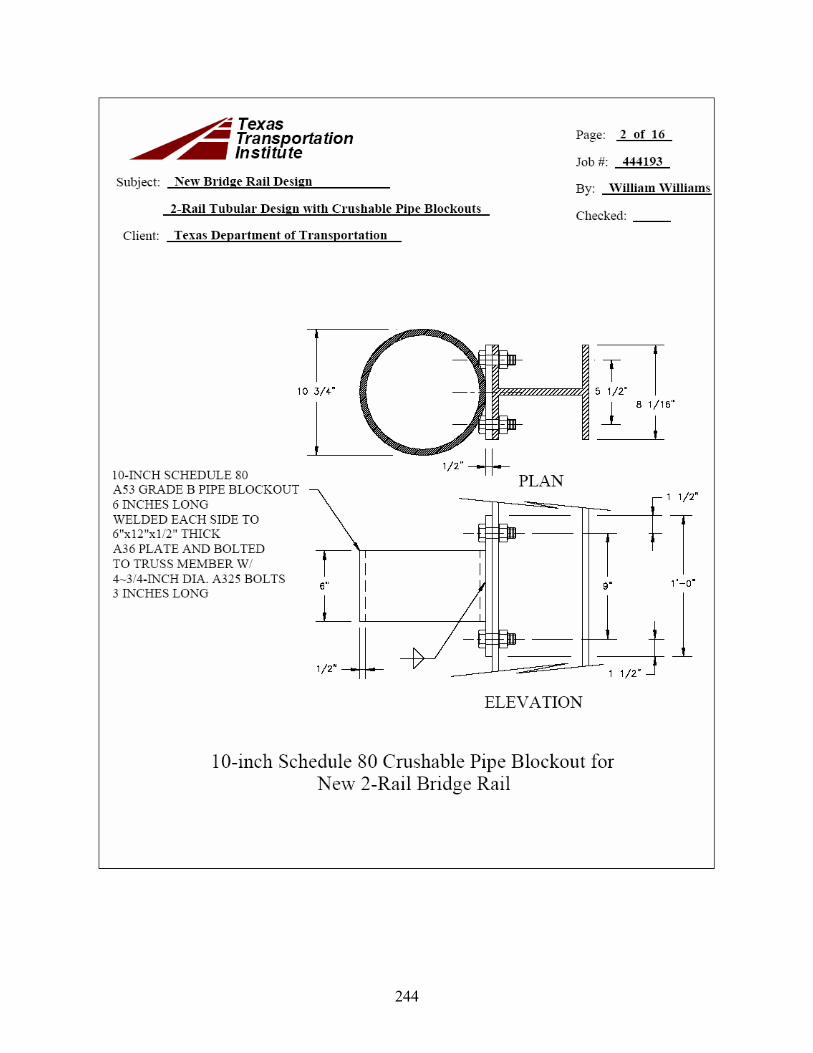
244

245

246
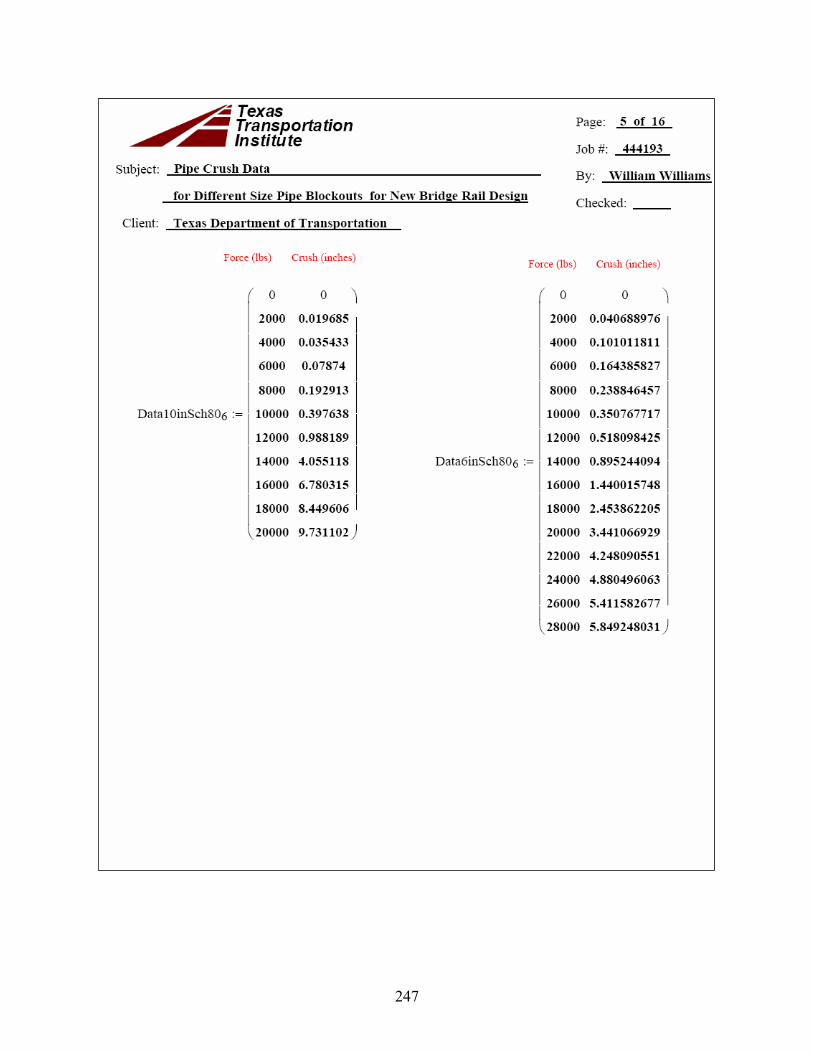
247
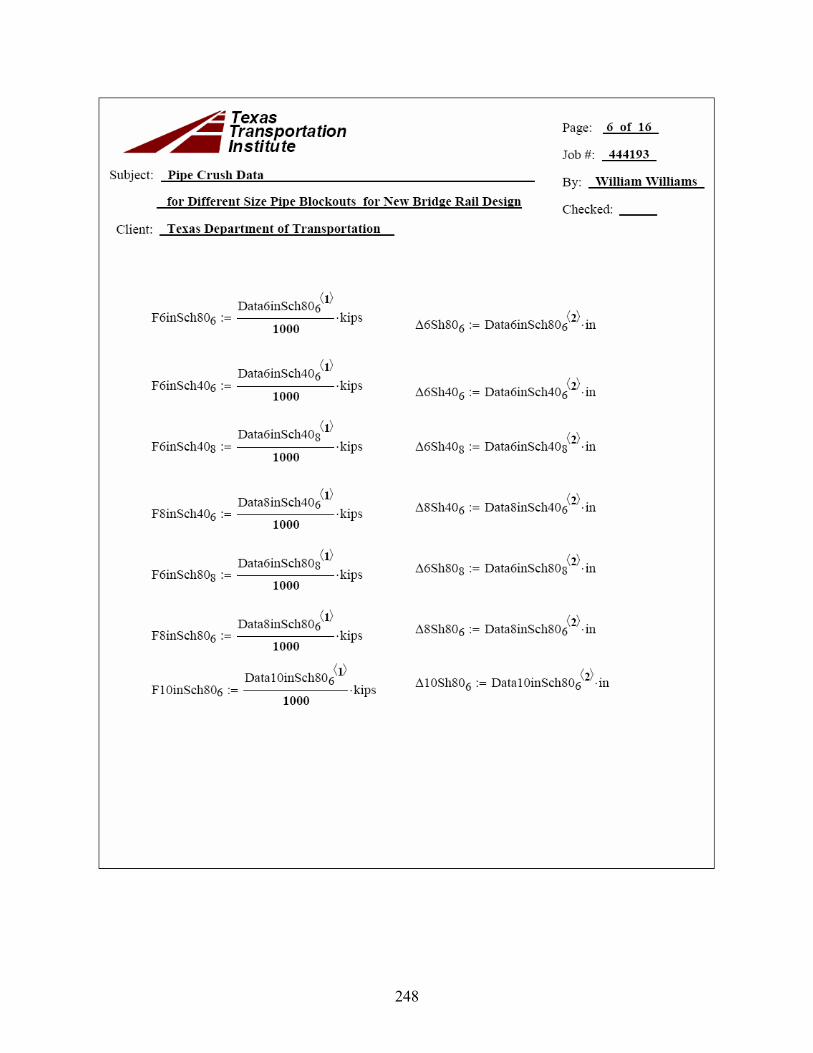
248
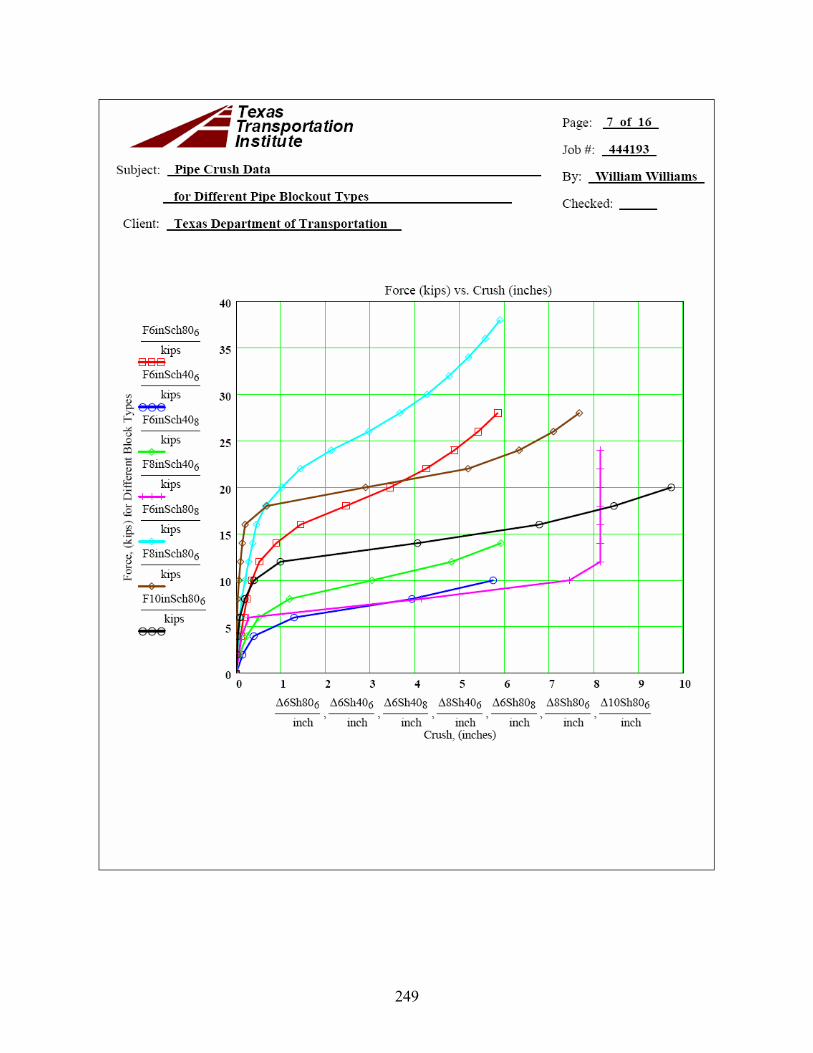
249

250
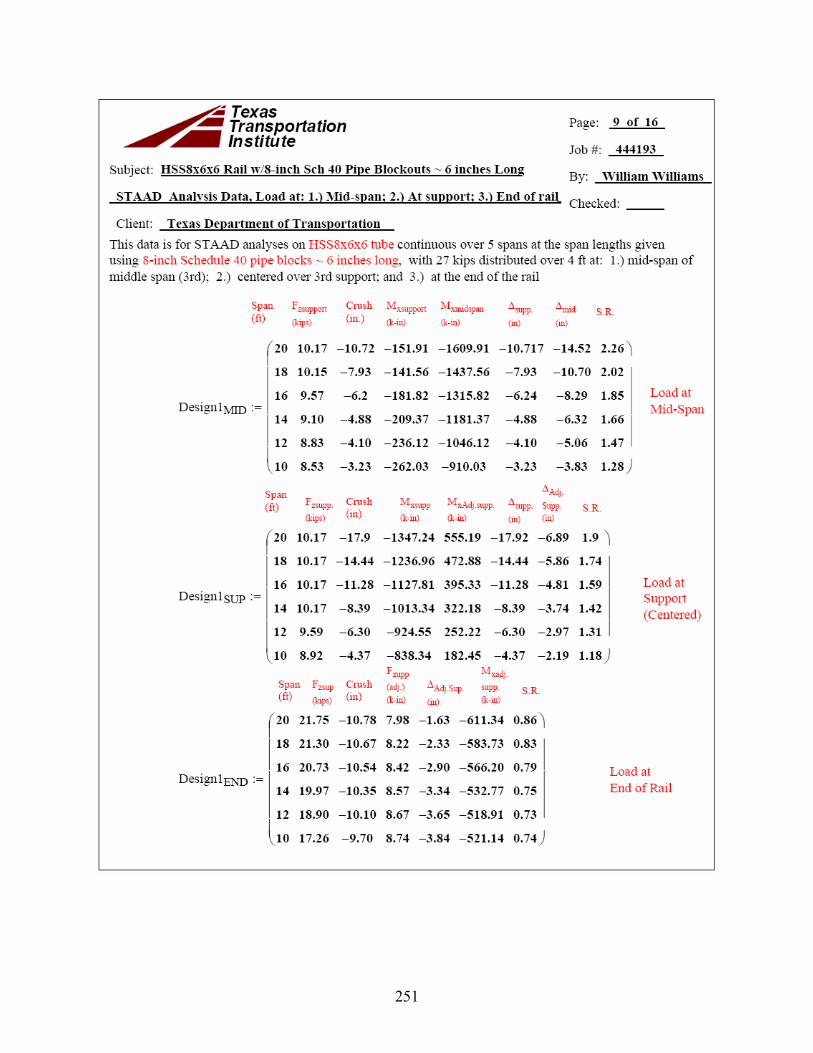
251
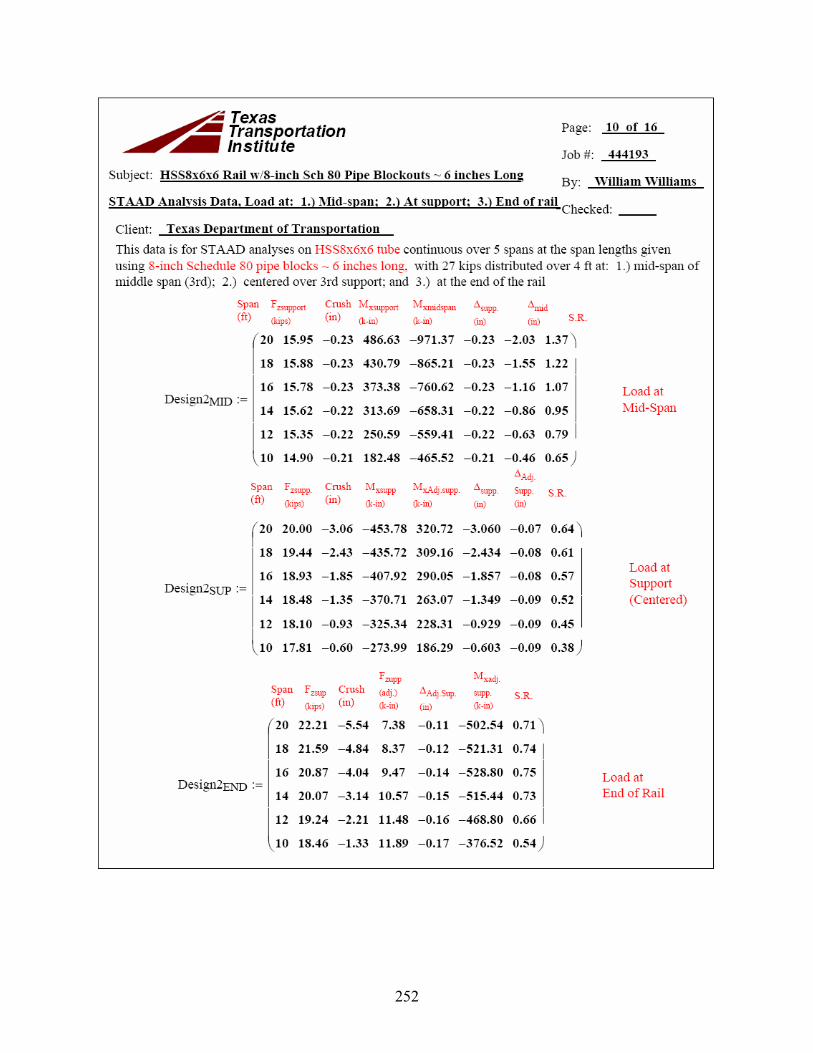
252
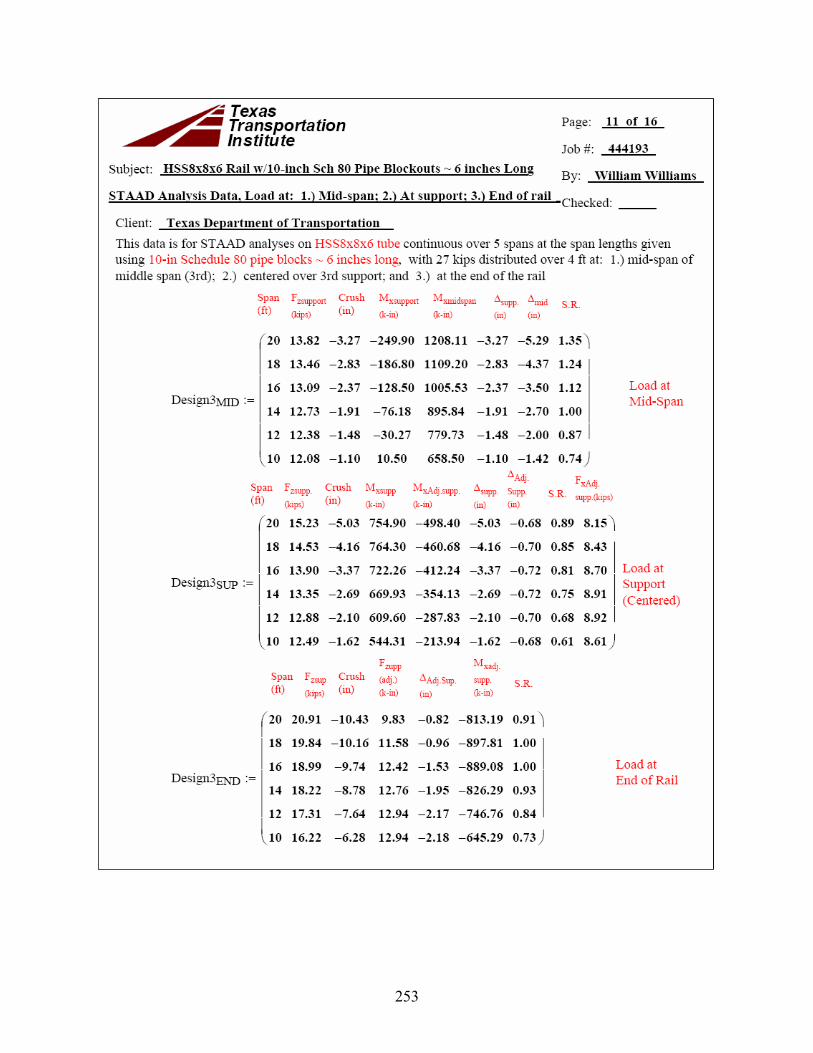
253
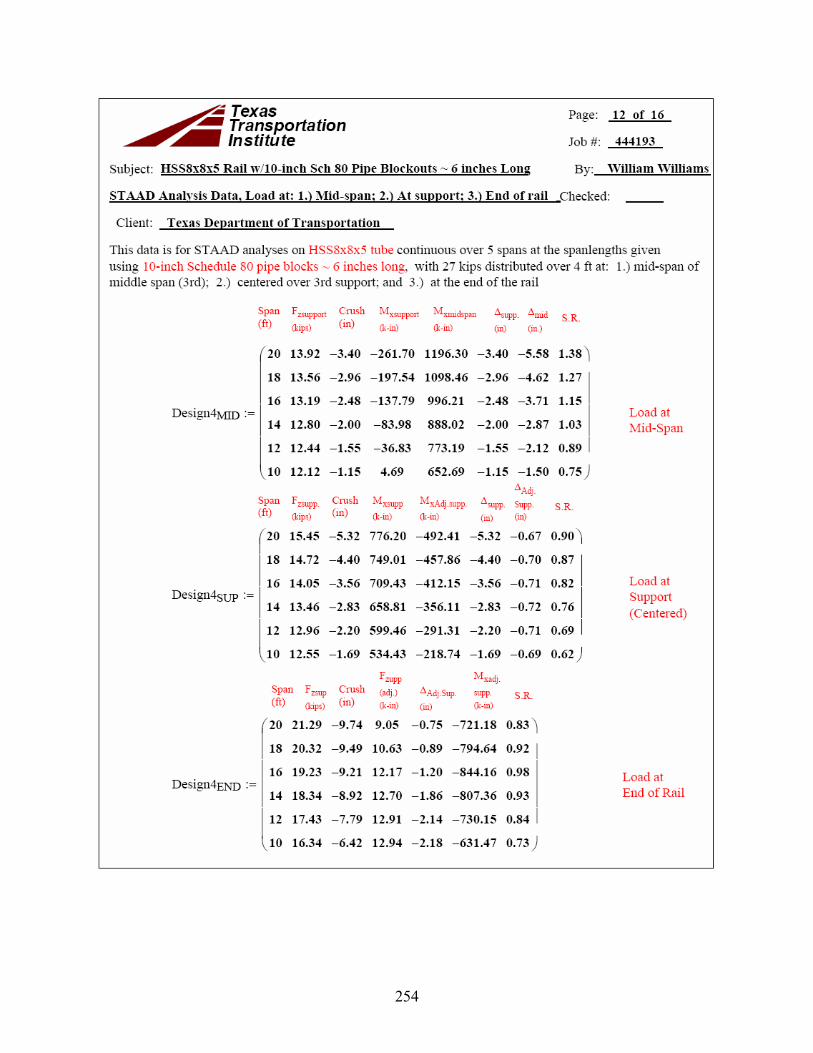
254
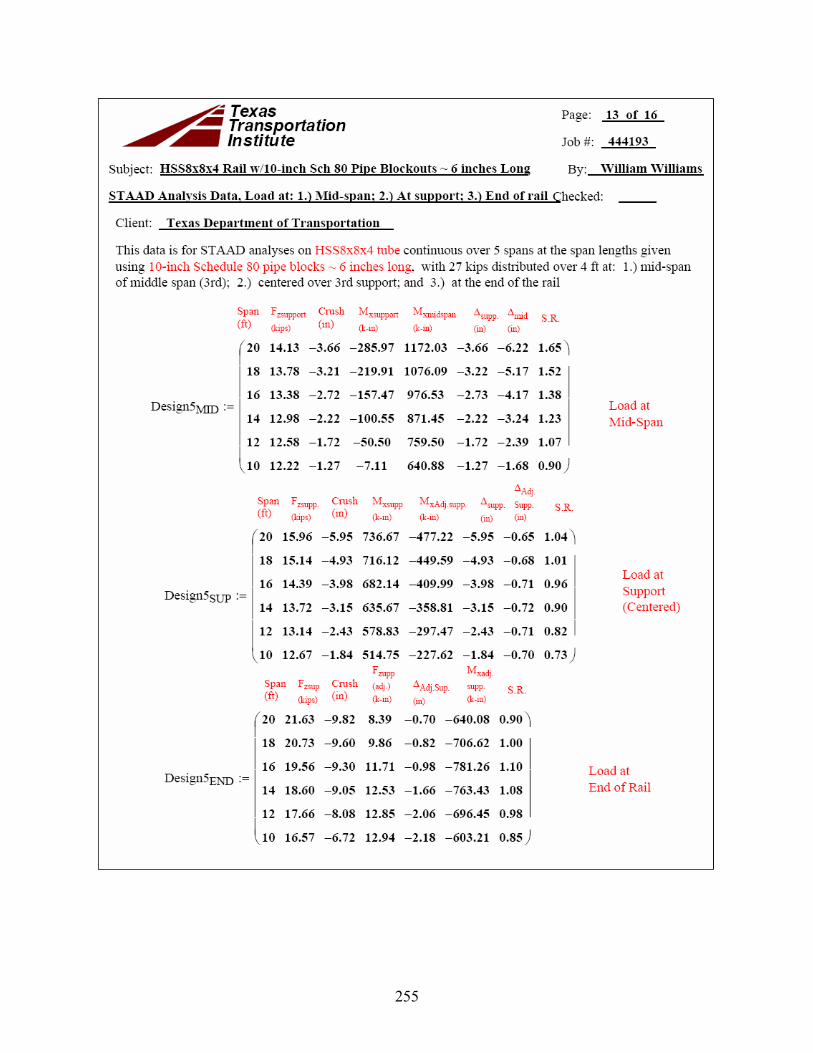
255
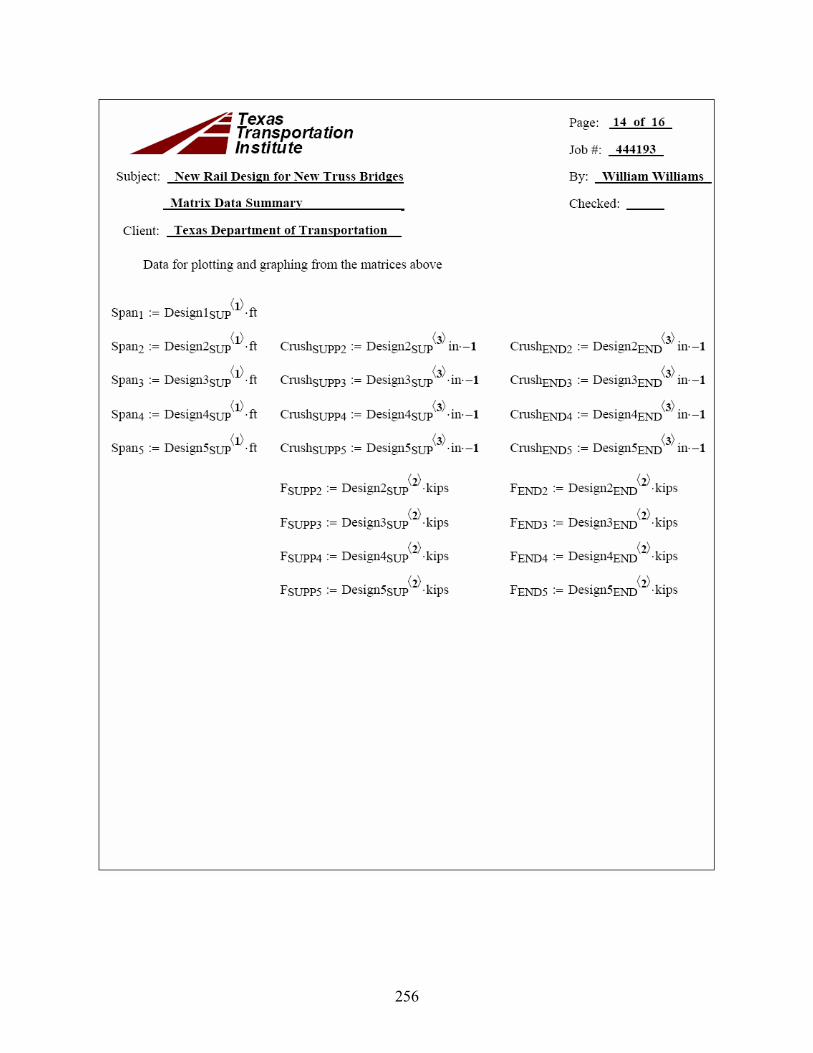
256
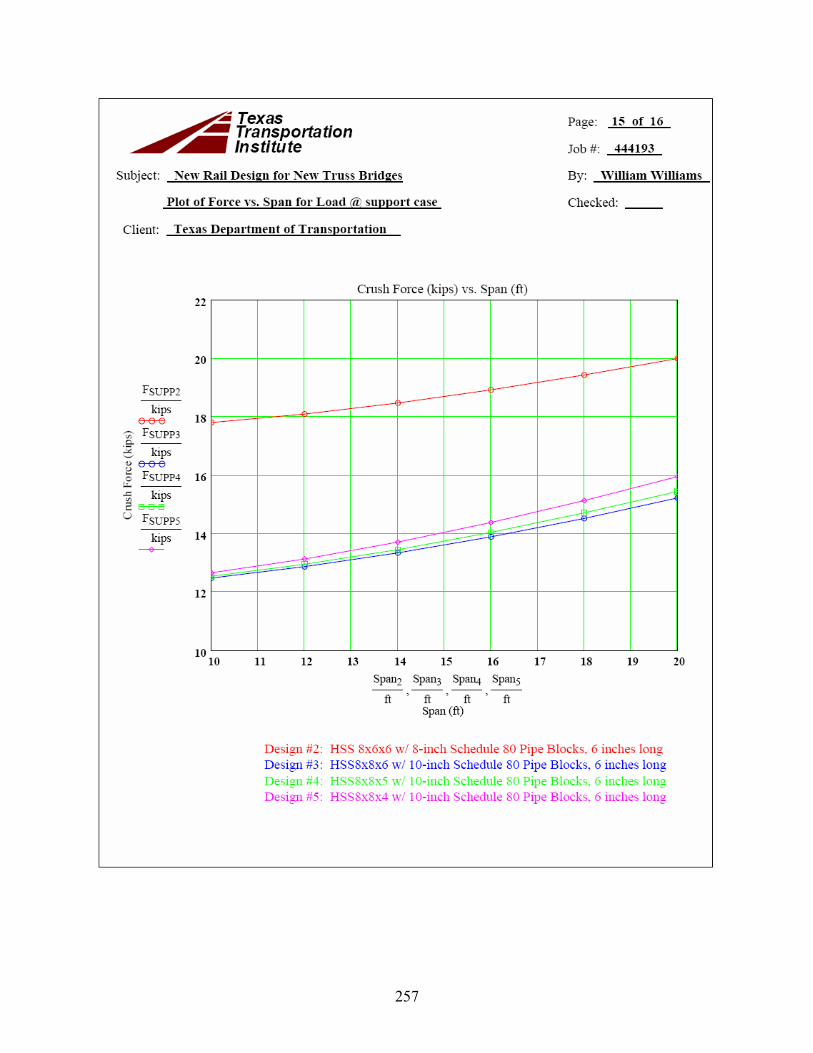
257
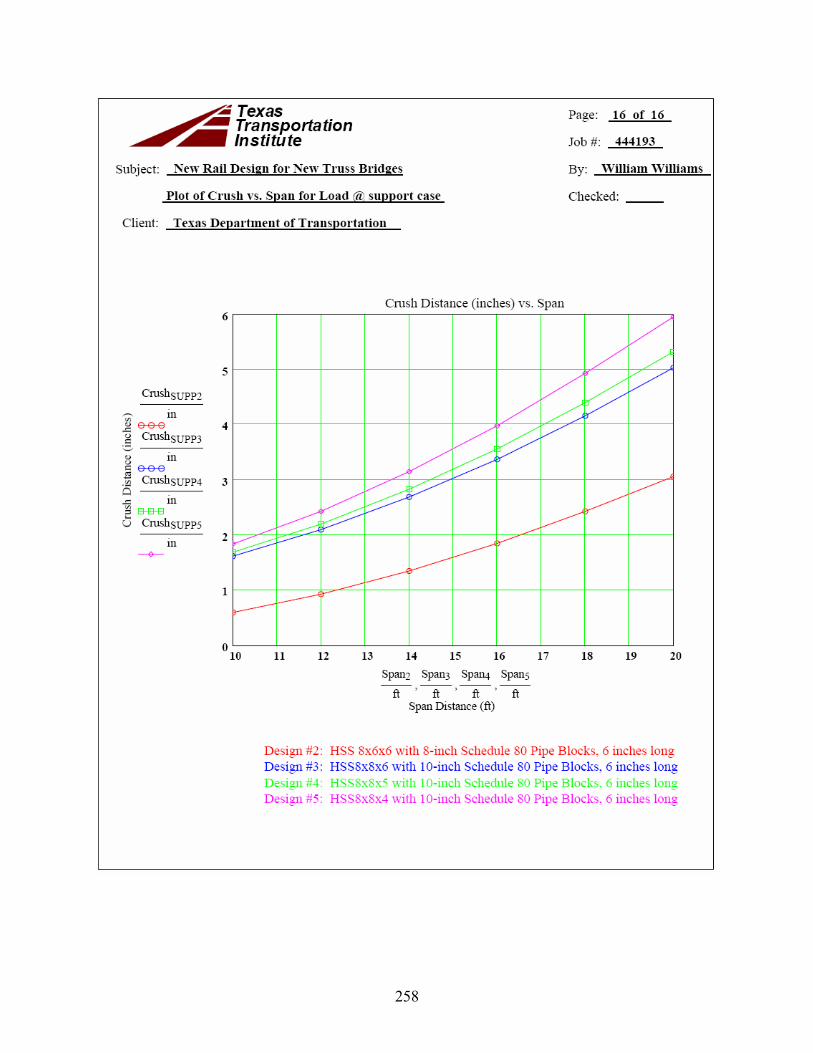
258