Embed Size (px)
Citation preview

Retrofitting of infilled RC frames using collar jointed masonry
By
Chuanlin Wang
Submitted in accordance with the requirements for the degree of
Doctor of Philosophy
The University of Leeds
School of Civil Engineering
January 2017

The candidate confirms that the work submitted in his own and that
appropriate credit has been given where reference has been made to the
work of others.
This copy has been supplied on the understanding that it is copyright
material and that no quotation from the thesis may be published without
proper acknowledgement.
The right of Chuanlin Wang to be identified as Author of this work has been
asserted by him in accordance with the Copyright, Designs and Patents Act
1988.
© 2016 The University of Leeds and Chuanlin Wang

Acknowledge
The research work presented in this thesis was funded by the China
Scholarship Council (CSC) and the University of Leeds, UK, which are
gratefully appreciated. It was undertaken at the School of Civil Engineering,
the University of Leeds since September 2012.
Firstly, I would like to express my sincere gratitude to my supervisors
Professor John P. Forth and Dr Nikolaos Nikitas for the continuous support
throughout my whole Ph.D. study and related research, for their patience,
motivation, and immense knowledge. I would also like to express my deep
appreciation to Dr Vasilis Sarhosis for his help and advice during my
research.
My sincere thanks also goes to all the technicians, especially, Peter Flatt,
Marvin Wilman, Stephen Holmes, and Robert Clarke, in the George Earle
Laboratory, for their assistance in my experimental work. Without their
precious support and help, it would not have been possible to conduct the
experiments. I would also like to thank MIDAS Group for their technical help
in the numerical work of this research.
I would also like to thank all my colleagues in the School of Civil Engineering
at the University of Leeds for the discussions and mutual help.
Last but not least, I would like to thank my parents and my sister for
supporting me spiritually throughout writing this thesis and my life in general.
i

Abstract
Masonry is a composite material made of masonry units bonded together
with mortar. A large number of historical buildings constructed using
masonry can be found all over the world. Little or no seismic loading was
considered when they were built. Therefore, masonry structures often need
to be retrofitted or strengthened. This research proposed a new
strengthening approach using a collar-jointed technique. Namely, the
approach is implemented by building another masonry wall parallel to the
existing single-leaf wall and bonding the two together using a mortar collar
joint. Furthermore, collar-jointed masonry wall construction is also a popular
construction system in reality. This thesis considers two different types of
collar wall strengthening applications: pre- and post-damaged walls. The
results found out that the pre-damaged strengthening could improve the
lateral resistance by about 50% while the post-damaged retrofitting can only
restore the initial strength.
A simplified micro-scale finite element model for fracture in masonry walls
was developed. The mortar joints and the brick-mortar interfaces are taken
to have zero-thickness. The bricks were modelled as elastic elements while
the brick-mortar interfaces were represented using a Mohr-Coulomb failure
surface with a tension cut-off and a linear compression cap. One feature of
the research was to identify the material parameters for the constitutive
model. The material parameters were tuned by minimizing the difference
between the experimental and numerical results of a single leaf wall panel.
The model was then validated by assigning the parameters to the single-leaf
masonry wall as well as to the double-leaf wall to predict its mechanical
behaviour. Good agreement with experimental results was found.
Furthermore, masonry is also widely used in the form of infill panels within
RC frames. Therefore, the collar-jointed technique has also been extended
and applied to the infilled RC frame. The numerical results showed that the
ii

collar-jointed technique could provide some benefits to the composite
structure.
iii

Contents
Acknowledge .................................................................................................. i Abstract .......................................................................................................... ii Contents ........................................................................................................ iv List of figures ............................................................................................... viii List of tables ................................................................................................. xv List of notations ........................................................................................... xvi
Chapter 1 Introduction ............................................................................. 1
1. 1 Background ...................................................................................... 1
1. 2 Research aims and objectives ......................................................... 4
1. 3 Thesis outline ................................................................................... 6
Chapter 2 Review of previous research on masonry ............................. 9
2. 1 Introduction ...................................................................................... 9
2. 2 Material properties ......................................................................... 10
2.2.1 Brick ........................................................................................ 10
2.2.2 Mortar ...................................................................................... 14
2.2.3 Brick-mortar interface .............................................................. 16
2.2.4 Masonry ................................................................................... 20
2. 3 Masonry failure pattern .................................................................. 22
2. 4 Strengthening approaches for masonry walls ................................ 26
2.4.1 Existing URM retrofitting techniques ....................................... 27
2.4.1.1 Conventional techniques ................................................... 27
2.4.1.2 Modern retrofitting methods .............................................. 33
2.4.2 Discussion of the existing methods ......................................... 35
2. 5 Double- and multi-leaf wall ............................................................. 39
2. 6 Modelling of masonry walls ............................................................ 44
2.6.1 Simplified micro-scale modelling ............................................. 47
2.6.1.1 Finite Element Method (FEM) ........................................... 47
2.6.1.2 Discrete Element Method (DEM) ...................................... 48
2.6.2 Macro-scale modelling ............................................................. 49
2. 7 Summary........................................................................................ 50
iv

Chapter 3 Experimental work on masonry walls .................................. 53
3. 1 Introduction .................................................................................... 53
3. 2 Specimen materials ....................................................................... 53
3.2.1 Brick ........................................................................................ 53
3.2.2 Sand ........................................................................................ 56
3.2.3 Cement .................................................................................... 57
3.2.4 Lime......................................................................................... 57
3.2.5 Water ....................................................................................... 58
3.2.6 Mortar ...................................................................................... 58
3. 3 Tests description ............................................................................ 60
3.3.1 Single-leaf wall panels ............................................................. 60
3.3.2 Double-leaf wall panels ........................................................... 63
3. 4 Curing ............................................................................................ 66
3. 5 Load design and history ................................................................. 67
3. 6 Summary........................................................................................ 69
Chapter 4 Experimental results ............................................................. 70
4. 1 Failure patterns; an initial qualitative assessment .......................... 70
4.1.1 Single-leaf wall panels ............................................................. 70
4.1.2 Double-leaf walls ..................................................................... 74
4.1.2.1 Pre-damaged test ............................................................. 75
4.1.2.2 Post-damaged test ............................................................ 78
4.1.3 The failure pattern of collar joint .............................................. 81
4.1.3.1 Pre-damaged test ............................................................. 81
4.1.3.2 Post-damaged test ............................................................ 82
4.1.4 Discussion ............................................................................... 83
4. 2 Failure load and deflection ............................................................. 86
4.2.1 Comparison of single-leaf walls ............................................... 86
4.2.2 Comparison of double-leaf walls ............................................. 88
4.2.3 Comparison of pre-damaged approach ................................... 89
4.2.4 Comparison of post-damaged approach ................................. 90
4. 3 Analysis of DEMEC gauge readings .............................................. 91
v

4.3.1 Single-leaf masonry walls ........................................................ 92
4.3.1.1 Wall 3 ................................................................................ 93
4.3.1.2 Wall 6 ................................................................................ 95
4.3.2 Double-leaf walls ..................................................................... 97
4.3.2.1 Wall 5 (Pre-damaged) ....................................................... 97
4.3.2.2 Wall 7 (Post-damaged) ..................................................... 98
4.3.3 Strain (stress) distribution of masonry wall ............................ 100
4.3.3.1 Single-leaf wall 3 ............................................................. 100
4.3.3.2 Double-leaf wall 5 ........................................................... 102
4. 4 Discussion of the strengthening/retrofitting approaches .............. 104
4. 5 Summary...................................................................................... 107
Chapter 5 Micro-scale simulation model ............................................ 110
5. 1 Introduction .................................................................................. 110
5. 2 Selection of numerical models ..................................................... 110
5.2.1 Comparison of macro-scale and micro-scale models ............ 111
5.2.2 Comparison of Finite Element Method (FEM) and Discrete Element Method (DEM) ..................................................................... 112
5. 3 Model in MIDAS FEA ................................................................... 114
5. 4 Micro-scale modelling .................................................................. 115
5.4.1 Brick representation............................................................... 116
5.4.2 Mortar joint representation ..................................................... 117
5.4.3 Constitutive law for the interface element .............................. 117
5. 5 Review on the application of this method ..................................... 121
5. 6 Summary...................................................................................... 124
Chapter 6 Calibration of material parameters of masonry wall ........ 125
6. 1 Introduction .................................................................................. 125
6. 2 Generation of initial model in MIDAS FEA ................................... 126
6.2.1 Geometry ............................................................................... 126
6.2.2 Materials details .................................................................... 127
6.2.3 Boundary conditions .............................................................. 129
6.2.4 Loading .................................................................................. 129
vi
6. 3 Parameters sensitivity study ........................................................ 129
6.3.1 Methodology .......................................................................... 129
6.3.2 The influence of brick-mortar interface’ parameters .............. 130
6.3.3 The influence of brick’s parameters ....................................... 140
6. 4 Results of analysis ....................................................................... 144
6.4.1 Brick crack interface .............................................................. 144
6.4.2 Brick-mortar interface ............................................................ 145
6. 5 Calibration work ........................................................................... 148
6.5.1 Methodology .......................................................................... 148
6.5.2 First stage (Linear stage) ....................................................... 150
6.5.3 Stage two (Load re-distribution stage) ................................... 157
6.5.4 Stage three (Failure stage) .................................................... 165
6. 6 Discussion of the calibration ........................................................ 170
6. 7 Summary...................................................................................... 171
Chapter 7 Computational work of masonry walls .............................. 173
7. 1 Introduction .................................................................................. 173
7. 2 Single-leaf wall panel ................................................................... 173
7.2.1 Generation of model in MIDAS FEA ...................................... 173
7.2.2 Model material parameters .................................................... 175
7.2.3 Numerical results ................................................................... 175
7. 3 Double-leaf wall panel (pre-damaged type) ................................. 178
7.3.1 Generation of model in MIDAS .............................................. 178
7.3.2 Model material ....................................................................... 180
7.3.3 Numerical results ................................................................... 181
7. 4 Double-leaf wall (post-damaged type) ......................................... 186
7.4.1 Generation of model in MIDAS .............................................. 186
7.4.2 Material model ....................................................................... 188
7.4.3 Numerical results ................................................................... 190
7. 5 Strain distribution (Comparison with DEMEC gauge readings) .... 193
7. 6 Summary...................................................................................... 195
Chapter 8 Mechanical behaviour of masonry infilled RC frame ....... 197
vii

8. 1 Introduction .................................................................................. 197
8. 2 Brief literature review on infilled RC frame ................................... 198
8. 3 Parametric study .......................................................................... 201
8. 4 Numerical simulation .................................................................... 208
8.4.1 Numerical model ................................................................... 208
8.4.2 Material property ................................................................... 209
8. 5 Simulation results and comparisons ............................................ 210
8.5.1 Comparison of bare and infilled RC frame ............................. 211
8.5.2 Comparison of concentrically and eccentrically infilled RC frame (SC and SE) ....................................................................................... 214
8.5.3 Comparison of RC frame infilled with single- and double-leaf masonry wall ...................................................................................... 216
8.5.4 Influence of opening size on infilled RC frame ...................... 219
8.5.5 Collar joint retrofitting on infilled RC frame with openings ..... 221
8. 6 Discussion.................................................................................... 223
8. 7 Conclusions ................................................................................. 224
Chapter 9 Conclusions, limitations and recommendations .............. 227
9. 1 Conclusions ................................................................................. 227
9.1.1 Primary conclusions .............................................................. 227
9.1.2 Secondary conclusions .......................................................... 230
9. 2 Limitations of this research .......................................................... 233
9. 3 Recommendations for future work ............................................... 234
References ................................................................................................ 236
viii
List of figures
Figure 2.1 Compressive behaviour of brick like materials ..................................... 12
Figure 2.2 Tensile behaviour of brick like materials............................................... 13
Figure 2.3 Tension test rig for brick-mortar interface (Almeida et al. 2002) ........... 17
Figure 2.4 Stress-displacement relation for the interface (van der Pluijm 1992) .... 17
Figure 2.5 Shear test rig for brick-mortar interface (Van Der Pluijm 1993) ............ 19
Figure 2.6 Stress-displacement diagram for shear with various confining stresses (van der Pluijm 1992) ....................................................................................... 19
Figure 2.7 Failure patterns of masonry wall subjected to tensile load parallel to bed joint .................................................................................................................. 21
Figure 2.8 Specimen for determination of masonry compressive strength (RILEM, 1985) ................................................................................................................ 21
Figure 2.9 Test rig for determination of masonry compressive strength (Dhanasekar, 1985) ................................................................................................................ 22
Figure 2.10 Cracking patterns of masonry walls (Lourenco and Rot 1997) ........... 24
Figure 2.11 Failure pattern of masonry walls (Campbell Barrza 2012) .................. 24
Figure 2.12 Application of shotcrete to URM wall (ElGawady et al. 2006) ............. 27
Figure 2.13 External reinforcement using vertical and diagonal bracing (Rai and Goel 1996) ....................................................................................................... 29
Figure 2.14 Reinforced tie columns confining masonry wall panels (ElGawady et al. 2004a) .............................................................................................................. 30
Figure 2.15 Bamboo reinforced wall with ring beam (Dowling et al. 2005) ............ 32
Figure 2.16 Retrofitted wall with PP-band ............................................................. 32
Figure 2.17 Application of a typical FRP strengthening approach ......................... 34
Figure 2.18 Summary of the characteristics of the methods .................................. 36
Figure 2.19 Assessment of the existing methods .................................................. 37
Figure 2.20 Geometrical arrangement of a typical double-leaf masonry wall ........ 40
Figure 2.21 Wallets dimensions in mm: (a) straight collar joint and (b) keyed collar joint (Pina-Heriques et al. 2004) ....................................................................... 43
Figure 2.22 Stresses and deformations of a three-leaf masonry subjected to compression (Vintzileou 2007) ......................................................................... 43
Figure 2.23 Modelling strategies for masonry: (a) typical masonry specimen; (b) detailed micro-modelling; (c) simplified micro-modelling; and (d) macro-modelling (Lourenco, 1996) .............................................................................. 45
Figure 3.1 The detail of brick used in this research ............................................... 54
viii
Figure 3.2 TONI PACK for compression test......................................................... 56
Figure 3.3 Sieve analysis of sand ......................................................................... 57
Figure 3.4 Dropping ball apparatus ....................................................................... 59
Figure 3.5 Testing rig of single-leaf panel ............................................................. 61
Figure 3.6 DEMEC gauge measurement .............................................................. 62
Figure 3.7 Test rig of single-leaf wall on the front side .......................................... 62
Figure 3.8 Test rig of single-leaf wall on the back side .......................................... 63
Figure 3.9 Testing rig of double-leaf panel ............................................................ 64
Figure 3.10 Test rig of double-leaf wall on the front side ....................................... 66
Figure 3.11 Test rig of double-leaf wall on the back side ...................................... 66
Figure 3.12 Summary of tests specimens ............................................................. 67
Figure 3.13 Typical deformed shape of RC frame infilled with masonry wall ......... 68
Figure 4.1 Failure pattern of single-leaf Wall 1 ...................................................... 70
Figure 4.2 Failure pattern of single-leaf Wall 2 ...................................................... 73
Figure 4.3 Failure pattern of single-leaf Wall 3 ...................................................... 73
Figure 4.4 Failure pattern of single-leaf Wall 6 ...................................................... 74
Figure 4.5 Failure pattern of double leaf wall W4 on the loaded leaf ..................... 76
Figure 4.6 Failure pattern of double-leaf wall W4 on the unloaded leaf ................. 77
Figure 4.7 Failure pattern of double leaf wall W5 on the loaded leaf ..................... 77
Figure 4.8 Failure pattern of double-leaf wall W5 on the unloaded leaf ................. 78
Figure 4.9 Failure pattern of double-leaf wall W7 on the front side ........................ 80
Figure 4.10 Failure pattern of double-leaf wall W7 on the back side ..................... 80
Figure 4.11 Failure pattern of the collar joint on top side of W4 ............................ 81
Figure 4.12 Failure pattern of the collar joint on top side of W5 ............................ 82
Figure 4.13 Failure pattern of the collar joint on top side of W7 ............................ 83
Figure 4.14 Interaction between bricks and mortar joint: (a) Smooth brick; (b) Ribbed brick ..................................................................................................... 85
Figure 4.15 Failure pattern of collar jointed (double-leaf) masonry wall................. 85
Figure 4.16 Failure load and deflection of all tests ................................................ 86
Figure 4.17 Load-Deflection relationship of single-leaf walls ................................. 87
Figure 4.18 Load-Deflection relationship the of double-leaf walls.......................... 89
Figure 4.19 Load-Deflection relationship of pre-damage strengthening ................ 90
Figure 4.20 Load-Deflection relationship of post-damage strengthening ............... 91
ix

Figure 4.21The location of DEMEC gauge points on masonry wall ....................... 92
Figure 4.22Load-strain curve of vertical DEMEC gauge points of Wall 3 .............. 93
Figure 4.23 Load-strain curve of horizontal DEMEC gauge points of Wall 6 ......... 96
Figure 4.24 Load-strain curve of vertical DEMEC gauge points of Wall 6 ............. 96
Figure 4.25 Horizontal and vertical load-strain curve of DEMEC gauge points of Double-leaf Wall 5 ............................................................................................ 97
Figure 4.26 Horizontal and vertical load-strain curve of DEMEC gauge points of Double leaf Wall 7 ............................................................................................ 99
Figure 4.27 Strain (Stress) distribution of wall 3 in the vertical direction .............. 100
Figure 4.28 Strain (Stress) distribution of wall 3 in the horizontal direction .......... 101
Figure 4.29 Strain (Stress) distribution of wall 5 in the horizontal direction on the loaded leaf ..................................................................................................... 103
Figure 4.30 Strain (Stress) distribution of wall 5 in the vertical direction on the loaded leaf ..................................................................................................... 104
Figure 4.31 Collar jointed wall with steel ties....................................................... 105
Figure 4.32 Masonry prisms’ dimensions in mm: (a) straight collar joint and (b) keyed collar joint (Pina-Heriques et al. 2004) ................................................. 107
Figure 5.1 Comparison of experimental against numerical results (Giordano et al. 2002) .............................................................................................................. 113
Figure 5.2 Simplified micro-modelling strategy for masonry panel (Lourenco 1996) ....................................................................................................................... 116
Figure 5.3 Deformable bricks with interface element ........................................... 117
Figure 5.4 Interface model proposed by Lourenco (1996) ................................... 118
Figure 5.5 Modelling parameters for the interface model and their definition ...... 118
Figure 5.6 Nonlinear compressive behaviour of the cap model (Lourenco and Rots 1997) .............................................................................................................. 121
Figure 5.7 Test setup for shear masonry wall: (a) solid wall; (b) wall with opening (Raijmakers and Vermeltfoort 1992) ............................................................... 122
Figure 5.8 Load-displacement diagram of shear wall: (a) solid wall; (b) wall with opening (Lourenco 1996). .............................................................................. 122
Figure 5.9 Load-displacement diagrams of the adobe masonry wall (Tarque 2011) ....................................................................................................................... 123
Figure 5.10 Load-displacement curves for infilled RC frame ............................... 123
Figure 6.1 Detailed process of calibration process .............................................. 126
Figure 6.2 Micro-modelling strategy for masonry (Lourenco 1996) ..................... 127
Figure 6.3 Influence of normal stiffness .............................................................. 134
x

Figure 6.4 Influence of tensile strength ............................................................... 135
Figure 6.5 Influence of mode I fracture energy .................................................... 136
Figure 6.6 Influence of coefficient of friction angle .............................................. 136
Figure 6.7 Influence of coefficient of dilatancy angle ........................................... 137
Figure 6.8 Influence of Mode II fracture energy ................................................... 138
Figure 6.9 Influence of compressive strength...................................................... 139
Figure 6.10 Influence of compressive fracture energy ......................................... 139
Figure 6.11 Influence of normal stiffness of brick crack ....................................... 141
Figure 6.12 Influence of brick type ...................................................................... 142
Figure 6.13 Influence of tensile strength of brick crack ....................................... 143
Figure 6.14 Influence of fracture energy of brick crack interface ......................... 143
Figure 6.15 Experimental Load-deflection of a single-leaf wall ............................ 145
Figure 6.16 Influence of other parameters on stage one ..................................... 146
Figure 6.17 Influence of other parameters on stage one ..................................... 146
Figure 6.18 Influence of other parameters on stage two ..................................... 147
Figure 6.19Methodology for the calibration of material parameters ..................... 150
Figure 6.20 Influence of tensile strength and normal stiffness of brick-mortar interface on the first stage .............................................................................. 152
Figure 6.21 Influence of normal stiffness and tensile strength of brick-mortar interface on the first stage of masonry wall..................................................... 153
Figure 6.22 Influence of tensile strength and normal stiffness of brick-mortar interface on the first stage of masonry wall..................................................... 154
Figure 6.23 Influence of normal stiffness and tensile strength of brick-mortar interface on the first stage of masonry wall..................................................... 154
Figure 6.24 Influence of tensile strength and normal stiffness of brick-mortar interface on the first stage of masonry wall..................................................... 155
Figure 6.25 Influence of normal stiffness and tensile strength of brick-mortar interface on the first stage of masonry wall..................................................... 156
Figure 6.26 Influence of Mode II fracture energy on stage two ............................ 158
Figure 6.27 Influence of dilatancy angle on stage two ......................................... 159
Figure 6.28 Influence of friction angle on stage two ............................................ 160
Figure 6.29 Influence of Mode II fracture energy on stage two ............................ 162
Figure 6.30 Influence of dilatancy angle on stage two ......................................... 163
Figure 6.31 Influence of dilatancy angle on stage two ......................................... 164
Figure 6.32 Influence of compressive fracture energy on the masonry wall ........ 166
xi
Figure 6.33 Influence of the compressive strength on the masonry wall ............. 167
Figure 6.34 Influence of compressive fracture energy on the masonry wall ........ 168
Figure 6.35 Influence of compressive strength on the masonry wall ................... 169
Figure 7.1 The validation 2D model in MIDAS FEA............................................. 174
Figure 7.2 Numerical model of single-leaf wall implemented in MIDAS FEA ....... 175
Figure 7.3 Load-deflection relationship of single-leaf masonry wall W3 .............. 177
Figure 7.4 Numerical deformation of single-leaf wall W3 at deflection of 7mm .... 178
Figure 7.5 Experimental deformation of single-leaf wall W3 ................................ 178
Figure 7.6 The validation 3D model in MIDAS FEA............................................. 179
Figure 7.7 Numerical model of double-leaf wall implemented in MIDAS FEA...... 180
Figure 7.8 Parameters for interface element of pre-damaged wall ...................... 181
Figure 7.9 Load-deflection relationship of collar jointed masonry wall W4 ........... 182
Figure 7.10 Numerical deformation of collar jointed wall W4 on the front side at deflection of 8mm ........................................................................................... 183
Figure 7.11 Experimental deformation of collar jointed wall W4 on the front side 183
Figure 7.12 Numerical deformation of collar jointed wall W4 on the back side at deflection of 8mm ........................................................................................... 184
Figure 7.13 Experimental deformation of collar jointed wall W4 on the back side 184
Figure 7.14 Failure patter of collar joint of numerical result ................................. 185
Figure 7.15 Stress distribution on the first leaf at deflection of 6mm ................... 185
Figure 7.16 Stress distribution on the second leaf at deflection of 6mm .............. 186
Figure 7.17Cracks on first leaf in experimental results ........................................ 187
Figure 7.18 Pre-defined cracks on first leaf in finite element modelling ............... 188
Figure 7.19 Parameters for interface element of post-damaged wall ................. 189
Figure 7.20 Load-deflection relationship of collar jointed masonry wall W7 ......... 190
Figure 7.21 Numerical deformation of collar jointed wall W7 on the front side at deflection of 6mm ........................................................................................... 191
Figure 7.22 Experimental deformation of collar jointed wall W7 on the front side 191
Figure 7.23 Numerical deformation of collar jointed wall W7 on the back side at deflection of 9mm ........................................................................................... 192
Figure 7.24 Experimental deformation of collar jointed wall W7 on the back side 192
Figure 7.25 The failure pattern of collar joint ....................................................... 193
Figure 7.26Total von Mises strain distribution of single-leaf Wall 3 at the load of 40kN .............................................................................................................. 194
xii

Figure 7.27 Total von Mises strain distribution of double-leaf Wall 4 at the load of 40kN .............................................................................................................. 195
Figure 8.1Different failure modes of the infilled frames: (a) corner curshing; (b) sliding shear; (c) diagonal compression; (d) diagonal cracking; and (e) frame bending failure (El-Dakhakhni et al. 2003) ...................................................... 200
Figure 8.2Details of test specimen (Al-Chaar and Mehrabi, 2008) ...................... 202
Figure 8.3New beam section for RC infilled frames ............................................ 203
Figure 8.4 Summary of designed specimens ...................................................... 204
Figure 8.5 Bare frame (BF) ................................................................................. 205
Figure 8.6 RC frame infilled with single-leaf wall concentrically (SC) .................. 205
Figure 8.7 RC frame infilled with single-leaf wall concentrically (SC) .................. 205
Figure 8.8 RC frame infilled with single-leaf wall eccentrically (SE) .................... 206
Figure 8.9 RC frame infilled with double-leaf wall from top side (DE) .................. 206
Figure 8.10 RC frame infilled with double-leaf wall from lateral side (DE) ........... 206
Figure 8.11 RC frame infilled with single-leaf wall with 9.7% opening (SO1) ....... 207
Figure 8.12RC frame infilled with single-leaf wall with 17.5% opening (SO2) ...... 207
Figure 8.13 RC frame infilled with single-leaf wall with 27.4% opening (SO3) ..... 208
Figure 8.14 RC frame infilled with single-leaf wall with 39.6% opening (SO3) ..... 208
Figure 8.15 Material property of reinforced concrete ........................................... 209
Figure 8.16 Material property of reinforcements .................................................. 209
Figure 8.17 Material properties for interface elements ........................................ 210
Figure 8.18 Load-deflection curve of BF and SC ................................................ 211
Figure 8.19 Deformation and stress contour of infilled RC frame at deflection of 10mm ............................................................................................................. 211
Figure 8.20 Von Mises stress distribution of the masonry infill ............................ 212
Figure 8.21 Simplified infilled RC frame .............................................................. 212
Figure 8.22 Load-deflection curve of specimen SC and SE ................................ 215
Figure 8.23 Deformed shape of eccentrically infilled RC frame at deflection of 25mm ............................................................................................................. 216
Figure 8.24Load-deflection curve of specimen SE and DE ................................. 216
Figure 8.25 Deformed shape of collar jointed infilled RC frame at deflection of 30mm ............................................................................................................. 217
Figure 8.26 Stress distribution on the front side .................................................. 217
Figure 8.27 Stress distribution on the back side .................................................. 218
Figure 8.28 Load-deflection curves of infilled RC frame with/without openings ... 219
xiii

Figure 8.29 Stress distribution of specimen with 9.7% opening .......................... 220
Figure 8.30 Stress distribution of specimen with 27.4% opening......................... 220
Figure 8.31 Load-deflection curves of strengthened/unstrengthened infilled RC frame with/without openings ........................................................................... 221
Figure 8.32 The relationship between opening size and improvement ................ 222
xiv

List of tables
Table 2.1 Summary of the characteristics of the methods ..................................... 36
Table 2.2 Assessment of the existing methods ..................................................... 37
Table 3.1 Summary of tests specimens ................................................................ 67
Table 4.1 Failure pattern of collar jointed (double-leaf) masonry wall .................... 85
Table 4.2 Failure load and deflection of all tests ................................................... 86
Table 5.1 Modelling parameters for the interface model and their definition ........ 118
Table 6.1 Range of brick and mortar properties identified from the literature ...... 132
Table 6.2 Initial brick and interface material parameters (Lourenco, 1996) ......... 133
Table 6.3 Property of clay brick crack interface................................................... 144
Table 6.4 Ranges of brick-mortar interface used in MIDAS ................................ 151
Table 6.5 Calibrated parameters of interface ...................................................... 156
Table 6.6 Ranges of brick-mortar interface used in MIDAS ................................ 157
Table 6.7 Calibrated parameters of the interface ................................................ 164
Table 6.8 Ranges of brick-mortar interface used in MIDAS ................................ 165
Table 6.9 Calibrated parameters of interface ...................................................... 172
Table 7.1 Parameters for interface element of pre-damaged wall ....................... 181
Table 7.2 Parameters for interface element of post-damaged wall .................... 189
Table 8.1 Summary of designed specimens ....................................................... 204
Table 8.2 Material property of reinforced concrete .............................................. 209
Table 8.3 Material property of reinforcements ..................................................... 209
Table 8.4 Material properties for interface elements ........................................... 210
xv

List of notations
Symbol Description 𝐴𝐴0 Crosse section 𝑐𝑐 Cohesion of brick-mortar interface
C𝑛𝑛 Control the interaction between cap mode and tension mode C𝑛𝑛𝑛𝑛 Control the centre of cap mode
C𝑠𝑠𝑠𝑠 Control the contribution of the shear stress to failure in cap mode
𝐸𝐸 Elastic modulus 𝐸𝐸𝑏𝑏 Elastic modulus of brick unit 𝐸𝐸𝑐𝑐 Elastic modulus of concrete 𝐸𝐸𝑚𝑚 Elastic modulus of mortar
𝐸𝐸𝑠𝑠 Elastic modulus of steel 𝐹𝐹 External force 𝑓𝑓𝑏𝑏 Compressive strength of brick unit 𝑓𝑓𝑡𝑡𝑐𝑐 Tensile strength of concrete 𝑓𝑓𝑡𝑡 Tensile strength of brick-mortar interface
𝑓𝑓𝑐𝑐 Compressive strength of brick-mortar interface 𝑓𝑓𝑚𝑚 Compressive strength of mortar 𝑓𝑓𝑐𝑐𝑐𝑐 Compressive strength of concrete 𝑓𝑓𝑏𝑏𝑡𝑡 Tensile strength of brick interface 𝑓𝑓𝑦𝑦1 Yield strength of steel
𝑓𝑓𝑢𝑢2 Ultimate strength of steel
𝐺𝐺𝑓𝑓𝐼𝐼 Mode I fracture energy of brick-mortar interface
𝐺𝐺𝑓𝑓𝐼𝐼𝐼𝐼 Mode II fracture energy of brick-mortar interface
𝐺𝐺𝑓𝑓𝑐𝑐 Compressive fracture energy of brick-mortar interface
𝐺𝐺𝑏𝑏 Shear modulus of brick unit 𝐺𝐺𝑚𝑚 Shear modulus of mortar joint
𝐺𝐺𝑓𝑓𝑏𝑏𝑡𝑡 Tensile fracture energy of brick interface
𝐺𝐺𝑓𝑓𝑐𝑐𝐼𝐼 Mode I fracture energy of concrete
𝐺𝐺𝑐𝑐𝑐𝑐𝐼𝐼𝐼𝐼 Mode II fracture energy of concrete
ℎ𝑚𝑚 Mortar joint thickness
xvi

𝐾𝐾𝑛𝑛 Normal stiffness of brick-mortar interface 𝐾𝐾𝑠𝑠 Shear stiffness of brick-mortar interface κ1 Amount of hardening or softening of tension mode κ2 Amount of hardening or softening of shear mode
κ3 Amount of hardening or softening of compressive mode 𝑘𝑘𝑏𝑏𝑛𝑛 Normal stiffness of brick interface 𝑘𝑘𝑏𝑏𝑠𝑠 Shear stiffness of brick interface 𝐿𝐿0 Initial length
∆𝐿𝐿 Change in length under external loading 𝑣𝑣𝑏𝑏 Poisson’s ration of brick unit 𝑣𝑣𝑚𝑚 Poisson’s ration of mortar joint 𝑣𝑣𝑐𝑐 Poisson’s ration of concrete
𝑣𝑣𝑠𝑠 Poisson’s ration of steel 𝜎𝜎 Normal stress 𝜎𝜎1 Normal stress of tension mode 𝜎𝜎2 Normal stress of shear mode
𝜎𝜎3 Normal stress of compressive mode 𝜎𝜎�1 Yield stress of tension mode 𝜎𝜎�2 Yield stress of shear mode 𝜎𝜎�3 Yield stress of compressive mode 𝜏𝜏 Shear stress
𝜀𝜀 Strain 𝛷𝛷 Friction angle 𝛷𝛷0 Initial friction angle 𝛷𝛷r Residual friction angle Ψ Dilatancy angle
xvii

Chapter 1 Introduction
Chapter 1 Introduction
1. 1 Background
Masonry is a composite material made of masonry units and bonded
together with or without mortar, which has been used for centuries in
building constructions. A large number of historical buildings constructed
using masonry can be found all over the world. Load bearing walls, infill
panels, pre-stressed masonry cores and low-rise buildings are some
examples of its wide spread use. Masonry units usually consist of fired clay
or calcium bricks, concrete blocks, adobes and stones. Mortar is normally a
mixture of cement, lime, sand and water and masonry is constructed by
stacking masonry units on top and next to each other and using mortar to
bond them. Though new developments in masonry materials and application
has occurred over the last few decades, this concept of building masonry
structures has not changed much up until now. By using different
combinations of masonry units, mortars and unit bonding patterns, a large
number of geometric arrangements and strength characteristics can be
obtained. This makes masonry a popular construction material due to the
reason that it can meet different requirements easily. Furthermore, as a
popular and old construction material, masonry has many inherent
characteristics, and the most important one is its simplicity. Other important
characteristics are the aesthetics, solidity, durability and low maintenance,
versatility, sound absorption and fire protection (Lourenco 1996).
Masonry is widely used in seismic-prone areas, such as masonry structures
and masonry-concrete structures. Besides, it is often used in the form of infill
panels within reinforced concrete (RC) or steel frames in modern structures.
Infills are customarily considered as secondary elements (also referred to as
1

Chapter 1 Introduction
non-structural elements) to the structure and usually are not considered in
the calculations of seismic capacity for simplification (sometimes the mass is
considered while the stiffness not). On one hand, it has been indicated from
experimental observations and analytical studies that masonry infills may
produce some beneficial effects on the response of the building. However,
observations from past earthquakes also showed that severe damage and
loss of life could occur in infilled frame buildings, which has led to the idea
that this type of structure exhibits poor seismic performance (Crisafulli et al.
2005). As such, the performance of masonry infill can be a decisive factor,
which may lead to a catastrophic structural failure. Therefore, it is necessary
to investigate the influence of the masonry infill on the composite structure.
Moreover, there is a large inventory of unreinforced masonry (URM)
buildings in the world. Little or no seismic loading was considered when they
were built, and they might not be capable of dissipating energy through
inelastic deformation during earthquakes (Ehsani et al. 1999). Therefore,
with this in mind, masonry structures often need to be retrofitted following
earthquake events or strengthened prior to seismic actions in order to
ensure that they can perform these important energy absorption and force
relieving roles.
In the past decades, the retrofitting or strengthening of masonry wall panels
has intrigued researchers' interest and extensive studies have been carried
out. The aim of strengthening is to improve the mechanical behaviour of
masonry structures, which is usually done before structural damage
occurred. However, retrofitting is normally done after the damage in order to
restore or improve its initial load carrying capacity.
Over the past decades, researchers have proposed various methods to
enhance the seismic behaviour of unreinforced masonry walls. The
proposed methods consist of two main groups: (1) conventional approaches
and (2) modern approaches. Among the conventional strengthening
approaches, ferrocement, shotcrete and grout/epoxy injection are some of
the most often used ones.
2

Chapter 1 Introduction
However, the conventional methods usually have the disadvantages of
affecting aesthetics and being considerably time consuming etc. Fibre
Reinforced Polymer (FRP) is a more state-of-the-art
strengthening/retrofitting technique. The enhancement of masonry walls
using FRP material has the common advantage of little added mass.
However, the main drawbacks are the high cost, the high technical skill
required for their installation, the effect on the architectural aesthetics and
the basic lack of experience with these materials particularly relevant to their
aging. Furthermore, one other major problem is that typically in developing
countries the masonry surface is not smooth and this causes stress points
for the FPR wrap and therefore results in premature failure/unpredictable
failure, thereby making the application of this technique very unpractical in
the developing countries.
This thesis is concerned with the strengthening/retrofitting of masonry
structures and a new strengthening/retrofitting approach using a collar joint
technique has been proposed. Namely, the approach is implemented by
building another masonry wall parallel to the existing single-leaf wall and
bonding the two together using a mortar (collar) joint. This method does not
require sophisticated workmanship because of its easy implementation,
which renders it practical. In addition, the material is easy and cheap to
obtain, which helps to prove its cost-effectiveness. Furthermore, double-leaf
or collar-jointed masonry wall systems are common in construction as they
can improve the sound, water and fire resistance of the structures.
However, this construction system has received little attention in the past.
Therefore, the influence of this building system on the whole structure has
not been extensively studied. Though the similar approach using
cement/epoxy injection has been applied in multi-stone masonry walls, the
research work on clay brickwork has not been done according to the
author's observation. The actual research of this thesis investigates
experimentally the merits of the collar-joint technique that differs from any
3

Chapter 1 Introduction
previous published work in terms of masonry materials and collar joint type.
In conclusion, this thesis aims to investigate the improvement of this
approach and the influence of this approach on the mechanical behaviour of
masonry structures. Furthermore, this collar jointed technique was extended
and applied to infilled RC frame to investigate its influence on the composite
structure.
In the past decades, extensive studies have been carried out to investigate
the mechanical behaviour of masonry (Hendry 1998, Rots 1997, Van der
Pluijm 1993). However, it is prohibitively expensive to conduct experiments,
therefore, it is fundamentally important to also develop a numerical approach
to predict the in-service behaviour of masonry walls. In the past decades,
an enormous growth in the development of numerical methods for structural
analysis has been achieved by researchers. Among them, micro- and
macro-scale methods are the most often used. In the micro-scale modelling,
Finite Element Method (FEM) and Discrete Element Method (DEM) are the
two most frequently studied. This research has also used numerical analysis
in order to have a better understanding on the improvement and influence of
this collar-joint technique, as well as to address the load transfer between
the two masonry leaves.
1. 2 Research aims and objectives
As the collar joint construction system is still popular nowadays, the principal
aimof this research is to experimentally and numerically quantify the in-plane
performance of the unreinforced masonry wall panels reinforced using the
collar jointed technique under a combined in-plane lateral quasi-static
loading, in order to investigate the effectiveness and practicability of this
construction system used as strengthening/retrofitting. As stated earlier, the
collar-jointed construction system is common in practice, This could be a
very economic and easy method for those residents in the developing
4

Chapter 1 Introduction
countries or masonry-popular area. The strengthening/retrofitting technique
and the computational model can be used by engineers and researchers to
compare and evaluate alternative methods of retrofitting or strengthening the
masonry structures. Although this research was conducted in the UK, which
earthquake is a rarity, and also using local materials, it is expected that
these research results can be referred and easily extrapolated to other
countries, thus it providing another alternative strengthening/retrofitting
method for the engineers and householders
The objectives of this study are summarized as:
1. To review the current literature to obtain an up-to-date understanding on
the structural behaviour of the single- and double-leaf masonry wall
panels.
2. To review and compare the existing strengthening/retrofitting approaches
in order to assess the advantages and disadvantages of the different
approaches.
3. To propose a new strengthening/retrofitting approach in order to
overcome the shortcomings of the existing approaches.
4. To review and evaluate the computational methods that are currently
available to predict the mechanical behaviour of masonry walls under a
combined quasi-static in-plane lateral loading.
5. To conduct an experimental study on masonry wall panels in order to
investigate their mechanical behaviour, including single- and double-leaf
masonry wall panels, as well as to assess the improvement of the
proposed approach.
5

Chapter 1 Introduction
6. To develop a simplified micro-scale model which is capable of predicting
quantitatively and qualitatively the serviceability and ultimate limit state
behaviour of masonry walls by including tensile, shear and compressive
failure.
7. To select an appropriate method to determine and calibrate the material
parameters for the constitutive model for the masonry material.
8. To verify and validate the models developed by comparing the predicted
behaviour with the behaviour observed in the experiments. The result of
the study will provide recommendations for the assessment and
strengthening of unreinforced masonry buildings using a collar jointed
technique.
9. To extend and apply the collar jointed technique to infill panels found in
RC frame structures and investigate the potential benefits to the
composite structure.
1. 3 Thesis outline
This thesis is divided into nine chapters. Following this introductory chapter,
a review of the literature on masonry is presented in Chapter 2. Chapter 2
serves as an overview of the past research conducted on masonry
structures. The aim of this chapter is to establish a base of knowledge and
understanding for the author’s research. Firstly, this chapter presents a brief
description of the material properties and the inherent variations in the
properties of masonry. Then, the possible failure patterns of masonry wall
panels are discussed, followed by a review of the existing strengthening
approaches for the masonry wall panels. After that, a typical review of
double-leaf (collar jointed) walls is presented as the double-leaf wall is the
6
Chapter 1 Introduction
main focus of this research. Finally, the analytical investigations and the
different modelling approaches that have been used in the past are
discussed. A summary is provided which highlights the extent of current
knowledge and the areas where new knowledge is required.
Chapter 3 describes the experimental work. The experimental tests are
carried out on both single- and double-leaf masonry wall panels. For the
double-leaf ones, pre- and post-damaged collar jointed walls are designed in
order to investigate the influence of different types of collar joint on the
mechanical behaviour of double-leaf masonry wall panels.
The experimental results of the tests described in Chapter 3 are presented
and discussed in Chapter 4. In this chapter, the mechanical behaviour of
both single-leaf and double-leaf wall panels are thoroughly analysed and
discussed. Furthermore, the experimental results are compared with each
other in order to find out the effectiveness of the proposed method in this
research.
Chapter 5 has identified a suitable numerical model to simulate masonry
walls, both at the serviceability state (pre-cracking) and at the ultimate limit
state (post-cracking). A number of existing modelling approaches are
assessed and compared before the selection of the most appropriate one.
The selected model is then used as the basis of the author’s research. For
this research, Finite Element Method (FEM) is selected and the commercial
finite element software, MIDAS FEA, is utilised.
Chapter 6 investigates the calibration of material parameters in the
modelling of masonry structures using MIDAS FEA. The investigation
includes a series of sensitivity studies of the parameters influencing the
mechanical behaviour of a single-leaf masonry wall. The calibration is
carried out based upon the sensitivity of the study results. It can be found in
both the experimental and numerical results that the performance of a
masonry wall has three stages: the linearly elastic stage (stage one), load
7

Chapter 1 Introduction
re-distribution stage (stage two), and the failure stage (stage three). The
numerical results of each stage will be compared with those obtained from
the laboratory testing as described in Chapter 4. The material parameters
are manually ‘‘tuned’’ step by step to achieve similar responses to those
obtained in the laboratory.
In Chapter 7, the parameters obtained in Chapter 6 are assigned to the
model in MIDAS FEA. The application of these parameters to the single-leaf
wall 3 is performed so as to numerically validate the model by capturing all
the failure modes. The characterized parameters are also used in double-
leaf walls, including the pre- and post-damaged types, to predict their
mechanical behaviour. The predicted numerical results are also compared
with the experimental results obtained in Chapter 4.
In Chapter 8, the proposed strengthening approach using a collar jointed
technique will be extended and applied to the masonry wall panels in
reinforced concrete (RC) frame structures. In this chapter, a new infilled RC
frame is designed by replacing Mehrabi’s (1996) infilled RC frame structures
with the masonry wall presented and studied in Chapter 3 and 4. The infilled
masonry walls can be solid or contain openings, and the newly designed
structures will be strengthened using the collar jointed technique. This
chapter is carried only numerically. Furthermore, the bare masonry infill
panel tested in the laboratory is compared with the masonry infill wall
restrained by a RC frame.
Finally, the principal and secondary findings from this research are
summarized in Chapter 9. The limitations of the current research are
presented as well as the recommendations for further research.
8

Chapter 2 Review of previous research on masonry
Chapter 2 Review of previous research on masonry
2. 1 Introduction
Masonry is a brittle, anisotropic, composite material that exhibits distinct
directional properties due to the mortar joints which act as planes of
weakness. In the past decades, extensive studies have been carried out to
investigate the mechanical behaviour of the masonry structures (Van der
Pluijm 1993, Rots 1997, Hendry 1998, Abrams et al. 2001, Stavridis and
Shing 2010). The analysis of the mechanical behaviour of masonry
structures is difficult due to its heterogeneous and anisotropic behaviour.
Furthermore, there is still a lack of good understanding in the complex
fracture behaviour of masonry. The behaviour of masonry is complicated
further by the inherent variations in the constituent materials, variations in
workmanship, and the effects of deterioration caused by weathering
processes and the development of other defects during the life of the
masonry structure. It is well known that masonry material has relatively high
resistance to compressive stress while has poor resistance to tensile stress..
When subjected to very low levels of stress, masonry behaves
approximately linearly elastically (Mosalam et al. 2009). However, it
becomes nonlinear after the formation of cracks and the subsequent
redistribution of stress through the uncracked elements. Nevertheless,
Kaushik et al. (2007) concluded that masonry does not behave elastically
under lateral loads, even in the range of small deformations.
This chapter provides basic knowledge on masonry materials and structures
and helps the author to generate a comprehensive understanding on the
performance of masonry materials and structures. Researches on different
aspects of masonry walls that have been studied over the past decades will
9

Chapter 2 Review of previous research on masonry
be reviewed here. The following sections will briefly summarize previous
researches relating to the material components, strengthening methods, in-
plane performance, and modelling of masonry walls.
2. 2 Material properties
It is well known that the analysis of a masonry structure is very difficult
mainly due to its complex components. The most important components
identified in a masonry wall panel are: brick characteristics; mortar joint
characteristics and brick/mortar bond characteristics. In this section, the
previous researches on the material properties of masonry components will
be presented and discussed in detail. This helps to understand the
mechanical behaviour of masonry wall panels in the following study and
provides initial data for the numerical work.
2.2.1 Brick
Bricks are a big part in a masonry structure and make up most percentage
of the structure. From a structural viewpoint, bricks used today are generally
made from a variety of raw materials such as clay, calcium silicate (sand-
lime), stone and concrete by a variety of production methods. This study will
be mainly focused on clay bricks as it is the most extensively used type of
masonry unit throughout the world. It is estimated that approximately 96% of
the bricks used in the United Kingdom are manufactured from clay (MIA,
2013). Clay brick used as a building material is made of clay with or without
a mixture of other substances, burned at an adequately high temperature to
prevent it from crumbling again when soaked in water. The properties of
bricks vary in a wide range of values in every structure. Even though the
bricks are made of the same material, the mechanical behaviour of bricks is
not homogeneous nor isotropic, especially for hollow or perforated bricks.
10

Chapter 2 Review of previous research on masonry
Information on the mechanical properties of clay bricks is required when
assessing existing URM buildings, which can be used as a guidance in the
following research, both experimentally and numerically. The most important
characteristics of a brick element are the compressive strength, tensile
strength and Young’s modulus, which are described in detail in the following
section.
Compressive strength
BS-3921 (1985) has presented a standardised procedure to obtain the
compressive strength of a masonry unit. Compressive strength has been
known to be influenced by several external factors such as loading rate,
specimen size and shape, and specimen boundary conditions. Figure 2.1
represents the compressive behaviour of a typical brick unit. In the figure,
the compressive behaviour starts with a linear elastic part up until the first
micro-cracks appear. The hardening starts at this moment, which means
that the stiffness of the material starts to decrease but the load can still
increase. Gradually, the micro-cracks propagate and finally result in bigger
macro-cracks by connecting several smaller ones. The softening part follows,
and the size and number of cracks increase significantly until it is crushed. In
the final stage, there is still a small amount of strength remaining regardless
of the amount of cracks that have developed (Van Noort 2012). The
compressive strength of clay bricks can vary from 20 to 145 MPadepending
on various factors such as the constituents of materials, firing conditions,
and the size and shape of unit (Charimoon 2007).
11

Chapter 2 Review of previous research on masonry
Figure 2.1 Compressive behaviour of brick like materials
Tensile strength
The measurement of the tensile strength of masonry is more difficult.
Although it can be determined by a direct tensile test, such testing is difficult
to perform. Even if possible, the test produces quite variable results because
of the complicated test apparatus and stress concentrations on the
specimen. Van der Pluijm (1997) demonstrated that the behaviour of
masonry units and mortar joints under tension showed a great similarity to
that of concrete. Figure 2.2 illustrates the tensile behaviour of a typical brick
unit. In the figure, the tensile behaviour starts with a linear elastic part up
until the tensile strength is reached and first cracking occurs. After that point
softening takes place, which is indicated by a decrease of the stiffness of the
material and also a decrease of the load applied to the material specimen.
The material is considered completely failed when the strength and stiffness
equal zero.
Generally, experiments have shown that the tensile strength of clay bricks is
best measured by indirect methods, which increases with the increase of
brick compressive strength (Chaimoon 2007). Based upon the previous
researches, a simple relationship between the compressive strength and
tensile strength was found. The other one can be approximately obtained if
12
Chapter 2 Review of previous research on masonry
only one is known already. Schubert (1988) found that the ratio between the
tensile and compressive strength ranges from 0.03 to 0.10 for the
longitudinal tensile strength of bricks. However, Sahlin (1971) reviewed the
test data and found that the ratio of the tensile strength to the compressive
strength of brick is around 1:20 for solid bricks and 1:30 for hollow bricks.
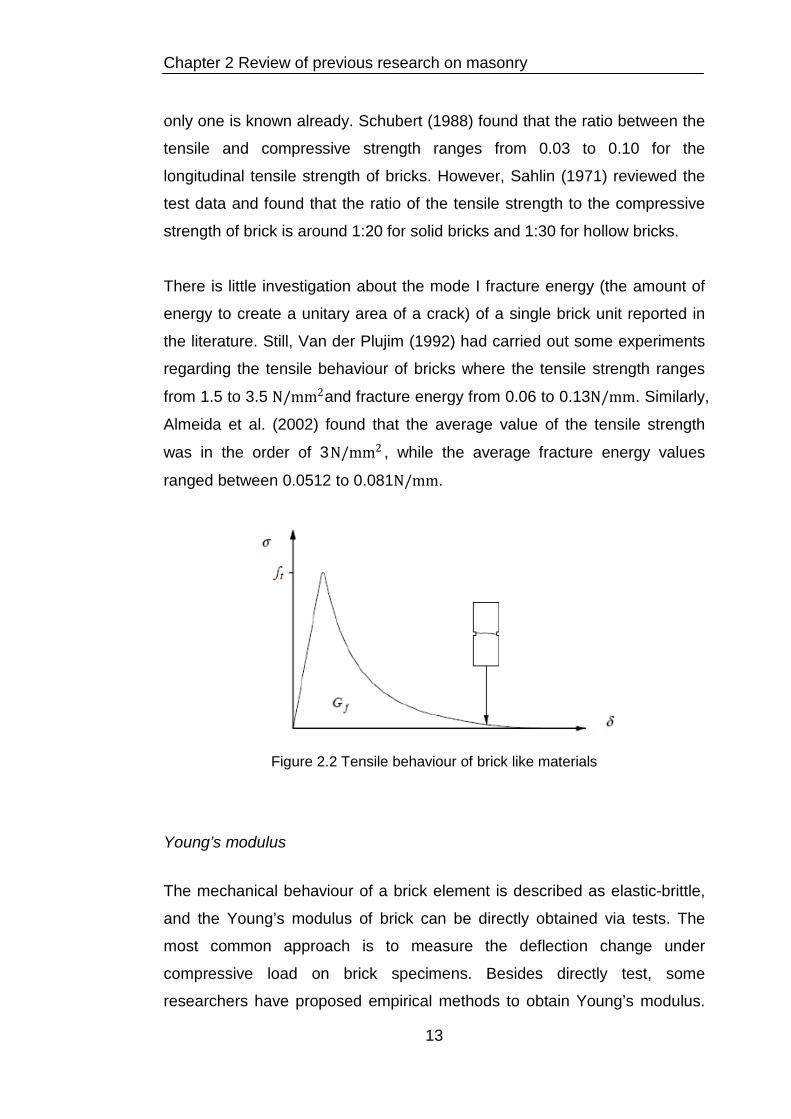
There is little investigation about the mode I fracture energy (the amount of
energy to create a unitary area of a crack) of a single brick unit reported in
the literature. Still, Van der Plujim (1992) had carried out some experiments
regarding the tensile behaviour of bricks where the tensile strength ranges
from 1.5 to 3.5 N/mm2and fracture energy from 0.06 to 0.13N/mm. Similarly,
Almeida et al. (2002) found that the average value of the tensile strength
was in the order of 3N/mm2 , while the average fracture energy values
ranged between 0.0512 to 0.081N/mm.
Figure 2.2 Tensile behaviour of brick like materials
Young’s modulus
The mechanical behaviour of a brick element is described as elastic-brittle,
and the Young’s modulus of brick can be directly obtained via tests. The
most common approach is to measure the deflection change under
compressive load on brick specimens. Besides directly test, some
researchers have proposed empirical methods to obtain Young’s modulus.
13

Chapter 2 Review of previous research on masonry
Sahlin (1971) proposed that the ratio of modulus of rupture varies roughly
between 10% and 30% of the compressive strength of clay brick.
Furthermore, (Kaushik et al. 2007) recommended a range of values
depending on the compression strength of the brick to estimate the elasticity
modulus of clay bricks, which is shown in Equation 2.1.
150.𝑓𝑓𝑏𝑏 ≤ 𝐸𝐸𝑏𝑏 ≤ 500.𝑓𝑓𝑏𝑏 (2.1)
Where fb represents the compressive strength of brick unit and Eb is the
elastic modulus of brick unit.
2.2.2 Mortar
Although mortar forms only a small proportion of brickwork as a whole, its
characteristics play a big influence on the mechanical behaviour of the
brickwork. Mortar is a mixture of different materials, such as cement, sand,
water, lime etc. with different portions. Mortar is used in masonry
construction as a binding material to bind individual masonry units into a
composite assemblage and take up all irregularities in the bricks.
Fundamentally, the cement adds strength, the lime and water contribute to
workability and the sand provides inexpensive filler. The moment the fresh
mortar contacts the brick, the brick absorbs water from the fresh mortar and
the moisture transmission process starts (Pel et al. 1995, Forth et al. 2000).
There are various types of mortar which have been used over several
centuries such as lime-pozzolanic, cement-lime and cement mortar.
Different admixtures and additives (milk, oils, starches, or natural resins, etc.)
can be added to mortar to form mortars with particular characteristics, such
as adhesion, water repellence, etc. (Harries and Sharma, 2016). Mortars
with general purposes are used to build masonry with joints of 10 to 15mm
in thickness while thin layer masonry use special thickness mortar with a
thickness of 3 to 4mm (Vermeltfoort 2005).
14

Chapter 2 Review of previous research on masonry
According to BS EN 998-2 (2010), mortar should have good workability,
sufficient bond and appropriate strength, and the first two properties are
more critical. The bonding is dependent upon a satisfactory value of the
brick suction and mortar water retention. The workability is the ability of the
mortar to flow easily over the surface of bricks. Though the use of more
water can improve the workability, it can also reduce the mortar strength.
Therefore, the amount of water needs to be added according to the ball
dropping test. Additionally, the standard specimens test results cannot
represent the real mortar strength in masonry joint as the standard non-
absorbent mould doesn’t take the water absorption effect of the masonry
unit into consideration. Therefore, mortar properties are mainly used as a
measure of quality control rather than representative of the actual properties.
Generally, it is the bond strength that matters more in the analysis
(Chaimoon 2007).
Mortar compressive strength can be determined using either cube or prism
tests (BS EN 1015-11:1999). The compressive strength (𝑓𝑓𝑚𝑚𝑐𝑐 ) of mortar
depends on its inherent material. The lime mortar has a strength of 0.5 to
1MPa, cement-lime mortar varies from 1 to 10MPa and pure cement mortar
strength ranges from 10 to 20MPa (Wijanto 2007). Furthermore, the strength
of bed and head mortar joints are different. According to Dialer (1990), the
strength of the head or perpend joints is usually lower than the strength of
the bed joints. This is a result of the greater degree of mortar shrinkage in
the perpend joints and also these joints are often not filled fully with mortar.
The modulus of elasticity of mortars,𝐸𝐸𝑚𝑚𝑐𝑐 , is approximately equal to 10𝑓𝑓𝑚𝑚𝑐𝑐
(Wijanto 2007) while Kaushik et al. (2007) recommended a range of values
shown in Equation 2.2. Poisson’s ratio of most hydraulic cement and lime
mortars is on the order of 0.2 (Wijanto 2007).
100.𝑓𝑓𝑚𝑚𝑐𝑐 ≤ 𝐸𝐸𝑚𝑚𝑐𝑐 ≤ 400.𝑓𝑓𝑚𝑚𝑐𝑐 (2.2)
Where 𝑓𝑓𝑚𝑚𝑐𝑐 is the compressive strength of mortar while 𝐸𝐸𝑚𝑚𝑐𝑐 is the elastic
modulus of mortar.
15

Chapter 2 Review of previous research on masonry
2.2.3 Brick-mortar interface
The connection between the bricks and mortar often is the weakest link in a
masonry structure, therefore cracks often occur along these interfaces
(Lourenco 1996). The property of the brick-mortar interface is very important
in the mechanical behaviour of masonry as it has a considerable effect on
the load transfer and cracking. Groot (1993) demonstrated that water is an
important factor in the strength development of these interfaces. After the
mortar has been applied on the bricks, the water in the mortar will be sucked
into the pores of the bricks. Cement particles from the mortar move along
with the water and will be spread along the surface of the brick, resulting in a
bond between the mortar joint and brick. Very high water-cement ratio or
very low water-cement ratio can both result in relatively low strength even if
the bricks and the mortar both have a very high strength. The reason is that
not enough cement particles are sucked into the brick's holes in both cases.
Generally, it is better to have a good bond between mortar and brick than a
high resistance mortar (Campbell Barraza 2012).
There are two modes of failure occurring in the brick-mortar interface, which
are tensile failure (mode I) and shear failure (mode II) as discussed by
Lourenco (1996). The mechanical behaviour of brick/mortar has been
conducted in the work of van der Pluijm (1992, 1993).
Brick-mortar interface tensile failure (mode I)
The tensile mechanical properties of the contact between brick and mortar
can be estimated from laboratory tests. Experiments on the direct tensile
strength of brick-mortar were performed by Van der Pluijm (1992). Figure
2.3 (Almeida et al. 2002) is a tensile bond test rig, which shows how to
determine the tensile behaviour of the interface between brick and mortar.
The tensile results showed that the tension softening response was an
exponential curve as shown in Figure 2.4.
16

Chapter 2 Review of previous research on masonry
Figure 2.3 Tension test rig for brick-mortar interface (Almeida et al. 2002)
Figure 2.4 Stress-displacement relation for the interface (van der Pluijm 1992)
The brick-mortar interface tensile strength is a key parameter for numerical
modelling of masonry structures. It can be seen that the mode I softening
curve is exponential, similar with the tensile behaviour of the bricks and
mortar. Van der Pluijm (1992) found that the bond strength varies between
0.3 to 0.9𝑁𝑁/𝑚𝑚𝑚𝑚2 and the mode I fracture energy, which is defined as the
amount of energy to create a unitary area of a crack along the brick/mortar
interface, ranges from 0.005 to 0.03𝑁𝑁𝑚𝑚𝑚𝑚/𝑚𝑚𝑚𝑚2 . Almeida et al. (2002),
quantified the tensile strength and mode I fracture energy for different types
of brick-mortar interfaces. The average bond tensile strength was in the
17

Chapter 2 Review of previous research on masonry
order of 2𝑁𝑁/𝑚𝑚𝑚𝑚2 and the average mode I fracture energy was around
0.008𝑁𝑁𝑚𝑚𝑚𝑚/𝑚𝑚𝑚𝑚2. However, the test results were considerably scattered, as
well as the shape of the softening branch.
Brick-mortar interface shear failure (mode II)
Beattie et al. (2001) proposed that the failure of masonry joints under shear
can be represented by a Mohr-Coulomb failure law which expresses a linear
relationship between the shear stress and the normal stress as Equation 2.3:
τ = c + tanФ. σ (2.3)
Where represents the cohesion or the shear strength at zero pre-
compression. is the tangent of the friction angle of the interface between unit
and mortar joint. The values of cohesion and friction angle that define the
brick/mortar interface may vary considerably according to different
unit/mortar combinations.
The estimation of the shear behaviour of the interface between brick and
mortar can be carried out by shear bond test rig (Van Der Pluijm 1993), which
is shown in Figure 2.5. Figure 2.6 (Van Der Pluijm 1992) shows the
mechanical shear behaviour (mode II failure).
BS 5628 (2005) gives design values for cohesion ranging from 0.35 to 1.75
𝑁𝑁/𝑚𝑚𝑚𝑚2 and tanψ equals to 0.6 for mortar designation. However, the
published values of the cohesion are reported to range between 0.1 and 1.8
𝑁𝑁/𝑚𝑚𝑚𝑚2 (Lourenco, 1998b; Hendry, 1998, Van der Pluijm 1992). Van der
Pluijm (1992) found that the value of mode II fracture energy GfII , ranges
from 0.01 to 0.25𝑁𝑁/𝑚𝑚𝑚𝑚. In addition, Van der Pluijm found that the tangent of
the initial internal friction angle 𝑡𝑡𝑡𝑡𝑛𝑛Ф0 ranges from 0.7 to 1.2 for different
18

Chapter 2 Review of previous research on masonry
unit/mortar combinations. The tangent of the residual internal friction angle
𝑡𝑡𝑡𝑡𝑛𝑛Ф𝑟𝑟 is approximately constant and equals to 0.75.
Figure 2.5 Shear test rig for brick-mortar interface (Van Der Pluijm 1993)
Figure 2.6 Stress-displacement diagram for shear with various confining stresses (van der Pluijm 1992)
Another relevant feature of masonry joints is the dilatancy angle (Ψ), which
measures the uplift of one unit over the other upon shearing, depends on the
level of the confining stress. The dilatancy angle is positive but tends to zero
upon increasing normal confining stress (Van der Pluijm, 1999). The
average value of 𝑡𝑡𝑡𝑡𝑛𝑛𝜓𝜓ranges from 0.2 to 0.7 depending on the roughness
of the brick surface for low confining pressures (Roca et al. 1998).
19

Chapter 2 Review of previous research on masonry
The brick/mortar interface can be influenced by many factors, and the
factors have been determined by Lawrence et al. (2008) and Vermeltfoort et
al. (2007). These factors are: the surface texture and the suction rate of
units; the mortar composition; the grain size distribution of the aggregate in
mortar; and the type of binders and the use of admixtures and additions for
the preparation of the mortar. Abdou et al. (2006) studied the influence of
holes on joint mortar behaviour by testing on half brick couplet specimens
made of both solid and hollow bricks. In both cases, the experimental results
showed that there was no stiffness degradation even in the softening regime.
However, it seems that the presence of holes increases the stiffness due to
mortar filling in the holes but does not affect the internal friction angle of the
mortar joint. Wang et al. (2013) found that the presence of perforations help
to increase shear strength by forcing failure to be both along the brick/mortar
interface and through the mortar in the perforation.
2.2.4 Masonry
The tensile strength and compressive strength are two of the most important
material parameters for the analysis and design of masonry structures. The
uniaxial tensile behaviour of masonry is dependent upon the direction of
loading. Lourenco (1996) found out that the failure is generally caused by
the failure of the relatively low tensile bond strength of the brick-mortar
interface if the tensile loading is perpendicular to the bed joints. There are
two different types of failure when tensile loading is parallel to the bed joints,
displayed in Figure 2.7, depending on the relative strength of joints and units.
The first type is represented by zigzag cracks (Figure 2.7 (a)) through the
head and bed joint. In the second type of failure, cracks run almost vertically
through the bricks and head joints (Figure 2.7 (b)). In this case, the tensile
strength of bricks is approximately the same with the mortar. The
compressive strength of brick masonry can be determined either from brick
and mortar strength using an approximating approach or from compression
20

Chapter 2 Review of previous research on masonry
tests on masonry prisms. The real uniaxial compressive strength of masonry
is suggested to be obtained from the so-called RILEM test, see Figure 2.8.
However, the RILEM (1985) specimen is relatively large and costly to carry
out. Therefore, the stacked bond prism (Figure 2.9) is frequently used to
obtain the uniaxial compressive strength instead (Dhanasekar, 1985).
There are several factors influencing the compressive behaviour of masonry.
Brick and mortar characteristics are the most important ones. Both brick and
mortar tend to expand laterally at different rates due to Poisson’s effect
under compression. The mortar normally has a higher value of Poisson’s
ratio and will therefore expand laterally more than the bricks. However, this
expansion is restrained by the bond and friction at the brick-mortar interface
leading to a state of tri-axial compression in the mortar and a state of
compression/ tension in the brick. This phenomenon has occurred in both
numerical analyses by Rots (1991) and in practice and can cause the
masonry to fail earlier than expected when loaded under compression.
(a) (b)
Figure 2.7 Failure patterns of masonry wall subjected to tensile load parallel to bed joint
Figure 2.8 Specimen for determination of masonry compressive strength (RILEM, 1985)
21

Chapter 2 Review of previous research on masonry
Figure 2.9 Test rig for determination of masonry compressive strength (Dhanasekar, 1985)
The curing of masonry after construction is very important as it affects the
global behaviour of masonry structure by helping the hydration of the
cement in the mortar. A few researchers (Anderson and Held, 1986, Marquis
and Borchelt, 1986) have investigated the effects of curing conditions on the
masonry strength in the past, and they have concluded that the masonry
cured wrapped under polyethylene sheeting has higher bond strength than
when it is cured open to air. Another factor that can influence the masonry
strength is the thickness of mortar joint. Thicker masonry joints decrease the
compressive strength because the flexible mortar tends to spread more and
causes tensile splitting of brick units at lower loads (Chaimoon 2007).
2. 3 Masonry failure pattern
Movements in masonry may arise from the application of external load,
foundation settlement, temperature changes, moisture content changes,
creep, and chemical reactions in the materials such as chemical attack or
corrosion of any carbon steel components embedded in the mortar such as
ties or reinforcement (Hendry 1998, Forth 2009). If the movement of the
masonry wall is restrained, the applied load may exceed the masonry wall’s
22

Chapter 2 Review of previous research on masonry
bearing capacity, thus making the masonry wall start to crack. Small and
invisible cracks can be gradually formed into big and visible cracks under
external loading. If cracks keep forming and finally propagate through the
structure, they may reduce the masonry’s load carrying capacity and could
lead, eventually, to collapse. One or combined cracking patterns can be
found in the failed masonry wall panels.
The cracking patterns are totally different with those found in other
structures made of different materials (concrete, steel, etc.). These special
crack patterns are attributed to the composite nature of masonry and the
characteristics of brick and mortar. Lourenco and Rots (1997) pointed out
that the basic failure mechanisms of masonry have five basic types: (1)
tensile cracking of the joints, (2) sliding along a bed/head joint at low values
of normal stress, (3) cracking of the masonry units in direct tension, (4)
diagonal tension cracking of masonry units at value of normal stress
sufficient to develop friction in joints and (5) compressive failure,
characterised by splitting of units in tension as a result of mortar dilatancy at
high compression values. Type (a) and (b) are joint mechanisms, (c, e) are
combined mechanisms involving bricks and joints and (d) is a brick
mechanism. The detailed cracking patterns are showing in Figure 2.10.
However, in terms of global failure patterns of masonry wall panels,
Campbell Barrza (2012) divided the failure modes into three main types: i)
sliding shear failure; ii) shear failure and iii) bending failure depending on
failure characteristics (Figure 2.11). Sliding shear failure is formed when the
predominantly horizontal force exceeds the shear strength. Shear failure is
exhibited when a wall is loaded with significant vertical as well as horizontal
forces and this is the most common mode of failure. Bending failure can
occur where walls have high shear resistance. This failure is characterized
by a toe crushing on the lower side of the wall and/or an opening on the
other side.
23

Chapter 2 Review of previous research on masonry
Figure 2.10 Cracking patterns of masonry walls (Lourenco and Rot 1997)
(a) Sliding shear failure (b) Shear failure (c) Bending failure
Figure 2.11 Failure pattern of masonry walls (Campbell Barrza 2012)
Generally in the experimental tests, one mode or combined failure modes
can be found in the failed masonry walls. A combined failure mode
happened in the structure can lead to a more complicated failure mechanism
in analysing masonry (Melbourne and Tomor, 2005). The formation and
occurrence of failure patterns of masonry walls vary depending on a lot of
factors. The aspect ratio (height to length) and the loading patterns are
some of the significant factors that may influence the failure pattern. The
24
Chapter 2 Review of previous research on masonry
other factors includes the strength ratio between masonry unit and mortar,
boundary conditions and building skills etc. Abrams and Shah (1992) have
investigated the influence of these factors by reporting on a series of
unreinforced masonry wall tests with different length-to-height aspect ratios
under different combinations of loadings. The first wall had an aspect ratio of
2.0 and was subjected to a vertical stress of 0.52MPa. This wall failed in
shear (diagonal tension) with no flexural cracking. The second wall had an
aspect ratio of 1.5 and was subjected to a stress of 0.34MPa. This wall,
which was subjected to a smaller vertical compressive stress, had a flexure-
shear failure as it was a toe compression failure. The third wall was a
slender wall with aspect ratio of 1.0 and subjected to a stress of 0.34MPa. A
flexure failure happened as the horizontal crack initiated along the bed joint
immediately above the bottom course.
Furthermore, the failure pattern is also influenced by the loading patterns,
and the biaxial behaviour is more complex than uniaxial one. The overall
biaxial behaviour is a result of the combination of stress redistribution, local
cracking and progressive failure in the localised regions (Chaimoon 2007). A
testing programme on masonry subjected to proportional biaxial loading was
performed by Dhanasekar (1985) to illustrate the influence of stress ratio
and stress orientation. Under uniaxial tension, cracking and sliding of the
head and bed joints governed failure while under tension-compression,
failure occurred either by cracking and sliding of the joints alone or in a
combined mechanism involving both units and joints.
In this chapter, only the performance of masonry wall without surrounding
constraints is presented. Regarding the failure patterns and mechanical
behaviour of masonry infill within infilled RC frame structures, the detail will
be presented in Chapter 8.
25

Chapter 2 Review of previous research on masonry
2. 4 Strengthening approaches for masonry walls
Unreinforced masonry buildings constitute a significant portion of existing
buildings around the world, and some of them are historically and culturally
important. Matthys and Noland (1989) estimated that more than 70% of the
buildings throughout the world are masonry buildings. Besides masonry
buildings, reinforced concrete frame structures infilled with masonry walls
are another popular construction system in the modern world. However, the
masonry infill can be a contributing factor to the catastrophic structural
failure if the structures are not properly designed. Moderate to strong
earthquakes can devastate buildings, resulting in massive death toll and
extensive economic losses. Especially for the developing countries, the
vicious cycle whereby they do not possess the wealth to develop their
infrastructure sufficiently to withstand the damages caused by earthquake
and conversely, earthquake destroys their economy development
(Bhattachary et al. 2014). As it is not feasible to demolish and replace these
masonry buildings due to some factors, this raises the problem of finding
methods to strengthen and retrofit the masonry buildings to ensure that they
can perform their highly sought energy absorption role.
In the past decades, researchers have proposed a variety of technical
methods to enhance the seismic behaviour of unreinforced masonry
structures. These methods have been investigated both experimentally and
numerically. However, as many repair and retrofit techniques have been
developed by practicing engineers on an individual basis, therefore there is
still little technical guidelines with which an engineer or researcher can
determine the relative merits of these methods (ElGawady et al. 2004).
The basic concept of retrofitting is to upgrade the structural strength and
improve the inelastic deformation capacity or ductility of the structure. This
section reviewed the previous studies on strengthening and retrofitting of
masonry structures in order to assess the advantages and disadvantages of
26

Chapter 2 Review of previous research on masonry
different approaches. Thus to develop a new method that differs with the
existing ones as well as to overcome the shortcomings.
2.4.1 Existing URM retrofitting techniques In the past decades, a large amount of research have been carried out
investigating the retrofitting or enhancing of existing URM buildings. So far,
the methods which have been implemented include conventional techniques
(ElGawady et al. 2004a) and modern retrofitting techniques (ElGawady et al.
2004b).
2.4.1.1 Conventional techniques
Shotcrete
Figure 2.12 Application of shotcrete to URM wall (ElGawady et al. 2006)
Shotcrete overlays are sprayed onto the surface of a masonry wall over a
mesh of reinforcing bars (Figure 2.12). ElGawady et al. (2006) carried out
tests on retrofitted masonry walls by applying shotcrete technique, and the
27

Chapter 2 Review of previous research on masonry
ultimate lateral load resistance of the walls was increased by a factor of
approximately 3.6. Shotcrete is advantageous in situations when formwork is
cost prohibitive or impractical and where forms can be reduced or eliminated,
or normal casting techniques cannot be employed. However, the
disadvantages are much time consumed in the implementation, available
spaces reduced and the affecting on the aesthetics.
Grout/epoxy injection
This method does not alter the aesthetic and architectural features of the
existing buildings and it is considered to be one of the most efficient
methods for repairing or strengthening structures of historical importance.
The main purpose of injections is to restore the original integrity of the
retrofitted wall and to fill the voids and cracks, which are presented in the
masonry due to physical and chemical deterioration and/or mechanical
actions (Bhattacharya et al. 2014). This method became popular and
practical because of its minimal cost and ease of implementation. An ideal
area of application is multi-leaf masonry walls where it is necessary to
connect the different layers of the wall and which also appear high amount
of voids in the dry rubble stones' inner core. The most important aspect of its
vast use lies with the fact that it is sustainable. However, this approach will
be successful only if the mechanical property of the mix and its physical
chemical compatibility with the masonry to be retrofitted is achieved (Alcaino
and Santa-Maria, 2008).
Ferrocement
Ferrocement is relatively cheap, strong and durable, and the basic technique
is easily acquired. It consists of a thin cement mortar laid over wire mesh,
which acts as a reinforcement. The mechanical properties of ferrocement
depend on mesh properties as the mesh helps to confine the masonry units
28

Chapter 2 Review of previous research on masonry
after cracking and thus improving in-plane inelastic deformation capacity.
Ferrocement is ideal for low cost housing since it is cheap and can be done
with unskilled workers. This retrofitting technique increases the in-plane
lateral resistance and improves wall out-of-plane stability and arching action
since it increases the wall height-to-thickness ratio (Garofano, 2011).
However, this method is much more time consumed in the implementation
and it affects the aesthetics.
Re-pointing
Sometimes, the bricks in the masonry buildings are still of good quality but
the mortar is poor. In this case, the mortar can be replaced to some extent
with a higher strength bonding material. However, this method is not
sustainable and the effectiveness is not remarkable as Tetley and
Madabhushi (2007) found that the addition of 2% Ordinary Portland Cement
to the mortar made little or no difference to the ultimate acceleration
resistance.
External reinforcement
Figure 2.13 External reinforcement using vertical and diagonal bracing (Rai and Goel 1996)
29

Chapter 2 Review of previous research on masonry
It has been found that the lateral load resistance and ductility of URM walls
have been improved greatly by mechanically attaching the exterior of
existing masonry walls with a structural system (Hamid et al. 1994). Rai and
Goel (1996) carried out a study by attaching a steel system directly to the
existing diaphragm and wall (Figure 2.13). In an earthquake, cracking in the
original masonry structure is expected and after sufficient cracking has
occurred, the new steel system will have comparable stiffness and be
effective (Hamid et al. 1994, Rai and Goel 1996). The steel strip system,
proposed to retrofit low-rise masonry and concrete walls, is effective in
increasing their in-plane strength, ductility, and energy dissipation capacity
(Rai and Goel 1996, Taghdi 2000).
Confinement of URM with RC tie columns
Figure 2.14 Reinforced tie columns confining masonry wall panels (ElGawady et al. 2004a)
This method (Figure 2.14) involves reinforced masonry tie columns confining
the walls at all corners and wall intersections as well as the vertical borders
of door and windows openings (ElGawady et al. 2004a). In order to be
effective, tie columns should connect with a tie beam along the walls at
floors levels. Eurocode 8 (1996) recommends the usage of such confined
30

Chapter 2 Review of previous research on masonry
system for masonry constructions. The confinement prevents disintegration
and improves ductility and energy dissipation of URM buildings, but has
limited effect on the ultimate load resistance (Chuxian et al. 1997).
Tomaževič and Klemenc (1997) found out that this strengthening method
can increase the lateral resistance by a factor of 1.5 as well as improve the
lateral deformations and energy dissipation by more than 50%.
Centre core technique
This method involves placing a grouted and reinforced core in the centre of
the building’s wall. In detail, a continuous vertical hole is drilled from the top
of the wall into its basement wall. After placing reinforcement in the centre of
the hole, a filler material is pumped from the top of the wall to the bottom
such that the core is filled from the bottom under pressure controlled by the
height of the grout. This strengthening method can improve the capability of
a wall to resist both in-plane and out-of-plane loading. This technique is
successfully used to double the resistance of URM wall in a static cyclic test
(Abrams and Lynch 2001).
Bamboo reinforcement
This method was proposed by Dowling et al. (2005) to use bamboo as part
of a system involving buttresses, a ring beam, internal vertical reinforcement
and horizontal internal reinforcement, which is shown in Figure 2.15. The
experimental tests showed that all reinforced structures survived up to a 100%
increase in displacement intensity. However, this remarkable improvement is
found on adobe walls, which is a very weak masonry material. With higher
strength material, the increase might not be so remarkable.
31
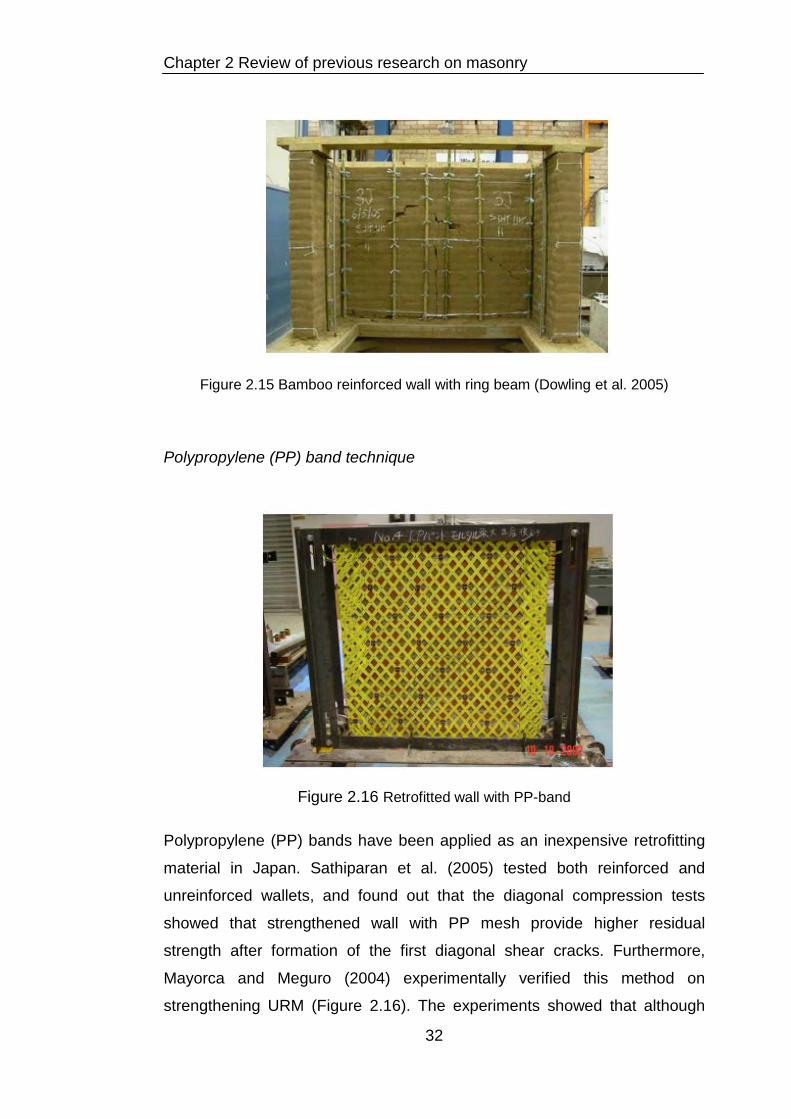
Chapter 2 Review of previous research on masonry
Figure 2.15 Bamboo reinforced wall with ring beam (Dowling et al. 2005)
Polypropylene (PP) band technique
Figure 2.16 Retrofitted wall with PP-band
Polypropylene (PP) bands have been applied as an inexpensive retrofitting
material in Japan. Sathiparan et al. (2005) tested both reinforced and
unreinforced wallets, and found out that the diagonal compression tests
showed that strengthened wall with PP mesh provide higher residual
strength after formation of the first diagonal shear cracks. Furthermore,
Mayorca and Meguro (2004) experimentally verified this method on
strengthening URM (Figure 2.16). The experiments showed that although
32

Chapter 2 Review of previous research on masonry
the reinforcement did not increase the structure peak strength, it contributed
to improve its performance after the crack occurrence. Though this approach
has the advantages of low-cost and simplicity of installation with available
resources and skills, the improvement of a structure's mechanical behaviour
is not significant and the aesthetic of the original structure is affected
significantly.
2.4.1.2 Modern retrofitting methods
The drawbacks of the conventional methods can be overcome by using
Fibre Reinforced Polymer (FRP) reinforcement. FRP probably is the most
widely used state-of-the-art approach to enhance masonry walls. Since the
early 1990s, FRP composites used as retrofitting or strengthening method
on existing concrete and other (masonry, timber) structures have been
extensively studied (Teng et al. 2003). The most widely used FRP
composites are Carbon FRP (CFRP), Glass FRP (GFRP) and Aramid FRP
(AFRP). Figure 2.17 illustrates a typical application of FRP on masonry wall
panels. In general, retrofitting of unreinforced masonry walls using FRP can
increase the lateral resistance by a factor ranges from 1.1 to 3 (ElGawady et
al. 2004b). Alcaino and Santa-Maria (2008) presented an analysis of the
experimental results of clay brick masonry walls retrofitted with carbon FRP,
and the results showed that the strength of the walls could be increased by
13-84%. In addition, Mohmood and Ingham (2011) conducted a research
programme in order to investigate the effectiveness of FRP additions as
seismic retrofit interventions for in-plane loaded unreinforced masonry walls.
The experimental results showed that the shear strength increased by up to
a factor of 3.25. Valluzzi et al (2002) performed a study in order to
investigate the efficiency of the strengthening of FRP with different
configurations. One was strips with grid arrangement and other was
diagonal strips. The panels were strengthened on both sides and only at one
side as well. It was noted that, the asymmetrical application of the
reinforcement is associate to a limited effectiveness in the improvement of
33

Chapter 2 Review of previous research on masonry
the shear resistance of masonry panels. Moreover, it is shown that the
diagonal configuration can be more efficient concerning the enhancement of
the shear capacity, while the configuration of strips as a grid allows a better
stress redistribution producing a less brittle failure due to crack.
Figure 2.17 Application of a typical FRP strengthening approach
The retrofitting of masonry wall using FRP has become popular recently.
The reasons are that it has the advantages of little added mass, low
disturbance and relatively high improvement in strength. However, the
drawbacks of this method are its high cost, high technical skill and affecting
on architectural aesthetics. The initial cost of FRP material is about 5 to 10
times more than steel (Burgoyne 2004), which is a huge burden for the
house owners in the developing countries. Moreover, many engineers have
not obtained enough knowledge of FRP materials; especially as their long-
term behaviour needs to be understood. In addition, one other major
problem is that typically in developing countries the masonry surface is not
smooth and this causes stress points for the FPR wrap and therefore results
in premature failure/unpredictable failure. Moreover, the FRP is usually
made by continuous strips or sheets externally and applied on the surface of
masonry wall. This may create a water-proof barrier and natural transpiration
of stone or ceramic material. Furthermore, the problem of fire resistance of 34

Chapter 2 Review of previous research on masonry
this strengthening approach may arise as well. Finally, this reinforced
buildings can be particularly vulnerable when FRP is used in combination
with epoxy-based bonding material, which made this technique detrimental
(Garofano 2011).
2.4.2 Discussion of the existing methods
The strengthening methods have been presented in the above section, and
the results illustrate that the improvement of different methods varies. Each
approach has its own advantages and disadvantages. The significance of
the improvement of each strengthening method depends on the structure
material and strengthening material. Therefore, the application of the
strengthening methods should be selected carefully. Table 2.1 summarizes
the characteristics of all the above methods. Table 2.2 assesses the
suitability of the methods based on the scores. The score ranges from 1 to
10 with 1 representing poor approach and 10 an excellent approach. The
rating system on Table 2.2 is based on the strengthening approach's
characteristics. For example, in terms of economic feature, FRP is about 10
times more expensive than steel, while mortar is much cheaper than steel.
Therefore, the economic score is assessed based on its cost, and they are
taken as FRP 1, steel 3 and mortar 9, respectively. In terms of strengthen
improvement, the FRP is more efficient as it can improve the strength about
1.1 to 3 times. However, for the grout injection, it can only restore the initial
strength. Therefore, the assessment score of the improvement for FRP is 10,
steel 7, and mortar4. It should be noted that this numbering is not taken as
accurate but as approximate assessment. As the exact value is not easy to
obtain. However, the value given in Table 2.2 is assessed carefully based on
the characteristics listed in Table 2.1 as well as the literature review, and it is
very close to the accurate value. Moreover, it should be noted that the
assessment and judgement was carried out on individual case, which means
the features of each retrofitting approach might be different when used in
other cases.
35

Chapter 2 Review of previous research on masonry
Figure 2.18 Summary of the characteristics of the methods Strengthening
method Characteristics
Shotcrete
The improvement of this method is significant. However it is too
expensive for application in poor communities as it requires the
use of concrete and steel reinforcement, as well as great effect
on the aesthetics.
Grout/epoxy
injection
It requires minimal cost and it is easily applied. However it
works only when the mechanical property of the mix and its
physical chemical compatibility with the masonry is achieved.
Ferrocement The improvement is remarkable. However, it is expensive due
to the use of steel reinforcement and it also affects the
aesthetics.
Re-pointing
It needs minimal cost as it only requires the manufacture of a
stronger mortar as well as little technique knowledge required.
However, it only restores the initial strength of masonry.
External
reinforcement
It has relatively remarkable improvement. However it is
expensive to apply. It also affects the aesthetic.
Confinement It is cost-effective for application in new building. However, it is
uneconomical as a retrofit for existing buildings, as it requires
demolition and reconstruction of wall sections
Centre core It could improve the performance remarkably. However, it is
expensive and complicated to implement.
Bamboo It requires very little cost and it is easily buildable. The
improvement is significant on the adobe structure. However, it
might not be effective with brickwork masonry structure.
Polypropylene
(PP) band
It requires very little cost, about 5% total cost of house. It is
simple enough for application by local craftsmen without
specific knowledge. However, it has huge effect on the
aesthetic and relatively small improvement.
FRP
It is expensive compared with other strengthening materials. It
requires sophisticated skills and it has an effect on the
aesthetic of the buildings. However, it has the advantages of
remarkable improvement and little added mass.
36

Chapter 2 Review of previous research on masonry
Figure 2.19 Assessment of the existing methods
Strengthening method Economic Improvement Sustainability Buildability
Total score
Shotcrete 2 8 5 5 20
Grout/epoxy
injection 9 4 8 8 29
Ferrocement 1 8 5 6 20
Re-pointing 10 1 8 8 27
External
reinforcement 3 7 5 6 21
Confinement 5 8 3 4 20
Centre core 2 9 6 3 20
Bamboo 7 5 7 6 25
Polypropylene
(PP) band 9 1 8 8 26
FRP 1 10 5 5 21
Based on Tables 2.1 and 2.2, it can be known that each approach has its
own characteristics and there is no best strengthening approach. Each
retrofitting technique has its own advantages and disadvantages. When a
technique is appropriate for one building, it may not necessarily be
appropriate for another. The strengthening/retrofitting approach must be
consistent with aesthetics, function, strength, ductility and stiffness and the
cost requirements. The selection should be decided by the owner depends
on which characteristic is more concerned. For example, if the improvement
is the only concern, FRP is the best choice. If the finance issue is more
concerned, grout injection or re-pointing should be preferred.
Chuang and Zhuge (2005) proposed a general procedure for retrofitting
masonry structures, and it is: (1) understanding the performance of the
building; (2) determination of required seismic capacity; (3) development and
37

Chapter 2 Review of previous research on masonry
selection of strengthening schemes; (4) design of connection details; and (5)
re-evaluating the retrofitted building. This chapter briefly followed this
procedure in order to find a retrofitting approach. In this chapter, section 2.2
and 2.3 have presented a basic understanding on the performance of
masonry building. After knowing the performance, the determination of
required seismic capacity should be made. Before the selection of
strengthening scheme, the retrofitting criteria are selected in conjunction
with the importance of the structure and seismic activities/intensities
expected at the site. Section 2.4 compared and assessed the existing
approaches, which provide a guidance on the selection of retrofitting
approaches. The engineer needs to identify the building's structural
deficiencies and understand the local and global mechanical characteristics
of the building. A good retrofitting solution requires consideration of technical,
economic and social aspects. After the selection of retrofitting method, the
craftsmen should implement the retrofitting strictly following the suggested
procedure.
In this research, the author has proposed and tested a new approach too,
which can been seen as a conventional, though practical retrofitting
approach. Namely, the traditional method of building a wall parallel to an
existing single-leaf wall and bonding the two leaves together using a mortar
(collar) joint is being considered as a possible strengthening and retrofitting
technique. The method does not require sophisticated workmanship
because of its easy implementation, which further renders it cost-effective.
Moreover, the material is easy and cheap to obtain in most countries.
Therefore, according to the literature review and compared with the
mentioned characteristics in Table 2.2, the score of this proposed method in
terms of economy, sustainability and buildability is 8, 8, and 9, respectively.
However, the improvement and influence of this technique is not known yet.
Therefore, it is necessary to conduct this research to investigate the
improvement.
38

Chapter 2 Review of previous research on masonry
Furthermore, the double-leaf wall system is also a popular construction
system as it can improve the soundproofing, waterproofing and fireproofing.
The actual research investigates experimentally the merits of the technique
that does differ from any previous published work. Based on the author's
knowledge and observation, it has not been extensively studied. Therefore,
the author intends to implement this construction system as a
strengthening/retrofitting approach and investigate its improvement. The
further intention of the study is to apply the suggested measure’s influence
on the holistic behaviour of infilled RC frames; this can actually be both
beneficial, e.g. due to adding strength, or detrimental, e.g. due to impact
damage on relatively weak columns and the influence on the structure
period because of added stiffness.
A preliminary parametric study has been conducted to evaluate the
performance of the enhancement method using a monotonically increasing
quasi-static loading scheme both experimentally and analytically. Notably,
the whole study is not only relevant to earthquake engineering, which is a
rarity in the UK; double-leaf (collar jointed) walls can also be used to
improve a structure’s lateral stability (e.g. against wind or blast loading)
through adding stiffness. Thus, this research broadly aims to generate
knowledge and understanding which can be directly applied in a number of
structural applications. The details of this approach will be presented in
Chapter 3 and 4.
2. 5 Double- and multi-leaf wall
As the proposed strengthening approach involves the double-leaf wall,
therefore, it is necessary to know the mechanical behaviour of this type of
wall. As far as the author knows, most of the researches on masonry
retrofitting or masonry mechanics were mainly on single-leaf walls, only few
researchers have conducted such studies on double- or multi-leaf masonry
walls. Still, double-leaf walls can be found in many historic structures and
39

Chapter 2 Review of previous research on masonry
they have regularly been exposed to considerable earthquakes, which
obviously affects the holistic structural dynamic performance. Furthermore,
double-leaf masonry walls are common in modern construction as they can
enhance soundproofing, fireproofing, and waterproofing characteristics. As
the proposed method to strengthen/retrofit masonry walls in this research
involves the double-leaf masonry walls too, therefore, the author feels
necessary to conduct research on such a construction system shedding light
to previous gaps in knowledge.
According to BS 5628-1: (2005), a double-leaf (collar jointed) wall is defined
as “two parallel single-leaf walls, with a space between not exceeding 25
mm, filled solidly with mortar and so tied together as to result in common
action under load”. Similarly definition can be found in Eurocode 6 (2005),
that ‘‘a wall consisting of two parallel leaves with the longitudinal joint
between filled solidly with mortar and securely tied together with wall ties so
as to result in common action under load.’’ A typical double-leaf (collar
jointed) masonry wall is illustrated in Figure 2.18.
Figure 2.20 Geometrical arrangement of a typical double-leaf masonry wall
Over the last few decades, few researchers have conducted studies on
double- or multi-leaf masonry structures. Among those researchers, Anand
40

Chapter 2 Review of previous research on masonry
and Yalamanchili (1996) analysed a composite masonry wall made of a
hollow block leaf and a brick leaf connected by two types of collar joint
(9.55mm and 51mm). The composite masonry walls were subjected to both
vertical and horizontal loads in a 3D arrangement to find out that collar joint
failed in brittle in nature and it kept propagating at a constant load once
initiated. However, as the double-leaf wall in this research is made up of two
leaves both with same material while the composite masonry leaves were
made of different materials (block and brick), therefore, it is still unknown
whether the same result can be acquired if the two leaves are made of same
materials. Moreover, Peraza (2009) found out that if the two masonry leaves
were made with different materials (clay brick and concrete block), the collar
joint may be harmful to the whole structure over the life time. As the clay
brick tends to expand over time while concrete block tends to shrink, and the
collar joint will constrain this change, thus causing the composite wall to bow
slightly. In this research, both the leaves are made of brick units, therefore,
this issue is not concerned herein.
Ferguson (2002) investigated the performance of collar joint masonry wall,
and found out that the collar joint fully infilled wall failed at a higher peak
load than those walls with empty collar joints. The same results were
confirmed in the work of Mirza et al. (2002) as well. In addition, the collar
joint was not fully infilled sometimes and improperly constructed collar joint
can reduce the structural integrity. This deficiency can be repaired by grout
injection (Krauth et al. 2001). Similarly, Vintzileou and Tassios (1995) and
Vintzileou and Miltiadou-Fezans (2008) used the grout injection to repair the
masonry which was made up of two exterior leaves. The grout injection
contributed to the increase of tensile and compressive strength of masonry.
However, this increase was not followed by substantial increase in the
stiffness of masonry. Moreover, the grout injection is different with the
proposed approach in this research in terms of building process. The grout
injection is normally done after the building of masonry walls while this
approach can be carried out during the constructions of the collar jointed
masonry walls.
41
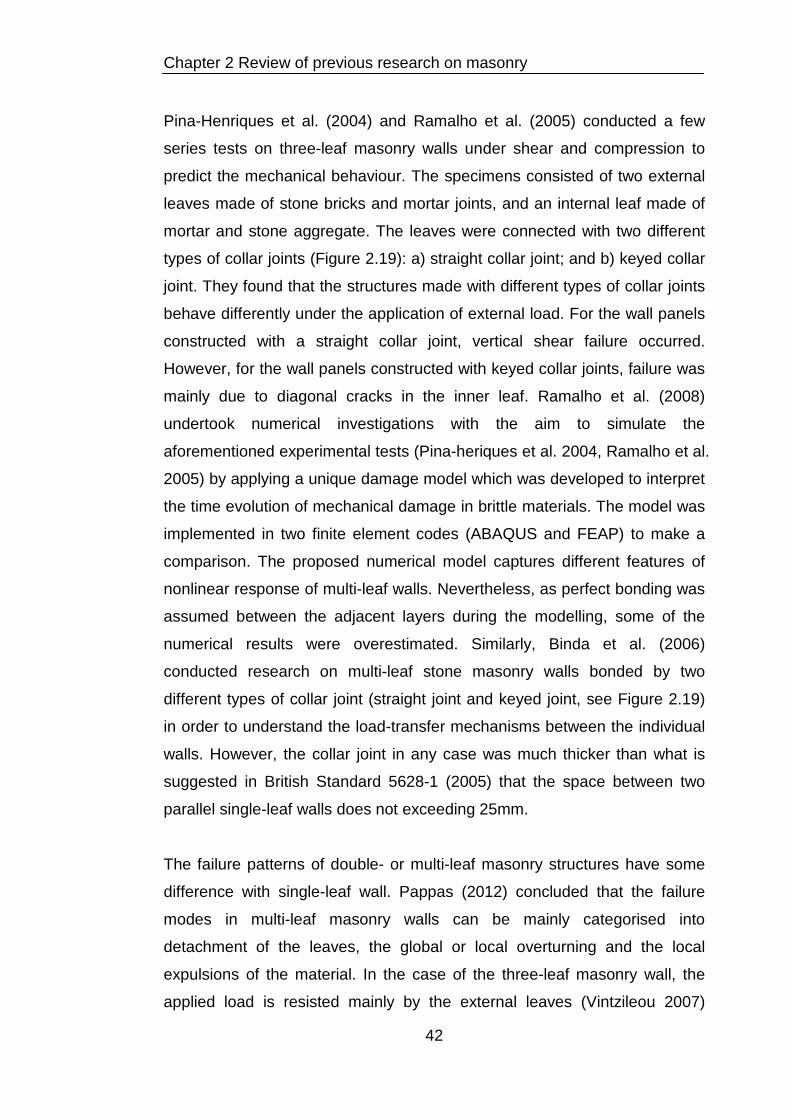
Chapter 2 Review of previous research on masonry
Pina-Henriques et al. (2004) and Ramalho et al. (2005) conducted a few
series tests on three-leaf masonry walls under shear and compression to
predict the mechanical behaviour. The specimens consisted of two external
leaves made of stone bricks and mortar joints, and an internal leaf made of
mortar and stone aggregate. The leaves were connected with two different
types of collar joints (Figure 2.19): a) straight collar joint; and b) keyed collar
joint. They found that the structures made with different types of collar joints
behave differently under the application of external load. For the wall panels
constructed with a straight collar joint, vertical shear failure occurred.
However, for the wall panels constructed with keyed collar joints, failure was
mainly due to diagonal cracks in the inner leaf. Ramalho et al. (2008)
undertook numerical investigations with the aim to simulate the
aforementioned experimental tests (Pina-heriques et al. 2004, Ramalho et al.
2005) by applying a unique damage model which was developed to interpret
the time evolution of mechanical damage in brittle materials. The model was
implemented in two finite element codes (ABAQUS and FEAP) to make a
comparison. The proposed numerical model captures different features of
nonlinear response of multi-leaf walls. Nevertheless, as perfect bonding was
assumed between the adjacent layers during the modelling, some of the
numerical results were overestimated. Similarly, Binda et al. (2006)
conducted research on multi-leaf stone masonry walls bonded by two
different types of collar joint (straight joint and keyed joint, see Figure 2.19)
in order to understand the load-transfer mechanisms between the individual
walls. However, the collar joint in any case was much thicker than what is
suggested in British Standard 5628-1 (2005) that the space between two
parallel single-leaf walls does not exceeding 25mm.
The failure patterns of double- or multi-leaf masonry structures have some
difference with single-leaf wall. Pappas (2012) concluded that the failure
modes in multi-leaf masonry walls can be mainly categorised into
detachment of the leaves, the global or local overturning and the local
expulsions of the material. In the case of the three-leaf masonry wall, the
applied load is resisted mainly by the external leaves (Vintzileou 2007)
42
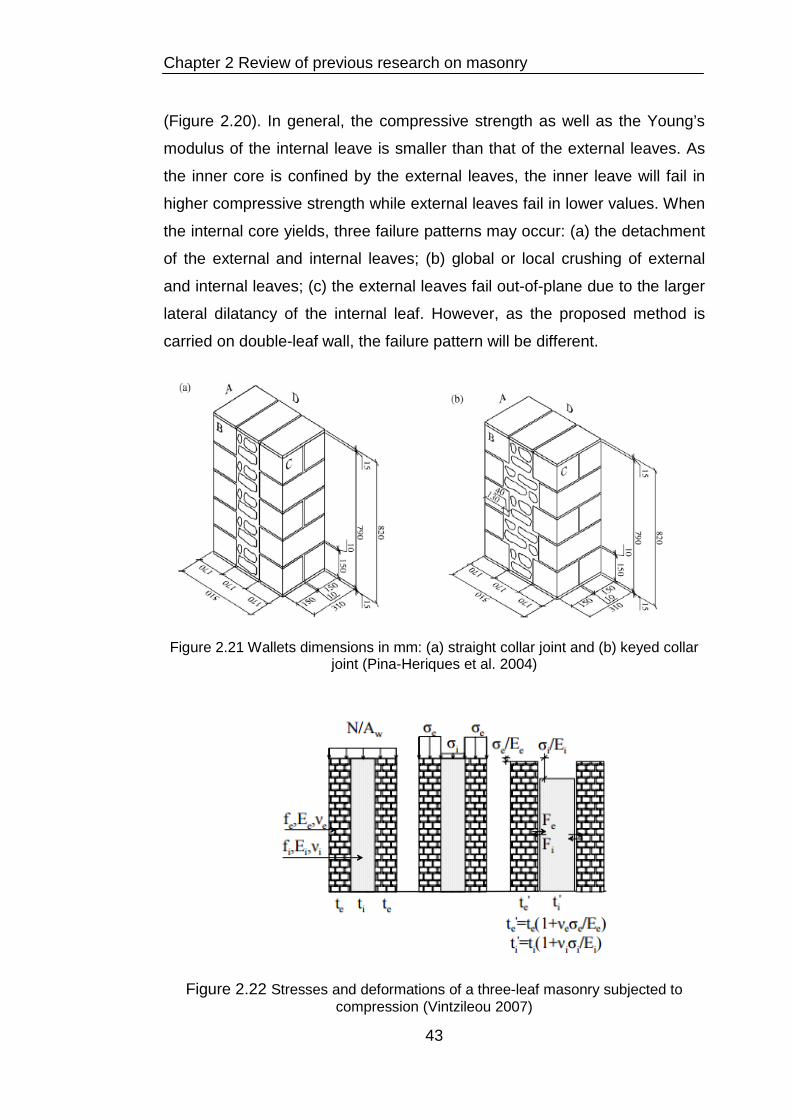
Chapter 2 Review of previous research on masonry
(Figure 2.20). In general, the compressive strength as well as the Young’s
modulus of the internal leave is smaller than that of the external leaves. As
the inner core is confined by the external leaves, the inner leave will fail in
higher compressive strength while external leaves fail in lower values. When
the internal core yields, three failure patterns may occur: (a) the detachment
of the external and internal leaves; (b) global or local crushing of external
and internal leaves; (c) the external leaves fail out-of-plane due to the larger
lateral dilatancy of the internal leaf. However, as the proposed method is
carried on double-leaf wall, the failure pattern will be different.
Figure 2.21 Wallets dimensions in mm: (a) straight collar joint and (b) keyed collar joint (Pina-Heriques et al. 2004)
Figure 2.22 Stresses and deformations of a three-leaf masonry subjected to compression (Vintzileou 2007)
43
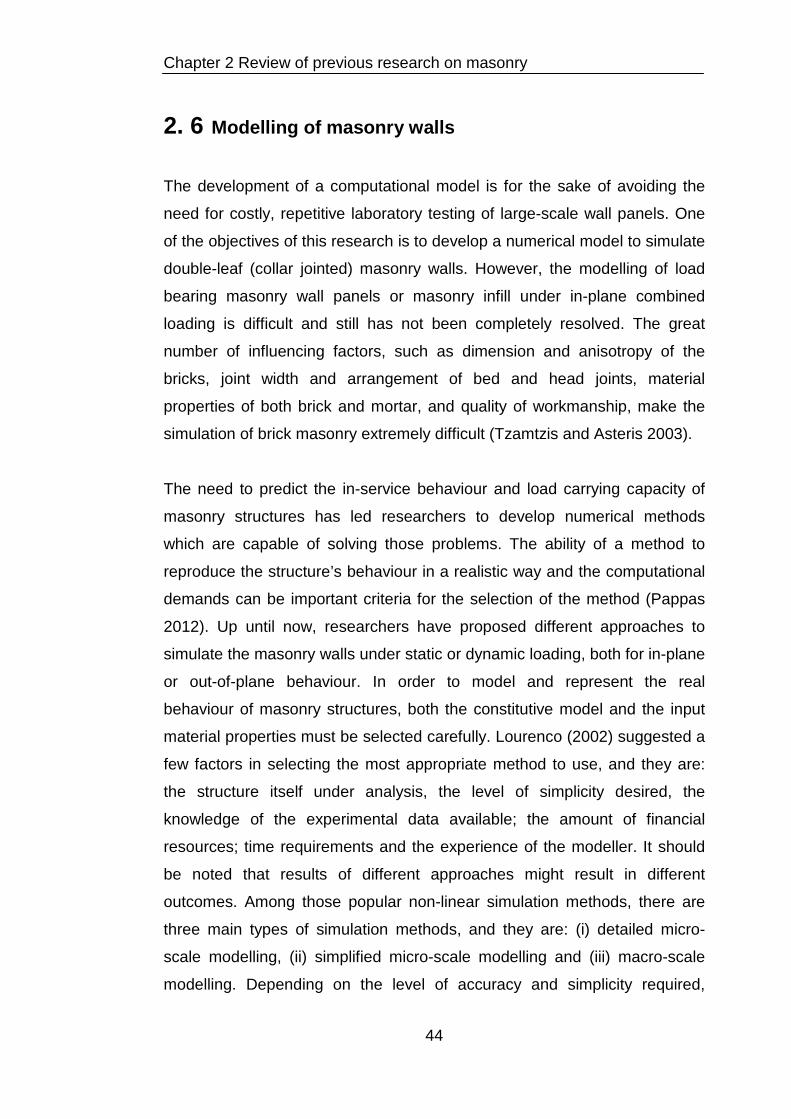
Chapter 2 Review of previous research on masonry
2. 6 Modelling of masonry walls
The development of a computational model is for the sake of avoiding the
need for costly, repetitive laboratory testing of large-scale wall panels. One
of the objectives of this research is to develop a numerical model to simulate
double-leaf (collar jointed) masonry walls. However, the modelling of load
bearing masonry wall panels or masonry infill under in-plane combined
loading is difficult and still has not been completely resolved. The great
number of influencing factors, such as dimension and anisotropy of the
bricks, joint width and arrangement of bed and head joints, material
properties of both brick and mortar, and quality of workmanship, make the
simulation of brick masonry extremely difficult (Tzamtzis and Asteris 2003).
The need to predict the in-service behaviour and load carrying capacity of
masonry structures has led researchers to develop numerical methods
which are capable of solving those problems. The ability of a method to
reproduce the structure’s behaviour in a realistic way and the computational
demands can be important criteria for the selection of the method (Pappas
2012). Up until now, researchers have proposed different approaches to
simulate the masonry walls under static or dynamic loading, both for in-plane
or out-of-plane behaviour. In order to model and represent the real
behaviour of masonry structures, both the constitutive model and the input
material properties must be selected carefully. Lourenco (2002) suggested a
few factors in selecting the most appropriate method to use, and they are:
the structure itself under analysis, the level of simplicity desired, the
knowledge of the experimental data available; the amount of financial
resources; time requirements and the experience of the modeller. It should
be noted that results of different approaches might result in different
outcomes. Among those popular non-linear simulation methods, there are
three main types of simulation methods, and they are: (i) detailed micro-
scale modelling, (ii) simplified micro-scale modelling and (iii) macro-scale
modelling. Depending on the level of accuracy and simplicity required,
44

Chapter 2 Review of previous research on masonry
different model strategy will be applied (Lourenco 1996). The methods are
summarized in Figure 2.21:
Figure 2.23 Modelling strategies for masonry: (a) typical masonry specimen; (b) detailed micro-modelling; (c) simplified micro-modelling; and (d) macro-modelling
(Lourenco, 1996)
Detailed micro-scale modelling: Figure 2.21(b) is a detailed micro-
modelling method. In this method, both the masonry units and the mortar are
discretised and modelled with continuum elements while the unit/mortar
interface is represented by discontinuous elements. Detailed micro-
modelling is probably the most accurate method to simulate the real
behaviour of masonry as it can take the elastic and inelastic properties of
both the unit and the mortar into account. However, it requires large
computational effort to analyse by applying this method. Therefore, this
method is used mainly to simulate tests on small specimens in order to
determine accurately the stress distribution in the masonry materials
(Lourenco and Pina-Henriques, 2006; Zucchini and Lourenco, 2006).
45

Chapter 2 Review of previous research on masonry
Simplified micro-scale modelling: Figure 2.21(c) is simplified micro-scale
modelling method. This method is refined based on the detailed micro-scale
modelling. In this method, the mortar joints are smeared into zero-thickness
interface while the masonry units are expanded by taking into the
dimensions of mortar joints in order to keep the whole geometry unchanged.
The expanded units are modelled as continuous elements while the
behaviour of the zero-thickness unit-mortar interface as dis-continuous
elements. Cracking in the masonry units can also be simulated by assigning
potential vertical zero thickness interfaces at the unit’s centre lines
(Lourenco 1996). The drawback of the large computational effort required by
detailed micro-modelling is partially overcome by the simplified micro-scale
modelling method as it can capture quite accurate results but take less
computational time. However, Lofti and Shing (1994), Lourenco and Rots
(1997) pointed out that the accuracy is lost since Poisson’s effect on the
mortar cannot be included and, as a result, the brick-mortar interaction can
only be partially described.
Macro-scale modelling: Figure 2.21(d) is macro-scale modelling. In this
method, the units, mortar joints and unit-mortar interfaces are smeared out
into a homogeneous anisotropic continuum. There is no distinction between
individual masonry units and the mortar joints within this method and
masonry is considered as a homogeneous anisotropic material. The
behaviour of masonry is described in terms of average stress and strains.
This approach is very attractive for large-scale masonry structures as it can
reduce much computational time as well as mesh generation flexibly. In
spite of this, it is not adequate for detailed studies and for capturing failure
mechanisms (Lourenco, 1996).
46

Chapter 2 Review of previous research on masonry
2.6.1 Simplified micro-scale modelling
Though the simplified micro-scale models are relatively costly to use due to
requiring a lot of input data and their failure criterion has a complicated form
due to the brick-mortar interaction. However, it can capture all possible
failure modes, thus giving a better understanding of the failure behaviour of
the masonry walls. The main methods available for modelling masonry
structures using the simplified micro-modelling approach include: (a) Finite
Element Method (FEM); (b) Discrete Element Method (DEM). These two
types of modelling will be described in detail in the following section.
2.6.1.1 Finite Element Method (FEM)
The finite element method (FEM) is the dominant and powerful approach for
the analysis of structures, which is able to simulate complex structures with
linear or non-linear material properties either at a micro or macro scale.
When modelling masonry using the FEM, discontinuities are generally
introduced using interface elements, for which the constitutive model is in
direct relation with the stress vector and the relative displacement vector
along the interface (Oliveira 2003). Therefore, for an accurate simulation of
masonry behaviour, it is essential to obtain a constitutive model for the
interface elements which is able to capture realistically the behaviour of
masonry and be able to simulate all the failure mechanisms.
Simplified micro-scale FEM describes masonry as a two phase material
where its constituents are considered separately. The bricks are represented
with plane stress quadrilateral finite elements. The mortar joints are
represented by non-linear interface elements, which can only deform in
normal and shear directions. This model was first proposed and applied to
solid masonry by Page (1978). Ali et al. (1987) used this method to study the
non-linear behaviour of masonry subjected to concentrated loads. Lourenco
47

Chapter 2 Review of previous research on masonry
(1996) introduced a compressive cap to the failure surface in Page’s model.
By this, the crushing of the masonry bricks is also enabled beyond the
interfaces, allowing for all possible failure modes to be taken into account.
In Lourenco’s (1996) work, this model is applied where bricks are subdivided
into a number of rigid elements and mortar joints are smeared into zero-
thickness interfaces. Al-Chaar and Mehrabi (2008) modelled RC frames
infilled with masonry walls using this method in DIANA. In addition, a lot of
other researchers have applied this method to model masonry structures
and good agreement was found (Van Zijl 2004, Dolatshahi and Aref 2011).
2.6.1.2 Discrete Element Method (DEM)
Discrete Element Method (DEM) is characterized by modelling the materials
as an assemblage of distinct blocks or particles interacting along their
boundaries and the mortar joints as zero thickness interfaces between the
distinct blocks. It was first introduced by Cundall (1971), which was applied
in the study of jointed rock engineering. Later this approach was extended to
other fields of engineering requiring a detailed study of the contact between
blocks or particles such as soil and other granular materials (Ghaboussi and
Barbosa 1990).
The discrete element method is based on discontinuous mechanics and
treats the model as discontinuous materials with the ability to have
progressive failure, crack propagation and large displacements and rotations
between the block. By the automatic rounding of the corners of the blocks, it
is possible to avoid the problem of the interlocking blocks which makes the
DEM a very convenient tool for analysis of masonry structures (Azevedo and
Sincraian 2001).
48

Chapter 2 Review of previous research on masonry
In the last two decades, the approach was applied successfully to model
masonry structures by Lemos (2007) and Zhuge (2008) in which the
collapse modes were typically governed by the mechanisms in which the
deformability of the blocks plays little or no role. Also, the possibility of
frequent changes in the connectivity and the type of contact as well as
marked non-linearity induced by the inability of the masonry joints to
withstand tension makes DE a suitable method for solving problems
involving discontinuities in the case with low bond strength masonry
(Sarhosis and Sheng 2014, Sarhosis et al. 2015).
2.6.2 Macro-scale modelling
There is no distinction between individual masonry units and the mortar
joints in macro-modelling approach. Masonry is simplified as a
homogeneous anisotropic composite by smearing units and mortar joints
into an average continuum.
Saw (1974) assumed masonry as an isotropic elastic behaviour by ignoring
the influence of mortar joints acting as planes of weakness. Dhanasekar et
al. (1985) proposed a non-linear finite element model for solid masonry
based on average properties. This assumption can work in predicting
deformations at low stress level, but not at higher stress levels where
extensive stress redistribution caused by non-linear material behaviour and
local failure would occur (Tzamtzis and Asteris 2003).
Macro-scale modelling neglects the influence of mortar joints, which makes
this modelling approach suitable for the study of the global behaviour of
masonry. Therefore, this model is applicable when the dimensions of a
structure are large enough so that the relationship between average
stresses and strains is acceptable (Lourenco 1996). This method is relatively
simple to use and requires less input data and a more simple failure criterion.
49

Chapter 2 Review of previous research on masonry
Thus remarkable simulation time can be saved by applying this method.
However, unconditionally accurate results and fine-detail of the behaviour
cannot be captured by the nature of this approach.
2. 7 Summary
This chapter reviewed the previous researches based on the aims and the
objectives of this research, which provides a general overview and basic
understanding on masonry. The literature is summarized briefly as following.
Masonry is a brittle, anisotropic, composite material, which has a better
performance in resisting compression rather than tension. It has been
experimentally and numerically studied in the past decades on the
mechanical behaviour of masonry. However, the mechanical behaviour is
still not thoroughly understood yet due to its inherent complexity. There is
still a lack of good understanding in the complex fracture behaviour of
masonry, especially on the double-leaf masonry wall.
As a building material, masonry can be often found in the residential
buildings as well as the historical heritages. Most of these buildings and
heritages are located in the seismic prone and populated areas, which are
vulnerable to damage if moderate to strong earthquake happens. Even if
without earthquake, these structures are facing different potential damages,
such as, wind, weather corrosion, and foundation settlement etc. The
damage of masonry structures might cause massive economic loss and
death toll. Therefore, it is necessary to strengthen the structure before
earthquake happens or retrofit after the damage occurs.
In order to have an effective strengthening/retrofitting, Chuang and Zhuge
(2005) proposed a general procedure, and it is: (1) understanding the
performance of the building; (2) determination of required seismic capacity;
50

Chapter 2 Review of previous research on masonry
(3) development and selection of strengthening schemes; (4) design of
connection details; and (5) re-evaluation of the retrofitted building. This
research was carried out followed this procedure. Sections 2.2 and 2.3 in
this research provide a basic knowledge on the performance of masonry
building. In section 2.4, different approaches on strengthening/retrofitting the
masonry structures have been proposed, and a comparison has been
assessed in Tables 2.1 and 2.2. According to the tables, each type of
strengthening approach has its own advantages and disadvantages, there is
no best strengthening/retrofitting approach. The application of the
strengthening approach needs to be assessed and selected based upon a
few factors: masonry material of the structure, finance problem, aesthetics
etc. Therefore, this research introduces a new strengthening/retrofitting
approach using collar jointed technique. This approach differs with the
existing strengthening approaches. Besides, collar jointed masonry wall is
quite a common and popular construction system in masonry structures as it
can improve the water, sound, and fire proofness. However, this topic has
not been extensively studied, let alone used as a strengthening method.
Therefore, in this research, the author proposed this construction system as
a new strengthening approach, namely, building a wall parallel to a single-
leaf wall and bounding the two leaves together using 10mm thick collar joint.
Though the basic concept of this approach has some similarities with the
grout/epoxy injection, it is totally different in terms of building process and
construction materials. The grout/epoxy injection is carried out after the
building of masonry structures in order to infill the cavity of the structure.
Furthermore, the grout/epoxy injection is most often carried out on stone
masonry structures as this type of structures is more easily to have cavity
between each leaves. The proposed strengthening approach using collar
jointed technique has its own characteristics. The collar jointed technique is
easy to be carried out in different types of masonry structures, including
adobe, brick and stone. Also, the material is cheap and easy to obtain in
most countries, which is a cost-effective choice for the householders in the
developing countries. Furthermore, this approach does not need
51

Chapter 2 Review of previous research on masonry
sophisticated skill, which is buildable for the local craftsmen. In addition, the
aesthetics of the structure can be affected least if the strengthening material
was chosen similarly with the original one. In conclusion, this method has its
advantages in economy, sustainability and buildability. However, the
improvement of this method is not known yet, which will be conducted in the
following chapters. In order to have a more comprehensive understanding
on the mechanical behaviour of masonry wall panels reinforced/unreinforced
using collar jointed techniques, experimental tests should be carried out in
the laboratory. More details of this approach will be presented in Chapter 3
and the test results will be demonstrated in Chapter 4.
52

Chapter 3 Experimental work on masonry walls
Chapter 3 Experimental work on masonry walls
3. 1 Introduction This chapter describes the materials and experimental details that have
been used and conducted throughout the research. Seven tests
investigating two different types of masonry walls, i.e. the benchmark single-
leaf and the innovative double-leaf, have been carried out in George Earle
Laboratory in the University of Leeds. The tests breaking down includes four
tests on single-leaf and three on double-leaf masonry wall panels, wherein
critical variables were modified. The experimental observations were
primarily focused on static displacement and load capacities clearly supports
a quasi-static rationale for performing any earthquake load related
assessments. In addition to the large scale tests on masonry walls, some
experimental tests on small specimens, including mortar cubes and brick
units, were conducted respectively as well, to obtain the mechanical
properties of the materials used in the experimental work.
3. 2 Specimen materials The materials used in this research have been tested and assessed by
carrying out a series of preliminary small scale tests to obtain all the relevant
material properties. The types of materials are discussed in detail and
presented according to the requirements needed.
3.2.1 Brick
Bricks make up most percentage of the masonry wall, and play an important
role in the whole mechanical behaviour of a masonry element. In general,
53
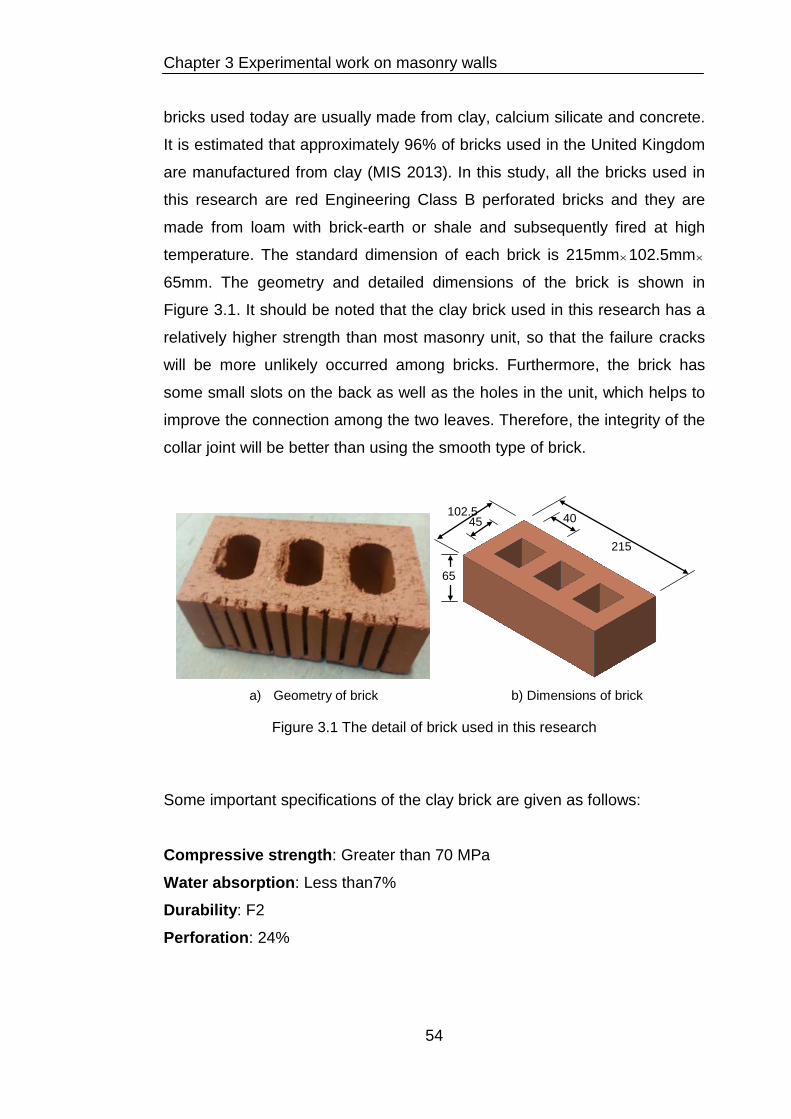
Chapter 3 Experimental work on masonry walls
bricks used today are usually made from clay, calcium silicate and concrete.
It is estimated that approximately 96% of bricks used in the United Kingdom
are manufactured from clay (MIS 2013). In this study, all the bricks used in
this research are red Engineering Class B perforated bricks and they are
made from loam with brick-earth or shale and subsequently fired at high
temperature. The standard dimension of each brick is 215mm×102.5mm×
65mm. The geometry and detailed dimensions of the brick is shown in
Figure 3.1. It should be noted that the clay brick used in this research has a
relatively higher strength than most masonry unit, so that the failure cracks
will be more unlikely occurred among bricks. Furthermore, the brick has
some small slots on the back as well as the holes in the unit, which helps to
improve the connection among the two leaves. Therefore, the integrity of the
collar joint will be better than using the smooth type of brick.
a) Geometry of brick b) Dimensions of brick
Figure 3.1 The detail of brick used in this research
Some important specifications of the clay brick are given as follows:
Compressive strength: Greater than 70 MPa
Water absorption: Less than7%
Durability: F2
Perforation: 24%
65
45
102.5
40 215
54

Chapter 3 Experimental work on masonry walls
The bricks have been tested under the guidance of British Standard BS
3921 (BSI 2005) and BS EN 772-1 (BSI 2011). The bricks were compressed
under the equipment TONI PACT 3000, which is shown in Figure 3.2, to
obtain brick’s compressive strength. Prior to the test, the bricks were
immersed in water for 24 hours before loading on bed face via 10mm
plywood plates as required by the standard. The results showed that the
bricks have a mean compressive strength of 74MPa.
Furthermore, the water absorption tests were carried out as well based on
British Standard BS 3921 (2005). Water absorption of brick affects the
performance of mortar and the deformation of masonry. The water
absorption of 10 bricks immersed in water for 24 hours was 5.6% (±0.6%).
However, there is no standard method available to date for measuring the
elasticity modulus of masonry units. Therefore, the elastic modulus test were
carried out in the traditional method, which is calculated by dividing the
tensile stress (stress is a force that tends to deform the body on which it acts
per unit area) by the extensional strain (strain is the measure of the extent to
which a body deforms under stress, which has no unit) in the elastic portion
of the stress-strain curve. The equation to obtain the modulus is shown as
following.
𝑬𝑬 = 𝝈𝝈𝜺𝜺
= 𝑭𝑭𝑳𝑳𝟎𝟎𝑨𝑨𝟎𝟎𝜟𝜟𝑳𝑳
(3.1)
In this research, the elastic modulus of brick has been tested by using strain
gauges to measure the strain change under compression. Though as
mentioned in the literature review section that brick is anisotropic, the elastic
modulus perpendicular to bed face is taken as 𝟏𝟏𝟏𝟏.𝟏𝟏𝟗𝟗𝟗𝟗/𝐦𝐦𝐦𝐦𝟐𝟐from the test
results. However, as the brick was extruded perpendicular to its bed face
during the manufacturing process, the strength and stiffness of a brick
parallel with bed face will be different due to the presence of perforations,
method of manufacture, and type of clay. In the majority of cases, bed-face
55

Chapter 3 Experimental work on masonry walls
modulus are equal to or greater than header-face modulus, but for pressed
clay bricks, the bed-face modulus is only about 50% of the header face
modulus (Brooks 2014). Based on the literature review that the masonry
behaves in a linear stress-strain manner when loaded below their strength
limit. Similar experimental result is also found in Chapter 4. Therefore, in this
study, the property of a single brick unit is taken as isotropic.
Figure 3.2 TONI PACK for compression test
3.2.2 Sand
Sand is mainly used as an inert material to give volume which results in
reduction of cost. Type S sand was provided in this research in order to
achieve the required strength and durability. The results of a sieve analysis
are shown in Figure 3.3, which complied with BS 1199 and 1200 (1976) and
BS 410-2 (2000).
56

Chapter 3 Experimental work on masonry walls
Figure 3.3 Sieve analysis of sand
3.2.3 Cement
High strength Portland cement is used to construct all masonry wall panels.
The cement is based on BS EN 197-1 (2011). It is supplied by Hanson
Heidelberg Cement Group, packed in bags of 25Kg.
3.2.4 Lime
Lime is used in this research because it improves the plasticity and
workability of mortar, while providing a high degree of cohesiveness.
Furthermore, lime mortars have high water retention, creating an improved
bond as there is more contact between the unit and the mortar. In this
research, the white hydrated building lime was used in the construction of
masonry walls, which is based on BS EN 459-1 (2015).
57
Chapter 3 Experimental work on masonry walls
3.2.5 Water
Clean tap water is used throughout the research work.
3.2.6 Mortar
Mortar is used as a means of sticking or bonding bricks together and to take
up all irregularities in the bricks. Although mortars form only a small
proportion of a masonry wall as a whole, its characteristics have a large
influence on the quality of the brickwork and mechanical behaviour of
masonry walls. To do this the mortar must be workable so that all joints are
filled completely. The stiffness and plasticity are two things of importance for
the workability (Wijanto 2007). The mortar stiffness depends on the quantity
of water added to the mortar mix. The ratio of water to be added to the
mortar depends on the application of the mortar, and does not indicate
anything about its quality but it is a characteristic of the condition. Therefore,
the workability of the mortar should be assessed before it being used in the
construction.
The tests on masonry mortar in this research were based on BS EN 1015-11
(1999). There were two different types of mortar used in the experiments,
Type S and Type N. Type S has mix proportions of Portland cement: lime:
sand by volume equal to 1:1/2:4½. The mix proportions of mortar by mass
can be estimated from the bulk density of each constituent. The mix
proportions by mass is 6.8:1.3:35.5 for cement, lime, and sand respectively.
For Type N mix proportions are changed to 1:1:6 by volume, and
6.3:2.5:42.6 by mass.
The mortar is mixed by machine to ensure a thorough mixing mortar. The
cement, lime and sand are mixed dry first to ensure a uniform mix. Then the
water will be added to the mixture and mixed thoroughly by machine until the
mortar is easily workable. Before the mortar is used in construction, the
58
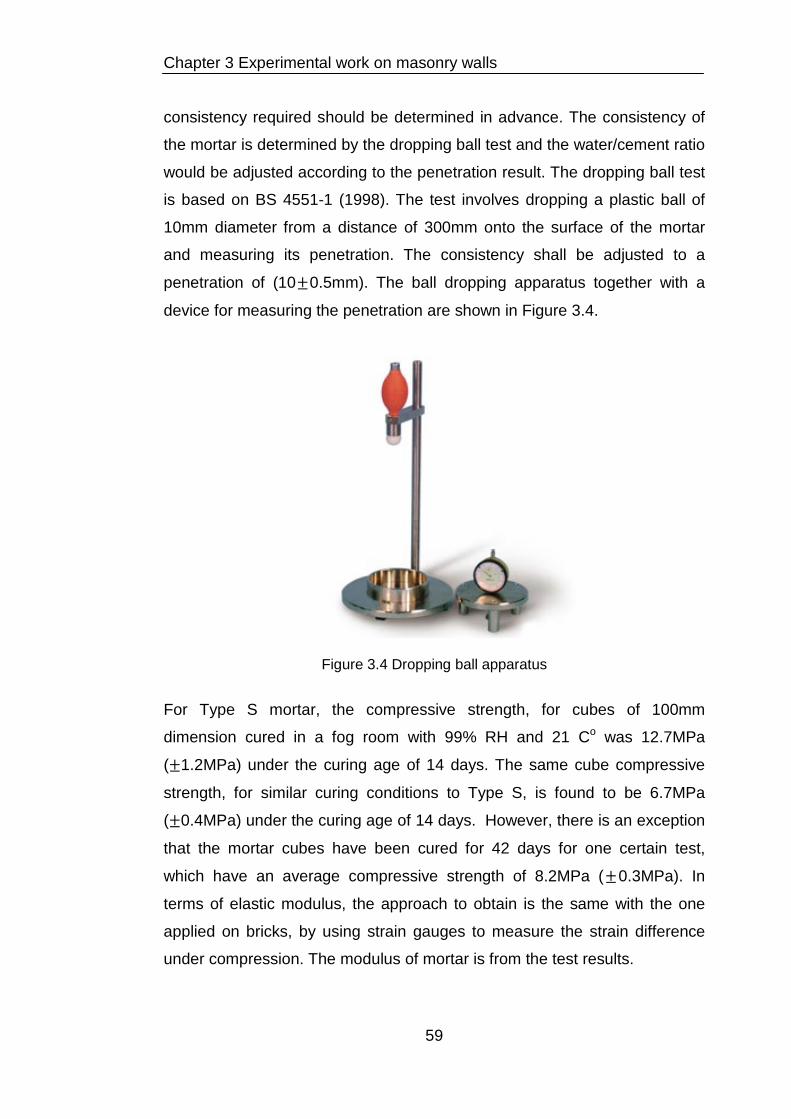
Chapter 3 Experimental work on masonry walls
consistency required should be determined in advance. The consistency of
the mortar is determined by the dropping ball test and the water/cement ratio
would be adjusted according to the penetration result. The dropping ball test
is based on BS 4551-1 (1998). The test involves dropping a plastic ball of
10mm diameter from a distance of 300mm onto the surface of the mortar
and measuring its penetration. The consistency shall be adjusted to a
penetration of (10±0.5mm). The ball dropping apparatus together with a
device for measuring the penetration are shown in Figure 3.4.
Figure 3.4 Dropping ball apparatus
For Type S mortar, the compressive strength, for cubes of 100mm
dimension cured in a fog room with 99% RH and 21 Co was 12.7MPa
(±1.2MPa) under the curing age of 14 days. The same cube compressive
strength, for similar curing conditions to Type S, is found to be 6.7MPa
(±0.4MPa) under the curing age of 14 days. However, there is an exception
that the mortar cubes have been cured for 42 days for one certain test,
which have an average compressive strength of 8.2MPa (±0.3MPa). In
terms of elastic modulus, the approach to obtain is the same with the one
applied on bricks, by using strain gauges to measure the strain difference
under compression. The modulus of mortar is from the test results.
59

Chapter 3 Experimental work on masonry walls
3. 3 Tests description
In this research, two different types of specimens have been tested: single-
leaf and double-leaf (collar-jointed) masonry walls. Collar jointed masonry
walls include the pre-damaged and post-damaged type. Based on the British
Standard BS 5628-1 (2005), the collar jointed wall is defined as two parallel
single-leaf walls, with a space between not exceeding 25mm, filled solidly
with mortar and so tied together as to result in common action under
external load.
3.3.1 Single-leaf wall panels
First of all, tests on single-leaf walls have been carried out. The test rig of
the single-leaf wall is demonstrated in Figure 3.5. The in-plane dimensions
of each built panel were 975mm×900mm×102.5mm (thirteen courses high
and four bricks wide). All the bricks were constructed in stretcher bond type
and tied together with 10mm thick mortar joint. Furthermore, the holes in the
brick were filled with mortar during the construction process of the wall. The
holes were filled straight away after each layer being completed so that the
holes can be taken as nearly fully filled. All construction work was completed
by an experienced mason in order to obtain uniformity.
Panels rested on a steel base-plate, which was constrained by the steel
portal. The wall was also restricted on the top-left corner by external –in-
plane quasi static loading. To avoid localised crushing of the masonry at the
point of application of the loads, a steel plate was placed on the top-left
corner of the wall to distribute and reduce stresses. The steel plates were
spanned in a vertical direction over the top three courses and one brick
length horizontally. There was a wide gap (10mm for the first two walls and
then 20mm for the rest) between the unloaded side of the panel and the
portal frame column in order to provide clearance for displacements. For the
60

Chapter 3 Experimental work on masonry walls
first three courses, starting from the base, this gap was filled with mortar to
restrict any horizontal movement of the wall. The mortar filled in the gap was
the same with the mortar used as bed and head joints. Sixteen demountable
mechanical strain gauges (DEMEC) points were mounted on the wall to
measure strains during testing. This instrument consists of a digital indicator
attached to an invar bar with hardened steel cones attached to one fixed and
one movable end. Stainless steel measurement discs with a blind drilled
circular hole were attached to the specimen surface with a suitable adhesive.
The distance between every adjacent two DEMEC gauge points was
200mm. The DEMEC gauge measurement tools are shown in Figure 3.6.
Each increment on the digital indicator represents 3.9 micro-strains.
Furthermore, a LVDT was set to measure the wall top horizontal deflection.
Figures 3.7 and 3.8 represent the real test rig of the single-leaf wall panel
carried out in the laboratory.
Figure 3.5 Testing rig of single-leaf panel
61

Chapter 3 Experimental work on masonry walls
Figure 3.6 DEMEC gauge measurement
Figure 3.7 Test rig of single-leaf wall on the front side
62

Chapter 3 Experimental work on masonry walls
Figure 3.8 Test rig of single-leaf wall on the back side
3.3.2 Double-leaf wall panels
After the tests on single-leaf walls, a second series of tests were
subsequently carried out for all double-leaf walls on an updated apparatus
based on the single-leaf wall panel, which are shown in Figure 3.9. The
second leaf was built parallel to the existing one and got ‘tied’ to it using a
10mm thick collar joint. The mortar used in the collar joint was exactly the
same as the mortar used in the other tests. Mortar was successively filled up
to the bricks’ top and the collar joint after constructing each new layer of
bricks. Therefore, it could be simply assumed that the holes in the bricks and
collar joint between the two walls were filled with mortar fully. As the brick
has many slots on the back side (shown in Figure 3.8) and the surface is
relatively rough, therefore, the mortar was filled directly into the vertical
collar joint without doing any surface treatment in advance. The new panel
(second leaf) was not restricted in any way by the portal frame, which meant
that it could move freely throughout its length along its in-plane axis. The
63

Chapter 3 Experimental work on masonry walls
load was only applied to the initial panel which was restrained by the portal
frame, and the loading setup was exactly the same with the single-leaf wall.
Thus, there was no direct loading applied to the second wall; the only load
sustained was transferred by shear from the initial panel via collar joint
between the two walls.
In this research, steel ties have not been used. The main purpose of the
steel tie is to link the different leaves and to promote a more monolithic
structural element, therefore, to prevent the out-of-plane instability of the
leaves. The main purpose of this research is to investigate the shear
performance of the collar joint wall under lateral load, thus only the collar
joint is considered in the experiments. The steel tie may have some
influence on the mechanical performance of collar jointed masonry wall, for
instance, preventing the two leaves from separating from each other.
Therefore,. in order to exclude the influence of the steel tie, the collar joint
without steel ties is conducted in this research. After knowing the behaviour
of the collar joint, then the steels could be included in the further research in
order to obtain the combined behaviour of the collar joint and steel tie.
Figure 3.9 Testing rig of double-leaf panel
64

Chapter 3 Experimental work on masonry walls
For the double-leaf walls, there was a further division into two categories
relevant to their damage stage. These will be quoted as pre-damaged and
post-damaged type.
For the pre-damaged case, the second-leaf was attached to the first leaf
before the first leaf was tested. In detail, the two leaves were built at the
same time with the same material and connected by a 10mm thick collar
joint. After that, the newly formed wall (double-leaf) could be assumed to
work as a whole panel as the mortar joint can provide a good bond
connection between the two leaves. The collar-jointed wall panel was tested
under the apparatus after curing for 14 days under polythene. For the post-
damaged type, the second leaf was attached to the first leaf only after the
latter had nominally failed making it essentially a means of retrofitting. In
detail, the first leaf was built by the mason first and then tested after it had
cured for certain number of days. However, the test was interrupted when
initial fine cracks (no big cracks) appeared along the mortar joints. This case
represents the small crack occurred on masonry walls because of
unexpected external loadings, foundation settlement, temperature changes
and moisture content changes etc happened. Therefore, in this case, it is
unlikely or unnecessary to replace the cracked masonry wall as the cracks
are too small. However, it is practicable to apply the post-damaged
retrofitting method proposed in this research. By using this method, the wall
could restore its initial strength without destructing the structure. Based on
the single-leaf wall panels’ tests that have been done previously, it could be
observed that the wall had nearly failed in this circumstance. Subsequently it
did not get any crack repair as the cracks were too small to fix, but got
retrofitted by “attaching” a second wall to it using the previously discussed
collar joint technique, thus becoming a post-damaged double-leaf wall. The
test rig of the double-leaf wall carried out in the laboratory is shown in
Figures 3.10 and 3.11.
65

Chapter 3 Experimental work on masonry walls
Figure 3.10 Test rig of double-leaf wall on the front side
Figure 3.11 Test rig of double-leaf wall on the back side
3. 4 Curing
In all cases, masonry wall panels were cured for 14 days under polythene
before being loaded with one exception. Wall 6 (a single-leaf wall) was cured
66

Chapter 3 Experimental work on masonry walls
for an extended period of 42 days before being tested in order to have some
indication of the curing impact. Eight mortar cubes had been cast every time
during the construction in order to control the mortar strength. All the cubes
were cured in the steaming room for the same period with the masonry wall.
A summary of the test configurations indicating the adopted tests’ naming
conventions for any later reference is provided in Table 3.1.
Figure 3.12 Summary of tests specimens
3. 5 Load design and history
The horizontal/lateral force was applied to the restricted panel by a
horizontal actuator. The lateral load was applied on the free side of the
masonry wall (the other side was restricted by steel portal frame), as it is
displayed in Figures 3.5 and 3.9. Among others, the scope of the test rig
was to potentially simulate the RC frame restraint as experienced by a real
infill wall. Therefore, a vertical load cell was also used to suppress the
vertical uplift of the restrained leaf, mimicking the interaction with an RC
frame, which is shown in Figure 3.12. Here in this research, the quasi-static
in-plane load is applied, which means the loading was added laterally to the
masonry wall with a slow rate and the deflection was recorded at the same
time. The nonlinear static (pushover) analysis is the often used procedure
Wall name Wall type Mortar type Cured days Pre/Post-damaged W1 Single-leaf S 14
W2 Single-leaf S 14
W3 Single-leaf N 14
W4 Double-leaf N 14 Pre-damaged
W5 Double-leaf N 14 Pre-damaged
W6 Single-leaf N 42
W7 Double-leaf N 14 Post-damaged
67

Chapter 3 Experimental work on masonry walls
for evaluation of the seismic response of the buildings, and it could
approximately model its mechanical behaviour.
Figure 3.13 Typical deformed shape of RC frame infilled with masonry wall
To avoid localised crushing of the masonry at the point of application of the
loads, steel plates were used to distribute and reduce stresses, which was
shown in Figure 3.5 and 3.9. The vertical load was set up to 20kN from the
start to represent the vertical load coming from the above beam, and then
increased slowly with the increase of horizontal/lateral load.
What happened unexpectedly to Wall 1 and Wall 2 is that the test stopped
before failure. As described that the gap between Wall 1 and the frame is
not big enough for the total deflection. Therefore, Wall 1 failed during the
test but it did not totally collapse. Wall 2, has been tested twice. In the first
test, the vertical load was kept constant at 20kN. However, the wall was
lifted up during the test. Therefore, for the second test, the vertical direction
was restrained so that the vertical load increased gradually. The horizontal
load was increased at a rate of 2kN/min. However, the test was paused at
every 5kN increment. In order to minimize the time relaxation effects, the
measure of the DEMEC gauge points was carried out as soon as possible.
In the future research, automatic data recording method should be applied..
68

Chapter 3 Experimental work on masonry walls
Once the walls failed, the lateral force-deflection and the relevant failure
patterns were recorded.
3. 6 Summary Masonry is a composite material and masonry structure is difficult to analyse
due to its complexity, especially for the collar jointed (double-leaf) masonry
wall panels. In this research, unreinforced masonry wall panel is
strengthened/retrofitted using collar jointed technique to form a collar jointed
masonry wall. In order to obtain a general overview and basic understanding
on the mechanical performance on both strengthened and unstrengthened
masonry wall panels, a detailed description of the experimental test rigs on
masonry wall panels, including four specimens on single-leaf and three
specimens on double-leaf, has been presented in this chapter. The
experimental results will be analysed and demonstrated in detail in Chapter
4.
69

Chapter 4 Experimental results
Chapter 4 Experimental results
The masonry wall specimens have been tested in Chapter 3 and the results
will be discussed and presented here in this chapter.
4. 1 Failure patterns; an initial qualitative assessment
This section describes the failure patterns of the single- and double-leaf
(collar jointed) masonry wall panels.
4.1.1 Single-leaf wall panels
The failure patterns of single-leaf Wall 1, 2, 3, and 6 are shown in Figures
4.1, 4.2, 4.3 and 4.4, respectively, which will be explained in detail as
following.
Figure 4.1 Failure pattern of single-leaf Wall 1
70

Chapter 4 Experimental results
According to the failure patterns illustrated in Figures 4.1 and 4.3, the failure
mode of a single-leaf masonry wall panel is described by a major diagonal
crack (except Wall 2, which will be discussed in the next paragraph). Based
on the experimental results observed on Wall 1, before this diagonal crack
was being developed, some small, hairline (shear) cracks appeared along
the bed joint length when the lateral load reached around 30kN. Further,
with the increase of the horizontal load, the top-corner of the wall (indicated
as area 1 in Figure 4.1 and Figure 4.3) began to rotate. However, the
rotation was restrained by the vertical actuator placed on the left-top corner
of the wall. Therefore the stress around the corner kept accumulating, until it
surpassed the strength of the masonry wall. When the lateral in-plane
resistance reached approximately 50kN, the corner was crushed around
area 1 and cracks started propagating from that region down through the
wall body. Stresses kept increasing with the applied load as long as the
rotation is restrained until it reached the wall’s failure load, 58kN.
The failure process of Wall 3 is very similar with Wall 1. The small cracks
showed up around 35kN. The cracks kept expanding until the load reached
62kN, then the big diagonal crack formed. However, the wall still kept
carrying more load until the lateral load reached about 70kN. Once the
external load exceeded the strength of the masonry, the failure occurred in
the form of the earlier quoted diagonal crack spanning widely from area 1 to
area 3, following a staircase path along the mortar interface.
In conclusion, these failure patterns demonstrated in Figures 4.1 and 4.3
have also been found and described in the work of Lourenco and Rots (1997)
in terms of local failures and in the work of Campbell Barrza (2012) in terms
of global failures which were demonstrated in Chapter 2. In Lourenco and
Rots' work, the cracking of unit in direct tension and masonry crushing can
be found in area 1 in both Figures 4.1 and 4.3. The joint tensile cracking and
unit diagonal tension crack can be found in area 2 in Figure 4.3. In terms of
global failures, the shear failure and bending failure described in Campbell
Barrza's work can be found in area 2 and 3 in both figures, respectively. This
71

Chapter 4 Experimental results
typical mechanical behaviour of a masonry wall under lateral load can also
be seen in the work of Vermeltfoort and Raijmakers (1993). This is because
the mortar is usually weaker compared with the brick in masonry walls and it
is the place where the cracks most likely occurred.
However, at some point, the cracks may pass through bricks as well as
shown in area 3 in Figure 4.3. This is because that the mortar was in a state
of approximate tri-axial compression, while the brick is subjected to
compression combined with bi-axial tension. The expansion of mortar under
compression was confined by bricks and therefore induced an approximate
state of tri-axial stress in mortar. The mortar could carry much higher
compression due to internal confining stresses. However, the expansion of
mortar could cause tension among bricks in reverse. If this tension
exceeded the tensile strength of the brick, cracks occurred. The point at the
top of the edge gap-filling mortar in area 3 is clearly a point of rotation and
as expected no local crushing of the masonry was observed below this
region. After the big diagonal crack appeared, the wall could carry no more
lateral load and failed soon after.
For Wall 2, which is shown in Figure 4.2, there are no obvious cracks
occurring in the whole panel. The reason is that Wall 2 had been tested
twice. For the first test, the vertical load was kept constant at 20kN. However,
as the rotation was not restrained (the vertical actuator was adjusted to free
the extra vertical load resulted from rotation), the wall was lifted up from the
base in the middle of the test. In this case, the wall failed by detaching from
the steel base while the whole masonry wall body was nearly intact during
the test. Then the wall was tested again with rotation restrained like Wall 1.
However, during this time the wall touched the frame before any obvious
cracks appeared. In this case, this experiment acted like a control test to
prove that the failure of a masonry panel are relevant with the boundary
conditions.
72

Chapter 4 Experimental results
Figure 4.2 Failure pattern of single-leaf Wall 2
Figure 4.3 Failure pattern of single-leaf Wall 3
For Wall 6, which is still a single-leaf wall. However, as it was explained in
the experiments section in Chapter 3, this wall was not totally failed and
there were no apparent cracks occurring in the wall, only some small and
hair-line cracks appeared along the mortar joints when the lateral load
73

Chapter 4 Experimental results
reached around 45kN. The number of cracks kept increasing unit the test
was stopped on purpose. This is because at this stage, the lateral load
reached about 70kN and the cracks were visible and the crack sound could
be heard clearly. Based on the findings from previous experiments the wall
was very close to failure. These cracks are highlighted with black line for
clarity, which is shown in Figure 4.4. However, compared with previous
researches and the totally failed experimental walls, the crack patterns were
very alike. It could be assumed that Wall 6 is nearly at the failure point and
the failure pattern would be represented by diagonal crack if it failed totally.
This wall will be strengthened and tested as a post-damaged approach. The
result of it is shown in section 4.1.2 in this chapter.
Figure 4.4 Failure pattern of single-leaf Wall 6
4.1.2 Double-leaf walls
The double-leaf walls consists of two types of masonry walls (as previously
defined) pre-damaged and post-damaged walls. As these two types were
built in different approaches, they will be presented separately as following.
74

Chapter 4 Experimental results
4.1.2.1 Pre-damaged test
Figures 4.5 and 4.6 represent the failure patterns of Wall 4, while Figures
4.7 and 4.8 represent Wall 5. As displayed in Figures 4.5 and 4.7, it is clear
that the failure pattern is represented by diagonal cracking in pre-damaged
walls, similar to the single-leaf wall cases.
However, at this instance, masonry walls had more cracks than their single-
leaf counterparts prior to the formation of the decisive diagonal crack that
signified the ultimate failure, this is a sign that for the double-leaf walls,
ductility (i.e. extent of plastic deformation) had improved through the
presence of a second leaf. In terms of the failure process, there were three
notable features of behaviour of this type of masonry wall, namely: i) initial
flexural cracking in the bed joints of the wall; followed by, ii) propagation of
stepped shear cracks, with increasing load leading to, iii) complete collapse.
In detail, some hairline cracks appeared along the bed joints on both leaves,
first when the lateral load reached around 42kN, similar with single-leaf wall.
With the increase of lateral load, the wall started to rotate. However, this
rotation was restrained by the vertical actuator. The stress among mortars
started to accumulate. The cracks kept increasing and propagating during
this stage. When the lateral load reached about 75kN, the cracks became
very obvious and crack sound could be heard. After that, the lateral load
kept increasing until it reached approximately 92kN, a big and remarkable
diagonal crack was formed and failure happened. From the test failure
process, it was clearly seen that the two leaves worked and failed as a
whole panel.
Note the cracks in the second leaf appeared later than the ones on the first
leaf, which is because the load from the first leaf was spread evenly by the
collar joint before it passed to the second leaf. Also, in all cases the cracks
on the second leaf were less compared to these of the first one and mainly
occurred along mortar joints, which are shown in Figures 4.6 and 4.8.
75

Chapter 4 Experimental results
Therefore, it became apparent that the stress transfer between the two
leaves was effective throughout the different loading stages as initially
envisaged. Namely, the load was applied directly to the first wall and
distributed to the second wall consistently via the collar-joint and there was
less stress concentration on the second leaf.
Although the two leaves are joined and the width of the loaded area
effectively equals to the double of the initial thickness, the real stress is not
distributed evenly, being concentrated at the top corner of the first wall and
“flowing” inhomogeneously through into the second wall. The uneven
distribution of the stress between the two walls is also influenced by the
boundary conditions imposed. The second leaf was not restrained by the
gap-filling mortar and is therefore being less stiff, it attracted less of the load.
From Figures 4.11 and 4.12, it can be seen that the two leaves are still
bound together, which means the composite masonry wall works as a whole
panel in general.
Figure 4.5 Failure pattern of double leaf wall W4 on the loaded leaf
76

Chapter 4 Experimental results
Figure 4.6 Failure pattern of double-leaf wall W4 on the unloaded leaf
Figure 4.7 Failure pattern of double leaf wall W5 on the loaded leaf
77

Chapter 4 Experimental results
Figure 4.8 Failure pattern of double-leaf wall W5 on the unloaded leaf
4.1.2.2 Post-damaged test
For the post-damaged double-leaf masonry wall panel, the failure process
and failure patterns were different with the pre-damaged masonry wall. In
terms of failure process, there were four notable features of behaviour
namely: i) initial flexural crack; followed by ii) formation of diagonal stepped
cracks from the top right hand side of the panel to the bottom left hand side
with increasing load leading to iii) detachment of the collar joint from the wall;
and finally iv) collapse as a result of shear failure.
In detail, the first leaf of the pre-damaged wall behaved in a similar manner
to the single-leaf walls tested previously (failure was governed by a wide
diagonal crack), as Figure 4.9 illustrates. This was obviously affected
strongly by the preloading and incipient damage induced to the wall.
78

Chapter 4 Experimental results
However, the second wall behaved quite differently to that seen on the first
leaf as well as the previous tests. The actual failure for the second leaf was
established by a horizontal shear crack, initiated by the failure of the collar
joint. The collar joint actually detached itself from the first leaf wall whilst
remained connected to the second wall – see Figure 4.13. Based on the
deformation figures, it can be seen that the collar joint was totally connected
to the second leaf. However, the collar joint was connected to the first leaf
only among the bottom three-layer bricks (about 20-30% of the first leaf).
This finding shows that the collar joint won't provide a perfect connection
between the two leaves under exceeding load. Unfortunately, the result
shows that the collar joint in post-damaged wall does not improve the whole
integrity of the composite masonry wall in this case as it detaches when
external load is large enough. The composite masonry wall works
individually after they were separated. However, detachment of the masonry
leaves is a common failure pattern of double- and multi-leaf masonry walls
(Pappas 2002).
On the front side it can be seen that the diagonal cracks passed through the
mortar joints and crossed some bricks. In terms of detailed failure process,
the first leaf already has small cracks along the joints. These cracks didn’t
expand remarkably until the lateral load reached around 30kN. When the
load reach about 53kN, the big diagonal crack formed and some other small
cracks appeared above the main diagonal crack. The cracks kept increasing
and expanding until the wall reached its failure load, 74kN.
However, in the back side, only a small sliding and stepped crack appeared
at the bottom of the wall, which is shown in Figure 4.10. This crack occurred
around 40kN. However, after the first leaf detached from collar joint, the
crack stopped growing until the wall totally failed. The localization of this
sliding and stepped crack must intuitively follow a weakest link path through
the mortar joints.
79

Chapter 4 Experimental results
Figure 4.9 Failure pattern of double-leaf wall W7 on the front side
Figure 4.10 Failure pattern of double-leaf wall W7 on the back side
80

Chapter 4 Experimental results
4.1.3 The failure pattern of collar joint
The failure patterns of the collar joints on the pre-damaged and post-
damaged masonry wall panels are presented in Figures 4.11, 4.12 and 4.13.
4.1.3.1 Pre-damaged test
It can be seen in both Figures 4.11 and 4.12 that, the collar joint between
two leaves hardly separated, only a small part cracked in the loaded corner
in Figure 4.12. This is because the two leaves were constructed in the same
time, and the two leaves were cured in the same condition and within the
same curing age. This could help to improve the bond between the two
leaves as the cement particles in the mortar joints could penetrate into each
other during the curing process.
In the pre-damaged test, the panels failed with a diagonal crack on both
leaves. The same failure pattern on both leaves means that the collar joint
helped the two leaves work together as a whole panel.
Figure 4.11 Failure pattern of the collar joint on top side of W4
81

Chapter 4 Experimental results
Figure 4.12 Failure pattern of the collar joint on top side of W5
4.1.3.2 Post-damaged test
Based on Figure 4.13, it can be seen that the collar joint actually detached
itself from the first leaf wall (loaded one) whilst remained connected to the
second leaf wall. This failure pattern is totally different with the one in the
pre-damaged test. This is because the two leaves were built in different
times and cured with a different curing age.
The mortar in the first leaf had been cured for 6 weeks and the mortar had
almost reached its ultimate strength. Though the cement particles could get
into the bricks in both leaves, it is very hard for the cement particles in the
collar joint to penetrate into the already cured mortar joints in the first leaf.
However, for the second leaf, the cement particles can easily penetrate into
the mortar joints during the curing process, thereby resulting a stronger bond
between the collar joint and second leaf compared with the bond between
the collar joint and first leaf. Therefore, as it can be seen in the figure, the
collar joint separated from the first leaf while remained connected with the
second leaf.
82

Chapter 4 Experimental results
Figure 4.13 Failure pattern of the collar joint on top side of W7
4.1.4 Discussion
In the single leaf wall tests, the failure patterns found are in an agreement
with the findings in the literature review. For the current test series, the
occurrence of the diagonal crack signified the end of each test. However, in
practice it is common that a masonry panel loaded in-plane within a frame
will become locked in and continue performing a structural role, even after
the diagonal crack is formed. The most notable aspect of such a role is the
potential for additional energy dissipation (Mehrabi et al. 1996) allowed
within the restrained sliding of the damaged interfaces. These tests do not
consider any load cycling or dynamic effect that is critical for assessing
holistically the masonry performance. However they still constitute an
insightful first attempt to explain and comprehend the up to failure
performance of the masonry wall.
The failure patterns of the collar jointed masonry walls studied in this
research differs with the literature review. The reason is due to the loading
83

Chapter 4 Experimental results
patterns and boundary conditions as they can lead to totally different failure
patterns. In the work of Vintzileou (2007), the multi-leaf masonry wall was
loaded vertically, which leaded to the detachment of the internal and
external leaves, global or local crushing of external and internal leaves and
the external leaves out-of-plane failure. In this research, the experimental
tests on collar jointed walls were carried out under combined in-plane
loading. The failure pattern in the pre-damaged masonry wall is represented
by diagonal shear crack while for the post-damaged masonry wall, the
failure pattern is represented by diagonal crack as well as separation in the
collar joint. The failure patterns of the two types of masonry walls (pre-
damaged and post-damaged) were different even under the same loading,
which indicated that collar joint is an important influence factor in the failure
pattern of collar jointed masonry wall. Therefore, the collar joint type should
be considered in investigating the performance of collar jointed masonry wall.
It should also be noted that the type of brick used in this research is a
special brick (ribbed), which has some influence on the connection between
collar joint and brick leaf. As the ribs can prevent the collar joint from moving
along its in-plane direction, thus improving the bond of the collar joint to
some degree. However, for other types of brick (for instance, smooth texture
brick), the connection between the collar joint and the brick leave will not be
as strong as the ribbed brick has. The interaction between the ribbed brick
and mortar joint as well as the smooth brick and mortar joint is demonstrated
in detail in Figure 4.14. From the figure, it can be known that only friction and
shear force existed between the smooth brick and mortar joint. However,
there is compressive force existed between ribbed bricks and mortar joint
besides the friction and shear force. It is widely known that the compressive
strength of mortar joint is much stronger than its shear and tensile strength.
Thus the collar joint between the ribbed bricks is able to provide a better
connection. Therefore, the failure patterns of both brick leaf and collar joint
will be different if different types of masonry unit and collar joint are used.
Furthermore, by combining the experimental results and the literature review
(mainly from the work of Binda et al. 2006, see Figure 2.19), the failure
84

Chapter 4 Experimental results
pattern of double-leaf (collar jointed) masonry wall can be summarized in
Table 4.1.
Figure 4.14 Interaction between bricks and mortar joint: (a) Smooth brick; (b) Ribbed brick
Figure 4.15 Failure pattern of collar jointed (double-leaf) masonry wall
This research Previous research
Pre-damaged
Post-
damaged
Straight collar joint
Keyed collar joint
Failure pattern
Mainly diagonal cracks and some shear cracks on both leaves
Mainly diagonal cracks and shear cracks on first leaf, only shear cracks and sliding on second leaf, separation of the collar joint
Spalling of the outer leaves and separation of collar joint (nearly undamaged)
Spalling of the outer leaves as well as the keyed collar joint
Loading pattern
(a) Smooth brick (b) Ribbed brick
85

Chapter 4 Experimental results
4. 2 Failure load and deflection
All the tests results have been recorded during the tests and analysed at a
later stage. In this section, the lateral load and displacement of both single-
leaf and double-leaf wall panels will be discussed and compared. The
ultimate failure loads along with critical deflection parameters for all tests are
summarised in Table 4.1:
Figure 4.16 Failure load and deflection of all tests
4.2.1 Comparison of single-leaf walls The horizontal load-deflection relationship for the ensemble of the single-leaf
walls is shown in Figure 4.15. It can be clearly seen that the curves are
almost linear before the maximum load. This agrees with the works of
Kanyeto (2006) and Campbell Barraza (2012) that masonry structures under
small load behave linearly. The stiffness of Wall 1 is very similar to, although
slightly below that of Wall 2. More importantly some extensive capability for
plastic deformation is observed in Wall 1, while this was not the case for
Wall 2. As a matter of fact Wall 1 could deform even more as its full plastic
range was not pursued as the limitation of the apparatus clearance was
Wall No.
Wall type Lateral
load (kN) Displacement at yield point
(mm)
Maximum displacement
(mm)
Mortar compressive
strength (MPa)
W1 Single-leaf 58 9.7 13.1 12.7
W2 Single-leaf 64 10.1 11.2 15.3
W3 Single-leaf 70 8.2 20.0 6.7
W4 Double-leaf 91 10.1 11.4 6.3
W5 Double-leaf 93 10.3 12.6 6.6
W6 Single-leaf 75 9.03 9.03 8.1
W7 Double-leaf 77 8.8 17.6 7.1
86

Chapter 4 Experimental results
reached (this was increased thereafter). Such experimental deviations are
expected in similar masonry constructions, as the results may vary a lot
even exactly the same materials are used, though the deviation is always
attributed to a substantial material difference. When referring to the different
mortar type of Wall 3 all the strength and deformation variables were
increased consistently and significantly. The post-peak stage of Wall 3
implies that the masonry wall is plastic and not as brittle as concluded in the
literature review. However, this remained in doubt as the tests were not
sufficient to rule out all contingencies. One of the reasons which might cause
this is the sudden failure of masonry wall. This sudden failure might cause
the wall to deflect remarkably.
Figure 4.17 Load-Deflection relationship of single-leaf walls
The testing of Wall 6 was stopped when it had nominally been assumed to
have yielded. This state was taken at the point when initial ‘fine’ cracking
appeared and the horizontal load-deflection relation started deviating
increasingly from the elastic region. At that point Wall 6 was unloaded and
its damaged stage was considered the benchmark for the later post-damage
retrofitting study.
87

Chapter 4 Experimental results
It can be seen in the above figure that there was no post-peak behaviour
captured for Wall 6.The stiffness of Wall 6 was evidently greater than that of
Wall 1 and 2. Although this can be attributed to the increased curing time
when compared to Wall 1 and 2, Wall 6 was cured for 42 days instead of 14
days. This increased stiffness which was also apparent in the case of Wall 3
seems mainly a product of the different mortar type. Interestingly, the Wall 6
stiffness is lower than that of Wall 3 and further imposing the small effect of
additional curing time beyond a certain limit. For the combined influence of
mortar type and curing age, it requires further experimental investigation.
4.2.2 Comparison of double-leaf walls Figure 4.16 illustrates the horizontal load-deflection behaviour for all the
collar-jointed masonry walls. As probably expected for these walls, Wall 4
and 5 (pre-damaged method) exhibited a much higher failure load (91 and
93kN, respectively) than any of the single leaf walls, which failed at loads
ranging between 58kN to 70kN.
In this figure, Wall 4 and 5 have similar failure loads yet their ultimate
deflection capability looks different at first look. This is an artificial output
with the measurement of Wall 5 encompassing a slip without which the
displacement behaviour becomes quite alike with any difference falling
within the acceptable experimental deviation bands. Interestingly, Wall 7 (the
post-damaged wall), although only achieving a failure load more in-line with
the single-leaf walls (around 75kN) going approximately halfway through the
capability of pre-damaged method, exhibits sustained ductility with much
more gradual strain-softening. The improved stiffness of Wall 7 in
comparison to Wall 4 and 5 is probably an unexpected surprise. It has been
cured for longer and the reduced damage seems to not have compromised
the stiffness but noting the small effect of the curing time previously
evidenced this output looks slightly strange. Compared with Wall 4 and 5,
88

Chapter 4 Experimental results
Wall 7 have a bigger ductility as the lateral load dropped gradually for quite a
long time after the peak stage.
Figure 4.18 Load-Deflection relationship the of double-leaf walls
4.2.3 Comparison of pre-damaged approach
Figure 4.17 illustrates the improvement of pre-damaged earthquake
strengthening in terms of the load-deflection relationship. The construction
process has been described in Chapter 3 (experimental work). As it was
explained in the above paragraph there was a slip on the displacement
measurement of Wall 5, therefore, only the lateral force and deformation of
Wall 4 is considered here. Compared with Wall 1 and 2, Wall 4 (double-leaf
wall) increased the failure load approximately about 60% and stiffness
around 50%, which is a remarkable result in terms of brittle material.
However, when it is compared with Wall 3, Wall 4 can only increase the
failure load about 40%. Furthermore, it didn’t increase the stiffness as it can
be seen that Wall 4 and Wall 3 had almost the same stiffness. This might be
related to the LVDT deflection measurement of Wall 3, as the stiffness of
Wall 3 is unexpectedly high. Therefore, further research should be carried
89
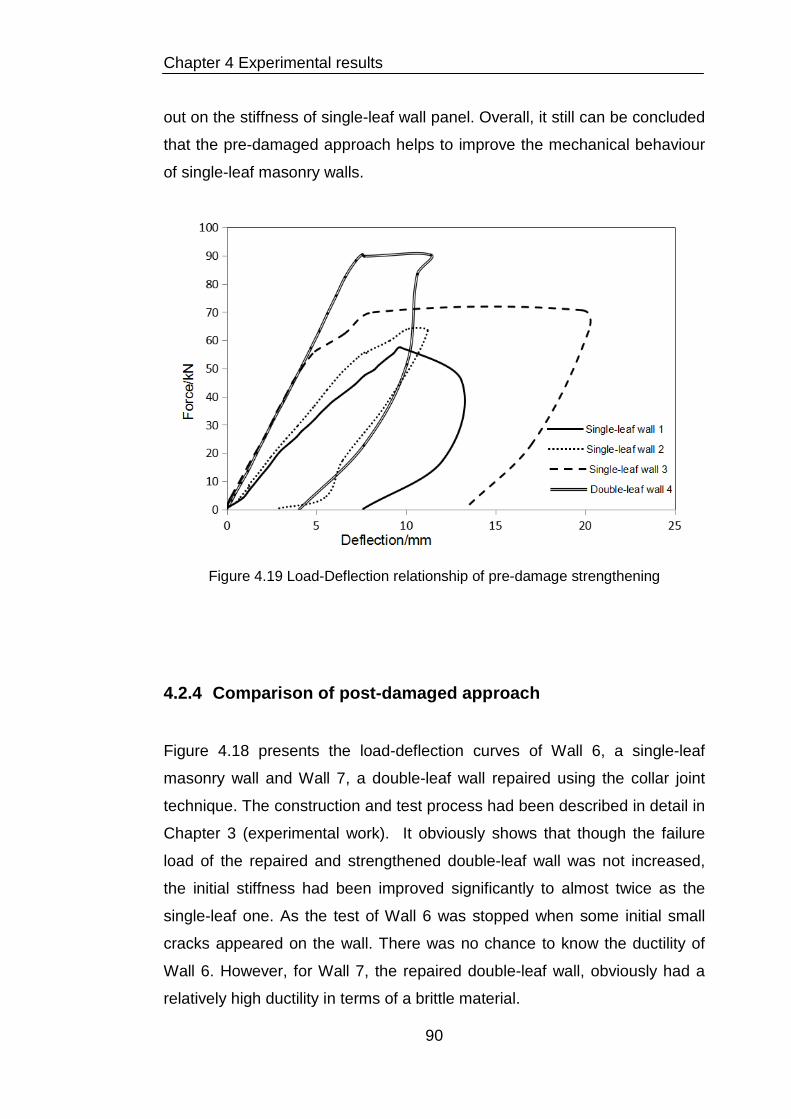
Chapter 4 Experimental results
out on the stiffness of single-leaf wall panel. Overall, it still can be concluded
that the pre-damaged approach helps to improve the mechanical behaviour
of single-leaf masonry walls.
Figure 4.19 Load-Deflection relationship of pre-damage strengthening
4.2.4 Comparison of post-damaged approach
Figure 4.18 presents the load-deflection curves of Wall 6, a single-leaf
masonry wall and Wall 7, a double-leaf wall repaired using the collar joint
technique. The construction and test process had been described in detail in
Chapter 3 (experimental work). It obviously shows that though the failure
load of the repaired and strengthened double-leaf wall was not increased,
the initial stiffness had been improved significantly to almost twice as the
single-leaf one. As the test of Wall 6 was stopped when some initial small
cracks appeared on the wall. There was no chance to know the ductility of
Wall 6. However, for Wall 7, the repaired double-leaf wall, obviously had a
relatively high ductility in terms of a brittle material.
90

Chapter 4 Experimental results
Figure 4.20 Load-Deflection relationship of post-damage strengthening
4. 3 Analysis of DEMEC gauge readings
As it had been described in the experiment’s section in Chapter 3 that there
are 16 DEMEC gauge points mounted on the wall and the DEMEC strain
gauge is ideal for strain measurement and crack monitoring. The masonry
element will shorten under compression load or elongate subjected to
tension. Therefore, this change can be recorded by DEMEC gauge points.
After knowing the strain change of the masonry wall, the stress distribution
of the masonry wall is known as the masonry is simplified to an isotropic
material in this research. Therefore, the DEMEC gauge readings could
provide a helpful overview and understanding on the load transfer among
single- and double-leaf masonry walls.
During the test, it was paused to measure DEMEC gauge readings at every
5kN increment. The DEMEC gauge points can only measure the strain
change vertically or horizontally. In order to have a clear visual impression
91

Chapter 4 Experimental results
about the analysed results, only some representative points are selected to
be presented here, including horizontal points and vertical points. The
locations of the DEMEC gauge points are illustrated again in Figure 4.19.
Figure 4.21The location of DEMEC gauge points on masonry wall
4.3.1 Single-leaf masonry walls
In this section, only the DEMEC gauge reading results on Wall 3 and 6 have
been analysed. The reason that Wall 1 and 2 were not analysed here is
because the DEMEC gauge points were not mounted at the same locations
with the rest specimens (Figures 4.1, 4.2, 4.3 and 4.4). Furthermore for Wall
2, it had been tested twice. The first loading might have already produced
some cracks. Therefore, Wall 3 and Wall 6 would give a better overview on
the strain change on masonry walls during the test.
92

Chapter 4 Experimental results
4.3.1.1 Wall 3
Figure 4.20Load-strain curve of horizontal DEMEC gauge points of Wall 3
Figure 4.22Load-strain curve of vertical DEMEC gauge points of Wall 3
93

Chapter 4 Experimental results
The load-strain relationship curves of horizontal DEMEC gauge points of
Wall 3 are demonstrated in Figure 4.20. The strain value in negative
represents compression while positive means tension. Point 1-2 represented
the strain around the loaded corner, which was in compression until it
reached around 55kN. Before this stage, the strain increased almost linearly
until the final failure happened. This finding agreed with Mosalam et al.
(2009) that masonry behaves in an approximately linearly elastically under
low levels of stress. It could be calculated that the failure stress of point 1-2
was around 4MPa. There was a sudden strain jump at this stage, which
meant a big crack occurred suddenly around the loaded corner. It was
proved in Figure 4.3 that the brick was crushed near point 1.
Point 2-3 was at the same height with Point 1-2 but a little further from the
loading point. It was shown that Point 2-3 was in compression but smaller
compared with Point 1-2, which means the lateral in-plane load reduced
gradually along the horizontal direction. For point 6-7 and10-11, they were
all in compression before the big diagonal crack occurred. The compression
strain was not large compared with point 1-2 due to the lateral load
spreading to the whole panel. However, point 7-8, 11-12 and 13-14 were in
minor tension before the failure occurred. It could be clearly seen that when
the lateral load reached about 55kN, the big diagonal crack, as described in
section 4.1.1, occurred. This big diagonal crack caused the strain of most
points increased abruptly. It reveals that the failure of masonry element is
brittle.
For the vertical points on Wall 3, as illustrated in Figure 4.21, most of the
points were in compression during the test, except for point 11-15, which
was in tension from the beginning. Similar with the horizontal points, when
the lateral load reached about 55kN, there was a small jump of the strain
because of the occurrence of diagonal crack. Point 5-9 and 8-12 did not
have any crack as they were always in small compression, and Figure 4.3
did not show any obvious crack among them.
94

Chapter 4 Experimental results
4.3.1.2 Wall 6
Figure 4.22 illustrates the load-strain curves of the horizontal DEMEC gauge
points of Wall 6. For Wall 6, the strain results behaved very similar with Wall
3. It could be seen that the strains of some points were changed when the
load reached around 40 to 45kN, as explained in section 4.1.1, some small
cracks occurred along the mortar joints in the centre area of Wall 4.
Compared with Wall 3, this increase was not abrupt. Instead it increased
gradually (determined by the acceleration). Therefore, this meant the small
cracks occurred, and the cracks kept expanding slowly under lateral loading.
Some of these cracks were too small to be observed as the wall was failed.
Furthermore, it could be seen that point 1-2 was not crushed even when the
strain reached -400 micro strain (nearly 6.5MPa in stress). As it was
explained that Wall 3 was crushed at a stress of 4MPa, while Wall 6 was still
working without any cracking. Besides the variation of masonry wall test, the
other reason was that Wall 6 was cured much longer than Wall 3, therefore
having a higher failure strength.
While for the vertical points, as demonstrated in Figure 4.23, point 1-5 was
still in compression as there was no failure happening around that area.
Point 11-15 behaved exactly the same compared with Wall 3, that in tension
first and then strain increased because of crack occurred when the lateral
load reached around 45kN. As for the other points, most of them were in
minor compression or minor tension, until the small cracks occurred along
the joints. Still, the increase of strain at the stage when the small cracks
occurred was mild and gradual.
The DEMEC gauge readings briefly revealed the failure process of single-
leaf masonry wall under combined loading. Fine cracks first occurred along
the mortar joints. With the accumulation of the stress in the loaded corner,
brick and mortar crushing cracks may appear suddenly, which caused the
fine cracks expanding abruptly, thereby causing the masonry wall fail in a
brittle manner.
95

Chapter 4 Experimental results
Figure 4.23 Load-strain curve of horizontal DEMEC gauge points of Wall 6
Figure 4.24 Load-strain curve of vertical DEMEC gauge points of Wall 6
96

Chapter 4 Experimental results
4.3.2 Double-leaf walls
Similar with single-leaf walls, the strains of all points behaved very much
alike in the double-leaf masonry walls. For the pre-damaged wall, Wall 5
was selected and Wall 7 for post-damaged wall. Only the first leaf in the
double-leaf walls has DEMEC points. The DEMEC gauge readings were
recorded during the test and analysed after the test. The following sections
present a detailed description and discussion on the results.
4.3.2.1 Wall 5 (Pre-damaged)
Figure 4.25 Horizontal and vertical load-strain curve of DEMEC gauge points of Double-leaf Wall 5
Figure 4.24 shows the load-strain relationships of some representative
points on Wall 5. Point 1-2 and point 1-5 were always under compression
with the increase of lateral load, as was the same with the single-leaf walls.
97
Chapter 4 Experimental results
However it can be calculated that when the strain of point 1-2 was -600
micro strains, the stress was nearly 9.6MPa, much higher than both single-
leaf Wall 3 and 6. As shown in Figure 4.7 there is no crack between points
1-2, which means that double-leaf wall does increase the failure strength of
masonry wall, at least around the loaded corner.
However, for point 1-5, there was a crack which passed through the brick,
but the load-strain curve indicated no cracks occurred. This was because
the measurement stopped around 80kN for safety reasons, and the crushing
of bricks happened around failure load (90kN). Therefore no cracks were
recorded by the DEMEC gauge at this stage. Most importantly, it can be
seen that most of the points were under minor compression during the test.
This is a good sign for the masonry wall as it could resist much higher
compressive load than tensile load. Therefore, the collar joint could help to
postpone the occurrence of cracks. However, there was still a small jump on
the strain when the lateral load reached about 75kN. This meant a few big
cracks occurred. The masonry wall tended to fail quickly after big diagonal
crack appeared. For the sake of safety, no more DEMEC gauge readings
were recorded after the occurrence of the big cracks.
4.3.2.2 Wall 7 (Post-damaged)
Figure 4.25 represents the load-strain relationship of DEMEC gauge points
on masonry Wall 7, which is a post-damaged retrofitted wall. The first leaf
had been tested and some minor cracks had already occurred along some
mortar joints, highlighted in Figure 4.4. The strain of point 1-2 increased
gradually under lateral load, which was still under compression. While for
point 1-5, the strain increased remarkably in the first 5kN and then increased
slowly after that. This was because there were some minor cracks happened
already. The second loading, which can be taken as a cyclic loading,
compressed the cracks at the very beginning of the test. The strain
98

Chapter 4 Experimental results
increased significantly after the occurrence of big crack when the lateral load
reached around 35kN. This is because the crack that appeared between
Point 11-15 was compressed under small lateral load. However, the crack
will expand after the re-distribution of external load. For point 2-6, 7-11, and
10-11, they were in tension from the beginning and the tension strain
increased slowly, which was because some minor cracks already occurred
between these points. Then the second load caused these cracks expand
again. However, bigger cracks occurred only when the lateral load reached
around 40 to 50kN. However, the strain increase of Wall 7 was not as
remarkable as Wall 5. This proves that post-damaged approach can improve
masonry wall’s ductility as it didn’t fail abruptly like brittle material, thereby
causing the post-damaged masonry wall to fail in a less brittle manner.
Figure 4.26 Horizontal and vertical load-strain curve of DEMEC gauge points of Double leaf Wall 7
99

Chapter 4 Experimental results
4.3.3 Strain (stress) distribution of masonry wall
The strain change can be obtained via the DEMCE gauge readings. Though
the property of masonry wall is anisotropic, it is taken approximately
isotropic. Therefore, as long as the strain was known, the stress can be
found. In this section, the DEMEC gauge readings were recorded when the
lateral load reached about 40kN. In this case, the walls were failed and are
still in their elastic stage according to the results displayed in Figure 4.15
and 4.16. Furthermore, the stress is in this stage was large enough to be
recorded and analysed. In this section, only single-leaf wall 3 and double-
leaf wall 5 have been selected to be researched.
4.3.3.1 Single-leaf wall 3
Figure 4.27 Strain (Stress) distribution of wall 3 in the vertical direction
-85.8 0 19.5 -11.7
-39 -31.2 -23.4 -70.2
39 -89.7 132.6 -113
100
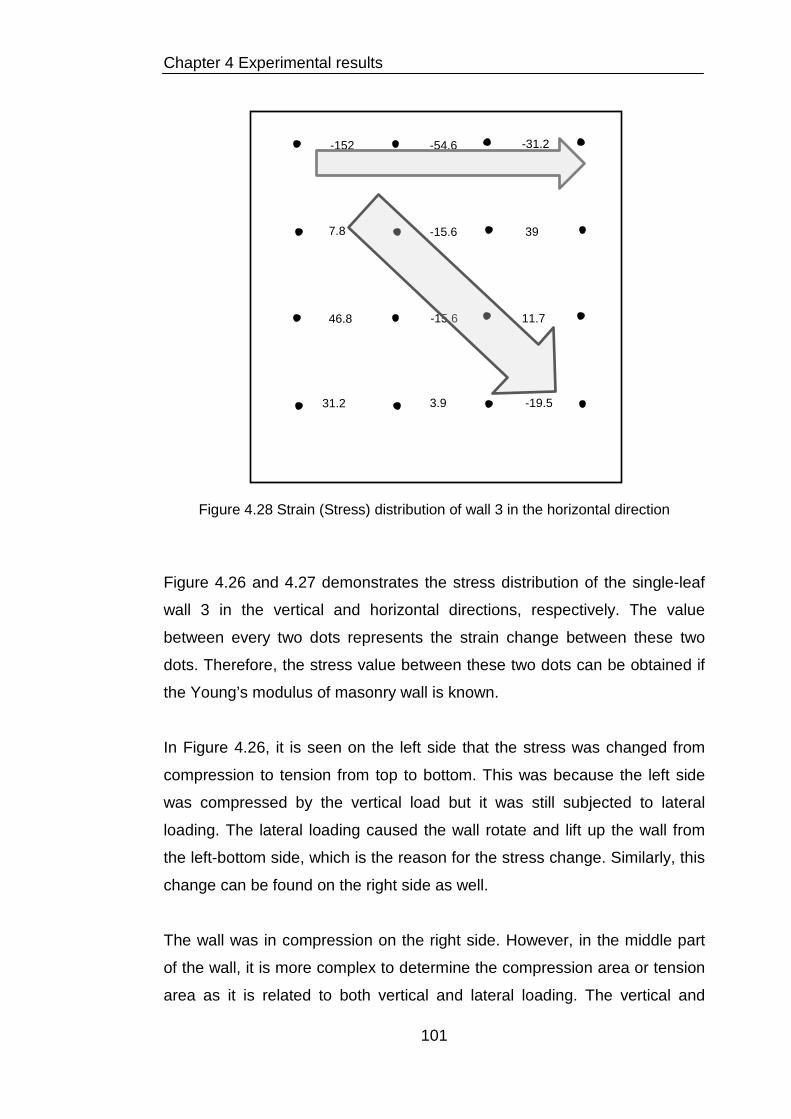
Chapter 4 Experimental results
Figure 4.28 Strain (Stress) distribution of wall 3 in the horizontal direction
Figure 4.26 and 4.27 demonstrates the stress distribution of the single-leaf
wall 3 in the vertical and horizontal directions, respectively. The value
between every two dots represents the strain change between these two
dots. Therefore, the stress value between these two dots can be obtained if
the Young’s modulus of masonry wall is known.
In Figure 4.26, it is seen on the left side that the stress was changed from
compression to tension from top to bottom. This was because the left side
was compressed by the vertical load but it was still subjected to lateral
loading. The lateral loading caused the wall rotate and lift up the wall from
the left-bottom side, which is the reason for the stress change. Similarly, this
change can be found on the right side as well.
The wall was in compression on the right side. However, in the middle part
of the wall, it is more complex to determine the compression area or tension
area as it is related to both vertical and lateral loading. The vertical and
-152 -54.6 -31.2
7.8 -15.6 39
46.8 -15.6 11.7
31.2 3.9 -19.5
101
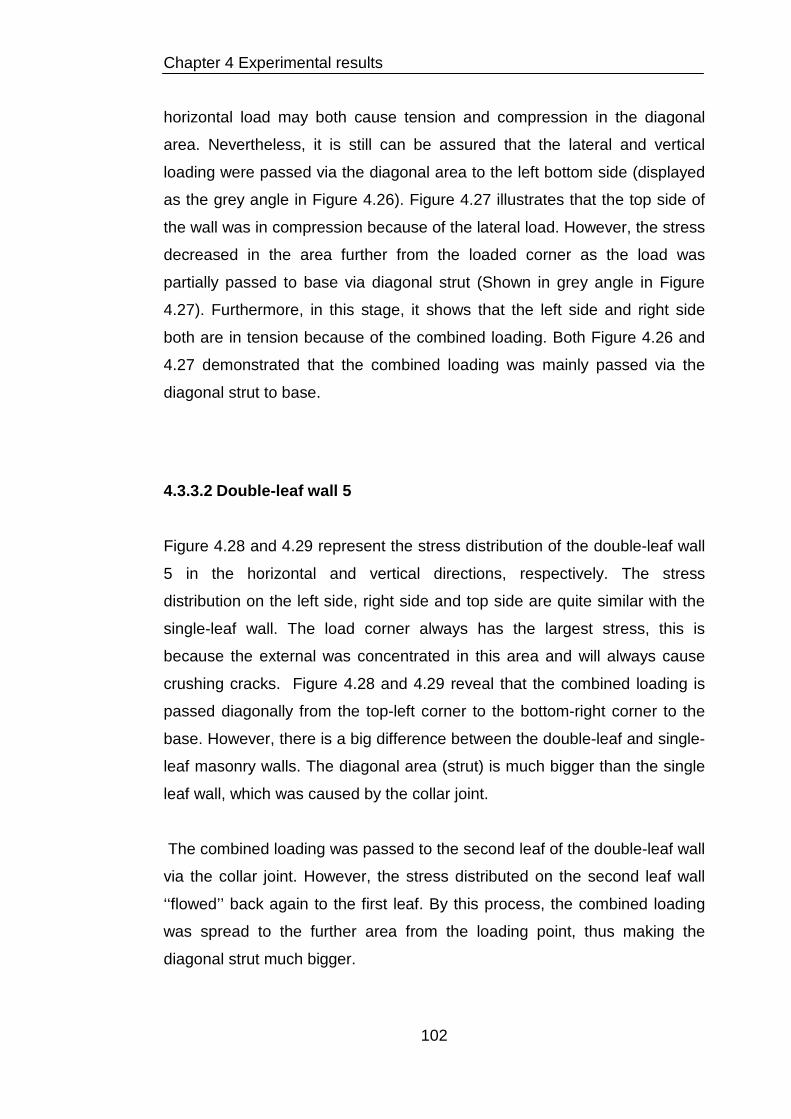
Chapter 4 Experimental results
horizontal load may both cause tension and compression in the diagonal
area. Nevertheless, it is still can be assured that the lateral and vertical
loading were passed via the diagonal area to the left bottom side (displayed
as the grey angle in Figure 4.26). Figure 4.27 illustrates that the top side of
the wall was in compression because of the lateral load. However, the stress
decreased in the area further from the loaded corner as the load was
partially passed to base via diagonal strut (Shown in grey angle in Figure
4.27). Furthermore, in this stage, it shows that the left side and right side
both are in tension because of the combined loading. Both Figure 4.26 and
4.27 demonstrated that the combined loading was mainly passed via the
diagonal strut to base.
4.3.3.2 Double-leaf wall 5
Figure 4.28 and 4.29 represent the stress distribution of the double-leaf wall
5 in the horizontal and vertical directions, respectively. The stress
distribution on the left side, right side and top side are quite similar with the
single-leaf wall. The load corner always has the largest stress, this is
because the external was concentrated in this area and will always cause
crushing cracks. Figure 4.28 and 4.29 reveal that the combined loading is
passed diagonally from the top-left corner to the bottom-right corner to the
base. However, there is a big difference between the double-leaf and single-
leaf masonry walls. The diagonal area (strut) is much bigger than the single
leaf wall, which was caused by the collar joint.
The combined loading was passed to the second leaf of the double-leaf wall
via the collar joint. However, the stress distributed on the second leaf wall
‘‘flowed’’ back again to the first leaf. By this process, the combined loading
was spread to the further area from the loading point, thus making the
diagonal strut much bigger.
102

Chapter 4 Experimental results
Based upon the DEMEC gauge strain readings on single- and double-leaf
walls, the stress distribution can be obtained. Mainly, the external loading is
passed to the base via the diagonal strut, also, the collar joint of the double-
leaf wall has a big influence on the stress distribution. The collar joint greatly
increases the diagonal strut area, which helps the tension stress change to
compression.
Figure 4.29 Strain (Stress) distribution of wall 5 in the horizontal direction on the loaded leaf
-320 -58.5 3.9
-39 -42.9 -23.4
-23.4 -11.7 -1.9
3.9 -23.4 -23.4
103

Chapter 4 Experimental results
Figure 4.30 Strain (Stress) distribution of wall 5 in the vertical direction on the loaded leaf
4. 4 Discussion of the strengthening/retrofitting approaches The results suggest that the post-damaged retrofitting method works less
effectively in terms of strength improvement than the pre-damaged method.
This is possibly an unfair comparison and this outcome is not really that
surprising owing to the different methods of construction adopted for the two
types of double-leaf walls. For example, the two walls in the pre-damaged
enhancement configuration were constructed at the same time, therefore,
the interlocking of the collar-joint within the two leaves is maximised.
However, for the post-damaged retrofitting, the second wall was bonded to
the first one after it had been tested and without any pre-treatment, i.e. the
mortar joints of the existing (first leaf) wall were not shaped to help the collar
joint to key into the walls. This meant that the bond between the two walls
was much weaker; there was effectively an interface weak region between
-234 -15.6 -31.2 -42.9
-74.1 -89.7 -81.9 -120
11.5 -74.1 -62.4 -78
104

Chapter 4 Experimental results
the collar-joint and the first wall. Future work should investigate certain
realistically and acceptably practical methods of ‘pre-treating’ the first wall to
ensure a stronger bond and a more efficient collar-joint along with indicators
of the sustained damage, yet this was not at all considered here. For
example, steel ties could be used to improve the bond between the two
leaves in post-damaged walls (shown in Figure 4.30). As illustrated in Figure
4.13 the two leaves were separated and the collar joint stopped working as a
binding material. The application of steel ties could prevent the separation or
at least postpone the separation and the improvement of post-damaged
method could be larger.
Figure 4.31 Collar jointed wall with steel ties
In addition, the collar joint in this research is assumed to be fully infilled
between the two leaves. This is the reason that the construction work was
carried out layer by layer and collar joint was also filled layer by layer. With
this process, the collar between the two leaves can be fully infilled with
mortar joint. However, in some cases the filling of the collar joint is carried
out after the two leaves have already been constructed. When this occurs,
the collar joint is hard to be fully infilled. Therefore, the possibility of partially
infilled collar joints should also be taken into consideration.
Moreover, as it is mentioned in Section 4.1.4, the brick in this research has
some slots on the back side. When the mortar is filled into the slots, the
formed collar jointed between the masonry leaves can be taken as keyed
joint, this is similar with the collar jointed conducted in the work of Pian-
105

Chapter 4 Experimental results
Heriques et al. (2004) (4.31(b)). In the work of Pina-Heriques et al., two
cases were considered, straight collar joint (4.31(a)) and keyed collar joint. It
was found that shear failure occurred in the panels constructed with a
straight collar joint. However, for the wall panels constructed with keyed
collar joints, failure was mainly due to diagonal cracks in the inner leaf.
Furthermore, the shear strength value for straight collar joints are between
0.09 and 0.17, whereas for the keyed joints, the values are in the 0.58-0.81
range, which means, the strength for keyed joints is 3.5 to 9 times stronger
than straight collar joints. In this research, only one case, i.e., keyed collar
joint is considered and the results showed that the bond of collar joint was
quite strong as well. However, not all the bricks are ribbed like the bricks
used in this research. If the back side of the brick unit is relatively smooth
and solid, then the type of straight collar joint should be taken into account.
The bond of the straight collar joint may have a totally different influence on
the failure pattern as well as the failure load. The results found in this
research are based on the ribbed bricks, which is not applicable in other
types of bricks. Therefore, in the future work, a straight collar joint should be
included in the research, which means different types of bricks (especially
smooth one) should be used.
In addition, the DEMCE gauges mounted on the first leave help to
understand the load transfer among the masonry wall. There are no DEMEC
gauges mounted on the second leaf, which means the load transfer among
the second leaf is not clearly known, although it can be known from the
numerical results. Therefore, in the future work, the DEMEC gauges should
also be mounted on the second leaf in order to have a sound understanding
on the load transfer.
106

Chapter 4 Experimental results
Figure 4.32 Masonry prisms’ dimensions in mm: (a) straight collar joint and (b) keyed collar joint (Pina-Heriques et al. 2004)
4. 5 Summary
In this Chapter, the results of a preliminary analysis of the experimental tests
that have been carried out in Chapter 3, have been presented and
discussed in detail. The tests were carried out both on single- and double-
leaf masonry wall panels. Double-leaf masonry walls consist two types: pre-
damaged and post-damaged masonry walls. The results are analysed in
terms of failure patterns, load-deflection relationship (failure load and
maximum deflection), and strain/stress distribution by using DEMEC gauge
points.
The results showed that pre-damaged approach works better than post-
damaged approach in terms of increasing failure load. The pre-damaged
double-leaf wall can improve the failure load of single-leaf wall up to 40% to
60%, while the post-damaged double-leaf wall can only restore the initial
failure load. However, in terms of stiffness improvement, post-damaged type
works better compared with the pre-damaged one. The stiffness of the post-
damaged wall was increased remarkably, almost twice that of single-leaf
wall. While for the pre-damaged type, the stiffness can be increased but not
107

Chapter 4 Experimental results
as significantly as post-damaged wall. Also, the improvement of the ductility
of the post-damaged wall was greater. Therefore, the pre-damaged
strengthening approach should be carried out in building the masonry
structures in order to improve the load resistance capability. For the existed
masonry structure with collar jointed masonry walls, this result assures the
safety of the building. However, for the masonry structuresthat have been
constructed, the post-damaged retrofitting approach can be applied. Surface
treatment prior to the retrofitting process may be needed in order to improve
the final effectiveness.
According to the failure patterns, the failure of single-leaf wall was
represented by a big and remarkable diagonal crack. The cracks occurred
mainly along mortar joint with only few passing through the bricks, which
agrees with the literature review. For the collar jointed walls, the failure was
represented by a big diagonal crack as well as some other small cracks.
Moreover, it can be seen that the cracks on the collar jointed walls were
much more than the single-leaf wall, which means the collar joint has spread
the stress more evenly through the whole panel. The results showed that the
collar joint could help to improve the integrity of the masonry wall panels.
In addition, two types of mortar, type S and Type N, had been used in the
single-leaf wall tests. The results of the single-leaf wall showed that the
mortar type doesn’t affect the failure load or failure pattern. However, this
conclusion needs more research. Besides, the longer the curing age is, the
stronger strength and stiffness the masonry wall can acquire. However, by
using the high strength cement, masonry wall and mortar can reach most of
its designed strength after cured for 14 days.
Furthermore, the failure process of the masonry wall can be easily explained
by using DEMEC gauge points. Strain in negative represents compression
while positive means tension. The readings represent the strain change
during the test and the stress can be obtained if the modulus of elasticity of
masonry wall is known. The DEMEC gauge results in section 4.3 shows that
108

Chapter 4 Experimental results
it can explain the failure process of masonry wall and stress distribution
among masonry wall panels very well. Therefore, more DEMEC gauge can
be used on both of the walls in order to get a more detailed understanding
on the performance. However, the analysis of DEMEC gauge is time
consuming and only the stress/strain on the brick leave’s surface can be
known. The mechanical behaviour of the collar joint is not able to know.
Therefore, in order to provide a detailed understanding on the stress/strain
distribution through the collar joint, a numerical analysis is necessary.
Furthermore, the simulation result is able to rule out the contingency
occurred in the experiments. The numerical work is carried out in Chapters 5
to 7.
109

Chapter 5 Micro-scale simulation model
Chapter 5 Micro-scale simulation model
5. 1 Introduction
In the past decades, relevant research on numerical methods to predict the
in-service behaviour and load carrying capacity of masonry walls has been
advanced considerably. However the modelling of a load bearing masonry
wall or masonry infill under in-plane combined loading remains difficult
primarily due to the complex mechanics developed within the different
materials of the wall. So far, a number of different approaches have been
implemented to simulate the mechanical behaviour of masonry walls
subjected to static or dynamic loading that can act in-plane, out-of-plane or
even simultaneously in both planes. Different approaches are available, with
linear elastic or non-linear inelastic material behaviour, at a micro or macro
level, with different ways of damage representation and with damage models
obeying different constitutive laws (Papps 2007). A review of the current
strategies for modelling masonry has been presented in Chapter 2 (literature
review). This chapter aims to develop a numerical model for masonry walls
that is able to validate the current experimental outcomes presented in
Chapter 4.
5. 2 Selection of numerical models
There is a broad range of numerical models to choose from the literature
review. It is necessary to select the most appropriate one in order to predict
the most accurate results. Lourenco (2002) proposed a few factors that need
to be taken into account in choosing the most appropriate methods, which
110

Chapter 5 Micro-scale simulation model
are: the structure itself; the simplicity desired; the experimental data
available; the amount of financial resources; time requirements and the
experience of the modeller.
In order to choose the best appropriate numerical model to simulate the
masonry wall panels tested in the laboratory, a comparison of the numerical
models that have been presented in Chapter 2 will be carried out as
following.
5.2.1 Comparison of macro-scale and micro-scale models
In macro-scale modelling, the masonry units and mortar joints are smeared
into an averaged continuum. There are no distinctions between the units, the
mortar and their interfaces. This model can be applicable when the
dimensions of a structure are large enough so that a description involving
average stresses and strains becomes acceptable. Considerable
computational time can be saved by applying this method. However,
unconditionally accurate results and fine-detail of the behaviour cannot be
captured by the nature of this approach.
On the other hand, the micro-scale modelling has two approaches: (a)
detailed micro-scale modelling; (b) simplified micro-scale modelling. In the
detailed micro-scale modelling approach, both the masonry units and the
mortar are discretised and modelled with continuum elements while the
unit/mortar interface is represented by discontinuous elements accounting
for potential crack of slip planes. While in the simplified micro-scale
modelling approach expanded units are modelled as continuous elements
while the behaviour of the mortar joints and unit-mortar interface is lumped
into discontinuous elements. Detailed micro-scale modelling is probably the
most accurate approach available today to simulate the real behaviour of
masonry as the elastic and inelastic properties of both the units and the
111

Chapter 5 Micro-scale simulation model
mortar can be realistically taken into account. With this method, a suitable
constitutive law is introduced in order to reproduce not only the behaviour of
the masonry units and mortar, but also their interaction. However, any
analysis with this level of refinement requires large computational effort.
Thus this method is used mainly to simulate tests on small specimens in
order to determine accurately the stress distribution in the masonry materials.
The drawback of the large computational effort required by detailed micro-
scale modelling is partially overcome by the simplified micro-scale modelling
strategy.
The dimensions of the experimental masonry wall carried out in the
laboratory are 900×975×102.5mm3. The dimensions are not large enough to
apply macro-scale modelling nor small enough to use detailed micro-scale
modelling. Furthermore, simplified micro-scale model can give a good
understanding of the local behaviour of masonry structures, meanwhile, it
also reduces computational time and computer memory requirements.
Therefore, simplified micro-scale modelling will be applied in this research.
5.2.2 Comparison of Finite Element Method (FEM) and Discrete Element Method (DEM)
Both FEM and DEM have been presented in detail in Chapter 2. Here in this
section, a comparison is carried out in order to select the more appropriate
one.
Finite element method is the most often used and well developed method in
calculation of masonry structures due to its long tradition. However, DEM
has only been used to model masonry in the last two decades (Zhuge et al.
2004). Stavridis and Shing (2008) concluded that nonlinear finite element
modelling is the most powerful analysis tool, which is able to simulate
complex structures with linear or non-linear material properties either at a
112

Chapter 5 Micro-scale simulation model
micro or macro scale. Researchers have carried out studies to compare the
effectiveness of FEM and DEM. Giordana et al. (2002) investigated the
applicability of both types of modelling. The comparison of numerical and
experimental results are shown in Figure 5.1. It can be seen that the load-
displacement curve obtained from the analysis by using FEM is in better
agreement with the experimental envelope, although a slightly stiffer
compared with the experimental one. In additional, there is a main drawback
for DEM, which is the poor constitutive law for the internal elements when
deformable blocks are taken into account. In the past, most numerical
models that are based on the discrete element method treated blocks as
rigid. This makes this method inappropriate for the analysis of the type of the
structures in which the state of strain and deformations inside a discrete
element cannot be ignored. However, this drawback can be overcome by
FEM modelling.
Figure 5.1 Comparison of experimental against numerical results (Giordano et al. 2002)
113

Chapter 5 Micro-scale simulation model
5. 3 Model in MIDAS FEA
The commercial finite element software MIDAS FEA was selected for the
modelling in this research. The reason to choose MIDAS FEA is because it
is a state-of-the-art software, which defines a new paradigm for advanced
nonlinear and detail analysis for civil and structural engineering applications.
In addition, MIDAS FEA combines a powerful pre/post processor and solver
that stands for reliability and accurate solutions. Furthermore, MIDAS FEA
possess the following characteristics:
• It provides an inherent material called ‘‘Combined tension-shearing-
cracking’’ for the brick-mortar interface, which combines all the failure
modes mentioned above;
• It allows users to assign different parameters that are obtained via
experimental tests or numerical calibration to different materials;
• It allows the user to assign different material properties at different
locations of the structure. This is important, especially when bed
mortar joint, head mortar joint or collar joint are totally different;
• It provides both 2D and 3D models;
• It is able to capture all the failure modes, including tensile failure, de-
bonding and shear slip at the brick-mortar interfaces;
• It is able to capture the onset and propagation of cracking on the
masonry wall, and also the measurement of crack width;
• It is able to simulate the post-cracking behaviour of masonry wall;
• It is able to provide a load-displacement relationship for analysis;
114

Chapter 5 Micro-scale simulation model
• And it is able to provide results with a satisfactory degree of accuracy.
5. 4 Micro-scale modelling
As the compared results showed in Section 5.2 in this chapter, simplified
micro-scale finite element modelling will be adopted, more details can be
found in the work of Lourenco (1996). Here in this section, the simplified
micro-scale finite element modelling will be described and presented in
detail.
As previously noted, the joints (including the collar joint in this research) in
masonry are typically the weakest parts. Therefore, it can be naturally
assumed that any cracks would develop along the joints. Such a simplified
micro-modelling approach whereby predefined cracks are included at the
joints is herein practiced. The mortar joints and the brick-mortar interfaces
are lumped into a zero-thickness interface while the dimensions of the brick
units are slightly expanded to keep the whole geometry of the given
masonry structure unchanged. Furthermore, a potential vertical crack is
placed in the middle part of every brick. This is due to the fact that in
masonry structures, as also evidenced in the current experimental failure
patterns, most of the propagating cracks beyond being located in the mortar
they can also develop in the middle of bricks (Dolatshahi and Aref 2011)
making these regions similarly quite prone to forming separations (Lourenco
and Rots 1997). Indicatively, this is shown in Figure 5.2.
115

Chapter 5 Micro-scale simulation model
Figure 5.2 Simplified micro-modelling strategy for masonry panel (Lourenco 1996)
5.4.1 Brick representation
As the mortar joints are represented by a zero thickness interface, the
dimensions of the bricks have to be expanded slightly to maintain the
geometry of the brickwork. Each individual brick can be taken as rigid or
deformable element. The rigid block does not change its geometry as a
result of any applied loading. Rigid elements can be applied when the
behaviour of the system is dominated by the mortar joints or alternatively
high strength and low deformability brick has been used. In the case of brick
modelled as deformable element, bricks can be assumed to be linear elastic
or non-linear according to the Mohr-Coulomb criterion. The bricks in this
research were assumed to be deformable behaving in a linear elastic
manner. For the 2D models, practiced in the case of single leaf walls, the
brick units were represented by eight-node plane stress continuum elements
while for the 3D models which are practiced in the case of double leaf walls,
the brick units were represented by eight-node hexahedron solid elements
(shown in Figure 5.3). The material parameters for the linear elastic model
are the unit weight of the brick, the Young’s modulus and the Poisson’s ratio.
The value of these parameters can be obtained via experimental tests on
small specimens.
Potential brick crack Brick-mortar interface
Unit
Joint
116

Chapter 5 Micro-scale simulation model
5.4.2 Mortar joint representation
As explained previously, the mortar joints are smeared into zero thickness
interfaces between adjacent bricks. This approach by making a significant
simplification and representing an entire mortar joint with a zero-thickness
cohesive interface model has been proved by Lotfi and Shing (1994). At the
interfaces, the bricks are connected to each other by sets of interface
elements. These interfaces are located at the outside perimeter of the bricks,
see Figure 5.3. It needs to be noted that the nodes on each element mesh
should match so that they can be connected together in the model. In the 2D
model, the brick-mortar joint interfaces were represented by six-node line
interface elements while for the 3D models relevant to collar jointed walls,
the surface interface elements were used to analyse the interface behaviour.
The interface behaviour was simulated using a Mohr-Coulomb failure
surface combined with a tension cut-off and a compression cap.
Figure 5.3 Deformable bricks with interface element
5.4.3 Constitutive law for the interface element
The zero thickness interface is based on multi-surface plasticity, comprising
a Coulomb friction model (mode II) for shear failure, a tension cut-off (mode I)
for tensile failure, and a cap mode for compressive failure, which is shown in
Figure 5.4. This model was described in detail by Lourenco (1996).
Joint
117

Chapter 5 Micro-scale simulation model
Figure 5.4 Interface model proposed by Lourenco (1996)
As it is known that there is an interface material model called ‘‘Combined
Cracking-Shearing-Crushing’’ in MIDAS FEA, which is capable of capturing
all the possible failure mechanisms of the masonry joints, such as sliding,
tensile cracking and crushing. The parameters needed to define the
interface model in MIDAS FEA are listed in Table 5.1. The model works by
combining different yield surfaces, including tension, shear, and
compression with softening in all three modes (Lourenco, 1996). Each of
these three yield surfaces is described in more detail as following.
Figure 5.5 Modelling parameters for the interface model and their definition
Parameter Symbol Normal stiffness 𝑘𝑘𝑛𝑛 (𝑁𝑁/𝑚𝑚𝑚𝑚3)
Shear Stiffness 𝑘𝑘𝑠𝑠 (𝑁𝑁/𝑚𝑚𝑚𝑚3)
Tensile strength 𝑓𝑓𝑡𝑡 (𝑁𝑁/𝑚𝑚𝑚𝑚2)
Mode I fracture energy 𝐺𝐺𝑓𝑓𝐼𝐼(𝑁𝑁/𝑚𝑚𝑚𝑚)
Cohesion C (𝑁𝑁/𝑚𝑚𝑚𝑚2)
Friction coefficient ϕ
Dilatancy coefficient Ψ
Mode II fracture energy 𝐺𝐺𝑓𝑓𝐼𝐼𝐼𝐼(𝑁𝑁/𝑚𝑚𝑚𝑚)
Compressive strength 𝑓𝑓𝑐𝑐 (𝑁𝑁/𝑚𝑚𝑚𝑚2)
Compressive fracture energy 𝐺𝐺𝑓𝑓𝑐𝑐(𝑁𝑁/𝑚𝑚𝑚𝑚)
118

Chapter 5 Micro-scale simulation model
Tensile behaviour
The tensile cracking of the interface model is represented with a tension cut-
off with exponential softening. The tension cut-off is illustrated as a vertical
line in the positive region of normal stress in Figure 5.4, which can simulate
the brittle failure of mortar joint under tensile force. The exponential
softening behaviour in tension is consistent with experimental results from
Pluijm (1992) (Lourenco, 1996), which is shown in Figure 2.4 in Chapter 2.
The yield function for tension mode reads
𝑓𝑓1(σ, κ1) = σ − σ1���(κ1) (5.1)
where the yield value σ1��� reads
σ1��� = 𝑓𝑓𝑡𝑡exp �− 𝑓𝑓𝑡𝑡𝐺𝐺𝑓𝑓𝐼𝐼 κ1� (5.2)
where 𝑓𝑓𝑡𝑡 is the tensile strength of the unit-mortar interface, 𝐺𝐺𝑓𝑓𝐼𝐼 is the mode I
fracture energy, and κ1 is introduced as a measure for the amount of
hardening or softening of tension mode.
Shear behaviour
As it is described in Chapter 2 that the shear behaviour of the interface
element can be modelled with the Mohr-Coulomb failure law, which is
defined in Equation 5.3:
𝑓𝑓2(σ, κ2)=|τ| + σ tan𝛷𝛷(κ2) −σ2���(κ2) (5.3)
where the yield value σ2��� reads
σ2��� = c exp �− c𝐺𝐺𝑓𝑓𝐼𝐼𝐼𝐼 κ2� (5.4)
and the friction angle 𝛷𝛷 is coupled with cohesion softening via the following
equation:
119

Chapter 5 Micro-scale simulation model
tan𝛷𝛷 = tan𝛷𝛷0 + (tan𝛷𝛷𝑟𝑟 − tan𝛷𝛷0) 𝑐𝑐−σ2����𝑐𝑐
(5.5)
The interface material model considers exponential softening for both the
cohesion and friction angle, which are demonstrated in Equations. The
softening of the friction angle is assumed to be proportional to the softening
of the cohesion (Lourenco, 1996). The dilatancy effect and strain softening
behaviour are also incorporated in this model.
In the above, C is the cohesion of the unit-mortar interface, 𝛷𝛷0 is the initial
friction angle, 𝛷𝛷𝑟𝑟 is the residual friction angle, 𝐺𝐺𝑓𝑓𝐼𝐼𝐼𝐼 is the mode II fracture
energy and κ2 is the amount of hardening or softening of mode II.
Compressive behaviour
For the cap mode, an ellipsoid interface model is used. The compressive
model is representative of the maximum compression strength of the
interface element. For the hardening/softening behaviour, the law shown in
Figure 5.5 was considered, where represents the amount of softening
(Lourenco and Rots 1997). The energy under the curve can be related to a
‘‘compressive fracture energy’’. For the yield function for a 2D model, it is
shown in Equation 5.6:
𝑓𝑓3(𝜎𝜎, 𝜅𝜅3) = 𝐶𝐶𝑛𝑛𝑛𝑛𝜎𝜎2 + 𝐶𝐶𝑠𝑠𝑠𝑠𝜏𝜏2 + 𝐶𝐶𝑛𝑛 − (σ3���(κ3))2 (5.6)
with 𝐶𝐶𝑛𝑛𝑛𝑛 ,𝐶𝐶𝑠𝑠𝑠𝑠 and 𝐶𝐶𝑛𝑛 a set of material parameters and σ3��� the yield value. The
parameters 𝐶𝐶𝑛𝑛𝑛𝑛 and 𝐶𝐶𝑛𝑛control the centre of the cap whereas the parameter
𝐶𝐶𝑠𝑠𝑠𝑠 controls the contribution of the shear stress to failure. In this study a
centred cap with 𝐶𝐶𝑛𝑛𝑛𝑛 = 1 and 𝐶𝐶𝑛𝑛 = 0is adopted because a tension cut-off will
be included in the composite yield surface. Furthermore, 𝐶𝐶𝑠𝑠𝑠𝑠 is taken as 9 as
this value provides the best result (Lourenco 1996).
120

Chapter 5 Micro-scale simulation model
Figure 5.6 Nonlinear compressive behaviour of the cap model (Lourenco and Rots
1997)
5. 5 Review on the application of this method
Lourenco (1996) applied this model to simulate the experimental test of
(Raijmakers and Vermeltfoort 1992). The experimental tests were two shear
walls, a solid clay brickwork and a clay brickwork with opening, which are
shown in Figures 5.6 (a) and (b). The numerical model was checked both
qualitatively and quantitatively against experimental data and a high degree
of correlation was found, which are shown in Figures 5.7 (a) and (b). Tarque
(2011) applied the finite element method MIDAS FEA to model the adobe
masonry wall, and good agreement with the experimental result was found.
The load-displacement diagrams are shown in Figure 5.8. Similarly, Lofti
(1992) and Attard et al. (2007) applied this method by modelling masonry
walls with a combination of continuum elements and interface elements.
121
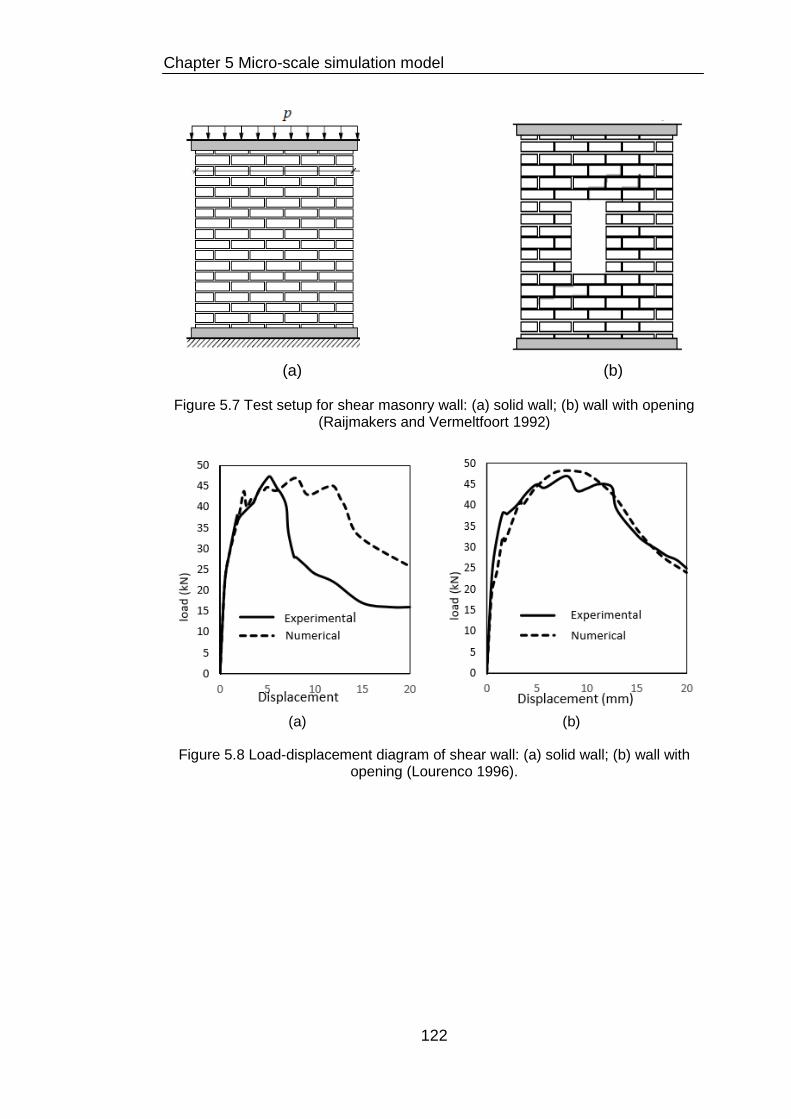
Chapter 5 Micro-scale simulation model
(a) (b)
Figure 5.7 Test setup for shear masonry wall: (a) solid wall; (b) wall with opening (Raijmakers and Vermeltfoort 1992)
(a) (b)
Figure 5.8 Load-displacement diagram of shear wall: (a) solid wall; (b) wall with opening (Lourenco 1996).
122

Chapter 5 Micro-scale simulation model
Figure 5.9 Load-displacement diagrams of the adobe masonry wall (Tarque 2011)
Also, Al-Chaar and Mehrabi (2008) used this method to model the masonry
infill of an infilled RC frame, which was tested by (Mehrabi et al. 1996). By
applying this method, a good agreement with experimental results was
found. The load-displacement curves for infilled RC frame is shown in Figure
5.9.
Figure 5.10 Load-displacement curves for infilled RC frame
123

Chapter 5 Micro-scale simulation model
5. 6 Summary In this chapter, a simplified micro-scale finite element model was developed.
Within this model, the mortar joints were smeared out into zero-thickness
interface, while the bricks were expanded in order to keep the whole
geometry unchanged. Furthermore, a potential vertical crack was pre-
defined in the middle of every brick as this is where the brick crack mostly
likely occur. This model was proposed and presented in the work of
Lourenco (1996), and it has been proved to be workable and effective by
many researchers (Al-Chaar and Mehrabi 2008, Lofti 1992, Attard et al.
2007). In this research, the commercial software MIDAS FEA was used due
to its powerful advantages in analysing masonry wall panels. Furthermore,
the inherent material model ‘‘combined cracking-shearing-crushing’’ is able
to capture all the failure modes occurred in masonry structure. However, as
the masonry material is composite and a lot of parameters are involved,
therefore, these parameters should be known before the numerical analysis
work. Some of the parameters are able to be obtained via tests on small
scale samples (Chapter 3) while the others can only be estimated or
calibrated numerically. The detail of the calibration work on those
parameters are carried out in Chapter 6.
124

Chapter 6 Calibration of material parameters of masonry wall
Chapter 6 Calibration of material parameters of masonry wall
6. 1 Introduction
The material properties of the masonry wall are difficult to obtain via small
scale specimen tests and the results could be variable. Therefore, the
parameters that cannot be obtained via tests need to be characterized by
the calibration method before the simulation work. In this chapter, the
calibration work is carried out based on the experimental results of a single-
leaf masonry wall. Firstly, a sensitivity study was carried out on the single
leaf masonry wall in order to identify the most influential parameters. Then,
the parameter calibration was conducted based on these sensitivity study
results. After the calibration work, the parameters will be assigned to the
masonry model in the simulation work in Chapter 7 to simulate the single-
leaf wall panel and to predicate the double-leaf wall panels. For a more
detailed calibration process, the flowchart is demonstrated in Figure 6.1
125
Chapter 6 Calibration of material parameters of masonry wall
Figure 6.1 Detailed process of calibration process
6. 2 Generation of initial model in MIDAS FEA
6.2.1 Geometry
The geometrical model representing the brickwork wall panels described in
Chapter 5 was created in MIDAS FEA. The brick was represented by an
elastic deformable element, while the mortar joints are represented by zero
thickness interfaces. As the mortar joints have been smeared out in the
modelling, this change needs to be taken into account. To allow for the
10mm thick mortar joints, each brick element was increased by 5mm in each
face direction to give it a size of 225 X 102.5 X 75mm3. This is illustrated in
Figure 6.2. In a more elaborate approach vertical-potential cracks are placed
through the bricks as well. This is due to the fact that in masonry structures,
as also evidenced in the current experimental failure patterns, most of the
propagating cracks beyond being located in the mortar also develop in the
126

Chapter 6 Calibration of material parameters of masonry wall
middle of bricks (Dolatshahi and Aref 2011) making these regions similarly
prone to forming separations (Lourenco and Rots 1997).
Figure 6.2 Micro-modelling strategy for masonry (Lourenco 1996)
6.2.2 Materials details
In MIDAS FEA, each brick was assumed to behave as a homogeneous,
isotropic continuum which exhibits linear stress-strain behaviour. The brick
element remained intact at all stages of applied loading while the
predominant failure mode would be sliding along the brick/mortar interface
and brick element slip along the pre-defined brick crack in the middle part of
the brick. Such failure modes have also been observed in the experiments
described in Chapter 4.
For the mortar joints and pre-defined brick cracks, these were represented
by a zero thickness interface. These interfaces were modelled using
‘‘combined cracking-shearing-crushing’’ material in MIDAS FEA. As
explained in Chapter 5, this material captures all the failure modes. The
material is based on the elastic normal and shear stiffness, tensile and
cohesive strength, compressive strength, Mode I fracture energy, Mode II
fracture energy, compressive fracture energy, friction angle as well as the
dilation characteristics of the mortar joints. All these parameters need to be
calibrated in order to validate the experimental masonry walls.
Potential brick crack Brick-mortar interface
127

Chapter 6 Calibration of material parameters of masonry wall
In this chapter, as all the parameters are not known yet, therefore, the
material property is assumed and selected for the initial simulation. This
assumption and selection were based on the previous researches. The
method can also be found in the work of Tarque (2011).
The selection of the initial value of the material parameters was mainly
based on the work of Van der Pluijm (1992) and Lourenco (1996). Obviously,
these material parameters do not accurately represent those for the wall
panels tested in the laboratory because it is impossible to obtain the
accurate value of each parameter as the curing condition, boundary
condition as well as other factors are different . The obtained parameters via
numerical work are perfect and they don't consider the deviation existed in
masonry material. Therefore, these material parameters can provide an
initial qualitative evaluation to represent the formation and propagation of
cracks and the global structural behaviour of the masonry walls with
sufficient reliability. For the pilot study, the initial value of the parameters are
taken the same with the literature review, thus only reasonable values are
considered. According to the literature review, the strength and stiffness of
head joint is about 75%-100% percent of its bed joint (Lourenco 1996, Al-
Chaar and Mehrabi 2008, Sarhosis 2012, Sattar 2013). In this research, the
material properties for bed mortar joints and head mortar joints are treated
as the same for simplicity. Although they may differ in real masonry walls, it
was considered to be acceptable as any significant differences that may
occur in practice would influence the behaviour of the panels in the
laboratory tests. Also, by taking the bed and head joints as the same, a
large amount of the numerical work and time in the calibration part can be
saved.
128

Chapter 6 Calibration of material parameters of masonry wall
6.2.3 Boundary conditions
As shown in Figure 3.1 in Chapter 3, the base of the masonry wall and the
right-bottom corner were restrained by a steel base and frame. Therefore,
they were modelled as rigid supports. The left-top part of the wall was
restrained as a roller after the vertical load being applied as the vertical
displacement is restrained while the wall still can move along the horizontal
direction.
6.2.4 Loading
A 20kN vertical load was applied to the left-top steel plate before the test.
The vertical load would increase gradually during the test as the vertical
deflection was restrained by the vertical load actuator. The horizontal load
was applied to the vertical steel plate on the left side of panel and it was
displacement controlled. The self-weight of the masonry wall was not
considered in this model.
6. 3 Parameters sensitivity study
6.3.1 Methodology
The sensitivity analysis took place in order to evaluate the influence of
different parameters on the calibrated numerical behaviour curves. As
mentioned above, there are quite a few parameters that need to be
calibrated and some of them can significantly affect the modelling results.
Some of the material parameters can be measured via small scale tests.
However, some others are very difficult to obtain via experimental tests,
such as the mode I fracture energy, mode II fracture energy etc. As the
material parameters define the characteristics of the zero thickness
interfaces between the mortar joints and the blocks, they can be difficult to
129

Chapter 6 Calibration of material parameters of masonry wall
measure directly from physical tests. Even if it is able to carry out the
experimental tests, the results always vary and are not trustworthy. For
instance, the tensile strength and the compressive strength etc. of the
mortar joint obtained from experimental tests on small samples is stronger
than its counterparts in masonry wall panels because of the effect of scale
factor and boundary conditions etc. Therefore, another method is needed to
obtain these parameters. In theory, every parameter needs to be calibrated
by taking other parameters into consideration. It would be very unlikely that
parametric studies are carried out by taking every parameter into account,
as it would be extremely time consuming. There are more than 16
parameters needed to be characterized in this research. Even if each
parameter has 5 different variables, it would take 165=1,048,576 simulations.
Therefore, it is impossible to conduct a parametric study by taking every
parameter into consideration.
In order to save computational time in the simulation work, some parameters
were calibrated together. The initial range of every parameter is selected
according to the literature review. As the previous researches have done
similar simulations on masonry structures. The parameters used in those
researches have been considered here as well. Therefore, only reasonable
values are considered here, which can save a lot of consuming time by
excluding the unnecessary ranges.
6.3.2 The influence of brick-mortar interface’ parameters
The shear/normal stiffness (𝐾𝐾𝑛𝑛 /𝐾𝐾𝑠𝑠)
Firstly, the stiffness of brick-mortar interface was conducted. The mortar
joints have been smeared out as a zero-thickness interface in the modelling.
Therefore, the properties of both brick and mortar should be taken into
consideration in the elastic interface stiffness (𝐾𝐾𝑛𝑛 and𝐾𝐾𝑠𝑠).
130

Chapter 6 Calibration of material parameters of masonry wall
Lourenco (1996) used detailed dis-continuum finite element analysis to
demonstrate that the interface stiffness can be directly related to the brick
and mortar properties as follows:
𝐾𝐾𝑛𝑛 = 𝐸𝐸𝑏𝑏𝐸𝐸𝑚𝑚ℎ𝑚𝑚 (𝐸𝐸𝑏𝑏−𝐸𝐸𝑚𝑚 )
(6.1)
𝐾𝐾𝑠𝑠 = 𝐺𝐺𝑏𝑏𝐺𝐺𝑚𝑚ℎ𝑚𝑚 (𝐺𝐺𝑏𝑏−𝐺𝐺𝑚𝑚 )
(6.2)
If the Poisson’s ratio (𝜈𝜈) is taken into account, the relation between Young’s
modulus and shear modulus will be known. 𝐾𝐾𝑠𝑠can be rewritten as following:
𝐾𝐾𝑠𝑠 = 𝐸𝐸𝑏𝑏𝐸𝐸𝑚𝑚2ℎ𝑚𝑚 [𝐸𝐸𝑏𝑏(1+𝑣𝑣𝑚𝑚 )−𝐸𝐸𝑚𝑚 (1+𝑣𝑣𝑏𝑏)]
(6.3)
By dividing equations (6.1) and (6.3), the relation between and is obtained,
this is shown in the Equation (6.4) to (6.7):
𝐾𝐾𝑛𝑛𝐾𝐾𝑠𝑠
=𝐸𝐸𝑏𝑏𝐸𝐸𝑚𝑚
ℎ𝑚𝑚 (𝐸𝐸𝑏𝑏−𝐸𝐸𝑚𝑚 )𝐸𝐸𝑏𝑏𝐸𝐸𝑚𝑚
2ℎ𝑚𝑚 �𝐸𝐸𝑏𝑏 (1+𝑣𝑣𝑚𝑚 )−𝐸𝐸𝑚𝑚 �1+𝑣𝑣𝑏𝑏 ��
(6.4)
𝐾𝐾𝑛𝑛𝐾𝐾𝑠𝑠
= 2(𝐸𝐸𝑏𝑏+𝐸𝐸𝑏𝑏𝑣𝑣𝑚𝑚−𝐸𝐸𝑚𝑚−𝐸𝐸𝑚𝑚 𝑣𝑣𝑏𝑏)𝐸𝐸𝑏𝑏−𝐸𝐸𝑚𝑚
(6.5)
𝐾𝐾𝑛𝑛𝐾𝐾𝑠𝑠
= 2 �1 + 𝐸𝐸𝑏𝑏𝑣𝑣𝑚𝑚−𝐸𝐸𝑚𝑚 𝑣𝑣𝑏𝑏𝐸𝐸𝑏𝑏−𝐸𝐸𝑚𝑚
� (6.6)
𝐾𝐾𝑛𝑛 = 2 �1 + 𝐸𝐸𝑏𝑏𝑣𝑣𝑚𝑚−𝐸𝐸𝑚𝑚𝑣𝑣𝑏𝑏𝐸𝐸𝑏𝑏−𝐸𝐸𝑚𝑚
�𝐾𝐾𝑠𝑠 (6.7)
Where 𝐸𝐸𝑏𝑏 and 𝐸𝐸𝑚𝑚are the Young’s module for the brick and mortar; 𝐺𝐺𝑏𝑏and
𝐺𝐺𝑚𝑚 are the shear module for the brick and mortar; 𝑣𝑣𝑏𝑏 and 𝑣𝑣𝑚𝑚 are the
Poisson’s ratio for brick and mortar andℎ𝑚𝑚 is the actual thickness of mortar
joint.
131

Chapter 6 Calibration of material parameters of masonry wall
According to Equation (6.7), the relation between 𝐾𝐾𝑛𝑛 and 𝐾𝐾𝑠𝑠 can be
obtained if the value of each parameter is given. The range of each
parameter is adopted from micro-scale experiments reported by Hendry
(1998), Van der pluijm (1992) and Sarangapani et al. (2005), which is shown
in Table 6.1.
Table 6.1 Range of brick and mortar properties identified from the literature
Interface parameter
Young’s modulus
of brick (𝑁𝑁/𝑚𝑚𝑚𝑚2)
Young’s modulus
of mortar
(𝑁𝑁/𝑚𝑚𝑚𝑚2)
Poisson’s
ration of
brick
Poisson’s
ration of
mortar
Symbol 𝐸𝐸𝑏𝑏 𝐸𝐸𝑚𝑚 𝑣𝑣𝑏𝑏 𝑣𝑣𝑚𝑚
Range (4~100)×103 (1~11)×103 0.1~0.2 0.1~0.2
After combining of the material parameters, the ratio of the normal to shear
stiffness ranges from 2.0852.514. Therefore, the value of the ratio can be
taken as the average of 2.085 and 2.514, namely 2.3.
As ratio between normal stiffness to shear stiffness is 2.3, therefore, only the
normal stiffness needs to be calibrated in the following study. As long as
normal stiffness is known, the shear stiffness will be known straightforward.
The initial parameters ranges are selected from the work of Van der Pluijm
(1992) and Lourenco (1996), which are listed in Table 6.2.
132
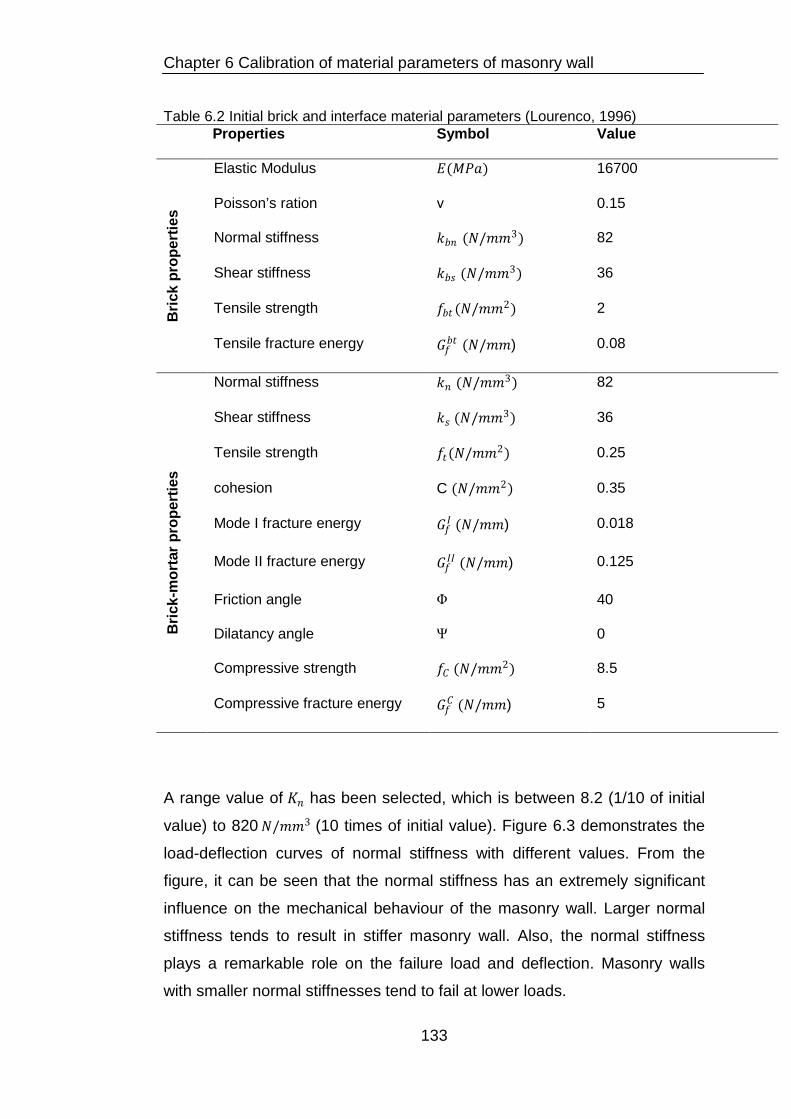
Chapter 6 Calibration of material parameters of masonry wall
Table 6.2 Initial brick and interface material parameters (Lourenco, 1996) Properties Symbol Value
Bric
k pr
oper
ties
Elastic Modulus 𝐸𝐸(𝑀𝑀𝑀𝑀𝑡𝑡) 16700
Poisson’s ration ν 0.15
Normal stiffness 𝑘𝑘𝑏𝑏𝑛𝑛 (𝑁𝑁/𝑚𝑚𝑚𝑚3) 82
Shear stiffness 𝑘𝑘𝑏𝑏𝑠𝑠 (𝑁𝑁/𝑚𝑚𝑚𝑚3) 36
Tensile strength 𝑓𝑓𝑏𝑏𝑡𝑡 (𝑁𝑁/𝑚𝑚𝑚𝑚2) 2
Tensile fracture energy 𝐺𝐺𝑓𝑓𝑏𝑏𝑡𝑡 (𝑁𝑁/𝑚𝑚𝑚𝑚) 0.08
Bric
k-m
orta
r pro
pert
ies
Normal stiffness 𝑘𝑘𝑛𝑛 (𝑁𝑁/𝑚𝑚𝑚𝑚3) 82
Shear stiffness 𝑘𝑘𝑠𝑠 (𝑁𝑁/𝑚𝑚𝑚𝑚3) 36
Tensile strength 𝑓𝑓𝑡𝑡(𝑁𝑁/𝑚𝑚𝑚𝑚2) 0.25
cohesion C (𝑁𝑁/𝑚𝑚𝑚𝑚2) 0.35
Mode I fracture energy 𝐺𝐺𝑓𝑓𝐼𝐼 (𝑁𝑁/𝑚𝑚𝑚𝑚) 0.018
Mode II fracture energy 𝐺𝐺𝑓𝑓𝐼𝐼𝐼𝐼 (𝑁𝑁/𝑚𝑚𝑚𝑚) 0.125
Friction angle Φ 40
Dilatancy angle Ψ 0
Compressive strength 𝑓𝑓𝐶𝐶 (𝑁𝑁/𝑚𝑚𝑚𝑚2) 8.5
Compressive fracture energy 𝐺𝐺𝑓𝑓𝐶𝐶 (𝑁𝑁/𝑚𝑚𝑚𝑚) 5
A range value of 𝐾𝐾𝑛𝑛 has been selected, which is between 8.2 (1/10 of initial
value) to 820 𝑁𝑁/𝑚𝑚𝑚𝑚3 (10 times of initial value). Figure 6.3 demonstrates the
load-deflection curves of normal stiffness with different values. From the
figure, it can be seen that the normal stiffness has an extremely significant
influence on the mechanical behaviour of the masonry wall. Larger normal
stiffness tends to result in stiffer masonry wall. Also, the normal stiffness
plays a remarkable role on the failure load and deflection. Masonry walls
with smaller normal stiffnesses tend to fail at lower loads.
133

Chapter 6 Calibration of material parameters of masonry wall
It can also be seen that the experimental result falls between the normal
stiffness of 8.2 and 17.2 𝑁𝑁/𝑚𝑚𝑚𝑚3and when normal stiffness is 17.2𝑁𝑁/𝑚𝑚𝑚𝑚3,
the modelling result is close to the experimental one. Obviously, it cannot be
claimed that the assumed normal stiffness (𝑘𝑘𝑛𝑛=17.2𝑁𝑁/𝑚𝑚𝑚𝑚3) is exactly the
same normal stiffness of the interface. Presumably, this normal stiffness
value is close to the real value, and it can be applied in the initial sensitivity
study.
Figure 6.3 Influence of normal stiffness
Tensile strength (𝒇𝒇𝒕𝒕) or cohesion (C)
Pluijm (1993) reported that the ratio of shear bond strength to direct tensile
bond strength varied between 1.3 and 6.5 and the ratio was largest for low
values of tensile bond strength. In addition Pluijm et al. (2000) take the ratio
as 1.5 when and this ratio is often found in masonry specimens (Binda et al.
2006). In the work of Lourenco (1996), the ratio of clay brickwork’s cohesion
0
20
40
60
80
100
120
140
160
0 1 2 3 4 5 6 7 8
Kn=86N/mm3
Kn=17.2N/mm3
Kn=8.6N/mm3
Deflection/mm
Forc
e/kN
Experimental work
Kn=860N/mm3
134
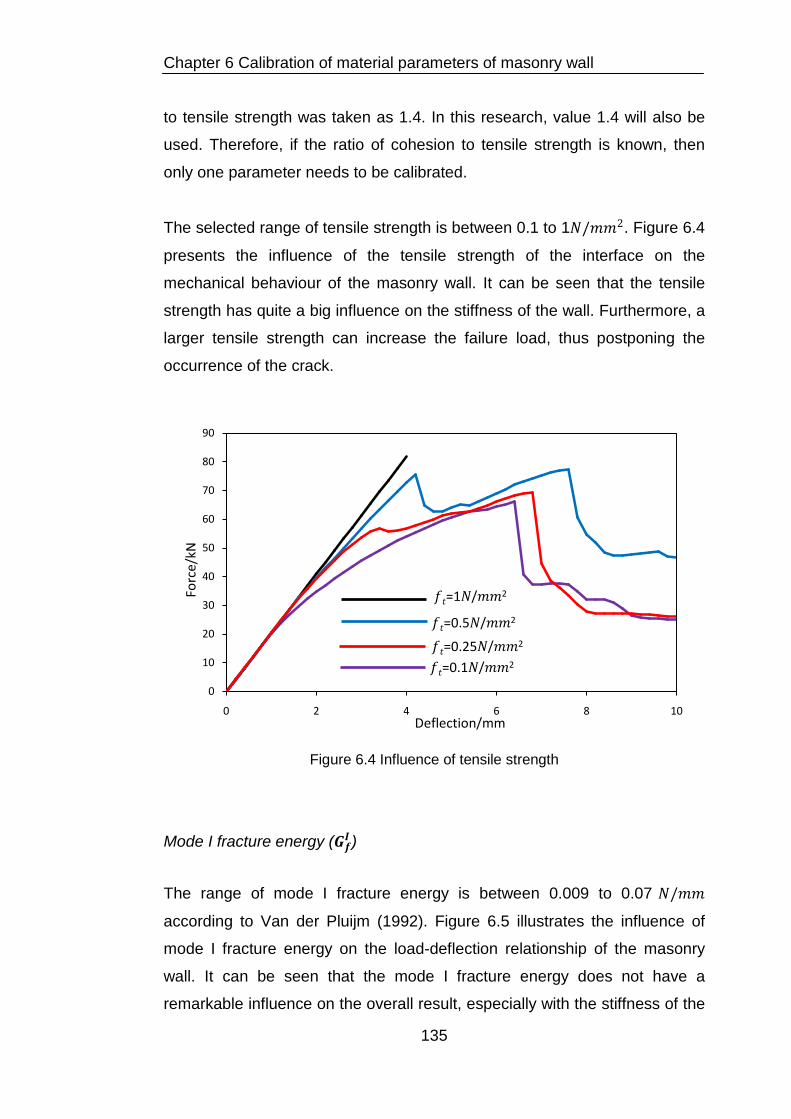
Chapter 6 Calibration of material parameters of masonry wall
to tensile strength was taken as 1.4. In this research, value 1.4 will also be
used. Therefore, if the ratio of cohesion to tensile strength is known, then
only one parameter needs to be calibrated.
The selected range of tensile strength is between 0.1 to 1𝑁𝑁/𝑚𝑚𝑚𝑚2. Figure 6.4
presents the influence of the tensile strength of the interface on the
mechanical behaviour of the masonry wall. It can be seen that the tensile
strength has quite a big influence on the stiffness of the wall. Furthermore, a
larger tensile strength can increase the failure load, thus postponing the
occurrence of the crack.
Figure 6.4 Influence of tensile strength
Mode I fracture energy (𝑮𝑮𝒇𝒇𝑰𝑰 )
The range of mode I fracture energy is between 0.009 to 0.07 𝑁𝑁/𝑚𝑚𝑚𝑚
according to Van der Pluijm (1992). Figure 6.5 illustrates the influence of
mode I fracture energy on the load-deflection relationship of the masonry
wall. It can be seen that the mode I fracture energy does not have a
remarkable influence on the overall result, especially with the stiffness of the
0
10
20
30
40
50
60
70
80
90
0 2 4 6 8 10
𝑓𝑓𝑡𝑡=1𝑁𝑁/𝑚𝑚𝑚𝑚2
𝑓𝑓𝑡𝑡=0.5𝑁𝑁/𝑚𝑚𝑚𝑚2
𝑓𝑓𝑡𝑡=0.25𝑁𝑁/𝑚𝑚𝑚𝑚2
Deflection/mm
Forc
e/kN
𝑓𝑓𝑡𝑡=0.1𝑁𝑁/𝑚𝑚𝑚𝑚2
135

Chapter 6 Calibration of material parameters of masonry wall
whole wall. However, bigger mode I fracture energy can slightly increase the
maximum load thus postponing the occurrence of failure.
Figure 6.5 Influence of mode I fracture energy
Coefficient of friction angle (𝐭𝐭𝐭𝐭𝐭𝐭𝜱𝜱))
Figure 6.6 Influence of coefficient of friction angle
0
10
20
30
40
50
60
70
80
0 2 4 6 8 10Deflection/mm
Forc
e/kN
0
10
20
30
40
50
60
70
80
0 2 4 6 8 10Deflection/mm
Forc
e/kN
136

Chapter 6 Calibration of material parameters of masonry wall
The friction coefficient of the interface ranges between 0.7 to 1.2 (Van der
Pluijm 1992). Figure 6.6 illustrates the load-deflection relationship under
different friction angles. In Figure 6.6, it can be seen that the friction angle
does not affect the stiffness of the whole wall. However, the friction angle
can affect the failure load and occurrence of cracks to some degree.
Coefficient of dilatancy angle (𝐭𝐭𝐭𝐭𝐭𝐭𝜳𝜳)
According to Van der Pluijm (1992), the coefficient of dilatancy angle ranges
from 0.2 to 0.7. The influence of dilatancy angle on the mechanical
behaviour of the whole wall is displayed in Figure 6.7. It reveals that before
the big crack occurred, the dilatancy angle does not affect the stiffness of
the masonry wall at all. However, after the big crack occurred and the re-
distribution happened, the dilatancy angle starts to have a significant
influence on the masonry wall. Bigger dilatancy angle can postpone the
occurrence of big cracks and also improve the failure load of the wall.
Figure 6.7 Influence of coefficient of dilatancy angle
0
10
20
30
40
50
60
70
80
0 2 4 6 8 10Deflection/mm
Forc
e/kN
137

Chapter 6 Calibration of material parameters of masonry wall
Mode II fracture energy (𝑮𝑮𝒇𝒇𝑰𝑰𝑰𝑰)
The selected range of mode II fracture energy is between 0.065 to 0.3 𝑁𝑁/
𝑚𝑚𝑚𝑚. Figure 6.8 displays the influence of Mode II fracture energy on the
behaviour of the masonry wall. Though it can be concluded that the mode II
fracture energy does not affect the stiffness of the wall, it does have a
relatively remarkable influence on the failure load and crack occurrence.
Larger value of mode II fracture energy can increase the failure load and
postpone the occurrence of big crack.
Figure 6.8 Influence of Mode II fracture energy
Compressive strength (𝒇𝒇𝒎𝒎)
Figure 6.9 presents the influence of the compressive strength on the load-
deflection relationship. It can be clearly observed that the compressive
strength does not affect the initial stiffness. However, it does have a great
influence on the failure load and post-peak behaviour.
0
10
20
30
40
50
60
70
80
0 2 4 6 8 10Deflection/mm
Forc
e/kN
138

Chapter 6 Calibration of material parameters of masonry wall
Figure 6.9 Influence of compressive strength
Compressive fracture energy (𝑮𝑮𝒄𝒄𝒇𝒇)
Figure 6.10 Influence of compressive fracture energy
Figure 6.10 illustrates the influence of compressive fracture energy on the
behaviour of the masonry wall. It reveals that the parameter compressive
0
10
20
30
40
50
60
70
80
90
100
0 2 4 6 8 10
𝑓𝑓𝑚𝑚=8𝑀𝑀𝑝𝑝𝑡𝑡𝑓𝑓𝑚𝑚=20𝑀𝑀𝑝𝑝𝑡𝑡
Deflection/mm
Forc
e/kN
𝑓𝑓𝑚𝑚=40𝑀𝑀𝑝𝑝𝑡𝑡
𝑓𝑓𝑚𝑚=5𝑀𝑀𝑝𝑝𝑡𝑡
0
10
20
30
40
50
60
70
80
0 2 4 6 8 10Deflection/mm
Forc
e/kN
139

Chapter 6 Calibration of material parameters of masonry wall
fracture energy does not influence the whole behaviour. However, it does
slightly affect the failure point.
6.3.3 The influence of brick’s parameters
As described in section two in chapter 5, there is a potential vertical crack
placed through the middle part of every brick. This crack is modelled by
using the same method with the brick-mortar interface. However, for
simplicity, this interface is modelled with a discreet cracking element. In this
case, only the normal/shear stiffness of the crack (𝐾𝐾𝑏𝑏𝑛𝑛 and 𝐾𝐾𝑏𝑏𝑠𝑠 ), tensile
strength (𝑓𝑓𝑏𝑏𝑡𝑡 ) and fracture energy (𝐺𝐺𝑓𝑓𝑏𝑏𝑡𝑡 ) should be obtained in advance. The
following section is the sensitivity parametric study carried out on these
parameters.
Normal/shear stiffness (𝑲𝑲𝒃𝒃𝒃𝒃/𝑲𝑲𝒃𝒃𝒃𝒃)
Similarly, the ratio of 𝑲𝑲𝒃𝒃𝒃𝒃 to 𝑲𝑲𝒃𝒃𝒃𝒃 is 2.3. The selected value of the normal
stiffness ranges from 100 to 1E6𝑁𝑁/𝑚𝑚𝑚𝑚3. Figure 6.11 illustrates the influence
of the normal/shear stiffness of the crack interface on the behaviour of the
whole masonry wall panel. It clearly shows that the normal/shear stiffness
does affect the stiffness and the failure load of the whole wall, however, this
effect is minor. Therefore, for simplicity, this minor effect can be ignored in
the parametric study. According to Lourenco (1996), the normal stiffness of
brick crack can be taken as 1000𝑁𝑁/𝑚𝑚𝑚𝑚3.
140

Chapter 6 Calibration of material parameters of masonry wall
Figure 6.11 Influence of normal stiffness of brick crack
Brick element type
When we model the brick as deformable element, linear elastic and non-
linear behaviour can be applied. Here in this section, both cases will be
conducted to find out the variation between them.
Figure 6.12 demonstrates the influence of the brick element type on the
global behaviour of the whole masonry wall panel. It reveals that no matter
which type of element is used, the modelling produced similar results. This is
because based on the literature review, the failures most likely occur along
the interfaces (brick-mortar interfaces and brick crack interfaces). Therefore,
the modelling element type of brick does not influence the final results by
much. For simplicity, linear elastic element type will be used in the modelling.
0
10
20
30
40
50
60
70
80
0 2 4 6 8 10Deflection/mm
Forc
e/kN
𝐾𝐾𝑛𝑛=100𝑁𝑁/𝑚𝑚𝑚𝑚3
𝐾𝐾𝑛𝑛=1000𝑁𝑁/𝑚𝑚𝑚𝑚3
𝐾𝐾𝑛𝑛=1𝐸𝐸6𝑁𝑁/𝑚𝑚𝑚𝑚3
141

Chapter 6 Calibration of material parameters of masonry wall
Figure 6.12 Influence of brick type
Tensile strength of brick crack (𝒇𝒇𝒃𝒃𝒕𝒕)
Figure 6.13 illustrates the influence of the brick crack tensile strength on the
behaviour of the masonry wall panel. The figure clearly reveals that the brick
crack tensile strength only presents a minor influence on the behaviour of
the final modelling results. This minor influence can be ignored in the
simulation. According to the Lourenco (1996), the brick crack tensile
strength for clay brick can be taken as 2𝑁𝑁/𝑚𝑚𝑚𝑚2.
0
10
20
30
40
50
60
70
80
0 2 4 6 8 10Deflection/mm
Forc
e/kN
linear elastic
non-linear
142

Chapter 6 Calibration of material parameters of masonry wall
Figure 6.13 Influence of tensile strength of brick crack
Fracture energy of brick crack interface (𝐺𝐺𝑓𝑓𝑏𝑏𝑡𝑡 )
Figure 6.14 Influence of fracture energy of brick crack interface
0
10
20
30
40
50
60
70
80
0 2 4 6 8 10
Deflection/mm
Forc
e/kN
𝑓𝑓𝑏𝑏𝑡𝑡=0.5𝑁𝑁/𝑚𝑚𝑚𝑚2
𝑓𝑓𝑏𝑏𝑡𝑡=1𝑁𝑁/𝑚𝑚𝑚𝑚2
𝑓𝑓𝑏𝑏𝑡𝑡=2𝑁𝑁/𝑚𝑚𝑚𝑚2
𝑓𝑓𝑏𝑏𝑡𝑡=4𝑁𝑁/𝑚𝑚𝑚𝑚2
0
10
20
30
40
50
60
70
80
0 1 2 3 4 5 6 7 8 9 10
Deflection/mm
Forc
e/kN
143

Chapter 6 Calibration of material parameters of masonry wall
Figure 6.14 presents the fracture energy of the brick crack on the
mechanical behaviour of the masonry wall. It shows that the fracture energy
nearly has no influence on the final results. According to the literature review
presented in Chapter 2, the fracture energy will be taken as 𝐺𝐺𝑓𝑓𝑏𝑏𝑡𝑡=0.08N/mm.
This value will be used all through the following research.
6. 4 Results of analysis
Based on the above sensitivity parametric study, a summary on the
influence of each parameter on the masonry wall can be concluded. The
parameters will be categorized based on the significance of the influence.
6.4.1 Brick crack interface
Firstly, from Figure 6.11 to 6.14, after changing the brick type, normal
stiffness, tensile strength, or tensile fracture energy, the final result is almost
unchanged. It can be concluded that the influence of these parameters on
the final results is very slight. This little influence can be ignored in the
simulation work. The value of these parameters will be selected according to
the literature review. The properties of a potential crack in a clay brick as
shown in Table 6.3. These parameters will be used all through the research.
Table 6.3 Property of clay brick crack interface Parameter Normal
stiffness Shear stiffness
Tensile strength
Tensile fracture energy
Symbol 𝐾𝐾𝑏𝑏𝑛𝑛 (𝑁𝑁/𝑚𝑚𝑚𝑚3) 𝐾𝐾𝑏𝑏𝑠𝑠 (𝑁𝑁/𝑚𝑚𝑚𝑚3) 𝑓𝑓𝑏𝑏𝑡𝑡 (𝑁𝑁/𝑚𝑚𝑚𝑚2) 𝐺𝐺𝑓𝑓𝑏𝑏𝑡𝑡 (𝑁𝑁/𝑚𝑚𝑚𝑚)
Value 1000 435 2 0.08
144

Chapter 6 Calibration of material parameters of masonry wall
6.4.2 Brick-mortar interface
Based on the above sensitivity parametric studies, the property of the brick-
mortar interface has had a significant influence on the mechanical behaviour
of the masonry wall panel. However, the significance of different parameters
varies on different stages. The influence can be categorized into three
stages based on their significance. The load-displacement of single-leaf wall
3 is shown in Figure 6.15.
Figure 6.15 Experimental Load-deflection of a single-leaf wall First stage (elastic stage)
This stage is the linear elastic stage. Here, the masonry wall behaves almost
linearly under the combined external load. Based on the results from Figure
6.3 to 6.10, it can be concluded that only 𝐾𝐾𝑛𝑛/𝐾𝐾𝑠𝑠 and 𝑓𝑓𝑡𝑡 of the interface have
a significant influence on this stage. The influence of other parameters is
very slight, which can be ignored in the simulation of this stage.
Deflection/mm
Forc
e/kN
Stage one
Stage two
Stage three
145

Chapter 6 Calibration of material parameters of masonry wall
To prove that the other parameters do not affect stage one, the
normal/shear stiffness and tensile strength of the interface will remain
constant, while the rest of the parameters will be variable. Figures 6.16 and
6.17 demonstrate the influence of the two combinations of the rest of the
parameters if they are taken into account at the same time. From both
figures, it is proven that the rest of the parameters do not have a big
influence on stage one.
Figure 6.16 Influence of other parameters on stage one
Figure 6.17 Influence of other parameters on stage one
0
10
20
30
40
50
60
70
80
0 2 4 6 8 10Deflection /mm
Forc
e/kN
Φ=40, Ψ=30Φ=40, Ψ=20
Φ=50, Ψ=20Φ=50, Ψ=30
0
10
20
30
40
50
60
70
80
90
100
0 1 2 3 4 5 6 7 8Deflection /mm
Forc
e/kN
146

Chapter 6 Calibration of material parameters of masonry wall
Second stage (re-distribution stage)
This stage is the load re-distribution stage. At this stage, small cracks were
connected together and formed big cracks. However, the wall did not fail.
The load was re-distributed among the wall. After the re-distribution, the wall
continued to carry more load. According to the figures from Figures 6.3 to
6.10, parameters like 𝐾𝐾𝑛𝑛/𝐾𝐾𝑠𝑠, 𝑓𝑓𝑡𝑡 , tan𝛷𝛷, tan𝛹𝛹, 𝐺𝐺𝑓𝑓𝐼𝐼𝐼𝐼, 𝐺𝐺𝑓𝑓𝐼𝐼𝐼𝐼and play an important
role in this stage. The other parameters do not have any remarkable
influence on the results. As𝐾𝐾𝑛𝑛/𝐾𝐾𝑠𝑠and 𝑓𝑓𝑡𝑡 have already been calibrated in the
first stage, therefore, only tan𝛷𝛷, tan𝛹𝛹, 𝐺𝐺𝑓𝑓𝐼𝐼and 𝐺𝐺𝑓𝑓𝐼𝐼𝐼𝐼need to be calibrated via
parametric study for in this stage.
To prove that the other parameters do not affect stage two, the
aforementioned parameters will remain constant while only 𝑓𝑓𝑐𝑐 and 𝐺𝐺𝑐𝑐𝑓𝑓 are
variable. Figure 6.18 shows the influence of these two parameters on stage
two. From the figure, it can be clearly seen that these two parameters do not
influence stage two at all.
Figure 6.18 Influence of other parameters on stage two Third stage (Failure point)
0
10
20
30
40
50
60
70
80
90
0 2 4 6 8 10Deflection /mm
Forc
e/kN
147

Chapter 6 Calibration of material parameters of masonry wall
The third stage is the failure stage. At this stage, the masonry wall reached
its maximum load capacity. After this stage, the wall could not carry any
more load, and it started to fail. As demonstrated in Figures 6.3 to 6.10 that
parameters like 𝐾𝐾𝑛𝑛/𝐾𝐾𝑠𝑠 , 𝑓𝑓𝑡𝑡 , tan𝛷𝛷 , tan𝛹𝛹 , 𝐺𝐺𝑓𝑓𝐼𝐼 , 𝐺𝐺𝑓𝑓𝐼𝐼𝐼𝐼 , 𝑓𝑓𝑐𝑐 and 𝐺𝐺𝑓𝑓𝑐𝑐 remarkably
influence the mechanical behaviour of masonry wall. However, 𝐾𝐾𝑛𝑛/𝐾𝐾𝑠𝑠 , 𝑓𝑓 ,
tan𝛷𝛷 , tan𝛹𝛹 , 𝐺𝐺𝑓𝑓𝐼𝐼𝐼𝐼 , 𝐺𝐺𝑓𝑓𝐼𝐼 have already been obtained in the first two stages.
Therefore, only 𝑓𝑓𝑐𝑐 and 𝐺𝐺𝑐𝑐𝑓𝑓 are needed in this stage.
6. 5 Calibration work
6.5.1 Methodology As the influence of parameters on each stage is known in Section 6.4, the
material calibration work can be carried out stage by stage. The aim of the
calibration work is to ‘‘tune’’ the difference between the numerical and
experimental results.
After the calibration of parameters in stage one, stage two and three can be
carried out using the same process and method. The methodology of
material parameter calibration for stage one is illustrated in Figure 6.19.
In detail, this calibration approach can be expressed as following steps: (1)
Select the initial value of the parameters based on the literature and assign
them in the FE model. In this step, the initial value of the parameters that
affect stage one will be selected and kept variable while the other
parameters will be kept constant based on the literature.(2) Compare the
numerical result with the experimental result. Only the results obtained from
stage one will be compared and analysed. (3) Shrink the range of the initial
parameters based on the comparison and assign them back to the model.
By this process, the initial range will be shrunk and more accurate value will
148

Chapter 6 Calibration of material parameters of masonry wall
be obtained. (4)Repeat step (2) and (3) until a satisfied result is obtained. (5)
Apply the same process to calibrate the parameters in stage two and three
until all the parameters needed have been calibrated.
By applying this calibration methodology, the results obtained will not be
exactly the same as the experimental results. However, as the properties of
masonry materials always vary even if in the same conditions, it is
impossible to obtain completely accurate material property. The aim of the
calibration work is to obtain the optimum estimation of the unknown model
parameters as it is very unlikely to take all the influence factors into account.
The estimation of the material parameters obtained from this approach can
be referred to as the maximum likely estimates.
149

Chapter 6 Calibration of material parameters of masonry wall
Figure 6.19Methodology for the calibration of material parameters
6.5.2 First stage (Linear stage) Figure 6.14 shows that the behaviour of masonry wall in first stage is almost
linear, therefore, the initial stiffness of the wall can be obtained by dividing
the load by displacement, which is shown in the Equation 6.8:
Computational stage
Experimental stage
Initial guess of the range of material parameters
Design of computational experiments
Apply initial parameters in FEM model
Obtain response data
Stage one
Carry out large scale experiment
Obtain experimental response data
Comparison of obtained experimental and computational data
Is obtained computational data close enough with
experimental one?
No
Yes
Material parameters are calibrated
Calibration for stage two
150

Chapter 6 Calibration of material parameters of masonry wall
𝐾𝐾 = 𝐹𝐹𝑖𝑖𝐷𝐷𝑖𝑖
(6.8)
where 𝐾𝐾 is the initial stiffness of the masonry wall, is the lateral load at
point , and is the displacement at point . Point is where the point still lays in
the linear stage. It is known from the experimental result (the stiffness of
Wall 3 in linear stage) that the stiffness of the masonry wall 𝐾𝐾 = 12.6𝑘𝑘𝑁𝑁/𝑚𝑚𝑚𝑚.
Based on Figure 6.3, the normal stiffness (𝐾𝐾𝑛𝑛 ) of the brick-mortar interface is
between 8.2 to 17.4𝑁𝑁/𝑚𝑚𝑚𝑚3 . The parametric study was carried out with
normal stiffness increase of 1.64𝑁𝑁/𝑚𝑚𝑚𝑚3, and the increase of tensile strength
is 0.1𝑁𝑁/𝑚𝑚𝑚𝑚2 from 0.1 to 0.5𝑁𝑁/𝑚𝑚𝑚𝑚2. The value range of the parameters are
presented in Table 6.4. Only the normal stiffness and tensile strength are
variables, the rest are taken from Lourenco’s (1996) work and remained
constant.
Table 6.4 Ranges of brick-mortar interface used in MIDAS Parameter Value
Varia
bles
Normal stiffness(𝑁𝑁/𝑚𝑚𝑚𝑚3) 8.2, 9.84,11.48, 13.12,14.76, 16.4
Shear Stiffness (𝑁𝑁/𝑚𝑚𝑚𝑚3) /2.3
Tensile strength (𝑁𝑁/𝑚𝑚𝑚𝑚2) 0.1, 0.2, 0.3, 0.4, 0.5
Con
stan
ts
Mode I fracture energy 𝐺𝐺𝑓𝑓𝐼𝐼(𝑁𝑁/
𝑚𝑚𝑚𝑚)
0.018
Cohesion (𝑁𝑁/𝑚𝑚𝑚𝑚2) 0.35
Friction coefficient 0.75
Dilatancy coefficient 0.6
Mode II fracture energy (𝑁𝑁/𝑚𝑚𝑚𝑚) 0.125
Compressive strength (𝑁𝑁/𝑚𝑚𝑚𝑚2) 8.5
Compressive fracture energy
𝐺𝐺𝑓𝑓𝑐𝑐(𝑁𝑁/𝑚𝑚𝑚𝑚)
5
151

Chapter 6 Calibration of material parameters of masonry wall
By selecting the initial value for each parameter, the results of different
combinations are produced. Here the stiffness result of every combination
will be compared with the experimental results. After the comparison, the
initial range was shrunk and then the further finer calibration was carried out.
By repeating the above process, a final value range will be acquired. After
applying these parameters in MIDAS FEA, the final results are illustrated in
Figures 6.20 and 6.21.
Figure 6.20 Influence of tensile strength and normal stiffness of brick-mortar interface on the first stage
8
9
10
11
12
13
14
15
16
17
18
0.2 0.25 0.3 0.35 0.4 0.45 0.5
Stiff
ness
(kN
/mm
)
Tensile strength (𝑁𝑁/𝑚𝑚𝑚𝑚2)
Experimental
𝐾𝐾𝑛𝑛=8.2𝐾𝐾𝑛𝑛=9.8𝐾𝐾𝑛𝑛=11.5𝐾𝐾𝑛𝑛=13.1𝐾𝐾𝑛𝑛=14.7𝐾𝐾𝑛𝑛=16.4
152

Chapter 6 Calibration of material parameters of masonry wall
Figure 6.21 Influence of normal stiffness and tensile strength of brick-mortar
interface on the first stage of masonry wall
According to Figure 6.20, it can be seen that the tensile strength of the
experimental result lies between 0.2 to 0.4𝑁𝑁/𝑚𝑚𝑚𝑚2 . Therefore, it can be
concluded that the value of the tensile strength of the interface is between
0.2 to 0.4𝑁𝑁/𝑚𝑚𝑚𝑚2. Similarly, the normal stiffness of the interface is between
11 to 13𝑁𝑁/𝑚𝑚𝑚𝑚3. However, both the stiffness and tensile strength vary within
a big range. Therefore, a second calibration is needed in order to get a finer
value. In the second calibration, the initial range has been shrunk. For the
second parametric study, the range of tensile strength is from 0.2 to
0.4𝑁𝑁/𝑚𝑚𝑚𝑚2 with every increment of while the range of normal stiffness is
from 11 to 13𝑁𝑁/𝑚𝑚𝑚𝑚3 with every increment of 0.5𝑁𝑁/𝑚𝑚𝑚𝑚3. The numerical
results are demonstrated in Figure 6.22 and 6.23.
9
10
11
12
13
14
15
16
17
18
8 10 12 14 16Normal stiffness (𝑁𝑁/𝑚𝑚𝑚𝑚3)
Stiff
ness
(kN
/mm
) Experimental𝑓𝑓𝑡𝑡=0.2𝑓𝑓𝑡𝑡=0.3𝑓𝑓𝑡𝑡=0.4𝑓𝑓𝑡𝑡=0.5
153

Chapter 6 Calibration of material parameters of masonry wall
Figure 6.22 Influence of tensile strength and normal stiffness of brick-mortar
interface on the first stage of masonry wall
Figure 6.23 Influence of normal stiffness and tensile strength of brick-mortar
interface on the first stage of masonry wall
According to Figures 6.22 and 6.23, it can be concluded that the value of the
tensile strength of the interface is between 0.22 to 0.25𝑁𝑁/𝑚𝑚𝑚𝑚2 , and the
11.5
12.5
13.5
14.5
0.2 0.25 0.3 0.35 0.4
Stiff
ness
(kN
/mm
)
Tensile strength (𝑁𝑁/𝑚𝑚𝑚𝑚2)
Experimental
11.5
12
12.5
13
13.5
14
14.5
11 11.5 12 12.5 13
Experimental𝑓𝑓𝑡𝑡=0.2
Normal stiffness (𝑁𝑁/𝑚𝑚𝑚𝑚3)
Stiff
ness
(kN
/mm
)
𝑓𝑓𝑡𝑡=0.25𝑓𝑓𝑡𝑡=0.3𝑓𝑓𝑡𝑡=0.35𝑓𝑓𝑡𝑡=0.4
154
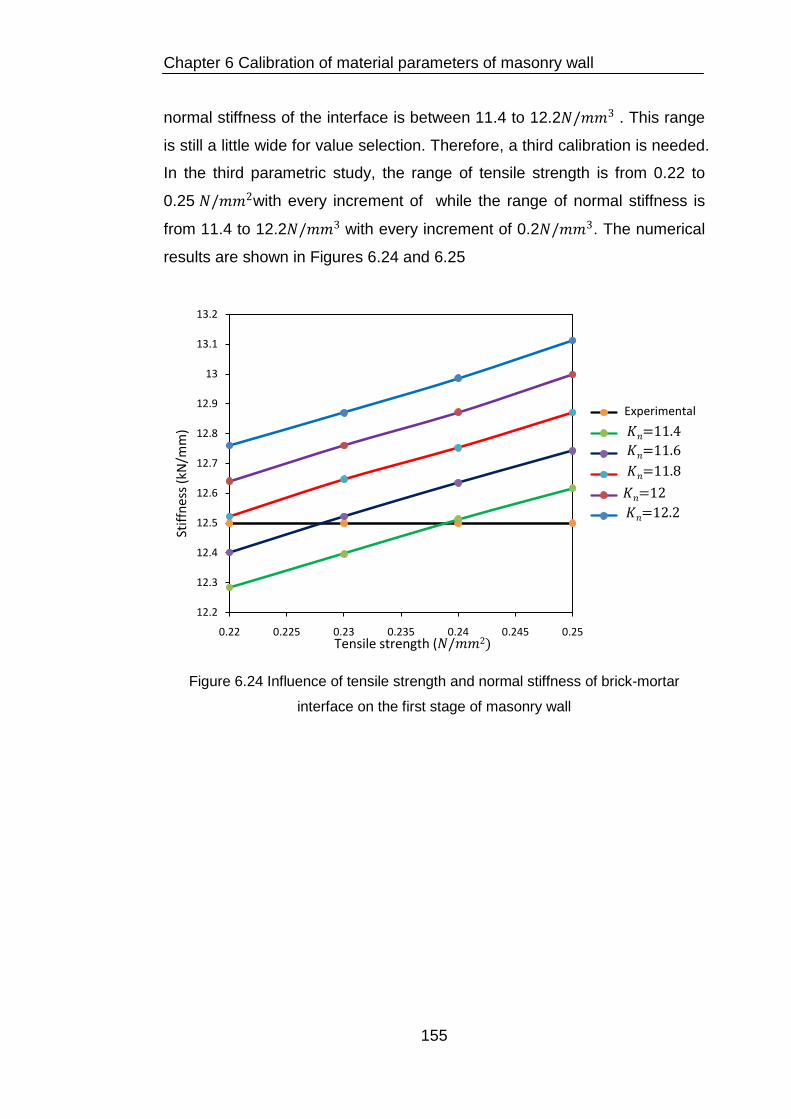
Chapter 6 Calibration of material parameters of masonry wall
normal stiffness of the interface is between 11.4 to 12.2𝑁𝑁/𝑚𝑚𝑚𝑚3 . This range
is still a little wide for value selection. Therefore, a third calibration is needed.
In the third parametric study, the range of tensile strength is from 0.22 to
0.25 𝑁𝑁/𝑚𝑚𝑚𝑚2with every increment of while the range of normal stiffness is
from 11.4 to 12.2𝑁𝑁/𝑚𝑚𝑚𝑚3 with every increment of 0.2𝑁𝑁/𝑚𝑚𝑚𝑚3. The numerical
results are shown in Figures 6.24 and 6.25
Figure 6.24 Influence of tensile strength and normal stiffness of brick-mortar
interface on the first stage of masonry wall
12.2
12.3
12.4
12.5
12.6
12.7
12.8
12.9
13
13.1
13.2
0.22 0.225 0.23 0.235 0.24 0.245 0.25
Stiff
ness
(kN
/mm
)
Tensile strength (𝑁𝑁/𝑚𝑚𝑚𝑚2)
Experimental𝐾𝐾𝑛𝑛=11.4𝐾𝐾𝑛𝑛=11.6𝐾𝐾𝑛𝑛=11.8𝐾𝐾𝑛𝑛=12𝐾𝐾𝑛𝑛=12.2
155

Chapter 6 Calibration of material parameters of masonry wall
Figure 6.25 Influence of normal stiffness and tensile strength of brick-mortar
interface on the first stage of masonry wall
Figures 6.24 and 6.25 reveal that the value of the tensile strength of the
masonry wall is between 0.228 to 0.24𝑁𝑁/𝑚𝑚𝑚𝑚2, and the normal stiffness is
between 11.55 to 11.8𝑁𝑁/𝑚𝑚𝑚𝑚3 . Taken as an average of them, the tensile
strength is 0.235𝑁𝑁/𝑚𝑚𝑚𝑚2 and the normal stiffness is 11.7𝑁𝑁/𝑚𝑚𝑚𝑚3 . The
obtained parameters are shown in Table 6.5:
Table 6.5 Calibrated parameters of interface Parameter Symbol Value
Normal stiffness(𝑁𝑁/𝑚𝑚𝑚𝑚3) 𝐾𝐾𝑛𝑛 11.7
Shear Stiffness (𝑁𝑁/𝑚𝑚𝑚𝑚3) 𝐾𝐾𝑠𝑠 5.1
Tensile strength (𝑁𝑁/𝑚𝑚𝑚𝑚2) 𝑓𝑓𝑡𝑡 0.235
12.2
12.3
12.4
12.5
12.6
12.7
12.8
12.9
13
13.1
13.2
11.4 11.6 11.8 12 12.2
Normal stiffness (𝑁𝑁/𝑚𝑚𝑚𝑚3)
Stiff
ness
(kN
/mm
) Experimental𝑓𝑓𝑡𝑡=0.22𝑓𝑓𝑡𝑡=0.23𝑓𝑓𝑡𝑡=0.24𝑓𝑓𝑡𝑡=0.25
156

Chapter 6 Calibration of material parameters of masonry wall
6.5.3 Stage two (Load re-distribution stage)
After the tensile strength and normal stiffness having been obtained, stage
two can be carried out. In this stage, four parameter, tan𝛷𝛷, tan𝛹𝛹, 𝐺𝐺𝑓𝑓𝐼𝐼and 𝐺𝐺𝑓𝑓𝐼𝐼𝐼𝐼
need to be characterized. It is assumed that 𝐺𝐺𝑓𝑓𝐼𝐼𝐼𝐼equals to 10𝐺𝐺𝑓𝑓𝐼𝐼 (Stavridis and
Shing 2008), therefore, only three parameters should be calibrated in the
simulation. Furthermore, the value of tan𝛷𝛷 is between 0.7 to 1.2 or the
friction angle ranges from 300 to 500, tan𝛹𝛹is between 0.2 to 0.7 or dilatancy
angle ranges from 100 to 300, and 𝐺𝐺𝑓𝑓𝐼𝐼𝐼𝐼 is between 0.01 o 0.25𝑁𝑁/𝑚𝑚𝑚𝑚2 .
Therefore, the selection of initial range has already been minimized.
The parametric study will be carried out with the friction angle increase of 50,
the increase of dilatancy angle is 12.50, and the increment of 𝐺𝐺𝑓𝑓𝐼𝐼𝐼𝐼 is 0.1𝑁𝑁/
𝑚𝑚𝑚𝑚2from 0.01 to 0.31𝑁𝑁/𝑚𝑚𝑚𝑚2. The parameters are shown in Table 6.6, the
rest are taken from Lourenco’s (1996) work and remained constant.
Table 6.6 Ranges of brick-mortar interface used in MIDAS Parameter Symbol Value
Con
stan
ts
Normal stiffness(𝑁𝑁/𝑚𝑚𝑚𝑚3) 𝐾𝐾𝑛𝑛 11.7
Shear Stiffness (𝑁𝑁/𝑚𝑚𝑚𝑚3) 𝐾𝐾𝑠𝑠 5.1
Tensile strength (𝑁𝑁/𝑚𝑚𝑚𝑚2) 𝑓𝑓𝑡𝑡 0.235
Cohesion (𝑁𝑁/𝑚𝑚𝑚𝑚2) C 0.329
Compressive strength (𝑁𝑁/𝑚𝑚𝑚𝑚2) 𝑓𝑓𝑚𝑚 8.5
Compressive fracture energy (𝑁𝑁/𝑚𝑚𝑚𝑚) 𝐺𝐺𝑓𝑓𝑐𝑐 5
Varia
bles
Mode I fracture energy (𝑁𝑁/𝑚𝑚𝑚𝑚) 𝑮𝑮𝒇𝒇𝑰𝑰 𝑮𝑮𝒇𝒇𝑰𝑰𝑰𝑰/10
Friction coefficient ϕ 30,35,40,45,50 Dilatancy coefficient Ψ 10,22.5,35 Mode II fracture energy (𝑁𝑁/𝑚𝑚𝑚𝑚) 𝑮𝑮𝒇𝒇𝑰𝑰𝑰𝑰 0.01,0.11,0.21,0.31
In stage two, the load and displacement at the re-distribution point is 57kN
and 4.85mm, respectively (Figure 4.14). After assigning the above
parameters in the model, the computational results are obtained and they
will be compared with the experimental results. For the first calibration, the
results are presented in Figures 6.26, 6.27 and 6.28.
157

Chapter 6 Calibration of material parameters of masonry wall
(a). Influence on the load
(b). Influence of on the displacement
Figure 6.26 Influence of Mode II fracture energy on stage two
40
45
50
55
60
65
70
75
0.1 0.15 0.2 0.25 0.3
Φ=50, Ψ=35
Φ=45, Ψ=35
Φ=40, Ψ=35
Φ=50, Ψ=22.5
Φ=45, Ψ=22.5
Φ=35, Ψ=35
Φ=50, Ψ=10
Φ=45, Ψ=10
Φ=40, Ψ=22.5Φ=40, Ψ=10
Φ=35, Ψ=22.5
Φ=35, Ψ=10Experimental
Mode II fracture energy (N/mm)
Load
(kN
)
3
3.5
4
4.5
5
5.5
6
6.5
0.1 0.15 0.2 0.25 0.3Mode II fracture energy (N/mm)
Disp
lace
men
t (m
m)
Φ=50, Ψ=35
Φ=45, Ψ=35
Φ=40, Ψ=35
Φ=50, Ψ=22.5
Φ=45, Ψ=22.5
Φ=35, Ψ=35
Φ=50, Ψ=10
Φ=45, Ψ=10
Φ=40, Ψ=22.5Φ=40, Ψ=10
Φ=35, Ψ=22.5Φ=35, Ψ=10Experimental
158

Chapter 6 Calibration of material parameters of masonry wall
(a). Influence on the load
(b). Influence on the displacement
Figure 6.27 Influence of dilatancy angle on stage two
40
45
50
55
60
65
70
75
10 15 20 25 30 35Dilatancy angle
Load
(kN
)
3
3.5
4
4.5
5
5.5
6
6.5
10 15 20 25 30 35Dilatancy angle
Disp
lace
men
t(m
m)
159

Chapter 6 Calibration of material parameters of masonry wall
(a). Influence on the load
(b). Influence on the displacement
Figure 6.28 Influence of friction angle on stage two
Based on Figure 6.26 (a) and (b), it can be concluded that the value of Mode
II fracture energy ranges from 0.15 to 0.25. Similarly, it can be obtained from
40
45
50
55
60
65
70
75
35 40 45 50
Friction angle
Load
(kN
)
3
3.5
4
4.5
5
5.5
6
6.5
35 40 45 50Friction angle
Disp
lace
men
t(m
m)
160

Chapter 6 Calibration of material parameters of masonry wall
Figure 6.27 (a) and (b) that the value of dilatancy angle ranges from 22 to 28.
Figure 6.28 (a) and (b) reveal that the value of friction angle ranges from 400
to 450.
As the value still lies between wide ranges for each parameter, a second
calibration is needed. The same procedure needs to be repeated and the
results are displayed in Figures 6.29, 6.30 and 6.31.
(a). Influence on the load
49
51
53
55
57
59
61
0.15 0.17 0.19 0.21 0.23 0.25Mode II fracture energy (N/mm)
Load
(kN
)
Φ=45, Ψ=30
Φ=42.5, Ψ=30
Φ=40, Ψ=30
Φ=45, Ψ=26
Φ=42.5, Ψ=26
Φ=45, Ψ=22
Φ=42.5, Ψ=22
Φ=40, Ψ=26
Φ=40, Ψ=22
Experimental
161

Chapter 6 Calibration of material parameters of masonry wall
(b). Influence on the displacement
Figure 6.29 Influence of Mode II fracture energy on stage two
(a). Influence on the load
3.5
3.7
3.9
4.1
4.3
4.5
4.7
4.9
5.1
5.3
5.5
0.15 0.17 0.19 0.21 0.23 0.25Mode II fracture energy (N/mm)
Disp
lace
men
t (m
m)
Φ=45, Ψ=30
Φ=42.5, Ψ=30
Φ=40, Ψ=30
Φ=45, Ψ=26
Φ=42.5, Ψ=26
Φ=45, Ψ=22
Φ=42.5, Ψ=22
Φ=40, Ψ=26
Φ=40, Ψ=22
Experimental
48
50
52
54
56
58
60
62
22 24 26 28 30Dilatancy angle
Load
(kN
)
162
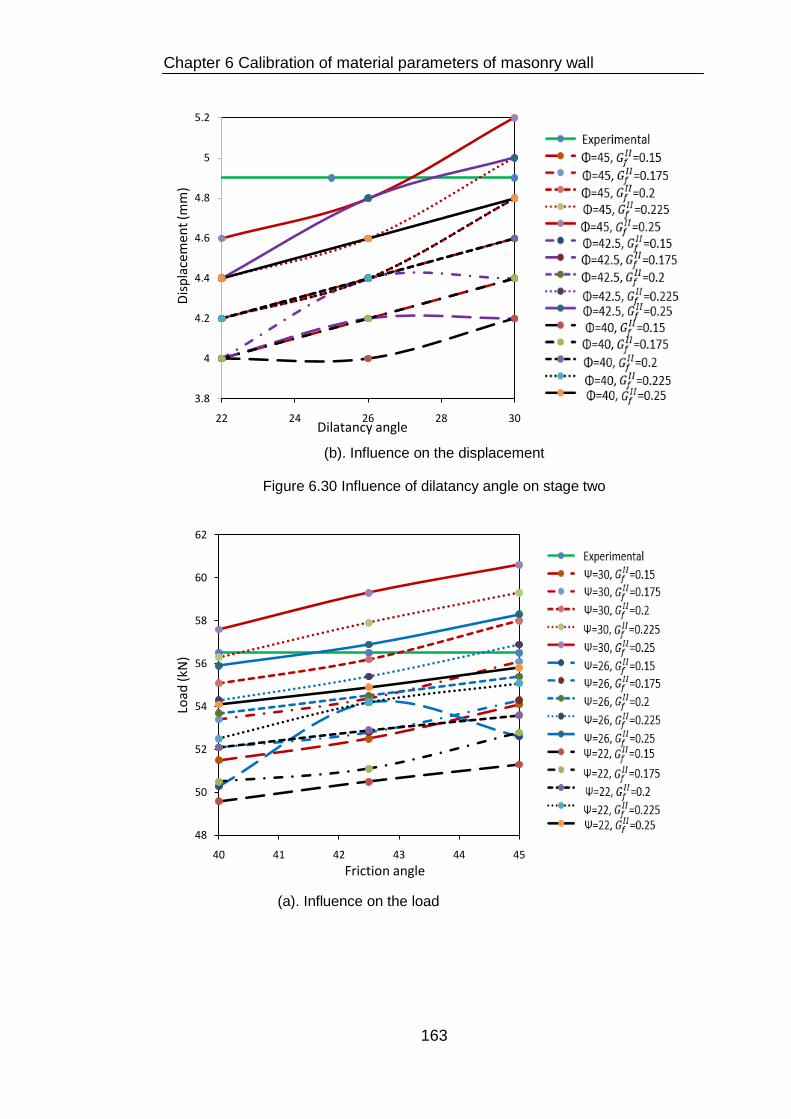
Chapter 6 Calibration of material parameters of masonry wall
(b). Influence on the displacement
Figure 6.30 Influence of dilatancy angle on stage two
(a). Influence on the load
3.8
4
4.2
4.4
4.6
4.8
5
5.2
22 24 26 28 30Dilatancy angle
Disp
lace
men
t(m
m)
48
50
52
54
56
58
60
62
40 41 42 43 44 45Friction angle
Load
(kN
)
163

Chapter 6 Calibration of material parameters of masonry wall
(b). Influence on the displacement
Figure 6.31 Influence of dilatancy angle on stage two
According to Figure 6.29 (a) and (b), it can be concluded that the value of
Mode II fracture energy is between 0.21 to 0.24 with an average value of
0.225. From Figure 6.30 (a) and (b), it can be observed that the value of
dilatancy angle is between 270 and 280 with its average value as 27.50.
Similarly, it can be obtained from Figure 6.31 (a) and (b) that the value of
friction angle is between 41.50 and 43.50 with the average value of 42.50. So
far, the obtained parameters are shown in Table 6.7.
Table 6.7 Calibrated parameters of the interface Parameter Symbol Value
Normal stiffness(𝑁𝑁/𝑚𝑚𝑚𝑚3) 𝐾𝐾𝑛𝑛 11.7
Shear Stiffness (𝑁𝑁/𝑚𝑚𝑚𝑚3) 𝐾𝐾𝑠𝑠 5.1
Tensile strength (𝑁𝑁/𝑚𝑚𝑚𝑚2) 𝑓𝑓𝑡𝑡 0.235
Mode I fracture energy (𝑁𝑁/𝑚𝑚𝑚𝑚) 𝐺𝐺𝑓𝑓𝐼𝐼 0.0225
Cohesion (𝑁𝑁/𝑚𝑚𝑚𝑚2) C 0.329
Friction coefficient ϕ 42.5
Dilatancy coefficient Ψ 27.5
Mode II fracture energy (𝑁𝑁/𝑚𝑚𝑚𝑚) 𝐺𝐺𝑓𝑓𝐼𝐼𝐼𝐼 0.225
3.9
4.1
4.3
4.5
4.7
4.9
5.1
5.3
40 41 42 43 44 45
Friction angle
Disp
lace
men
t(m
m)
164

Chapter 6 Calibration of material parameters of masonry wall
6.5.4 Stage three (Failure stage)
After the tensile strength and normal stiffness were obtained in stage one,
and friction angle, dilatancy angle, Mode I fracture and Mode II fracture
energy were obtained in stage two, the calibration work on stage three can
be carried out. In this stage, only two parameters, compressive strength and
compressive fracture energy need to be characterized. The parametric study
will be carried out with the variables shown in Table 6.8.
In this stage, the maximum load and displacement of masonry wall at failure
point is 69kN and 8.2mm, respectively. The numerical results of calibration
work will be compared with the experimental results, which are displayed in
Figures 6.32 and 6.33.
Table 6.8 Ranges of brick-mortar interface used in MIDAS Parameter Symbol Value
Con
stan
ts
Normal stiffness(𝑁𝑁/𝑚𝑚𝑚𝑚3) 𝐾𝐾𝑛𝑛 11.7
Shear Stiffness (𝑁𝑁/𝑚𝑚𝑚𝑚3) 𝐾𝐾𝑠𝑠 5.1
Tensile strength (𝑁𝑁/𝑚𝑚𝑚𝑚2) 𝑓𝑓𝑡𝑡 0.235
Mode I fracture energy (𝑁𝑁/𝑚𝑚𝑚𝑚) 𝐺𝐺𝑓𝑓𝐼𝐼 0.0225
Cohesion (𝑁𝑁/𝑚𝑚𝑚𝑚2) C 0.329
Friction coefficient ϕ 42.5
Dilatancy coefficient Ψ 27.5
Mode II fracture energy (𝑁𝑁/𝑚𝑚𝑚𝑚) 𝐺𝐺𝑓𝑓𝐼𝐼𝐼𝐼 0.225
Varia
bles
Compressive strength (𝑁𝑁/𝑚𝑚𝑚𝑚2) 𝒇𝒇𝒄𝒄 1, 5,10, 20, 40
Compressive fracture energy (𝑁𝑁/𝑚𝑚𝑚𝑚) 𝑮𝑮𝒇𝒇𝒄𝒄 1, 2.5, 5, 10, 20
165

Chapter 6 Calibration of material parameters of masonry wall
(a) Influence on the load
(b) Influence on the displacement
Figure 6.32 Influence of compressive fracture energy on the masonry wall
0
10
20
30
40
50
60
70
80
0 5 10 15 20 25 30Compressive fracture energy (N/mm)
Load
/kN
𝑓𝑓𝑚𝑚=1𝑓𝑓𝑚𝑚=5𝑓𝑓𝑚𝑚=10𝑓𝑓𝑚𝑚=20
Experimental
0
2
4
6
8
10
12
0 5 10 15 20 25 30
𝑓𝑓𝑚𝑚=1𝑓𝑓𝑚𝑚=5𝑓𝑓𝑚𝑚=10
𝑓𝑓𝑚𝑚=20
Experimental
Compressive fracture energy (N/mm)
Disp
lace
men
t (m
m)
166

Chapter 6 Calibration of material parameters of masonry wall
(a). Influence on the load
(b). Influence on the displacement
Figure 6.33 Influence of the compressive strength on the masonry wall
Based on Figure 6.32 (a) and (b), the value of the compressive fracture
energy ranges from 5 to 10. Similarly for Figure 6.33 (a) and (b), it can be
concluded that the value of the compressive strength ranges from 5 to 10. A
0
10
20
30
40
50
60
70
80
0 2 4 6 8 10 12 14 16 18 20
Compressivestrength (N/mm2)
Load
/kN
0
2
4
6
8
10
12
0 5 10 15 20
Disp
lace
men
t(m
m)
Compressive strength (N/mm2)
167

Chapter 6 Calibration of material parameters of masonry wall
finer calibration is needed. The results of the finer calibration are shown in
Figures 6.34 and 6.35.
(a) Influence on the load
(b) Influence on the displacement
Figure 6.34 Influence of compressive fracture energy on the masonry wall
50
55
60
65
70
75
80
5 6 7 8 9 10 11 12 13
Compressive fracture energy (N/mm)
Load
/kN
4
5
6
7
8
9
10
11
5 6 7 8 9 10 11 12 13Compressive fracture energy (N/mm)
Disp
lace
men
t (m
m)
𝑓𝑓𝑚𝑚=9𝑓𝑓𝑚𝑚=8𝑓𝑓𝑚𝑚=7𝑓𝑓𝑚𝑚=6
Experimental
𝑓𝑓𝑚𝑚=5
168

Chapter 6 Calibration of material parameters of masonry wall
(a). Influence on the load
(b). Influence on the displacement
Figure 6.35 Influence of compressive strength on the masonry wall
Based on Figures 6.34 (a) and (b), it can be concluded that the value of the
compressive fracture energy can be any number between 5 and 10𝑁𝑁/𝑚𝑚𝑚𝑚,
as any number among this range does not have a remarkable influence on
the failure load or displacement. According to the literature review, was
selected. In Figures 6.35 (a) and (b), it can be obtained that the value of the
compressive strength lies between 7 to 8, and the average value can be
taken as 7.5 𝑁𝑁/𝑚𝑚𝑚𝑚2.
50
55
60
65
70
75
80
5 6 7 8 9 10Compressive strength (N/mm2)
Load
/kN
4
5
6
7
8
9
10
11
5 6 7 8 9 10Compressive strength (N/mm2)
Disp
lace
met
n (m
m)
169

Chapter 6 Calibration of material parameters of masonry wall
6. 6 Discussion of the calibration
In this chapter, the calibration of the material parameters has been carried
out, and the detailed process of the calibration work is displayed in Figure
6.1. In the modelling work, some parameters, like elastic modulus and
Poisson's ratio, have be acquired from tests on small specimens. However,
for the parameters that are not able to or difficult to obtain via experimental
tests on small samples, such as normal/shear stiffness and mode I/II
fracture energy, are calibrated by using the above method.
The calibration method used in this research has its own characteristics.
First of all, the calibration work was carried out based on the experimental
result, which means that the calibration result agrees with the experimental
one. Thus the reliability of the result is improved. The practicability will be
proved in Chapter 6. Secondly, the sensitivity study of each parameter has
been conducted and all the parameters have been categorized according to
the sensitivity result. The aim of this process was trying to find out the most
significantly influential parameter on each stage. In this research, all the
parameters are divided into three groups, which is shown in Section 6.4.2.
The influence of each group is demonstrated in Figures 6.17, 6.18 and 6.19.
The figures clearly shows that the parameters in Group one only have
remarkable influence on stage one, and they don't have much influence on
other stages. Same findings are found in the parameters in Groups two and
three. Therefore, this calibration work has decreased and minimized the
interaction effect of parameters in different groups. For example, it is
unnecessary to consider the interaction between the parameters in Group
one and Group two as the numerical result doesn't change much. Thirdly,
the calibration work was carried out manually, which is simple and easy to
carry out. From the literature review, it is known that the failure process of
masonry wall follows the failure process showed in this research. It always
starts from small cracks appeared on masonry wall, to big cracks occurred
and then to fail finally. Similarly experimental result was found as well in the
170

Chapter 6 Calibration of material parameters of masonry wall
work of Sarhosis (2012). Therefore, this same process can be extended and
applied to other research conducted on masonry panels.
However, this method has its own shortcomings, which need to be
overcome and improved in further research. First of all, the calibration work
is cumbersome and time consuming because of its manual operation. Other
method, for example, optimization using software Altair Hyperstudy, could
be applied. Secondly, the interaction of each parameter in each group has
not been carried out. Though the parameters in one group do not have
significant influence on the parameters in different groups, the interaction
effect between each parameter within the same group is not known yet.
Therefore, further work on the interaction between each parameter within
the same group should be carried out in order to obtain more a accurate
calibration result.
In order to apply this method used in this research, the researchers should
follow the recommended process: (1) To obtain the parameters which can
be obtained via experimental tests on small specimens. The experimental
calibration could save much calibration work and time. (2). Divide the
parameters into different categories, which is based on the sensitivity study.
The sensitivity study investigates the influence of each parameter on the
whole masonry wall. Thus the parameters that have the same influence can
be categorized into the same group. (3)Then the calibration work can be
carried out as demonstrated in Section 6.5. (4) Assign the calibrated
parameters back to the finite element model to determine the accuracy of
the calibration results.
6. 7 Summary
The model proposed in Chapter 5 has been implemented in this chapter in
order to calibrate the unknown parameters. First of all, the sensitivity study
of each parameter has been carried out first in order to know the influence of
171

Chapter 6 Calibration of material parameters of masonry wall
the parameters on the whole wall. The sensitivity study shows that different
parameters influence the masonry wall in different stage and therefore they
can be divided into three stages. In the first stage, which is elastic stage,
only normal/shear stiffness and tensile strength have a big influence on the
whole behaviour and only these two parameters need to be calibrated. For
the second stage, which is the stress-redistribution stage, parameters
friction angle, dilatancy angle, cohesion, mode I fracture energy and mode II
fracture energy need to be calibrated. While for the final stage, i.e. failure
stage, only compressive strength and compressive fracture energy need to
be calibrated. After that, the calibration work on each parameter can be
carried out and the detailed process has been described in Section 6.5. After
the calibration study had been carried out in the above sections, all the
parameters were obtained and listed in Table 6.9. These parameters will be
assigned to single-leaf wall 3 in Chapter 7 to reproduce the experimental
results, as well as the collar jointed wall to validate its applicability.
Table 6.9 Calibrated parameters of interface Parameter Symbol Value
Normal stiffness 𝐾𝐾𝑛𝑛 (𝑁𝑁/𝑚𝑚𝑚𝑚3) 11.7
Shear Stiffness 𝐾𝐾𝑠𝑠 (𝑁𝑁/𝑚𝑚𝑚𝑚3) 5.1
Tensile strength ( 𝑓𝑓𝑡𝑡𝑁𝑁/𝑚𝑚𝑚𝑚2) 0.235
Mode I fracture energy 𝐺𝐺𝑓𝑓𝐼𝐼 (𝑁𝑁/𝑚𝑚𝑚𝑚) 0.0225
Cohesion C (𝑁𝑁/𝑚𝑚𝑚𝑚2) 0.329
Friction coefficient ϕ 42.5
Dilatancy coefficient Ψ 27.5
Mode II fracture energy 𝐺𝐺𝑓𝑓𝐼𝐼𝐼𝐼 (𝑁𝑁/𝑚𝑚𝑚𝑚) 0.225
Compressive strength 𝑓𝑓𝑐𝑐 (𝑁𝑁/𝑚𝑚𝑚𝑚2) 7.5
Compressive fracture energy 𝐺𝐺𝑓𝑓𝑐𝑐 (𝑁𝑁/𝑚𝑚𝑚𝑚) 5
Bric
k cr
ack
Normal stiffness 𝑘𝑘𝑏𝑏𝑛𝑛 (𝑁𝑁/𝑚𝑚𝑚𝑚3) 1000
Shear stiffness 𝑘𝑘𝑏𝑏𝑠𝑠 (𝑁𝑁/𝑚𝑚𝑚𝑚3) 435
Tensile strength 𝑓𝑓𝑏𝑏𝑡𝑡 (𝑁𝑁/𝑚𝑚𝑚𝑚2) 2
Tensile fracture energy 𝐺𝐺𝑓𝑓𝑏𝑏𝑡𝑡 (𝑁𝑁/𝑚𝑚𝑚𝑚) 0.08
172

Chapter 7 Computational work of masonry walls
Chapter 7 Computational work of masonry walls
7. 1 Introduction
In this chapter, the validity of the material parameters obtained in Chapter 6
will be checked against the experimental tests presented in Chapter 3 and 4.
These masonry walls are: (a) single-leaf masonry wall panel; (b) pre-
damaged masonry wall panel; and (c) post-damaged masonry wall panel.
The masonry wall is created in MIDAS FEA using linear elastic solid
elements to represent bricks and zero thickness non-linear interface
elements to represent brick-mortar interface. In Midas FEA, there is an
inherent material called ‘combined-cracking-shearing-crushing’, which is
used to represent the non-linear behaviour of the brick-mortar interfaces.
This material model has been explained in Chapter 5. All the solid elements
are considered elastic and isotropic. As the parameters of a single-leaf wall
were characterized in Chapter 6, the assigned parameters here are selected
straightforward and the numerical result will be compared with the
experimental result in order to demonstrate the ability of the model to
capture the behaviour observed in the experiments. Furthermore, these
parameters will be extended and applied to the double-leaf (collar jointed)
wall panels to predict their behaviour.
7. 2 Single-leaf wall panel
7.2.1 Generation of model in MIDAS FEA
For the single-leaf wall, a 2D micro model was developed. As the single-leaf
wall is taken as isotropic in the out-of-plane direction, 2D modelling can still
173

Chapter 7 Computational work of masonry walls
obtain a good numerical result. For the numerical analysis, units are
represented by plane stress continuum elements. While line interface
elements are adopted for the brick-mortar interfaces as well as the potential
vertical cracks in the middle part of the unit. The base was simulated as
fixed to replicate the restraint by the frame. The left-top corner of the
specimen was allowed to move only along the horizontal axis and a perfect
vertical constraint by the relevant actuator was assumed. The idealised
numerical model is presented in Figure 7.1, which clearly demonstrates the
matching of the geometries with the physical model. Figure 7.2 represents
the single-leaf model implemented in MIDAS FEA.
Figure 7.1 The validation 2D model in MIDAS FEA
174

Chapter 7 Computational work of masonry walls
Figure 7.2 Numerical model of single-leaf wall implemented in MIDAS FEA
7.2.2 Model material parameters
In Chapter 6, each parameter has been characterized, and the values have
been obtained, and are shown in the Table 6.9 in Chapter 6. The
parameters will be applied in this model to simulate the single-leaf wall panel.
Also please note that the self-weight of the wall was not considered in this
research.
7.2.3 Numerical results
After assigning the parameters, the numerical results are obtained. The
comparison of numerical and experimental results are presented in Figure
7.3, 7.4 and 7.5.
175

Chapter 7 Computational work of masonry walls
Figure 7.3 illustrates the comparison of the load-deflection relationship of the
experimental and numerical results. Figures 7.4 and 7.5 display the
experimental and numerical failure patterns of single-leaf wall panel. From
Figure 7.3, both the experimental and numerical results display that there
are three notable stages for the mechanical behaviour of the single-leaf
masonry wall:
(1) A linearly elastic stage before it reached its load-redistribution point;
followed by (2) load-redistribution stage where big cracks were formed by
connecting small cracks together; and (3) failure stage where the masonry
wall reached its maximum load capacity. However, there is a big difference
after the peak stage. The reason for the difference can be explained. For the
experimental result, the loading and deflection was recorded by a hydraulic
actuator and a LVDT.
The failure of the masonry wall is brittle and sudden, therefore, the deflection
change can be very remarkable in a very short time. Only the behaviour
before the peak stage should be compared. Both the experimental and
numerical results clearly indicate that the simplified micro-scale modelling
could simulate the masonry wall very well. The crack pattern follows the
experimental result, which starts from the top-left corner leading to the
bottom-right corner. For the loaded corners, it can be seen that there are
some brick units penetrate into each other. This is due to the reasons: (1)
The explanation provided by the MIDAS Group that the penetration
represents the brick crushing, which can also be seen in Figure 7.5. The
crush of the brick unit in the masonry wall panel is now being simulated as
well. (2) In order to have a more clearly read on the deformed shape, the
deformation of the masonry wall pane has been magnified, therefore, the
penetration effect looks much more significant. The comparison of Figures
7.4 and 7.5 reveal that the crack patterns and the development of crack at
different stages of the masonry wall can be obtained via numerical model.
By applying this interface element in the simplified micro-scale FE model,
176

Chapter 7 Computational work of masonry walls
the mechanical behaviour of masonry wall panel has been simulated very
well.
Figure 7.3 Load-deflection relationship of single-leaf masonry wall W3
0
10
20
30
40
50
60
70
80
0 5 10 15 20 25Deflection/mm
Load
/kN
Experimental
Numerical
177

Chapter 7 Computational work of masonry walls
Figure 7.4 Numerical deformation of single-leaf wall W3 at deflection of 7mm
Figure 7.5 Experimental deformation of single-leaf wall W3
7. 3 Double-leaf wall panel (pre-damaged type)
7.3.1 Generation of model in MIDAS
The numerical validation of the double-leaf wall scenario has been
implemented through a simplified micro-scale 3D model; this is a
prerequisite for accurately considering the mechanical behaviour of the
collar-joint, which naturally introduces the depth dimension. The behaviour
of this joint is decisive to the overall behaviour of the panel. It should be
noted that the cape mode is not included in 3D modelling in MIDAS FEA.
Similarly to the brick mortar joints, the collar joint was smeared into an
interfacial element for the purposes of this study. This is because the two
leaves connected by the collar joint have the same geometry and property,
just like two bricks connected by a mortar joint. All the other elements,
178

Chapter 7 Computational work of masonry walls
including the brick units, mortar joints and potential brick cracks are exactly
the same with the single-leaf wall. The boundary conditions for the first leaf
remained identical to the single-leaf wall case while for the second leaf wall,
no other restriction apart from the base being fixed was prescribed. The
illustration of the numerical model is given in Figure 7.6, which can be
compared to the previous single-leaf wall for identifying all changes. Figure
7.7 represents the double-leaf model implemented in MIDAS FEA.
Figure 7.6 The validation 3D model in MIDAS FEA
179

Chapter 7 Computational work of masonry walls
Figure 7.7 Numerical model of double-leaf wall implemented in MIDAS FEA
7.3.2 Model material
The construction material and curing age for the first and second leaf are the
same. Though the properties of the two leaves may vary because of their
inherent variation in materials and workmanship, it is still assumed that they
are the same. Therefore, the material parameters applied to single-leaf wall
can be directly assigned to the pre-damaged masonry wall, as the
construction of the collar jointed masonry wall used the same materials as
the single-leaf masonry wall and the curing age was also the same.
Therefore, the parameters obtained from Chapter 6 can also be used in the
simulation of the collar jointed masonry wall, shown as Collar Joint 1 in
Table 7.1. However, the geometry and boundary conditions of the collar joint
are different to the mortar joints. Therefore, the properties of collar joint may
be different. In order to determine the influence of the collar joint on the
mechanical behaviour of whole wall, another two types of collar joints are
assumed, their properties being taken as 0.8 and 1.2 time here of the initial
180
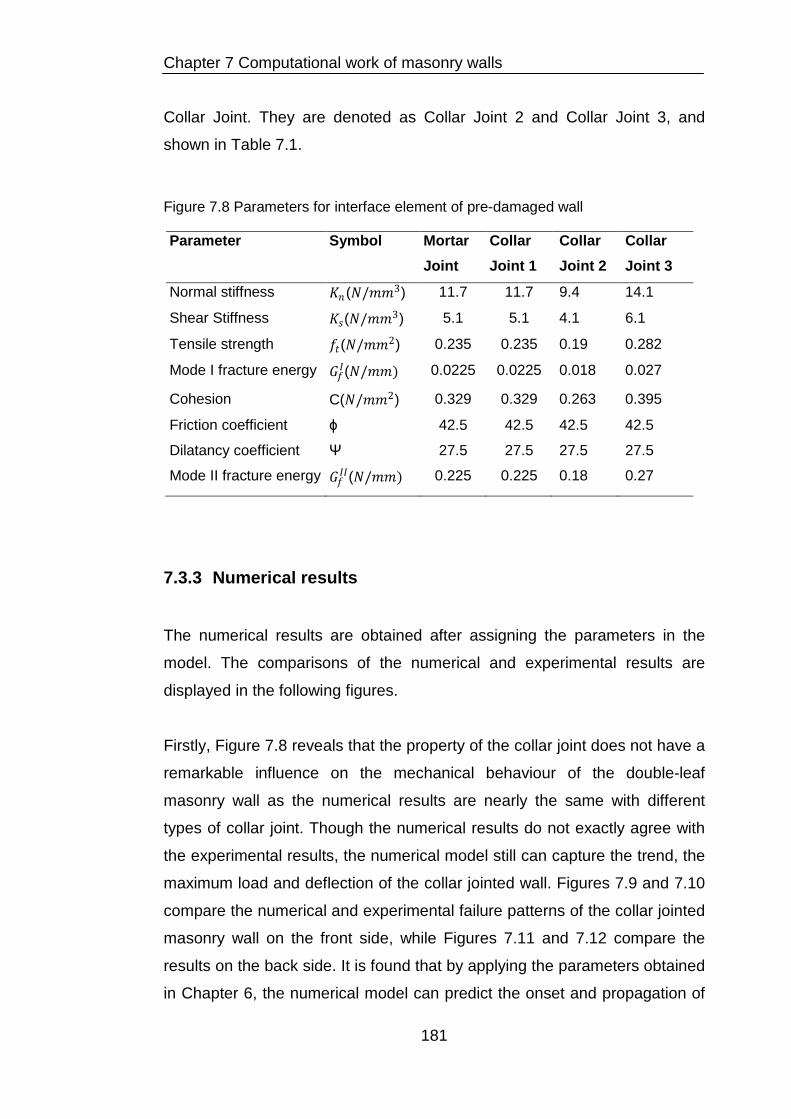
Chapter 7 Computational work of masonry walls
Collar Joint. They are denoted as Collar Joint 2 and Collar Joint 3, and
shown in Table 7.1.
Figure 7.8 Parameters for interface element of pre-damaged wall
Parameter Symbol Mortar Joint
Collar Joint 1
Collar Joint 2
Collar Joint 3
Normal stiffness 𝐾𝐾𝑛𝑛 (𝑁𝑁/𝑚𝑚𝑚𝑚3) 11.7 11.7 9.4 14.1
Shear Stiffness 𝐾𝐾𝑠𝑠(𝑁𝑁/𝑚𝑚𝑚𝑚3) 5.1 5.1 4.1 6.1
Tensile strength 𝑓𝑓𝑡𝑡(𝑁𝑁/𝑚𝑚𝑚𝑚2) 0.235 0.235 0.19 0.282
Mode I fracture energy 𝐺𝐺𝑓𝑓𝐼𝐼(𝑁𝑁/𝑚𝑚𝑚𝑚) 0.0225 0.0225 0.018 0.027
Cohesion C(𝑁𝑁/𝑚𝑚𝑚𝑚2) 0.329 0.329 0.263 0.395
Friction coefficient ϕ 42.5 42.5 42.5 42.5
Dilatancy coefficient Ψ 27.5 27.5 27.5 27.5
Mode II fracture energy 𝐺𝐺𝑓𝑓𝐼𝐼𝐼𝐼(𝑁𝑁/𝑚𝑚𝑚𝑚) 0.225 0.225 0.18 0.27
7.3.3 Numerical results
The numerical results are obtained after assigning the parameters in the
model. The comparisons of the numerical and experimental results are
displayed in the following figures.
Firstly, Figure 7.8 reveals that the property of the collar joint does not have a
remarkable influence on the mechanical behaviour of the double-leaf
masonry wall as the numerical results are nearly the same with different
types of collar joint. Though the numerical results do not exactly agree with
the experimental results, the numerical model still can capture the trend, the
maximum load and deflection of the collar jointed wall. Figures 7.9 and 7.10
compare the numerical and experimental failure patterns of the collar jointed
masonry wall on the front side, while Figures 7.11 and 7.12 compare the
results on the back side. It is found that by applying the parameters obtained
in Chapter 6, the numerical model can predict the onset and propagation of
181

Chapter 7 Computational work of masonry walls
cracks in collar jointed masonry walls. Figure 7.13 demonstrates the failure
pattern of collar joint. It reveals that the collar joint of the pre-damaged
double leaf masonry wall fails slightly near the loaded corner. This agrees
with the experimental results displayed in Figure 4.12 in Chapter 4. Figures
7.14 and 7.15 illustrate the stress distribution of the double-leaf wall at the
deflection of 5mm. Figure 7.14 reveals that the combined quasi-static load
was passed to the base via the diagonal strut, which agrees with the
experimental findings presented in Section 4.3 in Chapter 4. Figure 7.15
shows that the stress on the second leaf is more evenly spread than the first
leaf, which means that the load was spread evenly to the second leaf from
the first leaf via collar joint. This helps the double-leaf wall carry more load
by reducing the stress concentration.
Figure 7.9 Load-deflection relationship of collar jointed masonry wall W4
0
10
20
30
40
50
60
70
80
90
100
0 2 4 6 8 10 12 14
Experimental results
Collar joint 1
Collar joint 2
Collar joint 3
Forc
e/kN
Deflection/mm
182

Chapter 7 Computational work of masonry walls
Figure 7.10 Numerical deformation of collar jointed wall W4 on the front side at
deflection of 8mm
Figure 7.11 Experimental deformation of collar jointed wall W4 on the front side
183

Chapter 7 Computational work of masonry walls
Figure 7.12 Numerical deformation of collar jointed wall W4 on the back side at
deflection of 8mm
Figure 7.13 Experimental deformation of collar jointed wall W4 on the back side
184

Chapter 7 Computational work of masonry walls
Figure 7.14 Failure patter of collar joint of numerical result
Figure 7.15 Stress distribution on the first leaf at deflection of 6mm
185

Chapter 7 Computational work of masonry walls
Figure 7.16 Stress distribution on the second leaf at deflection of 6mm
7. 4 Double-leaf wall (post-damaged type)
7.4.1 Generation of model in MIDAS
For the post-damaged masonry wall (previously named Wall 7) the damage
results introduced some interesting modelling idiosyncrasies. The existence
of some initial minute cracks in the first wall need also to be estimated
correctly if accurate behaviour is to surface from the modelling attempt. The
first leaf had already been tested and some initial cracks had occurred in the
wall. Based on the experimental observations (shown in Figure 7.16), a grid
of existing cracks was pre-defined. This is represented by red dashed lines
in Figure 7.17, showing the numerical implementation of the wall. By this
method, the cracks were assumed not to have any interaction. Although
there might be some residual friction among the bricks along the crack
186

Chapter 7 Computational work of masonry walls
trajectory, it is very difficult to determine the residual behaviour of the
interfaces as it is unable to see the cracks inside of the masonry wall.
Furthermore, the worst case, which means there is no residual friction
existed, should be considered in order to confirm the safety of post-
damaged retrofitting method. Therefore, for simplicity, it was assumed not to
have any friction or binding effect. However, for a more accurate modelling,
the assumption of different percentages of residual friction should be carried
out in further research or experimental inspection should be carried out on ti.
The rest unit-mortar interfaces are still modelled as discontinuous elements.
The boundary conditions and loading scheme were envisaged to be identical
to the previous double-leaf wall setup (i.e. pre-damaged wall).
Figure 7.17Cracks on first leaf in experimental results
187

Chapter 7 Computational work of masonry walls
Figure 7.18 Pre-defined cracks on first leaf in finite element modelling
7.4.2 Material model
For the post-damaged collar jointed masonry wall, the second leaf masonry
wall used the same material and cured at the same time as the single-leaf
and pre-damaged masonry wall. Therefore the property is taken as the
same with the single-leaf masonry wall. The ‘‘preliminary’’ leaf was
constructed first and cured for over 6 weeks, while the ‘‘secondary’’ leaf was
constructed later and cured only for 2 weeks. Therefore, the brick-mortar
interfaces in two leaves are totally different. As the ‘‘preliminary’’ wall has
been cured for a longer time than the ‘‘secondary’’ one, the strength
properties of the ‘‘preliminary’’ wall are expected to be naturally higher than
the properties of the ‘‘secondary’’ one. In this research, the property of the
interface element in the first leaf was taken as 1.2 times of the single-leaf
wall. The number was selected based on the characteristics of masonry
material as well as the literature review. The first leaf has been cured for 6
weeks, where the mortar joint has nearly reached its designed strength.
However, for the second leaf masonry wall panel was cured for only 14 days,
which has reached 70%-80% of its designed strength (based on the tests of
mortar cubes on small samples). However, for a more precise assumption,
experimental tests should be carried out in order to know the strength of
188

Chapter 7 Computational work of masonry walls
both first and second leaf masonry wall panel. The collar joint in the post-
damaged wall is modelled differently to the one in the pre-damaged walls. In
this model, the collar joint hasn’t been smeared out. This is because the
interface 1(interface between first leaf and collar joint) is different with the
interface 2 (interface between the second leaf and collar joint). The bond
strength of interface 2 is stronger because of the collar joint and the second
leaf were cured together, which can provide a better bond effect. This was
confirmed from the experimental results (Figure 4.13 in Chapter 4) where
the collar joint was still connected with the ‘‘secondary’’ wall. According to
the numerical results of the pre-damaged wall, the interface 2 can be taken
as the same with the second leaf. For the interface 1, the property can be
taken as much smaller than interface 2. Based on the above findings from
experiments as well as the literature review, the extended table of material
parameters are given in Table 7.2.
Figure 7.19 Parameters for interface element of post-damaged wall
Parameter 1st leaf mortar
2nd leaf mortar
Collar joint interface 1
Collar joint interface 2
Normal stiffness(𝑁𝑁/𝑚𝑚𝑚𝑚3) 14.5 11.7 8.5 11.7
Shear Stiffness (𝑁𝑁/𝑚𝑚𝑚𝑚3) 6 5.1 3.6 5.1
Tensile strength (𝑁𝑁/𝑚𝑚𝑚𝑚2) 0.28 0.235 0.16 0.235
Mode I fracture energy(𝑁𝑁/
𝑚𝑚𝑚𝑚)
0.027 0.0225 0.015 0.0225
Cohesion (𝑁𝑁/𝑚𝑚𝑚𝑚2) 0.4 0.329 0.23 0.329
Friction coefficient 0.75 0.75 0.75 0.75
Dilatancy coefficient 0.56 0.56 0.56 0.56
Mode II fracture energy(𝑁𝑁/
𝑚𝑚𝑚𝑚)
0.27 0.225 0.15 0.225
189

Chapter 7 Computational work of masonry walls
7.4.3 Numerical results
After assigning the parameters in the model, the numerical results are
produced and the comparisons of the numerical and experimental results
are displayed in the following figures.
In Figure 7.18, it reveals that the numerical model can capture the trend, the
maximum load and deflection of the post-damaged collar jointed masonry
Wall 7. Figures 7.19 and 7.20 compare the numerical and experimental
failure patterns of collar jointed wall on the front side, while Figures 7.21 and
7.22 compare the results on the rear. Figure 7.23 demonstrates the failure
patterns of the collar joint in the post-damaged masonry wall. It can be seen
that with the parameters obtained in Chapter 6 along with the estimated
parameters, the numerical model can predict the onset and propagation of
cracks in collar jointed masonry wall very well.
Figure 7.20 Load-deflection relationship of collar jointed masonry wall W7
0
10
20
30
40
50
60
70
80
0 2 4 6 8 10
Experimental result
Numerical result
Deflection/mm
Forc
e/kN
190

Chapter 7 Computational work of masonry walls
Figure 7.21 Numerical deformation of collar jointed wall W7 on the front side at
deflection of 6mm
Figure 7.22 Experimental deformation of collar jointed wall W7 on the front side
191
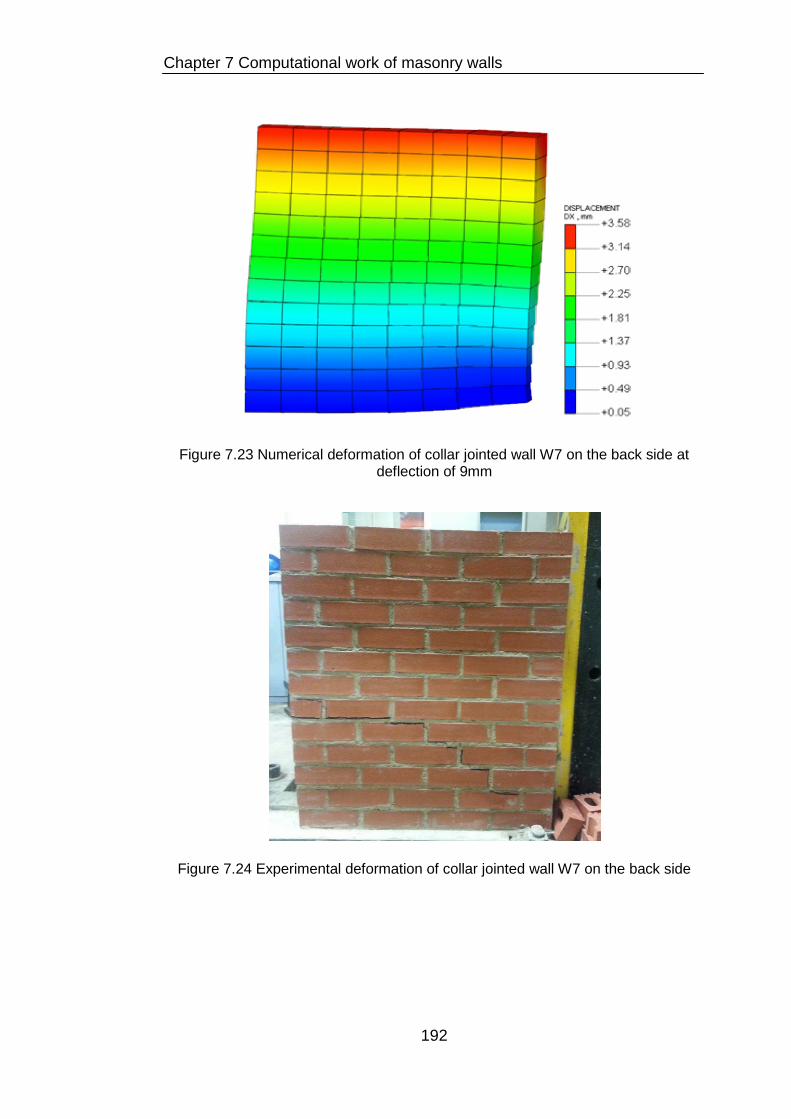
Chapter 7 Computational work of masonry walls
Figure 7.23 Numerical deformation of collar jointed wall W7 on the back side at
deflection of 9mm
Figure 7.24 Experimental deformation of collar jointed wall W7 on the back side
192

Chapter 7 Computational work of masonry walls
Figure 7.25 The failure pattern of collar joint
7. 5 Strain distribution (Comparison with DEMEC gauge readings)
The strain distribution of the single leaf Wall 3 is displayed in Figure 7.25,
and the double-leaf masonry Wall 4 in Figure 7.26. Compared with Figure
4.25 and 4.26 in Chapter 4, the strain distribution of numerical work agrees
with the experimental results. The strain distribution shows that the load
passed to the base via the diagonal strut.
Specifically, for the single-leaf wall, the strain of Point 1-2 is between 103 to
204 micro strains, while 70 to 128 micro strains for Point 1-5, which is in
agreement with the experimental results. For the double-leaf wall, the strain
of Point 6-7 and 6-10, are both between 36 to 105 micro strains, which falls
in line with the experimental results.
193

Chapter 7 Computational work of masonry walls
As the masonry is an anisotropic material, the numerical results won’t
exactly agree with the experimental results. However, the numerical work
still can prove that the DEMEC gauge points could experimentally represent
the stress and strain distribution of masonry wall in a quantitatively manner.
Figure 7.26Total von Mises strain distribution of single-leaf Wall 3 at the load of 40kN
194

Chapter 7 Computational work of masonry walls
Figure 7.27 Total von Mises strain distribution of double-leaf Wall 4 at the load of 40kN
7. 6 Summary
The simplified micro-scale finite element model proposed in Chapter 5 and
the parameters calibrated in Chapter 6 have been implemented to simulate
the masonry wall panels, including single-leaf and double-leaf, and good
agreement with the experimental result has been found. For different types
of masonry wall panels, different idiosyncrasies has been implemented. For
the single-leaf wall, a 2D modelling is applied while for the double-leaf wall,
3D modelling is needed. In terms of the double-leaf wall modelling, collar
joint could be smeared out in the pre-damaged wall as the interfaces
between collarjoint and the brick leave are the same. While for the post-
damaged wall, not only the collar joint should be taken into account, but also
the cracks occurred through the walls should also be considered. The
results proved that this numerical model is capable of simulating the
complex masonry material. Further masonry numerical work, including the
reinforced concrete frame infilled with masonry walls, could also be
195

Chapter 7 Computational work of masonry walls
conducted by this approach. In the following chapter, RC frame infilled with
masonry is conducted and the analysis of masonry infill has applied this
simplified micro-scale finite element model.
196

Chapter 8 Mechanical behaviour of masonry infilled RC frame
Chapter 8 Mechanical behaviour of masonry infilled RC frame
8. 1 Introduction
The masonry wall has been studied experimentally and numerically in the
previous chapters. In this chapter the author intends to extend the research
to masonry infill panels within RC frame structures as the masonry is also
often used as infill in the infilled RC frame to provide partitions. As the collar
jointed technique has been investigated and proved to be beneficial in bare
masonry wall panels, the author intends to extend the proposed method to
the infilled RC frame. The aim of this chapter is to investigate its influence on
the composite structure.
An infilled frame is a composite structure formed by the combination of a
moment resisting frame and infill walls (Pradhan et al. 2012). This building
system has been constructed all around the world, especially in the seismic
prone areas. In most infilled frames, the infills are made of masonry. Infill
walls are usually provided for functional and architectural reasons, such as
durable and economical partitions, and they are normally considered as non-
structural elements. On one hand, infilled frame structures have been
recognized to exhibit poor seismic performance as numerous buildings have
failed during earthquakes. On the other hand, it has been indicated from
experimental observations and analytical studies that masonry infills may
produce some beneficial effects on the response of the building. Therefore,
these contradictory conclusions indicate that masonry infilled frames exhibit
a poor or good performance depending on how the masonry is used in the
infilled RC structures.
197

Chapter 8 Mechanical behaviour of masonry infilled RC frame
8. 2 Brief literature review on infilled RC frame
This sections describes current knowledge about the behaviour and failure
mechanisms of masonry-infilled RC frames in order to give a basic
understanding on this type of structure.
The performance of masonry infilled RC frames has intrigued the interest of
many researchers worldwide in the past decades (Mehrabi et al. 1994,
Fardis et al. 1999). These studies indicated that the in-plane lateral
resistance of an infilled RC frame is usually greater than the sum of the
resistance of the masonry wall and the bare frame separately (Mainstone
1971). Similar results can be found in the work of Anil and Altin (2007). The
ductility of the infilled frame is larger than that of the unreinforced masonry
wall structures due to the composite action developed between panel and
frame (Zarnic and Tomazevic, 1988). In addition, the stiffness will be
increased because of the in-plane bracing action of the masonry panel, thus
reducing the lateral deformation when compared with that of the bare frame
(Crisafulli, 1997). Mehrabi et al (1996) confirmed that the stiffness and
strength of an infilled frame can be much greater compared to the bare
frame. However, the greatness depends both on the masonry panel and
surrounding frame. For the weak frame-weak panel structure, the stiffness is
about 15 times greater, while 50 times greater for the weak frame-strong
panel structure. For the resistance, it is 1.5 times and 2.3 times, greater
respectively. Nevertheless, the maximum resistance of strong frames were
increased by the weak and strong infills by factors of 1.4 and 3.2,
respectively.
The failure mechanisms of the masonry infilled frames are complex due to
the involvement of the high number of parameters in the mechanical
behaviour of the structure, such as the material property, configuration, and
relative stiffness of the frame to the infill, etc. (Sattar 2013). Stavridis (2009)
and Mehrabi (1994) have summarized the failure patterns as three main
mechanisms, and they are:
198

Chapter 8 Mechanical behaviour of masonry infilled RC frame
(i) Diagonal cracking in the infill with column shear failure or, more rarely,
plastic hinges in columns. This failure typically occurs in weak/non-
ductile frames with strong infill;
(ii) Horizontal sliding of the masonry with flexural or shear failure of the
columns. Infill crushing is sometimes observed in these tests. This
failure mechanism was observed in the weak frames with panels and
also in the strong and ductile frames with weak infill panels;
(iii) Infill corner crushing with flexural failure in the columns. This
mechanism is most likely to be found in strong and ductile frames
with strong infill.
Similarly, El-Dakhakhni et al. (2003) categorized the failure mechanisms of
masonry infilled RC frames into five distinct modes, i.e. (a) corner crushing
failure, which is associated with a strong frame with weak infill, (b) sliding
shear failure, associated with a weak mortar joint infill bounded with strong
frame, (c) diagonal compression failure, associated with slender flexible infill
walls, (d) diagonal cracking failure which is associated with a weak frame
with relatively strong infill and (e) a frame bending failure mode which is
associated with a weak frame with weak infill. The failure modes are
displayed in Figure 8.1.
Based on Figure 8.1, it should be noted that the failure modes of the
masonry infill restrained by a surrounding RC frame have some similarities
but also some differences compared with those found in the bare masonry
wall panels. Corner crushing, sliding shear and diagonal cracking are the
three most observed failure patterns in the bare masonry wall panels.
However, the diagonal compression failure is very rarely found in the bare
masonry wall panel.
199

Chapter 8 Mechanical behaviour of masonry infilled RC frame
Figure 8.1Different failure modes of the infilled frames: (a) corner curshing; (b)
sliding shear; (c) diagonal compression; (d) diagonal cracking; and (e) frame
bending failure (El-Dakhakhni et al. 2003)
In an infilled frame structure, infills can be provided fully or with openings
depending on the needs for provisions of partitions or for doors and windows.
Generally, there are four different types of frames: bare frame, fully infilled
frame, infilled with opening and partially infilled frame. Bare frames are rare
to see, as they are always to be filled with masonry or other partition
materials in order to prevent fire, provide soundproofing and other functions.
Some walls will be provided with openings (windows, doors) in terms of
different size, location and shape etc. to meet some certain requirements.
The partially infilled frames are the least frequently seen type. In some
buildings, like hospitals and academic institutions, partial infills are provided
in order to get more light in from outside. It was observed that such walls on
one hand contribute to enhancing the lateral stiffness of the structure while
on the other hand they play a role with an adverse effect called ‘’short
column effect’’. The term ‘‘short column effect’’ is defined as the effect
caused to the full storey slender column whose clear height is reduced by its
200
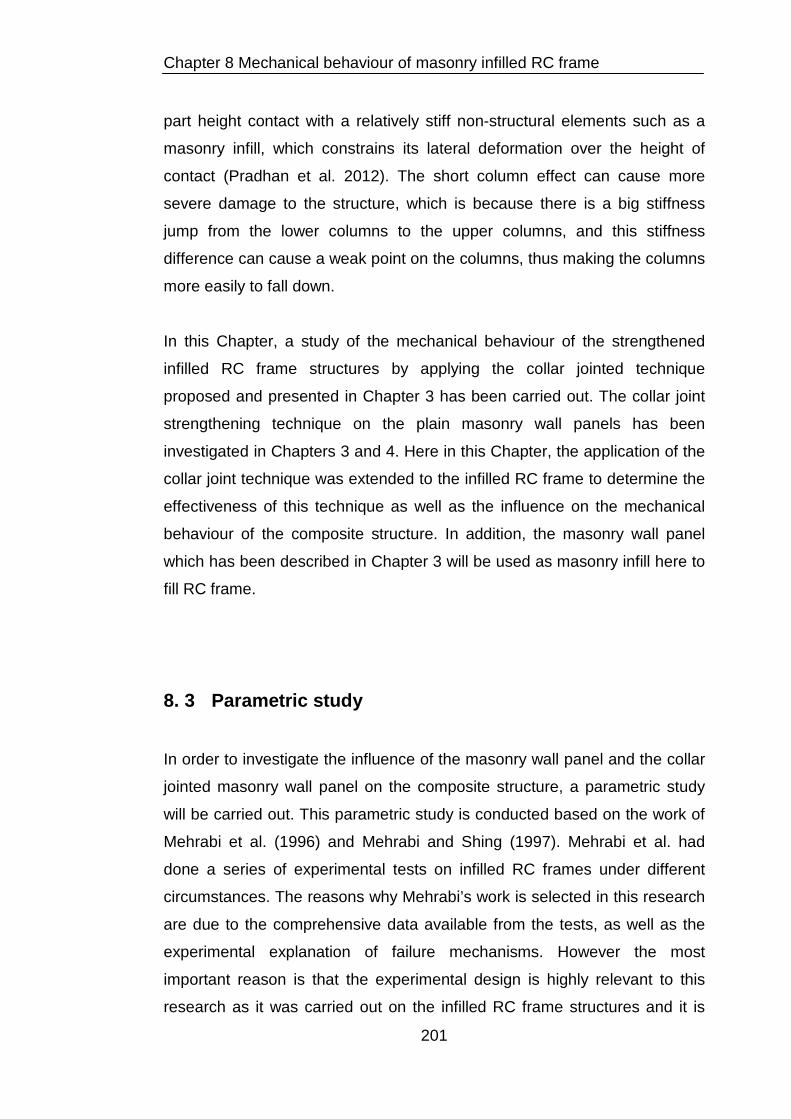
Chapter 8 Mechanical behaviour of masonry infilled RC frame
part height contact with a relatively stiff non-structural elements such as a
masonry infill, which constrains its lateral deformation over the height of
contact (Pradhan et al. 2012). The short column effect can cause more
severe damage to the structure, which is because there is a big stiffness
jump from the lower columns to the upper columns, and this stiffness
difference can cause a weak point on the columns, thus making the columns
more easily to fall down.
In this Chapter, a study of the mechanical behaviour of the strengthened
infilled RC frame structures by applying the collar jointed technique
proposed and presented in Chapter 3 has been carried out. The collar joint
strengthening technique on the plain masonry wall panels has been
investigated in Chapters 3 and 4. Here in this Chapter, the application of the
collar joint technique was extended to the infilled RC frame to determine the
effectiveness of this technique as well as the influence on the mechanical
behaviour of the composite structure. In addition, the masonry wall panel
which has been described in Chapter 3 will be used as masonry infill here to
fill RC frame.
8. 3 Parametric study
In order to investigate the influence of the masonry wall panel and the collar
jointed masonry wall panel on the composite structure, a parametric study
will be carried out. This parametric study is conducted based on the work of
Mehrabi et al. (1996) and Mehrabi and Shing (1997). Mehrabi et al. had
done a series of experimental tests on infilled RC frames under different
circumstances. The reasons why Mehrabi’s work is selected in this research
are due to the comprehensive data available from the tests, as well as the
experimental explanation of failure mechanisms. However the most
important reason is that the experimental design is highly relevant to this
research as it was carried out on the infilled RC frame structures and it is
201

Chapter 8 Mechanical behaviour of masonry infilled RC frame
able to replace the masonry infill easily with the masonry wall presented in
Chapter 3. The author combined Mehrabi’s surrounding RC frame with the
author’s masonry wall to form a new structure. The collar jointed technique
will be applied to this structure too. Then this newly formed structure will be
investigated numerically.
In this study, one specimen from Mehrabi’s experimental work is selected,
known as Specimen 9, The RC frame is a weak frame, which was designed
for a lateral wind load. In this research, Specimen 9 is selected because the
lateral wind load can be simplified as equivalent static wind load. The frame
was filled with a solid concrete brick panel. The geometry and detail of
Mehrabi’s experimental test set-up is displayed in Figure 8.2, as well as the
member sizes and reinforcement detailing of the surrounding frame.
Figure 8.2Details of test specimen (Al-Chaar and Mehrabi, 2008)
150
230
#2 @76
2 X2- #5
Section B-B
178
178 #2 @65
8-#4
Section A-A
230
356
1425
100 350
350 178 2138 178 350
P2 P2 P3 P3
202

Chapter 8 Mechanical behaviour of masonry infilled RC frame
First of all, Mehrabi’s specimen’s dimensions have been revised to fit in the
parametric study and simplify the modelling work. In this section, the width of
the beam is changed from 150mm to 178mm to make it the same size with
the column, which is shown in Figure 8.3. All the rest are still the same with
the original test set-up. Furthermore, the masonry infill in Mehrabi’s
experiments will be replaced with the masonry wall panel described in
Chapter 3. The dimension of the brick is 215102.565mm. The thickness of
the mortar in both bed-joints and head-joints in this specimen is 10mm. P2
and P3 in Figure 8.2 represent a constant vertical force during the test, and
the value of P2 and P3 is 98kN and 49kN, respectively. The lateral load P1
is applied monotonically during the test. All the material properties of
masonry infill have been characterized in Chapter 6 and will be applied in
this chapter to simulate the newly designed infilled RC frame.
Figure 8.3New beam section for RC infilled frames
In this research, the study will be carried out on the influence of masonry
infill, including single-leaf wall, collar-jointed wall and opening sizes, on the
reinforced concrete frame structures. It should be noted that the study is
only conducted numerically. The numerical specimens that have been
investigated in the parametric study are explained and presented in detail as
follows.
Firstly, a numerical simulation on bare frame is carried out. The geometry of
bare frame is shown in Figure 8.4. Then the bare RC frame is infilled with
single-leaf (shown in Figure 8.5) in two different types: (a) the infill being
placed concentrically between columns (shown in Figure 8.6) and (b)
178
230
#2 @76
2 X2- #5
Section B-B
203

Chapter 8 Mechanical behaviour of masonry infilled RC frame
eccentrically (shown in Figure 8.7) respectively. After that, the one that the
infill is placed eccentrically will be strengthened by building another wall
parallel to the existing one and tie them together using 10mm thick collar
joint. Therefore, it makes the infill wall into a double-leaf wall, which is shown
in Figures 8.8 and 8.9. Also, the RC frame will be infilled with a masonry wall
with an opening in order to determine the influence of the opening. The
opening is located in the central area. The reason why the opening is
located in the central area is because this research only investigates the
influence of opening size, but not the opening location. The location of the
opening towards the centre of the span, on the diagonal, resulted in further
decrease of resistance, residual resistance, stiffness and larger amounts of
loss of strength and energy due to loading. Therefore, the location factor has
been excluded and the opening is only located in the central area in this
research. There are four cases in terms of opening sizes, which are 9.7%
(Figure 8.10), 17.5% (Figure 8.11), 27.4% (Figure 8.12) and 39.6% (Figure
8.13). All of the four cases will be strengthened using the collar joint
technique as shown in Figure 8.8 and 8.9. For clarification and simplicity, a
summary of the specimens are presented in Table 8.1.
Figure 8.4 Summary of designed specimens
Symbol Description BF Bare frame, shown in Figure 8.4
SC Single-leaf infill, concentrically, shown in Figures 8.5 and 8.6
SE Single-leaf infill, eccentrically, shown in Figure8.7
DE Double-leaf infill, eccentrically, shown in Figures 8.8 and 8.9
SO1 Single-leaf infill, 9.7% opening, shown in Figure 8.10
DO1 Double-leaf infill, 9.7% opening, shown in Figure 8.9
SO2 Single-leaf infill, 17.5% opening, shown in Figure 8.11
DO2 Double-leaf infill, 17.5% opening, shown in Figure 8.8
SO3 Single-leaf infill, 27.4% opening, shown in Figure 8.12
DO3 Double-leaf infill, 27.4% opening, shown in Figure 8.8
SO4 Single-leaf infill, 39.6% opening, shown in Figure 8.13
DO4 Double-leaf infill, 39.6% opening, shown in Figure 8.8
204
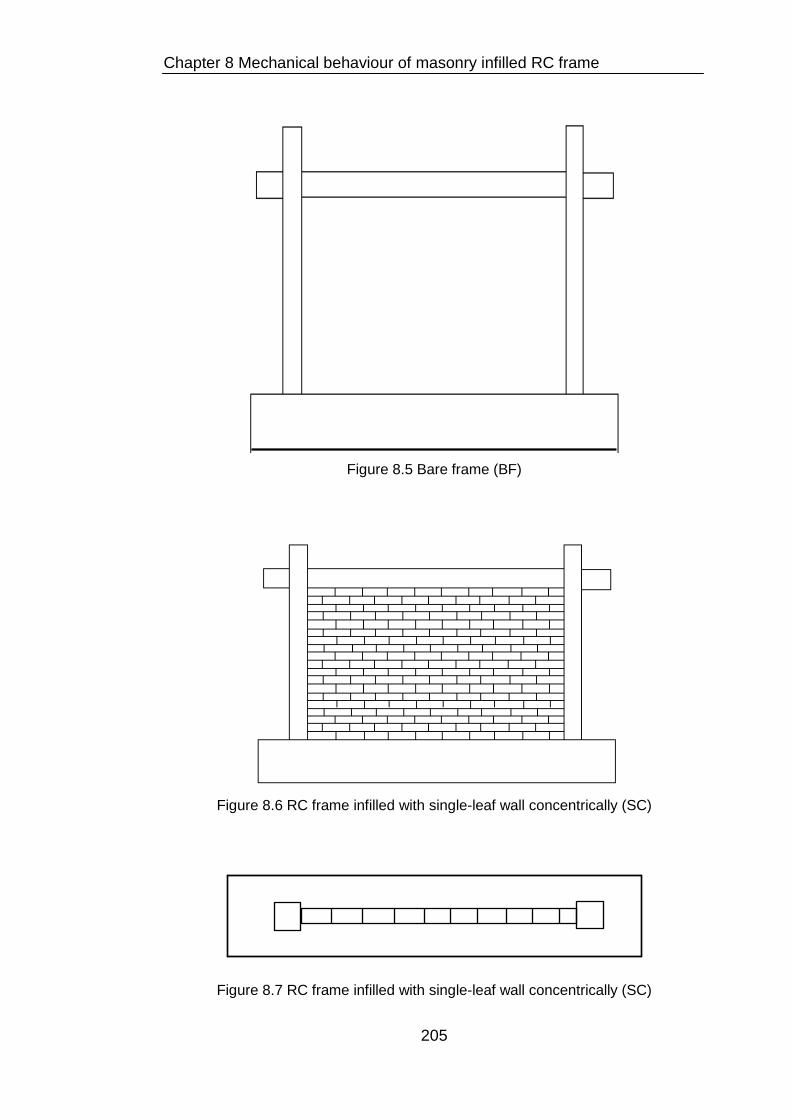
Chapter 8 Mechanical behaviour of masonry infilled RC frame
Figure 8.5 Bare frame (BF)
Figure 8.6 RC frame infilled with single-leaf wall concentrically (SC)
Figure 8.7 RC frame infilled with single-leaf wall concentrically (SC)
205
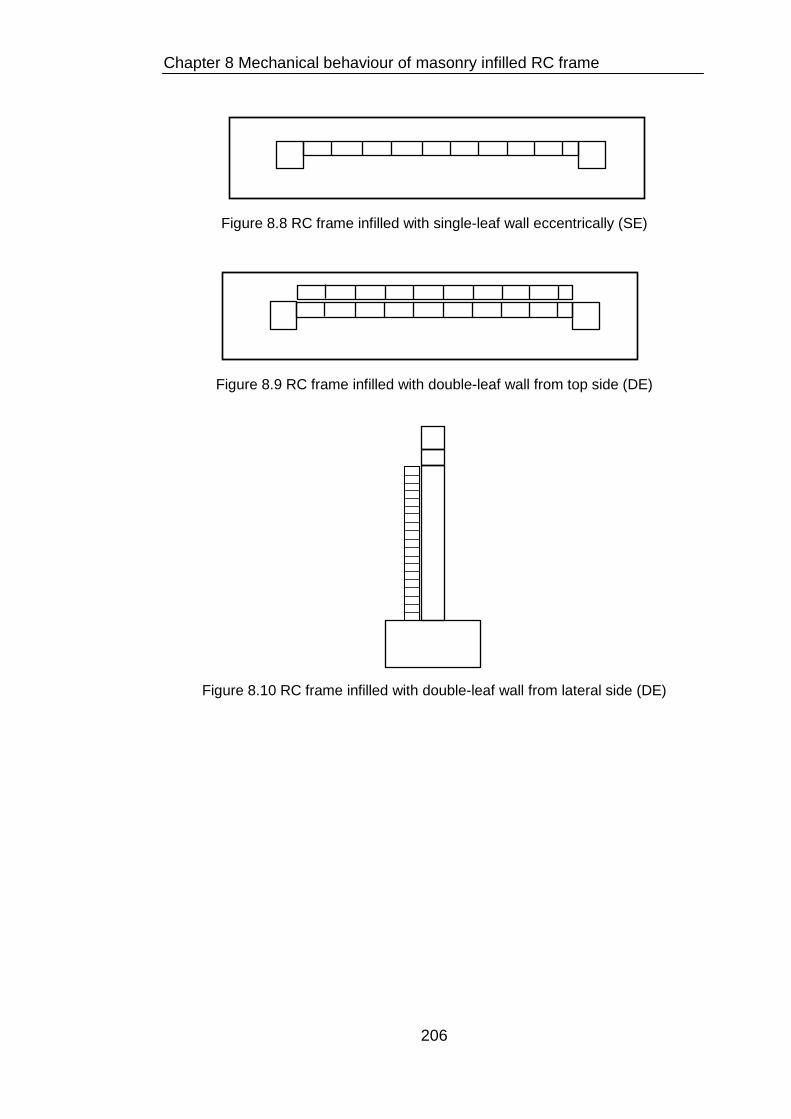
Chapter 8 Mechanical behaviour of masonry infilled RC frame
Figure 8.8 RC frame infilled with single-leaf wall eccentrically (SE)
Figure 8.9 RC frame infilled with double-leaf wall from top side (DE)
Figure 8.10 RC frame infilled with double-leaf wall from lateral side (DE)
206

Chapter 8 Mechanical behaviour of masonry infilled RC frame
Figure 8.11 RC frame infilled with single-leaf wall with 9.7% opening (SO1)
Figure 8.12RC frame infilled with single-leaf wall with 17.5% opening (SO2)
207

Chapter 8 Mechanical behaviour of masonry infilled RC frame
Figure 8.13 RC frame infilled with single-leaf wall with 27.4% opening (SO3)
Figure 8.14 RC frame infilled with single-leaf wall with 39.6% opening (SO3)
8. 4 Numerical simulation
8.4.1 Numerical model
The surrounding frame (reinforced concrete) is modelled as a continuum
model and assigned with the ‘‘total strain crack’’ material. ‘‘Total strain crack’’
material is an inherent material model in MIDAS FEA, which describes the
208

Chapter 8 Mechanical behaviour of masonry infilled RC frame
tensile and compressive behaviour of a material with a stress-strain
relationship. For the infill wall, the simplified micro-scale model described in
Chapter 5 is applied. In order to have a better understanding on the
mechanical behaviour of infilled RC frame, the model will be simulated in 3D.
The interface inelastic properties were simulated using a Mohr-Coulomb
failure surface combined with a tension cut-off. It should be noted that the
compression cape mode is not included in MIDAS FEA in 3D modelling. The
vertical load is applied in the initial stage of the analysis and kept constant
during the analysis. The base of the infilled RC frame is fixed in all directions.
8.4.2 Material property
The material properties of the surrounding RC frame and reinforcement
applied in this model are taken directly from Mehrabi et al. (1996) and Al-
Chaar and Mehrabi (2008). Material properties are shown in Tables 8.2 and
8.3.
Figure 8.15 Material property of reinforced concrete
Element 𝐸𝐸 (𝑁𝑁/𝑚𝑚𝑚𝑚2) 𝑣𝑣 𝑓𝑓𝑡𝑡(𝑁𝑁/𝑚𝑚𝑚𝑚2) 𝐺𝐺𝑓𝑓𝐼𝐼(𝑁𝑁/𝑚𝑚𝑚𝑚) 𝑓𝑓𝑐𝑐(𝑁𝑁/𝑚𝑚𝑚𝑚2) 𝐺𝐺𝑐𝑐𝐼𝐼𝐼𝐼(𝑁𝑁/𝑚𝑚𝑚𝑚)
Reinforced concrete
24100 0.16 2.69 0.0158 27.6 19.26
Figure 8.16 Material property of reinforcements
Bar size E (𝑁𝑁/𝑚𝑚𝑚𝑚2) 𝑣𝑣 𝑓𝑓𝑦𝑦1 (𝑁𝑁/𝑚𝑚𝑚𝑚2) 𝑓𝑓𝑢𝑢2 (𝑁𝑁/𝑚𝑚𝑚𝑚2)
No. 2 (transverse) 210000 0.3 345 415
No. 4-5 (longitudinal) 210000 0.3 485 580
209

Chapter 8 Mechanical behaviour of masonry infilled RC frame
The Young’s modulus of brick element is 19900 and the Poison’s ratio is
0.15. The material properties of brick and brick-mortar interface have been
characterized in Chapter 6. Therefore, the parameters will be assigned to
the masonry infill directly here, which are listed in Table 8.4. However, the
frame/infill interface is not known in this research. Therefore, it is estimated
in this research. Usually the frame/infill interface is weaker than the brick-
mortar interface (Sattar 2010). Therefore, in this research, the property of
frame/infill interface will be estimated as 0.8 of the brick-mortar interface.
Figure 8.17 Material properties for interface elements
Parameter Brick-mortar interface
Collar joint
Frame/infill interface
Pre-defined brick crack
Normal stiffness(𝑁𝑁/𝑚𝑚𝑚𝑚3) 11.7 11.7 9.4 1000
Shear stiffness(𝑁𝑁/𝑚𝑚𝑚𝑚3) 5.1 5.1 4.1 435
Tensile strength(𝑁𝑁/𝑚𝑚𝑚𝑚2) 0.235 0.235 0.188 2
Tensile fracture energy(𝑁𝑁/
𝑚𝑚𝑚𝑚)
0.0225 0.0225 0.0188 0.08
Cohesion(𝑁𝑁/𝑚𝑚𝑚𝑚2) 0.329 0.329 0.263
Friction coefficient 0.92 0.92 0.92
Dilatancy coefficient 0.52 0.52 0.52
Shear fracture energy(𝑁𝑁/
𝑚𝑚𝑚𝑚)
0.225 0.225 0.18
8. 5 Simulation results and comparisons
After assigning the parameters in the model, the simulation results can be
obtained. The comparisons are displayed as following.
210
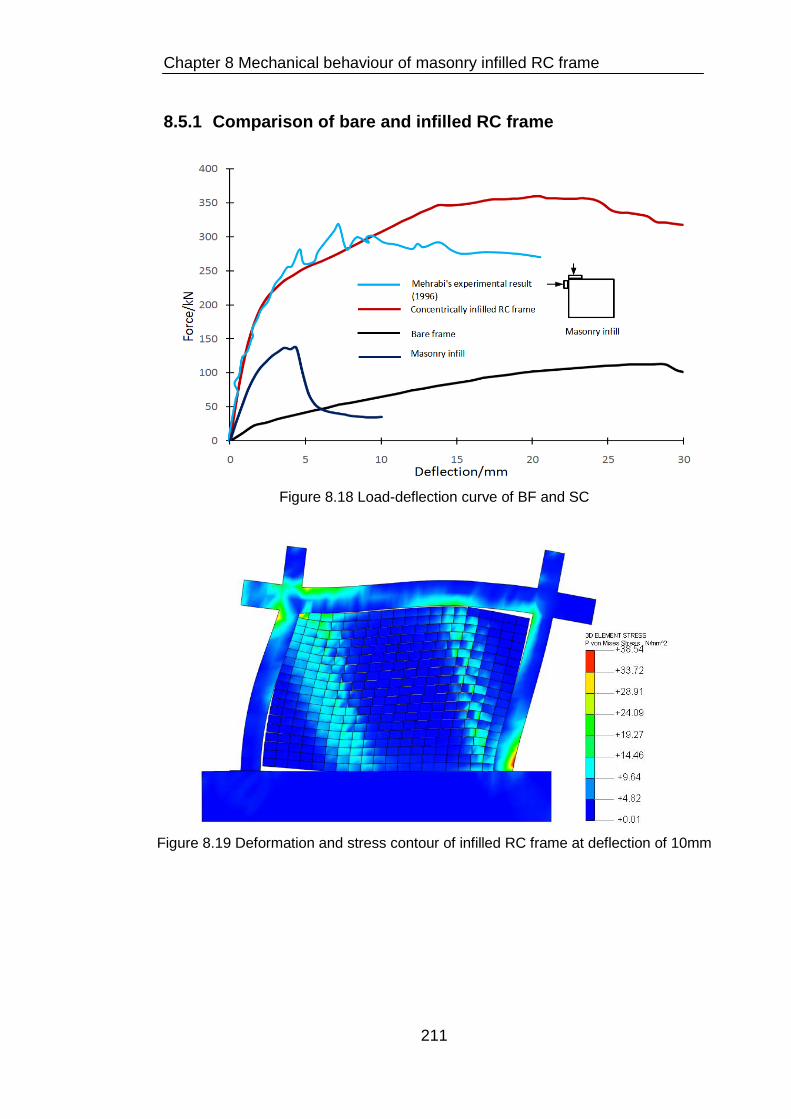
Chapter 8 Mechanical behaviour of masonry infilled RC frame
8.5.1 Comparison of bare and infilled RC frame
Figure 8.18 Load-deflection curve of BF and SC
Figure 8.19 Deformation and stress contour of infilled RC frame at deflection of 10mm
211

Chapter 8 Mechanical behaviour of masonry infilled RC frame
Figure 8.20 Von Mises stress distribution of the masonry infill
Figure 8.21 Simplified infilled RC frame
Figure 8.14 shows the load-deflection curves of the bare frame, masonry
wall panel and masonry infilled RC frame under a combined quasi-static
loading as well as the experimental result of Mehrabi's (1996) work. The
figures demonstrate that the numerical result agrees with Mehrabi's (1996)
experimental result in the beginning, however, it surpasses it at the
deflection of 10mm. This is due to the reasons that the width of the beam
used in this research is bigger than Mehrabi's. Besides, the masonry unit
used in this research is much stiffer and stronger than the Mehrabi's.
Therefore, the numerical specimen carries higher failure load. Furthermore,
the figure demonstrates that the infilled RC frame has much higher stiffness
and strength compared with the bare frame. Also, it overpasses the stiffness
and strength sum of the bare frame and masonry wall panel, which has been
RC frame
Diagonal strut
212

Chapter 8 Mechanical behaviour of masonry infilled RC frame
proven in the past researches (Mehrabi et al. 1996, Koutromanos 2011). In
detail, the stiffness of the infilled RC frame is nearly 8 times more than the
bare frame, as well as a 240% increase for the failure load. It has been
proven by many researchers (Al-Chaar et al. 2002, Mehrabi et al. 1996,
Stavridis and Shing, 2010, Sattar 2013) that masonry infill can have a big
influence on the mechanical performance of an infilled RC frame structure.
This improvement can help RC frame structure resist a larger lateral load
during earthquakes.
Figure 8.15 illustrates the deformation and stress contour of the infilled RC
frame at deflection of 10mm. This deformed shape illustrates the sliding in
the bed joints at the mid height of the infill panel, as well as the diagonal
cracking of the infill panel. The failure patterns of the masonry infill mainly
have three main types: a) diagonal cracking, b) mortar joint sliding and
separation, and c) corner crushing, and joint sliding and separation is the
governing failure mechanism for this infilled RC frame. It should be noted
that the masonry infill acts more or less like the masonry wall tested in the
laboratory, i.e., the top-left corner has nearly reached its compressive
strength, which signals crushing at the loaded corners under higher lateral
displacements. These results agreed well with the experimental analytical
results by Mehrabi et al (1994). Around the unloaded corner, the masonry
infill is detached from the surrounding frame. Furthermore, there are some
diagonal cracks and mortar sliding occurred along the diagonal area. These
findings were also found in plain masonry wall panel presented in Chapter 4.
Therefore, it could be assumed that it is possible to simplify the lateral
loaded masonry infill wall as bare masonry wall panel during the
experimental work. However, there is one thing that should be noted. The
aspect ratio of the experimental infill is 1.08, while the aspect ratio for the
masonry infill in infilled RC frame is 0.7. Therefore, further investigation on
the aspect ratio should be conducted.
Figure 8.16 shows the stress distribution of the masonry infill at a deflection
of 10mm. It can be seen that there are two diagonal struts (higher
213

Chapter 8 Mechanical behaviour of masonry infilled RC frame
compressive stress compared with surrounding area) formed in the masonry
infill, which is simplified and illustrated in Figure 8.17. The load was passed
along these two diagonal struts, and this is the reason why the diagonal
cracking occurred along the diagonal struts (Figure 8.15). This loading
system of infilled RC frame can also be found in other researches (El-
Dakhakhni et al. 2003, Crisafulli et al. 2000). Some other researchers have
proposed one diagonal strut (Zarnic and Tomazevic 1986) or multi diagonal
struts (Chrysotomou et al. 2002) theory depending on the aspect ratio, to
simplify the masonry infill. Therefore, if the width of the diagonal strut is
known, the modelling of infilled RC frame can be simplified. By this method,
a large amount of time can be saved in the modelling a whole infilled RC
frame structure. In this research, the width of the diagonal strut can be
calculated by counting the grid. As displayed in Figure 8.16, the total number
of the diagonal grid is 9.5 while the number of the strut grid is 3 to 4.
Therefore, the width of diagonal strut is 3~49.4
= 0.32~0.42, which agrees with
the research of Holmes (1961) that the strut width is taken roughly as 1/3 of
the diagonal length.
8.5.2 Comparison of concentrically and eccentrically infilled RC frame (SC and SE)
Figure 8.18 shows the comparison of the concentrically infilled frame and
eccentrically infilled frame in terms of load-deflection relationship. The figure
clearly illustrates that the initial stiffness of the composite structure does not
change due to only minor cracks occurring. However, after the big cracks
appeared and the load has re-distributed among the structure, both the
stiffness and failure load of the whole structure will be decreased slightly if
the infill is eccentrically located between the columns. The structure behaves
nearly linearly from beginning in both cases, as there is no big crack
occurring in both surrounding frame and infill. This linear behaviour stops
when the structure reached around 230kN. At this stage, the stiffness of the
214

Chapter 8 Mechanical behaviour of masonry infilled RC frame
structure started to decline due to the occurrence of big cracks on the infill.
However, the stiffness reduction of eccentrically infilled RC frame is larger
than the concentrically infilled one due to the torsion in the eccentrically
infilled RC frame. The stress will be redistributed among the infill after the
occurrence of cracks. The structure can still carry more load after the load
redistribution among the infill. The lateral load will stop increasing when it
reaches its failure load. When the torsion in the eccentrically infilled RC
frame is large enough, it can cause the infill fail out-of-plane. Therefore, if
torsion existed in a structure, the failure is a combination of in-plane and out-
of-plane failures.
Figure 8.19 represents the deformation of the eccentrically infilled RC frame.
The cracking patterns are very similar with the concentrically infilled one. It
can be seen that the in-plane failure (mortar sliding and separation)
dominates the failure modes. In this case, it is very hard to tell the out-of-
plane failure. It is because the out-of-plane failure appeared as the de-
bonding of mortar joints and brick units, which can also be found in in-plane
failures (Figure 8.15).
Figure 8.22 Load-deflection curve of specimen SC and SE
0
50
100
150
200
250
300
350
400
0 5 10 15 20 25
Concentrically infilled RC frame
Eccentrically infilled RC frame
Deflection/mm
Forc
e/kN
215
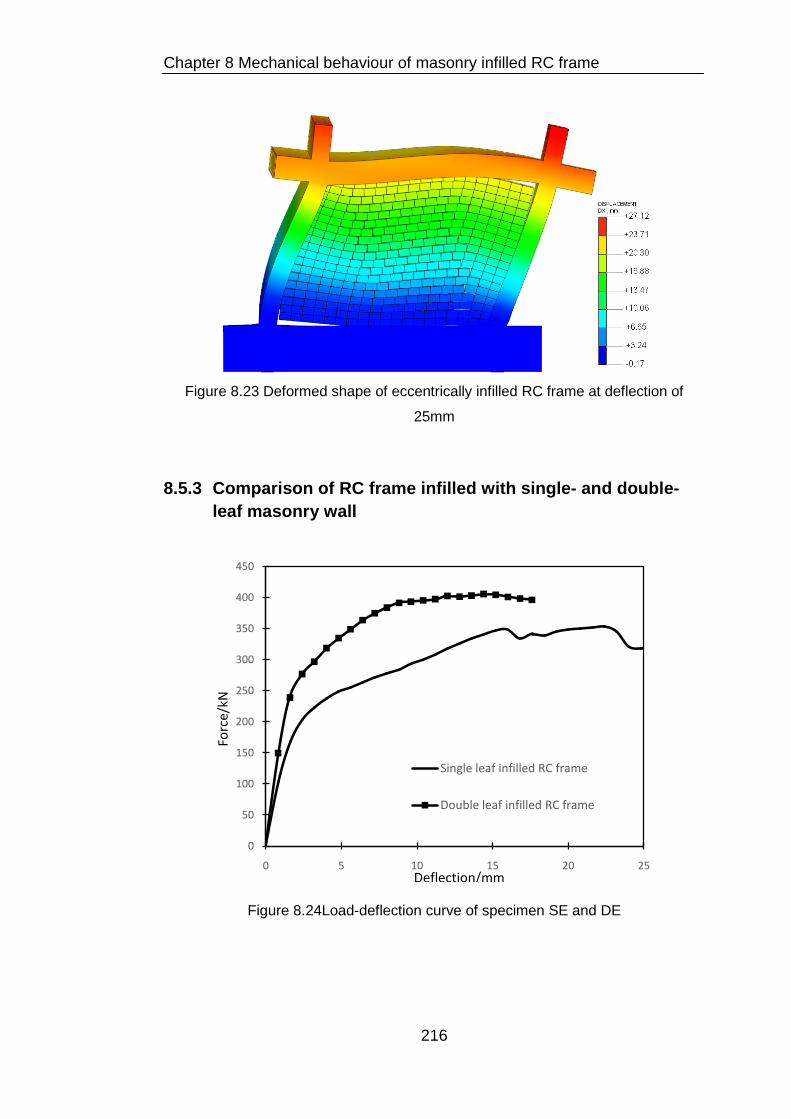
Chapter 8 Mechanical behaviour of masonry infilled RC frame
Figure 8.23 Deformed shape of eccentrically infilled RC frame at deflection of
25mm
8.5.3 Comparison of RC frame infilled with single- and double-leaf masonry wall
Figure 8.24Load-deflection curve of specimen SE and DE
0
50
100
150
200
250
300
350
400
450
0 5 10 15 20 25
Single leaf infilled RC frame
Double leaf infilled RC frame
Forc
e/kN
Deflection/mm
216
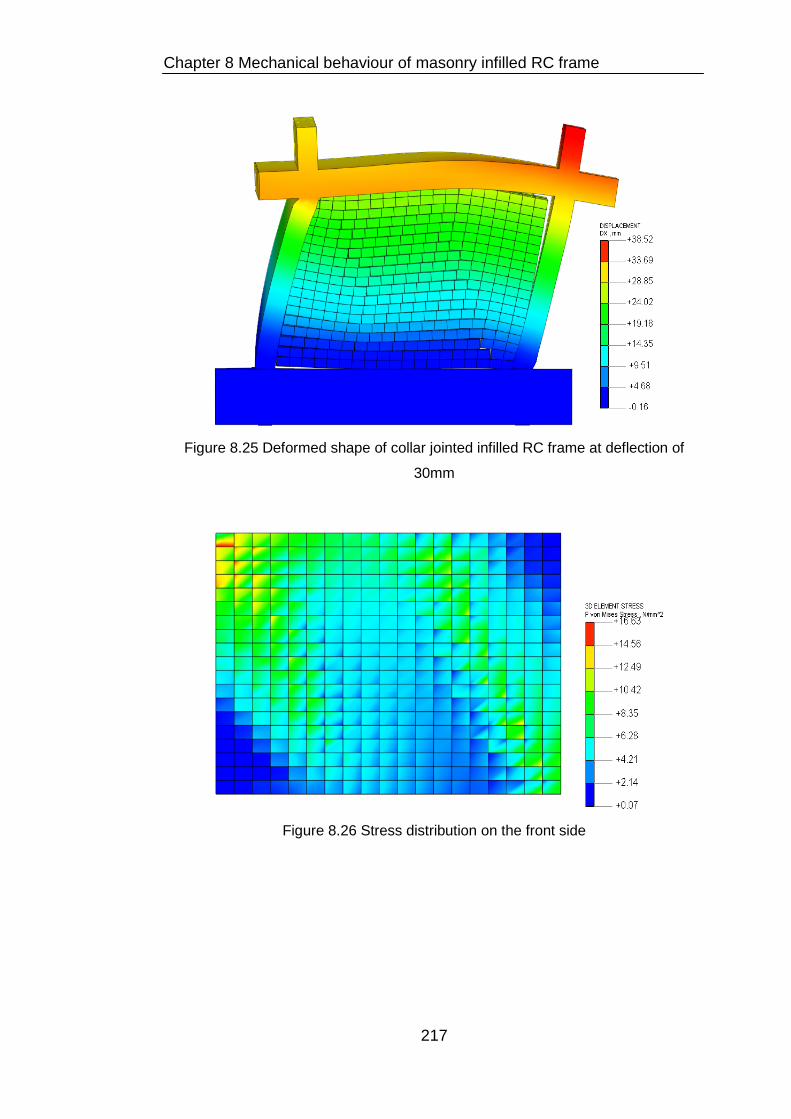
Chapter 8 Mechanical behaviour of masonry infilled RC frame
Figure 8.25 Deformed shape of collar jointed infilled RC frame at deflection of
30mm
Figure 8.26 Stress distribution on the front side
217

Chapter 8 Mechanical behaviour of masonry infilled RC frame
Figure 8.27 Stress distribution on the back side
Figure 8.20 represents the load-deflection curves of the single- and double-
leaf infilled RC frames. The figure demonstrates that the double-leaf infilled
method can postpone the failure of crack occurrence. For the single-leaf
masonry wall infilled frame, the big crack occurred when the lateral load
reached about 230kN, however, for double-leaf infilled frame, big cracks
appeared only when the lateral load reached about 290kN. Furthermore, the
double-leaf infilled method can increase the stiffness, by approximately 1.4
times of its initial stiffness. After big cracks appeared in both cases, both
structures can keep carrying more loads until both reached their failure load
stage. The failure load of the double-leaf masonry wall infilled structure is
about 20% higher than the single-leaf masonry wall infilled structure.
Therefore, it can be summarised that the second leaf (collar jointed system)
can improve the stiffness and failure load of the single eccentrically infilled
frame to some degree. Figure 8.21 shows the deformed shape of RC frame
infilled with double-leaf masonry wall. It shows that the failure patterns have
more diagonal cracks compared with the single-leaf masonry wall infilled RC
frame, where appeared along the two diagonal struts area.
It can also be seen that there are less sliding failure cracks or mortar joints
and brick units de-bonding cracks, which can be seen in Figure 8.19. This
218

Chapter 8 Mechanical behaviour of masonry infilled RC frame
finding means that the out-of-plane failure has been reduced because the
collar joint strengthening technique has increased the out-of-plane thickness,
therefore reducing out-of-plane failure. Figures 8.22 and 23 illustrate that the
stress distribution among two leaves are almost the same, which means that
the collar joint improves the integrity of masonry infill and makes the two
leaves work as a single-leaf wall. Compared with Figure 8.16, Figure 8.22
displays a less remarkable diagonal-strut model. This is because the lateral
load has been spread more evenly among the whole wall. Compared with
Figure 8.22, Figure 8.23 shows a less strong but more average stress
distribution, which means the external load has been flowed to the second
leaf via the collar joint, but the load was reduced and spread over among the
second leaf.
8.5.4 Influence of opening size on infilled RC frame
Figure 8.28 Load-deflection curves of infilled RC frame with/without openings
0
50
100
150
200
250
300
350
400
0 5 10 15 20 25 30
Solid9.7% opening17.5% opening27.4% opening39.6% opening
Forc
e/kN
Forc
e/kN
Deflection/mm
Forc
e/kN
219

Chapter 8 Mechanical behaviour of masonry infilled RC frame
Figure 8.29 Stress distribution of specimen with 9.7% opening
Figure 8.30 Stress distribution of specimen with 27.4% opening
Figure 8.24 illustrates the load-deflection relationships of RC frames infilled
with masonry infill contains opening with different sizes. Based on the figure,
it can be revealed that if the masonry infill has an opening, the stiffness will
be reduced as well as the maximum lateral load. The degree of reduction
depends on the opening size. The ratio of the reduction to the opening size
is not known yet as more specimens should be carried out in order to obtain
the relationship. However, it is clearly shown that the bigger opening size,
the larger reduction of stiffness and maximum lateral load. Similarly,
Surendran and Kaushik (2012) presented that the presence of openings
significantly reduced the initial lateral stiffness of the infilled frames.
220

Chapter 8 Mechanical behaviour of masonry infilled RC frame
However, in case of two similar rectangular frames with equal areas of
openings, the frame having larger width of opening exhibits more initial
lateral stiffness. Figure 8.25 shows the stress distribution of the masonry
infill with 9.7% opening. It can be seen that two-diagonal-strut model has not
been destroyed. This is because the opening locates in the central area of
the masonry wall and it does not interrupt the two-diagonal-strut model,
which is the reason why smaller opening size can carry more lateral load. In
the case of small opening, the lateral load from the top beam can still pass
from the two diagonal struts to the base. Figure 8.26 demonstrates the
stress distribution of masonry infill with 27.4% opening. It clearly shows that
the two-diagonal-strut model has been destroyed. Therefore, with bigger
opening size, the two-diagonal strut model will be broken and the lateral
loading carrying capacity will be decreased.
8.5.5 Collar joint retrofitting on infilled RC frame with openings
Figure 8.31 Load-deflection curves of strengthened/unstrengthened infilled RC
frame with/without openings
0
50
100
150
200
250
300
350
400
0 5 10 15 20 25
single, 9.7% opening Double, 9.7% opening
Single, 17.5% opening Double, 17.5% opening
Single, 27.4% opening Double, 27.4% opening
Single, 39.6% opening Double, 39.6% opening
Deflection/mm
Forc
e/kN
221

Chapter 8 Mechanical behaviour of masonry infilled RC frame
Figure 8.27 compares the load-deflection relationships of the single-leaf and
double-leaf masonry wall infilled RC frame with different opening sizes.
Obviously, it is seen that the collar joint technique can improve the stiffness
and strength of an infilled RC frame with opening. However, the
improvement varies, which depends on the opening size. For the 9.7%
opening, the improvement of the strength is 55kN or 18%, while for the
opening size of 17.5%, 27.4% and 39.6%, the strength improvement is
around 50kN (20.8%), 40kN (22%) and 25kN (16%). Compared with the
infilled RC frame with solid infill, it can be concluded that improvement varies
depending on the opening size. The relationship between the opening size
and improvement by using collar jointed technique is displayed in Figure
8.28. It can be seen that the improvement increases gradually up until it
reached its maximum improvement. After passing the maximum
improvement, the improvement will decrease with the increase of opening
size. However, it should be noted that more specimens with different
opening sizes should be carried out in order to obtain a more accurate curve.
Figure 8.32 The relationship between opening size and improvement
15%
16%
17%
18%
19%
20%
21%
22%
23%
0.05 0.1 0.15 0.2 0.25 0.3 0.35 0.4 0.45Opening size
Impr
ovem
ent
222

Chapter 8 Mechanical behaviour of masonry infilled RC frame
8. 6 Discussion
In this chapter, the strengthening/retrofitting approach using the collar joint
technique has been extended to the masonry infilled RC frames. The
numerical results showed that this approach could have a positive influence
in enhancing the composite structure. Though the influence is not
remarkable, this approach can still be applied in practice. In some countries,
the collar joint system has been implemented in order to provide some
certain functions (like waterproof, fireproof etc.). Therefore, this research
proves that this system can be beneficial to the existing composite
structures. In this research, the diagonal-strut model has been found on the
masonry infill. However, this approach hasn’t been studied thoroughly here
in this research as the aim of this research is to obtain a detailed study on
the composite structure. Nevertheless, this approach can be applied in a
more complex structure to simplify the numerical model.
It should be noted that the collar jointed masonry wall may have some
disadvantages to the original structure. Though the masonry infill could
improve the strength and stiffness of the composite structure, it adds mass
to the original structure as well. The added stiffness decreases the natural
period of the structure, which may result in higher seismic loads.
Furthermore, the added mass may cause larger seismic action to the
composite structure and may cause more severe damage as well. Therefore,
the collar jointed technique needs to be conducted dynamically in future
research in order to obtain its influence on the seismic behaviour of the
composite structure.
In this chapter, the masonry infill with opening has been studied and the
results agreed with the literature review. However, the relationship between
the opening size and strength/stiffness reduction has not been obtained yet.
According to the literature review, the strength/stiffness reduction is
dependent on the opening shape as well as the location. Therefore, in order
to obtain a more detailed and accurate reduction ratio, more specimens with
223

Chapter 8 Mechanical behaviour of masonry infilled RC frame
different types of openings as well as the locations, should be carried out.
Moreover, the collar jointed technique has also been applied on the masonry
infill with opening. The results demonstrate that this simple strengthening
approach could improve the mechanical behaviour of the composite
structure to some degree. A relationship between opening size and
improvement has been obtained.
8. 7 Conclusions
In this research, a numerical study on the performance of an RC frame
infilled with single-leaf and collar jointed masonry walls (with/without
openings), has been carried out. The infilled RC frame in this research is
newly designed with the surrounding RC frame taken from Mehrabi’s (1996)
experimental specimens and the masonry infill taken from the experimental
specimens described in Chapter 3. The material parameters of RC frame
are directly taken from Mehrabi’s works and the parameters of masonry infill
are taken from the calibration results in Chapter 6. The newly designed
structures are simulated in MIDAS FEA. It should be noted that the seismic
performance of this composite structure is not conducted here, which will be
studied in further research.
According to the above analysis, some findings and conclusions can be
made:
• This research confirmed that the masonry infill can significantly
improve the stiffness and maximum load of the bare RC frame.
Therefore, the masonry infill should be taken into account in designing
a masonry infilled RC frame structure or it should be assured that the
masonry infill and the surrounding RC frame has no interaction.
• The failure patterns of the masonry infill in the composite structure
mainly have three types: a) diagonal cracking, b) mortar joint sliding, 224

Chapter 8 Mechanical behaviour of masonry infilled RC frame
and c) corner crush, which have some similarities with the bare
masonry wall panel.
• The failure patterns are the same with those found on bare masonry
wall panel. These findings can prove that the restriction conditions on
masonry wall panel, which was described in Chapter 3, can
approximately represent the real restriction provided by surrounding
RC frame in reality. Therefore, the performance of masonry infill could
be obtained from the bare masonry wall panel test.
• The masonry infill can be simplified as a two-diagonal-strut model.
However, a one or multi diagonal strut model can be used depending
on the aspect ratio of masonry wall.
• The collar joint technique can improve the stiffness and failure load of
the composite structure to some degree. For the eccentrically infilled
RC frame, the collar joint technique can reduce the out-of-plane
failure. Furthermore, the collar joint technique can improve the
integrity of the eccentrically infilled frame to some degree and make
the two leaves work as a whole panel. Therefore, collar joint
techniques used as strengthening/retrofitting approach on infilled RC
frame is appropriate.
• Openings in the masonry infill can decrease the stiffness and strength
of the infilled RC frame structures remarkably. The bigger the opening,
the greater the reduction of stiffness and strength. Furthermore, the
location of the opening is also critical as the opening may break the
strut-model in masonry infill, thus reducing stiffness and strength
remarkably.
• Collar joint technique can help to improve the mechanical behaviour
of infilled RC frame with an opening. However, the significance of the
225

Chapter 8 Mechanical behaviour of masonry infilled RC frame
improvement depends on the opening size, and the relationship is
shown in Figure 8.28. In reality, the collar jointed technique is quite
commonly used in the masonry infill, therefore, this research result
assures the safety of using this construction system.
226

Chapter 9 Conclusions, Limitations and Recommendations
Chapter 9 Conclusions, limitations and recommendations
This thesis deals with the analysis of unreinforced masonry walls
strengthened using the collar jointed technique. The principal aims are to
identify the effectiveness of the proposed strengthening approach and to
develop a reliable computational model that can help to understand the
mechanical behaviour of a masonry wall subjected to combined static
loadings. In addition, the application of the collar joint technique has been
extended to masonry infill panels found in RC frame structures in order to
assess the effect on the performance of the RC frame, as well as to find out
the mechanical behaviour of masonry wall infills constrained by RC frames.
The conclusions, limitations as well as possible recommendations for future
work are presented in this Chapter.
9. 1 Conclusions
9.1.1 Primary conclusions
In this thesis, the proposed method of enhancing masonry wall panels using
the collar jointed technique as a retrofitting/strengthening approach has
been investigated experimentally and numerically. The experiments were
carried out in the laboratory, while for the numerical work, a simplified micro-
scale finite element model was developed to model the masonry elements.
Moreover, the collar jointed technique has also been extended to masonry
infill panels found in RC frame structures. According to the research results,
the primary conclusions are:
227

Chapter 9 Conclusions, Limitations and Recommendations
1. Both the experimental and numerical results indicate that the collar joint
technique is beneficial to the masonry structure under combined quasi-
static loading as it can improve the stiffness and lateral resistance of the
structure. The collar joint technique increased the lateral resistance by
about 50% on the pre-damaged masonry walls while it increased the
stiffness about 100% on the post-damaged masonry walls. Furthermore,
the ductility of the post-damaged masonry wall was improved remarkably.
The result assures that this strengthening/retrofitting approach is
effective in improving the performance of masonry wall panels. For the
pre-damaged approach, it could be applied in the designing and
constructing stage. For the existed masonry structures with collar jointed
wall system, it assures the safety of the usage. However, for the post-
damaged type, the pre-surface treatment may be needed in order to
improve the retrofitting effectiveness.
2. Collar jointed infill panels have been incorporated within an RC frame
and the results showed that this method could provide some benefits to
the composite structure (whether as solid masonry infill or as masonry
infill with an opening). The increase of lateral resistance is approximately
increased by 20% for all cases. However, for a particular masonry infill
with an opening, there is a maximum increase for a certain opening size.
When the opening is smaller or bigger than this certain size, the increase
of the collar joint technique will be decreased. This finding helps the
engineers and builders in deciding the use of collar joint technique in the
non-seismic area, in order to improve the mechanical behaviour of the
composite structure. For the collar jointed walls used as partitions in the
composite structures, this result confirms the safety of its usage.
3. A simplified micro-scale model was developed based on the generated
data from the experimental results. The mechanical behaviour of single-
and double-leaf (collar jointed) masonry walls has been investigated
using the developed method, and the simulation results agreed well with
the experimental results. Specifically, the load-transfer in collar jointed
228
Chapter 9 Conclusions, Limitations and Recommendations
masonry walls has been addressed, which contributes to the
understanding of the mechanical behaviour of the collar jointed masonry
wall. In a typical collar-jointed masonry wall, the lateral load was mainly
passed to the base via the diagonal strut in the first leaf. However, the
collar joint transferred the load from the first leaf and spread the shear
load evenly among the second leaf. As the numerical results agreed well
with the experiments, therefore, this method can be used by other
researchers in numerically investigating the performance of masonry wall
panels.
4. Compared with the review summarised in Table 2.2, Chapter 2, the
assessment score of this collar-jointed retrofitting approach in terms of
improvement, economy, sustainability and buildability is 5, 8, 8, and 9,
respectively, which makes the total score of 30. This approach is
therefore the most beneficial strengthening approach overall. This result
proves that the proposed approach in this research is a cost-effective
and practical strengthening/retrofitting method, which provides a potential
choice for the engineers and researchers, especially in the developing
countries.
5. The strengthening effects of the pre-damaged and post damaged
masonry walls are different; the strengthening of pre-damaged wall type
is more efficient. The pre-damaged type could increase the lateral
resistance about 50% while the post-damaged type could only restore
the initial strength. This is due to the combination of the collar joint in the
post-damaged type is poor. The first leaf was built earlier while the collar
joint was constructed at the same time with the second leaf. Therefore,
the bond between the first leaf and the collar joint was much weaker
(because of the curing effect) than the bond between the second leaf and
the collar joint. Therefore, in order to improve the retrofitting
effectiveness, some pre-surface treatment may need to be carried out
prior to the retrofitting work. Further work is required to see how to
229

Chapter 9 Conclusions, Limitations and Recommendations
improve the method of retrofitting in post damaged walls (see
Recommendations).
9.1.2 Secondary conclusions
In relation to the Objectives:
1. The review in Chapter 2 demonstrated that the mechanical behaviour of
masonry walls is a complex issue, especially double- or multi-leaf
masonry walls. This research confirmed the complexity of masonry,
especially for the collar jointed masonry wall. The mechanical behaviour
of a masonry wall could be taken as linearly elastic under small lateral
load. However, for the collar-jointed masonry wall, the stresses in
different leaves are totally different. The load was passed to the base via
diagonal strut in the first leaf while the load was spread evenly among
the second leaf.
2. Chapter 2 assessed the advantages and disadvantages of the existing
approaches to strengthen and retrofit masonry structures and concluded
that there was no best approach. The selection of a retrofit method
should require consideration of all of the following aspects; technical,
economic and social.
3. In this research, a new strengthening approach (e.g. a collar-joint) for
single-leaf masonry walls was proposed. The reason for this proposed
method was that the collar jointed technique is quite a
common/established construction method. Though the improvement of
the collar jointed strengthening/retrofitting technique is not very
remarkable (around 50% for the pre-damaged masonry wall panels while
approximate 20% for the masonry infilled RC frame), it has been shown
to be easy to be implemented and so ideal for the householders in the
developing countries. For those structures which already incorporate
230
Chapter 9 Conclusions, Limitations and Recommendations
collar-jointed systems, the research confirms the expected performance
of this technique.
4. A review on the existing modelling approaches has been presented and
compared. In this research, the simplified micro-scale finite element
modelling was preferred. This approach is able to catch all the failure
modes of the masonry wall panels without consuming too much
computational time.
5. In terms of the failure mechanisms, the experimental studies on single-
leaf unreinforced masonry walls have shown that cracks are more likely
to occur along the brick-mortar interfaces. Usually, the failure is
represented by de-bonding of the bricks from the mortar. It should be
noted that the failure pattern is significantly dependent on the dimensions
of the specimen, loading pattern and boundary conditions. In this
research, the experimental specimens (including single- and double-leaf
masonry panels) have their own unique (dimension, boundary condition
and loading pattern). Therefore, the failure pattern has its own unique
characteristics. However, this result can be referred in other research if
the similar experiments were carried out. In this research, the results in
Chapter 4 showed that there are 3 failure patterns for a single-leaf wall: i)
diagonal cracking, ii) corner crushing and iii) sliding; this is in agreement
with the literature (Lourenco and Rots 1997, Campbell Barrza 2012).
However, the failure modes of the double-leaf masonry wall panels differ
from those of single-leaf wall panels. For the double-leaf masonry wall
panel, the failure pattern was characterized by diagonal cracking. In
terms of the failure process, pre- and post-damaged walls behaved
differently. For the case of a pre-damaged wall, there were three notable
features of behaviour, namely: i) initial flexural cracking in the bed joints
of the walls; followed by, ii) propagation of stepped shear cracks; with
increasing load leading to, iii) complete collapse. For the post-damaged
masonry wall panel, there were four notable features of behaviour,
namely: i) initial flexural crack; followed by ii) formation of diagonal
231

Chapter 9 Conclusions, Limitations and Recommendations
stepped cracks through the diagonal area, with increasing load leading to
iii) detachment of the collar joint from the wall; and iv) collapse as a result
of shear failure. In the literature review, the failure of multi-leaf masonry
wall was mainly characterized by the crushing of the inner core and out-
of-plane failure of external leaves. It should be noted that this difference
might be due to the loading patterns and boundary conditions and the
type of masonry unit and mortar.
6. For this investigation, the most efficient FE Model was found to be a
simplified micro-scale model, wherein bricks are modelled as separate
blocks behaving in a linear elastic manner while the mortar joints are
represented by zero thickness interfaces behaving in an elastic-perfectly
plastic manner. For the brick, material parameters of Young’s modulus ()
and Poison’s ratio () are required. While the zero thickness interface is
based upon elastic normal () and shear () stiffness, cohesive (), tensile (),
frictional (Φ), dilatancy (Ψ), mode I fracture energy (), mode II fracture
energy (), compressive () and compressive fracture energy. From a
sensitivity analysis, predicted failure was largely independent of the brick
properties but very dependent on the joint interface parameters.
7. The sensitivity study showed that different parameters of the interface
affect the mechanical behaviour of masonry wall at different stages.
According to the results, only normal/shear stiffness and tensile strength
of the interface have a significant influence on the first stage (elastic
stage). At this stage, the masonry wall behaves approximately in a linear
elastic manner. For the second stage (re-distribution stage), the load was
re-distributed through the wall and continued to carry more load.
Normal/shear stiffness, tensile strength, coefficient of friction angle,
coefficient of dilatancy angle, Mode I fracture energy and Mode II fracture
energy play an important role. For the third stage (failure stage), all the
parameters, i.e. normal/shear stiffness, tensile strength, coefficient of
friction angle, coefficient of dilatancy angle, Mode I fracture energy,
Mode II fracture energy compressive strength and compressive fracture
232

Chapter 9 Conclusions, Limitations and Recommendations
energy have a significant influence on the mechanical behaviour of the
masonry walls.
8. Following the materials’ parameters’ calibration, the characterized
parameters were assigned to the single-leaf Wall 3 and to the double-leaf
Wall 4 and Wall 7 so as to predict the structural response. The predicted
results were compared with those obtained from the experimental tests
carried out in the laboratory and good correlation was achieved. The
model could capture all the failure patterns found in the experiments,
both in the single-leaf and the double-leaf masonry wall panels. For the
double-leaf wall panels, the model could capture the trend, the maximum
load and deflection.
9. By modelling the behaviour of a RC frame containing collar-jointed
masonry infills, it can be seen that the masonry has a large influence on
the composite behaviour of the structure, particularly when the masonry
contains openings. The opening on the masonry infill would jeopardise
the loading path system (diagonal strut model), therefore resulting in
reducing the lateral resistance. Moreover, the collar jointed technique
appears to improve the stiffness and failure load of the infilled RC frame,
no matter whether it is solid or with an opening as the lateral resistance
has been improved by approximate by 20% in all cases. Finally, the
restrained masonry infill wall within the RC frame behaved similarly to
that of the masonry wall tested in the laboratory. This suggests that the
boundary conditions imposed in the experiments successfully
represented those conditions present in a real frame.
9. 2 Limitations of this research
Both experimental and analytical methods were used to evaluate the
mechanical performance of a masonry wall under combined quasi-static
lateral loading. However, there are still some issues that are not covered in
233

Chapter 9 Conclusions, Limitations and Recommendations
this thesis. The limitations in this research regarding to the experimental and
computational work are listed as following:
1. In this project, only monotonic loading was considered. As most walls
are strengthened against earthquake loads, future research needs to
take into account cyclic loading. Furthermore, dynamic analysis should
be considered when investigating the influence of the collar jointed
masonry wall on the structural period of the composite structure.
2. In terms of the experimental tests, only one type of brick and mortar
was used in this research. Furthermore, as masonry is a complex
composite material, more walls need to be tested to increase the size
of the data sets.
3. In this research, the material calibration work is ‘‘tuned’’ manually,
which is cumbersome and time consuming. In future research, other
approaches in calibrating material parameters should be applied as
well.
9. 3 Recommendations for future work
Regarding further research on unreinforced single-leaf masonry wall as well
as collar jointed masonry walls, and the computational modelling of masonry
structures, the following recommendations are given:
• It is advisable to do more experiments regarding the material
properties of masonry. Experimental data are scarce and it is
desirable to expand the experimental data, particularly with respects
to brick and mortar types (it is expected that failure mechanisms will
also be dependent on masonry element properties).
234

Chapter 9 Conclusions, Limitations and Recommendations
• Data collection: the results of the experiments would be more reliable
if more than one LVDT could be used to measure displacement
during the tests. DEMEC gauges were used to measure strain during
the tests, and the tests had to be paused in order to record the
DEMEC gauge readings. If an electronic measurement system could
be used to measure the strain change then more accurate and
reliable data would be recorded.
• Enhancing the collar-joint: For future work, steel ties/anchors could be
used to enhance the shear capacity of the joint. Also, for the
retrofitted masonry wall, more preparation could be performed to help
key in the collar joint to the existing leaf (i.e. partially grind out the
mortar joints); this would be expected to drastically improve the post
damaged wall’s behaviour.
• The collar joint was fully infilled in this research. However, in practice,
different percentages of the collar joint infill would be likely occurred
and so the effect of a partially infilled collar joint needs to be
determined.
• This research only considered in-plane failure. Out-of-plane failure
can be taken into account in the future work.
235

References
References
Abdel-Hafez, L. M., Abouelezz, A. E. Y. and Elzefeary, F. F. (2015) 'Behavior of masonry strengthened infilled reinforced concrete frames under in-plane load', HBRC Journal, 11.2, 213-223.
Abdou, L., Ami, S. R., Meftah, F. and Mebarki, A. (2006) 'Experimental
investigations of the joint-mortar behaviour', Mechanics Research Communications, 33(3), 370-384.
Abrams, D. P. and Lynch, J. M. (2001) 'Flexural behaviour of retrofitted
masonry piers,' in KEERC-MAE Joint Seminar on Risk Mitigation for regions of Moderate Seismicity, Illinois, USA,
Abrams, D. P. and Shah, N. (1992) 'Cyclic load testing of unreinforced
masonry walls', ILLINOIS UNIV AT URBANA ADVANCED CONSTRUCTION TECHNOLOGY CENTER.
Al-Chaar, G. and Mehrabi, A. (2008) 'Constitutive models for nonlinear finite
element analysis of masonry prisms and infill walls', US Army Corps of Engineering.
Al-Chaar, G. K. (2002) 'Evaluating strength and stiffness of unreinforced
masonry infill structures', ERDC.CERL TR-02-1. Champaign, IL: Engineer Research and Development Center-Construction Engineering Research Laboratory.
Al-Chaar, G. K., Issa, M. and Sweeney, S. (2002) 'Behavior of masonry-
infilled non-ductile reinforced concrete concrete frames', Journal of Structural Engineering, 1055-1063.
Alcaino, P. and Santa-Maria, H. (2008) 'Experimental response of externally
retrofitted masonry walls subjected to shear loading', Journal of composites for Construction ASCE, 12 (5), 489-98.
Ali, S., Moore, I. D. and Page, A. W. (1987) 'Substructuring technique in
nonlinear analysis of brick masonry subjected to concentrated load', Computers & structures, 27(3), 417-425.
Almeida, J. C., Lourenco, P. B. and Barros, J. O. (2002) 'Characterization of
brick and brick-mortar interface under uniaxial tension', 7th
international seminar on structural masonry for developing countries. Brazil: 67-76.
Anand, S. C. and Yalamanchili, K. K. (1996) 'Three-dimensional failure
analysis of composite masonry walls', Journal of Structural Engineering-Asce, 122(9), 1031-1039.
236
References
Anderson, C. and Held, L. C. (1986) 'The effect of sand grading on mortar properties and tensile bond strength of brickwork specimens', Proceedings of the Brick Masonry Society, 1, 1-6.
Attard, M. M., Nappi, A. and Tin-Loi, F. (2007) 'Modelling fracture in
masonry', Journal of structural Engineering, ASCE, 133(10), 1385-1392.
Azevedo, J. and Sincraian, G. (2001) 'Modelling the seismic behaviour of
monumental masonry structures', Proceedings of the international congress archi 2000,UNESCO, Bethlehem, Palestine.
Beattoe, G., Molyneaux, T. C. K., Gilbert, M. and Burnett, S. (2001)
'Masonry shear strength under impact loading', In proceeding of 9th Canadian Masonry Symposum, New Brunswick, Canada.
Bhattacharya, S., Nayak, S. and Dutta, S. C. (2014) 'A critical review of
retrofitting methods for unreinforced masonry structures', International Journal of Disaster Risk Reduction, 7, 51-67.
Binda, L., Pina-Henriques, J., Anzani, A., Fontana, A. and Lourenco, P. B.
(2006) 'A contribution for the understanding of load-transfer mechanisms in multi-leaf masonry walls: Testing and modelling', Engineering Structures, 28(8), 1132-1148.
Brooks, J. J. (2014) 'Concrete and masonry movement', Oxford,
UK:Butterworth Heinemann Publictations. British Standards Institution. (1976) BS 1199 and 1200. 'Specification for
building sands from natural source', London, British Standards Institution.
British Standards Institution. (1985) BS 3921. 'Specification for clay bricks',
London, British Standards Institution. British Standards Institution. (1998) BS 4551-1. 'Methods of testing mortars,
screeds and plasters, Part 1. Physical testing', London, British Standards Institution.
British Standards Institution. (1999) BS EN 1015-11. 'Methods of test for
mortar for masonry, Part 1: Determination of flexural and compressive strength of hardened mortar', London, British Standards Institution.
British Standards Institution. (2000) BS 410-2. 'Test sieves-Technical
requirements and testing, Part 2: Test sieves of perforated metal plate', London, British Standards Institution.
237

References
British Standards Institution. (2005) BS 5628-1. 'Code of practice for the use of masonry, Part 1: structural use of unreinforced masonry', London, British Standards Institution.
British Standards Institution. (2010) BS EN 998-2. 'Specification for mortar
for masonry, Part 2: Masonry mortar', London, British Standards Institution
British Standards Institution. (2011a) BS EN 772-1. 'Cememnt Part 1:
Composition, specifications and conformity criteria for common cements', London, British Standards Institution.
British Standards Institution. (2011b) BS 197-1. 'Methods of test for masonry
units, Part 1: Determination of compressive strength', London, British Standards Institution.
British Standards Institution. (2015) BS 459-1. 'Building lime Part 1:
Definitions, specifications and conformity criteria', London, British Standards Institution.
Burgoyne C.J., (2004) 'Does FRP have an econmic fugure?', 4th conference
on advanced composite materials in bridges and structures, Calgary, Alberta, July 2004.
Campbell Barraz, J. A. (2012) 'Numerical model for nonlinear analysis of
masonry walls', PhD thesis. Chaimoon, K. (2007) 'Numerical simulation of fracture in unreinforced
masonry', unpublished thesis The University of New South Wales, Sydney, Australia.
Chaimoon, K. and Attard, M. M. (2007) 'Modeling of unreinforced masonry
walls under shear and compression', Engineering Structures, 29(9), 2056-2068.
Chrysostomou, C. Z., Gergely, P. and Abel, J. F. (2002) 'A six-strut model
for nonlinear dynamic analysis of steel infilled frames', International Journal of Structural Stability and Dynamics, 2.03(335-353).
Chuxian, S., Guiqiu, L. and Wenchao, W. (1997) 'The design of brick
masonry structure with concrete column', 11th international brick and block masonry conference, Shanghai, China: 626-633.
Crisafulli, F. (1997) 'Seismic behaviour of reinforced concrete structures with
masonry infills', PhD thesis, University of Canterbury. Crisafulli, F., Carr, A. and Park, R. (2000) 'Analytical modelling of infilled
frame structures: a general review', Bulletin-New Zealand Society for Earthquake Engineering, 33.1, 30-47.
238

References
Crisafulli, F., Carr, A. and Park, R. (2005) 'Experimental response of framed
masonry structures designed with new reinforcing details' Bulletin of the New Zealand society for earthquake engineering, Vol. 38, No.1, 19-32.
Cundall, P. A. (1971) 'A computer model for simulating prgressive large
scale movements in blocky rock systems ', in Proceedings of the symposium of the international society of rock mechanics, Nancy, France,
Dhanasekar, M. (1985) 'The performance of brick masonry subjected to in-
plane loading', PhD thesis, University of Newcastle. Dialer, C. (1990) 'Fracture and deformation behaviour of stress, biaxial tests
on scale model masonry', PhD thesis, Technical University of Munich, Germany.
Dolatshahi, K. M. and Aref, A. J. (2011) 'Two-dimensional computational
framework of meso-scale rigid and line interface elements for masonry structures', Engineering Structures, 33(12), 3657-3667.
Dowling, D., Samali, B. and Li, J. (2005) 'An improved means of reinforcing
adobe walls-external vertical reinforcement', in Sismo Adobe, PUCP, Lima, Peru, May 16-19th,
Ehsani, M., Saadatmanesh, H. and Velazquez-Dimas, J. (1999) 'Behavior of
retrofitted URM walls under simulated earthquake loading', Journal of Composites for Construction, 3 (3)(134-42).
El-Dakhakhni, W., Elgaaly, M. and Hamid, A. (2003) 'Three-strut model for
concrete masonry-infilled steel frames', Journal of Structural Engineering, 129(2), 177-185.
ElGawady, M., Lestuzzi, P. and Badoux, M. (2006) 'Retrofitting of masonry
walls using shotcrete', 13th international brick and block masonry conference, Vlo. 10 No. 10, New Zealand.
ElGawady, M. A., Lestuzzi, P. and Badoux, M. (2004a) 'a review of
conventional seismic retrofitting techniques for URM', in 13th International brick and block masonry conference, Amsterdam,
ElGawady, M. A., Lestuzzi, P. and Badoux, M. (2004b) 'A review of
retrofitting of unreinforced masonry walls using composits', in 4th International Conference on Advanced Composite Materials in Bridges and Structures, Calgary, Alberta, Cananda, July 20-23, 2004,
239

References
Eurocode 6. (1996) 'Design of masonry structures-Part 1-1: General-Rules for reinforced and unreinforced masonry, including lateral loading'. London.
Eurocode 8. (1996) 'Design provisions for earthquake resistance of structure.
London'. Fardis, M. N., Bousias, S. N., Franchioni, G. and Panagiotakos, T. B. (1999)
'Seismic response and design of RC structurs with plan-eccentric masonry infills', Journal of Earthquake Engineering and Structural Dynimicas, 28(173-191).
Ferguson, W. (2002) 'Collar-jointed walls: an assessment of their
performance and buildability', Proceedings of the British Masonry Society.
Forth, J. P. (2009) 'Movement in masonry: ICE manual of construction
materials', Thomas Telford. 431-442. Forth, J. P., Brooks, J. J. and Tapsir, S. H. (2000) 'The effect of unit water
absorption on long-term movements of masonry', Cement and Concrete Composites, 22.4, 273-280.
Garofano, A. (2011) 'Structural behaviour of masonry walls stregthened with
mortar layers reinforced with FRP grids', Master's thesis. Ghaboussi, J. and Barbosa, R. (1990) 'Three-dimensional discrete element
method for granular materials ', International journal of Numerical and Analytical Methods in Geomechanics, 14.7, 451-472.
Ghazali, M. Z. and Riddington, J. R. (1988) 'Simple test method for masonry
shear strength ', Proceedings of the institution of civil engineers, 85.3, 567-574.
Giordana, A., Mele, E. and Luca, A. (2002) 'Modelling of historical masonry
structures: Comparison of different approaches through a case study', Engineering Structures, 24(8), 1057-1069.
Groot, C. (1993) 'Effects of water on mortar-brick bond', PhD thesis Delft University of Technology, Delft.
Hamid, A., Mahmoud, A. and Abo El Maged, S. (1994) 'Strengthening and
repair of unreinforced masonry structures: stage-of-the-art', in 10th Internation Brick and Block Masonry Conference, Calgary, Canada, 485-497.
Harries, K. A. and Sharma, B. (2016) 'Nonconventional and vernacular
construction materials: characterisation, properties and applications', Woodhead Publishing.
240

References
Heaton, T., Sammon, C., Ault, J., Black, L. and Forth, J. P. (2014) 'Masonry units bound with waste vegetable oil-Chemical analysis and evaluation of engineering properties', Construction and Building materials, 64, 460-472.
Hendry, A. W. (1998) 'Sructural masonry', 2nd Edition ed., Palgrave
Macmillan, London, UK. Heyman, J. (1998) 'Structural Analysis: A historical approach', University
Press, Cambridge, UK. Kanyeto, O. J. (2006) 'Investigation of the behaviour of laterally loaded thin-
jointed concrete-block masonry panels', PhD thesis, Kingston University London, Kingston Upon Thames.
Kaushik, H., Rai, D. and Jain, S. (2007) 'Stress-strain characteristics of clay
brick masonry under uniaxial compression', Journal of Materials in Civil Engineering, 19.9, 728-739.
Kaushik, H. B., Rai, D. C. and Jain, S. K. (2007) 'Stress-strain
characteristics of clay brick masonry under uniaxial compression', Journal of Materials in Civil Engineering, 19(9), 728-739.
Koutromanos, I. (2011) 'Numerical analysis of masonry-infilled reinforced
concrete frames subjected to seismic loads and experimental evaluation of retrofit techniques', PhD thesis, University of California, San Diego.
Krauth, T., Ruth, W. T. and Vannoy, D. W. (2001) 'Investigation and repaire
of an improperly constructed masonry barrier wall system', Forensic Engineering: the investigatio of failure: proceedings of the second international conference on forensic engineering organized by the institution of civil engineering, London, UK:Thomas Telford.
Lawrence, S. J., Sugo, H. O. and Page, A. W. (2008) 'Masonry bond
strength and the effects of supplementary cementitious materials', Australian Journal of Structural Engineering, 8 (2), 101-115.
Lemos, J. (2007) 'Discrete element modelling of masonry structures',
international Journal of Architecture Heritage, 1, 190-213. Lenczner, D. (1990) 'Review on creep and stress relaxation in brick masonry
', Structural Engineering, 2, 161-168. Lotif, H. R. (1992) 'Finite element analysis of fracture of concrete and
masonry structures', PhD thesis, University of Colorado at Boulder. Lotif, H. R. and Shing, P. B. (1994) 'Interface model applied to fracture of
masonry structures', Journal of Structural Engineering, 120.1, 63-80.
241

References
Lourenco, P. B. (1998b) 'Senstivity analysis of masonry structures', The 8th
Canadian Masonry Symposium, Jasper, Canada: 563-574. Lourenco, P. B. (2002) 'Computations of historical masonry constructions',
Progress in Structural Engineering and Materials, 4 (3), 301-19. Lourenco, P. B. and Pina-Henriques, J. (2006) 'Validation of analytical and
continuum numerical methods for estimating the compressive strength of masonry', Computers and Structures, 84.29, 1977-1989.
Lourenco, P. B. (1996) 'Comuptational strategies for masonry structures',
PhD thesis, Delft University of Technology. Lourenco, P. B. and Rots, J. G. (1997) 'Multisurface interface model for
analysis of masonry structures', Journal of Engineering Mechanics-Asce, 123(7), 660-668.
Mahmood, H. and Ingham, J. (2011) 'Diagonal compression testing of FRP-
Retrofitted unreinforced clay brick masonry wallettes', Journal of composites for Construction ASCE, 15 (5), 810-20.
Mainstone, R. J. (1971) 'On the stiffness and strengths of infilled frames',
Proceedings of the Institution of Civil Engineers, 57-90. Marquis, E. L. and Borchelt, G. (1986) Bond strength comprarison of
laboratory and field tests, the 4th Canadian Masonry Symposium, Federation New Brunswick: 94-204.
Matthys, H. and Noland, L. (1989) Proceedings of an international seminar
on evaluation, strengthening and retrofitting masonry buildings, TMS, Colorado, USA.
Mayorca, P. and Meguro, K. (2004) 'Proposal of an efficient technique for
retrofitting unreinforced masonry dwellings', in 13th World Conference on Earthquake Engineering,, No. 2431.
Mehrabi, A. (1994) Behaviour of masonry-infilled reinforced concrete frames
subjected to lateral loading, PhD thesis, University of Colorado-Boulder.
Mehrabi, A. B. and Shing, P. B. (1997) 'Finite element modelling of masonry-
infilled RC frames', Journal of Structural Engineering, 123, 604-613. Mehrabi, A. B., Shing, P. B., Schuller, M. P. and Noland, J. L. (1994)
'Performance of masonry0infilled R/C frames under in-plane lateral loads', Report No. CU.SR-94/6, University of Colorado at Boulder.
242

References
Mehrabi, A. B., Shing, P. B., Schuller, M. P. and Noland, J. L. (1996) 'Experimental evaluation of masonry-infilled RC frames', Journal of Structural Engineering-Asce, 122(3), 228-237.
Melbourne, C. and Tomor, A. K. (2005) Effect of weak/deteriorated masonry
on the performance of arch bridges (Arch tests R-S). , Test Report, University of Salford, Salford, UK.
MIDAS (2013) Nonlinear FE analysis software, MIDAS Information
Technology Co. CSP. Mortar Industry Association (2013) 'Learning text part 5: Brick and block
production', Mortar Industry Assoication. Mirza, S. A., Phipps, M. E. and Bell, A. J. (2002) 'The performance of collar
jointed masonry in compression', Proceedings of the British Masonry Society.
Mosalam, K., Glascoe, L. and Bernier, J. (2009) 'Mechanical properties of
unreinforced brick masonry section-1', Documented to US Department of Energy by Lawrence Livermore National Laboratory.
Oliveira, D. V. C. (2003) 'Experimental and numerical analysis of blocky
masonry structures under cyclic loading' PhD thesis, University of Minho, Portugal.
Page, A. W. (1978) 'Finite-element model for masonry ', Journal of structure
Division, ASCE, 104 (8), 1267-85. Papas, A. W. (2012) 'Calibration of the numerical material behaviour of
multi-leaf stone masonry walls based on experimental results', PhD thesis, University of Padova.
Pel, L., Kopinga, K. and Brocken, H. (1995) 'Moisture transport in prous
building materials', PhD thesis, Technische Universiteit Eindhoven. Peraza, D. (2009) 'Special problems with composite multiwythe masonry
walls', Foresnsic Engineering, 66-73. Pina-Henriques, J., Lourenco, P. B., Binda, L. and Anzani, A. (2004) Testing
and modelling of multiple-leaf masonry walls under shear and compression, translated by Leiden (NL): Balkema: 299-310.
Pradhan, P. M., Pradhan, P. L. and Maskey, R. K. (2012) 'A review on
partial infilled frames under lateral loads', Kathmandu University Journal of Science, Engineering and Technology, 8.1, 142-152.
Rai, D. and Goel, S. (1996) 'Seismic strengthening of unreinforced masonry
piers with steel elements', Earthquake Spectrume, 12, 845-862.
243

References
Raijmakers, T. and Vermeltfoort, A. T. H. (1992) 'Deformation controlled
tests in masonry shear walls', Report B-92-1156, TNO-BOUW, Delft, The Nehterlands.
Ramalho, M. A., Taliercio, A., Anzani, A., Binda, L. and Papa, E. (2005)
'Experimental and numerical study of multi-leaf masonry walls', Transactions on the built environment, 333-342.
Ramalho, M. A., Taliercio, A., Anzani, A., Binda, L. and Papa, E. (2008) 'A
numerical model for the description of the nonlinear behaviour of multi-leaf masonry walls', Advances in Engineering Software, 39(4), 249-257.
RILEM TC-50 FMC Recommendation (1985) 'Determination of the fracture
energy of mortar and concrete by means of three-point bend tests on notched beams', Materials and Structures, 18(106). 285-290.
Roca, P., González, J. L., Oñate, E. and Lourenço, P. B. (1998)
'Experimental and numerical issues in the modelling of the mechanical behaviour of masonry', Structural Analysis of Historical Constructions II. CIMNE, Barcelona.
Rots, J. G. (1991) 'Numerical simulation of cracking in masonry', HERON,
36(2), 49-63. Rots, J. G. (1997) 'Structural masonry: An experimental/numerical basis for
practical design rules', The Netherlands:A.A. Balkema Publishers. Sahlin, S. (1971) 'Structural masonry', Premtoce-Hall, Englewood Cliffs, NJ. Sarangapani, G., Venkatarama, R. B. V. and Jagadish, K. S. (2005) 'Brick-
mortar bond and masonry compressive strength', Journal of Materials in Civil Engineering, 17(2), 229-237.
Sarhosis, V. (2012) 'Computational modelling of low bond strength masonry',
PhD thesis, The University of Leeds. Sarhosis, V., Garity, S. W. and Sheng, Y. (2015) 'Influence of brick-mortar
interface on the mechanical behaivour of low bond strength masonry brickwork lintels ', Engineering Structures, 88, 1-11.
Sarhosis, V. and Sheng, Y. (2014) 'Identification of material parameters for
low bond strength masorny', Engineering Structures, 60, 100-10. Sathiparan, N., Mayorca, P., Nesheli, K. N., Guragain, R. and Meguro, K.
(2005) 'Experimental study on in-plane and out-of-plane behaviour of masonry wallettes retrofitted by PP-band meshes', 生産研究, 57(6), 530-533.
244

References
Sattar, S. (2013) 'Influence of masonry infill walls and other building
characteristics on seismic collapse of concrete frame buildigs', PhD thesis, University of Colorado
Saw, C. B. (1974) 'Linear elastic finite element analysis of masonry walls on
beams', Building Science, 9(4), 299-307. Schubert, P. (1988) 'The influence of mortar on the strength of masonry', the
8th international brick and block masonry conference, 162-174. Schwegler, G. (1994) 'Masonry construction strengthened with fiber
composites in seismically endangered zones', in the 1oth European Conference on Earthquake Engineering, Vienna, Austria,
Stavridis, A. (2009) Analytical and experimental study of seismic
performance of reinforced concrete frames infilled with maosnry walls, PhD thesis, University of California San Diego.
Stavridis, A. and Shing, P. B. (2008) 'Calibration of a numerical model for
masonry infilled RC frames', The 14th world conference on earthquake engineering, Beijing, China.
Stavridis, A. and Shing, P. B. (2010) 'Finite-element modelling of nonlinear
behaviour of masonry-infilled RC frames', Journal of Structural Engineering, 136, 285-296.
Surendran, S. and Kaushik, H. B. (2012) 'Masonry infill RC frames with
openings: review of in-plane lateral load behaviour and modeling approaches', The open construction and building technology journal, Suppl 1-M9, 126-154.
Taghdi, M. (2000) 'Seismic retrofit of low-rise masonry and concrete walls by
steel strips', PhD thesis, University of Ottawa, Ottawa, Canada. Tarque, N. (2011) 'Numerical modelling of the seismic behaviour of adobe
buildings', PhD thesis, Universitá degli Studi di Pavia, Istituto Universitario di Studi Superiori, Pavia, Italy.
Teng, J. G., Chen, J. F., Smith, S. T. and Lam, L. (2003) 'Behaviour and
strength of FRP-strengthened RC structures: a state-of-the-art review', Proceedings of the institution of civil engineers-structures and buildings, 156(1), 51-62.
Tetley, R. and Madabhushi, G. (2007) 'Vulnerability of adobe buildings under
earthquake loading', in Fourth Conference Earthquake Geotechnical Engineering, Thessaloniki, Greece,
245
References
Tomaževič, M. and Klemenc, I. (1997) 'Seismic behaviour of confined masonry walls', Earthquake Engineering and Structural Dynamics, 26.10, 1059-1071.
Triantafillou, T. C. (1998) 'Strengthening of masonry structures using Epoxy-
bonded FRP laminates', Journal of Composites for Construction, 96-104.
Turer, A., Korkmaz, S. Z. and Korkmaz, H. H. (2007a) 'Performance
improvement studies of masonry houses using elastic post-tensioning straps', Earthquake Engineering and Structural Dynamics, 36, 683-705.
Turer, A., Korkmaz, S. Z. and Korkmaz, H. H. (2007b) 'Performance
improvement studies of masonry houses using elastic post-tensioning straps', Earth Engineering and Structural Dynamics, 36.5, 683-705.
Tzamtzis, A. D. and Asteris, P. G. (2003) 'Finite element analysis of
masonry structures: Part I: Review of previous work', in 9th North American masonry conference,
Valluzzi, M. R., Tinazzi, D. and Modena, C. (2002) 'Shear behaviour of
masonry panels strengthened by FRP laminates', Construction and Building materials, 16.7, 409-416.
Van der Pluijm, R. (1992b) 'Material properties of masonry and its
components under tension and shear', in 6th Canadian masonry symposium, Saskatchewan Canada, 675-686.
Van der Pluijm, R. (1993) 'Shear behaviour of bed joints', the 6th North
American Masonry Conference, Drexel University, Philadelphia, Pennsylvania, USA: 125-136.
Van der Pluijm, R. (1997) 'Non-linear behaviour of masonry under tension',
HERON-ENGLISH EDITION, 42, 25-54. Van der Pluijm, R. (1999) 'Out-of-plane bending of masonry behaviour and
strength', PhD thesis, Eindhoven University of Technology, The Netherlands.
Van der Pluijm, R., Rutten, H. and Ceelen, M. (2000) 'Shear behaviour of
bed joints', 12th Int. Brick/Block Masonry Conf. Proc. 1849-1862. Van Noort, J. R. (2012) 'Computational modelling of masonry structures',
PhD thesis, Delft Unviersity of Technology. Van Zijl, G. P. A. G. (2004) 'Modelling Masonry Shear-Compression: Role of
Dilatancy Highlighted', Journal of Engineering Mechanics, 130.11, 1289-1296.
246

References
Van Zijl, G. P. A. G. (2004) 'Modelling masonry shear-compression: role of
dilatancy highlighted', Journal of Engineering Mechanics, 130, 1289-1296.
Vermeltfoort, A. and Raijmakers, T. (1993) 'Shear tests on masonry walls',6th
North American Masonry Conference, 1183-93. Vermeltfoort, A. T. H. (2005) 'Brick-mortar interaction in masonry under
compression', PhD thesis, Technische Universiteit Eindhoven. Vermeltfoort, A. T. H., Martens, D. E. W. and Van Zijl, G. P. G. (2007) 'Brick
mortar interface effects on masonry under compression', Canadian Journal of Civil Engineering, 24 (1), 1475-1485.
Vintzileou, E. (2007) 'Grouting of three-leaf masonry: experimental results
and prediction of mechanical properties', Evoluzione nella sperimentazione per le costruzioni, Cipro. Cerca con Google.
Vintzileou, E. and Miltiadou-Fezans, A. (2008) 'Mechanical properties of
three-leaf stone masonry grouted with ternary or hydraulic lime-based grouts', Engineering Structures, 30, 2265-2276.
Vintzileou, E. and Tassios, T. P. (1995) 'Three-leaf stone masonry
strengthened by injecting cement grouts', Journal of Structural Engineering, 121.5, 848-856.
Wang, J., Heath, A. and Walker, P. (2013) 'Experimental investigation of
brickwork behaviour under shear, compression and flexure', Construction and Building materials, 48, 448-456.
Wijanto, L. S. (2007) 'Seismic Assessment of Unreinforced Masonry Walls',
PhD thesis, University of Canterbur, New Zealand. Zarnic, R. and Tomazevic, M. (1984) 'The behaviour of masonry infilled
reinforced concrete frames subjected to cyclic lateral loading.', in In: Proceedings of ninth world conference on earthquake engineering, San Francisco, USA, 863-870.
Zhuge, Y. (2008) 'Distinct element modelling of unreinforced masonry wall
under seismic loads with and without cable retrofitting', Transactions of Tianjin University, 14(1), 471-475.
Zhuge, Y., Jin, F. and Hunt, S. (2004) 'The prediction of damage to maosnry
houses caused by foundation movements', Advances in Structural Engineering, 7(1), 81-93.
247

References
Zucchini, A. and Lourenco, P. B. (2006) 'Mechanics of masonry in compression: Results from a homogenisation approach', Computers and Structures, 85(3), 193-204.
248