Embed Size (px)
Citation preview
EMBARGOED FOR MONDAY, JANUARY 28, 2002 1:00 A.M.
Return to Normalcy? How the Media Have Covered the War on Terrorism
FOR FURTHER INFORMATION CONTACT: Tom Rosenstiel, Director Amy Mitchell, Associate Director Chris Galdieri, Atiba Pertilla, Tom Avila, Research Wally Dean, Dante Chinni, Nancy Anderson, Editorial Lee Ann Brady, Senior Project Director, Princeton Survey Research Associates
1
Return To Normalcy? How the Media Have Covered the War on Terrorism
The news media reacted to the terrorist attacks of September 11 with great care
about not getting ahead of the facts, but over time the press is inching back toward pre-September 11th norms of behavior, according to a new study of press coverage of the war on terrorism. In the beginning, solid sourcing and factualness dominated the coverage of the bombings and their aftermath, according to the study, conducted by the Project for Excellence in Journalism with Princeton Survey Research Associates. A full 75% of what the press reported was a straightforward accounting of events--here is what happened. As the story moved to the war in Afghanistan, however, analysis and opinion swelled—so much so that the level of factualness declined to levels lower than those seen in the middle of the Clinton-Lewinsky scandal. The early coverage may help account for why we saw the first measurable upturn in public approval of the press in 15 years. But the changes in coverage offer a caution about why that approval has started to fall again.
Has the news media become jingoistic in covering the war amid intense Pentagon restrictions? Or is there a liberal or negative tilt to the coverage?
The study found that during the periods examined the press heavily favored pro-Administration and official U.S. viewpoints—as high as 71% early on. Over time the balance of viewpoints has broadened somewhat.
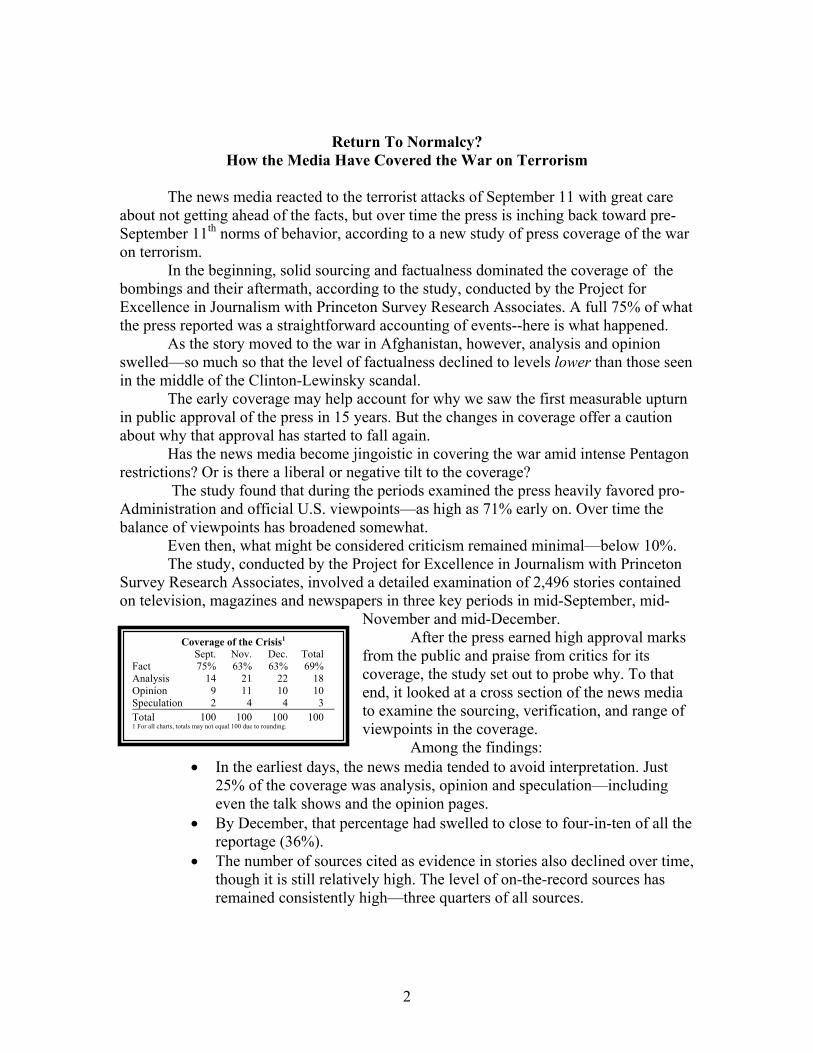
Even then, what might be considered criticism remained minimal—below 10%. The study, conducted by the Project for Excellence in Journalism with Princeton Survey Research Associates, involved a detailed examination of 2,496 stories contained on television, magazines and newspapers in three key periods in mid-September, mid-
November and mid-December. Coverage of the Crisis1
Sept. Nov. Dec. Total Fact 75% 63% 63% 69% Analysis 14 21 22 18 Opinion 9 11 10 10 Speculation 2 4 4 3 Total 100 100 100 100 1 For all charts, totals may not equal 100 due to rounding.
After the press earned high approval marks from the public and praise from critics for its coverage, the study set out to probe why. To that end, it looked at a cross section of the news media to examine the sourcing, verification, and range of viewpoints in the coverage.
Among the findings: • In the earliest days, the news media tended to avoid interpretation. Just
25% of the coverage was analysis, opinion and speculation—including even the talk shows and the opinion pages.
• By December, that percentage had swelled to close to four-in-ten of all the reportage (36%).
• The number of sources cited as evidence in stories also declined over time, though it is still relatively high. The level of on-the-record sources has remained consistently high—three quarters of all sources.
2
On talk shows, journalists often seemed to luxuriate in sounding not like knowledgeable experts on TV stages, but like anyone else standing in a barroom.
The death of Osama Bin Laden’s third in command for CNN’s Margaret Carlson on December 17 was “another reason to be cheerful."
“Having Osama bin Laden on trial in the United States of America is a nightmare,” Cokie Roberts declared on ABC’s This Week November 18. “With any luck, you know, he is--he is found dead.”
The study examined a snapshot of the news media culture during three different phases of the crisis. We looked at four newspapers (The New York Times, Washington Post, Cleveland Plain Dealer and the Fresno Bee), two news magazines (Time and Newsweek) four nightly news broadcasts (ABC, CBS, NBC and PBS), the three main network morning shows, the Sunday talk shows, three weeknight talk shows (Larry King, Charlie Rose and Hardball with Chris Matthews), Nightline, and relevant segments of three prime time network news magazines (Dateline, 20/20 and 60 Minutes II). The study also included an examination of two cable nightly newscasts (Fox Special Report with Brit Hume1 and CNN’s NewsNight with Aaron Brown. The study focused on three phases of the crisis, September 13-15, November 13-15 and December 10-12 as well as the closest weekend Sunday shows and news magazines.
The Project for Excellence in Journalism is a journalism think tank affiliated with Columbia University Graduate School of Journalism and is funded by The Pew Charitable Trusts.
One reason for the decline in sourcing and factualness and the rise in interpretation over time may be the restrictions the government is imposing on journalists’ access to information. “The restrictions are unprecedented and they are successful,” ABC National Security correspondent John McWethy told a panel at Columbia University Graduate School of Journalism last week.
The evidence strongly suggests that coverage is more factual when journalists have more information and becomes more interpretative, perhaps ironically, when they have less.
OTHER OVERALL FINDINGS
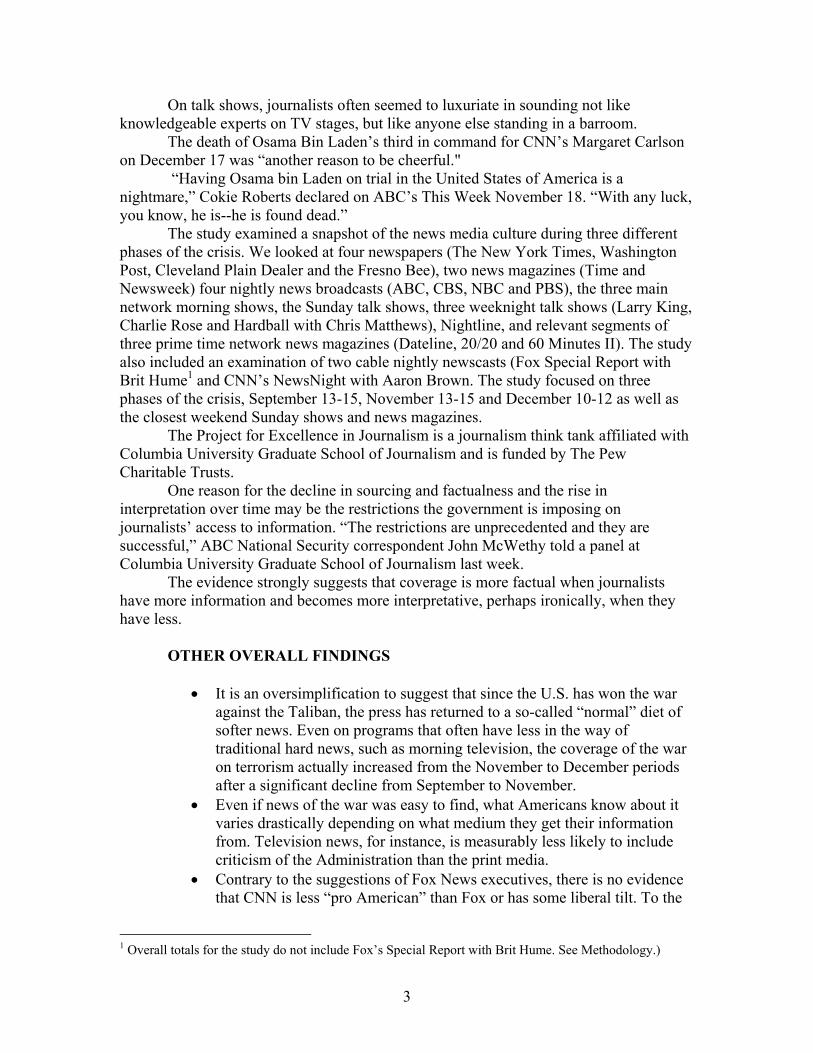
• It is an oversimplification to suggest that since the U.S. has won the war
against the Taliban, the press has returned to a so-called “normal” diet of softer news. Even on programs that often have less in the way of traditional hard news, such as morning television, the coverage of the war on terrorism actually increased from the November to December periods after a significant decline from September to November.
• Even if news of the war was easy to find, what Americans know about it varies drastically depending on what medium they get their information from. Television news, for instance, is measurably less likely to include criticism of the Administration than the print media.
• Contrary to the suggestions of Fox News executives, there is no evidence that CNN is less “pro American” than Fox or has some liberal tilt. To the
1 Overall totals for the study do not include Fox’s Special Report with Brit Hume. See Methodology.)
3
contrary, there is no appreciable difference in the likelihood of CNN to air viewpoints that dissent from American policy than there is Fox. This may not be anything to boast about. Both channels tended to favor pro-Administration viewpoints more than most other newscasts—even most talk shows.
• Just as the Project found in the Clinton-Lewinsky scandal, those who know the least may be the most prone to offer their opinions. As a rule, the weaker a story’s sourcing, the more likely it is to be interpretive. The better the sourcing, the less likely it is to interpret.
The three phases of the crisis examined in the study each offered distinct story
lines. The first phase, September 13 to 15, began with the day the television media
returned to regular news programming. The press focused on a nation in shock. Airlines remained grounded. President Bush was still five days from addressing a joint session of Congress to outline the U.S. response. The coverage focused on four themes—the potential war on terrorism, the September attacks and rescue efforts, personal connections stories, and citizen, community and state response.
The second phase of the study examined two months later, November 13 -15. The Northern Alliance was making major gains in the north. The Taliban was fleeing the Afghan capitol of Kabul, but it was still unclear whether this was a collapse or a strategic regrouping. The press coverage focused on the action in Afghanistan, the war on terrorism in general and the international response.
The third phase of the study examined December 10 through 12. The Taliban had fled Kandahar to the mountains around Tora Bora. The U.S. military focus had turned to the hunt for Bin Laden, Taliban leader Mullah Omar and other al Qaida leaders. The coverage focused on action in Afghanistan, the fight against terrorism generally, and continuing community and civic response to the September attacks.
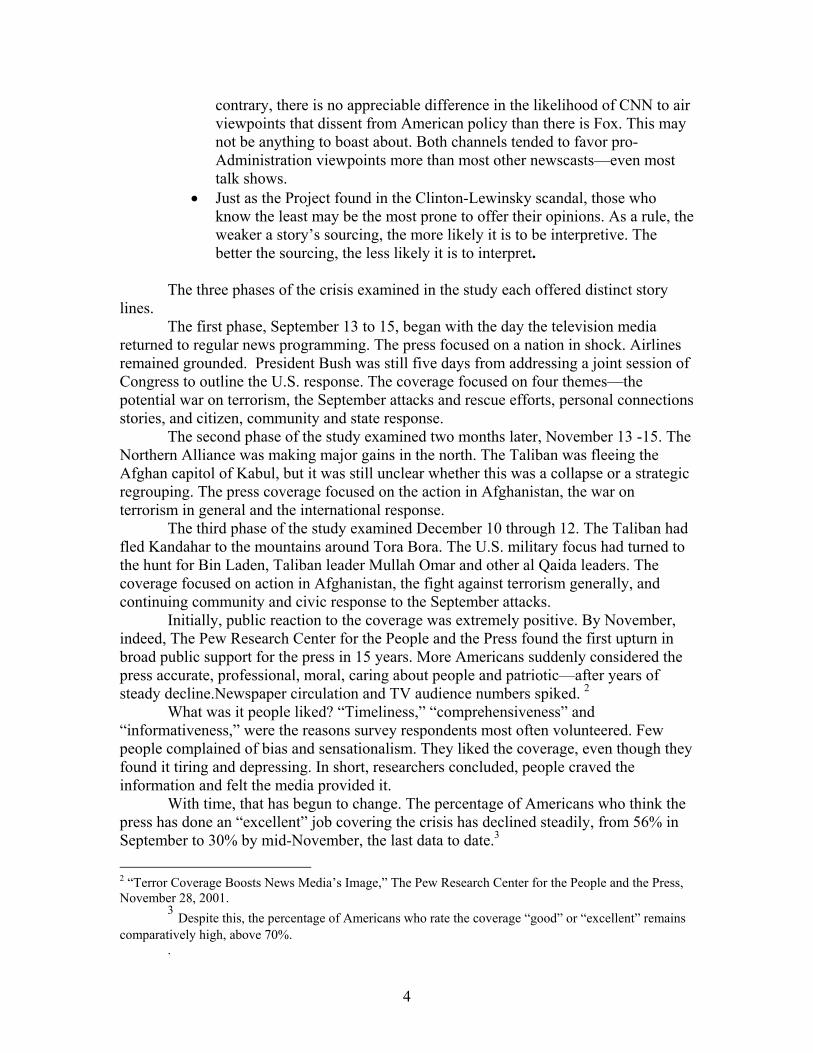
Initially, public reaction to the coverage was extremely positive. By November, indeed, The Pew Research Center for the People and the Press found the first upturn in broad public support for the press in 15 years. More Americans suddenly considered the press accurate, professional, moral, caring about people and patriotic—after years of steady decline.Newspaper circulation and TV audience numbers spiked. 2
What was it people liked? “Timeliness,” “comprehensiveness” and “informativeness,” were the reasons survey respondents most often volunteered. Few people complained of bias and sensationalism. They liked the coverage, even though they found it tiring and depressing. In short, researchers concluded, people craved the information and felt the media provided it.
With time, that has begun to change. The percentage of Americans who think the press has done an “excellent” job covering the crisis has declined steadily, from 56% in September to 30% by mid-November, the last data to date.3 2 “Terror Coverage Boosts News Media’s Image,” The Pew Research Center for the People and the Press, November 28, 2001.
3 Despite this, the percentage of Americans who rate the coverage “good” or “excellent” remains comparatively high, above 70%.
.
4
What accounts for the declining public approval? For years, surveys, focus groups and other research have found consistent patterns in what people say they don’t want from the press. People dislike anonymous sourcing. They want information more than interpretation. They resent journalists offering what they think rather than what they know. They dislike hype and the sense that the media is manufacturing and sensationalizing stories.
As the war on terrorism progressed, the press, for a variety of reasons, began to rely more on the methods and habits disliked by the public. In the months ahead, as the war broadens beyond Afghanistan and becomes harder to see, the pressures on journalists to resort to these means of presentation are likely to only increase.
Just the Facts
In the early days after September 11, critics praised the press for returning to a style of coverage that stuck more to reporting facts than interpreting them and for a notable caution about conveying rumor and speculation. “The word of the day is steady, steady,” Dan Rather said out loud on CBS the day of the attacks. “We are going to try to separate the rumors from the facts.” To examine whether this impression was true, the study looked at every story pertaining to the war on terrorism during the nine days studied.
Each statement or assertion was noted for whether it was: a), a fact b), a piece of analysis that could be attributed to some kind of reporting or c), an opinion or speculation that was un-attributed to anything. Each paragraph was then categorized by which type of statement predominated.
In the early days of September, the coverage was strikingly straightforward. More than three quarters (75%) of all the coverage was factual—here is what happened—as opposed to analysis or opinion.
Opinion and speculation accounted for just 11% of the reportage. Analysis made up 14%. The coverage was also notably well documented. Nearly half of the coverage
(45%) cited four or more sources. More than three quarters of all sources were named (76%).
The reporting was highly factual and well sourced in September across the more traditional news genres—evening news, morning and newspapers. Facts were not as dominate on the talk shows (54%), the prime time hours (52%).
By November, the coverage began to shift, becoming more analytical. Factual reporting dropped by 12 percentage points to 63%.
Analysis rose by half, to 21%. The amount of punditry grew to 15%. In December, the numbers remained close to the November levels. The level of documentation also shifted with time. By December, the percentage
of stories citing four or more sources had dropped from more than four in ten to just above a quarter (29%). The percentage of stories citing just one source had grown from 20% to 25%.
Why the change?
5
One reason may be that in the earliest days, as Americans were digging out of the shock and rubble, a premium was put on avoiding undue panic and speculation. As the situation stabilized, and the war moved overseas, the temptation to analyze and speculate naturally increased.
Another factor may be access. In September, the story was largely a domestic one—and in the media’s backyard in Washington and New York. Eyewitnesses and people with unique stories to tell were easier to find. The unrelenting financial cutbacks, particularly in television, were less of a factor when the events were occurring in the media’s hometown.
As the war moved abroad, the Pentagon made access to soldiers and the battlefield more difficult than it has ever been. Web sites with previously public information were suddenly removed. Sources quit talking. Reporters say they have never seen the Pentagon as intimidated about talking to the press as they do now.
When facts are hard to come by, the press, other studies have shown, tends to fill the vacuum with analysis, opinion and speculation.
Even so, when the press was citing sources, a high percentage of them remained on the record, even if they were offering more analysis than strictly facts (76% in September and November, 73% in December). Some Media Are More Fact Oriented Than Others
Reporting on Television
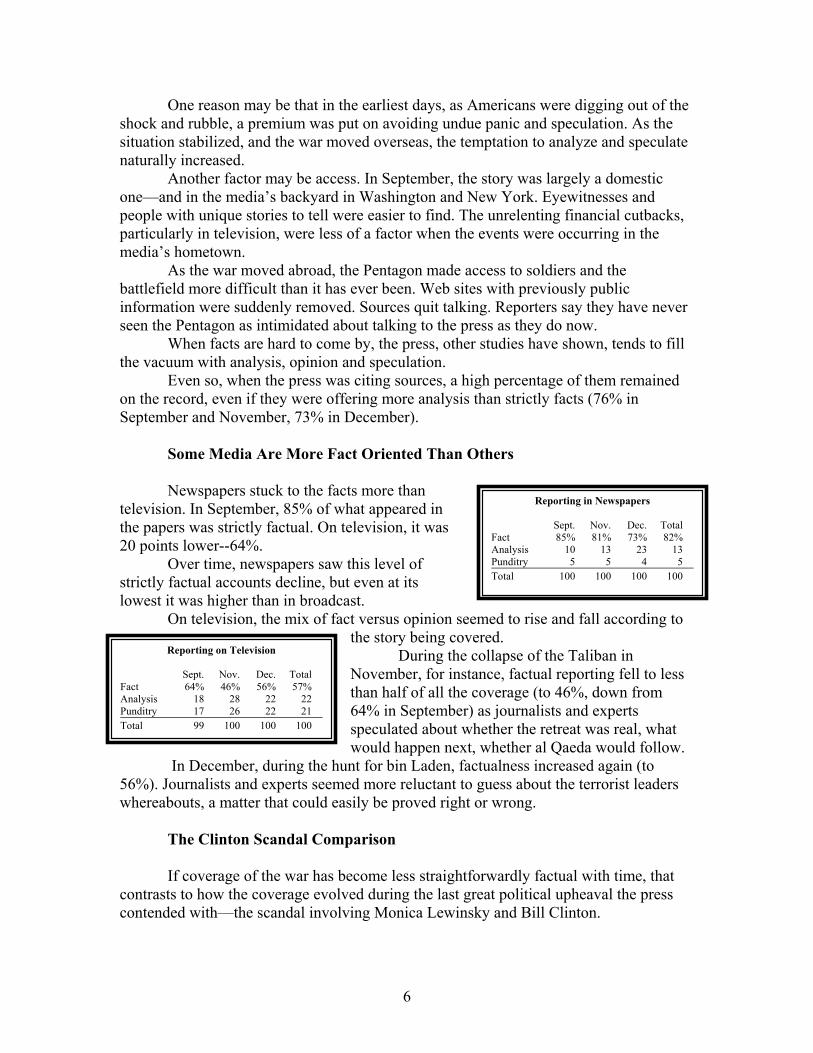
Sept. Nov. Dec. Total Fact 64% 46% 56% 57% Analysis 18 28 22 22 Punditry 17 26 22 21 Total 99 100 100 100
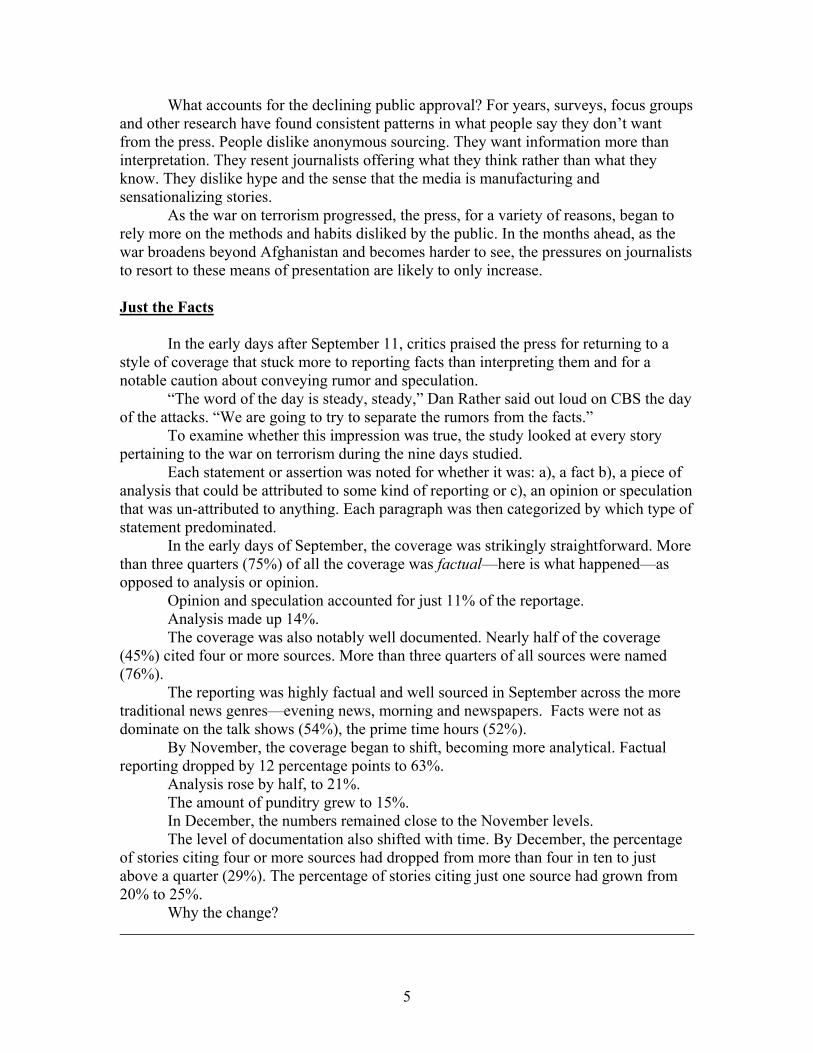
Newspapers stuck to the facts more than
television. In September, 85% of what appeared in the papers was strictly factual. On television, it was 20 points lower--64%.
Reporting in Newspapers
Sept. Nov. Dec. Total Fact 85% 81% 73% 82% Analysis 10 13 23 13 Punditry 5 5 4 5 Total 100 100 100 100
Over time, newspapers saw this level of strictly factual accounts decline, but even at its lowest it was higher than in broadcast.
On television, the mix of fact versus opinion seemed to rise and fall according to the story being covered.
During the collapse of the Taliban in November, for instance, factual reporting fell to less than half of all the coverage (to 46%, down from 64% in September) as journalists and experts speculated about whether the retreat was real, what would happen next, whether al Qaeda would follow.
In December, during the hunt for bin Laden, factualness increased again (to 56%). Journalists and experts seemed more reluctant to guess about the terrorist leaders whereabouts, a matter that could easily be proved right or wrong.
The Clinton Scandal Comparison If coverage of the war has become less straightforwardly factual with time, that
contrasts to how the coverage evolved during the last great political upheaval the press contended with—the scandal involving Monica Lewinsky and Bill Clinton.
6
During Lewinsky, the press initially was condemned for rushing to judgment and then over time became more factual and cautious.
During Lewinsky, the press initially was condemned for rushing to judgment and then over time became more factual and cautious.
In the war on terrorism, the press was praised for caution at first and has become more interpretive since.
In the war on terrorism, the press was praised for caution at first and has become more interpretive since.
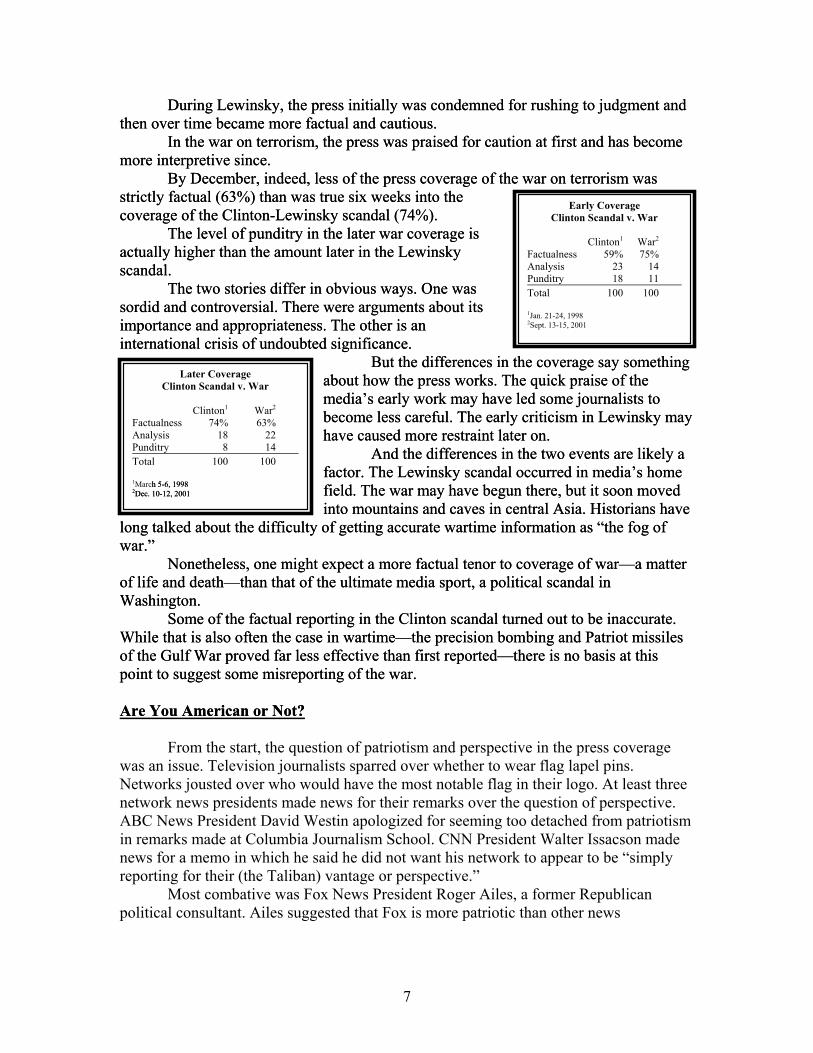
Early Coverage Clinton Scandal v. War
Clinton1 War2 Factualness 59% 75% Analysis 23 14 Punditry 18 11 Total 100 100 1Jan. 21-24, 1998 2Sept. 13-15, 2001
By December, indeed, less of the press coverage of the war on terrorism was strictly factual (63%) than was true six weeks into the coverage of the Clinton-Lewinsky scandal (74%).
By December, indeed, less of the press coverage of the war on terrorism was strictly factual (63%) than was true six weeks into the coverage of the Clinton-Lewinsky scandal (74%).
The level of punditry in the later war coverage is actually higher than the amount later in the Lewinsky scandal.
The level of punditry in the later war coverage is actually higher than the amount later in the Lewinsky scandal.
The two stories differ in obvious ways. One was sordid and controversial. There were arguments about its importance and appropriateness. The other is an international crisis of undoubted significance.
The two stories differ in obvious ways. One was sordid and controversial. There were arguments about its importance and appropriateness. The other is an international crisis of undoubted significance.
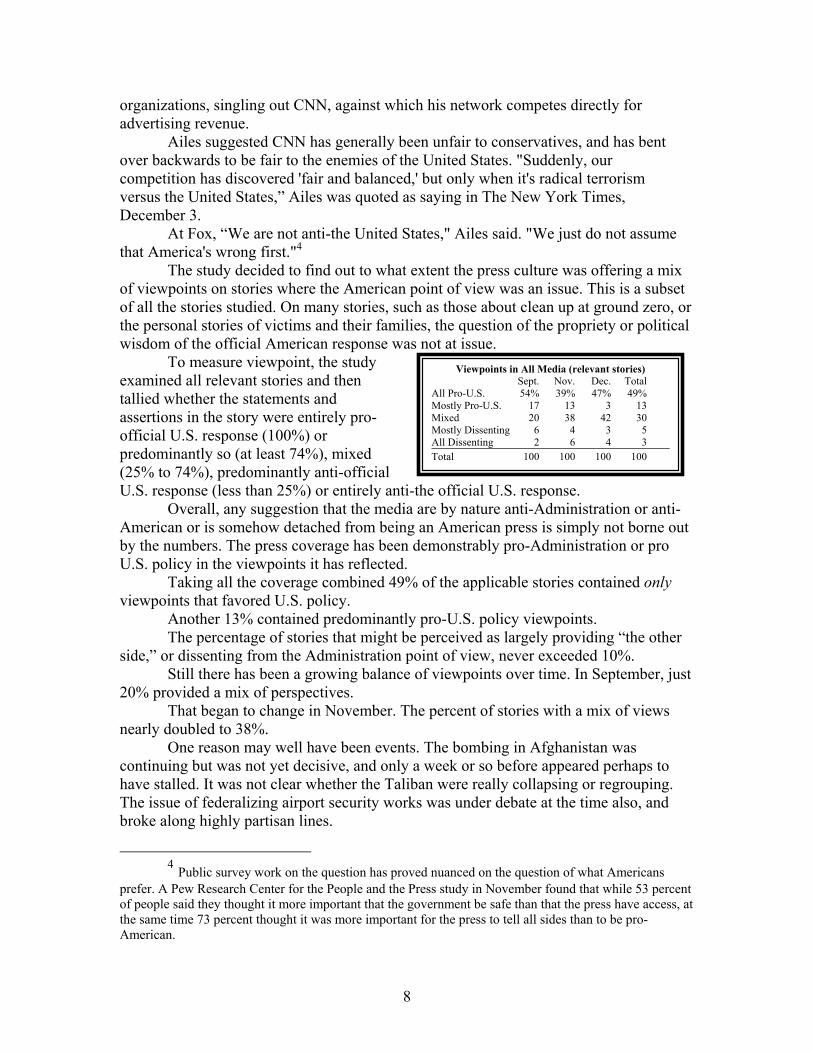
Later Coverage Clinton Scandal v. War
Clinton1 War2 Factualness 74% 63% Analysis 18 22 Punditry 8 14 Total 100 100 1March 5-6, 1998h 5-6, 1998 2Dec. 10-12, 2001 2Dec. 10-12, 2001
But the differences in the coverage say something about how the press works. The quick praise of the media’s early work may have led some journalists to become less careful. The early criticism in Lewinsky may have caused more restraint later on.
But the differences in the coverage say something about how the press works. The quick praise of the media’s early work may have led some journalists to become less careful. The early criticism in Lewinsky may have caused more restraint later on. And the differences in the two events are likely a factor. The Lewinsky scandal occurred in media’s home field. The war may have begun there, but it soon moved into mountains and caves in central Asia. Historians have
long talked about the difficulty of getting accurate wartime information as “the fog of war.”
And the differences in the two events are likely a factor. The Lewinsky scandal occurred in media’s home field. The war may have begun there, but it soon moved into mountains and caves in central Asia. Historians have
long talked about the difficulty of getting accurate wartime information as “the fog of war.” Nonetheless, one might expect a more factual tenor to coverage of war—a matter of life and death—than that of the ultimate media sport, a political scandal in Washington.
Nonetheless, one might expect a more factual tenor to coverage of war—a matter of life and death—than that of the ultimate media sport, a political scandal in Washington. Some of the factual reporting in the Clinton scandal turned out to be inaccurate. While that is also often the case in wartime—the precision bombing and Patriot missiles of the Gulf War proved far less effective than first reported—there is no basis at this point to suggest some misreporting of the war.
Some of the factual reporting in the Clinton scandal turned out to be inaccurate. While that is also often the case in wartime—the precision bombing and Patriot missiles of the Gulf War proved far less effective than first reported—there is no basis at this point to suggest some misreporting of the war.
Are You American or Not?Are You American or Not?
From the start, the question of patriotism and perspective in the press coverage
was an issue. Television journalists sparred over whether to wear flag lapel pins. Networks jousted over who would have the most notable flag in their logo. At least three network news presidents made news for their remarks over the question of perspective. ABC News President David Westin apologized for seeming too detached from patriotism in remarks made at Columbia Journalism School. CNN President Walter Issacson made news for a memo in which he said he did not want his network to appear to be “simply reporting for their (the Taliban) vantage or perspective.”
Most combative was Fox News President Roger Ailes, a former Republican political consultant. Ailes suggested that Fox is more patriotic than other news
7
organizations, singling out CNN, against which his network competes directly for advertising revenue.
Ailes suggested CNN has generally been unfair to conservatives, and has bent over backwards to be fair to the enemies of the United States. "Suddenly, our competition has discovered 'fair and balanced,' but only when it's radical terrorism versus the United States,” Ailes was quoted as saying in The New York Times, December 3.
At Fox, “We are not anti-the United States," Ailes said. "We just do not assume that America's wrong first."4
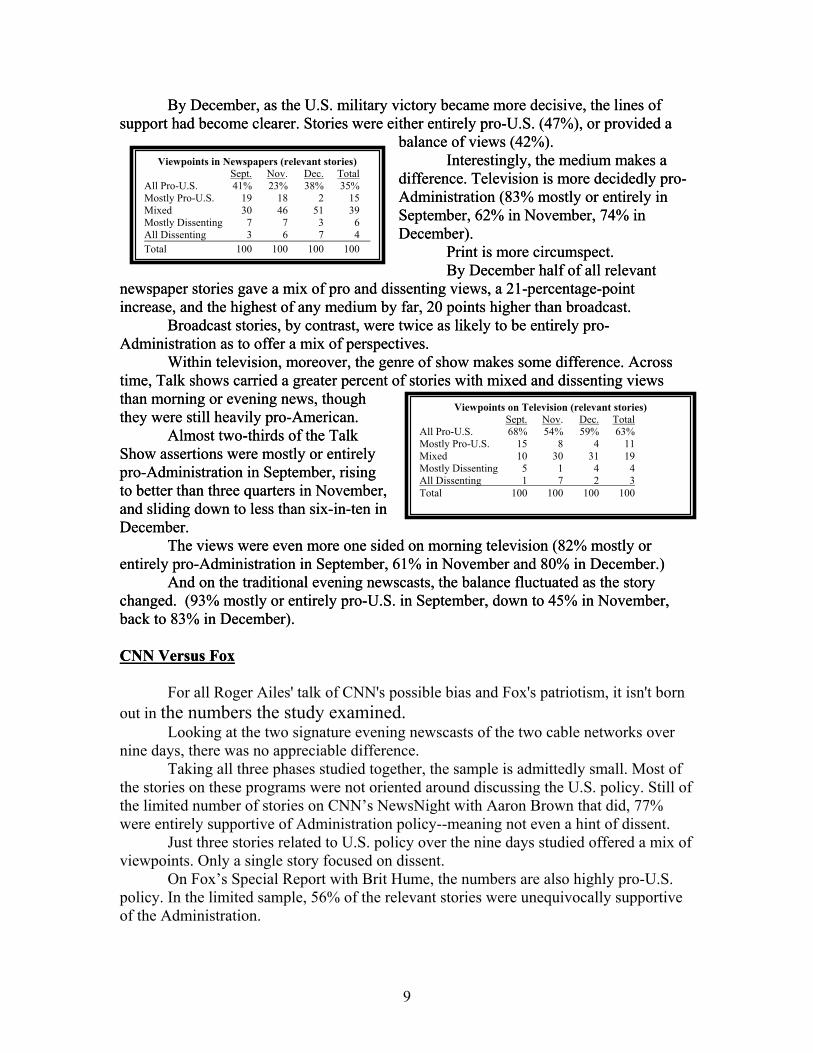
The study decided to find out to what extent the press culture was offering a mix of viewpoints on stories where the American point of view was an issue. This is a subset of all the stories studied. On many stories, such as those about clean up at ground zero, or the personal stories of victims and their families, the question of the propriety or political wisdom of the official American response was not at issue.
Viewpoints in All Media (relevant stories) Sept. Nov. Dec. Total All Pro-U.S. 54% 39% 47% 49% Mostly Pro-U.S. 17 13 3 13 Mixed 20 38 42 30 Mostly Dissenting 6 4 3 5 All Dissenting 2 6 4 3 Total 100 100 100 100
To measure viewpoint, the study examined all relevant stories and then tallied whether the statements and assertions in the story were entirely pro-official U.S. response (100%) or predominantly so (at least 74%), mixed (25% to 74%), predominantly anti-official U.S. response (less than 25%) or entirely anti-the official U.S. response.
Overall, any suggestion that the media are by nature anti-Administration or anti-American or is somehow detached from being an American press is simply not borne out by the numbers. The press coverage has been demonstrably pro-Administration or pro U.S. policy in the viewpoints it has reflected.
Taking all the coverage combined 49% of the applicable stories contained only viewpoints that favored U.S. policy.
Another 13% contained predominantly pro-U.S. policy viewpoints. The percentage of stories that might be perceived as largely providing “the other
side,” or dissenting from the Administration point of view, never exceeded 10%. Still there has been a growing balance of viewpoints over time. In September, just
20% provided a mix of perspectives. That began to change in November. The percent of stories with a mix of views
nearly doubled to 38%. One reason may well have been events. The bombing in Afghanistan was
continuing but was not yet decisive, and only a week or so before appeared perhaps to have stalled. It was not clear whether the Taliban were really collapsing or regrouping. The issue of federalizing airport security works was under debate at the time also, and broke along highly partisan lines.
4 Public survey work on the question has proved nuanced on the question of what Americans
prefer. A Pew Research Center for the People and the Press study in November found that while 53 percent of people said they thought it more important that the government be safe than that the press have access, at the same time 73 percent thought it was more important for the press to tell all sides than to be pro-American.
8
By December, as the U.S. military victory became more decisive, the lines of support had become clearer. Stories were either entirely pro-U.S. (47%), or provided a
balance of views (42%).
By December, as the U.S. military victory became more decisive, the lines of support had become clearer. Stories were either entirely pro-U.S. (47%), or provided a
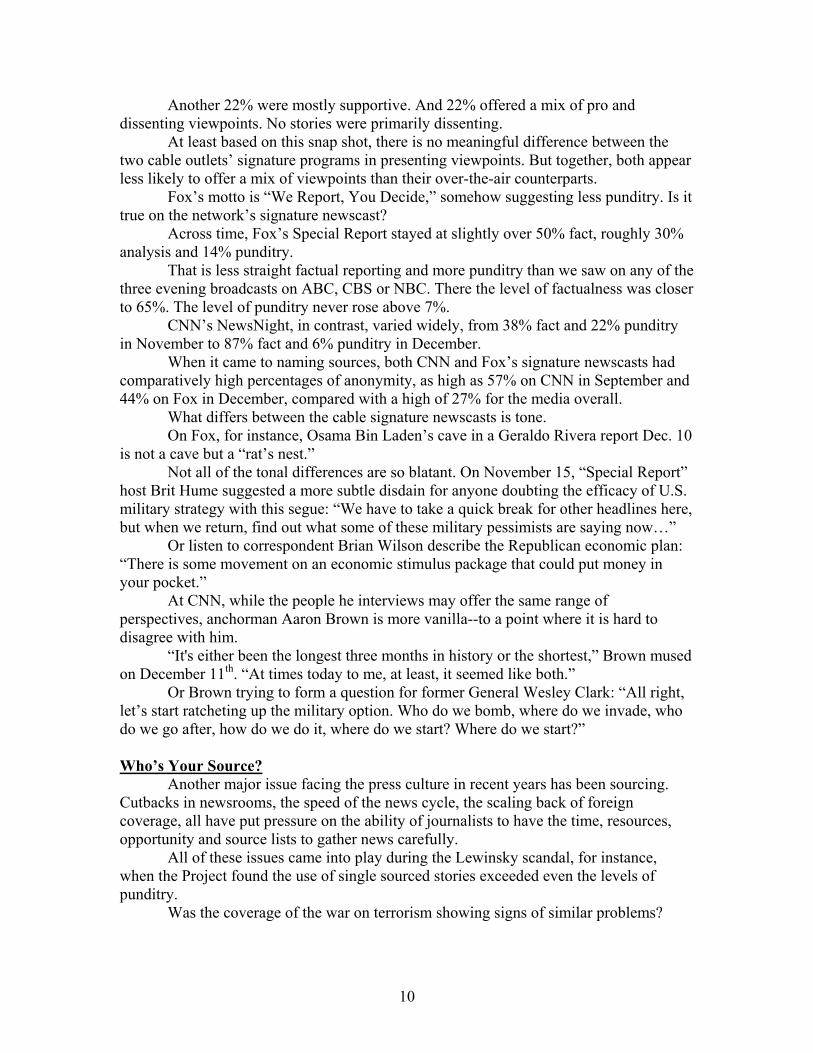
balance of views (42%). Viewpoints in Newspapers (relevant stories)
Sept. Nov. Dec. Total All Pro-U.S. 41% 23% 38% 35% Mostly Pro-U.S. 19 18 2 15 Mixed 30 46 51 39 Mostly Dissenting 7 7 3 6 All Dissenting 3 6 7 4 Total 100 100 100 100
Interestingly, the medium makes a difference. Television is more decidedly pro-Administration (83% mostly or entirely in September, 62% in November, 74% in December).
Interestingly, the medium makes a difference. Television is more decidedly pro-Administration (83% mostly or entirely in September, 62% in November, 74% in December).
Print is more circumspect. Print is more circumspect. By December half of all relevant
newspaper stories gave a mix of pro and dissenting views, a 21-percentage-point increase, and the highest of any medium by far, 20 points higher than broadcast.
By December half of all relevant newspaper stories gave a mix of pro and dissenting views, a 21-percentage-point increase, and the highest of any medium by far, 20 points higher than broadcast.
Broadcast stories, by contrast, were twice as likely to be entirely pro-Administration as to offer a mix of perspectives.
Broadcast stories, by contrast, were twice as likely to be entirely pro-Administration as to offer a mix of perspectives.
Viewpoints on Television (relevant stories) Sept. Nov. Dec. Total All Pro-U.S. 68% 54% 59% 63% Mostly Pro-U.S. 15 8 4 11 Mixed 10 30 31 19 Mostly Dissenting 5 1 4 4 All Dissenting 1 7 2 3 Total 100 100 100 100
Within television, moreover, the genre of show makes some difference. Across time, Talk shows carried a greater percent of stories with mixed and dissenting views than morning or evening news, though they were still heavily pro-American.
Within television, moreover, the genre of show makes some difference. Across time, Talk shows carried a greater percent of stories with mixed and dissenting views than morning or evening news, though they were still heavily pro-American.
Almost two-thirds of the Talk Show assertions were mostly or entirely pro-Administration in September, rising to better than three quarters in November, and sliding down to less than six-in-ten in December.
Almost two-thirds of the Talk Show assertions were mostly or entirely pro-Administration in September, rising to better than three quarters in November, and sliding down to less than six-in-ten in December.
The views were even more one sided on morning television (82% mostly or entirely pro-Administration in September, 61% in November and 80% in December.)
The views were even more one sided on morning television (82% mostly or entirely pro-Administration in September, 61% in November and 80% in December.)
And on the traditional evening newscasts, the balance fluctuated as the story changed. (93% mostly or entirely pro-U.S. in September, down to 45% in November, back to 83% in December).
And on the traditional evening newscasts, the balance fluctuated as the story changed. (93% mostly or entirely pro-U.S. in September, down to 45% in November, back to 83% in December).
CNN Versus FoxCNN Versus Fox
For all Roger Ailes' talk of CNN's possible bias and Fox's patriotism, it isn't born
out in the numbers the study examined. Looking at the two signature evening newscasts of the two cable networks over
nine days, there was no appreciable difference. Taking all three phases studied together, the sample is admittedly small. Most of
the stories on these programs were not oriented around discussing the U.S. policy. Still of the limited number of stories on CNN’s NewsNight with Aaron Brown that did, 77% were entirely supportive of Administration policy--meaning not even a hint of dissent.
Just three stories related to U.S. policy over the nine days studied offered a mix of viewpoints. Only a single story focused on dissent.
On Fox’s Special Report with Brit Hume, the numbers are also highly pro-U.S. policy. In the limited sample, 56% of the relevant stories were unequivocally supportive of the Administration.
9
Another 22% were mostly supportive. And 22% offered a mix of pro and dissenting viewpoints. No stories were primarily dissenting.
At least based on this snap shot, there is no meaningful difference between the two cable outlets’ signature programs in presenting viewpoints. But together, both appear less likely to offer a mix of viewpoints than their over-the-air counterparts.
Fox’s motto is “We Report, You Decide,” somehow suggesting less punditry. Is it true on the network’s signature newscast?
Across time, Fox’s Special Report stayed at slightly over 50% fact, roughly 30% analysis and 14% punditry.
That is less straight factual reporting and more punditry than we saw on any of the three evening broadcasts on ABC, CBS or NBC. There the level of factualness was closer to 65%. The level of punditry never rose above 7%.
CNN’s NewsNight, in contrast, varied widely, from 38% fact and 22% punditry in November to 87% fact and 6% punditry in December.
When it came to naming sources, both CNN and Fox’s signature newscasts had comparatively high percentages of anonymity, as high as 57% on CNN in September and 44% on Fox in December, compared with a high of 27% for the media overall.
What differs between the cable signature newscasts is tone. On Fox, for instance, Osama Bin Laden’s cave in a Geraldo Rivera report Dec. 10
is not a cave but a “rat’s nest.” Not all of the tonal differences are so blatant. On November 15, “Special Report”
host Brit Hume suggested a more subtle disdain for anyone doubting the efficacy of U.S. military strategy with this segue: “We have to take a quick break for other headlines here, but when we return, find out what some of these military pessimists are saying now…”
Or listen to correspondent Brian Wilson describe the Republican economic plan: “There is some movement on an economic stimulus package that could put money in your pocket.”
At CNN, while the people he interviews may offer the same range of perspectives, anchorman Aaron Brown is more vanilla--to a point where it is hard to disagree with him.
“It's either been the longest three months in history or the shortest,” Brown mused on December 11th. “At times today to me, at least, it seemed like both.”
Or Brown trying to form a question for former General Wesley Clark: “All right, let’s start ratcheting up the military option. Who do we bomb, where do we invade, who do we go after, how do we do it, where do we start? Where do we start?” Who’s Your Source?
Another major issue facing the press culture in recent years has been sourcing. Cutbacks in newsrooms, the speed of the news cycle, the scaling back of foreign coverage, all have put pressure on the ability of journalists to have the time, resources, opportunity and source lists to gather news carefully.
All of these issues came into play during the Lewinsky scandal, for instance, when the Project found the use of single sourced stories exceeded even the levels of punditry.
Was the coverage of the war on terrorism showing signs of similar problems?
10
Named Versus Unnamed Sources Named Versus Unnamed Sources
Number of Sources
Total Newspapers Television Sept. Nov. Dec. Sept. Nov. Dec. Sept. Nov. Dec. One-Two 31% 37% 41% 18% 19% 24% 46% 53% 50% Three 9 10 14 8 8 11 8 11 15 Four+ 45 43 29 64 62 52 27 27 18 None 15 10 16 10 11 11 20 9 18 Total 100 100 100 100 100 100 100 100 100
Sourcing in All Media
Sept. Nov. Dec. Total Named Sources 76% 76% 73% 76% Unnamed Sources 24 24 27 24 Total 100 100 100 100
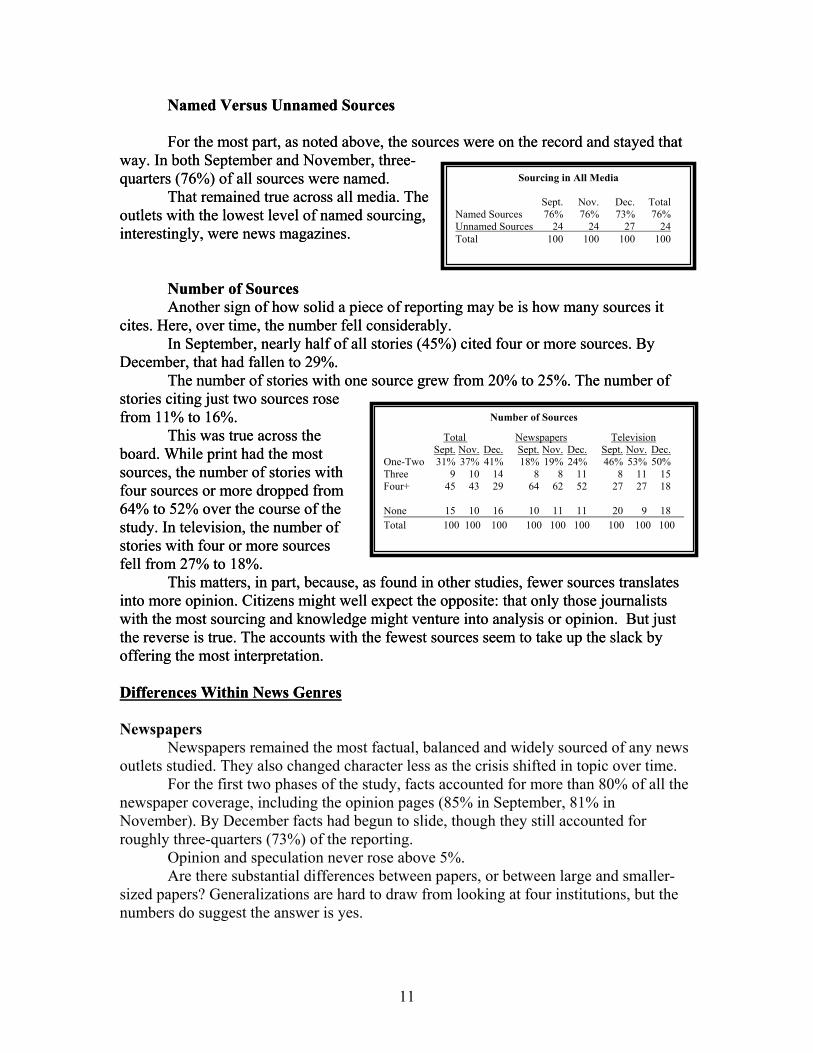
For the most part, as noted above, the sources were on the record and stayed that way. In both September and November, three-quarters (76%) of all sources were named.
For the most part, as noted above, the sources were on the record and stayed that way. In both September and November, three-quarters (76%) of all sources were named.
That remained true across all media. The outlets with the lowest level of named sourcing, interestingly, were news magazines.
That remained true across all media. The outlets with the lowest level of named sourcing, interestingly, were news magazines.
Number of Sources Number of Sources
Another sign of how solid a piece of reporting may be is how many sources it cites. Here, over time, the number fell considerably. Another sign of how solid a piece of reporting may be is how many sources it cites. Here, over time, the number fell considerably.
In September, nearly half of all stories (45%) cited four or more sources. By December, that had fallen to 29%.
In September, nearly half of all stories (45%) cited four or more sources. By December, that had fallen to 29%. The number of stories with one source grew from 20% to 25%. The number of stories citing just two sources rose from 11% to 16%.
The number of stories with one source grew from 20% to 25%. The number of stories citing just two sources rose from 11% to 16%.
This was true across the board. While print had the most sources, the number of stories with four sources or more dropped from 64% to 52% over the course of the study. In television, the number of stories with four or more sources fell from 27% to 18%.
This was true across the board. While print had the most sources, the number of stories with four sources or more dropped from 64% to 52% over the course of the study. In television, the number of stories with four or more sources fell from 27% to 18%. This matters, in part, because, as found in other studies, fewer sources translates into more opinion. Citizens might well expect the opposite: that only those journalists with the most sourcing and knowledge might venture into analysis or opinion. But just the reverse is true. The accounts with the fewest sources seem to take up the slack by offering the most interpretation.
This matters, in part, because, as found in other studies, fewer sources translates into more opinion. Citizens might well expect the opposite: that only those journalists with the most sourcing and knowledge might venture into analysis or opinion. But just the reverse is true. The accounts with the fewest sources seem to take up the slack by offering the most interpretation. Differences Within News GenresDifferences Within News Genres
Newspapers
Newspapers remained the most factual, balanced and widely sourced of any news outlets studied. They also changed character less as the crisis shifted in topic over time. For the first two phases of the study, facts accounted for more than 80% of all the newspaper coverage, including the opinion pages (85% in September, 81% in November). By December facts had begun to slide, though they still accounted for roughly three-quarters (73%) of the reporting.
Opinion and speculation never rose above 5%. Are there substantial differences between papers, or between large and smaller-
sized papers? Generalizations are hard to draw from looking at four institutions, but the numbers do suggest the answer is yes.
11
The Cleveland Plain Dealer and the Fresno Bee, for instance, relied less on anonymous sources than either the Post or the Times. The smaller papers began with factual accounts making up more of their coverage. Both shifted more toward analysis and punditry over time. The reason was that they began to rely more on syndicated columnists for their coverage, a reflection of the high costs of covering the war with reporters.
Interestingly, even from the start, both the Plain Dealer and the Bee relied little on wire service accounts. Instead, both leaned on staff writers to cover the crisis and often related the story back to events in their local communities.
In November, as the story moved to Afghanistan, the Times and Post began to show their muscle as news gathering organizations with a broad reach of sources.
The Plain Dealer and the Bee, by contrast, became even more local, increasing their reliance on community leaders as sources.
The New York Times was striking for the fact that in December it shifted more heavily toward interpretation. After more than 80% of its reporting was straightforward factual accounts in September and November, that number dropped to 66%. The shift was toward analysis rather than outright opinion or speculation, which never rose above 5%.
Beyond that, what stands out between The New York Times coverage and Washington Post coverage in the periods studied was how strikingly similar they were. Time & Newsweek
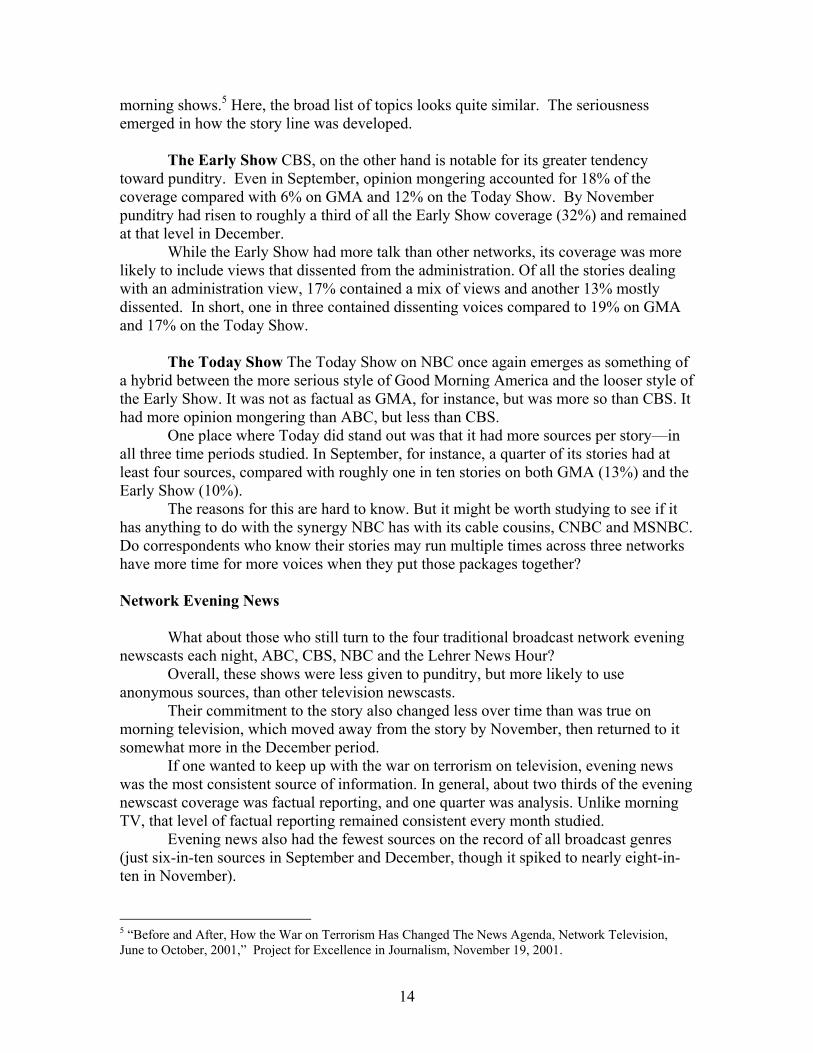
When it came to coverage of the war in the three time periods studied, Time and Newsweek appear to be very different animals.
Facts Analysis Punditry Total
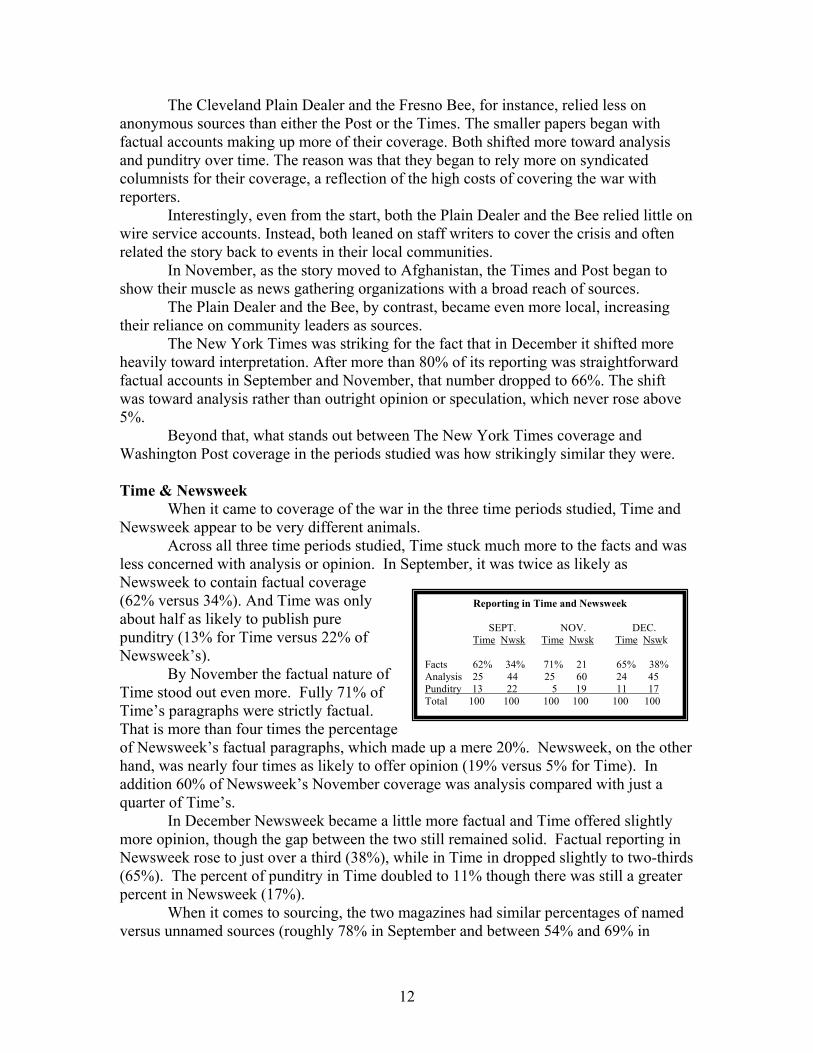
Across all three time periods studied, Time stuck much more to the facts and was less concerned with analysis or opinion. In September, it was twice as likely as Newsweek to contain factual coverage (62% versus 34%). And Time was only about half as likely to publish pure punditry (13% for Time versus 22% of Newsweek’s).
By November the factual nature of Time stood out even more. Fully 71% of Time’s paragraphs were strictly factual. That is more than four times the percentage of Newsweek’s factual paragraphs, which made up a mhand, was nearly four times as likely to offer opinion (addition 60% of Newsweek’s November coverage wasquarter of Time’s.
In December Newsweek became a little more fmore opinion, though the gap between the two still remNewsweek rose to just over a third (38%), while in Tim(65%). The percent of punditry in Time doubled to 11percent in Newsweek (17%).
When it comes to sourcing, the two magazinesversus unnamed sources (roughly 78% in September a
12
Reporting in Time and Newsweek
SEPT. NOV. DEC. Time Nwsk Time Nwsk Time Nswk
62% 34% 71% 21 65% 38% 25 44 25 60 24 45 13 22 5 19 11 17 100 100 100 100 100 100
ere 20%. Newsweek, on the other 19% versus 5% for Time). In analysis compared with just a
actual and Time offered slightly ained solid. Factual reporting in e in dropped slightly to two-thirds
% though there was still a greater
had similar percentages of named nd between 54% and 69% in
November and December), but Newsweek tended to provide more sources per story. Part of the explanation is that Time was much more likely than Newsweek to run short factual sidebars and background boxes that offered no sourcing. In September and November, nearly a third of Time’s stories had no source compared to less than one in ten for Newsweek. (The numbers evened out a bit in December, 12% unnamed sources for Time, 9% for Newsweek).
Newsweek, on the other hand, consistently offered more sources for its coverage though these sources may have been offering their opinion rather than facts—in every time period studied.
The two magazines also differed in whom they chose as sources. Across all three time periods, Newsweek looked more to community leaders than did Time. Newsweek’s reliance on these leaders continued to rise across time, rising to 19% in December, while Time use of community leaders never rose above 7%.
By November, however, Time became much more focused on what International officials had to say—three times more likely as Newsweek, and in December four times more likely. Newsweek, in contrast, focused more on what U.S. officials had to say.
Morning Shows
Reporting in Morning News
Sept. Nov. Dec. Total Fact 74 46 55 64 Analysis 14 28 22 19 Punditry 12 26 22 18 Total 100 100 100 100
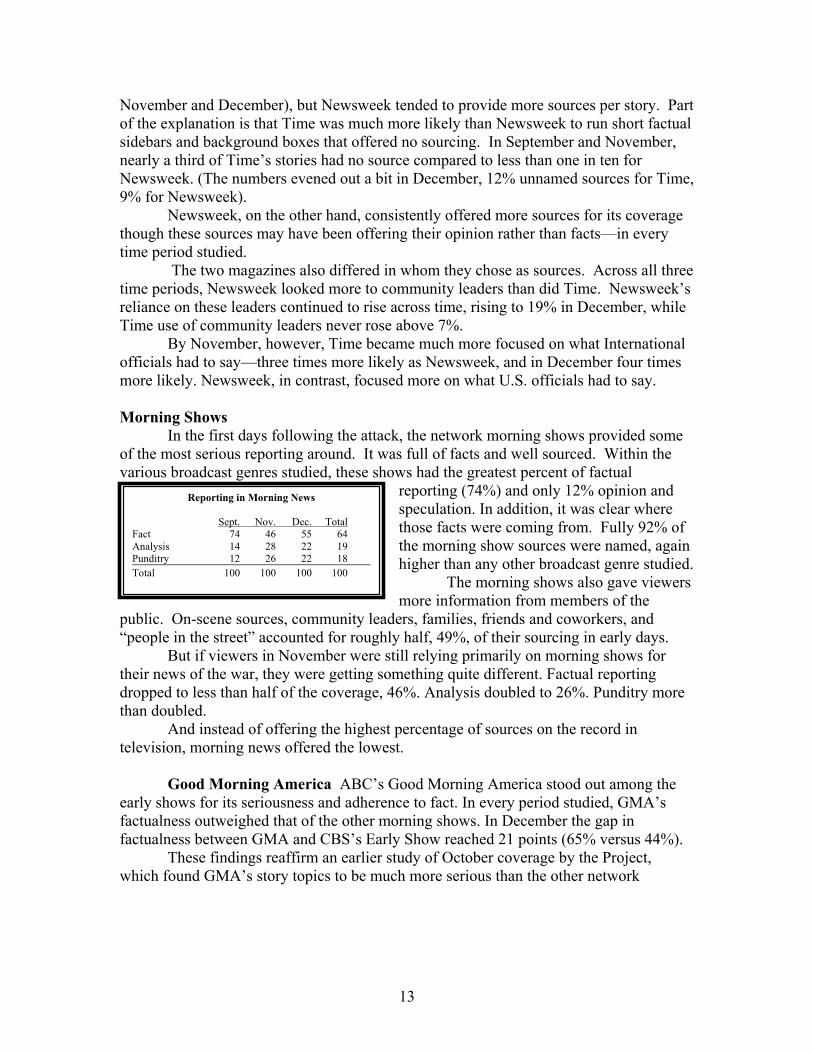
In the first days following the attack, the network morning shows provided some of the most serious reporting around. It was full of facts and well sourced. Within the various broadcast genres studied, these shows had the greatest percent of factual
reporting (74%) and only 12% opinion and speculation. In addition, it was clear where those facts were coming from. Fully 92% of the morning show sources were named, again higher than any other broadcast genre studied.
The morning shows also gave viewers more information from members of the
public. On-scene sources, community leaders, families, friends and coworkers, and “people in the street” accounted for roughly half, 49%, of their sourcing in early days.
But if viewers in November were still relying primarily on morning shows for their news of the war, they were getting something quite different. Factual reporting dropped to less than half of the coverage, 46%. Analysis doubled to 26%. Punditry more than doubled.
And instead of offering the highest percentage of sources on the record in television, morning news offered the lowest. Good Morning America ABC’s Good Morning America stood out among the early shows for its seriousness and adherence to fact. In every period studied, GMA’s factualness outweighed that of the other morning shows. In December the gap in factualness between GMA and CBS’s Early Show reached 21 points (65% versus 44%). These findings reaffirm an earlier study of October coverage by the Project, which found GMA’s story topics to be much more serious than the other network
13
morning shows.5 Here, the broad list of topics looks quite similar. The seriousness emerged in how the story line was developed.
The Early Show CBS, on the other hand is notable for its greater tendency toward punditry. Even in September, opinion mongering accounted for 18% of the coverage compared with 6% on GMA and 12% on the Today Show. By November punditry had risen to roughly a third of all the Early Show coverage (32%) and remained at that level in December.
While the Early Show had more talk than other networks, its coverage was more likely to include views that dissented from the administration. Of all the stories dealing with an administration view, 17% contained a mix of views and another 13% mostly dissented. In short, one in three contained dissenting voices compared to 19% on GMA and 17% on the Today Show.
The Today Show The Today Show on NBC once again emerges as something of a hybrid between the more serious style of Good Morning America and the looser style of the Early Show. It was not as factual as GMA, for instance, but was more so than CBS. It had more opinion mongering than ABC, but less than CBS.
One place where Today did stand out was that it had more sources per story—in all three time periods studied. In September, for instance, a quarter of its stories had at least four sources, compared with roughly one in ten stories on both GMA (13%) and the Early Show (10%).
The reasons for this are hard to know. But it might be worth studying to see if it has anything to do with the synergy NBC has with its cable cousins, CNBC and MSNBC. Do correspondents who know their stories may run multiple times across three networks have more time for more voices when they put those packages together?
Network Evening News
What about those who still turn to the four traditional broadcast network evening
newscasts each night, ABC, CBS, NBC and the Lehrer News Hour? Overall, these shows were less given to punditry, but more likely to use
anonymous sources, than other television newscasts. Their commitment to the story also changed less over time than was true on
morning television, which moved away from the story by November, then returned to it somewhat more in the December period.
If one wanted to keep up with the war on terrorism on television, evening news was the most consistent source of information. In general, about two thirds of the evening newscast coverage was factual reporting, and one quarter was analysis. Unlike morning TV, that level of factual reporting remained consistent every month studied.
Evening news also had the fewest sources on the record of all broadcast genres (just six-in-ten sources in September and December, though it spiked to nearly eight-in-ten in November).
5 “Before and After, How the War on Terrorism Has Changed The News Agenda, Network Television, June to October, 2001,” Project for Excellence in Journalism, November 19, 2001.
14
Much of the anonymity came from those programs’ reliance on U.S. officials for information. Roughly half of the U.S. officials cited on the evening news were unnamed. Another reason may be the fact that stories on the nightly newscasts tend to be shorter than elsewhere. Jennings, Brokaw and Rather The numbers for individual programs in this study are limited. Still in this snapshot the three commercial network evening broadcasts looked strikingly similar in their coverage of this crisis so far. They were all highly factual. They all had similarly low levels of punditry. They all had similarly high numbers of sources in each story.
Perhaps, after nearly 40 years of close competition, they have so assimilated each other’s virtues that they have become indistinguishable in the way they are put together.
One of the few areas of difference, though the numbers of relevant stories over nine broadcasts are admittedly small, came in how likely each program was to offer viewpoints that did not necessarily support U.S. policy. CBS was the most likely to air stories that contained no dissent whatsoever, doing so 64% of the time when the subject of U.S. policy came up. NBC fell in the middle at 54%. ABC was the least likely to do so, 45%.
The Newshour The one program that stood out was the PBS Newshour with Jim Lehrer, perhaps
the most consistent broadcast program studied. The Newshour represents a striking mix. It has about the same level of straightforward factual accounts as the other networks. But the program seemed to avoid analysis, in which conclusions are attributed to facts and evidence, and moved more into outright punditry.
Roughly 17% of the program during the time periods studied was punditry, more than double that of other network evening newscasts.
This is almost certainly due to the show’s format, packages followed by interview segments. It is interesting, however, that these interviews involve less analysis and more opinion.
The Lehrer show also stood out for its use of named sources. In the three periods studied, 81%, 85% and 97% of its sources were on the record.
Although the number of relevant stories was small, The Newshour was the evening news broadcast most likely to entirely support the administration’s stance. Overall, more than three quarters, 77% of its applicable stories entirely supported U.S. policy, the same as CNN’s NewsNight with Aaron Brown.
So much for the supposed liberal slant of PBS--at least in the periods covered by this study.
Talk Shows Talk shows comprise an increasingly large part of the television news landscape. In an effort to reduce its cost-per-minute of news time, even CNN, which once made its worldwide bureaus its hallmark, has fired scores of journalists and added more hours of talk to its broadcast day.
15
While many talk shows generate relatively small audiences by broadcast standards, the genre cumulatively makes up a key part of the prime time lineup of most cable networks. For this study, we examined two types of talk programs, the Sunday show lineup on ABC, CBS, NBC and CNN and a sample of weekday talk shows (Larry King on CNN, Hardball with Chris Matthews on MSNBC and Charlie Rose on PBS). Some journalists have speculated that one reason public approval of early press coverage of the crisis was so high was that even the talk shows seemed more factual than before. "I think even the cable shows themselves are somewhat more information focused,” New York Times Washington Bureau Chief Jill Abramson suggested at a Brookings Institution forum. “It isn't just a partisan or ideological debate about the war. That debate really isn't happening….I don't sense as much that tone on shows like Larry King."6 Was this really true?
For a short time, the answer was a relative yes. In September, just over half the statements on the talk shows (54%) were people offering factual information. The level of outright opinion and speculation was 30%.
Even so, the talk shows in September were nearly four times more likely than the evening news and three times more likely than morning news to engage in opinion mongering.
But by November the talk shows abandoned even this measure of factuality. Factual accounts dropped to just 32% of what was on the talk shows. Punditry surged to 40%. Analysis nearly doubled to 28%.
In December, the talk shows were basically a three way split between punditry, fact, and analysis.
At times, the speculation was as wild as ever. Consider the reaction on CNN’s Capital Gang to the idea that the November crash of American Airlines Flight 587 in Queens might actually be an accident.
"If it's an accident, there's never been an accident quite like it," columnist Robert Novak theorized.
"Within 30 minutes of the crash, before anybody really knew anything much, the government was asserting there's no evidence of sabotage, because they are so anxious for it not to be," agreed National Review Editor Kate O’Beirne.
It was curious, Wall Street Journal columnist Al Hunt added, "that just within a matter of weeks or months after this, that suddenly we have an unprecedented crash of this sort."
With universal agreement on the conspiracy, even Connecticut Senator Joseph Lieberman conceded, that, yes, there had been similar air crashes, "but nothing exactly like it."
As for balance, as noted above, the talk shows were slightly more likely than other broadcasts to provide some dissent about Administration policies, though not nearly as much as in print.
6 Brookings/Harvard Forum, "The Role of the Press in the Anti-Terrorism Campaign: What the Public Things of News Coverage Since September 11," November 28, 2001; available online at http://www.brookings.org/gs/research/press/112801.htm
16
But the dissent existed only within a limited range. Sixty to 75% of the viewpoints on the talk shows were predominantly or entirely pro-Administration depending on the time period. Outright criticism of U.S. policy never rose on the talk shows above 7%.
Sunday Shows There were, despite the basic format of journalists interviewing officials, clear
differences among the four Sunday interview shows studied, ABC’s This Week, CBS’s Face The Nation, NBC’s Meet the Press and CNN’s Capital Gang.
CNN’s Capital Gang had the most outright punditry. Even in September, there was as much opinion mongering as fact on the program, 38%—the only show to do so soon. By November punditry outweighed facts, accounting for more than 40% of the program in November and December.
The supposedly staid Face the Nation was close behind. The CBS show saw a steady rise in punditry from 24% in September to 41% in November and finally 43% in December.
On This Week and Meet the Press, punditry fluctuated over time but only once (Meet the Press in November) did it exceed 30%.
Weeknight Talk As a rule, talk shows on weeknights (Larry King, Hardball and Charlie Rose)
were even less factual and more engaged in punditry than the Sunday talk shows--except for Capital Gang. Larry King started out the most factual of the bunch (more than two-thirds fact in September compared to 49% on Hardball and 30% on Charlie Rose.)
By November facts took a beating even from Larry King, falling to less than half (49%) of what was on his shows, though that was still more than twice that of from Chris Matthews (20%) and four times that from Charlie Rose (12%). In December, the three shows had flip flopped. Hardball was the most factual (47%) followed by Charlie Rose (31%) with Larry King bringing up the rear (23%).
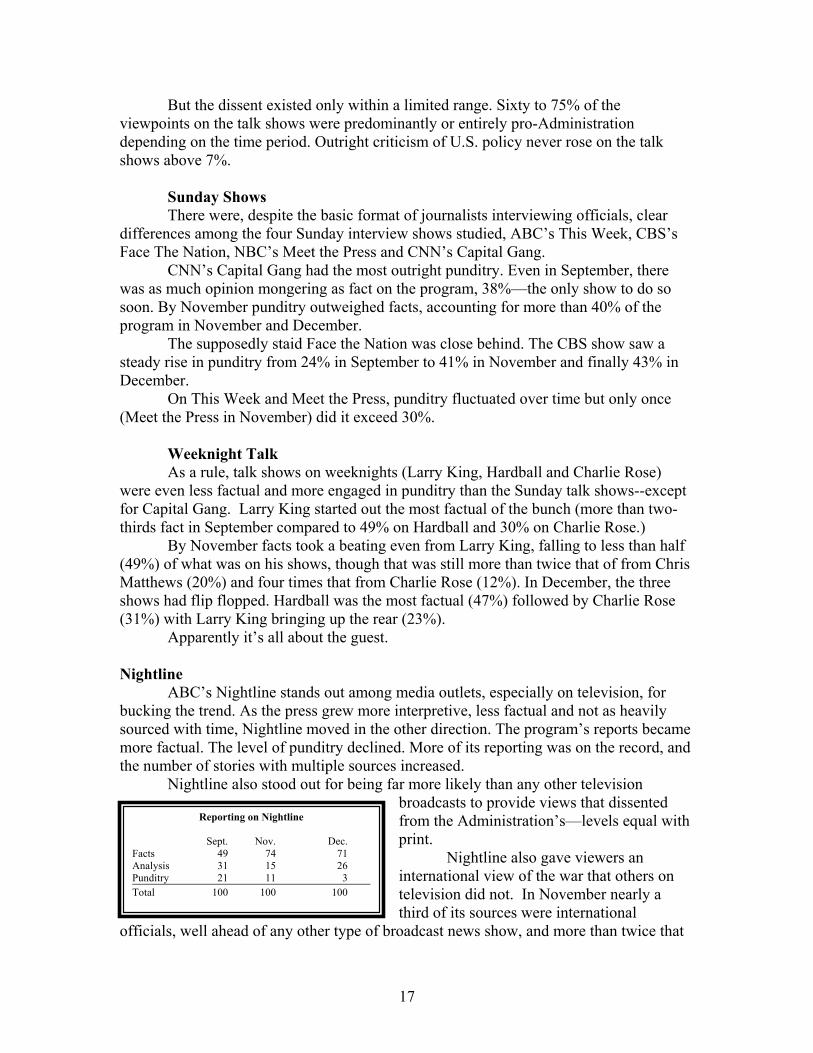
Apparently it’s all about the guest. Nightline ABC’s Nightline stands out among media outlets, especially on television, for bucking the trend. As the press grew more interpretive, less factual and not as heavily sourced with time, Nightline moved in the other direction. The program’s reports became more factual. The level of punditry declined. More of its reporting was on the record, and the number of stories with multiple sources increased.
Reporting on Nightline Sept. Nov. Dec. Facts 49 74 71 Analysis 31 15 26 Punditry 21 11 3 Total 100 100 100
Nightline also stood out for being far more likely than any other television broadcasts to provide views that dissented from the Administration’s—levels equal with print.
Nightline also gave viewers an international view of the war that others on television did not. In November nearly a third of its sources were international
officials, well ahead of any other type of broadcast news show, and more than twice that
17
of the talk shows. By December these foreign voices accounted for more than half (56%) of Nightline sources, compared with 20% on the evening news and a 15% on the talk shows.
Prime Time News Magazines On prime time magazines, such as Dateline, 20-20 and 60 Minutes II, we can see
the arc of the crisis and the return to media normalcy most clearly. In September, news in prime time became highly serious and dedicated exclusively to the crisis. By November, the war on terrorism was losing its place on these shows, and what did air tended to focus on emotional stories about heroes (Rudy Giuliani’s exit interview as N.Y. mayor with Barbara Walters and a fire fighter who donated bone marrow) or victims (in this case of con artists preying on survivors of the Trade Center attacks). One researcher, having noted a habit of the shows to assemble everyday survivors in such stories for in studio group interviews, called these stories “victims on risers.” PROJECT METHODOLOGY SELECTION/INCLUSION OF BROADCASTS AND PUBLICATIONS
Newspapers, newsmagazines, and broadcast news shows were chosen on an ad hoc basis to provide a snapshot of nationally influential media, as well as regional outlets. Diversity within the sample re: audience, ownership and editorial outlook was also a factor in selection.
Newspaper and network news stories were reviewed for three series of days: September 13-15, 2001; November 13-15, 2001; and December 10-12, 2001. Within each phase, the closest broadcast date of weekend talk shows and closest newstand appearance of newsmagazines determined selection. During the September 13-15 timeframe, events dictated schedule revisions for network and cable news. However, these findings reflect the broadcasts that appeared during the regularly-scheduled time periods (i.e., 7:00 a.m. to 9:00 a.m., Eastern time for weekday morning shows; 6:30 p.m. to 7:00 p.m. Eastern time for evening news, etc.) Because network primetime magazine shows were not presented in a uniform way during this period, a substitution was made. The hour of programming broadcast at 9:00 p.m. Eastern time on Friday, September 14th, on ABC, CBS, and NBC, constitutes the primetime magazine component for the initial phase of the study.
Sources and Search Terms
Newspaper and news magazine stories were downloaded from the NEXIS database. In order to cast the widest possible net, broad language was employed. The
18
original search term from September was appended as appropriate in November, and again in December, as dictated by changing story lines. The following reflects the final comprehensive statement as utilized for December stories.
(Bin Laden) or (World Trade Center) or (WTC) or (Pentagon) or (airline!) or (terror!) or (anthrax) or (Afghan!) or (Taliban) or (Pakistan) or (Kabul) or (Northern Alliance) or (Al Qaida) or (Al Qaeda) or (U.S. military) or (U.S. forces) or (tribunal)
Researchers screened newspaper stories and eliminated those that appeared in the
business, sports, entertainment, or lifestyle sections. For both newspapers and newsmagazines, letters to the editor were eliminated. (Note: when the NEXIS database provided nearly identical stories from different editions of one newspaper, the longer of the two stories was coded.)
Broadcast news show transcripts were downloaded in their entirety from the NEXIS database when available. In limited cases, professional transcript services or network websites served as sources for show transcripts.
NOTE: Fox transcripts were not made available until after all other coding was complete; as such, they are to be used for comparison purposes only. Results reported for particular time periods, genres, or project totals do not reflect FOX broadcasts.
Screening and Inclusion A one-fifth rule was established for inclusion across all media. Only stories where one-fifth (20%) or more of the article was specific to the events of September 11, ensuing U.S. action or events, or background re: terrorism, terrorists, etc., were included.
CODING
Researchers analyzed each news story in its entirety, working through the sequential variables. Project Rules for Coders were established prior to beginning that process, and were applied during all phases of coding. INTERCODER RELIABILITY
Intercoder reliability measures the rate at which two coders, operating independently of one another, code the same material in the same way. Throughout the project, a researcher working off-site served as the control coder for print stories, while a senior project director worked as the control coder for broadcast stories. Intercoder testing occurred throughout the coding process, and no significant systematic errors were identified.
19
PEJ
POST-TERRORISM CONTENT ANALYSIS
Selected Results, Sept. through Dec. 2001
01. SOURCE
TOTAL (#) NWSPRS (#) BRDCST (#)
NEWSMAGS (#)
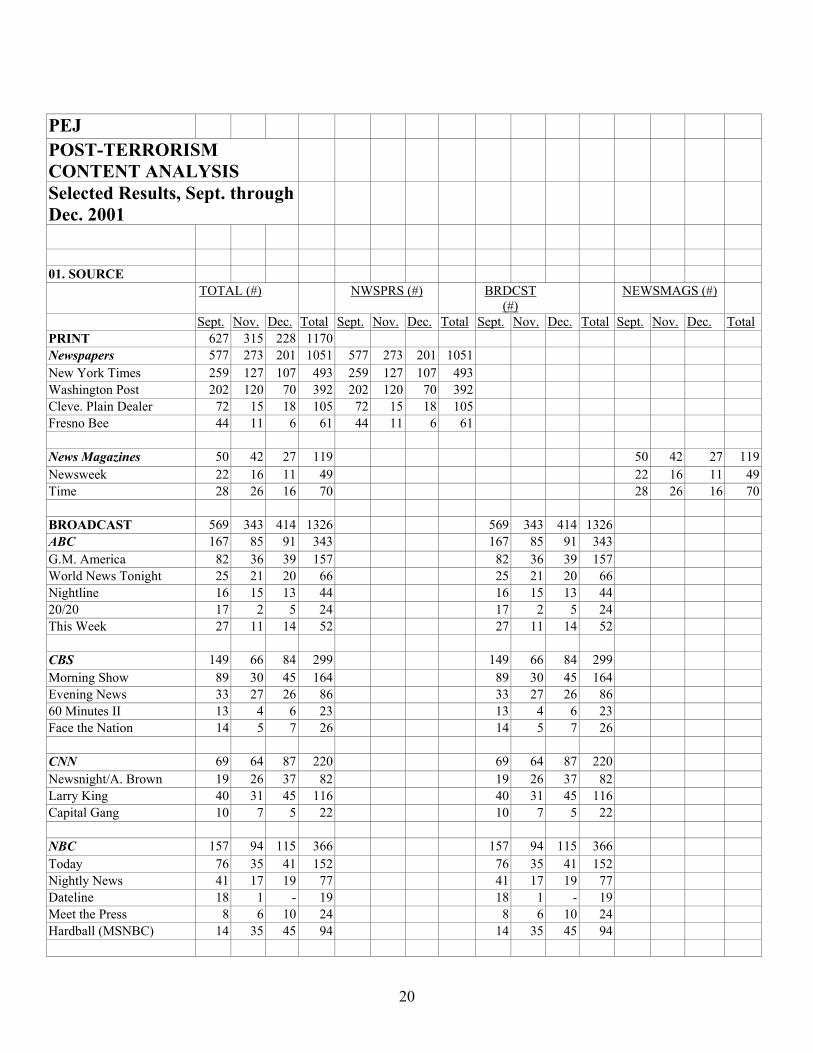
Sept. Nov. Dec. Total Sept. Nov. Dec. Total Sept. Nov. Dec. Total Sept. Nov. Dec. TotalPRINT 627 315 228 1170 Newspapers 577 273 201 1051 577 273 201 1051 New York Times 259 127 107 493 259 127 107 493 Washington Post 202 120 70 392 202 120 70 392 Cleve. Plain Dealer 72 15 18 105 72 15 18 105 Fresno Bee 44 11 6 61 44 11 6 61
News Magazines 50 42 27 119 50 42 27 119Newsweek 22 16 11 49 22 16 11 49Time 28 26 16 70 28 26 16 70
BROADCAST 569 343 414 1326 569 343 414 1326 ABC 167 85 91 343 167 85 91 343 G.M. America 82 36 39 157 82 36 39 157 World News Tonight 25 21 20 66 25 21 20 66 Nightline 16 15 13 44 16 15 13 44 20/20 17 2 5 24 17 2 5 24 This Week 27 11 14 52 27 11 14 52
CBS 149 66 84 299 149 66 84 299 Morning Show 89 30 45 164 89 30 45 164 Evening News 33 27 26 86 33 27 26 86 60 Minutes II 13 4 6 23 13 4 6 23 Face the Nation 14 5 7 26 14 5 7 26
CNN 69 64 87 220 69 64 87 220 Newsnight/A. Brown 19 26 37 82 19 26 37 82 Larry King 40 31 45 116 40 31 45 116 Capital Gang 10 7 5 22 10 7 5 22
NBC 157 94 115 366 157 94 115 366 Today 76 35 41 152 76 35 41 152 Nightly News 41 17 19 77 41 17 19 77 Dateline 18 1 - 19 18 1 - 19 Meet the Press 8 6 10 24 8 6 10 24 Hardball (MSNBC) 14 35 45 94 14 35 45 94
20
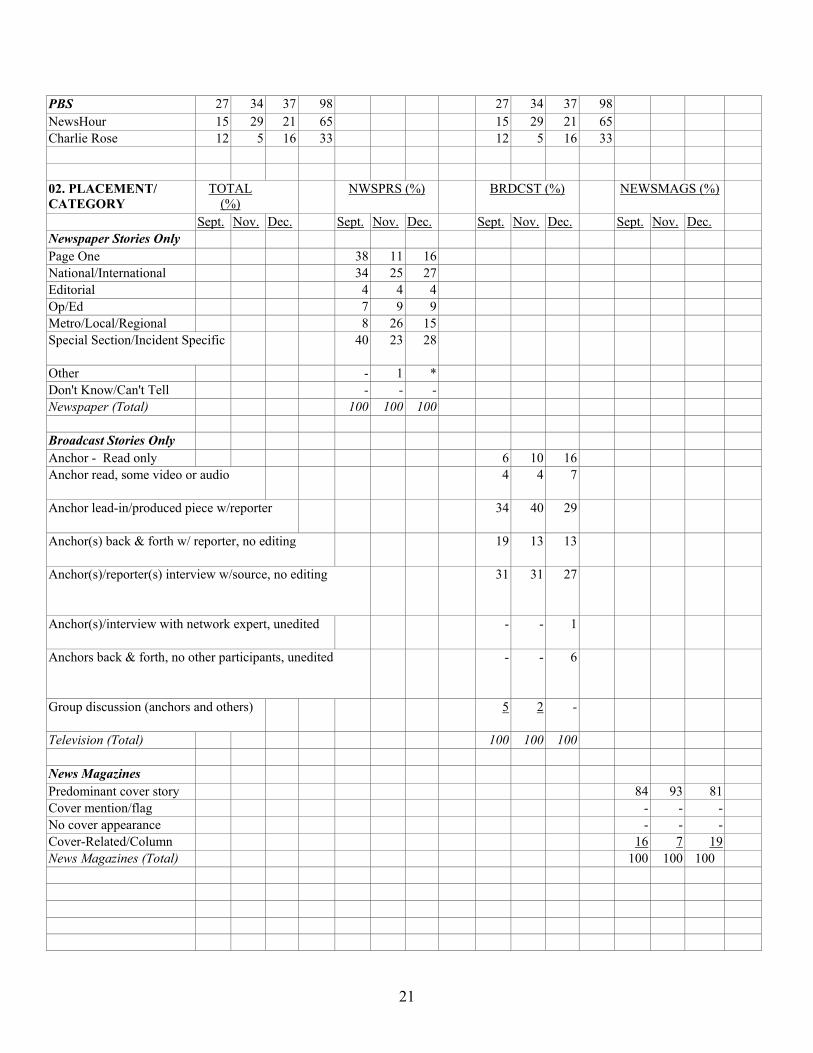
PBS 27 34 37 98 27 34 37 98 NewsHour 15 29 21 65 15 29 21 65 Charlie Rose 12 5 16 33 12 5 16 33
02. PLACEMENT/ CATEGORY
TOTAL (%)
NWSPRS (%) BRDCST (%) NEWSMAGS (%)
Sept. Nov. Dec. Sept. Nov. Dec. Sept. Nov. Dec. Sept. Nov. Dec. Newspaper Stories Only Page One 38 11 16 National/International 34 25 27 Editorial 4 4 4 Op/Ed 7 9 9 Metro/Local/Regional 8 26 15 Special Section/Incident Specific 40 23 28
Other - 1 * Don't Know/Can't Tell - - - Newspaper (Total) 100 100 100
Broadcast Stories Only Anchor - Read only 6 10 16 Anchor read, some video or audio 4 4 7
Anchor lead-in/produced piece w/reporter 34 40 29
Anchor(s) back & forth w/ reporter, no editing 19 13 13
Anchor(s)/reporter(s) interview w/source, no editing 31 31 27
Anchor(s)/interview with network expert, unedited - - 1
Anchors back & forth, no other participants, unedited - - 6
Group discussion (anchors and others) 5 2 -
Television (Total) 100 100 100
News Magazines Predominant cover story 84 93 81Cover mention/flag - - -No cover appearance - - -Cover-Related/Column 16 7 19News Magazines (Total) 100 100 100
21
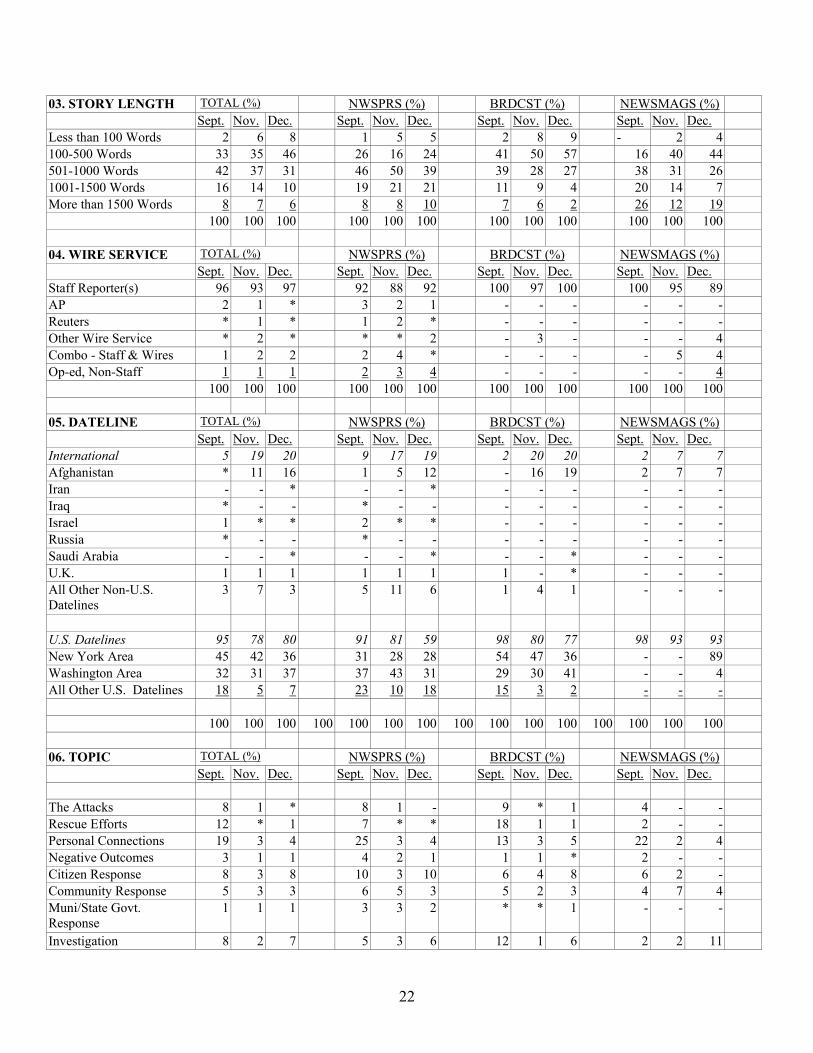
03. STORY LENGTH TOTAL (%) NWSPRS (%) BRDCST (%) NEWSMAGS (%) Sept. Nov. Dec. Sept. Nov. Dec. Sept. Nov. Dec. Sept. Nov. Dec.
Less than 100 Words 2 6 8 1 5 5 2 8 9 - 2 4100-500 Words 33 35 46 26 16 24 41 50 57 16 40 44501-1000 Words 42 37 31 46 50 39 39 28 27 38 31 261001-1500 Words 16 14 10 19 21 21 11 9 4 20 14 7More than 1500 Words 8 7 6 8 8 10 7 6 2 26 12 19
100 100 100 100 100 100 100 100 100 100 100 100
04. WIRE SERVICE TOTAL (%) NWSPRS (%) BRDCST (%) NEWSMAGS (%) Sept. Nov. Dec. Sept. Nov. Dec. Sept. Nov. Dec. Sept. Nov. Dec.
Staff Reporter(s) 96 93 97 92 88 92 100 97 100 100 95 89AP 2 1 * 3 2 1 - - - - - -Reuters * 1 * 1 2 * - - - - - -Other Wire Service * 2 * * * 2 - 3 - - - 4Combo - Staff & Wires 1 2 2 2 4 * - - - - 5 4Op-ed, Non-Staff 1 1 1 2 3 4 - - - - - 4
100 100 100 100 100 100 100 100 100 100 100 100
05. DATELINE TOTAL (%) NWSPRS (%) BRDCST (%) NEWSMAGS (%) Sept. Nov. Dec. Sept. Nov. Dec. Sept. Nov. Dec. Sept. Nov. Dec.
International 5 19 20 9 17 19 2 20 20 2 7 7 Afghanistan * 11 16 1 5 12 - 16 19 2 7 7 Iran - - * - - * - - - - - - Iraq * - - * - - - - - - - - Israel 1 * * 2 * * - - - - - - Russia * - - * - - - - - - - - Saudi Arabia - - * - - * - - * - - - U.K. 1 1 1 1 1 1 1 - * - - - All Other Non-U.S. Datelines
3 7 3 5 11 6 1 4 1 - - -
U.S. Datelines 95 78 80 91 81 59 98 80 77 98 93 New York Area 45 42 36 31 28 28 54 47 36 - - 89 Washington Area 32 31 37 37 43 31 29 30 41 - - 4 All Other U.S. Datelines 18 5 7 23 10 18 15 3 2 - - -
100 100 100 100 100 100 100 100 100 100 100 100 100 100 100
06. TOPIC TOTAL (%) NWSPRS (%) BRDCST (%) NEWSMAGS (%) Sept. Nov. Dec. Sept. Nov. Dec. Sept. Nov. Dec. Sept. Nov. Dec. The Attacks 8 1 * 8 1 - 9 * 1 4 - -Rescue Efforts 12 * 1 7 * * 18 1 1 2 - -Personal Connections 19 3 4 25 3 4 13 3 5 22 2 4Negative Outcomes 3 1 1 4 2 1 1 1 * 2 - -Citizen Response 8 3 8 10 3 10 6 4 8 6 2 -Community Response 5 3 3 6 5 3 5 2 3 4 7 4Muni/State Govt. Response
1 1 1 3 3 2 * * 1 - - -
Investigation 8 2 7 5 3 6 12 1 6 2 2 11
93
22
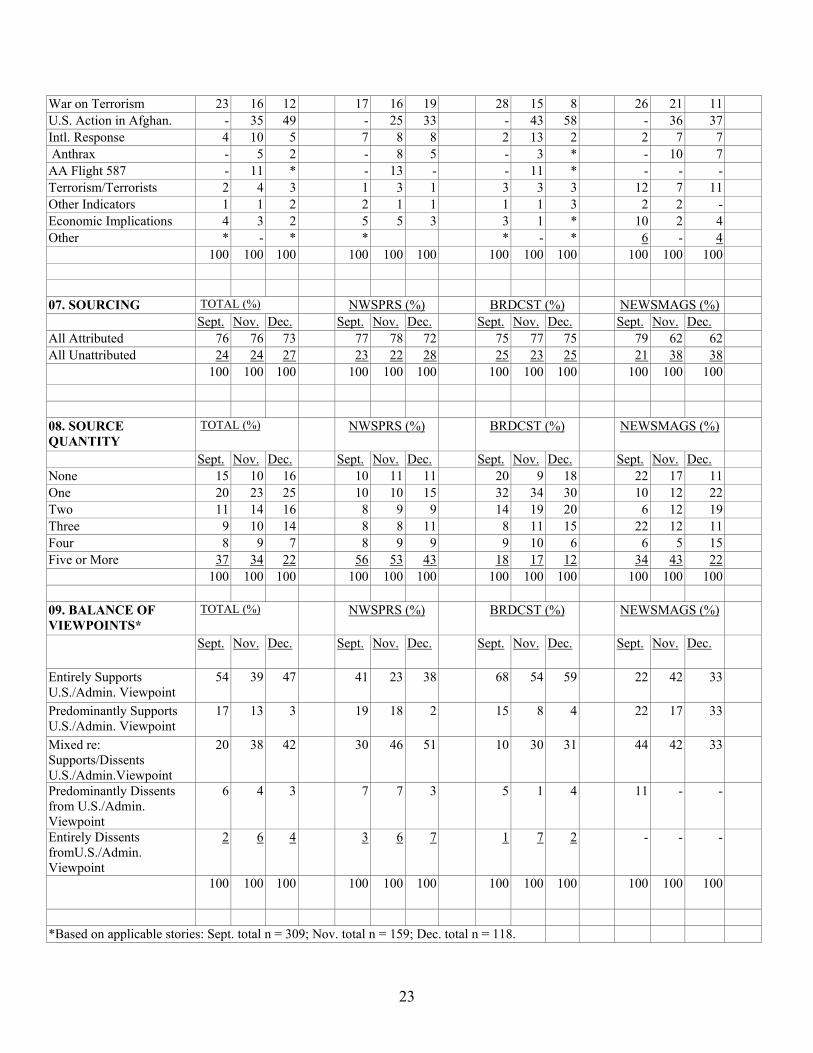
War on Terrorism 23 16 12 17 16 19 28 15 8 26 21 11U.S. Action in Afghan. - 35 49 - 25 33 - 43 58 - 36 37Intl. Response 4 10 5 7 8 8 2 13 2 2 7 7 Anthrax - 5 2 - 8 5 - 3 * - 10 7AA Flight 587 - 11 * - 13 - - 11 * - - -Terrorism/Terrorists 2 4 3 1 3 1 3 3 3 12 7 11Other Indicators 1 1 2 2 1 1 1 1 3 2 2 -Economic Implications 4 3 2 5 5 3 3 1 * 10 2 4Other * - * * * - * 6 - 4 100 100 100 100 100 100 100 100 100 100 100 100 07. SOURCING TOTAL (%) NWSPRS (%) BRDCST (%) NEWSMAGS (%) Sept. Nov. Dec. Sept. Nov. Dec. Sept. Nov. Dec. Sept. Nov. Dec. All Attributed 76 76 73 77 78 72 75 77 75 79 62 62All Unattributed 24 24 27 23 22 28 25 23 25 21 38 38 100 100 100 100 100 100 100 100 100 100 100 100 08. SOURCE QUANTITY
TOTAL (%) NWSPRS (%) BRDCST (%) NEWSMAGS (%)
Sept. Nov. Dec. Sept. Nov. Dec. Sept. Nov. Dec. Sept. Nov. Dec. None 15 10 16 10 11 11 20 9 18 22 17 11One 20 23 25 10 10 15 32 34 30 10 12 22Two 11 14 16 8 9 9 14 19 20 6 12 19Three 9 10 14 8 8 11 8 11 15 22 12 11Four 8 9 7 8 9 9 9 10 6 6 5 15Five or More 37 34 22 56 53 43 18 17 12 34 43 22 100 100 100 100 100 100 100 100 100 100 100 100 09. BALANCE OF VIEWPOINTS*
TOTAL (%) NWSPRS (%) BRDCST (%) NEWSMAGS (%)
Sept. Nov. Dec. Sept. Nov. Dec. Sept. Nov. Dec. Sept. Nov. Dec.
Entirely Supports U.S./Admin. Viewpoint
54 39 47 41 23 38 68 54 59 22 42 33
Predominantly Supports U.S./Admin. Viewpoint
17 13 3 19 18 2 15 8 4 22 17 33
Mixed re: Supports/Dissents U.S./Admin.Viewpoint
20 38 42 30 46 51 10 30 31 44 42 33
Predominantly Dissents from U.S./Admin. Viewpoint
6 4 3 7 7 3 5 1 4 11 - -
Entirely Dissents fromU.S./Admin. Viewpoint
2 6 4 3 6 7 1 7 2 - - -
100 100 100 100 100 100 100 100 100 100 100 100
*Based on applicable stories: Sept. total n = 309; Nov. total n = 159; Dec. total n = 118.
23
24
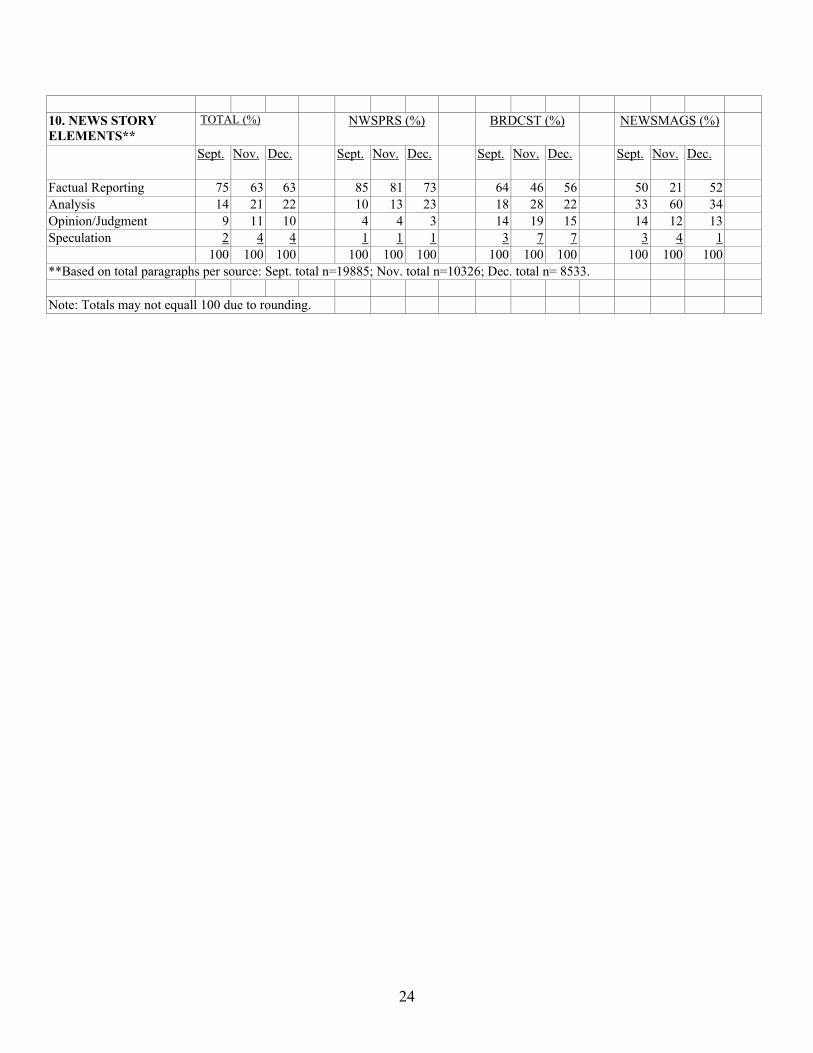
10. NEWS STORY ELEMENTS**
TOTAL (%) NWSPRS (%) BRDCST (%) NEWSMAGS (%)
Sept. Nov. Dec. Sept. Nov. Dec. Sept. Nov. Dec. Sept. Nov. Dec.
Factual Reporting 75 63 63 85 81 73 64 46 56 50 21 52Analysis 14 21 22 10 13 23 18 28 22 33 60 34Opinion/Judgment 9 11 10 4 4 3 14 19 15 14 12 13Speculation 2 4 4 1 1 1 3 7 7 3 4 1
100 100 100 100 100 100 100 100 100 100 100 100**Based on total paragraphs per source: Sept. total n=19885; Nov. total n=10326; Dec. total n= 8533.
Note: Totals may not equall 100 due to rounding.