Embed Size (px)
Citation preview

Thesis for the Degree of Licentiate of Engineering
Report L045
Returns Avoidance and Gatekeeping to Enhance E-commerce
Performance
Klas Hjort
Division of Logistics and Transportation Department of Technology Management and Economics Chalmers University of Technology Göteborg, Sweden December 2010 Swedish School of Textiles University of Borås Borås, Sweden December 2010

Returns Avoidance and Gatekeeping to Enhance E-commerce Performance © Klas Hjort, 2010 ISSN 1654-9732 Report/ Department of Logistics and Transportation, Chalmers University of Technology: L045 Division of Logistics and Transportation Department of Technology Management and Economics Chalmers University of Technology SE-412 96 Göteborg, Sweden Skrifter från Högskolan i Borås, ISSN 0280-381X. Nr. 22 Swedish School of Textiles University of Borås SE-501 90 Borås, Sweden

I
Returns Avoidance and Gatekeeping to Enhance E-commerce Performance
Klas Hjort
Department of Technology Management and Economics Chalmers University of Technology
Abstract
The mail order business was once a traditional method of selling and distributing clothes, and other commodities, to customers. Now, the e-commerce trend, with more sophisticated techniques of marketing, selling, and distributing goods, has not only challenged the traditional mail order system, it seems also that the traditional retail chain and even fashion chains are being challenged. This change not only affects how sellers compete (be they long-distance or not), it has probably affected us as consumers - our requirements and how we purchase. This work contributes to this development through extensive empirical investigations into how and why customers return what they have previously ordered. The primary conclusions are that consumer requirements tend to vary, and therefore the standard solution of delivering goods to a vast variety of consumers without engaging in discussion about the individual customer service requirements (et cetera) is most probably the central cause behind the increasing return trends seen in the business. The purpose of this thesis is to identify and to characterise important factors causing returns. Further, to assist the development of Returns Management research, the intention is to develop a theoretical model of a Supply/Demand Chain returns system that incorporates an application of avoidance and gatekeeping in a distance sale context with the aim to improve overall systems performance. The research design used in the thesis was a case study performed at one of the largest mail order organisation in Sweden, with a long tradition in the business. The main data used in the thesis has been collected from interviews, a questionnaire, and secondary data exported from the case organisation. Sales and returns data covering approximately one year of sales and returns in the Swedish market was quantitatively analysed, and the results were regularly discussed and presented to key informants at the case organisation to substantiate authenticity and trustworthiness. The overall conclusion is that the distance-sales trade is affected by the trends that are seen in other areas, namely increased competition - not only from within the distance trade but also from the traditional retail trade. This is probably due to the ease of shopping via e-commerce, and the vast supply of products that even exceeds that of the retail chains. This attracts new customer groups with new demands and requirements. This, in many ways, is an archetypal difference between today’s e-commerce business and yesterday’s mail order business, and could explain why customers from the different channels behave and return differently. The use of the Internet affects how we purchase, and therefore the result of the purchase. It is quite likely that we are far more spontaneous when purchasing over the Internet in comparison with telephone and mail orders.
Key words: Returns management, customer service, demand chain management, e-commerce, avoidance, gatekeeping

II
Acknowledgements
The results presented in this thesis would not have been achieved without the support of the case organisation, aiding the applied research with important empirical data, and professional knowledge. Confidentiality prohibits me from disclosing the company name, and the names of the individuals that have supported me, however, I would like to take this opportunity to thank you all!
Further, it would not have been possible for me to complete the thesis without the support of my fellow colleagues at the University of Borås, especially my colleagues at the School of Engineering, and Swedish School of Textiles. I am the latest in a group of PhD students within the field of logistics that have somehow fitted together, and in the end have finally concluded our theses at a licentiate level. I would like to thank you all for all the discussions we have had throughout. Thank you Göran, Daniel, Jonas Stray, Jonas Larsson, Roy, Agnes, and David.
To my supervisors, you have all supported me greatly in different ways. Professor Håkan Torstensson, you employed me and started my research journey. Even though I left my initial path within the field of reverse logistics, you supported me for a long time, and have helped me a lot. Professor Dag Ericsson, you have been an inspiration from day one, and you made me rethink what my research was about when you explained your views on how to look upon logistics or better, material administration, and Demand Chain Management. Finally I wish to thank Professor Kent Lumsden, at Chalmers. You, together with your colleagues, inspired me and my fellow students throughout the first courses of logistics and you supervised me in my thesis work for the masters’ degree. Now finally you are my examiner for the licentiate degree, and I hope that you are there for the next degree as well.
Before I get more personal I would like to thank those I have forgotten to mention that have supported me in different ways!
In October 2006 my son Karl was born and I believe that I owe Karl a lot; if was not for you I think I would not have found the strength to pull through, given the situation of living in Trelleborg and working in Borås. I know that you do not yet understand how much you mean to me!
Malin my wife, thank you for all the support you have given me throughout our years together, and for listening to my unnatural interest in returns. I love you with all my heart!
I thank you all for your support!
Trelleborg, December 2010
Klas Hjort

III
List of appended papers
Paper I:
Avoiding returns in distant selling through differentiating customers and their service delivery
Published:
Proceedings of the 21st Annual Conference for Nordic Researchers in Logistics, 2009
Paper II:
An application of Avoidance and Gatekeeping to manage returns in a distance selling setting
Published in:
Proceedings of the 22nd Annual Conference for Nordic Researchers in Logistics, 2010
Paper III:
Service delivery requirements of mail-order/e-commerce customers
Published in:
Proceedings of the 22nd Annual Conference for Nordic Researchers in Logistics, 2010

IV
Table of contents LISTOFFIGURES ...........................................................................................................................................VI
LISTOFTABLES.............................................................................................................................................VI
1 INTRODUCTION........................................................................................................................................1
1.1 BACKGROUND ..........................................................................................................................................................1
1.1.1 Drivingforcesbehindreturns .................................................................................................................. 3
1.1.2 EUregulation,thedistancesellingdirective..................................................................................... 4
1.1.3 Distancesellingfigures ............................................................................................................................... 6
1.2 PURPOSE ...................................................................................................................................................................7
1.3 RESEARCHQUESTIONS ...........................................................................................................................................8
1.4 RESEARCHOBJECTIVES...........................................................................................................................................9
1.5 LIMITATIONS.........................................................................................................................................................10
1.6 DEFINITIONS .........................................................................................................................................................10
1.7 THESISOUTLINE ..................................................................................................................................................11
2 METHODOLOGY .................................................................................................................................... 12
2.1 RESEARCHAPPROACH .........................................................................................................................................12
2.1.1 Systemsapproach .......................................................................................................................................15
2.2 RESEARCHPROCESS.............................................................................................................................................15
2.3 RESEARCHCHRONOLOGY....................................................................................................................................17
2.4 CASESELECTION...................................................................................................................................................17
2.5 DATASOURCES......................................................................................................................................................18
2.6 RESEARCHQUALITY.............................................................................................................................................19
3 FRAMEOFREFERENCE ....................................................................................................................... 20
3.1 LOGISTICS ..............................................................................................................................................................20
3.2 CUSTOMERSERVICE.............................................................................................................................................22
3.3 SUPPLYCHAINMANAGEMENT ..........................................................................................................................25
3.4 RETURNSMANAGEMENT ....................................................................................................................................26
3.4.1 Returns.............................................................................................................................................................27

V
3.4.2 Reverselogistics ...........................................................................................................................................28
3.4.3 Returnsavoidance ......................................................................................................................................29
3.4.4 Gatekeeping ...................................................................................................................................................29
3.5 DEMANDCHAINMANAGEMENT........................................................................................................................30
3.6 CONSUMERINSIGHT.............................................................................................................................................31
4 SUMMARYFROMAPPENDEDPAPERS ........................................................................................... 34
4.1 PAPER I – AVOIDING RETURNS IN DISTANT SELLING TROUGH DIFFERENTIATING CUSTOMERS ANDTHEIRSERVICEDELIVERY ...............................................................................................................................................34
4.2 PAPERII–ANAPPLICATIONOFAVOIDANCEANDGATEKEEPINGTOMANAGERETURNSINADISTANCESELLINGSETTING..............................................................................................................................................................37
4.3 PAPERIII–SERVICEDELIVERYREQUIREMENTSOFMAIL‐ORDER/E‐COMMERCECUSTOMERS ...........39
4.4 RESULTSOFAPPENDEDPAPERS ........................................................................................................................41
5 ANALYSIS................................................................................................................................................. 44
5.1 RESEARCHQUESTIONS‐ANALYSIS....................................................................................................................44
5.2 DISCUSSION ...........................................................................................................................................................45
5.3 CONTRIBUTIONS...................................................................................................................................................47
6 CONCLUSIONS ........................................................................................................................................ 48
7 FURTHERRESEARCH........................................................................................................................... 50
REFERENCES.................................................................................................................................................. 52
APPENDEDPAPERS
PaperI–Avoidingreturnsindistantsellingtroughdifferentiatingcustomersandtheirservicedelivery
PaperII–Anapplicationofavoidanceandgatekeepingtomanagereturnsinadistancesellingsetting
PaperIII–Servicedeliveryrequirementsofmailorder/ecommercecustomers

VI
List of figures
Figure1.1Forcesaffectingreturnsinavaluechain,adaptedfromCarterandEllram(1998)..................................3Figure1.2TheturnovertrendindistancesellinginSweden(ebarometern,2010) .......................................................6Figure1.3Applicationofreturnsavoidanceandgatekeepingtoadistantsellingvaluechain .................................8Figure1.4Researchquestionsinrelationtopresentedmodelofreturnsdrivingforces ...............................................9Figure1.5Systemlimitations,distributinggoodsfromstockviadistributionsystem,excludingthesupplysideofdistancesales............................................................................................................................................................................................10Figure2.1Threedifferentresearchapproaches(Kovacs,2006) ...........................................................................................14Figure2.2Researchchronology............................................................................................................................................................17Figure3.1Logisticssystem......................................................................................................................................................................20Figure3.2Keydriversofcustomervalue(HarrisonandvanHoek,2008) ........................................................................22Figure3.3Tendeterminantsofservicequality,withtheeightdeterminantspossibletoknowinadvancemarkedout(Parasuramanetal.,1985)............................................................................................................................................23Figure3.4Simplifiedservicequalitygapmodel(HarrisonandvanHoek,2008) ..........................................................24Figure3.5EightSupplyChainManagementkeybusinessesadaptedfromCroxtonetal.,(2001) .........................26Figure3.6Logisticssystemincludingreturnavoidanceandgatekeeping ........................................................................27Figure3.7Levelsofmarketingandsupplychainintegration(Jüttneretal.,2007)......................................................30Figure3.8Consumerbehaviourcharacteristics ............................................................................................................................32Figure4.1Returnlevelsperorderentrytypeoverleadtimeindays ..................................................................................36Figure4.2Indexedreturnlevelsforwaitordersoverleadtimeindays ............................................................................36Figure4.3Returnreasonsaspercentageofallreturns .............................................................................................................38Figure4.4Returnfactorsovercustomerageinyear,plottedtopresenttheskewtotheleft...................................38Figure4.5Customerratingscorefordeliveryleadtimeplottedovercustomerage ...................................................40Figure4.6Measureofgap1betweenspecifiedleadtimewhenplacingorderandmedianpreferredleadtime.............................................................................................................................................................................................................................41Figure5.1Customerservicedemandsandunderandoverdeliveryofservice .............................................................46Figure6.1Customercharacteristicsaffectingtheendresults ................................................................................................48Figure6.2Answeredresearchquestions...........................................................................................................................................49Figure7.1Returnseffectasafunctionofeaseofreturning(returnability)againstsalesandreturns ...............50
List of tables
Table1.1ReturnratesfordifferentindustriesintheUS(Rogers,98)....................................................................................1Table1.2Statisticsoverdistancesales2006(EMOTA,2010b) .................................................................................................7Table1.3Connectionsbetweenresearchquestionsandobjectives .........................................................................................9Table2.1Datasourcesusedinthethesis..........................................................................................................................................18Table2.2Fourtestsforevaluatingqualityofcasestudyresearch(Yin,2009)...............................................................19Table4.1Connectionsbetweenpapersandobjectives ...............................................................................................................34Table4.2Orderentryandtheirreturnlevelsbyage,averagenumberofyearsascustomer,andaverageageperordertype................................................................................................................................................................................................35Table4.3Relationbetweenappendedpapers,researchquestionsandmainfindings ................................................42Table5.1Reinterpretingresearchobjectivesintoresearchquestions................................................................................44

1
1 INTRODUCTION
This chapter presents a background to the research area, followed by an explanation as to the purpose of the conducted research. Chapter one ends with a presentation of the research questions, limitations and the outline of the thesis.
1.1 Background
Consumers are not buying products they are buying benefits (Christopher, 2005) - if this statement is true, and undoubtedly it is, organizations involved in the increasing e-commerce business should perhaps utilize their close contact with the end-user, and really try to understand why returns are steadily increasing. Return rates vary across industry and channel position, (cf. (Rogers and Tibben-Lembke, 1998; Croxton et al., 2002; Rogers et al., 2002)); across all industries they range from 2% to 50% of all shipments, and the average return rate for online apparel sales is as high as 35% to 40% (Norek, 2002).
Table 1.1 Return rates for different industries in the US (Rogers, 98)
Industry Percent
MagazinePublishing 50%BookPublishers 20‐30%
BookDistributors 10‐20%GreetingCards 20‐30%CatalogueRetailers 18‐35%ElectronicDistributors 10‐12%
ComputerManufacturers 10‐20%CD‐ROMs 18‐25%Printers 4‐8%
MailOrderComputerManufacturers 2‐5%MassMerchandisers 4‐15%AutoIndustry(Parts) 4‐6%ConsumerElectronics 4‐5%
HouseholdChemicals 2‐3%
Research into the reverse flow conducted at earlier times focused merely on planning and controlling the vertically integrated chain of events, with the main focus on efficiency. Today the focus has opened up to cover areas such as Returns Management (RM), where an extended approach with return avoidance and gatekeeping lets one work proactively to avoid returns, and to gatekeep the return system from “unwanted” returns (Rogers et al., 2002). Avoiding (preventing) returns is the most cost efficient way of reducing returns (authors note), previous research has focused on ease of use and improved quality issues.
There are several definitions of goods moving upstream, or towards the initial source; reverse logistics, closed loop supply chains, returns management, and so on. The research started with

2
the participation in a Reverse Logistics (RL) research project financed by Vinnova, the aim to improve the efficiency of waste transportation in Sweden. The project “Efficient Waste Transportation” (EFFA) ceased in 2005, having given the author an important insight into the waste transportation system in Sweden, and an increased understanding of the process of reverse logistics. In the literature review (EFFA) on reverse topics the author became aware of recent publications regarding reverse activities, where the emphasis had somewhat changed or expanded from a reverse logistics process perspective (Rogers and Tibben-Lembke, 1998) towards an integrated or Supply Chain Management perspective (Rogers et al., 2002). Just as there are definitions of logistics and supply chain management that are dependent of viewpoint, there are definitions that have changed over time; the same applies to reverse logistics and related areas. This thesis adopts the definition of Returns Management (RM) proposed by Rogers et al. (2002):
“Returns management is the part of supply chain management that includes returns, reverse logistics, gate keeping and avoidance”.
Traditionally, research has focused on reverse logistics, with the emphasis on efficient redistribution and handling of used products, packaging material, and inventory control of returned products. The focus has been on resource reduction, reuse, and recycling. Instead of the narrow reverse logistics perspective, the broader perspective of Returns Management opens new areas for handling returns through to reducing returns, or even avoiding some of them! Gatekeeping enables the control, and reduction, of returns without damaging customer service.
A model (see Figure 1.1) of the surroundings and the different forces that create returns is presented. The model is adapted from a model presented by Carter and Ellram (1998). The model shows four driving forces that create returns in a value chain; the outer boundary consists of regulatory and competitive forces that stipulate the outer conditions. Inside the value chain the outer regulatory forces, such as producer responsibility and consumer rights directives, directly stipulate return conditions, on both the supply and demand sides. The competitive forces indirectly influence the balance between physical supply and demand that could cause returns. The supply side might reposition (return) inventory located downstream, in order to respond to demand in another (competing) value chain (network). The demand side could return inventory for the same reason, i.e. over-anticipated demand, and push returns upstream towards supply side. The model does not explain why returns are created, but merely suggests that returns are likely caused by more than one factor. Returns therefore call for attention outside the organisation, i.e. the returns system must comply with legislation that varies depending on the market, and competitive pressure affects both the supply side and demand side, thus creating returns.

3
Figure 1.1 Forces affecting returns in a value chain, adapted from Carter and Ellram (1998)
1.1.1 Driving forces behind returns
Since the oil crises in the beginning of the nineteen seventies, and subsequently the relationship established between economic development and environmental degradation, first placed on the international agenda at the UN conference on the Human Environment held in Stockholm in 1972, the awareness of global environmental issues has risen (UN, 1992). After the conference, governments set up the United Nations Environment Program (UNEP), which today continues to act as a global catalyst for action to protect the environment. Producing companies became more and more involved in new regulations regarding what they produce and the waste they generate, both from the production and from their products. By 1983, when the UN set up the World Commission on Environment and Development, environmental degradation, which had been seen as a side effect of industrial wealth with only a limited impact, was understood to be a matter of survival for developing nations (UN, 1992). The Commission put forward the concept of sustainable development as an alternative approach to one simply based on economic growth:
“One which meets the needs of the present without compromising the ability of future generations to meet their own needs”
New regulations such as Extended Producer Responsibility (EPR) or “polluter pays”, together with tougher rules for disposal of waste and the regulations for landfills, have influenced both producers and consumers to separate recyclable resources from waste in Sweden, the EU, and other developed countries. In Sweden, most (perhaps all) EPR programmes operate in separate systems i.e. the producer or initial source does not operate the return systems themselves. The organisations that are obliged to conform to the regulations normally pay a “producer’s fee”, i.e. packaging material, tyres, and automobiles, et cetera, instead of operating the returns flow themselves. This, of course, is in line with the general trend towards focusing on core business and outsourcing.
Research in the field of reverse flow started in the seventies when firms producing consumer products developed recall procedures to recall defective products (Wood, 1979b). The producers often had to bypass the distribution chain and deal directly with the retailer or the ultimate consumer, as they had little control over the distribution channel and could not rely on intermediaries. Woods’ conclusions thus still remain important, that recalls and returns (authors note) can cause adverse publicity and have a major impact on customer satisfaction

4
and company image. Today, it is of course easier to manage recalls, due to better information systems; on the other hand, bad publicity is spread faster and more effectively through the same information systems!
Thierry, Salomon et al. (1995) introduced Product Recovery Management (PRM) and different product recovery options, such as repair, refurbish, and remanufacture cannibalization and recycling. PRM was company orientated, dealing with responsibilities for manufacturers, and aiming to recover as much of the economical and ecological value as reasonably possible. Thierry mentioned the importance for companies to become more adaptable to rapid changes in both regulations and customer demand for “green products”, i.e. products that can be resold, recovered or recycled.
Customer expectations have increased over the past 30 years (Christopher, 2005), and the importance of customer service has increased as a potential way of differentiating service levels.
There are different reasons why producers, customers, or end users, send or transport materials in reverse, or upstream (a better description). However, return flows can be divided into two separate flows, namely, packaging or products (Rogers and Tibben-Lembke, 1998, p. 6.). According to Rogers et al (2002, p. 3.) returns are grouped into five categories: consumer returns, marketing returns, asset returns, product recalls, and environmental returns. For products, customer returns accounts for a large share of the returns flow and are an increasing problem, due to the growing interest for e-commerce.
The returns allowance is often found in the distance sellers’ returns policy. Some organisations follow the legislation directly, and sometimes the policy in itself reads out as a text from the directive. Other organisation’s returns policies extends the allowed timeframe and even offers free returns as means of attracting new customers to the business. This in some way indicates that customers are reading through the returns policy before or during ordering. L.L. Bean, a U.S. mail order/e-commerce organisation, has taken the returns policy even further and offers customers a 100 % satisfaction guarantee which entitles customers to return anything they are not satisfied with at any time (Rogers and Tibben-Lembke, 1998).
1.1.2 EU regulation, the distance selling directive
E-commerce has boomed in several areas, such as books, music, clothes, home electronics, et cetera. In the EU the distance selling directive (EUR-Lex, 97) is transposed into national law to protect customers buying from a distance, i.e. phone, mail order, e-commerce, et cetera. Consumers are entitled by law to return what they have purchased within a certain timeframe and conditions. The interpretation of the directive and the implementation of the legislation within the EU differ. In Germany and Finland the interpretation allows customers to return what they ordered free of cost, i.e. the distance seller does not charge any return freight cost. There are other differences in the interpretation as well; some EU-countries allow a 7-day return period, while others stipulate that the customer has 14 days after delivery until they can return what they have found unsuitable in some way.
A new EU action plan (EMOTA, 2009) aims to create an online single market. The barriers to the digital single market are well known (see (EMOTA, 2009)). The main barriers to cross-border distance selling are of a regulatory nature. European differences, such as languages, currencies, and consumer preference, also play a role.

5
Consumer Protection
Distance sellers need to adapt their systems to meet different rules concerning all aspects of the sale, from payment conditions, to ‘cooling off’ periods, to after-sales service.
Sales Tax
VAT rates vary from 15% to 25%. In addition, excise duties apply in certain cases, and for certain products registration requirements differ.
Shipment Charges
Charges vary considerably from market to market and there is a lack of interoperability in multi-operator markets.
Payment Methods
Preferred methods of payment vary – e.g. bankcards, cash on delivery, and bank transfers, prevail in different markets - there are no easy pan-European solutions for distance sellers due to a lack of widely accepted standards.
Language
Catalogues, websites, and all other correspondence, needs to be translated and an ability to answer queries in local languages is essential when penetrating new markets.
Additional Barriers
There are many additional factors which fragment the European market, including differences in: data protection requirements, product safety rules, environmental rules, and exchange rates. In addition, there are a host of specific technical requirements (e.g. standards vary regarding clothing sizes, different plugs may be required for electrical equipment, etc).
(EMOTA, 2009)
The barriers have been a subject of the EU legislator and EMOTA’s attention for some time, and with the new report the European Commission recognises that more needs to be done. Further, faced with the complex and interdependent nature of the problems identified by their research, the Commission is proposing a package of diverse actions in order to address them. Not surprisingly, the proposed harmonisation of consumer laws tops the list. Full harmonisation of consumer rules would remove one of the important barriers to the development of cross-border trade:
• Withdrawal period: an end to differences in the length and starting point of the withdrawal period.
• Information requirements: more consistency regarding information requirements and the manner in which customers have to be informed.
• Cost of returns: confirmation regarding the customers’ responsibility to pay for returns and for any eventual reduction in value of the returned goods.

6
Member States should not in future be allowed to introduce further constraints than those which are foreseen in the Consumer Rights Directive, such as imposing free returns for the consumer or prohibiting charged phone calls for after-sales services.
1.1.3 Distance selling figures
Total European distances sales amounted to €123.8 billion in 2008, up 13.1%. Overall, Europe’s distance sellers are performing impressively, turnover has doubled since 2003, and 2008 marks the fourth consecutive year of double-digit growth (EMOTA, 2010b). EMOTA is the European trade organisation representing all aspects of distance selling both online and offline. With its 21 member associations, EMOTA represents nearly 2500 companies all across Europe (EMOTA, 2010a).
Distance sales, i.e. internet or mail order trade, represents an increasing share of the retail trade in Sweden. In 2005 the turnover amounted to SEK 13.4 billion, and in 2009 it has more than doubled, with the turnover reaching SEK 28.1 billion. Its share of the retail trade has increased by more than 50% over the same time period, and represents 4,6%. The trend is quite clear - distance selling is increasing, and the e-commerce side represents the greatest area. In Sweden alone, the e-commerce turnover reached SEK 22.1 billion in 2009, with an 8.1% increase since 2008, and it represented 4.2 % of the total retail trade.
Figure 1.2 The turnover trend in distance selling in Sweden (e-barometern, 2010)
Distance sales are increasing in both Sweden and in the EU. A harmonisation of the consumer rights and the creation of an online single market will probably affect e-commerce and the possibility for cross-border trade with greater transportation distances et cetera. In the EU, and other neighbouring countries, the sales per capita vary; in Russia and Spain the sales are rather modest in comparison with Germany and the UK (Table 1.2). However, both markets, underdeveloped and developed, are interesting for distance sales organisations, and are therefore driving forces for cross-border distance sales.

7
Table 1.2 Statistics over distance sales 2006 (EMOTA, 2010b)
CountryPopulationin
millionTotaldistancesales
inmillionEURDistancesalesper
capitaEUR
Denmark 5,4 1180 218,5Finland 5,2 620 119,3
France 63,0 18000 285,7Germany 82,4 26296 318,0Netherlands 16,3 3690 226,4Norway 4,6 1032 224,3
Russia 142 1297 9,1Spain 43,8 1094 25,0Sweden 9,0 1804 200,4
Switzerland 7,5 1644 219,2UK 60,4 26843 444,4
Returns management as a supply chain management process includes several features that can make an individual organisation more effective and efficient. However, the process will provide most benefits when implemented across members of the supply chain. The returns management process can reduce costs, increase revenues, and increase customer satisfaction (Rogers et al., 2002).
1.2 Purpose
Previous research has addressed the following areas for further research (Rogers et al., 2002):
• Determining the costs and benefits to the supply chains derived from improved returns management.
• Determining which methods of gatekeeping are most effective in managing the tradeoffs between costs and customer service.
• Identifying the information technology and types of systems that are needed to fully support returns management.
The purpose of this thesis is to identify what causes returns in mail order/e-commerce sales, and to characterise important factors causing returns. Further, to assist the development of Returns Management research, the intention is to develop a theoretical model of a Supply/Demand Chain returns system that incorporates an application of avoidance (to improve effectiveness) and gatekeeping (to improve efficiency) in a distance sale context with the aim to improve overall systems performance.
The overarching hypothesis is that through increased understanding improvements will come in returns avoidance procedures and the gatekeeping system and procedures.
Returns avoidance will be applied to the four factors causing returns (Figure 1.3 dotted rectangle) and gatekeeping will be applied primarily to parts of the value chain (Figure 1.3, dashed rectangle), however the outer boundaries (i.e. the environment) will be considered.

8
Figure 1.3 Application of returns avoidance and gatekeeping to a distant selling value chain
1.3 Research questions
In preceding chapters the background to the research is outlined, indicating a natural increase in returns depending on environmental concerns and legislative issues. Further, considering the increasing distance sales and return levels presented in Table 1.1, together with the awareness of increasing consumer expectations and the relatively new business of distance sales especially the e-commerce, we need to focus more on understanding what creates returns. A thorough understanding of what causes returns and how they affect organisations and the system should open up new systems opportunities. Below the three main research questions are presented.
RQ 1: What characterizes efficient returns systems? In particular, what are the causes and sources of returns, what factors and processes influence returns systems performance, and what are the key elements and requirements to consider when designing a returns system?
RQ 2: How can contemporary information systems enhance returns system performance and contribute to efficient returns management?
RQ 3: Based on the achieved understanding and results, how should a Supply/Demand Chain be organized to avoid future returns?
9
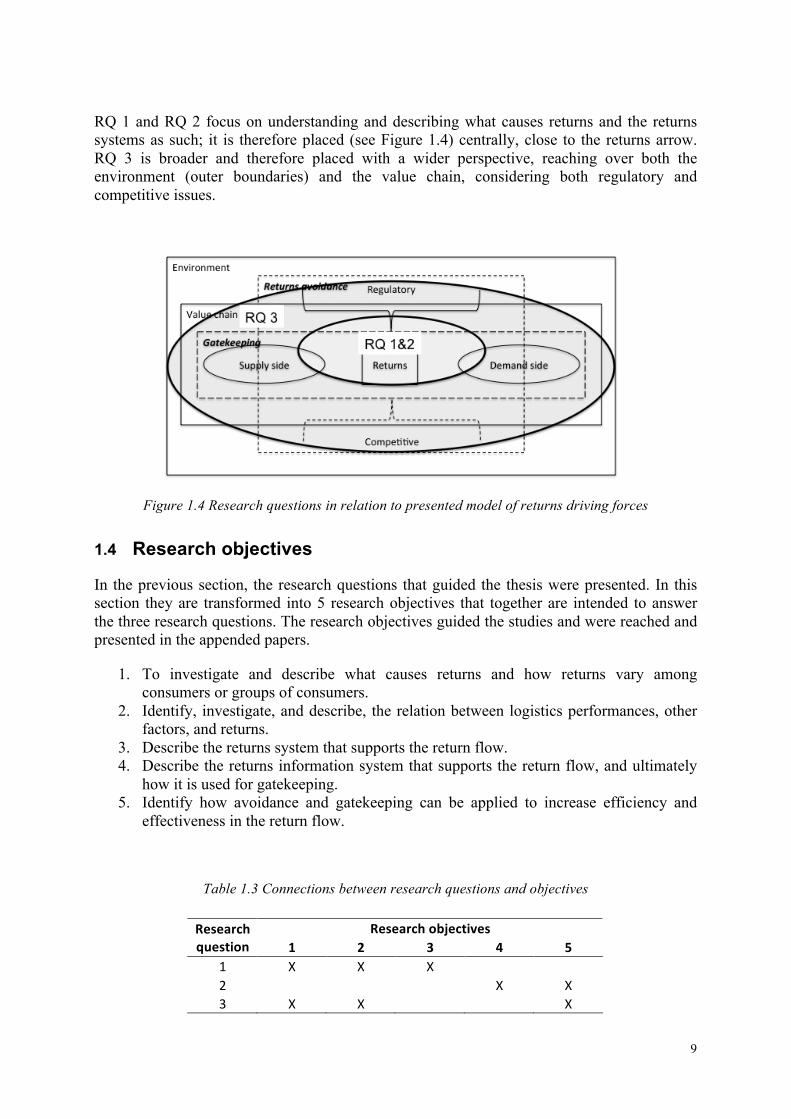
RQ 1 and RQ 2 focus on understanding and describing what causes returns and the returns systems as such; it is therefore placed (see Figure 1.4) centrally, close to the returns arrow. RQ 3 is broader and therefore placed with a wider perspective, reaching over both the environment (outer boundaries) and the value chain, considering both regulatory and competitive issues.
Figure 1.4 Research questions in relation to presented model of returns driving forces
1.4 Research objectives
In the previous section, the research questions that guided the thesis were presented. In this section they are transformed into 5 research objectives that together are intended to answer the three research questions. The research objectives guided the studies and were reached and presented in the appended papers.
1. To investigate and describe what causes returns and how returns vary among consumers or groups of consumers.
2. Identify, investigate, and describe, the relation between logistics performances, other factors, and returns.
3. Describe the returns system that supports the return flow. 4. Describe the returns information system that supports the return flow, and ultimately
how it is used for gatekeeping. 5. Identify how avoidance and gatekeeping can be applied to increase efficiency and
effectiveness in the return flow.
Table 1.3 Connections between research questions and objectives
ResearchobjectivesResearchquestion 1 2 3 4 5
1 X X X 2 X X3 X X X

10
1.5 Limitations
The application of returns management to the mail order/e-commerce market is limited to focus on two of four activities; returns avoidance and gatekeeping, excluding returns and reverse logistics (see, section 3.4). The analysis of present systems using a returns management framework will likely support the development of the more strategic returns part of returns management. The mail order/e-commerce system is characterized by delivery from stock, meaning the final distribution of finished goods will take place after a consumer has placed an order (see, Figure 1.5).
Figure 1.5 System limitations, distributing goods from stock via distribution system, excluding the
supply side of distance sales
The supply side in this thesis is therefore limited to supplying stocked products through a distribution system, and the demand side (see Figure 1.3) is limited to the consumer ordering.
1.6 Definitions
‘Distance sales’ is used to describe the combination of mail order and e-commerce. ‘Customer’ and ‘consumer’ are used interchangeably in the thesis as a term for the end-user i.e. the one that purchases, however it does not have be the one that finally consumes the resources.
The following definitions are used throughout the thesis to describe the amount of returns in relation to what was delivered. ‘Returns percentages’ are described in two ways, namely, for shipments and units. One shipment can contain one or more units and the shipments returns percentage for one shipment can only be 0% or 100%. However, for units it can be in the full

11
range of 0% to 100%. The greater the number of delivered units, the smaller the returns percentage can be, if we do not consider 0% as returns percentage. The opposite occurs for fewer delivered units - two delivered units can be returned in the range of 50% to 100%, if we exclude 0% as returns percentage.
Return percentage for shipments are calculated as described below:
Return percentage for units are calculated as described below:
1.7 Thesis Outline
This section presents a brief outline of the thesis as an introductory guide for the reader.
Chapter 1 - Introduction, in the introduction a background to the problem area of returns is presented, followed by a presentation of four driving forces behind returns. The purpose of the research is presented, and three research questions are proposed and discussed in relation to the purpose and problem background. Based on the purpose and the research questions, the scope of the research is presented, and limitations are also addressed at the end of the section.
Chapter 2 - Methodology, the methodology section provides a description of the research approach undertaken. The author attempts to delineate his pre-research presumptions, and how they may have influenced the research process and results.
Chapter 3 - Frame of Reference, in this section the theoretical backbone used in the two studies (that resulted in three papers) is presented. The section is quite comprehensive and was successively extended during the research.
Chapter 4 - Results from appended papers, the results from the appended papers are presented, together with the links to the research objectives.
Chapter 5 - Answers to research questions and Discussion, this section presents the answers to the research questions, through connecting the objectives to the questions, and it ends with a discussion about the findings.
Chapter 6 - Conclusions, the main conclusions in the thesis are presented in chapter six, where the empirical and theoretical contributions are discussed.
Chapter 7 - Further research, the thesis ends with suggestions on how to conduct future research presenting topics for an additional four papers.

12
2 METHODOLOGY
This chapter describes the methodological framework used in the thesis followed by a discussion on empirical data sources used and how results were verified and validated.
2.1 Research approach
History shows that observations are based on beliefs (Arbnor and Bjerke, 1997) - if we believe that the earth is round or flat, this belief will likely affect our statements concerning observations of the earth. Every researcher observes or studies phenomena with certain presumptions. Consciously or subconsciously, this affects our depiction of the phenomenon or problem; ultimately our presumptions or background hypotheses (Arbnor and Bjerke, 1997) affect our choice of research design, and the methods and techniques used. It took quite a while before the research journey progressed to where I am today as regards to my personal presumptions, and this is not due to a lack of understanding that people see things differently, including myself. It is interesting to think about what creates these personal lenses. When two people looking at the same thing and describe different things, objectivity becomes somewhat difficult to believe in. Paradigm is most certainly one of these lenses that affect what people (you and I) see, or how we interpret and describe what we see or discover. Positivists argue that there is an objective reality out there; the alternative or anti-positivistic side argues that there is no such thing as an objective reality. It is all created in people’s minds. The ontological assumptions based on the philosophy of science separate scientists into two sides, objectivist or subjectivist. This research belongs somewhere in between; the goal has never been an objective description of reality, and neither a subjective interpretation of it.
Ultimately, this research is likely to be affected by the author’s presumptions, however, to some extent, knowledge of these presumptions has resulted in the constant revision of how to conduct the research during the research process. It has also made me more understanding of the necessity of describing the research conducted, so that people, scientist or not, that read, review, listen, and finally judge, understand what the ultimate presumptions were. Scientists belonging to the social science group tend to be somewhere in between the positivistic and the anti-positivistic paradigms. The aim of the positivists is to explain, whereas that of the anti-positivist is to search for understanding. Either way, I believe that both sides are struggling - the ultimate explanation and the perfect understanding of phenomena are likely to be hard to find, depending especially on the phenomena of interest. The greater the scope, the harder it is to describe completely, and perhaps even to understand. Studying social phenomena and social interaction, the quest for increased understanding is likely to be the more fruitful path.
To carry out research in areas that could be characterised as ‘novel’ - where there is no or little previous knowledge to refer to - calls for an exploratory approach. The research carried out started as exploratory, to gain valuable insight into the area of consumer returns, later becoming more descriptive in order to better describe the research area under investigation, and finally, hopefully, to create new knowledge.
Theory and research, or the link between, denotes the research approach undertaken as inductive or deductive. The inductive approach aims at developing theory out of empirical observations/findings. Deduction however aims at testing theories, and therefore, theory is present prior to empirical observation. Social research is often guided by a lower level of abstraction, e.g. mid-range theories which facilitate the link to empirical investigations and findings, as opposed to grand-theories. According to Bryman (2008, pp. 9), deductive theory

13
represents the most common view of the nature of the relationship between theory and social research. The deductive researcher should develop or deduce hypotheses from what is known from previous research or theories. The hypothesis must then be tested or scrutinized against empirical evidence that either supports or rejects the hypothesis.
The inductive method starts with the observation and ends with new theory (Bryman, 2008, pp. 11) i.e. concluding general laws from individual cases and constructing theories using factual knowledge (Arbnor and Bjerke, 1997, pp. 92). The inductive and deductive approaches have met with massive criticism from opposing sides during the scientific development (Popper, 1959). The two sides, in using different research procedures, often represent two different research strategies, the quantitative and the qualitative. The quantitative side predominantly follows the deductive procedures, and emphasizes quantification in both the collection and analysis of data, following the natural scientific model in general, and the positivistic approach in particular (Bryman, 2008, pp. 22). The qualitative side follows the inductive procedures, and have rejected the natural scientific norms, emphasising the way that individuals interpret their socially constructed, ever-shifting, world.
Logistics research is interdisciplinary and stems from many different scientific traditions, and has been influenced by both economics and behaviour approaches (Kovács and Spens, 2005, pp. 132), borrowing ideas from disciplines of marketing, management, and engineering. Logistics has been criticised for not having a history of theory development, and, being a relatively recent discipline, it is somewhat surprising that it follows the positivistic path in testing theories. Further, logistics research has historically followed the path of deduction and induction (Kirkeby, 1990). Deductive reasoning with predominantly quantitative positivistic methods is most often represented in major logistics journals (Ellram, 1996), especially in the US (Näslund, 2002). Deductive research approach is more suitable for testing existing theories (Stentoft Arlbjørn and Halldorsson, 2002), not for creating new science, and therefore its usage and dominance in the relatively new field of logistics research is somewhat surprising. Kovács and Spens (2005) argue that the development of new theories in logistics research calls for a discussion on abduction. Abductive reasoning combines the inductive and deductive research procedures and emphasizes the search for suitable theories for an empirical observation (Kovács and Spens, 2005, pp. 138). Dubois and Gadde (2002) present a similar approach called ‘systemic combining’. Systemic combining focuses more on the refinement of existing theories than on the development of new theories. A major difference between, on the one hand, traditional inductive and deductive research and, on the other hand, abductive and systemic combining is their focus on the framework. The latter’s framework is successively modified during the course of the research, which allows the borrowing of theories from other disciplines (Stock, 1997), which also reduces the focus on reviewing all literature beforehand.
The research conducted followed the model of Kovács and Spens (2006), presented in Figure 2.1 below. The first group of “abductive” researchers saw abduction as a combination of systematized creativity in research to develop new knowledge (Kovács and Spens, 2005).

14
Figure 2.1 Three different research approaches (Kovacs, 2006)
The initial step of the abductive approach is similar to the inductive, but differing in that the inductive approach ends with new knowledge without testing the results, whereas the author’s ambition here was to develop and test the hypothesis/propositions in order to support or falsify them. Popper (1959), however, argues that hypotheses can never be fully supported; only falsified.
According to Arbnor (1997) there are three methodological approaches to use in business research: analytical, systems, and the actors approach. The analytical approach is closely related to positivistic research traditions where an objective reality is accessible and where causal relations are sought after, in order to explain and generalise the results and to predict future incidents (Gammelgaard, 2004). The researcher stays outside the research object in order not to affect the depicted reality.
This research followed a systems approach to logistics research, as Ekwall (2009) indicates as an established tradition. The author, however, acknowledges the actors approach as being equally as interesting, but given the research questions, purpose, and scope, the systems approach was found to be most suitable.
Case studies are suitable for holistic situations in real life settings (Ellram, 1996, pp. 99; Dubois and Gadde, 2002; Yin, 2009) and to formulate theories that later could be tested using surveys. A case study is not a linear process as many authors describe it, it requires an integrated approach to handle the interrelatedness of the various elements in the research work, and therefore the abductive procedures should support the case study method. Any preliminary analytical framework consists of the researcher’s ultimate presumptions, and the framework is developed as the empirical observations emerge.
A holistic approach often determines a systems approach, where the world is understood in terms of its mutually dependent components, whereas the more positivistic approach favours a reductionist approach, where the reality could be deconstructed into its parts (Gammelgaard, 2004). From a systems approach, deconstructing the reality into its parts is ultimately meaningless; the researcher should work very close to, and influence, the research object, and the main objective is to improve the system.
The actors approach discards the fact that there is an objective reality, and the reality is seen as a social construction. The idea is to understand and construct the reality from within, where the researcher is a part of the reality.

15
2.1.1 Systems approach
The systems approach is the common approach in logistics research (Ekwall, 2009), but the theoretical system can be explained or defined in different ways. Arbnor and Bjerke (1997) distinguish between three possible areas when adopting the systems approach to a study:
• Systems analysis • Systems construction • Systems theory
The systems analysis is meant to create a model of the real system without changing it, and to describe internal and external factors influencing it. In doing so, it has both a descriptive and explanatory purpose (Arbnor and Bjerke, 1997). System construction includes the (potential) construction of a new system model; the new system can be the real system depicted using the system analysis. The systems analysis and systems construction are parts in the development of new systems theory.
Within the systems approach, the model of a system is a reproduction of reality (Arbnor and Bjerke, 1997). A system can be either closed or open, the open system connecting with its surrounding environment. Studying the mail order/e-commerce system, and its return system, it seems rational to follow the acknowledged path of using the systems approach. The main reasoning behind this decision is:
• Social systems are complex • It is an open system • Relations between systems components
Using the systems approach in logistics research we assume that reality is arranged in a way, such that the whole differs from the sum of its parts – synergies or relations between parts in the system are important and therefore should not be reduced to simplified models searching for causal relations only thus acknowledging the soft systems thinking (Checkland, 1995), where the presence of human beings is seen as a part within the system examined. Checkland defines the difference between the hard and soft systems approaches, the approach that assumes the world to be systemic is hard; the approach that assumes that the process of enquiry can be systemic is soft.
The holistic systems perspective used in the conducted research uses the SC perspective when analysing the returns system. The depicted systems model in Figure 1.5 incorporates both distribution and delivery in the systems model, indicating that the case organisation, distributor (including pick up point), and consumer, are components.
2.2 Research process
All research starts with some knowledge about the problem, however, that knowledge might be more or less theoretical or empirical. The deductive strategy of course is more focused on the theoretical side of understanding, and it requires a thorough literature review as a starting point. This research commenced with a review of published material regarding the area of reverse logistics. The starting point of this thesis was the participation in a research project financed by Vinnova, and the main purpose of the research was to create an efficient waste transportation system in Sweden. In the finalisation stage of that project, a second literature review led the author to the notion of Returns Management.

16
Around the same time, the author participated in, and led, a pre study together with three mail order organisations and a third party logistics (3PL) service provider. The aim of this study was to examine whether the 3PL service provider could help the mail order organisations with their ever-increasing returns flow. The main purpose of the study was to examine possible efficiency increases in the handling of returns, mainly through economies of scale. Both initial studies battled with the problem of competing organisations, which were very restrictive regarding supporting the studies with data and information, as it was seen as highly confidential.
At the presentation of the pre-study results the author was granted the opportunity to present a more recent approach to returns - theories of returns management. During the presentation of returns management, one of the senior managers from one mail order organisation listened carefully when he heard about avoiding returns as opposed to the efficient handling of them. The same manager opened the door to an abundant amount of data and information, as we closed the doors to other participants. The conducted research began with little specific theoretical knowledge about what causes consumer returns, as it was a quite unknown area of research. The research questions address both organisational issues and consumer related causes of returns, and the purpose aims at developing the returns system as such. All this indicates that the research aims at understanding and describing complex systems, thus the case study design is well suited to produce this kind of context dependent knowledge (Aastrup and Halldorsson, 2008). The scope of the pilot case study (Yin, 2009) may be much broader and less focused. The pilot study resulted in a much deeper knowledge about the research problem and at the same time gave valuable insights in how to conduct future case studies and how to choose the following cases.
This, somewhat crooked, path to the conducted research continues with a more precise description of the research in the thesis. It contains the results of two studies performed with the same organisation presented in three papers I to III.
Given the characteristics of logistics research, complex systems, including organisational boundaries, the presented research questions, and the possibilities of accessing empirical data, from both production and consumers, the case study design was decided upon, using a mixed method approach combining both quantitative and qualitative data. According to Ellram (1996), research methodologies can be described according to the data used and the type of analysis performed.
The aim of the first study was to increase the understanding of possible returns causes and how returns management, especially avoidance and gatekeeping, applies to the problems of consumer returns. The first study is presented in two papers (I and II). To explore a little known phenomena an exploratory case study design is desirable, according to Ellram (1996). The case study design suits both exploratory and descriptive studies, and the combination of both in-depth understanding and broad descriptions - i.e. combining qualitative and quantitative techniques (Eisenhardt, 1989; Ellram, 1996) - facilitates the quest for what causes consumer returns.
The second case study relates to the outcome of the first, and tries to describe the differences in consumer requirements regarding logistics service delivery. The study uses the survey technique to gather empirical data from the customers to the case organisation in the first and second study. According to Yin (2009, pp. 63), mixed methods, in this case combining a survey within a case study, could be more difficult to perform but enable the researcher to address broader questions.
17
The overall research process has been described as abductive, which fits both the research questions and the purpose of the research, in the first study the initial exploratory search for causes of returns helped to further develop the research questions and to be more descriptive in the understanding of causes. This resulted in a developed framework that expanded towards logistics and customer service. In order to later apply avoidance we had to know more about the “root cause” of returns. Following the abductive approach, out of the exploratory results we developed hypotheses that were tested against the empirical data. The results of these hypotheses generated suggestions on what causes returns, or at least on parts of factors of what causes returns. Later, the propositions were tested in study 2 and presented in paper III, and this should be seen as the second test of the results.
2.3 Research chronology
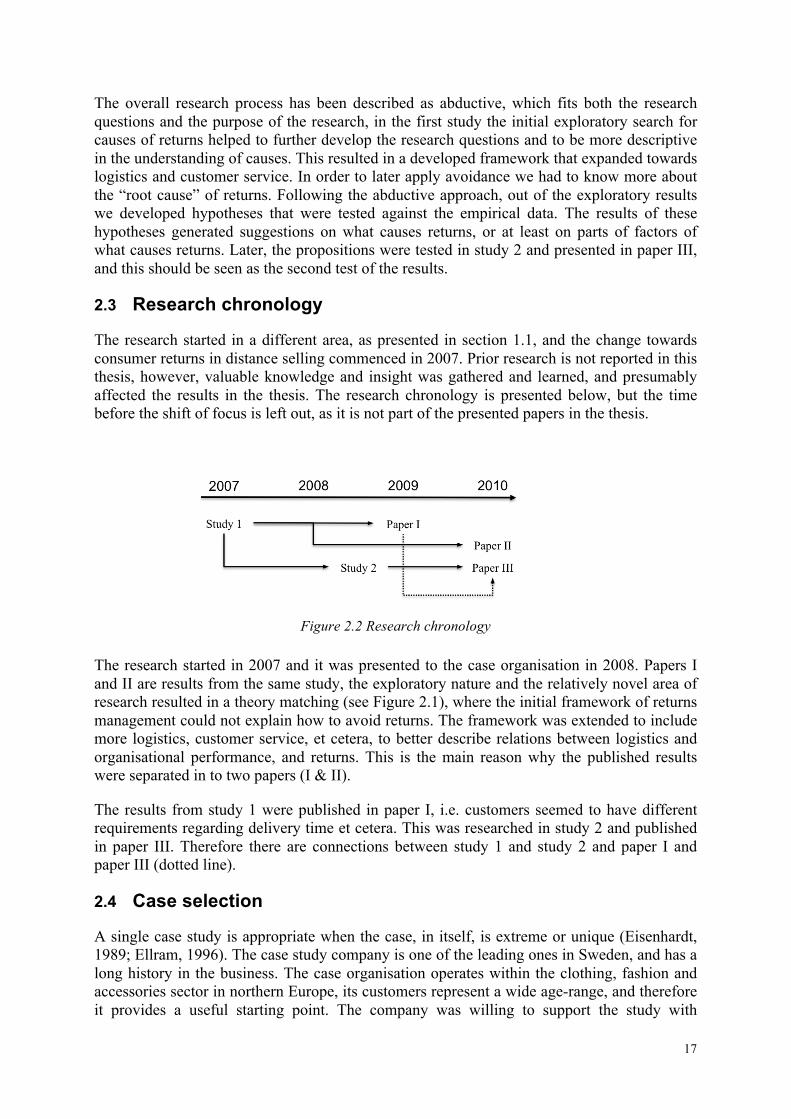
The research started in a different area, as presented in section 1.1, and the change towards consumer returns in distance selling commenced in 2007. Prior research is not reported in this thesis, however, valuable knowledge and insight was gathered and learned, and presumably affected the results in the thesis. The research chronology is presented below, but the time before the shift of focus is left out, as it is not part of the presented papers in the thesis.
Figure 2.2 Research chronology
The research started in 2007 and it was presented to the case organisation in 2008. Papers I and II are results from the same study, the exploratory nature and the relatively novel area of research resulted in a theory matching (see Figure 2.1), where the initial framework of returns management could not explain how to avoid returns. The framework was extended to include more logistics, customer service, et cetera, to better describe relations between logistics and organisational performance, and returns. This is the main reason why the published results were separated in to two papers (I & II).
The results from study 1 were published in paper I, i.e. customers seemed to have different requirements regarding delivery time et cetera. This was researched in study 2 and published in paper III. Therefore there are connections between study 1 and study 2 and paper I and paper III (dotted line).
2.4 Case selection
A single case study is appropriate when the case, in itself, is extreme or unique (Eisenhardt, 1989; Ellram, 1996). The case study company is one of the leading ones in Sweden, and has a long history in the business. The case organisation operates within the clothing, fashion and accessories sector in northern Europe, its customers represent a wide age-range, and therefore it provides a useful starting point. The company was willing to support the study with

18
otherwise inaccessible information and data, including production data and knowledge and data about its customers and access to them. The case can be seen as a pilot case in a coming series of case studies (Yin, 2009).
2.5 Data sources
The data used in the two studies can be categorised as qualitative or quantitative. The quantitative data used was primarily exported data from the case organisation’s system, and data retrieved from a questionnaire. Interviews can range from completely structured to completely unstructured (Lee, 1999). The interviews performed during both studies were informal conversational interviews, i.e. semi structured, with the company’s senior management about the results, probing additional meaning (Lee, 1999). These conversational interviews continued throughout the studies, and the author, visited the company on numerous occasions during the research. During the study, conversational interviews were held with key informants from different functional areas from the case organisation, i.e. assortment, marketing, logistics, et cetera. The use of informants can be utilized during quantitative research (Jick, 1979). The interviews held were also conducted to steer both studies and to discuss findings during the studies. The data sources used in the two studies are presented in Table 2.1.
Table 2.1 Data sources used in the thesis
PaperDatasources
I II III
Interviews x x xDocumentation x x x
Directobservation x x xParticipantobservation x x Archivalrecords x x
The archival records used in paper I & II contained historical order data from 1/7/2006 to 1/6/2007 and returns data from 18/9/2006 until 27/9/2007 that were exported as text files and contained 2 600 492 orders, 10 096 419 invoiced units, 642 290 returns and 1 524 342 returned units. The data sets accounted for all orders (deliveries and returns) for the organization’s Swedish customers, i.e. no sampling.
During the studies the author performed direct observations on site, visiting different departments such as logistics, marketing, and purchasing. Further, to better understand the mail order/e-commerce, the author purchased and returned goods (participant observation). This continued throughout the research with several organisations in order to follow the development and to compare performances.
The exported data from the case organisation contained return codes, given by the returner when returning. The data is questionable since it is possible that the codes do not represent the actual reasons for returning. It is possible that some returners even try to fraud the case organisation – blaming them in order to avoid return freight costs et cetera. However, the data represents all returning customers for a long time period and, therefore, the dependability

19
should be fairly high. The first study resulted in two papers, using the same exported data viewed from more than one angle. Even using different frameworks, and concluding the same thing regarding consumer behaviour causing returns, further strengthens the data and its credibility. The results derived from the data in the conducted research are context dependent, and are not to be generalized to other settings directly. Parts of the findings and the conclusions, however, should be able to fit into similar settings within the mail order/e-commerce setting, and this will be discussed in later chapters.
2.6 Research quality
Four tests are commonly used to establish the quality of empirical social research, according to Yin (2009). Case studies are one form of empirical social research, and therefore the tests are applicable to test the research quality of the case studies. According to Yin it is important to utilize the different tests, using different tactics in different phases, when performing case study research.
Table 2.2 Four tests for evaluating quality of case study research (Yin, 2009)
TESTS CasestudytacticPhaseofresearchinwhichtacticoccurs
Constructvalidity usemultiplesourcesofevidence establishchainofevidence havekeyinformantsreviewdraft
casestudyreport
datacollectiondatacollectioncomposition
Internalvalidity dopatternmatching doexplanationbuilding addressrivalexplanations uselogicmodels
dataanalysisdataanalysisdataanalysisdataanalysis
Externalvalidity usetheoryinsingle‐casestudies usereplicationlogicinmultiplecase‐
studies
researchdesignresearchdesign
Reliability usecasestudyprotocol developcasestudydatabase
datacollectiondatacollection
The first test is construct validity, it is used to test if the data used is free from bias. To achieve construct validity we used exported production data and consumer response data collected when returning. To both validate the findings and to correctly understand the data key informants were used on several occasions, not only reading the draft report. The second test, internal validity, is not relevant in the performed research as it is used to find causal relationship used in explanatory studies, not in exploratory or descriptive ones (Yin, 2009). The third test, external reliability, judges whether the results from the performed research can be generalized beyond the immediate case study. Case studies are not performed using sampling technique and statistical generalization; Yin however argues that analytical generalization can be used, where the researcher tries to generalize a particular set of results to a broader theory. The fourth test is reliability, it tests whether the research results can be repeated by another researcher/investigator and if the findings and conclusions match. We

20
used the case study protocol and every result and investigation were saved in a case study database. However, even though data would appear the same using the same database the findings and conclusion might vary, social science does not rely on a static world, where predictable natural laws prevail. How one performs and judges research results depends on one’s presumptions (Arbnor and Bjerke, 1997) and the possibility to repeat social science investigations using multiple data sources including key informants et cetera does not make much sense. The world is constantly changing and so are we!
3 FRAME OF REFERENCE
This chapter introduces the framework of this thesis. The theory matching process (see Figure 2.1) and the framework of Returns Management allow for a proactive approach to returns via returns avoidance (processes that might influence returns) and therefore further expands the thesis’s framework into logistics, customer service and customer value. Without the expansion of the framework the credibility of the results and suggested improvements based on new understanding would have been questionable without suitable theoretical connections. The expansion of the frame of reference had direct implication on the systems model; the returns system that was the assumed initial system, in the end included the distribution system.
3.1 Logistics
The etymology of logistics is found in the 18th century book ‘The Art of War’ by Baron de Jomini, a staff officer of Napoleon. (Holmes, 1953).
Essentially logistics can be considered management of the movement of materials from source to user. It pertains the planning of materials, information, resources and information flow from suppliers to consumers, see Figure 3.1.
Figure 3.1 Logistics system

21
The Council of Logistics Management (later The Council of Supply Chain Management Professionals) defined logistics as:
The process of planning, implementing, and controlling procedures for the efficient and effective transportation and storage of goods including services, and related information from the point of origin to the point of consumption for the purpose of conforming to customer requirements. This definition includes inbound, outbound internal, and external movements.
A later definition from Christopher (2005, pp. 4) extends the concept of logistics to include long term profit maximisation and cost-effective fulfilment of orders:
Logistics is the process of strategically managing the procurement, movement and storage of materials, parts and finished inventory (and the related information flows) through the organization ant its marketing channels in such a way that current and future profitability are maximized through the cost-effective fulfilment of orders.
A further definition is given by Harrison and van Hoek (2008):
“The task of coordinating material flow and information flow across the supply chain.”
Evidently the emphasis within a definition of logistics has evolved; more recent definitions emphasize the strategic, coordinative, future profitability, cost-effective fulfilment and supply chain elements. This shift of emphasis is likely a result of increased competition due to globalization, shorter product life cycles, more demanding consumers and so on.
Early attempts at improvement of competitive advantage focused on quality management, reengineering and so on, within an organisation or company (Woodruff, 1997). Today the emphasis is more external; competition for superior delivery of customer satisfaction (Christopher, 2008). Competitive advantage depends on the ability of an organisation to differentiate itself from its competitors in the eyes of the consumer. This differentiation can be achieved by cost advantage, value advantage, or a combination of both (Christopher, 2005). Cost advantage relies upon economics of scale and can result in a lower price for the consumer and/or greater profits for the organisation. Many companies and products compete on the basis of low prices which consequently influences production, distribution and services offered. Logistics, however, can provide ways to increase efficiency, productivity, and cost efficiency.
Harrison and van Hoek (2008) separate competitive advantages into hard and soft objectives. The hard objectives are easier to measure and relatively obvious to the end-customer. They include quality, speed of delivery (time) and price. The soft objectives are more service related and include confidence and security. Confidence is services such as promptly answering queries and so on, whereas security is services such as the confidential and secure treatment of customer’s information and property. Soft objectives are more difficult to measure than hard objectives and they are not always delivered by logistics; they are accounted for by marketing and design though they are supported by logistics. The increased importance of customer service is a result of more demanding consumers and the transition to commodity markets in which brand power is reduced. Therefore it is now harder for the product to be the competitive factor than it was previously.

22
3.2 Customer service
Customer value and loyalty are reliant upon the availability of superior customer service and outperformance of competitors in value (Figure 3.2). Customer satisfaction occurs when businesses successfully fulfil their obligations towards the customer (Lambert, 2000) which in turn results in customer loyalty.
Figure 3.2 Key drivers of customer value (Harrison and van Hoek, 2008)
Quality of services relates to the process of presenting products and services to the end-user (Harrison and van Hoek, 2008). Addressing service is crucial because retail success on the internet remains far from guaranteed (Mollenkopf et al., 2007b). Quality of service exists in the actual service delivery; the interaction between the buyer and seller, that is, a business customer or consumer (Mentzer et al., 2001; Harrison and van Hoek, 2008). The term quality itself is difficult to define. Since the seventies a lot of effort has been devoted to the research of quality of service. Research has shown the strategic importance of quality to both market share and returns on investments (ROI) (Garvin, 1983) and thus fewer failures in production mean lower costs and increased ROI. However, it should be noted that quality of services and quality of goods are two separate measures even though they both satisfy Garvin’s ‘conformance to requirements’ (1983). Quality of service includes characteristics such as intangibility, heterogeneity and inseparability (Parasuraman et al., 1985), as such they cannot be counted, measured, nor tested prior the delivery of service. Services are heterogeneous, that is, they vary between producers, and the services’ perceived delivery value varies between receivers. Furthermore, both producer’s and the services’ perceived delivery value are likely to vary over time. In labour intensive service delivery the consistency of service personnel behaviour is difficult to assure therefore the managerial control of service delivery and performance is difficult.
Garvin (1983) measured quality failures as internal and external failures; internal failures occur in the factory and external failures occur in the market or outside the factory.
Parasuraman et al. (1985) presented a service quality model containing five gaps. The model measures gaps between: consumer expectations and consumer perceptions; and internal management, communication, and execution. Consumer quality perception (gap 5) is the discrepancy between expected service and perceived service. Perceived quality depends on the other four gaps (1-4) with account for the design, marketing and delivery of service. Interpreted using Garvin’s measures of internal and external failures, the five gaps presented

23
by Parasuraman are all external. They are likely to be heterogeneous as different stakeholders in the value chain perform greater parts of the service delivery. Figure 3.3 presents the ten service quality determinants given by Parasuraman.
Figure 3.3 Ten determinants of service quality, with the eight determinants possible to know in
advance marked out (Parasuraman et al., 1985)
Eight of the ten determinants are experience properties, that is, they can only be known after the service has been performed. Credibility and tangibles might be known in advance from previous experience. Perceived service quality exists along a continuum that ranges from ideal to totally unacceptable quality. As the service quality measure has an experience property and is related to heterogeneous characteristics it is difficult to collate and measure. Furthermore, if a potential consumer’s needs exceed the service’s ability to deliver, the potential consumer is not likely to use the service, which represents a further complication to research.
Non-customers that do not use the available service (Figure 3.3) due to personal needs exceeding service quality specifications are also difficult to research:
“When prospective customers can't experience the product in advance, they are asked to buy what are essentially promises–promises of satisfaction” (Levitt, 1981).
If a customer expectation exceeds the specified service’s capacity (Gap 1, Figure 3.4) it falls in the domain of “unacceptable quality” and can be judged as an internal failure.
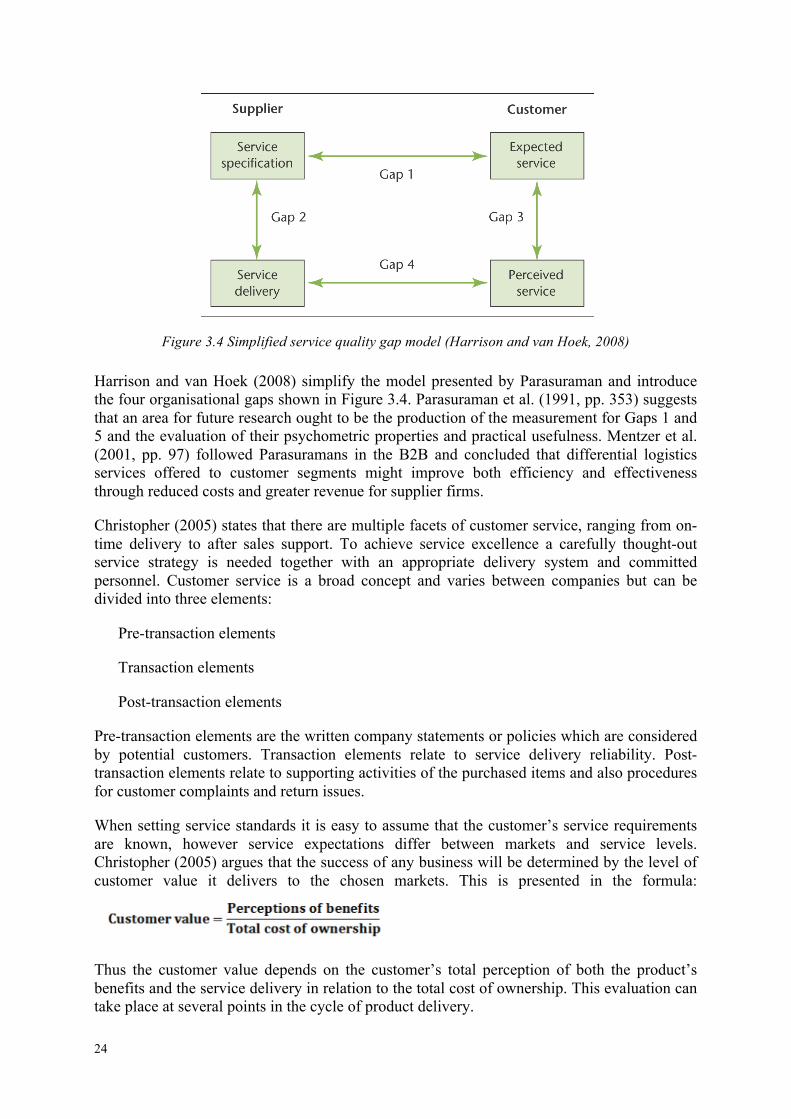
24
Figure 3.4 Simplified service quality gap model (Harrison and van Hoek, 2008)
Harrison and van Hoek (2008) simplify the model presented by Parasuraman and introduce the four organisational gaps shown in Figure 3.4. Parasuraman et al. (1991, pp. 353) suggests that an area for future research ought to be the production of the measurement for Gaps 1 and 5 and the evaluation of their psychometric properties and practical usefulness. Mentzer et al. (2001, pp. 97) followed Parasuramans in the B2B and concluded that differential logistics services offered to customer segments might improve both efficiency and effectiveness through reduced costs and greater revenue for supplier firms.
Christopher (2005) states that there are multiple facets of customer service, ranging from on-time delivery to after sales support. To achieve service excellence a carefully thought-out service strategy is needed together with an appropriate delivery system and committed personnel. Customer service is a broad concept and varies between companies but can be divided into three elements:
Pre-transaction elements
Transaction elements
Post-transaction elements
Pre-transaction elements are the written company statements or policies which are considered by potential customers. Transaction elements relate to service delivery reliability. Post-transaction elements relate to supporting activities of the purchased items and also procedures for customer complaints and return issues.
When setting service standards it is easy to assume that the customer’s service requirements are known, however service expectations differ between markets and service levels. Christopher (2005) argues that the success of any business will be determined by the level of customer value it delivers to the chosen markets. This is presented in the formula:
Thus the customer value depends on the customer’s total perception of both the product’s benefits and the service delivery in relation to the total cost of ownership. This evaluation can take place at several points in the cycle of product delivery.
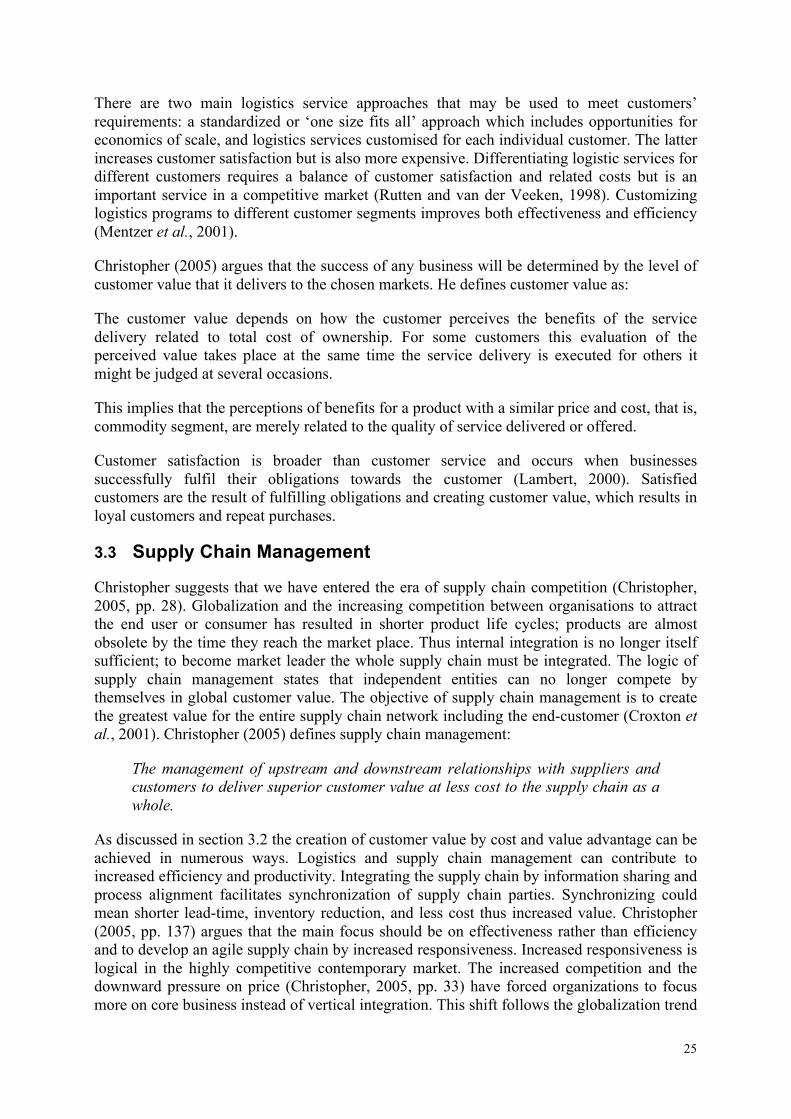
25
There are two main logistics service approaches that may be used to meet customers’ requirements: a standardized or ‘one size fits all’ approach which includes opportunities for economics of scale, and logistics services customised for each individual customer. The latter increases customer satisfaction but is also more expensive. Differentiating logistic services for different customers requires a balance of customer satisfaction and related costs but is an important service in a competitive market (Rutten and van der Veeken, 1998). Customizing logistics programs to different customer segments improves both effectiveness and efficiency (Mentzer et al., 2001).
Christopher (2005) argues that the success of any business will be determined by the level of customer value that it delivers to the chosen markets. He defines customer value as:
The customer value depends on how the customer perceives the benefits of the service delivery related to total cost of ownership. For some customers this evaluation of the perceived value takes place at the same time the service delivery is executed for others it might be judged at several occasions.
This implies that the perceptions of benefits for a product with a similar price and cost, that is, commodity segment, are merely related to the quality of service delivered or offered.
Customer satisfaction is broader than customer service and occurs when businesses successfully fulfil their obligations towards the customer (Lambert, 2000). Satisfied customers are the result of fulfilling obligations and creating customer value, which results in loyal customers and repeat purchases.
3.3 Supply Chain Management
Christopher suggests that we have entered the era of supply chain competition (Christopher, 2005, pp. 28). Globalization and the increasing competition between organisations to attract the end user or consumer has resulted in shorter product life cycles; products are almost obsolete by the time they reach the market place. Thus internal integration is no longer itself sufficient; to become market leader the whole supply chain must be integrated. The logic of supply chain management states that independent entities can no longer compete by themselves in global customer value. The objective of supply chain management is to create the greatest value for the entire supply chain network including the end-customer (Croxton et al., 2001). Christopher (2005) defines supply chain management:
The management of upstream and downstream relationships with suppliers and customers to deliver superior customer value at less cost to the supply chain as a whole.
As discussed in section 3.2 the creation of customer value by cost and value advantage can be achieved in numerous ways. Logistics and supply chain management can contribute to increased efficiency and productivity. Integrating the supply chain by information sharing and process alignment facilitates synchronization of supply chain parties. Synchronizing could mean shorter lead-time, inventory reduction, and less cost thus increased value. Christopher (2005, pp. 137) argues that the main focus should be on effectiveness rather than efficiency and to develop an agile supply chain by increased responsiveness. Increased responsiveness is logical in the highly competitive contemporary market. The increased competition and the downward pressure on price (Christopher, 2005, pp. 33) have forced organizations to focus more on core business instead of vertical integration. This shift follows the globalization trend

26
of outsourcing non-core business. This, however, increases the complexity of the supply chain which requires supply chain integration and management.
The eight key processes of supply chain management, as given by The Global Supply Chain Forum (Croxton et al., 2001, pp. 14), are given below (Figure 3.5).
Figure 3.5 Eight Supply Chain Management key businesses adapted from Croxton et al., (2001)
3.4 Returns management
The change from early product recalls to today’s returns management has evolved from being merely a company activity within a logistics network to an important Supply Chain Management process. There are a number of terms and definitions that describe the reverse flow of products, closed-loop supply chain management, reverse logistics or simply returns.
If organisations still view returns as a cost driver and not as a competitive edge, they miss the potential value it could add to them and their customers (Mollenkopf et al., 2007a). Wood (1979a) concluded already in -79 that customer satisfaction and company image were factors to consider when recalling products. Returns management consists of strategic and operational levels. The strategic part of RM develops the road map for the execution on the operational level. RM is often under-prioritised in comparison with other business processes. In distance sales with return levels reaching 20-50 % or even higher, it is difficult to understand that RM is still under-prioritised, especially when the cost of returns are paid by all customers, returning or not. However, returns management is increasingly being recognized for just that purpose, namely affecting competitive positioning, i.e. affecting sales, and it is nowadays seen as an important link between marketing and logistics (Mollenkopf et al., 2007a).
From a consumer’s perspective online purchase represents a certain level of risk (Mollenkopf et al., 2007b), not only relating to product quality, size and fit issues. The customer has to

27
await the delivery and the execution of service delivery as well. Mollenkopf (2007b) argues that a well executed returns handling could act as a service recovery opportunity, where the customer evaluates the ongoing service delivery during a particular purchase experience. According to Andreassen (2000), service recovery affects customer loyalty, which follows arguments by Harrison and van Hoek (2008) that service performance is important, as customers’ perception of delivered products and services is what creates loyal customers. Thus the importance of returns management should not be underestimated in distance sales.
Returns management is defined as:
The part of supply chain management that includes returns, reverse logistics, gatekeeping and avoidance. (Rogers et al., 2002, pp. 5)
The above definition is used in this thesis and the broader approach of returns management as it allows the discussion of the problem of returns and work proactively with avoidance and thereby hopefully avoids future returns.
Figure 3.6 Logistics system including return avoidance and gatekeeping
3.4.1 Returns
Organizations need to assess all possible returns and determine the best possible returns procedure. Consumer returns should be differentiated by cause of return. If the cause of return is not consumer error the best procedure might be targeting reconciliation with the consumer and thereby reducing the harm caused. Returns that are associated with quality issues require procedures that incorporate product development, production and suppliers.
Returns are caused by a plurality of factors depending on the position in the supply chain and the nature of the product. The Global Supply Chain Forum and authors of ‘The Returns Management Process’ (Rogers et al., 2002, p. 3-4) defined five types of returns.

28
Consumer returns are perhaps the most difficult as they are unpredictable, therefore difficult to anticipate, which affects the handling or execution of the return. The reasons for returning are often defective products or buyers’ dissatisfaction. Other possible reasons (non-defective defectives) are fit, size, missed collection or difficulty of operation. (Rogers and Tibben-Lembke, 1999).
Marketing returns are products returned from a position downstream in the supply chain. They often occur due to slow sales, quality issues, or a manufacturer’s purchase of a competitor’s retail stock. Another possible reason for a marketing return is producers and retailers who promote a brand or mark down their products if the consumer returns a similar used product. The enterprise Bröderna Nyman in Länghem in Sweden used this system in 2006 and 2008 and the products that were collected from consumers were then donated to charity. Using marketing returns then becomes a way of both increasing sales and positioning the brand in favour of competitors.
Asset returns are products (assets) that a company wants returned. Assets can be expensive assets such as oil drilling equipment or less expensive reusable assets such as containers or pallets (Rogers et al., 2002). Autoliv in Vårgårda in Sweden uses collapsible boxes to deliver airbags and other safety equipment to their customer in a closed-loop system and collects the collapsed containers and then deliver new products in a back-haul system. These containers are relatively expensive and used only when the closed-loop functions properly. When delivering to areas such as the Russian automotive industry other options are evaluated due to the high risk of losing expensive containers.
Product recalls are returns, which normally are initiated because of safety or quality issues. Industries that are susceptible to these types of returns, such as automotive or food industries, have to develop a system to inform customers and an efficient handling system. An example is Biltema, of Sweden who found that a wooden toy they sold would break if dropped from a height of 1.5 meters. No customer had reported breaking the toy; it was discovered when an employee dropped the toy. They conducted a voluntary recall of the product, informed the customers via the Internet and gave them the option to bring the product back to the nearest store for a full refund.
Environmental returns are returns caused by environmental regulations. This can be due to a product containing hazardous material or waste, or non-hazardous material or waste such as used packaging material. In the European Union (EU) the responsibility of disposing this material lies with the producer. In Sweden producer responsibility exists in five areas: cars, electronic appliances, packaging material, newspapers and tyres. This means that the importer or producer of these products must pay for collecting and recycling of the products sold on the market.
3.4.2 Reverse logistics
Reverse logistics deals with the physical flow of material from its final destination. Its main purpose is to recapture value from the product or, as a last resort, its proper disposal. It is the planning, implementing and controlling of the physical flow of returns (cf. (Thierry et al., 1995; Rogers and Tibben-Lembke, 1999)).

29
3.4.3 Returns avoidance
Avoidance aims at to find ways of minimizing return requests (Lambert, 2004) or returns by developing and selling product in such a manner. It is this activity that differentiates returns management from earlier reverse logistics, because by successfully applying avoidance, the returns are not sent backwards and could by definition not be reverse logistics (Rogers et al., 2002). The ways of executing avoidance may differ; improved quality, better information or instructions, and better service are some common applications. Also, if the results from previous experiences of a customer would classify a new order or order row as a “likely future return”, then the return can be avoided if the order (row) is not delivered at all, or if the customer is guided to a more suitable product with respect to size etc. This results in increased effectiveness and efficiency.
Improved quality can be considered a reduced number of defective products and better instructions or information. This can be in combination with better service, for example, home installation and education by the retailer. This is a service offered to ONOFF’s customers; both to visitors to the shop as well as internet buyers. Extra Film is trying to avoid certain returns; new customers that place an extraordinarily large order are contacted before the order is executed to ensure that there has been no error by the customer. Black & Decker integrates returns and product development to learn from previous returns in order to avoid future returns (Rogers et al., 2002). For online or catalogue retailers product consistency is a critical issue as traditionally many returns result from sizing and fit issues. Victoria’s Secrets returns management team works with their suppliers to apply sizing guidelines across all products in a uniform manner. This reduces costs and improves customer satisfaction (Rogers et al., 2002).
3.4.4 Gatekeeping
Gatekeeping is the screening of return requests and the returned item. Return requests can be prevented (avoidance) by better information on or training for product operation, i.e. user friendliness. Gatekeeping assures that only allowed returns are accepted and then guided to the correct point. The gate could be exemplified as a valve opening for “wanted” returns and closing for “unwanted” returns, i.e. the ones where value creation cannot be accomplished. Properly executed, gatekeeping improves the disposition of returns, reduces cost, and increases customer satisfaction. The result is increased effectiveness and efficiency. Normally it is applied at the entry point but can be applied to more than one place in the returns flow (Rogers et al., 2002). In Figure 3.6 returns are entering the returns system through a valve (grey circles) and guided (governed by rules) to the best disposition, given returns cost and possible value creation. The valve arrows pointing downwards guide the returns to recycling and the bent arrow pointing up right channels the returns into the normal product flow after their being inspected and handled, which could include finishing, repair etc. Moving to the left in the returns flow normally implies more work done to the returns (cf, (Thierry et al., 1995)). The gatekeeping activity is crucial in distance sales; the longer it takes to make the disposition decision of a returned product, the lower the expected market value of the returns when re-inserted into the normal product flow (Mollenkopf et al., 2007a), meaning that late returners (outside the stipulated return window) affect the possible value creation.

30
3.5 Demand Chain Management
The shift from logistics towards an integrated Supply Chain Management addresses the need for collaboration within the company and between partners. Christopher (1998) defines SCM as:
The management of upstream and downstream relationships with suppliers customers in order to create enhanced value in the final market place at less cost to the supply chain as a whole
“Enhanced value” and “at less cost” are important concepts that could be vital for mail order/e-commerce in the future. The synergy between SCM and marketing has, according to Jüttner et al. (2007), been widely acknowledged. Heikkilä (2002) argues that companies in fast-growing industries need to constantly develop their supply chain efficiency. At the same time, they constantly encounter customers with new situations and needs. Jüttner et al. and Heikkilä write for business customers but their conclusions are equally applicable to consumer or end-user assessments, especially in the mail order/e-commerce business.
Figure 3.7 Levels of marketing and supply chain integration (Jüttner et al., 2007)
Figure 3.7 presents the potential problems of an organisation focusing on either the high end of the supply chain or marketing advantage. The resulting failure of coordination results in inefficient and ineffective delivery of products and services. Heikkilä (2002) proposes that the improvement of the supply chain ought to begin at the customer end, and SCM should be reinterpreted as demand chain management.

31
3.6 Consumer insight
To understand your target consumers fully you must understand their pre- and post-purchase behaviour. Post-purchase behaviour could be influenced by a variety of factors: some a result of the actual transaction, others product related, others related to the consumer’s personal characteristics (Kang and Johnson, 2009). Insight into why the purchase is conducted and how and when the product will be used is difficult but it can be asserted that mail order/e-commerce have closer relationships with their customers than traditional retail chains. Today’s consumer marketing requires different techniques and a deeper understanding of consumers’ implicit needs. However, finding and solving implicit and hidden needs raises the perceived value of the transaction, see Figure 3.2. Firstly, there might be a gap between what the consumer expects and management’s perception of what the consumers want. Management may not always understand what features connote high quality to consumers, what features a service must have in order to meet consumer needs, or what levels of performance are expected to deliver high quality service. Secondly, there might be a gap between management perception of the customer’s definition of quality and the information given to those who provide the service within the organization. Thirdly, there might be a gap between service delivery specifications and the actual service delivery; service quality is evaluated when the consumer meets the vendor at the time of delivery. Fourthly, there might be a gap between the service actually delivered and the promises given in external communications.
Consumer expectations and consequently their returns behaviour are likely to vary. As seen in Figure 3.8, customers entering the mail order/e-commerce business are likely to respond differently when evaluating product, price and services while screening catalogues/websites before ordering, or evaluating the different steps or outcomes after ordering, i.e. information requirements, lead-time et cetera. Therefore today, consumer marketing requires a deeper understanding of the ‘whys’, ‘hows’ and ‘whens’ of buying behaviour and decision-making regarding both buying and returning decisions.

32
Figure 3.8 Consumer behaviour characteristics
Consumer behaviour is much more erratic and unpredictable today than ever before and this limits traditional consumer research techniques. Traditional methods may uncover the ‘when’ and ‘how’ a consumer buys, but the ‘whys’ of behaviour have been lacking in traditional consumer understanding (Florin et al., 2007).
The reasons for non-buying and non-usage are also important. Communication between customer and producer should lead to a comprehensive understanding of the consumer’s situation, consideration set (Florin et al., 2007), and the context in which decisions are made. This type of consumer research is based on real time interaction. Currently, information and communication technology (ICT) such as social media enable research into implicit consumer needs and give insight into customer behaviour.
One of the first qualifiers is the availability of the product. Can it be provided at the time, the place and in the quantity the consumer wants it? The consumer’s interpretation of quality results from a comparison between expectations and actual performance. This evaluation pertains not only the technical quality but also the functional quality of the product, which includes the process of delivery. What the vendor intends to deliver might be entirely different from what the customer receives. Previous research suggests that suppliers may not always understand what consumers expect of a service. External communications may affect not only consumer expectations but also consumer perceptions of the delivered service. This is why it is so important to relate consumer insight to branding. Consumer expectations are based on the consumer’s perception of the company. The branding process is a major component in the creation of this perception. Finally, there might be a gap between the expected service and the perceived service, and this gap is the determining factor in the consumer’s interpretation of perceived value. Explicit needs are quite often the main component of the initial definition of expectations.

33
In the contemporary market the focus ought to be on understanding the motivations behind decisions. It requires an understanding of individual consumers rather than an overly simplistic image of the ‘average consumer’; there are no average consumers.

34
4 SUMMARY FROM APPENDED PAPERS
In this section a summary of each appended paper is presented describing the purpose and main findings. Paper I and II are both results of the first study and paper III is a result of the second study. Both studies were performed at the case study organisation.
Table 4.1 Connections between papers and objectives
ResearchobjectivesStudy Paper
1 2 3 4 5
1 I X X x x x1 II X x x X x2 III X
In Table 4.1 the correlation between the research objectives, derived from three research questions, and the three appended papers is presented. The uppercase X depicts a stronger correlation than the lowercase x.
4.1 Paper I – Avoiding returns in distant selling trough differentiating customers and their service delivery
Purpose and overview
Paper I discusses possible reasons for consumer returns generally and the possible implications of not differentiating between customers and service delivery. Reasons accounting for returns can be specific such as incorrect size or undisclosed personal reasons of the customer. However, it is possible that returns are dependent to some extent on logistic performance factors such as delivery accuracy, lead-time, stock unavailability and so on. All causes of returns should be considered and it is possible that causes are often interrelated.
The research purpose was to investigate and describe what causes returns through examining order and returns data, consequently relating logistics performance and other possible returns factors to customers or groups of customers.
Paper I followed an abductive research strategy to explore and describe what causes returns in the case organization. A single organization case study designed with both quantitative and qualitative methodology was used to explore the relatively unresearched area of consumer returns and their relation to an organization’s order processing support system. The results were evaluated and discussed with different managers from the company to establish authenticity and reliability.
Order data from 1 July 2006 to 1 June 2007 and returns data from 18 September 2006 to 27 September 2007 were used in a quantitative study. No sampling was used, instead all data from Swedish customers was used which included 2 600 492 orders, and 10 096 419 invoiced units, 642 290 returns and 1 524 342 returned units. Exploring historical data from orders and returns presents an opportunity to study customer services elements such as availability, lead-

35
time and customer requirement differentiation between organization and supplier. If no difference exists one would expect to find a similar return pattern for all customers, that is, undifferentiated by age, gender and so on, or by internet, mail and phone order customers. On the other hand if differences exist one might draw the conclusion that there are customers unsatisfied with the service delivery and therefore different requirements of the organization’s service delivery.
Main findings
The results show that some customers, especially the younger age set who use the internet, are more demanding and less loyal to the organization. Furthermore, the exploratory results indicated that there is a relation between customer age, lead-time and order entry, that is, web, mail, or phone order and returns (see Table 4.2 and Figure 4.1).
Table 4.2 Order entry and their return levels by age, average number of years as customer, and
average age per order type
ReturnpercentageUnits Shipments
AgeOrdertype
‐25 26‐50 51‐75 76‐ ‐25 26‐50 51‐75 76‐
Yearsascustomer
Age
Phone 1,61 1,15 0,93 0,77 1,20 1,08 0,96 0,85 17,9 50,7Mail 1,35 0,84 0,67 0,50 0,94 0,78 0,67 0,50 18,4 54,4Web 1,99 1,14 0,94 1,24 1,56 1,11 0,97 1,08 13,2 39,9
In Table 4.2 the three main order entries, phone, mail and web/Internet return percentages are presented. The returns percentage level is indexed by the average return percentage.

36
Figure 4.1 Return levels per order entry type over lead-time in days
Figure 4.1 presents the variance of return levels depending on order entry presented over lead-time in days. The descriptive representation gives the conclusion, using a Chi-Square test, that returns were not independent of age, lead-time or order entry.
Figure 4.2 Indexed return levels for wait orders over lead-time in days
Figure 4.2 presents the return levels of the orders that were not delivered as planned, that is, the shipment was delayed until a complete shipment could be delivered. It is unlikely that there is any decrease in product quality of the delayed orders that could explain the difference in shipment curves. The curves for internet and phone order shipments are significantly steeper than mail shipments. Delivery lead-time information is significantly different however. Mail order information gives an approximate lead-time of 7-9 days in the catalogue, whereas internet and phone order customers should get a more accurate delivery time when

37
ordering. However, if the order is delayed pending delivery of a complete shipment then the delivery lead-time will not be as expected.
The main findings of paper I were as follows. The increase in returns is probably closely related to extended lead time, availability, competition, more demanding customers, and the entry of the organization into a demanding market sector. It is therefore likely that customer segmentation and service delivery differentiation would increase customers’ value perception and hence, ultimately avoiding some returns.
4.2 Paper II – An application of avoidance and gatekeeping to manage returns in a distance selling setting
Purpose and overview
Previous research in the field primarily focused on the return process; trying to increase the efficiency of returns handling in order to reduce the burden of increasing return rates. However, the purpose of paper II was twofold: to explore what causes returns in distant selling by examining return factors and their distribution; and to investigate how, and if, returns management, especially returns avoidance and gatekeeping, can be applied to a mail order/e-commerce organisation. To avoid returns and to gatekeep the returns system from unnecessary returns it is important to know more about what causes returns in the first place. A single organization case study, designed with both quantitative and qualitative strategies, was used to explore the relatively unobserved area of consumer returns. The results were then evaluated and discussed with different managers from the organization, to substantiate authenticity and reliability.
Main findings
The paper presents an interesting insight into the field of consumer returns in a distant setting. It shows that a considerable amount of returns are size and fit related as expected (see Figure 4.3).

38
Figure 4.3 Return reasons as percentage of all returns
However it also presents the interesting result that a large percentage of returns are consumer dependent, that is, not collecting deliveries and so on. The distribution of sales and returns was approximately normally distributed (see Figure 4.1 paper II). However, certain return factors when plotted together (see Figure 4.4) with customer age presented a skew to the left indicating that younger customers were more frequent returners.
Figure 4.4 Return factors over customer age in year, plotted to present the skew to the left
It is apparent that younger customers especially those ordering via the web are more frequent returners. However, it is not possible to establish the motivations for return using this data. Nevertheless, some returns could be avoided by better understanding customers’ demands. Though collecting reasons of return develops trends in the data they are too broad to allow specific returns avoidance. Interpreting the reasons of return is inherently subjective; the metrics that measure performance must measure something the customer perceives as valuable. Increased competition can be addressed using Demand Chain Management as it

39
offers a differentiated approach to customers and their service requirements. The multiplicity of customers’ requirements, which evolve over time, are likely the main reason for returns.
Returns Management, especially avoidance and gatekeeping can be applied to mail order/e-commerce businesses and thereby increase system efficiency by avoiding unnecessary returns flow.
4.3 Paper III – Service delivery requirements of mail-order/ e-commerce customers
Purpose and overview
Paper III’s aim was to investigate the variance in consumers’ service requirements whether consumer segmentation and differentiated service delivery increase perceived value of service value (Figure 3.2) thus reducing return levels. Conventionally, mail order and e-commerce organizations consider their customers as a single entity and thus offer undifferentiated service. Paper 1 shows that return levels are differentiated by age and lead-time thus end user requirements ought to be considered. This study investigates expected lead-time service requirements of one organisation’s mail order/e-commerce customers and measures the gap between the expected and the specified service.
Paper I’s results indicate that return levels are not independent of customer age and so on, and paper II indicates that younger customers have different return patterns. These results suggest that customers’ requirements vary and that this variation could be dependent on the strength of competition. From the previous results two propositions were made:
Proposition 1: Service demands vary between consumers and are dependent on age. Younger customers demand shorter delivery lead-time than older customers and even demand shorter lead-time than what is specified by the organization. This suggests a greater gap between delivered service and expected service for younger customers than older customers.
Proposition 2: Younger customers are more aware of alternative suppliers and order from a larger number of distance sellers. This creates stronger market competition and could account for differentiation of demand or service requirements.
Primary data was collected by an online questionnaire distributed via e-mail. Some of the customers (primarily older customers) did not have a registered email address thus a structured interview was conducted by telephone instead. The samples were selected from one of Sweden’s largest distance seller’s customer base. The questionnaire was distributed to 25 000 Swedish customers with approximately 6 000 responding, giving a response rate of 24 percent. Customers were selected randomly within age groups from order placements in July 2008.
Main findings
Customers were asked to rank the top four of ten service priorities. Price and quality were found to be the top two priorities for all age groups. Customers aged 18-29 prioritised low fees, freight costs, and delivery third and fourth. Older customers prioritised customer service and opening hours third and fourth respectively. Figure 4.5 below presents the average rating for lead-time differentiated by age group. It shows that the youngest age group gives

40
significantly higher priority to lead-time than other age groups. Paper III (appendix 1) contains a graph presenting all factors and their average ratings.
Figure 4.5 Customer rating score for delivery lead-time plotted over customer age
Figure 4.6 presents the data of customers’ lead-time service requirements. The lead-time value specified by the organization was 7-9 days and is plotted as an average value of 8 days. The median value is measured from the respondents’ answers to question 6 (see paper III) and is plotted as a dotted curve. It is obvious that almost all age groups demand (negative values Gap 1) shorter delivery lead-time than specified by the organization.

41
Figure 4.6 Measure of gap 1 between specified lead-time when placing order and median preferred
lead-time
Paper III’s results uphold proposition 1. Service requirements seem to vary with age and the gap is greater (negative) for younger customers. Though some results conform to proposition 2’s expectations it cannot be comprehensively upheld. Proposition 2 therefore cannot conclusively be upheld or dismissed on the basis of this study. Though the results cannot be generalized to include customers outside the sample it is plausible that cases with similar settings have similar results and the organizations would benefit from investigating their customers’ requirements and offering differentiated service delivery.
4.4 Results of appended papers
The individual results from the appended papers are combined and presented in relation to the research questions and main findings in Table 4.3. Research question 1 (RQ-1) is divided into four parts, as paper I does not answer the whole question. RQ-2 was addressed in both paper I and paper II, whereas RQ-3 was addressed in all three papers with a focus in paper III.
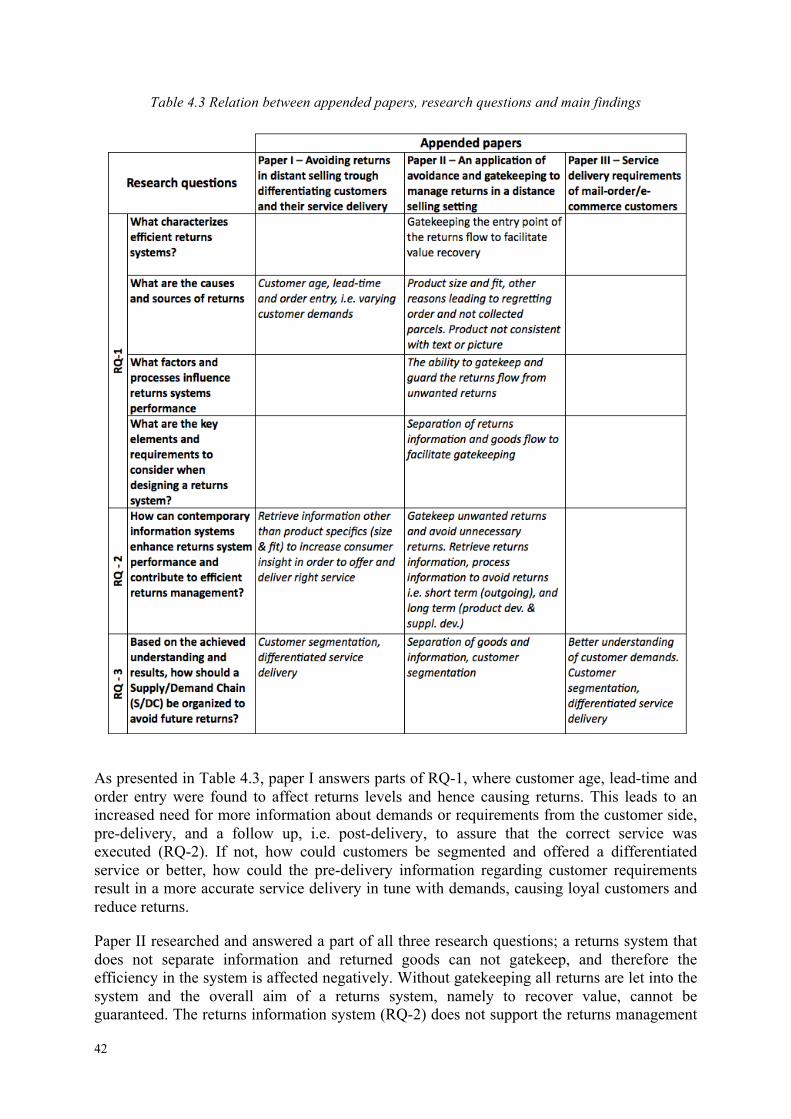
42
Table 4.3 Relation between appended papers, research questions and main findings
As presented in Table 4.3, paper I answers parts of RQ-1, where customer age, lead-time and order entry were found to affect returns levels and hence causing returns. This leads to an increased need for more information about demands or requirements from the customer side, pre-delivery, and a follow up, i.e. post-delivery, to assure that the correct service was executed (RQ-2). If not, how could customers be segmented and offered a differentiated service or better, how could the pre-delivery information regarding customer requirements result in a more accurate service delivery in tune with demands, causing loyal customers and reduce returns.
Paper II researched and answered a part of all three research questions; a returns system that does not separate information and returned goods can not gatekeep, and therefore the efficiency in the system is affected negatively. Without gatekeeping all returns are let into the system and the overall aim of a returns system, namely to recover value, cannot be guaranteed. The returns information system (RQ-2) does not support the returns management

43
process as such. A web-based returns system could help to facilitate both the gatekeeping function, through the separation of information and goods, and the avoidance function, where faster information flow can help to reduce unnecessary returns. Paper II also addressed RQ-3, though with modest results, the indication that returns levels vary with customer age and the notion that customers have different requirements further highlight the need for segmentation and differentiated service delivery.
Paper III followed the results from previous papers addressing the questions of customer requirements and their dispersion by possible segments. In line with the results from paper I and paper II it was concluded that today’s mail order/e-commerce business probably would benefit from investigating the customers’ needs and requirements and offer the customer segments differentiated services.

44
5 ANALYSIS
This chapter contains an analysis of the results from the appended papers using the presented frame of reference.
5.1 Research questions - analysis
Two studies were performed to answer the research questions presented in section 1.3. The questions were interpreted into the research objectives presented in section 1.4. This chapter aims at reinterpreting the research findings presented in paper I to III in order to answer the three research questions (cf. Table 5.1).
Table 5.1 Reinterpreting research objectives into research questions
ResearchquestionResearchobjectives 1 2 3
1 X X2 X X3 X 4 X 5 X X
RQ 1: What characterizes an efficient returns system? In particular, what are the causes and sources of returns, what factors and processes influence returns systems performance and what are the key elements and requirements to consider when designing a returns system?
The overall conclusions pertain to the results from study I; an efficient returns system first and foremost needs to control the returns flow to maximise value. Control entails gatekeeping so that returns handling and transportation costs can be evaluated against value creation before returns enter the returns flow.
The main causes of returns are product specific, such as size and fit, but a significant amount of returns are due to what can be considered customer behaviour. In paper I it was shown that returns are not independent of delivery lead-time, age, or order entry. These factors can be considered customer behaviour and are related to personal needs and requirements. The returns information system has a negative effect on the system’s performance and does not facilitate gatekeeping and control of returns. The returns system setup, which manages returns handling, is likely affected by lack of information and control. Further definition of cost and value creation, which incorporate the effects on the system, including redistribution and distribution, could alter the distribution and redistribution flow considerably. Currently all customers are treated the same way and all orders have the same value, that is, customer treatment is uniform, regardless of age. This thesis suggests that treatment of customers ought to be differentiated as different customers have different requirements. Therefore from a systems perspective, the handling of an individual return should be compared to all customer demands in the same system. It might be valuable to handle some parts of the returns flow downstream in order not to lose a customer, even at additional expense. When designing a new returns system it should be designed to support the distribution system as well. This is particularly true in anticipation of the cross border trade of the EU single e-commerce market.

45
RQ 2: How can contemporary information systems enhance returns system performance and contribute to efficient returns management?
As the most efficient way to control and gate-keep a returns system (by web registration of individual returns) an information system is an important part of an efficient returns system. This currently cannot be done as some customers have no internet access. The results show that internet customers are the most likely to return a product. As shown in section 1.1.3 most distance sales are e-commerce thus web registration could be used in a significant part of this market. A more developed returns system is especially necessary in the cross border market of the EU; the inefficiencies of contemporary returns systems are exacerbated by transportation across greater distances.
RQ 3: Based on the results and conclusions, how should a Supply/Demand Chain (S/DC) be organized to avoid future returns?
The theoretical understanding that customer demands vary (cf. (Christopher and Towill, 2001; Heikkilä, 2002) and that their behaviour varies as well (cf. (Kang and Johnson, 2009) accentuate the need for a greater insight in the demands and requirements of the target customer group. This study has shown empirically that the returning behaviour of the case organization’s customers is not uniform, and therefore we have concluded that, in line with the theoretical understanding, there is a need for customer segmentation and a more differentiated service delivery.
5.2 Discussion
This thesis has pursued research questions that arise in the literature and are of personal interest to the author. The motivation of the research has been to better understand the causes of returns and the use of Returns Management to minimize the negative effects on the system. Conventionally the negative effects of returns were addressed by reducing the costs of returns handling by economies of scale. Opportunities in the economy of scale arise by centralizing or outsourcing returns handling. Returns Management and avoidance combined with increased coordination of internal activities such as marketing allows avoidance of some returns. This possibility of returns avoidance is demonstrated by Jüttner et al. (2007) in Figure 3.7. Those with a strategy to differentiate products and processes are more likely to satisfy customer needs, thus gaining a market advantage by differentiation of supply chain capabilities. Furthermore, they will likely avoid the problems of underdelivery and overdelivery that are inherent in a system with a uniform service delivery (see Figure 5.1). Using the one system fits all order, delivery and returns systems neither guarantees lowest cost nor maximises revenue or sales. Delivering goods, without understanding or performing in accordance with the customers’ service demands, probably underdelivers with possible returns or lost sales, or the system overdelivers without benefiting from it. In a revenue perspective it might even be beneficial to add cost in order to assure that we do not underdeliver, i.e. lowest cost does not guarantee maximised revenue.

46
Figure 5.1 Customer service demands and under- and over-delivery of service
In Sweden, distance sales represent approximately 5% of the retail trade and an increased customer consideration, such as differentiated delivery, is likely to increase the market share further.
Individual consumer returns can be caused by a plurality of factors some of which are preventable if the company considers returns avoidance. As demonstrated in paper I, delivery-lead time is one factor that accounts for returns. However, this result may be distorted by interactions with other factors of return. Therefore reducing lead-time would only partially reduce the return rate. This is supported by the results in paper III, which showed a gap between customers’ delivery requirements and demands. Furthermore, return levels vary by age and order entry, which suggests that market competition is greater in e-commerce than mail order. Characteristics such as high quantity of alternative companies and immediacy of purchase account for this high competition. It can also be suggested that e-commerce attracts a new type of customer with unique demands and behaviour.
Paper II demonstrated that only a few product groups result in frequent returns. The reasons for return agree with previous research (Rogers and Tibben-Lembke, 1999; Rogers et al., 2002) which states that fit and size account for most returns. Further significant reasons for return were regret, incorrect ordering, and failure of collection. Younger customers were the most frequent returners and demanded shorter lead-time. These examples of unsatisfied customers agree with the earlier discussion of under-delivery.
The main aim of reverse logistics is to recapture value in the returned shipment which can be achieved in several ways. Unauthorized returns or returns where value creation cannot be achieved should not be allowed to enter the returns system. The gatekeeping function should preferably gatekeep at the entry point to the reverse system and should exclude such returns. Conventionally the gatekeeping function in mail order/e-commerce is found at the warehouse where returns are inspected, registered and handled. This is because returns are transported together with the returns information. An efficient returns system must therefore separate the goods flow and the information flow so that the system can control what enters the return flow.

47
A uniform delivery system which does not consider individual customer requirements likely affects return rates. A returns system that does not include returns information does not facilitate the gatekeeping process as any product can then enter the system. To successfully employ the gatekeeping function investment must be made in the separation of goods and information, and the creation of a web returns registration system. The return factors on current paper return forms are too broad to discern an accurate reason for return and thus prevent future returns. The same factors are used for all products resulting in undifferentiated information. Internet registration enables more detailed and differentiated return information.
5.3 Contributions
The contributions of this research are characterised as industrial/practical and theoretical, with the main contribution in the former category, as this is applied research in close cooperation with organisations. A main share of the practical contribution comes from the detailed descriptions of relations between logistics processes and returns, further, the relations between customer groups and returns and finally the relations between different order entries and returns. It indicates the importance of understanding customer requirements and gaining consumer insight, through both closer cooperation with customers and developing new information systems to communicate better and faster and to follow customers dynamically and their purchasing and returns behaviour.
Theoretical contributions from the research are modest, however the model (see Figure 1.1) adapted from Carter and Ellram (1998), presenting four forces causing returns, builds on previous research in the field of reverse logistics and somewhat opens up the perspective, shifting from a product perspective regarding returns to customer service et cetera. This leads to combining the frameworks of avoidance and demand chain management, resulting in a quite detailed discussion of over- and underdelivery (see Figure 3.7 and Section 5.2) and potential benefits from segmentation of customers and differentiated logistics service delivery.

48
6 CONCLUSIONS
This chapter summarises the main conclusions of the thesis. Both theoretical and empirical conclusions are presented.
The primary conclusion is that distance sale trade is affected or influenced by trends that are seen elsewhere, namely increased competition. This is likely due to the ease of e-commerce shopping and the diversity of available products. This attracts new customer groups with new demands and requirements. This differentiates e-commerce business from mail order business and explains why customers from these different markets behave differently. The use of internet likely affects the method of purchase and therefore the result of the purchase. It is likely that internet purchases are more spontaneous than phone and mail order purchases.
Figure 6.1 Customer characteristics affecting the end results
Figure 6.1 above is a model of the different steps that a distance sales customer may evaluate during the pre and post purchase phases. It is unlikely that all customers have the same requirements and evaluate the stages in the same way. The main method for suppliers to evaluate theses stages is by analysing return factors.
It has been shown that it is beneficial to avoid returns altogether, which can be achieved by increasing perceived customer value (Figure 3.2), thus creating loyal customers. This gives increased consumer insight and thus more supportive supply chain capabilities.
Finally a combination of Demand Chain Management, avoidance and the use of information and communication technology (ICT) has been considered. Distance sales organisations, particularly e-commerce organisations, have high levels of access to their customers. Development of ICT systems that can gather purchase and return information is beneficial.
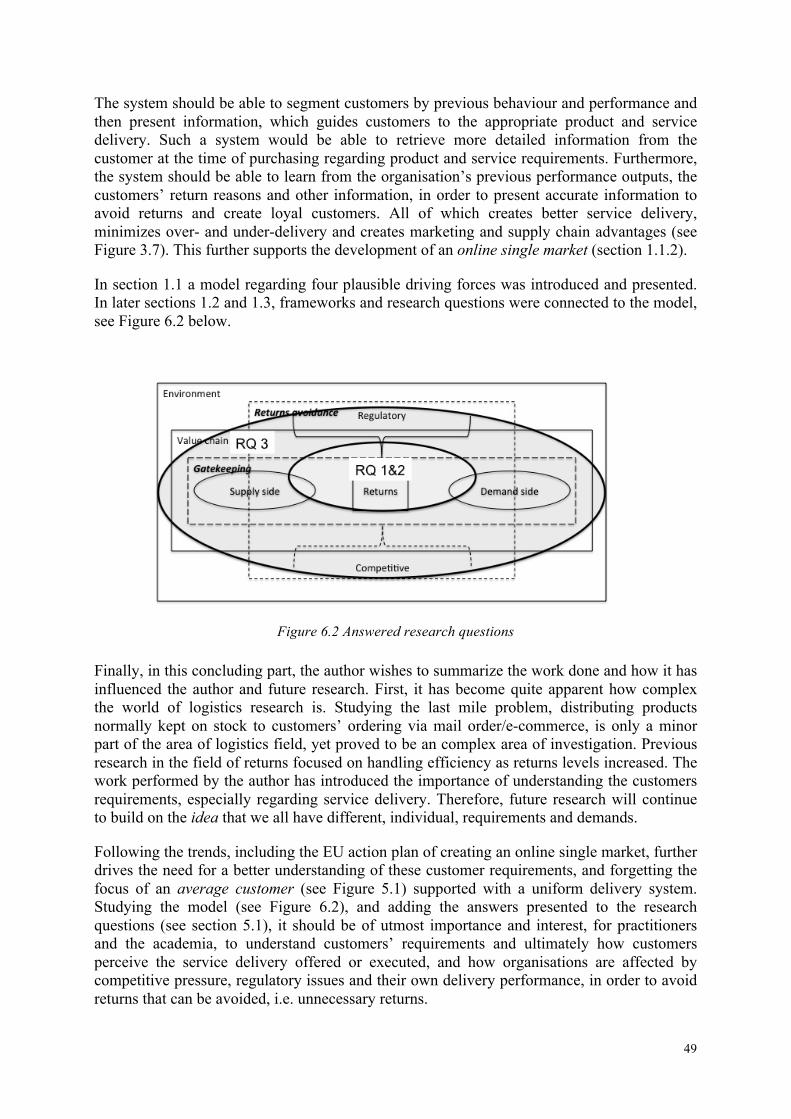
49
The system should be able to segment customers by previous behaviour and performance and then present information, which guides customers to the appropriate product and service delivery. Such a system would be able to retrieve more detailed information from the customer at the time of purchasing regarding product and service requirements. Furthermore, the system should be able to learn from the organisation’s previous performance outputs, the customers’ return reasons and other information, in order to present accurate information to avoid returns and create loyal customers. All of which creates better service delivery, minimizes over- and under-delivery and creates marketing and supply chain advantages (see Figure 3.7). This further supports the development of an online single market (section 1.1.2).
In section 1.1 a model regarding four plausible driving forces was introduced and presented. In later sections 1.2 and 1.3, frameworks and research questions were connected to the model, see Figure 6.2 below.
Figure 6.2 Answered research questions
Finally, in this concluding part, the author wishes to summarize the work done and how it has influenced the author and future research. First, it has become quite apparent how complex the world of logistics research is. Studying the last mile problem, distributing products normally kept on stock to customers’ ordering via mail order/e-commerce, is only a minor part of the area of logistics field, yet proved to be an complex area of investigation. Previous research in the field of returns focused on handling efficiency as returns levels increased. The work performed by the author has introduced the importance of understanding the customers requirements, especially regarding service delivery. Therefore, future research will continue to build on the idea that we all have different, individual, requirements and demands.
Following the trends, including the EU action plan of creating an online single market, further drives the need for a better understanding of these customer requirements, and forgetting the focus of an average customer (see Figure 5.1) supported with a uniform delivery system. Studying the model (see Figure 6.2), and adding the answers presented to the research questions (see section 5.1), it should be of utmost importance and interest, for practitioners and the academia, to understand customers’ requirements and ultimately how customers perceive the service delivery offered or executed, and how organisations are affected by competitive pressure, regulatory issues and their own delivery performance, in order to avoid returns that can be avoided, i.e. unnecessary returns.
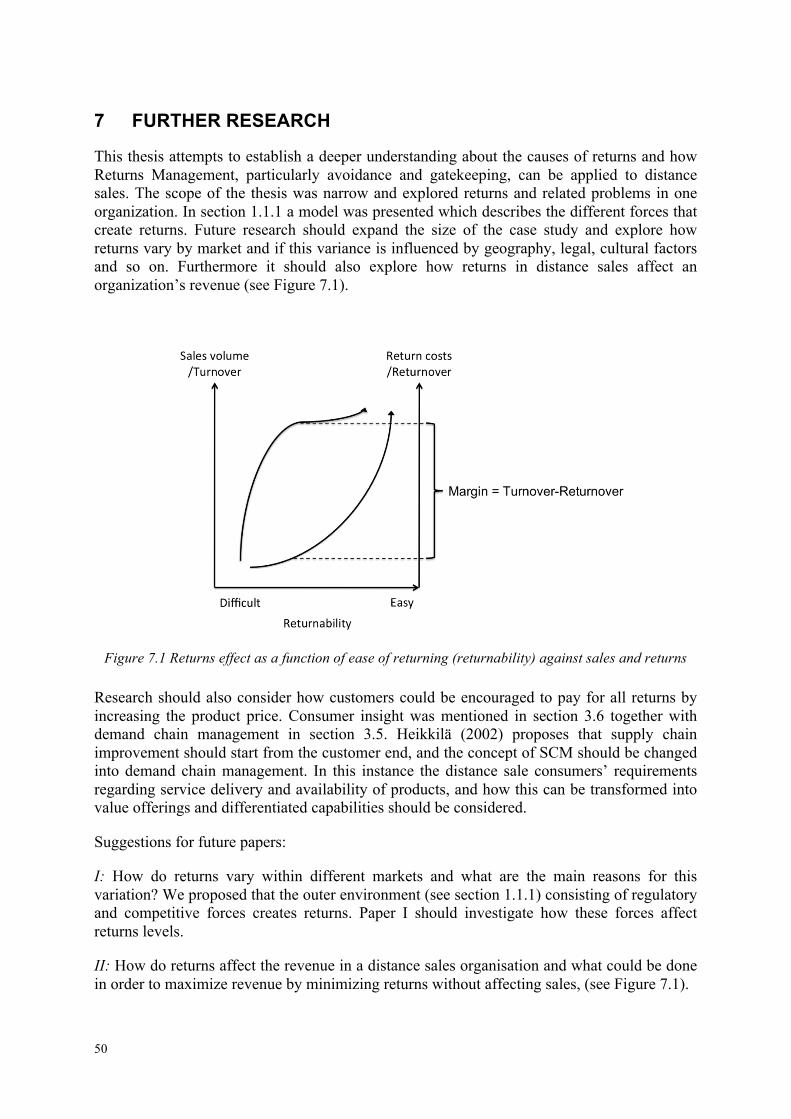
50
7 FURTHER RESEARCH
This thesis attempts to establish a deeper understanding about the causes of returns and how Returns Management, particularly avoidance and gatekeeping, can be applied to distance sales. The scope of the thesis was narrow and explored returns and related problems in one organization. In section 1.1.1 a model was presented which describes the different forces that create returns. Future research should expand the size of the case study and explore how returns vary by market and if this variance is influenced by geography, legal, cultural factors and so on. Furthermore it should also explore how returns in distance sales affect an organization’s revenue (see Figure 7.1).
Figure 7.1 Returns effect as a function of ease of returning (returnability) against sales and returns
Research should also consider how customers could be encouraged to pay for all returns by increasing the product price. Consumer insight was mentioned in section 3.6 together with demand chain management in section 3.5. Heikkilä (2002) proposes that supply chain improvement should start from the customer end, and the concept of SCM should be changed into demand chain management. In this instance the distance sale consumers’ requirements regarding service delivery and availability of products, and how this can be transformed into value offerings and differentiated capabilities should be considered.
Suggestions for future papers:
I: How do returns vary within different markets and what are the main reasons for this variation? We proposed that the outer environment (see section 1.1.1) consisting of regulatory and competitive forces creates returns. Paper I should investigate how these forces affect returns levels.
II: How do returns affect the revenue in a distance sales organisation and what could be done in order to maximize revenue by minimizing returns without affecting sales, (see Figure 7.1).
51
III: Test propositions from paper II as a quasi experiment and measure how sales and revenue are affected in relation to returns. Returns policies could be seen as a bridge that decreases the consumer risk regarding distance sales. It allows, new customers to test the business as such, further, liberal return policies that expands the policy to include reduced freight and returns costs, might attract new customers as well as, stimulate repurchase and a more impulsive behaviour when ordering, thus creating more returns.
IV: How can consumer insight be created and transformed into differentiated value propositions and supported by supply/demand chain capabilities in order to avoid under- and overdelivery of products and services.
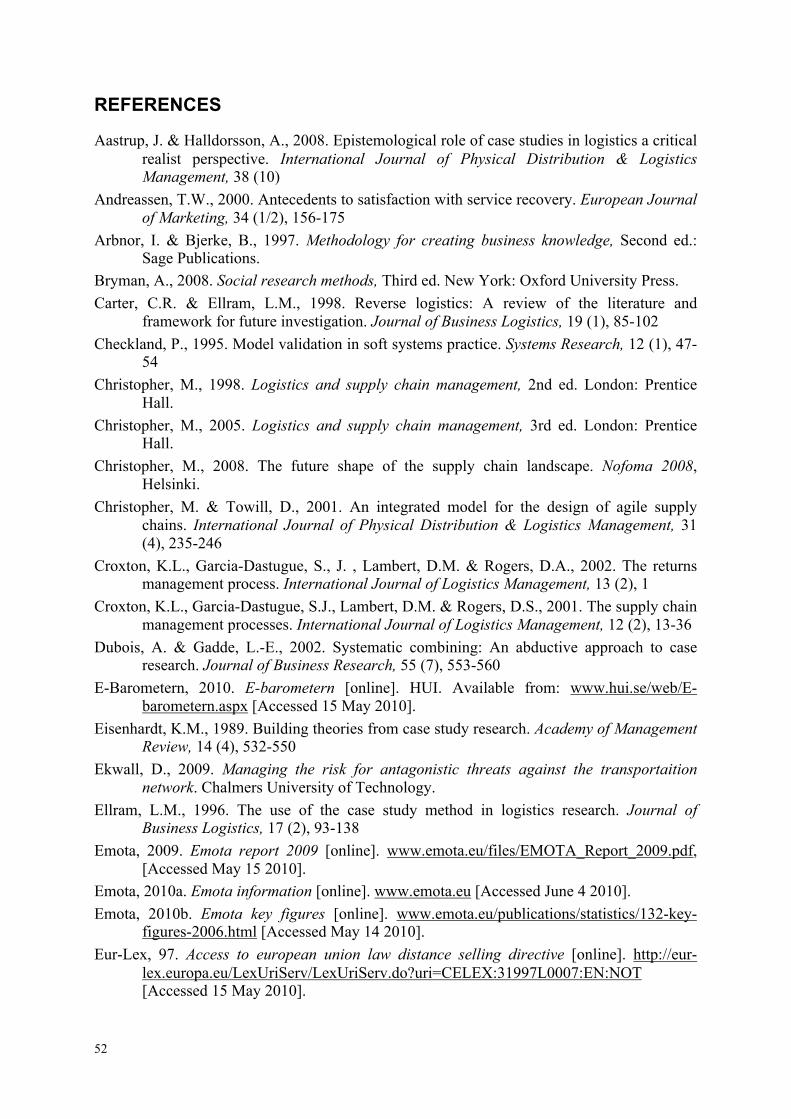
52
REFERENCES
Aastrup, J. & Halldorsson, A., 2008. Epistemological role of case studies in logistics a critical realist perspective. International Journal of Physical Distribution & Logistics Management, 38 (10)
Andreassen, T.W., 2000. Antecedents to satisfaction with service recovery. European Journal of Marketing, 34 (1/2), 156-175
Arbnor, I. & Bjerke, B., 1997. Methodology for creating business knowledge, Second ed.: Sage Publications.
Bryman, A., 2008. Social research methods, Third ed. New York: Oxford University Press. Carter, C.R. & Ellram, L.M., 1998. Reverse logistics: A review of the literature and
framework for future investigation. Journal of Business Logistics, 19 (1), 85-102 Checkland, P., 1995. Model validation in soft systems practice. Systems Research, 12 (1), 47-
54 Christopher, M., 1998. Logistics and supply chain management, 2nd ed. London: Prentice
Hall. Christopher, M., 2005. Logistics and supply chain management, 3rd ed. London: Prentice
Hall. Christopher, M., 2008. The future shape of the supply chain landscape. Nofoma 2008,
Helsinki. Christopher, M. & Towill, D., 2001. An integrated model for the design of agile supply
chains. International Journal of Physical Distribution & Logistics Management, 31 (4), 235-246
Croxton, K.L., Garcia-Dastugue, S., J. , Lambert, D.M. & Rogers, D.A., 2002. The returns management process. International Journal of Logistics Management, 13 (2), 1
Croxton, K.L., Garcia-Dastugue, S.J., Lambert, D.M. & Rogers, D.S., 2001. The supply chain management processes. International Journal of Logistics Management, 12 (2), 13-36
Dubois, A. & Gadde, L.-E., 2002. Systematic combining: An abductive approach to case research. Journal of Business Research, 55 (7), 553-560
E-Barometern, 2010. E-barometern [online]. HUI. Available from: www.hui.se/web/E-barometern.aspx [Accessed 15 May 2010].
Eisenhardt, K.M., 1989. Building theories from case study research. Academy of Management Review, 14 (4), 532-550
Ekwall, D., 2009. Managing the risk for antagonistic threats against the transportaition network. Chalmers University of Technology.
Ellram, L.M., 1996. The use of the case study method in logistics research. Journal of Business Logistics, 17 (2), 93-138
Emota, 2009. Emota report 2009 [online]. www.emota.eu/files/EMOTA_Report_2009.pdf, [Accessed May 15 2010].
Emota, 2010a. Emota information [online]. www.emota.eu [Accessed June 4 2010]. Emota, 2010b. Emota key figures [online]. www.emota.eu/publications/statistics/132-key-
figures-2006.html [Accessed May 14 2010]. Eur-Lex, 97. Access to european union law distance selling directive [online]. http://eur-
lex.europa.eu/LexUriServ/LexUriServ.do?uri=CELEX:31997L0007:EN:NOT [Accessed 15 May 2010].

53
Florin, D., Callen, B., Pratzel, M. & Kropp, J., 2007. Harnessing the power of consumer insight. Journal of Product & Brand Management, 16 (2), 76 - 81
Gammelgaard, B., 2004. Schools in logistics research? A methodological framework for analysis of the discipline. International Journal of Physical Distribution & Logistics Management, 34 (6), 479-491
Garvin, D.A., 1983. Quality on the line. Harvard Business Review, 61 (5), 64-75 Harrison, A. & Van Hoek, R., 2008. Logistics management and strategy, 3rd ed. London:
Prentice Hall. Heikkilä, J., 2002. From supply to demand chain management: Efficiency and customer
satisfaction. Journal of Operations Management, 20, 747-767 Holmes, J.O., 1953. Introduction to distribution logistics. In Forces, I.C.O.T.A. ed.
Washington, D.C. Jick, T.D., 1979. Mixing qualitative and quantitative methods: Triangulation in action.
Administrative Science Quarterly, 24 (4), 602-11 Jüttner, U., Christopher, M. & Baker, S., 2007. Demand chain management-integrating
marketing and supply chain management. Industrial Marketing Management, 36 (3), 377-392
Kang, M. & Johnson, K., 2009. Identifying characteristics of consumers who frequently return apparel. Journal of Fashion Marketing and Management, 13 (1), 37-48
Kovács, G. & Spens, K.M., 2005. Abductive reasoning in logistics research. International Journal of Physical Distribution & Logistics Management, 35 (2), 132-144
Kovács, G. & Spens, K.M., 2006. A content analysis of research approaches in logistics research. International Journal of Physical Distribution & Logistics Management, 36 (5), 374-390
Lambert, D.M., 2004. The eight essential supply chain management processes. Supply Chain Management Review, 8 (6), 18-26
Lambert, D.M., Burduroglu, Renan, 2000. Measuring and selling the value of logistics. The International Journal of Logistics Management, 11 (1), 1-18
Lee, T.W., 1999. Using qualitative methods in organizational research Thousad Oaks, California: Sage Publications.
Levitt, T., 1981. Marketing intangible products and product intangibles. Harvard Business Review, 59 (3), 94-102
Mentzer, J.T., Flint, D.J. & Hult, G.T.M., 2001. Logistics service quality as a segment-customized process. Journal of Marketing, 65 (4), 82-104
Mollenkopf, D., Russo, I. & Frankel, R., 2007a. The returns management process in supply chain strategy. International Journal of Physical Distribution & Logistics Management, 37 (7), 568-592
Mollenkopf, D.A., Rabinovich, E., Laseter, T.M. & Boyer, K.K., 2007b. Managing internet product returns: A focus on effective service operations. Decision Sciences, 38 (2), 215-250
Norek, C.D., 2002. Returns management making order out of chaos. Supply Chain Management Review, 6 (3), 34
Näslund, D., 2002. Logistics needs qualitative research – especially action research. International Journal of Physical Distribution & Logistics Management, 32 (5), 321 - 338

54
Parasuraman, A., Berry, L.L. & Zeithaml, V.A., 1991. Perceived service quality as a customer-based performance measure: An empirical examination of organizational barriers using an extended service quality model. Human Resource Management, 30 (3), 335-364
Parasuraman, A., Zeithaml, V.A. & Berry, L.L., 1985. A conceptual model of service quality and its implications for future research. Journal of Marketing, 49 (4), 41-50
Rogers, D.A., Croxton, K.L., Garcia-Dastugue, S.J. & Lambert, D.M., 2002. The returns management process. International Journal of Logistics Management, 13 (2), 1
Rogers, D.S. & Tibben-Lembke, R.S., 1998. Going backwards reverse logistics trends and practices Pittsburgh, Pennsylvania: Reverse Logistics Executive Council.
Rogers, D.S. & Tibben-Lembke, R.S., 1999. Going backwards reverse logistics trends and practices Pittsburgh, Pennsylvania: Reverse Logistics Executive Council.
Rutten, W.G.M.M. & Van Der Veeken, D.J.M., 1998. Logistics service management: Opportunities for differentiation. The International Journal of Logistics Management, 9 (2), 91-98
Stentoft Arlbjørn, J. & Halldorsson, A., 2002. Logistics knowledge creation: Reflections on content, context and processes. International Journal of Physical Distribution & Logistics Management, 32 (1), 22 - 40
Stock, J.R., 1997. Applying theories from other disciplines to logistics. International Journal of Physical Distribution & Logistics Management, 27 (9/10), 515 - 539
Thierry, M., Salomon, M., Van Nuen, J. & Van Wassenhove, L., 1995. Strategic issues in product recovery management. California Management Review, 37 (2), 114-135
Un, 1992. Un conference on environment and development (1992) [online]. www.un.org/geninfo/bp/envirp2.html [Accessed 15 May 2010].
Wood, D.F., Yaros, R.S., 1979a. Recalling products in the drug and cosmetic industry. Journal of business logistics, , 1 (2), 48-59
Wood, D.F., Yaros, R.S., 1979b. Recalling products in the drug and cosmetic industry. Journal of business logistics,, 1 (2), 48-59
Woodruff, R.B., 1997. Customer value: The next source for competitive advantage. Journal of the Academy of Marketing Science., 25 (2), 139-153
Yin, R.K., 2009. Case study research, 4th ed. Thousand Oaks, California: Sage Inc.

Paper I


AVOIDING RETURNS IN DISTANT SELLING THROUGH DIFFERENTIATING CUSTOMERS AND
THEIR SERVICE DELIVERY Klas Hjort*, Jonas Larsson**
*) School of Engineering, University of Borås, 501 90, Borås, Sweden E-mail: [email protected], Tel: + 46 33 435 40 00, Fax: + 46 33 435 40 08
**) Swedish School of Textiles, University of Borås, 501 90, Borås, Sweden E-mail: [email protected], Tel: + 46 33 435 40 00, Fax: + 46 33 435 40 09
ABSTRACT Purpose of this paper This paper discusses possible reasons behind consumer returns in general and possible implications of not differentiating between customers and an organization’s order processing systems support, as well as the possible relations between increased returns and not “understanding” customers demands in a business to consumer (B2C) distance selling context.
Design/methodology/approach A single organization case study designed with both quantitative and qualitative methods was used to explore the relatively unobserved area of consumer returns and their possible relations to an organization’s order processing system support. The results have been evaluated and discussed with different managers from the company under study, to substantiate authenticity and trustworthiness.
Findings It was revealed that some customers, especially the younger set using the Internet, are truly demanding and at the same time less loyal. This has caused commotion within the organization and with the supply chain network partners, because of the high return rates
Research limitations/implications This paper analyzes data from only one Swedish organization, but the empirical data covers more than two and a half million order data sets and close to half a million return data sets. What is original/value of paper Most studies within the field of returns focus on products and the efficient handling of returns. This study focuses on the service delivery aspect and concludes that having only one order processing system methodology will fail to support all customers’ demands. Keywords: Returns, Returns Management, Customer Demands, Customer Satisfaction.

2
1. INTRODUCTION The battle of consumers has increased the product flora and in many cases lowered the price that we pay for products (Christopher, 2005). It often results in a behavior where consumers are more spontaneous and demanding, where the abundance of alternative suppliers; especially on the Internet, makes today’s consumers less loyal in the sense that they are likely to try alternative suppliers when appropriate. The new Internet economy which Chris Anderson in 2006 coined “the Long Tail Economy” is challenging the traditional mail order companies. The Internet has given people almost unlimited access to niche markets and thus it is easy to find alternative suppliers (Anderson, 2006). Many traditional Swedish distant shops started with a catalog as the intermediary between them and their customers, later they extended it with a customer service desk handling customer over the phone and today the Internet is an important channel for incoming orders. Their initial logistic system was perhaps built around customers with less demand on the service delivery system and the system has been developed over time as customer demand has changed. Today traditional mail order companies as well as other distance selling enterprises are experiencing more demanding customer, demanding in the sense that they are forcing companies to improve their competitiveness in order to outperform their “rivals” in the creation of logistics advantage. Modern ICT technology has made it easy to customize the supply chains for each customer group. Customized supply chains might be one solution to the problem of increasing return rates. The use of customer segmentation facilitates today’s mass customization need for supply chains where the market is broken up into groups of customers with similar needs. It might be one solution to the problem of increasing return rates in the distant shop business.
In a case study performed at a Swedish mail order / distant shop it was revealed that some end-users, especially the younger once using the Internet to order, are truly demanding, spontaneous and at the same time less loyal and causes a commotion to the organization and their partners in the supply chain with high return rates. This relatively new shopping behavior might be due to the almost infinite supply of products on the Internet and that the particular customer group easily finds alternative shops in the Long Tail (Anderson, 2006).
Since the evolvement of the research field of reverse logistics and later returns management the emphasis has been on the physical flow of products, i.e. handling (de Koster et al., 2002), storing (de Brito and van der Laan, 2009), recycling etc. It has been mentioned, especially in returns management, that avoidance and gatekeeping are two strategic “weapons” to minimize the return flow. To avoid returns in a business to consumer (B2C) distant shopping environment one question arises whether one logistics service system provides the required support to all customers, or if organizations need to differentiate their service delivery.
2. RESEARCH METHODS, QUESTIONS AND DELIMITATIONS
This paper discusses possible reasons behind consumer returns in general and the implications of not differentiating customers and their logistics service delivery and the possible relations between increased returns and not “understanding” customers demands in a B2C distant selling context.

3
Why customers return what they previously purchased is something that companies normally tries to understand using returns reason codes given by the returner. There are likely to be reason behind returns that does not fit into codes and some customer might even want to “blame” the supplier for the return to avoid paying for he return freight. To understand the direct cause why customers return, calls for a direct dialog with the customers returning, a costly and time-consuming way! Given the fact that reason codes is not always the true reason behind returns; instead, in order to “understand” customer’s buying and returns behavior an indirect study of one organizations service performance regarding transaction and post-transaction elements were conducted answering the following questions:
Is there any characteristic difference in return behavior between customers regarding customer service delivery elements and what causes returns?
To generate results that can be generalized for all customers in one organization we analyzed purchase and returns data for all incoming orders and returned shipments for the time period of approximately one year. Logistics has been criticized for its lack of theory development (Stock, 1997) and for not using or borrowing theories from related disciplines. Modern logistics is based on holistic and systemic thinking and uses cross-functional approaches and it should be reflected in published research as well (Näslund, 2002). To study one organization in depth, asking questions about how, why and statistically observe who, what causes an occurrence in one setting calls for an exploratory case study method with both qualitative and quantitative methodologies (Ellram, 1996).
Figure 2.1 Three different research approaches (Kovács and Spens, 2006)
This paper represents an abductive approach where the paper covers the four steps in figure 2.1, using prior theoretical knowledge on real-life observations i.e. case study. The research process followed Kovacs model where the exploratory study commenced with a descriptive study of secondary data regarding purchase and returns. Matching results from the descriptive study (real-life observations) to theoretical frameworks and concluding the research with propositions about possible reasons. The authors found this approach with an exploratory study combined with a descriptive quantitative study suitable to describe the possible reasons behind certain behavior. The overall exploratory nature of the study is suitable when the problem is somewhat unknown and therefore the theoretical framework not totally given from the start.

4
The initial step is similar to the inductive approach but with the difference in that the inductive ends with new knowledge without testing the results whereas the authors ambition is to test the propositions in order to support them or to falsify them.
Logistics is interdisciplinary by definition and the same should go for logistics research (Kovács and Spens, 2005). To carry out research on a logistic system, using any known approach, calls for a structured but mixed methodology. The conducted study was delimited to the case organizations Swedish customers and consumer returns only where one or more unwanted units are returned from the customer i.e. not products for repair etc. Orders from the organizations staff was excluded due to that those was found to be irrelevant for the study and might affect generalization of the results.
3. RETURNS MANAGEMENT
The change from early product recalls to today’s returns management has evolved from being merely a company activity within a logistics network to an important Supply Chain Management key process. There are a number of terms and definitions that try to define the reverse flow of products, closed-loop supply chain management, reverse logistics or simply returns.
Returns are sprung out of many possible reasons depending on the position in the supply chain and the nature of the product (Rogers and Tibben-Lembke, 1998). The Global Supply Chain Forum together with the authors of the article The Returns Management Process (Rogers et al., 2002) defined five types of returns:
• Asset • Consumer • Environmental • Marketing • Product recall
This paper concentrates on consumer returns in B2C in a distance shopping context where the consumer has no change of evaluating the products physically or the promised service delivery until the product is delivered or the service executed.
Consumer returns are perhaps the group that is toughest to handle due to the fact that it is difficult to know when customers returns and therefore plan for an efficient execution of the return. The reason for returning is often defect products or simply buyers’ remorse. Others return reasons are fit, size, not collected or that consumer do not understand how to properly use the products; referred to as non-defective defectives (Rogers and Tibben-Lembke, 1998). Croxton (Rogers et al., 2002) defines the Returns Management (RM) process as:
“The part of supply chain management that includes returns, reverse logistics, gatekeeping and avoidance”.
The above definition of RM is used in this paper and the broader approach of returns management, compared to other definitions, lets one discuss the problem of returns and work proactively with return avoidance and thereby avoid future returns. Returns, handles the company’s strategic view or returns, the American distance seller L.L Bean has a 100 % customer satisfaction guarantee where they offer the customer to return any

5
purchase at any time, their believe of customer satisfaction does not end at the time of product and service delivery! Reverse Logistics (RL) has been a recognized logistics concept for decades now. It began to accelerate with a growing awareness of problems resulting from the industrial revolution. The concept dealt with problem areas from hazardous waste to consumer returns (Rogers and Tibben-Lembke, 1998). The common goal for all reverse flows is to recapture value from packaging material, consumer returns, waste etc.
Gatekeeping is the guarding of the entrance of the returns flow. The main activity is to screen return requests and the returned item. A requested return can be assisted with (avoidance) better information or training in the usage of the product and thereby avoided physically. Gatekeeping assures that only returns that are allowed may pass the entry and are then guided to the correct point in the supply chain. Properly executed, gatekeeping improves the disposition (see, (Rogers and Tibben-Lembke, 1998) of returns, reduces cost, and increases customer satisfaction. Normally it is applied at the entry but can be applied to more than one location in the returns flow.
Avoidance aims at finding ways to minimize return requests or returns. It is this activity that differentiates returns management from earlier reverse logistics, due to the fact that when successfully applying avoidance, the returns are not sent backwards and could by definition not be reverse logistics.
The ways of executing avoidance may differ; improved quality, better information or user instructions, and better service are some common applications. Improved quality is understood in terms of reduced number of defect products, better instructions or information in the sense that the consumer/user understands both what he is purchasing as well as how to operate it (Rogers et al., 2002). This could be in combination with better service, e.g. the retailer or seller makes a home visit and installs computer equipment and educates the user. This is a service offered to ONOFF’s customers, both to visitors to the shop as well as Internet customers. A Swedish shirt manufacturer has an innovative system for avoiding returns:
1. They let the customer design their own shirts that make the customer more satisfied already from the beginning regarding both silhoutte, colour and size.
2. Customers are able to follow the order fulfillment process from fabric to delivery via the Internet. It seems like customers are more willing to accept long lead-times if they are able to track and trace their order.
The company has a return rate of merely one percent and if the customer is not satiesfied, he or she receives a new shirt without cost. ETON Shirts has similar return rate figures for their made-to-measure supply chain. It is likely that customers of customized goods are more satisfied with the end result then customers of mass products. Thus, even if the company is not able to offer mass customized products, they might be able to offer a customized supply chain for the customer and in that way lower the return rate.
Extra Film is trying to avoid certain returns, new customer that place an extraordinarily large order are contacted before the order is executed to ensure that no mistake has been done from the customer side.

6
4. CUSTOMER SERVICE
In mail order and other distance selling businesses quality of service is crucial, especially when competitors are offering the same products in commodity segments where products and price is easy to copy. In distant shopping the costumer has to be convinced up to four times before the total benefit of doing business with the selected supplier is evaluated and finalized. First the new or previous customer has to be convinced to place an order, secondly the shipment must be accepted, thirdly if not satisfied the customer might want to return the item, forth an evaluation of the “hassle” of returning evaluated against the value of the item decides whether the return will take place or not. Creating and offering superior customer service and outperforming competitors in how customers perceive the value delivered are key driver of customer value and an important way to improve customer loyalty (below).
Figure 4.1 Key drivers of customer value (Harrison and van Hoek, 2008)
Christopher argues that there are many facets of customer service, ranging from on-time delivery to after sales support (Christopher, 2005). Quality of services addresses the process of handling over the product and services to the end-user (Harrison and van Hoek, 2008). To achieve service excellence a carefully thought-out service strategy is needed together with an appropriate delivery system and committed personnel from chief executive down.
For distance selling organizations it is important to incorporate the return flow as well in the strategy and strive for service excellence. Customer service is a broad concept and varies between companies but can be grouped into:
• Pre-transaction elements • Transaction elements • Post-transaction elements
Consumers evaluating a new “supplier” in distance selling are likely to go through all three elements before even becoming a customer. Pre-transaction elements relate to written company statements or policies and are the elements that new customers relate to before deciding to do business. The transaction elements are related to the service delivery reliability. The post-transaction relates to supporting activities to the purchased items but also procedures for customer complaints and return issues.
Customers screening the Internet for possible suppliers tend to evaluate pre and after sales service capabilities before placing an order, and if anything goes wrong during the execution

7
of service delivery a responsive return flow is necessary otherwise a large portion of business is lost and perhaps the customer as well. Setting service standards; it is easy to assume that “we know our customers service requirements” or needs. The service requirements and ways of communicate with customers in distance shopping are likely to be in the same continuous development phase as information- and delivery systems. Therefore it is easy to assume that we know what our customers want or need but it is difficult to know what our competitors delivers. Even if we know what one customer wants it is unlikely that all customers have the same requirements. After screening the suppliers’ customer service elements and related them to one’s personal needs a potential customer decides whether or not to become a customer. If not it is easy to assume that the screening of another supplier takes place if the need is not satisfied in other ways. This is one important way that differentiates today’s business from yesterdays! Especially in distance selling on the web, the amount of alternatives there is tremendous compared to the catalog market. Even if the intention was not to be spontaneous or disloyal to a previous supplier, the result of an inquiry over the phone to the customer service desk or over the web via a web order form might result in a new acquaintance with a supplier that hopefully can satisfy the customers need. In a perfect world everything would have been fine with the customer placing an order; delivering customer value however is not finalized until the execution of service and the delivery of products (Authors note). Offering a standard logistic service in a market typified by variations in customer characteristics i.e. B2C is perhaps not enough. To meet customers’ requirements there is three main logistics service approaches to choose from, a standardized or one fits all with economies of scale opportunities. Customized logistics services to each individual customer, maximizes customer satisfaction and all too often associated costs.
Differentiating the logistic service for different customers with similar requirements balances the customer satisfaction and related costs and is an important offer in a complex market (Rutten and van der Veeken, 1998). Customizing logistics programs to different customer segments improves both effectiveness and efficiency (Mentzer et al., 2001)
Christopher (Christopher, 2005) argues that the failure of any business will be determined by the level of customer value that it delivers to the chosen markets and presents several definitions of customer value:
The customer value depends of how the customer perceives the benefits of the service delivery related to total cost of ownership. For some customers this evaluation of the customer value takes place at the same time the service delivery is executed for others it might be judged at several occasions. Marketing the return policy as L.L Bean with a 100 % customer satisfaction guarantee where they offer the customer to return any purchase at any time implies that the customer actually evaluates post-transaction elements pre-ordering!
=

8
Another of Christopher’s definitions of customer value is:
This implies that the perceptions of benefits for a product with a similar price and cost i.e. commodity segment, are merely related to the quality of service delivered.
Customer satisfaction is broader than customer service and occurs when businesses successfully fulfills their obligations towards the customer (Lambert, 2000). Satisfied customers are sprung out of fulfilling obligations and by creating customer value, which results in loyal customers and repeat purchases. In this study customer retention, is studied as the amount of customers returning and at the same time reorder.
5. CASE STUDY
The case organization is one of the largest distant selling companies in Sweden and therefore an interesting organization to study. They have a long history in the business and where willing to participate and to support the study with empirical data. Therefore a single organization case study design with both quantitative and qualitative methods where used to explore the relatively unobserved area of returns.
The empirical research commenced in 2007 with informal discussions with the company’s senior management about returns, these discussions continued throughout the project and the researcher visited the company on several occasions. After discussions with the logistics manager and the vice president it was decided to commence with a quantitative study of possible factors that may influence the amount of returns. The study aimed to describe the distribution of the variable ‘returns percentage’ over internal factors as availability, lead-time etc. as well as factors related to the consumer such as age, new or previous customer and so on. To support the project and to further highlight the “Returns project” the author and a fellow researcher conducted a seminar for a management team about Returns Management and Demand Chain Management.
During the study the results of the quantitative study was presented and discussed with the organization in order to “interpret” the data correctly and to generate results that where interesting both theoretically and practically. After the study the results was presented to a team of managers on two occasions.
5.1. Quantitative study To learn about the reasons behind returns and to somehow avoid future returns it is essential to learn from history. The quantitative study was meant to do so and to enlighten researchers as well as practitioners about the hidden story behind returns by exploring return data. Historical order data from 1/7/2006 to 1/6/2007 and returns data from 18/9/2006 until 27/9/2007 were exported as text files and contained 2 600 492 orders, 10 096 419 invoiced units, 642 290 returns and 1 524 342 returned units.
=
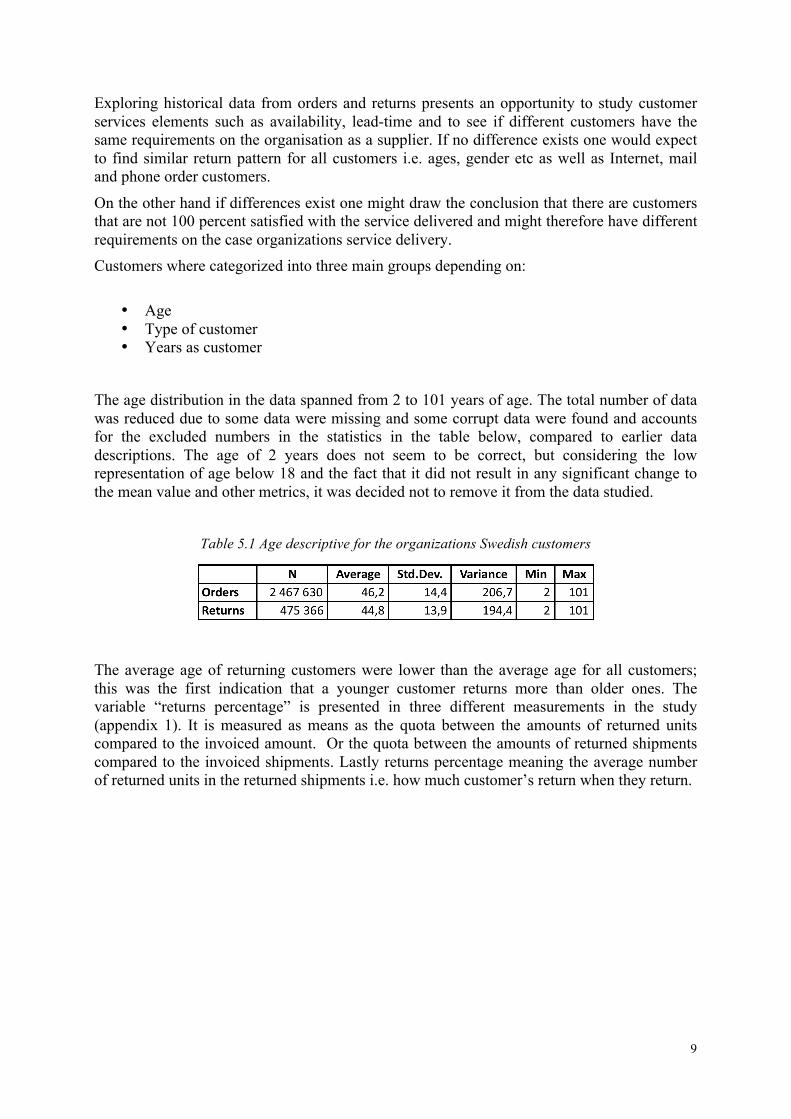
9
Exploring historical data from orders and returns presents an opportunity to study customer services elements such as availability, lead-time and to see if different customers have the same requirements on the organisation as a supplier. If no difference exists one would expect to find similar return pattern for all customers i.e. ages, gender etc as well as Internet, mail and phone order customers.
On the other hand if differences exist one might draw the conclusion that there are customers that are not 100 percent satisfied with the service delivered and might therefore have different requirements on the case organizations service delivery. Customers where categorized into three main groups depending on:
• Age • Type of customer • Years as customer
The age distribution in the data spanned from 2 to 101 years of age. The total number of data was reduced due to some data were missing and some corrupt data were found and accounts for the excluded numbers in the statistics in the table below, compared to earlier data descriptions. The age of 2 years does not seem to be correct, but considering the low representation of age below 18 and the fact that it did not result in any significant change to the mean value and other metrics, it was decided not to remove it from the data studied.
Table 5.1 Age descriptive for the organizations Swedish customers
The average age of returning customers were lower than the average age for all customers; this was the first indication that a younger customer returns more than older ones. The variable “returns percentage” is presented in three different measurements in the study (appendix 1). It is measured as means as the quota between the amounts of returned units compared to the invoiced amount. Or the quota between the amounts of returned shipments compared to the invoiced shipments. Lastly returns percentage meaning the average number of returned units in the returned shipments i.e. how much customer’s return when they return.

10
Figure 5.1 Age distribution of ordering and returning customer between 18 and 84 years.
The number of invoiced and returned units and shipments over age in years are presented above, the age distribution above has its peak level for both invoiced and returned units at 42 years and the distributions seems to be normal distributed. Type of customer relates to the way the order was registered, 12 different ways was found where three (se bold below) of them accounted for 97,5 % off all orders and those are the ones presented in detail in the paper. Below all different order types are decoded. The type I, 6 and 9 were not found in the study, 6 (personnel) was removed earlier as explained and I stands for Iceland and are not supposed to be present in the study over Swedish customers, and there seems not to be any unknown in the data studied.
A Internet order B Internet return I Iceland 1 Phone order 2 Mail normal 3 Infobot 4 Tape recorder 5 Return 6 Personnel 7 Other packet nr 8 Customer service called customer 9 Unknown
Years as customer are the amount of years that has passed since the first order until the order under study. The service elements that the study focused on were availability and timeliness. Availability in this paper is defined as the ability to deliver order from stock. Timeliness is depicted as lead-time and is measured from the day of registering order via the web, phone or receiving a mail order, until the order is picked and ready to be shipped to the consumer. During the time, that data in the study represents, the case organization presented a 7-9 days lead-time to customers ordering. The data analyzed and described is the amount of returned units divided with total shipped units as “units”, returns information is regarded as confidential and is therefore indexed. In figure 4 below all three mentioned returns percentages and respective measurements mean values are plotted over age. Younger customers (18-33) return items well above all three measured mean value shown as dotted line.

11
Figure 5.2 Return percentages as percentage of returned units over ages from 18 to 84 years
To get a more precise picture of how the return percentage varies with age, and whether any difference exists between invoiced and returned unit level an index quota was calculated and plotted. The index measures how much of the total invoiced units each age group is responsible for and thereafter the same calculation for returned units as part of the total returned was made. If each age interval orders and returns the same amount, as part of the total, the quota should be in line or close to one other; otherwise the curve with the higher value means a greater part of the total.
Figure 5.3 Shipped and returned units index quota
In the figure above it shows that customers between 23 and 33 return a higher percentage than they order, the opposite can be said about customers above 53 years of age. A similar shape was found when analyzing shipments. Customer orders were distributed in three ways, if everything was on stock the normal promised delivery lead-time during the time of the study was 7-9 working days. If a unit or so was unavailable on stock and replenishment was expected near in time the company might place the order in a “wait stage” so the shipment could be delivered in full. Otherwise a part delivery was made and the rest was sent later.
The lead time, measured as the time between a customer placing order until goods are picked and ready to be shipped to the customer, varies depending on several factors, such as the availability of products on stock, number of orders to process and so on. The study showed

12
that it seems to differ depending on age as well, the average lead time spanned from 9 to 12 days this was a bit surprising due to the fact that the ones with shorter lead times, i.e. younger customers were the ones returning most (figure 5.2).
Figure 5.4 Lead-time distribution in days and return percentage for returned units, shipments and return
It is likely that lead-time affects the returns percentage. Figure 5.4 above shows that the measured percentages are quite stable the first 10 days and then the shipments percentage decreases and at the same time the mean return percentage increases drastically from day 9 to 16. The sudden decrease in return level around day 9-12 was discussed during one of the meetings held at the case organization. According to the mangers, the decrease was a reaction from customers on long lead-time and the result was a cancellation of orders.
Figure 5.5 Lead time distribution in days and return percentage for wait orders
The graph above shows the return percentage for wait orders, the customers are not aware that the order will be held on wait until the whole shipment can be shipped, an increase in return levels appear after 3 days and continues to increase for both units and shipments.

13
Figure 5.6 Lead time distribution in days and return percentage for stock-out orders
The return levels for stock-outs (above) start at similar return level as wait orders but increases slower and does not reach the same height or peak as wait orders. The difference between the two order types (wait & stock-outs) is that customers ordering over the Internet or phone will be notified about the longer lead-time and might therefore exclude orders with long delivery.
Figure 5.7 Lead time distribution in days and return percentage for normal orders
Normal orders i.e. the ones that are not wait orders or stock-outs shows the highest overall return percentages where Internet customers together with phone customers are well above mail orders, it differs approximately 10 percent for shipments. The three major response codes are 1, 2 and A and represents 97,5% of all orders, cf. figure below. Phone orders (Order type 1) are close to units and shipments mean values (index 1), mail order is well below and Internet orders well above.

14
Table 5.2 Order types and their return percentages for units and shipments and respective order types market share
Table 5.3 Order type and their return levels over age and average number of years as customer, average years of age per order type
ReturnpercentageUnits Shipments
AgeOrdertype
‐25 26‐50 51‐75 75‐ ‐25 26‐50 51‐75 75‐
Yearsascustomer
Age
1 1,61 1,15 0,93 0,77 1,20 1,08 0,96 0,85 17,9 50,72 1,35 0,84 0,67 0,50 0,94 0,78 0,67 0,50 18,4 54,4A 1,99 1,14 0,94 1,24 1,56 1,11 0,97 1,08 13,2 39,9
Order type A have the lowest value for years as customer as well as age; order type 2 shows that mail order customers have the highest values. If one analyzes table 5.2 and 5.3 together it becomes evident that what was shown in figure 5.2 and 5.3, namely that younger customers return more than older. At the same time Internet customers are younger than other customers and return more as well.
The study shows that the average age of the Swedish customer is 46.2 years. At the same time it revealed that the average age for the returning customers is 44.8 years, which was the first indication that younger customers returned more than the older ones. In figure 4 returns percentages revealed that younger customers (18-33) return well above the three measured means. And the study also pointed out that younger customers returned a greater part of what they initially ordered, compared to older customers. This evidence was more distinct for the units than for shipments, but nevertheless a fact. New customers, up to year five, are the most frequent returners. Internet customers in general return more often than the other alternatives, and they are also younger. Abnormal may not be the best word for it, but new and young customers and Internet customers, especially younger new ones, are definitely the most frequent returners who also return the largest volumes.
6. HYPOTHESES AND TESTING
The descriptive statistics presented in the paper points in directions that imply that returns are dependent on certain conditions. If these conditions are fulfilled it affects a casual mechanism that cause the event i.e. returns. Social events are often the result of complicated causal mechanisms and they are activated by several conditions (Djurfeldt, 2003). The conditions that are highlighted in this paper are age, lead-time and different order entries; these are some of the possible conditions that activate the mechanisms that cause the return event.

15
Figure 6.1 Condition affecting causal mechanisms resulting in certain event (Djurfeldt, 2003).
The analysis of the quantitative data in this paper has been a somewhat trial and error process. From the start we did not know much about the data and therefore we; as explained earlier, in the exploratory study decided to describe the return data using a descriptive presentation. The amount of returns and returns percentages did not appear to be linear. Presented together with the described conditions age, lead-time we sensed some linearity in certain intervals, but as the graphs in the descriptive study shows, not a strong linearity. The author tested the correlation between the different conditions and returns but we were unable to find and present any strong correlation. The descriptive presentations anyhow indicated that age, lead-time and different ways of placing order influenced the amount of returns. To test if the event or return is independent of the three conditions a Chi2 test was conducted. We performed three individual Chi2 tests using the same hypothesis namely:
H0: Returns are independent of the condition
H1: Returns are dependent of the condition All three Chi2 tests were done using the SPSS soft ware and the test settings and detailed test results are presented in appendix 1 and 2. All three individual tests resulted in the falsification of the H0 hypothesis that the different conditions and the return level on shipment level are independent.
Table 6.1 Chi- square test results
Test Pearson Chi-Square
Degree of freedom
Significance level
Age 5 811 8 0,000 Lead-time 10 286 4 0,000 Order entry 9 936 7 0,000

16
7. CONCLUSIONS
Returns and the problem that they tend to increase over time are not easy tasks to solve or to even understand. To avoid some of the future returns that are related to today’s performance and understanding of customer needs and wants means that one has to communicate better with customers. The increase in returns is probably closely related to extended lead time, availability, competition and more demanding customers and the fact that the case organization tried hard to get into a more demanding segment with customers, who are younger and more focused on fashion. The above statements may have been expected and assumed before this study, but the present investigation presents enough information to confirm them. The question is how; even if there probably never will be a future without returns one must aim for a trouble-free future with a good relationship to customers and suppliers Improving returns handling for whatever reason calls for an understanding of the fundamental “causes” and effects that returns pose on an organization and its customers. The conducted study commenced with unstructured discussions about returns in general with key informants from the logistics department at the company. Returns from customers are an area of growing interest, organizations; especially those in the business of distance selling are recognizing the impact of it at different levels. First, maybe still, it may have been seen as a natural consequence of doing business at a distance. Later, it was in some areas seen as a potential way of differentiating from competitors, in areas such as customer satisfaction, cost, environmental concern etc.

17
REFERENCES Anderson, C., 2006. The long tail. Why the future of business is selling less of more, 1st ed.:
Hyperion Books. Christopher, M., 2005. Logistics and supply chain management, 3rd ed. London: Prentice
Hall. De Brito, M.P. & Van Der Laan, E.A., 2009. Inventory control with product returns: The
impact of imperfect information. European Journal of Operational Research, 194 (1), 85-101
De Koster, R.B.M., De Brito, M.P. & Van De Vendel, M.A., 2002. Return handling: An exploratory study with nine retailer warehouses. International Journal of Retail & Distribution Management, 30 (8), 407 - 421
Djurfeldt, G., Larsson, R., Stjärnhagen, O,, 2003. Statistisk verktygslåda: Studentlitteratur. Ellram, L.M., 1996. The use of the case study method in logistics research. Journal of
Business Logistics, 17 (2), 93-138 Harrison, A. & Van Hoek, R., 2008. Logistics management and strategy, 3rd ed. London:
Prentice Hall. Kovács, G. & Spens, K.M., 2005. Abductive reasoning in logistics research. International
Journal of Physical Distribution & Logistics Management, 35 (2), 132-144 Kovács, G. & Spens, K.M., 2006. A content analysis of research approaches in logistics
research. International Journal of Physical Distribution & Logistics Management, 36 (5), 374-390
Lambert, D.M., Burduroglu, Renan, 2000. Measuring and selling the value of logistics. The International Journal of Logistics Management, 11 (1), 1-18
Mentzer, J.T., Flint, D.J. & Hult, G.T.M., 2001. Logistics service quality as a segment-customized process. Journal of Marketing, 65 (4), 82-104
Näslund, D., 2002. Logistics needs qualitative research – especially action research. International Journal of Physical Distribution & Logistics Management, 32 (5), 321 - 338
Rogers, D.A., Croxton, K.L., Garcia-Dastugue, S.J. & Lambert, D.M., 2002. The returns management process. International Journal of Logistics Management, 13 (2), 1
Rogers, D.S. & Tibben-Lembke, R.S., 1998. Going backwards reverse logistics trends and practices Pittsburgh, Pennsylvania: Reverse Logistics Executive Council.
Rutten, W.G.M.M. & Van Der Veeken, D.J.M., 1998. Logistics service management: Opportunities for differentiation. The International Journal of Logistics Management, 9 (2), 91-98
Stock, J.R., 1997. Applying theories from other disciplines to logistics. International Journal of Physical Distribution & Logistics Management, 27 (9/10), 515 - 539

18
APPENDIX 1 Chi2 test age
Case Processing Summary Age
Cases
Valid Missing Total
N Percent N Percent N Percent
Returns * Age (Binned)
2 464 944 96,0% 102 587 4,0% 2 567 531 100,0%
Chi-Square Tests
Value df
Asymp. Sig. (2-sided)
Pearson Chi-Square 5 811 8 0,0000
0 Likelihood Ratio 5 945 8 0,0000
0 Linear-by-Linear Association
5 188 1 0,00000
N of Valid Cases 2 464 944 a. 0 cells (,0%) have expected count less than 5. The minimum expected count is 207,31.
Chi2 test Lead-time
Case Processing Summary Lead-time
Cases
Valid Missing Total
N Percent N Percent N Percent
Returns * Lead_time (Binned) 2567531 100,0% ,0% 2 567 531 100,0%
Chi-Square Tests
Value df Asymp. Sig.
(2-sided) Pearson Chi-Square 10 286 4 0,000 Likelihood Ratio 10 847 4 0,000 Linear-by-Linear Association 7 503 1 0,000 N of Valid Cases 2 567 531 a. 0 cells (,0%) have expected count less than 5. The minimum expected count is 13993,18.

19
APPENDIX 2
Chi2 test Order entry Case Processing Summary Order entry
Cases
Valid Missing Total
N Percent N Percent N Percent
Returns * Order_entry 2 567 531 100,0% ,0% 2 567 531 100,0%
Chi-Square Tests
Value df Asymp. Sig.
(2-sided) Pearson Chi-Square 9936,306a 7 ,000 Likelihood Ratio 10 548 7 ,000 N of Valid Cases 2 567 531 a. 0 cells (,0%) have expected count less than 5. The minimum expected count is 119,86.


Paper II

An application of Avoidance and Gatekeeping to manage returns in a distance selling setting
Klas Hjort*, Dag Ericsson**
*) School of Engineering, University of Borås, 501 90, Borås, Sweden E-mail: [email protected], Tel: + 46 33 435 40 00, Fax: + 46 33 435 40 08
**) School of Engineering, University of Borås, 501 90, Borås, Sweden E-mail: [email protected], Tel: + 46 33 435 40 00, Fax: + 46 33 435 40 08
ABSTRACT Purpose of this paper The purpose of this paper is twofold, to explore what causes returns in distant selling through examining return reason codes and their distribution. Further to investigate, how and if Returns Management, especially return avoidance and gatekeeping can be applied to a mail order / e-commerce organisation.
Design/methodology/approach A single organization case study, designed with both quantitative and qualitative strategies, was used to explore the relatively unobserved area of consumer returns. The results have been evaluated and discussed with different managers from the company under study, to substantiate authenticity and trustworthiness. Findings The paper presents interesting insight into the field of consumer returns in a distant setting. It shows that a considerable amount of returns are size and fit related as one might expect. However it also presents interesting results that a quite large percentage of returns are dependent on consumers i.e. not collecting deliveries etc.
Research limitations/implications The presented study provides a starting-point for further research in the mail order/e-commerce business. Practical implications When deciding a strategy for how to handle the problems of returns it is of outmost importance to consider why customers are returning. The returns avoidance process is perhaps the most efficient and effective way of reducing return costs, understanding customer requirements are an important ingredient in this. What is original/value of paper Most studies within the field of returns focus on products or the efficient handling of returns. This study focuses on understanding what causes returns through examining order and returns data, especially return reason codes.
Keywords: Returns Management, Avoidance, Gatekeeping, Reverse logistics, Case study

2
1. INTRODUCTION Consumers’ are not buying products they buy benefits (Christopher, 2005), if that statement is true, which it undoubtedly is, organization involved in the increasing e-commerce business should therefore utilize their close contact with the end-user and really try to understand why returns are steadily increasing. Return rates varies by industry (Rogers and Tibben-Lembke, 1998), across all industries they range from 3 to 50 percent of all shipments (Norek, 2002) and the average return rate for online apparel sales is as high as 35 to 40 percent. Problems caused by returns are high costs due to manual processing. Inadequate visibility and tracking of returns results in returns arriving at returns processing centres without any advance knowledge causing bottlenecks and inventory imbalances. Further, poor gatekeeping system fails to safeguard the returns system from returns that are not supposed to enter it i.e. unauthorised returns or products where value cannot be recaptured. Another problem is consumer dissatisfaction caused by poor returns system performance with inadequate visibility and tracking from the consumers’ side awaiting a credit or refund.
Research about the reverse flow in earlier days focused merely on planning and controlling the vertically integrated chain of events with the main focus on efficiency (de Koster et al., 2002; de Brito and van der Laan, 2009). Today the focus have opened up to cover areas such as Returns Management where an extended approach with return avoidance and gatekeeping lets one work proactively to avoid returns and to gatekeep the return system from “unwanted” returns (Rogers et al., 2002). Avoiding (preventing) returns is probably the most cost efficient way of reducing returns costs (authors note), previous research have focused on ease of use and improved quality issues as returns avoidance.
According to Christopher (2005), a common failing in business is to “assume we know what our customer’s want” or becoming divorced from the reality of the market place. Hjort (2009) argues that returns are dependent on, among other things, consumers age, lead-time and order entry i.e. mail, phone or web order. This implies that end users might have different demands on both products and service delivery whereas return avoidance could be addressed from a service perspective. Consumers in the market place are more demanding than ever (Christopher, 2005) and that demand does not seem to be uniform or constant. Today traditional mail order companies as well as other distance selling enterprises are experiencing more demanding consumers, demanding in the sense that they are forcing companies to improve their competitiveness in order to outperform their “rivals” in the creation of logistics advantage. At the same time evidence of e-commerce/ mail order organizations that segment consumers and offers differentiated service is lacking despite that the “one size fits all approach according” according to Hjort (2009) fails to support the requirements from end-users. Supply Chain Management (SCM) is a recognized concept that deals with the integration of key business processes from the consumer all the way back or upstream to the suppliers’ supplier. The more supply-oriented depiction of the network or chain, probably, facilitates certain businesses and even parts of the distant selling or e-commerce. However the development from mail order towards e-commerce together with an increased competition and risen consumer demands, perhaps calls for a more demand or consumer oriented integrated approach. Demand Chain Management (DCM) with the focus on the Consumer Insight process might just be “the enabler” that connects the supply side with the demand side through an increased understanding of the “wants and needs” that the more supply driven SCM sometimes fails to support.

3
There are four main forces on a value chain that influence the amount of returns that are created, the first and direct force is due to Regulatory or legislative forces that relates to both environmental concerns and public interests. The next force creates returns indirectly through competitive reasons mainly via increased competition from surrounding value chains. These two forces are likely to vary in different environments. The legal systems in Europe or the EC are more or less homogenous, when it comes to distant shopping they are more or less the same but there are different interpretations of the EC regulations on consumers’ rights to return as well as the producer responsibility. Below a model of the four forces that influence the amount of returns that are created in a value chain is presented.
Figure 1.1 A model of the four forces that causes returns in a value chain (adapted from (Carter and Ellram, 1998))
Within the value chain, disturbances to the equilibrium between supply and demand can cause returns. Disturbances that relates to marketing issues where demand is created and where the supply side cannot support it with the right product and service at the right time. Returns can also relate to an over supply of goods i.e. goods that are in the wrong place due to an anticipated demand or failure in understanding demand. The over supply can be a result of an competitors demand creation with the similar or same product whereas the supply side might have to reposition products in order to relocate them in another value chain where there (still) is a demand for the product. The alternative solution might be to reduce the price at current position. The same situation can be seen within a multi channel value chain where demand in one channel is low and vice versa, high in the other. In environments where competition is strong i.e. fashion and other fast moving consumer goods, end-user requirements tend to constantly evolve therefore a close interaction with the end user in order to understand shifting requirements is of great importance. Today Internet communication could close the gap between the consumer and the supplier through easier and faster transactions.
Previous research in the field had primarily focused on the return process trying to increase the efficiency of handling returns in order to decrease the burden of increased return rates. However the purpose of this paper is twofold, to explore what causes returns in distant selling through examining return reason codes and their distribution. Further to investigate, how and if Returns Management, especially return avoidance and gatekeeping can be applied to a mail order / e-commerce organisation. To avoid returns and to gatekeep the returns system from “unnecessary” returns it is important to know more about what causes returns in the first place.

4
The paper is organised as follows; first the research method is presented together with a brief description of the research process. Then the frame of reference is presented to place the study in relation to existing literature of Returns Management. After that, the case is described and it is followed by a discussion about what causes returns and how avoidance and gatekeeping could be applied theoretically to the case in order to avoid and hopefully gatekeep the system from unwanted returns. The paper ends with a conclusion and suggests areas for future research
2. METHODOLOGY The case study method was chosen to explore the relatively unknown phenomenon of consumer returns in a mail order/e-commerce setting. The case study method is suitable for indepth study of a single case using both qualitative and quantitative data (Eisenhardt, 1989; Ellram, 1996). To empirically study one organization in depth, asking questions about how, why and statistically observe who or what causes an occurrence in one “unknown setting” calls for an exploratory case study method (Ellram, 1996). The single case study research presented an opportunity to explore returns data in one organisation, to generate deep insight and presenting interesting examples of the phenomena in order to better understand it.
Case selection, the case organization is one of the largest distant selling organisations in Sweden and therefore an interesting and unique organization to study. The case organisation has a long history in the business, and where willing to participate and to support the study with empirical data (quantitative) exported from their system. Quantitative data is preferred when researchers believes that an activity is occurring and the aim is an better understanding of the incidence (Ellram, 1996). The case organisations senior logistics manager (key informant) and the single researcher formed a group that together planned the research, decided what data to export and to use in a quantitative study. Further, the group of two together, decided a time frame for the study, the aim, the unit of analysis i.e. what causes returns and how to avoid and gatekeep. The information was described in a written project plan or case study protocol to increase the reliability of the study (Ellram, 1996; Yin, 2003). The research commenced in 2007 with informal conversational interviews with the company’s senior management about returns. These conversational interviews continued throughout the project and the researcher visited the company on numerous occasions during the more then a yearlong research project. To carry out research on a logistic system, interdisciplinary by definition (Kovács and Spens, 2005) using any known approach, calls for a structured but mixed methodology with both qualitative and quantitative strategies. The data collection contained three major phases; first informal conversational interviewing with key informants was conducted throughout the study. Secondly the organisation had performed certain returns projects and the reports and secondary data from these projects were distributed to the researcher. Thirdly historical order data from 1/7/2006 to 1/6/2007 and returns data from 18/9/2006 until 27/9/2007 were exported as text files and contained over 2,5 million orders, over 10 million units, more then half a million returns and approximately 1,5 million returned units. All data was imported and stored in a database during the project. The data exported contained all customer order data during the time of the study i.e. no sampling except that the data represented only Swedish customers’. The different time frame for the two data sets (sales and returns data) depends on that it takes a certain time for customers’ to return. Consequently we had to expand the time frame into September 2007 in order to collect all returns from orders in May 2007.

5
Modern logistics is based on holistic and systemic thinking and uses cross-functional approaches and it should be reflected in published research as well (Näslund, 2002). Triangulation entail using more than one method or source of data in the study of social phenomena to increase the validity (Bryman, 2008). During the study, conversational interviews were held with key informants from different functional areas from the case organisation i.e. assortment, marketing, logistics etcetera. The use of informants can be utilized during quantitative research (Jick, 1979).
3. FRAME OF REFERENCE The change from early product recalls to today’s returns management has evolved from being merely a company activity within a logistics network to an important Supply Chain Management key process. There are a number of terms and definitions that try to define the reverse flow of products, closed-loop supply chain management, reverse logistics or simply returns. Returns management is defined as:
“The part of supply chain management that includes returns, reverse logistics, gatekeeping and avoidance.” (Rogers et al., 2002, p. 5)
The above definition is used in this report and the broader approach of returns management, compared to other definitions, lets one discuss the problem of returns, not just the reverse flow, and work proactively with avoidance and thereby avoid future returns.
3.1. Avoidance Avoidance aims at finding ways to minimize return requests or returns by developing and selling product in such as manner. It is this activity that differentiates returns management from earlier reverse logistics, due to the fact that when successfully applying avoidance, the returns are not sent backwards and could by definition not be reverse logistics (Rogers et al., 2002, p. 9). The ways of executing avoidance may differ; improved quality, better information or instructions, and better service are some common applications.
Improved quality is understood in terms of reduced number of defect products, better instructions or information in the sense that the consumer/user understands both what he/she is purchasing as well as how to operate it. This could be in combination with better service, e.g. the retailer or seller makes a home visit and installs computer equipment and educate the user. This is a service offered to “ONOFF’s” customers, both to visitors to the shop as well as Internet buyers. Extra Film is trying to avoid certain returns, new customer that place an extraordinarily large order are contacted before the order is executed to ensure that no mistake has been done from the customer side. “Black & Decker” integrates returns and product development to learn from previous returns in order to avoid future returns (Rogers et al., 2002). For online or catalogue retailers product consistency is a critical issue, as traditionally many returns are results of sizing and fit issues. “Victoria’s Secrets” returns management team works with their suppliers to apply sizing guidelines across all products in a uniform manner. This reduces costs and improves customer satisfaction (Rogers et al., 2002).
3.2. Gatekeeping Gatekeeping is the guarding of the entrance of the returns flow. The main activity is to screen return requests and the returned item. A requested return can be assisted with (avoidance) better information or training in the usage of the product and thereby avoided physically. Gatekeeping assures that only returns that are allowed may pass the entry and are then guided

6
to the correct point. Properly executed, gatekeeping improves the disposition of returns, reduces cost, and increases customer satisfaction. Normally it is applied at the entry but can be applied to more than one place in the returns flow (Rogers et al., 2002).
3.3. Returns Organizations need to assess all possible returns and find the best returns procedure for them all. A consumer return should be treated differently, depending on the cause of return. If it is not caused by the consumer the best procedure might be to put extra effort to reconcile with the consumer and thereby reduce the harm caused. Returns that are associated with quality issues require procedures that incorporate product development, production and suppliers.
Returns are sprung out of many possible reasons, depending on the position in the supply chain and the nature of the product. The Global Supply Chain Forum together with the authors of the article The Returns Management Process (Rogers et al., 2002, p. 3-4) defined five types of returns.
Consumer returns are perhaps the group that is toughest to handle due to the fact that it is difficult to know and therefore plan the efficient execution of the return. The reason for returning is often defect products or simply buyers’ remorse. Others are fit, size, not collected or that consumer do not understand how to properly use the products; referred to as non-defective defectives (Rogers and Tibben-Lembke, 1998). Marketing returns are products returned from a position downstream in the supply chain, often due to slow sales, quality issues, or when a manufacturer purchases a retailer’s stock of competitors’ products. It could also be a producer and retailers, who push out their brand, at the same times as they mark down their products if the consumer returns a similar used product, often from a competitor. The enterprise “Bröderna Nyman” in Länghem Sweden used this system in 2006 and 2008 and the products that were collected from consumers were then donated to charity. Using marketing returns then becomes a way of both increasing sales and positioning the brand in favour of competitors. Asset returns are products (assets) that one wants to see returned; it can be expensive assets such as oil drilling equipment or less expensive reusable containers or pallets (Rogers et al., 2002). Autoliv” in Vårgårda in Sweden uses collapsible boxes to deliver airbags and other safety equipment to their customer in a closed-loop system and collects the collapsed containers, as they deliver new products in a back-haul system. These containers are relatively expensive and used only when the closed-loop functions properly. When delivering in areas such as the automotive industry in Russia other options are evaluated, due to the fact that the risk of losing expensive containers is too high. Product recalls are returns, which normally are initiated because of safety or quality issues. Industries that are susceptible to these types of returns, automotive or food industries have to develop both a system to inform customers as well as an efficient handling system. Since 1966, American automobile manufacturers are forced, by law, to expeditiously notify purchasers of their cars, regarding defects that relates to motor vehicle safety (Hoffer and Wynne, 1975). It is around this time that researchers started to publish articles that relates to what today is known as product recalls, returns, reverse logistics etc.
“Biltema”, initially a large automotive spare-part dealer in Sweden, which today has broadened its product range, found that a wooden toy they sold might break if dropped from a height of 1.5 meters. No customer had reported breaking the toy; it was discovered when an employee dropped the toy. They conducted a voluntary recall of the product, informed the

7
customers via the Internet and gave them the option to bring the product back to the nearest store for full refund. Environmental returns are caused by environmental regulations. It can contain both hazardous material or waste or non-hazardous material or waste such as used packaging material etc. In the European Union (EU) producer responsibility has been adopted since long. In Sweden producer responsibility spans over five areas: cars, electronic appliances, packaging material, newspapers and tires. This means that the importer or producer of these products must pay for the collecting and recycling of the products sold on the market.
3.4. Reverse logistics Reverse logistics deals with the physical flow of material from a typical final destination. It was first driven by environmental or green issue (Rogers and Tibben-Lembke, 1998). The main reason is to try to recapture value from it or, as a last resort, its proper disposal. It is simply the planning, implementing and controlling of the physical flow of returns. The reverse flow is nowadays incorporated in some logistics definitions, and there are a number of definitions of reverse logistics. One definition, often used and referred to, is the following:
”The process of planning, implementing, and controlling the efficient, cost effective flow of raw materials, in-process inventory, finished goods and related information from the point of consumption to the point of origin for the purpose of recapturing value or proper disposal (Rogers and Tibben-Lembke, 1998).”
3.5. The operational Returns Management process It is the realization of the process developed at the strategic level (Rogers et al., 2002) it has six sub processes.
It all starts when a return request is initiated from the returning part, customer, consumer or other entities downstream. The consumer can submit the request via Internet, mail, phone or return it together with the item returned via mail. This is normally the entrance to the return flow and here gatekeeping should occur when the request is received in order to close the gate for unauthorized returns. At this stage return avoidance can be applied i.e. inform the user how to operate it or to receive information about quality issues and to check products before they are delivered. Once a request is received and accepted, the routing of the return is planned according to guidelines and policies, at this stage the information about the returned shipment is forwarded to other entities in the receiving end.
The third sub process is the receiving of the returned shipment. At the receiving point i.e. return centre in-house or external, the products need to be verified, inspected and processed.
The fourth stage is to select disposition, rules from the strategic level are used to determine what to do with the product. Depending on the product type it could include refurbish, remanufacture, resell, recycle etc. Depending on the nature of the return, other Supply Chain Management processes might have to connect with the returns management process i.e. order fulfilment etc to se to that the returner is properly taken care of or the demand management process that recoverable products are taken care of.
Once the returns have been processed the returner has to be credited or supplied with an exchange product. The final step is to analyse returns and measure performance and to identify avoidance opportunities. These opportunities should then be used to improve both products and other processes.

8
4. CASE DESCRIPTION
4.1. Ordering from the Case organization The end-user can place order via e-mail, web, phone, and fax and via normal mail using an order-form delivered with the catalogue. Customer orders were distributed in three ways, if everything was on stock the normal promised delivery lead-time during the time of the study was 7-9 working days. If a unit or so was unavailable on stock and replenishment was expected near in time the company might place the order in a “wait stage” so the shipment could be delivered in full. Otherwise a part delivery was made and the rest was sent later. It was revealed that the returns percentages for shipments were not independent on age, lead-time and order entry (Hjort and Larsson, 2009).
4.2. Quantitative study To learn about the reasons behind returns and to somehow avoid future returns it is essential to learn from history. The quantitative study was meant to do so and to enlighten researchers as well as practitioners about the hidden story behind returns by exploring return data. The study was divided into two parts, the first part concerning return percentages etcetera, was published during the Nofoma Conference in 2009 (Hjort and Larsson, 2009). This paper or the second part of the study concentrates on the distribution of registered return reasons and whether or not the consumer placed a new order when returning. Orders and return data are presented in Figure 4.1 the return percentage was considered confidential and therefore indexed against the mean return percentage.
Figure 4.1 Descriptive graph over order-, return figures and indexed return level over customer age
in years.
From the Figure 4.1 above it seems that curve representing returns have a slight skew to the left compared to the curve representing orders. It indicates that younger customers are more frequent returners which supports the first part of the study presented by Hjort and Larsson (2009).
4.3. The return process The case organisation delivers a pre paid return freight slip and a printed return form together with all outgoing shipments. The stipulated allowed return time for the Swedish end-user is 14 days from the day of delivery i.e. collecting the parcel at the drop off point or receiving it via mail. The returning end-user is asked to fill in the return reason using return codes on the

9
printed return form and to send it back together with the return shipment. The returning end-user is the one that takes the risk while returning i.e. if something happens to the shipments during the redistribution the end-user has to face the loss. Depending on the weight or the size of the return it could be returned through the normal mail or, for large/heavy items, via the same drop of point where it was picked up. From the drop of point it will be collected via distributors milk runs to the nearest distribution centre, and later transported in bulk shipments to the case organisation once a day when collecting the outgoing shipments. Depending on the returner’s geographical location this process might take 3-5 days.
4.4. Product groups There were 62 different product groups in the return data in this second study. Each group could contain more than one product. It is difficult to give an exact description of the products returned, and therefore statistics are given per group. The number of returns per product group is presented in Figure 4.2 below.
Figure 4.2 Frequency of returned product groups
The most frequent group is number 35, which contains clothes for women. Group number 32 (denim) is in second place and 12 (swim and beach wear), 34 (blouses, tops and shirts) third and 60 (shoes and boots) fourth place. All are products with sizing and fit concerns that in Rogers’s (1998) research used to have high return rates.
4.5. Return reasons When returning the returner is asked to fill in a pre printed return form and to fill in the returns reason code that best fits the reason for returning. The return reason code could be of great help when analyzing return reasons, if the code is representative for the actual reason behind returning, which we might assume that it does but there is no guarantee for that. To give the return reason is optional for end users and there is a possibility for misinterpreting the return reason and the description of it from customers as well as from the employee using it. There are several types of return reason codes, cf. Figure 4.3 below, the nine found most frequent in the study are presented in the figure below. Too small is the most frequent return reason, and it represents over 20 % of all returns see Figure 4.3 further down. Fit reasons are

10
the second most frequent return reason and it stands for approximately 18 % of all returned items. Not collected and too large are almost equal when it comes to return percentage. Too large is somewhat expected however not collected creates serious problems to the case organisation and the magnitude was quite unexpected. Other reason was found, during interviews, to be the code that the return handling personnel at the case organisation, marked if the customer did not present any return reason and it is therefore difficult to use in the study. Regret/wrong ordering represents approximately 12 % of all returns and falls in the group of interesting reasons to investigate further. The remaining three reasons, not consistent with text or picture, other/delivery and finally defect are considerably lower percentages of total returns but still interesting. The defect returns represent a group that should not be allowed to enter the returns flow as they only add costs when handled and transported.
Figure 4.3 Frequency of return reasons code
Hjort and Larsson (2009) indicated that consumers age and returns were not independent and to test if there are similar patterns, the return reason codes was plotted against consumer age. The six plotted curves, cf. Figure 4.4 below, seem to have a similar curvature, although it seems that all curves, except too small have a slight skew to the left, meaning younger customers are more frequent returners.
Figure 4.4 Return reason codes over customer age in years.

11
Not collected, regretted/wrong ordering and not consistent with text or picture are plotted together, cf. Figure 4.5 below, because of the shapes of the curvature. All curves are well to the left of the more centred ones in the Figure 4.1 and Figure 4.4.
Figure 4.5 Return reason codes over customer age in year, plotted to present the skew to the left
73% of returns “not collected” come from the cash on delivery payment type, 14% account customers and 9% from monthly invoice customers. 21 percent of all non collected returns comes from new or first year customers, 10 percent from second year and then it decreases further to 5 percent for year three and so on. The cash on delivery payment deliveries are held in the drop-of point for thirty days if not collected. After that non-collected shipments are sent upstream towards the case organisation. The result is that the case organisation has a “virtual ware-house” for a considerable amount of time.
5. DISCUSSION Returns are a central part of the e-commerce/ mail order business and it is not likely that all returns can be avoided, however an increased understanding of the return system including how end-users returns, the system performance etcetera presents plausible improvements opportunities. The first and perhaps most important in today’s business climate is to better understand the requirements on the system as seen from the end-users. We have presented certain result that indicates that some end-users, preferably the younger are responsible for not collected, regret/wrong ordering and seem to believe that the information provided about products are insufficient.
The case organisations performance regarding returns presents certain opportunities for improvements. Gatekeeping does not exist today because all returns are collected and transported all the way to the warehouse before they are inspected etc. The returns reasons showed that around 2 % of the returns that were sent back were in fact defects. Consequently if there is no gatekeeping there is no way of ensuring that value is recovered during the returns process. The logistics manager at the case organisation calculated the cost of an individual return to approximately SEK 70. 2 % defect returns out of 1.5 million returned items ends up with approximately SEK 2 million and possible savings if the information and goods are separated and returns routed accordingly. Separating the information flow from the goods flow results in several avoidance opportunities where the case organisation can develop procedures and rules where the “system” reacts if return figures are higher than “normal” and to activate a quality check etc.

12
before shipping new “returns”. As presented in section 3.5 the gatekeeping should be occur at the entrance of the return flow. It is apparent that younger customers especially the ones ordering via the web are more frequent returners. If this is a result of product misfit, consumer behaviour, competition etc. or a combination of different reason we might never know. However, it should be possible to avoid certain returns if the case organisation better understood what demands the consumers have on products and services. Collecting return reasons are one way of following return trends and to indicate the performance, but they are quite broad if one wants to improve and to avoid future returns. Subjective interpretations of the meaning of the reason code is inherent in the system, using metrics to measure performance, the measurement must measure something that the consumer perceives valuable.
6. CONCLUSIONS Research has shown that the case organisations customers’ return behaviour varies and that younger customers’, to a greater extent, tend to regret or not even pick up the delivery from drop of points. A large percentage of non collected deliveries are connected to the cash on delivery payment system and all these mentioned return reasons are clearly not product related an therefore the reason for returning is vital to know better in order to avoid some of them.
It has been stated en previous research (Hjort and Larsson, 2009) that returns are not independent of customers age and delivery lead-time. Utilizing the one-size fit all delivery system without any deeper interaction with the customer at the point of ordering regarding individual requirements might be affecting the return rates described. The non-existing returns information system does not facilitate the gatekeeping process, as the guardian of the return entrance is open for any return i.e. the value recovery of the returns are not guaranteed. To be able to apply the gatekeeping function the case organisation probably has to invest in a system that facilitates the separation of goods and information flow together with a possibility for customers to register returns on the web. The standardized paper return form that is used to day to retrieve return information and return codes are to broad to present a proper return reason so that returns might be avoided in the future. The same codes are used for every product resulting in that fit and size issues are reported in the same way for shoes and clothes etcetera. A web solution facilitates more return information and codes that are better suited for different products.
Returns avoidance and Deman Chain Management have certain things in common, return avoidance could mean:
“developing and selling the product in a manner that return requests are minimized”
(Rogers et al., 2002) A suggestion for future research is combine avoidance and DCM The increased competition could also be addressed using DCM meaning a more differentiated approach towards customers and their service requirements. It is probably one of the reasons perhaps the most important reason why returns are created. It is quite likely that customers have different needs and wants and they might even vary over time.
Returns Management, especially avoidance and gatekeeping can be applied to mail order/e-commerce businesses and thereby increase the system efficiency through avoiding unnecessary returns flow.

13
REFERENCES Bryman, A., 2008. Social research methods, Third ed. New York: Oxford University Press. Carter, C.R. & Ellram, L.M., 1998. Reverse logistics: A review of the literature and
framework for future investigation. Journal of Business Logistics, 19 (1), 85-102 Christopher, M., 2005. Logistics and supply chain management, 3rd ed. London: Prentice
Hall. De Brito, M.P. & Van Der Laan, E.A., 2009. Inventory control with product returns: The
impact of imperfect information. European Journal of Operational Research, 194 (1), 85-101
De Koster, R.B.M., De Brito, M.P. & Van De Vendel, M.A., 2002. Return handling: An exploratory study with nine retailer warehouses. International Journal of Retail & Distribution Management, 30 (8), 407 - 421
Eisenhardt, K.M., 1989. Building theories from case study research. Academy of Management Review, 14 (4), 532-550
Ellram, L.M., 1996. The use of the case study method in logistics research. Journal of Business Logistics, 17 (2), 93-138
Hjort, K. & Larsson, J., 2009. Avoiding returns in distant selling through differentiating customers and their service delivery. Proceedings of the 21st Annual Conference for Nordic Researchers in Logistics, 2009, Jönköping, Sweden, 349-364.
Hoffer, G.E. & Wynne, A.J., 1975. Consumer responses to auto recalls. Journal of Consumer Affairs, 9 (2), 212
Jick, T.D., 1979. Mixing qualitative and quantitative methods: Triangulation in action. Administrative Science Quarterly, 24 (4), 602-11
Kovács, G. & Spens, K.M., 2005. Abductive reasoning in logistics research. International Journal of Physical Distribution & Logistics Management, 35 (2), 132-144
Norek, C.D., 2002. Returns management making order out of chaos. Supply Chain Management Review, 6 (3), 34
Näslund, D., 2002. Logistics needs qualitative research – especially action research. International Journal of Physical Distribution & Logistics Management, 32 (5), 321 - 338
Rogers, D.A., Croxton, K.L., Garcia-Dastugue, S.J. & Lambert, D.M., 2002. The returns management process. International Journal of Logistics Management, 13 (2), 1
Rogers, D.S. & Tibben-Lembke, R.S., 1998. Going backwards reverse logistics trends and practices Pittsburgh, Pennsylvania: Reverse Logistics Executive Council.
Yin, R.K., 2003. Case study research: Design and methods, 3rd ed. Thousand Oaks CA: Sage publications.


Paper III


Service delivery requirements of mail-order/ e-commerce customers
Klas Hjort*, Håkan Torstensson**, Hanna Aronsson***, Hanna Näslund****
*) School of Engineering, University of Borås, 501 90, Borås, Sweden E-mail: [email protected], Tel: + 46 33 435 40 00, Fax: + 46 33 435 40 08
**) Swedish School of Textiles, University of Borås, 501 90, Borås, Sweden E-mail: [email protected], Tel: + 46 33 435 40 00, Fax: + 46 33 435 40 09
***) School of Engineering, University of Borås, 501 90, Borås, Sweden E-mail: [email protected], Tel: +46 70 308 70 56
****) School of Engineering, University of Borås, 501 90, Borås, Sweden E-mail: [email protected], Tel: +46 76 855 73 87
ABSTRACT Purpose of this paper - Traditionally, mail order and e-commerce organisations view the consumers as one entity, meaning there is no differentiation of service. Research has shown that return levels depend on both age and lead-time, and consequently end user requirements are of great interest. This study investigates expected lead-time service requirements of one organisations mail order/e-commerce customers and measures the gap between the expected and the specified service.
Design/methodology/approach - A case study was performed with one of the leading Swedish mail order/e-commerce organisations. The descriptive study combined qualitative and quantitative data answering questions regarding the consumer’s requirements and how they vary depending on age.
Findings - The proposition that the gap between specified and expected customer service requirements varies with age and lead-time was supported, thus indicating that mail order and e-commerce organisations should work closer with their customers. They should likely segment their customers and differentiate their service delivery. Research limitations/implications - This research is based on primary data from a customer survey with answers from more than 6 000 respondents. Practical implications - The presented research results describe what service requirements regarding lead-time are, and how they vary with age for customers of one organisation. The only normative statement is that close cooperation between the case organisation and its customers is vital. How customers should be categorized and how to differentiate the service delivery will be topics of further research. What is original/value of paper - The results show that there is a gap between the customers’ service requirements and the service specified/delivered by the case organisation and that the gap varies with age as proposed.
Keywords: Customer survey, E-commerce, Mail order, Return avoidance, Consumer insight

2
1. INTRODUCTION
In the saturated market of today, consumer demands have become more salient and more influential on the supply chain. Such demands on availability, lead-time and other service-related processes are vital to understand, in order for e-commerce and mail order organisations to hit the bull’s eye. It is easy to lose track or get diverted from one’s most important task; understanding consumer demands (Christopher, (2005). Hjort (2009) concluded that in an e-commerce setting the consumers’ return levels were dependent upon delivery lead-time, age and order entry, i.e. whether consumers placed orders via web, phone or mail. This implies that other aspects than product specifics are important in the evaluation process when e-commerce customers decide to keep or return what they ordered. The fact that returns depend on both delivery lead-time and customer age indicates that service delivery might be an important determinant and that the importance varies with age. Further, Hjort argued that segmenting consumers and offering differentiated service, more in tune with consumer requirements, would increase the overall perceived value of the delivered product and service. Traditional mail order, introduced in 1879 (Johnson, 2010) in Sweden has evolved from a business that reached out to a narrow public via catalogues, distributed once or perhaps twice a year. At the time around 1950, in Sweden there were three or four major competitors all located in the city of Borås. They were competitors but helped each other and even exchanged customer registers, as their main competitor at that time was traditional retail. Since then much has changed. Today e-commerce has somewhat boomed and the traditional mail order companies have all expanded and are today a mix of mail order/e-commerce businesses. The change from mail order to e-commerce is more than a shift of marketing channels; it puts a burden on the whole business idea as such. In the start, mail order reached a narrow or local customer base with local production, later it expanded its customer base, as distribution systems were developed. Later, as the local production became too expensive, the production moved to low-cost production countries in the Baltic region. The change from local consumption and production towards expansion into Scandinavia and Europe, consumption- and production-wise, meant a greater dependence on planning, warehousing and distribution. The traditional mail order business model contains rigid and inflexible components with long production lead times, large order quantities, and production and distribution of catalogues. Successful e-commerce businesses with new systems and delivery setups offer new ways of marketing, selling and delivering products. Here the focus has shifted from a long planning horizon, i.e. from one to two seasons per year to four or six, and toward more agile solutions, based on information flow. This shift has affected how consumers perceive delivery performance of mail order/e-commerce organisations as such. Consumers with a history in traditional mail order have seen a drastic service improvement in today’s mail order. However, new customers, who move between pure e-commerce and mail order/e-commerce settings, may expect the same delivery performance wherever they order. This change in set-up has not only affected how organisations compete. It has probably affected both consumer behaviour and consumers’ service demands. When examining the delivery service, there seems to be a quite polarised view of consumers’ service requirements regarding delivery performance. The more traditional mail order side delivers with approximately one week delivery lead-time, while the more recent e-commerce organisations often deliver or ship the same day as the order is received. Delivering the same service to all consumers inherently acknowledges that all consumers have the same service requirements. On the other hand, if that is not the case, one might conclude that some consumers are over-prioritized while others

3
become under-prioritized. It is likely that pure mail order consumers do not choose between as many suppliers as the purely e-commerce consumers do, due to the number of possible competitors. It is even more likely that it is easier to find information over the Internet about new suppliers and thereby increase the supplier base. Another aspect of the abundance of possible suppliers from an e-consumer perspective is the fact that the amount of information about purchase, delivery and returns conditions, which one has to read through prior to ordering, when choosing among a multitude of suppliers, is so large that in many cases it is probably not done. The consumer might therefore expect the same or similar service, regardless of where the order is placed.
The aim of this paper is to investigate whether consumers’ service requirements vary and if it is reasonable to say that consumer segmentation and differentiated service delivery can increase the perceived value (see (Harrison and van Hoek, 2008, pp. 47)) of service delivery and ultimately reduce return levels. Previous results from the same case study (Hjort and Larsson, 2009) indicated that delivery lead-time and customer age influenced the amount of product returned. Consequently, it is interesting to investigate customer requirements regarding service, in particular delivery lead-time. Hjort (2009) indicated that returns are not independent of order entry i.e. via web, phone or traditional mail. Younger customers were more frequent web customers and older customers more frequent phone and mail customers. The average age of customers was lowest for web customers and highest for mail customers. The average return level was highest for web orders and lowest for mail orders. It is reasonable to believe that the competition is toughest in the e-commerce business, due to the amount of alternatives on the web. For the same reason, competing organisations might push their service delivery in order to attract new customers, possibly resulting in elevated consumer requirements. However this calls for the discussion whether consumers’ service requirements differ and if they even vary over time.
This paper analyses whether a mail-order/e-commerce organisation should interact closer with its consumers, i.e. create consumer insight, in order to increase the consumers’ perceived value and ultimately reduce return levels. If there is a distinct difference in consumer demands regarding service elements, such as delivery lead-time and other service aspects, then one might expect that the “one size fits all” delivery service used today does not fit all customers. It might possibly be one of the reasons why consumer returns are dependent on age, delivery lead-time and order entry as previous research has shown (Hjort and Larsson, 2009). The competition in distance selling has changed, as presented in the introduction; the amount of possible “known” alternative suppliers may therefore influence customers’ lead-time requirements. From previous research it is known that return levels are not independent of customers’ age and order entry, and at the same time the average age of web customers was shown to be comparatively low.
Proposition 1: The service demands vary between consumers and are dependent on age. Younger customers demand shorter delivery lead-time than older customers, and it is likely that younger customers even demand shorter lead-time than what is specified, when they place the order, i.e. 7-9 days. This implies a greater gap between delivered service and expected service for younger customers, compared to older ones. Proposition 2: Younger customers are aware of more alternative suppliers and order from a larger number of distance sellers, which in turn confirms a tougher competition and possibly explains different demand or service requirements.

4
2. THEORETICAL FRAMEWORK
2.1. Logistics and the service delivery The ultimate purpose of any logistics system is to satisfy customers (Christopher, 2005, pp. 45). It is essential to expose the right product at the right place at the right time. In retail stores this is done through placing products on the shelves, visible and reachable for consumers visiting the shop. In mail order/e-commerce the last portion of the distribution is performed after the order is placed, meaning that consumers are unlikely to evaluate the product and the service delivery prior to purchase. How customers perceive products and services delivered are important determinants for the failure or success for any business. Customer value is something perceived by customers, rather than objectively determined by a seller (Woodruff, 1997). Losing track of consumer demands is clearly a step on the route to failure, especially in today’s market with rising demands and increased competition. To ensure that superior customer value is delivered it is of course essential to understand consumers’ demand and keep a track on competitors’ performance. Otherwise, how could customer value be created and guaranteed? In mail order and other distance-selling businesses quality of service is crucial, especially when competitors are offering the same products in commodity segments, where products and price are easy to duplicate. Creating and offering superior customer service and out-performing competitors in how customers perceive the value delivered are key drivers of customer value and an important way to improve customer loyalty. It is argued that there are many facets of customer service, ranging from on-time delivery to after sales support (Christopher, 2005). Quality of service addresses the process of handing over the product and services to the end-user (Harrison and van Hoek, 2008).
Harrison (2008, pp. 44) argues that quality of service relates to the service delivery where the actual interaction between the customer and the service process takes place. In their simplified service quality gap model (Figure 2.1), four different gaps associated with different performance measurements are suggested.
Figure 2.1 Simplified service quality gap model (Harrison and van Hoek, 2008)
The simplified model however excludes the fifth gap, defined by Parasuraman (Parasuraman et al., 1991). Parasuraman proposed that gap 5, the customer-based measure, is a function of organisational gaps (gap 1-4). We adopt the fifth gap in this paper as we intend to measure “wanted or reasonable” delivery service performance (question 6).

5
To achieve service excellence a carefully thought-out service strategy is needed, together with an appropriate delivery system and committed personnel from chief executive and down. Customer service is a broad concept and varies between companies but can be grouped into three categories, pre-transaction, transaction, and post-transaction elements (LaLonde 1976). Pre-transaction elements relate to written company statements or policies. They are the elements that new customers relate to before deciding to do business. The transaction elements are related to the service delivery reliability, i.e. order cycle time, inventory availability, order fill rate etc. (Christopher, 2005). The post-transaction elements relate to supporting activities to the purchased items, but also to procedures for customer complaints and return issues. In setting service standards, it is easy to assume that the customers’ service requirements or needs are well known. The service requirements and ways to communicate with customers in distance selling are likely to be in the same continuous development phase as information and delivery systems. Therefore it is easy to assume that the customers’ desires or needs are known, but it is difficult to know what the competitors deliver. Even if we know what one customer wants, it is unlikely that all customers have the same requirements. Offering a standard logistics service in a market typified by variations in customer characteristics, i.e. B2C, is perhaps not enough. To meet customers’ requirements there are three main logistics service approaches to choose from. One is standardized or ‘one fits all’ with economy-of-scale opportunities. Customized logistics services to each individual customer maximize customer satisfaction and all too often the associated costs. Differentiating the logistics service for different customers with similar requirements balances the customer satisfaction and related costs and it is an important offer in a complex market (Rutten and van der Veeken, 1998). Customizing logistics programmes to different customer segments improves both effectiveness and efficiency (Mentzer et al., 2001).
Customer value depends of how the customer perceives the benefits of the product and service delivery related to total cost of ownership. For some customers this evaluation of customer value takes place at the same time as the service delivery is executed. For others it may be assessed at several occasions. Marketing the return policy, like L.L Bean with a 100% customer satisfaction guarantee, where they offer the customer to return any purchase at any time, implies that the customer actually evaluates post-transaction elements before ordering. Customer satisfaction is broader than customer service and occurs when businesses successfully fulfil their obligations towards the customer (Lambert, 2000). Satisfied customers are sprung out of fulfilling obligations and by creating customer value, which result in loyal customers and repeat purchases.
2.2. Supply Chain Management The terms “supply chain management” and logistics are often confused and viewed as overlapping, depending on the definition used (Lummus, 2001). The orthodoxy of supply chain management emphasises competitive advantage through increased operational efficiency and market responsiveness from production and distribution processes into the hands of consumers. In the late 20th and the early 21st century it was anticipated that future competition would be between chains rather than between firms (Christopher, 1998; Woods et al., 2002). The supply chain contains three major stakeholders; supplier, manufacturer and customer. Today’s business climate imposes specialisation and the focus has shifted from vertical integration towards specialisation, meaning out-sourcing of non-core business processes. The increasing globalization trend, together with increasing consumer demands, requires closer co-operation and co-ordination of material and information flow. The Global
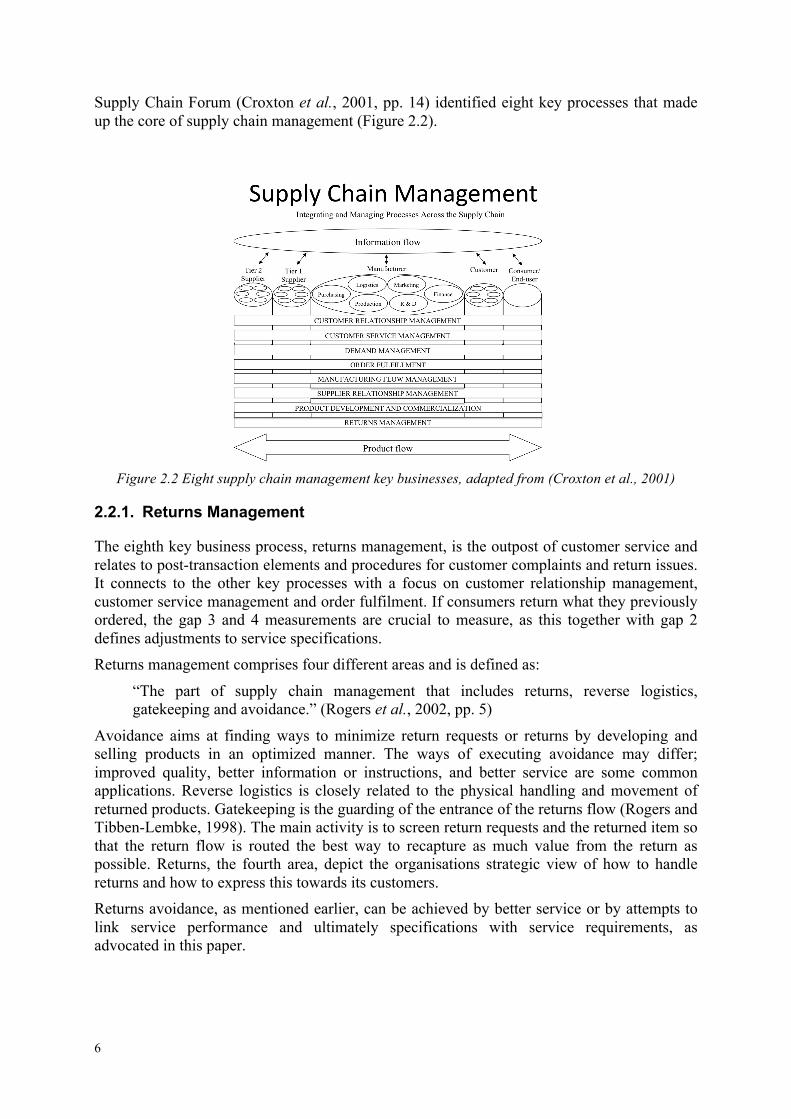
6
Supply Chain Forum (Croxton et al., 2001, pp. 14) identified eight key processes that made up the core of supply chain management (Figure 2.2).
Figure 2.2 Eight supply chain management key businesses, adapted from (Croxton et al., 2001)
2.2.1. Returns Management
The eighth key business process, returns management, is the outpost of customer service and relates to post-transaction elements and procedures for customer complaints and return issues. It connects to the other key processes with a focus on customer relationship management, customer service management and order fulfilment. If consumers return what they previously ordered, the gap 3 and 4 measurements are crucial to measure, as this together with gap 2 defines adjustments to service specifications. Returns management comprises four different areas and is defined as:
“The part of supply chain management that includes returns, reverse logistics, gatekeeping and avoidance.” (Rogers et al., 2002, pp. 5)
Avoidance aims at finding ways to minimize return requests or returns by developing and selling products in an optimized manner. The ways of executing avoidance may differ; improved quality, better information or instructions, and better service are some common applications. Reverse logistics is closely related to the physical handling and movement of returned products. Gatekeeping is the guarding of the entrance of the returns flow (Rogers and Tibben-Lembke, 1998). The main activity is to screen return requests and the returned item so that the return flow is routed the best way to recapture as much value from the return as possible. Returns, the fourth area, depict the organisations strategic view of how to handle returns and how to express this towards its customers. Returns avoidance, as mentioned earlier, can be achieved by better service or by attempts to link service performance and ultimately specifications with service requirements, as advocated in this paper.

7
3. METHODOLOGY
A single case study was performed with one of the leading Swedish mail order/e-commerce organisations. Case studies are suitable for detailed studies of real-life settings with clear boundaries such as organisations (Ellram, 1996). A single case study is appropriate, when the case in itself is extreme or unique (Eisenhardt, 1989; Ellram, 1996). The case company is one of the leading ones and has a long history in the business, and it was willing to support the study with otherwise inaccessible information and data, namely their knowledge and data about consumers. A case study is suitable for both testing and generating theory (Eisenhardt, 1989). Inductive research (Bryman, 2008) starts with empirical data and ends with theory, whilst deductive research tests existing theory. According to Ellram (1996), the combination of both quantitative and qualitative data is appropriate for case studies. Key informants from different departments were interviewed at several occasions in an unstructured manner to discuss both the questionnaire and its results. The chosen research strategy was inductive, as the research area of consumer returns within e-commerce settings is seen as an emerging area and the aim was to explore and describe consumer requirements, using empirical evidence. However, as stated earlier, the purpose of the research stems from prior knowledge about the case organisation and its problems with consumer returns, presented by Hjort (2009).
3.1. Data collection Primary data was collected primarily via an online survey, distributed via e-mail. However, some of the chosen respondents, primarily the older ones, did not have any e-mail address registered, so a group of respondents were contacted via telephone and the questionnaire was completed as a structured interview. Bryman (2008) states that mixed administration of customer surveys does not seem to generate significant differences in the replies. The respondents were selected from one of Sweden’s largest distance seller’s customer base. The questionnaire was distributed to 25 000 Swedish respondents with approximately 6 000 respondents answering, giving a response rate of 24 percent. The respondents were selected evenly over age, and randomly within age groups from customers who placed an order in the same month - July 2008.
4. CASE DESCRIPTION
The present study was conducted as a follow-up on a research project that was carried out in 2007 (Hjort and Larsson). It covered a wider range of questions, a total of 18, than the ones presented in the paper; however, the questions presented there were closely related to the findings and propositions from the previous study reported to the organisation.
4.1. Case organisation The case organisation is one of the largest distance selling companies in Sweden and therefore interesting to study. It has a long history in the business and was willing to participate and to support the study with its customer data and knowledge. Therefore a single organisation case study design with both quantitative and qualitative methods was used to describe its customers’ requirements and demands regarding service delivery. The case organisation does not differentiate its service delivery with regard to segmented customer groups and potential differences in demand requirements. During the time of the study it offered a 7-9 day delivery lead-time to customers ordering via the different entry systems; mail, web, email and phone.

8
4.2. Questionnaire The questionnaire contained a total of 18 questions; however, the paper only presents the six questions that relate to the propositions presented in section 1. The questions were presented to the respondents in Swedish and translated into English for the publication of the paper. The factors used in the questionnaire were discussed together with key informants from the case organisation and represent alternatives that could be discussed in connection with a possible differentiation of service levels. Question 1, customers’ priorities when deciding where (what company) to place the order. The respondents were asked to rank the importance of the following ten factors in terms of the top four priorities.
1. Quality
2. Price 3. Customer service
4. Friendly treatment 5. Open hours
6. Payment alternatives
7. Low fees and freight costs 8. Pick Up Place
9. Delivery lead-time 10. Return conditions
Question 2, customers’ priorities regarding delivery i.e. after deciding where (what company) to place the order. The respondents were asked to rank the importance of the following eight factors, again as identifying the top four priorities.
1. Delivery lead-time
2. Low fees and freight costs 3. Possibility to choose Pick Up
Place 4. One shipment (if stock-out, wait
until all products are available for delivery)
5. Split shipment (if stock-out, deliver what is available)
6. Delivery accuracy (keep promised delivery date)
7. Availability at Pick Up Place (open hours)
8. Products well packaged
Question 3, customers were asked to rate whether delivery lead-time is seen as not important, important, very important or crucial when ordering from the case organisation. Question 4, customers were asked how many mail order/e-commerce organisations, similar to the case organisation, they knew of. This question was meant to depict whether there was a significant difference in number of “competing” or alternative suppliers for customers.
Question 5, customers were asked how many mail order/e-commerce organisations similar to the case organisation they ordered from the last year. This question relates to question 4, if there is a significant difference in number of suppliers known and ordered from, there might be a difference in number of “suitable” suppliers, meaning difference in fulfilment of demand requirements and presumably tougher competition. Question 6, customers were asked to give their view of a reasonable delivery lead-time when they order from the case organisation.

9
5. ANALYSIS
The performed study with the case organisation’s customers has provided useful results. In this chapter the results from the performed web survey are presented and analysed.
5.1. Customers’ priorities when deciding where to place order The first question presented ten alternatives to choose from and to prioritize the top four. The highest ranking was given the value 4 and the lowest ranking the value 1, etc. The total amount of respondents per ranking and per age group were calculated and multiplied with the ranking value (1-4) and finally divided with 4 (rating options), presenting an average rating score per age group. The average rating score was then plotted within the different factors over age groups. Below (Figure 5.1) the average rating score for the factor lead-time is plotted showing a quite distinctive difference in rating, i.e. the three youngest groups give considerably higher priority to lead-time. In appendix 1, a graph presenting all factors and the average rating scores is presented.
Figure 5.1 Customers’ requirements when deciding where to place an order
Price and quality were found to be the top two priorities for all age groups, for customers up to 29 years of age low fees and freight costs, together with deliver lead-time battled for the third and fourth place. For the older customers, the third and fourth places were taken by customer service and opening hours at the pick up place.
5.2. Customers’ priorities regarding delivery In question 2 customers were asked to prioritize between eight factors and to point out the four most important ones. Delivery lead-time, low fees and freight costs and delivery accuracy, i.e. to keep promised delivery dates, were found to be the three most important factors for all age groups. The youngest customers favour low fees, otherwise it is obvious that the younger customers (up to 39) favour lead-time and the older ones (55 and over) favour delivery accuracy. It is quite clear that the importance or priority of delivery lead-time decreases with age. In appendix 1 all eight factors are presented in a graph.

10
Figure 5.2 Customers’ priorities regarding delivery
5.3. Customers rating delivery lead-time Question 3 is about customers’ rating of delivery lead-time. One of the most obvious differences between the age groups is the lack of “not important” in the two age groups representing the youngest customers and the lack of representation of “crucial” in the age group representing the oldest customers, cf. Figure 5.3. Another evident difference is the decrease of “very important” with age and conversely the increase of the lower priority, i.e. “important” with age.
Figure 5.3 The importance or priority of delivery lead-time over age groups
5.4. Number of known mail order/ e-commerce organisations’ The customers were asked to pinpoint the number of alternative suppliers similar to the case organisation that they knew of. In the proposition of this paper it was stated that one possible reason why younger customers are more frequent returners is that they have a greater number of possible alternatives to choose from, meaning that this could influence their demand requirements as such. Similar to the results of the previous questions; cf. figure 5.3, there was found a decrease with age of the percentage of customers with ”11-20” alternative mail order/e-commerce locations, and the opposite for the ”6-10”, i.e. an increase with age. This indicates that younger customers, to a higher extent, has a larger number of alternatives than the older customers. Similarly, the number of customers with ”21 or more” alternative

11
suppliers peaks at the group representing the youngest customers. The amount of customers with ”1-5” alternatives peaks för the second youngest customer group.
Figure 5.4 Number of known alternative suppliers similar to the case organisation, as stated by their
customers.
5.5. Number of mail order/ e-commerce organisations’ ordered from Similar to question 4, here the customers were asked how many mail order/e-commerce organisations they have ordered from the last year. It is evident that the amount of alternatives that younger customers actually ordered from is much smaller than the amount of known ones. In the graphs (5.4 and 5.5), the shape looks identical for customers between 45 and 64, while there seems to be a greater difference for customers on either side, i.e. younger and older.
Figure 5.5 Number of mail order/e-commerce organisations’ ordered from during the last year
5.6. Reasonable delivery lead-time The final question addresses reasonable or wanted delivery lead-time in days, as presented by the customers. As mentioned earlier, the case organisation at the time of the study stated the delivery lead-time to be between seven and nine days on average. The results from question 6 strongly indicated that there was a difference in requirements and that the younger consumers demand a shorter lead-time. To verify the results a box-plot was performed and the results

12
indicated that there was a difference when analysing the median values. A one-way analysis of variance (ANOVA) was performed in order to rule out that the difference in requirements was not a random variation and to test if there in fact was a statistically significant dependency between age and lead-time requirements. The ANOVA results showed that with a 99.9% certainty there was a significant dependency between lead-time requirements and consumers’ age to a significance level of 0.000. The values in the customer survey are not normally distributed, which limits the ANOVA applicability. Using exponents to transform the data, which might result in a lower reliability of significance, can solve this. We have a level of possible error for significance below 0.1%, which makes the result still trustable.
To be able to measure the difference in lead-time requirements we used the simplified gap model presented in Figure 2.1. The model measures four different gaps, however gap 1 identifies possible adjustments to the service specifications as presented below in order to increase perceived customer value and the creation of loyal customers, (see (Harrison and van Hoek, 2008, pp. 47)). The conducted customer survey, question 6, covers customers’ service requirements regarding lead-time. In Figure 5.6 the gap between specified and wanted delivery lead-time is plotted as a dotted curve. The lead-time value specified by the case organisation was 7-9 days and is plotted as an average value of 8 days. The median value is measured from the respondents’ answers to question 6. It is obvious that almost all age groups demand (negative values gap 1) shorter delivery lead-time than specified from the case organisation.
Figure 5.6 Gap between specified service (delivery lead-time) and wanted lead-time
However, by measuring gap 5 (Parasuraman et al., 1991) and extending it to cover non-customers and their demands on service delivery, it would be possible to reach out to a wider customer base.
Lead-time should perhaps not be seen as an isolated factor with an absolute causality relation to returns. However previous results (Hjort and Larsson, 2009) show that the percentage of returns is not independent from lead-time, indicating a degree of causality.
6. CONCLUSION
There is a new trust in logistics and supply chain strategy that facilitates revenue generation as opposed to only cost reduction (Ballou, 2006). The understanding of consumer demands regarding service delivery in distance selling facilitates both cost reduction and revenue generation. Knowing the actual delivery lead-time demands of individuals or consumer

13
segments makes the operational planning and execution of service delivery more effective and efficient. Striving for an “average” service demand level, without any connection to the actual demand requirements, produces an over- and under-prioritized delivery of service, without any guarantee for revenue generation, but surely increased cost, as returns levels (in certain contexts) depend on both age and lead-time (Hjort and Larsson, 2009).
In Figure 6.1 below, the difference between the known numbers of alternatives and the number of suppliers ordered from is presented. The similarities between the two graphs are much greater for customers between 40-64 years of age than for the younger and older customer groups, see Figure 6.1.
Figure 6.1 Difference between the number of stated known alternative suppliers (Question 4) and the
number of suppliers ordered from (Question 5)
The negative values in the graph in Figure 6.1 imply that the number of stated suppliers ordered from is greater than the number of known ones. The opposite goes for the positive values, and the two sides of course have to balance each other to zero. However, the interesting part is that all the positive values represent the greater number of alternatives, i.e. 11 or more with one exception. Do customers older than 75 years order from more suppliers than they know of? Consequently the greater negative values found in the group of younger customers indicate a possibility that even though they know a greater amount of alternative suppliers, only a few of these suit their purpose. It may also mean that they use Internet in a way that makes them find a greater number of alternatives.
The reasons for returns are of course individual and perhaps even for the returner sometimes difficult to express. It is reasonable to say that at some occasions this depends mainly on the product, sometimes on price or on lead-time. Selling and distributing products over the Internet or via catalogue without knowing what the consumer requires in the sense of service delivery etc. will produce ineffective and inefficient delivery of service and products. This paper presents results from a customer survey from one case organisation that show that there are distinct differences in requirements from the consumers, which ultimately supports the results from a previous study. There are results that indicate that the case organisation should benefit from a more synchronised service delivery, in tune with the consumer demands. Delivery lead-time is of course not the only determinant of whether consumers return or not. However it was quite obvious that price and quality were the most important factors from the results presented in question 1. Returns directly influence the price paid for products, as the cost of handling returns are paid by all customers, whether they return or not. Thus if a long lead-time creates returns, it also increases price.

14
Measuring gap 5 or the “customer based measure” (Parasuraman et al., 1991) and extending it to cover consumer insight, meaning understanding both consumers and non-consumers, facilitate both increased perceived customer value and loyalty. This is a way to increase the customer base. Proposition 1: The service demands vary between consumers and are dependent on age. Younger customers demand shorter delivery lead-time than older customers, and it is likely that younger customers even demand shorter lead-time than what is specified, when they place the order, i.e. 7-9 days. This implies a greater gap between delivered service and expected service for younger customers, compared to older ones. The presented results indicate that proposition 1 holds Figure 5.6 presents the measured gap between wanted and delivered service delivery. The service requirements seem to vary with age and the gap is grater (negative) for younger customers. Proposition 2: Younger customers are aware of more alternative suppliers and order from a larger number of distance sellers, which in turn confirms a tougher competition and possibly explains different demand or service requirements. There are some indications inline with proposition 2 but not as conclusive as we believed before the study. So the results from the study does not support the proposition fully, however the results are not conclusive enough to fully reject proposition 2 either. How can these results be generalized to other populations outside the sample population i.e. case organisation? Strictly speaking we cannot generalize beyond the population (Bryman, 2008). However it is quite likely that cases with similar settings have similar varying customer requirements and would benefit from investigating their customers’ requirements.

15
REFERENCES Ballou, R.H., 2006. Revenue estimation for logistics customer service offerings. The
International Journal of Logistics Management, 17 (1), 21-37 Bryman, A., 2008. Social research methods, third ed. Oxford: Oxford University Press. Christopher, M., 1998. Logistics and supply chain management, 2nd ed. London: Prentice
Hall. Christopher, M., 2005. Logistics and supply chain management, 3rd ed. London: Prentice
Hall. Croxton, K.L., Garcia-Dastugue, S.J., Lambert, D.M. & Rogers, D.S., 2001. The supply chain
management processes. International Journal of Logistics Management, 12 (2), 13-36 Eisenhardt, K.M., 1989. Building theories from case study research. Academy of Management
Review, 14 (4), 532-550 Ellram, L.M., 1996. The use of the case study method in logistics research. Journal of
Business Logistics, 17 (2), 93-138 Harrison, A. & Van Hoek, R., 2008. Logistics management and strategy, 3rd ed. London:
Prentice Hall. Hjort, K. & Larsson, J., 2009. Avoiding returns in distant selling through differentiating
customers and their service delivery. Proceedings of the 21st Annual Conference for Nordic Researchers in Logistics, 2009, Jönköping, Sweden, 349-364.
Johnson, A., 2010. Postorderhandeln [online]. http://www.mercurius.nu/skarp/index.php?main=3&id=37&type=article [Accessed 2010-03-26.
Lambert, D.M., Burduroglu, Renan, 2000. Measuring and selling the value of logistics. The International Journal of Logistics Management, 11 (1), 1-18
Lummus, R.R., Krumwiede, Dennis W., Vokurka, Robert J., 2001. The relationship of logistics to supply chain management: Developing a common industry definition. Industrial Management & Data Systems, 101 (8), 426 - 432
Mentzer, J.T., Flint, D.J. & Hult, G.T.M., 2001. Logistics service quality as a segment-customized process. Journal of Marketing, 65 (4), 82-104
Parasuraman, A., Berry, L.L. & Zeithaml, V.A., 1991. Perceived service quality as a customer-based performance measure: An empirical examination of organizational barriers using an extended service quality model. Human Resource Management, 30 (3), 335-364
Rogers, D.A., Croxton, K.L., Garcia-Dastugue, S.J. & Lambert, D.M., 2002. The returns management process. International Journal of Logistics Management, 13 (2), 1
Rogers, D.S. & Tibben-Lembke, R.S., 1998. Going backwards reverse logistics trends and practices Pittsburgh, Pennsylvania: Reverse Logistics Executive Council.
Rutten, W.G.M.M. & Van Der Veeken, D.J.M., 1998. Logistics service management: Opportunities for differentiation. The International Journal of Logistics Management, 9 (2), 91-98
Woodruff, R.B., 1997. Customer value: The next source for competitive advantage. Journal of the Academy of Marketing Science., 25 (2), 139-153
Woods, E.J., Wei, S., Singgih, S. & Adar, D., 2002. Supply chain management as beyond operational efficiency. In Drew, R. ed. Proceedings of the international symposium on tropical and subtropical fruits, vols 1 and 2. Leuven 1: International Society Horticultural Science, 425-431.

16
Appendix 1
Customer priorities (all factors) when deciding where to place order over (question 2) age groups
Customer priorities (all factors) regarding delivery (question 2) over age groups