Embed Size (px)
Citation preview

Master Thesis
Autumn 2008
Lund University
Department of Economics
Returns To Education For Mexican
Immigrants To The United States
Supervisor: Inga Persson Meri Aghajanyan
Martin Nordin Tolga Erbasol
Table of Contents
1. Introduction _____________________________________ 4
1.1 Aim ______________________________________________ 4
1.2 Methodology _______________________________________ 5
1.3 Data _____________________________________________ 5
1.4 Outline _____________________________________ 5
2. Theoretical Framework _______________________ 6
2.1 Rate of return to schooling ___________________________ 6
2.2 The Mincer’s earnings function _______________________ 8
2.3 Modifications of Mincer/Becker in the case of migration ___ 10
2.3.1 Transferability _________________________________ 10
2.3.2 Country-Specific Human Capital ___________________ 12
2.3.3 Discrimination _________________________________ 12
2.4 Signalling/ Sheepskin Effects _________________________ 13
2.5 Summary _________________________________________ 14
3. Mexican immigration to the United States ________ 15
3.1 Survey of earlier studies _____________________________ 15
3.2 Characteristics of Mexican immigrants to USA ___________ 17
3.2.1 Geographical location ___________________________ 17
3.2.2 Language skills ________________________________ 17
3.2.3 Educational attainment __________________________ 18
3.3 The impact of Mexican immigrants on the U.S. economic growth and labour
market ___________________________________________________ 19
4. Data and Method ____________________________ 20
4.1 The sample ________________________________________ 21
4.2 The estimating equation ______________________________ 22
5. Regression analysis ___________________________ 23
6. Conclusion __________________________________ 25
7. References __________________________________ 27
Appendix ____________________________________ 30
2
Abstract
This thesis is about returns to schooling for Mexican immigrants to the United
States. The United States became the home of many immigrants. There is an
evidence that large amount of immigrants in USA are from Mexico. They are
among both oldest and newest inhabitants of the nation. Mexican immigrants and
their descendants now make-up a significant portion of the US population and
have become one of the most influential social and cultural groups in the country.
But many studies found that immigrants from Mexico show lower levels of
educational attainment, which leads to lower earnings. Our aim is to focus on
returns to schooling for Mexican immigrants to the United States using the
Mincer’s earnings function. Using Current Population Survey (CPS) data, we
analyzed the differences in returns to schooling between native Americans and
Mexican immigrants. And also we investigated whether there are Sheepskin
effects or not. We found that there are positive Sheepskin effects for both Mexican
immigrants and native Americans. But still there is a difference in rate of return to
schooling for natives and Mexican immigrants, namely the rate of returns to
schooling for Mexican immigrants is lower than for natives.
Key words: Mexico, immigration, human capital, returns to schooling, USA
3

1. Introduction
The United States became the home of many immigrants. There is an evidence that
large amount of immigrants in USA are from Mexico. They are among both the oldest
and newest inhabitants of the nation. Mexican immigrants and their descendants now
make-up a significant portion of the US population and have become one of the most
influential social and cultural groups in the US. But many studies found that
immigrants from Mexico show lower levels of educational attainment, which leads to
the lower earnings comparing with native Americans. Another important fact why
earnings are lower for Mexican immigrants is that English language is not their first
language and it is well known that proficiency in English may exert much influence
on how successfully they fare in living new lives in the United States. English
deficiency is likely to make it difficult to transfer skills obtained in Mexico to the
United States’ labour market. Mexican immigrants in US labour market may have
limited employment and training opportunities. And also lack in English proficiency
face discrimination in the US labour market. In addition, long-term structural changes
in the US economy have increased the importance of education, making high-school
completion a minimum requirement for any individual to compete successfully in the
labour market. (Chiswick and Miller, 2002; Ibarran and Labotsky, 2005).
1.1. Aim
The aim of this paper is to focus on returns to schooling for Mexican immigrants in
the United States in comparison with the native Americans, namely estimating so-
called Mincer earnings function. Furthermore, we investigate whether there are so
called Sheepskin effects, i.e. whether having a degree or not affects earnings.
4
1.2 Methodology
The econometric models estimated in the thesis are based upon research by J.
Mincer (1974). In our labour market approach we will employ the panel regression
model to investigate the relationship between the dependent variable, which is the
wage rate and the five explanatory variables: years of schooling, the potential labour
market experience and its square, years since migration and its square. We will
compare the Mexican immigrants performance in the United States labour market
with that of the natives. We have performed the regressions in the statistical software
SPSS.
To perform the econometric estimations, the study is based upon the
methodology of ordinary least squares (OLS). This method adjusts a line to the real
observations by minimizing the residual sum of squares. This estimation technique
has certain assumptions1 that need to be investigated in order to avoid misleading
inference.
1.3. Data
The data to estimate the above model is taken from the Integrated Public Use
Microdata Series-Current Population Survey (IPUMS-CPS) over the period 2000-
2007. IPUMS-CPS is an integrated set of data from the Current Population Survey.
The CPS is a monthly U.S. household survey conducted jointly by the U.S. Census
Bureau and Bureau of Labour Statistics.
1.4 Outline
The structure of the thesis is the following.
1There are assumptions in the Econometrics area, called Gauss-Markov assumptions, which state that the expected value of the
error term is zero, which means that the regression line should be correct. The next, second, assumption states that error terms
have the same variances, which is referred to as homoskedasticity, while the third assumption imposes zero correlation between
different error terms. This is excludes any form of autocorrelation.(Verbeek, 2005)
5

Section 2 presents a theoretical framework connected to the theory of human capital
and migration, particularly the evolution of the earnings function. The third section
presents the characteristics of Mexican immigrants to the USA (their geographical
origin, language skills, education), earlier studies that have been done within this area,
and the impact of Mexican immigrants on the US economy and labour market. The
fourth section presents the econometric model specification used in the study and
description of the data. This section is followed by a description of the empirical
analysis and a discussion of the results concerning the returns to education for natives
and Mexican immigrants. The final section contains the conclusions from our study.
The table with the definition of the variables is included in the appendix.
2. Theoretical Framework
In this section we will present the theoretical framework of our study, namely the
human capital theory and economics of migration. Furthermore, we will see how
these theories can be empirically implemented via the Mincer’s earnings equation.
2.1 Rate of return to schooling
Human capital is the notion that individuals acquire skills and knowledge to increase
their value in labour markets. Experience, training and education are the three main
mechanisms for acquiring human capital, with education being primary for most
individuals. The amount of education acquired by workers has an important impact on
their labour market outcomes. The most direct way that education affects the labour
market outcome of workers is by increasing their productivity, thus increasing their
earnings. The more education individuals acquire, the better they are able to absorb
new information, acquire new skills and familiarize themselves with new
technologies. By increasing their human capital, workers enhance the productivity of
their labour and the other capital they use at work. If higher levels of productivity
reflect higher levels of human capital, which are in turn primarily a result of increased
education, then a positive relationship should exist between educational attainment
and earnings. Individuals provide the majority of the resources for human capital
6
investment through their own financial resources and the time spent acquiring
additional education. A high school graduate, when considering college, will factor in
the costs of education as well as the benefits. The cost of education borne by the
student consists not only of tuition and other direct costs but also of forgone earnings.
The costs and benefits associated with declining to acquire a bachelors degree are
represented in the diagram below. This diagram illustrates two possible earnings
streams facing a high school graduate. The costs associated with college attendance
includes both indirect and direct costs of college. And also gross benefits show the
increase in earnings that a college graduate would be expected to receive over the rest
of his or her worklife. Deciding whether to invest requires comparison of the present
value of future benefits with direct and indirect costs. Benefits consist of the
difference between the two earnings profiles, ∆Y. The present value of these benefits
discounted at rate i will be approximately.
PV(i) ≈ ∆Y/i
It is expected that an individual would attend college if the present value of the costs
is less than the present value of the benefits.
The investment criterion is usually stated in terms of the internal rate of return (IRR),
which was defined as that interest rate which just equated the costs and benefits. Thus,
the interest rate that equates the present value of the returns to the present value of the
cost is the internal rate of return.
PV(IRR) = ∆Y/IRR=Cost
On this criterion, the highest IRR would be considered the best.(Polachek, 1993)
7

Diagram 1.
Age
Indirect costs
Direct costs
Gross benefits
Y Earnings/ Bachelor degree
Earnings
Y Earnings/ High school degree
Source: S.W Polachek and W.S. Siebert, 1993.
2.2 The Mincer’s earnings function
The Mincer’s (1974) earnings function is the prime analytical tool when it comes to
empirically implement the human capital theory. It is the framework used to estimate
returns to schooling, returns to schooling quality and to measure the impact of
differences in work experience on e.g male-female wage gaps. This equation has
become the cornerstone of empirical researches on earnings determinations. In the
most widely used version of Mincer’s human capital earnings function log earnings
are modelled as the sum of a linear function of years of education and a quadratic
function of years of potential experience:
LnY= β0 + β1S + β2T + β3T2 + u
Where S indicates the number of years of schooling, T gives the number of years of
labour market experience, T2 is a quadratic on experience and Y is the wage rate.
8

β0 is related to initial earnings capacity, β1 is the rate of return to education, β2 and β3
are related to both the amount and the financial return to on-job-training, u is the error
term.
Mincer’s earnings function yields at least three important empirical implications. The
first is that earnings levels are related to human capital investments. This means that
the more human capital investments an individual makes the higher his or her
earnings. Second, the earnings function is concave2. It implies that earnings rise more
quickly for the young, then earnings growth decreases gradually in the middle ages.
The third is related to the social return which highlights any spillover effects and
includes transfers and taxes.
According to the general approach of earnings function described above, we can
present separate human capital earnings functions both for natives and immigrants
and look at differences in returns to schooling for each group.
LnYN= β0N + β1NCN + uN (1)
LnYI= β0I + β1ICI + uI (2)
Where, for simplicity, number of years of schooling, number of labour market
experience, quadratic on experience, years since migration and quadratic on years
since migration are summarized by C, and YN and YI represent the wages for natives
and immigrants respectively, subscripts N and I are for natives and immigrants
respectively, uN and uI are the error terms. If we add the term β1N(CN-CI) to both
equations (1) and (2) and subtracting eq. (2) from eq. (1) we will obtain the following:
LnYN – LnYI = (β0N- β0I)+ β1N(CN-CI)+CI (β1N- β1I)+(uN-uI) (3)
The terms in equation (3) can be represented in diagram 2 below and be interpreted as
follows: first, the term β1N(CN-CI) in eq. (3) measures the differences in the mean
values of all the variables in C when these are valued at natives’ prices (β1N). Second,
the term CI (β1N- β1I) measures the higher prices (β1N- β1I) that natives receive, which
illuminates possible discrimination. Finally, the term (β0N- β0I), which is the intercept,
it is the unexplained part of the difference in earnings which also might reflect
discrimination.
2 The earnings function concavity resulting from the negative β3 coefficient found when estimating equation. This result is the
same across countries and years, i.e T2 coefficient is almost always negative. This means that earnings rise at a decreasing rate
throughout one’s life.
9

Then, discrimination, D, (in the diagram 2 below) measured at native’s prices will be
D1= (β0N- β0I) + CI (β1N- β1I).We can equally add β1I(CN-CI) to both eq. (1) and eq. (2)
which would have showed the prices received by immigrants. Then discrimination
would be measured as D2= (β0N- β0I) + CN (β1N- β1I). As we can see from the diagram
below D1 would be lower and D2 would be greater.(Borjas, 2008)
Diagram 2.
Y Natives
YN
Β1N(CN-CI)
D2
D1
Immigrants
YI
β1N-β2I β1I(CN-CI)
C
Source: Borjas G., 2008 CI CN
2.3 Modifications of Mincer/Becker in the case of migration
2.3.1 Transferability
Chiswick (1978) was the first to argue that, for the same number of years of
schooling, the ability to convert schooling into earnings might differ between the
10
foreign-born and the native-born. This argument implied that immigrants would be
unable to transfer completely the human capital accumulated in their home country to
the labour market of the destination country. To analyze this aspect of immigration,
Chiswick developed the phrase international transferability of skills. International
transferability of skills can be viewed as a function of similarities in the labour
markets of the home country and the host country, taking into account schooling and
language which are two important indicators. Schooling has an origin-specific
component and an internationally transferable component. These two components
differ by the level and the type of education attained by the immigrants. The more
skills acquired through schooling in the origin, the greater the transferability to the
destination. Becker (1967) developed a model of optimal schooling. The model
explains the following: the individuals face a demand and supply schedules. The
demand schedule reflects the marginal rate of return on investments in schooling and
a supply schedule reflects the marginal interest cost of obtaining funds to finance the
investment in schooling. Optimal investment occurs when the marginal rate of return
on investment equals the marginal interest cost of funds. Chiswick (1999) interpreted
Becker’s model in the case of racial and ethnic groups. Chiswick argued that group
differences in investment in schooling might arise from either differences in demand
conditions or differences in supply conditions or from their combination. He further
maintained that group differences in demand conditions vary more than group
differences in supply conditions, which in turn implies a positive relationship between
levels of schooling and rates of return from schooling.
Based on the above discussion the theoretical demand for schooling equation for
immigrants can be expressed as a function of both pre-immigration conditions and the
post-migration experience of immigrants. Pre-immigration conditions and post-
migration experience play important role in immigrants schooling investment
decisions because they affect the level and the transferability of skills that immigrants
bring with them. While pre-immigration condition includes age at immigration,
country of origin and pre-immigration educational attainment, post-migration
experience is associated with immigrant duration in the destination country. For the
foreign-born total schooling has two components schooling acquired before and
schooling acquired after migration. Post-migration experience is usually measured by
duration in the destination country. If post-migration investments are made, they
occur in the first few years after immigration and diminish thereafter. (Hashmi, 1987).
11
According to Chiswick (1999) the model of immigrant adjustment based on human
capital theory suggests that the economic status of immigrants improves with their
duration of stay, that is immigrant assimilation in the host country is positively related
to length of stay.
2.3.2 Country –Specific Human Capital
Among immigrants, educational attainment will differ by country of origin.
Immigrants to the US from non-English speaking countries will exhibit a higher
demand for investments specific to the US but will be handicapped by their lesser
proficiency in English.
Language is an important component affecting transferability of skills since the lower
the immigrant’s fluency in the destination language, the lower the transferability of
the origin country skills. Furthermore, the lower an immigrant’s transferability of
skills, the greater the incentive to invest in destination specific human capital because
of the positive effect that destination country education has on increasing the
transferability of origin country skills. (Trejo, 1997)
2.3.3 Discrimination
Differences in returns to education may arise from discrimination in access to quality
schooling and in the labour market. Discrimination in the access to quality schooling
will lower the human capital stock and rates of return to number of years of schooling.
Discrimination in the labour market will generally lower earnings and rates of return
from schooling. Even if labour market discrimination is neutral with respect to skill,
that is if it results in the same percentage fall in earnings for all levels of schooling,
the rate of return is lowered3. Discrimination in the labour market is the usual
explanation for the lower measured rates of return from schooling received by the
immigrants. (Borjas, 2008; Smith and Welch, 1986)
3This arises so long as the private direct costs of schooling do not decline with discrimination.
12
2.4 Signalling/Sheepskin Effects
Sheepskin effects, also known as credential effects, refer to an increase in labour
market earnings associated with the completion of a diploma or degree, such as high
school or university graduation. In the labour economics literature the relationship
between earnings and education is one of the most important areas for empirical
estimation. According to the human capital approach the positive correlation between
education and earnings can be investigated with only the total number of years of
education as an educational variable (observed skill).On the other hand, studies on
screening theories of education argue that degrees, indeed have an independent
implication for the returns to education. As mentioned above in the labour economics
literature, the earnings function is used to investigate the determinants of earnings,
more specifically the earnings-education relationship. According to that application of
the Mincer equation, earnings are considered as a function of the years of education
variable as a proxy of human capital variable (observed skill variable.). This means
that the estimated return to education represents the return to human capital. On the
one hand, the theory of human capital is concerned with the role of learning in
determining the returns to education. It is assumed that years of education, used as
observed skill variable, is the only relevant variable to determine earnings together
with experience and demographic variables. Diploma or credentials should have no
independent effect on the earnings of a worker. However, this human capital approach
is criticized. If diplomas or credentials have no relevant implication on earnings, there
would be no difference in earnings between those with a similar number of years of
education who complete a program and those who do not. (Ferrer and Riddell , 2001).
In contrast to that vision, screening (signalling) theory of education, shows another
way in order to display what determines the earnings of a person. Other studies
consider whether education might be used merely as a signal of worker quality rather
than as a tool to enhance productivity. Employers are held to screen potential
employees using educational qualification as a guide to potential productivity. Job
seekers use their educational achievements to signal their productivity potential to
employers. Screening theories of education, while allowing for learning, suggest that
better- educated individuals earn more because education serves as a credential which
signals higher productivity (Arrow, 1973). With the help of empirical studies the
13
question whether a diploma or credential has an independent impact on earnings, can
be illuminated. One implication of the signalling model is the existence of sheepskin
effects, i.e. returns to diploma over and beyond the additional year of education.
(Melissa, 2006). This type of modelling does not deny the effect of years of education
on the earnings of workers but they highlight that also diploma has an additional
effect on earnings. The insight of this theory suggests that the main function of
education is to serve as a signalling or elimination device to show which employees
are more productive than the others. Nonetheless, an alternative sheepskin effect
model also suggests that education has no effect on earnings. According to that view,
it is proposed that if one does not finish and acquire an educational degree, the years
of education has no effect on that worker’s income. This view is counted as pure
credentialist approach. Following this theory, it is predicted that only the acquisition
of diplomas trigger an increase in the worker’s earnings so that a sheepskin effect
exists. (Melissa, 2006)
2.5 Summary
As we mentioned earlier in our paper our purpose is to estimate the earnings function
with additional high school and bachelor degree dummy variables and look at the
effects. Further in our empirical results we will analyze the results based on the
theoretical part discussed in section 2. Main focus will be on the questions such as:
a) Differences in the rate of return to schooling, that is we will estimate our
equations and will look at the differences between slopes β1N and β1I as
described in section 2.
b) Sheepskin effects, namely we will analyze whether sheepskin effects exist in
the case of natives and Mexican immigrants according to our regression
results.
c) All these analyses will be done separately for men and women.
14
3. Mexican immigration to the United States
In this section we will give a brief history of Mexican immigration to the USA by
means of a survey of earlier studies that have been done within this area. We will also
give a brief outline of the characteristics of Mexican immigrants in the United States
in terms of their geographical location, language skills and educational attainment.
Finally, we will describe the impact of Mexican immigrants on the United States
labour market and economy.
3.1 Survey of earlier studies
Legal and illegal migration to the United States and within the region will continue to
rise. Despite declining population growth and strong economic prospects in Mexico,
persistent poverty and large wage differentials will further fuel large-scale emigration
to the United States. By far the most important source for immigration to the United
States is Mexico. By 2003, 10.2 million Mexicans or almost 9% of the Mexican
population had migrated to the United States. They are also among the most
economically disadvantaged workers in the nation. In 1989 Mexican-origin
households earned on average, 27% less than non-Hispanic white households, 37%
less than Asian households and 3% more than black households. (U.S. Census, 1990)
Chavez (1991) argues that the large inflows of recent immigrants from Mexico create
a deceptively pessimistic picture of Mexican-origin workers in the US labour market.
In her view, US born, English-speaking Mexican Americans have enjoyed rapid
progress over the last couple of decades and are approaching the labour market status
of non-Hispanic whites. In contrast to this, Chapa (1990) sees little evidence that
Mexican Americans are making steady progress toward economic parity with Anglos
and he worries about the emergence of a Chicano underclass with many of the same
problems faced by inner-city blacks. Borjas and Katz (2005) use the US census data
to provide a sweeping account of the evolution of the Mexican born workforce in the
United States. The empirical analysis of Borjas and Katz yields a number of
interesting findings. They find that the large differences in educational attainment
between native-born workers and Mexican-born immigrants accounts for nearly 75%
15

of the very large wage disadvantage suffered by Mexican immigrants in the US
workforce. Borjas and Katz also estimate a structural model of labour demand and
show that Mexican immigration has affected the earnings of less-educated native
workers in recent decades. In fact, they find that practically all of the predicted
reduction in the real wage of high school can be traced to the depressing wage effects
caused by the increase in the supply of low skill workers attributable to Mexican
immigration. Blau and Kahn (2000) provide a study of the assimilation of Mexican
immigrants in the US labour market. They examine the relationship between gender
and assimilation in labour supply and wages both within and across generations. Blau
and Kahn (2000) find that there is a much more traditional gender division of labour
in the family in Mexico than among Mexican immigrants in the United States.
Women in US of Mexican origin have considerably lower labour force participation
and higher fertility than their ethnic counterparts in the United States. Another
interesting finding has been made by Ibarraran and Labotsky (2005). Their main goal
is to assess empirically if Mexican migrants are, in fact, positively or negatively
selected. Using data from the 2000 Mexican and US Censuses, they examine how the
educational attainment of Mexican migrants to the United States compares with the
educational attainment of the Mexican workforce who choose to remain in Mexico.
Their main finding is that low-skill Mexicans are more likely to migrate to the United
States than high-skill Mexicans. They also show that the degree of negative selection
among emigrants is larger in Mexican counties where workers typically face higher
returns to education. Borjas (1996) in his paper uses the 1970, 1980 and 1990 Public
Use Samples of the US Census to document how Mexican immigrants perform in the
US labour market and finds that there has been a decline in the relative wage of
Mexican immigrants in the past 30 years. He shows that even after adjusting for
changes in the wage structure between 1970 and 1990, the entry wage of Mexican
immigrant cohorts declined by about 9% in the 1970s and by about 7% in the 1980s.
In fact, Borjas finds that there is little convergence between the wages of Mexican
immigrants and the wages of native workers. And also, much of the wage gap
between Mexican immigrants and natives Borjas explained by the very low
educational attainment of the Mexican immigrant population
.
16

3.2 Characteristics of Mexican immigrants to USA
3.2.1 Geographical location
Mexican immigration into the United States has ranged as high as one million a year.
By 1950, nearly 39.1 % of Mexican immigrants lived in Texas and 40.3% in
California. By 1980, almost 60% of Mexican immigrants lived in California and the
fraction of those living in Texas had further declined to 21.2%. By 2000 the fraction
of Mexican immigrants living in California had declined to 42.1% and nearly 14.8 of
the California workforce and 10.9 of the Texas workforce are Mexican-born. Also
almost 3% of the Mexican immigrants was located in North Carolina and Georgia by
2000. Similarly, less than 1% of workers in Colorado were Mexican born in 1980. By
2000, almost 5% of Colorado’s workforce was Mexican-born. The growth of Mexican
immigrants is dramatic especially in California. In 1970, only 2.4% of California’s
workforce was Mexican-born. By 2000, this statistic had increased sixfold, to 14.8%.
(Borjas and Katz, 2005)
3.2.2 Language skills
Since 1965 the US has seen increasingly large numbers of immigrants crossing its
borders. The 1990s saw more immigrants enter the US than any previous decade.
(INS, 1999). A disturbing corollary to the recent explosion in immigration is the
corresponding decline of immigrant wages relative to the wages of natives. As a
prime example, Mexican immigrants now outnumber any other national group while
having one of the biggest relative wage gaps, with Mexican immigrant males earning
on average 50% less than native males. (Trejo, 1997).This wage differential is a
problem. Mexican immigrants tend to be segregated from the rest of US society, some
42% of Hispanics lived in predominantly Hispanic neighborhoods in 1990 (Chiswick
and Miller, 1999). This is because immigrants feel most comfortable living with those
who speak their language and share their culture. In fact, the language deficiency is an
important determinant of the wage gap between Mexican immigrants and US natives.
There is an evidence that Mexican immigrants who do not speak English at all earn
only about half of what Mexican immigrants who speak very well earn (Trejo, 1997).
17

Language deficiency prevents Mexican immigrants from being rewarded for their
human capital investments. English language deficiency prevents immigrants from
making use of their acquired human capital in the US labour market. This could be
because poor English skills force Mexican immigrants into ethnic neighbourhoods
where labour demand might be low or it could be simply because a college degree
means little to an employer if the potential employee cannot speak English. And the
English language is an important enough determinant of income to explain a very
large portion of the immigrant-native wage gap. (Trejo, 1997)
3.2.3 Educational attainment
Mexicans are less likely to participate in any postsecondary education and have some
of the highest poverty levels of all immigrant groups. According to the 1999 US
Census, Mexicans had the lowest proportion of high school diplomas of all groups, at
50%. In 1990, of the Mexican immigrants aged 15-17, only 25% were in school,
nearly 20% fewer than that of any other immigrant group, and 17% lower than natives
of Mexican origin. Only 7% of the Mexican American population has bachelor
degrees, as compared to about 26% of the foreign and native born..(Gray, et. al,
1996). In fact, Mexicans in the US are the largest and poorest immigrant group. They
participate and succeed in higher education at lower levels than other immigrants and
natives of the US.
3.3 The impact of Mexican immigrants on the U.S. economic
growth and labour market
The impact of Mexican immigration on the United States has been a major focus of
policymakers and the public for well over a decade now. During the 1990s the
number of Mexican immigrants living in the US rose by more than 5 million. By the
2000 Census, Mexican immigrants made up more than 4% of the working age
population. The growing importance of Mexican immigrants in the labour force has
18
catalyzed a research and policy debate regarding their impact on wages and
employment outcomes of US born workers. American employers in a wide variety of
industries, however, clearly recognize the value of Mexican immigrant workers. US
industry has hired and continues to seek to hire large numbers of Mexican workers
due to significant worker shortages in America, fueling a dramatically increased role
for Mexican immigrants in the national economy. For American employers, Mexican
immigration plays a critical role in efforts to maintain a sufficiently large pool of
workers in part because of the close match between the needs of employers and the
job readiness of Mexican immigrant workers. In fact, by 2010 some 24.7 million jobs
will open up for persons with minimal education levels and these jobs will represent
nearly 43% of all projected openings. As citizens of a developing nation, many
Mexican immigrants may have relatively low levels of formal education, but they
have the necessary skills that are compatible with numerous jobs being created in the
US. Furthermore, Mexicans experience pressures to emigration in search of jobs
because of high unemployment in their home country. Under this, Mexican
immigrants are an obvious source of recruits for American employers. (US Census
Bureau, 2001).
The impact of immigrants on labour market outcomes for natives depends on the
substitutability between natives and immigrants. If immigrants and natives are perfect
substitutes, an increase in the supply of immigrants will lower wages for natives. On
the other hand, if immigrants and native workers are not gross substitutes for each
other, but rather, are complements in production, then an increase in immigrants’
inflow into the labour market could raise the wages of native workers, if the latter
reallocate into occupations with higher wages. Convention suggests that low-skilled
immigrants and natives are potentially greater substitutes for one another. This is
because low-skilled occupations tend to have lower training costs and require less
institutional knowledge. (Friedberg, 2000). Julian Betts and Magnus Lofstrom (1998)
use data drawn from the decennial censuses to study the trends in educational
attainment and subsequent earnings of immigrants relative to those of natives. An
important lesson of the empirical evidence is the importance of differences in
educational attainment between immigrants and natives, as well as among immigrant
groups, in determining wage differences among the various populations. Betts and
Lofstrom document the familiar result that the gap in educational attainment between
immigrants and natives widened between 1970 and 1990, with immigrants
19

experiencing an ever larger disadvantage. More important, they show that much of
this widening in the gap is driven by changes in the bottom half of the education
distribution with a larger number of immigrants arriving in the United States with
relatively little schooling. The analysis concludes that differences in educational
attainment can explain more than half of the observed wage gap between immigrants
and natives. Depending on the methodological approach, some studies found a
negative impact of immigrants on natives. Others found no significant impact on
natives. Card and Lewis (2005) found that inflows of Mexican immigrants into the
new metropolitan areas have had no effect on the relative wages of the very low
skilled. Rather, Mexican workers do affect relative wages for high school graduates.
They suggest that this may be due to two possibilities. First, Mexican workers may be
closer substitutes to natives with high school diploma. Second, firms may be
absorbing new inflows of low-skilled Mexican workers in local labour markets by
adjusting for skill requirements in the workplace.
4. Data and Method
The empirical analysis discussed in this paper are based on data from Current
Population Survey (CPS) over the period 2000-2007. The Current Population Survey
is a monthly US household Survey conducted by the US Census Bureau and Bureau
of Labour Statistics. The CPS provides information on employment, unemployment,
earnings, hours of work and other labour force indicators on all household members
more than 16 years old. Such data are available by a variety of demographic
characteristics including age, sex, race, marital status and educational attainment.
4.1 The sample
The total sample size of the 2000-2007 CPS is 186,841 individuals, that is 87,010
native men and 91,375 native women and 4,508 immigrant men and 3,948 immigrant
women. Because the purpose of this paper is to study the relationship between
schooling and earnings, we also exclude from the sample individuals who do not have
20
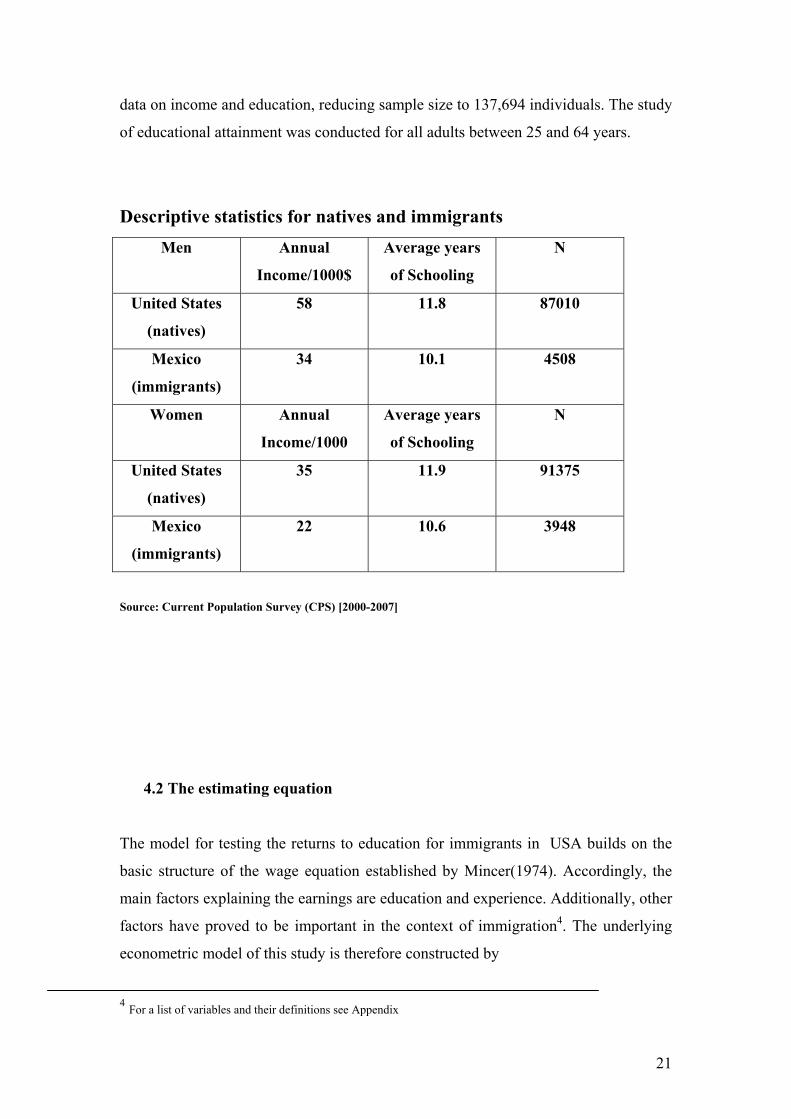
data on income and education, reducing sample size to 137,694 individuals. The study
of educational attainment was conducted for all adults between 25 and 64 years.
Descriptive statistics for natives and immigrants
Men Annual
Income/1000$
Average years
of Schooling
N
United States
(natives)
58 11.8 87010
Mexico
(immigrants)
34 10.1 4508
Women Annual
Income/1000
Average years
of Schooling
N
United States
(natives)
35 11.9 91375
Mexico
(immigrants)
22 10.6 3948
Source: Current Population Survey (CPS) [2000-2007]
4.2 The estimating equation
The model for testing the returns to education for immigrants in USA builds on the
basic structure of the wage equation established by Mincer(1974). Accordingly, the
main factors explaining the earnings are education and experience. Additionally, other
factors have proved to be important in the context of immigration4. The underlying
econometric model of this study is therefore constructed by
4 For a list of variables and their definitions see Appendix
21

Lnw= βo +β1schooling +β2potexp +β3potexp2 +β4ysm +β5ysm2 +β6X + β7E + u
Where;
w- is the wage rate
potexp – are the years of potential labour market experience
potexp2– are the years of potential labour market experience squared
ysm- are the years since migration to the US
ysm2- are the years since migration squared
u- is the error term
Since there is likely to be diminishing returns to years of experience and years since
migration, these variables are also included in quadratic form.
X includes a vector of dummies like marital status and sex and E represents a set of
dummies for completed education (high school and bachelor degree). The latter
variables are of special interest for testing the signalling and sheepskin hypothesis
discussed in section 2. For this purpose the model is estimated for four different
categories, one for native Americans with high school degree, the second for Mexican
immigrants with high school degree, the third is for natives with both high school and
bachelor degrees and the fourth is for Mexican immigrants both with high school and
bachelor degrees. This way the model allows comparing these two groups that is
Mexican immigrants returns to education with natives holding other factors constant.
To perform the econometric estimations, the study is based upon the methodology of
ordinary least squares (OLS). This method adjusts a linear line to the real observations
by minimizing the residual sum of squares. This estimation technique has certain
assumptions that needs to be investigated in order to avoid misleading inference.
5. Regression Analysis
We now use our sample to estimate earnings regression as specified in Section 4. The
dependent variable for the regression equation is the log of earnings. Three different
specifications of the equation were considered. The primary explanatory variables
22

used in all three specifications are years of schooling, potential labour market
experience and its square, years since migration and its square. The basic specification
is a simple model which used the above mentioned set of explanatory variables:
LnW= β0 + β1S + β2Exp + β3Exp2 + β4Ysm+ β5YSM2 + u (1)
Focusing on model (1) [Table 1. below] of the regression the positive sign of potential
experience with the negative sign of potential experience squared shows an increase
in earnings with the number of years of potential experience but at a decreasing rate
for both native men and native women. The effect of an additional year since
migration on the earnings of Mexican immigrants is given by the coefficients of
variables years since migration and years since migration squared. The positive
coefficients of years since migration indicate the earnings of Mexican immigrants
increase with years since migration (as it is mentioned in section 2.), in other words,
the earnings of Mexican immigrants depends on years since migration. We also used
the ysm (years since migration) as a proxy variable for English language. With this
variable we can explain the dynamics of the language adjustment process among
Mexican immigrants in the US, that is Mexican immigrants will achieve the high level
in English language along with an additional year since migration to the USA.
The remaining coefficients in the estimating equation are all highly significant. Native
Americans women’s return to schooling is 20.7% while for native men is 18.1%.
Being a Mexican immigrant woman returns to schooling is 11.8% which is lower
comparing with native women, while the rate of return for immigrant men is 17.5%
which also is somewhat lower comparing with native men.
Table 1. The relationship between earnings and schooling
Native Men
N= 87010
Native Women
N=91375
Immigrant Men
N=4508
Immigrant Women
N=3948
Intercept 6.994 (.038) 6.380 (.049) 7.578 (.086) 7.051 (.026)
Schooling 0.181 (.003) 0.207 (.003) 0.175 (.005) 0.118 (.008)
Experience 0.092 (.001) 0.068 (.002) 0.051 (.004) 0.026 (.004)
Experience2 -0.002 (.000) -0.001 (.000) -0.001 (.000) 0.000 (.000)
YSM - - 0.013 (.003) 0.019 (.004)
YSM2 - - 0.000 (.000) 0.000 (.000)
R2 0.200 0.136 0.206 0.148
Note: Standard errors in parentheses, N is the number of observation.
23
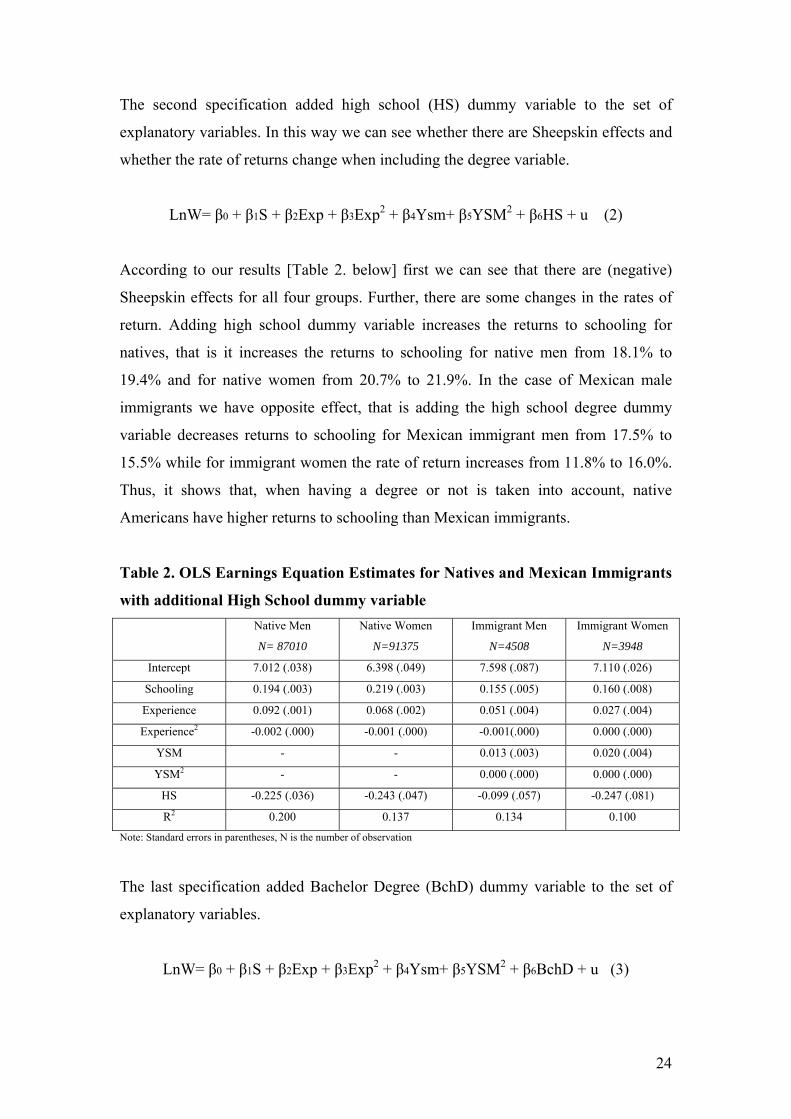
The second specification added high school (HS) dummy variable to the set of
explanatory variables. In this way we can see whether there are Sheepskin effects and
whether the rate of returns change when including the degree variable.
LnW= β0 + β1S + β2Exp + β3Exp2 + β4Ysm+ β5YSM2 + β6HS + u (2)
According to our results [Table 2. below] first we can see that there are (negative)
Sheepskin effects for all four groups. Further, there are some changes in the rates of
return. Adding high school dummy variable increases the returns to schooling for
natives, that is it increases the returns to schooling for native men from 18.1% to
19.4% and for native women from 20.7% to 21.9%. In the case of Mexican male
immigrants we have opposite effect, that is adding the high school degree dummy
variable decreases returns to schooling for Mexican immigrant men from 17.5% to
15.5% while for immigrant women the rate of return increases from 11.8% to 16.0%.
Thus, it shows that, when having a degree or not is taken into account, native
Americans have higher returns to schooling than Mexican immigrants.
Table 2. OLS Earnings Equation Estimates for Natives and Mexican Immigrants
with additional High School dummy variable
Native Men
N= 87010
Native Women
N=91375
Immigrant Men
N=4508
Immigrant Women
N=3948
Intercept 7.012 (.038) 6.398 (.049) 7.598 (.087) 7.110 (.026)
Schooling 0.194 (.003) 0.219 (.003) 0.155 (.005) 0.160 (.008)
Experience 0.092 (.001) 0.068 (.002) 0.051 (.004) 0.027 (.004)
Experience2 -0.002 (.000) -0.001 (.000) -0.001(.000) 0.000 (.000)
YSM - - 0.013 (.003) 0.020 (.004)
YSM2 - - 0.000 (.000) 0.000 (.000)
HS -0.225 (.036) -0.243 (.047) -0.099 (.057) -0.247 (.081)
R2 0.200 0.137 0.134 0.100
Note: Standard errors in parentheses, N is the number of observation
The last specification added Bachelor Degree (BchD) dummy variable to the set of
explanatory variables.
LnW= β0 + β1S + β2Exp + β3Exp2 + β4Ysm+ β5YSM2 + β6BchD + u (3)
24
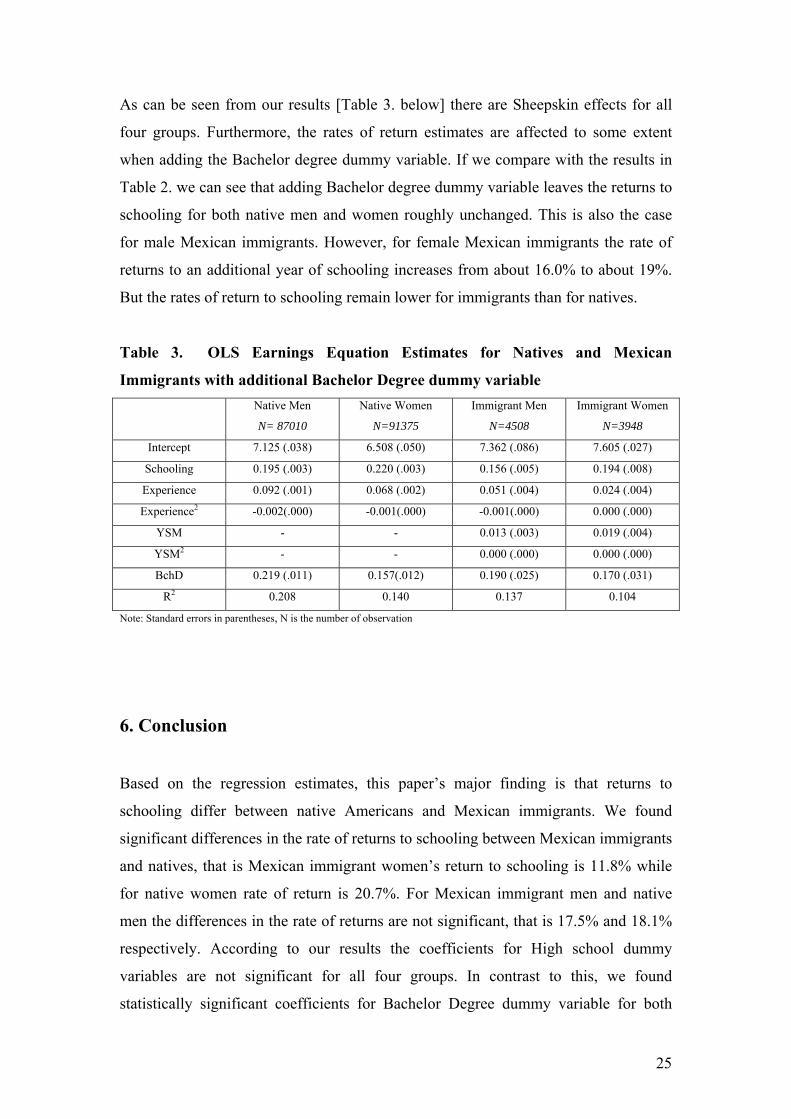
As can be seen from our results [Table 3. below] there are Sheepskin effects for all
four groups. Furthermore, the rates of return estimates are affected to some extent
when adding the Bachelor degree dummy variable. If we compare with the results in
Table 2. we can see that adding Bachelor degree dummy variable leaves the returns to
schooling for both native men and women roughly unchanged. This is also the case
for male Mexican immigrants. However, for female Mexican immigrants the rate of
returns to an additional year of schooling increases from about 16.0% to about 19%.
But the rates of return to schooling remain lower for immigrants than for natives.
Table 3. OLS Earnings Equation Estimates for Natives and Mexican
Immigrants with additional Bachelor Degree dummy variable
Native Men
N= 87010
Native Women
N=91375
Immigrant Men
N=4508
Immigrant Women
N=3948
Intercept 7.125 (.038) 6.508 (.050) 7.362 (.086) 7.605 (.027)
Schooling 0.195 (.003) 0.220 (.003) 0.156 (.005) 0.194 (.008)
Experience 0.092 (.001) 0.068 (.002) 0.051 (.004) 0.024 (.004)
Experience2 -0.002(.000) -0.001(.000) -0.001(.000) 0.000 (.000)
YSM - - 0.013 (.003) 0.019 (.004)
YSM2 - - 0.000 (.000) 0.000 (.000)
BchD 0.219 (.011) 0.157(.012) 0.190 (.025) 0.170 (.031)
R2 0.208 0.140 0.137 0.104
Note: Standard errors in parentheses, N is the number of observation
6. Conclusion
Based on the regression estimates, this paper’s major finding is that returns to
schooling differ between native Americans and Mexican immigrants. We found
significant differences in the rate of returns to schooling between Mexican immigrants
and natives, that is Mexican immigrant women’s return to schooling is 11.8% while
for native women rate of return is 20.7%. For Mexican immigrant men and native
men the differences in the rate of returns are not significant, that is 17.5% and 18.1%
respectively. According to our results the coefficients for High school dummy
variables are not significant for all four groups. In contrast to this, we found
statistically significant coefficients for Bachelor Degree dummy variable for both
25

Mexican immigrants and natives which is the fact of the existence of positive
Sheepskin effects for all four groups. But still there are differences in returns rate of
schooling between Mexican immigrants and natives. These differences in rate of
returns might be the differences in the quality of education which differ by country of
origin. Lack of English language proficiency also might be the reason for differences
between natives and Mexican immigrants. Mexican immigrants are from non-English
speaking country and might exhibit a higher demand for investments specific to the
US but will handicapped by their lesser proficiency in English. The other reason that
the differences in rates of return may arise might be the discrimination which will
generally lead to the lower earnings and rates of return from schooling in the labour
market.
26
7. Reference
Arrow, Kenneth J. (1973) ’’Higher Education as a Filter’’ Journal of Public
Economics, pp.193-216, July
Betts, J. and Lofstrom, M. (1998) ’’The Educational Attainment of Immigrants:
Trends and Implications’’ NBER Working Paper, No. W6757
Becker, G.S. (1967) ’’Human Capital and the Personal Distribution of Income,
Wyotinsky Lecture’’, No.1, Ann Arbor: University of Michigan
Borjas, G. and Katz L.F, (2005) ’’The Evolution of the Mexican-Born workforce in
the United States’’ NBER Working Paper No. 11281
Borjas George J. (1996) “The earnings of Mexican immigrants in the
United States” Journal of Development Economics Vol. 51 pp.69-98
Borjas, G. J. (2008) ’’ Labor Economics’’ Fourth Edition, Published by McGraw-
Hill/Irwin
Blau F. and Kahn L.(2000) ’’Gender differencies in Pay’’ NBER, Working Paper
No.W7732
Card D. and E.G.Lewis, (2005) ’’The Diffussion of Mexican Immigrants during the
1990s;Explanation and Implications’’ NBER Working Paper, No. 11552
Chapa, Jorge. (1990) ’’The Myth of Hispanic Progress; Trends in the Educational and
Economic Attainment of Mexican Americans’’ J. Hispanic Policy 4; 3-18
Chavez, Linda. (1991) ’’Out of the Barrio; Toward a New Politics of Hispanic
Assimilation’’. New York; Basic books,
27

Chiswick, B.R. (1978) ’’The effect of Americanization on the earnings of foreign-
born men’’ Journal of Political Economy, 86(5), 897-922, October
Chiswick, B.R. (1999) ’’Are immigrants favourably self-selected?’’ American
Economic Review, 89(2), 181-185
Chiswick, B.R., and Miller, P.W.,(1999) ’’Language skills and earnings among
legalized aliens’’ Journal of Population Economics, volume 12, number 1
Chiswick, B.R, Miller, P.W., Yew Liang Lee, (2002) ’’Immigrant’s Language Skills
and Visa Category’’, IZA DP No. 471
Clark Melissa A. and Jaeger David A. (2006) ’’Natives, the foreign-born and high
school equivalents. New evidence on the returns to the GED’’ Journal of Population
Economics, volume 19, pp. 769-793
Gray, M.J., Rolph, E. and Melamid, E. (1996) ’’Immigration and higher education;
Institutional responses to changing demographics’’ Retrieved February 3, 2003
Ferrer A.M. and Riddell W.C. (2001) ’’Sheepskin Effects and The Returns to
education’’ University of British Columbia, November
Friedberg R., (2000). ’’You can’t take it with you? Immigrant Assimilation and the
Portability of Human Capital’’ Journal of Labour Economics 18(April); 221-151
Ibarraran Pablo and Lubotsky Darren (2005) “Mexican Immigration and Self-
Selection: New Evidence from the 2000 Mexican Census” Institute for Research on
Poverty, Discussion Paper no. 1308-05
Hashmi, A.(1987) ’’Post-migration investment in education by immigrants in the
United States’’ PhD Dissertation, University of Illinois at Chicago
Mincer, (1974) “Schooling, Experience and Earnings,” New York: National Bureau of
Economic Research.
28
Polachek S.W. and W.S. Siebert, (1993). ’’The Economics of Earnings’’ Cambridge
University Press
Smith, James P. and Finis R. ,Welch (1986) ’’Closing the Gap: Forty Years of
Economic Progress for Balcks’’ (Santa Monica, CA: Rand Corp.)
Trejo, Stephen. (1997). “Why Do Mexican Americans Earn Low Wages?” Journal of
Political Economy 105 (6): 1235–1268.
U.S. Census Bureau (2001) ’’The Foreign-Born Population in the United States’’
January
U.S. Census Bureau 1990 Census of Population, Social and Economic Characteristics,
United States. Washington;Government Printing Office.1993
Verbeek, M. (2005). ’’A guide to modern econometrics ’’(2nd edition). Chichester,
England: John Wiley & Sons, Ltd.
Electronic References
Current Population Survey (CPS)
www.ipums.org
Immigration and Naturalization Services (INS) 1999, Statistical Yearbook of
Immigration and Naturalization
(www.ins.gov/graphics/aboutins/statistics/IMM99list.htm)
29
30
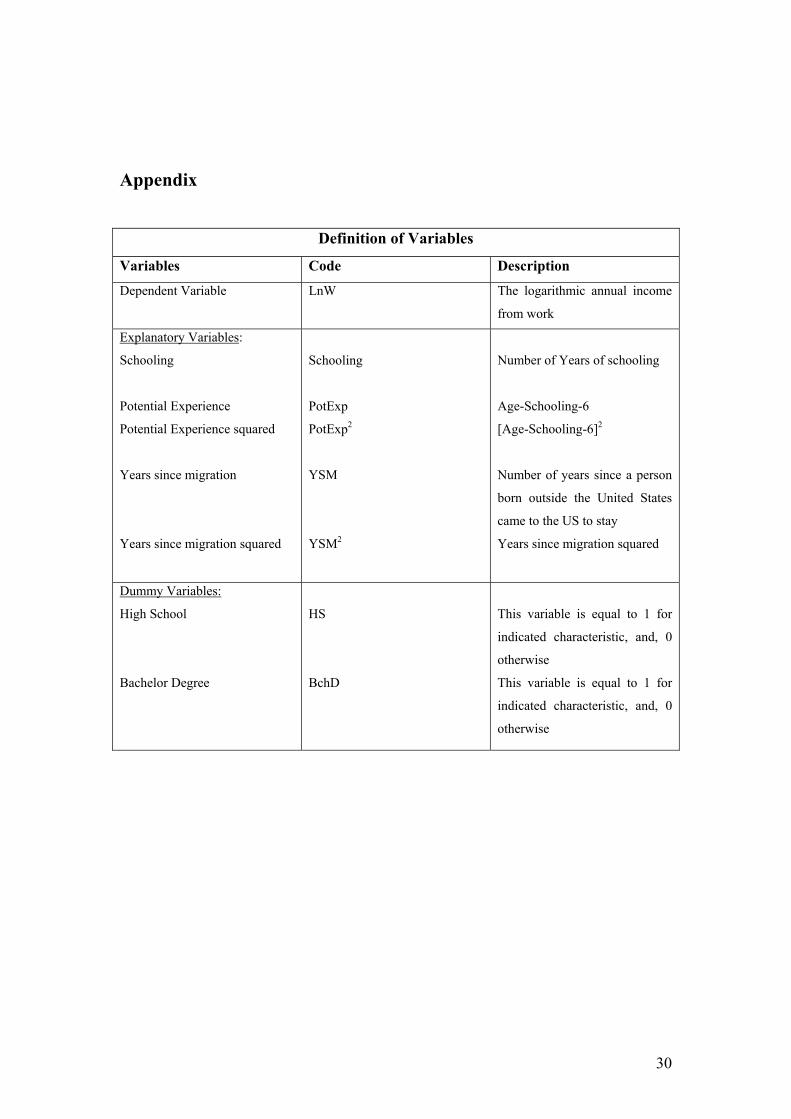
Appendix
Definition of Variables
Variables Code Description
Dependent Variable LnW The logarithmic annual income
from work
Explanatory Variables:
Schooling
Potential Experience
Potential Experience squared
Years since migration
Years since migration squared
Schooling
PotExp
PotExp2
YSM
YSM2
Number of Years of schooling
Age-Schooling-6
[Age-Schooling-6]2
Number of years since a person
born outside the United States
came to the US to stay
Years since migration squared
Dummy Variables:
High School
Bachelor Degree
HS
BchD
This variable is equal to 1 for
indicated characteristic, and, 0
otherwise
This variable is equal to 1 for
indicated characteristic, and, 0
otherwise


![MEXICAN IMMIGRANTS IN SOUTH CAROLINA: A PROFILE1].pdfThe major aims of the study were to provide a baseline profile of Mexican immigrants in South Carolina, and to establish a record](https://img.pdfslide.net/doc/110x75/5f06a3117e708231d418fbbb/mexican-immigrants-in-south-carolina-a-1pdf-the-major-aims-of-the-study-were.jpg)