Embed Size (px)
Citation preview
RETURNS TO VOCATIONAL EDUCATION IN PORTUGALSofia Oliveira, Nova SBE
Variable Estimates
Exp0.0211***(0.0006)
Exp2 -0.0001**(0.0001)
Voc0.0190***(0.0018)
Voc*Exp-0.0025**(0.0010)
Voc*Exp2 -0.0001(0.0001)
No. of observations 1 509 643
No. of individuals 553 319
𝑅2 (overall) 0.54
𝜌 0.56Source: Quadros de PessoalNote: Dependent variable: logarithm of wage. Robust standard errorsin parentheses. Significant at ***1%, **5%, *10%.
3. Variables
Explanatory variables:
Worker-related variables:‐ Type of education (𝑣𝑜𝑐=1 if vocational)‐ Age‐ Gender‐ Hours worked per week‐ Tenure in years‐ Labor-market experience in years‐ Previous experience‐ Presence in the labor market with 18, 19, 20
and 21 years old‐ Hierarchy level within the firm
Firm-related variables:‐ Industry‐ Region‐ Log of sales‐ Number of branches‐ Number of employees‐ Shares of public and private capital stock
Explained variable: log of wage
5. Results
4. Econometric Model
Estimation method: random effects.
Plus worker’s and firm’s controls.
𝑙𝑤𝑎𝑔𝑒𝑖𝑡= 𝛽0 + 𝛽4𝑒𝑥𝑝𝑖𝑡 + 𝛽5𝑒𝑥𝑝𝑖𝑡
2 + 𝛽6𝑣𝑜𝑐𝑖 + 𝛽7𝑣𝑜𝑐𝑖 ∗ 𝑒𝑥𝑝𝑖𝑡+ 𝛽8𝑣𝑜𝑐𝑖 ∗ 𝑒𝑥𝑝𝑖𝑡
2 + 𝜇𝑖 + 𝜀𝑖𝑡
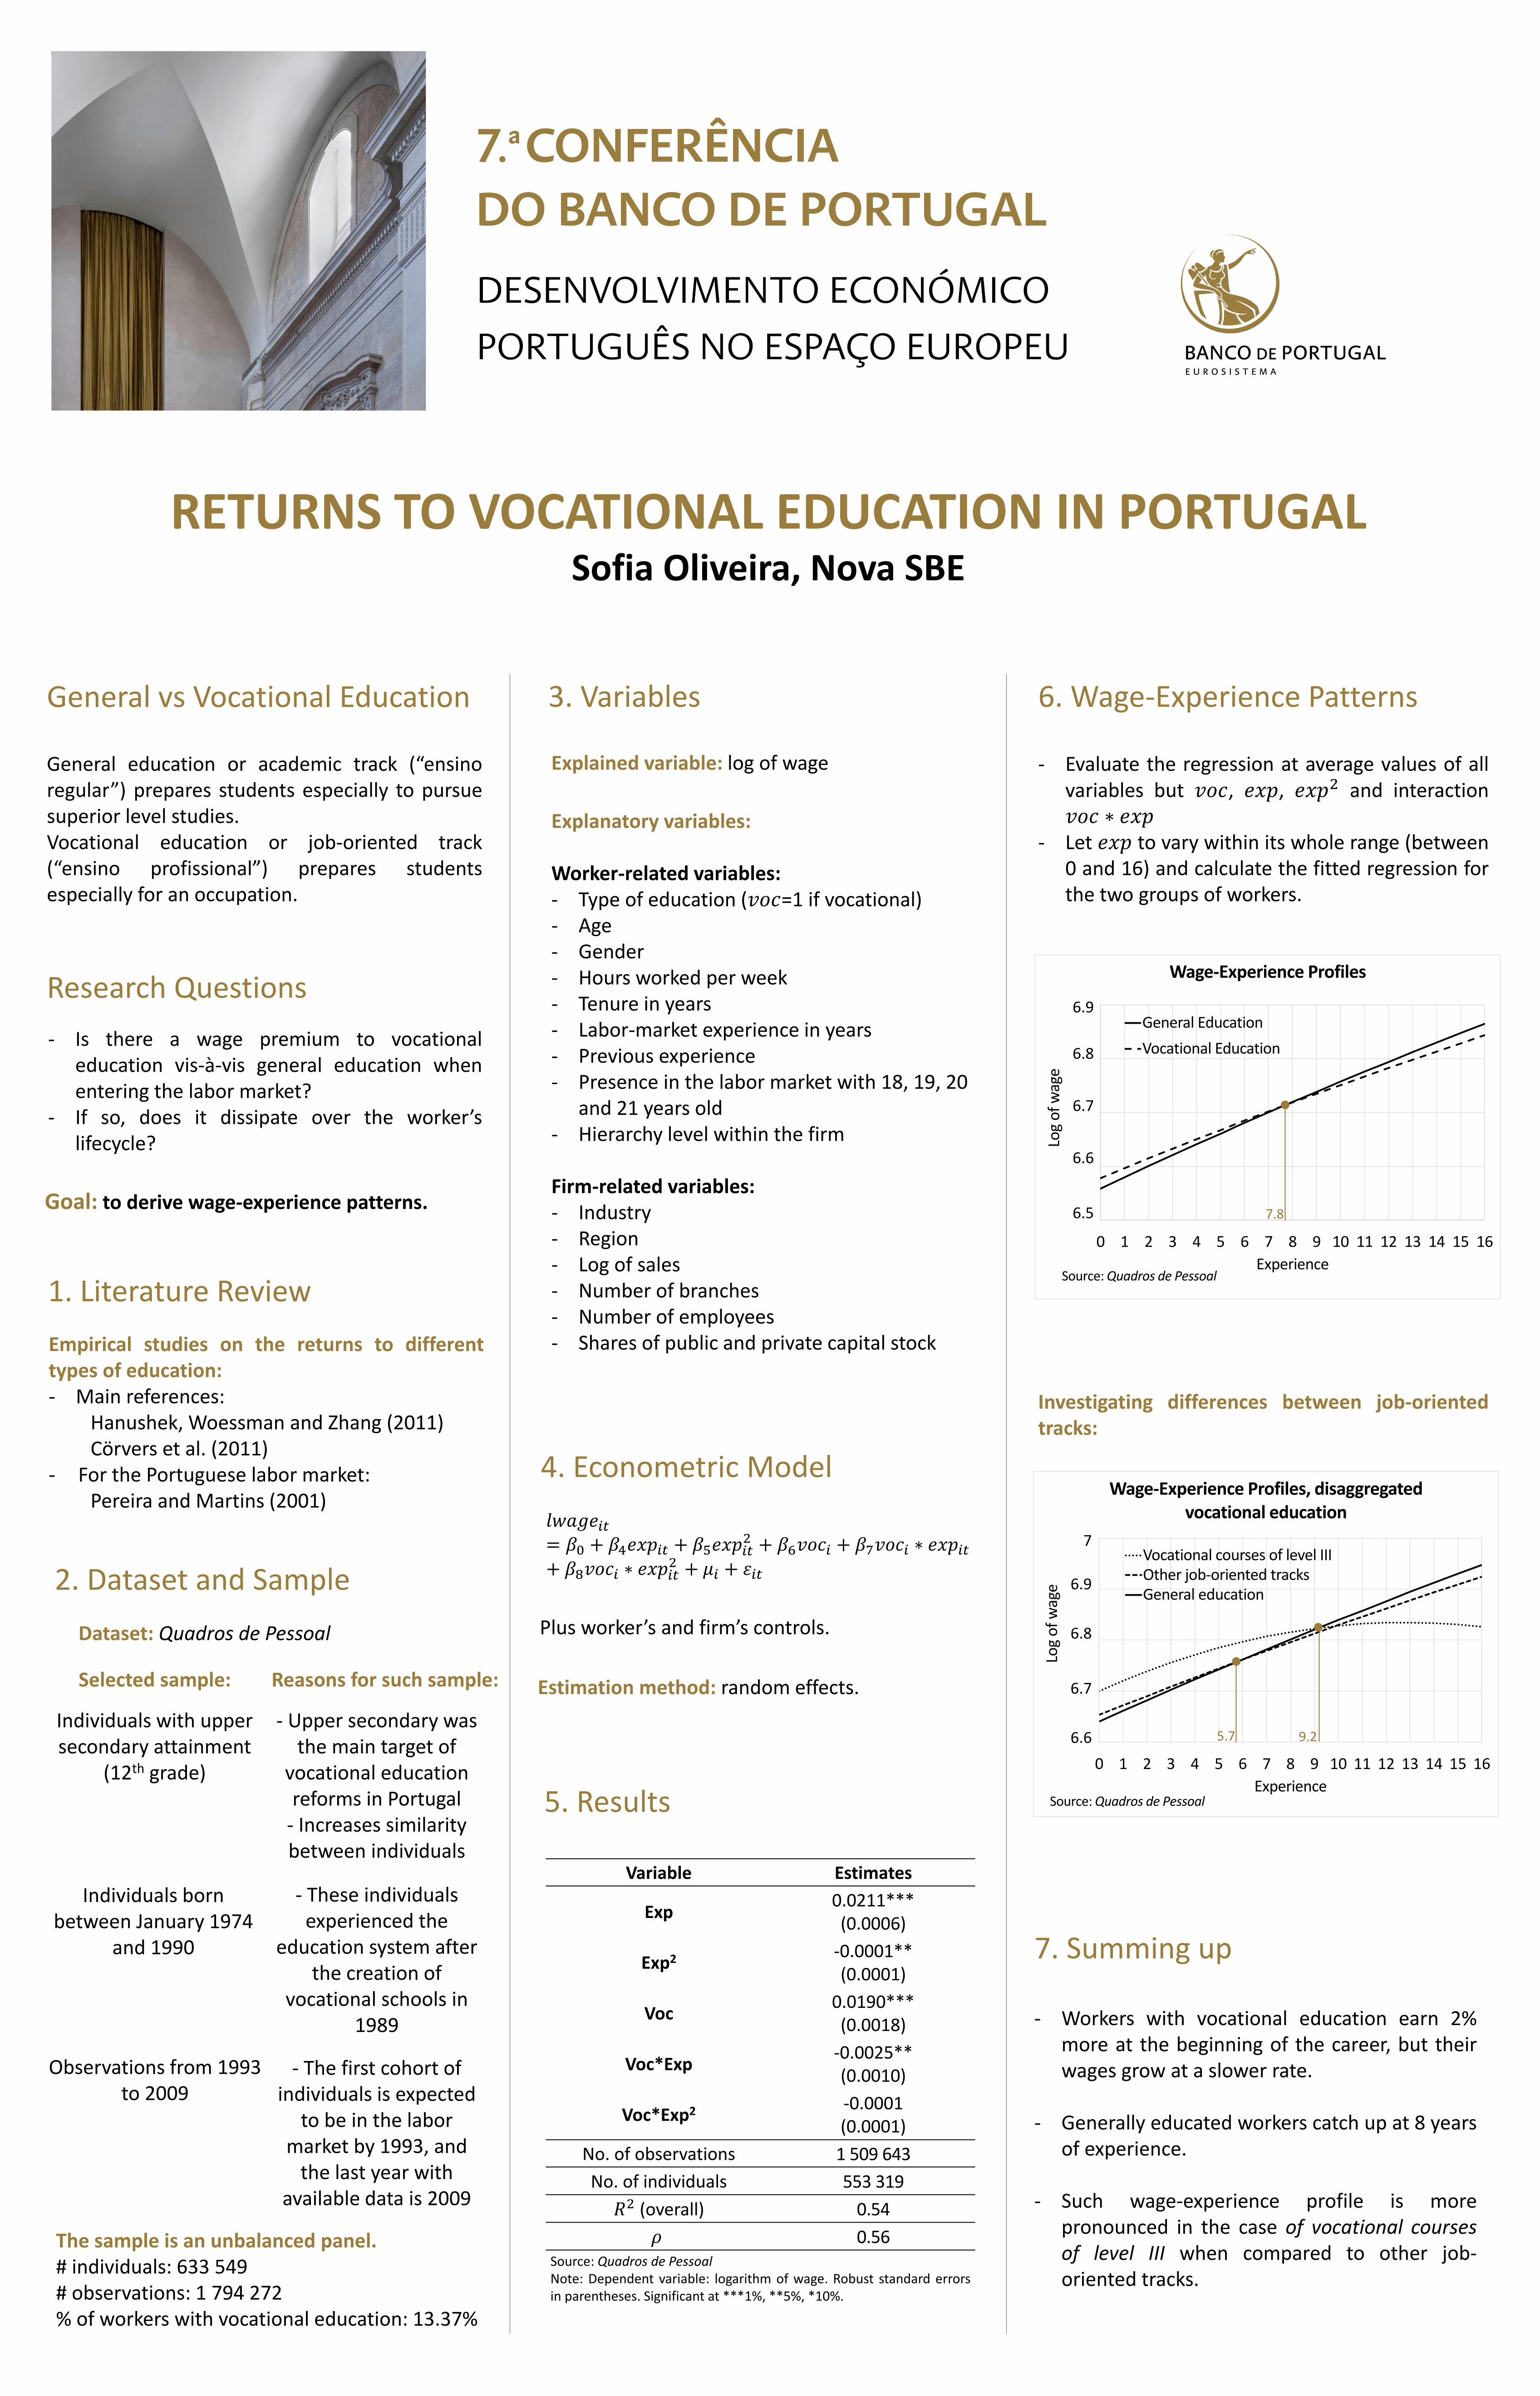
- Evaluate the regression at average values of allvariables but 𝑣𝑜𝑐, 𝑒𝑥𝑝, 𝑒𝑥𝑝2 and interaction𝑣𝑜𝑐 ∗ 𝑒𝑥𝑝
- Let 𝑒𝑥𝑝 to vary within its whole range (between0 and 16) and calculate the fitted regression forthe two groups of workers.
6. Wage-Experience Patterns
Investigating differences between job-orientedtracks:
7. Summing up
‐ Workers with vocational education earn 2%more at the beginning of the career, but theirwages grow at a slower rate.
‐ Generally educated workers catch up at 8 yearsof experience.
‐ Such wage-experience profile is morepronounced in the case of vocational coursesof level III when compared to other job-oriented tracks.
6,5
6,6
6,7
6,8
6,9
0 1 2 3 4 5 6 7 8 9 10 11 12 13 14 15 16
Log
of w
age
Experience
Wage-Experience Profiles
General Education
Vocational Education
Source: Quadros de Pessoal
6.9
6.8
6.7
6.6
6.5 7.8
6,6
6,7
6,8
6,9
7
0 1 2 3 4 5 6 7 8 9 10 11 12 13 14 15 16
Log
of w
age
Experience
Wage-Experience Profiles, disaggregated vocational education
Vocational courses of level IIIOther job-oriented tracksGeneral education
Source: Quadros de Pessoal
7
6.9
6.8
6.7
6.6 9.25.7
2. Dataset and Sample
Dataset: Quadros de Pessoal
Selected sample:
Individuals with upper secondary attainment
(12th grade)
Reasons for such sample:
Observations from 1993 to 2009
Individuals born between January 1974
and 1990
- Upper secondary was the main target of
vocational education reforms in Portugal
- Increases similarity between individuals
- These individuals experienced the
education system after the creation of
vocational schools in 1989
- The first cohort of individuals is expected
to be in the labor market by 1993, and
the last year with available data is 2009
General vs Vocational Education
‐ Is there a wage premium to vocationaleducation vis-à-vis general education whenentering the labor market?
‐ If so, does it dissipate over the worker’slifecycle?
Goal: to derive wage-experience patterns.
Research Questions
General education or academic track (“ensinoregular”) prepares students especially to pursuesuperior level studies.Vocational education or job-oriented track(“ensino profissional”) prepares studentsespecially for an occupation.
The sample is an unbalanced panel.# individuals: 633 549# observations: 1 794 272% of workers with vocational education: 13.37%
1. Literature Review
Empirical studies on the returns to differenttypes of education:- Main references:
Hanushek, Woessman and Zhang (2011)Cörvers et al. (2011)
‐ For the Portuguese labor market:Pereira and Martins (2001)