Embed Size (px)
Citation preview
European Journal of Academic Essays 4(2): 26-38, 2017 ISSN (online): 2183-1904 ISSN (print): 2183-3818 www.euroessays.org
Revealing the Impact of Fadama III Project on the
Income Level of Beneficiary Farmers in Plateau
State, Nigeria
*A. A. Girei1, N. D. Saingbe
1, M. A. Bitrus
1,., and I. H. Bassey
2
1Department of Agricultural Economics and Extension, Nasarawa State University, Keffi, Nigeria.
2Department of Economics, Kwararafa University, Wukari, Taraba State, Nigeria
Abstract: The study examined the impact of Fadama III project on the income level of beneficiary farmers in Plateau State. The
assessment was carried out before and after project implementation within five districts in the study area. The findings were based
on the use of structured pretested questionnaires, personal interview and secondary data. One hundred questionnaires were
randomly distributed in equal proportions to ten Fadama III beneficiary households belonging to Fadama Users Groups (FUGs)
and ten non-beneficiary households which serve as the control group within the same districts. The Double Difference (DD)
estimator was used in determining the outcome measures between beneficiaries and non-beneficiaries of the project. The study
revealed that more men (61%) compared to women (39%) participated in Fadama activities in the study area. The use of group
participation was encouraged thus the use of FUGs & EIGs. Most of the participants were married (70%) with few singles (18%)
and widows (8%). More young people participated; the average age bracket was 41 years. A reasonable number of literate persons
(63%) participated in the programme. Most participants (79%) employ other means of income generation through diversification
of enterprises. The average income of beneficiaries before project implementation was N3,051,000.00 while the income of the
non-beneficiary group was N3,192,000.00 on the other hand, the real average income of beneficiaries increased to N4,208,000.00
representing 27.49%, for the non-beneficiaries the income rise to N3,615,000.00 representing 11.7%. The high percentage rise for
beneficiaries was as a result of participation in the project.
Keyword: Understanding, Impact, Fadama III, Project, Income Level, Beneficiary, Farmers
--------------------------------------------------------------------------------------------------------------------------
INTRODUCTION
The growth in income of farmers is strongly correlated with
the overall growth of the economy especially in the
agricultural sector. This fact has been demonstrated in cross
country and individual country studies [1]. There is an indirect
link between poverty status and poverty reduction among the
farming households through the relationship between
productivity, income growth and poverty [2]. Therefore, in
order to reduce poverty, fundamental economic policies
should aim at promoting rapid economic growth with
implication for rural farmers increased production. [3]
believed that an effective approach towards more
comprehensive poverty reduction is to enhance economic
growth especially at the rural (farm) level.
[4] also argued that macro-economic policies that
promote growth in income are likely to lead into poverty
reduction. Although, in agriculture, positive changes in price
can provide incentives for agricultural production and
specialization, which in turn may lead to growth and
distribution of income through employment generation and
revenue enhancement, and consequently, poverty reduction.
Similarly, at the micro level, enterprises that promote income

European Journal of Academic Essays 4(2): 26-38, 2017
27
growth and distribution enhance the revenue of the rural farm
households leading to their poverty reduction. Also,
improvement in farmer’s productivity and output would lead
to income growth and consequently poverty reduction. [3].
[5] is of the opinion that agriculture has already made
a significant contribution to the economic prosperity of
advanced countries and its role in the economic development
of less developed countries is of vital importance. This can be
achieved through increased agricultural output and
productivity which contributes substantially to an overall
economic development of a predominantly agricultural
populating of a country like Nigeria. The [6] also stated that,
low productivity in agriculture is the cause of high incidence
of food insecurity and poverty in Nigeria.
[2] observed that productivity improvement for the
Nigerian small scale farmers is the ultimate if development is
to take place and be sustained. This proposes that in Nigeria,
the greater part of food production (70%) made available to
consumers, is in the hands of small-scale subsistence farmers
who reside mostly in the villages or rural areas (of the
country. However, these farmers farm with local implements
and unimproved inputs which limit their productivity. More
so, if the farmer is to be alleviated from poverty, the
productivity of the farmer should be improved to support
increased income, better standard of living and serves as a
check on environmental degradation consequently.
Resources committed to agriculture should generate
high productivity and the productivity should be transformed
into an improvement in the quality of life of targeted
Nigerians. Therefore to achieve prosperity and overcome
stagnation, there is need to increase growth in all sectors of
the economy; such growth will be the most efficient means of
alleviating poverty and generating long term sustainable
development. Resources should also be used more efficiently
with much attention paid to eliminating waste, as this will lead
to an increase in productivity and income in the long run.
Similarly, [1] opines that for growth to have some
meaningful impact on poverty, it must occur in sectors in
which a large proportion of the poor derive their livelihood. It
is an irony however, that an agrarian country like Nigeria
could fail in its successive effort to utilize its large resources
for producing food and income wealth for the effective well-
being of its citizenry.
Therefore, it is necessary to observe the impact of the
National Fadama Development Project (NFDP), among the
several projects in order to promote agricultural and economic
development in Nigeria; it is meeting such needs among
others. The programme was established in states with Fadama
potentials through the pooled World Bank loan which is
aimed at increasing and financing small scale irrigation. Also
it has the objective of increasing the income and skills of
beneficiaries through capacity building to improve their
livelihoods by increasing income generating activities [7]
National. The Third National Fadama Development Project
popularly known as Fadama III emerged as a follow up after
the success story of second National Fadama Development
project.
PROBLEM STATEMENT
The Federal Republic of Nigeria has embarked on
several projects with the aim of improving the income and
productivity of the small scale rural farmers. However, these
projects have neither generated increased income nor
improved the living standard of the poor rural farmers in
Nigeria. The United Nations Development Programme
(UNDP) in Human Development Index (HDI) ranked Nigeria
among the 44 poorest countries of the world and Nigeria is
recently placed among the 26 poorest countries with more
than 70% estimated to be living below the internationally
defined poverty level of one dollar per day [8], hence this has
been a major and similar problem among the small-scale rural
farmers in Plateau State. It is on recorded that since
independence, the Federal Government of Nigeria in
conjunction with the United Nations and other developed
agencies have initiated Agricultural Economic development
related projects of the farmers of which, the NFDP is one.
Over the years since its establishment, it is necessary to
observe the level of its performance with the implication to
satisfying the needs of the benefiting farmers. Therefore, this

European Journal of Academic Essays 4(2): 26-38, 2017
28
study intends to assess the impact of Fadama III project on the
income of beneficiary farmers in Plateau State.
OBJECTIVES OF THE STUDY
The broad objective of the study is to assess the
impact of the third National Fadama Development Project on
the income level of the farming beneficiaries in Plateau State,
while the specific objectives are:
i. To examine the socio-economic
characteristics of Fadama III farming
beneficiaries and their influence on the
farming activities of the farmers.
ii. To identify the reasons for Fadama farming
by Fadama Users.
iii. To ascertain the income level of Fadama III
farming beneficiaries, before and after the
project.
iv. To identify constraints associated with the
Fadama III farming beneficiaries of the
project.
Justification for the Study
[9] identifies the small scale farmer as the major
producer of both food and export crops in the country. This
has essentially affected to a larger extent the food and
livestock demand of the households and plays a crucial role in
providing raw materials for both large and small-scale
industries in the country. The small -scale holder needs to be
well informed so as to having the right mind set and positive
attitudes which subsequently leads to increased productivity
and income. Since most of the Nigerian population lives in the
rural areas and most of these people are subsistence farmers
who still live below the poverty line, the development
objectives of the Fadama project which is to increase the
income of the rural and water resource users on a sustainable
basis can therefore fit appropriately into the situations of
farmers in Plateau State and subsequently in Nigeria at large.
Since there are available water-logged plains and abandoned
tin – mine ponds around this area that could be effectively
utilize for fadama farming and other activities.
Hypothesis
There is no relationship between the socio-economic
characteristics of the income level of Fadama III beneficiaries
and non-beneficiaries.
The Concept, “Fadama”: “Fadama” is a Hausa word for
irrigable land. Usually it is a low-laying plain underlayed by
shallow aquifers found along Nigeria’s major river systems.
Such lands are especially suitable for irrigated production,
fishing and traditionally provide feeds and water for livestock
[7].
Similarly, “Fadama” can also be referred to a low-
laying water logged area mostly characterized by fine-alluvial
or clayey soil, suitable for irrigated crop production during the
dry seasons or drought periods. When irrigated, Fadama
provides good moisture for crop root establishment. The
Fadama land facilitates crop production all year round and
increases crop productivity.
[10], have it that the Fadama lands have high
potentials and agricultural values several times more than the
adjacent uplands. They are low-laying and subject to seasonal
flooding along the bank of streams or depressions.
Again, [11], stated that, Fadama development is a
typical form of small scale irrigation practice characterized by
flexibility of farming operations, low input requirement, high
economic values, minimal social and environmental impacts,
and hence, conform with the general criteria for sustainable
development. Akinbile, in viewing at Fadama farming as a
way of improving the land quality, showed that pumping
water from wells in Fadama farming areas helps in controlling
the water table and its therefore serves as an anti-water
logging device. Similarly, the practice increases infiltration
and leaching of harmful salts from the root zone thereby
providing additional basis for impact sustainable Fadama
development.
A Review of Agricultural Development Programmes in
Nigeria: A programme according to [12] is a tool for
achieving the objectives stated in the National Development
Plan of a Nation. Each programme has its own objectives
European Journal of Academic Essays 4(2): 26-38, 2017
29
which are consistent with the overall development plan from
which a set of specific objectives are identified and selected.
The need for support for agricultural development in
Nigeria motivated the government to establish several
programmes in a bid to improve agricultural production with
the aim of improving the living standard of its teaming
population. Some among these programmes include, The
Farm Settlement Scheme (FSS, 1972), National Accelerated
Food Production Programme (NAFPP, 1973), Operation Feed
the Nation (OFN, 1976), River Basin Development Authority
(RBDA, 1977), the Green Revolution, (GR, 1979),
Agricultural Development Programme (ADP, 1975),
Agricultural Transformation Agenda (ATA, 2011) to mention
but a few. [13], however, observed that some of these
agricultural policies could not yield positive effectiveness
either because they have been misguided or because their
impacts had been swamped by macro policies affecting
inflation, exchange rates or cost of capital.
The National Fadama Development Project (NFDP):
Recognizing the challenges posed by the
ineffectiveness of the National Development Programmes, the
federal government has identified the modernization of the
agricultural sector as a priority.
It is generally observed that, small scale irrigation
was adjudged as one of the most successful initiatives that had
led to the follow-up project called National Fadama
Development Project within the Fadama areas through the use
of improved but simple technology.
Thus [14] reported that in developing countries
where agriculture is in the hands of small-scale peasant
farmers, the demands for inputs are usually high. The small-
holders need simple technology to substitute their local
equipment at a subsidized rate. This will thereby improve
their income.
Since the Fadama project recognizes the irrigation
scheme as a developmental project, [15] pointed out that the
development of large and small scale irrigation scheme in
Fadama land is part of the strategies for rural development
which creates employment opportunities in the rural areas and
also maximizes the use of land.
In the same vein, [16], opined that in the
development of irrigation schemes, the common national aim
may include economic efficiency in the use of resources,
gaining of foreign exchange through the production of export
crops to substitute for export, development and modernization
of rural economy. This will ensure that food supply
(qualitatively and quantitatively) keeps pace with increasing
population. Significantly, increasing the production of
agricultural raw materials to support agro based industries will
facilitate a smooth integrated development of the agricultural
potentials such as cultivating Fadama land.
The National Fadama Development Project (NFDP)
is an International Development Project (IDP) credit facility,
cofounded by the Federal Government of Nigeria (FGN),
State Government (SG), Local Government (LG) and
benefitting communities through counter funding and
beneficiary contribution respectively.
METHODOLOGY
Area of Study: The study was conducted within Bokkos
Local Government Area of Plateau State, Nigeria. Plateau
State is found in the central part of Nigeria, which lies within
the middle belt region of the country. It can be located
between latitude 80o28’N and longitude 80
o32’ and 100
o38’E.
The state has a land area of 30,913km2 with an estimated
population of 3,553,440 [17]. The climate of the state is near
temperate (11oC) and is ideal for numerous agricultural
activities.
Bokkos local government area of Plateau state was
created on the 7th
October 1991 out of Mangu Local
Government Area of the State. It is located within the central
senatorial zone of the state. Bokkos the local governments
headquarter is located 22km south-west of Jos, the Plateau
State capital. Bokkos Local Government Area shares
boundary with Mangu LGA in the West, Nassarawa State in
the East, barkin Ladi local government area in the north and
Quan-pan local government area in the south.
The LGA occupies an area of about 3,053 square
kilometers with abundant rainfall and sunshine. The
European Journal of Academic Essays 4(2): 26-38, 2017
30
temperature can be as low as 11oC between November and
February. The local government is made up of eight districts
which make up the major towns, they include Bokkos, Daffo,
Mushere, Richa, Manguna, Sha, Toff and Kamwai with Ron,
Kulere and Mushere as the major languages. It has an
estimated population of 178, 454 [17]
Agriculture is the predominant occupation of the
people. The area is endowed with a wide expanse of arable
rich fertile soils which enhance the production of various
crops and livestock. Crops produced include maize, Irish
potatoes, acha, millet, cocoyam, beans, soya beans, sugar
cane, palm oil, palm kennel, yam, sweet potatoes, assorted
fruits and vegetables. Livestock reared are cattle, sheep, goats,
pigs and poultry. Mineral resources include tin, columbite,
kaolin, Gemstones, marble among others.
Population and Sampling Procedure: In analyzing the
impact of Fadama III project on beneficiaries, the sample
frame was divided into two strata; the direct project
participants (i.e Fadama III beneficiaries) and Non Fadama III
beneficiaries. This allows for estimation of direct effect of
Fadama III project beneficiaries to non-beneficiaries within
the communities. A total of one hundred (100) structured
questionnaires were distributed in equal proportion to direct
project participating and non-participating households based
on their farming activities (crop and livestock farming) as
related to project implementation of Fadama Users Groups
(FUGs).
Method of Data Collection: Data for the study was collected
through the use of structured questionnaires in five (5)
districts within the study area which include Bokkos, Daffo,
Mushere, Manguna and Toff. Information were randomly
collected from ten (10) Fadama III participating households
belonging to Fadama User Groups (FUGs) from each of the
five participating districts to give a total of fifty households.
In the same vein, ten (10) non-Fadama III
participating households from the same districts were
randomly selected to give a total of fifty households which
serves as control group.
Analytic Tools: Descriptive analysis was used to achieve
objectives 1, 2 and 4 using percentage mean and frequency
while the double difference (DD) Estimator was used to
compare variations of results in outcome measures for
objective 3.
The Double Difference Estimator also known as
Difference in Difference method [18] has the formula
DD = (Yp1 – Ypo) – (YnP1-YnPo)
Where
YP1 = Outcome (e.g. income) of beneficiaries after
the project started
YPo = Outcome of beneficiaries before the project
started
YnP1 = Outcome of non-beneficiaries after the
project started
Yn Po = Outcome of non-beneficiaries before the
project started
The advantage of the Double Difference Estimator is that, it
nets out the effects of additive factors (whether observable or
non-observable) that have fixed (time invariant) impact on the
outcome indicator (such as the abilities of farmers or the
inherent quality of natural resources), or that reflex common
trends affecting project participants and non-participants
equally such as changes in prices or weather [19.
In principle the DD approach can be used to assess project
impacts without using any other statistical tool (such as the
propensity score matching (PSM) method as applied by [20]
as it will produce unbiased estimates of impact as long as
these assumptions hold, hence the adoption of this method in
this study for estimating the project impact among the Fadama
III beneficiary farmers of Bokkos LGA Plateau State, Nigeria.
This method was also applied by [21]
RESULTS AND DISCUSSION
Socio Economic Characteristics of Respondents: The
socio-economic profiles of the respondents were
examined under various variables such as gender, age,
educational level, occupation, marital status,
household size, years of farming experience, source of
information on Fadama programme, types of
farming practice and membership cooperative society. Table
1 reveals the frequencies and percentage of
the variables studied

European Journal of Academic Essays 4(2): 26-38, 2017
31
Table 1: Distribution of the Respondents by Socio-economic characteristics
Variables Frequency Percentage
Gender
Male
Female
61
39
61
39
Age range (years)
21 – 30
31 – 40
41 – 50
51 – 60
X = 41
61and above
13
40
26
18
3
13
40
26
18
3
Educational Level
Non-formal
Primary
Secondary
Tertiary
1
3
33
63
1
3
33
63
Occupation
Full time
Farming and others
21
79
21
79
Marital Status
Married
Single
Widow
74
18
8
74
18
8
Household size
1 – 5
6 – 10
11 – 15
16 and above
X = 6
44
48
7
1
44
48
7
1
Years of farming experience
1 - 10
11 - 20
21 – 30
31 – 40
41 and above
X = 15
16
32
22
8
2
16
32
22
8
2
Source of Information on Fadama
III
9
9

European Journal of Academic Essays 4(2): 26-38, 2017
32
Radio
Television
Friends and neighbors
Other members
Family members
PADP/FDA
Buyers
Fadama Facilitators
2
28
8
2
-
-
1
2
28
8
2
-
-
1
Types of farming system practical
Crop farming
Animal farming
78
22
78
22
Membership of Cooperative society
Member
Non-member
66
34
66
34
Source: Field survey, 2015
Distribution of Respondents by Gender: Table 1 shows
that majority (61%) of the respondents were male while 39%
were females. This indicates a dominance of the male folks
over females in Fadama III activities within the study area.
This result correspond with the work of [22] findings on the
impact of food security among rice farmers in Kogi State,
where 51.8% of the farmers were males whole 25% were
females. Although women dominate farming activities in
some communities e.g. among the Beroms while in others
religious belief instructs for seclusion as in the purdah of
Islam. Women also dominate in carrying out lighter
processing activities (author’s personal observation).
Distribution of respondents by Age: The ages of the
respondents in this study indicates that about 40% of the
farmers are between the age brackets of 31 to 40 while 26%
are between the ages of 41 – 50 years. The mean age bracket
of the farmers is 41 years. This implies that majority of the
farmers are still within their active age. This could be due to
the fact that many young school leavers have no option for
income generation than farming activities due to inadequate
white collar jobs. This is evident in Table 1.
Educational level of the farmers: Again, from Table 1, the
investigation shows that about 1% of the respondents did not
have any formal educational background, 3% primary
education, 33% had secondary school education while 63%
of the farmers had tertiary education, this implies that
majority of the farmers have had a form of formal education
at different levels. This is in agreement with the findings of
[21], that literacy level makes easier the implementation of
projects. Also, more literate people are becoming interested
in farming no matter their professions. [23] are also of the
opinion that education has been a factor in the adoption of
modern practices. It is generally considered an important
variable that could enhance farmers’ adoption of new
technology.
Occupation of Respondents: The distribution of
respondents on Table 1 based on the involvement in farming
activities showed that most of the farmers (79%) employed
other off farm activities as a supplement to the family
income. It is evident from table 4.1 that only about 21% of
the farmers had no secondary occupation apart from farming.
This implies that the respondent have other sources of
increasing their family income through diversification of
enterprises. This could be that dependent on just one source
of income does not meet the family needs adequately.
Marital Status of Respondents: It is evident from Table 1
that a greater proportion (70%) of the respondents were
married while 18% and 8% were single and widowed
respectively. This findings show that married people are
involved in farming activities than single persons in the study
area. Couple can depend on one another for different farm
activities and financial needs towards farming. Also, the
dependency ratio in the family could force couples into
farming.
Household Size of Respondents: Household size means
the number of persons that contribute to the income of the
household and also feed from the same source in the family.
The result from the survey in Table 1 showed that 44% of the
respondents had a household size of between1-5, 48%had 6
to 10 members while 7% had 11 to 15 and 1% had over 16
persons in the household. Also, the mean house hold is 6.
This indicates that majority (48%) of the farmers had a fairly
large household which could probably supply farm labour.
[22], said household are characterized by high number of
members with high dependency ratio in Nigeria. This is due
European Journal of Academic Essays 4(2): 26-38, 2017
33
to the needs for more hands that constitute the labour on the
farm.
Years of Farming Experience: The distribution of farmers
based on farming experience on table1 showed that 32
respondents had 11-20 years of farming experience. The
mean years of farming experience is 15 years. This indicate
that majority of the farmers had a reasonable years of
farming experience. These assist farmers in averting
unnecessary risk which could lead to achieving better
productivity.
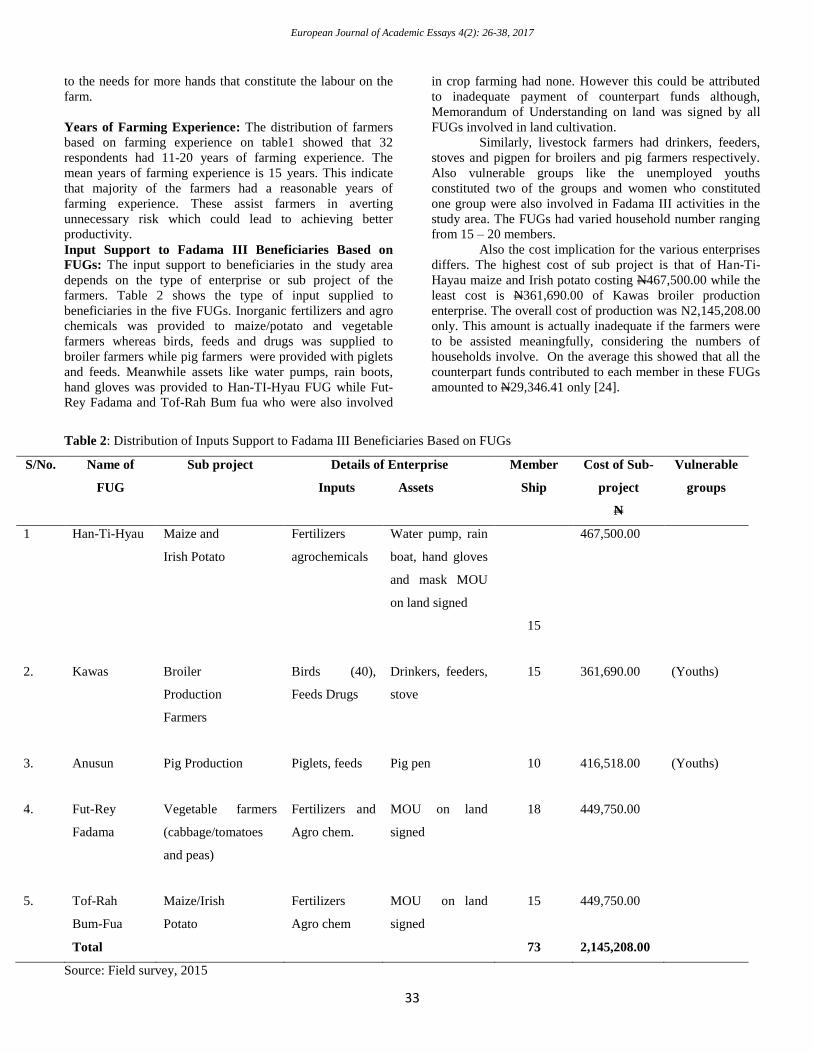
Input Support to Fadama III Beneficiaries Based on
FUGs: The input support to beneficiaries in the study area
depends on the type of enterprise or sub project of the
farmers. Table 2 shows the type of input supplied to
beneficiaries in the five FUGs. Inorganic fertilizers and agro
chemicals was provided to maize/potato and vegetable
farmers whereas birds, feeds and drugs was supplied to
broiler farmers while pig farmers were provided with piglets
and feeds. Meanwhile assets like water pumps, rain boots,
hand gloves was provided to Han-TI-Hyau FUG while Fut-
Rey Fadama and Tof-Rah Bum fua who were also involved
in crop farming had none. However this could be attributed
to inadequate payment of counterpart funds although,
Memorandum of Understanding on land was signed by all
FUGs involved in land cultivation.
Similarly, livestock farmers had drinkers, feeders,
stoves and pigpen for broilers and pig farmers respectively.
Also vulnerable groups like the unemployed youths
constituted two of the groups and women who constituted
one group were also involved in Fadama III activities in the
study area. The FUGs had varied household number ranging
from 15 – 20 members.
Also the cost implication for the various enterprises
differs. The highest cost of sub project is that of Han-Ti-
Hayau maize and Irish potato costing N467,500.00 while the
least cost is N361,690.00 of Kawas broiler production
enterprise. The overall cost of production was N2,145,208.00
only. This amount is actually inadequate if the farmers were
to be assisted meaningfully, considering the numbers of
households involve. On the average this showed that all the
counterpart funds contributed to each member in these FUGs
amounted to N29,346.41 only [24].
Table 2: Distribution of Inputs Support to Fadama III Beneficiaries Based on FUGs
S/No. Name of
FUG
Sub project Details of Enterprise
Inputs Assets
Member
Ship
Cost of Sub-
project
N
Vulnerable
groups
1 Han-Ti-Hyau Maize and
Irish Potato
Fertilizers
agrochemicals
Water pump, rain
boat, hand gloves
and mask MOU
on land signed
15
467,500.00
2.
Kawas
Broiler
Production
Farmers
Birds (40),
Feeds Drugs
Drinkers, feeders,
stove
15
361,690.00
(Youths)
3.
Anusun
Pig Production
Piglets, feeds
Pig pen
10
416,518.00
(Youths)
4.
Fut-Rey
Fadama
Vegetable farmers
(cabbage/tomatoes
and peas)
Fertilizers and
Agro chem.
MOU on land
signed
18
449,750.00
5.
Tof-Rah
Bum-Fua
Maize/Irish
Potato
Fertilizers
Agro chem
MOU on land
signed
15
449,750.00
Total 73 2,145,208.00
Source: Field survey, 2015

European Journal of Academic Essays 4(2): 26-38, 2017
34
Sample of Fadama III participant Enterprise Groups
and Non-participant Enterprise Groups: The different
sampled Fadama III enterprise groups for participants and
non-participants are presented in Table 3. The study for
the Fadama III FUGs reveals that about 78% of the sampled
FUGs were engaged in crop farming. Maize and Potato
enterprise groups (FUGs) dominate the crop category with
about 56% while in the livestock category, pig enterprise
group (FUGs) has 16%.In the same vein maize and potato
has about 54% of the non Fadama III enterprise group while
pig farmers in the livestock categories have10%
respectively. Poultry farming seem to be unpopular in the
study area as very few farmers engaged in this enterprise.
Table 3: Distribution of Respondents by Enterprise Groups for Beneficiaries and Non-beneficiaries
Fadama III beneficiaries Fadama III non-beneficiaries
Enterprise Frequency Percentage Frequency Percentage
Crop farmers
Maize and potato
Vegetable farmers
Livestock farmers
Pig farmers
Poultry farmers
28
11
8
3
56
22
16
6
27
16
5
12
54
32
10
4
Total 50 100 50 100
Source: Field survey, 2015
Income Level of Beneficiary and Non-beneficiary
households before the implementation of Fadama III
Project: Table 4 expresses the different income levels of
both beneficiaries and non-beneficiaries of the Fadama III
project. Findings in the data generated indicate that the
average per capita income of the Fadama III user households
before the implementation of the project in the state was
N49,724.00 [24]. The income range of different households
prior to Fadama III project is shown in Table 4. About 66%
of the respondents in the beneficiary groups had less than
N50,000 before the implementation of the project, where
only 1 of the respondent household (2%) had income level
of between N251 to N300,000.00. This information actually
corresponds with the best line income of participating
households as published by PSFCO.
Comparatively, 62% of the non-beneficiaries are
within the income range of less than N50,000.00 while the
highest income was between N251 and N300,000.00 only
owned by 2% of the population.
Table 4: Income Level Of Respondent Households Before
The Implementation Of Fadama III Project
Fadama III beneficiaries Fadama III non-beneficiaries
Level of Income Frequency Percentage Frequency Percentage
Less than N50,000
N51,- 100,000
N101 – 251, 000.
N151 – 200,000
N201 – 250,000
N251 – 300,000
301,000 and above
33
13
1
2
-
1
-
66
26
2
4
-
2
-
31
11
4
3
-
1
-
62
22
8
6
-
2
-
Total 50 100 50 100

European Journal of Academic Essays 4(2): 26-38, 2017
35
Source: Field survey, 2015
Income Level of Fadama III Enterprise Groups and
Non-Enterprise Groups before Project Implementation:
The findings indicated that the average per capita
income for beneficiary households prior to project
implement was N61,020.00 while that of the non-
beneficiary households was N63,840.00 against the baseline
survey income of N49,724 in the state. However, on
enterprise basis, the vegetable based enterprise has the
highest average income of N100,454.55 for the beneficiaries
and N66,437.50 for the non-beneficiary groups. The poultry
subsector followed with an average income of N123,333.33
for the beneficiary and N142,000.00 for the no-beneficiary
households (Table 5), before the project implementation of
Fadama III.
Table 5: Distribution Of Fadama III Enterprise Groups And Non-Enterprise Groups According To Income Level Before Project
Implementation
Fadama III beneficiaries Fadama III non-beneficiaries
Enterprise Category FUG Income level Av. Income Income level Av. Income
Crop farmers:
Maize and potato
Vegetable farmers
Livestock farmers
Pig farmers
Poultry farmers
N
1,151,000,00
1,105,000.00
425,000.00
370,000.00
N
41,107.14
100,454.55
53,125.00
123,333.33
N
1,326,000.00
1,063,000.00
519,000.00
284,000.00
N
49,111,11
66,437.50
103,800.00
142.000.00
Total 3,051,000 61,020.00 3,192,000 63,840.00
Source: Field survey, 2015
Income level of Fadama III Enterprise Groups after
Project Implementation: The impact of Fadama III project
on household income (Table 6) shows that there was an
increase in total value from N3,051,000.00 to
N4,208,000.00 for beneficiary households and from
N3,192,000.00 to N3,615,000.00 for non-beneficiary
household respectively after the project. This is also in line
with the study conducted by [25] on fadama II beneficiaries
in Adamawa State and the findings showed that the income
of the beneficiaries rose from N187,559.12 t0 N323,631.69.
This represent an increase of N136,072.57 which represent
about 72.55%. On the average, the real income of Fadama
III beneficiaries increased from N61,020.00 to N84,100.00
as a result of participation in the project.
Table 6: Distribution Of Fadama III Enterprise Groups And Non-Enterprise Group According To Income Level After Project
Implementation
| Fadama III
Beneficiaries
Fadama III
non-beneficiaries
Enterprise Category FUG Income Level (N) Av income Income Level (N) Av Income
Crop farmers
Maize and potato
Vegetable farmers
Livestock farmers
Pig farmers
Poultry farmers
1,829,000.00
1,428,000.00
426,000.00
525,000.00
65,321.43
129,818.18
53,250.00
175,000.00
1,584,000.00
1,092,000.00
426,000.00
513,000.00
58,666.67
68,250.00
85,200.00
256,500.00
Total 4,208,000.00 84,160.00 3,615,000.00 72,300.00

European Journal of Academic Essays 4(2): 26-38, 2017
36
Source: Field survey, 2015
The Outcome measures of Fadama III beneficiaries and
non-beneficiaries based on the Double Different (DD)
Estimator: This compares changes in outcome measures
between the Fadama III beneficiaries and non-Fadama III
beneficiaries. From the computation, the values provided
showed an increase in income of about seven hundred and
thirty four thousand naira only (N734,000.00) netting out
the impact on beneficiaries. The percentage rise in income
of beneficiaries was about 27.49% as against 11.7% rise in
income of non-beneficiary households. The result indicates
a significant difference in the income of Fadama III
beneficiaries and non-beneficiaries.
The outcome measures of Fadama III beneficiaries and
non-beneficiaries based on the Double Difference (DD)
Estimator.
DD = (Yp1 = YP0) -(YnP1 = YnP0)
Where:
YP1 = Outcome (e.g. income) of beneficiaries
after the project implementation
(N4,208,000.00).
YP0 = Outcome of beneficiaries before the
project implementation (N3,051,000.00).
YnP1 = Outcome of Non-beneficiaries after the
project implementation (N3,615,000.00).
YnP0 = Outcome of non-beneficiaries before the
project implementation (N3,192,000.00).
DD = (N4,208,000 – N3,051,000.00) – (N3,
615,000 – N3,192,000.00)
= (N1,157,000.00) – (N423,000.00)
= N734,000.00
Percentage increase in beneficiaries’ income
= YP1 -YP0 x 100
YP1 1
= N4,208,000 – N3,051,000 x 100
N4,208,000 1
= N1,157,000 x 100
N4,208,000 1
= 0.27495 x 100
= 27.49%
Challenges posed by Fadama III Programme: Some of
the problems encountered by the respondents include the
following:
a) Most of the asset supplied could not stand the test
of time as they break down soon after they are
supplied contractors should endeavor to supply
quality materials.
b) Again, the high cost of fertilizer is another aspect
of serious concerned as well as the prevalence of
pest and diseases. These causes serious havoc on
the farms even before the produce are harvest.
c) The late supply of inputs delay farmers from
planting their crop in good time thereby exceeding
into periods of excessive rainfall leading to crop
devastation and thereby low consequently.
d) Lack of good agricultural market and transport
facilities for the disposal of these produce leads to
price fluctuation and reduced profit.
e) Inadequate and poor communication network is
another problem encountered by some of the
respondent,
CONCLUSION AND RECOMMENDATIONS
The socioeconomic characteristics of respondents
revealed that the male gender dominated Fadama activities
in the study area. Although, this does not mean that women
participate less in farming activities. It could be due to the
usual dominance of men in certain public functions as in
politics. The mean age bracket of farmers is 41 years. This
indicates that most of the farmers are still in their active
years. This could be due to the inadequacies in securing
white collar jobs by the teeming youths. The findings also
revealed that 96% of the population has a kind of formal
education. This showed that the campaign against illiteracy
is becoming effective and people are gradually responding
towards agriculture as a means of occupation. About 79% of
the participants are involved in other activities to
supplement farming. This could be that total dependence on
farming alone cannot make ends meet due to inadequate
income involved in farming alone as an occupation.
Similarly, the study revealed that about 70% of the farmers
were married compared to singles persons. Couples could be
forced to farm due to high depending ratio and to meet the
food requirements of the family. The household size of
respondents reflected a fairly large family size with an
average of six (6) people per household. This shows that the
campaign for family planning is yet to be very effective in
this area. This might force the government to enact policy
that might enable people to cut down their family sizes. The
mean years of farming experience among respondents is 15
years. Such lengthy period can assist farmers in averting risk
and uncertainty for better outputs. Based on the findings of
the study, the programme made appreciable impact on the
average income of Fadama III user households based on
their different enterprise activities. It has also been able to
determine the proportion of the Fadama User households
attaining the observed average income, the real income of
Fadama III beneficiaries increased by about 27.49% (from
N61,020 to N84,160.00) as a result of participation in the
project.
Recommendations 1. Government allows the continuity of the project beyond
the government that formulated it. As is the practice most
especially in Nigeria, successive government policies of the
Federal Government is always inimical to long term
investment in agriculture. Thus, it is important if the
programme is allowed to progress. The government should
ensure that service providers execute project to
specification. Assets supplied should be of standard quality
to avoid breakdown soon after they are supplied.
2. There should be adequate awareness of the programme
for increased participation by other farmers most especially
at the local level. More extension workers should be trained
European Journal of Academic Essays 4(2): 26-38, 2017
37
to advocate the programme even in mosques and churches to
give enough coverage. This will not only increase the
income of participants but facilitate the acquisition of the
community owned rural infrastructures.
3. The supply of inputs should also be carried out on good
times, as is the complaint of most respondents. This should
be planned ahead of time to meet the expectation of farmers
since activities were carried out both in the rainy and dry
seasons.
4. Government should also make available better service
providers for the disposal of the outputs. Most farmers sold
their produce at very low prices due to the absence of
adequate markets and storage facilities. If the existing
marketing board can be strengthened and made more
responsible to provide better services for the farmers, their
produce will not be constantly sold on giveaway prices.
Also, the provision of processing facilities for these produce
will go a long way in mopping up the excess produce.
5. All the respondent complaints of pest and diseases as the
major problems confronting farming activities. The
government in partnership with NGOs should sponsor
researchers to look into the causes and how to cope the
occurrence of these ointments which are major hindrance to
farming activities in the study area.
REFERENCES
[1]. Chirwa, E; Mohome, M. (2001). Agricultural growth
and poverty in Rural Malawi,
www.gdn.int./:/Ephraim&Marriam.
[2]. Simom, T. Penda and Benjamin C. Asogwa (2011).
Efficiency and Income Among the Rural Farmers in
Nigeria. J. Hum. Ecol. 35(3):173 - 179
[3]. Penda, S. T and Asogwa, B..C. (2011) Efficiency and
income among the rural farmers in Nigeria.
Department of Agricultural Economics, University
of Agriculture Makurdi Benue State, Nigeria.
[4]. Chirwa, E. W. (2005). Macro-economic policies and
poverty Reduction in Malawi IMF University of
Malawi, Chancellor College. Version: January
2005. www.imf.org/.../chirwa.pdf//
[5]. Desai, R. G. (2001). Agricultural economics (Models,
problems and policy issues)Himalaya Publishing
House.
[6]. World Bank (1996). Nigeria: Poverty in the midst of
plenty. The challenge of growth with inclusion. A
World Bank Poverty Assessment, Population and
Human Resources Division Report No. 14733 –
UNI, Washington, D. C. the World Bank
[7]. National Fadama Coordination office (2012). Federal
Ministry of Agriculture and Rural Development.
Third National Fadama Development Project
[8]. African Development Fund (ADF, 2003). A republic of
Nigeria Fadama Development Project Appraisal
Report in agriculture.
[9]. The Nigeria Policy on Agriculture, (2000). Federal
Ministry of Agriculture and Rural Development.
[10]. Baba, K. M and Singh, B. R (1998). Sustainable
Development of Fadama Lands in Northern
Nigeria. A Review of the Potentials and Challenges
Nigeria. Journal of Rural Sociology.
[11]. Akinbile, L: A. Oladoja M.A; Awoniyi F. M and Adisa
B. O. (2006). Effects of Community Participation
on Perception of Sustainability of Rural Water
Projects in Oyun Local Government Area of Kwara
State. Nigeria. Journal of Food Agriculture and
Environment 4 (3,4) Pp 257 – 261.
www.worldfood.net.
[12]. Alabi, J. O. (1996) Evaluation Agriculture and Rural
Development programme in Nigeria. A study on
REDA. Obafemi Awolowo University, Ile-Ife.
[13]. Ehui, S, K. Tsigas, Marinos EW (2009). The role of
agriculture in Nigeria’s economic growth. A
general equilibrium analysis.
[14]. Mallam, G. (1994). ABC of Agricultural Development
(unpunished research)
[15]. Akinlade, O.S.(1992). Corporate strategy for
agricultural and rural development in Nigeria.
Shyraden Nigeria Ltd Pp 1 – 9.
[16]. Emmanuel O (1998). Political decisions in the Nigeria
agricultural industry, Tamaz Publishing Company
Limited 1st Edition Pp 37 – 42.
[17]. National Population Commission (NPC, 2006).
Estimated population Figures. National Population
Commission of Nigeria , Abuja
[18]. Duflo, E., Mulainathan, S., and Bertrand, M. (2004)
How much should we trust difference in difference
estimates/ Quarterly Journal of Economic, 119 (1):
249 – 275.
[19]. Ravalion, M. (2006) Evaluation Anti-Poverty
Programme Policy Research Working Papers. No.
3625, World Bank Washington D. C.
[20]. Philip, D. E. Nkonya, J. Penda., and O. A. Oni (2009).
Constraints to Increasing Agricultural Productivity
in Nigeria. A Review Nigeria Strategy Support
Programme (NSSP) Background Paper 6.
International Food Policy Research Institute,
Washington D.C.
[21]. Ike, P.C. (2012). An analysis of the impact of Fadama
III project on poverty alleviation in Delta State,
Nigeria. Asian Journal of Agricultural Science 4
(2). 158 – 164, Maxwell Scientific Organization
[22. Olaolu, M. O., Akinnagbe, O. M., and Agber,
T.(2013). The Impact of National Fadama
Development Project Phase II on poverty and food
security among rice farming beneficiaries in Kogi
State, Nigeria. American Journal of Research
Communication. , 1, 280 - 295
[23]. A. A. Girei, and B. Dire. (2013). Impact of National
Fadama II Project on the Socioeconomic
Characteristics of Crop Farmers in Adamawa
State, Nigeria. International Journal of Innovative
Agriculture & Biology Research. 1 (2):31- 38
[24]. Plateau State Fadama Coordination Office (PSFCO,
2012) Progress Report of Plateau State Fadama

European Journal of Academic Essays 4(2): 26-38, 2017
38
Coordination Office (SFCO) 2009 -2012: Pp 1 –
94.
[25]. Girei, A. A & Galadima, O. E. (2016). Understanding
Household Income and Expenditure of
Beneficiaries of Fadama II Project in Adamawa
State, Nigeria. International Journal of Innovative
Agriculture & Biology Research 4(3): 39 - 44