Embed Size (px)
Citation preview
Content 1. Contents pages 2016-17.doc
REVENUE AND CAPITAL BUDGETS 2016/17
CONTENTS Revenue Budget Page No.
1. Contents…………………………………………………………..…….…………… 1
2. General Introduction - Annual Budget ……..……………………………………. 2
3. Annual Budget Summary.…………………………………………………………. 11
4. Reconciliation of 2016/17 Original Budget to SAP Plan 0..…….….………….. 14
5. Contingency Estimate...………………………………………………….….…….. 16
6. Interest and Capital Charges Account………………………………………….... 17
7. Provisions and Reserves ………………..………………………………..…….. 18
8. History of Council Tax 2009/10 - 2016/17….………………………….….……... 21
9. Analysis of Budgets over Services...……………….…………………………….. 22
10. Pie Charts - Analysis of Budgets over Services ……………………….……….. 23
11. Analysis of Staffing……..………………………………………………….………. 24
12. Statistics and Performance Indicators………………….………………….…….. 25
13. Glossary of Terms…………………………………………………..….…….……. 30
14. Subjective and Directorate Analysis……..……………………………………….. 33
Chief Executive’s……………...………………………….…………………….. 34 Corporate Expenditure……..…………………………….…………………….. 35 Culture and Communities Services.………………………………………….. 36 Families …………………………………….……………....…………………… 44 Finance ……………..………………..……………………….………………… 57 Housing & Growth…………………………………….…..……………………. 65 Neighbourhoods & Commissioning…………………………………………… 72 Operations ………………………..……………………….……………………. 80 Regeneration & Growth………………………………….…………………….. 90
15a Overall subjective analysis by cost element including HRA & DSG……..……. 95
15b Overall subjective analysis by cost element excluding HRA & DSG.……....… 104
Capital Budget
16. General Introduction………………………………………………….………….… 113
17. Capital Expenditure and Financing...……………………………….………….… 114
18. Detailed Capital Expenditure 2016 - 2020……………..………………………... 115
Financial Strategy
19. Savings 2016/17 and beyond…………………………………….……………….. 119
20. Growth and Council Priorities………..…………..…………………….…………. 135
21. Fees and Charges…………………….…………..…………………….…………. 136
22. Medium Term Financial Strategy 2015 - 2020…………………….….………… 198
23. Revenue Budget Risk Assessment.…………..………………………………….. 200
Content 2 Annual budget process 2016-17.doc
ANNUAL BUDGET INTRODUCTION The approval of the Annual Budget is an important stage in the Council’s annual planning and budgetary process, as the revenue estimates form the basis for setting the Council Tax for the following year. This section aims to put finance into its corporate context. Not all matters can be covered in detail, but it is intended to give a flavour of how finance influences the way Waltham Forest Council operates and is governed. Finance as a resource:- Finance is one of the five key resources available to the authority, ie.
• People • Property (land and buildings) • Systems • Information • Finance
All of these resources are essential to making the organisation successful. However, finance is arguably the key resource, because it enables Waltham Forest to pay staff, acquire and maintain property, maintain systems and gather and disseminate information. Managing the Council’s finances is an important activity, not just because of the importance of Finance as a resource, but because the Council’s finances represent public money entrusted to the Council.
Finance and Corporate Planning Within the framework of legislation and Government controls, local authorities retain responsibility for determining the level of their budgets and how those budgets will be spent, subject to legislation and grant conditions. A budget is simply a plan expressed in financial terms. The purpose of the Council’s budget is;
• To enable the Council to fulfil its statutory duty to set a Council Tax and rent levels each financial year.
• To ensure that use of the Council’s financial resources is planned. • To set financial targets for service managers against which their use of
financial resources can be measured and controlled. • To facilitate the delivery of the Council’s corporate and service priorities by
allocating resources between services according to agreed strategies and plans.
The first of these is a statutory requirement and the Council’s process, if it does nothing else, must fulfil this obligation. None of these points can be overlooked, but arguably the fourth - about resource allocation - is the most important. It means that Finance always needs to be seen in the context of other Council plans, whether at service level or, ultimately, at corporate level. Thus, Waltham Forest will wish to ensure that its financial resources, subject
Content 2 Annual budget process 2016-17.doc
to all other constraints, are allocated in accordance with Council priorities. This is easier said than done, of course, and in practice any number of constraints prevent the Council from spending purely in accordance with its current priorities, for example:-
• Government constraints over use of resources. • Legal requirements to provide certain services. • Financial and legal commitments, and other agreements, e.g. staff contracts. • Costs incurred in implementing change. • Limited availability of resources. • Time needed to plan for change. • Pressure to maintain and improve services and not to cut back.
Some of these constraints relate to ‘fixed costs’, i.e. costs which cannot be removed in the short-term. In the medium to long term, however, the proportion of fixed costs may be very much less as the costs that cannot be varied are fewer. For this reason, it is important to plan the use of resources, as medium-term planning can allow changes to be foreseen and fixed costs to be reduced in a planned way. Government Control over Finance In the UK, Central Government through Parliament exercises overall authority over public expenditure. Public expenditure needs to be controlled as it plays a major part in the country’s economy. The Government therefore has a keen interest in controlling local government expenditure. It does this by:-
• Limiting the grants and subsidies it gives to local authorities to what it considers to be an affordable level.
• Applying pressure over Council Tax increases. • Determining the NNDR retention ratio. • Setting the NNDR multiplier. • Legal limitations to what local authorities can do. • Allocating some resources for specific purposes only (specific grants). • Setting guidelines and frameworks for local authority income, eg. restructuring
Housing Rents. • Keeping reserve powers to limit local authority budgets (known as ‘capping’). • In the case of Education, keeping reserve powers to set the schools budget
(sometimes known as ‘ring-fencing’).
Setting the Council’s annual revenue budget has been a challenging process for a number of years. The reductions in Government support as contained in both the 2010 and 2015 Spending Reviews have resulted in an unprecedented level of savings being required. This, coupled with budget pressures and a council tax freeze, has meant that savings of £98 million since 2011/12 have been approved. The Council has in every year of the Government’s fiscal consolidation programme delivered a balanced MTFS against the backdrop of growing population and an increase in the demand for services.
Content 2 Annual budget process 2016-17.doc
Budget Strategy
The main aims of the budget strategy are as follows:
• to continue to set a balanced budget for 2016/17 and over the revised MTFS period;
• to invest in the Council’s agreed priorities;
• that no additional funding for growth other than for new burdens is approved as part of these proposals;
• where grants are ceasing or funding streams of services are reducing, that exit strategies must be adhered to;
• to strengthen the Council’s financial position, so that it has sufficient reserves and balances to address future risks and unforeseen events without detriment to service delivery;
• to align budgeting and service planning, ensuring that any reductions required are considered within a corporate and strategic framework;
• to adopt a strategic approach to meeting the budgetary challenges for the remainder of the decade, using as appropriate, the Budget Strategy Reserve to support the budget so that savings can be delivered in a planned way optimising outcomes for residents and investment in improving the way that the Council delivers services (contributing to future savings requirements);
• to ensure that the Council delivers value for money and continues to identify savings, while demonstrating efficiency;
• to continue to refresh the MTFS during the annual financial planning cycle to reflect all known changes and to realistically predict potential future Spending Review assumptions;
• to ensure that savings are genuinely achievable, that the estimated financial implications are robust and subject to an assessment in accordance with equalities legislation.
2016/17 Financial Settlement The “Provisional Local Government Finance Settlement 2016/17 and an offer to councils for future years” was announced by the Secretary of State for Communities and Local Government on 17 December 2015. This settlement announcement is very significant and more complex than usual as it contained a number of important technical changes to the funding distribution system, alongside some policy changes which will affect the financial modelling assumptions up to the end of the decade. At the start of the 2010 Spending Review almost 80% of council expenditure was financed by central government grants. The Government predicts that by 2016/17 this proportion will have fallen to 16% of spending power and by 2020 it will only account for 5%. By 2020 RSG is expected to disappear altogether as we move to a 100% business rates retention system. Consequently local government will be funded locally, through council tax and business rates.
Content 2 Annual budget process 2016-17.doc
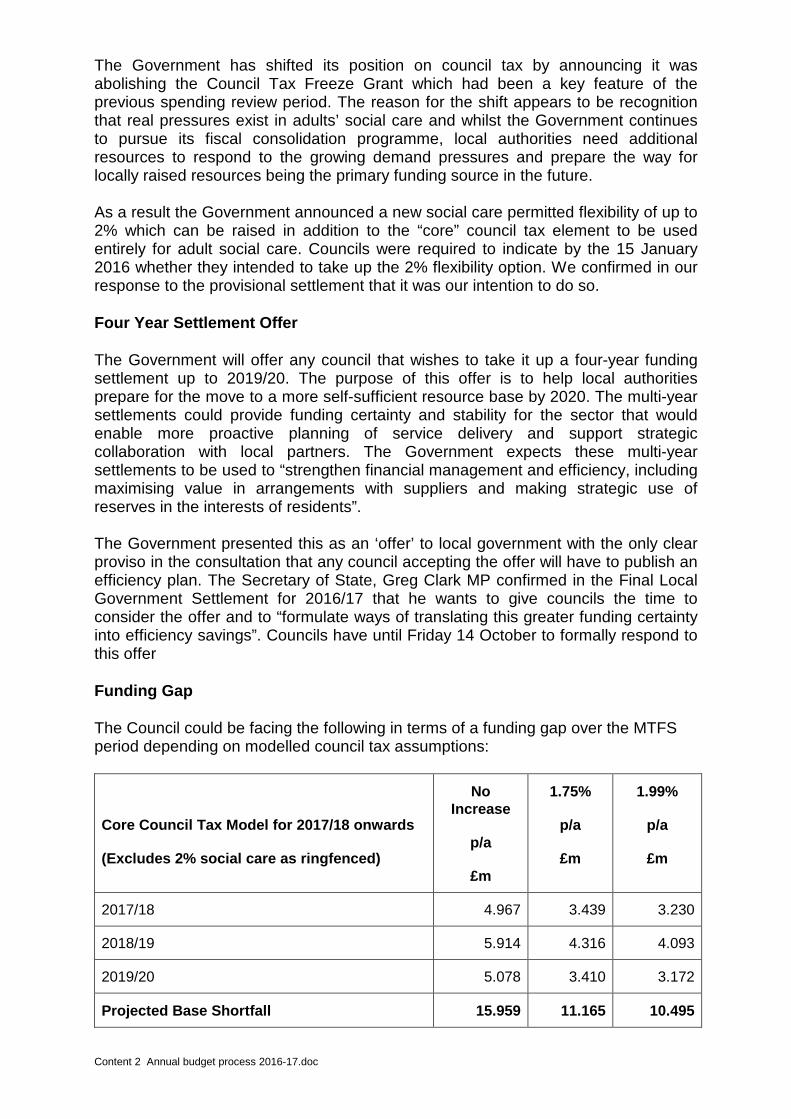
The Government has shifted its position on council tax by announcing it was abolishing the Council Tax Freeze Grant which had been a key feature of the previous spending review period. The reason for the shift appears to be recognition that real pressures exist in adults’ social care and whilst the Government continues to pursue its fiscal consolidation programme, local authorities need additional resources to respond to the growing demand pressures and prepare the way for locally raised resources being the primary funding source in the future. As a result the Government announced a new social care permitted flexibility of up to 2% which can be raised in addition to the “core” council tax element to be used entirely for adult social care. Councils were required to indicate by the 15 January 2016 whether they intended to take up the 2% flexibility option. We confirmed in our response to the provisional settlement that it was our intention to do so. Four Year Settlement Offer The Government will offer any council that wishes to take it up a four-year funding settlement up to 2019/20. The purpose of this offer is to help local authorities prepare for the move to a more self-sufficient resource base by 2020. The multi-year settlements could provide funding certainty and stability for the sector that would enable more proactive planning of service delivery and support strategic collaboration with local partners. The Government expects these multi-year settlements to be used to “strengthen financial management and efficiency, including maximising value in arrangements with suppliers and making strategic use of reserves in the interests of residents”. The Government presented this as an ‘offer’ to local government with the only clear proviso in the consultation that any council accepting the offer will have to publish an efficiency plan. The Secretary of State, Greg Clark MP confirmed in the Final Local Government Settlement for 2016/17 that he wants to give councils the time to consider the offer and to “formulate ways of translating this greater funding certainty into efficiency savings”. Councils have until Friday 14 October to formally respond to this offer Funding Gap The Council could be facing the following in terms of a funding gap over the MTFS period depending on modelled council tax assumptions:
Core Council Tax Model for 2017/18 onwards
(Excludes 2% social care as ringfenced)
No Increase
p/a
£m
1.75%
p/a
£m
1.99%
p/a
£m
2017/18 4.967 3.439 3.230
2018/19 5.914 4.316 4.093
2019/20 5.078 3.410 3.172
Projected Base Shortfall 15.959 11.165 10.495
Content 2 Annual budget process 2016-17.doc
The gap of £16 million (column one) is based on the assumed reductions in Government funding over the next spending review period, other pressures, the take up of the four year settlement offer and a proposed council tax increase of 3.99% in 2016/17 and no further increases over the spending review period. The gap of £11.2 million (column two) is based on the 3.99% being applied in 2016/17 and that future years “core” council tax will increase in line with the Government’s CPI estimate of 1.75% per annum for the period 2017/18 up to 2019/20. This would reduce the projected base shortfall by £4.8 million. The MTFS appended is modelled on this assumption. The gap of £10.5 million (column three) is based on the 3.99% being applied in 2016/17 and that future years “core” council tax will increase by 1.99% up to the referendum limit for the period 2017/18 up to 2019/20. This would reduce the projected base shortfall by £5.5 million. Both models are based on the full delivery of the package of savings totalling £13.762 million from Redefining Waltham Forest (RWF) Phase Two approved by Cabinet in July 2015, along with the previously approved Redefining Waltham Forest Phase One savings. A significant proportion of the approved RWF savings are due to be delivered in 2016/17, leaving only a residual sum of £1.2 million expected in 2017/18. In addition to the approved RWF savings, the MTFS assumes an annual 2% efficiency savings target of £3 million effective from 2017/18, continuing through to the end of the spending review period, which equates to a total of £9 million. If there is any slippage on these efficiency targets, the base shortfalls above would increase. Budget Strategy Reserve (BSR)
As part of the approved budget strategy, a Budget Strategy Reserve (BSR) was set up to help fund future years’ funding gaps to give the Council some time to formulate new sustainable reductions. The reserves review concluded that £8.226 million is recommended to transfer from other reserves into the BSR. In addition, the revised MTFS now includes planned contributions of £8.424 million to the BSR in 2016/17. This contribution is predicated on the approved savings being secured as profiled within the MTFS.
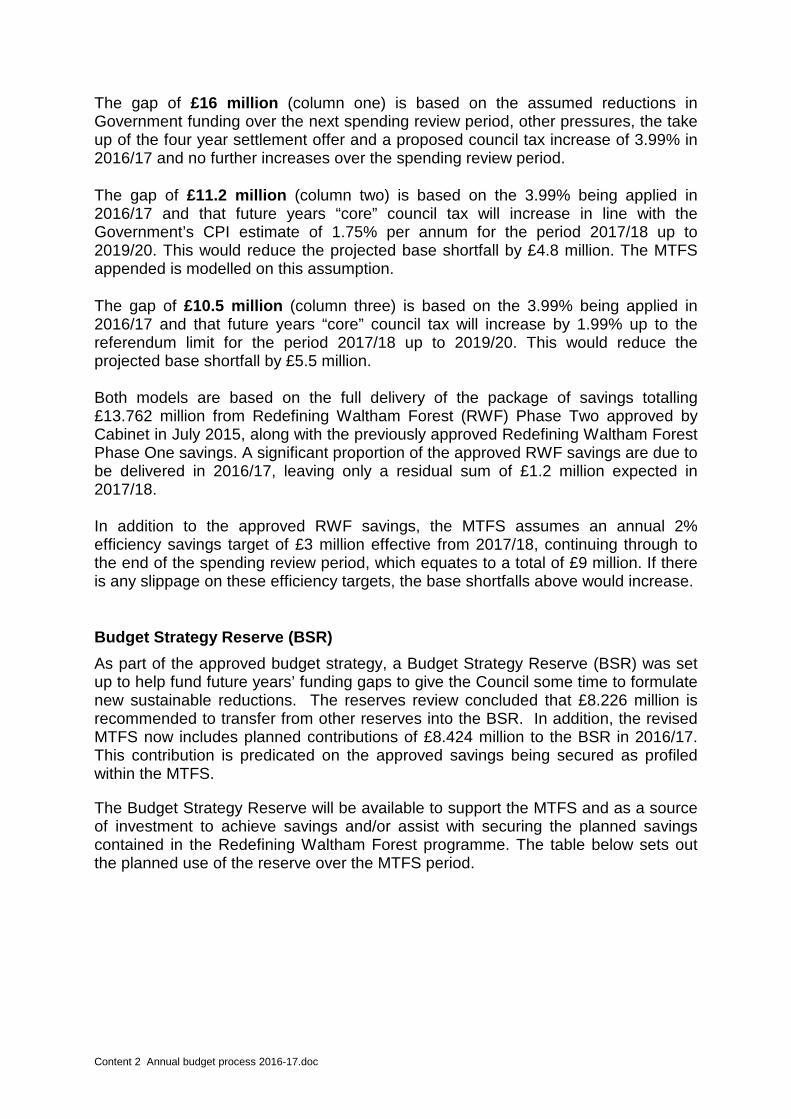
The Budget Strategy Reserve will be available to support the MTFS and as a source of investment to achieve savings and/or assist with securing the planned savings contained in the Redefining Waltham Forest programme. The table below sets out the planned use of the reserve over the MTFS period.
Content 2 Annual budget process 2016-17.doc
£’000
Balance at 31.3.15 37,912
Additional NNDR s31 grant 668
Repayment of Licensing ‘loan’ 719
Projected use of BSR 2015/16 (12,228)
Planned contribution per MTFS 1,292
Transfer in per Reserves Review 8,226
Projected Balance at 31.3.16 36,589
Projected use of BSR 2016/17 (8,770)
Planned contribution per MTFS 8,424
Projected Balance at 31.3.17 36,243
Required to support 2017/18 (3,439)
Required to support 2018/19 (7,755)
Projected Balance at 31.3.19 25,049
As can be seen from the above table, there are sufficient resources in the BSR to support the MTFS up to 2018/19 based on the existing set of assumptions. If the Council decided to increase council tax levels over the remaining MTFS period, further resources could be available to partially support the MTFS in 2019/20 and/or meet other priorities.
Redefining Waltham Forest
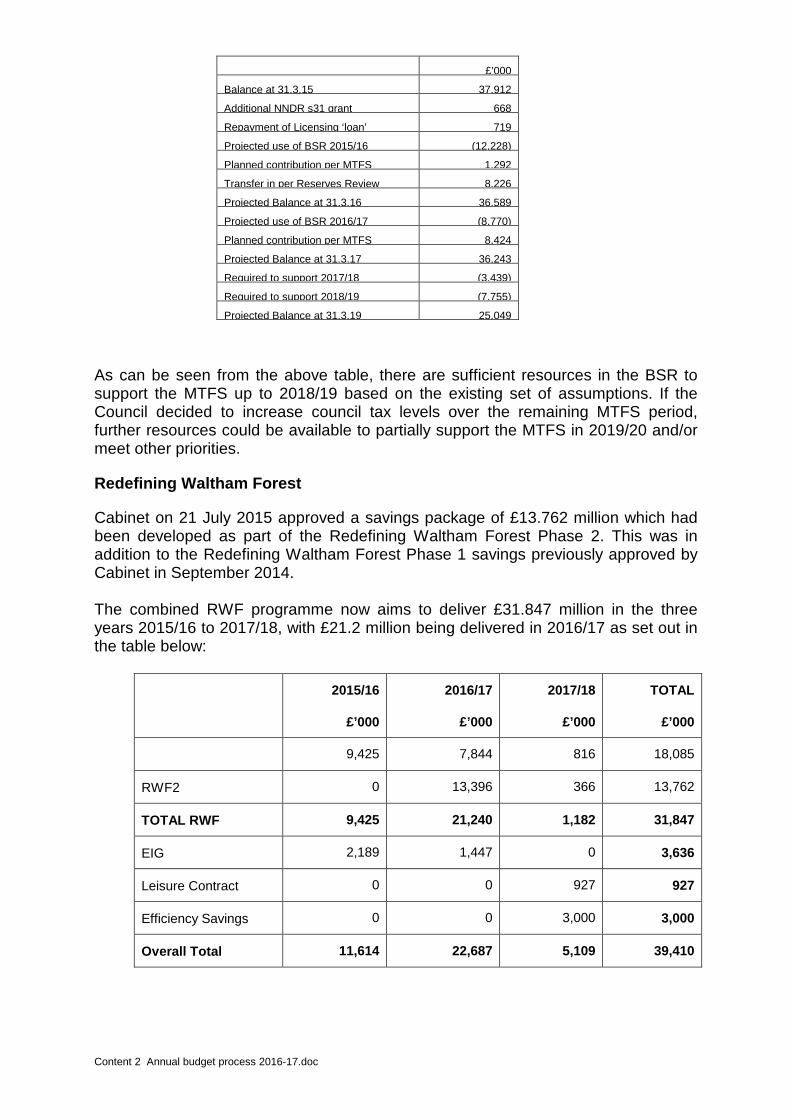
Cabinet on 21 July 2015 approved a savings package of £13.762 million which had been developed as part of the Redefining Waltham Forest Phase 2. This was in addition to the Redefining Waltham Forest Phase 1 savings previously approved by Cabinet in September 2014. The combined RWF programme now aims to deliver £31.847 million in the three years 2015/16 to 2017/18, with £21.2 million being delivered in 2016/17 as set out in the table below:
2015/16
£’000
2016/17
£’000
2017/18
£’000
TOTAL
£’000
9,425 7,844 816 18,085
RWF2 0 13,396 366 13,762
TOTAL RWF 9,425 21,240 1,182 31,847
EIG 2,189 1,447 0 3,636
Leisure Contract 0 0 927 927
Efficiency Savings 0 0 3,000 3,000
Overall Total 11,614 22,687 5,109 39,410
Content 2 Annual budget process 2016-17.doc
In addition to the new RWF savings previously approved by Cabinet, there are still some existing MTFS savings to be implemented during 2016/17, including some grant exit strategies around Early Intervention Grant. The Leisure Services contract will start to deliver savings from 2017/18 in line with the original financial modelling assumptions as the delivery of the new Waltham Forest facility is confirmed for autumn 2016. The MTFS contains a 2% Efficiency Target for each service from 2017/18 and this programme is expected to deliver £9 million of savings over the Spending Review period. The Directorate Programme Boards will continue to monitor the deliverability of all approved savings and progress will be reported to Cabinet as part of the regular revenue monitoring process. BASE BUDGET 2016/17 The Base Budget is updated to take account of the approved full year effects of budget changes, other cost increases and commitments.
Pay Awards, Price Inflation The offer for the pay award for APTC staff is a rise of 1% from April 2016. The allocation to contingency for pay awards is 1% in 2016/17 and subsequent years through to 2019/20. The allocation to contingency for price increases is based on 1.5% of contractor payments in 2016/17 and 2% from 2017/18 through to 2019/20. In general, the 2016/17 service budgets do not include any increase for pay and prices. A sum of £1.719 million has been set aside in the 2016/17 Revenue Budget for non-pay related inflation.
Cabinet agreed the proposed fees and charges for 2016/17 on 15 December 2015 and 26 January 2016 and these increases have been reflected in the service budgets.
Central Contingency The amount held in central contingency is £5.926 million in 2016/17, following an additional allocation of £3 million. It is considered prudent to increase the level of contingency held due to the service risks the Council is facing around Homelessness, Adult Social Care and No Recourse to Public Funds cases. The increased level of central contingency is good practice in an uncertain financial environment. Cabinet will be requested to approve the use of contingency funding as part of the regular budget monitoring process during the year.
GENERAL FUND The General Fund includes all expenditure and income relating to the Council’s main services other than the provision of Council housing for rent. This is accounted for separately in the Housing Revenue Account (HRA) and a separate MTFS has been developed and reported to Cabinet on the 23 February 2016. The Council also operates other specialist funds not related to the main services, for example, the Pension Fund, which deals with pensions on behalf of its employees. The Council’s net budget for General Fund services for 2016/17 after allowing for contributions from balances and reserves and the Interest and Capital Charges
Content 2 Annual budget process 2016-17.doc
Account, is shown on page 11. To this is added the amount the Council is required to pay in levies to other Authorities, totalling £7.820million. By law, this is required to be met from Waltham Forest’s General Fund. In addition, any surplus or deficit on the Council Tax Collection Fund is to be shared between the preceptors on that Fund. Waltham Forest’s share of the surplus in respect of 2014/15 was £6.938 million of which £2.35 million was accounted for in 2014/15. The balance of £5.408 million was accounted for in 2015/16 along with the estimated surplus for 2015/16 of £2.344 million. With the introduction of Business Rate retention, it is necessary to calculate the likely surplus/deficit on the collection fund for business rates. The authority’s share of the deficit for 2014/15 was £1.369 million but £1.809 million was accounted for in 2015/16, which means an adjustment of £440,000 needs to be made in 2015/16. The projection for the authority’s share in 2015/16 is a deficit of £892,000, and this is largely due to back dated appeals and an increase in the bad debt provision. The resulting net £452,000 deficit has been accounted for in 2016/17.
Receipts from Business Rates Retention, Revenue Support Grant, Top Up, Dedicated Schools Grant and a number of other Exchequer Grants are treated as income to the General Fund. The Budget Requirement, less total exchequer support brings the amount required from Council Tax payers to support Waltham Forest’s spending to £86,128million (page 12). COUNCIL TAX 2016/17 The Council approved its budget and precepting requirements on the 3 March 2016. As set out above, the amount required from Council Tax by Waltham Forest to support its expenditure in 2016/17 is £86,128 million. In addition, the precept upon this borough by the Greater London Authority amounts to £19,839 million. This brings the total expenditure to be met by Waltham Forest Council Taxpayers to £105,967 million. The Localism Act introduced new provisions for council tax referenda and replaced the previous capping rules. Authorities are required to determine whether the amount of council tax they plan to raise is excessive. The Secretary of State defines annually a set of principles which determine the level of increase that would be ‘excessive’.
For 2016/17, the relevant basic amount of council tax is deemed excessive if it is more than 2% greater than its relevant basic amount of council tax for 2015/16. se
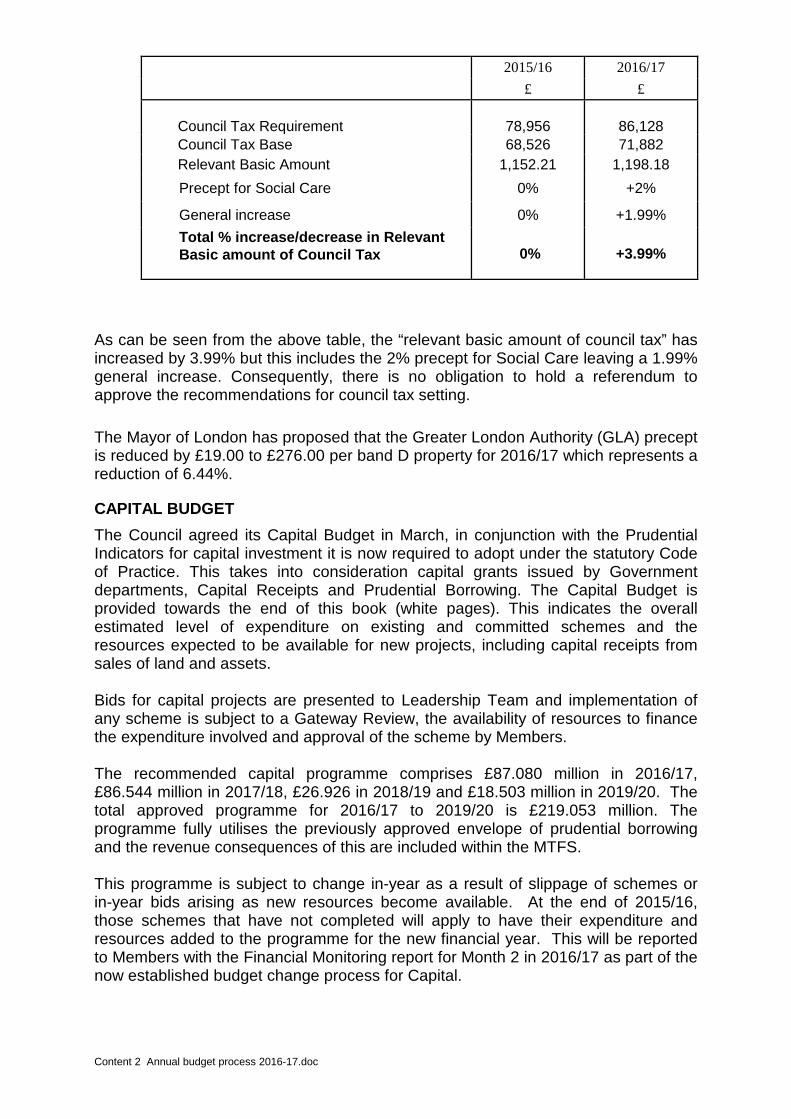
The relevant figures for determining whether the 2016/17 council tax increase is excessive are set out in the following table:
Content 2 Annual budget process 2016-17.doc
2015/16 2016/17
£ £ Council Tax Requirement
78,956
86,128
Council Tax Base 68,526 71,882 Relevant Basic Amount 1,152.21 1,198.18
Precept for Social Care 0% +2%
General increase 0% +1.99% Total % increase/decrease in Relevant Basic amount of Council Tax
0% +3.99%
As can be seen from the above table, the “relevant basic amount of council tax” has increased by 3.99% but this includes the 2% precept for Social Care leaving a 1.99% general increase. Consequently, there is no obligation to hold a referendum to approve the recommendations for council tax setting.
The Mayor of London has proposed that the Greater London Authority (GLA) precept is reduced by £19.00 to £276.00 per band D property for 2016/17 which represents a reduction of 6.44%.
CAPITAL BUDGET The Council agreed its Capital Budget in March, in conjunction with the Prudential Indicators for capital investment it is now required to adopt under the statutory Code of Practice. This takes into consideration capital grants issued by Government departments, Capital Receipts and Prudential Borrowing. The Capital Budget is provided towards the end of this book (white pages). This indicates the overall estimated level of expenditure on existing and committed schemes and the resources expected to be available for new projects, including capital receipts from sales of land and assets. Bids for capital projects are presented to Leadership Team and implementation of any scheme is subject to a Gateway Review, the availability of resources to finance the expenditure involved and approval of the scheme by Members. The recommended capital programme comprises £87.080 million in 2016/17, £86.544 million in 2017/18, £26.926 in 2018/19 and £18.503 million in 2019/20. The total approved programme for 2016/17 to 2019/20 is £219.053 million. The programme fully utilises the previously approved envelope of prudential borrowing and the revenue consequences of this are included within the MTFS.
This programme is subject to change in-year as a result of slippage of schemes or in-year bids arising as new resources become available. At the end of 2015/16, those schemes that have not completed will apply to have their expenditure and resources added to the programme for the new financial year. This will be reported to Members with the Financial Monitoring report for Month 2 in 2016/17 as part of the now established budget change process for Capital.
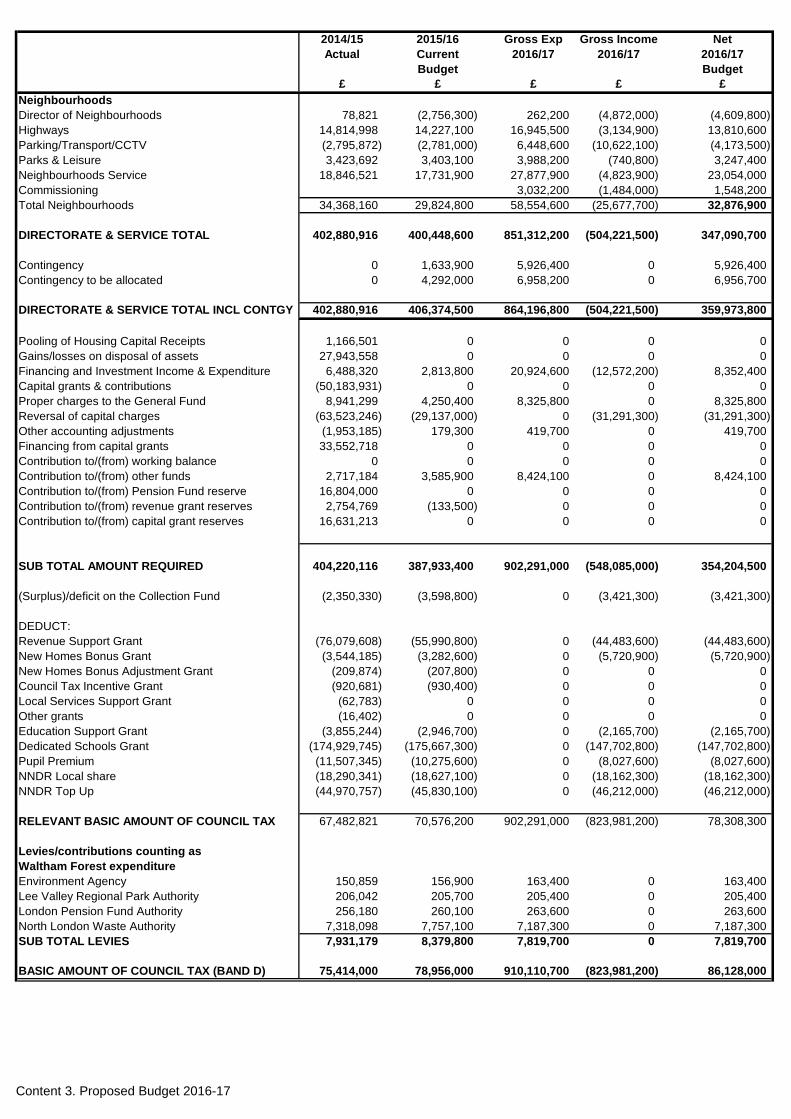
Content 3. Proposed Budget 2016-17
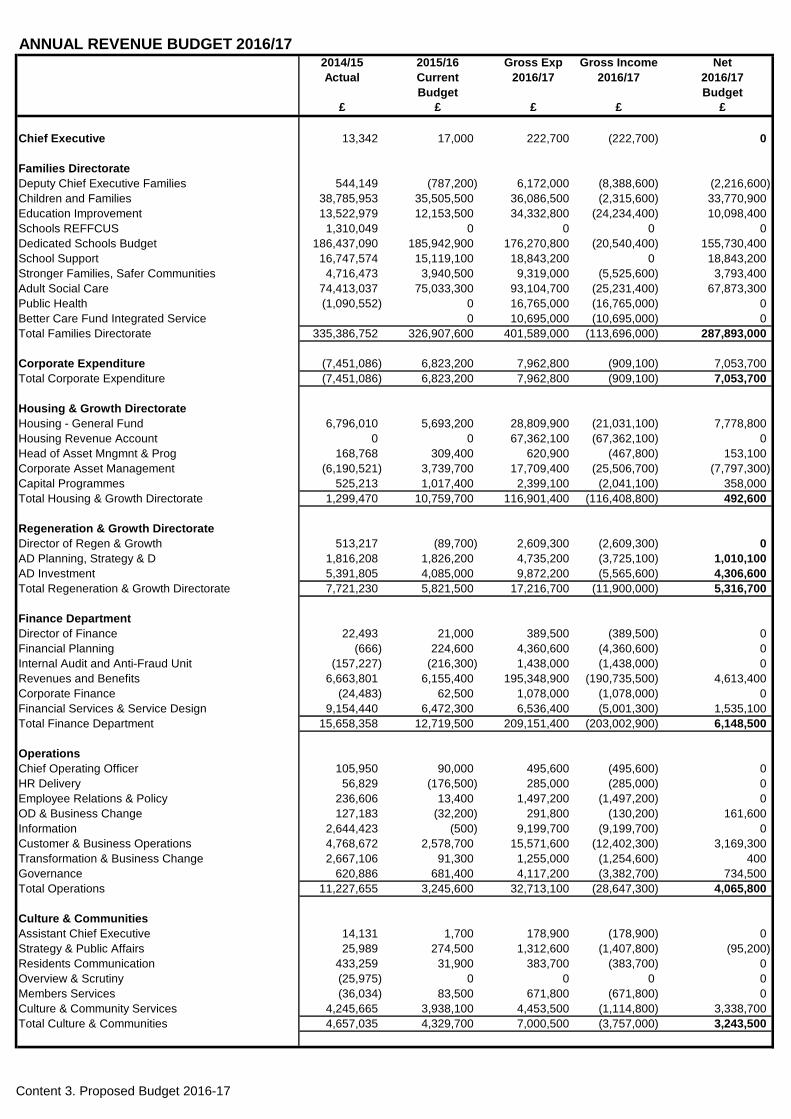
ANNUAL REVENUE BUDGET 2016/172014/15 2015/16 Gross Exp Gross Income NetActual Current 2016/17 2016/17 2016/17
Budget Budget£ £ £ £ £
Chief Executive 13,342 17,000 222,700 (222,700) 0
Families DirectorateDeputy Chief Executive Families 544,149 (787,200) 6,172,000 (8,388,600) (2,216,600)Children and Families 38,785,953 35,505,500 36,086,500 (2,315,600) 33,770,900Education Improvement 13,522,979 12,153,500 34,332,800 (24,234,400) 10,098,400Schools REFFCUS 1,310,049 0 0 0 0Dedicated Schools Budget 186,437,090 185,942,900 176,270,800 (20,540,400) 155,730,400School Support 16,747,574 15,119,100 18,843,200 0 18,843,200Stronger Families, Safer Communities 4,716,473 3,940,500 9,319,000 (5,525,600) 3,793,400Adult Social Care 74,413,037 75,033,300 93,104,700 (25,231,400) 67,873,300Public Health (1,090,552) 0 16,765,000 (16,765,000) 0Better Care Fund Integrated Service 0 10,695,000 (10,695,000) 0Total Families Directorate 335,386,752 326,907,600 401,589,000 (113,696,000) 287,893,000
Corporate Expenditure (7,451,086) 6,823,200 7,962,800 (909,100) 7,053,700Total Corporate Expenditure (7,451,086) 6,823,200 7,962,800 (909,100) 7,053,700
Housing & Growth DirectorateHousing - General Fund 6,796,010 5,693,200 28,809,900 (21,031,100) 7,778,800Housing Revenue Account 0 0 67,362,100 (67,362,100) 0Head of Asset Mngmnt & Prog 168,768 309,400 620,900 (467,800) 153,100Corporate Asset Management (6,190,521) 3,739,700 17,709,400 (25,506,700) (7,797,300)Capital Programmes 525,213 1,017,400 2,399,100 (2,041,100) 358,000Total Housing & Growth Directorate 1,299,470 10,759,700 116,901,400 (116,408,800) 492,600
Regeneration & Growth DirectorateDirector of Regen & Growth 513,217 (89,700) 2,609,300 (2,609,300) 0AD Planning, Strategy & D 1,816,208 1,826,200 4,735,200 (3,725,100) 1,010,100AD Investment 5,391,805 4,085,000 9,872,200 (5,565,600) 4,306,600Total Regeneration & Growth Directorate 7,721,230 5,821,500 17,216,700 (11,900,000) 5,316,700
Finance DepartmentDirector of Finance 22,493 21,000 389,500 (389,500) 0Financial Planning (666) 224,600 4,360,600 (4,360,600) 0Internal Audit and Anti-Fraud Unit (157,227) (216,300) 1,438,000 (1,438,000) 0Revenues and Benefits 6,663,801 6,155,400 195,348,900 (190,735,500) 4,613,400Corporate Finance (24,483) 62,500 1,078,000 (1,078,000) 0Financial Services & Service Design 9,154,440 6,472,300 6,536,400 (5,001,300) 1,535,100Total Finance Department 15,658,358 12,719,500 209,151,400 (203,002,900) 6,148,500
OperationsChief Operating Officer 105,950 90,000 495,600 (495,600) 0HR Delivery 56,829 (176,500) 285,000 (285,000) 0Employee Relations & Policy 236,606 13,400 1,497,200 (1,497,200) 0OD & Business Change 127,183 (32,200) 291,800 (130,200) 161,600Information 2,644,423 (500) 9,199,700 (9,199,700) 0Customer & Business Operations 4,768,672 2,578,700 15,571,600 (12,402,300) 3,169,300Transformation & Business Change 2,667,106 91,300 1,255,000 (1,254,600) 400Governance 620,886 681,400 4,117,200 (3,382,700) 734,500Total Operations 11,227,655 3,245,600 32,713,100 (28,647,300) 4,065,800
Culture & CommunitiesAssistant Chief Executive 14,131 1,700 178,900 (178,900) 0Strategy & Public Affairs 25,989 274,500 1,312,600 (1,407,800) (95,200)Residents Communication 433,259 31,900 383,700 (383,700) 0Overview & Scrutiny (25,975) 0 0 0 0Members Services (36,034) 83,500 671,800 (671,800) 0Culture & Community Services 4,245,665 3,938,100 4,453,500 (1,114,800) 3,338,700Total Culture & Communities 4,657,035 4,329,700 7,000,500 (3,757,000) 3,243,500
Content 3. Proposed Budget 2016-17
2014/15 2015/16 Gross Exp Gross Income NetActual Current 2016/17 2016/17 2016/17
Budget Budget£ £ £ £ £
NeighbourhoodsDirector of Neighbourhoods 78,821 (2,756,300) 262,200 (4,872,000) (4,609,800)Highways 14,814,998 14,227,100 16,945,500 (3,134,900) 13,810,600Parking/Transport/CCTV (2,795,872) (2,781,000) 6,448,600 (10,622,100) (4,173,500)Parks & Leisure 3,423,692 3,403,100 3,988,200 (740,800) 3,247,400Neighbourhoods Service 18,846,521 17,731,900 27,877,900 (4,823,900) 23,054,000Commissioning 3,032,200 (1,484,000) 1,548,200Total Neighbourhoods 34,368,160 29,824,800 58,554,600 (25,677,700) 32,876,900
DIRECTORATE & SERVICE TOTAL 402,880,916 400,448,600 851,312,200 (504,221,500) 347,090,700
Contingency 0 1,633,900 5,926,400 0 5,926,400Contingency to be allocated 0 4,292,000 6,958,200 0 6,956,700
DIRECTORATE & SERVICE TOTAL INCL CONTGY 402,880,916 406,374,500 864,196,800 (504,221,500) 359,973,800
Pooling of Housing Capital Receipts 1,166,501 0 0 0 0Gains/losses on disposal of assets 27,943,558 0 0 0 0Financing and Investment Income & Expenditure 6,488,320 2,813,800 20,924,600 (12,572,200) 8,352,400Capital grants & contributions (50,183,931) 0 0 0 0Proper charges to the General Fund 8,941,299 4,250,400 8,325,800 0 8,325,800Reversal of capital charges (63,523,246) (29,137,000) 0 (31,291,300) (31,291,300)Other accounting adjustments (1,953,185) 179,300 419,700 0 419,700Financing from capital grants 33,552,718 0 0 0 0Contribution to/(from) working balance 0 0 0 0 0Contribution to/(from) other funds 2,717,184 3,585,900 8,424,100 0 8,424,100Contribution to/(from) Pension Fund reserve 16,804,000 0 0 0 0Contribution to/(from) revenue grant reserves 2,754,769 (133,500) 0 0 0Contribution to/(from) capital grant reserves 16,631,213 0 0 0 0
SUB TOTAL AMOUNT REQUIRED 404,220,116 387,933,400 902,291,000 (548,085,000) 354,204,500
(Surplus)/deficit on the Collection Fund (2,350,330) (3,598,800) 0 (3,421,300) (3,421,300)
DEDUCT:Revenue Support Grant (76,079,608) (55,990,800) 0 (44,483,600) (44,483,600)New Homes Bonus Grant (3,544,185) (3,282,600) 0 (5,720,900) (5,720,900)New Homes Bonus Adjustment Grant (209,874) (207,800) 0 0 0Council Tax Incentive Grant (920,681) (930,400) 0 0 0Local Services Support Grant (62,783) 0 0 0 0Other grants (16,402) 0 0 0 0Education Support Grant (3,855,244) (2,946,700) 0 (2,165,700) (2,165,700)Dedicated Schools Grant (174,929,745) (175,667,300) 0 (147,702,800) (147,702,800)Pupil Premium (11,507,345) (10,275,600) 0 (8,027,600) (8,027,600)NNDR Local share (18,290,341) (18,627,100) 0 (18,162,300) (18,162,300)NNDR Top Up (44,970,757) (45,830,100) 0 (46,212,000) (46,212,000)
RELEVANT BASIC AMOUNT OF COUNCIL TAX 67,482,821 70,576,200 902,291,000 (823,981,200) 78,308,300
Levies/contributions counting asWaltham Forest expenditureEnvironment Agency 150,859 156,900 163,400 0 163,400Lee Valley Regional Park Authority 206,042 205,700 205,400 0 205,400London Pension Fund Authority 256,180 260,100 263,600 0 263,600North London Waste Authority 7,318,098 7,757,100 7,187,300 0 7,187,300SUB TOTAL LEVIES 7,931,179 8,379,800 7,819,700 0 7,819,700
BASIC AMOUNT OF COUNCIL TAX (BAND D) 75,414,000 78,956,000 910,110,700 (823,981,200) 86,128,000
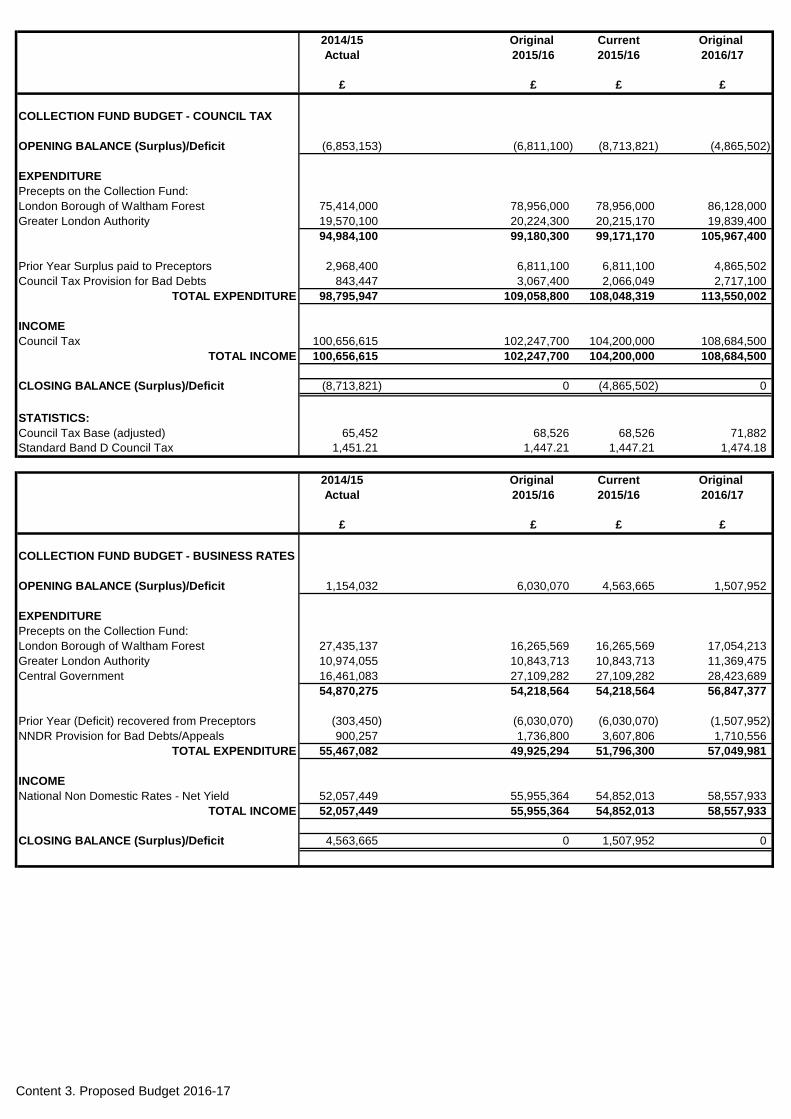
Content 3. Proposed Budget 2016-17
2014/15 Original Current Original Actual 2015/16 2015/16 2016/17
£ £ £ £
COLLECTION FUND BUDGET - COUNCIL TAX
OPENING BALANCE (Surplus)/Deficit (6,853,153) (6,811,100) (8,713,821) (4,865,502)
EXPENDITUREPrecepts on the Collection Fund:London Borough of Waltham Forest 75,414,000 78,956,000 78,956,000 86,128,000Greater London Authority 19,570,100 20,224,300 20,215,170 19,839,400
94,984,100 99,180,300 99,171,170 105,967,400
Prior Year Surplus paid to Preceptors 2,968,400 6,811,100 6,811,100 4,865,502Council Tax Provision for Bad Debts 843,447 3,067,400 2,066,049 2,717,100
TOTAL EXPENDITURE 98,795,947 109,058,800 108,048,319 113,550,002
INCOMECouncil Tax 100,656,615 102,247,700 104,200,000 108,684,500
TOTAL INCOME 100,656,615 102,247,700 104,200,000 108,684,500
CLOSING BALANCE (Surplus)/Deficit (8,713,821) 0 (4,865,502) 0
STATISTICS:Council Tax Base (adjusted) 65,452 68,526 68,526 71,882Standard Band D Council Tax 1,451.21 1,447.21 1,447.21 1,474.18
2014/15 Original Current Original Actual 2015/16 2015/16 2016/17
£ £ £ £
COLLECTION FUND BUDGET - BUSINESS RATES
OPENING BALANCE (Surplus)/Deficit 1,154,032 6,030,070 4,563,665 1,507,952
EXPENDITUREPrecepts on the Collection Fund:London Borough of Waltham Forest 27,435,137 16,265,569 16,265,569 17,054,213Greater London Authority 10,974,055 10,843,713 10,843,713 11,369,475Central Government 16,461,083 27,109,282 27,109,282 28,423,689
54,870,275 54,218,564 54,218,564 56,847,377
Prior Year (Deficit) recovered from Preceptors (303,450) (6,030,070) (6,030,070) (1,507,952)NNDR Provision for Bad Debts/Appeals 900,257 1,736,800 3,607,806 1,710,556
TOTAL EXPENDITURE 55,467,082 49,925,294 51,796,300 57,049,981
INCOMENational Non Domestic Rates - Net Yield 52,057,449 55,955,364 54,852,013 58,557,933
TOTAL INCOME 52,057,449 55,955,364 54,852,013 58,557,933
CLOSING BALANCE (Surplus)/Deficit 4,563,665 0 1,507,952 0
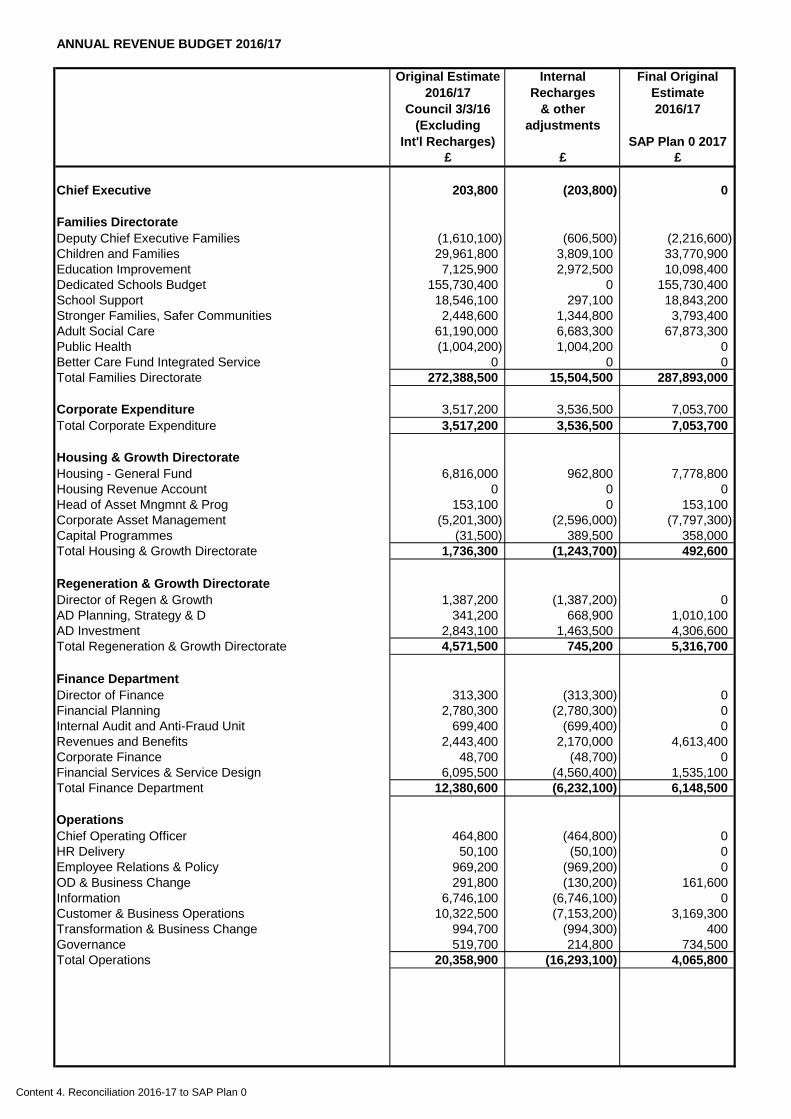
Content 4. Reconciliation 2016-17 to SAP Plan 0
ANNUAL REVENUE BUDGET 2016/17
Original Estimate Internal Final Original2016/17 Recharges Estimate
Council 3/3/16 & other 2016/17(Excluding adjustments
Int'l Recharges) SAP Plan 0 2017£ £ £
Chief Executive 203,800 (203,800) 0
Families DirectorateDeputy Chief Executive Families (1,610,100) (606,500) (2,216,600)Children and Families 29,961,800 3,809,100 33,770,900Education Improvement 7,125,900 2,972,500 10,098,400Dedicated Schools Budget 155,730,400 0 155,730,400School Support 18,546,100 297,100 18,843,200Stronger Families, Safer Communities 2,448,600 1,344,800 3,793,400Adult Social Care 61,190,000 6,683,300 67,873,300Public Health (1,004,200) 1,004,200 0Better Care Fund Integrated Service 0 0 0Total Families Directorate 272,388,500 15,504,500 287,893,000
Corporate Expenditure 3,517,200 3,536,500 7,053,700Total Corporate Expenditure 3,517,200 3,536,500 7,053,700
Housing & Growth DirectorateHousing - General Fund 6,816,000 962,800 7,778,800Housing Revenue Account 0 0 0Head of Asset Mngmnt & Prog 153,100 0 153,100Corporate Asset Management (5,201,300) (2,596,000) (7,797,300)Capital Programmes (31,500) 389,500 358,000Total Housing & Growth Directorate 1,736,300 (1,243,700) 492,600
Regeneration & Growth DirectorateDirector of Regen & Growth 1,387,200 (1,387,200) 0AD Planning, Strategy & D 341,200 668,900 1,010,100AD Investment 2,843,100 1,463,500 4,306,600Total Regeneration & Growth Directorate 4,571,500 745,200 5,316,700
Finance DepartmentDirector of Finance 313,300 (313,300) 0Financial Planning 2,780,300 (2,780,300) 0Internal Audit and Anti-Fraud Unit 699,400 (699,400) 0Revenues and Benefits 2,443,400 2,170,000 4,613,400Corporate Finance 48,700 (48,700) 0Financial Services & Service Design 6,095,500 (4,560,400) 1,535,100Total Finance Department 12,380,600 (6,232,100) 6,148,500
OperationsChief Operating Officer 464,800 (464,800) 0HR Delivery 50,100 (50,100) 0Employee Relations & Policy 969,200 (969,200) 0OD & Business Change 291,800 (130,200) 161,600Information 6,746,100 (6,746,100) 0Customer & Business Operations 10,322,500 (7,153,200) 3,169,300Transformation & Business Change 994,700 (994,300) 400Governance 519,700 214,800 734,500Total Operations 20,358,900 (16,293,100) 4,065,800
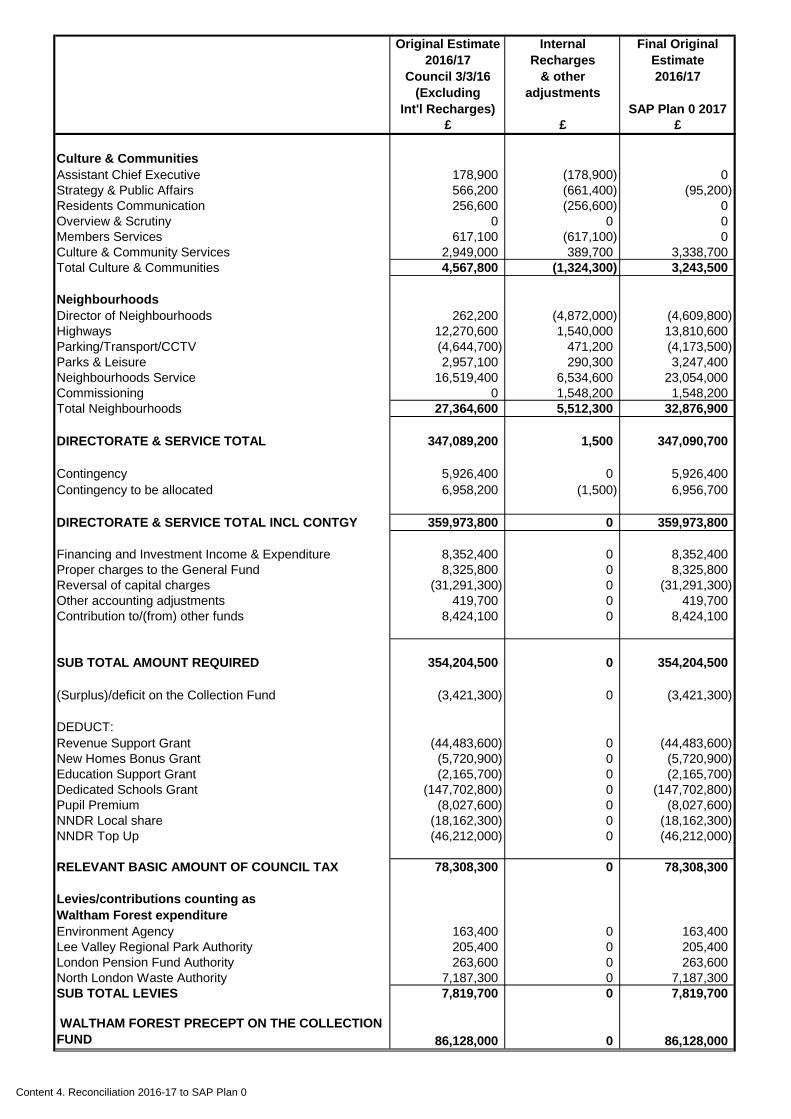
Content 4. Reconciliation 2016-17 to SAP Plan 0
Original Estimate Internal Final Original2016/17 Recharges Estimate
Council 3/3/16 & other 2016/17(Excluding adjustments
Int'l Recharges) SAP Plan 0 2017£ £ £
Culture & CommunitiesAssistant Chief Executive 178,900 (178,900) 0Strategy & Public Affairs 566,200 (661,400) (95,200)Residents Communication 256,600 (256,600) 0Overview & Scrutiny 0 0 0Members Services 617,100 (617,100) 0Culture & Community Services 2,949,000 389,700 3,338,700Total Culture & Communities 4,567,800 (1,324,300) 3,243,500
NeighbourhoodsDirector of Neighbourhoods 262,200 (4,872,000) (4,609,800)Highways 12,270,600 1,540,000 13,810,600Parking/Transport/CCTV (4,644,700) 471,200 (4,173,500)Parks & Leisure 2,957,100 290,300 3,247,400Neighbourhoods Service 16,519,400 6,534,600 23,054,000Commissioning 0 1,548,200 1,548,200Total Neighbourhoods 27,364,600 5,512,300 32,876,900
DIRECTORATE & SERVICE TOTAL 347,089,200 1,500 347,090,700
Contingency 5,926,400 0 5,926,400Contingency to be allocated 6,958,200 (1,500) 6,956,700
DIRECTORATE & SERVICE TOTAL INCL CONTGY 359,973,800 0 359,973,800
Financing and Investment Income & Expenditure 8,352,400 0 8,352,400Proper charges to the General Fund 8,325,800 0 8,325,800Reversal of capital charges (31,291,300) 0 (31,291,300)Other accounting adjustments 419,700 0 419,700Contribution to/(from) other funds 8,424,100 0 8,424,100
SUB TOTAL AMOUNT REQUIRED 354,204,500 0 354,204,500
(Surplus)/deficit on the Collection Fund (3,421,300) 0 (3,421,300)
DEDUCT:Revenue Support Grant (44,483,600) 0 (44,483,600)New Homes Bonus Grant (5,720,900) 0 (5,720,900)Education Support Grant (2,165,700) 0 (2,165,700)Dedicated Schools Grant (147,702,800) 0 (147,702,800)Pupil Premium (8,027,600) 0 (8,027,600)NNDR Local share (18,162,300) 0 (18,162,300)NNDR Top Up (46,212,000) 0 (46,212,000)
RELEVANT BASIC AMOUNT OF COUNCIL TAX 78,308,300 0 78,308,300
Levies/contributions counting asWaltham Forest expenditureEnvironment Agency 163,400 0 163,400Lee Valley Regional Park Authority 205,400 0 205,400London Pension Fund Authority 263,600 0 263,600North London Waste Authority 7,187,300 0 7,187,300SUB TOTAL LEVIES 7,819,700 0 7,819,700
WALTHAM FOREST PRECEPT ON THE COLLECTION FUND 86,128,000 0 86,128,000
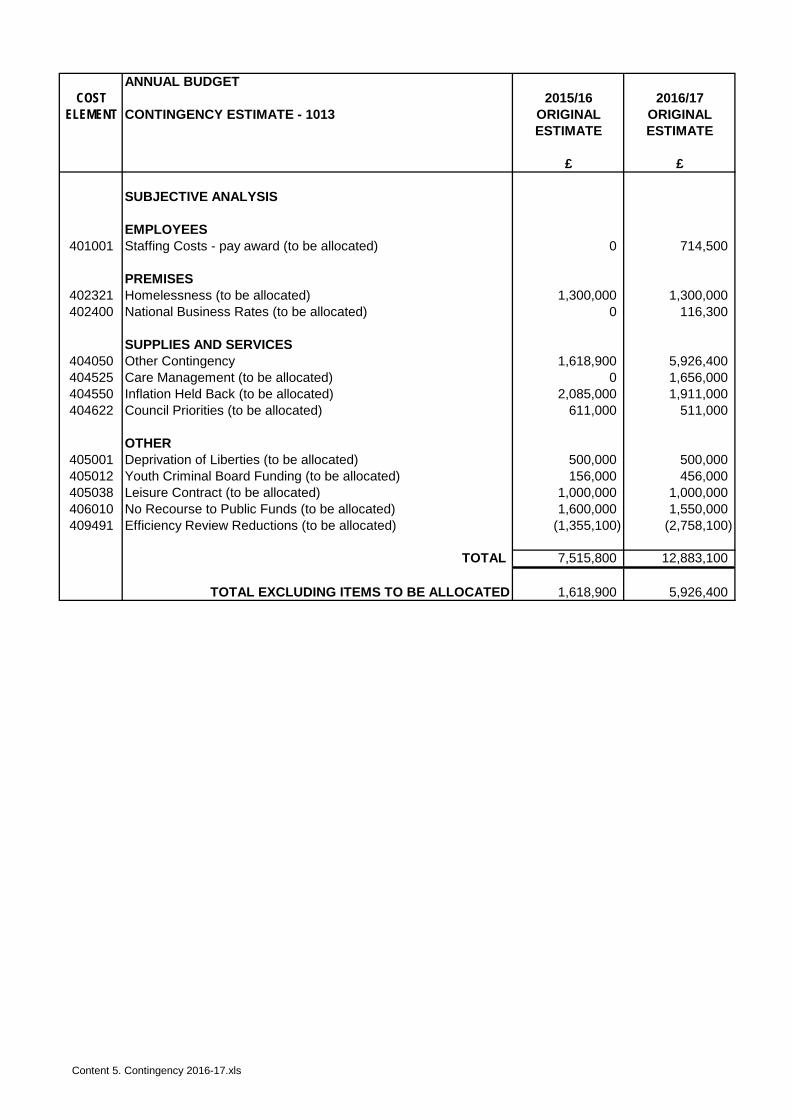
Content 5. Contingency 2016-17.xls
ANNUAL BUDGETCOST 2015/16 2016/17
ELEMENT CONTINGENCY ESTIMATE - 1013 ORIGINAL ORIGINALESTIMATE ESTIMATE
£ £
SUBJECTIVE ANALYSIS
EMPLOYEES401001 Staffing Costs - pay award (to be allocated) 0 714,500
PREMISES402321 Homelessness (to be allocated) 1,300,000 1,300,000402400 National Business Rates (to be allocated) 0 116,300
SUPPLIES AND SERVICES404050 Other Contingency 1,618,900 5,926,400404525 Care Management (to be allocated) 0 1,656,000404550 Inflation Held Back (to be allocated) 2,085,000 1,911,000404622 Council Priorities (to be allocated) 611,000 511,000
OTHER405001 Deprivation of Liberties (to be allocated) 500,000 500,000405012 Youth Criminal Board Funding (to be allocated) 156,000 456,000405038 Leisure Contract (to be allocated) 1,000,000 1,000,000406010 No Recourse to Public Funds (to be allocated) 1,600,000 1,550,000409491 Efficiency Review Reductions (to be allocated) (1,355,100) (2,758,100)
TOTAL 7,515,800 12,883,100
TOTAL EXCLUDING ITEMS TO BE ALLOCATED 1,618,900 5,926,400
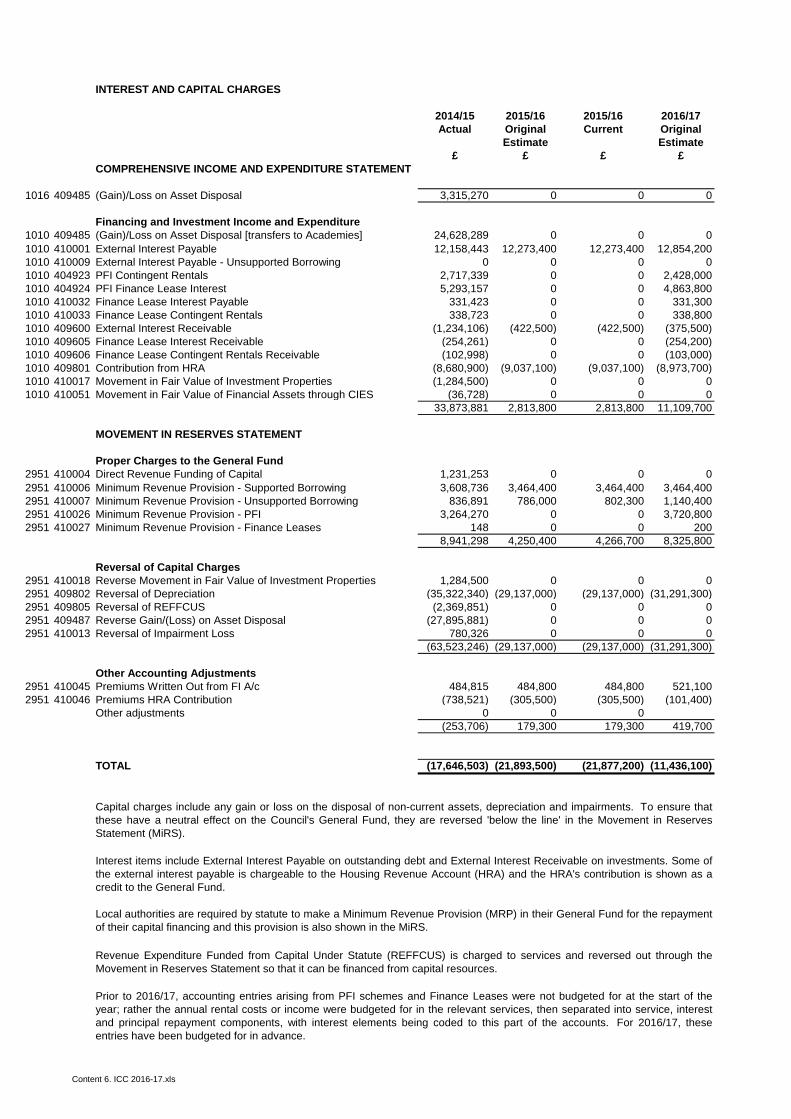
Content 6. ICC 2016-17.xls
INTEREST AND CAPITAL CHARGES
2014/15 2015/16 2015/16 2016/17Actual Original Current Original
Estimate Estimate£ £ £ £
COMPREHENSIVE INCOME AND EXPENDITURE STATEMENT
1016 409485 (Gain)/Loss on Asset Disposal 3,315,270 0 0 0
Financing and Investment Income and Expenditure1010 409485 (Gain)/Loss on Asset Disposal [transfers to Academies] 24,628,289 0 0 01010 410001 External Interest Payable 12,158,443 12,273,400 12,273,400 12,854,2001010 410009 External Interest Payable - Unsupported Borrowing 0 0 0 01010 404923 PFI Contingent Rentals 2,717,339 0 0 2,428,0001010 404924 PFI Finance Lease Interest 5,293,157 0 0 4,863,8001010 410032 Finance Lease Interest Payable 331,423 0 0 331,3001010 410033 Finance Lease Contingent Rentals 338,723 0 0 338,8001010 409600 External Interest Receivable (1,234,106) (422,500) (422,500) (375,500)1010 409605 Finance Lease Interest Receivable (254,261) 0 0 (254,200)1010 409606 Finance Lease Contingent Rentals Receivable (102,998) 0 0 (103,000)1010 409801 Contribution from HRA (8,680,900) (9,037,100) (9,037,100) (8,973,700)1010 410017 Movement in Fair Value of Investment Properties (1,284,500) 0 0 01010 410051 Movement in Fair Value of Financial Assets through CIES (36,728) 0 0 0
33,873,881 2,813,800 2,813,800 11,109,700
MOVEMENT IN RESERVES STATEMENT
Proper Charges to the General Fund2951 410004 Direct Revenue Funding of Capital 1,231,253 0 0 02951 410006 Minimum Revenue Provision - Supported Borrowing 3,608,736 3,464,400 3,464,400 3,464,4002951 410007 Minimum Revenue Provision - Unsupported Borrowing 836,891 786,000 802,300 1,140,4002951 410026 Minimum Revenue Provision - PFI 3,264,270 0 0 3,720,8002951 410027 Minimum Revenue Provision - Finance Leases 148 0 0 200
8,941,298 4,250,400 4,266,700 8,325,800
Reversal of Capital Charges2951 410018 Reverse Movement in Fair Value of Investment Properties 1,284,500 0 0 02951 409802 Reversal of Depreciation (35,322,340) (29,137,000) (29,137,000) (31,291,300)2951 409805 Reversal of REFFCUS (2,369,851) 0 0 02951 409487 Reverse Gain/(Loss) on Asset Disposal (27,895,881) 0 0 02951 410013 Reversal of Impairment Loss 780,326 0 0 0
(63,523,246) (29,137,000) (29,137,000) (31,291,300)
Other Accounting Adjustments2951 410045 Premiums Written Out from FI A/c 484,815 484,800 484,800 521,1002951 410046 Premiums HRA Contribution (738,521) (305,500) (305,500) (101,400)
Other adjustments 0 0 0(253,706) 179,300 179,300 419,700
TOTAL (17,646,503) (21,893,500) (21,877,200) (11,436,100)
Capital charges include any gain or loss on the disposal of non-current assets, depreciation and impairments. To ensure thatthese have a neutral effect on the Council's General Fund, they are reversed 'below the line' in the Movement in ReservesStatement (MiRS).
Interest items include External Interest Payable on outstanding debt and External Interest Receivable on investments. Some ofthe external interest payable is chargeable to the Housing Revenue Account (HRA) and the HRA's contribution is shown as acredit to the General Fund.
Local authorities are required by statute to make a Minimum Revenue Provision (MRP) in their General Fund for the repaymentof their capital financing and this provision is also shown in the MiRS.
Revenue Expenditure Funded from Capital Under Statute (REFFCUS) is charged to services and reversed out through theMovement in Reserves Statement so that it can be financed from capital resources.
Prior to 2016/17, accounting entries arising from PFI schemes and Finance Leases were not budgeted for at the start of theyear; rather the annual rental costs or income were budgeted for in the relevant services, then separated into service, interestand principal repayment components, with interest elements being coded to this part of the accounts. For 2016/17, theseentries have been budgeted for in advance.
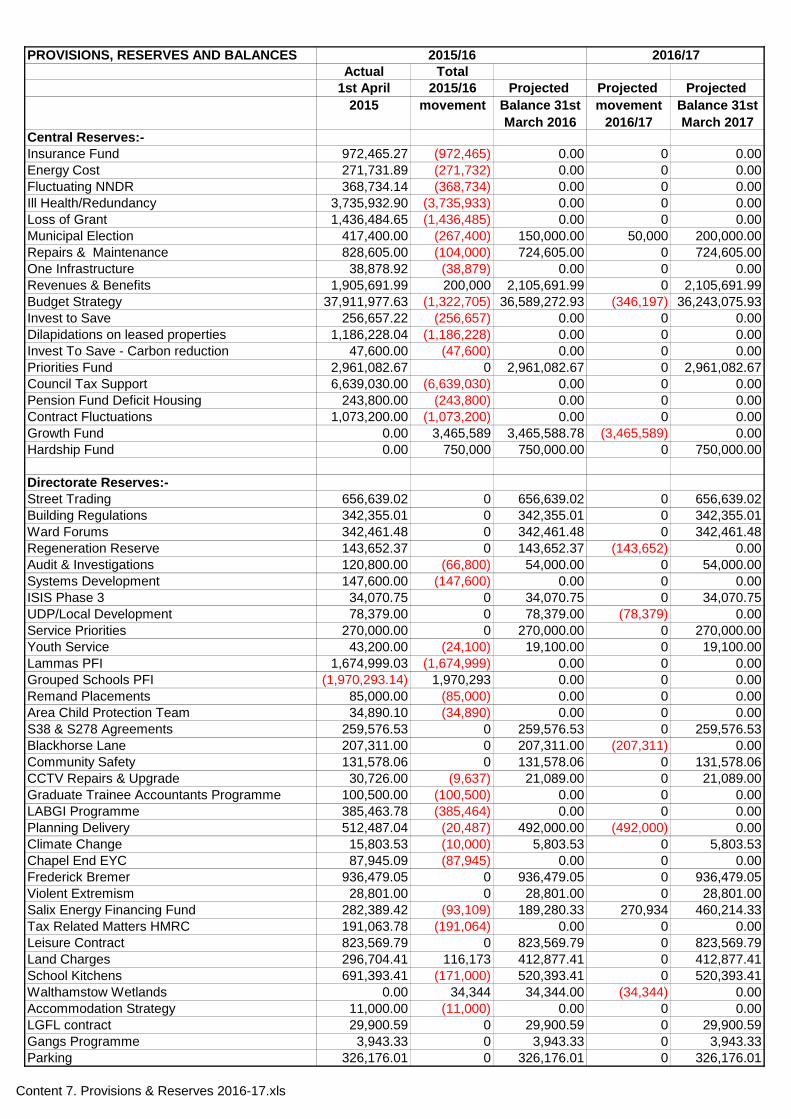
Content 7. Provisions & Reserves 2016-17.xls
PROVISIONS, RESERVES AND BALANCESActual Total
1st April 2015/16 Projected Projected Projected 2015 movement Balance 31st
March 2016movement
2016/17Balance 31st March 2017
Central Reserves:-Insurance Fund 972,465.27 (972,465) 0.00 0 0.00Energy Cost 271,731.89 (271,732) 0.00 0 0.00Fluctuating NNDR 368,734.14 (368,734) 0.00 0 0.00Ill Health/Redundancy 3,735,932.90 (3,735,933) 0.00 0 0.00Loss of Grant 1,436,484.65 (1,436,485) 0.00 0 0.00Municipal Election 417,400.00 (267,400) 150,000.00 50,000 200,000.00Repairs & Maintenance 828,605.00 (104,000) 724,605.00 0 724,605.00One Infrastructure 38,878.92 (38,879) 0.00 0 0.00Revenues & Benefits 1,905,691.99 200,000 2,105,691.99 0 2,105,691.99Budget Strategy 37,911,977.63 (1,322,705) 36,589,272.93 (346,197) 36,243,075.93Invest to Save 256,657.22 (256,657) 0.00 0 0.00Dilapidations on leased properties 1,186,228.04 (1,186,228) 0.00 0 0.00Invest To Save - Carbon reduction 47,600.00 (47,600) 0.00 0 0.00Priorities Fund 2,961,082.67 0 2,961,082.67 0 2,961,082.67Council Tax Support 6,639,030.00 (6,639,030) 0.00 0 0.00Pension Fund Deficit Housing 243,800.00 (243,800) 0.00 0 0.00Contract Fluctuations 1,073,200.00 (1,073,200) 0.00 0 0.00Growth Fund 0.00 3,465,589 3,465,588.78 (3,465,589) 0.00Hardship Fund 0.00 750,000 750,000.00 0 750,000.00
Directorate Reserves:-Street Trading 656,639.02 0 656,639.02 0 656,639.02Building Regulations 342,355.01 0 342,355.01 0 342,355.01Ward Forums 342,461.48 0 342,461.48 0 342,461.48Regeneration Reserve 143,652.37 0 143,652.37 (143,652) 0.00Audit & Investigations 120,800.00 (66,800) 54,000.00 0 54,000.00Systems Development 147,600.00 (147,600) 0.00 0 0.00ISIS Phase 3 34,070.75 0 34,070.75 0 34,070.75UDP/Local Development 78,379.00 0 78,379.00 (78,379) 0.00Service Priorities 270,000.00 0 270,000.00 0 270,000.00Youth Service 43,200.00 (24,100) 19,100.00 0 19,100.00Lammas PFI 1,674,999.03 (1,674,999) 0.00 0 0.00Grouped Schools PFI (1,970,293.14) 1,970,293 0.00 0 0.00Remand Placements 85,000.00 (85,000) 0.00 0 0.00Area Child Protection Team 34,890.10 (34,890) 0.00 0 0.00S38 & S278 Agreements 259,576.53 0 259,576.53 0 259,576.53Blackhorse Lane 207,311.00 0 207,311.00 (207,311) 0.00Community Safety 131,578.06 0 131,578.06 0 131,578.06CCTV Repairs & Upgrade 30,726.00 (9,637) 21,089.00 0 21,089.00Graduate Trainee Accountants Programme 100,500.00 (100,500) 0.00 0 0.00LABGI Programme 385,463.78 (385,464) 0.00 0 0.00Planning Delivery 512,487.04 (20,487) 492,000.00 (492,000) 0.00Climate Change 15,803.53 (10,000) 5,803.53 0 5,803.53Chapel End EYC 87,945.09 (87,945) 0.00 0 0.00Frederick Bremer 936,479.05 0 936,479.05 0 936,479.05Violent Extremism 28,801.00 0 28,801.00 0 28,801.00Salix Energy Financing Fund 282,389.42 (93,109) 189,280.33 270,934 460,214.33Tax Related Matters HMRC 191,063.78 (191,064) 0.00 0 0.00Leisure Contract 823,569.79 0 823,569.79 0 823,569.79Land Charges 296,704.41 116,173 412,877.41 0 412,877.41School Kitchens 691,393.41 (171,000) 520,393.41 0 520,393.41Walthamstow Wetlands 0.00 34,344 34,344.00 (34,344) 0.00Accommodation Strategy 11,000.00 (11,000) 0.00 0 0.00LGFL contract 29,900.59 0 29,900.59 0 29,900.59Gangs Programme 3,943.33 0 3,943.33 0 3,943.33Parking 326,176.01 0 326,176.01 0 326,176.01
2015/16 2016/17
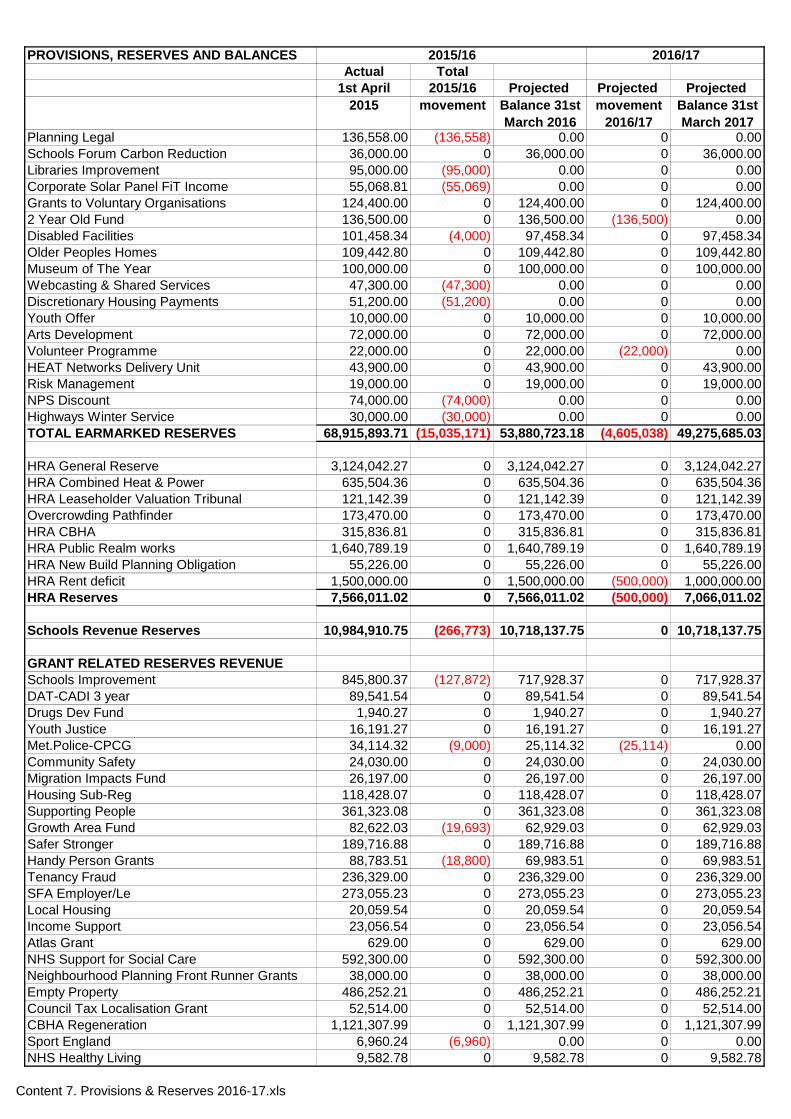
Content 7. Provisions & Reserves 2016-17.xls
PROVISIONS, RESERVES AND BALANCESActual Total
1st April 2015/16 Projected Projected Projected 2015 movement Balance 31st
March 2016movement
2016/17Balance 31st March 2017
2015/16 2016/17
Planning Legal 136,558.00 (136,558) 0.00 0 0.00Schools Forum Carbon Reduction 36,000.00 0 36,000.00 0 36,000.00Libraries Improvement 95,000.00 (95,000) 0.00 0 0.00Corporate Solar Panel FiT Income 55,068.81 (55,069) 0.00 0 0.00Grants to Voluntary Organisations 124,400.00 0 124,400.00 0 124,400.002 Year Old Fund 136,500.00 0 136,500.00 (136,500) 0.00Disabled Facilities 101,458.34 (4,000) 97,458.34 0 97,458.34Older Peoples Homes 109,442.80 0 109,442.80 0 109,442.80Museum of The Year 100,000.00 0 100,000.00 0 100,000.00Webcasting & Shared Services 47,300.00 (47,300) 0.00 0 0.00Discretionary Housing Payments 51,200.00 (51,200) 0.00 0 0.00Youth Offer 10,000.00 0 10,000.00 0 10,000.00Arts Development 72,000.00 0 72,000.00 0 72,000.00Volunteer Programme 22,000.00 0 22,000.00 (22,000) 0.00HEAT Networks Delivery Unit 43,900.00 0 43,900.00 0 43,900.00Risk Management 19,000.00 0 19,000.00 0 19,000.00NPS Discount 74,000.00 (74,000) 0.00 0 0.00Highways Winter Service 30,000.00 (30,000) 0.00 0 0.00TOTAL EARMARKED RESERVES 68,915,893.71 (15,035,171) 53,880,723.18 (4,605,038) 49,275,685.03
HRA General Reserve 3,124,042.27 0 3,124,042.27 0 3,124,042.27HRA Combined Heat & Power 635,504.36 0 635,504.36 0 635,504.36HRA Leaseholder Valuation Tribunal 121,142.39 0 121,142.39 0 121,142.39Overcrowding Pathfinder 173,470.00 0 173,470.00 0 173,470.00HRA CBHA 315,836.81 0 315,836.81 0 315,836.81HRA Public Realm works 1,640,789.19 0 1,640,789.19 0 1,640,789.19HRA New Build Planning Obligation 55,226.00 0 55,226.00 0 55,226.00HRA Rent deficit 1,500,000.00 0 1,500,000.00 (500,000) 1,000,000.00HRA Reserves 7,566,011.02 0 7,566,011.02 (500,000) 7,066,011.02
Schools Revenue Reserves 10,984,910.75 (266,773) 10,718,137.75 0 10,718,137.75
GRANT RELATED RESERVES REVENUE Schools Improvement 845,800.37 (127,872) 717,928.37 0 717,928.37DAT-CADI 3 year 89,541.54 0 89,541.54 0 89,541.54Drugs Dev Fund 1,940.27 0 1,940.27 0 1,940.27Youth Justice 16,191.27 0 16,191.27 0 16,191.27Met.Police-CPCG 34,114.32 (9,000) 25,114.32 (25,114) 0.00Community Safety 24,030.00 0 24,030.00 0 24,030.00Migration Impacts Fund 26,197.00 0 26,197.00 0 26,197.00Housing Sub-Reg 118,428.07 0 118,428.07 0 118,428.07Supporting People 361,323.08 0 361,323.08 0 361,323.08Growth Area Fund 82,622.03 (19,693) 62,929.03 0 62,929.03Safer Stronger 189,716.88 0 189,716.88 0 189,716.88Handy Person Grants 88,783.51 (18,800) 69,983.51 0 69,983.51Tenancy Fraud 236,329.00 0 236,329.00 0 236,329.00SFA Employer/Le 273,055.23 0 273,055.23 0 273,055.23Local Housing 20,059.54 0 20,059.54 0 20,059.54Income Support 23,056.54 0 23,056.54 0 23,056.54Atlas Grant 629.00 0 629.00 0 629.00NHS Support for Social Care 592,300.00 0 592,300.00 0 592,300.00Neighbourhood Planning Front Runner Grants 38,000.00 0 38,000.00 0 38,000.00Empty Property 486,252.21 0 486,252.21 0 486,252.21Council Tax Localisation Grant 52,514.00 0 52,514.00 0 52,514.00CBHA Regeneration 1,121,307.99 0 1,121,307.99 0 1,121,307.99Sport England 6,960.24 (6,960) 0.00 0 0.00NHS Healthy Living 9,582.78 0 9,582.78 0 9,582.78
Content 7. Provisions & Reserves 2016-17.xls
PROVISIONS, RESERVES AND BALANCESActual Total
1st April 2015/16 Projected Projected Projected 2015 movement Balance 31st
March 2016movement
2016/17Balance 31st March 2017
2015/16 2016/17
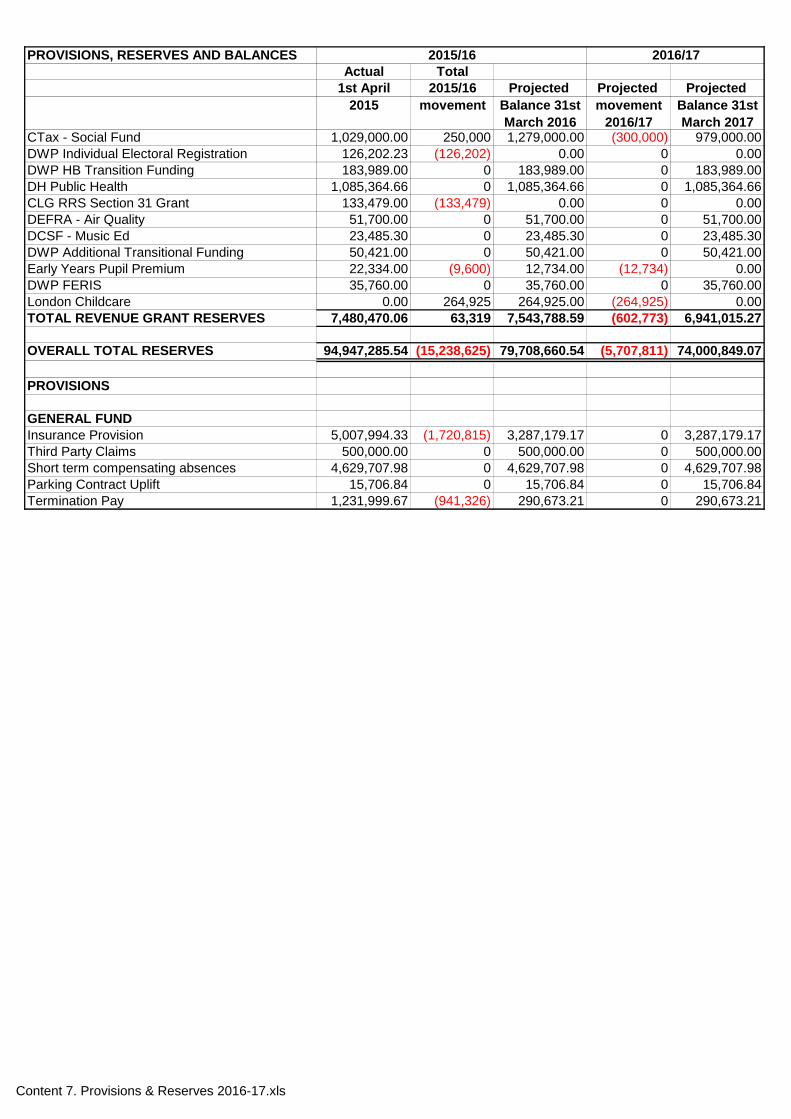
CTax - Social Fund 1,029,000.00 250,000 1,279,000.00 (300,000) 979,000.00DWP Individual Electoral Registration 126,202.23 (126,202) 0.00 0 0.00DWP HB Transition Funding 183,989.00 0 183,989.00 0 183,989.00DH Public Health 1,085,364.66 0 1,085,364.66 0 1,085,364.66CLG RRS Section 31 Grant 133,479.00 (133,479) 0.00 0 0.00DEFRA - Air Quality 51,700.00 0 51,700.00 0 51,700.00DCSF - Music Ed 23,485.30 0 23,485.30 0 23,485.30DWP Additional Transitional Funding 50,421.00 0 50,421.00 0 50,421.00Early Years Pupil Premium 22,334.00 (9,600) 12,734.00 (12,734) 0.00DWP FERIS 35,760.00 0 35,760.00 0 35,760.00London Childcare 0.00 264,925 264,925.00 (264,925) 0.00TOTAL REVENUE GRANT RESERVES 7,480,470.06 63,319 7,543,788.59 (602,773) 6,941,015.27
OVERALL TOTAL RESERVES 94,947,285.54 (15,238,625) 79,708,660.54 (5,707,811) 74,000,849.07
PROVISIONS
GENERAL FUNDInsurance Provision 5,007,994.33 (1,720,815) 3,287,179.17 0 3,287,179.17Third Party Claims 500,000.00 0 500,000.00 0 500,000.00Short term compensating absences 4,629,707.98 0 4,629,707.98 0 4,629,707.98Parking Contract Uplift 15,706.84 0 15,706.84 0 15,706.84Termination Pay 1,231,999.67 (941,326) 290,673.21 0 290,673.21
LBWF - COUNCIL TAX HISTORY
2009/10 2010/11 2011/12 2012/13 2013/14 2014/15 2015/16 2016/17£'000 £'000 £'000 £'000 £'000 £'000 £'000 £'000
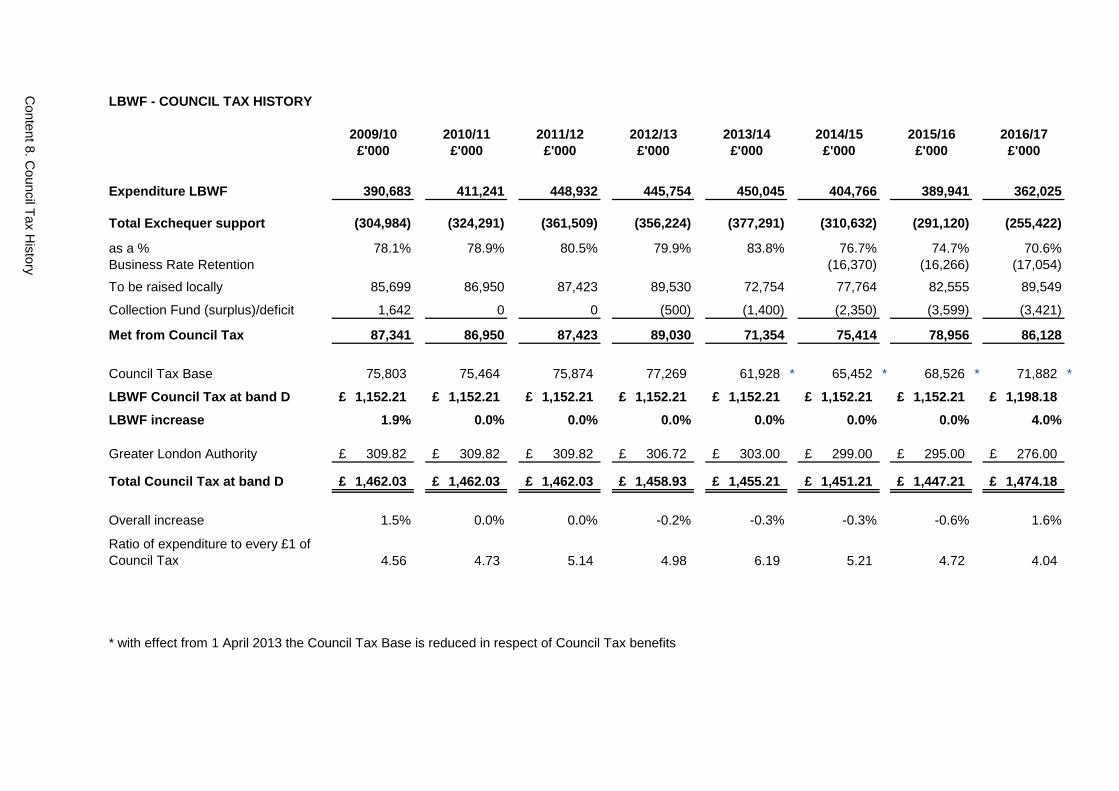
Expenditure LBWF 390,683 411,241 448,932 445,754 450,045 404,766 389,941 362,025
Total Exchequer support (304,984) (324,291) (361,509) (356,224) (377,291) (310,632) (291,120) (255,422)
as a % 78.1% 78.9% 80.5% 79.9% 83.8% 76.7% 74.7% 70.6%Business Rate Retention (16,370) (16,266) (17,054)
To be raised locally 85,699 86,950 87,423 89,530 72,754 77,764 82,555 89,549
Collection Fund (surplus)/deficit 1,642 0 0 (500) (1,400) (2,350) (3,599) (3,421)
Met from Council Tax 87,341 86,950 87,423 89,030 71,354 75,414 78,956 86,128
Council Tax Base 75,803 75,464 75,874 77,269 61,928 * 65,452 * 68,526 * 71,882 *
LBWF Council Tax at band D 1,152.21£ 1,152.21£ 1,152.21£ 1,152.21£ 1,152.21£ 1,152.21£ 1,152.21£ 1,198.18£
LBWF increase 1.9% 0.0% 0.0% 0.0% 0.0% 0.0% 0.0% 4.0%
Greater London Authority 309.82£ 309.82£ 309.82£ 306.72£ 303.00£ 299.00£ 295.00£ 276.00£
Total Council Tax at band D 1,462.03£ 1,462.03£ 1,462.03£ 1,458.93£ 1,455.21£ 1,451.21£ 1,447.21£ 1,474.18£
Overall increase 1.5% 0.0% 0.0% -0.2% -0.3% -0.3% -0.6% 1.6%
Ratio of expenditure to every £1 of Council Tax 4.56 4.73 5.14 4.98 6.19 5.21 4.72 4.04
* with effect from 1 April 2013 the Council Tax Base is reduced in respect of Council Tax benefits
Content 8. C
ouncil Tax History
Content 9. Analysis of budgets by service.xls
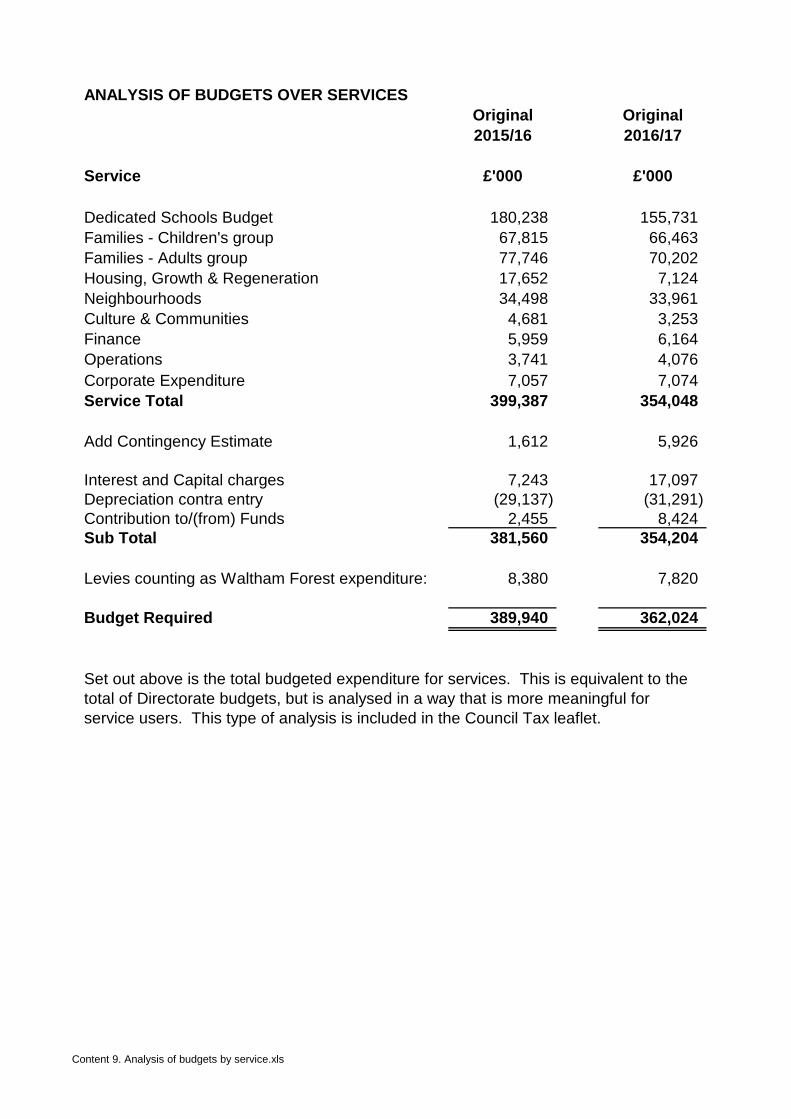
ANALYSIS OF BUDGETS OVER SERVICESOriginal Original2015/16 2016/17
Service £'000 £'000
Dedicated Schools Budget 180,238 155,731Families - Children's group 67,815 66,463Families - Adults group 77,746 70,202Housing, Growth & Regeneration 17,652 7,124Neighbourhoods 34,498 33,961Culture & Communities 4,681 3,253Finance 5,959 6,164Operations 3,741 4,076Corporate Expenditure 7,057 7,074Service Total 399,387 354,048
Add Contingency Estimate 1,612 5,926
Interest and Capital charges 7,243 17,097Depreciation contra entry (29,137) (31,291)Contribution to/(from) Funds 2,455 8,424Sub Total 381,560 354,204
Levies counting as Waltham Forest expenditure: 8,380 7,820
Budget Required 389,940 362,024
Set out above is the total budgeted expenditure for services. This is equivalent to the total of Directorate budgets, but is analysed in a way that is more meaningful for service users. This type of analysis is included in the Council Tax leaflet.
Content 10. Pie Charts 2016-17.xls
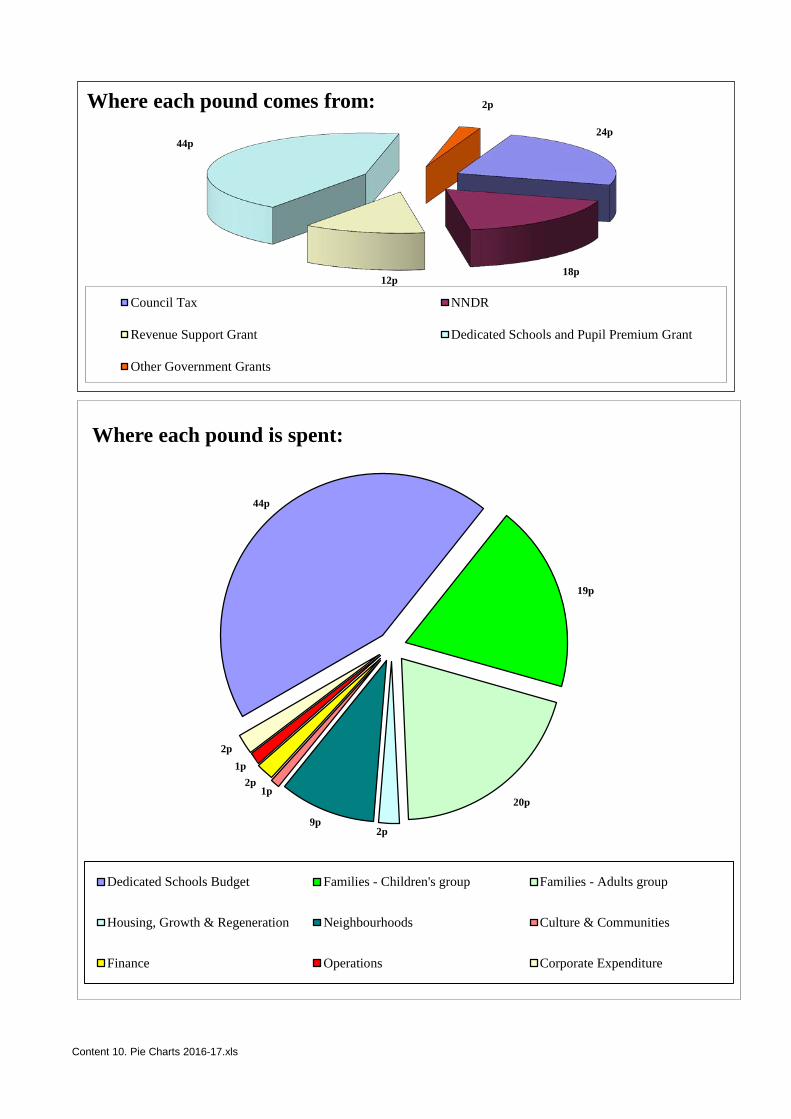
24p
18p 12p
44p
2p Where each pound comes from:
Council Tax NNDR
Revenue Support Grant Dedicated Schools and Pupil Premium Grant
Other Government Grants
44p
19p
20p
2p 9p
1p 2p
1p 2p
Where each pound is spent:
Dedicated Schools Budget Families - Children's group Families - Adults group
Housing, Growth & Regeneration Neighbourhoods Culture & Communities
Finance Operations Corporate Expenditure
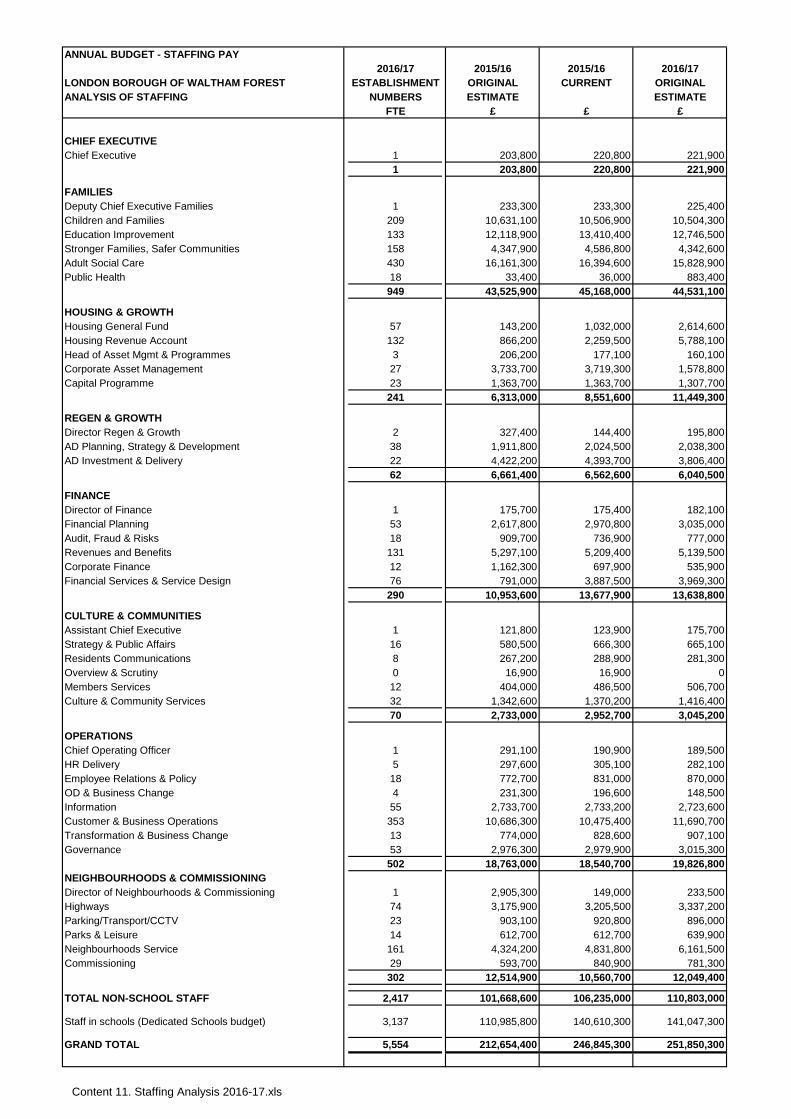
Content 11. Staffing Analysis 2016-17.xls
ANNUAL BUDGET - STAFFING PAY2016/17 2015/16 2015/16 2016/17
LONDON BOROUGH OF WALTHAM FOREST ESTABLISHMENT ORIGINAL CURRENT ORIGINALANALYSIS OF STAFFING NUMBERS ESTIMATE ESTIMATE
FTE £ £ £
CHIEF EXECUTIVEChief Executive 1 203,800 220,800 221,900
1 203,800 220,800 221,900
FAMILIESDeputy Chief Executive Families 1 233,300 233,300 225,400Children and Families 209 10,631,100 10,506,900 10,504,300Education Improvement 133 12,118,900 13,410,400 12,746,500Stronger Families, Safer Communities 158 4,347,900 4,586,800 4,342,600Adult Social Care 430 16,161,300 16,394,600 15,828,900Public Health 18 33,400 36,000 883,400
949 43,525,900 45,168,000 44,531,100
HOUSING & GROWTHHousing General Fund 57 143,200 1,032,000 2,614,600Housing Revenue Account 132 866,200 2,259,500 5,788,100Head of Asset Mgmt & Programmes 3 206,200 177,100 160,100Corporate Asset Management 27 3,733,700 3,719,300 1,578,800Capital Programme 23 1,363,700 1,363,700 1,307,700
241 6,313,000 8,551,600 11,449,300
REGEN & GROWTHDirector Regen & Growth 2 327,400 144,400 195,800AD Planning, Strategy & Development 38 1,911,800 2,024,500 2,038,300AD Investment & Delivery 22 4,422,200 4,393,700 3,806,400
62 6,661,400 6,562,600 6,040,500
FINANCEDirector of Finance 1 175,700 175,400 182,100Financial Planning 53 2,617,800 2,970,800 3,035,000Audit, Fraud & Risks 18 909,700 736,900 777,000Revenues and Benefits 131 5,297,100 5,209,400 5,139,500Corporate Finance 12 1,162,300 697,900 535,900Financial Services & Service Design 76 791,000 3,887,500 3,969,300
290 10,953,600 13,677,900 13,638,800
CULTURE & COMMUNITIESAssistant Chief Executive 1 121,800 123,900 175,700Strategy & Public Affairs 16 580,500 666,300 665,100Residents Communications 8 267,200 288,900 281,300Overview & Scrutiny 0 16,900 16,900 0Members Services 12 404,000 486,500 506,700Culture & Community Services 32 1,342,600 1,370,200 1,416,400
70 2,733,000 2,952,700 3,045,200
OPERATIONSChief Operating Officer 1 291,100 190,900 189,500HR Delivery 5 297,600 305,100 282,100Employee Relations & Policy 18 772,700 831,000 870,000OD & Business Change 4 231,300 196,600 148,500Information 55 2,733,700 2,733,200 2,723,600Customer & Business Operations 353 10,686,300 10,475,400 11,690,700Transformation & Business Change 13 774,000 828,600 907,100Governance 53 2,976,300 2,979,900 3,015,300
502 18,763,000 18,540,700 19,826,800NEIGHBOURHOODS & COMMISSIONINGDirector of Neighbourhoods & Commissioning 1 2,905,300 149,000 233,500Highways 74 3,175,900 3,205,500 3,337,200Parking/Transport/CCTV 23 903,100 920,800 896,000Parks & Leisure 14 612,700 612,700 639,900Neighbourhoods Service 161 4,324,200 4,831,800 6,161,500Commissioning 29 593,700 840,900 781,300
302 12,514,900 10,560,700 12,049,400
TOTAL NON-SCHOOL STAFF 2,417 101,668,600 106,235,000 110,803,000
Staff in schools (Dedicated Schools budget) 3,137 110,985,800 140,610,300 141,047,300
GRAND TOTAL 5,554 212,654,400 246,845,300 251,850,300
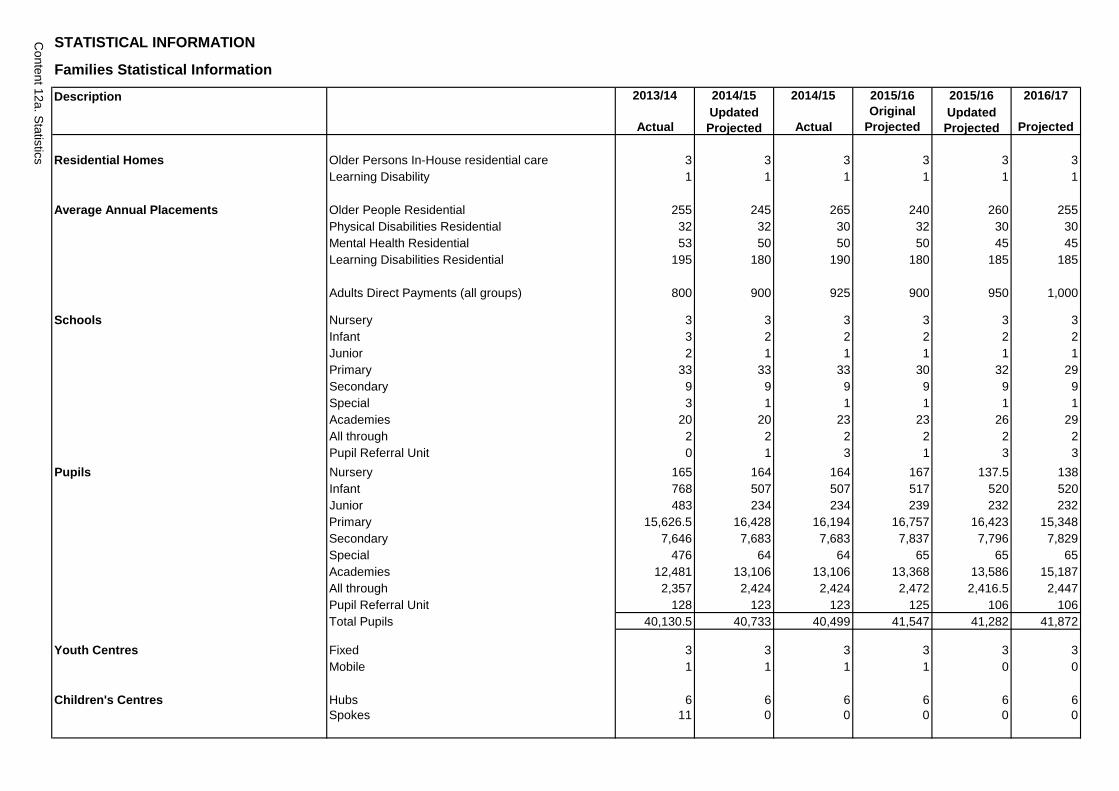
STATISTICAL INFORMATION
Families Statistical Information
Description 2013/14 2014/15 2014/15 2015/16 2015/16 2016/17
ActualUpdated Projected Actual
Original Projected
Updated Projected Projected
Residential Homes Older Persons In-House residential care 3 3 3 3 3 3Learning Disability 1 1 1 1 1 1
Average Annual Placements Older People Residential 255 245 265 240 260 255Physical Disabilities Residential 32 32 30 32 30 30Mental Health Residential 53 50 50 50 45 45Learning Disabilities Residential 195 180 190 180 185 185
Adults Direct Payments (all groups) 800 900 925 900 950 1,000
Schools Nursery 3 3 3 3 3 3Infant 3 2 2 2 2 2Junior 2 1 1 1 1 1Primary 33 33 33 30 32 29Secondary 9 9 9 9 9 9Special 3 1 1 1 1 1Academies 20 20 23 23 26 29All through 2 2 2 2 2 2Pupil Referral Unit 0 1 3 1 3 3
Pupils Nursery 165 164 164 167 137.5 138Infant 768 507 507 517 520 520Junior 483 234 234 239 232 232Primary 15,626.5 16,428 16,194 16,757 16,423 15,348Secondary 7,646 7,683 7,683 7,837 7,796 7,829Special 476 64 64 65 65 65Academies 12,481 13,106 13,106 13,368 13,586 15,187All through 2,357 2,424 2,424 2,472 2,416.5 2,447Pupil Referral Unit 128 123 123 125 106 106Total Pupils 40,130.5 40,733 40,499 41,547 41,282 41,872
Youth Centres Fixed 3 3 3 3 3 3Mobile 1 1 1 1 0 0
Children's Centres Hubs 6 6 6 6 6 6Spokes 11 0 0 0 0 0
Content 12a. Statistics
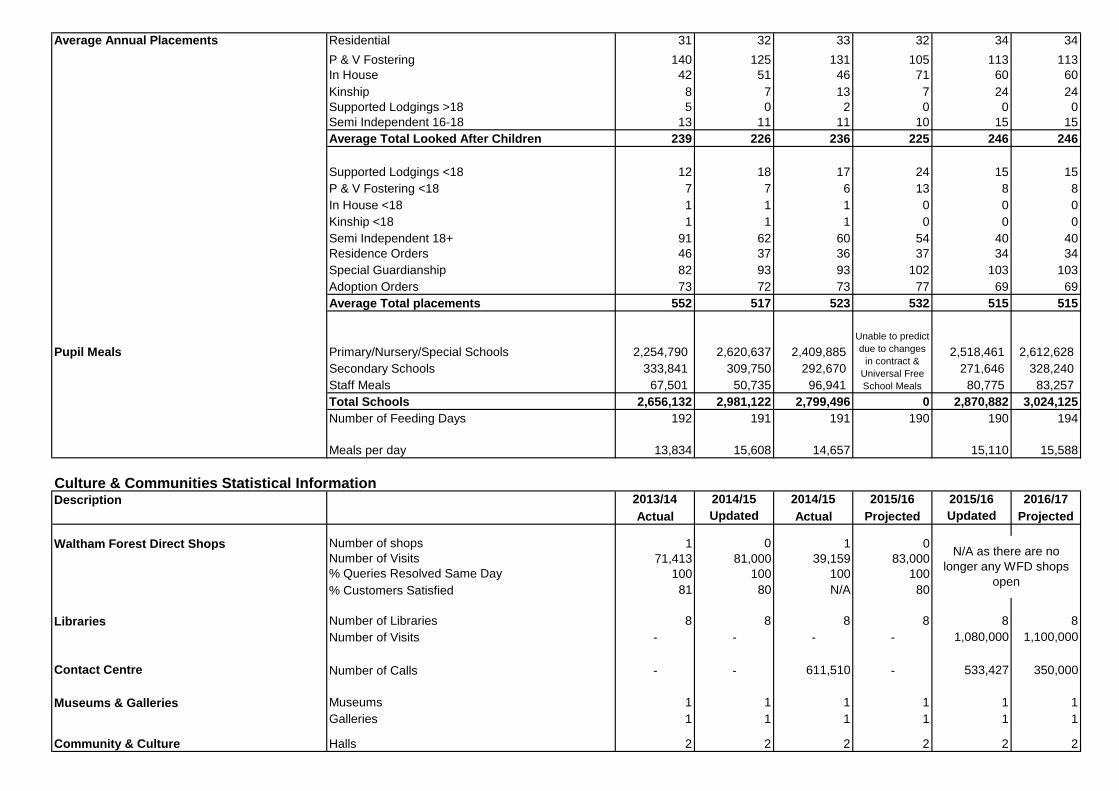
Average Annual Placements Residential 31 32 33 32 34 34P & V Fostering 140 125 131 105 113 113In House 42 51 46 71 60 60Kinship 8 7 13 7 24 24Supported Lodgings >18 5 0 2 0 0 0Semi Independent 16-18 13 11 11 10 15 15Average Total Looked After Children 239 226 236 225 246 246
Supported Lodgings <18 12 18 17 24 15 15P & V Fostering <18 7 7 6 13 8 8In House <18 1 1 1 0 0 0Kinship <18 1 1 1 0 0 0Semi Independent 18+ 91 62 60 54 40 40Residence Orders 46 37 36 37 34 34Special Guardianship 82 93 93 102 103 103Adoption Orders 73 72 73 77 69 69Average Total placements 552 517 523 532 515 515
Pupil Meals Primary/Nursery/Special Schools 2,254,790 2,620,637 2,409,885 2,518,461 2,612,628 Secondary Schools 333,841 309,750 292,670 271,646 328,240 Staff Meals 67,501 50,735 96,941 80,775 83,257 Total Schools 2,656,132 2,981,122 2,799,496 0 2,870,882 3,024,125Number of Feeding Days 192 191 191 190 190 194
Meals per day 13,834 15,608 14,657 15,110 15,588
Culture & Communities Statistical InformationDescription 2013/14 2014/15 2014/15 2015/16 2015/16 2016/17
Actual Updated Actual
Projected Updated Projected
Waltham Forest Direct Shops Number of shops 1 0 1 0Number of Visits 71,413 81,000 39,159 83,000% Queries Resolved Same Day 100 100 100 100% Customers Satisfied 81 80 N/A 80
Libraries Number of Libraries 8 8 8 8 8 8Number of Visits - - - - 1,080,000 1,100,000
Contact Centre Number of Calls - - 611,510 - 533,427 350,000
Museums & Galleries Museums 1 1 1 1 1 1Galleries 1 1 1 1 1 1
Community & Culture Halls 2 2 2 2 2 2
Unable to predict due to changes
in contract & Universal Free School Meals
N/A as there are no longer any WFD shops
open
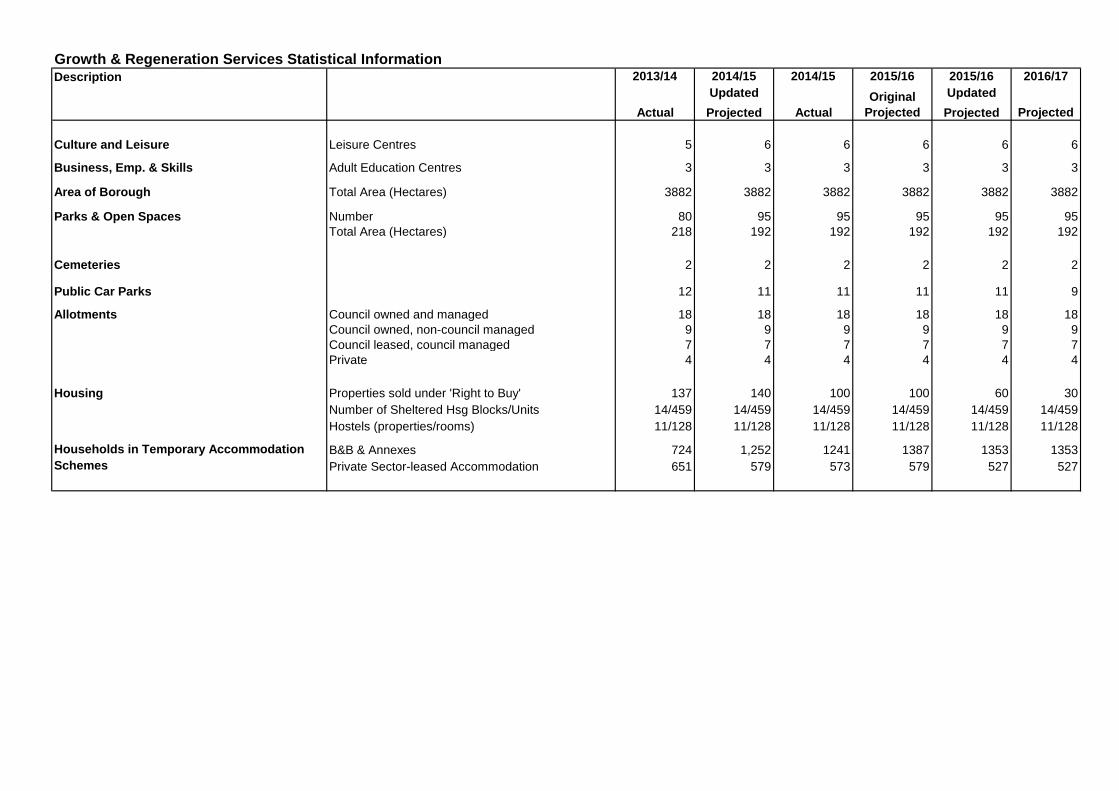
Growth & Regeneration Services Statistical InformationDescription 2013/14 2014/15 2014/15 2015/16 2015/16 2016/17
ActualUpdated Projected Actual
Original Projected
Updated Projected Projected
Culture and Leisure Leisure Centres 5 6 6 6 6 6
Business, Emp. & Skills Adult Education Centres 3 3 3 3 3 3
Area of Borough Total Area (Hectares) 3882 3882 3882 3882 3882 3882
Parks & Open Spaces Number 80 95 95 95 95 95Total Area (Hectares) 218 192 192 192 192 192
Cemeteries 2 2 2 2 2 2
Public Car Parks 12 11 11 11 11 9
Allotments Council owned and managed 18 18 18 18 18 18Council owned, non-council managed 9 9 9 9 9 9Council leased, council managed 7 7 7 7 7 7Private 4 4 4 4 4 4
Housing Properties sold under 'Right to Buy' 137 140 100 100 60 30Number of Sheltered Hsg Blocks/Units 14/459 14/459 14/459 14/459 14/459 14/459Hostels (properties/rooms) 11/128 11/128 11/128 11/128 11/128 11/128
B&B & Annexes 724 1,252 1241 1387 1353 1353Private Sector-leased Accommodation 651 579 573 579 527 527
Households in Temporary Accommodation Schemes
Content 12b. Statistics - 2016/17 (Performance)
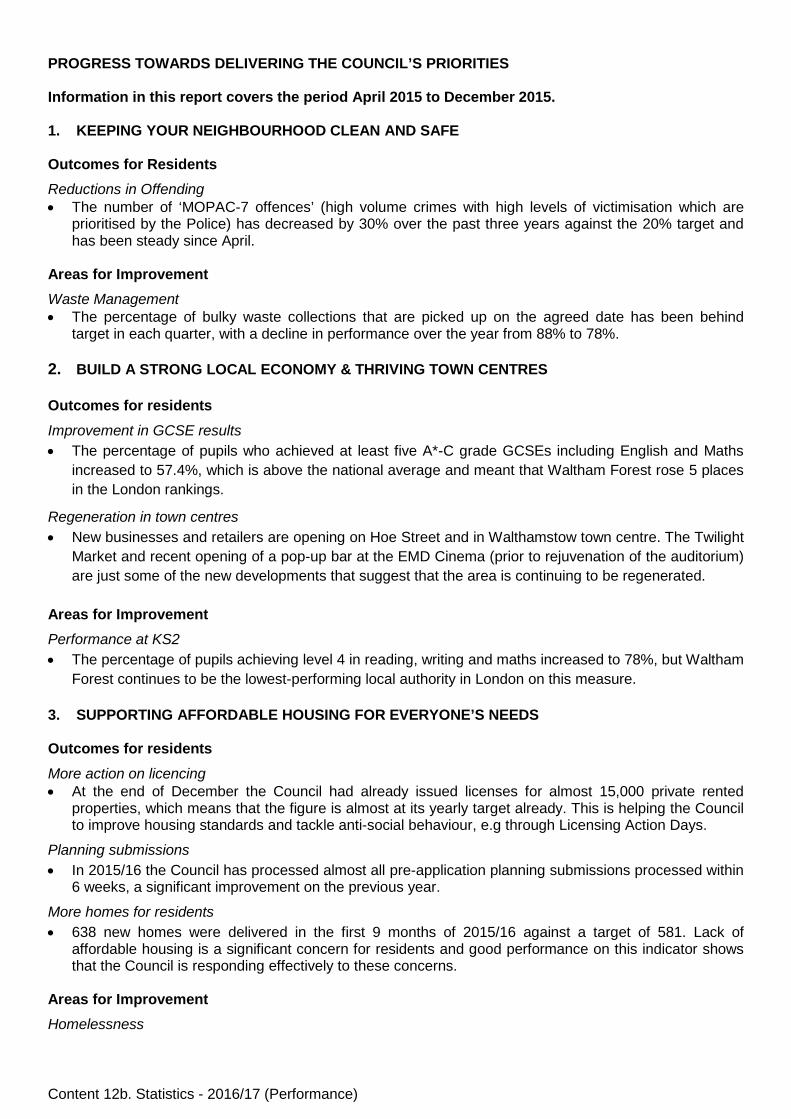
PROGRESS TOWARDS DELIVERING THE COUNCIL’S PRIORITIES Information in this report covers the period April 2015 to December 2015. 1. KEEPING YOUR NEIGHBOURHOOD CLEAN AND SAFE
Outcomes for Residents Reductions in Offending • The number of ‘MOPAC-7 offences’ (high volume crimes with high levels of victimisation which are
prioritised by the Police) has decreased by 30% over the past three years against the 20% target and has been steady since April.
Areas for Improvement Waste Management • The percentage of bulky waste collections that are picked up on the agreed date has been behind
target in each quarter, with a decline in performance over the year from 88% to 78%. 2. BUILD A STRONG LOCAL ECONOMY & THRIVING TOWN CENTRES Outcomes for residents Improvement in GCSE results • The percentage of pupils who achieved at least five A*-C grade GCSEs including English and Maths
increased to 57.4%, which is above the national average and meant that Waltham Forest rose 5 places in the London rankings.
Regeneration in town centres • New businesses and retailers are opening on Hoe Street and in Walthamstow town centre. The Twilight
Market and recent opening of a pop-up bar at the EMD Cinema (prior to rejuvenation of the auditorium) are just some of the new developments that suggest that the area is continuing to be regenerated.
Areas for Improvement Performance at KS2 • The percentage of pupils achieving level 4 in reading, writing and maths increased to 78%, but Waltham
Forest continues to be the lowest-performing local authority in London on this measure. 3. SUPPORTING AFFORDABLE HOUSING FOR EVERYONE’S NEEDS
Outcomes for residents More action on licencing • At the end of December the Council had already issued licenses for almost 15,000 private rented
properties, which means that the figure is almost at its yearly target already. This is helping the Council to improve housing standards and tackle anti-social behaviour, e.g through Licensing Action Days.
Planning submissions • In 2015/16 the Council has processed almost all pre-application planning submissions processed within
6 weeks, a significant improvement on the previous year.
More homes for residents • 638 new homes were delivered in the first 9 months of 2015/16 against a target of 581. Lack of
affordable housing is a significant concern for residents and good performance on this indicator shows that the Council is responding effectively to these concerns.
Areas for Improvement Homelessness
Content 12b. Statistics - 2016/17 (Performance)
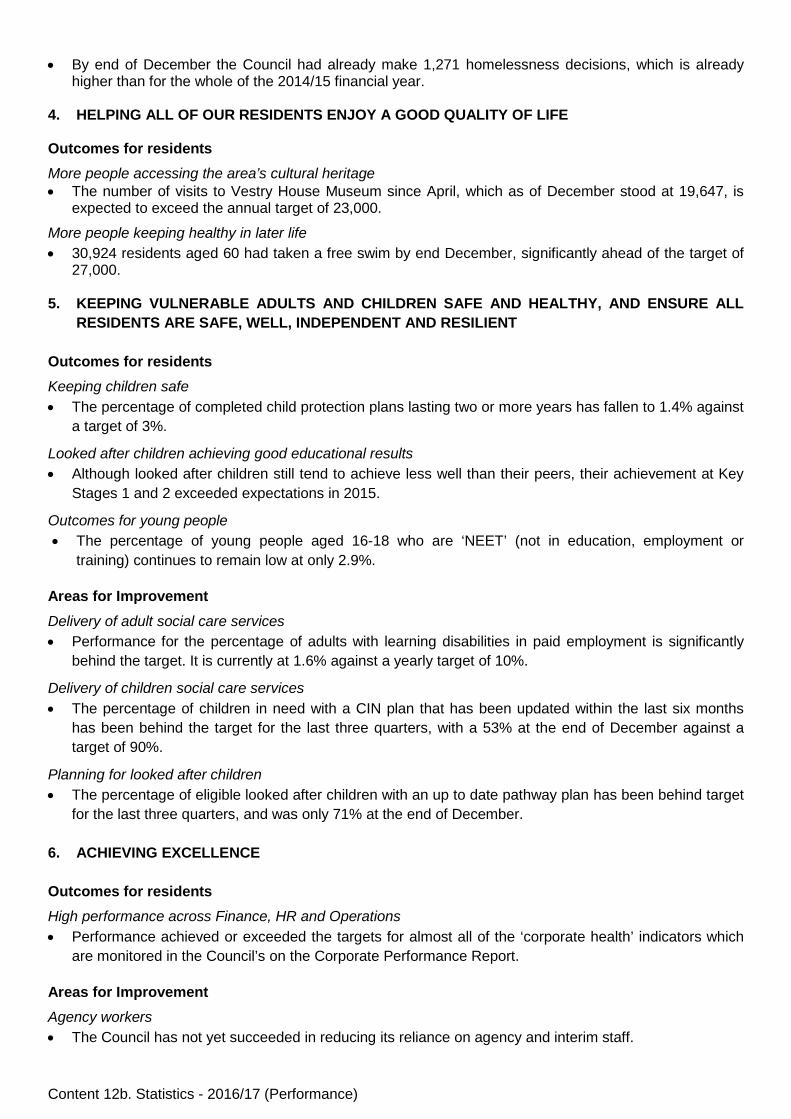
• By end of December the Council had already make 1,271 homelessness decisions, which is already higher than for the whole of the 2014/15 financial year.
4. HELPING ALL OF OUR RESIDENTS ENJOY A GOOD QUALITY OF LIFE Outcomes for residents More people accessing the area’s cultural heritage • The number of visits to Vestry House Museum since April, which as of December stood at 19,647, is
expected to exceed the annual target of 23,000.
More people keeping healthy in later life • 30,924 residents aged 60 had taken a free swim by end December, significantly ahead of the target of
27,000. 5. KEEPING VULNERABLE ADULTS AND CHILDREN SAFE AND HEALTHY, AND ENSURE ALL
RESIDENTS ARE SAFE, WELL, INDEPENDENT AND RESILIENT Outcomes for residents Keeping children safe • The percentage of completed child protection plans lasting two or more years has fallen to 1.4% against
a target of 3%.
Looked after children achieving good educational results • Although looked after children still tend to achieve less well than their peers, their achievement at Key
Stages 1 and 2 exceeded expectations in 2015.
Outcomes for young people • The percentage of young people aged 16-18 who are ‘NEET’ (not in education, employment or
training) continues to remain low at only 2.9%. Areas for Improvement Delivery of adult social care services • Performance for the percentage of adults with learning disabilities in paid employment is significantly
behind the target. It is currently at 1.6% against a yearly target of 10%.
Delivery of children social care services • The percentage of children in need with a CIN plan that has been updated within the last six months
has been behind the target for the last three quarters, with a 53% at the end of December against a target of 90%.
Planning for looked after children • The percentage of eligible looked after children with an up to date pathway plan has been behind target
for the last three quarters, and was only 71% at the end of December. 6. ACHIEVING EXCELLENCE Outcomes for residents High performance across Finance, HR and Operations • Performance achieved or exceeded the targets for almost all of the ‘corporate health’ indicators which
are monitored in the Council’s on the Corporate Performance Report. Areas for Improvement Agency workers • The Council has not yet succeeded in reducing its reliance on agency and interim staff.
Content 13. Glossary of Terms.doc
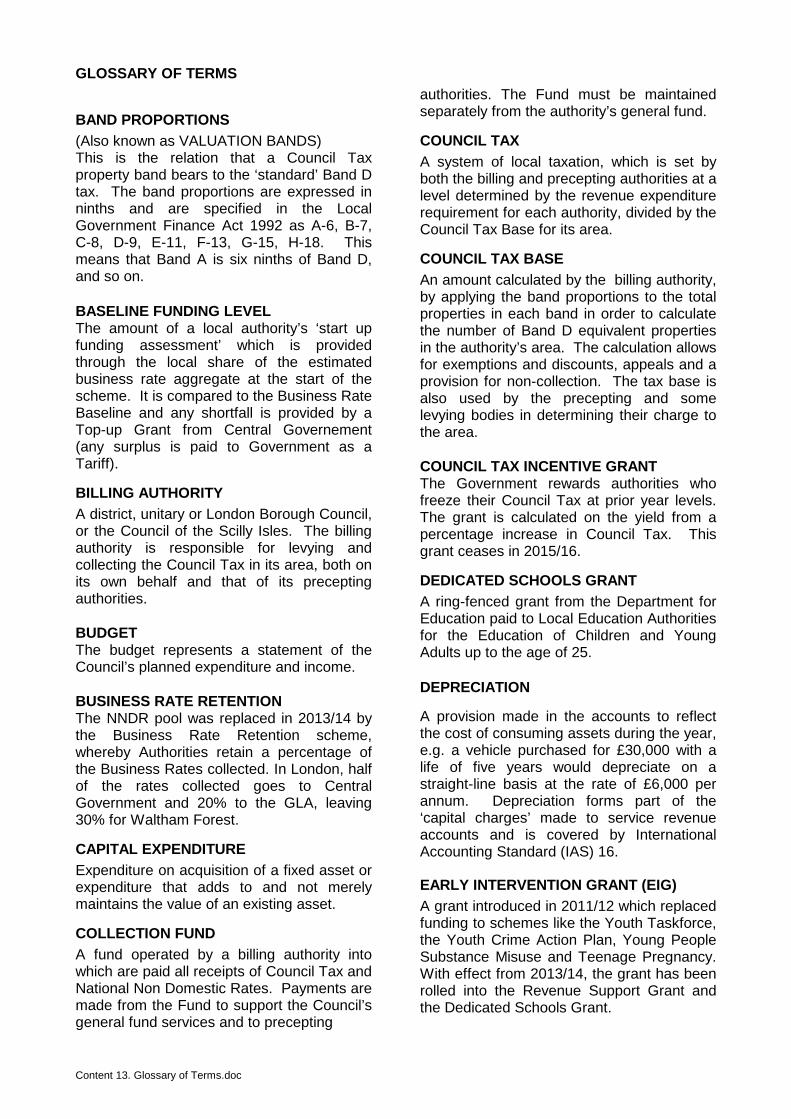
GLOSSARY OF TERMS
BAND PROPORTIONS (Also known as VALUATION BANDS) This is the relation that a Council Tax property band bears to the ‘standard’ Band D tax. The band proportions are expressed in ninths and are specified in the Local Government Finance Act 1992 as A-6, B-7, C-8, D-9, E-11, F-13, G-15, H-18. This means that Band A is six ninths of Band D, and so on. BASELINE FUNDING LEVEL The amount of a local authority’s ‘start up funding assessment’ which is provided through the local share of the estimated business rate aggregate at the start of the scheme. It is compared to the Business Rate Baseline and any shortfall is provided by a Top-up Grant from Central Governement (any surplus is paid to Government as a Tariff).
BILLING AUTHORITY A district, unitary or London Borough Council, or the Council of the Scilly Isles. The billing authority is responsible for levying and collecting the Council Tax in its area, both on its own behalf and that of its precepting authorities. BUDGET The budget represents a statement of the Council’s planned expenditure and income. BUSINESS RATE RETENTION The NNDR pool was replaced in 2013/14 by the Business Rate Retention scheme, whereby Authorities retain a percentage of the Business Rates collected. In London, half of the rates collected goes to Central Government and 20% to the GLA, leaving 30% for Waltham Forest.
CAPITAL EXPENDITURE Expenditure on acquisition of a fixed asset or expenditure that adds to and not merely maintains the value of an existing asset.
COLLECTION FUND A fund operated by a billing authority into which are paid all receipts of Council Tax and National Non Domestic Rates. Payments are made from the Fund to support the Council’s general fund services and to precepting
authorities. The Fund must be maintained separately from the authority’s general fund.
COUNCIL TAX A system of local taxation, which is set by both the billing and precepting authorities at a level determined by the revenue expenditure requirement for each authority, divided by the Council Tax Base for its area.
COUNCIL TAX BASE An amount calculated by the billing authority, by applying the band proportions to the total properties in each band in order to calculate the number of Band D equivalent properties in the authority’s area. The calculation allows for exemptions and discounts, appeals and a provision for non-collection. The tax base is also used by the precepting and some levying bodies in determining their charge to the area. COUNCIL TAX INCENTIVE GRANT The Government rewards authorities who freeze their Council Tax at prior year levels. The grant is calculated on the yield from a percentage increase in Council Tax. This grant ceases in 2015/16.
DEDICATED SCHOOLS GRANT A ring-fenced grant from the Department for Education paid to Local Education Authorities for the Education of Children and Young Adults up to the age of 25. DEPRECIATION
A provision made in the accounts to reflect the cost of consuming assets during the year, e.g. a vehicle purchased for £30,000 with a life of five years would depreciate on a straight-line basis at the rate of £6,000 per annum. Depreciation forms part of the ‘capital charges’ made to service revenue accounts and is covered by International Accounting Standard (IAS) 16.
EARLY INTERVENTION GRANT (EIG) A grant introduced in 2011/12 which replaced funding to schemes like the Youth Taskforce, the Youth Crime Action Plan, Young People Substance Misuse and Teenage Pregnancy. With effect from 2013/14, the grant has been rolled into the Revenue Support Grant and the Dedicated Schools Grant.
Content 13. Glossary of Terms.doc
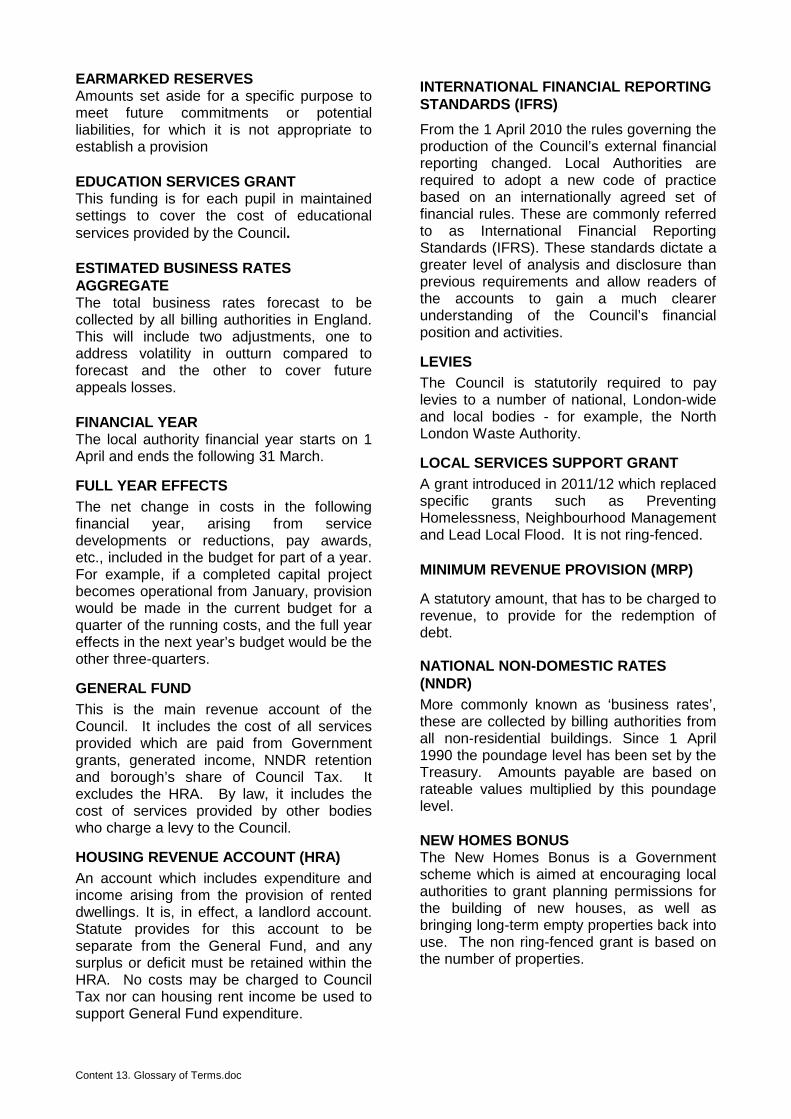
EARMARKED RESERVES Amounts set aside for a specific purpose to meet future commitments or potential liabilities, for which it is not appropriate to establish a provision EDUCATION SERVICES GRANT This funding is for each pupil in maintained settings to cover the cost of educational services provided by the Council. ESTIMATED BUSINESS RATES AGGREGATE The total business rates forecast to be collected by all billing authorities in England. This will include two adjustments, one to address volatility in outturn compared to forecast and the other to cover future appeals losses. FINANCIAL YEAR The local authority financial year starts on 1 April and ends the following 31 March.
FULL YEAR EFFECTS The net change in costs in the following financial year, arising from service developments or reductions, pay awards, etc., included in the budget for part of a year. For example, if a completed capital project becomes operational from January, provision would be made in the current budget for a quarter of the running costs, and the full year effects in the next year’s budget would be the other three-quarters.
GENERAL FUND This is the main revenue account of the Council. It includes the cost of all services provided which are paid from Government grants, generated income, NNDR retention and borough’s share of Council Tax. It excludes the HRA. By law, it includes the cost of services provided by other bodies who charge a levy to the Council.
HOUSING REVENUE ACCOUNT (HRA) An account which includes expenditure and income arising from the provision of rented dwellings. It is, in effect, a landlord account. Statute provides for this account to be separate from the General Fund, and any surplus or deficit must be retained within the HRA. No costs may be charged to Council Tax nor can housing rent income be used to support General Fund expenditure.
INTERNATIONAL FINANCIAL REPORTING STANDARDS (IFRS) From the 1 April 2010 the rules governing the production of the Council’s external financial reporting changed. Local Authorities are required to adopt a new code of practice based on an internationally agreed set of financial rules. These are commonly referred to as International Financial Reporting Standards (IFRS). These standards dictate a greater level of analysis and disclosure than previous requirements and allow readers of the accounts to gain a much clearer understanding of the Council’s financial position and activities.
LEVIES The Council is statutorily required to pay levies to a number of national, London-wide and local bodies - for example, the North London Waste Authority.
LOCAL SERVICES SUPPORT GRANT A grant introduced in 2011/12 which replaced specific grants such as Preventing Homelessness, Neighbourhood Management and Lead Local Flood. It is not ring-fenced. MINIMUM REVENUE PROVISION (MRP)
A statutory amount, that has to be charged to revenue, to provide for the redemption of debt.
NATIONAL NON-DOMESTIC RATES (NNDR) More commonly known as ‘business rates’, these are collected by billing authorities from all non-residential buildings. Since 1 April 1990 the poundage level has been set by the Treasury. Amounts payable are based on rateable values multiplied by this poundage level. NEW HOMES BONUS The New Homes Bonus is a Government scheme which is aimed at encouraging local authorities to grant planning permissions for the building of new houses, as well as bringing long-term empty properties back into use. The non ring-fenced grant is based on the number of properties.
Content 13. Glossary of Terms.doc
PENSION FUNDS For the Local Government Pension Scheme, the funds that invest employers’ and employees’ pension contributions in order to provide pensions for employees on their retirement and pensions for employees’ dependants in the event of death of an employee. PRIVATE FINANCE INITIATIVE (PFI) PFI started in 1997/98 and offers a form of Public-Private Partnership in which local authorities do not buy assets but rather pay for the use of assets held by the private sector.
PRECEPT This is the method by which a precepting authority (the Greater London Authority in London) obtains income from the billing authority to cover its net expenditure. This is calculated after deducting its own Revenue Support Grant. The precept levied by the precepting authority is incorporated within the Council Tax charge. The Council has to pay over the amount demanded on an agreed time scale. PROVISION
Amount set aside for liabilities and losses, which are certain or very likely to occur but where the exact amount or timing of the payment is uncertain.
PRUDENTIAL CODE Prior to 2004/05, the Government closely controlled capital spending by local authorities through their borrowing. The Prudential Code frees authorities to set their own borrowing limits having regard to affordability. In order to demonstrate that this has been done, and enable adherence to be monitored, authorities also have to adopt a number of appropriate ‘Prudential Indicators’. PUPIL PREMIUM GRANT In addition to the DSG, schools also receive a Pupil Premium. This is based on Free School Meals (FSM) eligibility data. This is ring-fenced to schools in the same way as DSG.
RATEABLE VALUE The Valuation Office Agency (part of HM Revenue and Customs) assesses the rateable value of individual non-domestic properties. Business Rate bills are set by
multiplying the rateable value by the NNDR poundage set by the Government for the year. (Domestic properties no longer have individual rateable values but are assigned to one of the eight valuation bands for Council Tax.)
REVENUE EXPENDITURE The regular day to day running costs an authority incurs in providing services, as distinct from Capital Expenditure.
REVENUE SUPPORT GRANT (RSG) The general grant paid by the Government to local authorities to help them finance the revenue cost of their services. It is based on the Relative Needs Formula for each authority, after taking into account its Council Tax and NNDR resources. SAFETY NET Mechanism to protect any authority which sees its business rates income drop, in any year, by more than 7.5% below their baseline funding level. The baseline funding levels are uprated each year by the September Retail Prices Index for the purposes of assessing eligibility for the safety net. START UP FUNDING ASSESSMENT From 2013/14, each Authority receives a Start-Up Funding Assessment which combines formula funding (what Formula Grant would have been had it continued) and a number of rolled-in grants. This is then broken down into two elements, the Revenue Support Grant and the Baseline Funding Level. TARIFF/TOP-UP This fee/grant is payable/receivable in respect of the amount by which the Baseline Funding Level is less than/exceeds the Business Rates Baseline. It is index linked to the Retail Prices Index.
VALUATION BANDS Eight bands for Council Tax are specified in the Local Government Finance Act 1992. Domestic properties are assigned to a band, depending upon the valuation of the property set by the District Valuer.
Content 14a. Subjective and Directorate Analysis 1617.xlsx
LONDON BOROUGH OF WALTHAM FOREST
ANNUAL BUDGET
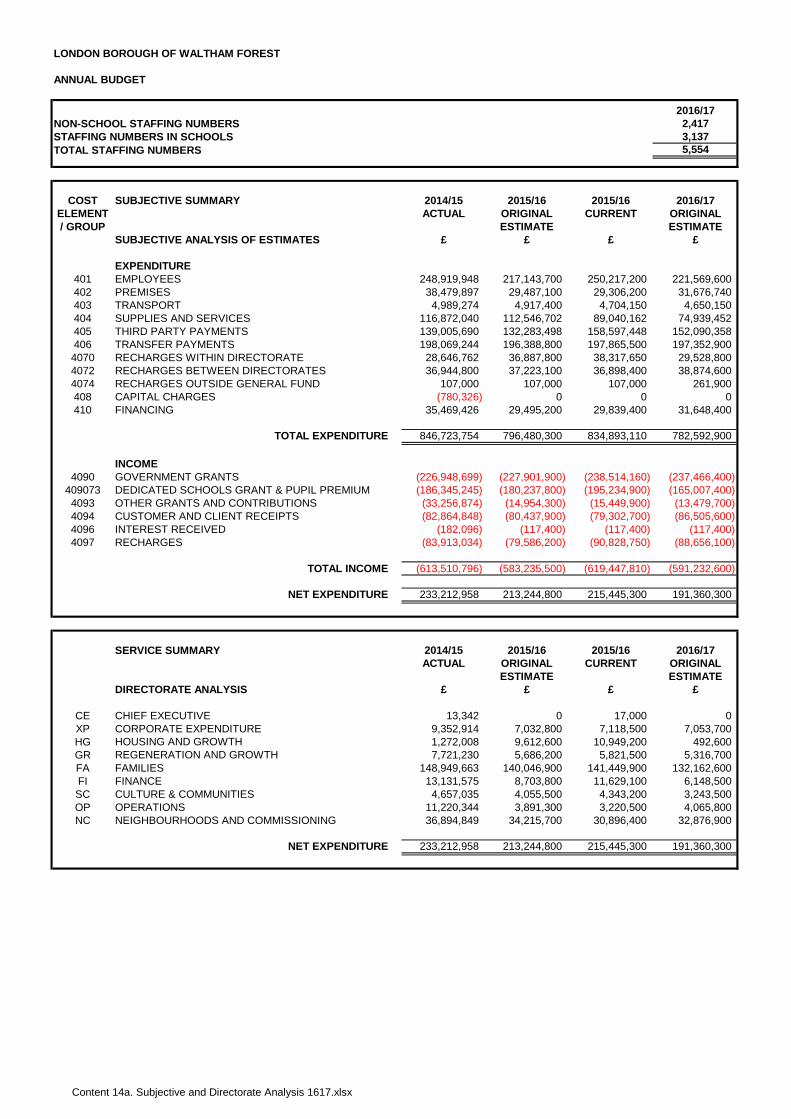
2016/17NON-SCHOOL STAFFING NUMBERS 2,417STAFFING NUMBERS IN SCHOOLS 3,137TOTAL STAFFING NUMBERS 5,554
COST SUBJECTIVE SUMMARY 2014/15 2015/16 2015/16 2016/17ELEMENT ACTUAL ORIGINAL CURRENT ORIGINAL/ GROUP ESTIMATE ESTIMATE
SUBJECTIVE ANALYSIS OF ESTIMATES £ £ £ £
EXPENDITURE401 EMPLOYEES 248,919,948 217,143,700 250,217,200 221,569,600402 PREMISES 38,479,897 29,487,100 29,306,200 31,676,740403 TRANSPORT 4,989,274 4,917,400 4,704,150 4,650,150404 SUPPLIES AND SERVICES 116,872,040 112,546,702 89,040,162 74,939,452405 THIRD PARTY PAYMENTS 139,005,690 132,283,498 158,597,448 152,090,358406 TRANSFER PAYMENTS 198,069,244 196,388,800 197,865,500 197,352,9004070 RECHARGES WITHIN DIRECTORATE 28,646,762 36,887,800 38,317,650 29,528,8004072 RECHARGES BETWEEN DIRECTORATES 36,944,800 37,223,100 36,898,400 38,874,6004074 RECHARGES OUTSIDE GENERAL FUND 107,000 107,000 107,000 261,900408 CAPITAL CHARGES (780,326) 0 0 0410 FINANCING 35,469,426 29,495,200 29,839,400 31,648,400
TOTAL EXPENDITURE 846,723,754 796,480,300 834,893,110 782,592,900
INCOME4090 GOVERNMENT GRANTS (226,948,699) (227,901,900) (238,514,160) (237,466,400)
409073 DEDICATED SCHOOLS GRANT & PUPIL PREMIUM (186,345,245) (180,237,800) (195,234,900) (165,007,400)4093 OTHER GRANTS AND CONTRIBUTIONS (33,256,874) (14,954,300) (15,449,900) (13,479,700)4094 CUSTOMER AND CLIENT RECEIPTS (82,864,848) (80,437,900) (79,302,700) (86,505,600)4096 INTEREST RECEIVED (182,096) (117,400) (117,400) (117,400)4097 RECHARGES (83,913,034) (79,586,200) (90,828,750) (88,656,100)
TOTAL INCOME (613,510,796) (583,235,500) (619,447,810) (591,232,600)
NET EXPENDITURE 233,212,958 213,244,800 215,445,300 191,360,300
SERVICE SUMMARY 2014/15 2015/16 2015/16 2016/17ACTUAL ORIGINAL CURRENT ORIGINAL
ESTIMATE ESTIMATEDIRECTORATE ANALYSIS £ £ £ £
CE CHIEF EXECUTIVE 13,342 0 17,000 0XP CORPORATE EXPENDITURE 9,352,914 7,032,800 7,118,500 7,053,700HG HOUSING AND GROWTH 1,272,008 9,612,600 10,949,200 492,600GR REGENERATION AND GROWTH 7,721,230 5,686,200 5,821,500 5,316,700FA FAMILIES 148,949,663 140,046,900 141,449,900 132,162,600FI FINANCE 13,131,575 8,703,800 11,629,100 6,148,500SC CULTURE & COMMUNITIES 4,657,035 4,055,500 4,343,200 3,243,500OP OPERATIONS 11,220,344 3,891,300 3,220,500 4,065,800NC NEIGHBOURHOODS AND COMMISSIONING 36,894,849 34,215,700 30,896,400 32,876,900
NET EXPENDITURE 233,212,958 213,244,800 215,445,300 191,360,300
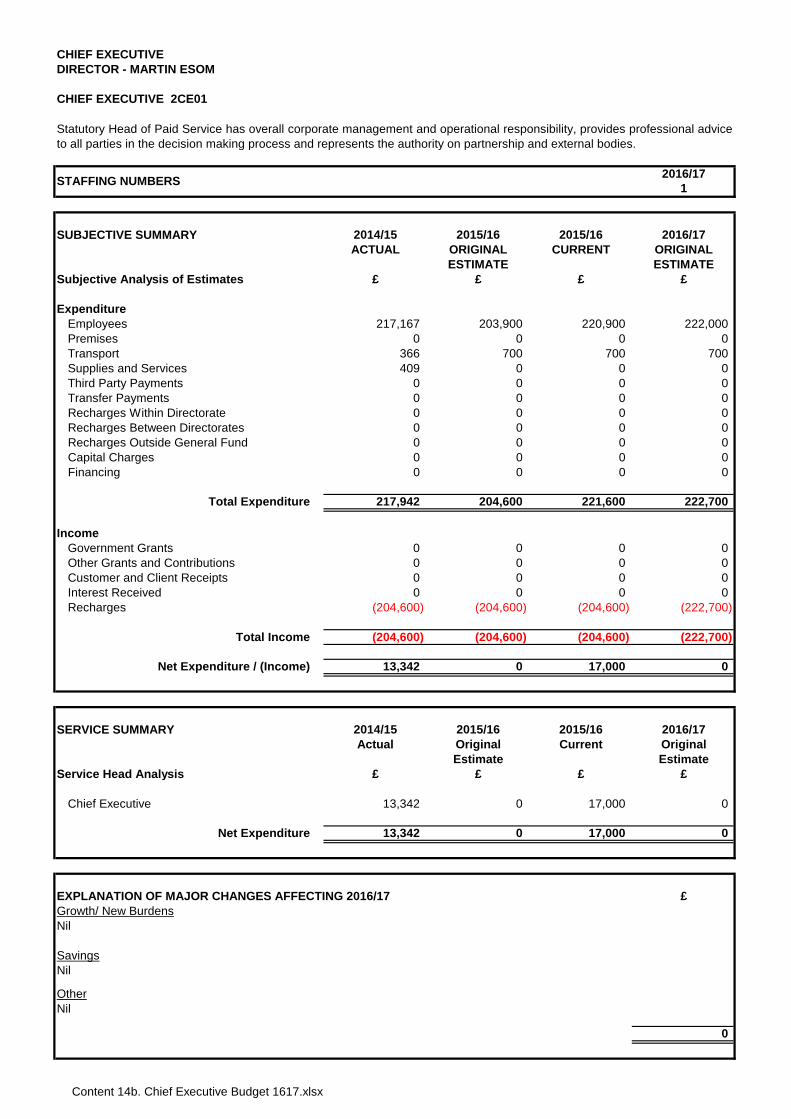
Content 14b. Chief Executive Budget 1617.xlsx
CHIEF EXECUTIVEDIRECTOR - MARTIN ESOM
CHIEF EXECUTIVE 2CE01
2016/171
SUBJECTIVE SUMMARY 2014/15 2015/16 2015/16 2016/17ACTUAL ORIGINAL CURRENT ORIGINAL
ESTIMATE ESTIMATESubjective Analysis of Estimates £ £ £ £
ExpenditureEmployees 217,167 203,900 220,900 222,000Premises 0 0 0 0Transport 366 700 700 700Supplies and Services 409 0 0 0Third Party Payments 0 0 0 0Transfer Payments 0 0 0 0Recharges Within Directorate 0 0 0 0Recharges Between Directorates 0 0 0 0Recharges Outside General Fund 0 0 0 0Capital Charges 0 0 0 0Financing 0 0 0 0
Total Expenditure 217,942 204,600 221,600 222,700
IncomeGovernment Grants 0 0 0 0Other Grants and Contributions 0 0 0 0Customer and Client Receipts 0 0 0 0Interest Received 0 0 0 0Recharges (204,600) (204,600) (204,600) (222,700)
Total Income (204,600) (204,600) (204,600) (222,700)
Net Expenditure / (Income) 13,342 0 17,000 0
SERVICE SUMMARY 2014/15 2015/16 2015/16 2016/17Actual Original Current Original
Estimate EstimateService Head Analysis £ £ £ £
Chief Executive 13,342 0 17,000 0
Net Expenditure 13,342 0 17,000 0
£Growth/ New Burdens
Savings
Other
0
Statutory Head of Paid Service has overall corporate management and operational responsibility, provides professional adviceto all parties in the decision making process and represents the authority on partnership and external bodies.
STAFFING NUMBERS
EXPLANATION OF MAJOR CHANGES AFFECTING 2016/17
Nil
Nil
Nil
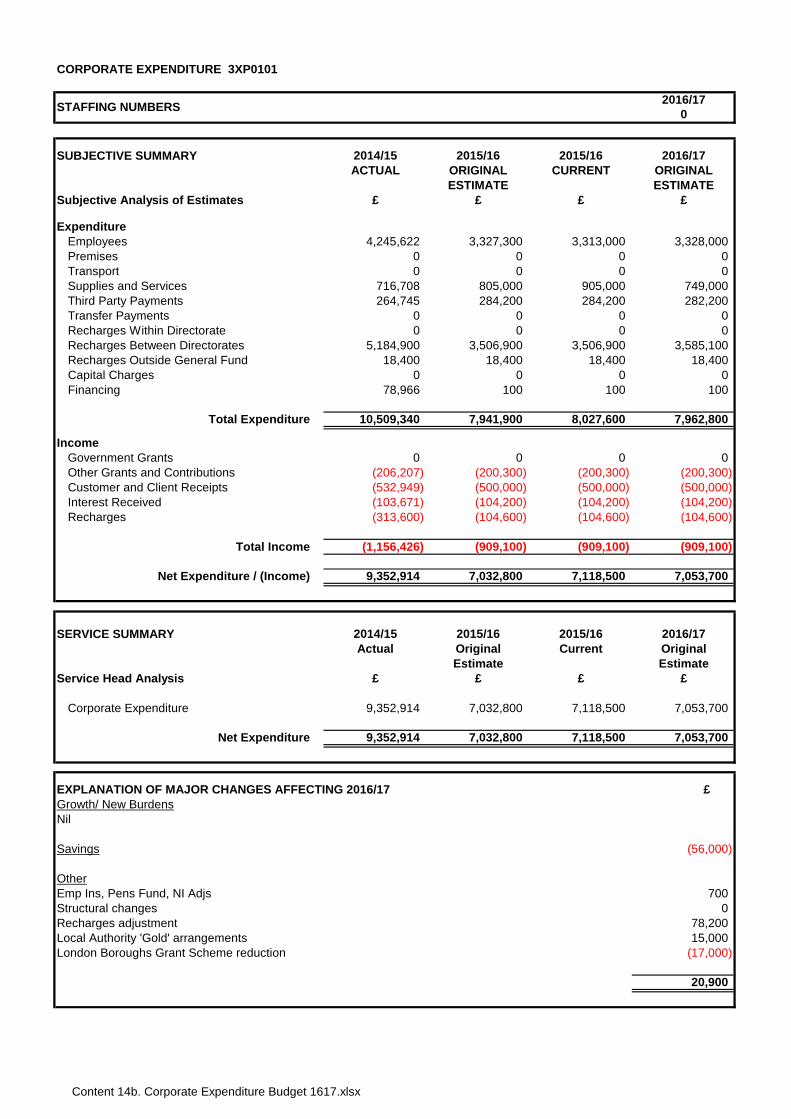
Content 14b. Corporate Expenditure Budget 1617.xlsx
CORPORATE EXPENDITURE 3XP0101
2016/170
SUBJECTIVE SUMMARY 2014/15 2015/16 2015/16 2016/17ACTUAL ORIGINAL CURRENT ORIGINAL
ESTIMATE ESTIMATESubjective Analysis of Estimates £ £ £ £
ExpenditureEmployees 4,245,622 3,327,300 3,313,000 3,328,000Premises 0 0 0 0Transport 0 0 0 0Supplies and Services 716,708 805,000 905,000 749,000Third Party Payments 264,745 284,200 284,200 282,200Transfer Payments 0 0 0 0Recharges Within Directorate 0 0 0 0Recharges Between Directorates 5,184,900 3,506,900 3,506,900 3,585,100Recharges Outside General Fund 18,400 18,400 18,400 18,400Capital Charges 0 0 0 0Financing 78,966 100 100 100
Total Expenditure 10,509,340 7,941,900 8,027,600 7,962,800
IncomeGovernment Grants 0 0 0 0Other Grants and Contributions (206,207) (200,300) (200,300) (200,300)Customer and Client Receipts (532,949) (500,000) (500,000) (500,000)Interest Received (103,671) (104,200) (104,200) (104,200)Recharges (313,600) (104,600) (104,600) (104,600)
Total Income (1,156,426) (909,100) (909,100) (909,100)
Net Expenditure / (Income) 9,352,914 7,032,800 7,118,500 7,053,700
SERVICE SUMMARY 2014/15 2015/16 2015/16 2016/17Actual Original Current Original
Estimate EstimateService Head Analysis £ £ £ £
Corporate Expenditure 9,352,914 7,032,800 7,118,500 7,053,700
Net Expenditure 9,352,914 7,032,800 7,118,500 7,053,700
£Growth/ New BurdensNil
Savings (56,000)
OtherEmp Ins, Pens Fund, NI Adjs 700Structural changes 0
78,20015,000
London Boroughs Grant Scheme reduction (17,000)
20,900
STAFFING NUMBERS
Recharges adjustment
EXPLANATION OF MAJOR CHANGES AFFECTING 2016/17
Local Authority 'Gold' arrangements
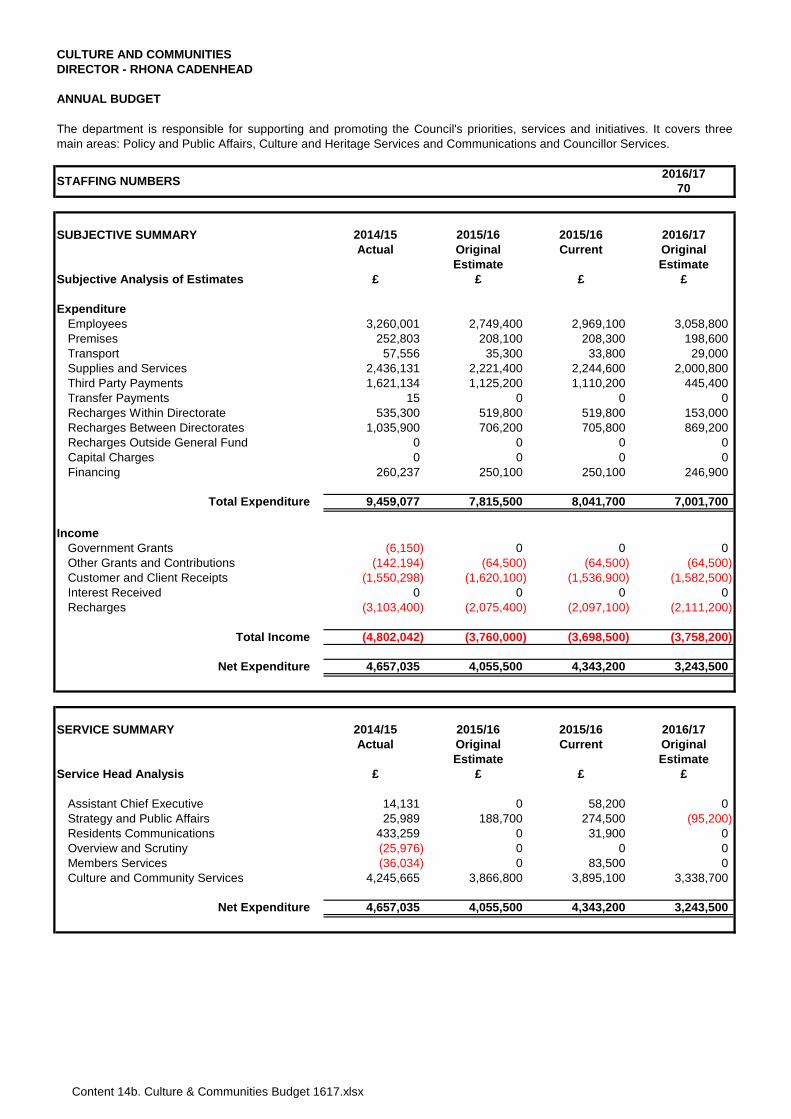
Content 14b. Culture & Communities Budget 1617.xlsx
CULTURE AND COMMUNITIESDIRECTOR - RHONA CADENHEAD
ANNUAL BUDGET
2016/1770
SUBJECTIVE SUMMARY 2014/15 2015/16 2015/16 2016/17Actual Original Current Original
Estimate EstimateSubjective Analysis of Estimates £ £ £ £
ExpenditureEmployees 3,260,001 2,749,400 2,969,100 3,058,800Premises 252,803 208,100 208,300 198,600Transport 57,556 35,300 33,800 29,000Supplies and Services 2,436,131 2,221,400 2,244,600 2,000,800Third Party Payments 1,621,134 1,125,200 1,110,200 445,400Transfer Payments 15 0 0 0Recharges Within Directorate 535,300 519,800 519,800 153,000Recharges Between Directorates 1,035,900 706,200 705,800 869,200Recharges Outside General Fund 0 0 0 0Capital Charges 0 0 0 0Financing 260,237 250,100 250,100 246,900
Total Expenditure 9,459,077 7,815,500 8,041,700 7,001,700
IncomeGovernment Grants (6,150) 0 0 0Other Grants and Contributions (142,194) (64,500) (64,500) (64,500)Customer and Client Receipts (1,550,298) (1,620,100) (1,536,900) (1,582,500)Interest Received 0 0 0 0Recharges (3,103,400) (2,075,400) (2,097,100) (2,111,200)
Total Income (4,802,042) (3,760,000) (3,698,500) (3,758,200)
Net Expenditure 4,657,035 4,055,500 4,343,200 3,243,500
SERVICE SUMMARY 2014/15 2015/16 2015/16 2016/17Actual Original Current Original
Estimate EstimateService Head Analysis £ £ £ £
Assistant Chief Executive 14,131 0 58,200 0Strategy and Public Affairs 25,989 188,700 274,500 (95,200)Residents Communications 433,259 0 31,900 0Overview and Scrutiny (25,976) 0 0 0Members Services (36,034) 0 83,500 0Culture and Community Services 4,245,665 3,866,800 3,895,100 3,338,700
Net Expenditure 4,657,035 4,055,500 4,343,200 3,243,500
The department is responsible for supporting and promoting the Council's priorities, services and initiatives. It covers threemain areas: Policy and Public Affairs, Culture and Heritage Services and Communications and Councillor Services.
STAFFING NUMBERS
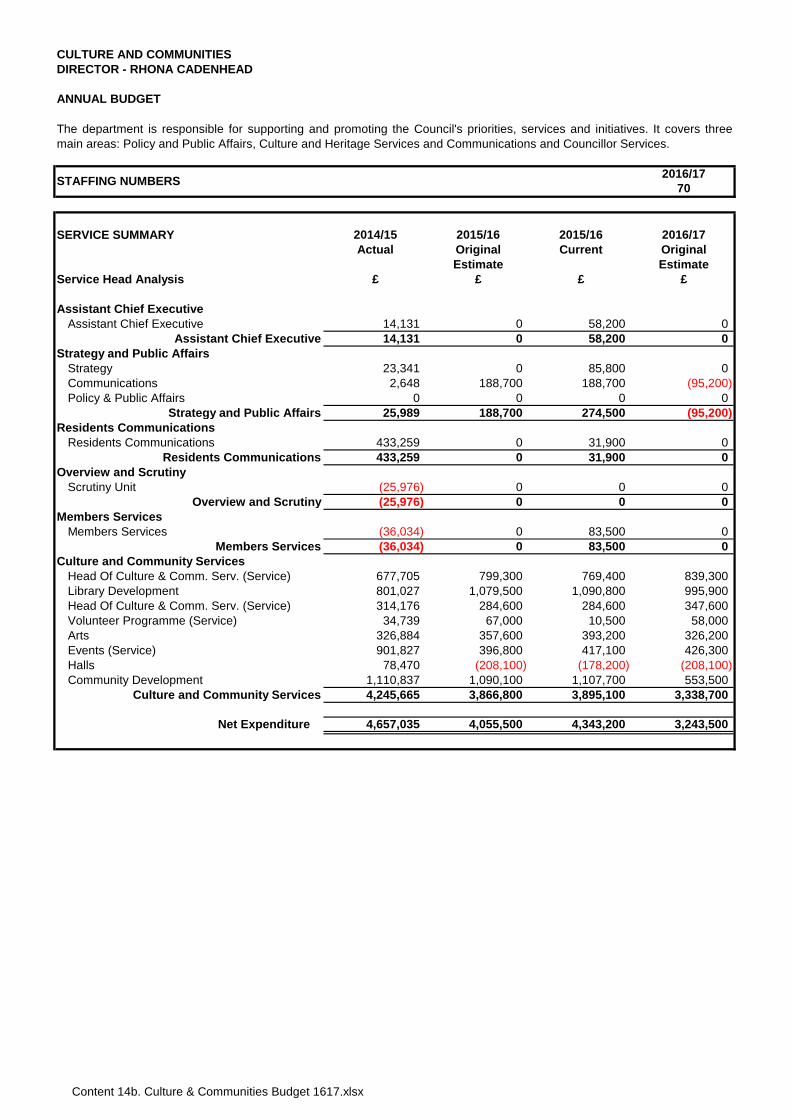
Content 14b. Culture & Communities Budget 1617.xlsx
CULTURE AND COMMUNITIESDIRECTOR - RHONA CADENHEAD
ANNUAL BUDGET
2016/1770
SERVICE SUMMARY 2014/15 2015/16 2015/16 2016/17Actual Original Current Original
Estimate EstimateService Head Analysis £ £ £ £
Assistant Chief ExecutiveAssistant Chief Executive 14,131 0 58,200 0
Assistant Chief Executive 14,131 0 58,200 0Strategy and Public Affairs
Strategy 23,341 0 85,800 0Communications 2,648 188,700 188,700 (95,200)Policy & Public Affairs 0 0 0 0
Strategy and Public Affairs 25,989 188,700 274,500 (95,200)Residents Communications
Residents Communications 433,259 0 31,900 0Residents Communications 433,259 0 31,900 0
Overview and ScrutinyScrutiny Unit (25,976) 0 0 0
Overview and Scrutiny (25,976) 0 0 0Members Services
Members Services (36,034) 0 83,500 0Members Services (36,034) 0 83,500 0
Culture and Community ServicesHead Of Culture & Comm. Serv. (Service) 677,705 799,300 769,400 839,300Library Development 801,027 1,079,500 1,090,800 995,900Head Of Culture & Comm. Serv. (Service) 314,176 284,600 284,600 347,600Volunteer Programme (Service) 34,739 67,000 10,500 58,000Arts 326,884 357,600 393,200 326,200Events (Service) 901,827 396,800 417,100 426,300Halls 78,470 (208,100) (178,200) (208,100)Community Development 1,110,837 1,090,100 1,107,700 553,500
Culture and Community Services 4,245,665 3,866,800 3,895,100 3,338,700
Net Expenditure 4,657,035 4,055,500 4,343,200 3,243,500
The department is responsible for supporting and promoting the Council's priorities, services and initiatives. It covers threemain areas: Policy and Public Affairs, Culture and Heritage Services and Communications and Councillor Services.
STAFFING NUMBERS
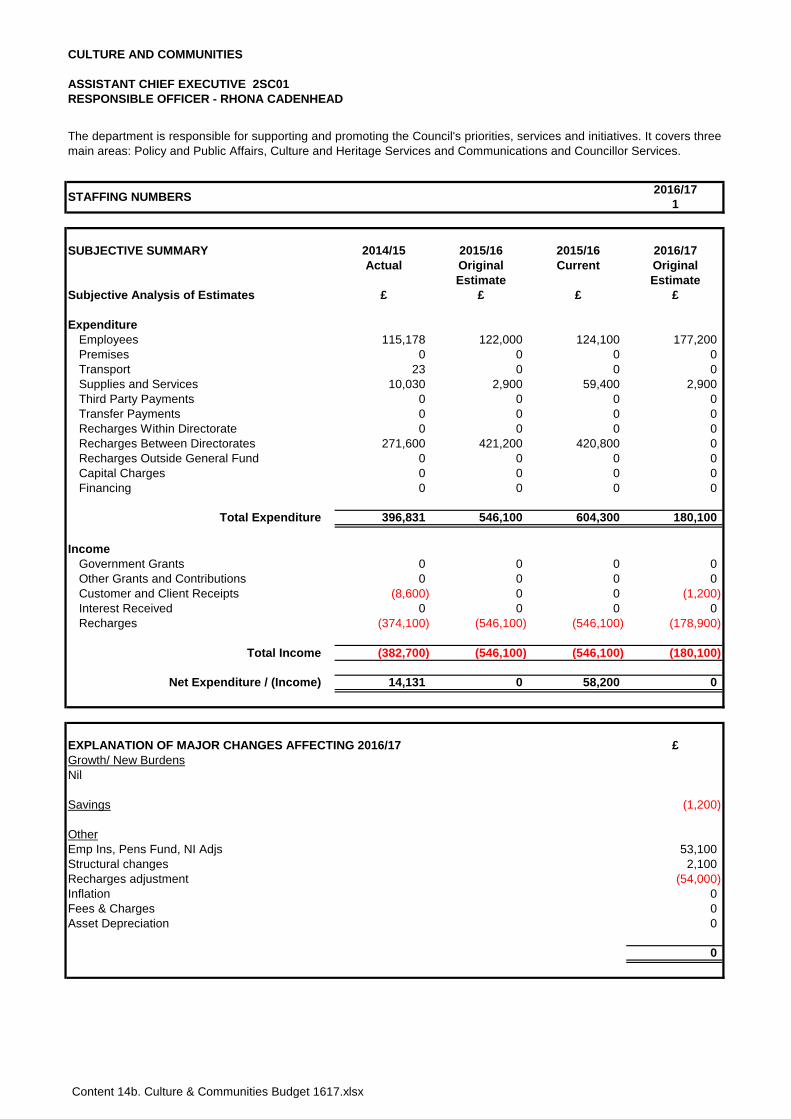
Content 14b. Culture & Communities Budget 1617.xlsx
CULTURE AND COMMUNITIES
ASSISTANT CHIEF EXECUTIVE 2SC01RESPONSIBLE OFFICER - RHONA CADENHEAD
2016/171
SUBJECTIVE SUMMARY 2014/15 2015/16 2015/16 2016/17Actual Original Current Original
Estimate EstimateSubjective Analysis of Estimates £ £ £ £
ExpenditureEmployees 115,178 122,000 124,100 177,200Premises 0 0 0 0Transport 23 0 0 0Supplies and Services 10,030 2,900 59,400 2,900Third Party Payments 0 0 0 0Transfer Payments 0 0 0 0Recharges Within Directorate 0 0 0 0Recharges Between Directorates 271,600 421,200 420,800 0Recharges Outside General Fund 0 0 0 0Capital Charges 0 0 0 0Financing 0 0 0 0
Total Expenditure 396,831 546,100 604,300 180,100
IncomeGovernment Grants 0 0 0 0Other Grants and Contributions 0 0 0 0Customer and Client Receipts (8,600) 0 0 (1,200)Interest Received 0 0 0 0Recharges (374,100) (546,100) (546,100) (178,900)
Total Income (382,700) (546,100) (546,100) (180,100)
Net Expenditure / (Income) 14,131 0 58,200 0
£Growth/ New Burdens
Savings (1,200)
OtherEmp Ins, Pens Fund, NI Adjs 53,100Structural changes 2,100
(54,000)Inflation 0
00
0
Fees & Charges
The department is responsible for supporting and promoting the Council's priorities, services and initiatives. It covers threemain areas: Policy and Public Affairs, Culture and Heritage Services and Communications and Councillor Services.
STAFFING NUMBERS
EXPLANATION OF MAJOR CHANGES AFFECTING 2016/17
Nil
Asset Depreciation
Recharges adjustment
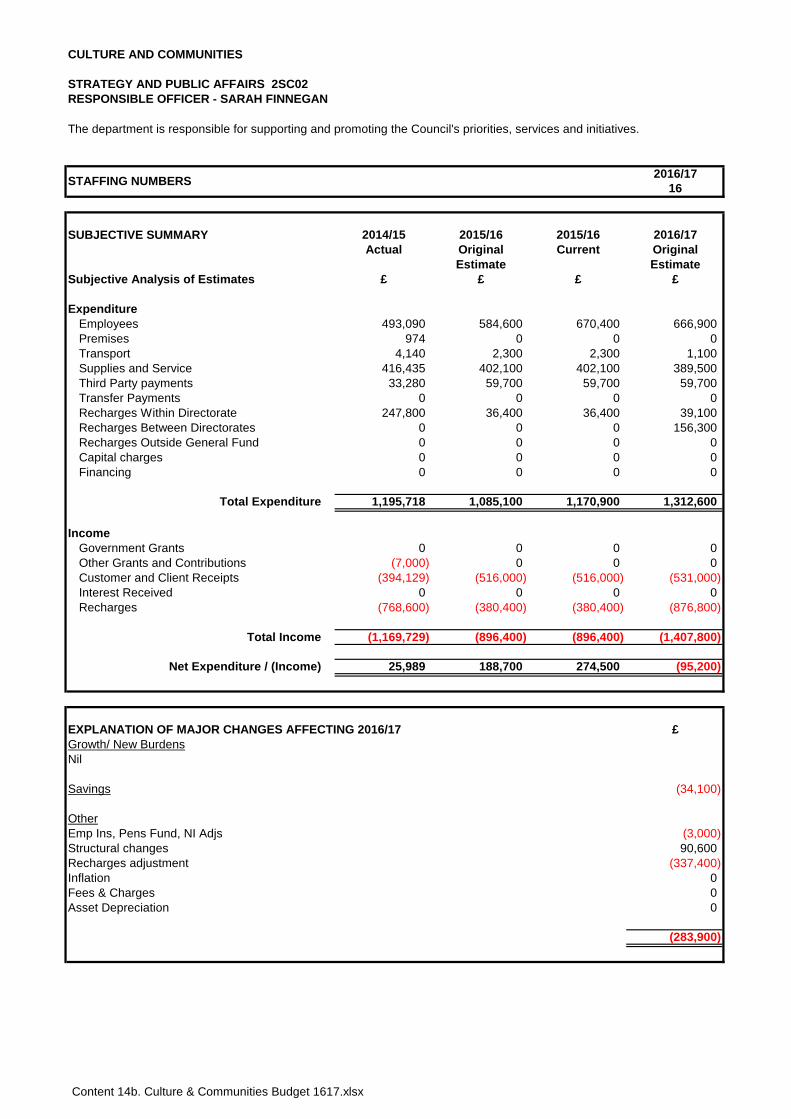
Content 14b. Culture & Communities Budget 1617.xlsx
CULTURE AND COMMUNITIES
STRATEGY AND PUBLIC AFFAIRS 2SC02RESPONSIBLE OFFICER - SARAH FINNEGAN
2016/1716
SUBJECTIVE SUMMARY 2014/15 2015/16 2015/16 2016/17Actual Original Current Original
Estimate EstimateSubjective Analysis of Estimates £ £ £ £
ExpenditureEmployees 493,090 584,600 670,400 666,900Premises 974 0 0 0Transport 4,140 2,300 2,300 1,100Supplies and Service 416,435 402,100 402,100 389,500Third Party payments 33,280 59,700 59,700 59,700Transfer Payments 0 0 0 0Recharges Within Directorate 247,800 36,400 36,400 39,100Recharges Between Directorates 0 0 0 156,300Recharges Outside General Fund 0 0 0 0Capital charges 0 0 0 0Financing 0 0 0 0
Total Expenditure 1,195,718 1,085,100 1,170,900 1,312,600
IncomeGovernment Grants 0 0 0 0Other Grants and Contributions (7,000) 0 0 0Customer and Client Receipts (394,129) (516,000) (516,000) (531,000)Interest Received 0 0 0 0Recharges (768,600) (380,400) (380,400) (876,800)
Total Income (1,169,729) (896,400) (896,400) (1,407,800)
Net Expenditure / (Income) 25,989 188,700 274,500 (95,200)
£Growth/ New Burdens
(34,100)
OtherEmp Ins, Pens Fund, NI Adjs (3,000)Structural changes 90,600
(337,400)Inflation 0
00
(283,900)
The department is responsible for supporting and promoting the Council's priorities, services and initiatives.
STAFFING NUMBERS
EXPLANATION OF MAJOR CHANGES AFFECTING 2016/17
Asset Depreciation
Savings
Nil
Recharges adjustment
Fees & Charges
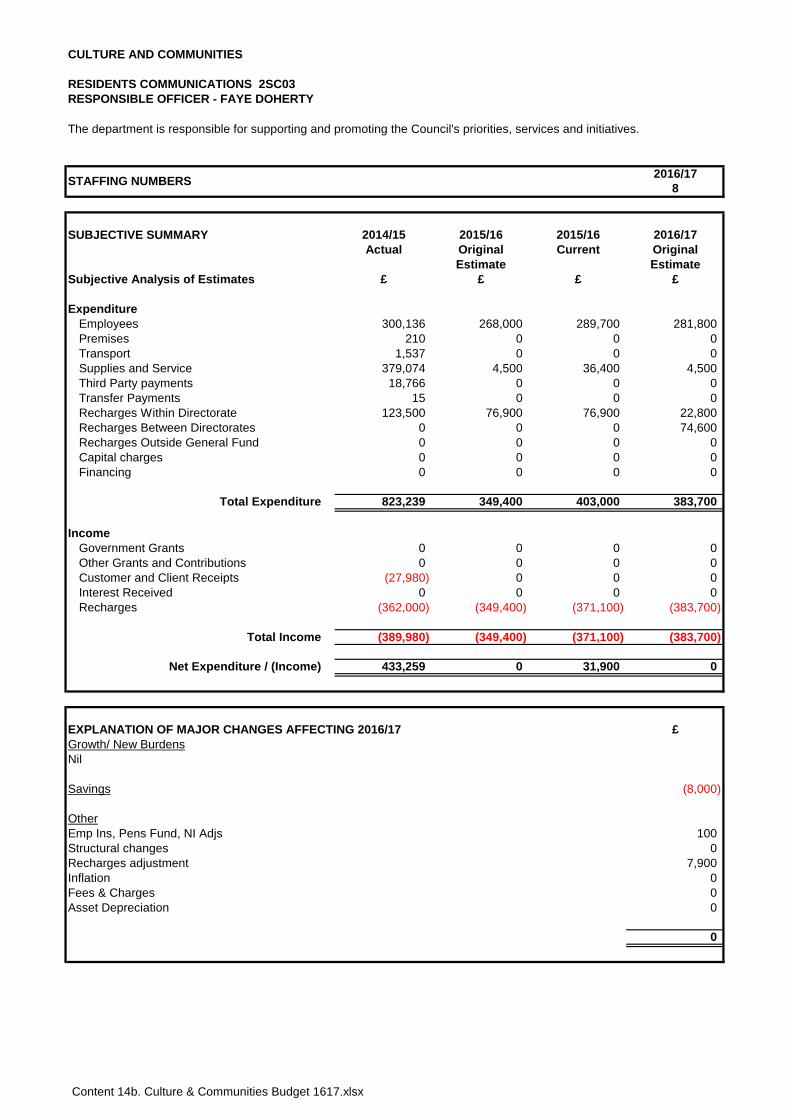
Content 14b. Culture & Communities Budget 1617.xlsx
CULTURE AND COMMUNITIES
RESIDENTS COMMUNICATIONS 2SC03RESPONSIBLE OFFICER - FAYE DOHERTY
2016/178
SUBJECTIVE SUMMARY 2014/15 2015/16 2015/16 2016/17Actual Original Current Original
Estimate EstimateSubjective Analysis of Estimates £ £ £ £
ExpenditureEmployees 300,136 268,000 289,700 281,800Premises 210 0 0 0Transport 1,537 0 0 0Supplies and Service 379,074 4,500 36,400 4,500Third Party payments 18,766 0 0 0Transfer Payments 15 0 0 0Recharges Within Directorate 123,500 76,900 76,900 22,800Recharges Between Directorates 0 0 0 74,600Recharges Outside General Fund 0 0 0 0Capital charges 0 0 0 0Financing 0 0 0 0
Total Expenditure 823,239 349,400 403,000 383,700
IncomeGovernment Grants 0 0 0 0Other Grants and Contributions 0 0 0 0Customer and Client Receipts (27,980) 0 0 0Interest Received 0 0 0 0Recharges (362,000) (349,400) (371,100) (383,700)
Total Income (389,980) (349,400) (371,100) (383,700)
Net Expenditure / (Income) 433,259 0 31,900 0
£Growth/ New Burdens
Savings (8,000)
OtherEmp Ins, Pens Fund, NI Adjs 100Structural changes 0
7,900Inflation 0
00
0
The department is responsible for supporting and promoting the Council's priorities, services and initiatives.
Asset Depreciation
STAFFING NUMBERS
EXPLANATION OF MAJOR CHANGES AFFECTING 2016/17
Nil
Recharges adjustment
Fees & Charges

Content 14b. Culture & Communities Budget 1617.xlsx
CULTURE AND COMMUNITIES
OVERVIEW AND SCRUTINY 2SC04RESPONSIBLE OFFICER - NONE
2016/170
SUBJECTIVE SUMMARY 2014/15 2015/16 2015/16 2016/17Actual Original Current Original
Estimate EstimateSubjective Analysis of Estimates £ £ £ £
ExpenditureEmployees 173,646 18,100 18,100 0Premises 0 0 0 0Transport 183 200 200 0Supplies and Service 9,695 12,600 12,600 0Third Party payments 0 0 0 0Transfer Payments 0 0 0 0Recharges Within Directorate 65,000 0 0 0Recharges Between Directorates 0 0 0 0Recharges Outside General Fund 0 0 0 0Capital charges 0 0 0 0Financing 0 0 0 0
Total Expenditure 248,525 30,900 30,900 0
IncomeGovernment Grants 0 0 0 0Other Grants and Contributions 0 0 0 0Customer and Client Receipts 0 0 0 0Interest Received 0 0 0 0Recharges (274,500) (30,900) (30,900) 0
Total Income (274,500) (30,900) (30,900) 0
Net Expenditure / (Income) (25,976) 0 0 0
£Growth/ New Burdens
(10,000)
OtherEmp Ins, Pens Fund, NI Adjs (16,100)Structural changes (4,800)
30,900Inflation 0
00
0
Service has been restructured
STAFFING NUMBERS
EXPLANATION OF MAJOR CHANGES AFFECTING 2016/17
Nil
Savings
Asset Depreciation
Recharges adjustment
Fees & Charges
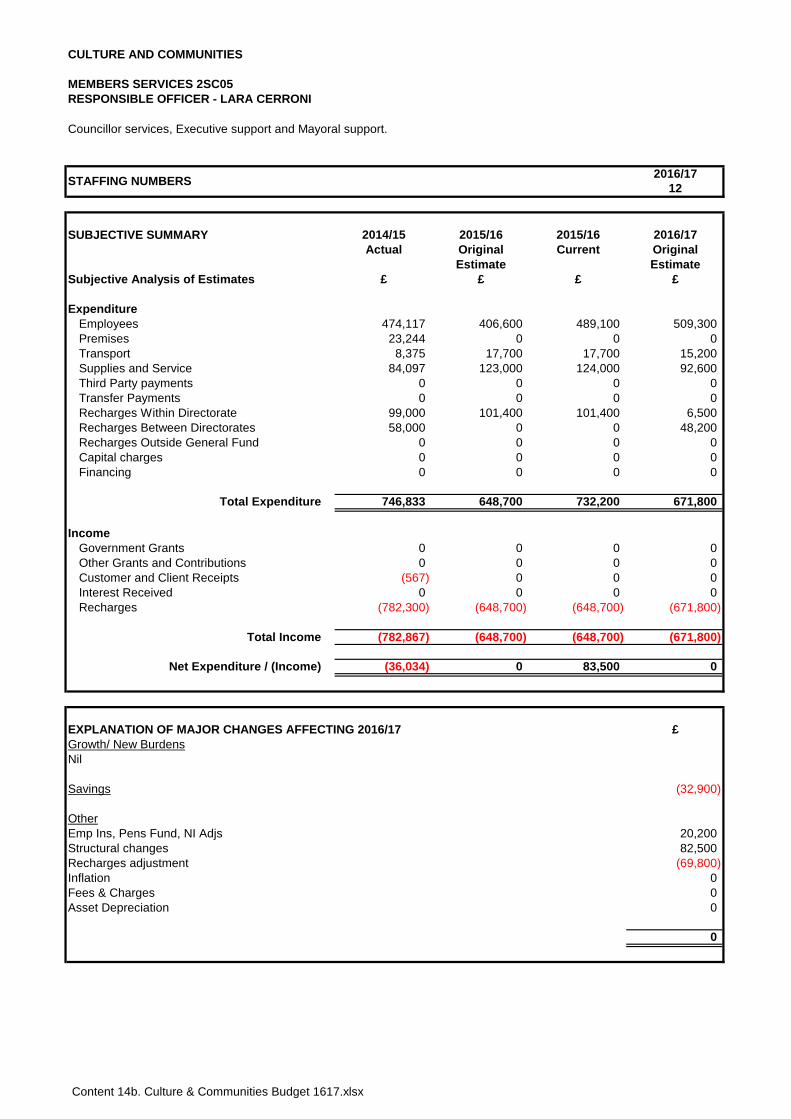
Content 14b. Culture & Communities Budget 1617.xlsx
CULTURE AND COMMUNITIES
MEMBERS SERVICES 2SC05RESPONSIBLE OFFICER - LARA CERRONI
2016/1712
SUBJECTIVE SUMMARY 2014/15 2015/16 2015/16 2016/17Actual Original Current Original
Estimate EstimateSubjective Analysis of Estimates £ £ £ £
ExpenditureEmployees 474,117 406,600 489,100 509,300Premises 23,244 0 0 0Transport 8,375 17,700 17,700 15,200Supplies and Service 84,097 123,000 124,000 92,600Third Party payments 0 0 0 0Transfer Payments 0 0 0 0Recharges Within Directorate 99,000 101,400 101,400 6,500Recharges Between Directorates 58,000 0 0 48,200Recharges Outside General Fund 0 0 0 0Capital charges 0 0 0 0Financing 0 0 0 0
Total Expenditure 746,833 648,700 732,200 671,800
IncomeGovernment Grants 0 0 0 0Other Grants and Contributions 0 0 0 0Customer and Client Receipts (567) 0 0 0Interest Received 0 0 0 0Recharges (782,300) (648,700) (648,700) (671,800)
Total Income (782,867) (648,700) (648,700) (671,800)
Net Expenditure / (Income) (36,034) 0 83,500 0
£Growth/ New Burdens
(32,900)
OtherEmp Ins, Pens Fund, NI Adjs 20,200Structural changes 82,500
(69,800)Inflation 0
00
0
Councillor services, Executive support and Mayoral support.
STAFFING NUMBERS
EXPLANATION OF MAJOR CHANGES AFFECTING 2016/17
Nil
Savings
Asset Depreciation
Recharges adjustment
Fees & Charges
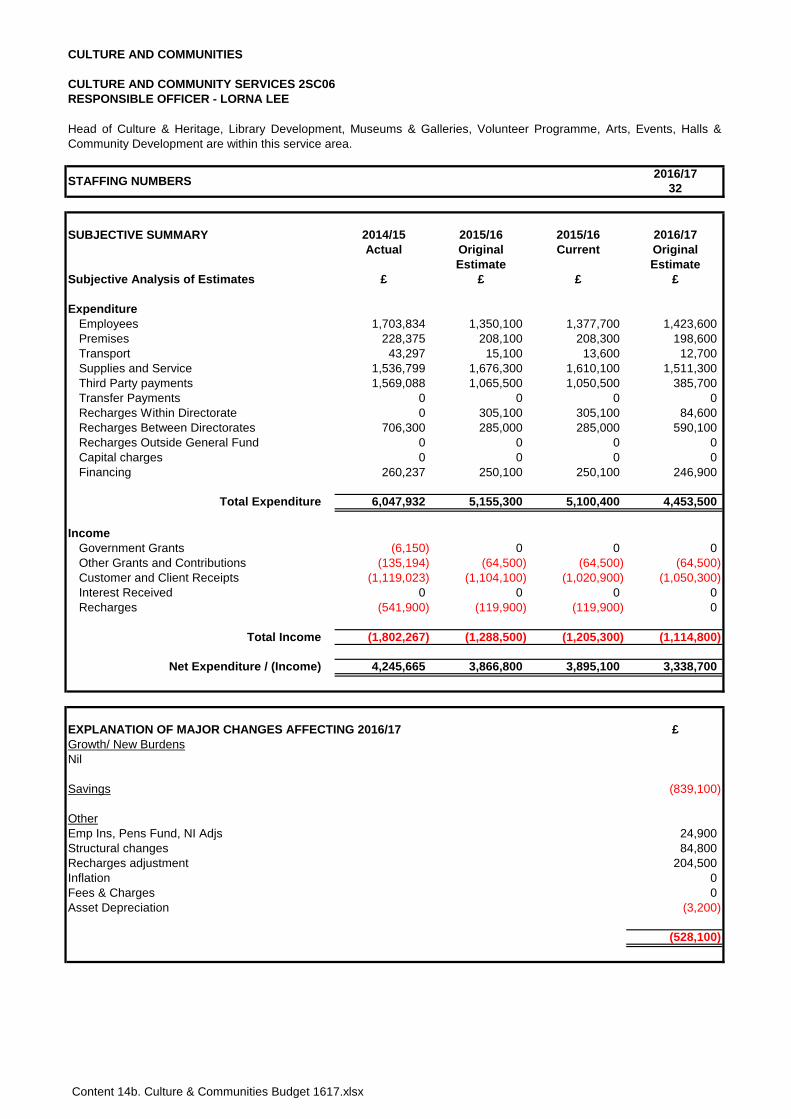
Content 14b. Culture & Communities Budget 1617.xlsx
CULTURE AND COMMUNITIES
CULTURE AND COMMUNITY SERVICES 2SC06RESPONSIBLE OFFICER - LORNA LEE
2016/1732
SUBJECTIVE SUMMARY 2014/15 2015/16 2015/16 2016/17Actual Original Current Original
Estimate EstimateSubjective Analysis of Estimates £ £ £ £
ExpenditureEmployees 1,703,834 1,350,100 1,377,700 1,423,600Premises 228,375 208,100 208,300 198,600Transport 43,297 15,100 13,600 12,700Supplies and Service 1,536,799 1,676,300 1,610,100 1,511,300Third Party payments 1,569,088 1,065,500 1,050,500 385,700Transfer Payments 0 0 0 0Recharges Within Directorate 0 305,100 305,100 84,600Recharges Between Directorates 706,300 285,000 285,000 590,100Recharges Outside General Fund 0 0 0 0Capital charges 0 0 0 0Financing 260,237 250,100 250,100 246,900
Total Expenditure 6,047,932 5,155,300 5,100,400 4,453,500
IncomeGovernment Grants (6,150) 0 0 0Other Grants and Contributions (135,194) (64,500) (64,500) (64,500)Customer and Client Receipts (1,119,023) (1,104,100) (1,020,900) (1,050,300)Interest Received 0 0 0 0Recharges (541,900) (119,900) (119,900) 0
Total Income (1,802,267) (1,288,500) (1,205,300) (1,114,800)
Net Expenditure / (Income) 4,245,665 3,866,800 3,895,100 3,338,700
£Growth/ New Burdens
(839,100)
OtherEmp Ins, Pens Fund, NI Adjs 24,900Structural changes 84,800
204,500Inflation 0
0(3,200)
(528,100)
Head of Culture & Heritage, Library Development, Museums & Galleries, Volunteer Programme, Arts, Events, Halls &Community Development are within this service area.
STAFFING NUMBERS
EXPLANATION OF MAJOR CHANGES AFFECTING 2016/17
Nil
Savings
Asset Depreciation
Recharges adjustment
Fees & Charges
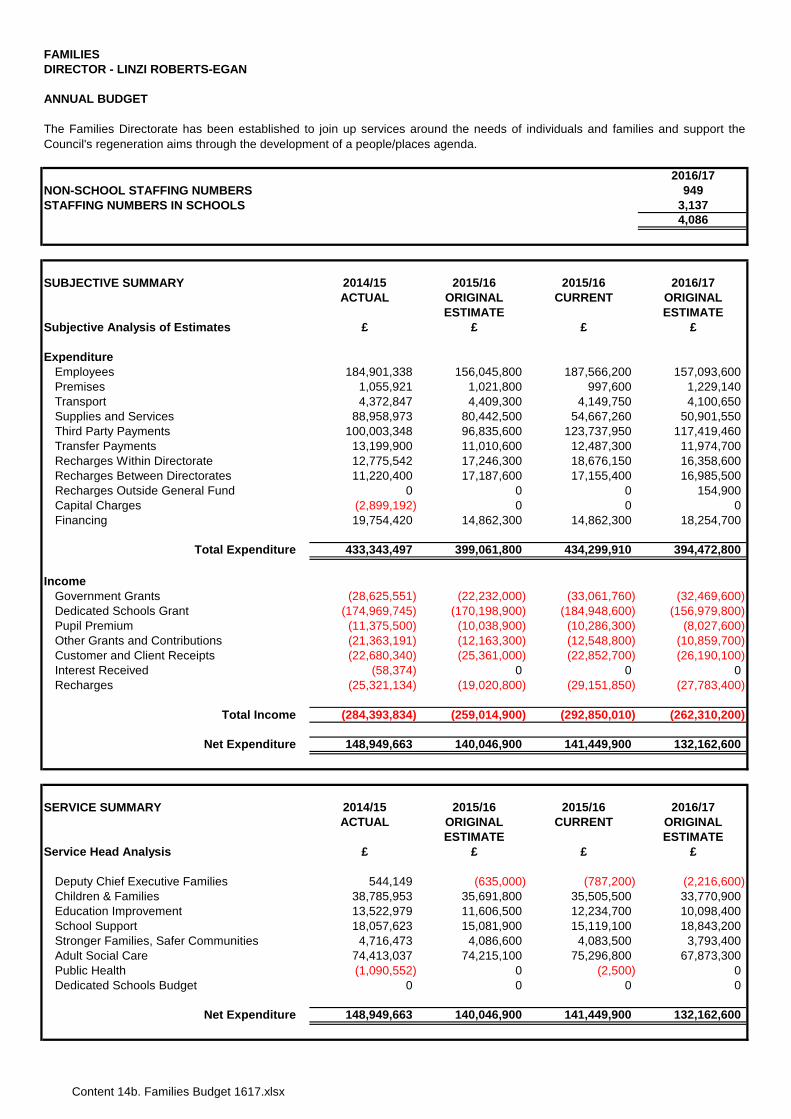
Content 14b. Families Budget 1617.xlsx
FAMILIESDIRECTOR - LINZI ROBERTS-EGAN
ANNUAL BUDGET
2016/17NON-SCHOOL STAFFING NUMBERS 949STAFFING NUMBERS IN SCHOOLS 3,137
4,086
SUBJECTIVE SUMMARY 2014/15 2015/16 2015/16 2016/17ACTUAL ORIGINAL CURRENT ORIGINAL
ESTIMATE ESTIMATESubjective Analysis of Estimates £ £ £ £
ExpenditureEmployees 184,901,338 156,045,800 187,566,200 157,093,600Premises 1,055,921 1,021,800 997,600 1,229,140Transport 4,372,847 4,409,300 4,149,750 4,100,650Supplies and Services 88,958,973 80,442,500 54,667,260 50,901,550Third Party Payments 100,003,348 96,835,600 123,737,950 117,419,460Transfer Payments 13,199,900 11,010,600 12,487,300 11,974,700Recharges Within Directorate 12,775,542 17,246,300 18,676,150 16,358,600Recharges Between Directorates 11,220,400 17,187,600 17,155,400 16,985,500Recharges Outside General Fund 0 0 0 154,900Capital Charges (2,899,192) 0 0 0Financing 19,754,420 14,862,300 14,862,300 18,254,700
Total Expenditure 433,343,497 399,061,800 434,299,910 394,472,800
IncomeGovernment Grants (28,625,551) (22,232,000) (33,061,760) (32,469,600)Dedicated Schools Grant (174,969,745) (170,198,900) (184,948,600) (156,979,800)Pupil Premium (11,375,500) (10,038,900) (10,286,300) (8,027,600)Other Grants and Contributions (21,363,191) (12,163,300) (12,548,800) (10,859,700)Customer and Client Receipts (22,680,340) (25,361,000) (22,852,700) (26,190,100)Interest Received (58,374) 0 0 0Recharges (25,321,134) (19,020,800) (29,151,850) (27,783,400)
Total Income (284,393,834) (259,014,900) (292,850,010) (262,310,200)
Net Expenditure 148,949,663 140,046,900 141,449,900 132,162,600
SERVICE SUMMARY 2014/15 2015/16 2015/16 2016/17ACTUAL ORIGINAL CURRENT ORIGINAL
ESTIMATE ESTIMATEService Head Analysis £ £ £ £
Deputy Chief Executive Families 544,149 (635,000) (787,200) (2,216,600)Children & Families 38,785,953 35,691,800 35,505,500 33,770,900Education Improvement 13,522,979 11,606,500 12,234,700 10,098,400School Support 18,057,623 15,081,900 15,119,100 18,843,200Stronger Families, Safer Communities 4,716,473 4,086,600 4,083,500 3,793,400Adult Social Care 74,413,037 74,215,100 75,296,800 67,873,300Public Health (1,090,552) 0 (2,500) 0Dedicated Schools Budget 0 0 0 0
Net Expenditure 148,949,663 140,046,900 141,449,900 132,162,600
The Families Directorate has been established to join up services around the needs of individuals and families and support theCouncil's regeneration aims through the development of a people/places agenda.
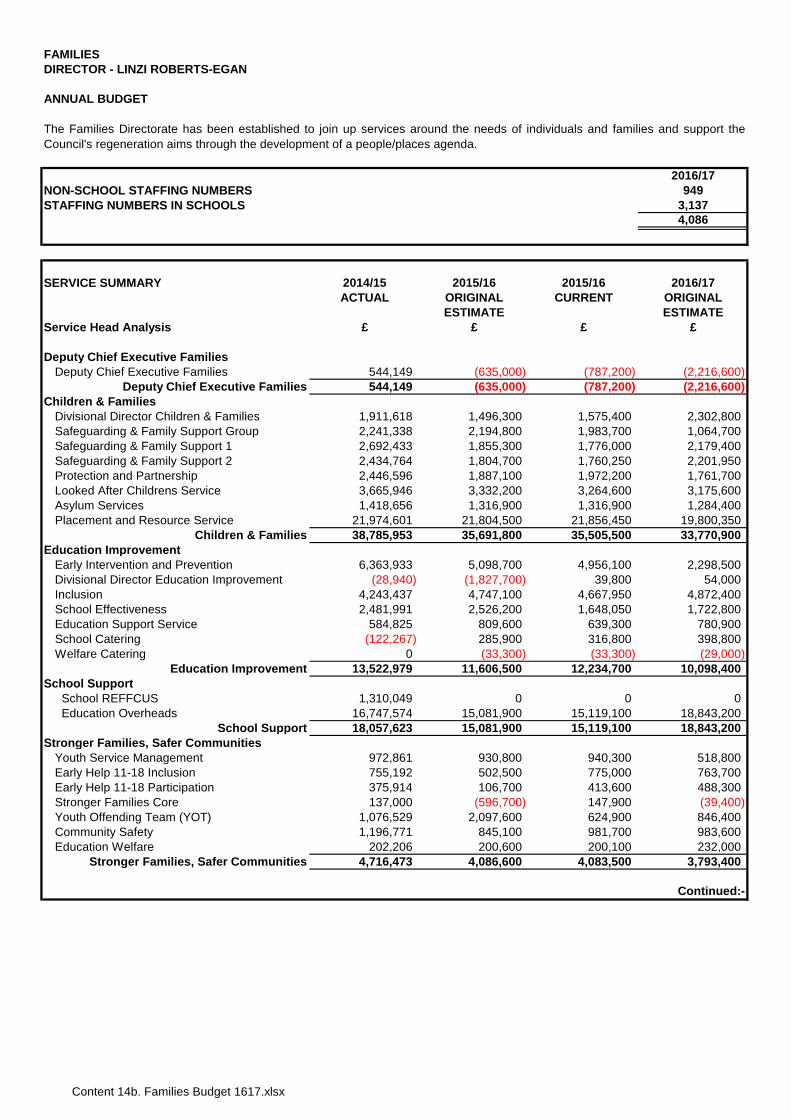
Content 14b. Families Budget 1617.xlsx
FAMILIESDIRECTOR - LINZI ROBERTS-EGAN
ANNUAL BUDGET
2016/17NON-SCHOOL STAFFING NUMBERS 949STAFFING NUMBERS IN SCHOOLS 3,137
4,086
SERVICE SUMMARY 2014/15 2015/16 2015/16 2016/17ACTUAL ORIGINAL CURRENT ORIGINAL
ESTIMATE ESTIMATEService Head Analysis £ £ £ £
Deputy Chief Executive FamiliesDeputy Chief Executive Families 544,149 (635,000) (787,200) (2,216,600)
Deputy Chief Executive Families 544,149 (635,000) (787,200) (2,216,600)Children & Families
Divisional Director Children & Families 1,911,618 1,496,300 1,575,400 2,302,800Safeguarding & Family Support Group 2,241,338 2,194,800 1,983,700 1,064,700Safeguarding & Family Support 1 2,692,433 1,855,300 1,776,000 2,179,400Safeguarding & Family Support 2 2,434,764 1,804,700 1,760,250 2,201,950Protection and Partnership 2,446,596 1,887,100 1,972,200 1,761,700Looked After Childrens Service 3,665,946 3,332,200 3,264,600 3,175,600Asylum Services 1,418,656 1,316,900 1,316,900 1,284,400Placement and Resource Service 21,974,601 21,804,500 21,856,450 19,800,350
Children & Families 38,785,953 35,691,800 35,505,500 33,770,900Education Improvement
Early Intervention and Prevention 6,363,933 5,098,700 4,956,100 2,298,500Divisional Director Education Improvement (28,940) (1,827,700) 39,800 54,000Inclusion 4,243,437 4,747,100 4,667,950 4,872,400School Effectiveness 2,481,991 2,526,200 1,648,050 1,722,800Education Support Service 584,825 809,600 639,300 780,900School Catering (122,267) 285,900 316,800 398,800Welfare Catering 0 (33,300) (33,300) (29,000)
Education Improvement 13,522,979 11,606,500 12,234,700 10,098,400School Support
School REFFCUS 1,310,049 0 0 0 Education Overheads 16,747,574 15,081,900 15,119,100 18,843,200
School Support 18,057,623 15,081,900 15,119,100 18,843,200Stronger Families, Safer Communities
Youth Service Management 972,861 930,800 940,300 518,800Early Help 11-18 Inclusion 755,192 502,500 775,000 763,700Early Help 11-18 Participation 375,914 106,700 413,600 488,300Stronger Families Core 137,000 (596,700) 147,900 (39,400)Youth Offending Team (YOT) 1,076,529 2,097,600 624,900 846,400Community Safety 1,196,771 845,100 981,700 983,600Education Welfare 202,206 200,600 200,100 232,000
Stronger Families, Safer Communities 4,716,473 4,086,600 4,083,500 3,793,400
Continued:-
The Families Directorate has been established to join up services around the needs of individuals and families and support theCouncil's regeneration aims through the development of a people/places agenda.
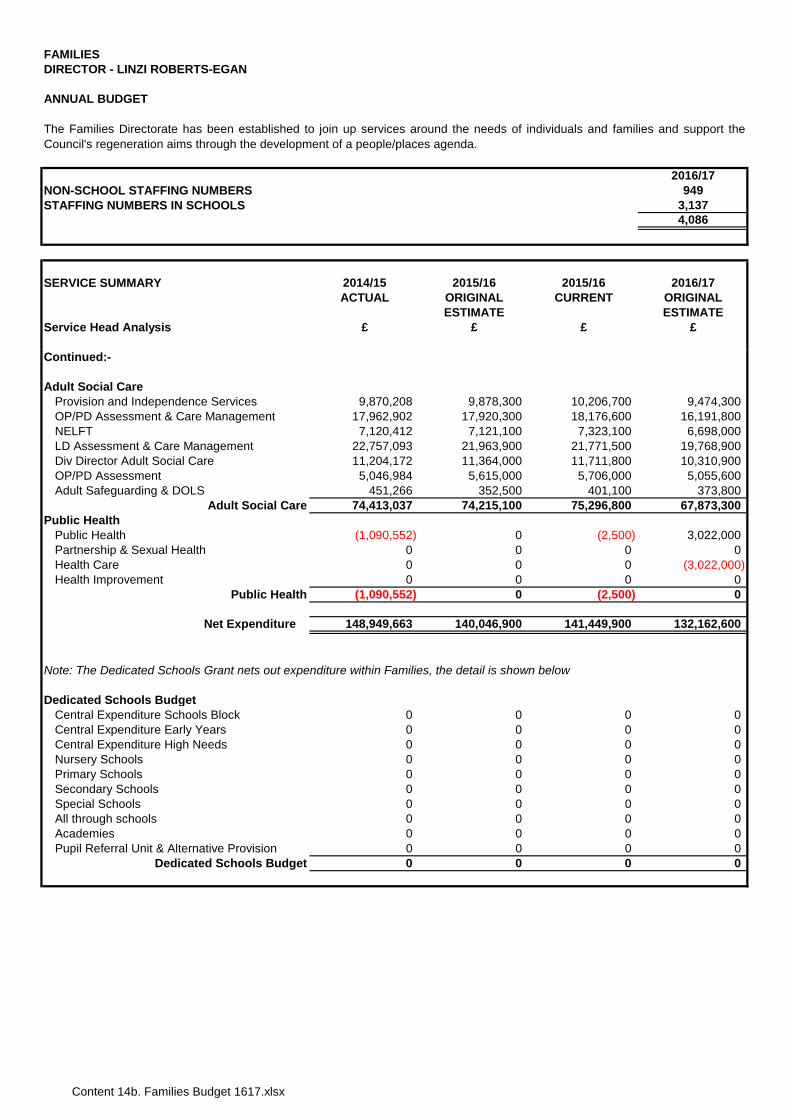
Content 14b. Families Budget 1617.xlsx
FAMILIESDIRECTOR - LINZI ROBERTS-EGAN
ANNUAL BUDGET
2016/17NON-SCHOOL STAFFING NUMBERS 949STAFFING NUMBERS IN SCHOOLS 3,137
4,086
SERVICE SUMMARY 2014/15 2015/16 2015/16 2016/17ACTUAL ORIGINAL CURRENT ORIGINAL
ESTIMATE ESTIMATEService Head Analysis £ £ £ £
The Families Directorate has been established to join up services around the needs of individuals and families and support theCouncil's regeneration aims through the development of a people/places agenda.
Continued:-
Adult Social CareProvision and Independence Services 9,870,208 9,878,300 10,206,700 9,474,300OP/PD Assessment & Care Management 17,962,902 17,920,300 18,176,600 16,191,800NELFT 7,120,412 7,121,100 7,323,100 6,698,000LD Assessment & Care Management 22,757,093 21,963,900 21,771,500 19,768,900Div Director Adult Social Care 11,204,172 11,364,000 11,711,800 10,310,900OP/PD Assessment 5,046,984 5,615,000 5,706,000 5,055,600Adult Safeguarding & DOLS 451,266 352,500 401,100 373,800
Adult Social Care 74,413,037 74,215,100 75,296,800 67,873,300Public Health
Public Health (1,090,552) 0 (2,500) 3,022,000Partnership & Sexual Health 0 0 0 0Health Care 0 0 0 (3,022,000)Health Improvement 0 0 0 0
Public Health (1,090,552) 0 (2,500) 0
Net Expenditure 148,949,663 140,046,900 141,449,900 132,162,600
Note: The Dedicated Schools Grant nets out expenditure within Families, the detail is shown below
Dedicated Schools BudgetCentral Expenditure Schools Block 0 0 0 0Central Expenditure Early Years 0 0 0 0Central Expenditure High Needs 0 0 0 0Nursery Schools 0 0 0 0Primary Schools 0 0 0 0Secondary Schools 0 0 0 0Special Schools 0 0 0 0All through schools 0 0 0 0Academies 0 0 0 0Pupil Referral Unit & Alternative Provision 0 0 0 0
Dedicated Schools Budget 0 0 0 0
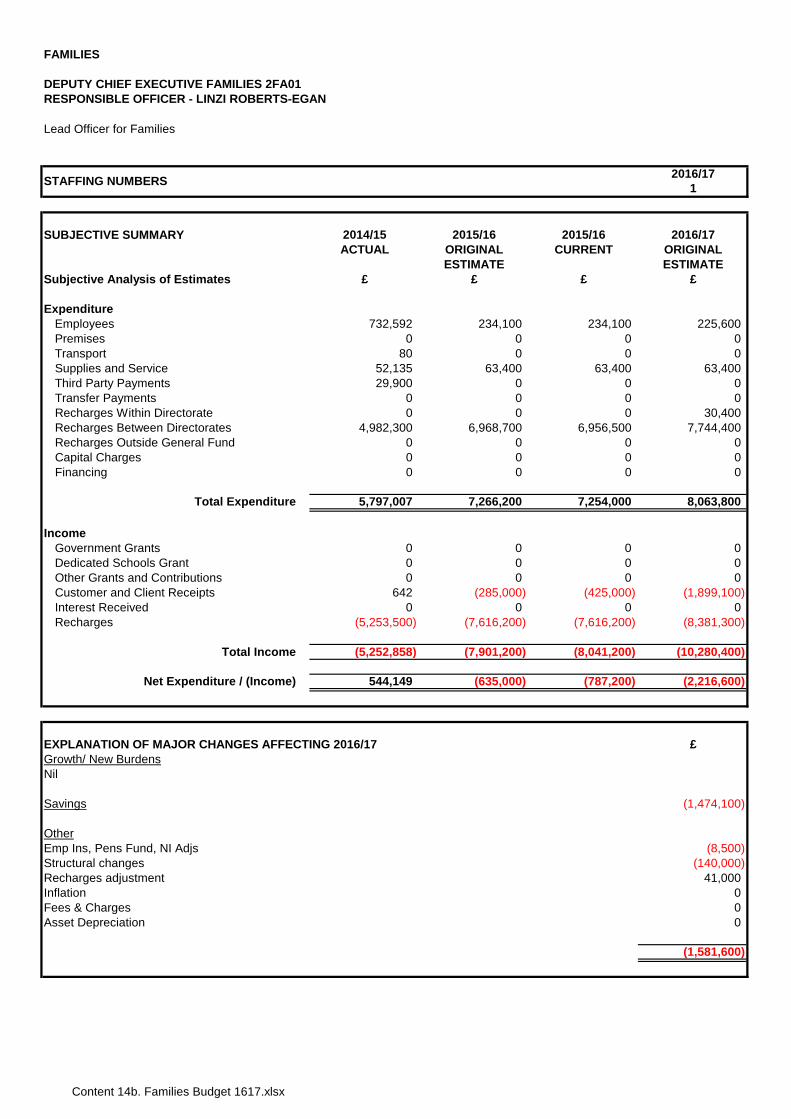
Content 14b. Families Budget 1617.xlsx
FAMILIES
DEPUTY CHIEF EXECUTIVE FAMILIES 2FA01RESPONSIBLE OFFICER - LINZI ROBERTS-EGAN
2016/171
SUBJECTIVE SUMMARY 2014/15 2015/16 2015/16 2016/17ACTUAL ORIGINAL CURRENT ORIGINAL
ESTIMATE ESTIMATESubjective Analysis of Estimates £ £ £ £
ExpenditureEmployees 732,592 234,100 234,100 225,600Premises 0 0 0 0Transport 80 0 0 0Supplies and Service 52,135 63,400 63,400 63,400Third Party Payments 29,900 0 0 0Transfer Payments 0 0 0 0Recharges Within Directorate 0 0 0 30,400Recharges Between Directorates 4,982,300 6,968,700 6,956,500 7,744,400Recharges Outside General Fund 0 0 0 0Capital Charges 0 0 0 0Financing 0 0 0 0
Total Expenditure 5,797,007 7,266,200 7,254,000 8,063,800
IncomeGovernment Grants 0 0 0 0Dedicated Schools Grant 0 0 0 0Other Grants and Contributions 0 0 0 0Customer and Client Receipts 642 (285,000) (425,000) (1,899,100)Interest Received 0 0 0 0Recharges (5,253,500) (7,616,200) (7,616,200) (8,381,300)
Total Income (5,252,858) (7,901,200) (8,041,200) (10,280,400)
Net Expenditure / (Income) 544,149 (635,000) (787,200) (2,216,600)
£Growth/ New Burdens
Savings (1,474,100)
OtherEmp Ins, Pens Fund, NI Adjs (8,500)Structural changes (140,000)
41,0000
Fees & Charges 0Asset Depreciation 0
(1,581,600)
Lead Officer for Families
STAFFING NUMBERS
Inflation
EXPLANATION OF MAJOR CHANGES AFFECTING 2016/17
Recharges adjustment
Nil
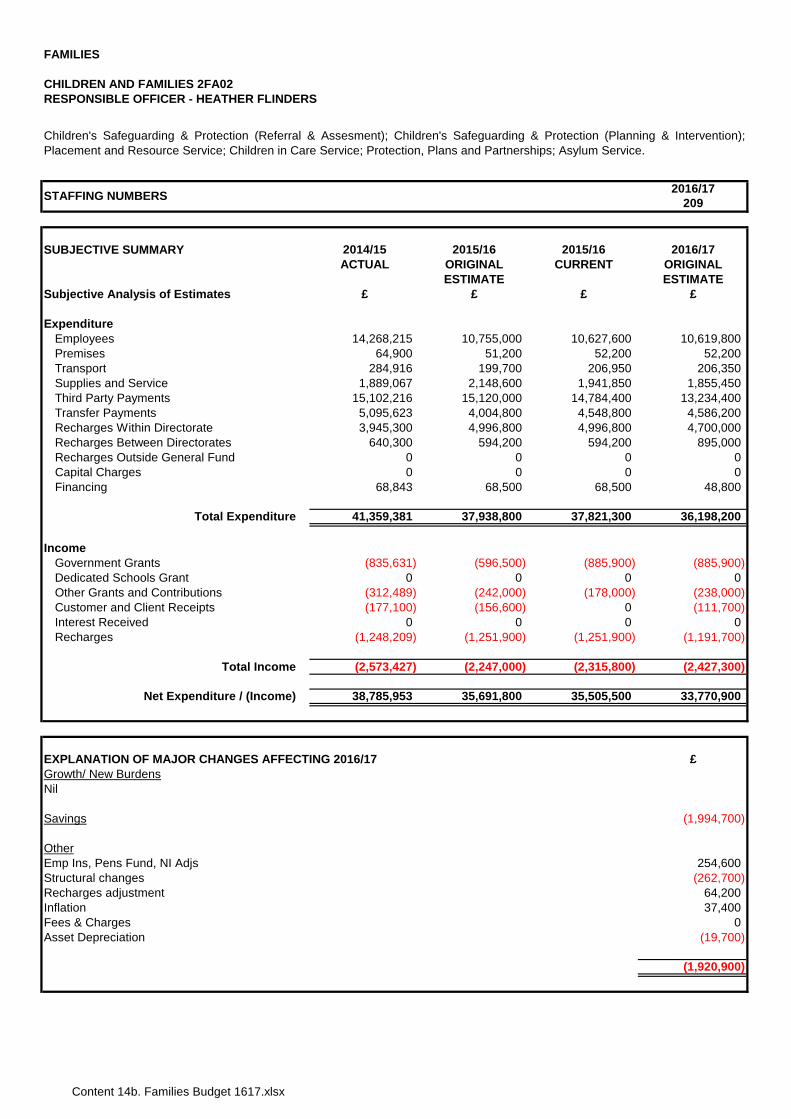
Content 14b. Families Budget 1617.xlsx
FAMILIES
CHILDREN AND FAMILIES 2FA02RESPONSIBLE OFFICER - HEATHER FLINDERS
2016/17209
SUBJECTIVE SUMMARY 2014/15 2015/16 2015/16 2016/17ACTUAL ORIGINAL CURRENT ORIGINAL
ESTIMATE ESTIMATESubjective Analysis of Estimates £ £ £ £
ExpenditureEmployees 14,268,215 10,755,000 10,627,600 10,619,800Premises 64,900 51,200 52,200 52,200Transport 284,916 199,700 206,950 206,350Supplies and Service 1,889,067 2,148,600 1,941,850 1,855,450Third Party Payments 15,102,216 15,120,000 14,784,400 13,234,400Transfer Payments 5,095,623 4,004,800 4,548,800 4,586,200Recharges Within Directorate 3,945,300 4,996,800 4,996,800 4,700,000Recharges Between Directorates 640,300 594,200 594,200 895,000Recharges Outside General Fund 0 0 0 0Capital Charges 0 0 0 0Financing 68,843 68,500 68,500 48,800
Total Expenditure 41,359,381 37,938,800 37,821,300 36,198,200
IncomeGovernment Grants (835,631) (596,500) (885,900) (885,900)Dedicated Schools Grant 0 0 0 0Other Grants and Contributions (312,489) (242,000) (178,000) (238,000)Customer and Client Receipts (177,100) (156,600) 0 (111,700)Interest Received 0 0 0 0Recharges (1,248,209) (1,251,900) (1,251,900) (1,191,700)
Total Income (2,573,427) (2,247,000) (2,315,800) (2,427,300)
Net Expenditure / (Income) 38,785,953 35,691,800 35,505,500 33,770,900
£Growth/ New Burdens
(1,994,700)
OtherEmp Ins, Pens Fund, NI Adjs 254,600Structural changes (262,700)
64,20037,400
Fees & Charges 0Asset Depreciation (19,700)
(1,920,900)
Children's Safeguarding & Protection (Referral & Assesment); Children's Safeguarding & Protection (Planning & Intervention);Placement and Resource Service; Children in Care Service; Protection, Plans and Partnerships; Asylum Service.
STAFFING NUMBERS
Inflation
EXPLANATION OF MAJOR CHANGES AFFECTING 2016/17
Nil
Savings
Recharges adjustment
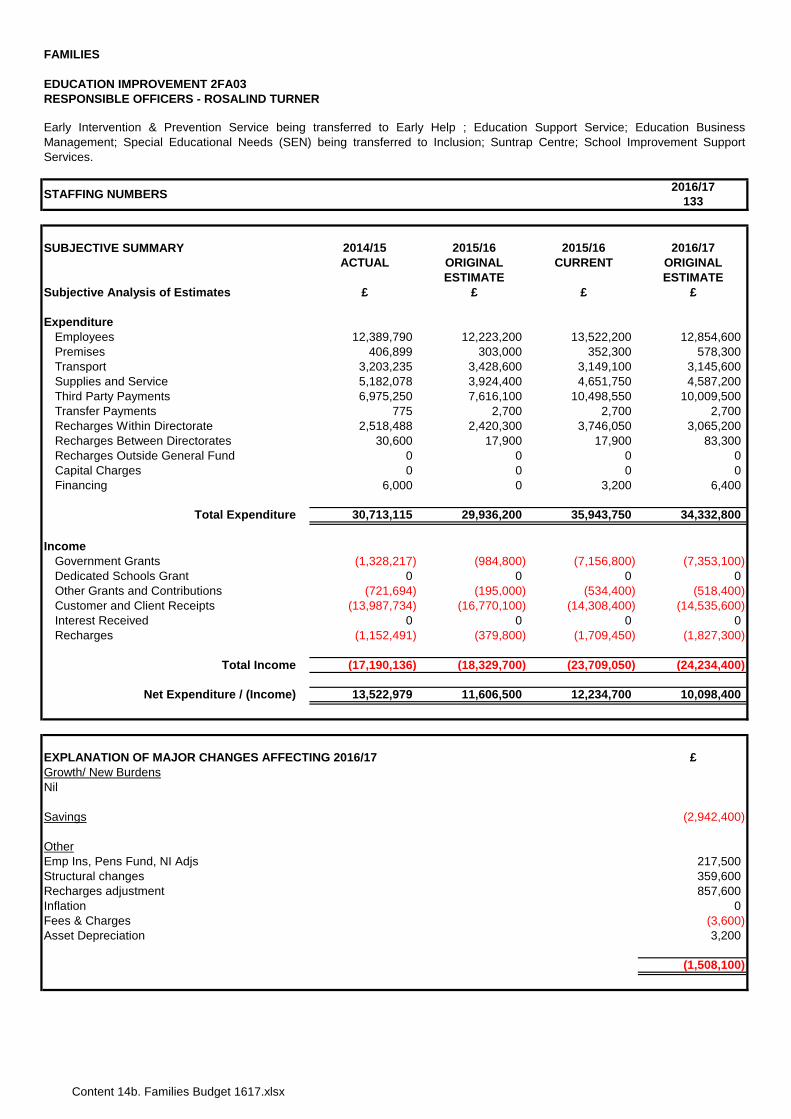
Content 14b. Families Budget 1617.xlsx
FAMILIES
EDUCATION IMPROVEMENT 2FA03RESPONSIBLE OFFICERS - ROSALIND TURNER
2016/17133
SUBJECTIVE SUMMARY 2014/15 2015/16 2015/16 2016/17ACTUAL ORIGINAL CURRENT ORIGINAL
ESTIMATE ESTIMATESubjective Analysis of Estimates £ £ £ £
ExpenditureEmployees 12,389,790 12,223,200 13,522,200 12,854,600Premises 406,899 303,000 352,300 578,300Transport 3,203,235 3,428,600 3,149,100 3,145,600Supplies and Service 5,182,078 3,924,400 4,651,750 4,587,200Third Party Payments 6,975,250 7,616,100 10,498,550 10,009,500Transfer Payments 775 2,700 2,700 2,700Recharges Within Directorate 2,518,488 2,420,300 3,746,050 3,065,200Recharges Between Directorates 30,600 17,900 17,900 83,300Recharges Outside General Fund 0 0 0 0Capital Charges 0 0 0 0Financing 6,000 0 3,200 6,400
Total Expenditure 30,713,115 29,936,200 35,943,750 34,332,800
IncomeGovernment Grants (1,328,217) (984,800) (7,156,800) (7,353,100)Dedicated Schools Grant 0 0 0 0Other Grants and Contributions (721,694) (195,000) (534,400) (518,400)Customer and Client Receipts (13,987,734) (16,770,100) (14,308,400) (14,535,600)Interest Received 0 0 0 0Recharges (1,152,491) (379,800) (1,709,450) (1,827,300)
Total Income (17,190,136) (18,329,700) (23,709,050) (24,234,400)
Net Expenditure / (Income) 13,522,979 11,606,500 12,234,700 10,098,400
£Growth/ New Burdens
(2,942,400)
Emp Ins, Pens Fund, NI Adjs 217,500Structural changes 359,600
857,6000
Fees & Charges (3,600)Asset Depreciation 3,200
(1,508,100)
Early Intervention & Prevention Service being transferred to Early Help ; Education Support Service; Education BusinessManagement; Special Educational Needs (SEN) being transferred to Inclusion; Suntrap Centre; School Improvement SupportServices.
Nil
STAFFING NUMBERS
Inflation
EXPLANATION OF MAJOR CHANGES AFFECTING 2016/17
Recharges adjustment
Other
Savings
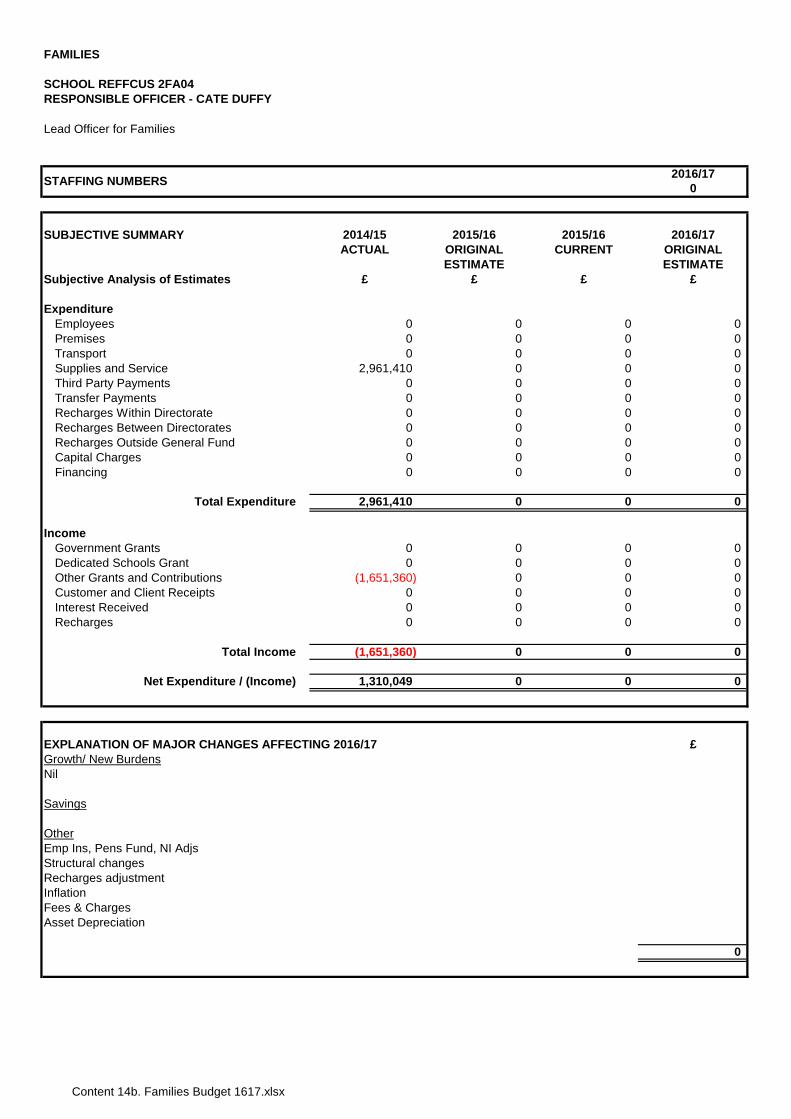
Content 14b. Families Budget 1617.xlsx
FAMILIES
SCHOOL REFFCUS 2FA04RESPONSIBLE OFFICER - CATE DUFFY
2016/170
SUBJECTIVE SUMMARY 2014/15 2015/16 2015/16 2016/17ACTUAL ORIGINAL CURRENT ORIGINAL
ESTIMATE ESTIMATESubjective Analysis of Estimates £ £ £ £
ExpenditureEmployees 0 0 0 0Premises 0 0 0 0Transport 0 0 0 0Supplies and Service 2,961,410 0 0 0Third Party Payments 0 0 0 0Transfer Payments 0 0 0 0Recharges Within Directorate 0 0 0 0Recharges Between Directorates 0 0 0 0Recharges Outside General Fund 0 0 0 0Capital Charges 0 0 0 0Financing 0 0 0 0
Total Expenditure 2,961,410 0 0 0
IncomeGovernment Grants 0 0 0 0Dedicated Schools Grant 0 0 0 0Other Grants and Contributions (1,651,360) 0 0 0Customer and Client Receipts 0 0 0 0Interest Received 0 0 0 0Recharges 0 0 0 0
Total Income (1,651,360) 0 0 0
Net Expenditure / (Income) 1,310,049 0 0 0
£Growth/ New Burdens
Savings
OtherEmp Ins, Pens Fund, NI AdjsStructural changes
Fees & ChargesAsset Depreciation
0
Recharges adjustmentInflation
Lead Officer for Families
STAFFING NUMBERS
EXPLANATION OF MAJOR CHANGES AFFECTING 2016/17
Nil
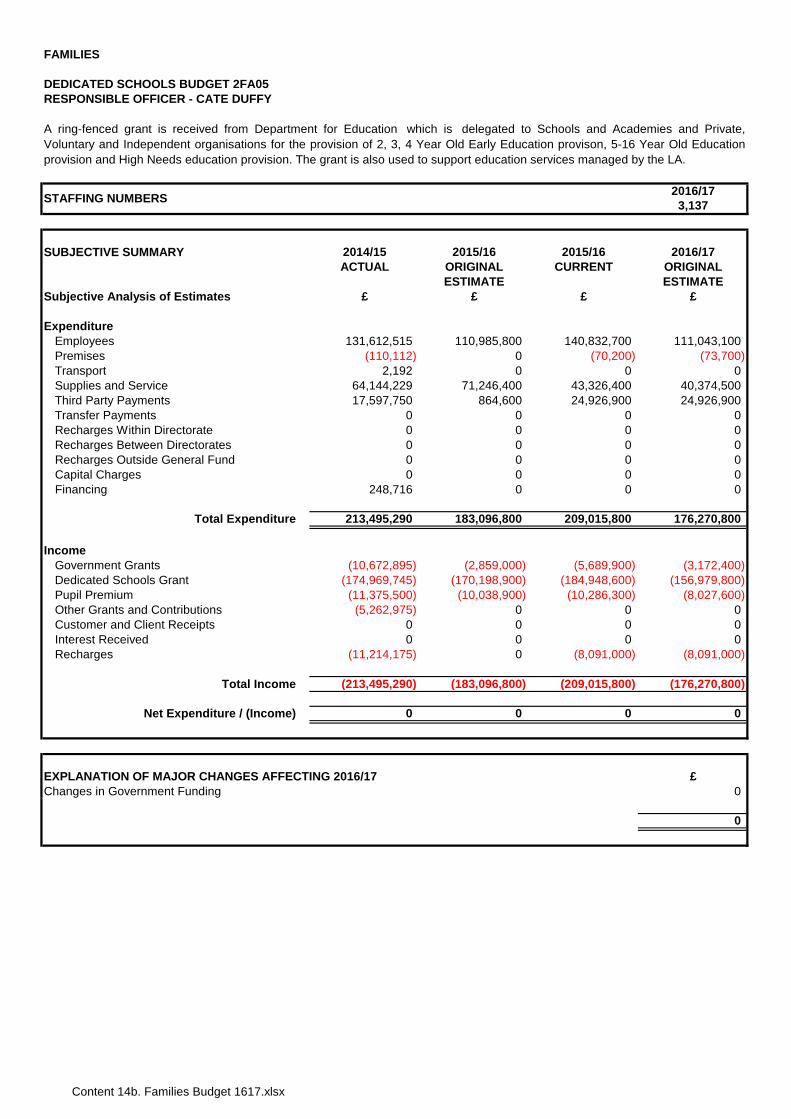
Content 14b. Families Budget 1617.xlsx
FAMILIES
DEDICATED SCHOOLS BUDGET 2FA05RESPONSIBLE OFFICER - CATE DUFFY
2016/173,137
SUBJECTIVE SUMMARY 2014/15 2015/16 2015/16 2016/17ACTUAL ORIGINAL CURRENT ORIGINAL
ESTIMATE ESTIMATESubjective Analysis of Estimates £ £ £ £
ExpenditureEmployees 131,612,515 110,985,800 140,832,700 111,043,100Premises (110,112) 0 (70,200) (73,700)Transport 2,192 0 0 0Supplies and Service 64,144,229 71,246,400 43,326,400 40,374,500Third Party Payments 17,597,750 864,600 24,926,900 24,926,900Transfer Payments 0 0 0 0Recharges Within Directorate 0 0 0 0Recharges Between Directorates 0 0 0 0Recharges Outside General Fund 0 0 0 0Capital Charges 0 0 0 0Financing 248,716 0 0 0
Total Expenditure 213,495,290 183,096,800 209,015,800 176,270,800
IncomeGovernment Grants (10,672,895) (2,859,000) (5,689,900) (3,172,400)Dedicated Schools Grant (174,969,745) (170,198,900) (184,948,600) (156,979,800)Pupil Premium (11,375,500) (10,038,900) (10,286,300) (8,027,600)Other Grants and Contributions (5,262,975) 0 0 0Customer and Client Receipts 0 0 0 0Interest Received 0 0 0 0Recharges (11,214,175) 0 (8,091,000) (8,091,000)
Total Income (213,495,290) (183,096,800) (209,015,800) (176,270,800)
Net Expenditure / (Income) 0 0 0 0
£0
0
A ring-fenced grant is received from Department for Education which is delegated to Schools and Academies and Private,Voluntary and Independent organisations for the provision of 2, 3, 4 Year Old Early Education provison, 5-16 Year Old Educationprovision and High Needs education provision. The grant is also used to support education services managed by the LA.
STAFFING NUMBERS
EXPLANATION OF MAJOR CHANGES AFFECTING 2016/17Changes in Government Funding
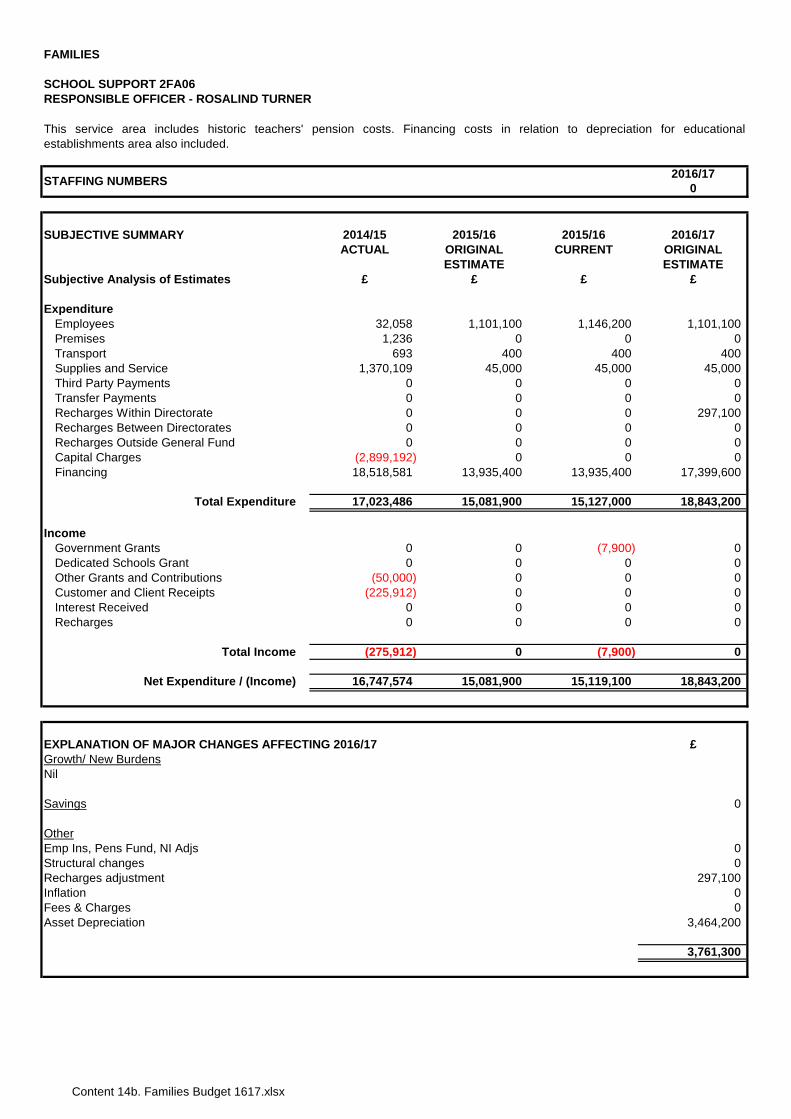
Content 14b. Families Budget 1617.xlsx
FAMILIES
SCHOOL SUPPORT 2FA06RESPONSIBLE OFFICER - ROSALIND TURNER
2016/170
SUBJECTIVE SUMMARY 2014/15 2015/16 2015/16 2016/17ACTUAL ORIGINAL CURRENT ORIGINAL
ESTIMATE ESTIMATESubjective Analysis of Estimates £ £ £ £
ExpenditureEmployees 32,058 1,101,100 1,146,200 1,101,100Premises 1,236 0 0 0Transport 693 400 400 400Supplies and Service 1,370,109 45,000 45,000 45,000Third Party Payments 0 0 0 0Transfer Payments 0 0 0 0Recharges Within Directorate 0 0 0 297,100Recharges Between Directorates 0 0 0 0Recharges Outside General Fund 0 0 0 0Capital Charges (2,899,192) 0 0 0Financing 18,518,581 13,935,400 13,935,400 17,399,600
Total Expenditure 17,023,486 15,081,900 15,127,000 18,843,200
IncomeGovernment Grants 0 0 (7,900) 0Dedicated Schools Grant 0 0 0 0Other Grants and Contributions (50,000) 0 0 0Customer and Client Receipts (225,912) 0 0 0Interest Received 0 0 0 0Recharges 0 0 0 0
Total Income (275,912) 0 (7,900) 0
Net Expenditure / (Income) 16,747,574 15,081,900 15,119,100 18,843,200
£Growth/ New Burdens
Savings 0
OtherEmp Ins, Pens Fund, NI Adjs 0Structural changes 0
297,1000
Fees & Charges 0Asset Depreciation 3,464,200
3,761,300
This service area includes historic teachers' pension costs. Financing costs in relation to depreciation for educationalestablishments area also included.
Nil
STAFFING NUMBERS
Inflation
EXPLANATION OF MAJOR CHANGES AFFECTING 2016/17
Recharges adjustment

Content 14b. Families Budget 1617.xlsx
FAMILIES
EARLY HELP (INCLUDES STRONGER FAMILIES, SAFER COMMUNITIES) 2FA07RESPONSIBLE OFFICER - DANIEL PHELPS
2016/17158
SUBJECTIVE SUMMARY 2014/15 2015/16 2015/16 2016/17ACTUAL ORIGINAL CURRENT ORIGINAL
ESTIMATE ESTIMATESubjective Analysis of Estimates £ £ £ £
ExpenditureEmployees 4,779,813 4,359,000 4,582,800 4,354,000Premises 152,617 171,500 149,300 158,340Transport 84,165 59,500 59,500 59,500Supplies and Service 767,109 145,300 1,158,960 283,100Third Party Payments 2,628,083 3,031,000 3,406,400 2,745,360Transfer Payments 2,420 0 0 0Recharges Within Directorate 949,054 1,389,400 1,493,500 1,338,600Recharges Between Directorates 174,700 129,300 129,300 226,000Recharges Outside General Fund 0 0 0 154,900Capital Charges 0 0 0 0Financing 218,765 217,800 217,800 185,400
Total Expenditure 9,756,727 9,502,800 11,197,560 9,505,200
IncomeGovernment Grants (2,693,844) (2,721,100) (4,136,660) (3,083,200)Dedicated Schools Grant 0 0 0 0Other Grants and Contributions (580,442) (600,000) (400,700) (618,900)Customer and Client Receipts (326,010) (662,500) (433,700) (571,900)Interest Received 0 0 0 0Recharges (1,439,959) (1,432,600) (2,143,000) (1,437,800)
Total Income (5,040,254) (5,416,200) (7,114,060) (5,711,800)
Net Expenditure / (Income) 4,716,473 4,086,600 4,083,500 3,793,400
£
Growth/ New Burdens
(94,700)
OtherEmp Ins, Pens Fund, NI Adjs 87,000Structural changes (436,300)
186,9000
Fees & Charges (3,700)Asset Depreciation (32,400)
(293,200)
Recharges adjustmentInflation
Savings
Provision of Education Welfare, Community Safety, Youth Offending Service, Youth Support Services , Early Help and TroubledFamilies.
STAFFING NUMBERS
EXPLANATION OF MAJOR CHANGES AFFECTING 2016/17
Nil
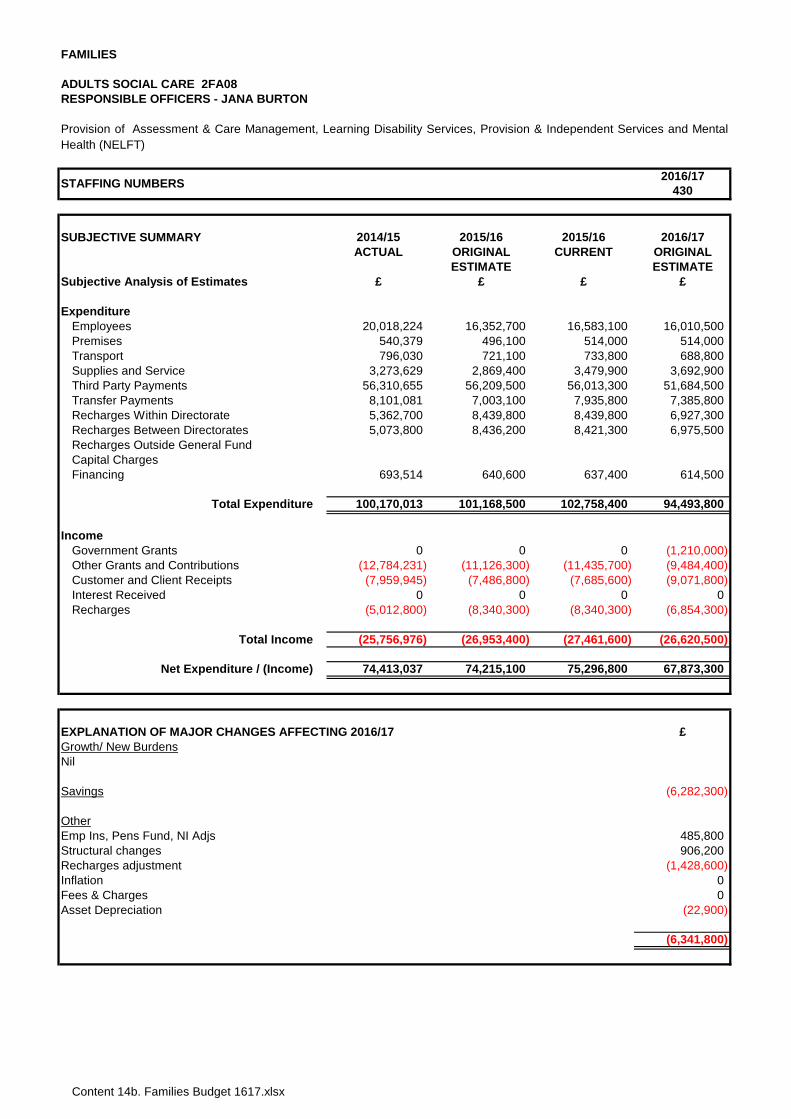
Content 14b. Families Budget 1617.xlsx
FAMILIES
ADULTS SOCIAL CARE 2FA08
2016/17430
SUBJECTIVE SUMMARY 2014/15 2015/16 2015/16 2016/17ACTUAL ORIGINAL CURRENT ORIGINAL
ESTIMATE ESTIMATESubjective Analysis of Estimates £ £ £ £
ExpenditureEmployees 20,018,224 16,352,700 16,583,100 16,010,500Premises 540,379 496,100 514,000 514,000Transport 796,030 721,100 733,800 688,800Supplies and Service 3,273,629 2,869,400 3,479,900 3,692,900Third Party Payments 56,310,655 56,209,500 56,013,300 51,684,500Transfer Payments 8,101,081 7,003,100 7,935,800 7,385,800Recharges Within Directorate 5,362,700 8,439,800 8,439,800 6,927,300Recharges Between Directorates 5,073,800 8,436,200 8,421,300 6,975,500Recharges Outside General FundCapital ChargesFinancing 693,514 640,600 637,400 614,500
Total Expenditure 100,170,013 101,168,500 102,758,400 94,493,800
IncomeGovernment Grants 0 0 0 (1,210,000)Other Grants and Contributions (12,784,231) (11,126,300) (11,435,700) (9,484,400)Customer and Client Receipts (7,959,945) (7,486,800) (7,685,600) (9,071,800)Interest Received 0 0 0 0Recharges (5,012,800) (8,340,300) (8,340,300) (6,854,300)
Total Income (25,756,976) (26,953,400) (27,461,600) (26,620,500)
Net Expenditure / (Income) 74,413,037 74,215,100 75,296,800 67,873,300
£
(6,282,300)
Emp Ins, Pens Fund, NI Adjs 485,800Structural changes 906,200
(1,428,600)0
Fees & Charges 0Asset Depreciation (22,900)
(6,341,800)
Provision of Assessment & Care Management, Learning Disability Services, Provision & Independent Services and MentalHealth (NELFT)
RESPONSIBLE OFFICERS - JANA BURTON
STAFFING NUMBERS
Inflation
EXPLANATION OF MAJOR CHANGES AFFECTING 2016/17
Nil
Recharges adjustment
Savings
Other
Growth/ New Burdens
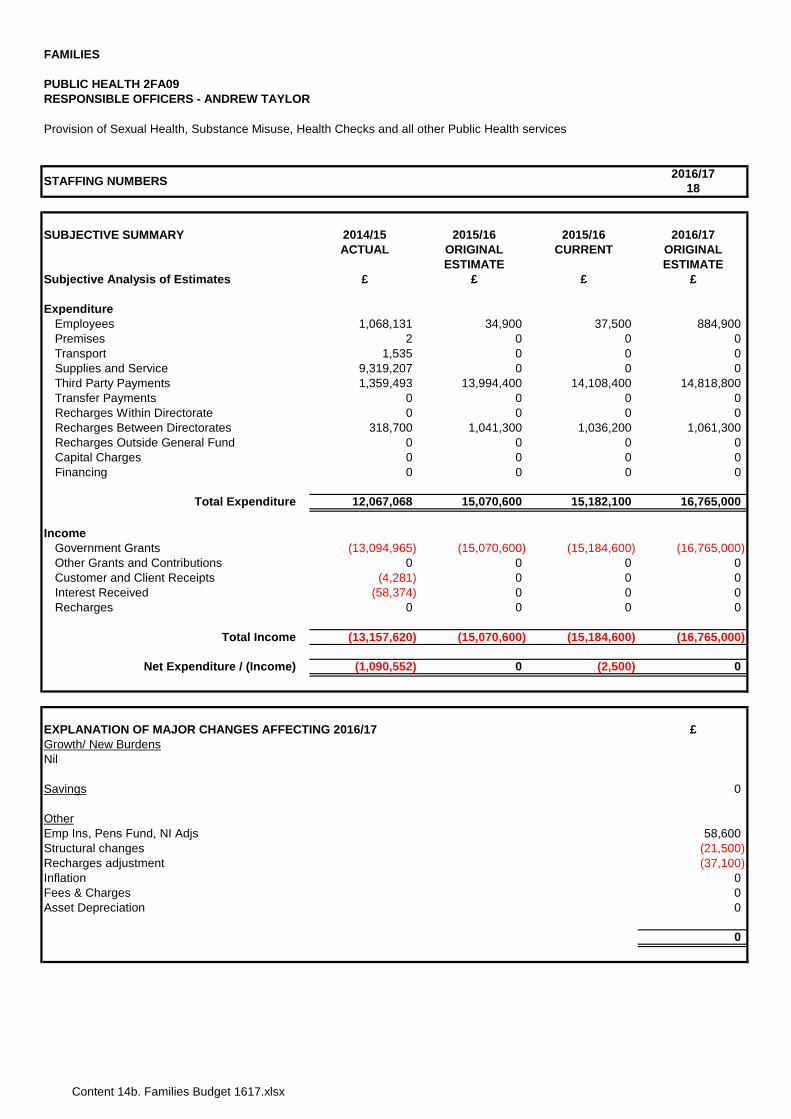
Content 14b. Families Budget 1617.xlsx
FAMILIES
PUBLIC HEALTH 2FA09
2016/1718
SUBJECTIVE SUMMARY 2014/15 2015/16 2015/16 2016/17ACTUAL ORIGINAL CURRENT ORIGINAL
ESTIMATE ESTIMATESubjective Analysis of Estimates £ £ £ £
ExpenditureEmployees 1,068,131 34,900 37,500 884,900Premises 2 0 0 0Transport 1,535 0 0 0Supplies and Service 9,319,207 0 0 0Third Party Payments 1,359,493 13,994,400 14,108,400 14,818,800Transfer Payments 0 0 0 0Recharges Within Directorate 0 0 0 0Recharges Between Directorates 318,700 1,041,300 1,036,200 1,061,300Recharges Outside General Fund 0 0 0 0Capital Charges 0 0 0 0Financing 0 0 0 0
Total Expenditure 12,067,068 15,070,600 15,182,100 16,765,000
IncomeGovernment Grants (13,094,965) (15,070,600) (15,184,600) (16,765,000)Other Grants and Contributions 0 0 0 0Customer and Client Receipts (4,281) 0 0 0Interest Received (58,374) 0 0 0Recharges 0 0 0 0
Total Income (13,157,620) (15,070,600) (15,184,600) (16,765,000)
Net Expenditure / (Income) (1,090,552) 0 (2,500) 0
£
0
Emp Ins, Pens Fund, NI Adjs 58,600Structural changes (21,500)
(37,100)0
Fees & Charges 0Asset Depreciation 0
0
Other
RESPONSIBLE OFFICERS - ANDREW TAYLOR
Provision of Sexual Health, Substance Misuse, Health Checks and all other Public Health services
STAFFING NUMBERS
EXPLANATION OF MAJOR CHANGES AFFECTING 2016/17Growth/ New BurdensNil
Savings
InflationRecharges adjustment
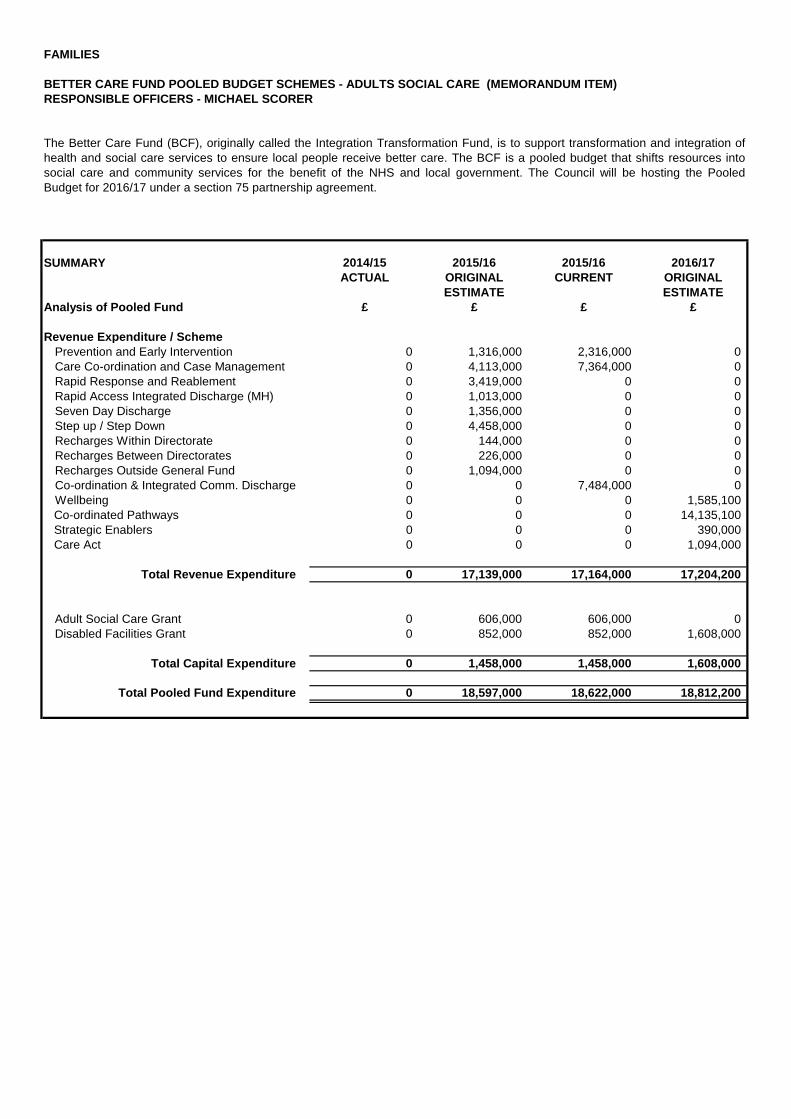
FAMILIES
BETTER CARE FUND POOLED BUDGET SCHEMES - ADULTS SOCIAL CARE (MEMORANDUM ITEM)
SUMMARY 2014/15 2015/16 2015/16 2016/17ACTUAL ORIGINAL CURRENT ORIGINAL
ESTIMATE ESTIMATEAnalysis of Pooled Fund £ £ £ £
Revenue Expenditure / SchemePrevention and Early Intervention 0 1,316,000 2,316,000 0Care Co-ordination and Case Management 0 4,113,000 7,364,000 0Rapid Response and Reablement 0 3,419,000 0 0Rapid Access Integrated Discharge (MH) 0 1,013,000 0 0Seven Day Discharge 0 1,356,000 0 0Step up / Step Down 0 4,458,000 0 0Recharges Within Directorate 0 144,000 0 0Recharges Between Directorates 0 226,000 0 0Recharges Outside General Fund 0 1,094,000 0 0Co-ordination & Integrated Comm. Discharge 0 0 7,484,000 0Wellbeing 0 0 0 1,585,100
Co-ordinated Pathways 0 0 0 14,135,100 Strategic Enablers 0 0 0 390,000 Care Act 0 0 0 1,094,000
Total Revenue Expenditure 0 17,139,000 17,164,000 17,204,200
Adult Social Care Grant 0 606,000 606,000 0Disabled Facilities Grant 0 852,000 852,000 1,608,000
Total Capital Expenditure 0 1,458,000 1,458,000 1,608,000
Total Pooled Fund Expenditure 0 18,597,000 18,622,000 18,812,200
RESPONSIBLE OFFICERS - MICHAEL SCORER
The Better Care Fund (BCF), originally called the Integration Transformation Fund, is to support transformation and integration ofhealth and social care services to ensure local people receive better care. The BCF is a pooled budget that shifts resources intosocial care and community services for the benefit of the NHS and local government. The Council will be hosting the PooledBudget for 2016/17 under a section 75 partnership agreement.
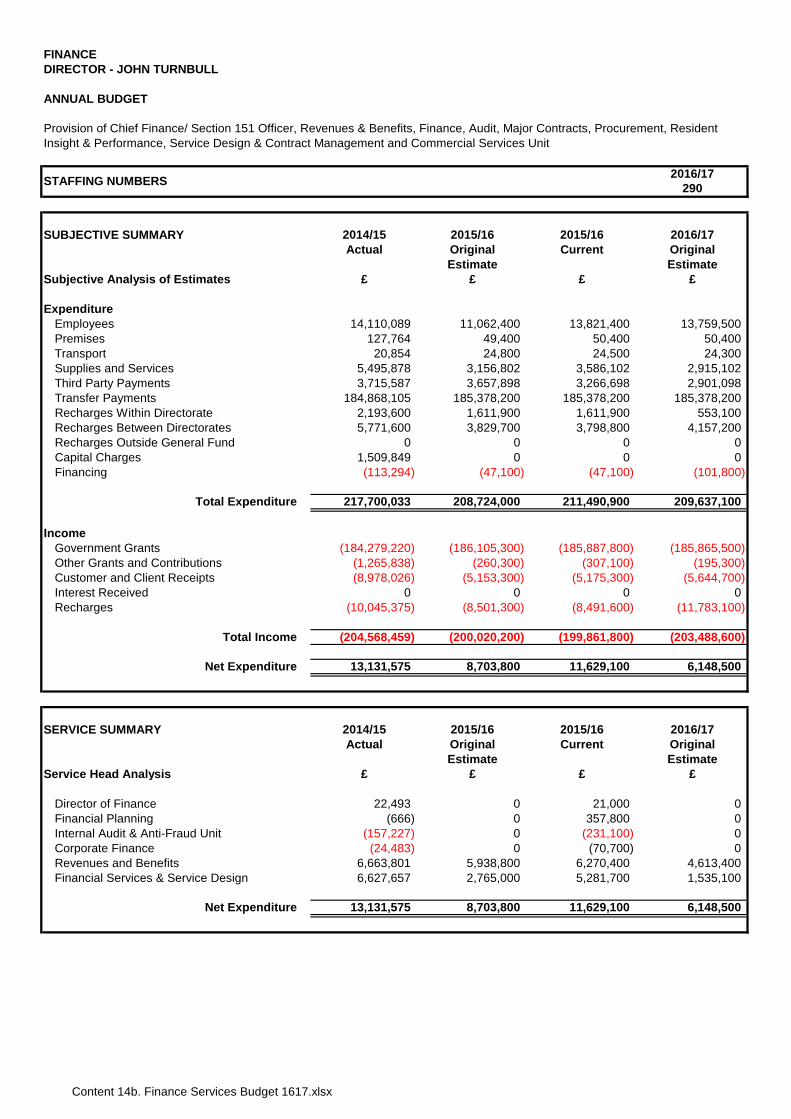
Content 14b. Finance Services Budget 1617.xlsx
FINANCEDIRECTOR - JOHN TURNBULL
ANNUAL BUDGET
2016/17290
SUBJECTIVE SUMMARY 2014/15 2015/16 2015/16 2016/17Actual Original Current Original
Estimate EstimateSubjective Analysis of Estimates £ £ £ £
ExpenditureEmployees 14,110,089 11,062,400 13,821,400 13,759,500Premises 127,764 49,400 50,400 50,400Transport 20,854 24,800 24,500 24,300Supplies and Services 5,495,878 3,156,802 3,586,102 2,915,102Third Party Payments 3,715,587 3,657,898 3,266,698 2,901,098Transfer Payments 184,868,105 185,378,200 185,378,200 185,378,200Recharges Within Directorate 2,193,600 1,611,900 1,611,900 553,100Recharges Between Directorates 5,771,600 3,829,700 3,798,800 4,157,200Recharges Outside General Fund 0 0 0 0Capital Charges 1,509,849 0 0 0Financing (113,294) (47,100) (47,100) (101,800)
Total Expenditure 217,700,033 208,724,000 211,490,900 209,637,100
IncomeGovernment Grants (184,279,220) (186,105,300) (185,887,800) (185,865,500)Other Grants and Contributions (1,265,838) (260,300) (307,100) (195,300)Customer and Client Receipts (8,978,026) (5,153,300) (5,175,300) (5,644,700)Interest Received 0 0 0 0Recharges (10,045,375) (8,501,300) (8,491,600) (11,783,100)
Total Income (204,568,459) (200,020,200) (199,861,800) (203,488,600)
Net Expenditure 13,131,575 8,703,800 11,629,100 6,148,500
SERVICE SUMMARY 2014/15 2015/16 2015/16 2016/17Actual Original Current Original
Estimate EstimateService Head Analysis £ £ £ £
Director of Finance 22,493 0 21,000 0Financial Planning (666) 0 357,800 0Internal Audit & Anti-Fraud Unit (157,227) 0 (231,100) 0Corporate Finance (24,483) 0 (70,700) 0Revenues and Benefits 6,663,801 5,938,800 6,270,400 4,613,400Financial Services & Service Design 6,627,657 2,765,000 5,281,700 1,535,100
Net Expenditure 13,131,575 8,703,800 11,629,100 6,148,500
Provision of Chief Finance/ Section 151 Officer, Revenues & Benefits, Finance, Audit, Major Contracts, Procurement, Resident Insight & Performance, Service Design & Contract Management and Commercial Services Unit
STAFFING NUMBERS
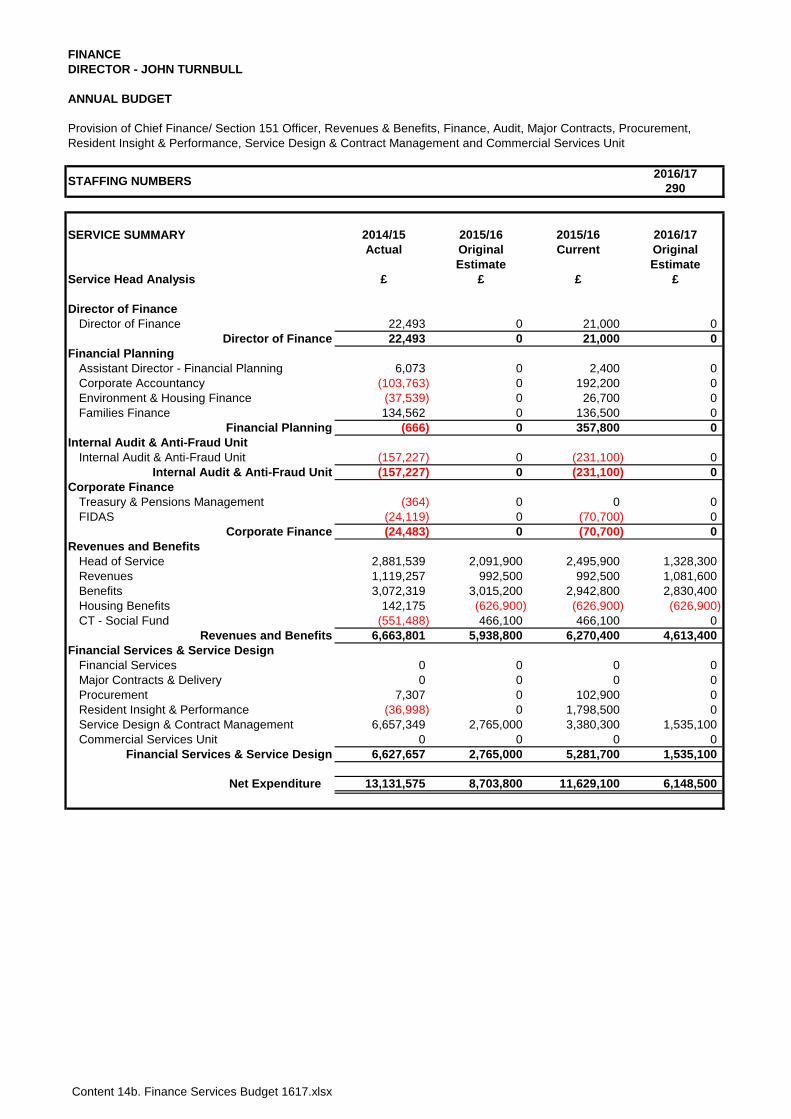
Content 14b. Finance Services Budget 1617.xlsx
FINANCEDIRECTOR - JOHN TURNBULL
ANNUAL BUDGET
2016/17290
SERVICE SUMMARY 2014/15 2015/16 2015/16 2016/17Actual Original Current Original
Estimate EstimateService Head Analysis £ £ £ £
Director of FinanceDirector of Finance 22,493 0 21,000 0
Director of Finance 22,493 0 21,000 0Financial Planning
Assistant Director - Financial Planning 6,073 0 2,400 0Corporate Accountancy (103,763) 0 192,200 0Environment & Housing Finance (37,539) 0 26,700 0Families Finance 134,562 0 136,500 0
Financial Planning (666) 0 357,800 0Internal Audit & Anti-Fraud Unit
Internal Audit & Anti-Fraud Unit (157,227) 0 (231,100) 0Internal Audit & Anti-Fraud Unit (157,227) 0 (231,100) 0
Corporate FinanceTreasury & Pensions Management (364) 0 0 0FIDAS (24,119) 0 (70,700) 0
Corporate Finance (24,483) 0 (70,700) 0Revenues and Benefits
Head of Service 2,881,539 2,091,900 2,495,900 1,328,300Revenues 1,119,257 992,500 992,500 1,081,600Benefits 3,072,319 3,015,200 2,942,800 2,830,400Housing Benefits 142,175 (626,900) (626,900) (626,900)CT - Social Fund (551,488) 466,100 466,100 0
Revenues and Benefits 6,663,801 5,938,800 6,270,400 4,613,400Financial Services & Service Design
Financial Services 0 0 0 0Major Contracts & Delivery 0 0 0 0Procurement 7,307 0 102,900 0Resident Insight & Performance (36,998) 0 1,798,500 0Service Design & Contract Management 6,657,349 2,765,000 3,380,300 1,535,100Commercial Services Unit 0 0 0 0
Financial Services & Service Design 6,627,657 2,765,000 5,281,700 1,535,100
Net Expenditure 13,131,575 8,703,800 11,629,100 6,148,500
Provision of Chief Finance/ Section 151 Officer, Revenues & Benefits, Finance, Audit, Major Contracts, Procurement, Resident Insight & Performance, Service Design & Contract Management and Commercial Services Unit
STAFFING NUMBERS
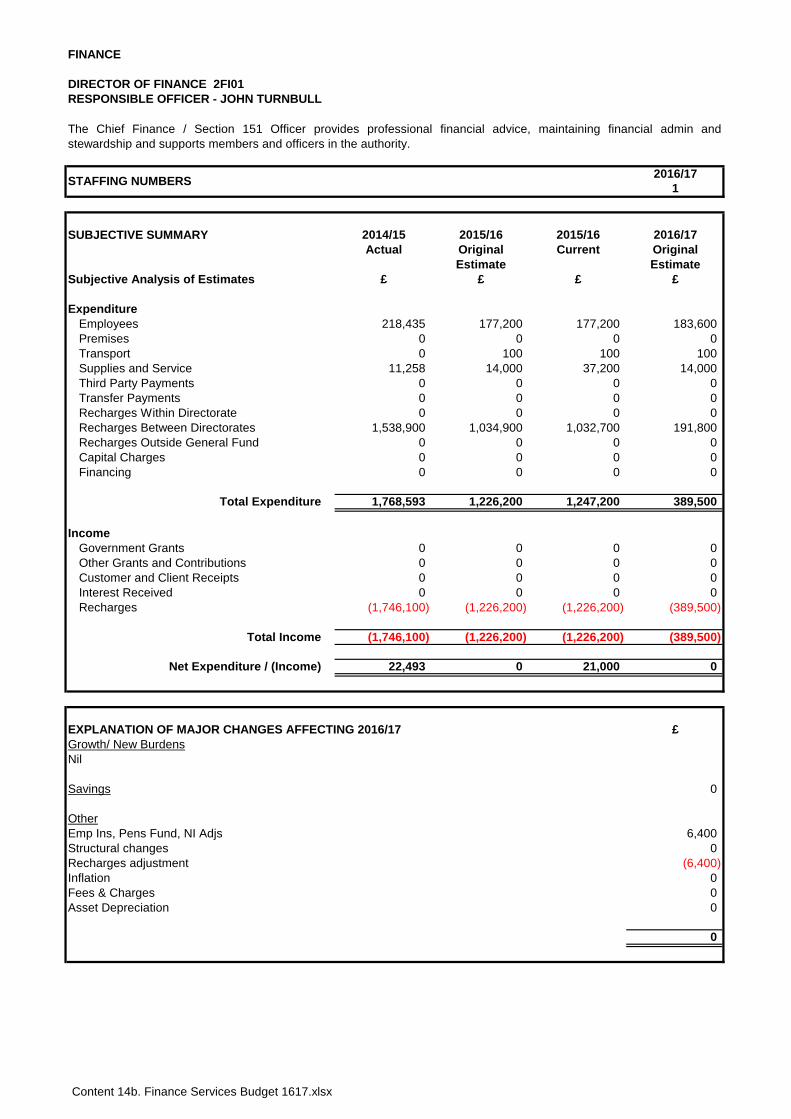
Content 14b. Finance Services Budget 1617.xlsx
FINANCE
DIRECTOR OF FINANCE 2FI01RESPONSIBLE OFFICER - JOHN TURNBULL
2016/171
SUBJECTIVE SUMMARY 2014/15 2015/16 2015/16 2016/17Actual Original Current Original
Estimate EstimateSubjective Analysis of Estimates £ £ £ £
ExpenditureEmployees 218,435 177,200 177,200 183,600Premises 0 0 0 0Transport 0 100 100 100Supplies and Service 11,258 14,000 37,200 14,000Third Party Payments 0 0 0 0Transfer Payments 0 0 0 0Recharges Within Directorate 0 0 0 0Recharges Between Directorates 1,538,900 1,034,900 1,032,700 191,800Recharges Outside General Fund 0 0 0 0Capital Charges 0 0 0 0Financing 0 0 0 0
Total Expenditure 1,768,593 1,226,200 1,247,200 389,500
IncomeGovernment Grants 0 0 0 0Other Grants and Contributions 0 0 0 0Customer and Client Receipts 0 0 0 0Interest Received 0 0 0 0Recharges (1,746,100) (1,226,200) (1,226,200) (389,500)
Total Income (1,746,100) (1,226,200) (1,226,200) (389,500)
Net Expenditure / (Income) 22,493 0 21,000 0
£Growth/ New Burdens
Savings 0
OtherEmp Ins, Pens Fund, NI Adjs 6,400Structural changes 0
(6,400)Inflation 0
00
0
Asset Depreciation
The Chief Finance / Section 151 Officer provides professional financial advice, maintaining financial admin andstewardship and supports members and officers in the authority.
STAFFING NUMBERS
EXPLANATION OF MAJOR CHANGES AFFECTING 2016/17
Nil
Recharges adjustment
Fees & Charges
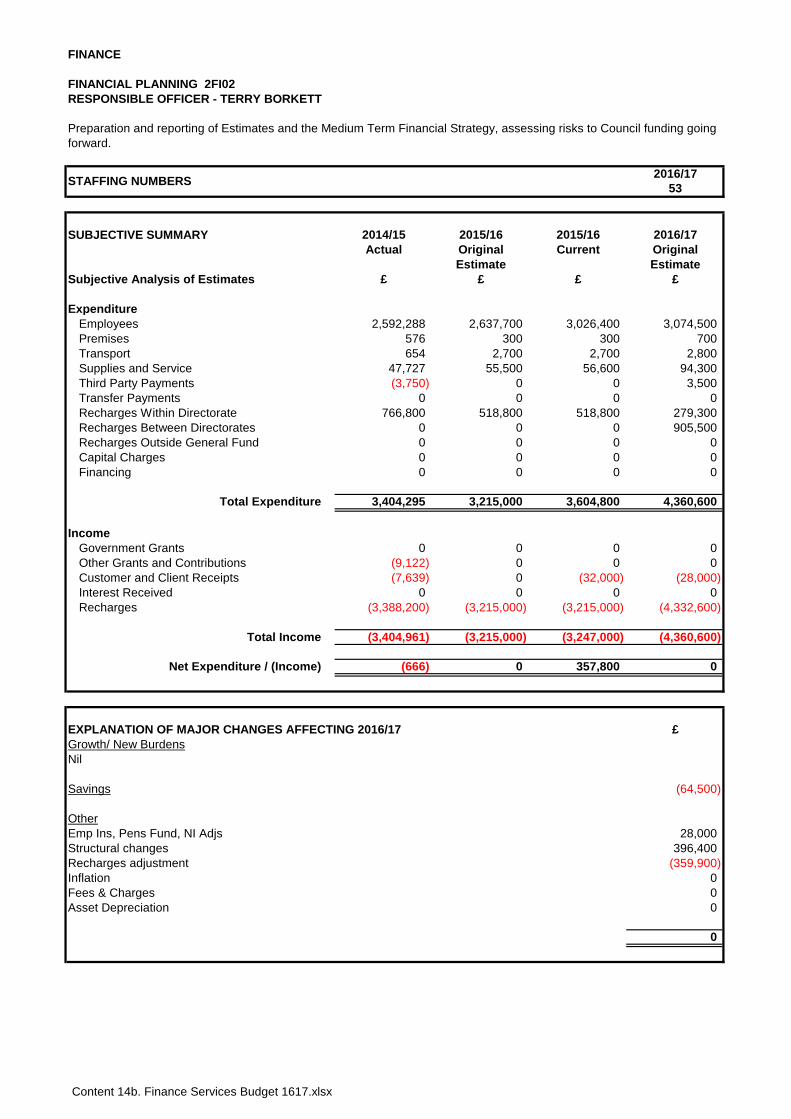
Content 14b. Finance Services Budget 1617.xlsx
FINANCE
FINANCIAL PLANNING 2FI02RESPONSIBLE OFFICER - TERRY BORKETT
2016/1753
SUBJECTIVE SUMMARY 2014/15 2015/16 2015/16 2016/17Actual Original Current Original
Estimate EstimateSubjective Analysis of Estimates £ £ £ £
ExpenditureEmployees 2,592,288 2,637,700 3,026,400 3,074,500Premises 576 300 300 700Transport 654 2,700 2,700 2,800Supplies and Service 47,727 55,500 56,600 94,300Third Party Payments (3,750) 0 0 3,500Transfer Payments 0 0 0 0Recharges Within Directorate 766,800 518,800 518,800 279,300Recharges Between Directorates 0 0 0 905,500Recharges Outside General Fund 0 0 0 0Capital Charges 0 0 0 0Financing 0 0 0 0
Total Expenditure 3,404,295 3,215,000 3,604,800 4,360,600
IncomeGovernment Grants 0 0 0 0Other Grants and Contributions (9,122) 0 0 0Customer and Client Receipts (7,639) 0 (32,000) (28,000)Interest Received 0 0 0 0Recharges (3,388,200) (3,215,000) (3,215,000) (4,332,600)
Total Income (3,404,961) (3,215,000) (3,247,000) (4,360,600)
Net Expenditure / (Income) (666) 0 357,800 0
£Growth/ New Burdens
Savings (64,500)
OtherEmp Ins, Pens Fund, NI Adjs 28,000Structural changes 396,400
(359,900)Inflation 0
00
0
Nil
Preparation and reporting of Estimates and the Medium Term Financial Strategy, assessing risks to Council funding going forward.
STAFFING NUMBERS
EXPLANATION OF MAJOR CHANGES AFFECTING 2016/17
Asset Depreciation
Recharges adjustment
Fees & Charges
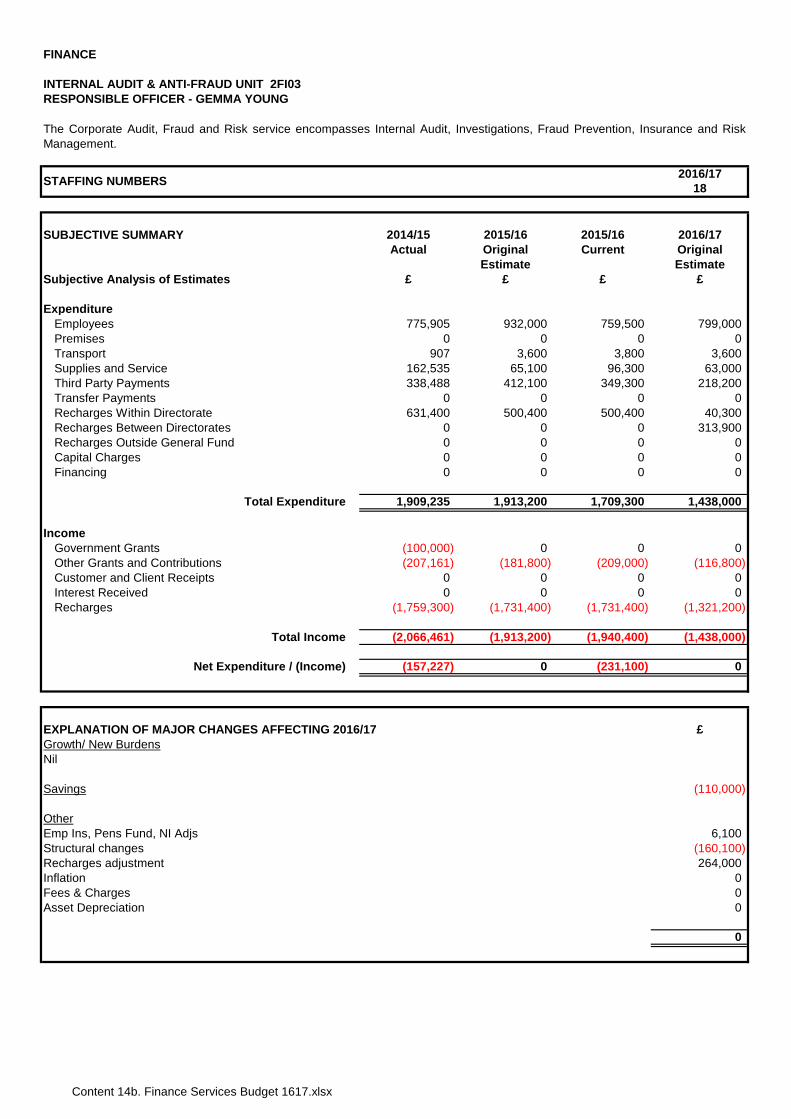
Content 14b. Finance Services Budget 1617.xlsx
FINANCE
INTERNAL AUDIT & ANTI-FRAUD UNIT 2FI03RESPONSIBLE OFFICER - GEMMA YOUNG
2016/1718
SUBJECTIVE SUMMARY 2014/15 2015/16 2015/16 2016/17Actual Original Current Original
Estimate EstimateSubjective Analysis of Estimates £ £ £ £
ExpenditureEmployees 775,905 932,000 759,500 799,000Premises 0 0 0 0Transport 907 3,600 3,800 3,600Supplies and Service 162,535 65,100 96,300 63,000Third Party Payments 338,488 412,100 349,300 218,200Transfer Payments 0 0 0 0Recharges Within Directorate 631,400 500,400 500,400 40,300Recharges Between Directorates 0 0 0 313,900Recharges Outside General Fund 0 0 0 0Capital Charges 0 0 0 0Financing 0 0 0 0
Total Expenditure 1,909,235 1,913,200 1,709,300 1,438,000
IncomeGovernment Grants (100,000) 0 0 0Other Grants and Contributions (207,161) (181,800) (209,000) (116,800)Customer and Client Receipts 0 0 0 0Interest Received 0 0 0 0Recharges (1,759,300) (1,731,400) (1,731,400) (1,321,200)
Total Income (2,066,461) (1,913,200) (1,940,400) (1,438,000)
Net Expenditure / (Income) (157,227) 0 (231,100) 0
£Growth/ New Burdens
Savings (110,000)
OtherEmp Ins, Pens Fund, NI Adjs 6,100Structural changes (160,100)
264,000Inflation 0
00
0
Asset Depreciation
The Corporate Audit, Fraud and Risk service encompasses Internal Audit, Investigations, Fraud Prevention, Insurance and RiskManagement.
STAFFING NUMBERS
EXPLANATION OF MAJOR CHANGES AFFECTING 2016/17
Nil
Fees & Charges
Recharges adjustment
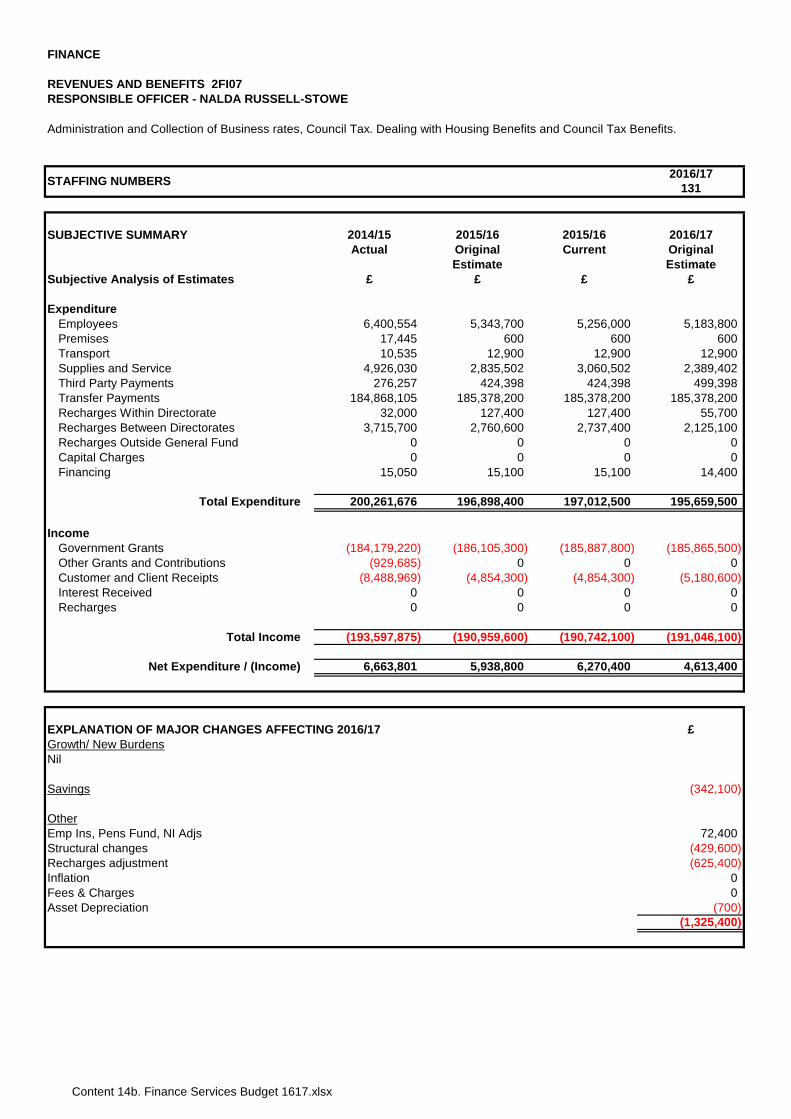
Content 14b. Finance Services Budget 1617.xlsx
FINANCE
REVENUES AND BENEFITS 2FI07RESPONSIBLE OFFICER - NALDA RUSSELL-STOWE
2016/17131
SUBJECTIVE SUMMARY 2014/15 2015/16 2015/16 2016/17Actual Original Current Original
Estimate EstimateSubjective Analysis of Estimates £ £ £ £
ExpenditureEmployees 6,400,554 5,343,700 5,256,000 5,183,800Premises 17,445 600 600 600Transport 10,535 12,900 12,900 12,900Supplies and Service 4,926,030 2,835,502 3,060,502 2,389,402Third Party Payments 276,257 424,398 424,398 499,398Transfer Payments 184,868,105 185,378,200 185,378,200 185,378,200Recharges Within Directorate 32,000 127,400 127,400 55,700Recharges Between Directorates 3,715,700 2,760,600 2,737,400 2,125,100Recharges Outside General Fund 0 0 0 0Capital Charges 0 0 0 0Financing 15,050 15,100 15,100 14,400
Total Expenditure 200,261,676 196,898,400 197,012,500 195,659,500
IncomeGovernment Grants (184,179,220) (186,105,300) (185,887,800) (185,865,500)Other Grants and Contributions (929,685) 0 0 0Customer and Client Receipts (8,488,969) (4,854,300) (4,854,300) (5,180,600)Interest Received 0 0 0 0Recharges 0 0 0 0
Total Income (193,597,875) (190,959,600) (190,742,100) (191,046,100)
Net Expenditure / (Income) 6,663,801 5,938,800 6,270,400 4,613,400
£Growth/ New BurdensNil
(342,100)
OtherEmp Ins, Pens Fund, NI Adjs 72,400Structural changes (429,600)
(625,400)Inflation 0
0(700)
(1,325,400)
EXPLANATION OF MAJOR CHANGES AFFECTING 2016/17
Asset Depreciation
Savings
Administration and Collection of Business rates, Council Tax. Dealing with Housing Benefits and Council Tax Benefits.
STAFFING NUMBERS
Fees & Charges
Recharges adjustment
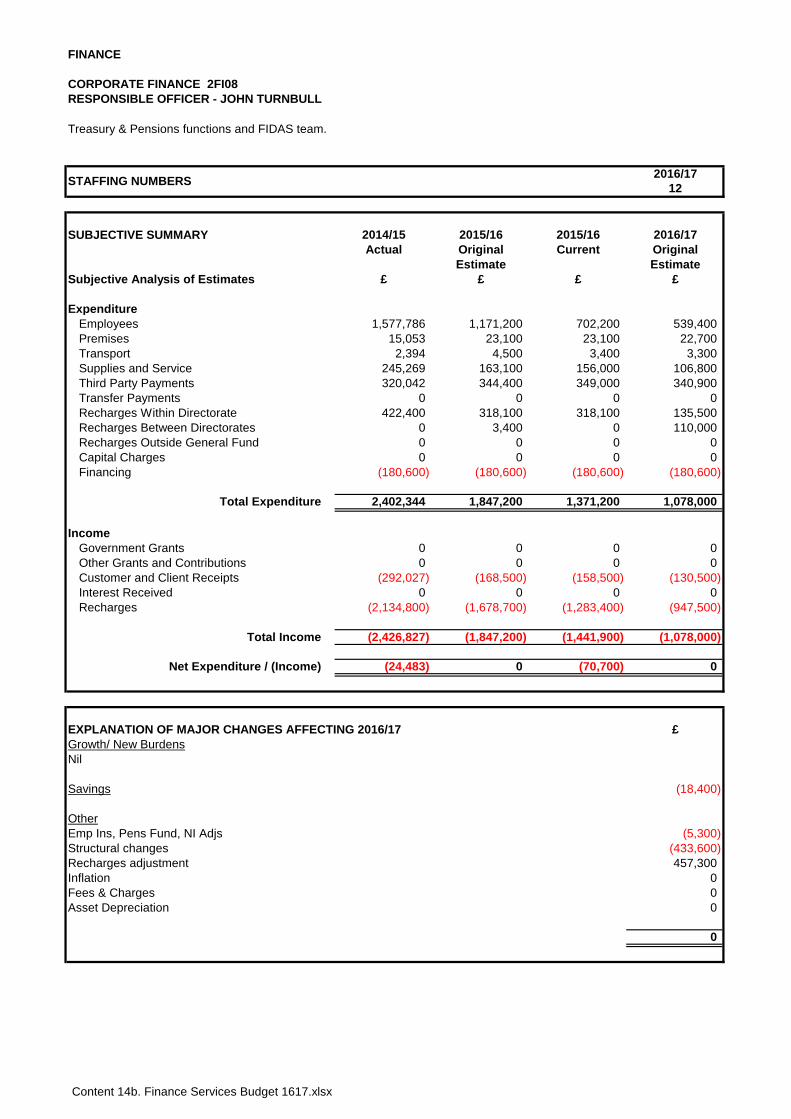
Content 14b. Finance Services Budget 1617.xlsx
FINANCE
CORPORATE FINANCE 2FI08RESPONSIBLE OFFICER - JOHN TURNBULL
2016/1712
SUBJECTIVE SUMMARY 2014/15 2015/16 2015/16 2016/17Actual Original Current Original
Estimate EstimateSubjective Analysis of Estimates £ £ £ £
ExpenditureEmployees 1,577,786 1,171,200 702,200 539,400Premises 15,053 23,100 23,100 22,700Transport 2,394 4,500 3,400 3,300Supplies and Service 245,269 163,100 156,000 106,800Third Party Payments 320,042 344,400 349,000 340,900Transfer Payments 0 0 0 0Recharges Within Directorate 422,400 318,100 318,100 135,500Recharges Between Directorates 0 3,400 0 110,000Recharges Outside General Fund 0 0 0 0Capital Charges 0 0 0 0Financing (180,600) (180,600) (180,600) (180,600)
Total Expenditure 2,402,344 1,847,200 1,371,200 1,078,000
IncomeGovernment Grants 0 0 0 0Other Grants and Contributions 0 0 0 0Customer and Client Receipts (292,027) (168,500) (158,500) (130,500)Interest Received 0 0 0 0Recharges (2,134,800) (1,678,700) (1,283,400) (947,500)
Total Income (2,426,827) (1,847,200) (1,441,900) (1,078,000)
Net Expenditure / (Income) (24,483) 0 (70,700) 0
£Growth/ New Burdens
Savings (18,400)
OtherEmp Ins, Pens Fund, NI Adjs (5,300)Structural changes (433,600)
457,300Inflation 0
00
0
Treasury & Pensions functions and FIDAS team.
STAFFING NUMBERS
EXPLANATION OF MAJOR CHANGES AFFECTING 2016/17
Nil
Asset Depreciation
Recharges adjustment
Fees & Charges
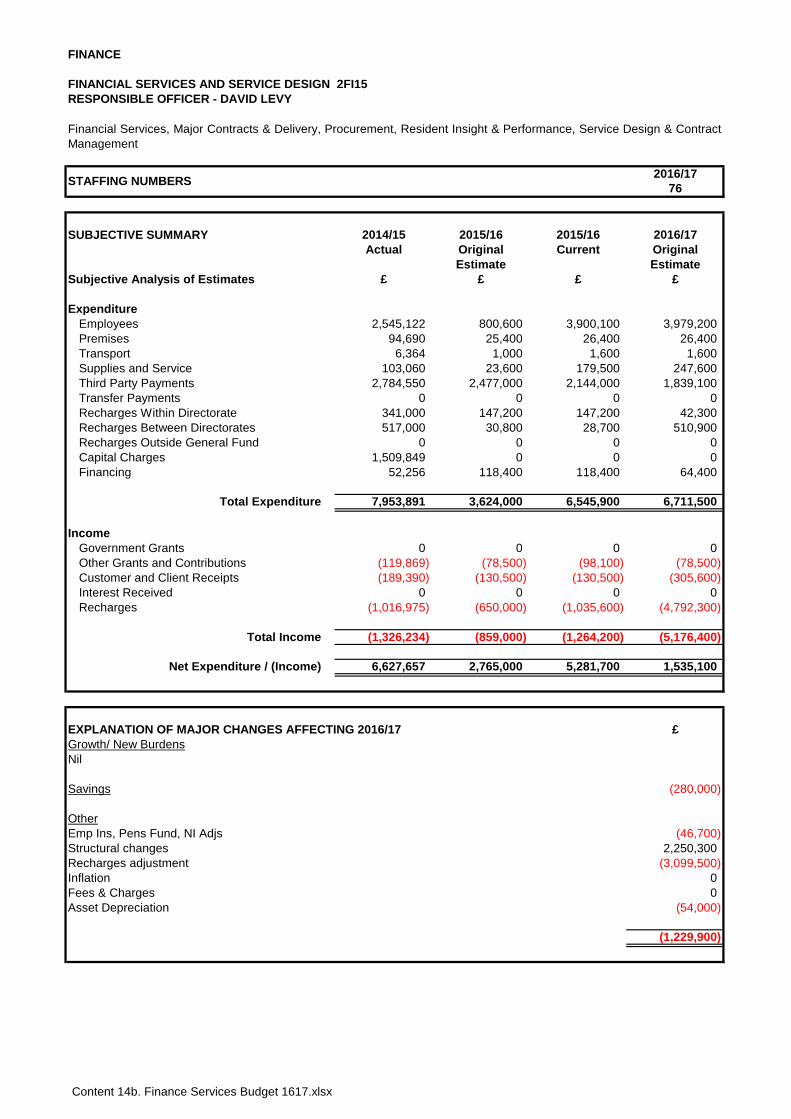
Content 14b. Finance Services Budget 1617.xlsx
FINANCE
FINANCIAL SERVICES AND SERVICE DESIGN 2FI15RESPONSIBLE OFFICER - DAVID LEVY
2016/1776
SUBJECTIVE SUMMARY 2014/15 2015/16 2015/16 2016/17Actual Original Current Original
Estimate EstimateSubjective Analysis of Estimates £ £ £ £
ExpenditureEmployees 2,545,122 800,600 3,900,100 3,979,200Premises 94,690 25,400 26,400 26,400Transport 6,364 1,000 1,600 1,600Supplies and Service 103,060 23,600 179,500 247,600Third Party Payments 2,784,550 2,477,000 2,144,000 1,839,100Transfer Payments 0 0 0 0Recharges Within Directorate 341,000 147,200 147,200 42,300Recharges Between Directorates 517,000 30,800 28,700 510,900Recharges Outside General Fund 0 0 0 0Capital Charges 1,509,849 0 0 0Financing 52,256 118,400 118,400 64,400
Total Expenditure 7,953,891 3,624,000 6,545,900 6,711,500
IncomeGovernment Grants 0 0 0 0Other Grants and Contributions (119,869) (78,500) (98,100) (78,500)Customer and Client Receipts (189,390) (130,500) (130,500) (305,600)Interest Received 0 0 0 0Recharges (1,016,975) (650,000) (1,035,600) (4,792,300)
Total Income (1,326,234) (859,000) (1,264,200) (5,176,400)
Net Expenditure / (Income) 6,627,657 2,765,000 5,281,700 1,535,100
£Growth/ New Burdens
Savings (280,000)
OtherEmp Ins, Pens Fund, NI Adjs (46,700)Structural changes 2,250,300
(3,099,500)Inflation 0
0(54,000)
(1,229,900)
Asset Depreciation
Recharges adjustment
Fees & Charges
Financial Services, Major Contracts & Delivery, Procurement, Resident Insight & Performance, Service Design & ContractManagement
STAFFING NUMBERS
EXPLANATION OF MAJOR CHANGES AFFECTING 2016/17
Nil
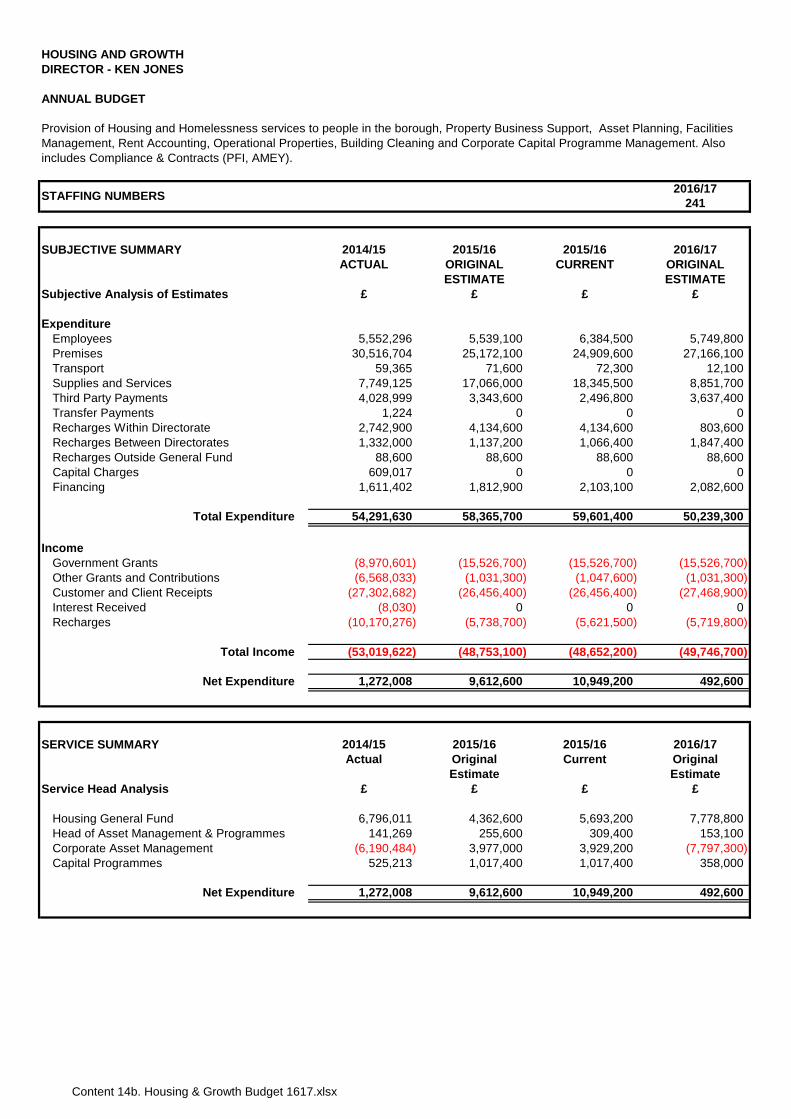
Content 14b. Housing & Growth Budget 1617.xlsx
HOUSING AND GROWTHDIRECTOR - KEN JONES
ANNUAL BUDGET
2016/17241
SUBJECTIVE SUMMARY 2014/15 2015/16 2015/16 2016/17ACTUAL ORIGINAL CURRENT ORIGINAL
ESTIMATE ESTIMATESubjective Analysis of Estimates £ £ £ £
ExpenditureEmployees 5,552,296 5,539,100 6,384,500 5,749,800Premises 30,516,704 25,172,100 24,909,600 27,166,100Transport 59,365 71,600 72,300 12,100Supplies and Services 7,749,125 17,066,000 18,345,500 8,851,700Third Party Payments 4,028,999 3,343,600 2,496,800 3,637,400Transfer Payments 1,224 0 0 0Recharges Within Directorate 2,742,900 4,134,600 4,134,600 803,600Recharges Between Directorates 1,332,000 1,137,200 1,066,400 1,847,400Recharges Outside General Fund 88,600 88,600 88,600 88,600Capital Charges 609,017 0 0 0Financing 1,611,402 1,812,900 2,103,100 2,082,600
Total Expenditure 54,291,630 58,365,700 59,601,400 50,239,300
IncomeGovernment Grants (8,970,601) (15,526,700) (15,526,700) (15,526,700)Other Grants and Contributions (6,568,033) (1,031,300) (1,047,600) (1,031,300)Customer and Client Receipts (27,302,682) (26,456,400) (26,456,400) (27,468,900)Interest Received (8,030) 0 0 0Recharges (10,170,276) (5,738,700) (5,621,500) (5,719,800)
Total Income (53,019,622) (48,753,100) (48,652,200) (49,746,700)
Net Expenditure 1,272,008 9,612,600 10,949,200 492,600
SERVICE SUMMARY 2014/15 2015/16 2015/16 2016/17Actual Original Current Original
Estimate EstimateService Head Analysis £ £ £ £
Housing General Fund 6,796,011 4,362,600 5,693,200 7,778,800Head of Asset Management & Programmes 141,269 255,600 309,400 153,100Corporate Asset Management (6,190,484) 3,977,000 3,929,200 (7,797,300)Capital Programmes 525,213 1,017,400 1,017,400 358,000
Net Expenditure 1,272,008 9,612,600 10,949,200 492,600
Provision of Housing and Homelessness services to people in the borough, Property Business Support, Asset Planning, Facilities Management, Rent Accounting, Operational Properties, Building Cleaning and Corporate Capital Programme Management. Also includes Compliance & Contracts (PFI, AMEY).
STAFFING NUMBERS
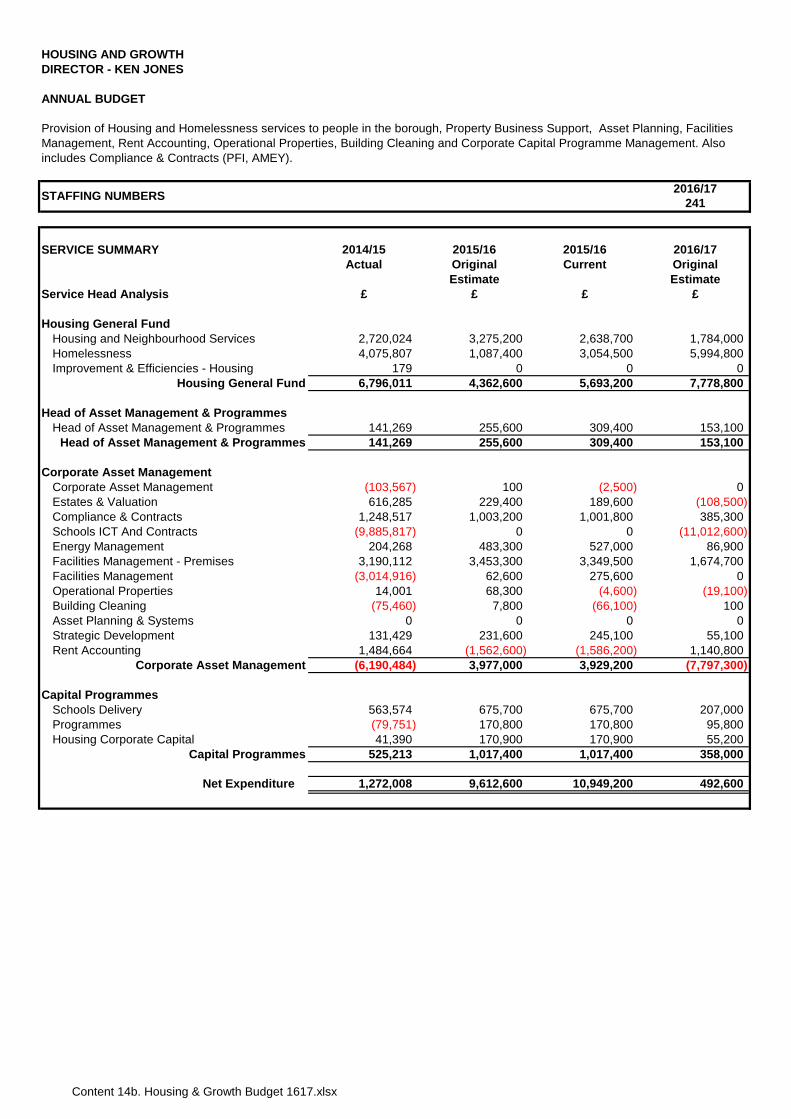
Content 14b. Housing & Growth Budget 1617.xlsx
HOUSING AND GROWTHDIRECTOR - KEN JONES
ANNUAL BUDGET
2016/17241
SERVICE SUMMARY 2014/15 2015/16 2015/16 2016/17Actual Original Current Original
Estimate EstimateService Head Analysis £ £ £ £
Housing General FundHousing and Neighbourhood Services 2,720,024 3,275,200 2,638,700 1,784,000Homelessness 4,075,807 1,087,400 3,054,500 5,994,800Improvement & Efficiencies - Housing 179 0 0 0
Housing General Fund 6,796,011 4,362,600 5,693,200 7,778,800
Head of Asset Management & ProgrammesHead of Asset Management & Programmes 141,269 255,600 309,400 153,100
Head of Asset Management & Programmes 141,269 255,600 309,400 153,100
Corporate Asset ManagementCorporate Asset Management (103,567) 100 (2,500) 0Estates & Valuation 616,285 229,400 189,600 (108,500)Compliance & Contracts 1,248,517 1,003,200 1,001,800 385,300Schools ICT And Contracts (9,885,817) 0 0 (11,012,600)Energy Management 204,268 483,300 527,000 86,900Facilities Management - Premises 3,190,112 3,453,300 3,349,500 1,674,700Facilities Management (3,014,916) 62,600 275,600 0Operational Properties 14,001 68,300 (4,600) (19,100)Building Cleaning (75,460) 7,800 (66,100) 100Asset Planning & Systems 0 0 0 0Strategic Development 131,429 231,600 245,100 55,100Rent Accounting 1,484,664 (1,562,600) (1,586,200) 1,140,800
Corporate Asset Management (6,190,484) 3,977,000 3,929,200 (7,797,300)
Capital ProgrammesSchools Delivery 563,574 675,700 675,700 207,000Programmes (79,751) 170,800 170,800 95,800Housing Corporate Capital 41,390 170,900 170,900 55,200
Capital Programmes 525,213 1,017,400 1,017,400 358,000
Net Expenditure 1,272,008 9,612,600 10,949,200 492,600
Provision of Housing and Homelessness services to people in the borough, Property Business Support, Asset Planning, Facilities Management, Rent Accounting, Operational Properties, Building Cleaning and Corporate Capital Programme Management. Also includes Compliance & Contracts (PFI, AMEY).
STAFFING NUMBERS
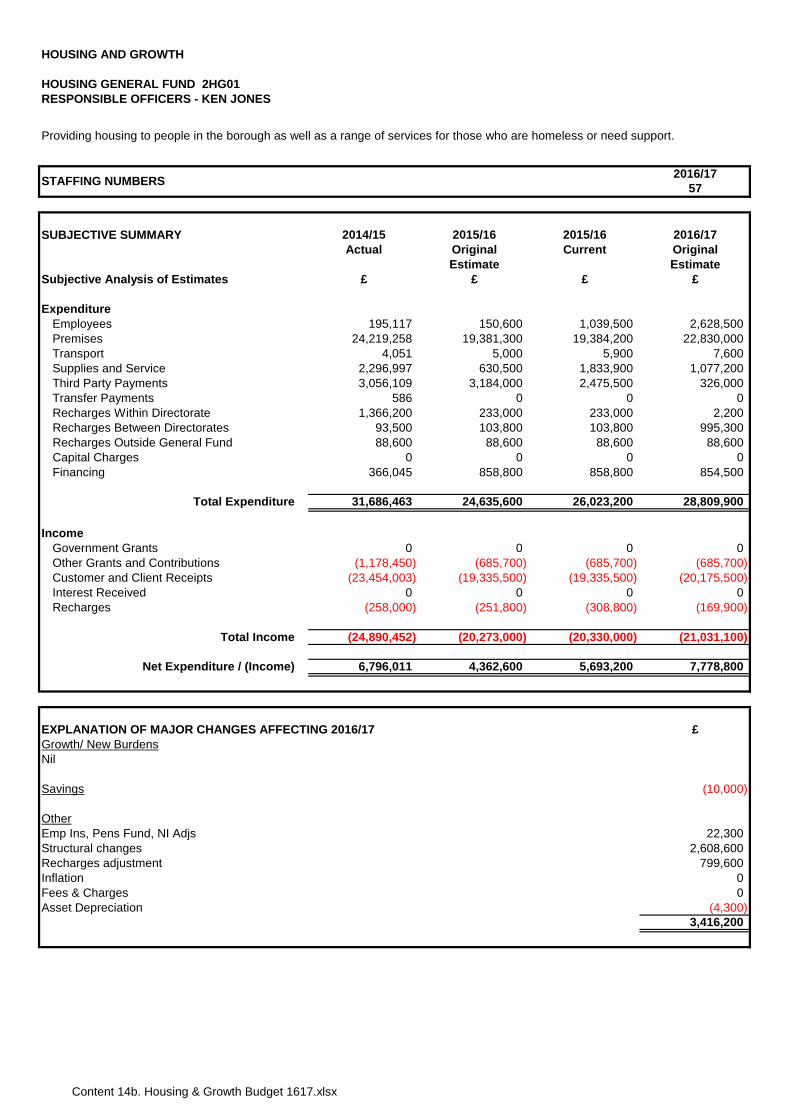
Content 14b. Housing & Growth Budget 1617.xlsx
HOUSING AND GROWTH
HOUSING GENERAL FUND 2HG01
2016/1757
SUBJECTIVE SUMMARY 2014/15 2015/16 2015/16 2016/17Actual Original Current Original
Estimate EstimateSubjective Analysis of Estimates £ £ £ £
ExpenditureEmployees 195,117 150,600 1,039,500 2,628,500Premises 24,219,258 19,381,300 19,384,200 22,830,000Transport 4,051 5,000 5,900 7,600Supplies and Service 2,296,997 630,500 1,833,900 1,077,200Third Party Payments 3,056,109 3,184,000 2,475,500 326,000Transfer Payments 586 0 0 0Recharges Within Directorate 1,366,200 233,000 233,000 2,200Recharges Between Directorates 93,500 103,800 103,800 995,300Recharges Outside General Fund 88,600 88,600 88,600 88,600Capital Charges 0 0 0 0Financing 366,045 858,800 858,800 854,500
Total Expenditure 31,686,463 24,635,600 26,023,200 28,809,900
IncomeGovernment Grants 0 0 0 0Other Grants and Contributions (1,178,450) (685,700) (685,700) (685,700)Customer and Client Receipts (23,454,003) (19,335,500) (19,335,500) (20,175,500)Interest Received 0 0 0 0Recharges (258,000) (251,800) (308,800) (169,900)
Total Income (24,890,452) (20,273,000) (20,330,000) (21,031,100)
Net Expenditure / (Income) 6,796,011 4,362,600 5,693,200 7,778,800
£Growth/ New Burdens
Savings (10,000)
OtherEmp Ins, Pens Fund, NI Adjs 22,300Structural changes 2,608,600
799,600Inflation 0
0(4,300)
3,416,200
Nil
RESPONSIBLE OFFICERS - KEN JONES
Providing housing to people in the borough as well as a range of services for those who are homeless or need support.
STAFFING NUMBERS
EXPLANATION OF MAJOR CHANGES AFFECTING 2016/17
Recharges adjustment
Asset DepreciationFees & Charges
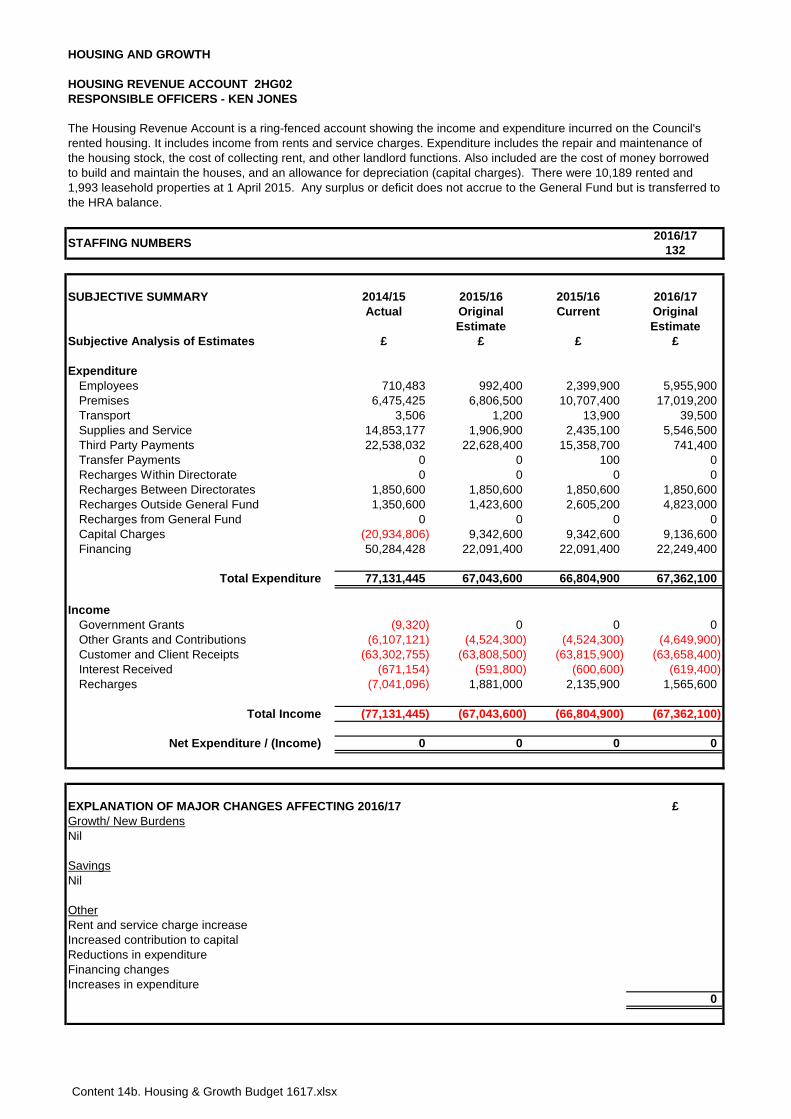
Content 14b. Housing & Growth Budget 1617.xlsx
HOUSING AND GROWTH
HOUSING REVENUE ACCOUNT 2HG02
2016/17132
SUBJECTIVE SUMMARY 2014/15 2015/16 2015/16 2016/17Actual Original Current Original
Estimate EstimateSubjective Analysis of Estimates £ £ £ £
ExpenditureEmployees 710,483 992,400 2,399,900 5,955,900Premises 6,475,425 6,806,500 10,707,400 17,019,200Transport 3,506 1,200 13,900 39,500Supplies and Service 14,853,177 1,906,900 2,435,100 5,546,500Third Party Payments 22,538,032 22,628,400 15,358,700 741,400Transfer Payments 0 0 100 0Recharges Within Directorate 0 0 0 0Recharges Between Directorates 1,850,600 1,850,600 1,850,600 1,850,600Recharges Outside General Fund 1,350,600 1,423,600 2,605,200 4,823,000Recharges from General Fund 0 0 0 0Capital Charges (20,934,806) 9,342,600 9,342,600 9,136,600Financing 50,284,428 22,091,400 22,091,400 22,249,400
Total Expenditure 77,131,445 67,043,600 66,804,900 67,362,100
IncomeGovernment Grants (9,320) 0 0 0Other Grants and Contributions (6,107,121) (4,524,300) (4,524,300) (4,649,900)Customer and Client Receipts (63,302,755) (63,808,500) (63,815,900) (63,658,400)Interest Received (671,154) (591,800) (600,600) (619,400)Recharges (7,041,096) 1,881,000 2,135,900 1,565,600
Total Income (77,131,445) (67,043,600) (66,804,900) (67,362,100)
Net Expenditure / (Income) 0 0 0 0
£Growth/ New Burdens
Savings
OtherRent and service charge increase
0
RESPONSIBLE OFFICERS - KEN JONES
STAFFING NUMBERS
Financing changes
Increased contribution to capital
The Housing Revenue Account is a ring-fenced account showing the income and expenditure incurred on the Council's rented housing. It includes income from rents and service charges. Expenditure includes the repair and maintenance of the housing stock, the cost of collecting rent, and other landlord functions. Also included are the cost of money borrowed to build and maintain the houses, and an allowance for depreciation (capital charges). There were 10,189 rented and 1,993 leasehold properties at 1 April 2015. Any surplus or deficit does not accrue to the General Fund but is transferred to the HRA balance.
Increases in expenditure
EXPLANATION OF MAJOR CHANGES AFFECTING 2016/17
Nil
Nil
Reductions in expenditure
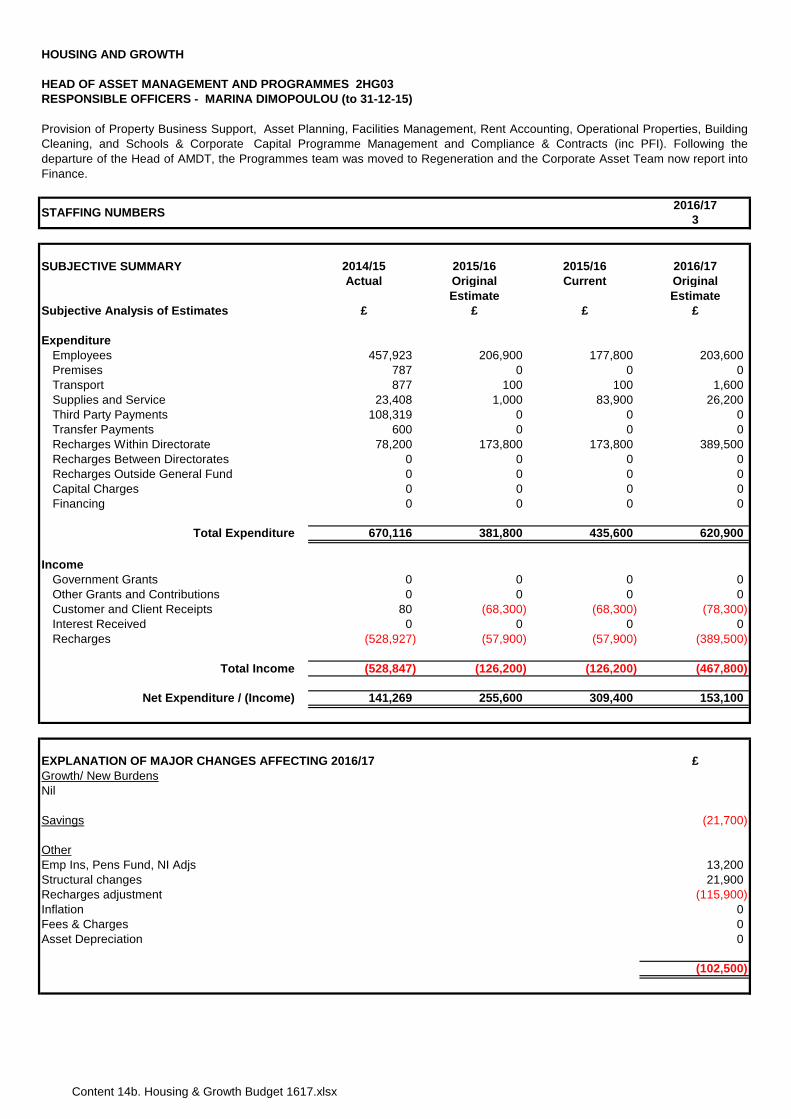
Content 14b. Housing & Growth Budget 1617.xlsx
HOUSING AND GROWTH
HEAD OF ASSET MANAGEMENT AND PROGRAMMES 2HG03
2016/173
SUBJECTIVE SUMMARY 2014/15 2015/16 2015/16 2016/17Actual Original Current Original
Estimate EstimateSubjective Analysis of Estimates £ £ £ £
ExpenditureEmployees 457,923 206,900 177,800 203,600Premises 787 0 0 0Transport 877 100 100 1,600Supplies and Service 23,408 1,000 83,900 26,200Third Party Payments 108,319 0 0 0Transfer Payments 600 0 0 0Recharges Within Directorate 78,200 173,800 173,800 389,500Recharges Between Directorates 0 0 0 0Recharges Outside General Fund 0 0 0 0Capital Charges 0 0 0 0Financing 0 0 0 0
Total Expenditure 670,116 381,800 435,600 620,900
IncomeGovernment Grants 0 0 0 0Other Grants and Contributions 0 0 0 0Customer and Client Receipts 80 (68,300) (68,300) (78,300)Interest Received 0 0 0 0Recharges (528,927) (57,900) (57,900) (389,500)
Total Income (528,847) (126,200) (126,200) (467,800)
Net Expenditure / (Income) 141,269 255,600 309,400 153,100
£Growth/ New Burdens
(21,700)
OtherEmp Ins, Pens Fund, NI Adjs 13,200Structural changes 21,900
(115,900)Inflation 0
00
(102,500)
EXPLANATION OF MAJOR CHANGES AFFECTING 2016/17
Nil
Savings
Asset Depreciation
Recharges adjustment
Fees & Charges
RESPONSIBLE OFFICERS - MARINA DIMOPOULOU (to 31-12-15)
Provision of Property Business Support, Asset Planning, Facilities Management, Rent Accounting, Operational Properties, BuildingCleaning, and Schools & Corporate Capital Programme Management and Compliance & Contracts (inc PFI). Following thedeparture of the Head of AMDT, the Programmes team was moved to Regeneration and the Corporate Asset Team now report intoFinance.
STAFFING NUMBERS
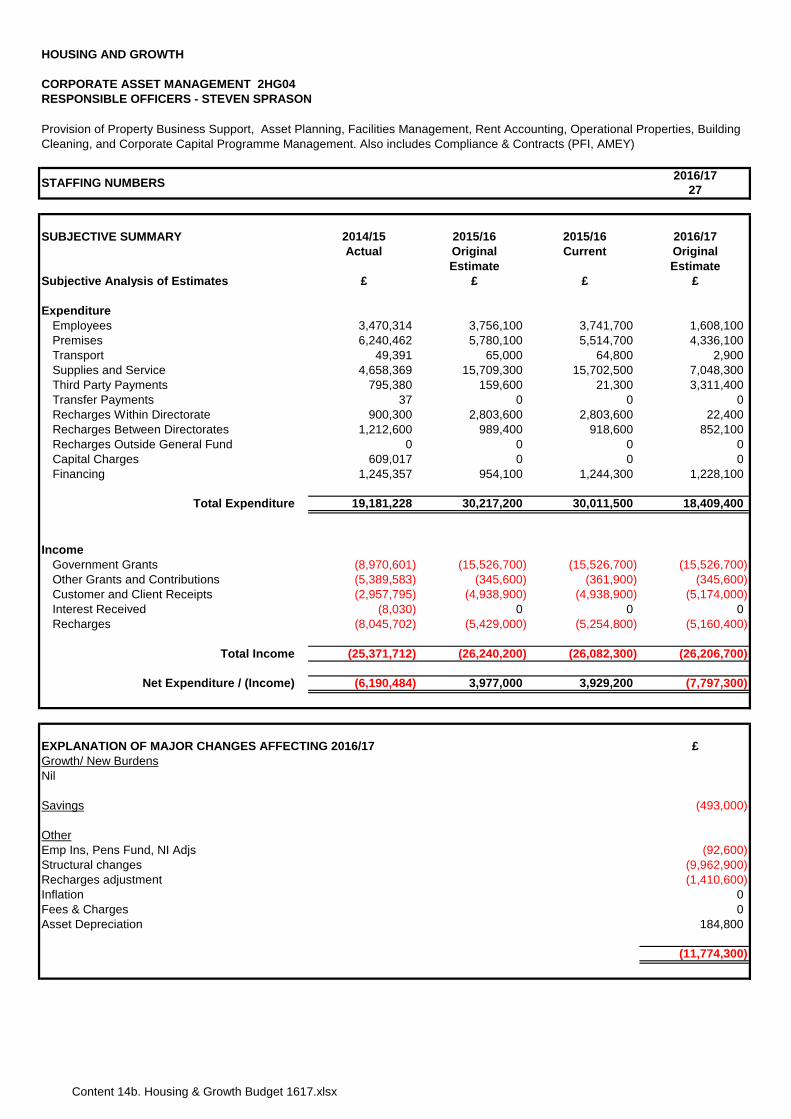
Content 14b. Housing & Growth Budget 1617.xlsx
HOUSING AND GROWTH
CORPORATE ASSET MANAGEMENT 2HG04
2016/1727
SUBJECTIVE SUMMARY 2014/15 2015/16 2015/16 2016/17Actual Original Current Original
Estimate EstimateSubjective Analysis of Estimates £ £ £ £
ExpenditureEmployees 3,470,314 3,756,100 3,741,700 1,608,100Premises 6,240,462 5,780,100 5,514,700 4,336,100Transport 49,391 65,000 64,800 2,900Supplies and Service 4,658,369 15,709,300 15,702,500 7,048,300Third Party Payments 795,380 159,600 21,300 3,311,400Transfer Payments 37 0 0 0Recharges Within Directorate 900,300 2,803,600 2,803,600 22,400Recharges Between Directorates 1,212,600 989,400 918,600 852,100Recharges Outside General Fund 0 0 0 0Capital Charges 609,017 0 0 0Financing 1,245,357 954,100 1,244,300 1,228,100
Total Expenditure 19,181,228 30,217,200 30,011,500 18,409,400
IncomeGovernment Grants (8,970,601) (15,526,700) (15,526,700) (15,526,700)Other Grants and Contributions (5,389,583) (345,600) (361,900) (345,600)Customer and Client Receipts (2,957,795) (4,938,900) (4,938,900) (5,174,000)Interest Received (8,030) 0 0 0Recharges (8,045,702) (5,429,000) (5,254,800) (5,160,400)
Total Income (25,371,712) (26,240,200) (26,082,300) (26,206,700)
Net Expenditure / (Income) (6,190,484) 3,977,000 3,929,200 (7,797,300)
£Growth/ New Burdens
(493,000)
OtherEmp Ins, Pens Fund, NI Adjs (92,600)Structural changes (9,962,900)
(1,410,600)Inflation 0
0184,800
(11,774,300)
RESPONSIBLE OFFICERS - STEVEN SPRASON
Provision of Property Business Support, Asset Planning, Facilities Management, Rent Accounting, Operational Properties, Building Cleaning, and Corporate Capital Programme Management. Also includes Compliance & Contracts (PFI, AMEY)
STAFFING NUMBERS
EXPLANATION OF MAJOR CHANGES AFFECTING 2016/17
Nil
Asset Depreciation
Savings
Recharges adjustment
Fees & Charges
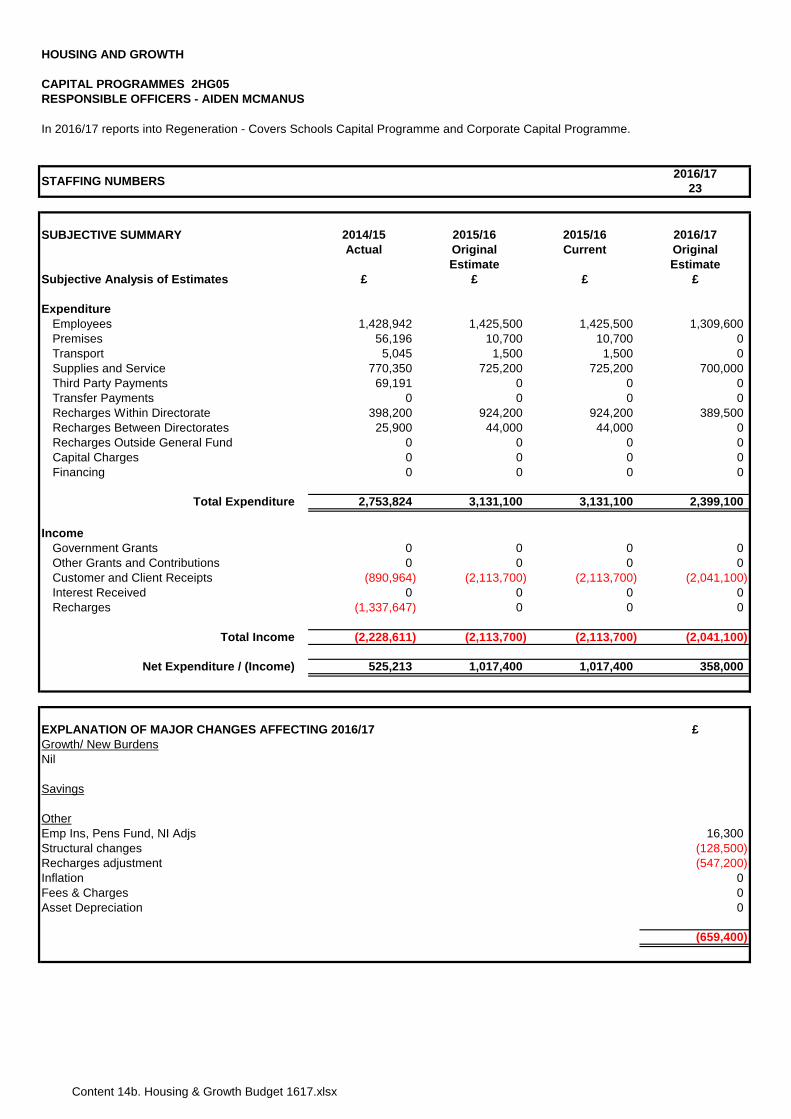
Content 14b. Housing & Growth Budget 1617.xlsx
HOUSING AND GROWTH
CAPITAL PROGRAMMES 2HG05
2016/1723
SUBJECTIVE SUMMARY 2014/15 2015/16 2015/16 2016/17Actual Original Current Original
Estimate EstimateSubjective Analysis of Estimates £ £ £ £
ExpenditureEmployees 1,428,942 1,425,500 1,425,500 1,309,600Premises 56,196 10,700 10,700 0Transport 5,045 1,500 1,500 0Supplies and Service 770,350 725,200 725,200 700,000Third Party Payments 69,191 0 0 0Transfer Payments 0 0 0 0Recharges Within Directorate 398,200 924,200 924,200 389,500Recharges Between Directorates 25,900 44,000 44,000 0Recharges Outside General Fund 0 0 0 0Capital Charges 0 0 0 0Financing 0 0 0 0
Total Expenditure 2,753,824 3,131,100 3,131,100 2,399,100
IncomeGovernment Grants 0 0 0 0Other Grants and Contributions 0 0 0 0Customer and Client Receipts (890,964) (2,113,700) (2,113,700) (2,041,100)Interest Received 0 0 0 0Recharges (1,337,647) 0 0 0
Total Income (2,228,611) (2,113,700) (2,113,700) (2,041,100)
Net Expenditure / (Income) 525,213 1,017,400 1,017,400 358,000
£Growth/ New Burdens
OtherEmp Ins, Pens Fund, NI Adjs 16,300Structural changes (128,500)
(547,200)Inflation 0
00
(659,400)
EXPLANATION OF MAJOR CHANGES AFFECTING 2016/17
RESPONSIBLE OFFICERS - AIDEN MCMANUS
In 2016/17 reports into Regeneration - Covers Schools Capital Programme and Corporate Capital Programme.
STAFFING NUMBERS
Nil
Savings
Recharges adjustment
Fees & ChargesAsset Depreciation
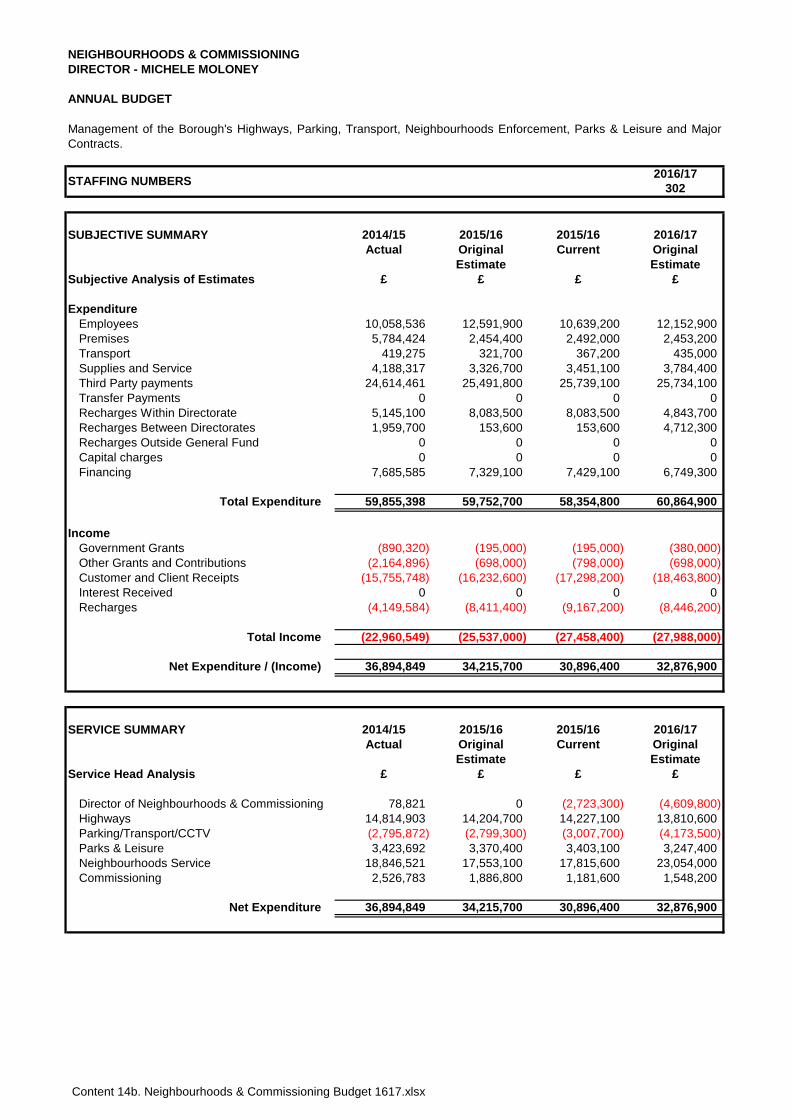
Content 14b. Neighbourhoods & Commissioning Budget 1617.xlsx
NEIGHBOURHOODS & COMMISSIONINGDIRECTOR - MICHELE MOLONEY
ANNUAL BUDGET
2016/17302
SUBJECTIVE SUMMARY 2014/15 2015/16 2015/16 2016/17Actual Original Current Original
Estimate EstimateSubjective Analysis of Estimates £ £ £ £
ExpenditureEmployees 10,058,536 12,591,900 10,639,200 12,152,900Premises 5,784,424 2,454,400 2,492,000 2,453,200Transport 419,275 321,700 367,200 435,000Supplies and Service 4,188,317 3,326,700 3,451,100 3,784,400Third Party payments 24,614,461 25,491,800 25,739,100 25,734,100Transfer Payments 0 0 0 0Recharges Within Directorate 5,145,100 8,083,500 8,083,500 4,843,700Recharges Between Directorates 1,959,700 153,600 153,600 4,712,300Recharges Outside General Fund 0 0 0 0Capital charges 0 0 0 0Financing 7,685,585 7,329,100 7,429,100 6,749,300
Total Expenditure 59,855,398 59,752,700 58,354,800 60,864,900
IncomeGovernment Grants (890,320) (195,000) (195,000) (380,000)Other Grants and Contributions (2,164,896) (698,000) (798,000) (698,000)Customer and Client Receipts (15,755,748) (16,232,600) (17,298,200) (18,463,800)Interest Received 0 0 0 0Recharges (4,149,584) (8,411,400) (9,167,200) (8,446,200)
Total Income (22,960,549) (25,537,000) (27,458,400) (27,988,000)
Net Expenditure / (Income) 36,894,849 34,215,700 30,896,400 32,876,900
SERVICE SUMMARY 2014/15 2015/16 2015/16 2016/17Actual Original Current Original
Estimate EstimateService Head Analysis £ £ £ £
Director of Neighbourhoods & Commissioning 78,821 0 (2,723,300) (4,609,800)Highways 14,814,903 14,204,700 14,227,100 13,810,600Parking/Transport/CCTV (2,795,872) (2,799,300) (3,007,700) (4,173,500)Parks & Leisure 3,423,692 3,370,400 3,403,100 3,247,400Neighbourhoods Service 18,846,521 17,553,100 17,815,600 23,054,000Commissioning 2,526,783 1,886,800 1,181,600 1,548,200
Net Expenditure 36,894,849 34,215,700 30,896,400 32,876,900
Management of the Borough's Highways, Parking, Transport, Neighbourhoods Enforcement, Parks & Leisure and MajorContracts.
STAFFING NUMBERS
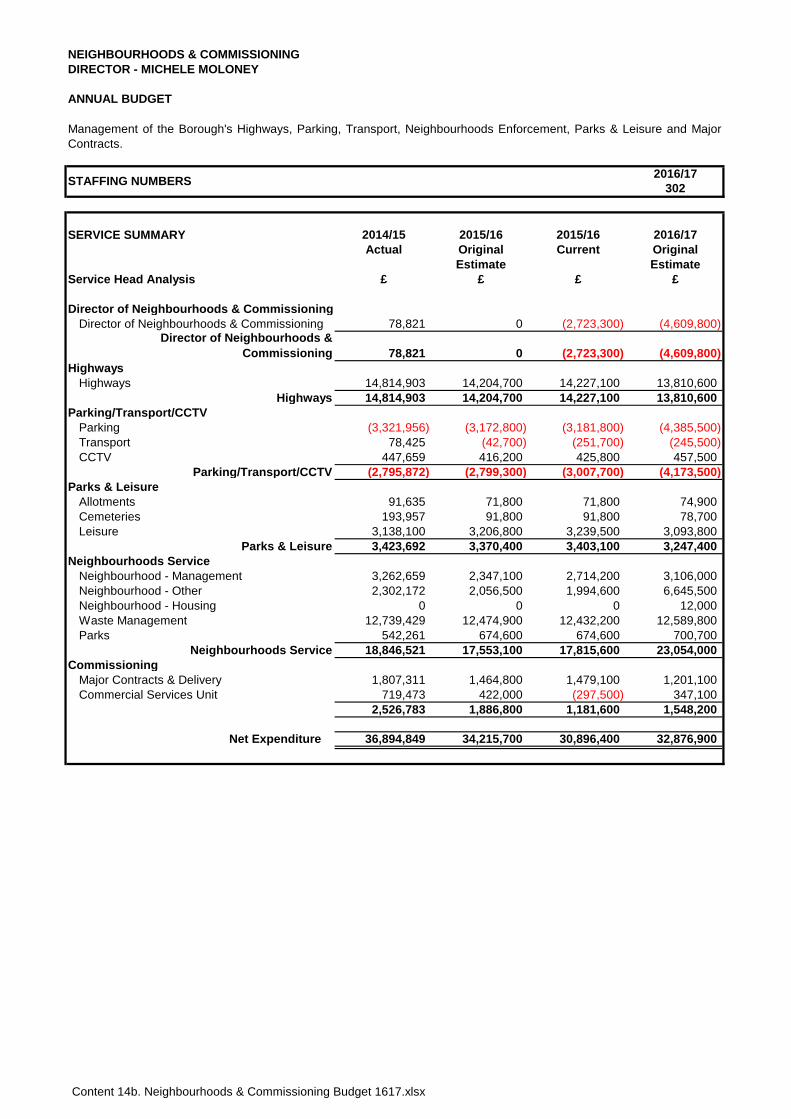
Content 14b. Neighbourhoods & Commissioning Budget 1617.xlsx
NEIGHBOURHOODS & COMMISSIONINGDIRECTOR - MICHELE MOLONEY
ANNUAL BUDGET
2016/17302
SERVICE SUMMARY 2014/15 2015/16 2015/16 2016/17Actual Original Current Original
Estimate EstimateService Head Analysis £ £ £ £
Director of Neighbourhoods & CommissioningDirector of Neighbourhoods & Commissioning 78,821 0 (2,723,300) (4,609,800)
Director of Neighbourhoods & Commissioning 78,821 0 (2,723,300) (4,609,800)
HighwaysHighways 14,814,903 14,204,700 14,227,100 13,810,600
Highways 14,814,903 14,204,700 14,227,100 13,810,600Parking/Transport/CCTV
Parking (3,321,956) (3,172,800) (3,181,800) (4,385,500)Transport 78,425 (42,700) (251,700) (245,500)CCTV 447,659 416,200 425,800 457,500
Parking/Transport/CCTV (2,795,872) (2,799,300) (3,007,700) (4,173,500)Parks & Leisure
Allotments 91,635 71,800 71,800 74,900Cemeteries 193,957 91,800 91,800 78,700Leisure 3,138,100 3,206,800 3,239,500 3,093,800
Parks & Leisure 3,423,692 3,370,400 3,403,100 3,247,400Neighbourhoods Service
Neighbourhood - Management 3,262,659 2,347,100 2,714,200 3,106,000Neighbourhood - Other 2,302,172 2,056,500 1,994,600 6,645,500Neighbourhood - Housing 0 0 0 12,000Waste Management 12,739,429 12,474,900 12,432,200 12,589,800Parks 542,261 674,600 674,600 700,700
Neighbourhoods Service 18,846,521 17,553,100 17,815,600 23,054,000Commissioning
Major Contracts & Delivery 1,807,311 1,464,800 1,479,100 1,201,100Commercial Services Unit 719,473 422,000 (297,500) 347,100
2,526,783 1,886,800 1,181,600 1,548,200
Net Expenditure 36,894,849 34,215,700 30,896,400 32,876,900
Management of the Borough's Highways, Parking, Transport, Neighbourhoods Enforcement, Parks & Leisure and MajorContracts.
STAFFING NUMBERS
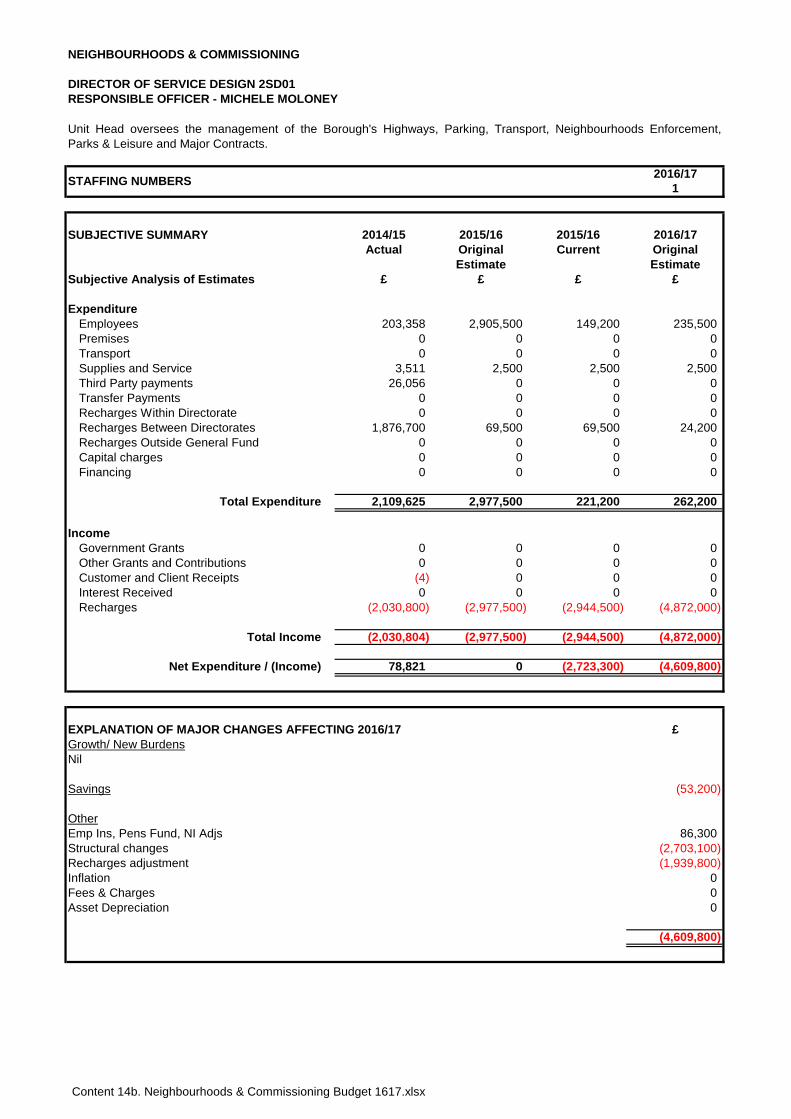
Content 14b. Neighbourhoods & Commissioning Budget 1617.xlsx
NEIGHBOURHOODS & COMMISSIONING
DIRECTOR OF SERVICE DESIGN 2SD01RESPONSIBLE OFFICER - MICHELE MOLONEY
2016/171
SUBJECTIVE SUMMARY 2014/15 2015/16 2015/16 2016/17Actual Original Current Original
Estimate EstimateSubjective Analysis of Estimates £ £ £ £
ExpenditureEmployees 203,358 2,905,500 149,200 235,500Premises 0 0 0 0Transport 0 0 0 0Supplies and Service 3,511 2,500 2,500 2,500Third Party payments 26,056 0 0 0Transfer Payments 0 0 0 0Recharges Within Directorate 0 0 0 0Recharges Between Directorates 1,876,700 69,500 69,500 24,200Recharges Outside General Fund 0 0 0 0Capital charges 0 0 0 0Financing 0 0 0 0
Total Expenditure 2,109,625 2,977,500 221,200 262,200
IncomeGovernment Grants 0 0 0 0Other Grants and Contributions 0 0 0 0Customer and Client Receipts (4) 0 0 0Interest Received 0 0 0 0Recharges (2,030,800) (2,977,500) (2,944,500) (4,872,000)
Total Income (2,030,804) (2,977,500) (2,944,500) (4,872,000)
Net Expenditure / (Income) 78,821 0 (2,723,300) (4,609,800)
£Growth/ New Burdens
Savings (53,200)
OtherEmp Ins, Pens Fund, NI Adjs 86,300Structural changes (2,703,100)
(1,939,800)Inflation 0
00
(4,609,800)
Asset Depreciation
Recharges adjustment
Fees & Charges
Unit Head oversees the management of the Borough's Highways, Parking, Transport, Neighbourhoods Enforcement,Parks & Leisure and Major Contracts.
STAFFING NUMBERS
EXPLANATION OF MAJOR CHANGES AFFECTING 2016/17
Nil
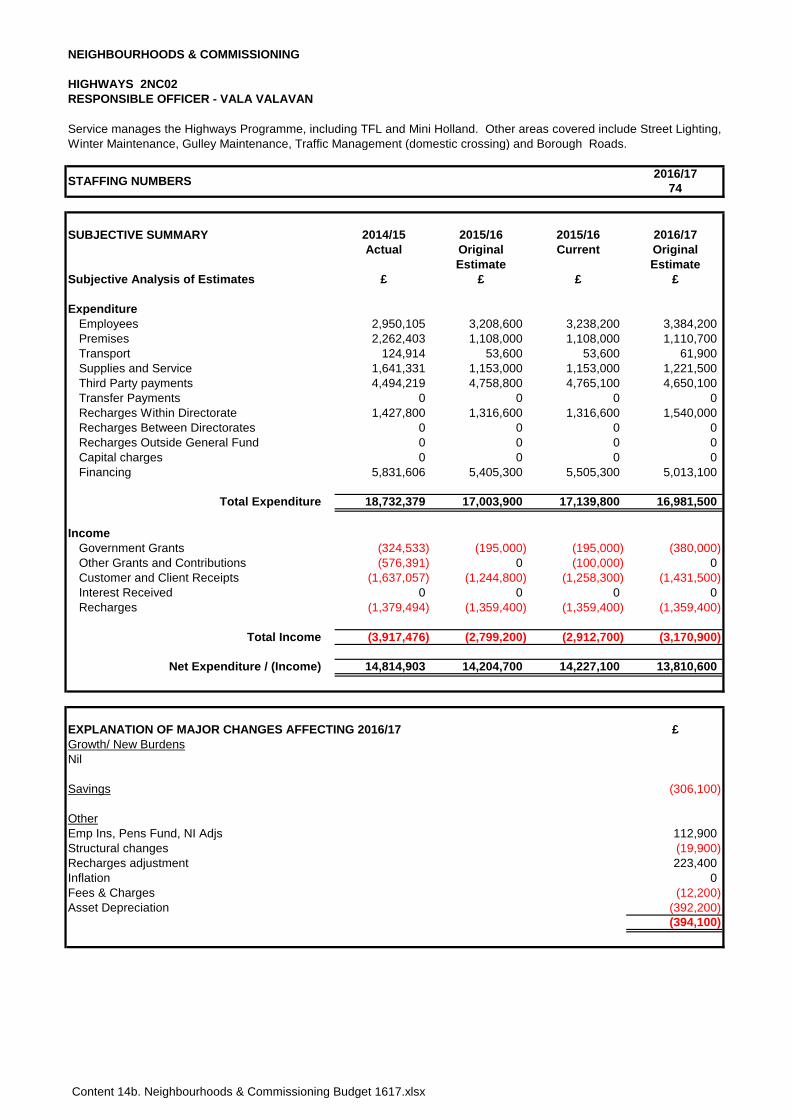
Content 14b. Neighbourhoods & Commissioning Budget 1617.xlsx
NEIGHBOURHOODS & COMMISSIONING
HIGHWAYS 2NC02RESPONSIBLE OFFICER - VALA VALAVAN
2016/1774
SUBJECTIVE SUMMARY 2014/15 2015/16 2015/16 2016/17Actual Original Current Original
Estimate EstimateSubjective Analysis of Estimates £ £ £ £
ExpenditureEmployees 2,950,105 3,208,600 3,238,200 3,384,200Premises 2,262,403 1,108,000 1,108,000 1,110,700Transport 124,914 53,600 53,600 61,900Supplies and Service 1,641,331 1,153,000 1,153,000 1,221,500Third Party payments 4,494,219 4,758,800 4,765,100 4,650,100Transfer Payments 0 0 0 0Recharges Within Directorate 1,427,800 1,316,600 1,316,600 1,540,000Recharges Between Directorates 0 0 0 0Recharges Outside General Fund 0 0 0 0Capital charges 0 0 0 0Financing 5,831,606 5,405,300 5,505,300 5,013,100
Total Expenditure 18,732,379 17,003,900 17,139,800 16,981,500
IncomeGovernment Grants (324,533) (195,000) (195,000) (380,000)Other Grants and Contributions (576,391) 0 (100,000) 0Customer and Client Receipts (1,637,057) (1,244,800) (1,258,300) (1,431,500)Interest Received 0 0 0 0Recharges (1,379,494) (1,359,400) (1,359,400) (1,359,400)
Total Income (3,917,476) (2,799,200) (2,912,700) (3,170,900)
Net Expenditure / (Income) 14,814,903 14,204,700 14,227,100 13,810,600
£Growth/ New Burdens
Savings (306,100)
OtherEmp Ins, Pens Fund, NI Adjs 112,900Structural changes (19,900)
223,400Inflation 0
(12,200)(392,200)(394,100)
Fees & ChargesAsset Depreciation
Recharges adjustment
Service manages the Highways Programme, including TFL and Mini Holland. Other areas covered include Street Lighting,Winter Maintenance, Gulley Maintenance, Traffic Management (domestic crossing) and Borough Roads.
STAFFING NUMBERS
EXPLANATION OF MAJOR CHANGES AFFECTING 2016/17
Nil
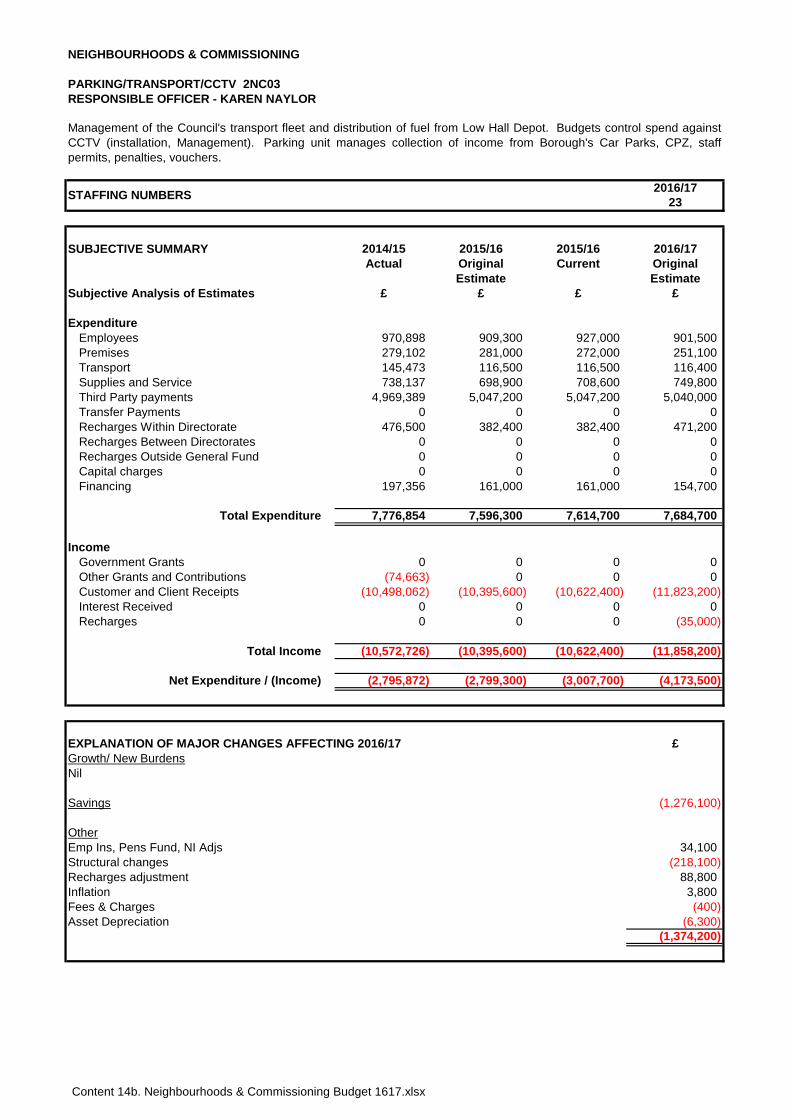
Content 14b. Neighbourhoods & Commissioning Budget 1617.xlsx
NEIGHBOURHOODS & COMMISSIONING
PARKING/TRANSPORT/CCTV 2NC03RESPONSIBLE OFFICER - KAREN NAYLOR
2016/1723
SUBJECTIVE SUMMARY 2014/15 2015/16 2015/16 2016/17Actual Original Current Original
Estimate EstimateSubjective Analysis of Estimates £ £ £ £
ExpenditureEmployees 970,898 909,300 927,000 901,500Premises 279,102 281,000 272,000 251,100Transport 145,473 116,500 116,500 116,400Supplies and Service 738,137 698,900 708,600 749,800Third Party payments 4,969,389 5,047,200 5,047,200 5,040,000Transfer Payments 0 0 0 0Recharges Within Directorate 476,500 382,400 382,400 471,200Recharges Between Directorates 0 0 0 0Recharges Outside General Fund 0 0 0 0Capital charges 0 0 0 0Financing 197,356 161,000 161,000 154,700
Total Expenditure 7,776,854 7,596,300 7,614,700 7,684,700
IncomeGovernment Grants 0 0 0 0Other Grants and Contributions (74,663) 0 0 0Customer and Client Receipts (10,498,062) (10,395,600) (10,622,400) (11,823,200)Interest Received 0 0 0 0Recharges 0 0 0 (35,000)
Total Income (10,572,726) (10,395,600) (10,622,400) (11,858,200)
Net Expenditure / (Income) (2,795,872) (2,799,300) (3,007,700) (4,173,500)
£Growth/ New Burdens
Savings (1,276,100)
OtherEmp Ins, Pens Fund, NI Adjs 34,100Structural changes (218,100)
88,800Inflation 3,800
(400)(6,300)
(1,374,200)
Fees & ChargesAsset Depreciation
Management of the Council's transport fleet and distribution of fuel from Low Hall Depot. Budgets control spend againstCCTV (installation, Management). Parking unit manages collection of income from Borough's Car Parks, CPZ, staffpermits, penalties, vouchers.
STAFFING NUMBERS
EXPLANATION OF MAJOR CHANGES AFFECTING 2016/17
Nil
Recharges adjustment
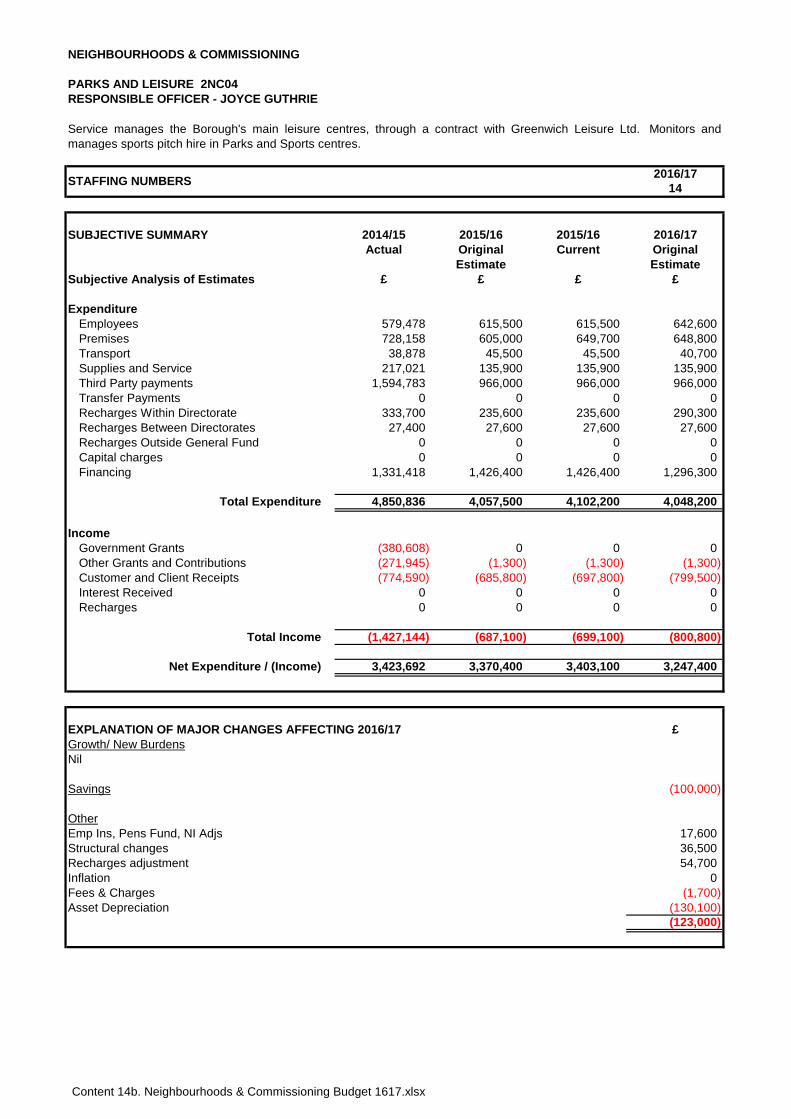
Content 14b. Neighbourhoods & Commissioning Budget 1617.xlsx
NEIGHBOURHOODS & COMMISSIONING
PARKS AND LEISURE 2NC04RESPONSIBLE OFFICER - JOYCE GUTHRIE
2016/1714
SUBJECTIVE SUMMARY 2014/15 2015/16 2015/16 2016/17Actual Original Current Original
Estimate EstimateSubjective Analysis of Estimates £ £ £ £
ExpenditureEmployees 579,478 615,500 615,500 642,600Premises 728,158 605,000 649,700 648,800Transport 38,878 45,500 45,500 40,700Supplies and Service 217,021 135,900 135,900 135,900Third Party payments 1,594,783 966,000 966,000 966,000Transfer Payments 0 0 0 0Recharges Within Directorate 333,700 235,600 235,600 290,300Recharges Between Directorates 27,400 27,600 27,600 27,600Recharges Outside General Fund 0 0 0 0Capital charges 0 0 0 0Financing 1,331,418 1,426,400 1,426,400 1,296,300
Total Expenditure 4,850,836 4,057,500 4,102,200 4,048,200
IncomeGovernment Grants (380,608) 0 0 0Other Grants and Contributions (271,945) (1,300) (1,300) (1,300)Customer and Client Receipts (774,590) (685,800) (697,800) (799,500)Interest Received 0 0 0 0Recharges 0 0 0 0
Total Income (1,427,144) (687,100) (699,100) (800,800)
Net Expenditure / (Income) 3,423,692 3,370,400 3,403,100 3,247,400
£Growth/ New Burdens
Savings (100,000)
OtherEmp Ins, Pens Fund, NI Adjs 17,600Structural changes 36,500
54,700Inflation 0
(1,700)(130,100)(123,000)
Fees & ChargesAsset Depreciation
Service manages the Borough's main leisure centres, through a contract with Greenwich Leisure Ltd. Monitors andmanages sports pitch hire in Parks and Sports centres.
STAFFING NUMBERS
EXPLANATION OF MAJOR CHANGES AFFECTING 2016/17
Nil
Recharges adjustment
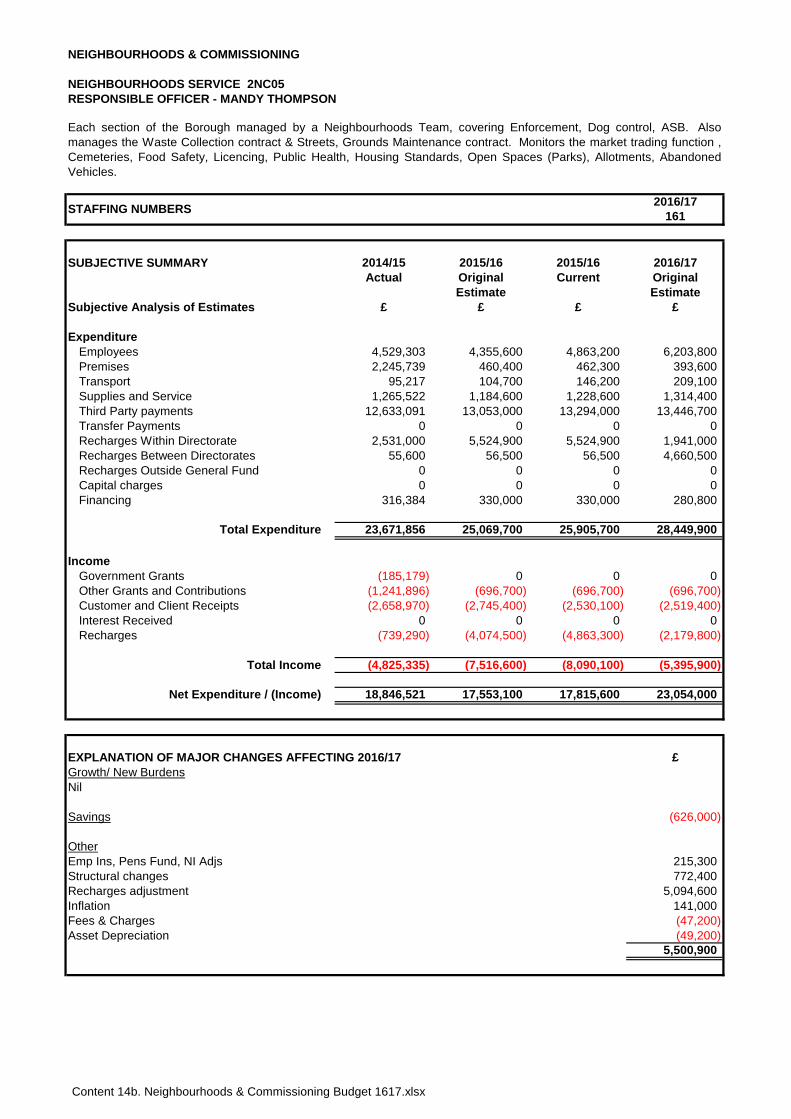
Content 14b. Neighbourhoods & Commissioning Budget 1617.xlsx
NEIGHBOURHOODS & COMMISSIONING
NEIGHBOURHOODS SERVICE 2NC05RESPONSIBLE OFFICER - MANDY THOMPSON
2016/17161
SUBJECTIVE SUMMARY 2014/15 2015/16 2015/16 2016/17Actual Original Current Original
Estimate EstimateSubjective Analysis of Estimates £ £ £ £
ExpenditureEmployees 4,529,303 4,355,600 4,863,200 6,203,800Premises 2,245,739 460,400 462,300 393,600Transport 95,217 104,700 146,200 209,100Supplies and Service 1,265,522 1,184,600 1,228,600 1,314,400Third Party payments 12,633,091 13,053,000 13,294,000 13,446,700Transfer Payments 0 0 0 0Recharges Within Directorate 2,531,000 5,524,900 5,524,900 1,941,000Recharges Between Directorates 55,600 56,500 56,500 4,660,500Recharges Outside General Fund 0 0 0 0Capital charges 0 0 0 0Financing 316,384 330,000 330,000 280,800
Total Expenditure 23,671,856 25,069,700 25,905,700 28,449,900
IncomeGovernment Grants (185,179) 0 0 0Other Grants and Contributions (1,241,896) (696,700) (696,700) (696,700)Customer and Client Receipts (2,658,970) (2,745,400) (2,530,100) (2,519,400)Interest Received 0 0 0 0Recharges (739,290) (4,074,500) (4,863,300) (2,179,800)
Total Income (4,825,335) (7,516,600) (8,090,100) (5,395,900)
Net Expenditure / (Income) 18,846,521 17,553,100 17,815,600 23,054,000
£Growth/ New Burdens
Savings (626,000)
OtherEmp Ins, Pens Fund, NI Adjs 215,300Structural changes 772,400
5,094,600Inflation 141,000
(47,200)(49,200)
5,500,900
Fees & ChargesAsset Depreciation
Each section of the Borough managed by a Neighbourhoods Team, covering Enforcement, Dog control, ASB. Alsomanages the Waste Collection contract & Streets, Grounds Maintenance contract. Monitors the market trading function ,Cemeteries, Food Safety, Licencing, Public Health, Housing Standards, Open Spaces (Parks), Allotments, AbandonedVehicles.
STAFFING NUMBERS
EXPLANATION OF MAJOR CHANGES AFFECTING 2016/17
Nil
Recharges adjustment
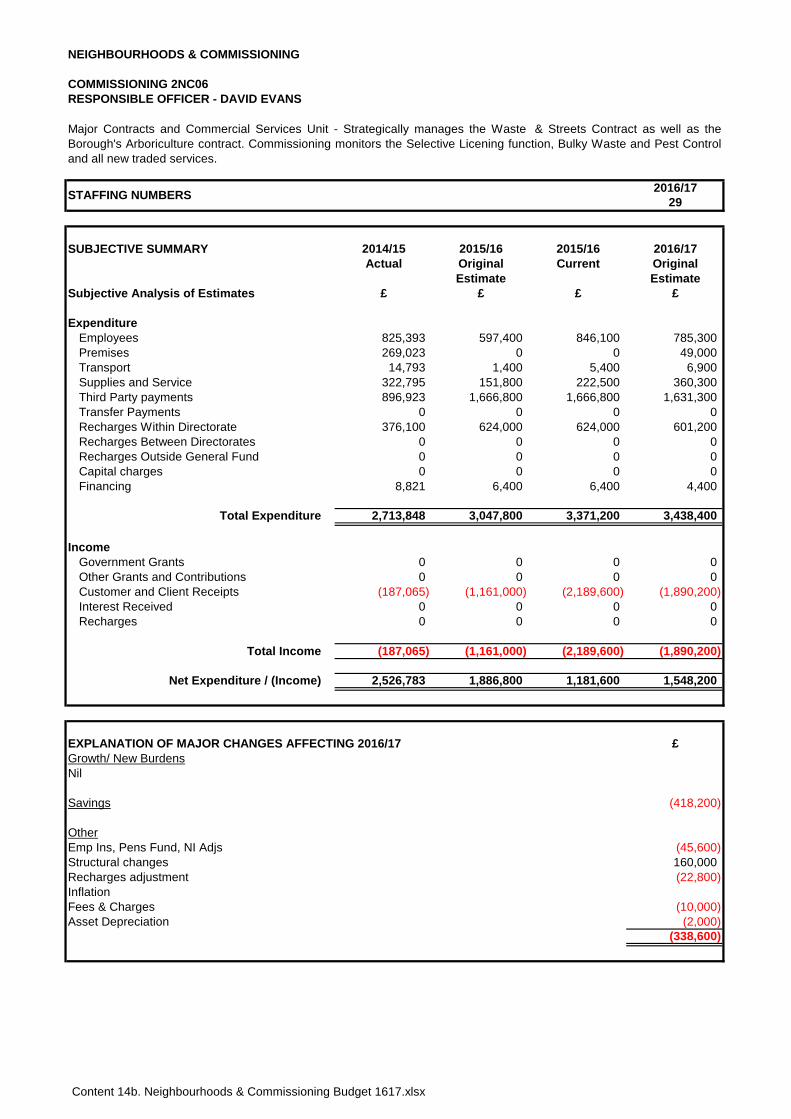
Content 14b. Neighbourhoods & Commissioning Budget 1617.xlsx
NEIGHBOURHOODS & COMMISSIONING
COMMISSIONING 2NC06RESPONSIBLE OFFICER - DAVID EVANS
2016/1729
SUBJECTIVE SUMMARY 2014/15 2015/16 2015/16 2016/17Actual Original Current Original
Estimate EstimateSubjective Analysis of Estimates £ £ £ £
ExpenditureEmployees 825,393 597,400 846,100 785,300Premises 269,023 0 0 49,000Transport 14,793 1,400 5,400 6,900Supplies and Service 322,795 151,800 222,500 360,300Third Party payments 896,923 1,666,800 1,666,800 1,631,300Transfer Payments 0 0 0 0Recharges Within Directorate 376,100 624,000 624,000 601,200Recharges Between Directorates 0 0 0 0Recharges Outside General Fund 0 0 0 0Capital charges 0 0 0 0Financing 8,821 6,400 6,400 4,400
Total Expenditure 2,713,848 3,047,800 3,371,200 3,438,400
IncomeGovernment Grants 0 0 0 0Other Grants and Contributions 0 0 0 0Customer and Client Receipts (187,065) (1,161,000) (2,189,600) (1,890,200)Interest Received 0 0 0 0Recharges 0 0 0 0
Total Income (187,065) (1,161,000) (2,189,600) (1,890,200)
Net Expenditure / (Income) 2,526,783 1,886,800 1,181,600 1,548,200
£Growth/ New Burdens
Savings (418,200)
OtherEmp Ins, Pens Fund, NI Adjs (45,600)Structural changes 160,000
(22,800)Inflation
(10,000)(2,000)
(338,600)
Fees & ChargesAsset Depreciation
Major Contracts and Commercial Services Unit - Strategically manages the Waste & Streets Contract as well as theBorough's Arboriculture contract. Commissioning monitors the Selective Licening function, Bulky Waste and Pest Controland all new traded services.
STAFFING NUMBERS
EXPLANATION OF MAJOR CHANGES AFFECTING 2016/17
Nil
Recharges adjustment
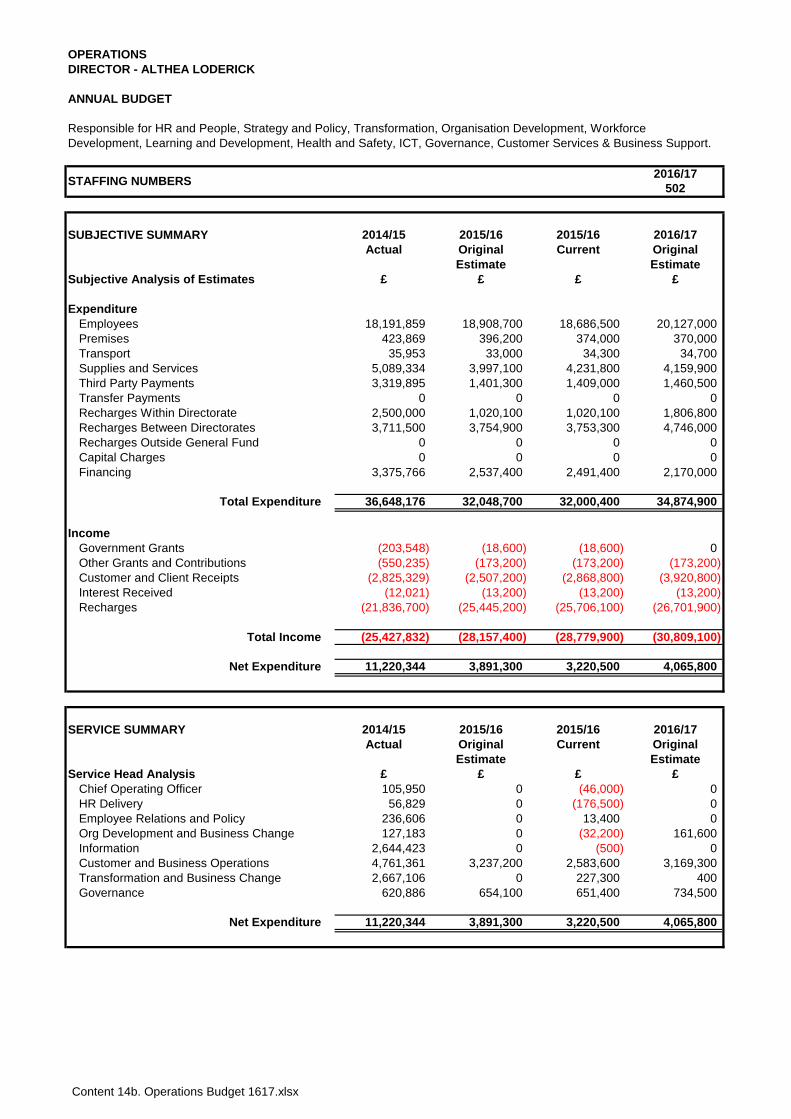
Content 14b. Operations Budget 1617.xlsx
OPERATIONSDIRECTOR - ALTHEA LODERICK
ANNUAL BUDGET
2016/17502
SUBJECTIVE SUMMARY 2014/15 2015/16 2015/16 2016/17Actual Original Current Original
Estimate EstimateSubjective Analysis of Estimates £ £ £ £
ExpenditureEmployees 18,191,859 18,908,700 18,686,500 20,127,000Premises 423,869 396,200 374,000 370,000Transport 35,953 33,000 34,300 34,700Supplies and Services 5,089,334 3,997,100 4,231,800 4,159,900Third Party Payments 3,319,895 1,401,300 1,409,000 1,460,500Transfer Payments 0 0 0 0Recharges Within Directorate 2,500,000 1,020,100 1,020,100 1,806,800Recharges Between Directorates 3,711,500 3,754,900 3,753,300 4,746,000Recharges Outside General Fund 0 0 0 0Capital Charges 0 0 0 0Financing 3,375,766 2,537,400 2,491,400 2,170,000
Total Expenditure 36,648,176 32,048,700 32,000,400 34,874,900
IncomeGovernment Grants (203,548) (18,600) (18,600) 0Other Grants and Contributions (550,235) (173,200) (173,200) (173,200)Customer and Client Receipts (2,825,329) (2,507,200) (2,868,800) (3,920,800)Interest Received (12,021) (13,200) (13,200) (13,200)Recharges (21,836,700) (25,445,200) (25,706,100) (26,701,900)
Total Income (25,427,832) (28,157,400) (28,779,900) (30,809,100)
Net Expenditure 11,220,344 3,891,300 3,220,500 4,065,800
SERVICE SUMMARY 2014/15 2015/16 2015/16 2016/17Actual Original Current Original
Estimate EstimateService Head Analysis £ £ £ £
Chief Operating Officer 105,950 0 (46,000) 0HR Delivery 56,829 0 (176,500) 0Employee Relations and Policy 236,606 0 13,400 0Org Development and Business Change 127,183 0 (32,200) 161,600Information 2,644,423 0 (500) 0Customer and Business Operations 4,761,361 3,237,200 2,583,600 3,169,300Transformation and Business Change 2,667,106 0 227,300 400Governance 620,886 654,100 651,400 734,500
Net Expenditure 11,220,344 3,891,300 3,220,500 4,065,800
Responsible for HR and People, Strategy and Policy, Transformation, Organisation Development, Workforce Development, Learning and Development, Health and Safety, ICT, Governance, Customer Services & Business Support.
STAFFING NUMBERS
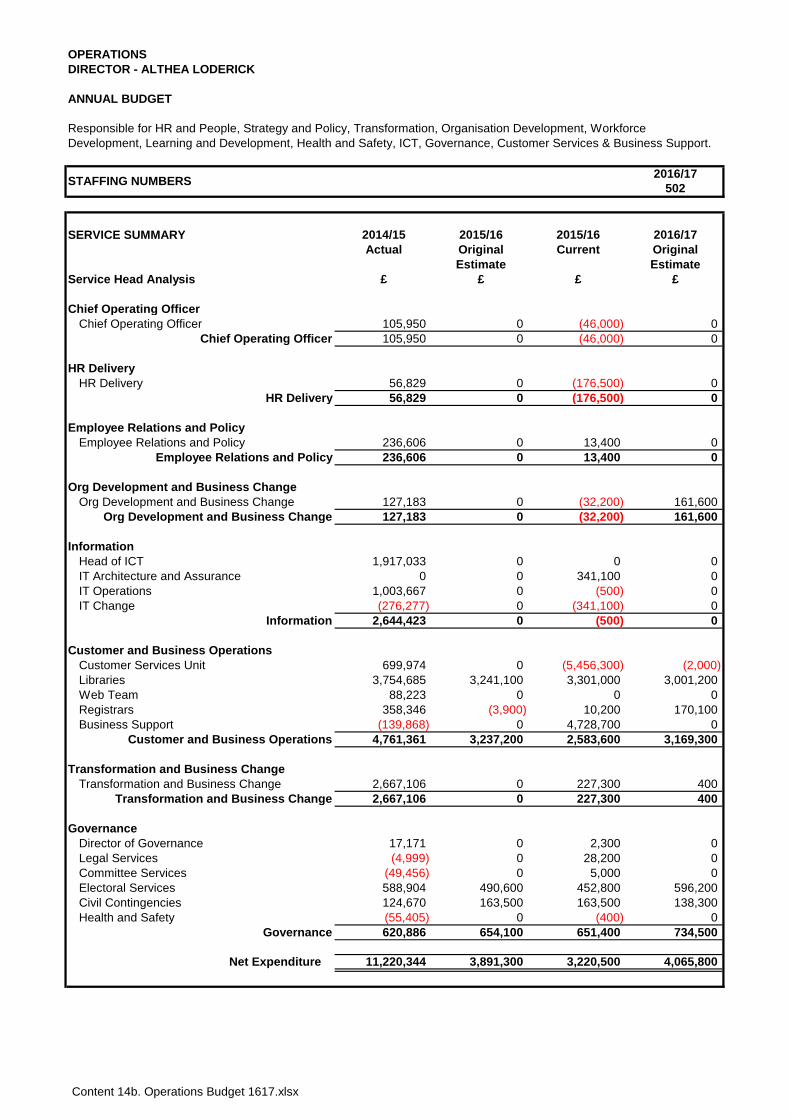
Content 14b. Operations Budget 1617.xlsx
OPERATIONSDIRECTOR - ALTHEA LODERICK
ANNUAL BUDGET
2016/17502
SERVICE SUMMARY 2014/15 2015/16 2015/16 2016/17Actual Original Current Original
Estimate EstimateService Head Analysis £ £ £ £
Chief Operating OfficerChief Operating Officer 105,950 0 (46,000) 0
Chief Operating Officer 105,950 0 (46,000) 0
HR DeliveryHR Delivery 56,829 0 (176,500) 0
HR Delivery 56,829 0 (176,500) 0
Employee Relations and PolicyEmployee Relations and Policy 236,606 0 13,400 0
Employee Relations and Policy 236,606 0 13,400 0
Org Development and Business ChangeOrg Development and Business Change 127,183 0 (32,200) 161,600
Org Development and Business Change 127,183 0 (32,200) 161,600
InformationHead of ICT 1,917,033 0 0 0 IT Architecture and Assurance 0 0 341,100 0 IT Operations 1,003,667 0 (500) 0 IT Change (276,277) 0 (341,100) 0
Information 2,644,423 0 (500) 0
Customer and Business OperationsCustomer Services Unit 699,974 0 (5,456,300) (2,000)Libraries 3,754,685 3,241,100 3,301,000 3,001,200 Web Team 88,223 0 0 0 Registrars 358,346 (3,900) 10,200 170,100 Business Support (139,868) 0 4,728,700 0
Customer and Business Operations 4,761,361 3,237,200 2,583,600 3,169,300
Transformation and Business ChangeTransformation and Business Change 2,667,106 0 227,300 400
Transformation and Business Change 2,667,106 0 227,300 400
GovernanceDirector of Governance 17,171 0 2,300 0 Legal Services (4,999) 0 28,200 0 Committee Services (49,456) 0 5,000 0 Electoral Services 588,904 490,600 452,800 596,200 Civil Contingencies 124,670 163,500 163,500 138,300 Health and Safety (55,405) 0 (400) 0
Governance 620,886 654,100 651,400 734,500
Net Expenditure 11,220,344 3,891,300 3,220,500 4,065,800
Responsible for HR and People, Strategy and Policy, Transformation, Organisation Development, Workforce Development, Learning and Development, Health and Safety, ICT, Governance, Customer Services & Business Support.
STAFFING NUMBERS
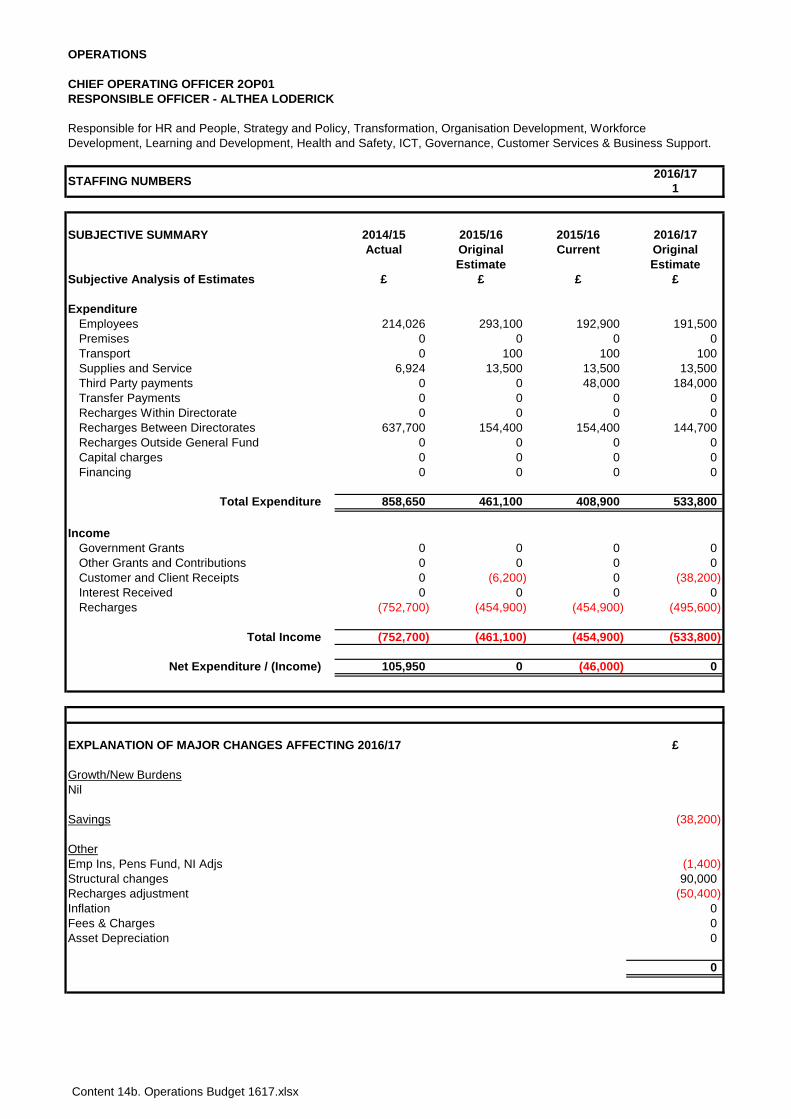
Content 14b. Operations Budget 1617.xlsx
OPERATIONS
CHIEF OPERATING OFFICER 2OP01RESPONSIBLE OFFICER - ALTHEA LODERICK
2016/171
SUBJECTIVE SUMMARY 2014/15 2015/16 2015/16 2016/17Actual Original Current Original
Estimate EstimateSubjective Analysis of Estimates £ £ £ £
ExpenditureEmployees 214,026 293,100 192,900 191,500Premises 0 0 0 0Transport 0 100 100 100Supplies and Service 6,924 13,500 13,500 13,500Third Party payments 0 0 48,000 184,000Transfer Payments 0 0 0 0Recharges Within Directorate 0 0 0 0Recharges Between Directorates 637,700 154,400 154,400 144,700Recharges Outside General Fund 0 0 0 0Capital charges 0 0 0 0Financing 0 0 0 0
Total Expenditure 858,650 461,100 408,900 533,800
IncomeGovernment Grants 0 0 0 0Other Grants and Contributions 0 0 0 0Customer and Client Receipts 0 (6,200) 0 (38,200)Interest Received 0 0 0 0Recharges (752,700) (454,900) (454,900) (495,600)
Total Income (752,700) (461,100) (454,900) (533,800)
Net Expenditure / (Income) 105,950 0 (46,000) 0
£
Growth/New BurdensNil
Savings (38,200)
OtherEmp Ins, Pens Fund, NI Adjs (1,400)Structural changes 90,000Recharges adjustment (50,400)Inflation 0Fees & Charges 0Asset Depreciation 0
0
Responsible for HR and People, Strategy and Policy, Transformation, Organisation Development, Workforce Development, Learning and Development, Health and Safety, ICT, Governance, Customer Services & Business Support.
STAFFING NUMBERS
EXPLANATION OF MAJOR CHANGES AFFECTING 2016/17
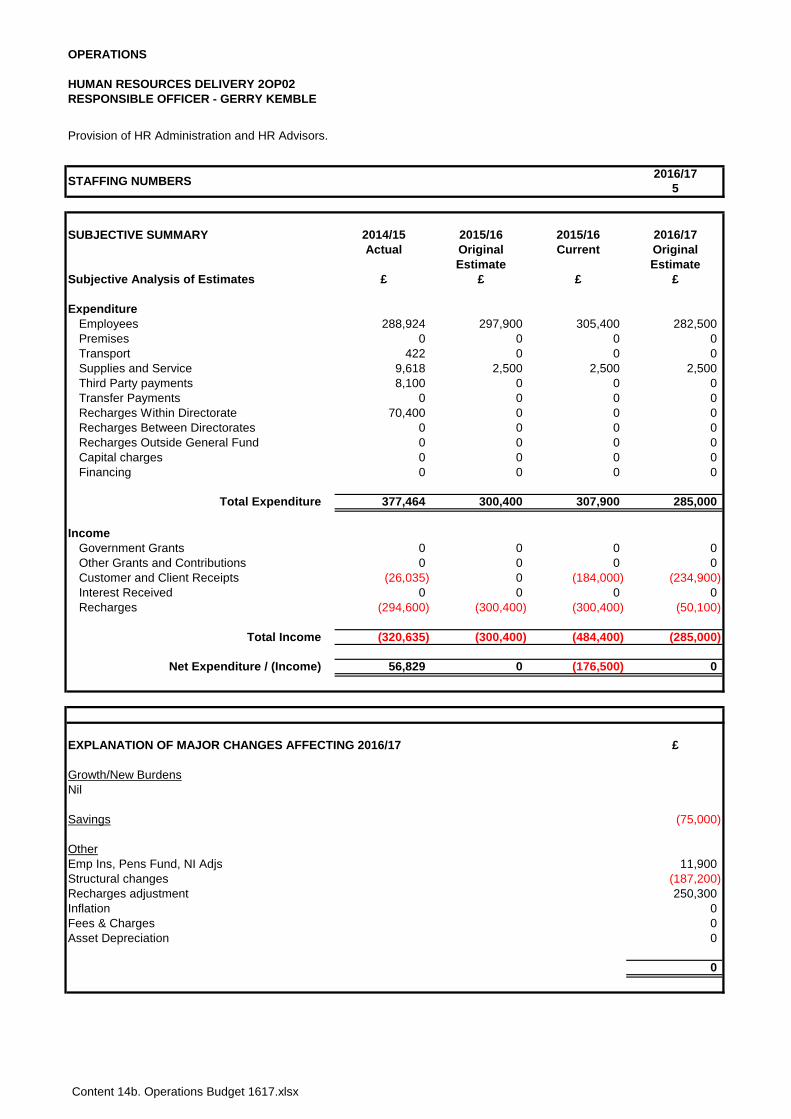
Content 14b. Operations Budget 1617.xlsx
OPERATIONS
HUMAN RESOURCES DELIVERY 2OP02RESPONSIBLE OFFICER - GERRY KEMBLE
2016/175
SUBJECTIVE SUMMARY 2014/15 2015/16 2015/16 2016/17Actual Original Current Original
Estimate EstimateSubjective Analysis of Estimates £ £ £ £
ExpenditureEmployees 288,924 297,900 305,400 282,500Premises 0 0 0 0Transport 422 0 0 0Supplies and Service 9,618 2,500 2,500 2,500Third Party payments 8,100 0 0 0Transfer Payments 0 0 0 0Recharges Within Directorate 70,400 0 0 0Recharges Between Directorates 0 0 0 0Recharges Outside General Fund 0 0 0 0Capital charges 0 0 0 0Financing 0 0 0 0
Total Expenditure 377,464 300,400 307,900 285,000
IncomeGovernment Grants 0 0 0 0Other Grants and Contributions 0 0 0 0Customer and Client Receipts (26,035) 0 (184,000) (234,900)Interest Received 0 0 0 0Recharges (294,600) (300,400) (300,400) (50,100)
Total Income (320,635) (300,400) (484,400) (285,000)
Net Expenditure / (Income) 56,829 0 (176,500) 0
£
Growth/New BurdensNil
Savings (75,000)
OtherEmp Ins, Pens Fund, NI Adjs 11,900Structural changes (187,200)Recharges adjustment 250,300Inflation 0Fees & Charges 0Asset Depreciation 0
0
Provision of HR Administration and HR Advisors.
STAFFING NUMBERS
EXPLANATION OF MAJOR CHANGES AFFECTING 2016/17
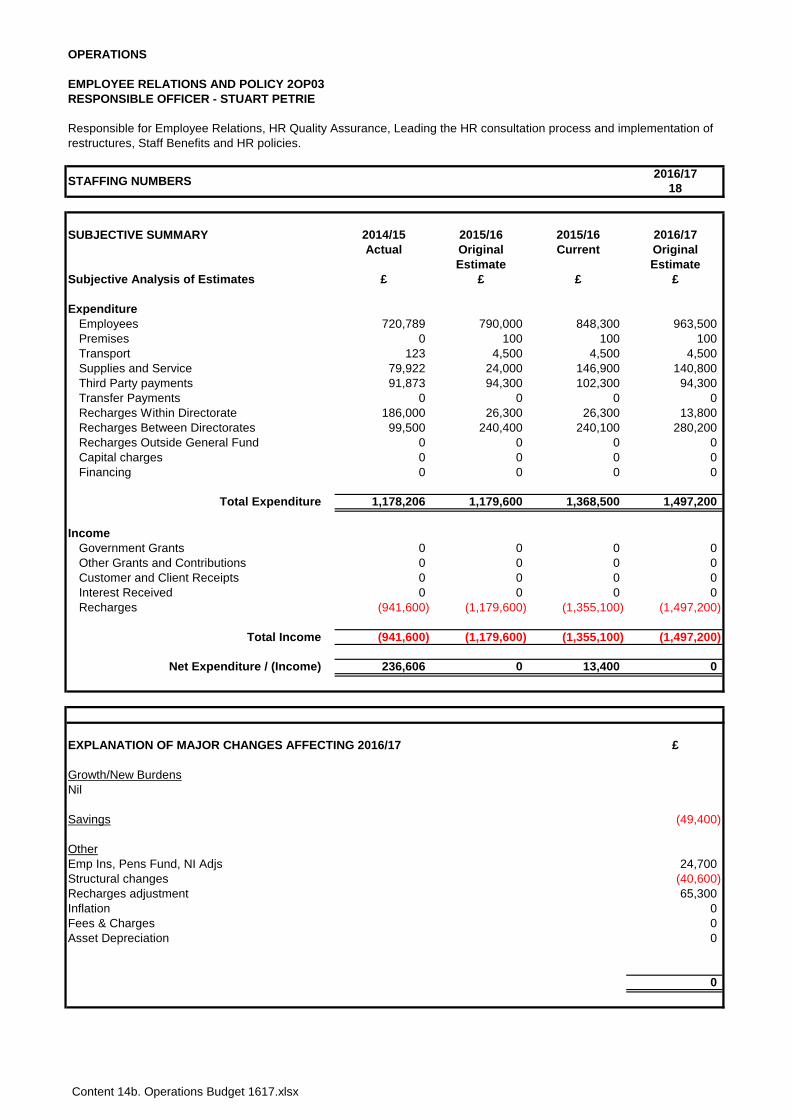
Content 14b. Operations Budget 1617.xlsx
OPERATIONS
EMPLOYEE RELATIONS AND POLICY 2OP03RESPONSIBLE OFFICER - STUART PETRIE
2016/1718
SUBJECTIVE SUMMARY 2014/15 2015/16 2015/16 2016/17Actual Original Current Original
Estimate EstimateSubjective Analysis of Estimates £ £ £ £
ExpenditureEmployees 720,789 790,000 848,300 963,500Premises 0 100 100 100Transport 123 4,500 4,500 4,500Supplies and Service 79,922 24,000 146,900 140,800Third Party payments 91,873 94,300 102,300 94,300Transfer Payments 0 0 0 0Recharges Within Directorate 186,000 26,300 26,300 13,800Recharges Between Directorates 99,500 240,400 240,100 280,200Recharges Outside General Fund 0 0 0 0Capital charges 0 0 0 0Financing 0 0 0 0
Total Expenditure 1,178,206 1,179,600 1,368,500 1,497,200
IncomeGovernment Grants 0 0 0 0Other Grants and Contributions 0 0 0 0Customer and Client Receipts 0 0 0 0Interest Received 0 0 0 0Recharges (941,600) (1,179,600) (1,355,100) (1,497,200)
Total Income (941,600) (1,179,600) (1,355,100) (1,497,200)
Net Expenditure / (Income) 236,606 0 13,400 0
£
Growth/New BurdensNil
Savings (49,400)
OtherEmp Ins, Pens Fund, NI Adjs 24,700Structural changes (40,600)Recharges adjustment 65,300Inflation 0Fees & Charges 0Asset Depreciation 0
0
Responsible for Employee Relations, HR Quality Assurance, Leading the HR consultation process and implementation of restructures, Staff Benefits and HR policies.
STAFFING NUMBERS
EXPLANATION OF MAJOR CHANGES AFFECTING 2016/17
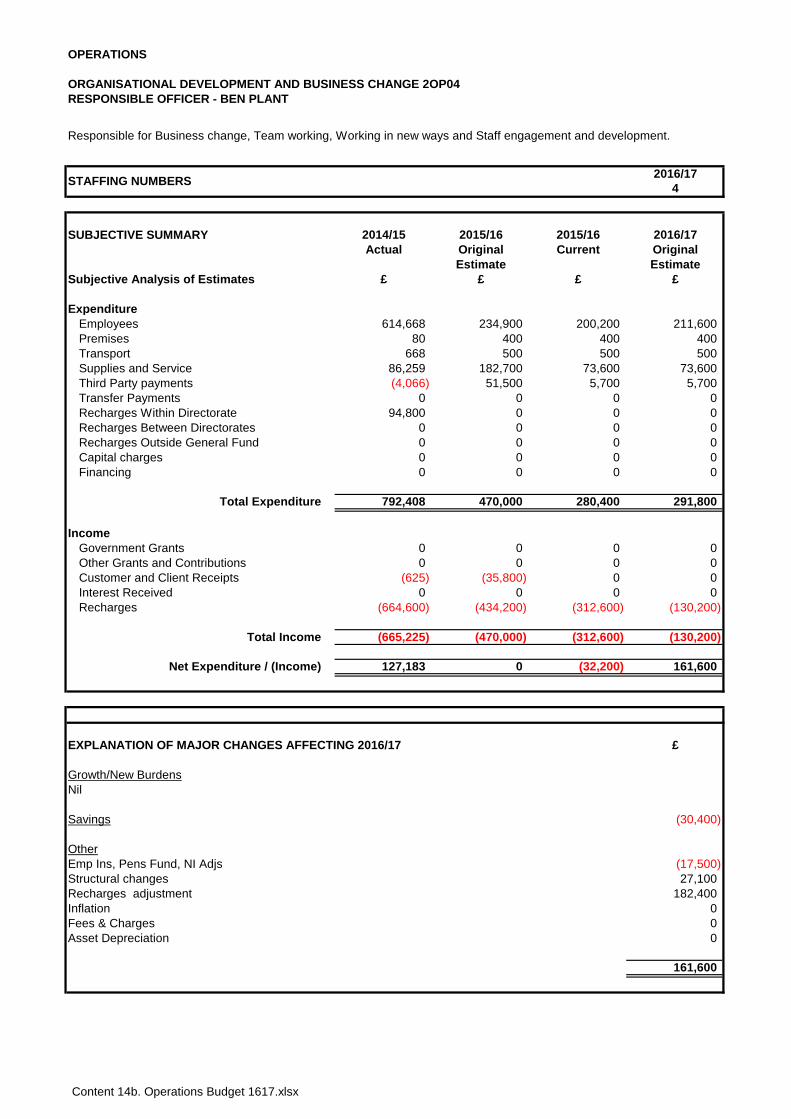
Content 14b. Operations Budget 1617.xlsx
OPERATIONS
ORGANISATIONAL DEVELOPMENT AND BUSINESS CHANGE 2OP04RESPONSIBLE OFFICER - BEN PLANT
2016/174
SUBJECTIVE SUMMARY 2014/15 2015/16 2015/16 2016/17Actual Original Current Original
Estimate EstimateSubjective Analysis of Estimates £ £ £ £
ExpenditureEmployees 614,668 234,900 200,200 211,600Premises 80 400 400 400Transport 668 500 500 500Supplies and Service 86,259 182,700 73,600 73,600Third Party payments (4,066) 51,500 5,700 5,700Transfer Payments 0 0 0 0Recharges Within Directorate 94,800 0 0 0Recharges Between Directorates 0 0 0 0Recharges Outside General Fund 0 0 0 0Capital charges 0 0 0 0Financing 0 0 0 0
Total Expenditure 792,408 470,000 280,400 291,800
IncomeGovernment Grants 0 0 0 0Other Grants and Contributions 0 0 0 0Customer and Client Receipts (625) (35,800) 0 0Interest Received 0 0 0 0Recharges (664,600) (434,200) (312,600) (130,200)
Total Income (665,225) (470,000) (312,600) (130,200)
Net Expenditure / (Income) 127,183 0 (32,200) 161,600
£
Growth/New BurdensNil
Savings (30,400)
OtherEmp Ins, Pens Fund, NI Adjs (17,500)Structural changes 27,100Recharges adjustment 182,400Inflation 0Fees & Charges 0Asset Depreciation 0
161,600
Responsible for Business change, Team working, Working in new ways and Staff engagement and development.
STAFFING NUMBERS
EXPLANATION OF MAJOR CHANGES AFFECTING 2016/17
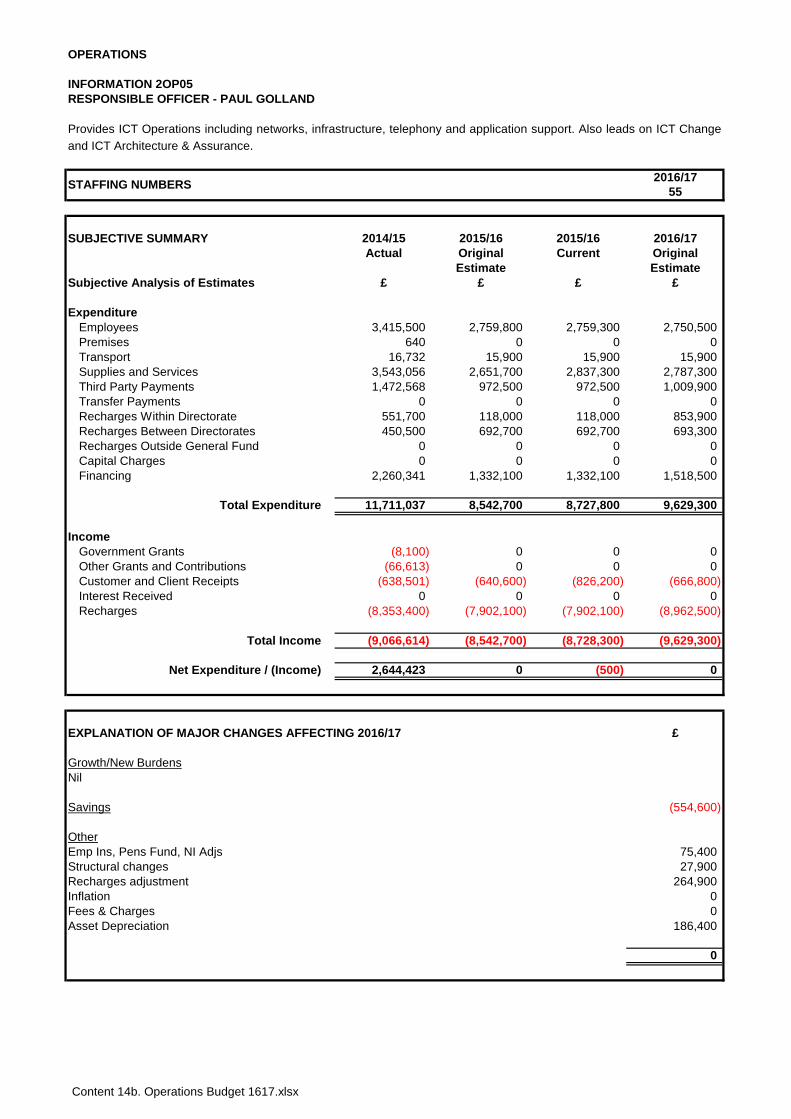
Content 14b. Operations Budget 1617.xlsx
OPERATIONS
INFORMATION 2OP05RESPONSIBLE OFFICER - PAUL GOLLAND
2016/1755
SUBJECTIVE SUMMARY 2014/15 2015/16 2015/16 2016/17Actual Original Current Original
Estimate EstimateSubjective Analysis of Estimates £ £ £ £
ExpenditureEmployees 3,415,500 2,759,800 2,759,300 2,750,500Premises 640 0 0 0Transport 16,732 15,900 15,900 15,900Supplies and Services 3,543,056 2,651,700 2,837,300 2,787,300Third Party Payments 1,472,568 972,500 972,500 1,009,900Transfer Payments 0 0 0 0Recharges Within Directorate 551,700 118,000 118,000 853,900Recharges Between Directorates 450,500 692,700 692,700 693,300Recharges Outside General Fund 0 0 0 0Capital Charges 0 0 0 0Financing 2,260,341 1,332,100 1,332,100 1,518,500
Total Expenditure 11,711,037 8,542,700 8,727,800 9,629,300
IncomeGovernment Grants (8,100) 0 0 0Other Grants and Contributions (66,613) 0 0 0Customer and Client Receipts (638,501) (640,600) (826,200) (666,800)Interest Received 0 0 0 0Recharges (8,353,400) (7,902,100) (7,902,100) (8,962,500)
Total Income (9,066,614) (8,542,700) (8,728,300) (9,629,300)
Net Expenditure / (Income) 2,644,423 0 (500) 0
£
Growth/New BurdensNil
Savings (554,600)
OtherEmp Ins, Pens Fund, NI Adjs 75,400Structural changes 27,900Recharges adjustment 264,900Inflation 0Fees & Charges 0Asset Depreciation 186,400
0
Provides ICT Operations including networks, infrastructure, telephony and application support. Also leads on ICT Changeand ICT Architecture & Assurance.
STAFFING NUMBERS
EXPLANATION OF MAJOR CHANGES AFFECTING 2016/17
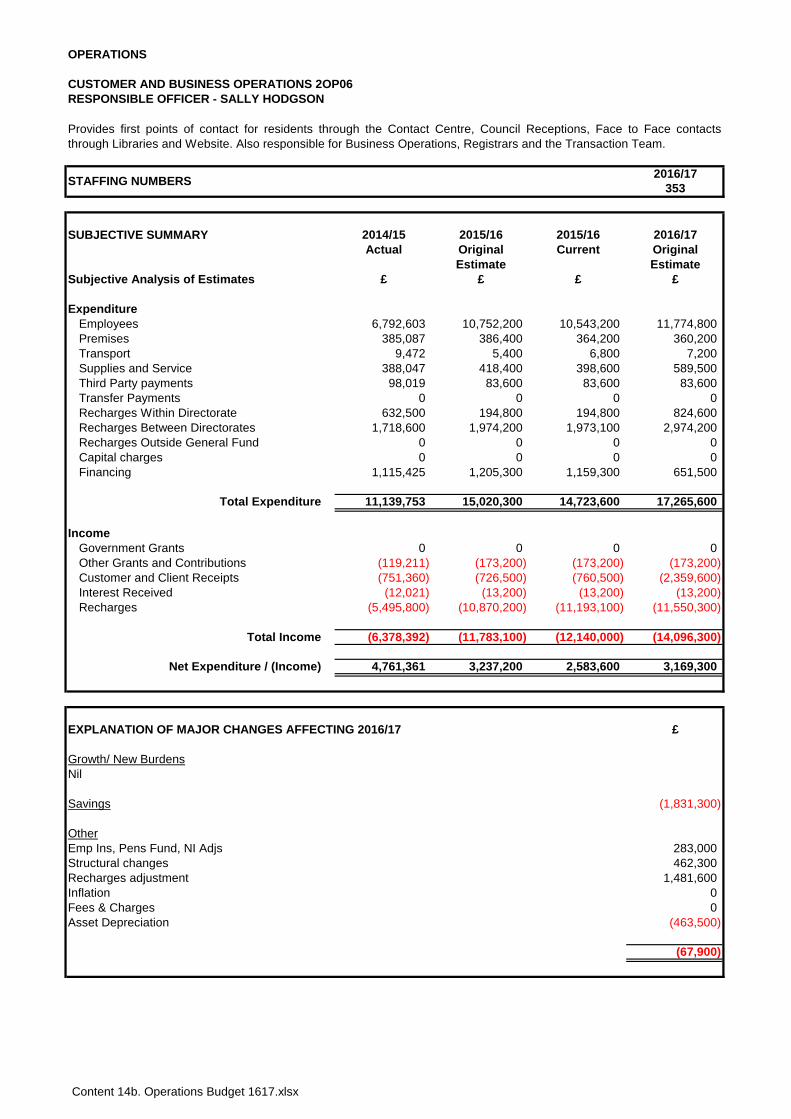
Content 14b. Operations Budget 1617.xlsx
OPERATIONS
CUSTOMER AND BUSINESS OPERATIONS 2OP06RESPONSIBLE OFFICER - SALLY HODGSON
2016/17353
SUBJECTIVE SUMMARY 2014/15 2015/16 2015/16 2016/17Actual Original Current Original
Estimate EstimateSubjective Analysis of Estimates £ £ £ £
ExpenditureEmployees 6,792,603 10,752,200 10,543,200 11,774,800Premises 385,087 386,400 364,200 360,200Transport 9,472 5,400 6,800 7,200Supplies and Service 388,047 418,400 398,600 589,500Third Party payments 98,019 83,600 83,600 83,600Transfer Payments 0 0 0 0Recharges Within Directorate 632,500 194,800 194,800 824,600Recharges Between Directorates 1,718,600 1,974,200 1,973,100 2,974,200Recharges Outside General Fund 0 0 0 0Capital charges 0 0 0 0Financing 1,115,425 1,205,300 1,159,300 651,500
Total Expenditure 11,139,753 15,020,300 14,723,600 17,265,600
IncomeGovernment Grants 0 0 0 0Other Grants and Contributions (119,211) (173,200) (173,200) (173,200)Customer and Client Receipts (751,360) (726,500) (760,500) (2,359,600)Interest Received (12,021) (13,200) (13,200) (13,200)Recharges (5,495,800) (10,870,200) (11,193,100) (11,550,300)
Total Income (6,378,392) (11,783,100) (12,140,000) (14,096,300)
Net Expenditure / (Income) 4,761,361 3,237,200 2,583,600 3,169,300
£
Growth/ New Burdens
(1,831,300)
OtherEmp Ins, Pens Fund, NI Adjs 283,000Structural changes 462,300Recharges adjustment 1,481,600Inflation 0Fees & Charges 0Asset Depreciation (463,500)
(67,900)
Savings
Provides first points of contact for residents through the Contact Centre, Council Receptions, Face to Face contactsthrough Libraries and Website. Also responsible for Business Operations, Registrars and the Transaction Team.
STAFFING NUMBERS
EXPLANATION OF MAJOR CHANGES AFFECTING 2016/17
Nil
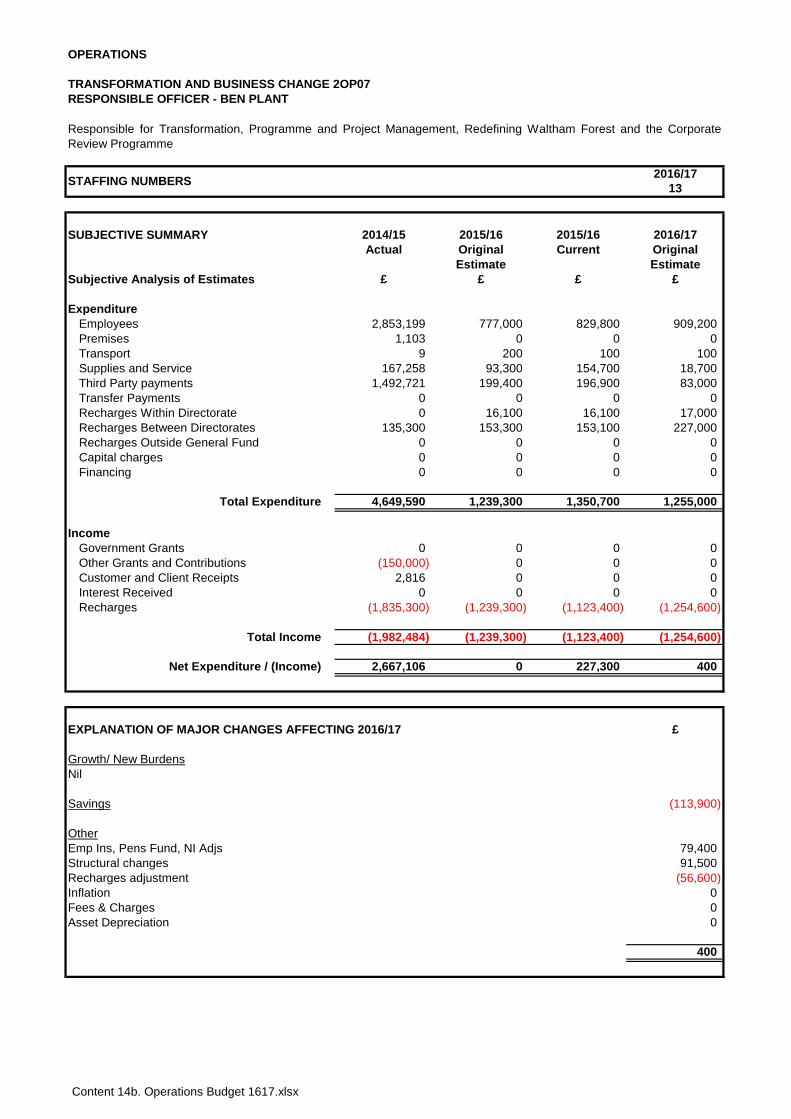
Content 14b. Operations Budget 1617.xlsx
OPERATIONS
TRANSFORMATION AND BUSINESS CHANGE 2OP07RESPONSIBLE OFFICER - BEN PLANT
2016/1713
SUBJECTIVE SUMMARY 2014/15 2015/16 2015/16 2016/17Actual Original Current Original
Estimate EstimateSubjective Analysis of Estimates £ £ £ £
ExpenditureEmployees 2,853,199 777,000 829,800 909,200Premises 1,103 0 0 0Transport 9 200 100 100Supplies and Service 167,258 93,300 154,700 18,700Third Party payments 1,492,721 199,400 196,900 83,000Transfer Payments 0 0 0 0Recharges Within Directorate 0 16,100 16,100 17,000Recharges Between Directorates 135,300 153,300 153,100 227,000Recharges Outside General Fund 0 0 0 0Capital charges 0 0 0 0Financing 0 0 0 0
Total Expenditure 4,649,590 1,239,300 1,350,700 1,255,000
IncomeGovernment Grants 0 0 0 0Other Grants and Contributions (150,000) 0 0 0Customer and Client Receipts 2,816 0 0 0Interest Received 0 0 0 0Recharges (1,835,300) (1,239,300) (1,123,400) (1,254,600)
Total Income (1,982,484) (1,239,300) (1,123,400) (1,254,600)
Net Expenditure / (Income) 2,667,106 0 227,300 400
£
Growth/ New Burdens
(113,900)
Emp Ins, Pens Fund, NI Adjs 79,400Structural changes 91,500Recharges adjustment (56,600)Inflation 0Fees & Charges 0Asset Depreciation 0
400
Savings
Other
Responsible for Transformation, Programme and Project Management, Redefining Waltham Forest and the CorporateReview Programme
STAFFING NUMBERS
EXPLANATION OF MAJOR CHANGES AFFECTING 2016/17
Nil
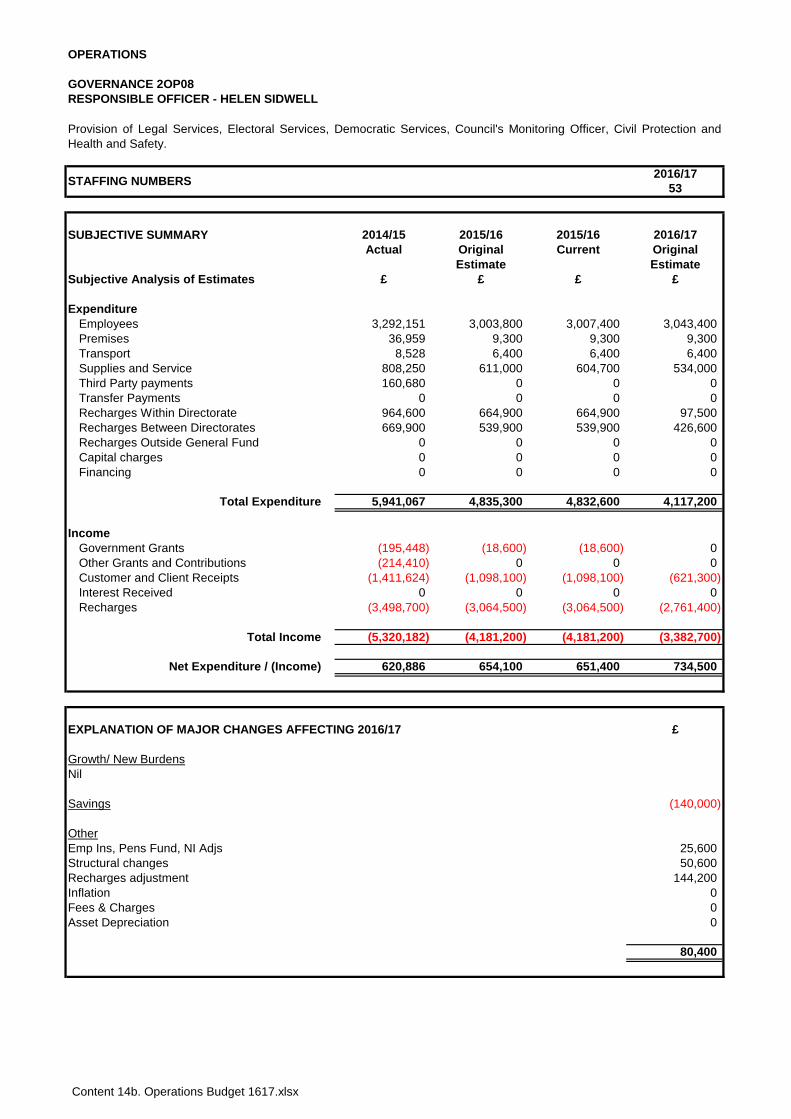
Content 14b. Operations Budget 1617.xlsx
OPERATIONS
GOVERNANCE 2OP08RESPONSIBLE OFFICER - HELEN SIDWELL
2016/1753
SUBJECTIVE SUMMARY 2014/15 2015/16 2015/16 2016/17Actual Original Current Original
Estimate EstimateSubjective Analysis of Estimates £ £ £ £
ExpenditureEmployees 3,292,151 3,003,800 3,007,400 3,043,400Premises 36,959 9,300 9,300 9,300Transport 8,528 6,400 6,400 6,400Supplies and Service 808,250 611,000 604,700 534,000Third Party payments 160,680 0 0 0Transfer Payments 0 0 0 0Recharges Within Directorate 964,600 664,900 664,900 97,500Recharges Between Directorates 669,900 539,900 539,900 426,600Recharges Outside General Fund 0 0 0 0Capital charges 0 0 0 0Financing 0 0 0 0
Total Expenditure 5,941,067 4,835,300 4,832,600 4,117,200
IncomeGovernment Grants (195,448) (18,600) (18,600) 0Other Grants and Contributions (214,410) 0 0 0Customer and Client Receipts (1,411,624) (1,098,100) (1,098,100) (621,300)Interest Received 0 0 0 0Recharges (3,498,700) (3,064,500) (3,064,500) (2,761,400)
Total Income (5,320,182) (4,181,200) (4,181,200) (3,382,700)
Net Expenditure / (Income) 620,886 654,100 651,400 734,500
£
Growth/ New Burdens
(140,000)
OtherEmp Ins, Pens Fund, NI Adjs 25,600Structural changes 50,600Recharges adjustment 144,200Inflation 0Fees & Charges 0Asset Depreciation 0
80,400
Savings
Provision of Legal Services, Electoral Services, Democratic Services, Council's Monitoring Officer, Civil Protection andHealth and Safety.
STAFFING NUMBERS
EXPLANATION OF MAJOR CHANGES AFFECTING 2016/17
Nil
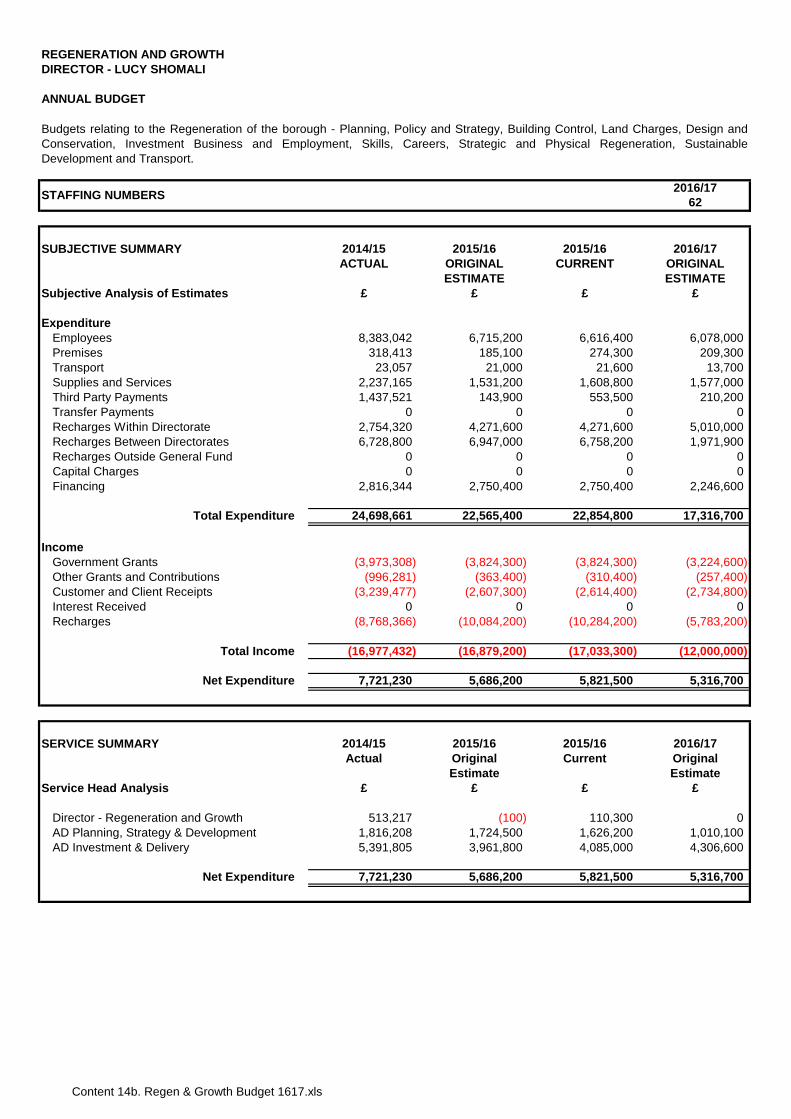
Content 14b. Regen & Growth Budget 1617.xls
REGENERATION AND GROWTHDIRECTOR - LUCY SHOMALI
ANNUAL BUDGET
2016/1762
SUBJECTIVE SUMMARY 2014/15 2015/16 2015/16 2016/17ACTUAL ORIGINAL CURRENT ORIGINAL
ESTIMATE ESTIMATESubjective Analysis of Estimates £ £ £ £
ExpenditureEmployees 8,383,042 6,715,200 6,616,400 6,078,000Premises 318,413 185,100 274,300 209,300Transport 23,057 21,000 21,600 13,700Supplies and Services 2,237,165 1,531,200 1,608,800 1,577,000Third Party Payments 1,437,521 143,900 553,500 210,200Transfer Payments 0 0 0 0Recharges Within Directorate 2,754,320 4,271,600 4,271,600 5,010,000Recharges Between Directorates 6,728,800 6,947,000 6,758,200 1,971,900Recharges Outside General Fund 0 0 0 0Capital Charges 0 0 0 0Financing 2,816,344 2,750,400 2,750,400 2,246,600
Total Expenditure 24,698,661 22,565,400 22,854,800 17,316,700
IncomeGovernment Grants (3,973,308) (3,824,300) (3,824,300) (3,224,600)Other Grants and Contributions (996,281) (363,400) (310,400) (257,400)Customer and Client Receipts (3,239,477) (2,607,300) (2,614,400) (2,734,800)Interest Received 0 0 0 0Recharges (8,768,366) (10,084,200) (10,284,200) (5,783,200)
Total Income (16,977,432) (16,879,200) (17,033,300) (12,000,000)
Net Expenditure 7,721,230 5,686,200 5,821,500 5,316,700
SERVICE SUMMARY 2014/15 2015/16 2015/16 2016/17Actual Original Current Original
Estimate EstimateService Head Analysis £ £ £ £
Director - Regeneration and Growth 513,217 (100) 110,300 0AD Planning, Strategy & Development 1,816,208 1,724,500 1,626,200 1,010,100AD Investment & Delivery 5,391,805 3,961,800 4,085,000 4,306,600
Net Expenditure 7,721,230 5,686,200 5,821,500 5,316,700
Budgets relating to the Regeneration of the borough - Planning, Policy and Strategy, Building Control, Land Charges, Design andConservation, Investment Business and Employment, Skills, Careers, Strategic and Physical Regeneration, SustainableDevelopment and Transport.
STAFFING NUMBERS
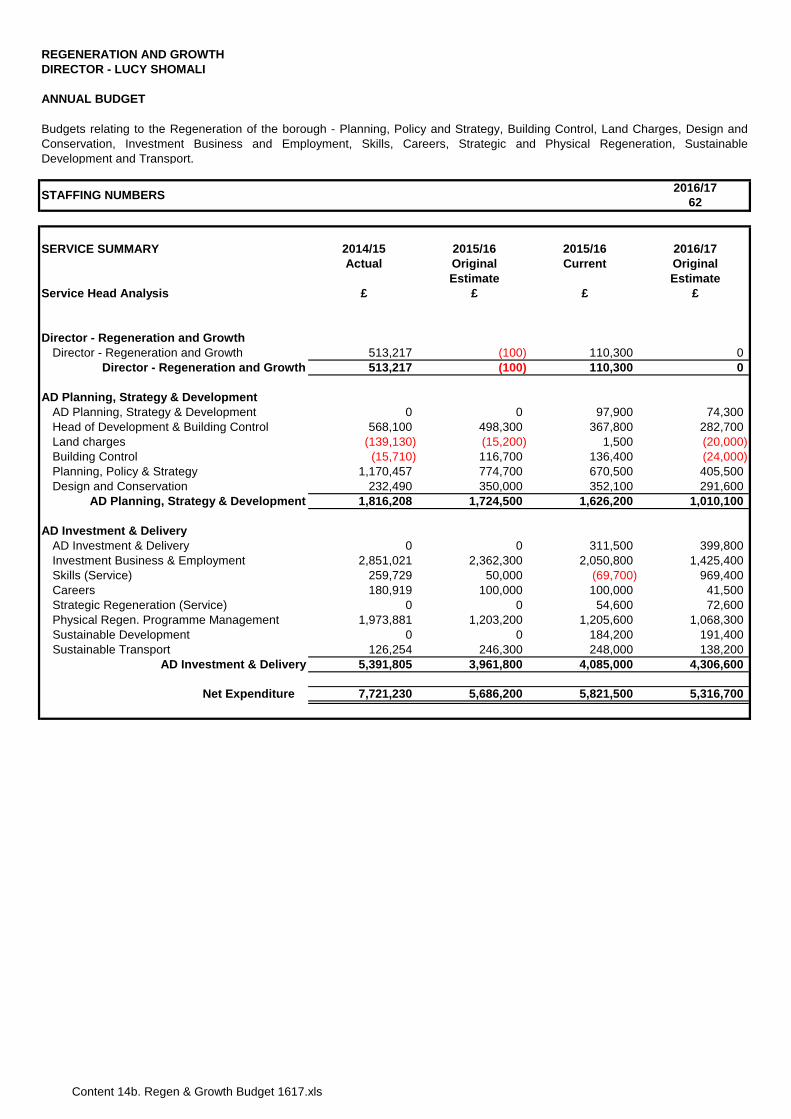
Content 14b. Regen & Growth Budget 1617.xls
REGENERATION AND GROWTHDIRECTOR - LUCY SHOMALI
ANNUAL BUDGET
2016/1762
SERVICE SUMMARY 2014/15 2015/16 2015/16 2016/17Actual Original Current Original
Estimate EstimateService Head Analysis £ £ £ £
Director - Regeneration and GrowthDirector - Regeneration and Growth 513,217 (100) 110,300 0
Director - Regeneration and Growth 513,217 (100) 110,300 0
AD Planning, Strategy & DevelopmentAD Planning, Strategy & Development 0 0 97,900 74,300Head of Development & Building Control 568,100 498,300 367,800 282,700Land charges (139,130) (15,200) 1,500 (20,000)Building Control (15,710) 116,700 136,400 (24,000)Planning, Policy & Strategy 1,170,457 774,700 670,500 405,500Design and Conservation 232,490 350,000 352,100 291,600
AD Planning, Strategy & Development 1,816,208 1,724,500 1,626,200 1,010,100
AD Investment & DeliveryAD Investment & Delivery 0 0 311,500 399,800Investment Business & Employment 2,851,021 2,362,300 2,050,800 1,425,400Skills (Service) 259,729 50,000 (69,700) 969,400Careers 180,919 100,000 100,000 41,500Strategic Regeneration (Service) 0 0 54,600 72,600Physical Regen. Programme Management 1,973,881 1,203,200 1,205,600 1,068,300Sustainable Development 0 0 184,200 191,400Sustainable Transport 126,254 246,300 248,000 138,200
AD Investment & Delivery 5,391,805 3,961,800 4,085,000 4,306,600
Net Expenditure 7,721,230 5,686,200 5,821,500 5,316,700
Budgets relating to the Regeneration of the borough - Planning, Policy and Strategy, Building Control, Land Charges, Design andConservation, Investment Business and Employment, Skills, Careers, Strategic and Physical Regeneration, SustainableDevelopment and Transport.
STAFFING NUMBERS
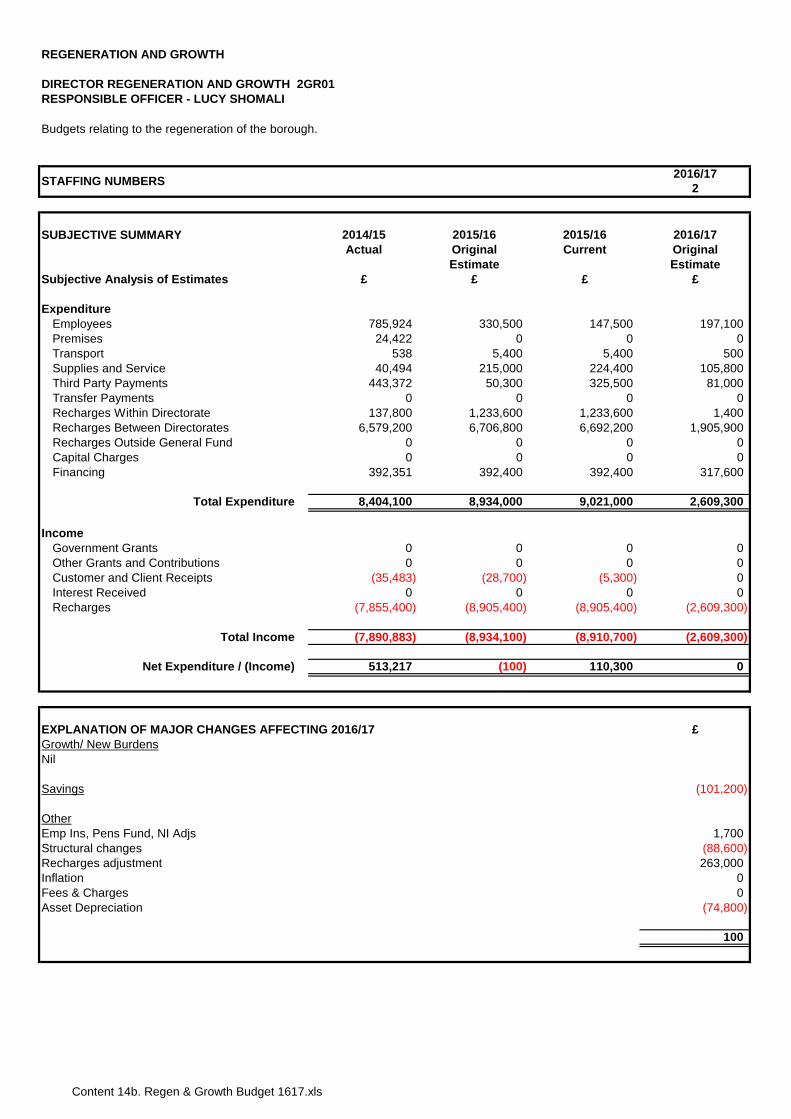
Content 14b. Regen & Growth Budget 1617.xls
REGENERATION AND GROWTH
DIRECTOR REGENERATION AND GROWTH 2GR01
2016/172
SUBJECTIVE SUMMARY 2014/15 2015/16 2015/16 2016/17Actual Original Current Original
Estimate EstimateSubjective Analysis of Estimates £ £ £ £
ExpenditureEmployees 785,924 330,500 147,500 197,100Premises 24,422 0 0 0Transport 538 5,400 5,400 500Supplies and Service 40,494 215,000 224,400 105,800Third Party Payments 443,372 50,300 325,500 81,000Transfer Payments 0 0 0 0Recharges Within Directorate 137,800 1,233,600 1,233,600 1,400Recharges Between Directorates 6,579,200 6,706,800 6,692,200 1,905,900Recharges Outside General Fund 0 0 0 0Capital Charges 0 0 0 0Financing 392,351 392,400 392,400 317,600
Total Expenditure 8,404,100 8,934,000 9,021,000 2,609,300
IncomeGovernment Grants 0 0 0 0Other Grants and Contributions 0 0 0 0Customer and Client Receipts (35,483) (28,700) (5,300) 0Interest Received 0 0 0 0Recharges (7,855,400) (8,905,400) (8,905,400) (2,609,300)
Total Income (7,890,883) (8,934,100) (8,910,700) (2,609,300)
Net Expenditure / (Income) 513,217 (100) 110,300 0
£Growth/ New Burdens
(101,200)
OtherEmp Ins, Pens Fund, NI Adjs 1,700Structural changes (88,600)Recharges adjustment 263,000Inflation 0Fees & Charges 0Asset Depreciation (74,800)
100
EXPLANATION OF MAJOR CHANGES AFFECTING 2016/17
Nil
Savings
RESPONSIBLE OFFICER - LUCY SHOMALI
Budgets relating to the regeneration of the borough.
STAFFING NUMBERS
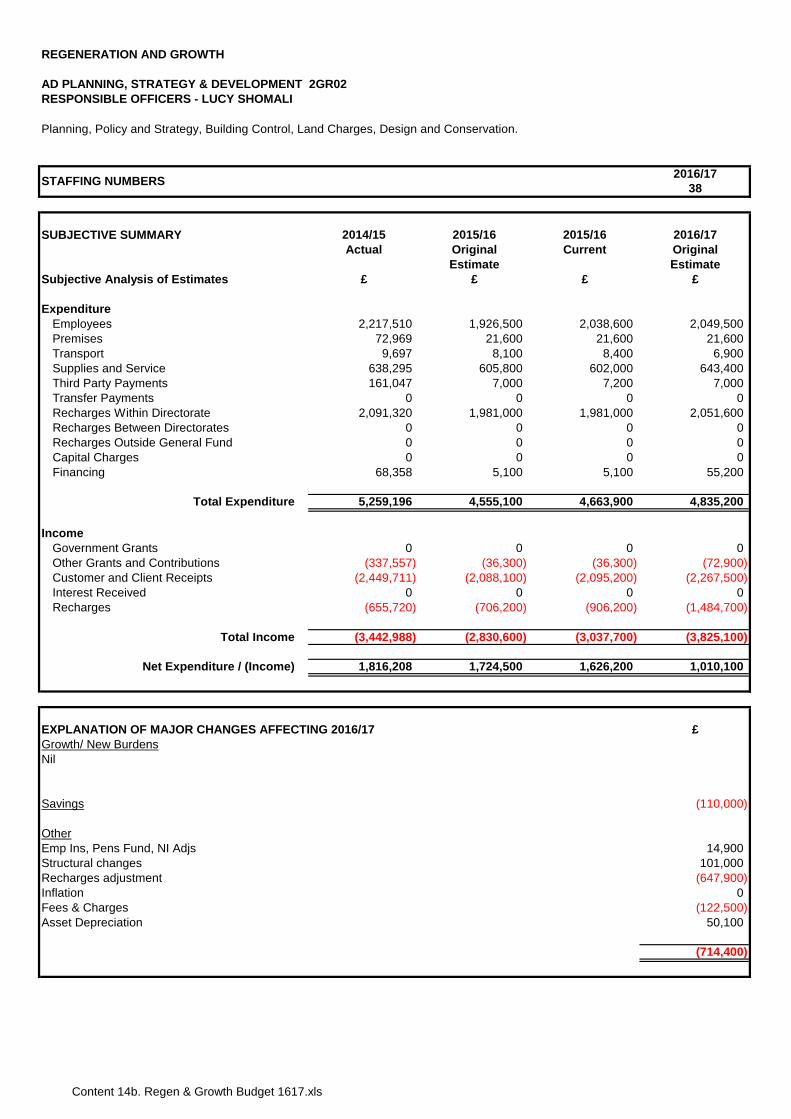
Content 14b. Regen & Growth Budget 1617.xls
REGENERATION AND GROWTH
AD PLANNING, STRATEGY & DEVELOPMENT 2GR02
2016/1738
SUBJECTIVE SUMMARY 2014/15 2015/16 2015/16 2016/17Actual Original Current Original
Estimate EstimateSubjective Analysis of Estimates £ £ £ £
ExpenditureEmployees 2,217,510 1,926,500 2,038,600 2,049,500Premises 72,969 21,600 21,600 21,600Transport 9,697 8,100 8,400 6,900Supplies and Service 638,295 605,800 602,000 643,400Third Party Payments 161,047 7,000 7,200 7,000Transfer Payments 0 0 0 0Recharges Within Directorate 2,091,320 1,981,000 1,981,000 2,051,600Recharges Between Directorates 0 0 0 0Recharges Outside General Fund 0 0 0 0Capital Charges 0 0 0 0Financing 68,358 5,100 5,100 55,200
Total Expenditure 5,259,196 4,555,100 4,663,900 4,835,200
IncomeGovernment Grants 0 0 0 0Other Grants and Contributions (337,557) (36,300) (36,300) (72,900)Customer and Client Receipts (2,449,711) (2,088,100) (2,095,200) (2,267,500)Interest Received 0 0 0 0Recharges (655,720) (706,200) (906,200) (1,484,700)
Total Income (3,442,988) (2,830,600) (3,037,700) (3,825,100)
Net Expenditure / (Income) 1,816,208 1,724,500 1,626,200 1,010,100
£Growth/ New Burdens
(110,000)
OtherEmp Ins, Pens Fund, NI Adjs 14,900Structural changes 101,000Recharges adjustment (647,900)Inflation 0Fees & Charges (122,500)Asset Depreciation 50,100
(714,400)
STAFFING NUMBERS
EXPLANATION OF MAJOR CHANGES AFFECTING 2016/17
Nil
Savings
Planning, Policy and Strategy, Building Control, Land Charges, Design and Conservation.
RESPONSIBLE OFFICERS - LUCY SHOMALI
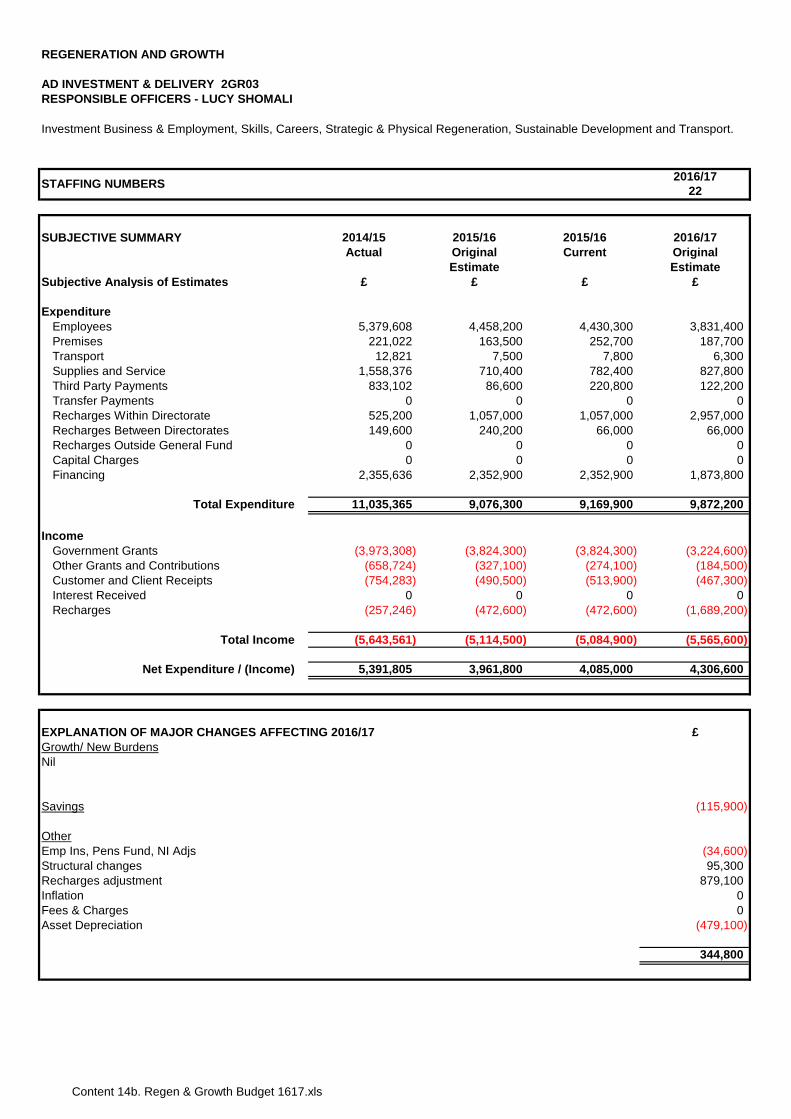
Content 14b. Regen & Growth Budget 1617.xls
REGENERATION AND GROWTH
AD INVESTMENT & DELIVERY 2GR03
2016/1722
SUBJECTIVE SUMMARY 2014/15 2015/16 2015/16 2016/17Actual Original Current Original
Estimate EstimateSubjective Analysis of Estimates £ £ £ £
ExpenditureEmployees 5,379,608 4,458,200 4,430,300 3,831,400Premises 221,022 163,500 252,700 187,700Transport 12,821 7,500 7,800 6,300Supplies and Service 1,558,376 710,400 782,400 827,800Third Party Payments 833,102 86,600 220,800 122,200Transfer Payments 0 0 0 0Recharges Within Directorate 525,200 1,057,000 1,057,000 2,957,000Recharges Between Directorates 149,600 240,200 66,000 66,000Recharges Outside General Fund 0 0 0 0Capital Charges 0 0 0 0Financing 2,355,636 2,352,900 2,352,900 1,873,800
Total Expenditure 11,035,365 9,076,300 9,169,900 9,872,200
IncomeGovernment Grants (3,973,308) (3,824,300) (3,824,300) (3,224,600)Other Grants and Contributions (658,724) (327,100) (274,100) (184,500)Customer and Client Receipts (754,283) (490,500) (513,900) (467,300)Interest Received 0 0 0 0Recharges (257,246) (472,600) (472,600) (1,689,200)
Total Income (5,643,561) (5,114,500) (5,084,900) (5,565,600)
Net Expenditure / (Income) 5,391,805 3,961,800 4,085,000 4,306,600
£Growth/ New Burdens
(115,900)
OtherEmp Ins, Pens Fund, NI Adjs (34,600)Structural changes 95,300Recharges adjustment 879,100Inflation 0Fees & Charges 0Asset Depreciation (479,100)
344,800
RESPONSIBLE OFFICERS - LUCY SHOMALI
Investment Business & Employment, Skills, Careers, Strategic & Physical Regeneration, Sustainable Development and Transport.
STAFFING NUMBERS
EXPLANATION OF MAJOR CHANGES AFFECTING 2016/17
Savings
Nil
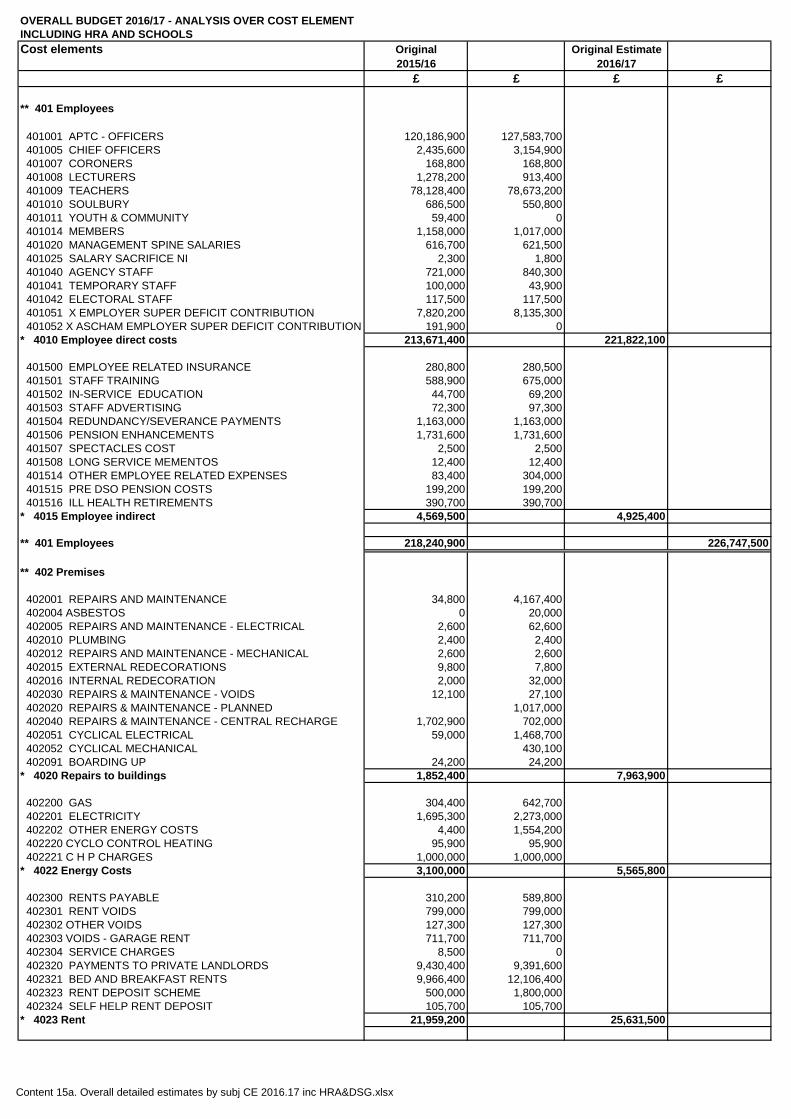
Content 15a. Overall detailed estimates by subj CE 2016.17 inc HRA&DSG.xlsx
OVERALL BUDGET 2016/17 - ANALYSIS OVER COST ELEMENTINCLUDING HRA AND SCHOOLSCost elements Original Original Estimate
2015/16 2016/17£ £ £ £
** 401 Employees
401001 APTC - OFFICERS 120,186,900 127,583,700 401005 CHIEF OFFICERS 2,435,600 3,154,900 401007 CORONERS 168,800 168,800 401008 LECTURERS 1,278,200 913,400 401009 TEACHERS 78,128,400 78,673,200 401010 SOULBURY 686,500 550,800 401011 YOUTH & COMMUNITY 59,400 0 401014 MEMBERS 1,158,000 1,017,000 401020 MANAGEMENT SPINE SALARIES 616,700 621,500 401025 SALARY SACRIFICE NI 2,300 1,800 401040 AGENCY STAFF 721,000 840,300 401041 TEMPORARY STAFF 100,000 43,900 401042 ELECTORAL STAFF 117,500 117,500 401051 X EMPLOYER SUPER DEFICIT CONTRIBUTION 7,820,200 8,135,300 401052 X ASCHAM EMPLOYER SUPER DEFICIT CONTRIBUTION 191,900 0* 4010 Employee direct costs 213,671,400 221,822,100
401500 EMPLOYEE RELATED INSURANCE 280,800 280,500 401501 STAFF TRAINING 588,900 675,000 401502 IN-SERVICE EDUCATION 44,700 69,200 401503 STAFF ADVERTISING 72,300 97,300 401504 REDUNDANCY/SEVERANCE PAYMENTS 1,163,000 1,163,000 401506 PENSION ENHANCEMENTS 1,731,600 1,731,600 401507 SPECTACLES COST 2,500 2,500 401508 LONG SERVICE MEMENTOS 12,400 12,400 401514 OTHER EMPLOYEE RELATED EXPENSES 83,400 304,000 401515 PRE DSO PENSION COSTS 199,200 199,200 401516 ILL HEALTH RETIREMENTS 390,700 390,700* 4015 Employee indirect 4,569,500 4,925,400
** 401 Employees 218,240,900 226,747,500
** 402 Premises
402001 REPAIRS AND MAINTENANCE 34,800 4,167,400 402004 ASBESTOS 0 20,000 402005 REPAIRS AND MAINTENANCE - ELECTRICAL 2,600 62,600 402010 PLUMBING 2,400 2,400 402012 REPAIRS AND MAINTENANCE - MECHANICAL 2,600 2,600 402015 EXTERNAL REDECORATIONS 9,800 7,800 402016 INTERNAL REDECORATION 2,000 32,000 402030 REPAIRS & MAINTENANCE - VOIDS 12,100 27,100 402020 REPAIRS & MAINTENANCE - PLANNED 1,017,000 402040 REPAIRS & MAINTENANCE - CENTRAL RECHARGE 1,702,900 702,000 402051 CYCLICAL ELECTRICAL 59,000 1,468,700 402052 CYCLICAL MECHANICAL 430,100 402091 BOARDING UP 24,200 24,200* 4020 Repairs to buildings 1,852,400 7,963,900
402200 GAS 304,400 642,700 402201 ELECTRICITY 1,695,300 2,273,000 402202 OTHER ENERGY COSTS 4,400 1,554,200 402220 CYCLO CONTROL HEATING 95,900 95,900 402221 C H P CHARGES 1,000,000 1,000,000* 4022 Energy Costs 3,100,000 5,565,800
402300 RENTS PAYABLE 310,200 589,800 402301 RENT VOIDS 799,000 799,000 402302 OTHER VOIDS 127,300 127,300 402303 VOIDS - GARAGE RENT 711,700 711,700 402304 SERVICE CHARGES 8,500 0 402320 PAYMENTS TO PRIVATE LANDLORDS 9,430,400 9,391,600 402321 BED AND BREAKFAST RENTS 9,966,400 12,106,400 402323 RENT DEPOSIT SCHEME 500,000 1,800,000 402324 SELF HELP RENT DEPOSIT 105,700 105,700* 4023 Rent 21,959,200 25,631,500
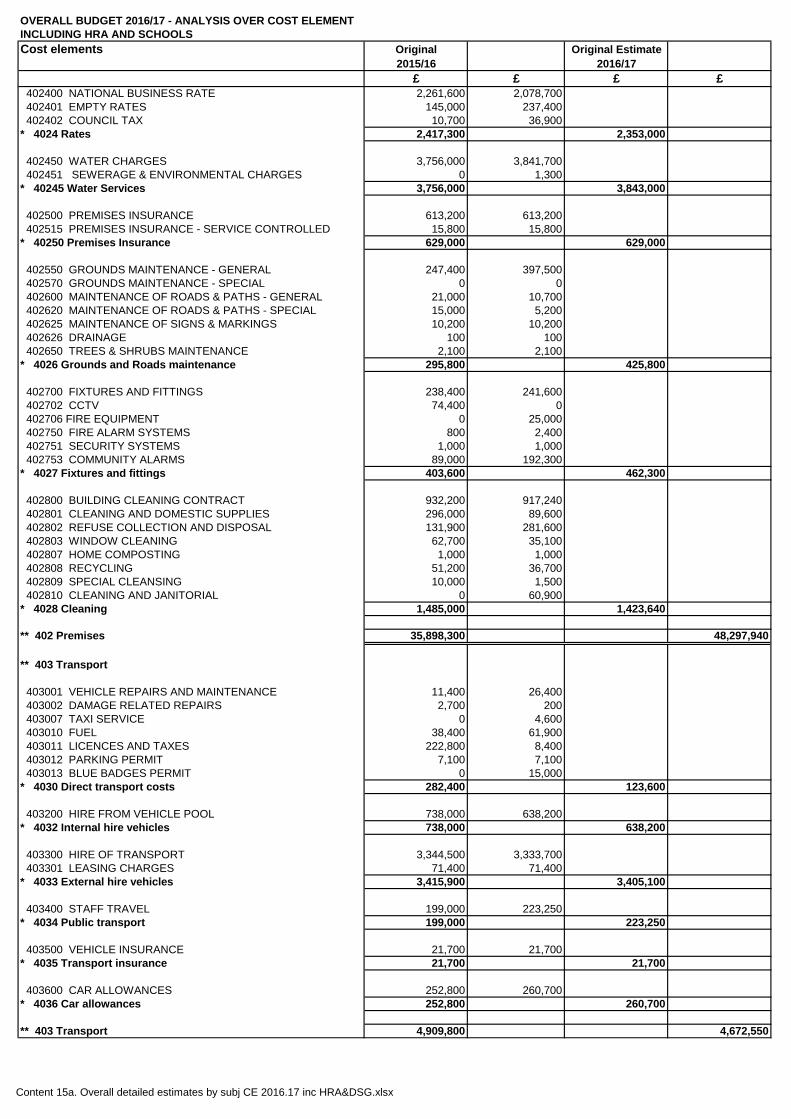
Content 15a. Overall detailed estimates by subj CE 2016.17 inc HRA&DSG.xlsx
OVERALL BUDGET 2016/17 - ANALYSIS OVER COST ELEMENTINCLUDING HRA AND SCHOOLSCost elements Original Original Estimate
2015/16 2016/17£ £ £ £
402400 NATIONAL BUSINESS RATE 2,261,600 2,078,700 402401 EMPTY RATES 145,000 237,400 402402 COUNCIL TAX 10,700 36,900* 4024 Rates 2,417,300 2,353,000
402450 WATER CHARGES 3,756,000 3,841,700 402451 SEWERAGE & ENVIRONMENTAL CHARGES 0 1,300* 40245 Water Services 3,756,000 3,843,000
402500 PREMISES INSURANCE 613,200 613,200 402515 PREMISES INSURANCE - SERVICE CONTROLLED 15,800 15,800* 40250 Premises Insurance 629,000 629,000
402550 GROUNDS MAINTENANCE - GENERAL 247,400 397,500 402570 GROUNDS MAINTENANCE - SPECIAL 0 0 402600 MAINTENANCE OF ROADS & PATHS - GENERAL 21,000 10,700 402620 MAINTENANCE OF ROADS & PATHS - SPECIAL 15,000 5,200 402625 MAINTENANCE OF SIGNS & MARKINGS 10,200 10,200 402626 DRAINAGE 100 100 402650 TREES & SHRUBS MAINTENANCE 2,100 2,100* 4026 Grounds and Roads maintenance 295,800 425,800
402700 FIXTURES AND FITTINGS 238,400 241,600 402702 CCTV 74,400 0 402706 FIRE EQUIPMENT 0 25,000 402750 FIRE ALARM SYSTEMS 800 2,400 402751 SECURITY SYSTEMS 1,000 1,000 402753 COMMUNITY ALARMS 89,000 192,300* 4027 Fixtures and fittings 403,600 462,300
402800 BUILDING CLEANING CONTRACT 932,200 917,240 402801 CLEANING AND DOMESTIC SUPPLIES 296,000 89,600 402802 REFUSE COLLECTION AND DISPOSAL 131,900 281,600 402803 WINDOW CLEANING 62,700 35,100 402807 HOME COMPOSTING 1,000 1,000 402808 RECYCLING 51,200 36,700 402809 SPECIAL CLEANSING 10,000 1,500 402810 CLEANING AND JANITORIAL 0 60,900* 4028 Cleaning 1,485,000 1,423,640
** 402 Premises 35,898,300 48,297,940
** 403 Transport
403001 VEHICLE REPAIRS AND MAINTENANCE 11,400 26,400 403002 DAMAGE RELATED REPAIRS 2,700 200 403007 TAXI SERVICE 0 4,600 403010 FUEL 38,400 61,900 403011 LICENCES AND TAXES 222,800 8,400 403012 PARKING PERMIT 7,100 7,100 403013 BLUE BADGES PERMIT 0 15,000* 4030 Direct transport costs 282,400 123,600
403200 HIRE FROM VEHICLE POOL 738,000 638,200* 4032 Internal hire vehicles 738,000 638,200
403300 HIRE OF TRANSPORT 3,344,500 3,333,700 403301 LEASING CHARGES 71,400 71,400* 4033 External hire vehicles 3,415,900 3,405,100
403400 STAFF TRAVEL 199,000 223,250* 4034 Public transport 199,000 223,250
403500 VEHICLE INSURANCE 21,700 21,700* 4035 Transport insurance 21,700 21,700
403600 CAR ALLOWANCES 252,800 260,700* 4036 Car allowances 252,800 260,700
** 403 Transport 4,909,800 4,672,550
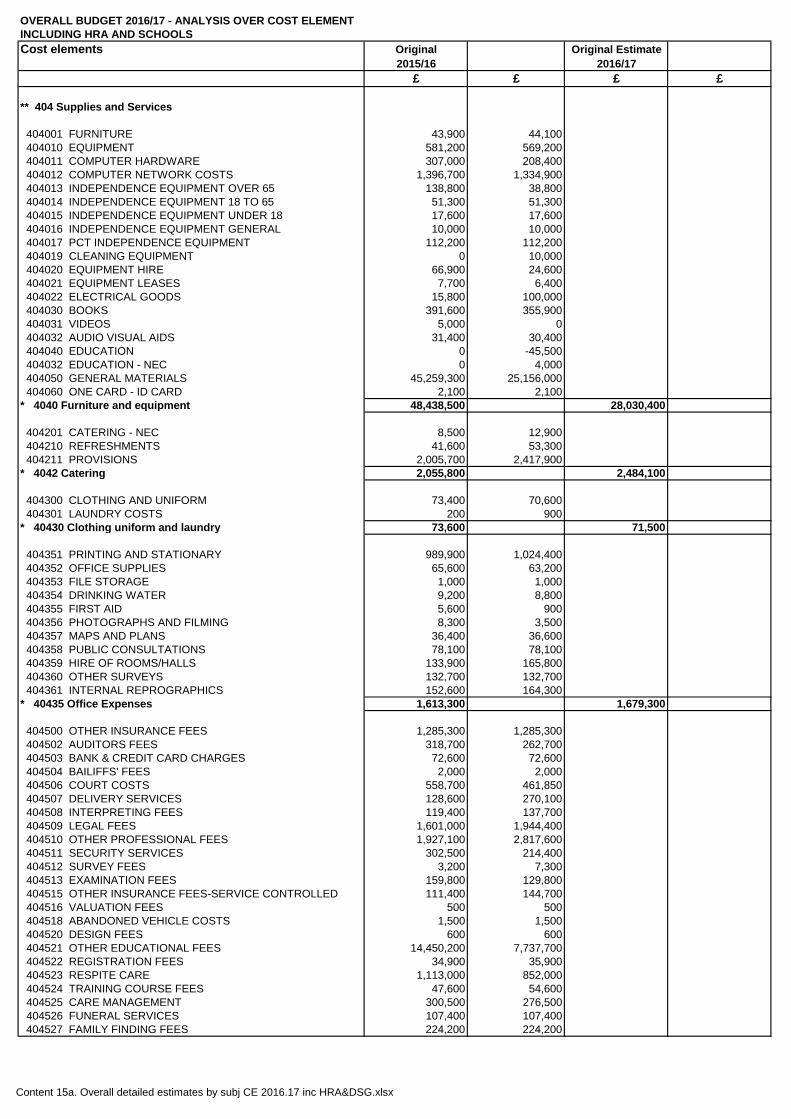
Content 15a. Overall detailed estimates by subj CE 2016.17 inc HRA&DSG.xlsx
OVERALL BUDGET 2016/17 - ANALYSIS OVER COST ELEMENTINCLUDING HRA AND SCHOOLSCost elements Original Original Estimate
2015/16 2016/17£ £ £ £
** 404 Supplies and Services
404001 FURNITURE 43,900 44,100 404010 EQUIPMENT 581,200 569,200 404011 COMPUTER HARDWARE 307,000 208,400 404012 COMPUTER NETWORK COSTS 1,396,700 1,334,900 404013 INDEPENDENCE EQUIPMENT OVER 65 138,800 38,800 404014 INDEPENDENCE EQUIPMENT 18 TO 65 51,300 51,300 404015 INDEPENDENCE EQUIPMENT UNDER 18 17,600 17,600 404016 INDEPENDENCE EQUIPMENT GENERAL 10,000 10,000 404017 PCT INDEPENDENCE EQUIPMENT 112,200 112,200 404019 CLEANING EQUIPMENT 0 10,000 404020 EQUIPMENT HIRE 66,900 24,600 404021 EQUIPMENT LEASES 7,700 6,400 404022 ELECTRICAL GOODS 15,800 100,000 404030 BOOKS 391,600 355,900 404031 VIDEOS 5,000 0 404032 AUDIO VISUAL AIDS 31,400 30,400 404040 EDUCATION 0 -45,500 404032 EDUCATION - NEC 0 4,000 404050 GENERAL MATERIALS 45,259,300 25,156,000 404060 ONE CARD - ID CARD 2,100 2,100* 4040 Furniture and equipment 48,438,500 28,030,400
404201 CATERING - NEC 8,500 12,900 404210 REFRESHMENTS 41,600 53,300 404211 PROVISIONS 2,005,700 2,417,900* 4042 Catering 2,055,800 2,484,100
404300 CLOTHING AND UNIFORM 73,400 70,600 404301 LAUNDRY COSTS 200 900* 40430 Clothing uniform and laundry 73,600 71,500
404351 PRINTING AND STATIONARY 989,900 1,024,400 404352 OFFICE SUPPLIES 65,600 63,200 404353 FILE STORAGE 1,000 1,000 404354 DRINKING WATER 9,200 8,800 404355 FIRST AID 5,600 900 404356 PHOTOGRAPHS AND FILMING 8,300 3,500 404357 MAPS AND PLANS 36,400 36,600 404358 PUBLIC CONSULTATIONS 78,100 78,100 404359 HIRE OF ROOMS/HALLS 133,900 165,800 404360 OTHER SURVEYS 132,700 132,700 404361 INTERNAL REPROGRAPHICS 152,600 164,300* 40435 Office Expenses 1,613,300 1,679,300
404500 OTHER INSURANCE FEES 1,285,300 1,285,300 404502 AUDITORS FEES 318,700 262,700 404503 BANK & CREDIT CARD CHARGES 72,600 72,600 404504 BAILIFFS' FEES 2,000 2,000 404506 COURT COSTS 558,700 461,850 404507 DELIVERY SERVICES 128,600 270,100 404508 INTERPRETING FEES 119,400 137,700 404509 LEGAL FEES 1,601,000 1,944,400 404510 OTHER PROFESSIONAL FEES 1,927,100 2,817,600 404511 SECURITY SERVICES 302,500 214,400 404512 SURVEY FEES 3,200 7,300 404513 EXAMINATION FEES 159,800 129,800 404515 OTHER INSURANCE FEES-SERVICE CONTROLLED 111,400 144,700 404516 VALUATION FEES 500 500 404518 ABANDONED VEHICLE COSTS 1,500 1,500 404520 DESIGN FEES 600 600 404521 OTHER EDUCATIONAL FEES 14,450,200 7,737,700 404522 REGISTRATION FEES 34,900 35,900 404523 RESPITE CARE 1,113,000 852,000 404524 TRAINING COURSE FEES 47,600 54,600 404525 CARE MANAGEMENT 300,500 276,500 404526 FUNERAL SERVICES 107,400 107,400 404527 FAMILY FINDING FEES 224,200 224,200
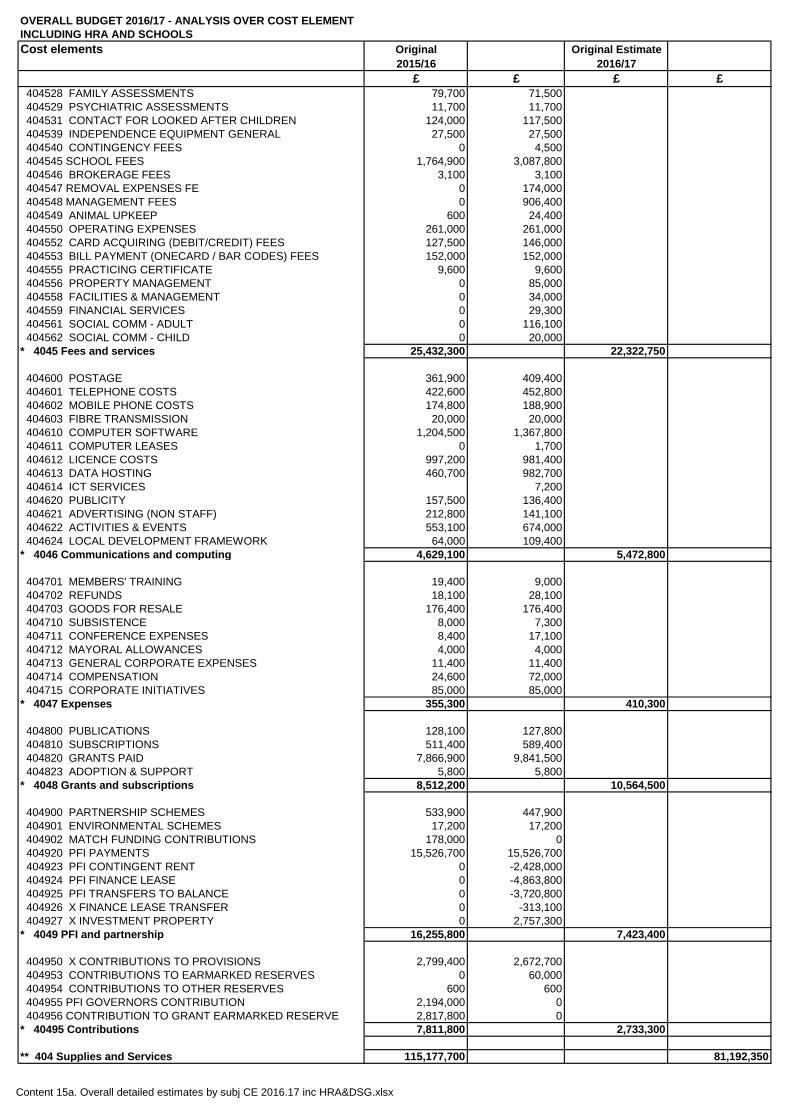
Content 15a. Overall detailed estimates by subj CE 2016.17 inc HRA&DSG.xlsx
OVERALL BUDGET 2016/17 - ANALYSIS OVER COST ELEMENTINCLUDING HRA AND SCHOOLSCost elements Original Original Estimate
2015/16 2016/17£ £ £ £
404528 FAMILY ASSESSMENTS 79,700 71,500 404529 PSYCHIATRIC ASSESSMENTS 11,700 11,700 404531 CONTACT FOR LOOKED AFTER CHILDREN 124,000 117,500 404539 INDEPENDENCE EQUIPMENT GENERAL 27,500 27,500 404540 CONTINGENCY FEES 0 4,500 404545 SCHOOL FEES 1,764,900 3,087,800 404546 BROKERAGE FEES 3,100 3,100 404547 REMOVAL EXPENSES FE 0 174,000 404548 MANAGEMENT FEES 0 906,400 404549 ANIMAL UPKEEP 600 24,400 404550 OPERATING EXPENSES 261,000 261,000 404552 CARD ACQUIRING (DEBIT/CREDIT) FEES 127,500 146,000 404553 BILL PAYMENT (ONECARD / BAR CODES) FEES 152,000 152,000 404555 PRACTICING CERTIFICATE 9,600 9,600 404556 PROPERTY MANAGEMENT 0 85,000 404558 FACILITIES & MANAGEMENT 0 34,000 404559 FINANCIAL SERVICES 0 29,300 404561 SOCIAL COMM - ADULT 0 116,100 404562 SOCIAL COMM - CHILD 0 20,000* 4045 Fees and services 25,432,300 22,322,750
404600 POSTAGE 361,900 409,400 404601 TELEPHONE COSTS 422,600 452,800 404602 MOBILE PHONE COSTS 174,800 188,900 404603 FIBRE TRANSMISSION 20,000 20,000 404610 COMPUTER SOFTWARE 1,204,500 1,367,800 404611 COMPUTER LEASES 0 1,700 404612 LICENCE COSTS 997,200 981,400 404613 DATA HOSTING 460,700 982,700 404614 ICT SERVICES 7,200 404620 PUBLICITY 157,500 136,400 404621 ADVERTISING (NON STAFF) 212,800 141,100 404622 ACTIVITIES & EVENTS 553,100 674,000 404624 LOCAL DEVELOPMENT FRAMEWORK 64,000 109,400* 4046 Communications and computing 4,629,100 5,472,800
404701 MEMBERS' TRAINING 19,400 9,000 404702 REFUNDS 18,100 28,100 404703 GOODS FOR RESALE 176,400 176,400 404710 SUBSISTENCE 8,000 7,300 404711 CONFERENCE EXPENSES 8,400 17,100 404712 MAYORAL ALLOWANCES 4,000 4,000 404713 GENERAL CORPORATE EXPENSES 11,400 11,400 404714 COMPENSATION 24,600 72,000 404715 CORPORATE INITIATIVES 85,000 85,000* 4047 Expenses 355,300 410,300
404800 PUBLICATIONS 128,100 127,800 404810 SUBSCRIPTIONS 511,400 589,400 404820 GRANTS PAID 7,866,900 9,841,500 404823 ADOPTION & SUPPORT 5,800 5,800* 4048 Grants and subscriptions 8,512,200 10,564,500
404900 PARTNERSHIP SCHEMES 533,900 447,900 404901 ENVIRONMENTAL SCHEMES 17,200 17,200 404902 MATCH FUNDING CONTRIBUTIONS 178,000 0 404920 PFI PAYMENTS 15,526,700 15,526,700 404923 PFI CONTINGENT RENT 0 -2,428,000 404924 PFI FINANCE LEASE 0 -4,863,800 404925 PFI TRANSFERS TO BALANCE 0 -3,720,800 404926 X FINANCE LEASE TRANSFER 0 -313,100 404927 X INVESTMENT PROPERTY 0 2,757,300* 4049 PFI and partnership 16,255,800 7,423,400
404950 X CONTRIBUTIONS TO PROVISIONS 2,799,400 2,672,700 404953 CONTRIBUTIONS TO EARMARKED RESERVES 0 60,000 404954 CONTRIBUTIONS TO OTHER RESERVES 600 600 404955 PFI GOVERNORS CONTRIBUTION 2,194,000 0 404956 CONTRIBUTION TO GRANT EARMARKED RESERVE 2,817,800 0* 40495 Contributions 7,811,800 2,733,300
** 404 Supplies and Services 115,177,700 81,192,350
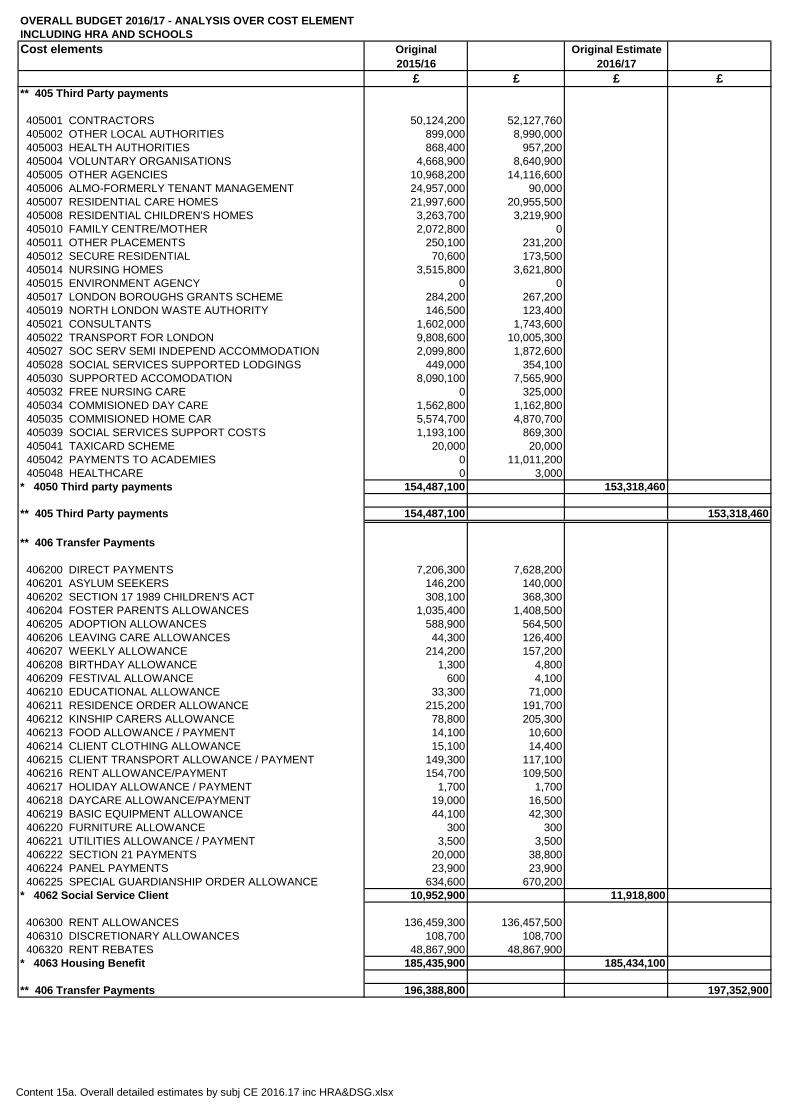
Content 15a. Overall detailed estimates by subj CE 2016.17 inc HRA&DSG.xlsx
OVERALL BUDGET 2016/17 - ANALYSIS OVER COST ELEMENTINCLUDING HRA AND SCHOOLSCost elements Original Original Estimate
2015/16 2016/17£ £ £ £
** 405 Third Party payments
405001 CONTRACTORS 50,124,200 52,127,760 405002 OTHER LOCAL AUTHORITIES 899,000 8,990,000 405003 HEALTH AUTHORITIES 868,400 957,200 405004 VOLUNTARY ORGANISATIONS 4,668,900 8,640,900 405005 OTHER AGENCIES 10,968,200 14,116,600 405006 ALMO-FORMERLY TENANT MANAGEMENT 24,957,000 90,000 405007 RESIDENTIAL CARE HOMES 21,997,600 20,955,500 405008 RESIDENTIAL CHILDREN'S HOMES 3,263,700 3,219,900 405010 FAMILY CENTRE/MOTHER 2,072,800 0 405011 OTHER PLACEMENTS 250,100 231,200 405012 SECURE RESIDENTIAL 70,600 173,500 405014 NURSING HOMES 3,515,800 3,621,800 405015 ENVIRONMENT AGENCY 0 0 405017 LONDON BOROUGHS GRANTS SCHEME 284,200 267,200 405019 NORTH LONDON WASTE AUTHORITY 146,500 123,400 405021 CONSULTANTS 1,602,000 1,743,600 405022 TRANSPORT FOR LONDON 9,808,600 10,005,300 405027 SOC SERV SEMI INDEPEND ACCOMMODATION 2,099,800 1,872,600 405028 SOCIAL SERVICES SUPPORTED LODGINGS 449,000 354,100 405030 SUPPORTED ACCOMODATION 8,090,100 7,565,900 405032 FREE NURSING CARE 0 325,000 405034 COMMISIONED DAY CARE 1,562,800 1,162,800 405035 COMMISIONED HOME CAR 5,574,700 4,870,700 405039 SOCIAL SERVICES SUPPORT COSTS 1,193,100 869,300 405041 TAXICARD SCHEME 20,000 20,000 405042 PAYMENTS TO ACADEMIES 0 11,011,200 405048 HEALTHCARE 0 3,000* 4050 Third party payments 154,487,100 153,318,460
** 405 Third Party payments 154,487,100 153,318,460
** 406 Transfer Payments
406200 DIRECT PAYMENTS 7,206,300 7,628,200 406201 ASYLUM SEEKERS 146,200 140,000 406202 SECTION 17 1989 CHILDREN'S ACT 308,100 368,300 406204 FOSTER PARENTS ALLOWANCES 1,035,400 1,408,500 406205 ADOPTION ALLOWANCES 588,900 564,500 406206 LEAVING CARE ALLOWANCES 44,300 126,400 406207 WEEKLY ALLOWANCE 214,200 157,200 406208 BIRTHDAY ALLOWANCE 1,300 4,800 406209 FESTIVAL ALLOWANCE 600 4,100 406210 EDUCATIONAL ALLOWANCE 33,300 71,000 406211 RESIDENCE ORDER ALLOWANCE 215,200 191,700 406212 KINSHIP CARERS ALLOWANCE 78,800 205,300 406213 FOOD ALLOWANCE / PAYMENT 14,100 10,600 406214 CLIENT CLOTHING ALLOWANCE 15,100 14,400 406215 CLIENT TRANSPORT ALLOWANCE / PAYMENT 149,300 117,100 406216 RENT ALLOWANCE/PAYMENT 154,700 109,500 406217 HOLIDAY ALLOWANCE / PAYMENT 1,700 1,700 406218 DAYCARE ALLOWANCE/PAYMENT 19,000 16,500 406219 BASIC EQUIPMENT ALLOWANCE 44,100 42,300 406220 FURNITURE ALLOWANCE 300 300 406221 UTILITIES ALLOWANCE / PAYMENT 3,500 3,500 406222 SECTION 21 PAYMENTS 20,000 38,800 406224 PANEL PAYMENTS 23,900 23,900 406225 SPECIAL GUARDIANSHIP ORDER ALLOWANCE 634,600 670,200* 4062 Social Service Client 10,952,900 11,918,800
406300 RENT ALLOWANCES 136,459,300 136,457,500 406310 DISCRETIONARY ALLOWANCES 108,700 108,700 406320 RENT REBATES 48,867,900 48,867,900* 4063 Housing Benefit 185,435,900 185,434,100
** 406 Transfer Payments 196,388,800 197,352,900
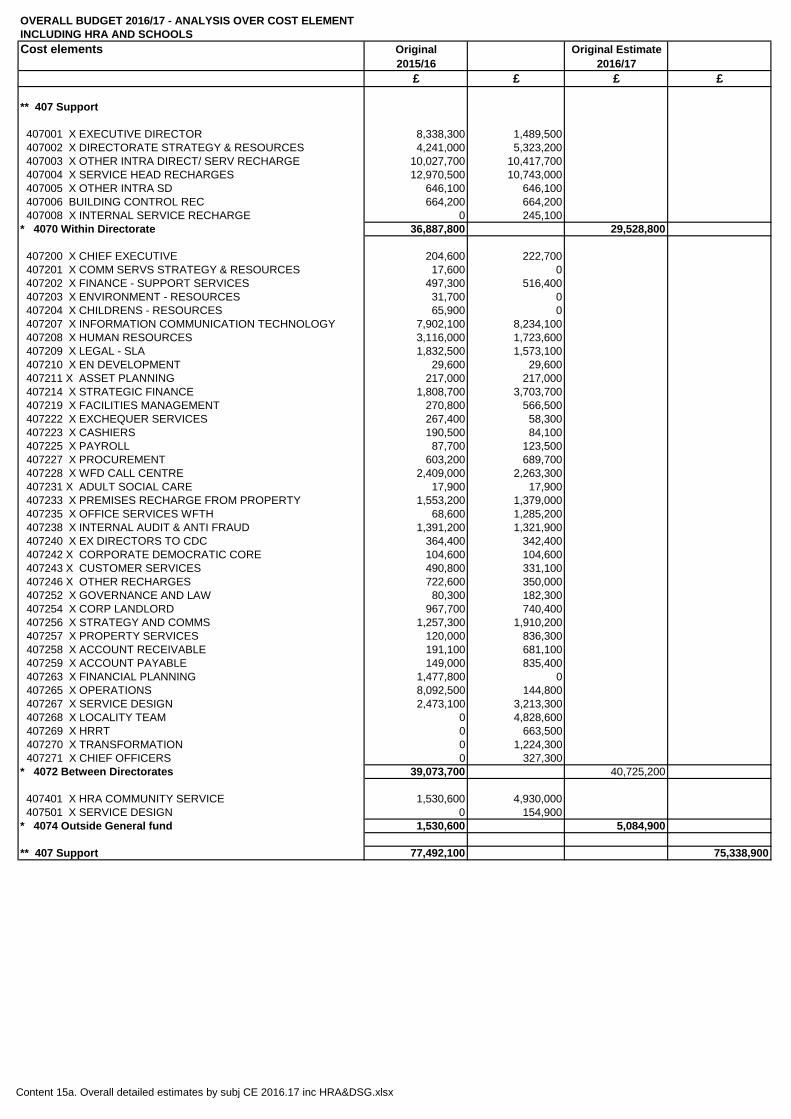
Content 15a. Overall detailed estimates by subj CE 2016.17 inc HRA&DSG.xlsx
OVERALL BUDGET 2016/17 - ANALYSIS OVER COST ELEMENTINCLUDING HRA AND SCHOOLSCost elements Original Original Estimate
2015/16 2016/17£ £ £ £
** 407 Support
407001 X EXECUTIVE DIRECTOR 8,338,300 1,489,500 407002 X DIRECTORATE STRATEGY & RESOURCES 4,241,000 5,323,200 407003 X OTHER INTRA DIRECT/ SERV RECHARGE 10,027,700 10,417,700 407004 X SERVICE HEAD RECHARGES 12,970,500 10,743,000 407005 X OTHER INTRA SD 646,100 646,100 407006 BUILDING CONTROL REC 664,200 664,200 407008 X INTERNAL SERVICE RECHARGE 0 245,100* 4070 Within Directorate 36,887,800 29,528,800
407200 X CHIEF EXECUTIVE 204,600 222,700 407201 X COMM SERVS STRATEGY & RESOURCES 17,600 0 407202 X FINANCE - SUPPORT SERVICES 497,300 516,400 407203 X ENVIRONMENT - RESOURCES 31,700 0 407204 X CHILDRENS - RESOURCES 65,900 0 407207 X INFORMATION COMMUNICATION TECHNOLOGY 7,902,100 8,234,100 407208 X HUMAN RESOURCES 3,116,000 1,723,600 407209 X LEGAL - SLA 1,832,500 1,573,100 407210 X EN DEVELOPMENT 29,600 29,600 407211 X ASSET PLANNING 217,000 217,000 407214 X STRATEGIC FINANCE 1,808,700 3,703,700 407219 X FACILITIES MANAGEMENT 270,800 566,500 407222 X EXCHEQUER SERVICES 267,400 58,300 407223 X CASHIERS 190,500 84,100 407225 X PAYROLL 87,700 123,500 407227 X PROCUREMENT 603,200 689,700 407228 X WFD CALL CENTRE 2,409,000 2,263,300 407231 X ADULT SOCIAL CARE 17,900 17,900 407233 X PREMISES RECHARGE FROM PROPERTY 1,553,200 1,379,000 407235 X OFFICE SERVICES WFTH 68,600 1,285,200 407238 X INTERNAL AUDIT & ANTI FRAUD 1,391,200 1,321,900 407240 X EX DIRECTORS TO CDC 364,400 342,400 407242 X CORPORATE DEMOCRATIC CORE 104,600 104,600 407243 X CUSTOMER SERVICES 490,800 331,100 407246 X OTHER RECHARGES 722,600 350,000 407252 X GOVERNANCE AND LAW 80,300 182,300 407254 X CORP LANDLORD 967,700 740,400 407256 X STRATEGY AND COMMS 1,257,300 1,910,200 407257 X PROPERTY SERVICES 120,000 836,300 407258 X ACCOUNT RECEIVABLE 191,100 681,100 407259 X ACCOUNT PAYABLE 149,000 835,400 407263 X FINANCIAL PLANNING 1,477,800 0 407265 X OPERATIONS 8,092,500 144,800 407267 X SERVICE DESIGN 2,473,100 3,213,300 407268 X LOCALITY TEAM 0 4,828,600 407269 X HRRT 0 663,500 407270 X TRANSFORMATION 0 1,224,300 407271 X CHIEF OFFICERS 0 327,300* 4072 Between Directorates 39,073,700 40,725,200
407401 X HRA COMMUNITY SERVICE 1,530,600 4,930,000 407501 X SERVICE DESIGN 0 154,900* 4074 Outside General fund 1,530,600 5,084,900
** 407 Support 77,492,100 75,338,900
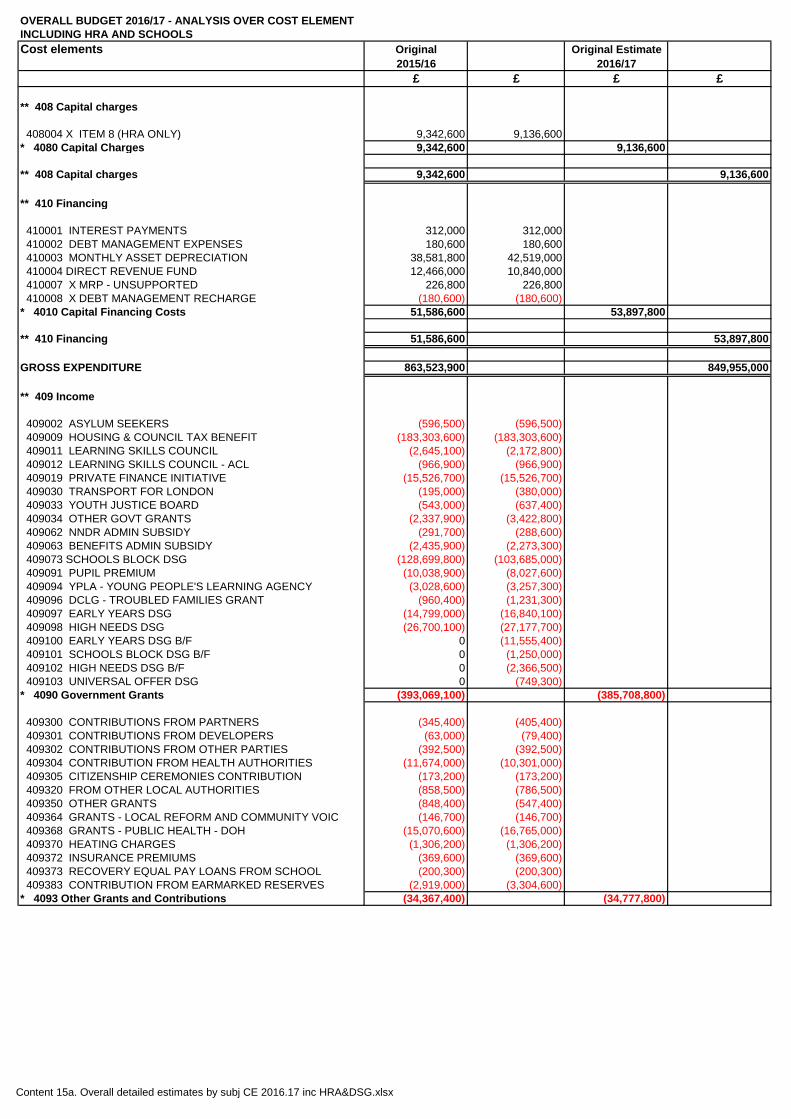
Content 15a. Overall detailed estimates by subj CE 2016.17 inc HRA&DSG.xlsx
OVERALL BUDGET 2016/17 - ANALYSIS OVER COST ELEMENTINCLUDING HRA AND SCHOOLSCost elements Original Original Estimate
2015/16 2016/17£ £ £ £
** 408 Capital charges
408004 X ITEM 8 (HRA ONLY) 9,342,600 9,136,600* 4080 Capital Charges 9,342,600 9,136,600
** 408 Capital charges 9,342,600 9,136,600
** 410 Financing
410001 INTEREST PAYMENTS 312,000 312,000 410002 DEBT MANAGEMENT EXPENSES 180,600 180,600 410003 MONTHLY ASSET DEPRECIATION 38,581,800 42,519,000 410004 DIRECT REVENUE FUND 12,466,000 10,840,000 410007 X MRP - UNSUPPORTED 226,800 226,800 410008 X DEBT MANAGEMENT RECHARGE (180,600) (180,600)* 4010 Capital Financing Costs 51,586,600 53,897,800
** 410 Financing 51,586,600 53,897,800
GROSS EXPENDITURE 863,523,900 849,955,000
** 409 Income
409002 ASYLUM SEEKERS (596,500) (596,500) 409009 HOUSING & COUNCIL TAX BENEFIT (183,303,600) (183,303,600) 409011 LEARNING SKILLS COUNCIL (2,645,100) (2,172,800) 409012 LEARNING SKILLS COUNCIL - ACL (966,900) (966,900) 409019 PRIVATE FINANCE INITIATIVE (15,526,700) (15,526,700) 409030 TRANSPORT FOR LONDON (195,000) (380,000) 409033 YOUTH JUSTICE BOARD (543,000) (637,400) 409034 OTHER GOVT GRANTS (2,337,900) (3,422,800) 409062 NNDR ADMIN SUBSIDY (291,700) (288,600) 409063 BENEFITS ADMIN SUBSIDY (2,435,900) (2,273,300) 409073 SCHOOLS BLOCK DSG (128,699,800) (103,685,000) 409091 PUPIL PREMIUM (10,038,900) (8,027,600) 409094 YPLA - YOUNG PEOPLE'S LEARNING AGENCY (3,028,600) (3,257,300) 409096 DCLG - TROUBLED FAMILIES GRANT (960,400) (1,231,300) 409097 EARLY YEARS DSG (14,799,000) (16,840,100) 409098 HIGH NEEDS DSG (26,700,100) (27,177,700) 409100 EARLY YEARS DSG B/F 0 (11,555,400) 409101 SCHOOLS BLOCK DSG B/F 0 (1,250,000) 409102 HIGH NEEDS DSG B/F 0 (2,366,500) 409103 UNIVERSAL OFFER DSG 0 (749,300)* 4090 Government Grants (393,069,100) (385,708,800)
409300 CONTRIBUTIONS FROM PARTNERS (345,400) (405,400) 409301 CONTRIBUTIONS FROM DEVELOPERS (63,000) (79,400) 409302 CONTRIBUTIONS FROM OTHER PARTIES (392,500) (392,500) 409304 CONTRIBUTION FROM HEALTH AUTHORITIES (11,674,000) (10,301,000) 409305 CITIZENSHIP CEREMONIES CONTRIBUTION (173,200) (173,200) 409320 FROM OTHER LOCAL AUTHORITIES (858,500) (786,500) 409350 OTHER GRANTS (848,400) (547,400) 409364 GRANTS - LOCAL REFORM AND COMMUNITY VOIC (146,700) (146,700) 409368 GRANTS - PUBLIC HEALTH - DOH (15,070,600) (16,765,000) 409370 HEATING CHARGES (1,306,200) (1,306,200) 409372 INSURANCE PREMIUMS (369,600) (369,600) 409373 RECOVERY EQUAL PAY LOANS FROM SCHOOL (200,300) (200,300) 409383 CONTRIBUTION FROM EARMARKED RESERVES (2,919,000) (3,304,600)* 4093 Other Grants and Contributions (34,367,400) (34,777,800)
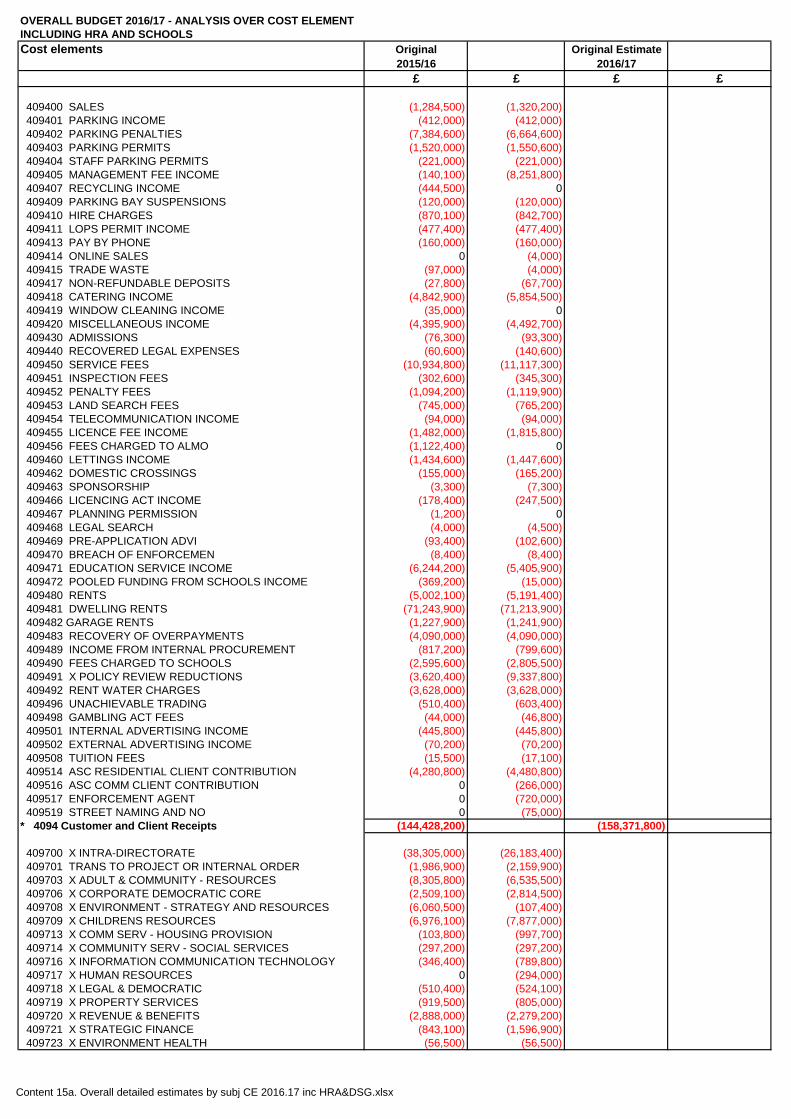
Content 15a. Overall detailed estimates by subj CE 2016.17 inc HRA&DSG.xlsx
OVERALL BUDGET 2016/17 - ANALYSIS OVER COST ELEMENTINCLUDING HRA AND SCHOOLSCost elements Original Original Estimate
2015/16 2016/17£ £ £ £
409400 SALES (1,284,500) (1,320,200) 409401 PARKING INCOME (412,000) (412,000) 409402 PARKING PENALTIES (7,384,600) (6,664,600) 409403 PARKING PERMITS (1,520,000) (1,550,600) 409404 STAFF PARKING PERMITS (221,000) (221,000) 409405 MANAGEMENT FEE INCOME (140,100) (8,251,800) 409407 RECYCLING INCOME (444,500) 0 409409 PARKING BAY SUSPENSIONS (120,000) (120,000) 409410 HIRE CHARGES (870,100) (842,700) 409411 LOPS PERMIT INCOME (477,400) (477,400) 409413 PAY BY PHONE (160,000) (160,000) 409414 ONLINE SALES 0 (4,000) 409415 TRADE WASTE (97,000) (4,000) 409417 NON-REFUNDABLE DEPOSITS (27,800) (67,700) 409418 CATERING INCOME (4,842,900) (5,854,500) 409419 WINDOW CLEANING INCOME (35,000) 0 409420 MISCELLANEOUS INCOME (4,395,900) (4,492,700) 409430 ADMISSIONS (76,300) (93,300) 409440 RECOVERED LEGAL EXPENSES (60,600) (140,600) 409450 SERVICE FEES (10,934,800) (11,117,300) 409451 INSPECTION FEES (302,600) (345,300) 409452 PENALTY FEES (1,094,200) (1,119,900) 409453 LAND SEARCH FEES (745,000) (765,200) 409454 TELECOMMUNICATION INCOME (94,000) (94,000) 409455 LICENCE FEE INCOME (1,482,000) (1,815,800) 409456 FEES CHARGED TO ALMO (1,122,400) 0 409460 LETTINGS INCOME (1,434,600) (1,447,600) 409462 DOMESTIC CROSSINGS (155,000) (165,200) 409463 SPONSORSHIP (3,300) (7,300) 409466 LICENCING ACT INCOME (178,400) (247,500) 409467 PLANNING PERMISSION (1,200) 0 409468 LEGAL SEARCH (4,000) (4,500) 409469 PRE-APPLICATION ADVI (93,400) (102,600) 409470 BREACH OF ENFORCEMEN (8,400) (8,400) 409471 EDUCATION SERVICE INCOME (6,244,200) (5,405,900) 409472 POOLED FUNDING FROM SCHOOLS INCOME (369,200) (15,000) 409480 RENTS (5,002,100) (5,191,400) 409481 DWELLING RENTS (71,243,900) (71,213,900) 409482 GARAGE RENTS (1,227,900) (1,241,900) 409483 RECOVERY OF OVERPAYMENTS (4,090,000) (4,090,000) 409489 INCOME FROM INTERNAL PROCUREMENT (817,200) (799,600) 409490 FEES CHARGED TO SCHOOLS (2,595,600) (2,805,500) 409491 X POLICY REVIEW REDUCTIONS (3,620,400) (9,337,800) 409492 RENT WATER CHARGES (3,628,000) (3,628,000) 409496 UNACHIEVABLE TRADING (510,400) (603,400) 409498 GAMBLING ACT FEES (44,000) (46,800) 409501 INTERNAL ADVERTISING INCOME (445,800) (445,800) 409502 EXTERNAL ADVERTISING INCOME (70,200) (70,200) 409508 TUITION FEES (15,500) (17,100) 409514 ASC RESIDENTIAL CLIENT CONTRIBUTION (4,280,800) (4,480,800) 409516 ASC COMM CLIENT CONTRIBUTION 0 (266,000) 409517 ENFORCEMENT AGENT 0 (720,000) 409519 STREET NAMING AND NO 0 (75,000)* 4094 Customer and Client Receipts (144,428,200) (158,371,800)
409700 X INTRA-DIRECTORATE (38,305,000) (26,183,400) 409701 TRANS TO PROJECT OR INTERNAL ORDER (1,986,900) (2,159,900) 409703 X ADULT & COMMUNITY - RESOURCES (8,305,800) (6,535,500) 409706 X CORPORATE DEMOCRATIC CORE (2,509,100) (2,814,500) 409708 X ENVIRONMENT - STRATEGY AND RESOURCES (6,060,500) (107,400) 409709 X CHILDRENS RESOURCES (6,976,100) (7,877,000) 409713 X COMM SERV - HOUSING PROVISION (103,800) (997,700) 409714 X COMMUNITY SERV - SOCIAL SERVICES (297,200) (297,200) 409716 X INFORMATION COMMUNICATION TECHNOLOGY (346,400) (789,800) 409717 X HUMAN RESOURCES 0 (294,000) 409718 X LEGAL & DEMOCRATIC (510,400) (524,100) 409719 X PROPERTY SERVICES (919,500) (805,000) 409720 X REVENUE & BENEFITS (2,888,000) (2,279,200) 409721 X STRATEGIC FINANCE (843,100) (1,596,900) 409723 X ENVIRONMENT HEALTH (56,500) (56,500)
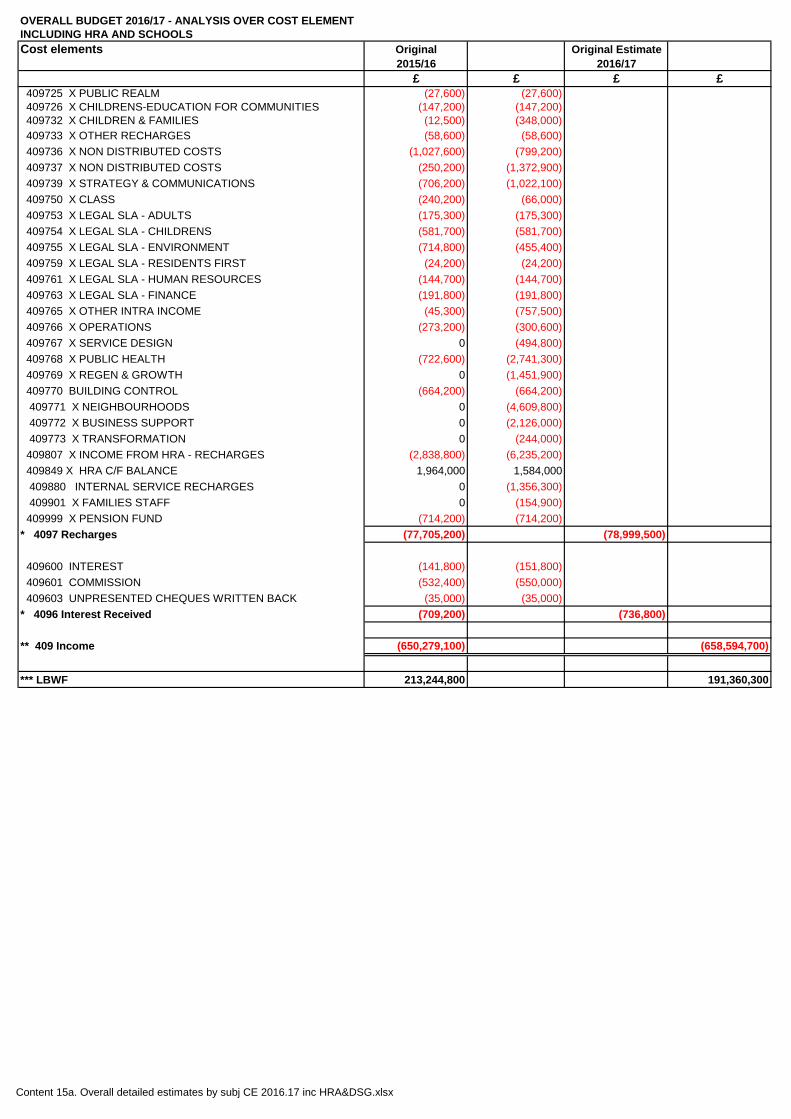
Content 15a. Overall detailed estimates by subj CE 2016.17 inc HRA&DSG.xlsx
OVERALL BUDGET 2016/17 - ANALYSIS OVER COST ELEMENTINCLUDING HRA AND SCHOOLSCost elements Original Original Estimate
2015/16 2016/17£ £ £ £
409725 X PUBLIC REALM (27,600) (27,600) 409726 X CHILDRENS-EDUCATION FOR COMMUNITIES (147,200) (147,200) 409732 X CHILDREN & FAMILIES (12,500) (348,000) 409733 X OTHER RECHARGES (58,600) (58,600) 409736 X NON DISTRIBUTED COSTS (1,027,600) (799,200) 409737 X NON DISTRIBUTED COSTS (250,200) (1,372,900) 409739 X STRATEGY & COMMUNICATIONS (706,200) (1,022,100) 409750 X CLASS (240,200) (66,000) 409753 X LEGAL SLA - ADULTS (175,300) (175,300) 409754 X LEGAL SLA - CHILDRENS (581,700) (581,700) 409755 X LEGAL SLA - ENVIRONMENT (714,800) (455,400) 409759 X LEGAL SLA - RESIDENTS FIRST (24,200) (24,200) 409761 X LEGAL SLA - HUMAN RESOURCES (144,700) (144,700) 409763 X LEGAL SLA - FINANCE (191,800) (191,800) 409765 X OTHER INTRA INCOME (45,300) (757,500) 409766 X OPERATIONS (273,200) (300,600) 409767 X SERVICE DESIGN 0 (494,800) 409768 X PUBLIC HEALTH (722,600) (2,741,300) 409769 X REGEN & GROWTH 0 (1,451,900) 409770 BUILDING CONTROL (664,200) (664,200) 409771 X NEIGHBOURHOODS 0 (4,609,800) 409772 X BUSINESS SUPPORT 0 (2,126,000) 409773 X TRANSFORMATION 0 (244,000) 409807 X INCOME FROM HRA - RECHARGES (2,838,800) (6,235,200) 409849 X HRA C/F BALANCE 1,964,000 1,584,000 409880 INTERNAL SERVICE RECHARGES 0 (1,356,300) 409901 X FAMILIES STAFF 0 (154,900) 409999 X PENSION FUND (714,200) (714,200)* 4097 Recharges (77,705,200) (78,999,500)
409600 INTEREST (141,800) (151,800) 409601 COMMISSION (532,400) (550,000) 409603 UNPRESENTED CHEQUES WRITTEN BACK (35,000) (35,000)* 4096 Interest Received (709,200) (736,800)
** 409 Income (650,279,100) (658,594,700)
*** LBWF 213,244,800 191,360,300
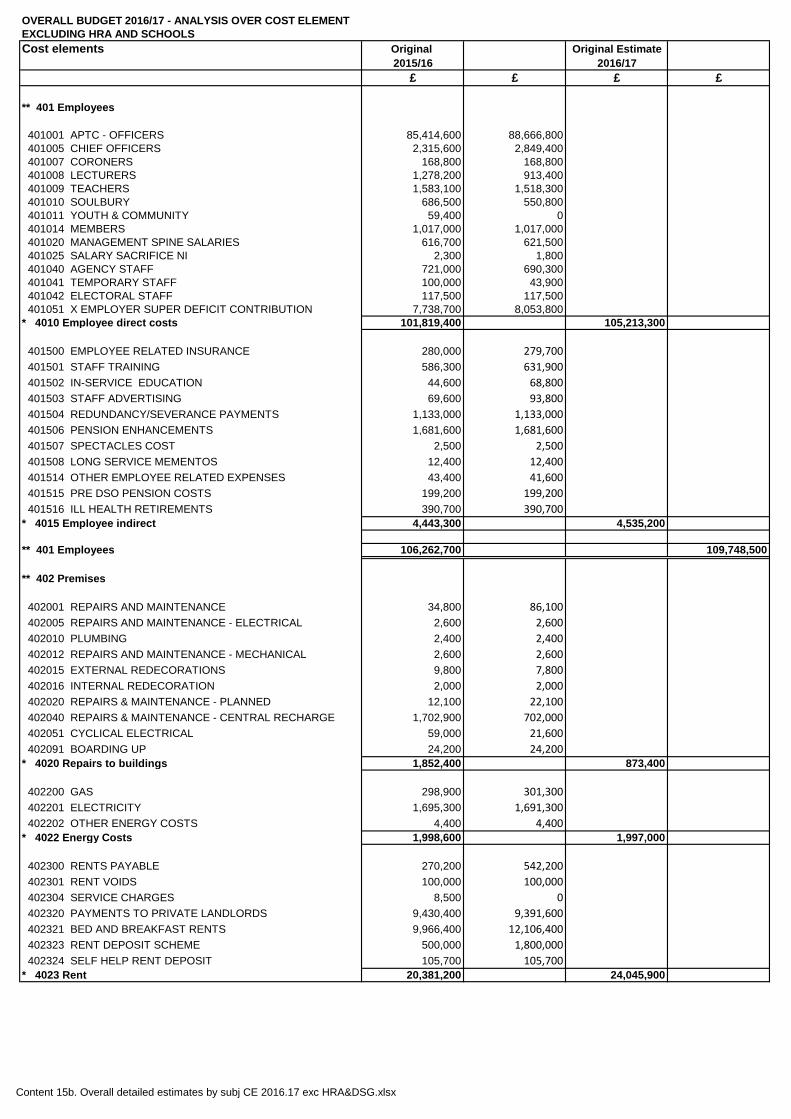
Content 15b. Overall detailed estimates by subj CE 2016.17 exc HRA&DSG.xlsx
OVERALL BUDGET 2016/17 - ANALYSIS OVER COST ELEMENTEXCLUDING HRA AND SCHOOLSCost elements Original Original Estimate
2015/16 2016/17£ £ £ £
** 401 Employees
401001 APTC - OFFICERS 85,414,600 88,666,800 401005 CHIEF OFFICERS 2,315,600 2,849,400 401007 CORONERS 168,800 168,800 401008 LECTURERS 1,278,200 913,400 401009 TEACHERS 1,583,100 1,518,300 401010 SOULBURY 686,500 550,800 401011 YOUTH & COMMUNITY 59,400 0 401014 MEMBERS 1,017,000 1,017,000 401020 MANAGEMENT SPINE SALARIES 616,700 621,500 401025 SALARY SACRIFICE NI 2,300 1,800 401040 AGENCY STAFF 721,000 690,300 401041 TEMPORARY STAFF 100,000 43,900 401042 ELECTORAL STAFF 117,500 117,500 401051 X EMPLOYER SUPER DEFICIT CONTRIBUTION 7,738,700 8,053,800* 4010 Employee direct costs 101,819,400 105,213,300
401500 EMPLOYEE RELATED INSURANCE 280,000 279,700 401501 STAFF TRAINING 586,300 631,900 401502 IN-SERVICE EDUCATION 44,600 68,800 401503 STAFF ADVERTISING 69,600 93,800 401504 REDUNDANCY/SEVERANCE PAYMENTS 1,133,000 1,133,000 401506 PENSION ENHANCEMENTS 1,681,600 1,681,600 401507 SPECTACLES COST 2,500 2,500 401508 LONG SERVICE MEMENTOS 12,400 12,400 401514 OTHER EMPLOYEE RELATED EXPENSES 43,400 41,600 401515 PRE DSO PENSION COSTS 199,200 199,200 401516 ILL HEALTH RETIREMENTS 390,700 390,700* 4015 Employee indirect 4,443,300 4,535,200
** 401 Employees 106,262,700 109,748,500
** 402 Premises
402001 REPAIRS AND MAINTENANCE 34,800 86,100 402005 REPAIRS AND MAINTENANCE - ELECTRICAL 2,600 2,600 402010 PLUMBING 2,400 2,400 402012 REPAIRS AND MAINTENANCE - MECHANICAL 2,600 2,600 402015 EXTERNAL REDECORATIONS 9,800 7,800 402016 INTERNAL REDECORATION 2,000 2,000 402020 REPAIRS & MAINTENANCE - PLANNED 12,100 22,100 402040 REPAIRS & MAINTENANCE - CENTRAL RECHARGE 1,702,900 702,000 402051 CYCLICAL ELECTRICAL 59,000 21,600 402091 BOARDING UP 24,200 24,200* 4020 Repairs to buildings 1,852,400 873,400
402200 GAS 298,900 301,300 402201 ELECTRICITY 1,695,300 1,691,300 402202 OTHER ENERGY COSTS 4,400 4,400* 4022 Energy Costs 1,998,600 1,997,000
402300 RENTS PAYABLE 270,200 542,200 402301 RENT VOIDS 100,000 100,000 402304 SERVICE CHARGES 8,500 0 402320 PAYMENTS TO PRIVATE LANDLORDS 9,430,400 9,391,600 402321 BED AND BREAKFAST RENTS 9,966,400 12,106,400 402323 RENT DEPOSIT SCHEME 500,000 1,800,000 402324 SELF HELP RENT DEPOSIT 105,700 105,700* 4023 Rent 20,381,200 24,045,900
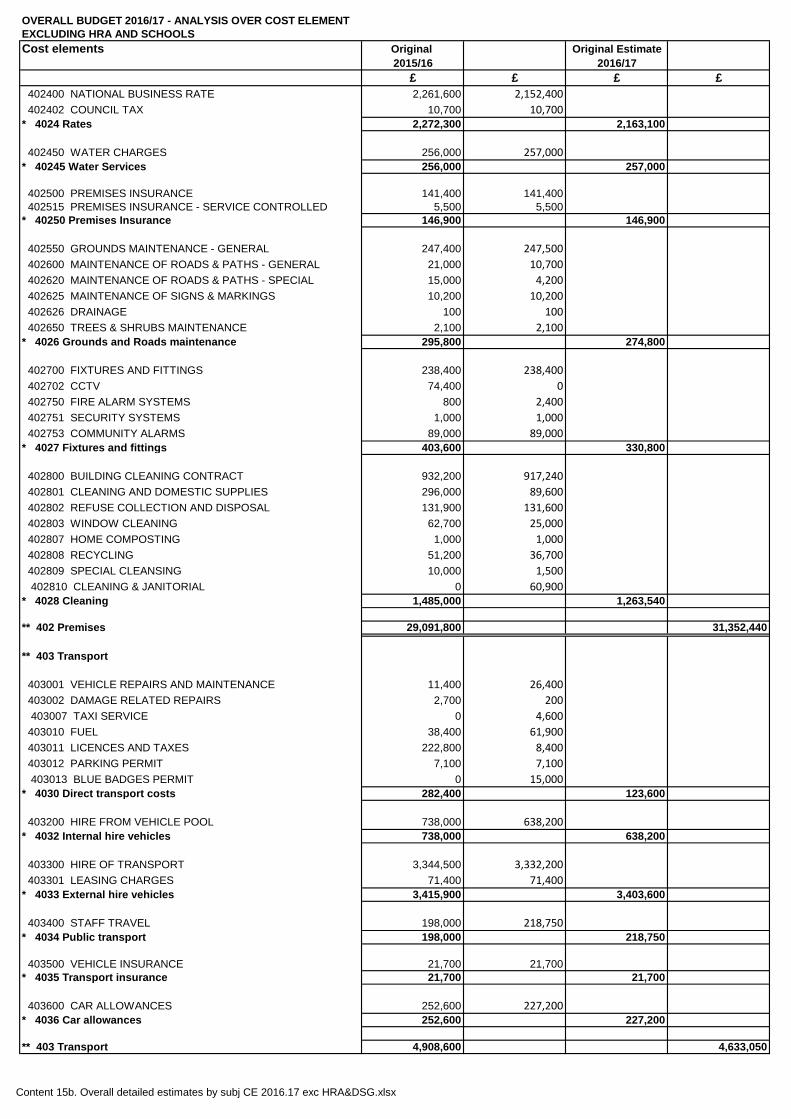
Content 15b. Overall detailed estimates by subj CE 2016.17 exc HRA&DSG.xlsx
OVERALL BUDGET 2016/17 - ANALYSIS OVER COST ELEMENTEXCLUDING HRA AND SCHOOLSCost elements Original Original Estimate
2015/16 2016/17£ £ £ £
402400 NATIONAL BUSINESS RATE 2,261,600 2,152,400 402402 COUNCIL TAX 10,700 10,700* 4024 Rates 2,272,300 2,163,100
402450 WATER CHARGES 256,000 257,000* 40245 Water Services 256,000 257,000
402500 PREMISES INSURANCE 141,400 141,400 402515 PREMISES INSURANCE - SERVICE CONTROLLED 5,500 5,500* 40250 Premises Insurance 146,900 146,900
402550 GROUNDS MAINTENANCE - GENERAL 247,400 247,500 402600 MAINTENANCE OF ROADS & PATHS - GENERAL 21,000 10,700 402620 MAINTENANCE OF ROADS & PATHS - SPECIAL 15,000 4,200 402625 MAINTENANCE OF SIGNS & MARKINGS 10,200 10,200 402626 DRAINAGE 100 100 402650 TREES & SHRUBS MAINTENANCE 2,100 2,100* 4026 Grounds and Roads maintenance 295,800 274,800
402700 FIXTURES AND FITTINGS 238,400 238,400 402702 CCTV 74,400 0 402750 FIRE ALARM SYSTEMS 800 2,400 402751 SECURITY SYSTEMS 1,000 1,000 402753 COMMUNITY ALARMS 89,000 89,000* 4027 Fixtures and fittings 403,600 330,800
402800 BUILDING CLEANING CONTRACT 932,200 917,240 402801 CLEANING AND DOMESTIC SUPPLIES 296,000 89,600 402802 REFUSE COLLECTION AND DISPOSAL 131,900 131,600 402803 WINDOW CLEANING 62,700 25,000 402807 HOME COMPOSTING 1,000 1,000 402808 RECYCLING 51,200 36,700 402809 SPECIAL CLEANSING 10,000 1,500 402810 CLEANING & JANITORIAL 0 60,900* 4028 Cleaning 1,485,000 1,263,540
** 402 Premises 29,091,800 31,352,440
** 403 Transport
403001 VEHICLE REPAIRS AND MAINTENANCE 11,400 26,400 403002 DAMAGE RELATED REPAIRS 2,700 200 403007 TAXI SERVICE 0 4,600 403010 FUEL 38,400 61,900 403011 LICENCES AND TAXES 222,800 8,400 403012 PARKING PERMIT 7,100 7,100 403013 BLUE BADGES PERMIT 0 15,000* 4030 Direct transport costs 282,400 123,600
403200 HIRE FROM VEHICLE POOL 738,000 638,200* 4032 Internal hire vehicles 738,000 638,200
403300 HIRE OF TRANSPORT 3,344,500 3,332,200 403301 LEASING CHARGES 71,400 71,400* 4033 External hire vehicles 3,415,900 3,403,600
403400 STAFF TRAVEL 198,000 218,750* 4034 Public transport 198,000 218,750
403500 VEHICLE INSURANCE 21,700 21,700* 4035 Transport insurance 21,700 21,700
403600 CAR ALLOWANCES 252,600 227,200* 4036 Car allowances 252,600 227,200
** 403 Transport 4,908,600 4,633,050
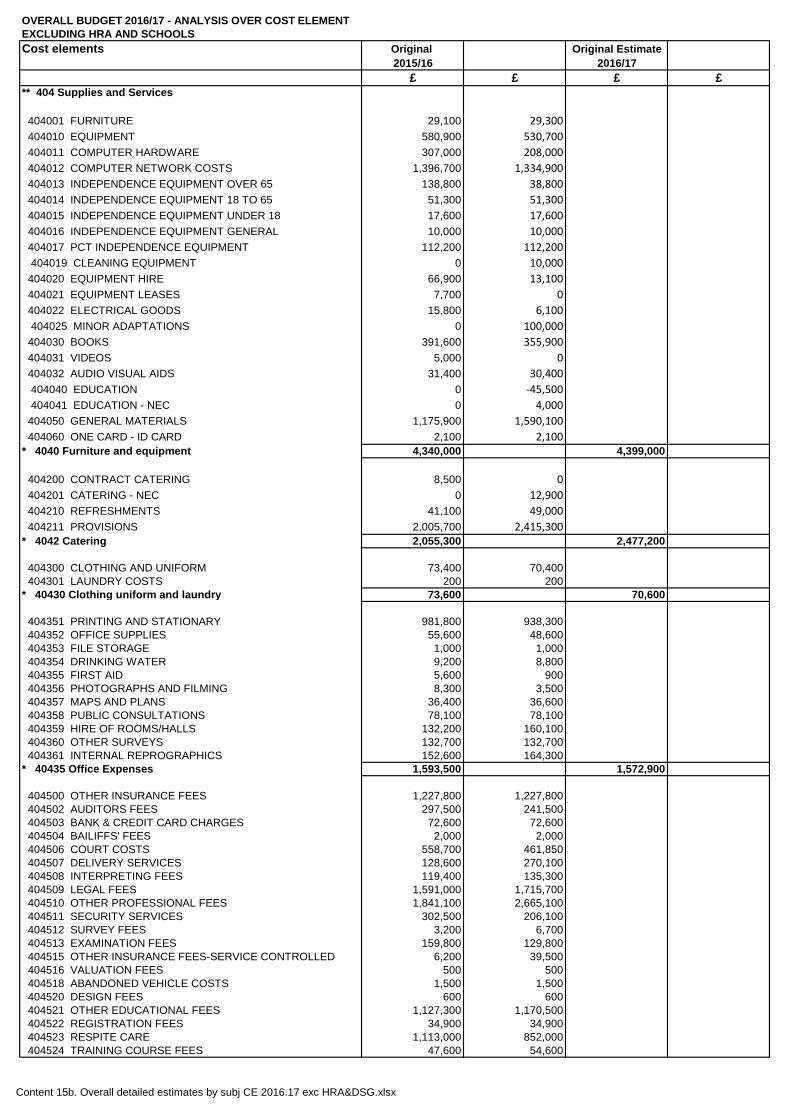
Content 15b. Overall detailed estimates by subj CE 2016.17 exc HRA&DSG.xlsx
OVERALL BUDGET 2016/17 - ANALYSIS OVER COST ELEMENTEXCLUDING HRA AND SCHOOLSCost elements Original Original Estimate
2015/16 2016/17£ £ £ £
** 404 Supplies and Services
404001 FURNITURE 29,100 29,300 404010 EQUIPMENT 580,900 530,700 404011 COMPUTER HARDWARE 307,000 208,000 404012 COMPUTER NETWORK COSTS 1,396,700 1,334,900 404013 INDEPENDENCE EQUIPMENT OVER 65 138,800 38,800 404014 INDEPENDENCE EQUIPMENT 18 TO 65 51,300 51,300 404015 INDEPENDENCE EQUIPMENT UNDER 18 17,600 17,600 404016 INDEPENDENCE EQUIPMENT GENERAL 10,000 10,000 404017 PCT INDEPENDENCE EQUIPMENT 112,200 112,200 404019 CLEANING EQUIPMENT 0 10,000 404020 EQUIPMENT HIRE 66,900 13,100 404021 EQUIPMENT LEASES 7,700 0 404022 ELECTRICAL GOODS 15,800 6,100 404025 MINOR ADAPTATIONS 0 100,000 404030 BOOKS 391,600 355,900 404031 VIDEOS 5,000 0 404032 AUDIO VISUAL AIDS 31,400 30,400 404040 EDUCATION 0 -45,500 404041 EDUCATION - NEC 0 4,000 404050 GENERAL MATERIALS 1,175,900 1,590,100 404060 ONE CARD - ID CARD 2,100 2,100* 4040 Furniture and equipment 4,340,000 4,399,000
404200 CONTRACT CATERING 8,500 0 404201 CATERING - NEC 0 12,900 404210 REFRESHMENTS 41,100 49,000 404211 PROVISIONS 2,005,700 2,415,300* 4042 Catering 2,055,300 2,477,200
404300 CLOTHING AND UNIFORM 73,400 70,400 404301 LAUNDRY COSTS 200 200* 40430 Clothing uniform and laundry 73,600 70,600
404351 PRINTING AND STATIONARY 981,800 938,300 404352 OFFICE SUPPLIES 55,600 48,600 404353 FILE STORAGE 1,000 1,000 404354 DRINKING WATER 9,200 8,800 404355 FIRST AID 5,600 900 404356 PHOTOGRAPHS AND FILMING 8,300 3,500 404357 MAPS AND PLANS 36,400 36,600 404358 PUBLIC CONSULTATIONS 78,100 78,100 404359 HIRE OF ROOMS/HALLS 132,200 160,100 404360 OTHER SURVEYS 132,700 132,700 404361 INTERNAL REPROGRAPHICS 152,600 164,300* 40435 Office Expenses 1,593,500 1,572,900
404500 OTHER INSURANCE FEES 1,227,800 1,227,800 404502 AUDITORS FEES 297,500 241,500 404503 BANK & CREDIT CARD CHARGES 72,600 72,600 404504 BAILIFFS' FEES 2,000 2,000 404506 COURT COSTS 558,700 461,850 404507 DELIVERY SERVICES 128,600 270,100 404508 INTERPRETING FEES 119,400 135,300 404509 LEGAL FEES 1,591,000 1,715,700 404510 OTHER PROFESSIONAL FEES 1,841,100 2,665,100 404511 SECURITY SERVICES 302,500 206,100 404512 SURVEY FEES 3,200 6,700 404513 EXAMINATION FEES 159,800 129,800 404515 OTHER INSURANCE FEES-SERVICE CONTROLLED 6,200 39,500 404516 VALUATION FEES 500 500 404518 ABANDONED VEHICLE COSTS 1,500 1,500 404520 DESIGN FEES 600 600 404521 OTHER EDUCATIONAL FEES 1,127,300 1,170,500 404522 REGISTRATION FEES 34,900 34,900 404523 RESPITE CARE 1,113,000 852,000 404524 TRAINING COURSE FEES 47,600 54,600
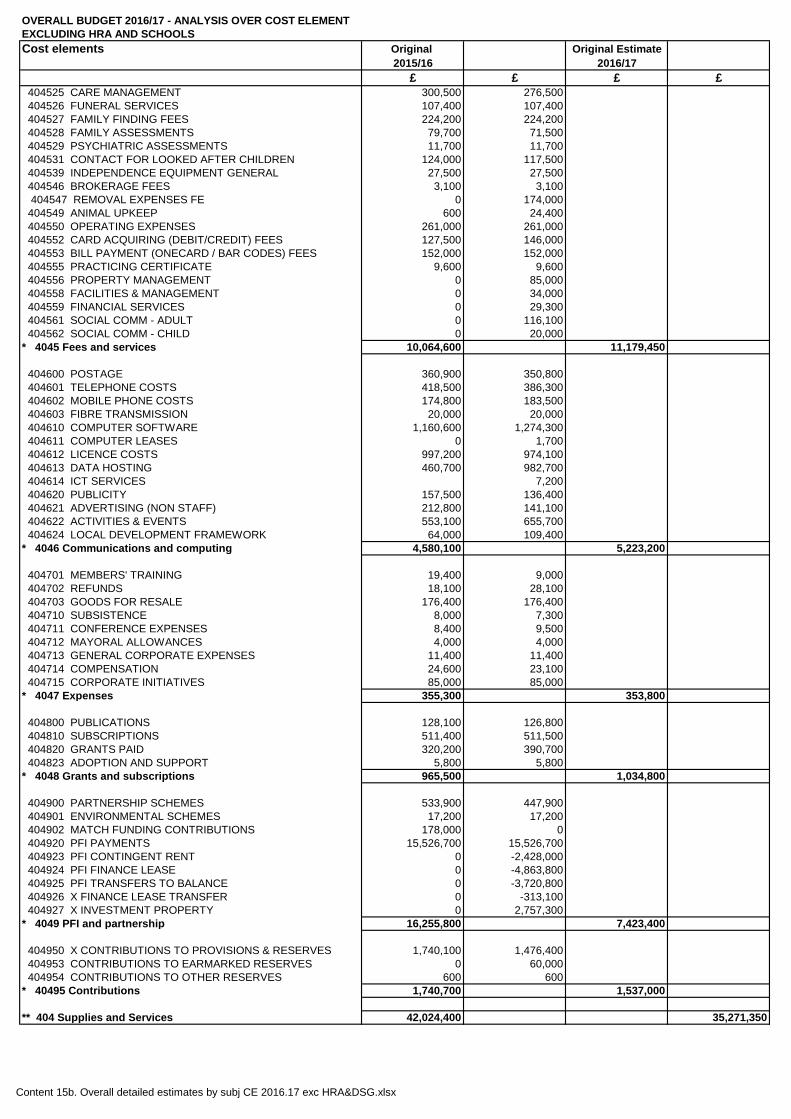
Content 15b. Overall detailed estimates by subj CE 2016.17 exc HRA&DSG.xlsx
OVERALL BUDGET 2016/17 - ANALYSIS OVER COST ELEMENTEXCLUDING HRA AND SCHOOLSCost elements Original Original Estimate
2015/16 2016/17£ £ £ £
404525 CARE MANAGEMENT 300,500 276,500 404526 FUNERAL SERVICES 107,400 107,400 404527 FAMILY FINDING FEES 224,200 224,200 404528 FAMILY ASSESSMENTS 79,700 71,500 404529 PSYCHIATRIC ASSESSMENTS 11,700 11,700 404531 CONTACT FOR LOOKED AFTER CHILDREN 124,000 117,500 404539 INDEPENDENCE EQUIPMENT GENERAL 27,500 27,500 404546 BROKERAGE FEES 3,100 3,100 404547 REMOVAL EXPENSES FE 0 174,000 404549 ANIMAL UPKEEP 600 24,400 404550 OPERATING EXPENSES 261,000 261,000 404552 CARD ACQUIRING (DEBIT/CREDIT) FEES 127,500 146,000 404553 BILL PAYMENT (ONECARD / BAR CODES) FEES 152,000 152,000 404555 PRACTICING CERTIFICATE 9,600 9,600 404556 PROPERTY MANAGEMENT 0 85,000 404558 FACILITIES & MANAGEMENT 0 34,000 404559 FINANCIAL SERVICES 0 29,300 404561 SOCIAL COMM - ADULT 0 116,100 404562 SOCIAL COMM - CHILD 0 20,000* 4045 Fees and services 10,064,600 11,179,450
404600 POSTAGE 360,900 350,800 404601 TELEPHONE COSTS 418,500 386,300 404602 MOBILE PHONE COSTS 174,800 183,500 404603 FIBRE TRANSMISSION 20,000 20,000 404610 COMPUTER SOFTWARE 1,160,600 1,274,300 404611 COMPUTER LEASES 0 1,700 404612 LICENCE COSTS 997,200 974,100 404613 DATA HOSTING 460,700 982,700 404614 ICT SERVICES 7,200 404620 PUBLICITY 157,500 136,400 404621 ADVERTISING (NON STAFF) 212,800 141,100 404622 ACTIVITIES & EVENTS 553,100 655,700 404624 LOCAL DEVELOPMENT FRAMEWORK 64,000 109,400* 4046 Communications and computing 4,580,100 5,223,200
404701 MEMBERS' TRAINING 19,400 9,000 404702 REFUNDS 18,100 28,100 404703 GOODS FOR RESALE 176,400 176,400 404710 SUBSISTENCE 8,000 7,300 404711 CONFERENCE EXPENSES 8,400 9,500 404712 MAYORAL ALLOWANCES 4,000 4,000 404713 GENERAL CORPORATE EXPENSES 11,400 11,400 404714 COMPENSATION 24,600 23,100 404715 CORPORATE INITIATIVES 85,000 85,000* 4047 Expenses 355,300 353,800
404800 PUBLICATIONS 128,100 126,800 404810 SUBSCRIPTIONS 511,400 511,500 404820 GRANTS PAID 320,200 390,700 404823 ADOPTION AND SUPPORT 5,800 5,800* 4048 Grants and subscriptions 965,500 1,034,800
404900 PARTNERSHIP SCHEMES 533,900 447,900 404901 ENVIRONMENTAL SCHEMES 17,200 17,200 404902 MATCH FUNDING CONTRIBUTIONS 178,000 0 404920 PFI PAYMENTS 15,526,700 15,526,700 404923 PFI CONTINGENT RENT 0 -2,428,000 404924 PFI FINANCE LEASE 0 -4,863,800 404925 PFI TRANSFERS TO BALANCE 0 -3,720,800 404926 X FINANCE LEASE TRANSFER 0 -313,100 404927 X INVESTMENT PROPERTY 0 2,757,300* 4049 PFI and partnership 16,255,800 7,423,400
404950 X CONTRIBUTIONS TO PROVISIONS & RESERVES 1,740,100 1,476,400 404953 CONTRIBUTIONS TO EARMARKED RESERVES 0 60,000 404954 CONTRIBUTIONS TO OTHER RESERVES 600 600* 40495 Contributions 1,740,700 1,537,000
** 404 Supplies and Services 42,024,400 35,271,350
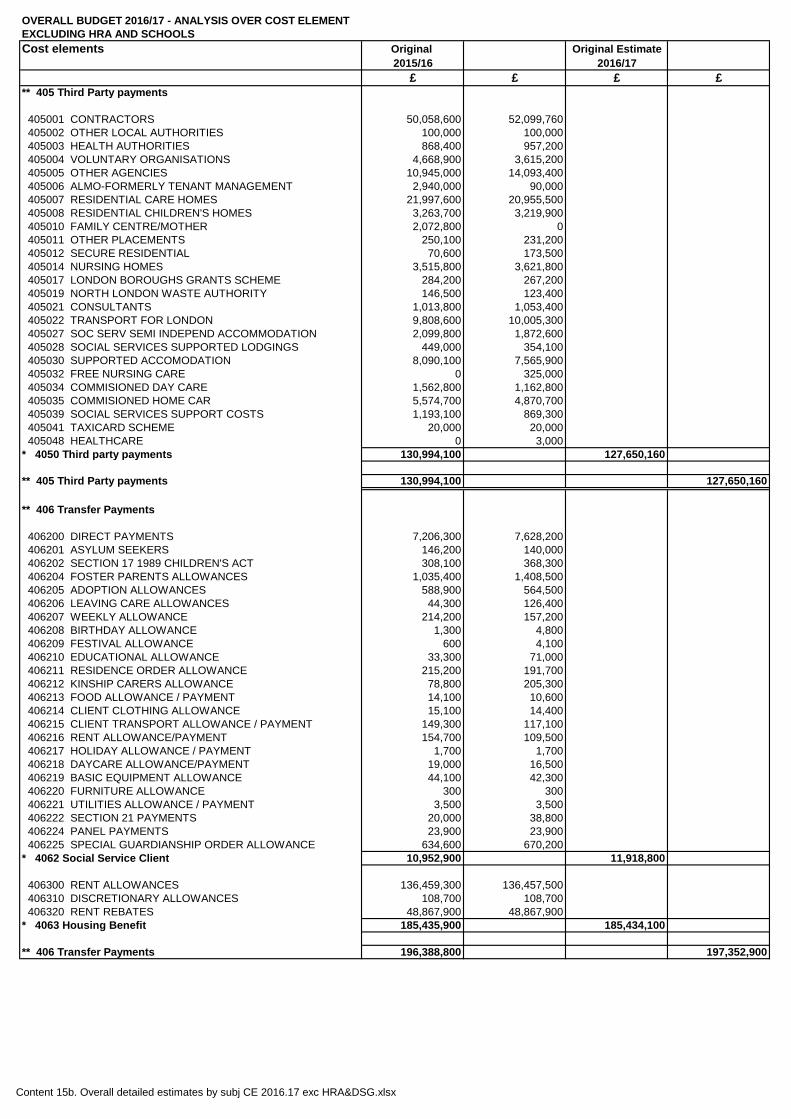
Content 15b. Overall detailed estimates by subj CE 2016.17 exc HRA&DSG.xlsx
OVERALL BUDGET 2016/17 - ANALYSIS OVER COST ELEMENTEXCLUDING HRA AND SCHOOLSCost elements Original Original Estimate
2015/16 2016/17£ £ £ £
** 405 Third Party payments
405001 CONTRACTORS 50,058,600 52,099,760 405002 OTHER LOCAL AUTHORITIES 100,000 100,000 405003 HEALTH AUTHORITIES 868,400 957,200 405004 VOLUNTARY ORGANISATIONS 4,668,900 3,615,200 405005 OTHER AGENCIES 10,945,000 14,093,400 405006 ALMO-FORMERLY TENANT MANAGEMENT 2,940,000 90,000 405007 RESIDENTIAL CARE HOMES 21,997,600 20,955,500 405008 RESIDENTIAL CHILDREN'S HOMES 3,263,700 3,219,900 405010 FAMILY CENTRE/MOTHER 2,072,800 0 405011 OTHER PLACEMENTS 250,100 231,200 405012 SECURE RESIDENTIAL 70,600 173,500 405014 NURSING HOMES 3,515,800 3,621,800 405017 LONDON BOROUGHS GRANTS SCHEME 284,200 267,200 405019 NORTH LONDON WASTE AUTHORITY 146,500 123,400 405021 CONSULTANTS 1,013,800 1,053,400 405022 TRANSPORT FOR LONDON 9,808,600 10,005,300 405027 SOC SERV SEMI INDEPEND ACCOMMODATION 2,099,800 1,872,600 405028 SOCIAL SERVICES SUPPORTED LODGINGS 449,000 354,100 405030 SUPPORTED ACCOMODATION 8,090,100 7,565,900 405032 FREE NURSING CARE 0 325,000 405034 COMMISIONED DAY CARE 1,562,800 1,162,800 405035 COMMISIONED HOME CAR 5,574,700 4,870,700 405039 SOCIAL SERVICES SUPPORT COSTS 1,193,100 869,300 405041 TAXICARD SCHEME 20,000 20,000 405048 HEALTHCARE 0 3,000* 4050 Third party payments 130,994,100 127,650,160
** 405 Third Party payments 130,994,100 127,650,160
** 406 Transfer Payments
406200 DIRECT PAYMENTS 7,206,300 7,628,200 406201 ASYLUM SEEKERS 146,200 140,000 406202 SECTION 17 1989 CHILDREN'S ACT 308,100 368,300 406204 FOSTER PARENTS ALLOWANCES 1,035,400 1,408,500 406205 ADOPTION ALLOWANCES 588,900 564,500 406206 LEAVING CARE ALLOWANCES 44,300 126,400 406207 WEEKLY ALLOWANCE 214,200 157,200 406208 BIRTHDAY ALLOWANCE 1,300 4,800 406209 FESTIVAL ALLOWANCE 600 4,100 406210 EDUCATIONAL ALLOWANCE 33,300 71,000 406211 RESIDENCE ORDER ALLOWANCE 215,200 191,700 406212 KINSHIP CARERS ALLOWANCE 78,800 205,300 406213 FOOD ALLOWANCE / PAYMENT 14,100 10,600 406214 CLIENT CLOTHING ALLOWANCE 15,100 14,400 406215 CLIENT TRANSPORT ALLOWANCE / PAYMENT 149,300 117,100 406216 RENT ALLOWANCE/PAYMENT 154,700 109,500 406217 HOLIDAY ALLOWANCE / PAYMENT 1,700 1,700 406218 DAYCARE ALLOWANCE/PAYMENT 19,000 16,500 406219 BASIC EQUIPMENT ALLOWANCE 44,100 42,300 406220 FURNITURE ALLOWANCE 300 300 406221 UTILITIES ALLOWANCE / PAYMENT 3,500 3,500 406222 SECTION 21 PAYMENTS 20,000 38,800 406224 PANEL PAYMENTS 23,900 23,900 406225 SPECIAL GUARDIANSHIP ORDER ALLOWANCE 634,600 670,200* 4062 Social Service Client 10,952,900 11,918,800
406300 RENT ALLOWANCES 136,459,300 136,457,500 406310 DISCRETIONARY ALLOWANCES 108,700 108,700 406320 RENT REBATES 48,867,900 48,867,900* 4063 Housing Benefit 185,435,900 185,434,100
** 406 Transfer Payments 196,388,800 197,352,900
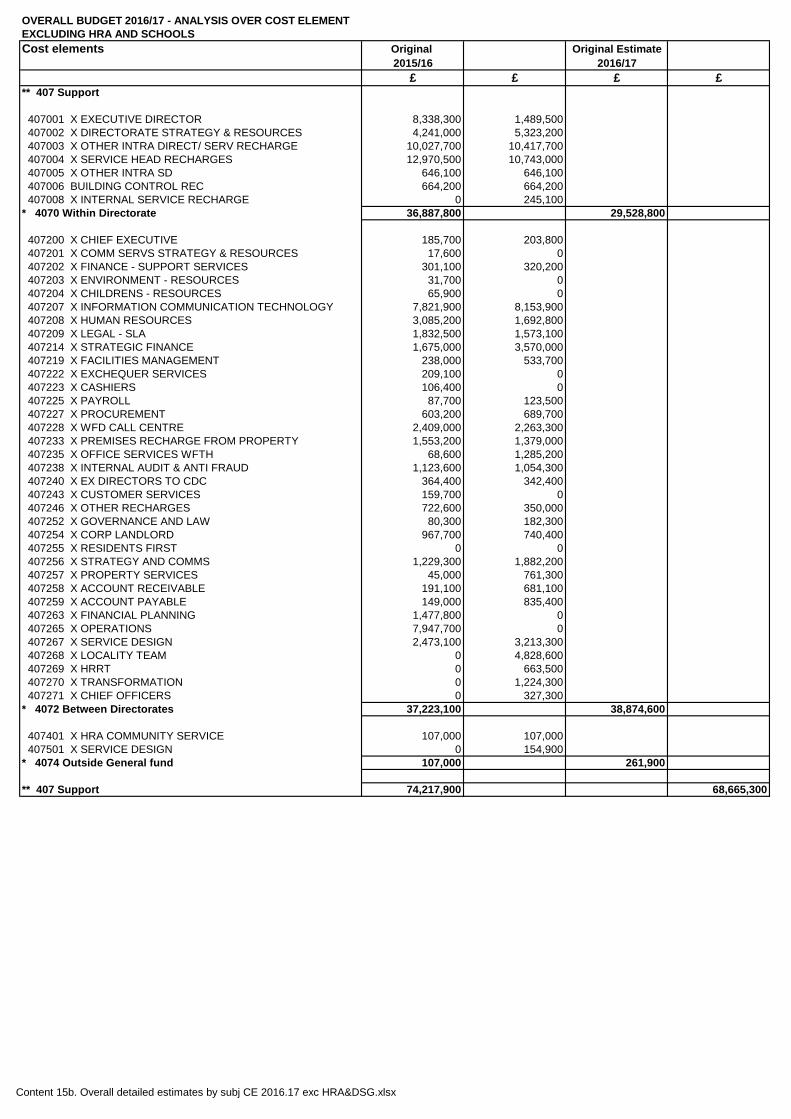
Content 15b. Overall detailed estimates by subj CE 2016.17 exc HRA&DSG.xlsx
OVERALL BUDGET 2016/17 - ANALYSIS OVER COST ELEMENTEXCLUDING HRA AND SCHOOLSCost elements Original Original Estimate
2015/16 2016/17£ £ £ £
** 407 Support
407001 X EXECUTIVE DIRECTOR 8,338,300 1,489,500 407002 X DIRECTORATE STRATEGY & RESOURCES 4,241,000 5,323,200 407003 X OTHER INTRA DIRECT/ SERV RECHARGE 10,027,700 10,417,700 407004 X SERVICE HEAD RECHARGES 12,970,500 10,743,000 407005 X OTHER INTRA SD 646,100 646,100 407006 BUILDING CONTROL REC 664,200 664,200 407008 X INTERNAL SERVICE RECHARGE 0 245,100* 4070 Within Directorate 36,887,800 29,528,800
407200 X CHIEF EXECUTIVE 185,700 203,800 407201 X COMM SERVS STRATEGY & RESOURCES 17,600 0 407202 X FINANCE - SUPPORT SERVICES 301,100 320,200 407203 X ENVIRONMENT - RESOURCES 31,700 0 407204 X CHILDRENS - RESOURCES 65,900 0 407207 X INFORMATION COMMUNICATION TECHNOLOGY 7,821,900 8,153,900 407208 X HUMAN RESOURCES 3,085,200 1,692,800 407209 X LEGAL - SLA 1,832,500 1,573,100 407214 X STRATEGIC FINANCE 1,675,000 3,570,000 407219 X FACILITIES MANAGEMENT 238,000 533,700 407222 X EXCHEQUER SERVICES 209,100 0 407223 X CASHIERS 106,400 0 407225 X PAYROLL 87,700 123,500 407227 X PROCUREMENT 603,200 689,700 407228 X WFD CALL CENTRE 2,409,000 2,263,300 407233 X PREMISES RECHARGE FROM PROPERTY 1,553,200 1,379,000 407235 X OFFICE SERVICES WFTH 68,600 1,285,200 407238 X INTERNAL AUDIT & ANTI FRAUD 1,123,600 1,054,300 407240 X EX DIRECTORS TO CDC 364,400 342,400 407243 X CUSTOMER SERVICES 159,700 0 407246 X OTHER RECHARGES 722,600 350,000 407252 X GOVERNANCE AND LAW 80,300 182,300 407254 X CORP LANDLORD 967,700 740,400 407255 X RESIDENTS FIRST 0 0 407256 X STRATEGY AND COMMS 1,229,300 1,882,200 407257 X PROPERTY SERVICES 45,000 761,300 407258 X ACCOUNT RECEIVABLE 191,100 681,100 407259 X ACCOUNT PAYABLE 149,000 835,400 407263 X FINANCIAL PLANNING 1,477,800 0 407265 X OPERATIONS 7,947,700 0 407267 X SERVICE DESIGN 2,473,100 3,213,300 407268 X LOCALITY TEAM 0 4,828,600 407269 X HRRT 0 663,500 407270 X TRANSFORMATION 0 1,224,300 407271 X CHIEF OFFICERS 0 327,300* 4072 Between Directorates 37,223,100 38,874,600
407401 X HRA COMMUNITY SERVICE 107,000 107,000 407501 X SERVICE DESIGN 0 154,900* 4074 Outside General fund 107,000 261,900
** 407 Support 74,217,900 68,665,300
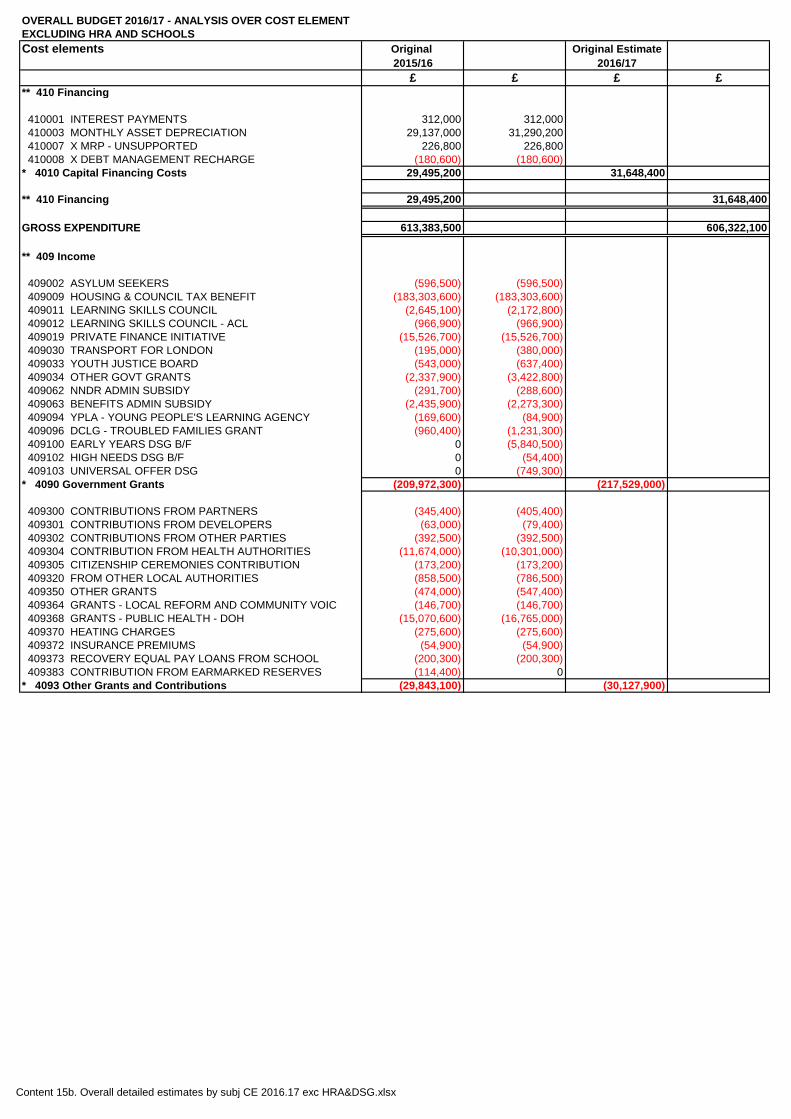
Content 15b. Overall detailed estimates by subj CE 2016.17 exc HRA&DSG.xlsx
OVERALL BUDGET 2016/17 - ANALYSIS OVER COST ELEMENTEXCLUDING HRA AND SCHOOLSCost elements Original Original Estimate
2015/16 2016/17£ £ £ £
** 410 Financing
410001 INTEREST PAYMENTS 312,000 312,000 410003 MONTHLY ASSET DEPRECIATION 29,137,000 31,290,200 410007 X MRP - UNSUPPORTED 226,800 226,800 410008 X DEBT MANAGEMENT RECHARGE (180,600) (180,600)* 4010 Capital Financing Costs 29,495,200 31,648,400
** 410 Financing 29,495,200 31,648,400
GROSS EXPENDITURE 613,383,500 606,322,100
** 409 Income
409002 ASYLUM SEEKERS (596,500) (596,500) 409009 HOUSING & COUNCIL TAX BENEFIT (183,303,600) (183,303,600) 409011 LEARNING SKILLS COUNCIL (2,645,100) (2,172,800) 409012 LEARNING SKILLS COUNCIL - ACL (966,900) (966,900) 409019 PRIVATE FINANCE INITIATIVE (15,526,700) (15,526,700) 409030 TRANSPORT FOR LONDON (195,000) (380,000) 409033 YOUTH JUSTICE BOARD (543,000) (637,400) 409034 OTHER GOVT GRANTS (2,337,900) (3,422,800) 409062 NNDR ADMIN SUBSIDY (291,700) (288,600) 409063 BENEFITS ADMIN SUBSIDY (2,435,900) (2,273,300) 409094 YPLA - YOUNG PEOPLE'S LEARNING AGENCY (169,600) (84,900) 409096 DCLG - TROUBLED FAMILIES GRANT (960,400) (1,231,300) 409100 EARLY YEARS DSG B/F 0 (5,840,500) 409102 HIGH NEEDS DSG B/F 0 (54,400) 409103 UNIVERSAL OFFER DSG 0 (749,300)* 4090 Government Grants (209,972,300) (217,529,000)
409300 CONTRIBUTIONS FROM PARTNERS (345,400) (405,400) 409301 CONTRIBUTIONS FROM DEVELOPERS (63,000) (79,400) 409302 CONTRIBUTIONS FROM OTHER PARTIES (392,500) (392,500) 409304 CONTRIBUTION FROM HEALTH AUTHORITIES (11,674,000) (10,301,000) 409305 CITIZENSHIP CEREMONIES CONTRIBUTION (173,200) (173,200) 409320 FROM OTHER LOCAL AUTHORITIES (858,500) (786,500) 409350 OTHER GRANTS (474,000) (547,400) 409364 GRANTS - LOCAL REFORM AND COMMUNITY VOIC (146,700) (146,700) 409368 GRANTS - PUBLIC HEALTH - DOH (15,070,600) (16,765,000) 409370 HEATING CHARGES (275,600) (275,600) 409372 INSURANCE PREMIUMS (54,900) (54,900) 409373 RECOVERY EQUAL PAY LOANS FROM SCHOOL (200,300) (200,300) 409383 CONTRIBUTION FROM EARMARKED RESERVES (114,400) 0* 4093 Other Grants and Contributions (29,843,100) (30,127,900)
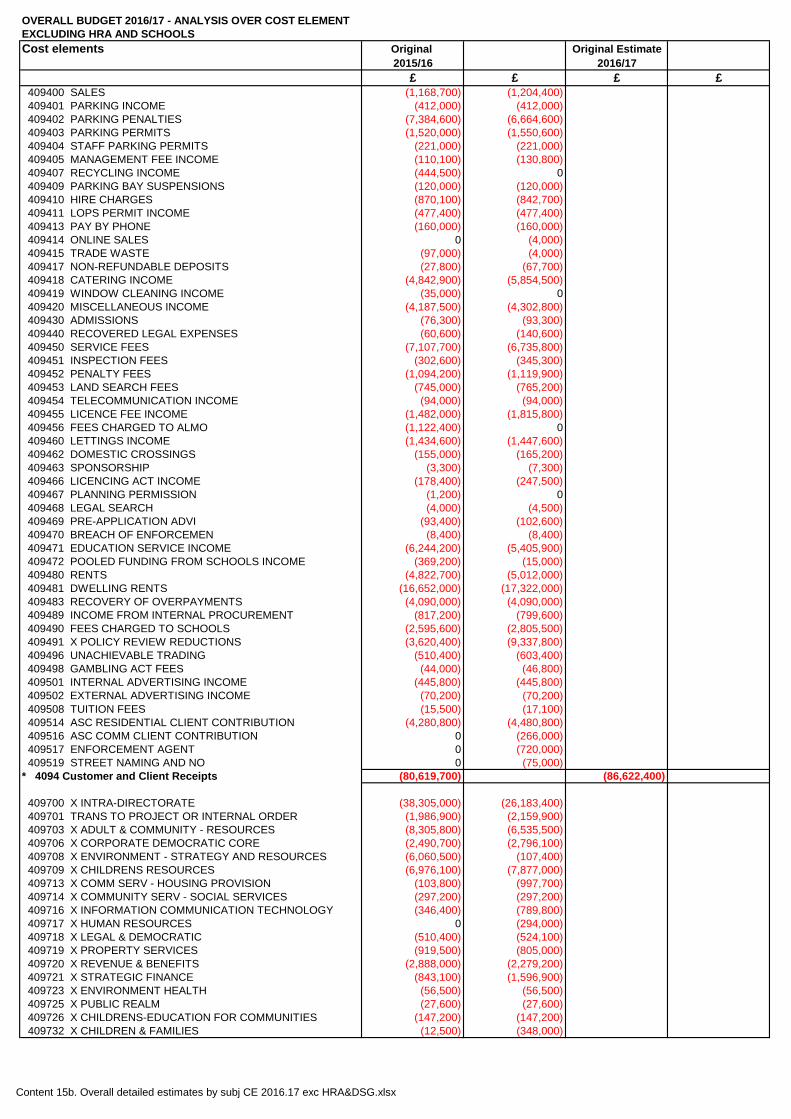
Content 15b. Overall detailed estimates by subj CE 2016.17 exc HRA&DSG.xlsx
OVERALL BUDGET 2016/17 - ANALYSIS OVER COST ELEMENTEXCLUDING HRA AND SCHOOLSCost elements Original Original Estimate
2015/16 2016/17£ £ £ £
409400 SALES (1,168,700) (1,204,400) 409401 PARKING INCOME (412,000) (412,000) 409402 PARKING PENALTIES (7,384,600) (6,664,600) 409403 PARKING PERMITS (1,520,000) (1,550,600) 409404 STAFF PARKING PERMITS (221,000) (221,000) 409405 MANAGEMENT FEE INCOME (110,100) (130,800) 409407 RECYCLING INCOME (444,500) 0 409409 PARKING BAY SUSPENSIONS (120,000) (120,000) 409410 HIRE CHARGES (870,100) (842,700) 409411 LOPS PERMIT INCOME (477,400) (477,400) 409413 PAY BY PHONE (160,000) (160,000) 409414 ONLINE SALES 0 (4,000) 409415 TRADE WASTE (97,000) (4,000) 409417 NON-REFUNDABLE DEPOSITS (27,800) (67,700) 409418 CATERING INCOME (4,842,900) (5,854,500) 409419 WINDOW CLEANING INCOME (35,000) 0 409420 MISCELLANEOUS INCOME (4,187,500) (4,302,800) 409430 ADMISSIONS (76,300) (93,300) 409440 RECOVERED LEGAL EXPENSES (60,600) (140,600) 409450 SERVICE FEES (7,107,700) (6,735,800) 409451 INSPECTION FEES (302,600) (345,300) 409452 PENALTY FEES (1,094,200) (1,119,900) 409453 LAND SEARCH FEES (745,000) (765,200) 409454 TELECOMMUNICATION INCOME (94,000) (94,000) 409455 LICENCE FEE INCOME (1,482,000) (1,815,800) 409456 FEES CHARGED TO ALMO (1,122,400) 0 409460 LETTINGS INCOME (1,434,600) (1,447,600) 409462 DOMESTIC CROSSINGS (155,000) (165,200) 409463 SPONSORSHIP (3,300) (7,300) 409466 LICENCING ACT INCOME (178,400) (247,500) 409467 PLANNING PERMISSION (1,200) 0 409468 LEGAL SEARCH (4,000) (4,500) 409469 PRE-APPLICATION ADVI (93,400) (102,600) 409470 BREACH OF ENFORCEMEN (8,400) (8,400) 409471 EDUCATION SERVICE INCOME (6,244,200) (5,405,900) 409472 POOLED FUNDING FROM SCHOOLS INCOME (369,200) (15,000) 409480 RENTS (4,822,700) (5,012,000) 409481 DWELLING RENTS (16,652,000) (17,322,000) 409483 RECOVERY OF OVERPAYMENTS (4,090,000) (4,090,000) 409489 INCOME FROM INTERNAL PROCUREMENT (817,200) (799,600) 409490 FEES CHARGED TO SCHOOLS (2,595,600) (2,805,500) 409491 X POLICY REVIEW REDUCTIONS (3,620,400) (9,337,800) 409496 UNACHIEVABLE TRADING (510,400) (603,400) 409498 GAMBLING ACT FEES (44,000) (46,800) 409501 INTERNAL ADVERTISING INCOME (445,800) (445,800) 409502 EXTERNAL ADVERTISING INCOME (70,200) (70,200) 409508 TUITION FEES (15,500) (17,100) 409514 ASC RESIDENTIAL CLIENT CONTRIBUTION (4,280,800) (4,480,800) 409516 ASC COMM CLIENT CONTRIBUTION 0 (266,000) 409517 ENFORCEMENT AGENT 0 (720,000) 409519 STREET NAMING AND NO 0 (75,000)* 4094 Customer and Client Receipts (80,619,700) (86,622,400)
409700 X INTRA-DIRECTORATE (38,305,000) (26,183,400) 409701 TRANS TO PROJECT OR INTERNAL ORDER (1,986,900) (2,159,900) 409703 X ADULT & COMMUNITY - RESOURCES (8,305,800) (6,535,500) 409706 X CORPORATE DEMOCRATIC CORE (2,490,700) (2,796,100) 409708 X ENVIRONMENT - STRATEGY AND RESOURCES (6,060,500) (107,400) 409709 X CHILDRENS RESOURCES (6,976,100) (7,877,000) 409713 X COMM SERV - HOUSING PROVISION (103,800) (997,700) 409714 X COMMUNITY SERV - SOCIAL SERVICES (297,200) (297,200) 409716 X INFORMATION COMMUNICATION TECHNOLOGY (346,400) (789,800) 409717 X HUMAN RESOURCES 0 (294,000) 409718 X LEGAL & DEMOCRATIC (510,400) (524,100) 409719 X PROPERTY SERVICES (919,500) (805,000) 409720 X REVENUE & BENEFITS (2,888,000) (2,279,200) 409721 X STRATEGIC FINANCE (843,100) (1,596,900) 409723 X ENVIRONMENT HEALTH (56,500) (56,500) 409725 X PUBLIC REALM (27,600) (27,600) 409726 X CHILDRENS-EDUCATION FOR COMMUNITIES (147,200) (147,200) 409732 X CHILDREN & FAMILIES (12,500) (348,000)
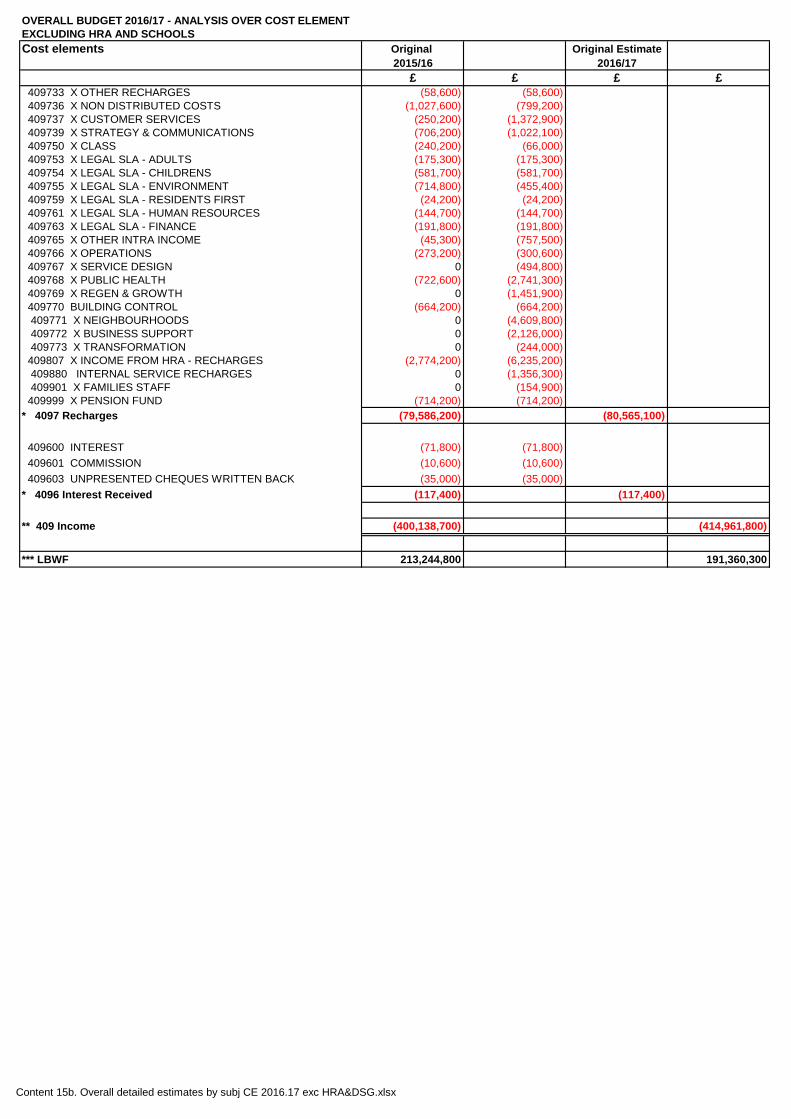
Content 15b. Overall detailed estimates by subj CE 2016.17 exc HRA&DSG.xlsx
OVERALL BUDGET 2016/17 - ANALYSIS OVER COST ELEMENTEXCLUDING HRA AND SCHOOLSCost elements Original Original Estimate
2015/16 2016/17£ £ £ £
409733 X OTHER RECHARGES (58,600) (58,600) 409736 X NON DISTRIBUTED COSTS (1,027,600) (799,200) 409737 X CUSTOMER SERVICES (250,200) (1,372,900) 409739 X STRATEGY & COMMUNICATIONS (706,200) (1,022,100) 409750 X CLASS (240,200) (66,000) 409753 X LEGAL SLA - ADULTS (175,300) (175,300) 409754 X LEGAL SLA - CHILDRENS (581,700) (581,700) 409755 X LEGAL SLA - ENVIRONMENT (714,800) (455,400) 409759 X LEGAL SLA - RESIDENTS FIRST (24,200) (24,200) 409761 X LEGAL SLA - HUMAN RESOURCES (144,700) (144,700) 409763 X LEGAL SLA - FINANCE (191,800) (191,800) 409765 X OTHER INTRA INCOME (45,300) (757,500) 409766 X OPERATIONS (273,200) (300,600) 409767 X SERVICE DESIGN 0 (494,800) 409768 X PUBLIC HEALTH (722,600) (2,741,300) 409769 X REGEN & GROWTH 0 (1,451,900) 409770 BUILDING CONTROL (664,200) (664,200) 409771 X NEIGHBOURHOODS 0 (4,609,800) 409772 X BUSINESS SUPPORT 0 (2,126,000) 409773 X TRANSFORMATION 0 (244,000) 409807 X INCOME FROM HRA - RECHARGES (2,774,200) (6,235,200) 409880 INTERNAL SERVICE RECHARGES 0 (1,356,300) 409901 X FAMILIES STAFF 0 (154,900) 409999 X PENSION FUND (714,200) (714,200)* 4097 Recharges (79,586,200) (80,565,100)
409600 INTEREST (71,800) (71,800) 409601 COMMISSION (10,600) (10,600) 409603 UNPRESENTED CHEQUES WRITTEN BACK (35,000) (35,000)* 4096 Interest Received (117,400) (117,400)
** 409 Income (400,138,700) (414,961,800)
*** LBWF 213,244,800 191,360,300
Content 16. Capital Budget - General introduction.doc
CAPITAL BUDGET 2016/17 TO 2019/20
The Capital Strategy incorporates the Capital Programme for the four year period 2016/17 to 2019/20. The Capital Programme summarises anticipated capital spending and estimated resources available for financing. These resources include government grants, capital receipts, prudential borrowing, direct revenue funding (including reserves) and other capital income. The capital programme has been categorised into seven blocks: Culture and Communities, Schools, Operations, Neighbourhoods, Regeneration and Growth, Housing and Growth, plus an amount for programme Contingency. It shows the estimated costs for schemes in progress phased over the anticipated life of each scheme. The Capital Programme is based upon an estimate of achieving a total of £26 million in capital receipts over the years 2015/16 to 2017/18. If the disposals programme realises more or less than anticipated, the Capital Programme will be reviewed. External resources, in particular grant allocations, are usually announced over a one or two year time frame; therefore the majority of schemes will only be forecast over this period. The programme is updated quarterly for any changes in resources, and refreshed annually. The Capital Programme endeavours to deliver schemes and projects which meet Council objectives and priorities. When planning new capital projects, services should have regard to value for money objectives, and these need to be demonstrated when putting forward bids for capital resources.
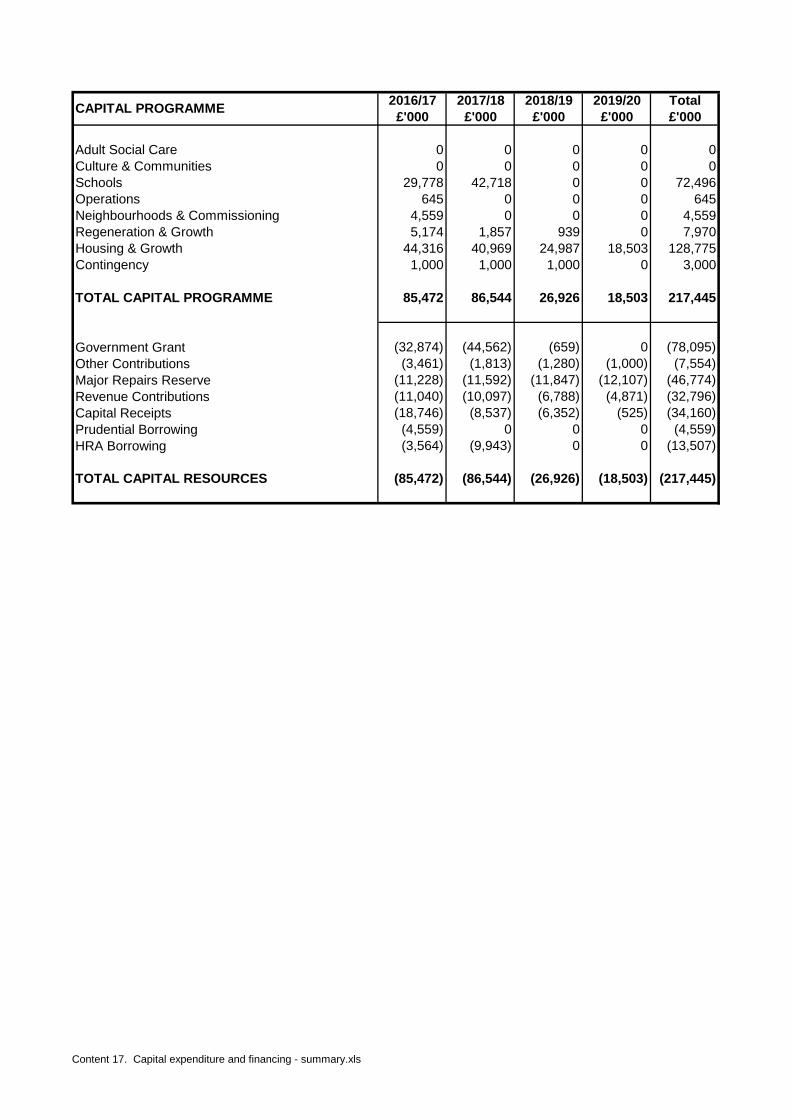
Content 17. Capital expenditure and financing - summary.xls
2016/17 2017/18 2018/19 2019/20 Total£'000 £'000 £'000 £'000 £'000
Adult Social Care 0 0 0 0 0Culture & Communities 0 0 0 0 0Schools 29,778 42,718 0 0 72,496Operations 645 0 0 0 645Neighbourhoods & Commissioning 4,559 0 0 0 4,559Regeneration & Growth 5,174 1,857 939 0 7,970Housing & Growth 44,316 40,969 24,987 18,503 128,775Contingency 1,000 1,000 1,000 0 3,000
TOTAL CAPITAL PROGRAMME 85,472 86,544 26,926 18,503 217,445
Government Grant (32,874) (44,562) (659) 0 (78,095)Other Contributions (3,461) (1,813) (1,280) (1,000) (7,554)Major Repairs Reserve (11,228) (11,592) (11,847) (12,107) (46,774)Revenue Contributions (11,040) (10,097) (6,788) (4,871) (32,796)Capital Receipts (18,746) (8,537) (6,352) (525) (34,160)Prudential Borrowing (4,559) 0 0 0 (4,559)HRA Borrowing (3,564) (9,943) 0 0 (13,507)
TOTAL CAPITAL RESOURCES (85,472) (86,544) (26,926) (18,503) (217,445)
CAPITAL PROGRAMME
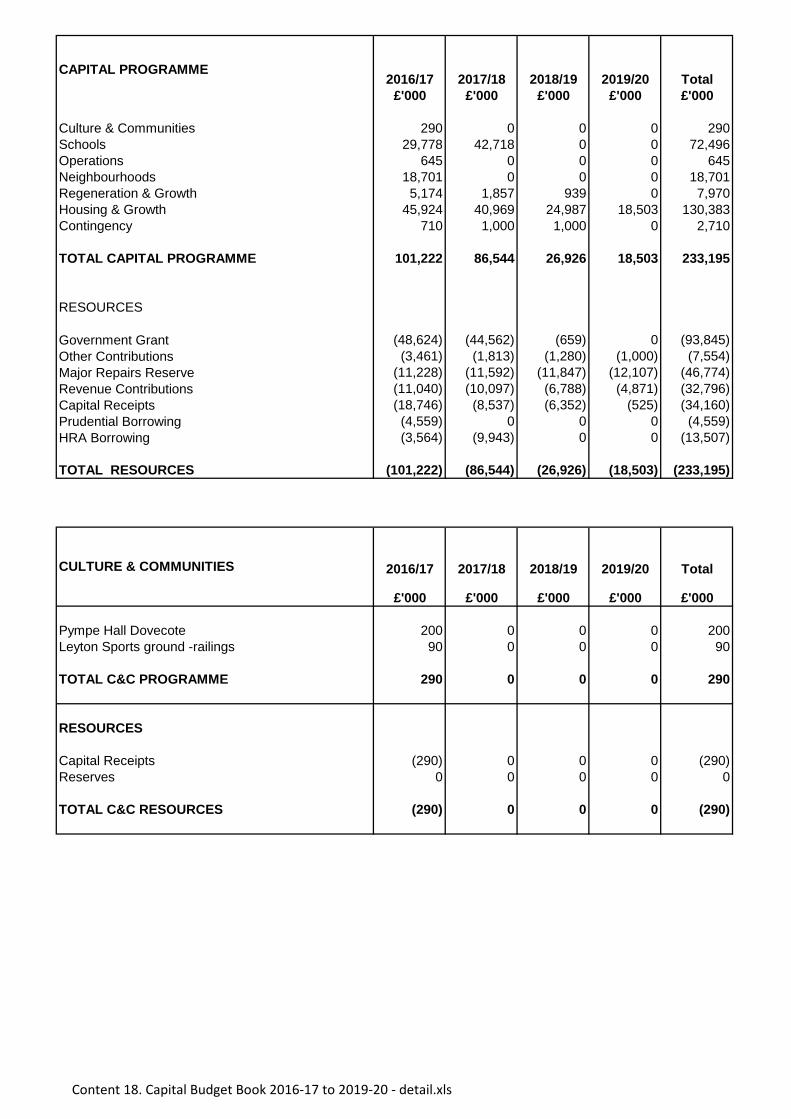
Content 18. Capital Budget Book 2016-17 to 2019-20 - detail.xls
2016/17 2017/18 2018/19 2019/20 Total£'000 £'000 £'000 £'000 £'000
Culture & Communities 290 0 0 0 290Schools 29,778 42,718 0 0 72,496Operations 645 0 0 0 645Neighbourhoods 18,701 0 0 0 18,701Regeneration & Growth 5,174 1,857 939 0 7,970Housing & Growth 45,924 40,969 24,987 18,503 130,383Contingency 710 1,000 1,000 0 2,710
TOTAL CAPITAL PROGRAMME 101,222 86,544 26,926 18,503 233,195
RESOURCES
Government Grant (48,624) (44,562) (659) 0 (93,845)Other Contributions (3,461) (1,813) (1,280) (1,000) (7,554)Major Repairs Reserve (11,228) (11,592) (11,847) (12,107) (46,774)Revenue Contributions (11,040) (10,097) (6,788) (4,871) (32,796)Capital Receipts (18,746) (8,537) (6,352) (525) (34,160)Prudential Borrowing (4,559) 0 0 0 (4,559)HRA Borrowing (3,564) (9,943) 0 0 (13,507)
TOTAL RESOURCES (101,222) (86,544) (26,926) (18,503) (233,195)
2016/17 2017/18 2018/19 2019/20 Total
£'000 £'000 £'000 £'000 £'000
Pympe Hall Dovecote 200 0 0 0 200Leyton Sports ground -railings 90 0 0 0 90
TOTAL C&C PROGRAMME 290 0 0 0 290
RESOURCES
Capital Receipts (290) 0 0 0 (290)Reserves 0 0 0 0 0
TOTAL C&C RESOURCES (290) 0 0 0 (290)
CAPITAL PROGRAMME
CULTURE & COMMUNITIES
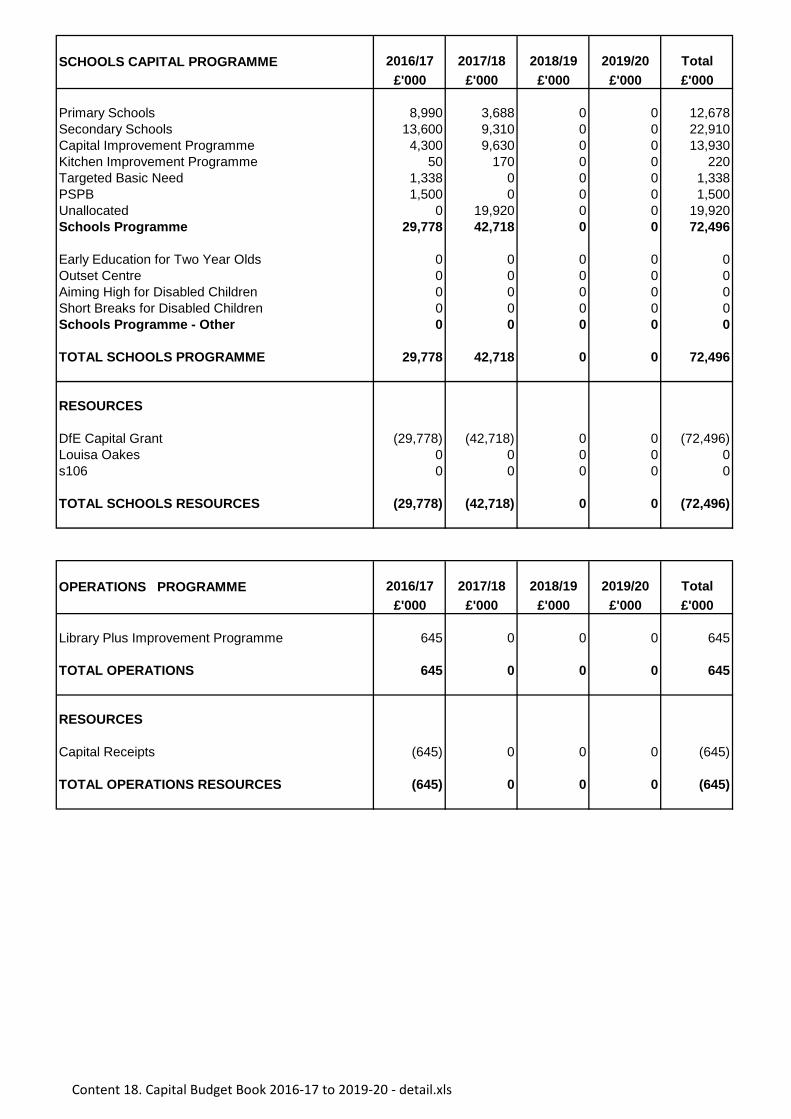
Content 18. Capital Budget Book 2016-17 to 2019-20 - detail.xls
2016/17 2017/18 2018/19 2019/20 Total£'000 £'000 £'000 £'000 £'000
Primary Schools 8,990 3,688 0 0 12,678Secondary Schools 13,600 9,310 0 0 22,910Capital Improvement Programme 4,300 9,630 0 0 13,930Kitchen Improvement Programme 50 170 0 0 220Targeted Basic Need 1,338 0 0 0 1,338PSPB 1,500 0 0 0 1,500Unallocated 0 19,920 0 0 19,920Schools Programme 29,778 42,718 0 0 72,496
Early Education for Two Year Olds 0 0 0 0 0Outset Centre 0 0 0 0 0Aiming High for Disabled Children 0 0 0 0 0Short Breaks for Disabled Children 0 0 0 0 0Schools Programme - Other 0 0 0 0 0
TOTAL SCHOOLS PROGRAMME 29,778 42,718 0 0 72,496
RESOURCES
DfE Capital Grant (29,778) (42,718) 0 0 (72,496)Louisa Oakes 0 0 0 0 0s106 0 0 0 0 0
TOTAL SCHOOLS RESOURCES (29,778) (42,718) 0 0 (72,496)
2016/17 2017/18 2018/19 2019/20 Total£'000 £'000 £'000 £'000 £'000
Library Plus Improvement Programme 645 0 0 0 645
TOTAL OPERATIONS 645 0 0 0 645
RESOURCES
Capital Receipts (645) 0 0 0 (645)
TOTAL OPERATIONS RESOURCES (645) 0 0 0 (645)
SCHOOLS CAPITAL PROGRAMME
OPERATIONS PROGRAMME
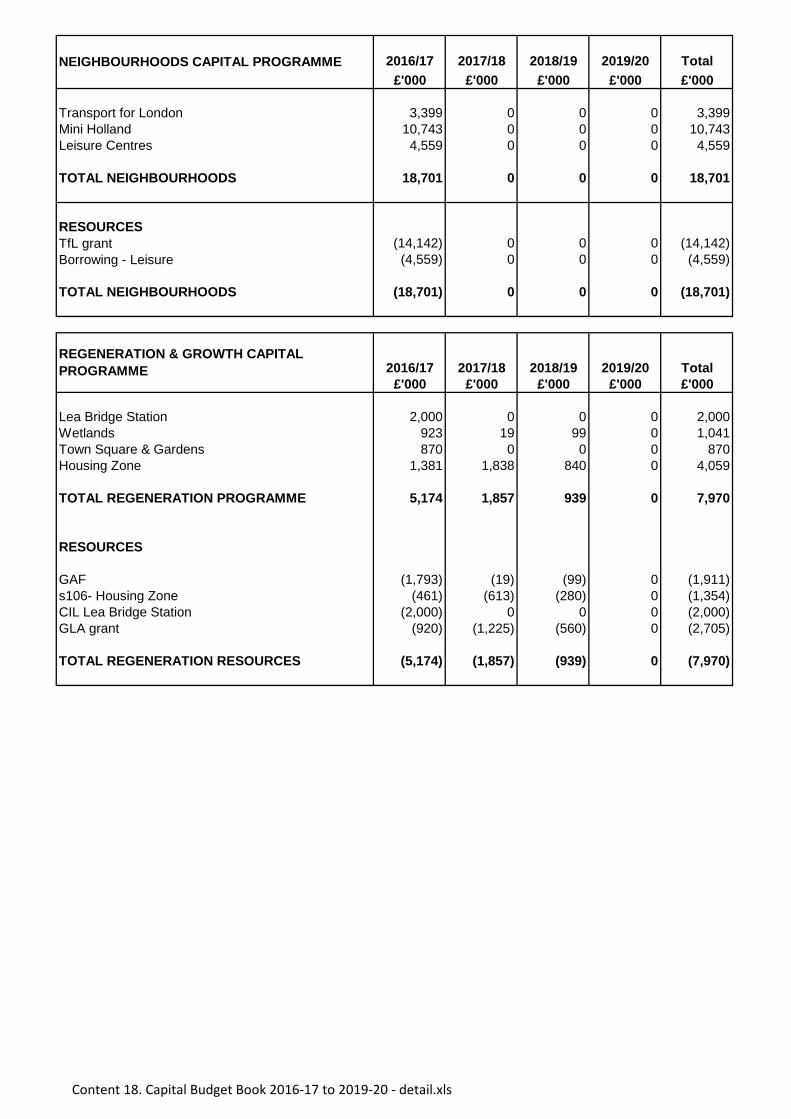
Content 18. Capital Budget Book 2016-17 to 2019-20 - detail.xls
2016/17 2017/18 2018/19 2019/20 Total£'000 £'000 £'000 £'000 £'000
Transport for London 3,399 0 0 0 3,399Mini Holland 10,743 0 0 0 10,743Leisure Centres 4,559 0 0 0 4,559
TOTAL NEIGHBOURHOODS 18,701 0 0 0 18,701
RESOURCESTfL grant (14,142) 0 0 0 (14,142)Borrowing - Leisure (4,559) 0 0 0 (4,559)
TOTAL NEIGHBOURHOODS (18,701) 0 0 0 (18,701)
2016/17 2017/18 2018/19 2019/20 Total£'000 £'000 £'000 £'000 £'000
Lea Bridge Station 2,000 0 0 0 2,000Wetlands 923 19 99 0 1,041Town Square & Gardens 870 0 0 0 870Housing Zone 1,381 1,838 840 0 4,059
TOTAL REGENERATION PROGRAMME 5,174 1,857 939 0 7,970
RESOURCES
GAF (1,793) (19) (99) 0 (1,911)s106- Housing Zone (461) (613) (280) 0 (1,354)CIL Lea Bridge Station (2,000) 0 0 0 (2,000)GLA grant (920) (1,225) (560) 0 (2,705)
TOTAL REGENERATION RESOURCES (5,174) (1,857) (939) 0 (7,970)
NEIGHBOURHOODS CAPITAL PROGRAMME
REGENERATION & GROWTH CAPITAL PROGRAMME
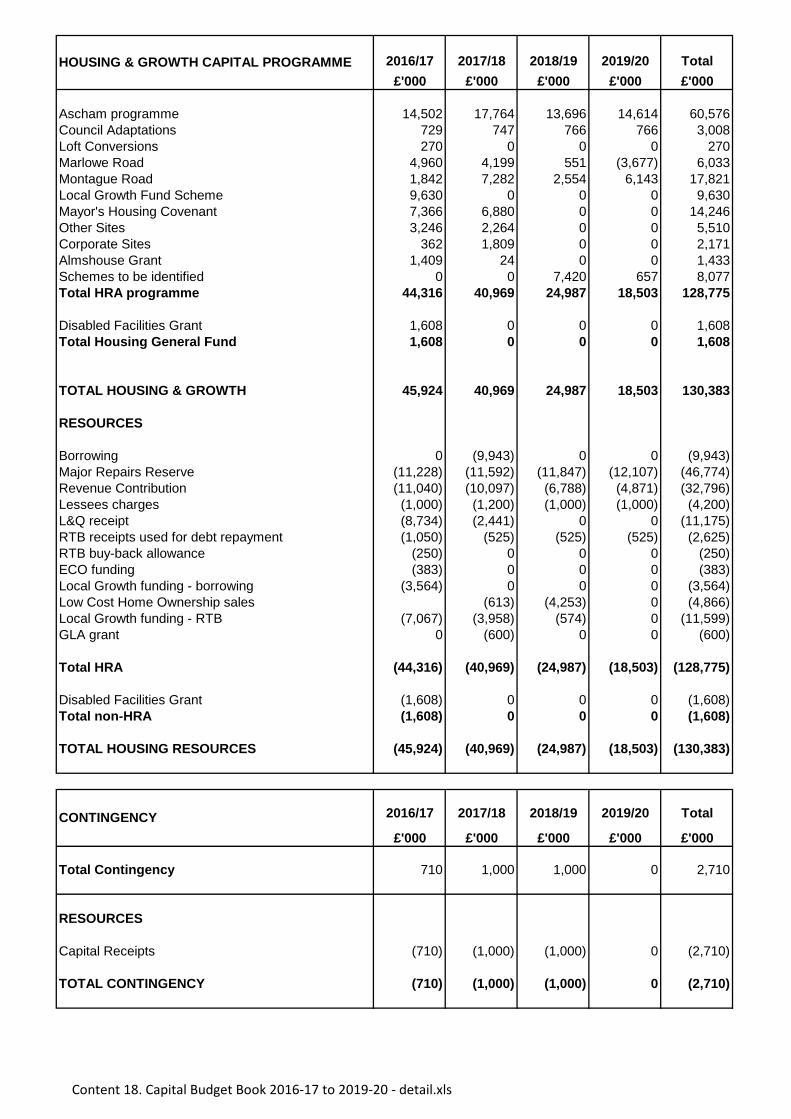
Content 18. Capital Budget Book 2016-17 to 2019-20 - detail.xls
2016/17 2017/18 2018/19 2019/20 Total£'000 £'000 £'000 £'000 £'000
Ascham programme 14,502 17,764 13,696 14,614 60,576Council Adaptations 729 747 766 766 3,008Loft Conversions 270 0 0 0 270Marlowe Road 4,960 4,199 551 (3,677) 6,033Montague Road 1,842 7,282 2,554 6,143 17,821Local Growth Fund Scheme 9,630 0 0 0 9,630Mayor's Housing Covenant 7,366 6,880 0 0 14,246Other Sites 3,246 2,264 0 0 5,510Corporate Sites 362 1,809 0 0 2,171Almshouse Grant 1,409 24 0 0 1,433Schemes to be identified 0 0 7,420 657 8,077Total HRA programme 44,316 40,969 24,987 18,503 128,775
Disabled Facilities Grant 1,608 0 0 0 1,608Total Housing General Fund 1,608 0 0 0 1,608
TOTAL HOUSING & GROWTH 45,924 40,969 24,987 18,503 130,383
RESOURCES
Borrowing 0 (9,943) 0 0 (9,943)Major Repairs Reserve (11,228) (11,592) (11,847) (12,107) (46,774)Revenue Contribution (11,040) (10,097) (6,788) (4,871) (32,796)Lessees charges (1,000) (1,200) (1,000) (1,000) (4,200)L&Q receipt (8,734) (2,441) 0 0 (11,175)RTB receipts used for debt repayment (1,050) (525) (525) (525) (2,625)RTB buy-back allowance (250) 0 0 0 (250)ECO funding (383) 0 0 0 (383)Local Growth funding - borrowing (3,564) 0 0 0 (3,564)Low Cost Home Ownership sales (613) (4,253) 0 (4,866)Local Growth funding - RTB (7,067) (3,958) (574) 0 (11,599)GLA grant 0 (600) 0 0 (600)
Total HRA (44,316) (40,969) (24,987) (18,503) (128,775)
Disabled Facilities Grant (1,608) 0 0 0 (1,608)Total non-HRA (1,608) 0 0 0 (1,608)
TOTAL HOUSING RESOURCES (45,924) (40,969) (24,987) (18,503) (130,383)
2016/17 2017/18 2018/19 2019/20 Total
£'000 £'000 £'000 £'000 £'000
Total Contingency 710 1,000 1,000 0 2,710
RESOURCES
Capital Receipts (710) (1,000) (1,000) 0 (2,710)
TOTAL CONTINGENCY (710) (1,000) (1,000) 0 (2,710)
HOUSING & GROWTH CAPITAL PROGRAMME
CONTINGENCY
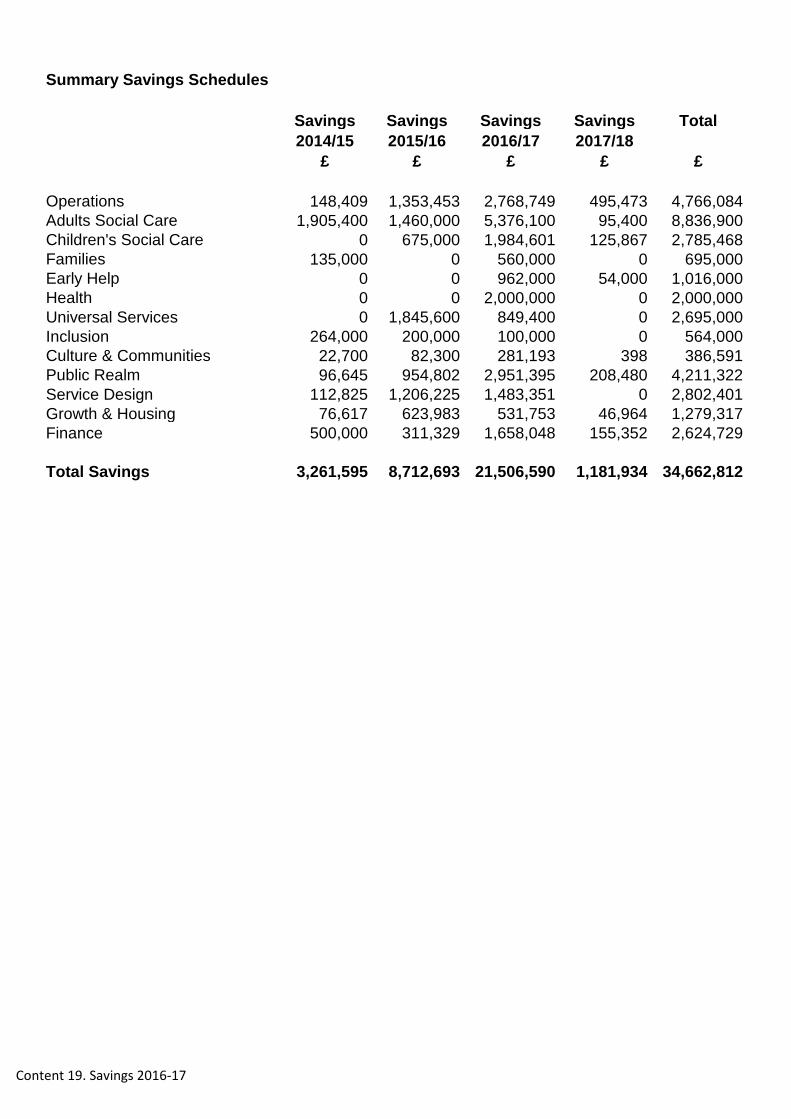
Content 19. Savings 2016-17
Summary Savings Schedules
Savings Savings Savings Savings Total2014/15 2015/16 2016/17 2017/18
£ £ £ £ £
Operations 148,409 1,353,453 2,768,749 495,473 4,766,084Adults Social Care 1,905,400 1,460,000 5,376,100 95,400 8,836,900Children's Social Care 0 675,000 1,984,601 125,867 2,785,468Families 135,000 0 560,000 0 695,000Early Help 0 0 962,000 54,000 1,016,000Health 0 0 2,000,000 0 2,000,000Universal Services 0 1,845,600 849,400 0 2,695,000Inclusion 264,000 200,000 100,000 0 564,000Culture & Communities 22,700 82,300 281,193 398 386,591Public Realm 96,645 954,802 2,951,395 208,480 4,211,322Service Design 112,825 1,206,225 1,483,351 0 2,802,401Growth & Housing 76,617 623,983 531,753 46,964 1,279,317Finance 500,000 311,329 1,658,048 155,352 2,624,729
Total Savings 3,261,595 8,712,693 21,506,590 1,181,934 34,662,812
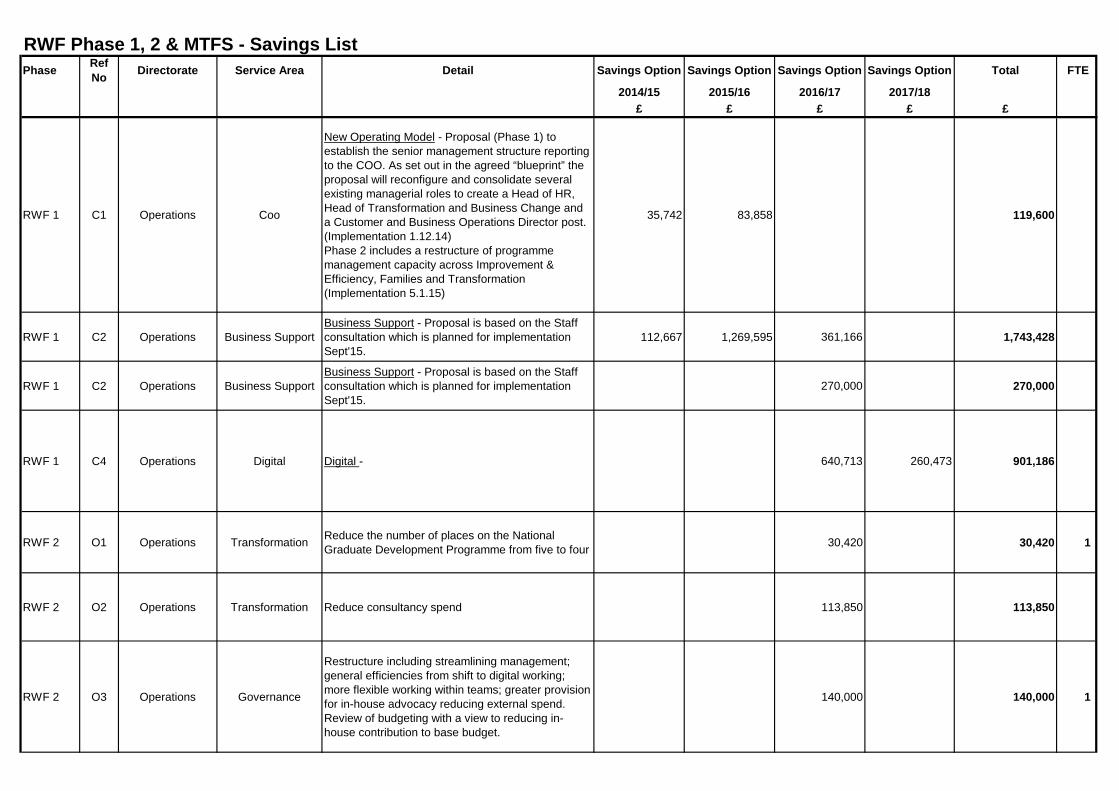
Phase Ref No Directorate Service Area Detail Savings Option Savings Option Savings Option Savings Option Total FTE
2014/15 2015/16 2016/17 2017/18£ £ £ £ £
RWF 1 C1 Operations Coo
New Operating Model - Proposal (Phase 1) to establish the senior management structure reporting to the COO. As set out in the agreed “blueprint” the proposal will reconfigure and consolidate several existing managerial roles to create a Head of HR, Head of Transformation and Business Change and a Customer and Business Operations Director post. (Implementation 1.12.14) Phase 2 includes a restructure of programme management capacity across Improvement & Efficiency, Families and Transformation (Implementation 5.1.15)
35,742 83,858 119,600
RWF 1 C2 Operations Business SupportBusiness Support - Proposal is based on the Staff consultation which is planned for implementation Sept'15.
112,667 1,269,595 361,166 1,743,428
RWF 1 C2 Operations Business SupportBusiness Support - Proposal is based on the Staff consultation which is planned for implementation Sept'15.
270,000 270,000
RWF 1 C4 Operations Digital Digital - 640,713 260,473 901,186
RWF 2 O1 Operations Transformation Reduce the number of places on the National Graduate Development Programme from five to four 30,420 30,420 1
RWF 2 O2 Operations Transformation Reduce consultancy spend 113,850 113,850
RWF 2 O3 Operations Governance
Restructure including streamlining management; general efficiencies from shift to digital working; more flexible working within teams; greater provision for in-house advocacy reducing external spend. Review of budgeting with a view to reducing in-house contribution to base budget.
140,000 140,000 1
RWF Phase 1, 2 & MTFS - Savings List
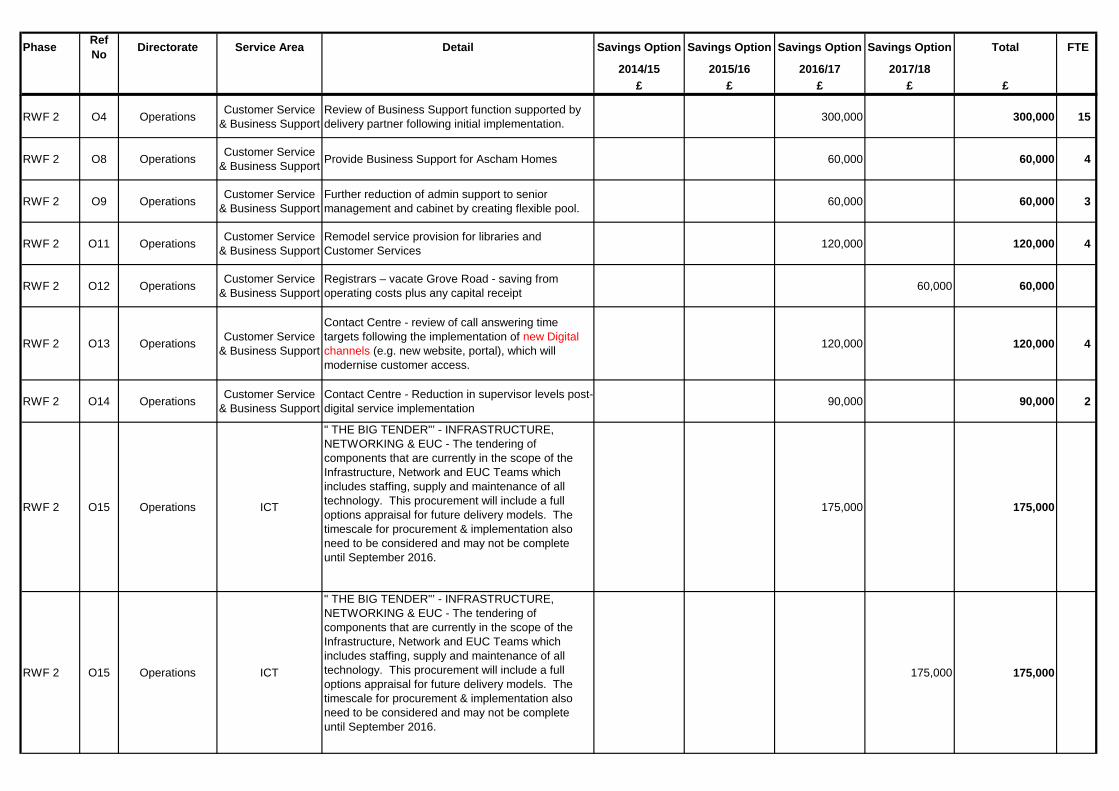
Phase Ref No Directorate Service Area Detail Savings Option Savings Option Savings Option Savings Option Total FTE
2014/15 2015/16 2016/17 2017/18£ £ £ £ £
RWF 2 O4 Operations Customer Service & Business Support
Review of Business Support function supported by delivery partner following initial implementation. 300,000 300,000 15
RWF 2 O8 Operations Customer Service & Business Support Provide Business Support for Ascham Homes 60,000 60,000 4
RWF 2 O9 Operations Customer Service & Business Support
Further reduction of admin support to senior management and cabinet by creating flexible pool. 60,000 60,000 3
RWF 2 O11 Operations Customer Service & Business Support
Remodel service provision for libraries and Customer Services 120,000 120,000 4
RWF 2 O12 Operations Customer Service & Business Support
Registrars – vacate Grove Road - saving from operating costs plus any capital receipt 60,000 60,000
RWF 2 O13 Operations Customer Service & Business Support
Contact Centre - review of call answering time targets following the implementation of new Digital channels (e.g. new website, portal), which will modernise customer access.
120,000 120,000 4
RWF 2 O14 Operations Customer Service & Business Support
Contact Centre - Reduction in supervisor levels post-digital service implementation 90,000 90,000 2
RWF 2 O15 Operations ICT
" THE BIG TENDER"’ - INFRASTRUCTURE, NETWORKING & EUC - The tendering of components that are currently in the scope of the Infrastructure, Network and EUC Teams which includes staffing, supply and maintenance of all technology. This procurement will include a full options appraisal for future delivery models. The timescale for procurement & implementation also need to be considered and may not be complete until September 2016.
175,000 175,000
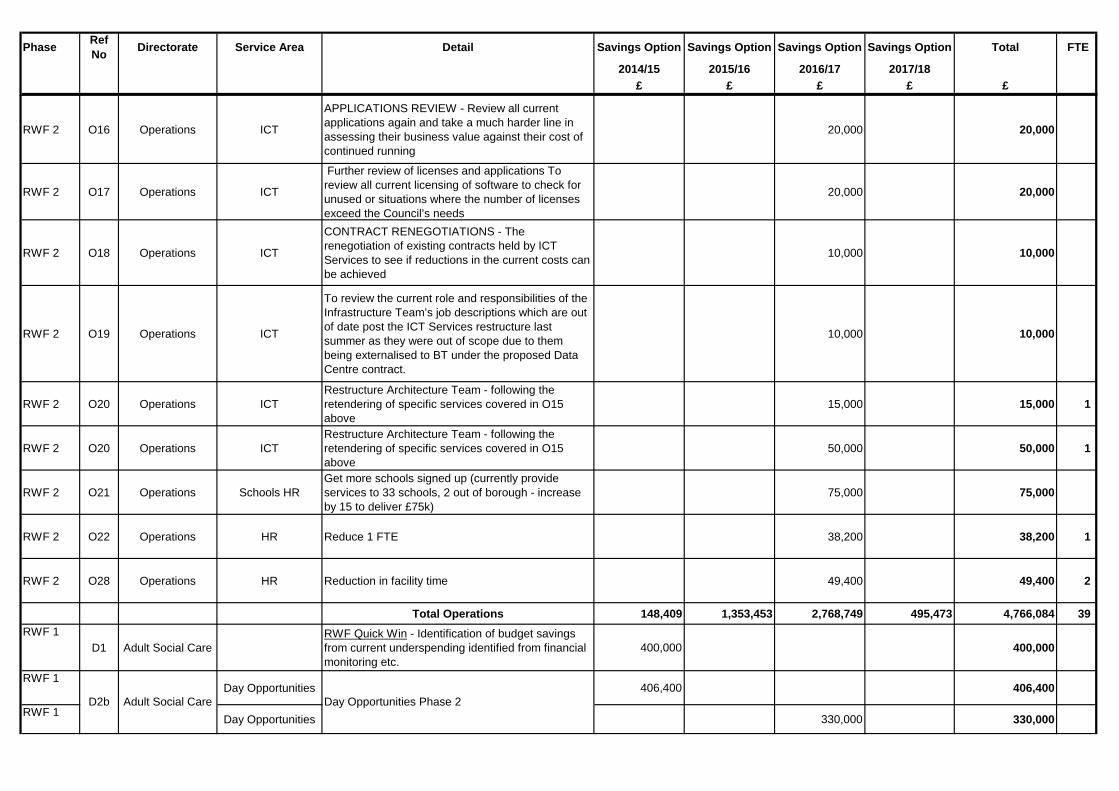
Phase Ref No Directorate Service Area Detail Savings Option Savings Option Savings Option Savings Option Total FTE
2014/15 2015/16 2016/17 2017/18£ £ £ £ £
RWF 2 O16 Operations ICT
APPLICATIONS REVIEW - Review all current applications again and take a much harder line in assessing their business value against their cost of continued running
20,000 20,000
RWF 2 O17 Operations ICT
Further review of licenses and applications To review all current licensing of software to check for unused or situations where the number of licenses exceed the Council’s needs
20,000 20,000
RWF 2 O18 Operations ICT
CONTRACT RENEGOTIATIONS - The renegotiation of existing contracts held by ICT Services to see if reductions in the current costs can be achieved
10,000 10,000
RWF 2 O19 Operations ICT
To review the current role and responsibilities of the Infrastructure Team’s job descriptions which are out of date post the ICT Services restructure last summer as they were out of scope due to them being externalised to BT under the proposed Data Centre contract.
10,000 10,000
RWF 2 O20 Operations ICTRestructure Architecture Team - following the retendering of specific services covered in O15 above
15,000 15,000 1
RWF 2 O20 Operations ICTRestructure Architecture Team - following the retendering of specific services covered in O15 above
50,000 50,000 1
RWF 2 O21 Operations Schools HRGet more schools signed up (currently provide services to 33 schools, 2 out of borough - increase by 15 to deliver £75k)
75,000 75,000
RWF 2 O22 Operations HR Reduce 1 FTE 38,200 38,200 1
RWF 2 O28 Operations HR Reduction in facility time 49,400 49,400 2
Total Operations 148,409 1,353,453 2,768,749 495,473 4,766,084 39 RWF 1
D1 Adult Social CareRWF Quick Win - Identification of budget savings from current underspending identified from financial monitoring etc.
400,000 400,000
RWF 1Day Opportunities 406,400 406,400
RWF 1 Day Opportunities 330,000 330,000D2b Adult Social Care Day Opportunities Phase 2
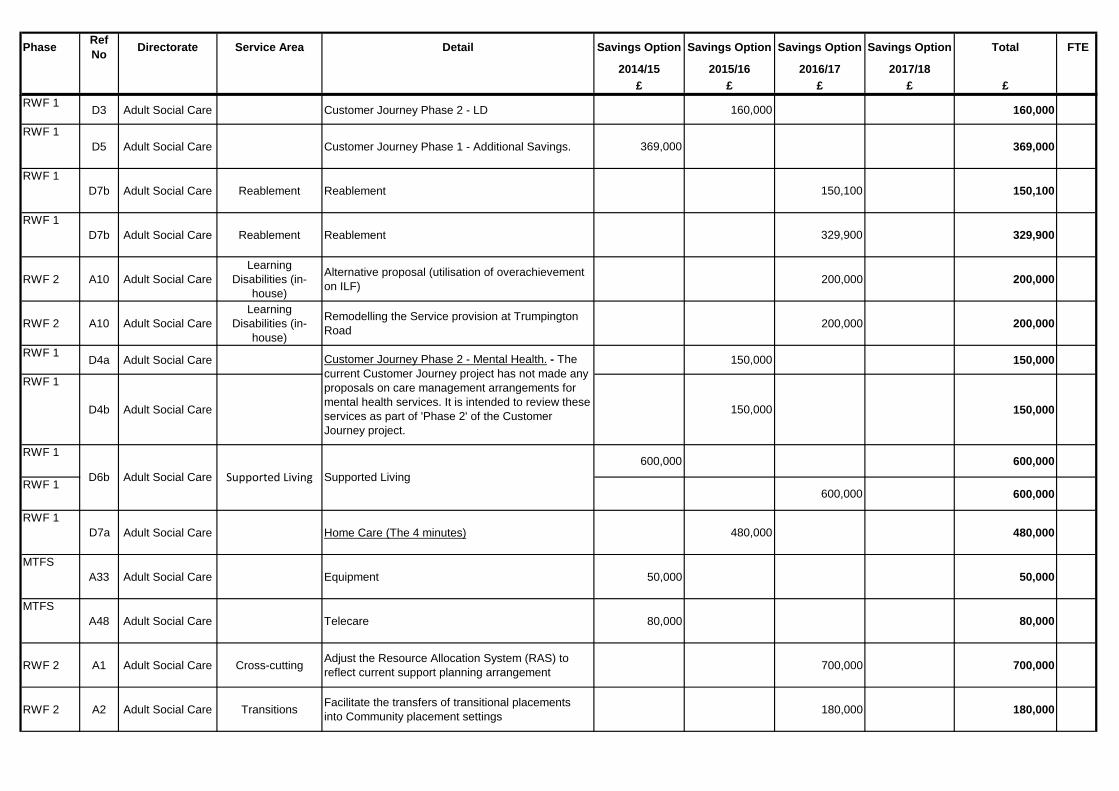
Phase Ref No Directorate Service Area Detail Savings Option Savings Option Savings Option Savings Option Total FTE
2014/15 2015/16 2016/17 2017/18£ £ £ £ £
RWF 1 D3 Adult Social Care Customer Journey Phase 2 - LD 160,000 160,000
RWF 1D5 Adult Social Care Customer Journey Phase 1 - Additional Savings. 369,000 369,000
RWF 1D7b Adult Social Care Reablement Reablement 150,100 150,100
RWF 1D7b Adult Social Care Reablement Reablement 329,900 329,900
RWF 2 A10 Adult Social CareLearning
Disabilities (in-house)
Alternative proposal (utilisation of overachievement on ILF) 200,000 200,000
RWF 2 A10 Adult Social CareLearning
Disabilities (in-house)
Remodelling the Service provision at Trumpington Road 200,000 200,000
RWF 1 D4a Adult Social Care 150,000 150,000
RWF 1
D4b Adult Social Care 150,000 150,000
RWF 1600,000 600,000
RWF 1600,000 600,000
RWF 1D7a Adult Social Care Home Care (The 4 minutes) 480,000 480,000
MTFSA33 Adult Social Care Equipment 50,000 50,000
MTFSA48 Adult Social Care Telecare 80,000 80,000
RWF 2 A1 Adult Social Care Cross-cutting Adjust the Resource Allocation System (RAS) to reflect current support planning arrangement 700,000 700,000
RWF 2 A2 Adult Social Care Transitions Facilitate the transfers of transitional placements into Community placement settings 180,000 180,000
Customer Journey Phase 2 - Mental Health. - The current Customer Journey project has not made any proposals on care management arrangements for mental health services. It is intended to review these services as part of 'Phase 2' of the Customer Journey project.
D6b Adult Social Care Supported Living Supported Living
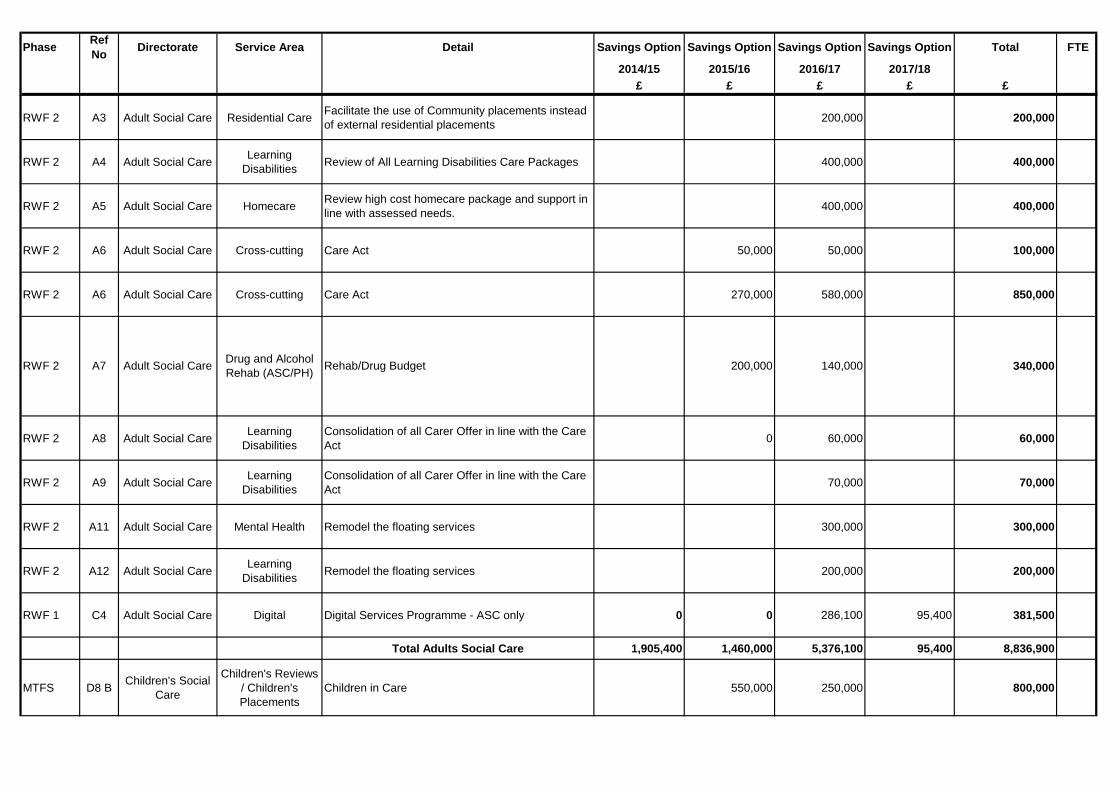
Phase Ref No Directorate Service Area Detail Savings Option Savings Option Savings Option Savings Option Total FTE
2014/15 2015/16 2016/17 2017/18£ £ £ £ £
RWF 2 A3 Adult Social Care Residential Care Facilitate the use of Community placements instead of external residential placements 200,000 200,000
RWF 2 A4 Adult Social Care Learning Disabilities Review of All Learning Disabilities Care Packages 400,000 400,000
RWF 2 A5 Adult Social Care Homecare Review high cost homecare package and support in line with assessed needs. 400,000 400,000
RWF 2 A6 Adult Social Care Cross-cutting Care Act 50,000 50,000 100,000
RWF 2 A6 Adult Social Care Cross-cutting Care Act 270,000 580,000 850,000
RWF 2 A8 Adult Social Care Learning Disabilities
Consolidation of all Carer Offer in line with the Care Act 0 60,000 60,000
RWF 2 A9 Adult Social Care Learning Disabilities
Consolidation of all Carer Offer in line with the Care Act 70,000 70,000
RWF 2 A11 Adult Social Care Mental Health Remodel the floating services 300,000 300,000
RWF 2 A12 Adult Social Care Learning Disabilities Remodel the floating services 200,000 200,000
RWF 1 C4 Adult Social Care Digital Digital Services Programme - ASC only 0 0 286,100 95,400 381,500
Total Adults Social Care 1,905,400 1,460,000 5,376,100 95,400 8,836,900
MTFS D8 B Children's Social Care
Children's Reviews / Children's Placements
Children in Care 550,000 250,000 800,000
RWF 2 A7 Adult Social Care Drug and Alcohol Rehab (ASC/PH) 340,000Rehab/Drug Budget 200,000 140,000
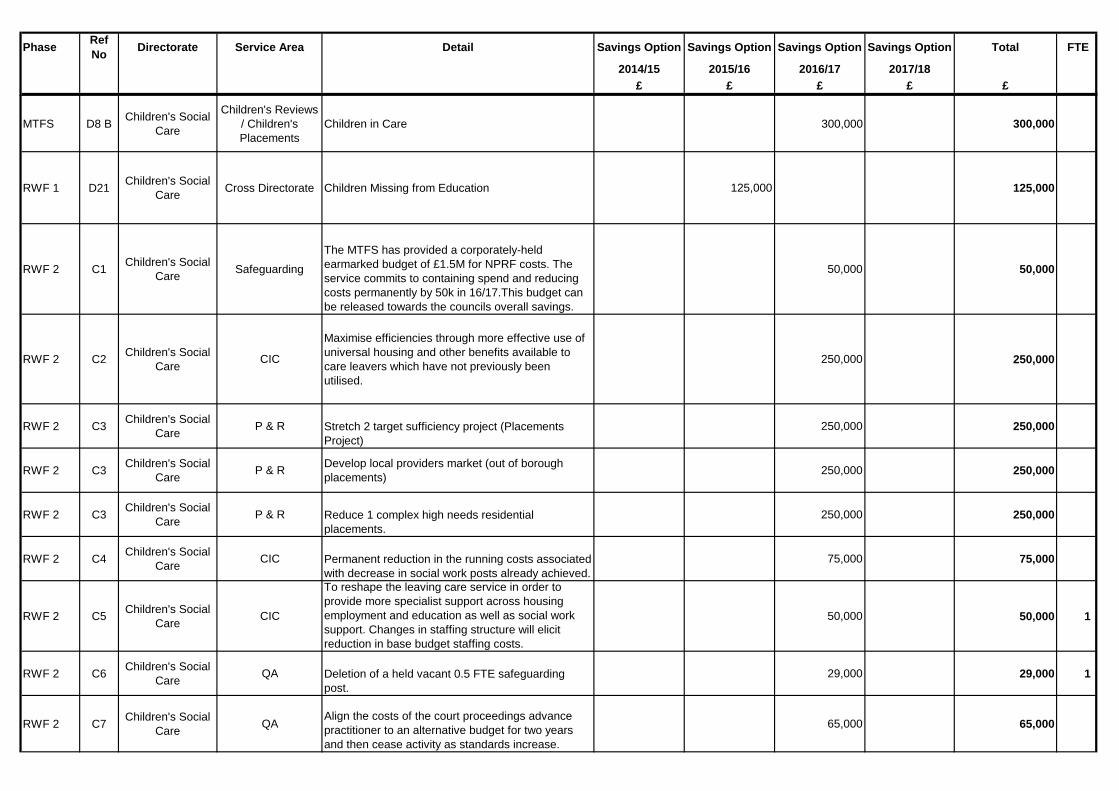
Phase Ref No Directorate Service Area Detail Savings Option Savings Option Savings Option Savings Option Total FTE
2014/15 2015/16 2016/17 2017/18£ £ £ £ £
MTFS D8 B Children's Social Care
Children's Reviews / Children's Placements
Children in Care 300,000 300,000
RWF 1 D21 Children's Social Care Cross Directorate Children Missing from Education 125,000 125,000
RWF 2 C1 Children's Social Care Safeguarding
The MTFS has provided a corporately-held earmarked budget of £1.5M for NPRF costs. The service commits to containing spend and reducing costs permanently by 50k in 16/17.This budget can be released towards the councils overall savings.
50,000 50,000
RWF 2 C2 Children's Social Care CIC
Maximise efficiencies through more effective use of universal housing and other benefits available to care leavers which have not previously been utilised.
250,000 250,000
RWF 2 C3 Children's Social Care P & R Stretch 2 target sufficiency project (Placements
Project)250,000 250,000
RWF 2 C3 Children's Social Care P & R Develop local providers market (out of borough
placements) 250,000 250,000
RWF 2 C3 Children's Social Care P & R Reduce 1 complex high needs residential
placements. 250,000 250,000
RWF 2 C4 Children's Social Care CIC Permanent reduction in the running costs associated
with decrease in social work posts already achieved. 75,000 75,000
RWF 2 C5 Children's Social Care CIC
To reshape the leaving care service in order to provide more specialist support across housing employment and education as well as social work support. Changes in staffing structure will elicit reduction in base budget staffing costs.
50,000 50,000 1
RWF 2 C6 Children's Social Care QA Deletion of a held vacant 0.5 FTE safeguarding
post. 29,000 29,000 1
RWF 2 C7 Children's Social Care QA
Align the costs of the court proceedings advance practitioner to an alternative budget for two years and then cease activity as standards increase.
65,000 65,000
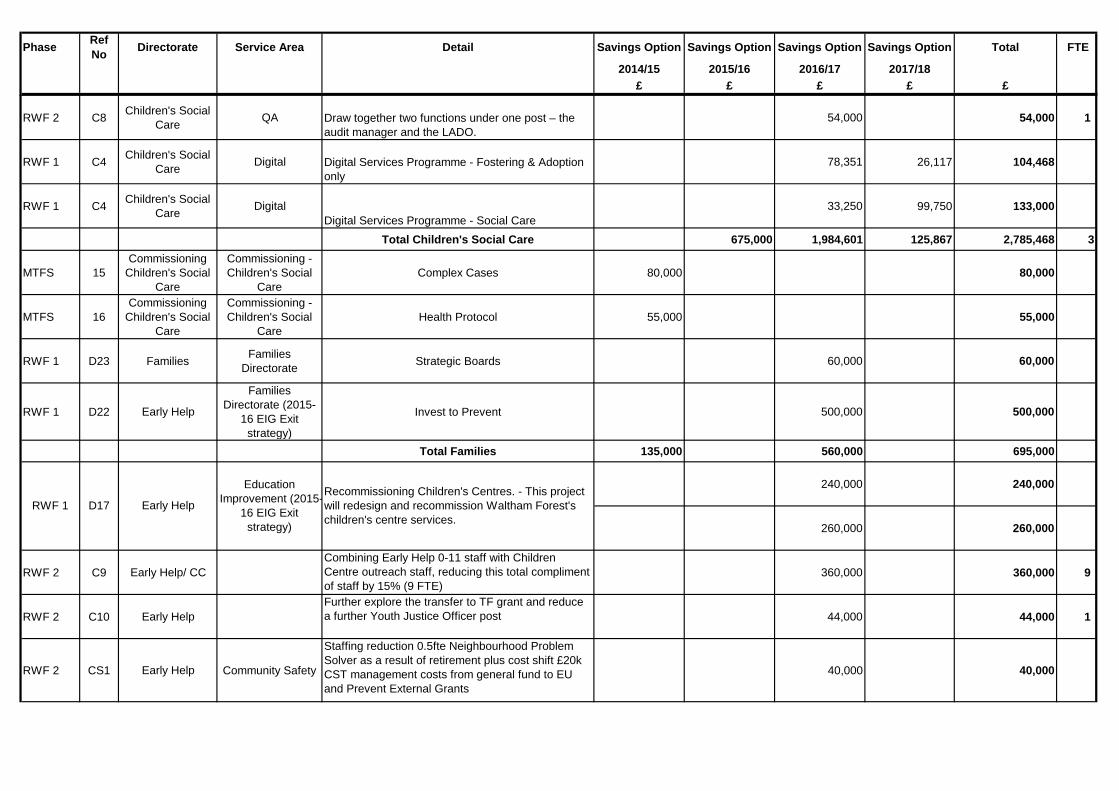
Phase Ref No Directorate Service Area Detail Savings Option Savings Option Savings Option Savings Option Total FTE
2014/15 2015/16 2016/17 2017/18£ £ £ £ £
RWF 2 C8 Children's Social Care QA Draw together two functions under one post – the
audit manager and the LADO. 54,000 54,000 1
RWF 1 C4 Children's Social Care Digital Digital Services Programme - Fostering & Adoption
only 78,351 26,117 104,468
RWF 1 C4 Children's Social Care Digital
Digital Services Programme - Social Care33,250 99,750 133,000
Total Children's Social Care 675,000 1,984,601 125,867 2,785,468 3
MTFS 15Commissioning
Children's Social Care
Commissioning -Children's Social
CareComplex Cases 80,000 80,000
MTFS 16Commissioning
Children's Social Care
Commissioning -Children's Social
CareHealth Protocol 55,000 55,000
RWF 1 D23 Families Families Directorate Strategic Boards 60,000 60,000
RWF 1 D22 Early Help
Families Directorate (2015-
16 EIG Exit strategy)
Invest to Prevent 500,000 500,000
Total Families 135,000 560,000 695,000
240,000 240,000
260,000 260,000
RWF 2 C9 Early Help/ CCCombining Early Help 0-11 staff with Children Centre outreach staff, reducing this total compliment of staff by 15% (9 FTE)
360,000 360,000 9
RWF 2 C10 Early HelpFurther explore the transfer to TF grant and reduce a further Youth Justice Officer post 44,000 44,000 1
RWF 2 CS1 Early Help Community Safety
Staffing reduction 0.5fte Neighbourhood Problem Solver as a result of retirement plus cost shift £20k CST management costs from general fund to EU and Prevent External Grants
40,000 40,000
Recommissioning Children's Centres. - This project will redesign and recommission Waltham Forest's children's centre services.
RWF 1 D17 Early Help
Education Improvement (2015-
16 EIG Exit strategy)
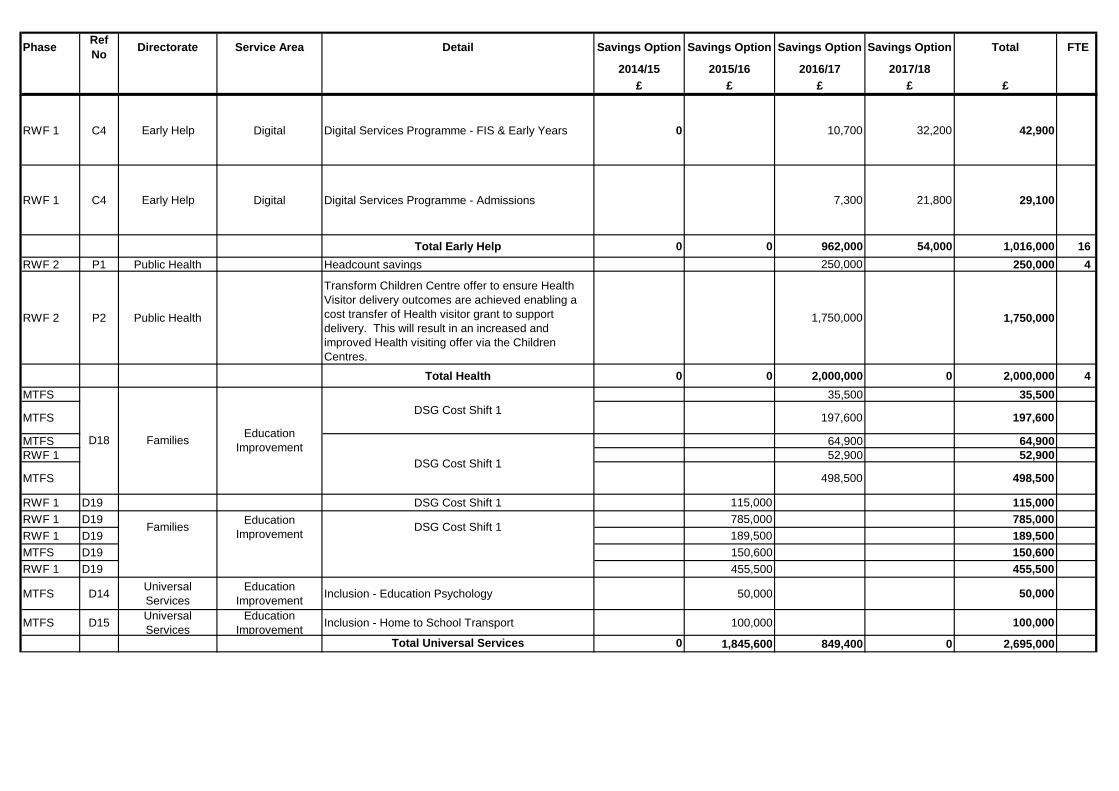
Phase Ref No Directorate Service Area Detail Savings Option Savings Option Savings Option Savings Option Total FTE
2014/15 2015/16 2016/17 2017/18£ £ £ £ £
RWF 1 C4 Early Help Digital Digital Services Programme - FIS & Early Years 0 10,700 32,200 42,900
RWF 1 C4 Early Help Digital Digital Services Programme - Admissions 7,300 21,800 29,100
Total Early Help 0 0 962,000 54,000 1,016,000 16 RWF 2 P1 Public Health Headcount savings 250,000 250,000 4
RWF 2 P2 Public Health
Transform Children Centre offer to ensure Health Visitor delivery outcomes are achieved enabling a cost transfer of Health visitor grant to support delivery. This will result in an increased and improved Health visiting offer via the Children Centres.
1,750,000 1,750,000
Total Health 0 0 2,000,000 0 2,000,000 4 MTFS 35,500 35,500
MTFS 197,600 197,600
MTFS 64,900 64,900RWF 1 52,900 52,900
MTFS 498,500 498,500
RWF 1 D19 DSG Cost Shift 1 115,000 115,000RWF 1 D19 785,000 785,000RWF 1 D19 189,500 189,500MTFS D19 150,600 150,600RWF 1 D19 455,500 455,500
MTFS D14 Universal Services
Education Improvement Inclusion - Education Psychology 50,000 50,000
MTFS D15 Universal Services
Education Improvement Inclusion - Home to School Transport 100,000 100,000
Total Universal Services 0 1,845,600 849,400 0 2,695,000
DSG Cost Shift 1
DSG Cost Shift 1
Families Education Improvement DSG Cost Shift 1
D18 Families Education Improvement
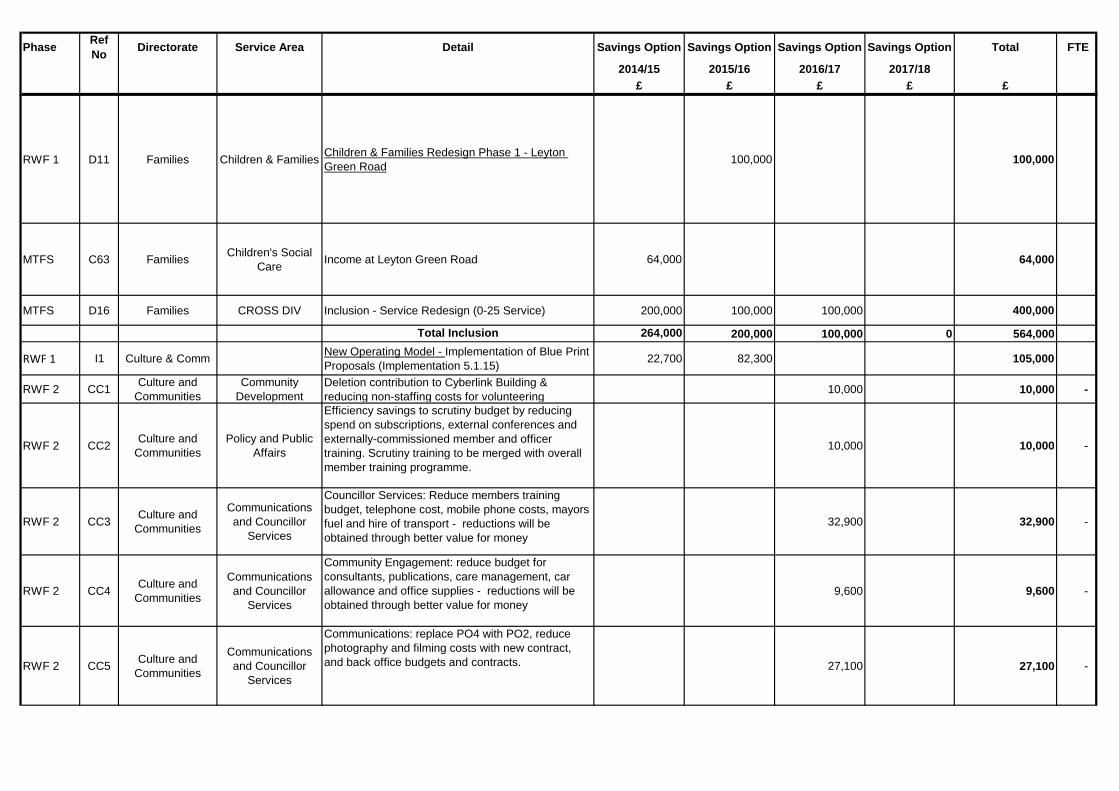
Phase Ref No Directorate Service Area Detail Savings Option Savings Option Savings Option Savings Option Total FTE
2014/15 2015/16 2016/17 2017/18£ £ £ £ £
RWF 1 D11 Families Children & Families Children & Families Redesign Phase 1 - Leyton Green Road 100,000 100,000
MTFS C63 Families Children's Social Care Income at Leyton Green Road 64,000 64,000
MTFS D16 Families CROSS DIV Inclusion - Service Redesign (0-25 Service) 200,000 100,000 100,000 400,000
Total Inclusion 264,000 200,000 100,000 0 564,000
RWF 1 I1 Culture & Comm New Operating Model - Implementation of Blue Print Proposals (Implementation 5.1.15) 22,700 82,300 105,000
RWF 2 CC1 Culture and Communities
Community Development
Deletion contribution to Cyberlink Building & reducing non-staffing costs for volunteering 10,000 10,000 -
RWF 2 CC2 Culture and Communities
Policy and Public Affairs
Efficiency savings to scrutiny budget by reducing spend on subscriptions, external conferences and externally-commissioned member and officer training. Scrutiny training to be merged with overall member training programme.
10,000 10,000 -
RWF 2 CC3 Culture and Communities
Communications and Councillor
Services
Councillor Services: Reduce members training budget, telephone cost, mobile phone costs, mayors fuel and hire of transport - reductions will be obtained through better value for money
32,900 32,900 -
RWF 2 CC4 Culture and Communities
Communications and Councillor
Services
Community Engagement: reduce budget for consultants, publications, care management, car allowance and office supplies - reductions will be obtained through better value for money
9,600 9,600 -
RWF 2 CC5 Culture and Communities
Communications and Councillor
Services
Communications: replace PO4 with PO2, reduce photography and filming costs with new contract, and back office budgets and contracts. 27,100 27,100 -
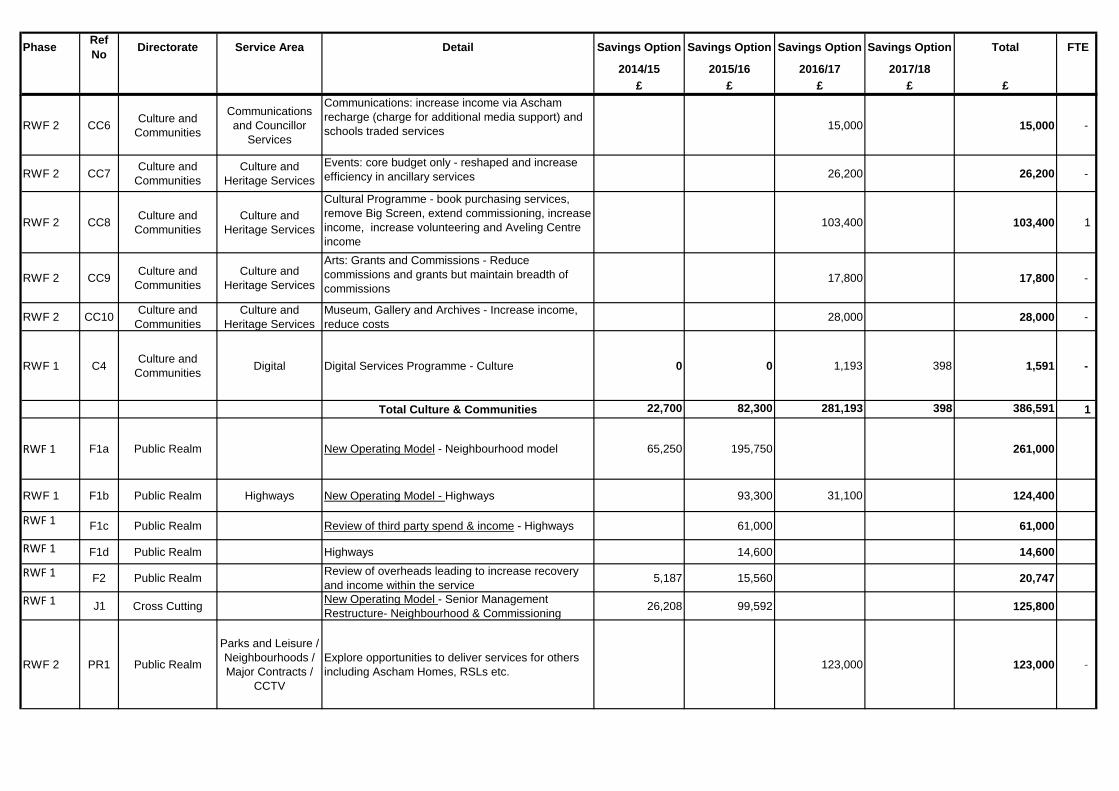
Phase Ref No Directorate Service Area Detail Savings Option Savings Option Savings Option Savings Option Total FTE
2014/15 2015/16 2016/17 2017/18£ £ £ £ £
RWF 2 CC6 Culture and Communities
Communications and Councillor
Services
Communications: increase income via Ascham recharge (charge for additional media support) and schools traded services 15,000 15,000 -
RWF 2 CC7 Culture and Communities
Culture and Heritage Services
Events: core budget only - reshaped and increase efficiency in ancillary services 26,200 26,200 -
RWF 2 CC8 Culture and Communities
Culture and Heritage Services
Cultural Programme - book purchasing services, remove Big Screen, extend commissioning, increase income, increase volunteering and Aveling Centre income
103,400 103,400 1
RWF 2 CC9 Culture and Communities
Culture and Heritage Services
Arts: Grants and Commissions - Reduce commissions and grants but maintain breadth of commissions
17,800 17,800 -
RWF 2 CC10 Culture and Communities
Culture and Heritage Services
Museum, Gallery and Archives - Increase income, reduce costs 28,000 28,000 -
RWF 1 C4 Culture and Communities Digital Digital Services Programme - Culture 0 0 1,193 398 1,591 -
Total Culture & Communities 22,700 82,300 281,193 398 386,591 1
RWF 1 F1a Public Realm New Operating Model - Neighbourhood model 65,250 195,750 261,000
RWF 1 F1b Public Realm Highways New Operating Model - Highways 93,300 31,100 124,400
RWF 1 F1c Public Realm Review of third party spend & income - Highways 61,000 61,000
RWF 1 F1d Public Realm Highways 14,600 14,600
RWF 1 F2 Public Realm Review of overheads leading to increase recovery and income within the service 5,187 15,560 20,747
RWF 1 J1 Cross Cutting New Operating Model - Senior Management Restructure- Neighbourhood & Commissioning 26,208 99,592 125,800
RWF 2 PR1 Public Realm
Parks and Leisure / Neighbourhoods / Major Contracts /
CCTV
Explore opportunities to deliver services for others including Ascham Homes, RSLs etc. 123,000 123,000 -
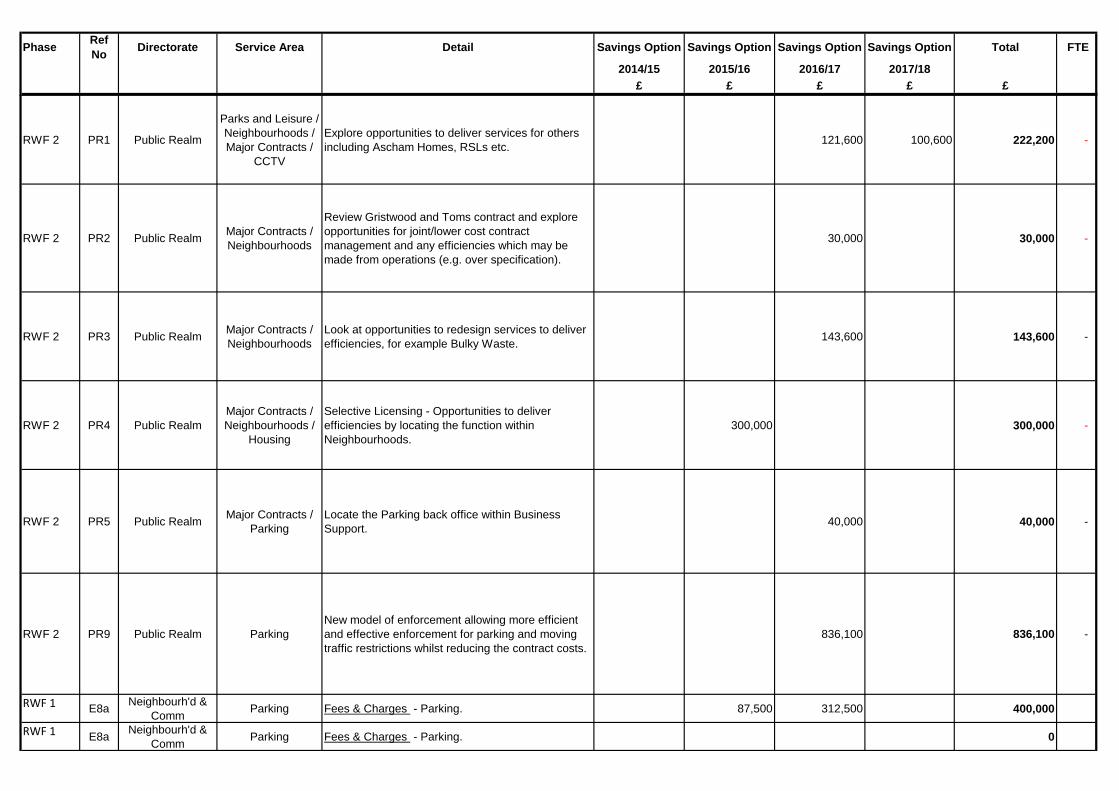
Phase Ref No Directorate Service Area Detail Savings Option Savings Option Savings Option Savings Option Total FTE
2014/15 2015/16 2016/17 2017/18£ £ £ £ £
RWF 2 PR1 Public Realm
Parks and Leisure / Neighbourhoods / Major Contracts /
CCTV
Explore opportunities to deliver services for others including Ascham Homes, RSLs etc. 121,600 100,600 222,200 -
RWF 2 PR2 Public Realm Major Contracts / Neighbourhoods
Review Gristwood and Toms contract and explore opportunities for joint/lower cost contract management and any efficiencies which may be made from operations (e.g. over specification).
30,000 30,000 -
RWF 2 PR3 Public Realm Major Contracts / Neighbourhoods
Look at opportunities to redesign services to deliver efficiencies, for example Bulky Waste. 143,600 143,600 -
RWF 2 PR4 Public RealmMajor Contracts / Neighbourhoods /
Housing
Selective Licensing - Opportunities to deliver efficiencies by locating the function within Neighbourhoods.
300,000 300,000 -
RWF 2 PR5 Public Realm Major Contracts / Parking
Locate the Parking back office within Business Support. 40,000 40,000 -
RWF 2 PR9 Public Realm ParkingNew model of enforcement allowing more efficient and effective enforcement for parking and moving traffic restrictions whilst reducing the contract costs.
836,100 836,100 -
RWF 1 E8a Neighbourh'd & Comm Parking Fees & Charges - Parking. 87,500 312,500 400,000
RWF 1 E8a Neighbourh'd & Comm Parking Fees & Charges - Parking. 0
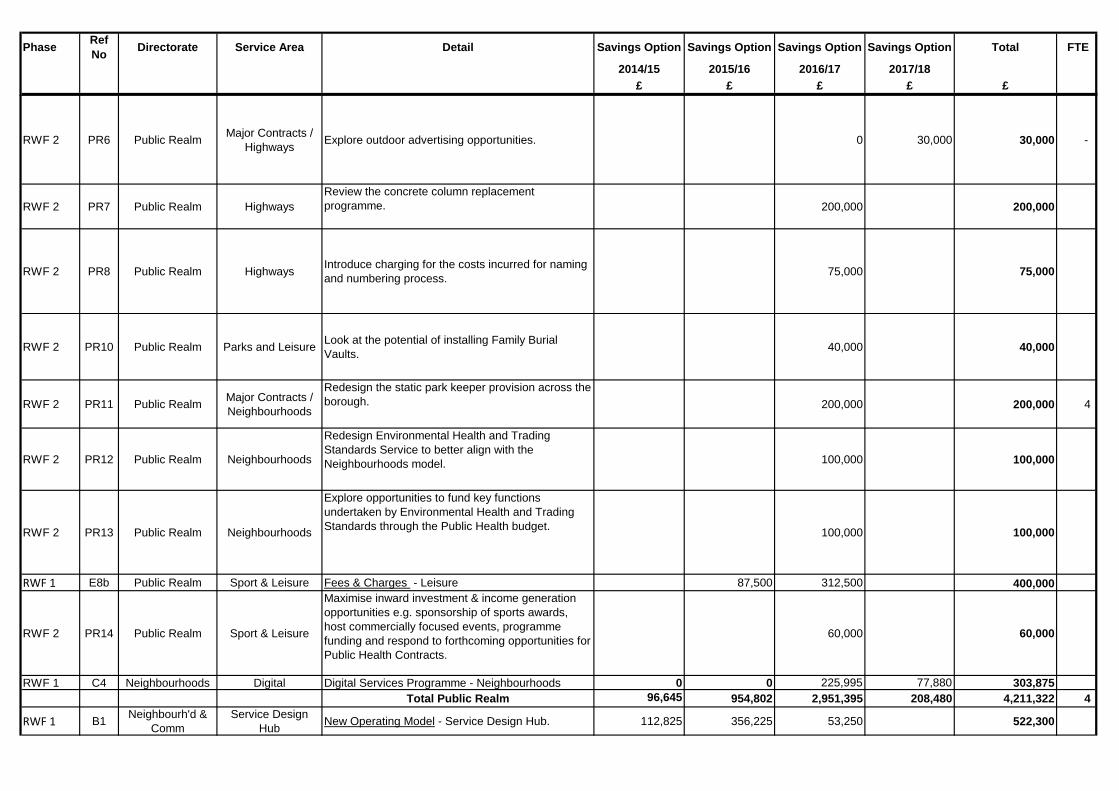
Phase Ref No Directorate Service Area Detail Savings Option Savings Option Savings Option Savings Option Total FTE
2014/15 2015/16 2016/17 2017/18£ £ £ £ £
RWF 2 PR6 Public Realm Major Contracts / Highways Explore outdoor advertising opportunities. 0 30,000 30,000 -
RWF 2 PR7 Public Realm HighwaysReview the concrete column replacement programme. 200,000 200,000
RWF 2 PR8 Public Realm Highways Introduce charging for the costs incurred for naming and numbering process. 75,000 75,000
RWF 2 PR10 Public Realm Parks and Leisure Look at the potential of installing Family Burial Vaults. 40,000 40,000
RWF 2 PR11 Public Realm Major Contracts / Neighbourhoods
Redesign the static park keeper provision across the borough. 200,000 200,000 4
RWF 2 PR12 Public Realm Neighbourhoods
Redesign Environmental Health and Trading Standards Service to better align with the Neighbourhoods model. 100,000 100,000
RWF 2 PR13 Public Realm Neighbourhoods
Explore opportunities to fund key functions undertaken by Environmental Health and Trading Standards through the Public Health budget. 100,000 100,000
RWF 1 E8b Public Realm Sport & Leisure Fees & Charges - Leisure 87,500 312,500 400,000
RWF 2 PR14 Public Realm Sport & Leisure
Maximise inward investment & income generation opportunities e.g. sponsorship of sports awards, host commercially focused events, programme funding and respond to forthcoming opportunities for Public Health Contracts.
60,000 60,000
RWF 1 C4 Neighbourhoods Digital Digital Services Programme - Neighbourhoods 0 0 225,995 77,880 303,875Total Public Realm 96,645 954,802 2,951,395 208,480 4,211,322 4
RWF 1 B1 Neighbourh'd & Comm
Service Design Hub New Operating Model - Service Design Hub. 112,825 356,225 53,250 522,300
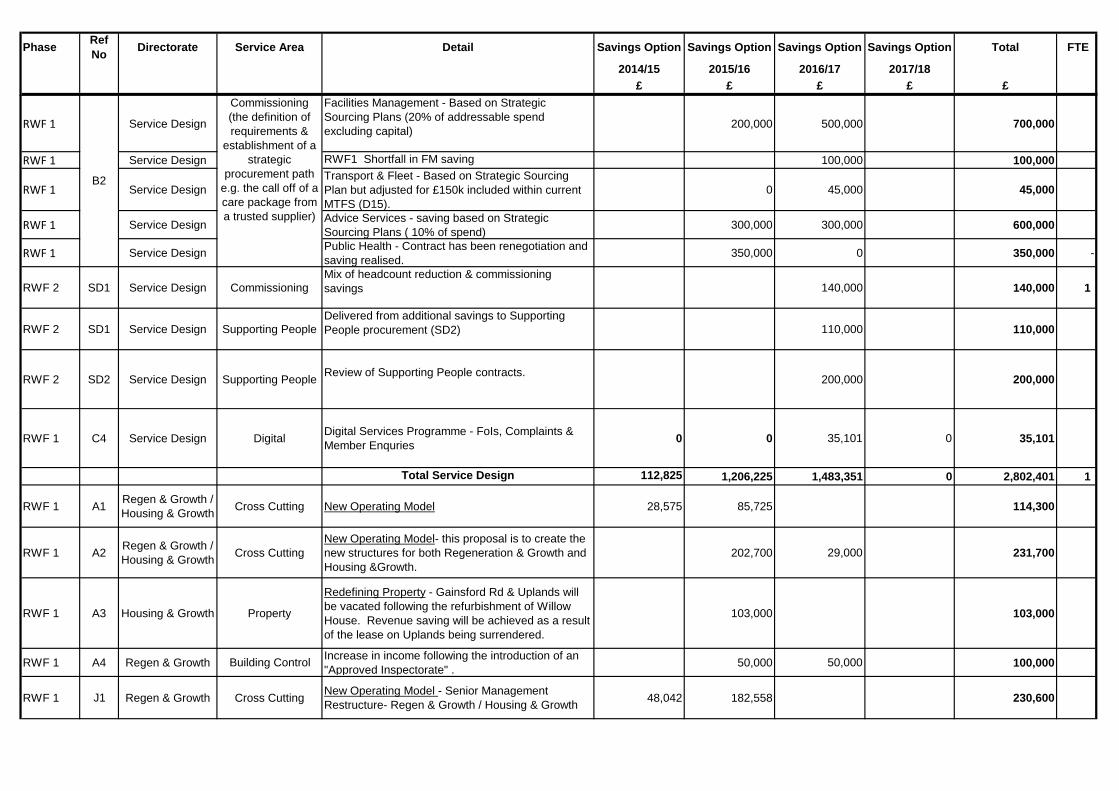
Phase Ref No Directorate Service Area Detail Savings Option Savings Option Savings Option Savings Option Total FTE
2014/15 2015/16 2016/17 2017/18£ £ £ £ £
RWF 1 Service Design
Facilities Management - Based on Strategic Sourcing Plans (20% of addressable spend excluding capital) 200,000 500,000 700,000
RWF 1 Service Design RWF1 Shortfall in FM saving 100,000 100,000
RWF 1 Service DesignTransport & Fleet - Based on Strategic Sourcing Plan but adjusted for £150k included within current MTFS (D15).
0 45,000 45,000
RWF 1 Service Design Advice Services - saving based on Strategic Sourcing Plans ( 10% of spend) 300,000 300,000 600,000
RWF 1 Service Design Public Health - Contract has been renegotiation and saving realised. 350,000 0 350,000 -
RWF 2 SD1 Service Design CommissioningMix of headcount reduction & commissioning savings 140,000 140,000 1
RWF 2 SD1 Service Design Supporting PeopleDelivered from additional savings to Supporting People procurement (SD2) 110,000 110,000
RWF 2 SD2 Service Design Supporting People Review of Supporting People contracts. 200,000 200,000
RWF 1 C4 Service Design Digital Digital Services Programme - FoIs, Complaints & Member Enquries 0 0 35,101 0 35,101
Total Service Design 112,825 1,206,225 1,483,351 0 2,802,401 1
RWF 1 A1 Regen & Growth / Housing & Growth Cross Cutting New Operating Model 28,575 85,725 114,300
RWF 1 A2 Regen & Growth / Housing & Growth Cross Cutting
New Operating Model- this proposal is to create the new structures for both Regeneration & Growth and Housing &Growth.
202,700 29,000 231,700
RWF 1 A3 Housing & Growth Property
Redefining Property - Gainsford Rd & Uplands will be vacated following the refurbishment of Willow House. Revenue saving will be achieved as a result of the lease on Uplands being surrendered.
103,000 103,000
RWF 1 A4 Regen & Growth Building Control Increase in income following the introduction of an "Approved Inspectorate" . 50,000 50,000 100,000
RWF 1 J1 Regen & Growth Cross Cutting New Operating Model - Senior Management Restructure- Regen & Growth / Housing & Growth 48,042 182,558 230,600
B2
Commissioning (the definition of requirements &
establishment of a strategic
procurement path e.g. the call off of a care package from a trusted supplier)
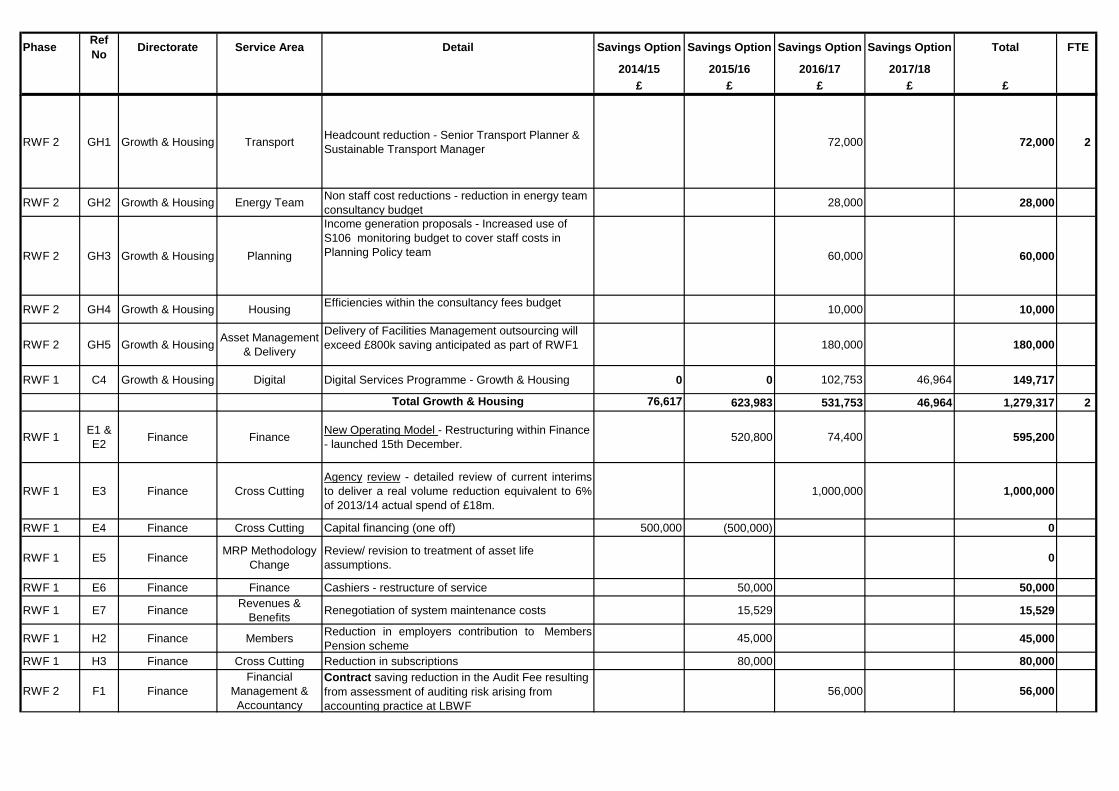
Phase Ref No Directorate Service Area Detail Savings Option Savings Option Savings Option Savings Option Total FTE
2014/15 2015/16 2016/17 2017/18£ £ £ £ £
RWF 2 GH1 Growth & Housing Transport Headcount reduction - Senior Transport Planner & Sustainable Transport Manager 72,000 72,000 2
RWF 2 GH2 Growth & Housing Energy Team Non staff cost reductions - reduction in energy team consultancy budget 28,000 28,000
RWF 2 GH3 Growth & Housing Planning
Income generation proposals - Increased use of S106 monitoring budget to cover staff costs in Planning Policy team 60,000 60,000
RWF 2 GH4 Growth & Housing Housing Efficiencies within the consultancy fees budget 10,000 10,000
RWF 2 GH5 Growth & Housing Asset Management & Delivery
Delivery of Facilities Management outsourcing will exceed £800k saving anticipated as part of RWF1 180,000 180,000
RWF 1 C4 Growth & Housing Digital Digital Services Programme - Growth & Housing 0 0 102,753 46,964 149,717
Total Growth & Housing 76,617 623,983 531,753 46,964 1,279,317 2
RWF 1 E1 & E2 Finance Finance New Operating Model - Restructuring within Finance
- launched 15th December. 520,800 74,400 595,200
RWF 1 E3 Finance Cross CuttingAgency review - detailed review of current interimsto deliver a real volume reduction equivalent to 6%of 2013/14 actual spend of £18m.
1,000,000 1,000,000
RWF 1 E4 Finance Cross Cutting Capital financing (one off) 500,000 (500,000) 0
RWF 1 E5 Finance MRP Methodology Change
Review/ revision to treatment of asset life assumptions. 0
RWF 1 E6 Finance Finance Cashiers - restructure of service 50,000 50,000
RWF 1 E7 Finance Revenues & Benefits Renegotiation of system maintenance costs 15,529 15,529
RWF 1 H2 Finance Members Reduction in employers contribution to MembersPension scheme 45,000 45,000
RWF 1 H3 Finance Cross Cutting Reduction in subscriptions 80,000 80,000
RWF 2 F1 FinanceFinancial
Management & Accountancy
Contract saving reduction in the Audit Fee resulting from assessment of auditing risk arising from accounting practice at LBWF
56,000 56,000
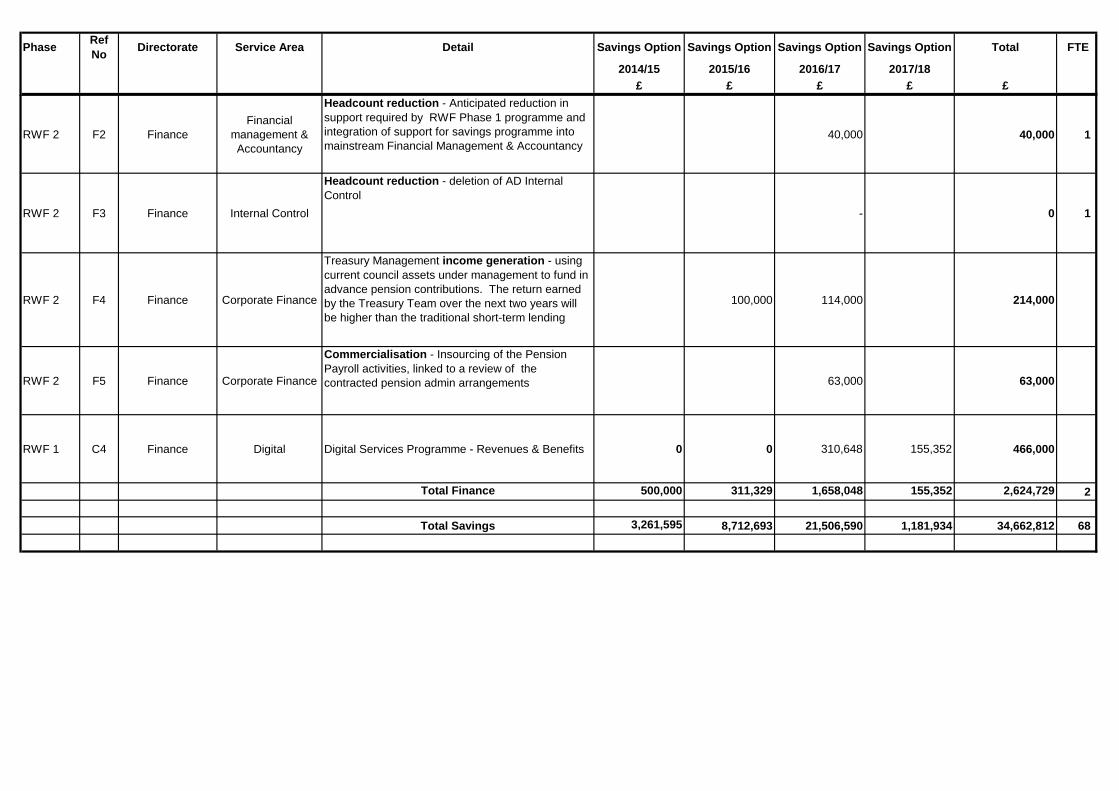
Phase Ref No Directorate Service Area Detail Savings Option Savings Option Savings Option Savings Option Total FTE
2014/15 2015/16 2016/17 2017/18£ £ £ £ £
RWF 2 F2 FinanceFinancial
management & Accountancy
Headcount reduction - Anticipated reduction in support required by RWF Phase 1 programme and integration of support for savings programme into mainstream Financial Management & Accountancy
40,000 40,000 1
RWF 2 F3 Finance Internal Control
Headcount reduction - deletion of AD Internal Control
- 0 1
RWF 2 F4 Finance Corporate Finance
Treasury Management income generation - using current council assets under management to fund in advance pension contributions. The return earned by the Treasury Team over the next two years will be higher than the traditional short-term lending
100,000 114,000 214,000
RWF 2 F5 Finance Corporate Finance
Commercialisation - Insourcing of the Pension Payroll activities, linked to a review of the contracted pension admin arrangements 63,000 63,000
RWF 1 C4 Finance Digital Digital Services Programme - Revenues & Benefits 0 0 310,648 155,352 466,000
Total Finance 500,000 311,329 1,658,048 155,352 2,624,729 2
Total Savings 3,261,595 8,712,693 21,506,590 1,181,934 34,662,812 68
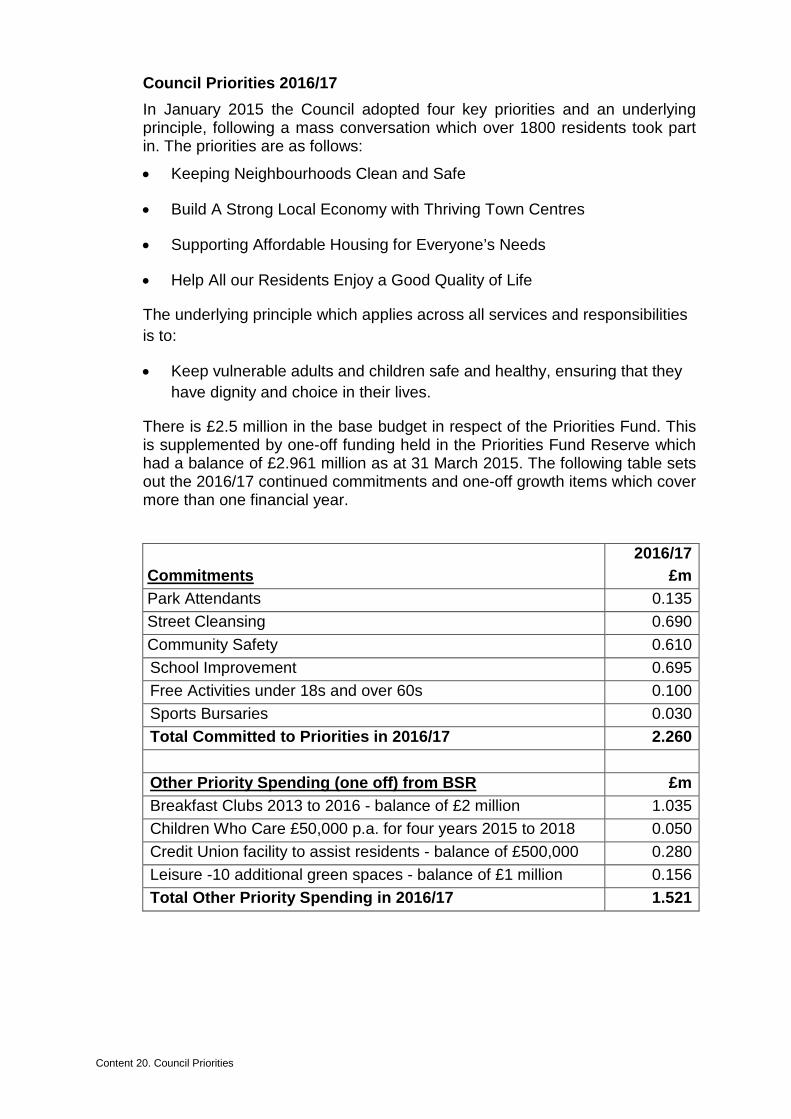
Content 20. Council Priorities
Council Priorities 2016/17 In January 2015 the Council adopted four key priorities and an underlying principle, following a mass conversation which over 1800 residents took part in. The priorities are as follows:
• Keeping Neighbourhoods Clean and Safe
• Build A Strong Local Economy with Thriving Town Centres
• Supporting Affordable Housing for Everyone’s Needs
• Help All our Residents Enjoy a Good Quality of Life
The underlying principle which applies across all services and responsibilities is to:
• Keep vulnerable adults and children safe and healthy, ensuring that they have dignity and choice in their lives.
There is £2.5 million in the base budget in respect of the Priorities Fund. This is supplemented by one-off funding held in the Priorities Fund Reserve which had a balance of £2.961 million as at 31 March 2015. The following table sets out the 2016/17 continued commitments and one-off growth items which cover more than one financial year.
2016/17 Commitments £m Park Attendants 0.135 Street Cleansing 0.690 Community Safety 0.610 School Improvement 0.695 Free Activities under 18s and over 60s 0.100 Sports Bursaries 0.030 Total Committed to Priorities in 2016/17 2.260 Other Priority Spending (one off) from BSR £m Breakfast Clubs 2013 to 2016 - balance of £2 million 1.035 Children Who Care £50,000 p.a. for four years 2015 to 2018 0.050 Credit Union facility to assist residents - balance of £500,000 0.280 Leisure -10 additional green spaces - balance of £1 million 0.156 Total Other Priority Spending in 2016/17 1.521
Content 21. Fees and Charges 2016/17
FEES AND CHARGES
2016/17
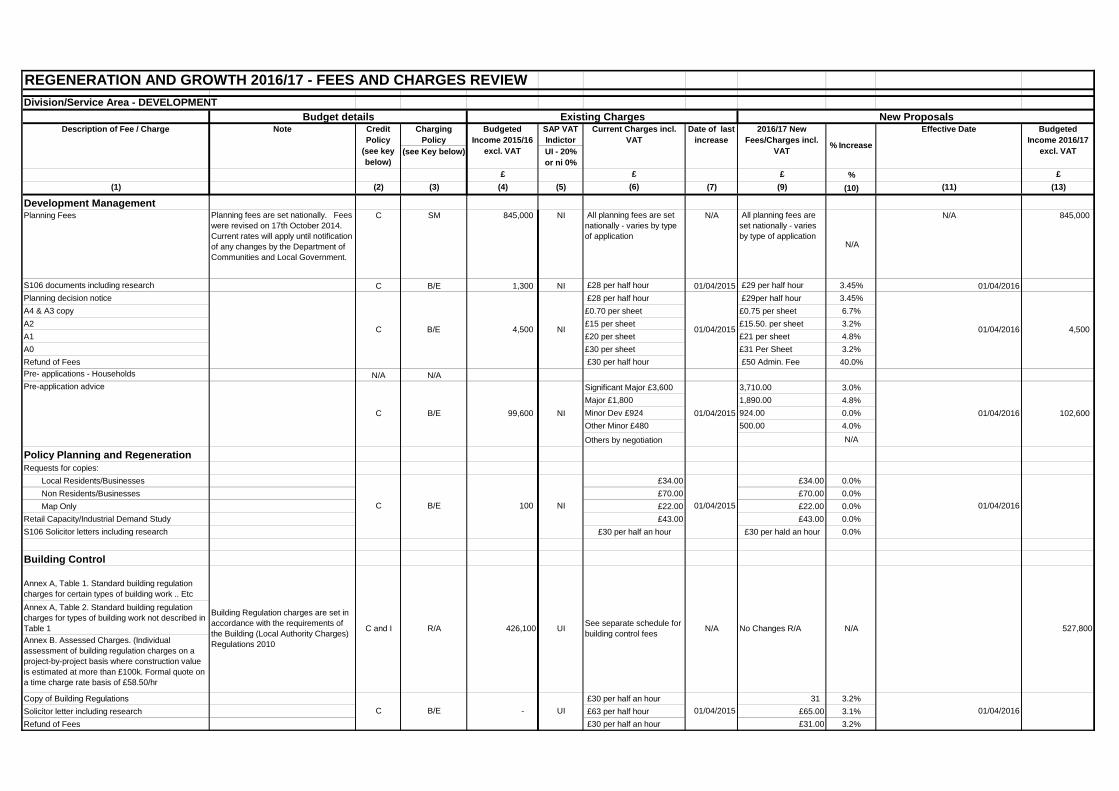
REGENERATION AND GROWTH 2016/17 - FEES AND CHARGES REVIEW Division/Service Area - DEVELOPMENT
Charging Policy
SAP VAT Indictor
(see Key below) UI - 20% or ni 0%
£ £ £ % £(1) (2) (3) (4) (5) (6) (7) (9) (10) (11) (13)
Development ManagementPlanning Fees Planning fees are set nationally. Fees
were revised on 17th October 2014. Current rates will apply until notification of any changes by the Department of Communities and Local Government.
C SM 845,000 NI All planning fees are set nationally - varies by type of application
N/A All planning fees are set nationally - varies by type of application
N/A
N/A 845,000
S106 documents including research C B/E 1,300 NI £28 per half hour 01/04/2015 £29 per half hour 3.45% 01/04/2016Planning decision notice £28 per half hour £29per half hour 3.45%A4 & A3 copy £0.70 per sheet £0.75 per sheet 6.7%A2 £15 per sheet £15.50. per sheet 3.2%A1 £20 per sheet £21 per sheet 4.8%A0 £30 per sheet £31 Per Sheet 3.2%Refund of Fees £30 per half hour £50 Admin. Fee 40.0%Pre- applications - Households N/A N/A
Significant Major £3,600 3,710.00 3.0%Major £1,800 1,890.00 4.8%Minor Dev £924 924.00 0.0%Other Minor £480 500.00 4.0%
Others by negotiation N/A
Policy Planning and RegenerationRequests for copies: Local Residents/Businesses £34.00 £34.00 0.0% Non Residents/Businesses £70.00 £70.00 0.0% Map Only £22.00 £22.00 0.0%Retail Capacity/Industrial Demand Study £43.00 £43.00 0.0%S106 Solicitor letters including research £30 per half an hour £30 per hald an hour 0.0%
Building Control
Annex A, Table 1. Standard building regulation charges for certain types of building work .. EtcAnnex A, Table 2. Standard building regulation charges for types of building work not described in Table 1Annex B. Assessed Charges. (Individual assessment of building regulation charges on a project-by-project basis where construction value is estimated at more than £100k. Formal quote on a time charge rate basis of £58.50/hr
Copy of Building Regulations £30 per half an hour 31 3.2%Solicitor letter including research £63 per half hour £65.00 3.1%Refund of Fees £30 per half an hour £31.00 3.2%
01/04/2016C B/E - UI
See separate schedule for building control fees N/AUI
01/04/2015
No Changes R/A N/A 527,800
01/04/2015 01/04/2016
Building Regulation charges are set in accordance with the requirements of the Building (Local Authority Charges) Regulations 2010
C and I R/A 426,100
C B/E 100 NI
B/E 99,600 NI 01/04/2015 01/04/2016 102,600
4,500 NI 01/04/2015 01/04/2016 4,500
Pre-application advice
C
Date of last increase
2016/17 New Fees/Charges incl.
VAT % Increase
Effective Date Budgeted Income 2016/17
excl. VAT
C B/E
Budget details Existing Charges New ProposalsDescription of Fee / Charge Note Credit
Policy (see key below)
Budgeted Income 2015/16
excl. VAT
Current Charges incl. VAT
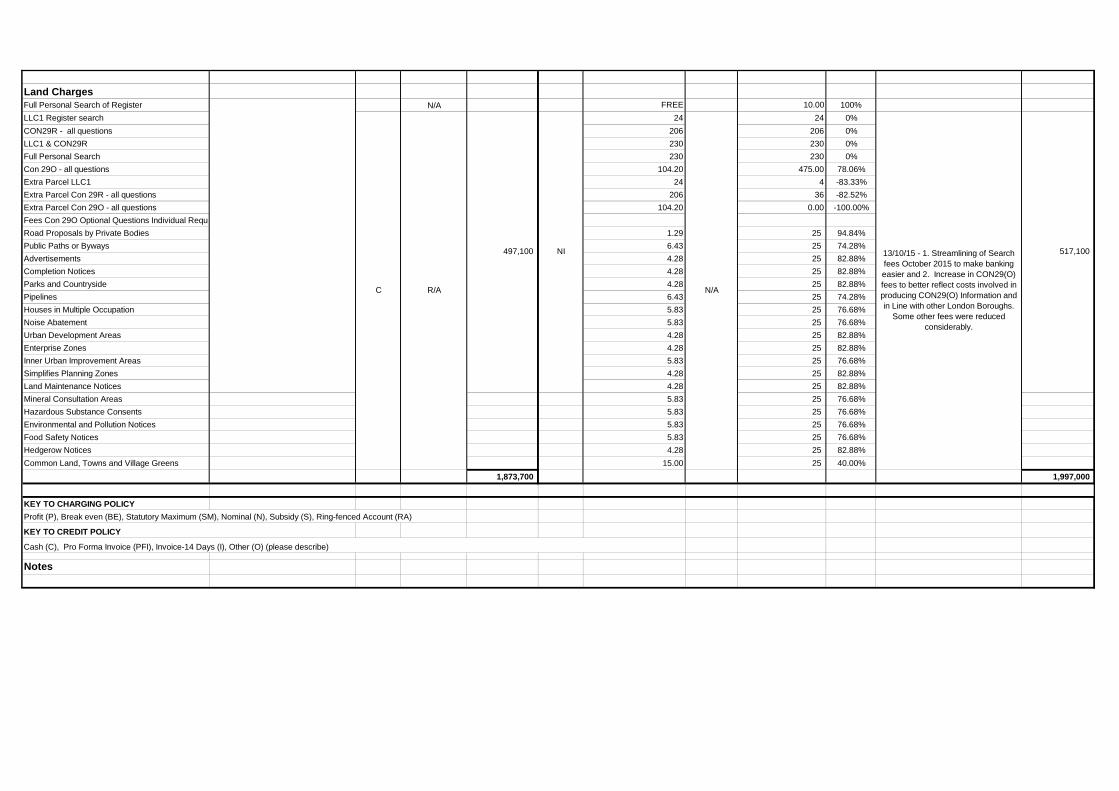
Land ChargesFull Personal Search of Register N/A FREE 10.00 100%LLC1 Register search 24 24 0%CON29R - all questions 206 206 0%LLC1 & CON29R 230 230 0%Full Personal Search 230 230 0%Con 29O - all questions 104.20 475.00 78.06%Extra Parcel LLC1 24 4 -83.33%Extra Parcel Con 29R - all questions 206 36 -82.52%Extra Parcel Con 29O - all questions 104.20 0.00 -100.00%Fees Con 29O Optional Questions Individual RequeRoad Proposals by Private Bodies 1.29 25 94.84%Public Paths or Byways 6.43 25 74.28%Advertisements 4.28 25 82.88%Completion Notices 4.28 25 82.88%Parks and Countryside 4.28 25 82.88%Pipelines 6.43 25 74.28%Houses in Multiple Occupation 5.83 25 76.68%Noise Abatement 5.83 25 76.68%Urban Development Areas 4.28 25 82.88%Enterprise Zones 4.28 25 82.88%Inner Urban Improvement Areas 5.83 25 76.68%Simplifies Planning Zones 4.28 25 82.88%Land Maintenance Notices 4.28 25 82.88%Mineral Consultation Areas 5.83 25 76.68%Hazardous Substance Consents 5.83 25 76.68%Environmental and Pollution Notices 5.83 25 76.68%Food Safety Notices 5.83 25 76.68%Hedgerow Notices 4.28 25 82.88%Common Land, Towns and Village Greens 15.00 25 40.00%
1,873,700 1,997,000
KEY TO CHARGING POLICYProfit (P), Break even (BE), Statutory Maximum (SM), Nominal (N), Subsidy (S), Ring-fenced Account (RA)
Notes
Cash (C), Pro Forma Invoice (PFI), Invoice-14 Days (I), Other (O) (please describe)
13/10/15 - 1. Streamlining of Search fees October 2015 to make banking easier and 2. Increase in CON29(O) fees to better reflect costs involved in producing CON29(O) Information and in Line with other London Boroughs.
Some other fees were reduced considerably.
517,100
KEY TO CREDIT POLICY
R/AC
497,100 NI
N/A
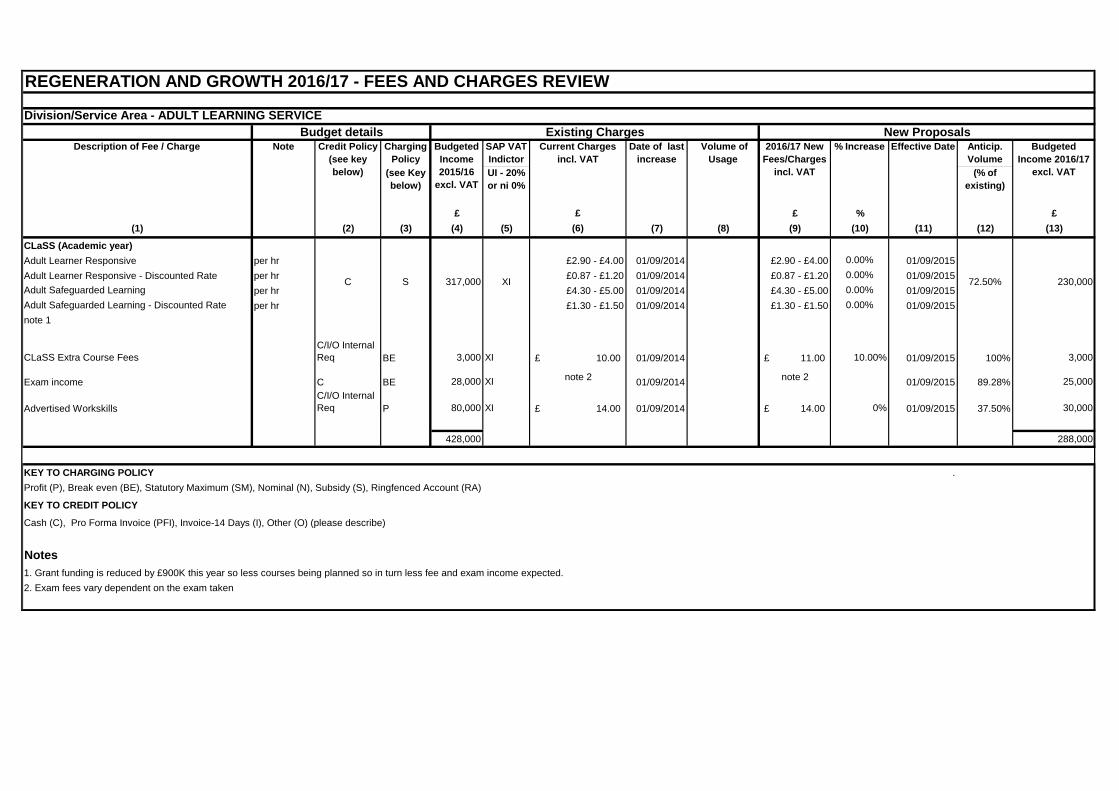
REGENERATION AND GROWTH 2016/17 - FEES AND CHARGES REVIEW Division/Service Area - ADULT LEARNING SERVICE
Charging Policy
SAP VAT Indictor
Anticip. Volume
(see Key below)
UI - 20% or ni 0%
(% of existing)
£ £ £ % £(1) (2) (3) (4) (5) (6) (7) (8) (9) (10) (11) (12) (13)
CLaSS (Academic year)Adult Learner Responsive per hr £2.90 - £4.00 01/09/2014 £2.90 - £4.00 0.00% 01/09/2015Adult Learner Responsive - Discounted Rate per hr £0.87 - £1.20 01/09/2014 £0.87 - £1.20 0.00% 01/09/2015Adult Safeguarded Learning per hr £4.30 - £5.00 01/09/2014 £4.30 - £5.00 0.00% 01/09/2015Adult Safeguarded Learning - Discounted Rate per hr £1.30 - £1.50 01/09/2014 £1.30 - £1.50 0.00% 01/09/2015note 1
CLaSS Extra Course FeesC/I/O Internal Req BE 3,000 XI 10.00£ 01/09/2014 11.00£ 10.00% 01/09/2015 100% 3,000
Exam income C BE 28,000 XI note 2 01/09/2014 note 2 01/09/2015 89.28% 25,000
Advertised WorkskillsC/I/O Internal Req P 80,000 XI 14.00£ 01/09/2014 14.00£ 0% 01/09/2015 37.50% 30,000
428,000 288,000
KEY TO CHARGING POLICY .Profit (P), Break even (BE), Statutory Maximum (SM), Nominal (N), Subsidy (S), Ringfenced Account (RA)
Notes1. Grant funding is reduced by £900K this year so less courses being planned so in turn less fee and exam income expected.2. Exam fees vary dependent on the exam taken
72.50%
Budgeted Income 2016/17
excl. VAT
Budget details Existing Charges New Proposals Volume of
Usage 2016/17 New
Fees/Charges incl. VAT
% Increase Effective Date
230,000
Description of Fee / Charge Note Credit Policy (see key below)
Date of last increase
Current Charges incl. VAT
Budgeted Income 2015/16
excl. VAT
KEY TO CREDIT POLICY
Cash (C), Pro Forma Invoice (PFI), Invoice-14 Days (I), Other (O) (please describe)
C S 317,000 XI
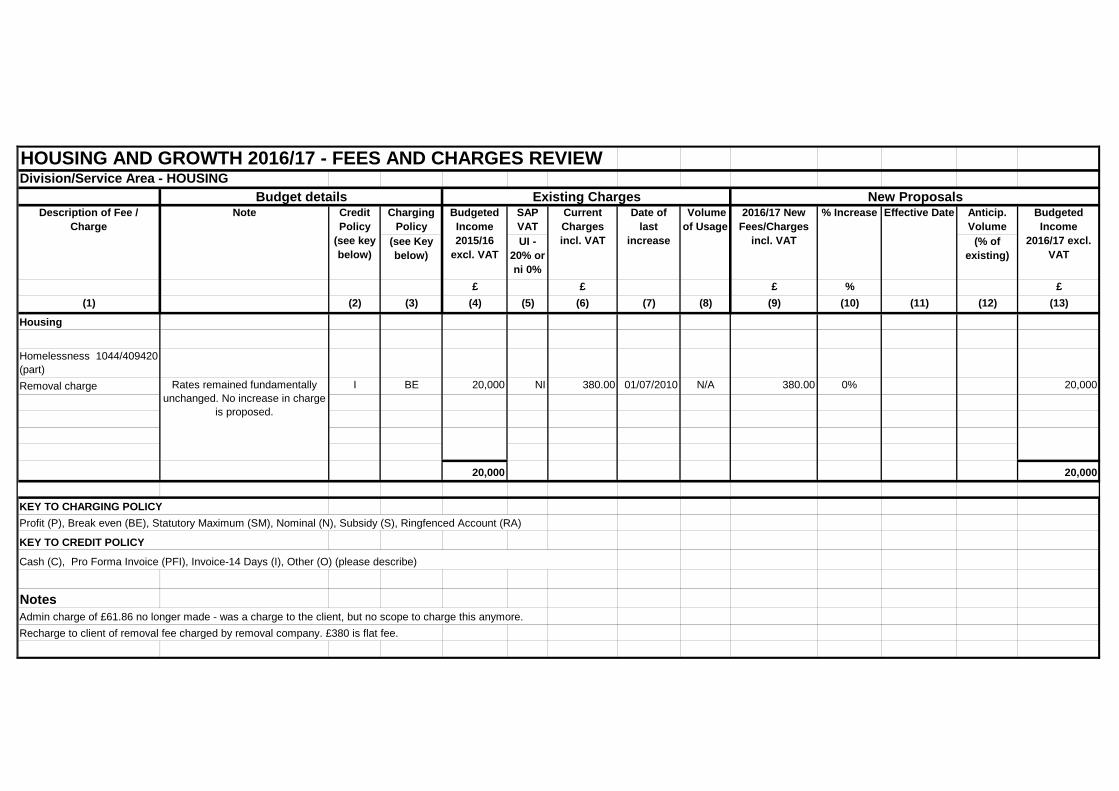
HOUSING AND GROWTH 2016/17 - FEES AND CHARGES REVIEWDivision/Service Area - HOUSING
Charging Policy
SAP VAT
Anticip. Volume
(see Key below)
UI - 20% or ni 0%
(% of existing)
£ £ £ % £(1) (2) (3) (4) (5) (6) (7) (8) (9) (10) (11) (12) (13)
Housing
Homelessness 1044/409420 (part)Removal charge I BE 20,000 NI 380.00 01/07/2010 N/A 380.00 0% 20,000
20,000 20,000
KEY TO CHARGING POLICYProfit (P), Break even (BE), Statutory Maximum (SM), Nominal (N), Subsidy (S), Ringfenced Account (RA)
NotesAdmin charge of £61.86 no longer made - was a charge to the client, but no scope to charge this anymore.Recharge to client of removal fee charged by removal company. £380 is flat fee.
KEY TO CREDIT POLICY
Cash (C), Pro Forma Invoice (PFI), Invoice-14 Days (I), Other (O) (please describe)
Rates remained fundamentally unchanged. No increase in charge
is proposed.
Date of last
increase
Volume of Usage
2016/17 New Fees/Charges
incl. VAT
% Increase Effective Date Budgeted Income
2016/17 excl. VAT
Budget details Existing Charges New ProposalsDescription of Fee /
ChargeNote Credit
Policy (see key below)
Budgeted Income 2015/16
excl. VAT
Current Charges incl. VAT
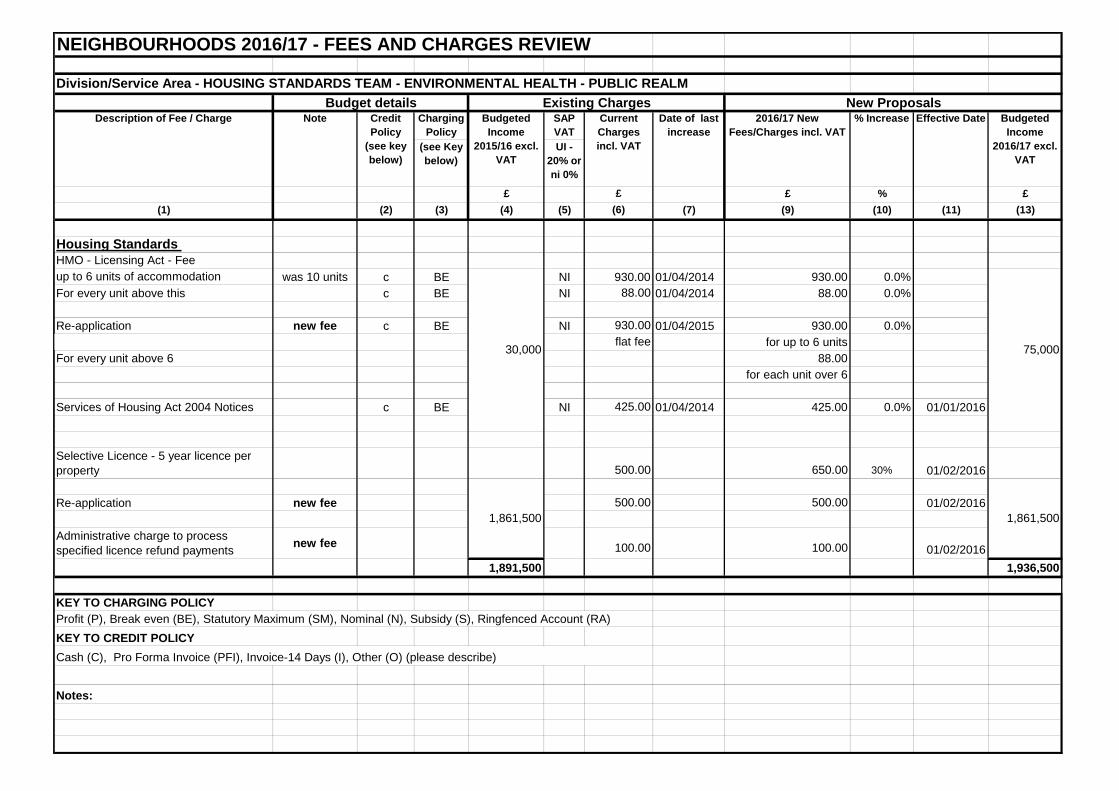
NEIGHBOURHOODS 2016/17 - FEES AND CHARGES REVIEW Division/Service Area - HOUSING STANDARDS TEAM - ENVIRONMENTAL HEALTH - PUBLIC REALM
Charging Policy
SAP VAT
(see Key below)
UI - 20% or ni 0%
£ £ £ % £(1) (2) (3) (4) (5) (6) (7) (9) (10) (11) (13)
Housing Standards HMO - Licensing Act - Fee up to 6 units of accommodation was 10 units c BE NI 930.00 01/04/2014 930.00 0.0%For every unit above this c BE NI 88.00 01/04/2014 88.00 0.0%
Re-application new fee c BE NI 930.00 01/04/2015 930.00 0.0%flat fee for up to 6 units
For every unit above 6 88.00for each unit over 6
Services of Housing Act 2004 Notices c BE NI 425.00 01/04/2014 425.00 0.0% 01/01/2016
Selective Licence - 5 year licence per property 500.00 650.00 30% 01/02/2016
Re-application new fee 500.00 500.00 01/02/2016
Administrative charge to process specified licence refund payments new fee 100.00 100.00 01/02/2016
1,891,500 1,936,500
KEY TO CHARGING POLICYProfit (P), Break even (BE), Statutory Maximum (SM), Nominal (N), Subsidy (S), Ringfenced Account (RA)
Notes:
Budget details Existing Charges New ProposalsNote Budgeted
Income 2016/17 excl.
VAT
Cash (C), Pro Forma Invoice (PFI), Invoice-14 Days (I), Other (O) (please describe)
Description of Fee / Charge Credit Policy
(see key below)
KEY TO CREDIT POLICY
Effective DateCurrent Charges incl. VAT
1,861,500
Budgeted Income
2015/16 excl. VAT
30,000
1,861,500
75,000
Date of last increase
2016/17 New Fees/Charges incl. VAT
% Increase
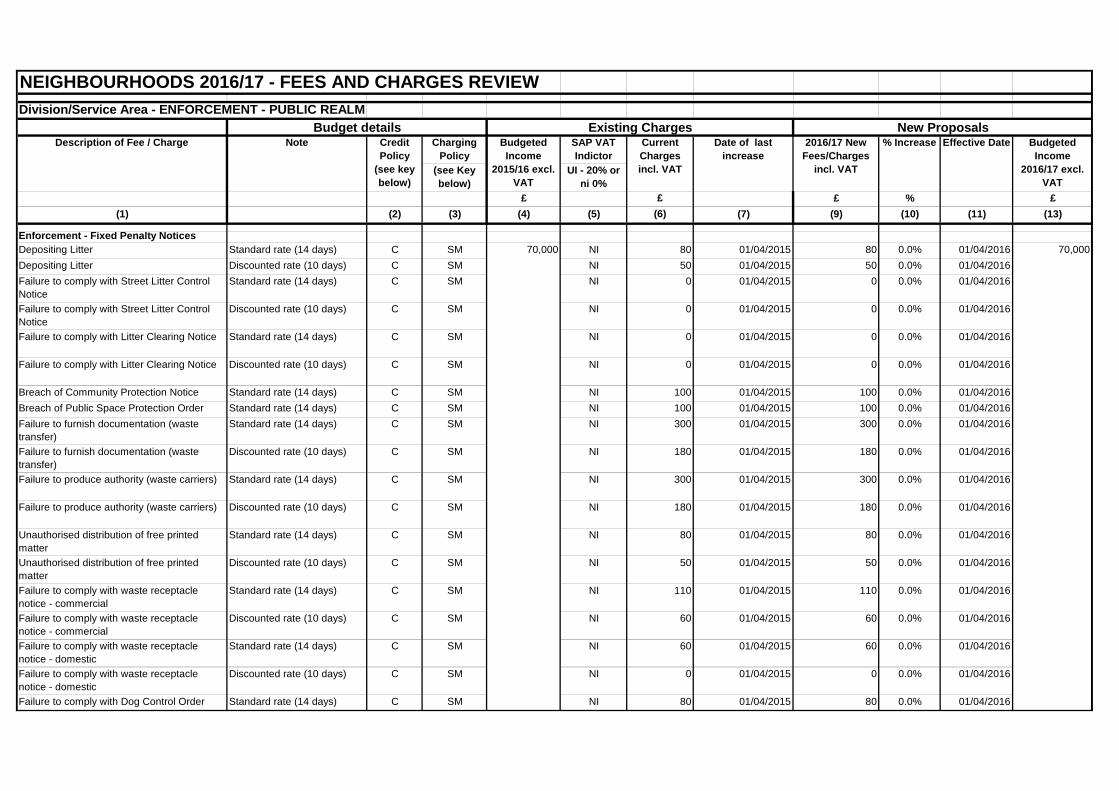
NEIGHBOURHOODS 2016/17 - FEES AND CHARGES REVIEW Division/Service Area - ENFORCEMENT - PUBLIC REALM
Charging Policy
SAP VAT Indictor
(see Key below)
UI - 20% or ni 0%
£ £ £ % £(1) (2) (3) (4) (5) (6) (7) (9) (10) (11) (13)
Enforcement - Fixed Penalty NoticesDepositing Litter Standard rate (14 days) C SM NI 80 01/04/2015 80 0.0% 01/04/2016Depositing Litter Discounted rate (10 days) C SM NI 50 01/04/2015 50 0.0% 01/04/2016Failure to comply with Street Litter Control Notice
Standard rate (14 days) C SM NI 0 01/04/2015 0 0.0% 01/04/2016
Failure to comply with Street Litter Control Notice
Discounted rate (10 days) C SM NI 0 01/04/2015 0 0.0% 01/04/2016
Failure to comply with Litter Clearing Notice Standard rate (14 days) C SM NI 0 01/04/2015 0 0.0% 01/04/2016
Failure to comply with Litter Clearing Notice Discounted rate (10 days) C SM NI 0 01/04/2015 0 0.0% 01/04/2016
Breach of Community Protection Notice Standard rate (14 days) C SM NI 100 01/04/2015 100 0.0% 01/04/2016Breach of Public Space Protection Order Standard rate (14 days) C SM NI 100 01/04/2015 100 0.0% 01/04/2016Failure to furnish documentation (waste transfer)
Standard rate (14 days) C SM NI 300 01/04/2015 300 0.0% 01/04/2016
Failure to furnish documentation (waste transfer)
Discounted rate (10 days) C SM NI 180 01/04/2015 180 0.0% 01/04/2016
Failure to produce authority (waste carriers) Standard rate (14 days) C SM NI 300 01/04/2015 300 0.0% 01/04/2016
Failure to produce authority (waste carriers) Discounted rate (10 days) C SM NI 180 01/04/2015 180 0.0% 01/04/2016
Unauthorised distribution of free printed matter
Standard rate (14 days) C SM NI 80 01/04/2015 80 0.0% 01/04/2016
Unauthorised distribution of free printed matter
Discounted rate (10 days) C SM NI 50 01/04/2015 50 0.0% 01/04/2016
Failure to comply with waste receptacle notice - commercial
Standard rate (14 days) C SM NI 110 01/04/2015 110 0.0% 01/04/2016
Failure to comply with waste receptacle notice - commercial
Discounted rate (10 days) C SM NI 60 01/04/2015 60 0.0% 01/04/2016
Failure to comply with waste receptacle notice - domestic
Standard rate (14 days) C SM NI 60 01/04/2015 60 0.0% 01/04/2016
Failure to comply with waste receptacle notice - domestic
Discounted rate (10 days) C SM NI 0 01/04/2015 0 0.0% 01/04/2016
Failure to comply with Dog Control Order Standard rate (14 days) C SM NI 80 01/04/2015 80 0.0% 01/04/2016
70,000 70,000
Date of last increase
2016/17 New Fees/Charges
incl. VAT
% Increase Effective Date Budgeted Income
2016/17 excl. VAT
Budget details Existing Charges New ProposalsDescription of Fee / Charge Note Credit
Policy (see key below)
Budgeted Income
2015/16 excl. VAT
Current Charges incl. VAT
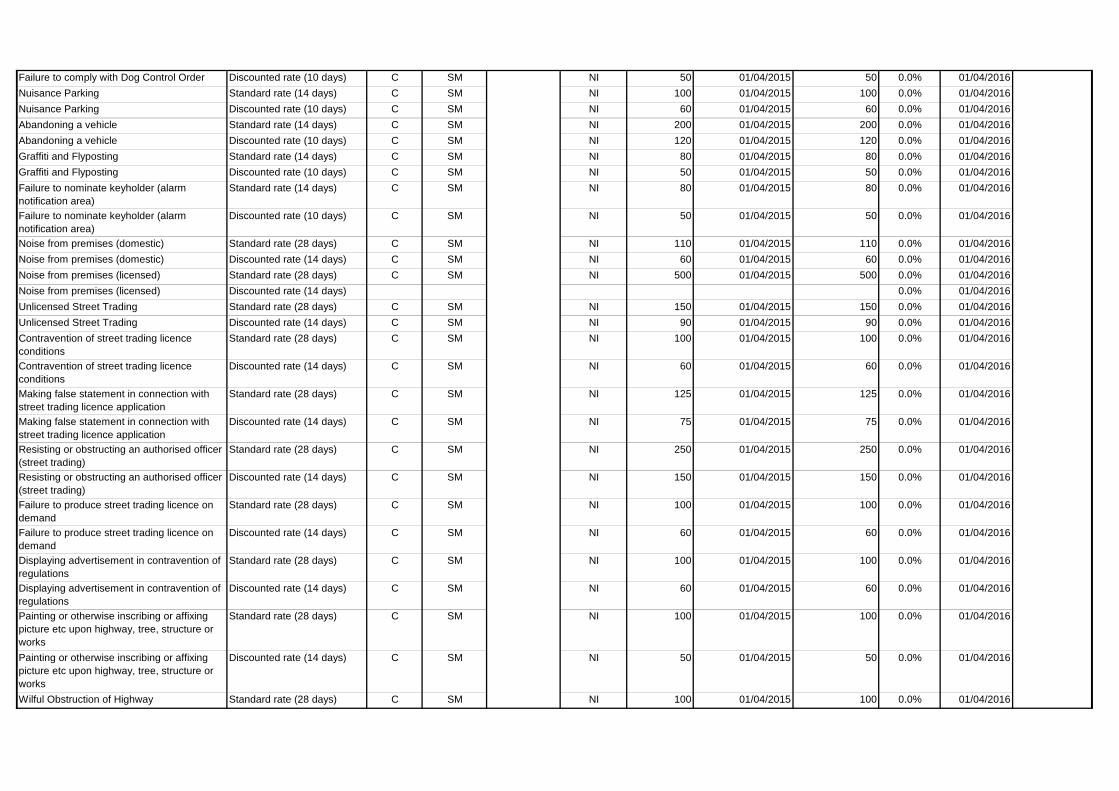
Failure to comply with Dog Control Order Discounted rate (10 days) C SM NI 50 01/04/2015 50 0.0% 01/04/2016Nuisance Parking Standard rate (14 days) C SM NI 100 01/04/2015 100 0.0% 01/04/2016Nuisance Parking Discounted rate (10 days) C SM NI 60 01/04/2015 60 0.0% 01/04/2016Abandoning a vehicle Standard rate (14 days) C SM NI 200 01/04/2015 200 0.0% 01/04/2016Abandoning a vehicle Discounted rate (10 days) C SM NI 120 01/04/2015 120 0.0% 01/04/2016Graffiti and Flyposting Standard rate (14 days) C SM NI 80 01/04/2015 80 0.0% 01/04/2016Graffiti and Flyposting Discounted rate (10 days) C SM NI 50 01/04/2015 50 0.0% 01/04/2016Failure to nominate keyholder (alarm notification area)
Standard rate (14 days) C SM NI 80 01/04/2015 80 0.0% 01/04/2016
Failure to nominate keyholder (alarm notification area)
Discounted rate (10 days) C SM NI 50 01/04/2015 50 0.0% 01/04/2016
Noise from premises (domestic) Standard rate (28 days) C SM NI 110 01/04/2015 110 0.0% 01/04/2016Noise from premises (domestic) Discounted rate (14 days) C SM NI 60 01/04/2015 60 0.0% 01/04/2016Noise from premises (licensed) Standard rate (28 days) C SM NI 500 01/04/2015 500 0.0% 01/04/2016Noise from premises (licensed) Discounted rate (14 days) 0.0% 01/04/2016Unlicensed Street Trading Standard rate (28 days) C SM NI 150 01/04/2015 150 0.0% 01/04/2016Unlicensed Street Trading Discounted rate (14 days) C SM NI 90 01/04/2015 90 0.0% 01/04/2016Contravention of street trading licence conditions
Standard rate (28 days) C SM NI 100 01/04/2015 100 0.0% 01/04/2016
Contravention of street trading licence conditions
Discounted rate (14 days) C SM NI 60 01/04/2015 60 0.0% 01/04/2016
Making false statement in connection with street trading licence application
Standard rate (28 days) C SM NI 125 01/04/2015 125 0.0% 01/04/2016
Making false statement in connection with street trading licence application
Discounted rate (14 days) C SM NI 75 01/04/2015 75 0.0% 01/04/2016
Resisting or obstructing an authorised officer (street trading)
Standard rate (28 days) C SM NI 250 01/04/2015 250 0.0% 01/04/2016
Resisting or obstructing an authorised officer (street trading)
Discounted rate (14 days) C SM NI 150 01/04/2015 150 0.0% 01/04/2016
Failure to produce street trading licence on demand
Standard rate (28 days) C SM NI 100 01/04/2015 100 0.0% 01/04/2016
Failure to produce street trading licence on demand
Discounted rate (14 days) C SM NI 60 01/04/2015 60 0.0% 01/04/2016
Displaying advertisement in contravention of regulations
Standard rate (28 days) C SM NI 100 01/04/2015 100 0.0% 01/04/2016
Displaying advertisement in contravention of regulations
Discounted rate (14 days) C SM NI 60 01/04/2015 60 0.0% 01/04/2016
Painting or otherwise inscribing or affixing picture etc upon highway, tree, structure or works
Standard rate (28 days) C SM NI 100 01/04/2015 100 0.0% 01/04/2016
Painting or otherwise inscribing or affixing picture etc upon highway, tree, structure or works
Discounted rate (14 days) C SM NI 50 01/04/2015 50 0.0% 01/04/2016
Wilful Obstruction of Highway Standard rate (28 days) C SM NI 100 01/04/2015 100 0.0% 01/04/2016
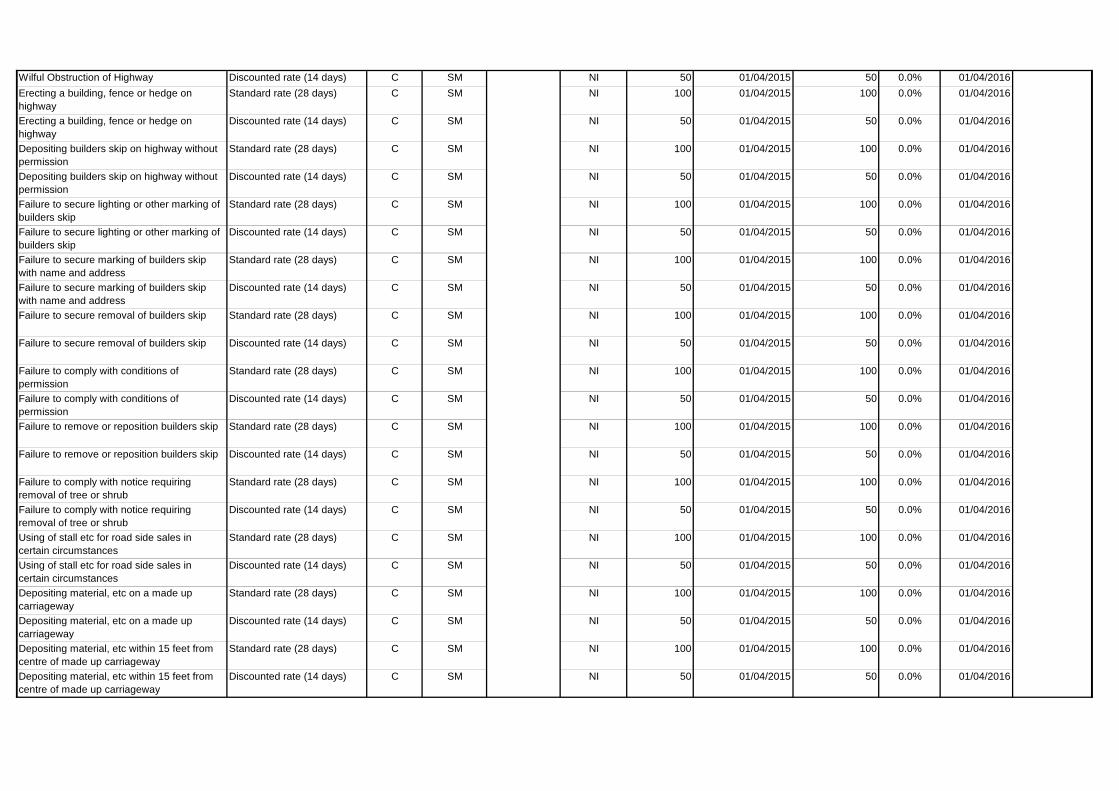
Wilful Obstruction of Highway Discounted rate (14 days) C SM NI 50 01/04/2015 50 0.0% 01/04/2016Erecting a building, fence or hedge on highway
Standard rate (28 days) C SM NI 100 01/04/2015 100 0.0% 01/04/2016
Erecting a building, fence or hedge on highway
Discounted rate (14 days) C SM NI 50 01/04/2015 50 0.0% 01/04/2016
Depositing builders skip on highway without permission
Standard rate (28 days) C SM NI 100 01/04/2015 100 0.0% 01/04/2016
Depositing builders skip on highway without permission
Discounted rate (14 days) C SM NI 50 01/04/2015 50 0.0% 01/04/2016
Failure to secure lighting or other marking of builders skip
Standard rate (28 days) C SM NI 100 01/04/2015 100 0.0% 01/04/2016
Failure to secure lighting or other marking of builders skip
Discounted rate (14 days) C SM NI 50 01/04/2015 50 0.0% 01/04/2016
Failure to secure marking of builders skip with name and address
Standard rate (28 days) C SM NI 100 01/04/2015 100 0.0% 01/04/2016
Failure to secure marking of builders skip with name and address
Discounted rate (14 days) C SM NI 50 01/04/2015 50 0.0% 01/04/2016
Failure to secure removal of builders skip Standard rate (28 days) C SM NI 100 01/04/2015 100 0.0% 01/04/2016
Failure to secure removal of builders skip Discounted rate (14 days) C SM NI 50 01/04/2015 50 0.0% 01/04/2016
Failure to comply with conditions of permission
Standard rate (28 days) C SM NI 100 01/04/2015 100 0.0% 01/04/2016
Failure to comply with conditions of permission
Discounted rate (14 days) C SM NI 50 01/04/2015 50 0.0% 01/04/2016
Failure to remove or reposition builders skip Standard rate (28 days) C SM NI 100 01/04/2015 100 0.0% 01/04/2016
Failure to remove or reposition builders skip Discounted rate (14 days) C SM NI 50 01/04/2015 50 0.0% 01/04/2016
Failure to comply with notice requiring removal of tree or shrub
Standard rate (28 days) C SM NI 100 01/04/2015 100 0.0% 01/04/2016
Failure to comply with notice requiring removal of tree or shrub
Discounted rate (14 days) C SM NI 50 01/04/2015 50 0.0% 01/04/2016
Using of stall etc for road side sales in certain circumstances
Standard rate (28 days) C SM NI 100 01/04/2015 100 0.0% 01/04/2016
Using of stall etc for road side sales in certain circumstances
Discounted rate (14 days) C SM NI 50 01/04/2015 50 0.0% 01/04/2016
Depositing material, etc on a made up carriageway
Standard rate (28 days) C SM NI 100 01/04/2015 100 0.0% 01/04/2016
Depositing material, etc on a made up carriageway
Discounted rate (14 days) C SM NI 50 01/04/2015 50 0.0% 01/04/2016
Depositing material, etc within 15 feet from centre of made up carriageway
Standard rate (28 days) C SM NI 100 01/04/2015 100 0.0% 01/04/2016
Depositing material, etc within 15 feet from centre of made up carriageway
Discounted rate (14 days) C SM NI 50 01/04/2015 50 0.0% 01/04/2016
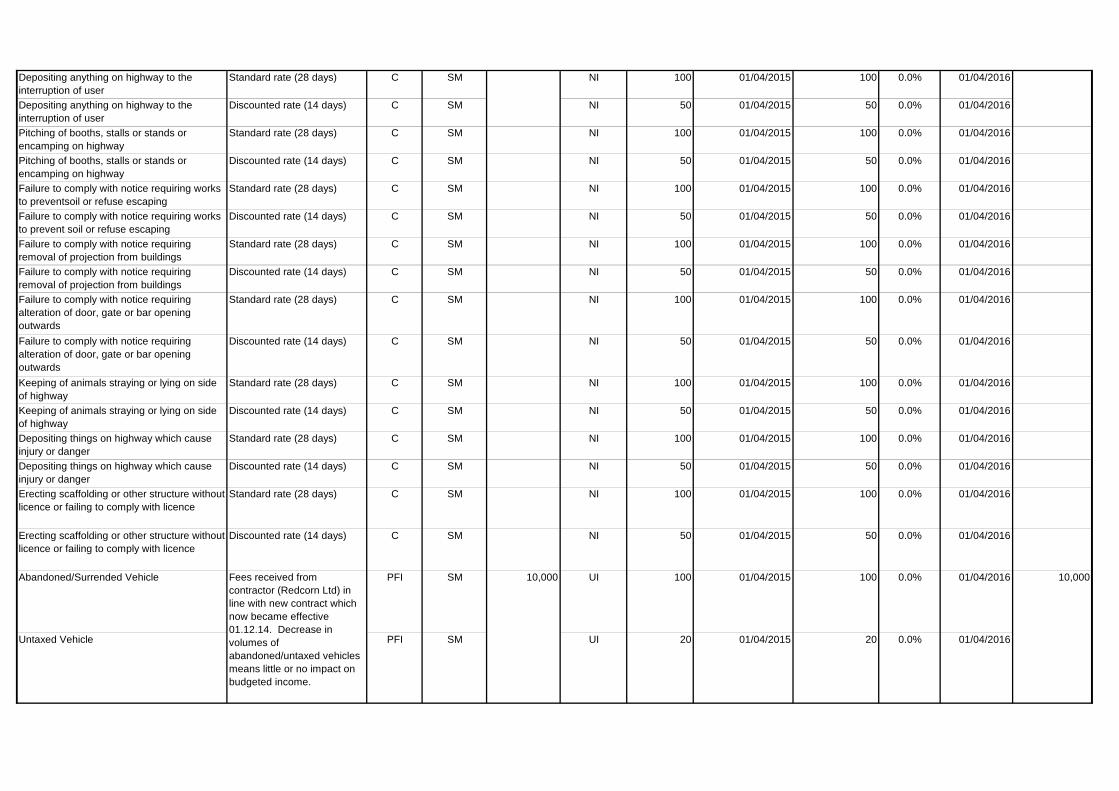
Depositing anything on highway to the interruption of user
Standard rate (28 days) C SM NI 100 01/04/2015 100 0.0% 01/04/2016
Depositing anything on highway to the interruption of user
Discounted rate (14 days) C SM NI 50 01/04/2015 50 0.0% 01/04/2016
Pitching of booths, stalls or stands or encamping on highway
Standard rate (28 days) C SM NI 100 01/04/2015 100 0.0% 01/04/2016
Pitching of booths, stalls or stands or encamping on highway
Discounted rate (14 days) C SM NI 50 01/04/2015 50 0.0% 01/04/2016
Failure to comply with notice requiring works to preventsoil or refuse escaping
Standard rate (28 days) C SM NI 100 01/04/2015 100 0.0% 01/04/2016
Failure to comply with notice requiring works to prevent soil or refuse escaping
Discounted rate (14 days) C SM NI 50 01/04/2015 50 0.0% 01/04/2016
Failure to comply with notice requiring removal of projection from buildings
Standard rate (28 days) C SM NI 100 01/04/2015 100 0.0% 01/04/2016
Failure to comply with notice requiring removal of projection from buildings
Discounted rate (14 days) C SM NI 50 01/04/2015 50 0.0% 01/04/2016
Failure to comply with notice requiring alteration of door, gate or bar opening outwards
Standard rate (28 days) C SM NI 100 01/04/2015 100 0.0% 01/04/2016
Failure to comply with notice requiring alteration of door, gate or bar opening outwards
Discounted rate (14 days) C SM NI 50 01/04/2015 50 0.0% 01/04/2016
Keeping of animals straying or lying on side of highway
Standard rate (28 days) C SM NI 100 01/04/2015 100 0.0% 01/04/2016
Keeping of animals straying or lying on side of highway
Discounted rate (14 days) C SM NI 50 01/04/2015 50 0.0% 01/04/2016
Depositing things on highway which cause injury or danger
Standard rate (28 days) C SM NI 100 01/04/2015 100 0.0% 01/04/2016
Depositing things on highway which cause injury or danger
Discounted rate (14 days) C SM NI 50 01/04/2015 50 0.0% 01/04/2016
Erecting scaffolding or other structure without licence or failing to comply with licence
Standard rate (28 days) C SM NI 100 01/04/2015 100 0.0% 01/04/2016
Erecting scaffolding or other structure without licence or failing to comply with licence
Discounted rate (14 days) C SM NI 50 01/04/2015 50 0.0% 01/04/2016
Abandoned/Surrended Vehicle PFI SM UI 100 01/04/2015 100 0.0% 01/04/2016
Untaxed Vehicle PFI SM UI 20 01/04/2015 20 0.0% 01/04/2016
Fees received from contractor (Redcorn Ltd) in line with new contract which now became effective 01.12.14. Decrease in volumes of abandoned/untaxed vehicles means little or no impact on budgeted income.
10,000 10,000
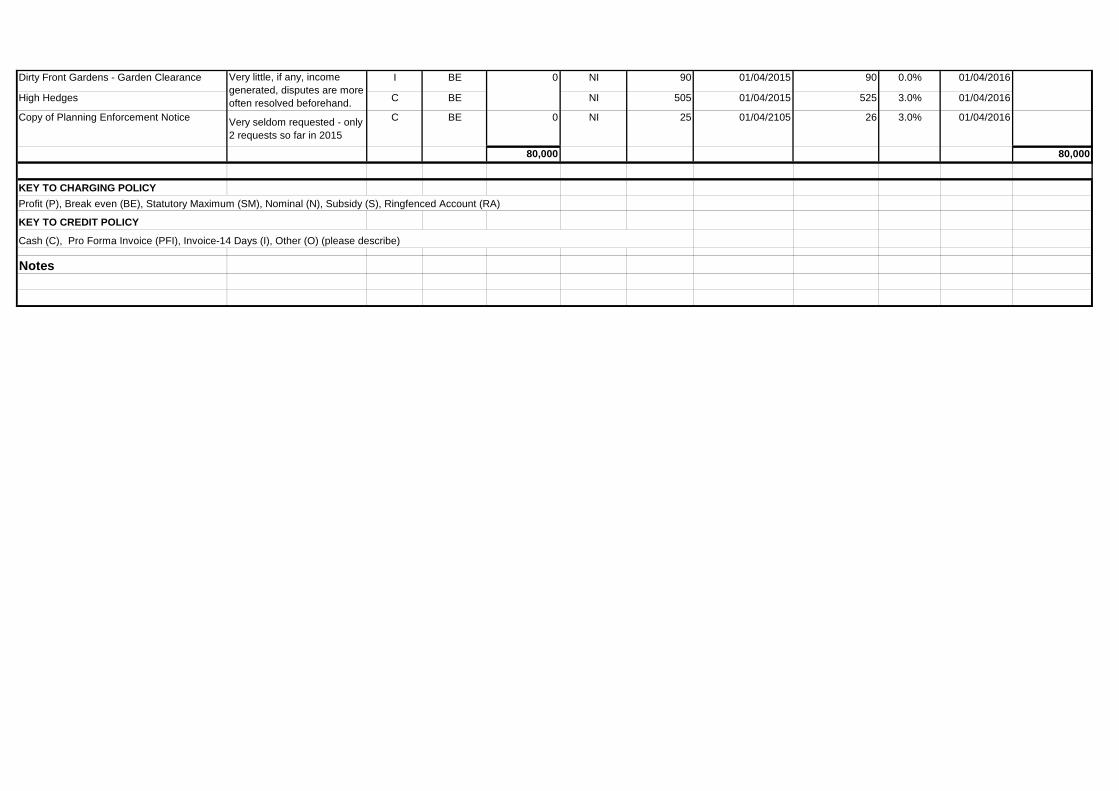
Dirty Front Gardens - Garden Clearance I BE NI 90 01/04/2015 90 0.0% 01/04/2016
High Hedges C BE NI 505 01/04/2015 525 3.0% 01/04/2016
Copy of Planning Enforcement Notice Very seldom requested - only 2 requests so far in 2015
C BE 0 NI 25 01/04/2105 26 3.0% 01/04/2016
80,000 80,000
KEY TO CHARGING POLICYProfit (P), Break even (BE), Statutory Maximum (SM), Nominal (N), Subsidy (S), Ringfenced Account (RA)
Notes
KEY TO CREDIT POLICY
Cash (C), Pro Forma Invoice (PFI), Invoice-14 Days (I), Other (O) (please describe)
Very little, if any, income generated, disputes are more often resolved beforehand.
0
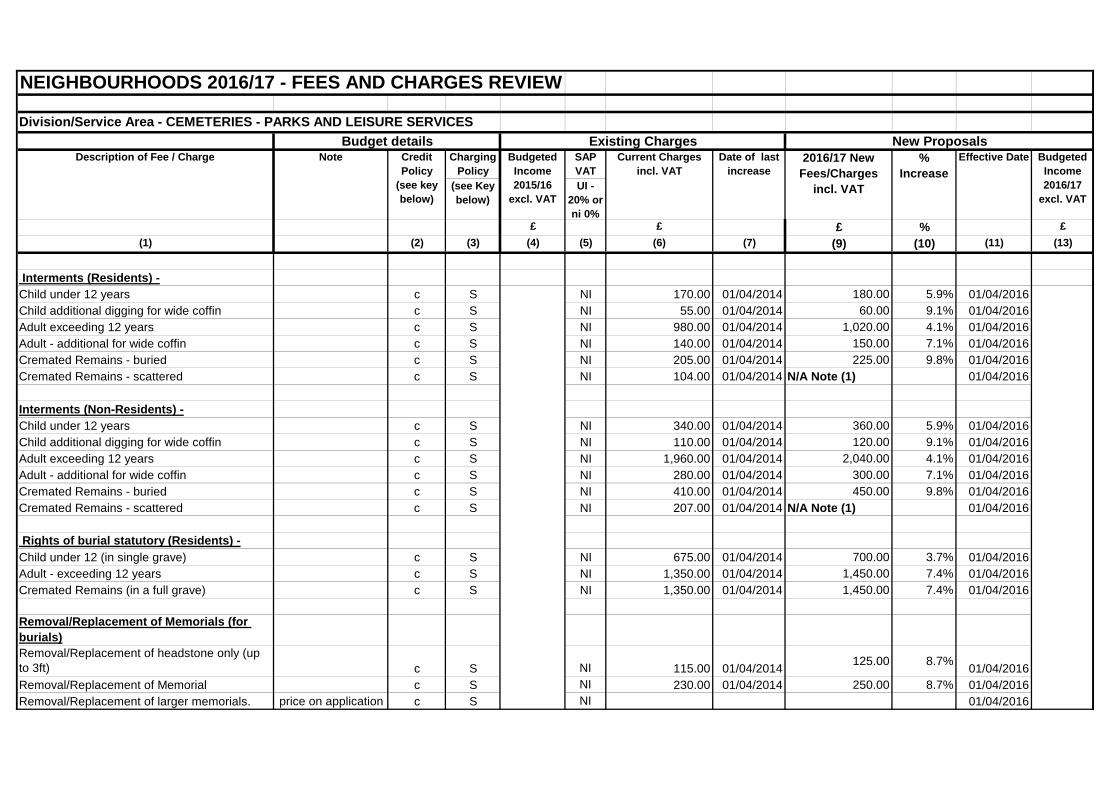
NEIGHBOURHOODS 2016/17 - FEES AND CHARGES REVIEW Division/Service Area - CEMETERIES - PARKS AND LEISURE SERVICES
Charging Policy
SAP VAT
(see Key below)
UI - 20% or ni 0%
£ £ £ % £(1) (2) (3) (4) (5) (6) (7) (9) (10) (11) (13)
Interments (Residents) -Child under 12 years c S NI 170.00 01/04/2014 180.00 5.9% 01/04/2016Child additional digging for wide coffin c S NI 55.00 01/04/2014 60.00 9.1% 01/04/2016Adult exceeding 12 years c S NI 980.00 01/04/2014 1,020.00 4.1% 01/04/2016Adult - additional for wide coffin c S NI 140.00 01/04/2014 150.00 7.1% 01/04/2016Cremated Remains - buried c S NI 205.00 01/04/2014 225.00 9.8% 01/04/2016Cremated Remains - scattered c S NI 104.00 01/04/2014 N/A Note (1) 01/04/2016
Interments (Non-Residents) -Child under 12 years c S NI 340.00 01/04/2014 360.00 5.9% 01/04/2016Child additional digging for wide coffin c S NI 110.00 01/04/2014 120.00 9.1% 01/04/2016Adult exceeding 12 years c S NI 1,960.00 01/04/2014 2,040.00 4.1% 01/04/2016Adult - additional for wide coffin c S NI 280.00 01/04/2014 300.00 7.1% 01/04/2016Cremated Remains - buried c S NI 410.00 01/04/2014 450.00 9.8% 01/04/2016Cremated Remains - scattered c S NI 207.00 01/04/2014 N/A Note (1) 01/04/2016
Rights of burial statutory (Residents) -Child under 12 (in single grave) c S NI 675.00 01/04/2014 700.00 3.7% 01/04/2016Adult - exceeding 12 years c S NI 1,350.00 01/04/2014 1,450.00 7.4% 01/04/2016Cremated Remains (in a full grave) c S NI 1,350.00 01/04/2014 1,450.00 7.4% 01/04/2016
Removal/Replacement of Memorials (for burials)Removal/Replacement of headstone only (up to 3ft) c S NI 115.00 01/04/2014 125.00 8.7% 01/04/2016Removal/Replacement of Memorial c S NI 230.00 01/04/2014 250.00 8.7% 01/04/2016Removal/Replacement of larger memorials. price on application c S NI 01/04/2016
Date of last increase
2016/17 New Fees/Charges
incl. VAT
% Increase
Effective Date Budgeted Income 2016/17
excl. VAT
Budget details Existing Charges New ProposalsDescription of Fee / Charge Note Credit
Policy (see key below)
Budgeted Income 2015/16
excl. VAT
Current Charges incl. VAT
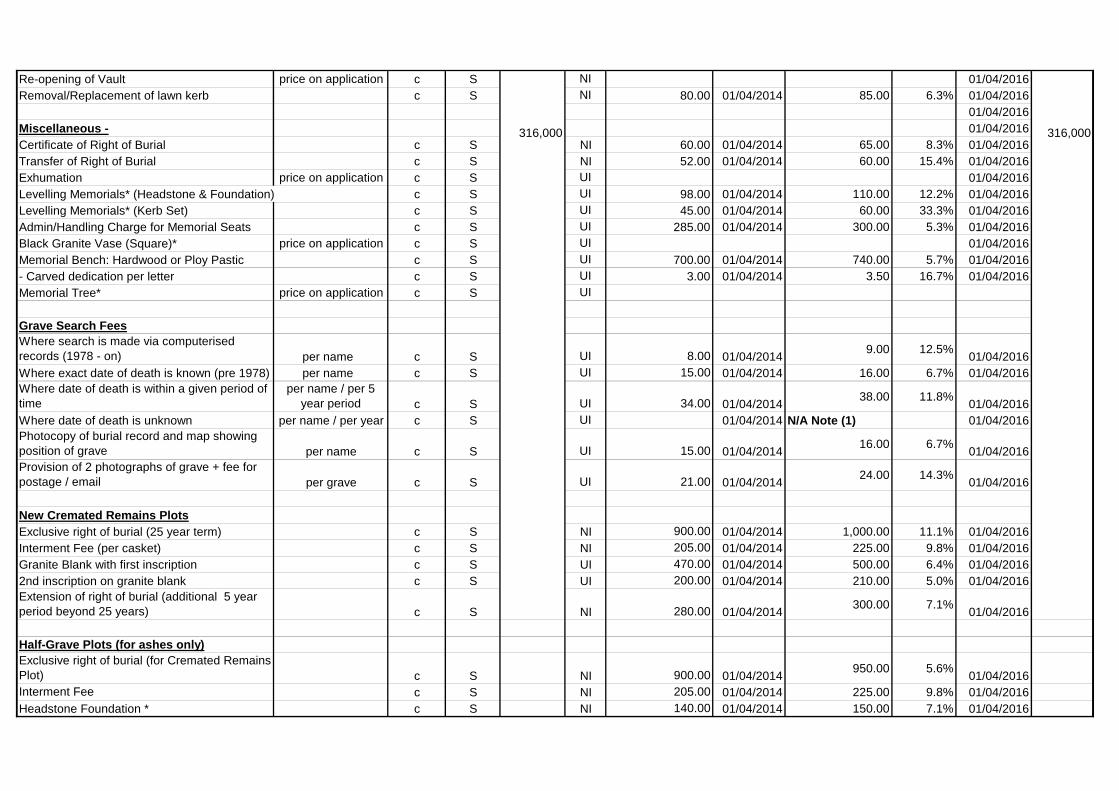
Re-opening of Vault price on application c S NI 01/04/2016Removal/Replacement of lawn kerb c S NI 80.00 01/04/2014 85.00 6.3% 01/04/2016
01/04/2016Miscellaneous - 01/04/2016Certificate of Right of Burial c S NI 60.00 01/04/2014 65.00 8.3% 01/04/2016Transfer of Right of Burial c S NI 52.00 01/04/2014 60.00 15.4% 01/04/2016Exhumation price on application c S UI 01/04/2016Levelling Memorials* (Headstone & Foundation) c S UI 98.00 01/04/2014 110.00 12.2% 01/04/2016Levelling Memorials* (Kerb Set) c S UI 45.00 01/04/2014 60.00 33.3% 01/04/2016Admin/Handling Charge for Memorial Seats c S UI 285.00 01/04/2014 300.00 5.3% 01/04/2016Black Granite Vase (Square)* price on application c S UI 01/04/2016Memorial Bench: Hardwood or Ploy Pastic c S UI 700.00 01/04/2014 740.00 5.7% 01/04/2016- Carved dedication per letter c S UI 3.00 01/04/2014 3.50 16.7% 01/04/2016Memorial Tree* price on application c S UI
Grave Search FeesWhere search is made via computerised records (1978 - on) per name c S UI 8.00 01/04/2014 9.00 12.5% 01/04/2016Where exact date of death is known (pre 1978) per name c S UI 15.00 01/04/2014 16.00 6.7% 01/04/2016Where date of death is within a given period of time
per name / per 5 year period c S UI 34.00 01/04/2014 38.00 11.8% 01/04/2016
Where date of death is unknown per name / per year c S UI 01/04/2014 N/A Note (1) 01/04/2016Photocopy of burial record and map showing position of grave per name c S UI 15.00 01/04/2014 16.00 6.7% 01/04/2016Provision of 2 photographs of grave + fee for postage / email per grave c S UI 21.00 01/04/2014 24.00 14.3% 01/04/2016
New Cremated Remains PlotsExclusive right of burial (25 year term) c S NI 900.00 01/04/2014 1,000.00 11.1% 01/04/2016Interment Fee (per casket) c S NI 205.00 01/04/2014 225.00 9.8% 01/04/2016Granite Blank with first inscription c S UI 470.00 01/04/2014 500.00 6.4% 01/04/20162nd inscription on granite blank c S UI 200.00 01/04/2014 210.00 5.0% 01/04/2016Extension of right of burial (additional 5 year period beyond 25 years) c S NI 280.00 01/04/2014 300.00 7.1% 01/04/2016
Half-Grave Plots (for ashes only)Exclusive right of burial (for Cremated Remains Plot) c S NI 900.00 01/04/2014 950.00 5.6% 01/04/2016Interment Fee c S NI 205.00 01/04/2014 225.00 9.8% 01/04/2016Headstone Foundation * c S NI 140.00 01/04/2014 150.00 7.1% 01/04/2016
316,000 316,000
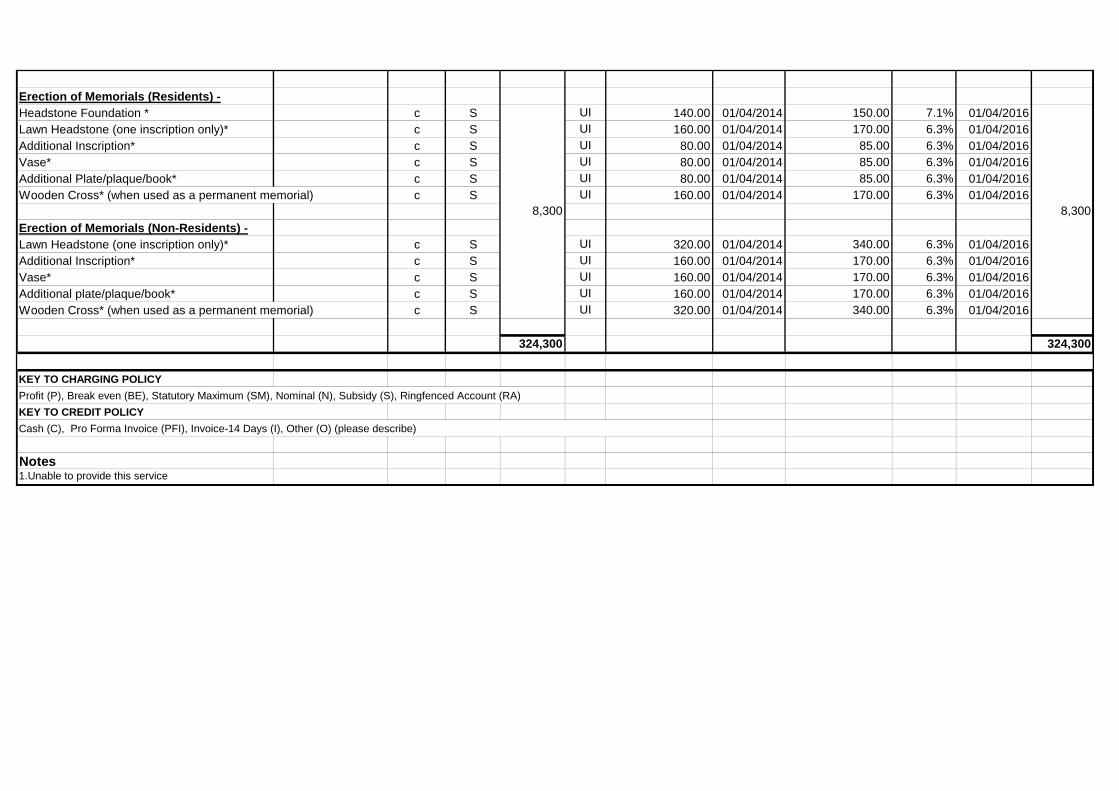
Erection of Memorials (Residents) -Headstone Foundation * c S UI 140.00 01/04/2014 150.00 7.1% 01/04/2016Lawn Headstone (one inscription only)* c S UI 160.00 01/04/2014 170.00 6.3% 01/04/2016Additional Inscription* c S UI 80.00 01/04/2014 85.00 6.3% 01/04/2016Vase* c S UI 80.00 01/04/2014 85.00 6.3% 01/04/2016Additional Plate/plaque/book* c S UI 80.00 01/04/2014 85.00 6.3% 01/04/2016Wooden Cross* (when used as a permanent memorial) c S UI 160.00 01/04/2014 170.00 6.3% 01/04/2016
Erection of Memorials (Non-Residents) -Lawn Headstone (one inscription only)* c S UI 320.00 01/04/2014 340.00 6.3% 01/04/2016Additional Inscription* c S UI 160.00 01/04/2014 170.00 6.3% 01/04/2016Vase* c S UI 160.00 01/04/2014 170.00 6.3% 01/04/2016Additional plate/plaque/book* c S UI 160.00 01/04/2014 170.00 6.3% 01/04/2016Wooden Cross* (when used as a permanent memorial) c S UI 320.00 01/04/2014 340.00 6.3% 01/04/2016
324,300 324,300
KEY TO CHARGING POLICYProfit (P), Break even (BE), Statutory Maximum (SM), Nominal (N), Subsidy (S), Ringfenced Account (RA)
Notes1.Unable to provide this service
Cash (C), Pro Forma Invoice (PFI), Invoice-14 Days (I), Other (O) (please describe)
8,300 8,300
KEY TO CREDIT POLICY
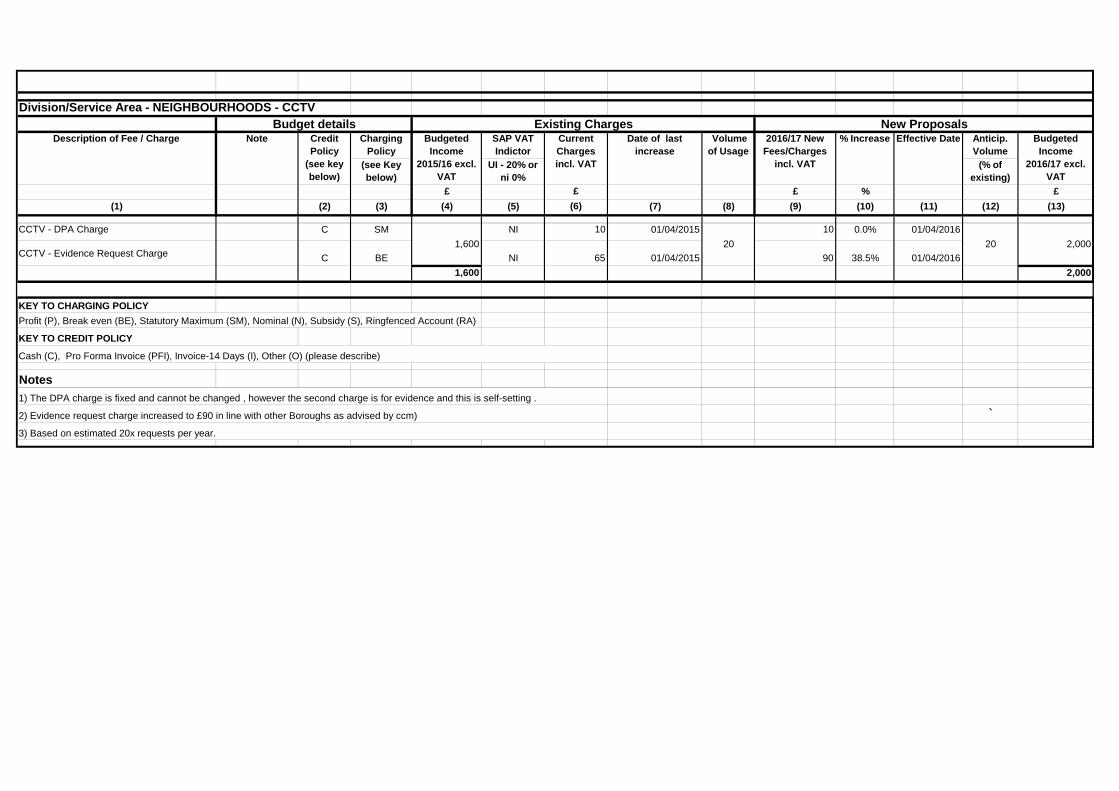
Division/Service Area - NEIGHBOURHOODS - CCTV
Charging Policy
SAP VAT Indictor
Anticip. Volume
(see Key below)
UI - 20% or ni 0%
(% of existing)
£ £ £ % £(1) (2) (3) (4) (5) (6) (7) (8) (9) (10) (11) (12) (13)
CCTV - DPA Charge C SM NI 10 01/04/2015 10 0.0% 01/04/2016
CCTV - Evidence Request Charge C BE NI 65 01/04/2015 90 38.5% 01/04/20161,600 2,000
KEY TO CHARGING POLICYProfit (P), Break even (BE), Statutory Maximum (SM), Nominal (N), Subsidy (S), Ringfenced Account (RA)
Notes
`
Budget details Existing Charges New ProposalsDescription of Fee / Charge Note Credit
Policy (see key below)
Budgeted Income
2015/16 excl. VAT
Current Charges incl. VAT
2,000
KEY TO CREDIT POLICY
Cash (C), Pro Forma Invoice (PFI), Invoice-14 Days (I), Other (O) (please describe)
Date of last increase
Volume of Usage
2016/17 New Fees/Charges
incl. VAT
% Increase Effective Date Budgeted Income
2016/17 excl. VAT
1) The DPA charge is fixed and cannot be changed , however the second charge is for evidence and this is self-setting .
2) Evidence request charge increased to £90 in line with other Boroughs as advised by ccm)
3) Based on estimated 20x requests per year.
1,600 20 20
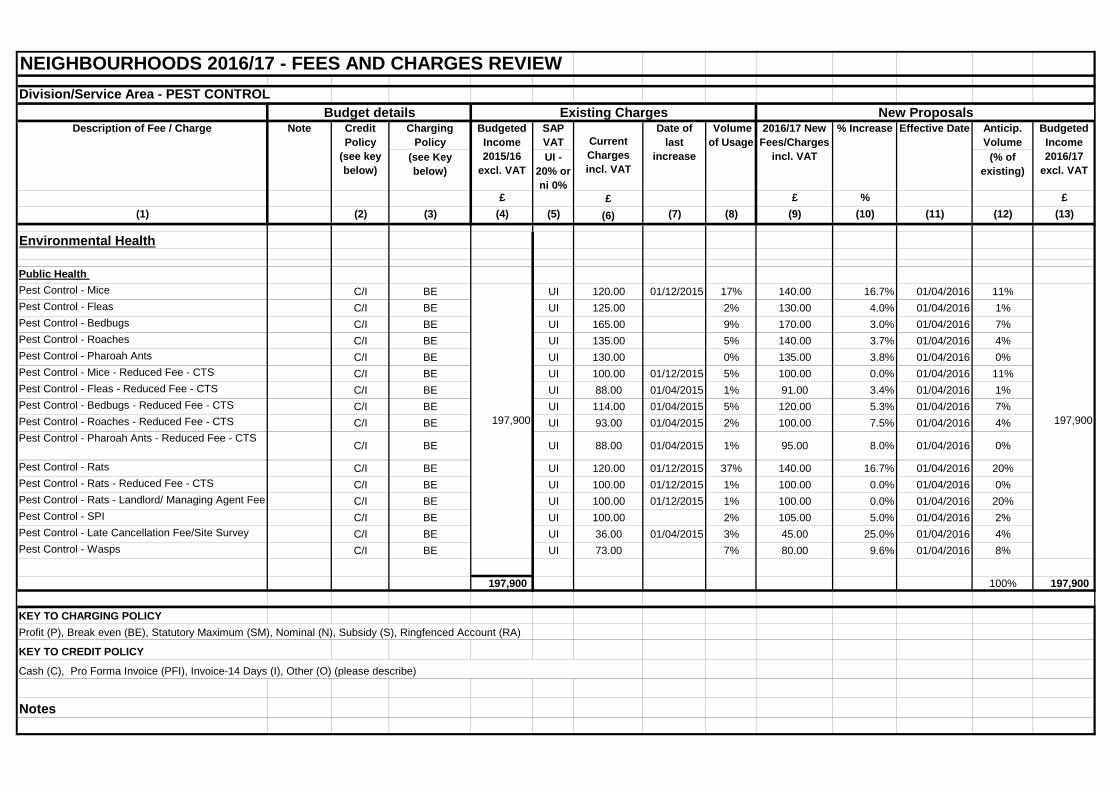
NEIGHBOURHOODS 2016/17 - FEES AND CHARGES REVIEW Division/Service Area - PEST CONTROL
Charging Policy
SAP VAT
Anticip. Volume
(see Key below)
UI - 20% or ni 0%
(% of existing)
£ £ £ % £(1) (2) (3) (4) (5) (6) (7) (8) (9) (10) (11) (12) (13)
Environmental Health
Public Health Pest Control - Mice C/I BE UI 120.00 01/12/2015 17% 140.00 16.7% 01/04/2016 11%Pest Control - Fleas C/I BE UI 125.00 2% 130.00 4.0% 01/04/2016 1%Pest Control - Bedbugs C/I BE UI 165.00 9% 170.00 3.0% 01/04/2016 7%Pest Control - Roaches C/I BE UI 135.00 5% 140.00 3.7% 01/04/2016 4%Pest Control - Pharoah Ants C/I BE UI 130.00 0% 135.00 3.8% 01/04/2016 0%Pest Control - Mice - Reduced Fee - CTS C/I BE UI 100.00 01/12/2015 5% 100.00 0.0% 01/04/2016 11%Pest Control - Fleas - Reduced Fee - CTS C/I BE UI 88.00 01/04/2015 1% 91.00 3.4% 01/04/2016 1%Pest Control - Bedbugs - Reduced Fee - CTS C/I BE UI 114.00 01/04/2015 5% 120.00 5.3% 01/04/2016 7%Pest Control - Roaches - Reduced Fee - CTS C/I BE UI 93.00 01/04/2015 2% 100.00 7.5% 01/04/2016 4%Pest Control - Pharoah Ants - Reduced Fee - CTS
C/I BE UI 88.00 01/04/2015 1% 95.00 8.0% 01/04/2016 0%
Pest Control - Rats C/I BE UI 120.00 01/12/2015 37% 140.00 16.7% 01/04/2016 20%Pest Control - Rats - Reduced Fee - CTS C/I BE UI 100.00 01/12/2015 1% 100.00 0.0% 01/04/2016 0%Pest Control - Rats - Landlord/ Managing Agent Fee C/I BE UI 100.00 01/12/2015 1% 100.00 0.0% 01/04/2016 20%Pest Control - SPI C/I BE UI 100.00 2% 105.00 5.0% 01/04/2016 2%Pest Control - Late Cancellation Fee/Site Survey C/I BE UI 36.00 01/04/2015 3% 45.00 25.0% 01/04/2016 4%Pest Control - Wasps C/I BE UI 73.00 7% 80.00 9.6% 01/04/2016 8%
197,900 100% 197,900
KEY TO CHARGING POLICYProfit (P), Break even (BE), Statutory Maximum (SM), Nominal (N), Subsidy (S), Ringfenced Account (RA)
Notes
Budget details Existing Charges New ProposalsDescription of Fee / Charge Note Credit
Policy (see key below)
Budgeted Income 2015/16
excl. VAT
Current Charges incl. VAT
197,900 197,900
KEY TO CREDIT POLICY
Cash (C), Pro Forma Invoice (PFI), Invoice-14 Days (I), Other (O) (please describe)
Date of last
increase
Volume of Usage
2016/17 New Fees/Charges
incl. VAT
% Increase Effective Date Budgeted Income 2016/17
excl. VAT
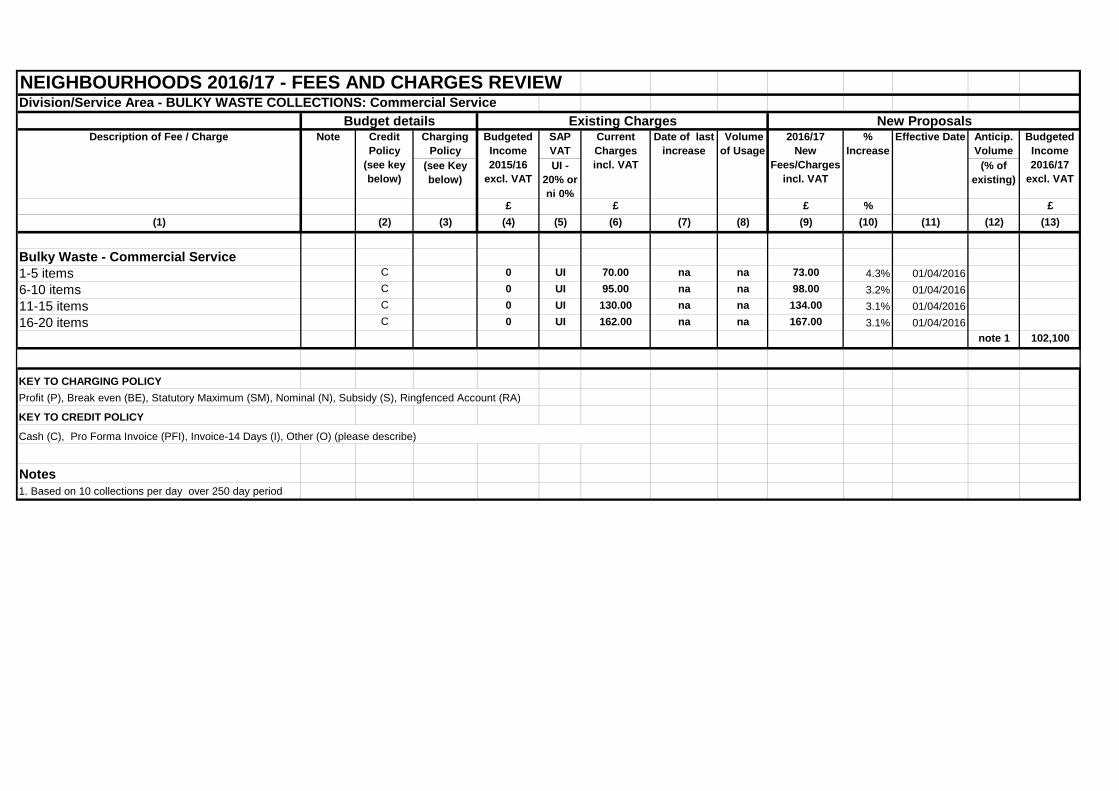
NEIGHBOURHOODS 2016/17 - FEES AND CHARGES REVIEWDivision/Service Area - BULKY WASTE COLLECTIONS: Commercial Service
Charging Policy
SAP VAT
Anticip. Volume
(see Key below)
UI - 20% or ni 0%
(% of existing)
£ £ £ % £(1) (2) (3) (4) (5) (6) (7) (8) (9) (10) (11) (12) (13)
Bulky Waste - Commercial Service1-5 items C 0 UI 70.00 na na 73.00 4.3% 01/04/20166-10 items C 0 UI 95.00 na na 98.00 3.2% 01/04/201611-15 items C 0 UI 130.00 na na 134.00 3.1% 01/04/201616-20 items C 0 UI 162.00 na na 167.00 3.1% 01/04/2016
note 1 102,100
KEY TO CHARGING POLICYProfit (P), Break even (BE), Statutory Maximum (SM), Nominal (N), Subsidy (S), Ringfenced Account (RA)
Notes1. Based on 10 collections per day over 250 day period
Effective Date Budgeted Income 2016/17
excl. VAT
Budget details Existing Charges New ProposalsDescription of Fee / Charge Note Credit
Policy (see key below)
KEY TO CREDIT POLICY
Cash (C), Pro Forma Invoice (PFI), Invoice-14 Days (I), Other (O) (please describe)
Date of last increase
Volume of Usage
2016/17 New
Fees/Charges incl. VAT
% Increase
Budgeted Income 2015/16
excl. VAT
Current Charges incl. VAT
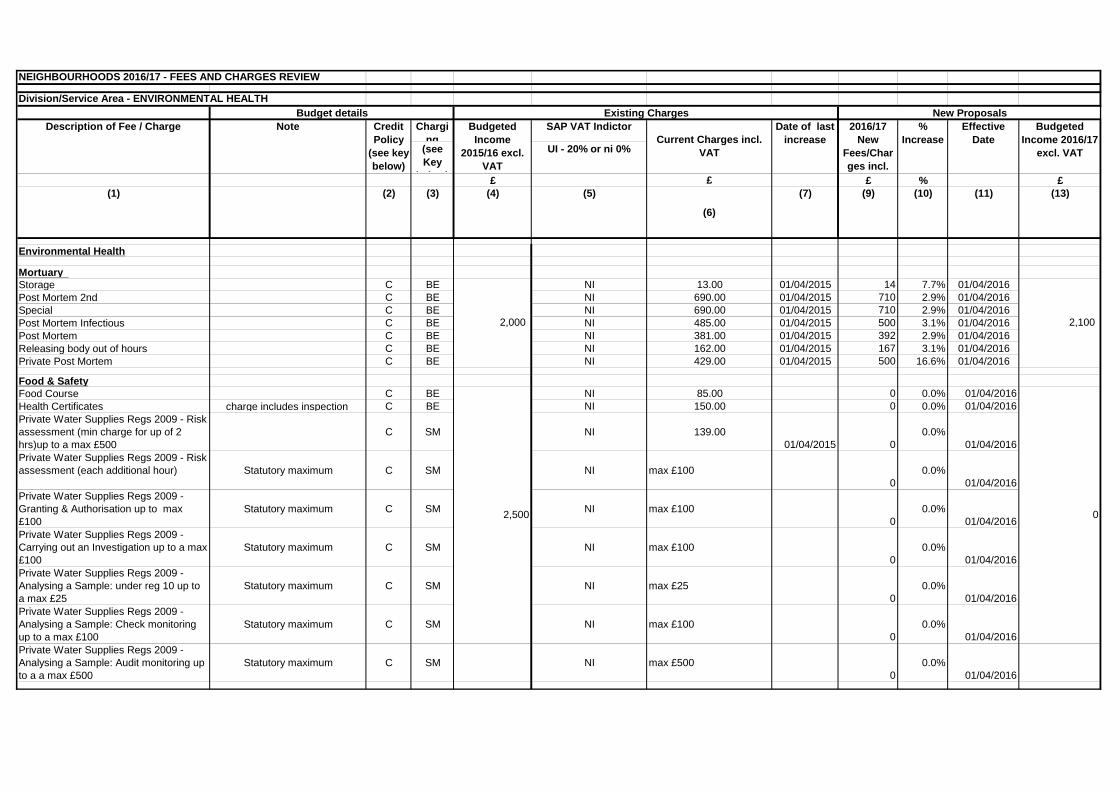
NEIGHBOURHOODS 2016/17 - FEES AND CHARGES REVIEW Division/Service Area - ENVIRONMENTAL HEALTH
Charging
SAP VAT Indictor
(see Key
b l )
UI - 20% or ni 0%
£ £ £ % £(1) (2) (3) (4) (5)
(6)
(7) (9) (10) (11) (13)
Environmental Health
Mortuary Storage C BE NI 13.00 01/04/2015 14 7.7% 01/04/2016Post Mortem 2nd C BE NI 690.00 01/04/2015 710 2.9% 01/04/2016Special C BE NI 690.00 01/04/2015 710 2.9% 01/04/2016Post Mortem Infectious C BE NI 485.00 01/04/2015 500 3.1% 01/04/2016Post Mortem C BE NI 381.00 01/04/2015 392 2.9% 01/04/2016Releasing body out of hours C BE NI 162.00 01/04/2015 167 3.1% 01/04/2016Private Post Mortem C BE NI 429.00 01/04/2015 500 16.6% 01/04/2016
Food & SafetyFood Course C BE NI 85.00 0 0.0% 01/04/2016Health Certificates charge includes inspection C BE NI 150.00 0 0.0% 01/04/2016Private Water Supplies Regs 2009 - Risk assessment (min charge for up of 2 hrs)up to a max £500
C SM NI 139.0001/04/2015 0
0.0%01/04/2016
Private Water Supplies Regs 2009 - Risk assessment (each additional hour) Statutory maximum C SM NI max £100
00.0%
01/04/2016Private Water Supplies Regs 2009 - Granting & Authorisation up to max £100
Statutory maximum C SM NI max £1000
0.0%01/04/2016
Private Water Supplies Regs 2009 - Carrying out an Investigation up to a max £100
Statutory maximum C SM NI max £1000
0.0%01/04/2016
Private Water Supplies Regs 2009 - Analysing a Sample: under reg 10 up to a max £25
Statutory maximum C SM NI max £250
0.0%01/04/2016
Private Water Supplies Regs 2009 - Analysing a Sample: Check monitoring up to a max £100
Statutory maximum C SM NI max £1000
0.0%01/04/2016
Private Water Supplies Regs 2009 - Analysing a Sample: Audit monitoring up to a a max £500
Statutory maximum C SM NI max £5000
0.0%01/04/2016
Budget details Existing Charges New ProposalsDescription of Fee / Charge Note Credit
Policy (see key below)
Budgeted Income
2015/16 excl. VAT
Current Charges incl. VAT
Date of last increase
2016/17 New
Fees/Charges incl.
% Increase
Effective Date
Budgeted Income 2016/17
excl. VAT
2,000 2,100
2,500 0
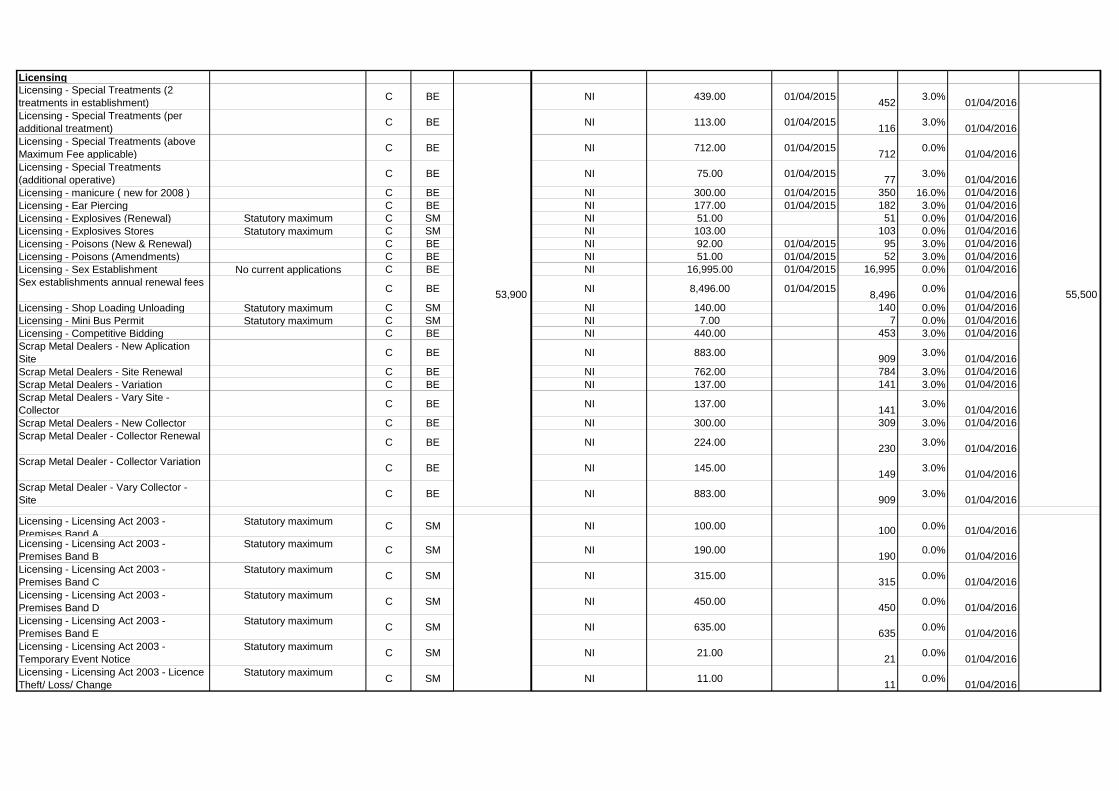
LicensingLicensing - Special Treatments (2 treatments in establishment) C BE NI 439.00 01/04/2015 452 3.0% 01/04/2016Licensing - Special Treatments (per additional treatment) C BE NI 113.00 01/04/2015 116 3.0% 01/04/2016Licensing - Special Treatments (above Maximum Fee applicable) C BE NI 712.00 01/04/2015 712 0.0% 01/04/2016Licensing - Special Treatments (additional operative) C BE NI 75.00 01/04/2015 77 3.0% 01/04/2016Licensing - manicure ( new for 2008 ) C BE NI 300.00 01/04/2015 350 16.0% 01/04/2016Licensing - Ear Piercing C BE NI 177.00 01/04/2015 182 3.0% 01/04/2016Licensing - Explosives (Renewal) Statutory maximum C SM NI 51.00 51 0.0% 01/04/2016Licensing - Explosives Stores Statutory maximum C SM NI 103.00 103 0.0% 01/04/2016Licensing - Poisons (New & Renewal) C BE NI 92.00 01/04/2015 95 3.0% 01/04/2016Licensing - Poisons (Amendments) C BE NI 51.00 01/04/2015 52 3.0% 01/04/2016Licensing - Sex Establishment No current applications C BE NI 16,995.00 01/04/2015 16,995 0.0% 01/04/2016Sex establishments annual renewal fees C BE NI 8,496.00 01/04/2015 8,496 0.0% 01/04/2016Licensing - Shop Loading Unloading Statutory maximum C SM NI 140.00 140 0.0% 01/04/2016Licensing - Mini Bus Permit Statutory maximum C SM NI 7.00 7 0.0% 01/04/2016Licensing - Competitive Bidding C BE NI 440.00 453 3.0% 01/04/2016Scrap Metal Dealers - New Aplication Site C BE NI 883.00 909 3.0% 01/04/2016Scrap Metal Dealers - Site Renewal C BE NI 762.00 784 3.0% 01/04/2016Scrap Metal Dealers - Variation C BE NI 137.00 141 3.0% 01/04/2016Scrap Metal Dealers - Vary Site - Collector C BE NI 137.00 141 3.0% 01/04/2016Scrap Metal Dealers - New Collector C BE NI 300.00 309 3.0% 01/04/2016Scrap Metal Dealer - Collector Renewal C BE NI 224.00 230 3.0% 01/04/2016Scrap Metal Dealer - Collector Variation C BE NI 145.00 149 3.0% 01/04/2016Scrap Metal Dealer - Vary Collector - Site C BE NI 883.00 909 3.0% 01/04/2016
Licensing - Licensing Act 2003 - Premises Band A
Statutory maximum C SM NI 100.00 100 0.0% 01/04/2016Licensing - Licensing Act 2003 - Premises Band B
Statutory maximum C SM NI 190.00 190 0.0% 01/04/2016Licensing - Licensing Act 2003 - Premises Band C
Statutory maximum C SM NI 315.00 315 0.0% 01/04/2016Licensing - Licensing Act 2003 - Premises Band D
Statutory maximum C SM NI 450.00 450 0.0% 01/04/2016Licensing - Licensing Act 2003 - Premises Band E
Statutory maximum C SM NI 635.00 635 0.0% 01/04/2016Licensing - Licensing Act 2003 - Temporary Event Notice
Statutory maximum C SM NI 21.00 21 0.0% 01/04/2016Licensing - Licensing Act 2003 - Licence Theft/ Loss/ Change
Statutory maximum C SM NI 11.00 11 0.0% 01/04/2016
53,900 55,500
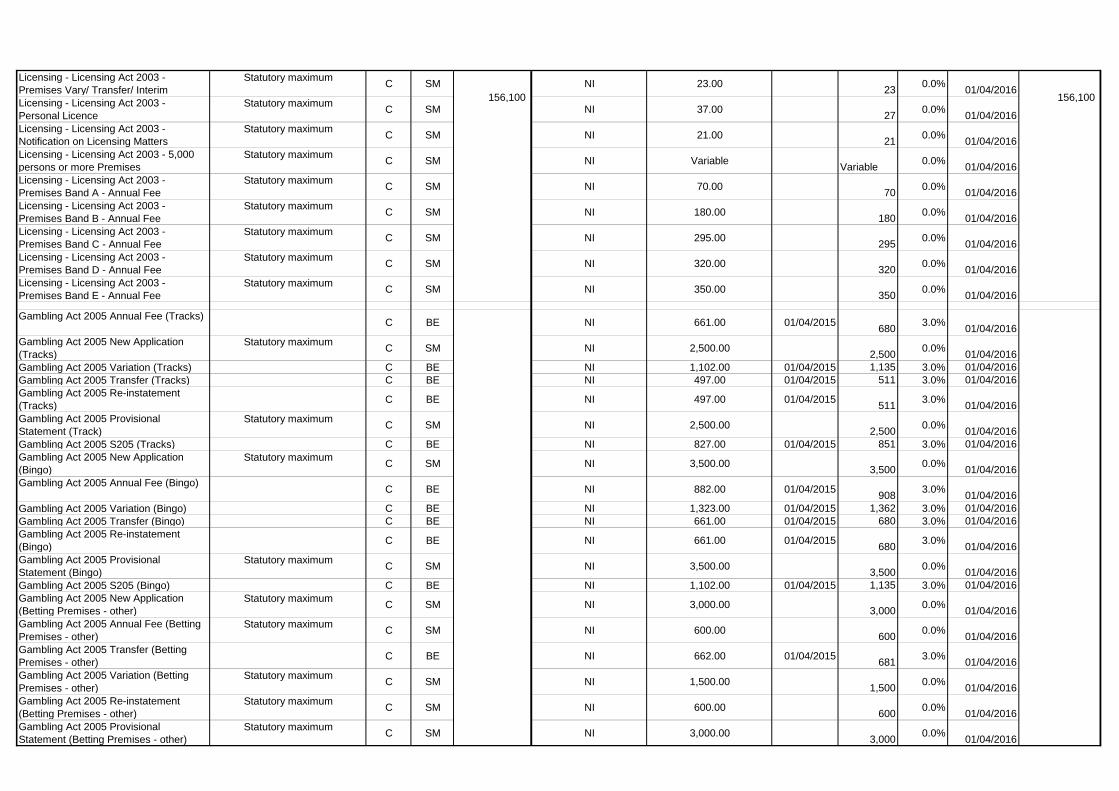
Licensing - Licensing Act 2003 - Premises Vary/ Transfer/ Interim
Statutory maximum C SM NI 23.00 23 0.0% 01/04/2016Licensing - Licensing Act 2003 - Personal Licence
Statutory maximum C SM NI 37.00 27 0.0% 01/04/2016Licensing - Licensing Act 2003 - Notification on Licensing Matters
Statutory maximum C SM NI 21.00 21 0.0% 01/04/2016Licensing - Licensing Act 2003 - 5,000 persons or more Premises
Statutory maximum C SM NI Variable Variable 0.0% 01/04/2016Licensing - Licensing Act 2003 - Premises Band A - Annual Fee
Statutory maximum C SM NI 70.00 70 0.0% 01/04/2016Licensing - Licensing Act 2003 - Premises Band B - Annual Fee
Statutory maximum C SM NI 180.00 180 0.0% 01/04/2016Licensing - Licensing Act 2003 - Premises Band C - Annual Fee
Statutory maximum C SM NI 295.00 295 0.0% 01/04/2016Licensing - Licensing Act 2003 - Premises Band D - Annual Fee
Statutory maximum C SM NI 320.00 320 0.0% 01/04/2016Licensing - Licensing Act 2003 - Premises Band E - Annual Fee
Statutory maximum C SM NI 350.00 350 0.0% 01/04/2016
Gambling Act 2005 Annual Fee (Tracks) C BE NI 661.00 01/04/2015 680 3.0% 01/04/2016Gambling Act 2005 New Application (Tracks)
Statutory maximum C SM NI 2,500.00 2,500 0.0% 01/04/2016Gambling Act 2005 Variation (Tracks) C BE NI 1,102.00 01/04/2015 1,135 3.0% 01/04/2016Gambling Act 2005 Transfer (Tracks) C BE NI 497.00 01/04/2015 511 3.0% 01/04/2016Gambling Act 2005 Re-instatement (Tracks) C BE NI 497.00 01/04/2015 511 3.0% 01/04/2016Gambling Act 2005 Provisional Statement (Track)
Statutory maximum C SM NI 2,500.00 2,500 0.0% 01/04/2016Gambling Act 2005 S205 (Tracks) C BE NI 827.00 01/04/2015 851 3.0% 01/04/2016Gambling Act 2005 New Application (Bingo)
Statutory maximum C SM NI 3,500.00 3,500 0.0% 01/04/2016Gambling Act 2005 Annual Fee (Bingo) C BE NI 882.00 01/04/2015 908 3.0% 01/04/2016Gambling Act 2005 Variation (Bingo) C BE NI 1,323.00 01/04/2015 1,362 3.0% 01/04/2016Gambling Act 2005 Transfer (Bingo) C BE NI 661.00 01/04/2015 680 3.0% 01/04/2016Gambling Act 2005 Re-instatement (Bingo) C BE NI 661.00 01/04/2015 680 3.0% 01/04/2016Gambling Act 2005 Provisional Statement (Bingo)
Statutory maximum C SM NI 3,500.00 3,500 0.0% 01/04/2016Gambling Act 2005 S205 (Bingo) C BE NI 1,102.00 01/04/2015 1,135 3.0% 01/04/2016Gambling Act 2005 New Application (Betting Premises - other)
Statutory maximum C SM NI 3,000.00 3,000 0.0% 01/04/2016Gambling Act 2005 Annual Fee (Betting Premises - other)
Statutory maximum C SM NI 600.00 600 0.0% 01/04/2016Gambling Act 2005 Transfer (Betting Premises - other) C BE NI 662.00 01/04/2015 681 3.0% 01/04/2016Gambling Act 2005 Variation (Betting Premises - other)
Statutory maximum C SM NI 1,500.00 1,500 0.0% 01/04/2016Gambling Act 2005 Re-instatement (Betting Premises - other)
Statutory maximum C SM NI 600.00 600 0.0% 01/04/2016Gambling Act 2005 Provisional Statement (Betting Premises - other)
Statutory maximum C SM NI 3,000.00 3,000 0.0% 01/04/2016
156,100 156,100
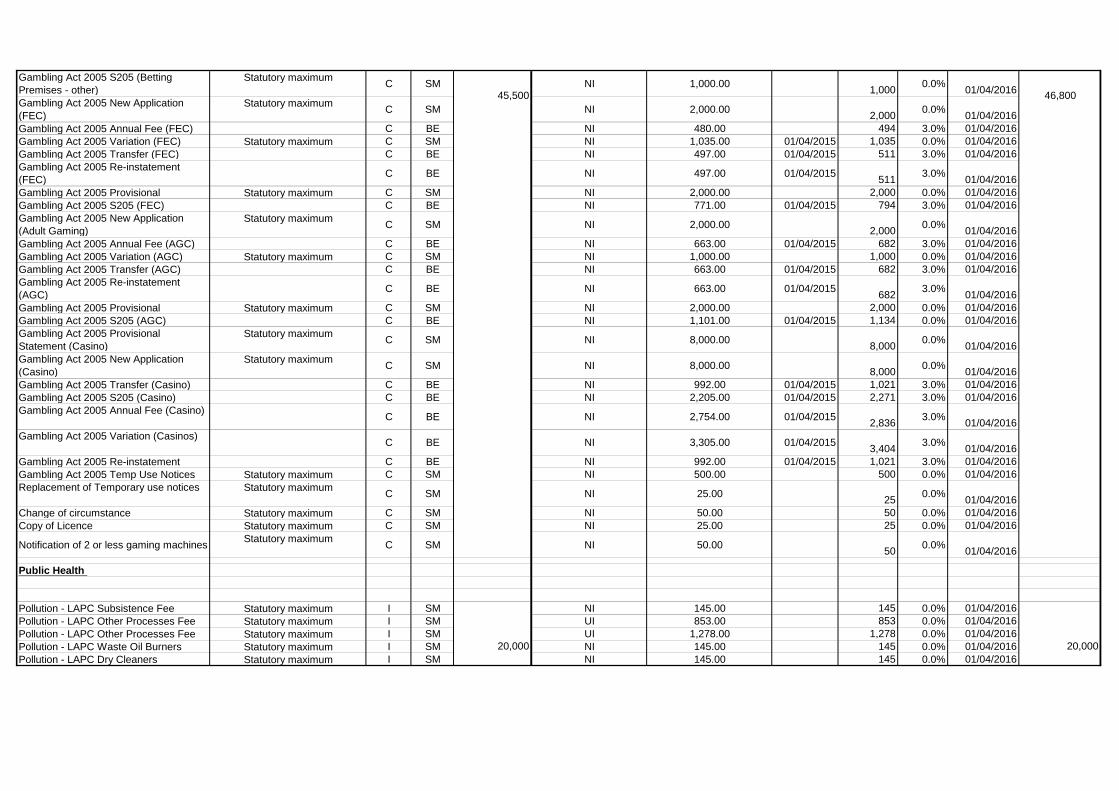
Gambling Act 2005 S205 (Betting Premises - other)
Statutory maximum C SM NI 1,000.00 1,000 0.0% 01/04/2016Gambling Act 2005 New Application (FEC)
Statutory maximum C SM NI 2,000.00 2,000 0.0% 01/04/2016Gambling Act 2005 Annual Fee (FEC) C BE NI 480.00 494 3.0% 01/04/2016Gambling Act 2005 Variation (FEC) Statutory maximum C SM NI 1,035.00 01/04/2015 1,035 0.0% 01/04/2016Gambling Act 2005 Transfer (FEC) C BE NI 497.00 01/04/2015 511 3.0% 01/04/2016Gambling Act 2005 Re-instatement (FEC) C BE NI 497.00 01/04/2015 511 3.0% 01/04/2016Gambling Act 2005 Provisional Statutory maximum C SM NI 2,000.00 2,000 0.0% 01/04/2016Gambling Act 2005 S205 (FEC) C BE NI 771.00 01/04/2015 794 3.0% 01/04/2016Gambling Act 2005 New Application (Adult Gaming)
Statutory maximum C SM NI 2,000.00 2,000 0.0% 01/04/2016Gambling Act 2005 Annual Fee (AGC) C BE NI 663.00 01/04/2015 682 3.0% 01/04/2016Gambling Act 2005 Variation (AGC) Statutory maximum C SM NI 1,000.00 1,000 0.0% 01/04/2016Gambling Act 2005 Transfer (AGC) C BE NI 663.00 01/04/2015 682 3.0% 01/04/2016Gambling Act 2005 Re-instatement (AGC) C BE NI 663.00 01/04/2015 682 3.0% 01/04/2016Gambling Act 2005 Provisional Statutory maximum C SM NI 2,000.00 2,000 0.0% 01/04/2016Gambling Act 2005 S205 (AGC) C BE NI 1,101.00 01/04/2015 1,134 0.0% 01/04/2016Gambling Act 2005 Provisional Statement (Casino)
Statutory maximum C SM NI 8,000.00 8,000 0.0% 01/04/2016Gambling Act 2005 New Application (Casino)
Statutory maximum C SM NI 8,000.00 8,000 0.0% 01/04/2016Gambling Act 2005 Transfer (Casino) C BE NI 992.00 01/04/2015 1,021 3.0% 01/04/2016Gambling Act 2005 S205 (Casino) C BE NI 2,205.00 01/04/2015 2,271 3.0% 01/04/2016Gambling Act 2005 Annual Fee (Casino) C BE NI 2,754.00 01/04/2015 2,836 3.0% 01/04/2016Gambling Act 2005 Variation (Casinos) C BE NI 3,305.00 01/04/2015 3,404 3.0% 01/04/2016Gambling Act 2005 Re-instatement C BE NI 992.00 01/04/2015 1,021 3.0% 01/04/2016Gambling Act 2005 Temp Use Notices Statutory maximum C SM NI 500.00 500 0.0% 01/04/2016Replacement of Temporary use notices Statutory maximum C SM NI 25.00 25 0.0% 01/04/2016Change of circumstance Statutory maximum C SM NI 50.00 50 0.0% 01/04/2016Copy of Licence Statutory maximum C SM NI 25.00 25 0.0% 01/04/2016
Notification of 2 or less gaming machines Statutory maximum C SM NI 50.00 50 0.0% 01/04/2016
Public Health
Pollution - LAPC Subsistence Fee Statutory maximum I SM NI 145.00 145 0.0% 01/04/2016Pollution - LAPC Other Processes Fee Statutory maximum I SM UI 853.00 853 0.0% 01/04/2016Pollution - LAPC Other Processes Fee Statutory maximum I SM UI 1,278.00 1,278 0.0% 01/04/2016Pollution - LAPC Waste Oil Burners Statutory maximum I SM NI 145.00 145 0.0% 01/04/2016Pollution - LAPC Dry Cleaners Statutory maximum I SM NI 145.00 145 0.0% 01/04/2016
45,500 46,800
20,000 20,000
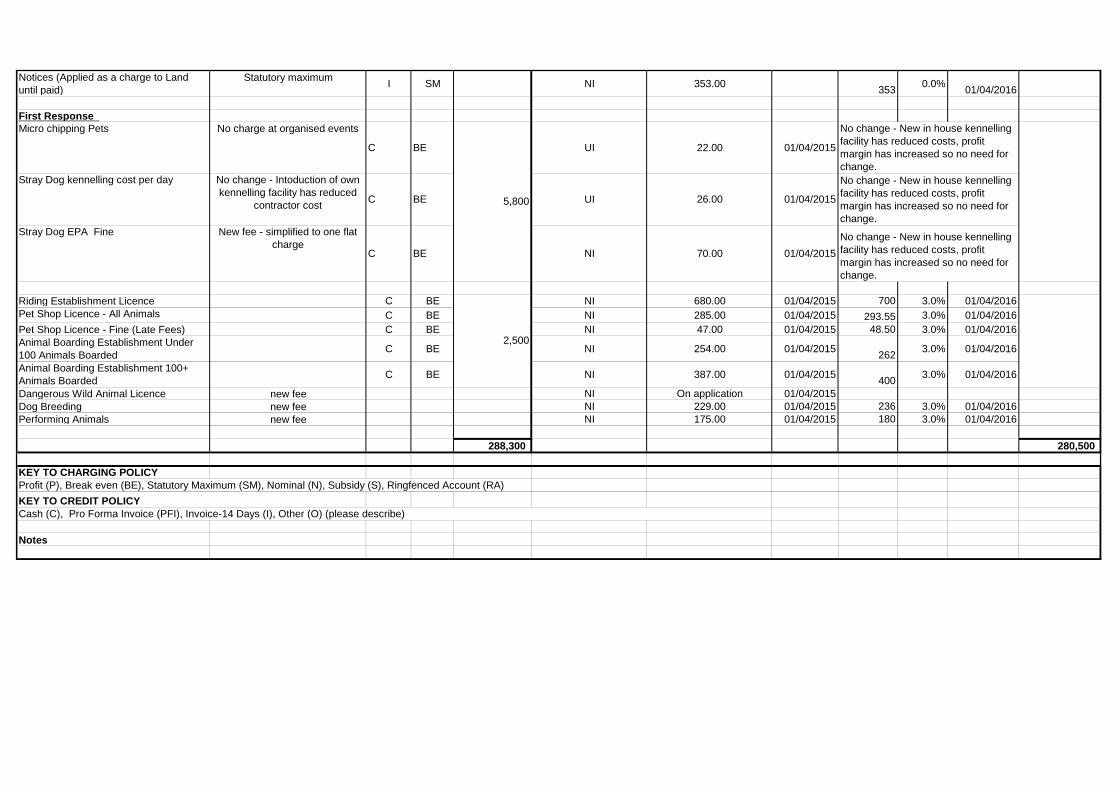
Notices (Applied as a charge to Land until paid)
Statutory maximum I SM NI 353.00 353 0.0% 01/04/2016
First Response Micro chipping Pets No charge at organised events
C BE UI 22.00 01/04/2015
Stray Dog kennelling cost per day No change - Intoduction of own kennelling facility has reduced
contractor cost C BE UI 26.00 01/04/2015
Stray Dog EPA Fine New fee - simplified to one flat charge
C BE NI 70.00 01/04/2015
Riding Establishment Licence C BE NI 680.00 01/04/2015 700 3.0% 01/04/2016Pet Shop Licence - All Animals C BE NI 285.00 01/04/2015 293.55 3.0% 01/04/2016Pet Shop Licence - Fine (Late Fees) C BE NI 47.00 01/04/2015 48.50 3.0% 01/04/2016Animal Boarding Establishment Under 100 Animals Boarded C BE NI 254.00 01/04/2015 262 3.0% 01/04/2016
Animal Boarding Establishment 100+ Animals Boarded C BE NI 387.00 01/04/2015 400 3.0% 01/04/2016
Dangerous Wild Animal Licence new fee NI On application 01/04/2015Dog Breeding new fee NI 229.00 01/04/2015 236 3.0% 01/04/2016Performing Animals new fee NI 175.00 01/04/2015 180 3.0% 01/04/2016
288,300 280,500
KEY TO CHARGING POLICYProfit (P), Break even (BE), Statutory Maximum (SM), Nominal (N), Subsidy (S), Ringfenced Account (RA)
Notes
5,800
2,500
KEY TO CREDIT POLICYCash (C), Pro Forma Invoice (PFI), Invoice-14 Days (I), Other (O) (please describe)
No change - New in house kennelling facility has reduced costs, profit margin has increased so no need for change.No change - New in house kennelling facility has reduced costs, profit margin has increased so no need for change.
No change - New in house kennelling facility has reduced costs, profit margin has increased so no need for change.
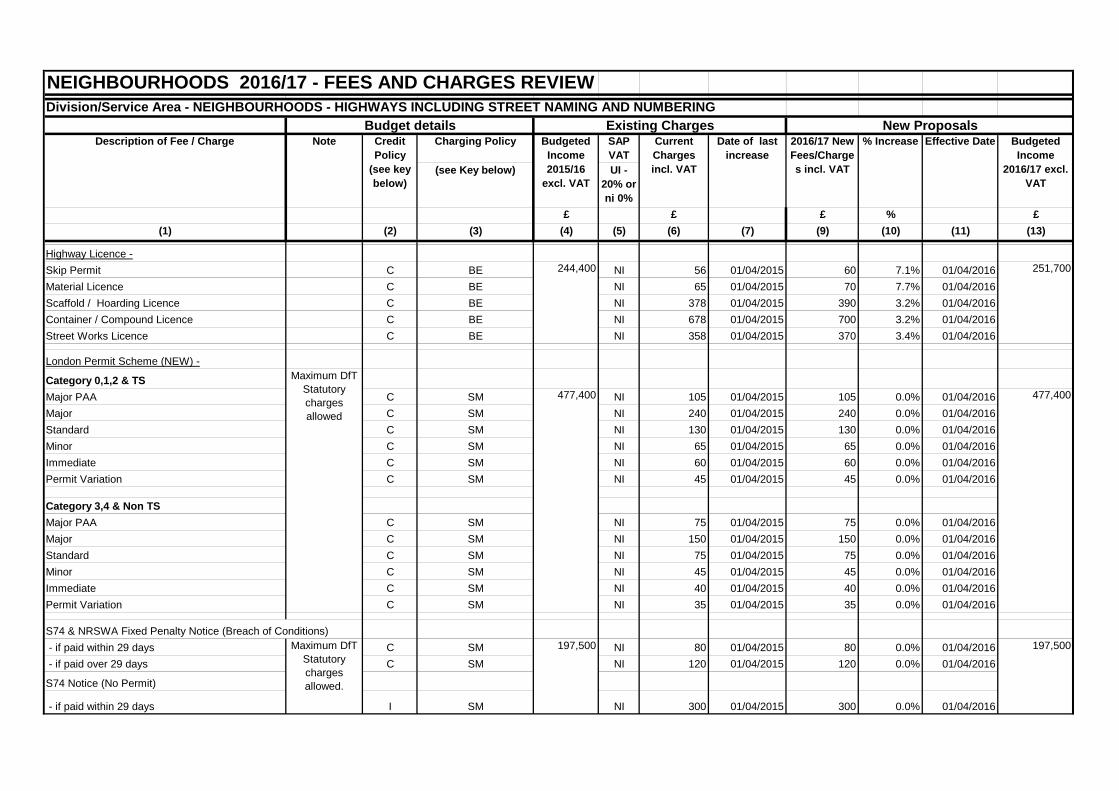
NEIGHBOURHOODS 2016/17 - FEES AND CHARGES REVIEW Division/Service Area - NEIGHBOURHOODS - HIGHWAYS INCLUDING STREET NAMING AND NUMBERING
Charging Policy SAP VAT
(see Key below) UI - 20% or ni 0%
£ £ £ % £(1) (2) (3) (4) (5) (6) (7) (9) (10) (11) (13)
Highway Licence -Skip Permit C BE NI 56 01/04/2015 60 7.1% 01/04/2016Material Licence C BE NI 65 01/04/2015 70 7.7% 01/04/2016Scaffold / Hoarding Licence C BE NI 378 01/04/2015 390 3.2% 01/04/2016Container / Compound Licence C BE NI 678 01/04/2015 700 3.2% 01/04/2016Street Works Licence C BE NI 358 01/04/2015 370 3.4% 01/04/2016
London Permit Scheme (NEW) -
Category 0,1,2 & TSMajor PAA C SM NI 105 01/04/2015 105 0.0% 01/04/2016Major C SM NI 240 01/04/2015 240 0.0% 01/04/2016Standard C SM NI 130 01/04/2015 130 0.0% 01/04/2016Minor C SM NI 65 01/04/2015 65 0.0% 01/04/2016Immediate C SM NI 60 01/04/2015 60 0.0% 01/04/2016Permit Variation C SM NI 45 01/04/2015 45 0.0% 01/04/2016
Category 3,4 & Non TSMajor PAA C SM NI 75 01/04/2015 75 0.0% 01/04/2016Major C SM NI 150 01/04/2015 150 0.0% 01/04/2016Standard C SM NI 75 01/04/2015 75 0.0% 01/04/2016Minor C SM NI 45 01/04/2015 45 0.0% 01/04/2016Immediate C SM NI 40 01/04/2015 40 0.0% 01/04/2016Permit Variation C SM NI 35 01/04/2015 35 0.0% 01/04/2016
S74 & NRSWA Fixed Penalty Notice (Breach of Conditions) - if paid within 29 days C SM NI 80 01/04/2015 80 0.0% 01/04/2016 - if paid over 29 days C SM NI 120 01/04/2015 120 0.0% 01/04/2016
S74 Notice (No Permit)
- if paid within 29 days I SM NI 300 01/04/2015 300 0.0% 01/04/2016
477,400
Maximum DfT Statutory charges allowed.
197,500 197,500
Maximum DfT Statutory charges allowed
477,400
244,400
Credit Policy
(see key below)
Budgeted Income 2015/16
excl. VAT
Current Charges incl. VAT
251,700
Date of last increase
2016/17 New Fees/Charges incl. VAT
% Increase Effective Date Budgeted Income
2016/17 excl. VAT
Budget details Existing Charges New ProposalsDescription of Fee / Charge Note
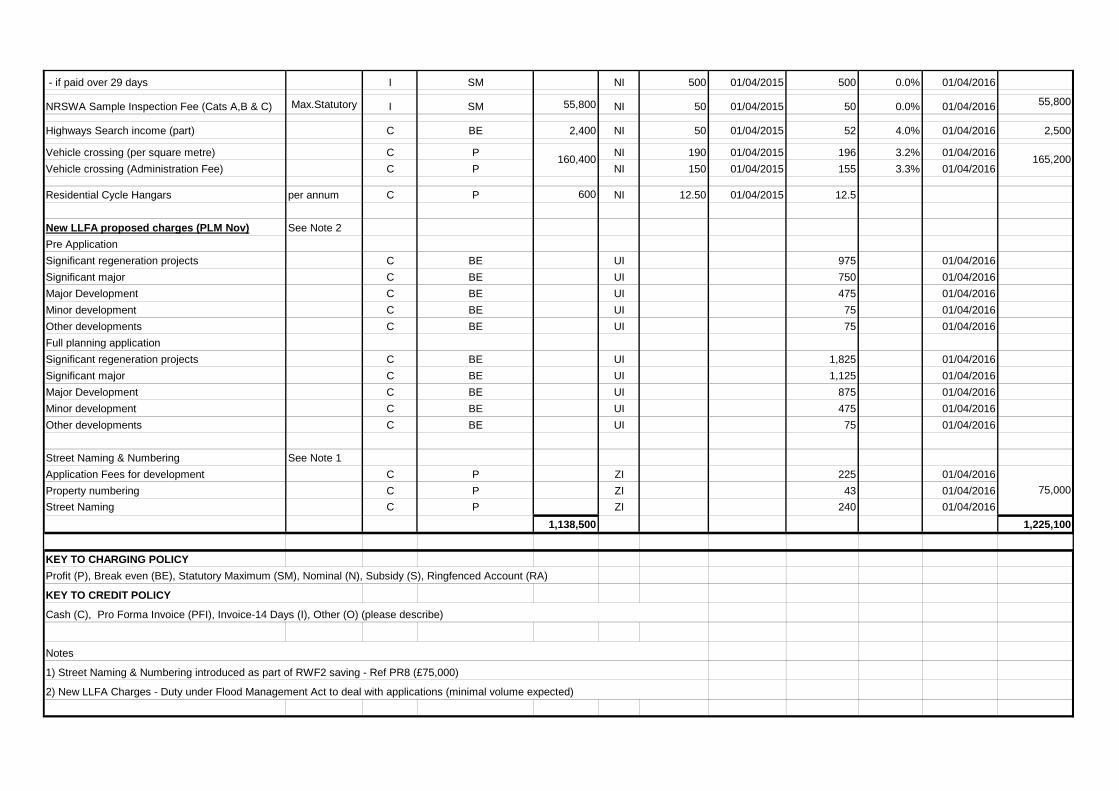
- if paid over 29 days I SM NI 500 01/04/2015 500 0.0% 01/04/2016
NRSWA Sample Inspection Fee (Cats A,B & C) Max.Statutory I SM 55,800 NI 50 01/04/2015 50 0.0% 01/04/2016 55,800
Highways Search income (part) C BE 2,400 NI 50 01/04/2015 52 4.0% 01/04/2016 2,500
Vehicle crossing (per square metre) C P NI 190 01/04/2015 196 3.2% 01/04/2016Vehicle crossing (Administration Fee) C P NI 150 01/04/2015 155 3.3% 01/04/2016
Residential Cycle Hangars per annum C P 600 NI 12.50 01/04/2015 12.5
New LLFA proposed charges (PLM Nov) See Note 2Pre ApplicationSignificant regeneration projects C BE UI 975 01/04/2016Significant major C BE UI 750 01/04/2016Major Development C BE UI 475 01/04/2016Minor development C BE UI 75 01/04/2016Other developments C BE UI 75 01/04/2016Full planning applicationSignificant regeneration projects C BE UI 1,825 01/04/2016Significant major C BE UI 1,125 01/04/2016Major Development C BE UI 875 01/04/2016Minor development C BE UI 475 01/04/2016Other developments C BE UI 75 01/04/2016
Street Naming & Numbering See Note 1Application Fees for development C P ZI 225 01/04/2016Property numbering C P ZI 43 01/04/2016Street Naming C P ZI 240 01/04/2016
1,138,500 1,225,100
KEY TO CHARGING POLICYProfit (P), Break even (BE), Statutory Maximum (SM), Nominal (N), Subsidy (S), Ringfenced Account (RA)
75,000
KEY TO CREDIT POLICY
Cash (C), Pro Forma Invoice (PFI), Invoice-14 Days (I), Other (O) (please describe)
160,400 165,200
Notes
1) Street Naming & Numbering introduced as part of RWF2 saving - Ref PR8 (£75,000)
2) New LLFA Charges - Duty under Flood Management Act to deal with applications (minimal volume expected)
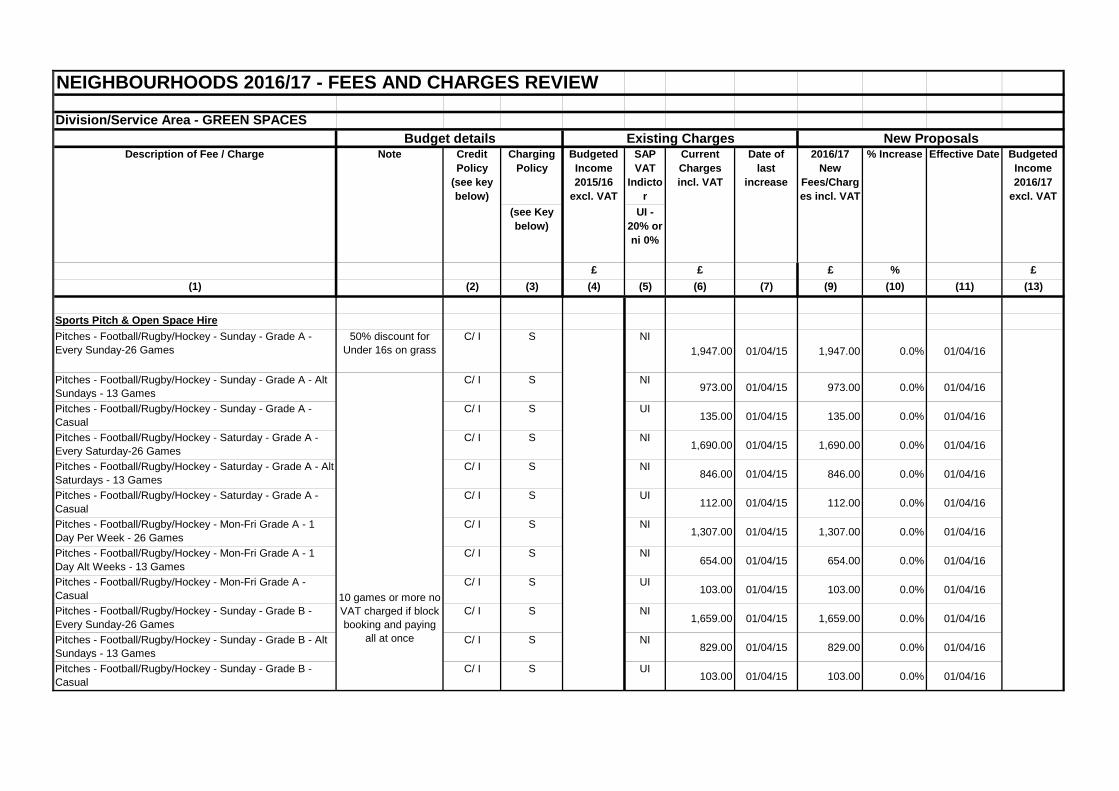
NEIGHBOURHOODS 2016/17 - FEES AND CHARGES REVIEW Division/Service Area - GREEN SPACES
Charging Policy
SAP VAT
Indictor
(see Key below)
UI - 20% or ni 0%
£ £ £ % £(1) (2) (3) (4) (5) (6) (7) (9) (10) (11) (13)
Sports Pitch & Open Space HirePitches - Football/Rugby/Hockey - Sunday - Grade A - Every Sunday-26 Games
50% discount for Under 16s on grass
C/ I S NI1,947.00 01/04/15 1,947.00 0.0% 01/04/16
Pitches - Football/Rugby/Hockey - Sunday - Grade A - Alt Sundays - 13 Games
C/ I S NI973.00 01/04/15 973.00 0.0% 01/04/16
Pitches - Football/Rugby/Hockey - Sunday - Grade A - Casual
C/ I S UI135.00 01/04/15 135.00 0.0% 01/04/16
Pitches - Football/Rugby/Hockey - Saturday - Grade A - Every Saturday-26 Games
C/ I S NI1,690.00 01/04/15 1,690.00 0.0% 01/04/16
Pitches - Football/Rugby/Hockey - Saturday - Grade A - Alt Saturdays - 13 Games
C/ I S NI846.00 01/04/15 846.00 0.0% 01/04/16
Pitches - Football/Rugby/Hockey - Saturday - Grade A - Casual
C/ I S UI112.00 01/04/15 112.00 0.0% 01/04/16
Pitches - Football/Rugby/Hockey - Mon-Fri Grade A - 1 Day Per Week - 26 Games
C/ I S NI1,307.00 01/04/15 1,307.00 0.0% 01/04/16
Pitches - Football/Rugby/Hockey - Mon-Fri Grade A - 1 Day Alt Weeks - 13 Games
C/ I S NI654.00 01/04/15 654.00 0.0% 01/04/16
Pitches - Football/Rugby/Hockey - Mon-Fri Grade A - Casual
C/ I S UI103.00 01/04/15 103.00 0.0% 01/04/16
Pitches - Football/Rugby/Hockey - Sunday - Grade B - Every Sunday-26 Games
C/ I S NI1,659.00 01/04/15 1,659.00 0.0% 01/04/16
Pitches - Football/Rugby/Hockey - Sunday - Grade B - Alt Sundays - 13 Games
C/ I S NI829.00 01/04/15 829.00 0.0% 01/04/16
Pitches - Football/Rugby/Hockey - Sunday - Grade B - Casual
C/ I S UI103.00 01/04/15 103.00 0.0% 01/04/16
Budget details Existing Charges New ProposalsDescription of Fee / Charge Note Credit
Policy (see key below)
Budgeted Income 2015/16
excl. VAT
Current Charges incl. VAT
Date of last
increase
2016/17 New
Fees/Charges incl. VAT
% Increase Effective Date Budgeted Income 2016/17
excl. VAT
10 games or more no VAT charged if block booking and paying
all at once
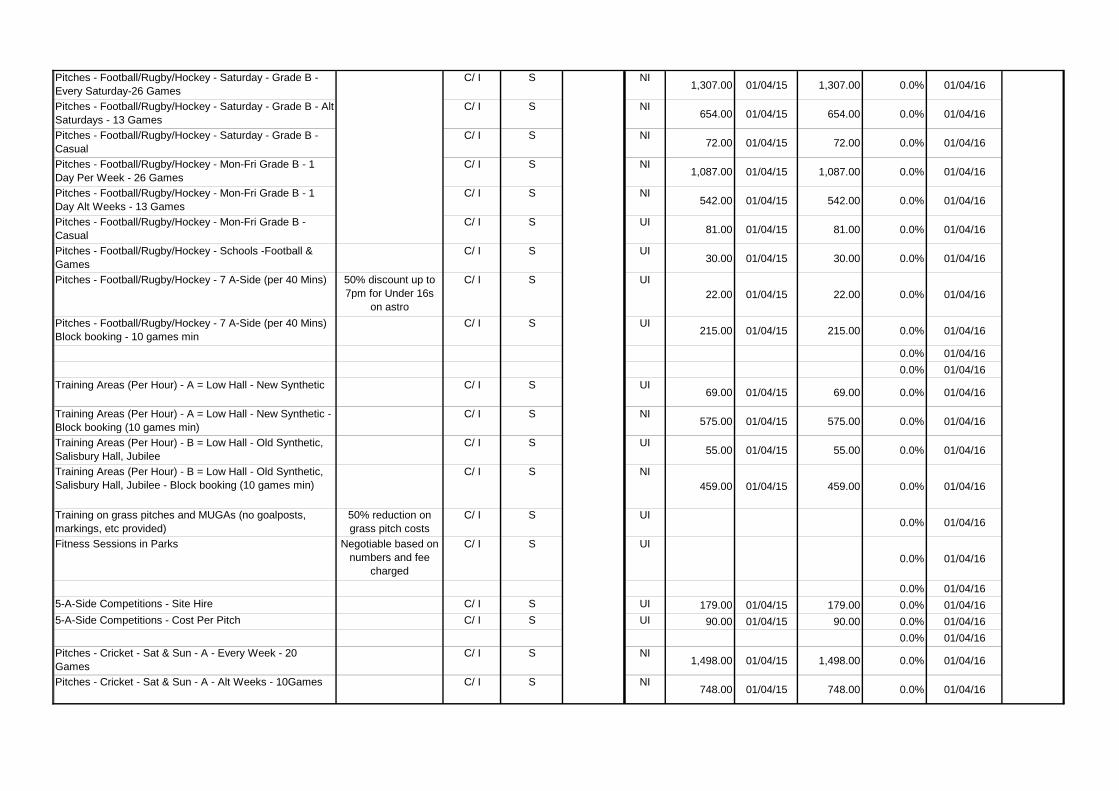
Pitches - Football/Rugby/Hockey - Saturday - Grade B - Every Saturday-26 Games
C/ I S NI1,307.00 01/04/15 1,307.00 0.0% 01/04/16
Pitches - Football/Rugby/Hockey - Saturday - Grade B - Alt Saturdays - 13 Games
C/ I S NI654.00 01/04/15 654.00 0.0% 01/04/16
Pitches - Football/Rugby/Hockey - Saturday - Grade B - Casual
C/ I S NI72.00 01/04/15 72.00 0.0% 01/04/16
Pitches - Football/Rugby/Hockey - Mon-Fri Grade B - 1 Day Per Week - 26 Games
C/ I S NI1,087.00 01/04/15 1,087.00 0.0% 01/04/16
Pitches - Football/Rugby/Hockey - Mon-Fri Grade B - 1 Day Alt Weeks - 13 Games
C/ I S NI542.00 01/04/15 542.00 0.0% 01/04/16
Pitches - Football/Rugby/Hockey - Mon-Fri Grade B - Casual
C/ I S UI81.00 01/04/15 81.00 0.0% 01/04/16
Pitches - Football/Rugby/Hockey - Schools -Football & Games
C/ I S UI30.00 01/04/15 30.00 0.0% 01/04/16
Pitches - Football/Rugby/Hockey - 7 A-Side (per 40 Mins) 50% discount up to 7pm for Under 16s
on astro
C/ I S UI22.00 01/04/15 22.00 0.0% 01/04/16
Pitches - Football/Rugby/Hockey - 7 A-Side (per 40 Mins) Block booking - 10 games min
C/ I S UI215.00 01/04/15 215.00 0.0% 01/04/16
0.0% 01/04/160.0% 01/04/16
Training Areas (Per Hour) - A = Low Hall - New Synthetic C/ I S UI69.00 01/04/15 69.00 0.0% 01/04/16
Training Areas (Per Hour) - A = Low Hall - New Synthetic - Block booking (10 games min)
C/ I S NI575.00 01/04/15 575.00 0.0% 01/04/16
Training Areas (Per Hour) - B = Low Hall - Old Synthetic, Salisbury Hall, Jubilee
C/ I S UI55.00 01/04/15 55.00 0.0% 01/04/16
Training Areas (Per Hour) - B = Low Hall - Old Synthetic, Salisbury Hall, Jubilee - Block booking (10 games min)
C/ I S NI459.00 01/04/15 459.00 0.0% 01/04/16
Training on grass pitches and MUGAs (no goalposts, markings, etc provided)
50% reduction on grass pitch costs
C/ I S UI0.0% 01/04/16
Fitness Sessions in Parks Negotiable based on numbers and fee
charged
C/ I S UI0.0% 01/04/16
0.0% 01/04/165-A-Side Competitions - Site Hire C/ I S UI 179.00 01/04/15 179.00 0.0% 01/04/165-A-Side Competitions - Cost Per Pitch C/ I S UI 90.00 01/04/15 90.00 0.0% 01/04/16
0.0% 01/04/16Pitches - Cricket - Sat & Sun - A - Every Week - 20 Games
C/ I S NI1,498.00 01/04/15 1,498.00 0.0% 01/04/16
Pitches - Cricket - Sat & Sun - A - Alt Weeks - 10Games C/ I S NI748.00 01/04/15 748.00 0.0% 01/04/16
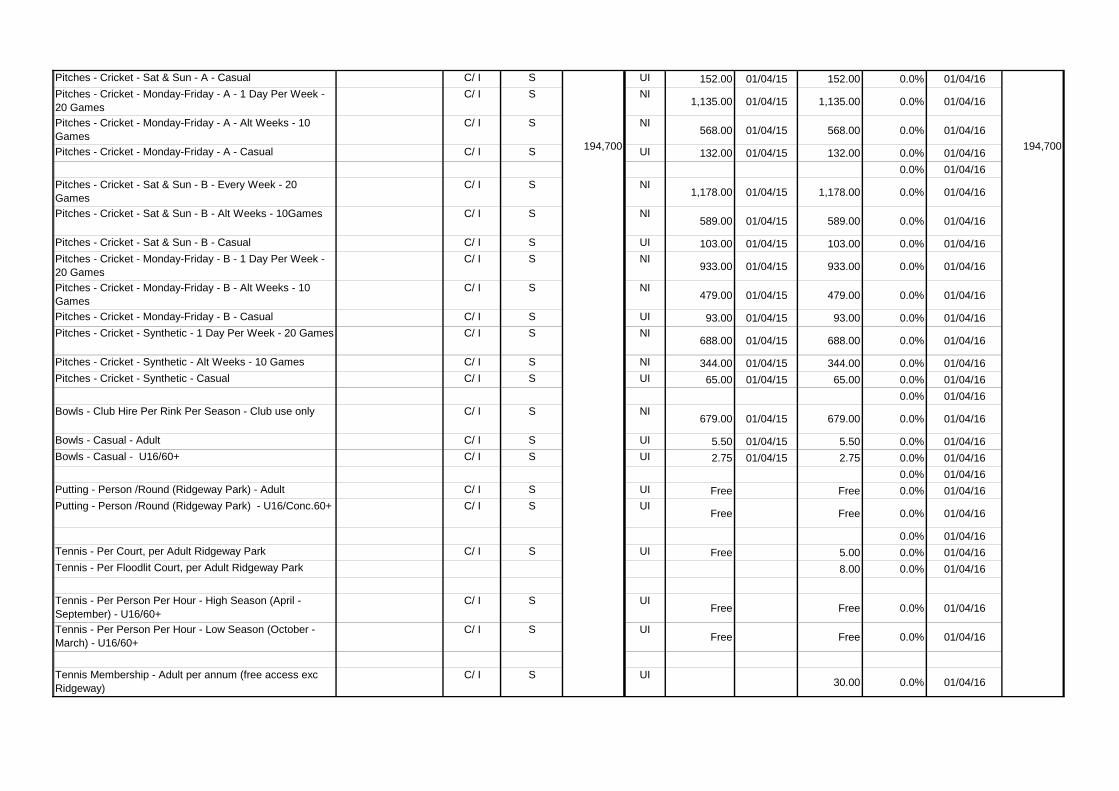
Pitches - Cricket - Sat & Sun - A - Casual C/ I S UI 152.00 01/04/15 152.00 0.0% 01/04/16Pitches - Cricket - Monday-Friday - A - 1 Day Per Week - 20 Games
C/ I S NI1,135.00 01/04/15 1,135.00 0.0% 01/04/16
Pitches - Cricket - Monday-Friday - A - Alt Weeks - 10 Games
C/ I S NI568.00 01/04/15 568.00 0.0% 01/04/16
Pitches - Cricket - Monday-Friday - A - Casual C/ I S UI 132.00 01/04/15 132.00 0.0% 01/04/160.0% 01/04/16
Pitches - Cricket - Sat & Sun - B - Every Week - 20 Games
C/ I S NI1,178.00 01/04/15 1,178.00 0.0% 01/04/16
Pitches - Cricket - Sat & Sun - B - Alt Weeks - 10Games C/ I S NI589.00 01/04/15 589.00 0.0% 01/04/16
Pitches - Cricket - Sat & Sun - B - Casual C/ I S UI 103.00 01/04/15 103.00 0.0% 01/04/16Pitches - Cricket - Monday-Friday - B - 1 Day Per Week - 20 Games
C/ I S NI933.00 01/04/15 933.00 0.0% 01/04/16
Pitches - Cricket - Monday-Friday - B - Alt Weeks - 10 Games
C/ I S NI479.00 01/04/15 479.00 0.0% 01/04/16
Pitches - Cricket - Monday-Friday - B - Casual C/ I S UI 93.00 01/04/15 93.00 0.0% 01/04/16Pitches - Cricket - Synthetic - 1 Day Per Week - 20 Games C/ I S NI
688.00 01/04/15 688.00 0.0% 01/04/16
Pitches - Cricket - Synthetic - Alt Weeks - 10 Games C/ I S NI 344.00 01/04/15 344.00 0.0% 01/04/16Pitches - Cricket - Synthetic - Casual C/ I S UI 65.00 01/04/15 65.00 0.0% 01/04/16
0.0% 01/04/16Bowls - Club Hire Per Rink Per Season - Club use only C/ I S NI
679.00 01/04/15 679.00 0.0% 01/04/16
Bowls - Casual - Adult C/ I S UI 5.50 01/04/15 5.50 0.0% 01/04/16Bowls - Casual - U16/60+ C/ I S UI 2.75 01/04/15 2.75 0.0% 01/04/16
0.0% 01/04/16Putting - Person /Round (Ridgeway Park) - Adult C/ I S UI Free Free 0.0% 01/04/16Putting - Person /Round (Ridgeway Park) - U16/Conc.60+ C/ I S UI
Free Free 0.0% 01/04/16
0.0% 01/04/16Tennis - Per Court, per Adult Ridgeway Park C/ I S UI Free 5.00 0.0% 01/04/16Tennis - Per Floodlit Court, per Adult Ridgeway Park 8.00 0.0% 01/04/16
Tennis - Per Person Per Hour - High Season (April - September) - U16/60+
C/ I S UIFree Free 0.0% 01/04/16
Tennis - Per Person Per Hour - Low Season (October - March) - U16/60+
C/ I S UIFree Free 0.0% 01/04/16
Tennis Membership - Adult per annum (free access exc Ridgeway)
C/ I S UI30.00 0.0% 01/04/16
194,700 194,700
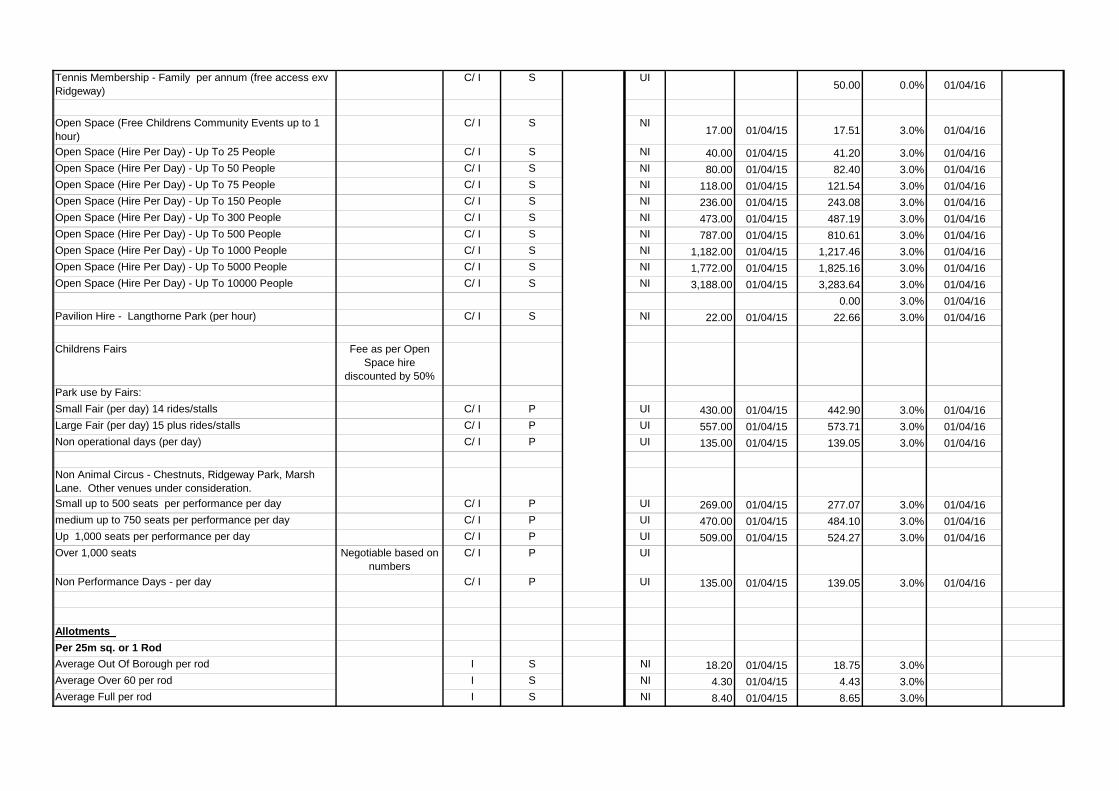
Tennis Membership - Family per annum (free access exv Ridgeway)
C/ I S UI50.00 0.0% 01/04/16
Open Space (Free Childrens Community Events up to 1 hour)
C/ I S NI17.00 01/04/15 17.51 3.0% 01/04/16
Open Space (Hire Per Day) - Up To 25 People C/ I S NI 40.00 01/04/15 41.20 3.0% 01/04/16Open Space (Hire Per Day) - Up To 50 People C/ I S NI 80.00 01/04/15 82.40 3.0% 01/04/16Open Space (Hire Per Day) - Up To 75 People C/ I S NI 118.00 01/04/15 121.54 3.0% 01/04/16Open Space (Hire Per Day) - Up To 150 People C/ I S NI 236.00 01/04/15 243.08 3.0% 01/04/16Open Space (Hire Per Day) - Up To 300 People C/ I S NI 473.00 01/04/15 487.19 3.0% 01/04/16Open Space (Hire Per Day) - Up To 500 People C/ I S NI 787.00 01/04/15 810.61 3.0% 01/04/16Open Space (Hire Per Day) - Up To 1000 People C/ I S NI 1,182.00 01/04/15 1,217.46 3.0% 01/04/16Open Space (Hire Per Day) - Up To 5000 People C/ I S NI 1,772.00 01/04/15 1,825.16 3.0% 01/04/16Open Space (Hire Per Day) - Up To 10000 People C/ I S NI 3,188.00 01/04/15 3,283.64 3.0% 01/04/16
0.00 3.0% 01/04/16Pavilion Hire - Langthorne Park (per hour) C/ I S NI 22.00 01/04/15 22.66 3.0% 01/04/16
Childrens Fairs Fee as per Open Space hire
discounted by 50%Park use by Fairs:Small Fair (per day) 14 rides/stalls C/ I P UI 430.00 01/04/15 442.90 3.0% 01/04/16Large Fair (per day) 15 plus rides/stalls C/ I P UI 557.00 01/04/15 573.71 3.0% 01/04/16Non operational days (per day) C/ I P UI 135.00 01/04/15 139.05 3.0% 01/04/16
Non Animal Circus - Chestnuts, Ridgeway Park, Marsh Lane. Other venues under consideration.Small up to 500 seats per performance per day C/ I P UI 269.00 01/04/15 277.07 3.0% 01/04/16medium up to 750 seats per performance per day C/ I P UI 470.00 01/04/15 484.10 3.0% 01/04/16Up 1,000 seats per performance per day C/ I P UI 509.00 01/04/15 524.27 3.0% 01/04/16Over 1,000 seats Negotiable based on
numbers C/ I P UI
Non Performance Days - per day C/ I P UI 135.00 01/04/15 139.05 3.0% 01/04/16
Allotments Per 25m sq. or 1 RodAverage Out Of Borough per rod I S NI 18.20 01/04/15 18.75 3.0%Average Over 60 per rod I S NI 4.30 01/04/15 4.43 3.0%Average Full per rod I S NI 8.40 01/04/15 8.65 3.0%
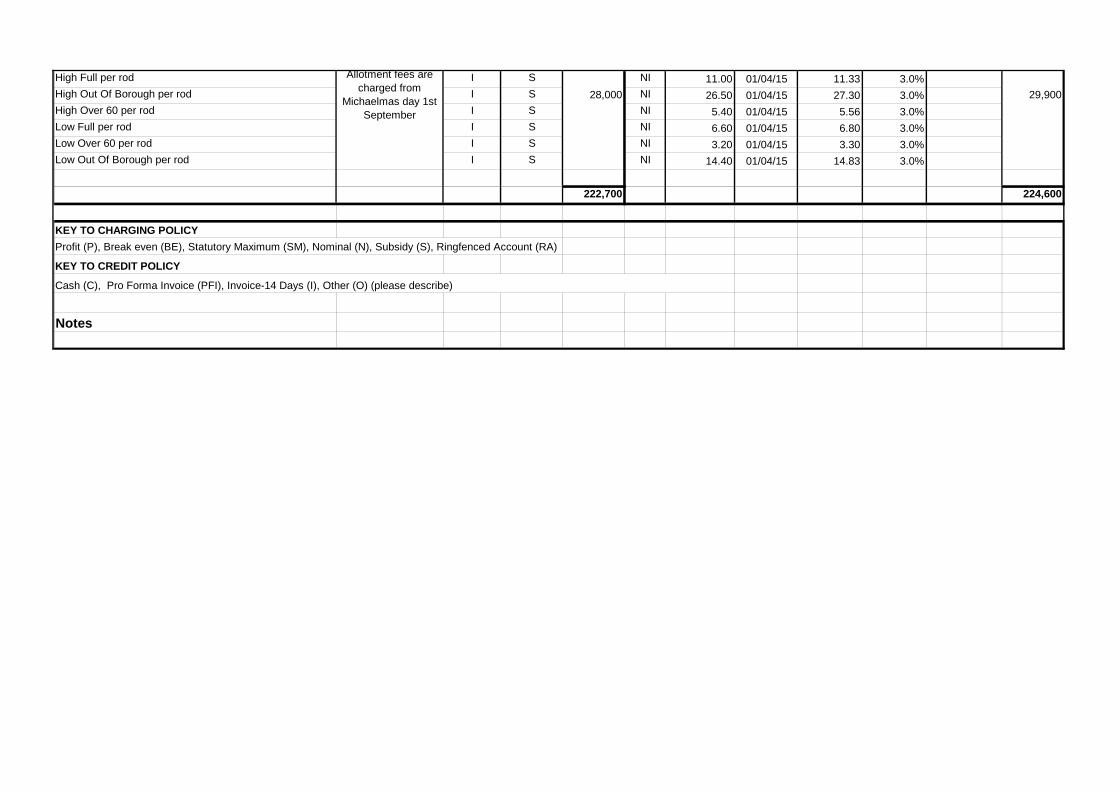
High Full per rod I S NI 11.00 01/04/15 11.33 3.0%High Out Of Borough per rod I S NI 26.50 01/04/15 27.30 3.0%High Over 60 per rod I S NI 5.40 01/04/15 5.56 3.0%Low Full per rod I S NI 6.60 01/04/15 6.80 3.0%Low Over 60 per rod I S NI 3.20 01/04/15 3.30 3.0%Low Out Of Borough per rod I S NI 14.40 01/04/15 14.83 3.0%
222,700 224,600
KEY TO CHARGING POLICYProfit (P), Break even (BE), Statutory Maximum (SM), Nominal (N), Subsidy (S), Ringfenced Account (RA)
Notes
KEY TO CREDIT POLICY
Cash (C), Pro Forma Invoice (PFI), Invoice-14 Days (I), Other (O) (please describe)
Allotment fees are charged from
Michaelmas day 1st September
28,000 29,900
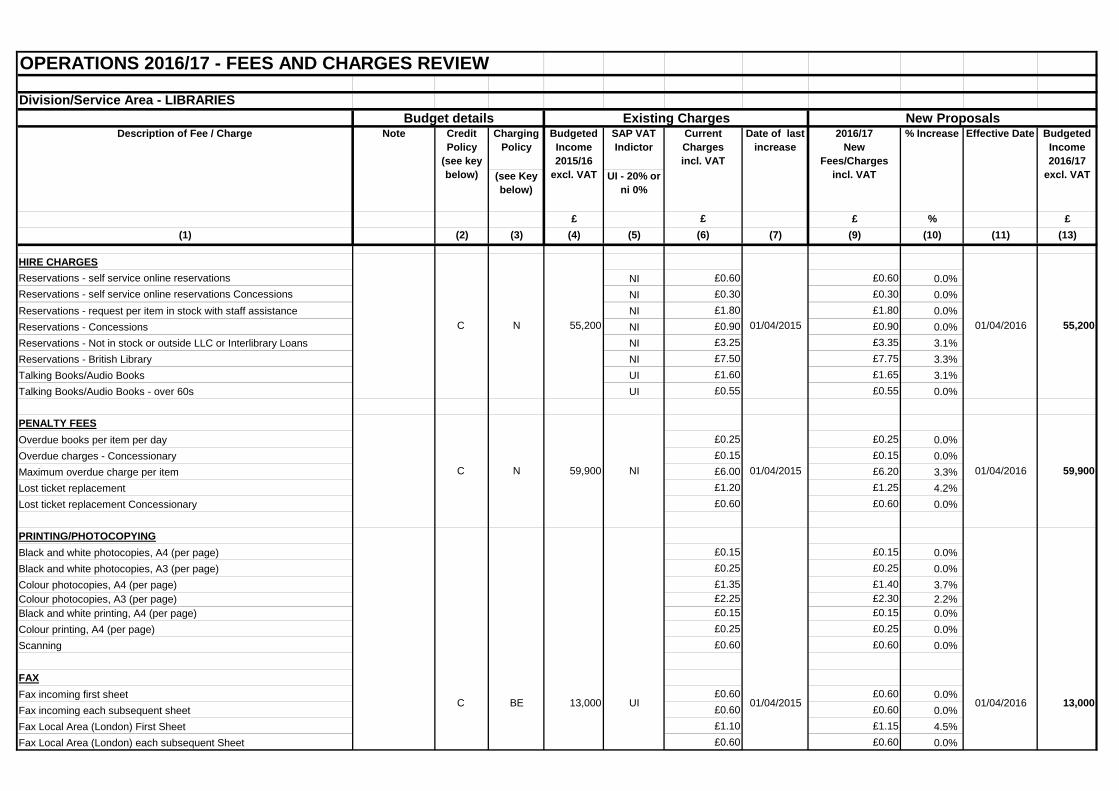
OPERATIONS 2016/17 - FEES AND CHARGES REVIEW Division/Service Area - LIBRARIES
Charging Policy
SAP VAT Indictor
(see Key below)
UI - 20% or ni 0%
£ £ £ % £(1) (2) (3) (4) (5) (6) (7) (9) (10) (11) (13)
HIRE CHARGESReservations - self service online reservations NI £0.60 £0.60 0.0%Reservations - self service online reservations Concessions NI £0.30 £0.30 0.0%Reservations - request per item in stock with staff assistance NI £1.80 £1.80 0.0%Reservations - Concessions NI £0.90 £0.90 0.0%Reservations - Not in stock or outside LLC or Interlibrary Loans NI £3.25 £3.35 3.1%Reservations - British Library NI £7.50 £7.75 3.3%Talking Books/Audio Books UI £1.60 £1.65 3.1%Talking Books/Audio Books - over 60s UI £0.55 £0.55 0.0%
PENALTY FEESOverdue books per item per day £0.25 £0.25 0.0%Overdue charges - Concessionary £0.15 £0.15 0.0%Maximum overdue charge per item £6.00 £6.20 3.3%Lost ticket replacement £1.20 £1.25 4.2%Lost ticket replacement Concessionary £0.60 £0.60 0.0%
PRINTING/PHOTOCOPYINGBlack and white photocopies, A4 (per page) £0.15 £0.15 0.0%Black and white photocopies, A3 (per page) £0.25 £0.25 0.0%Colour photocopies, A4 (per page) £1.35 £1.40 3.7%Colour photocopies, A3 (per page) £2.25 £2.30 2.2%Black and white printing, A4 (per page) £0.15 £0.15 0.0%Colour printing, A4 (per page) £0.25 £0.25 0.0%Scanning £0.60 £0.60 0.0%
FAXFax incoming first sheet £0.60 £0.60 0.0%Fax incoming each subsequent sheet £0.60 £0.60 0.0%Fax Local Area (London) First Sheet £1.10 £1.15 4.5%Fax Local Area (London) each subsequent Sheet £0.60 £0.60 0.0%
01/04/2015 01/04/2016 13,000
01/04/2015 01/04/2016 59,900
C BE 13,000 UI
01/04/2015 01/04/2016 55,200
C N 59,900 NI
C N 55,200
Date of last increase
2016/17 New
Fees/Charges incl. VAT
% Increase Effective Date Budgeted Income 2016/17
excl. VAT
Budget details Existing Charges New ProposalsDescription of Fee / Charge Note Credit
Policy (see key below)
Budgeted Income 2015/16
excl. VAT
Current Charges incl. VAT
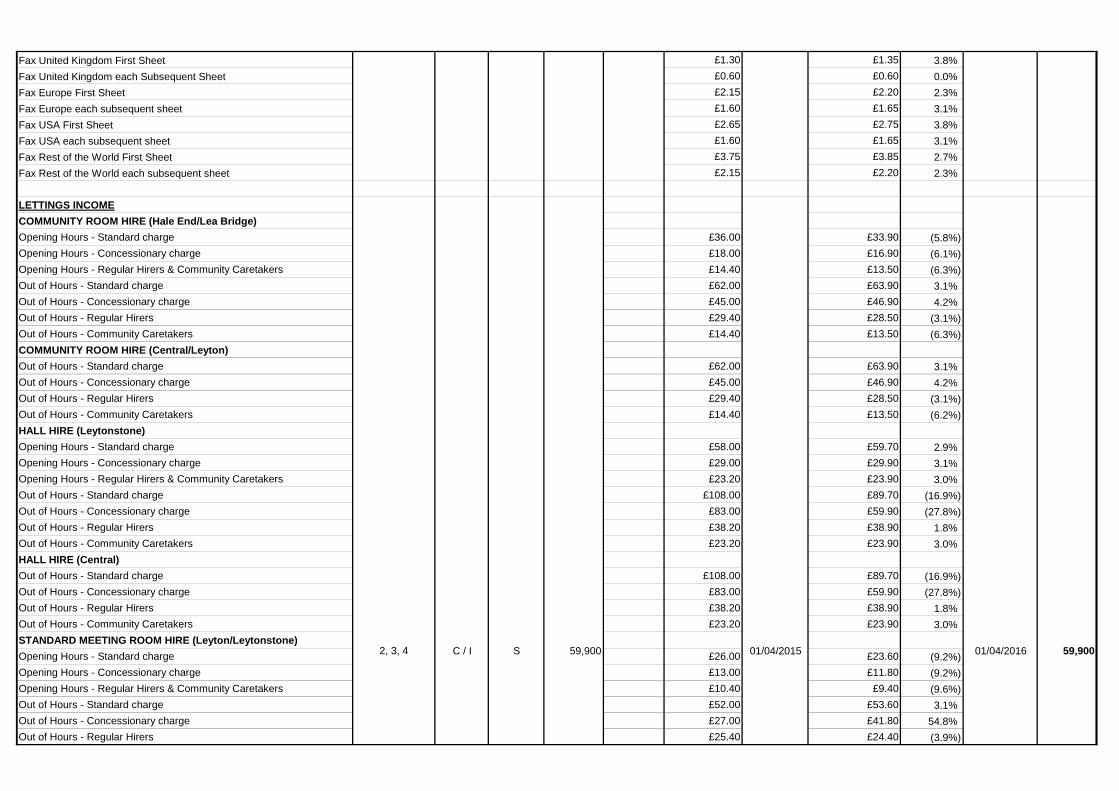
Fax United Kingdom First Sheet £1.30 £1.35 3.8%Fax United Kingdom each Subsequent Sheet £0.60 £0.60 0.0%Fax Europe First Sheet £2.15 £2.20 2.3%Fax Europe each subsequent sheet £1.60 £1.65 3.1%Fax USA First Sheet £2.65 £2.75 3.8%Fax USA each subsequent sheet £1.60 £1.65 3.1%Fax Rest of the World First Sheet £3.75 £3.85 2.7%Fax Rest of the World each subsequent sheet £2.15 £2.20 2.3%
LETTINGS INCOMECOMMUNITY ROOM HIRE (Hale End/Lea Bridge)Opening Hours - Standard charge £36.00 £33.90 (5.8%)Opening Hours - Concessionary charge £18.00 £16.90 (6.1%)Opening Hours - Regular Hirers & Community Caretakers £14.40 £13.50 (6.3%)Out of Hours - Standard charge £62.00 £63.90 3.1%Out of Hours - Concessionary charge £45.00 £46.90 4.2%Out of Hours - Regular Hirers £29.40 £28.50 (3.1%)Out of Hours - Community Caretakers £14.40 £13.50 (6.3%)COMMUNITY ROOM HIRE (Central/Leyton)Out of Hours - Standard charge £62.00 £63.90 3.1%Out of Hours - Concessionary charge £45.00 £46.90 4.2%Out of Hours - Regular Hirers £29.40 £28.50 (3.1%)Out of Hours - Community Caretakers £14.40 £13.50 (6.2%)HALL HIRE (Leytonstone)Opening Hours - Standard charge £58.00 £59.70 2.9%Opening Hours - Concessionary charge £29.00 £29.90 3.1%Opening Hours - Regular Hirers & Community Caretakers £23.20 £23.90 3.0%Out of Hours - Standard charge £108.00 £89.70 (16.9%)Out of Hours - Concessionary charge £83.00 £59.90 (27.8%)Out of Hours - Regular Hirers £38.20 £38.90 1.8%Out of Hours - Community Caretakers £23.20 £23.90 3.0%HALL HIRE (Central)Out of Hours - Standard charge £108.00 £89.70 (16.9%)Out of Hours - Concessionary charge £83.00 £59.90 (27.8%)Out of Hours - Regular Hirers £38.20 £38.90 1.8%Out of Hours - Community Caretakers £23.20 £23.90 3.0%STANDARD MEETING ROOM HIRE (Leyton/Leytonstone)Opening Hours - Standard charge £26.00 £23.60 (9.2%)Opening Hours - Concessionary charge £13.00 £11.80 (9.2%)Opening Hours - Regular Hirers & Community Caretakers £10.40 £9.40 (9.6%)Out of Hours - Standard charge £52.00 £53.60 3.1%Out of Hours - Concessionary charge £27.00 £41.80 54.8%Out of Hours - Regular Hirers £25.40 £24.40 (3.9%)
01/04/2016 59,9002, 3, 4 C / I S 59,900 01/04/2015
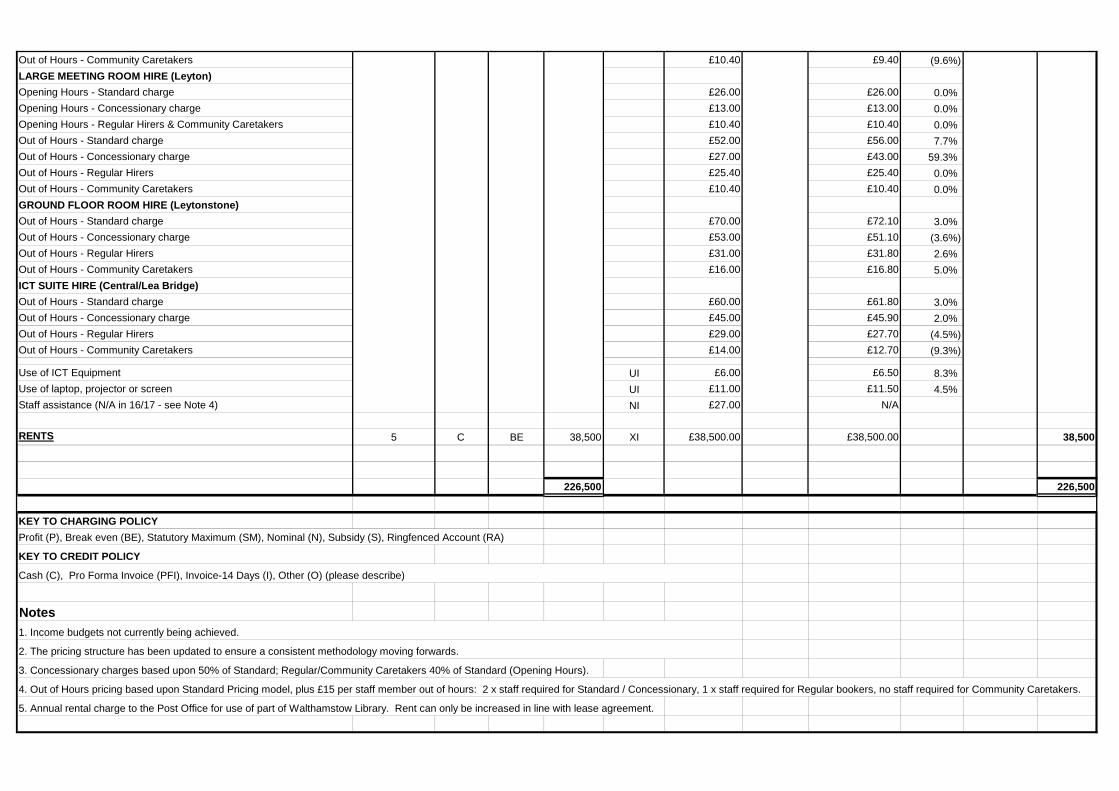
Out of Hours - Community Caretakers £10.40 £9.40 (9.6%)LARGE MEETING ROOM HIRE (Leyton)Opening Hours - Standard charge £26.00 £26.00 0.0%Opening Hours - Concessionary charge £13.00 £13.00 0.0%Opening Hours - Regular Hirers & Community Caretakers £10.40 £10.40 0.0%Out of Hours - Standard charge £52.00 £56.00 7.7%Out of Hours - Concessionary charge £27.00 £43.00 59.3%Out of Hours - Regular Hirers £25.40 £25.40 0.0%Out of Hours - Community Caretakers £10.40 £10.40 0.0%GROUND FLOOR ROOM HIRE (Leytonstone)Out of Hours - Standard charge £70.00 £72.10 3.0%Out of Hours - Concessionary charge £53.00 £51.10 (3.6%)Out of Hours - Regular Hirers £31.00 £31.80 2.6%Out of Hours - Community Caretakers £16.00 £16.80 5.0%ICT SUITE HIRE (Central/Lea Bridge)Out of Hours - Standard charge £60.00 £61.80 3.0%Out of Hours - Concessionary charge £45.00 £45.90 2.0%Out of Hours - Regular Hirers £29.00 £27.70 (4.5%)Out of Hours - Community Caretakers £14.00 £12.70 (9.3%)
Use of ICT Equipment UI £6.00 £6.50 8.3%Use of laptop, projector or screen UI £11.00 £11.50 4.5%Staff assistance (N/A in 16/17 - see Note 4) NI £27.00 N/A
RENTS 5 C BE 38,500 XI £38,500.00 £38,500.00 38,500
226,500 226,500
KEY TO CHARGING POLICYProfit (P), Break even (BE), Statutory Maximum (SM), Nominal (N), Subsidy (S), Ringfenced Account (RA)
Notes
3. Concessionary charges based upon 50% of Standard; Regular/Community Caretakers 40% of Standard (Opening Hours).
4. Out of Hours pricing based upon Standard Pricing model, plus £15 per staff member out of hours: 2 x staff required for Standard / Concessionary, 1 x staff required for Regular bookers, no staff required for Community Caretakers.
5. Annual rental charge to the Post Office for use of part of Walthamstow Library. Rent can only be increased in line with lease agreement.
KEY TO CREDIT POLICY
Cash (C), Pro Forma Invoice (PFI), Invoice-14 Days (I), Other (O) (please describe)
1. Income budgets not currently being achieved.
2. The pricing structure has been updated to ensure a consistent methodology moving forwards.
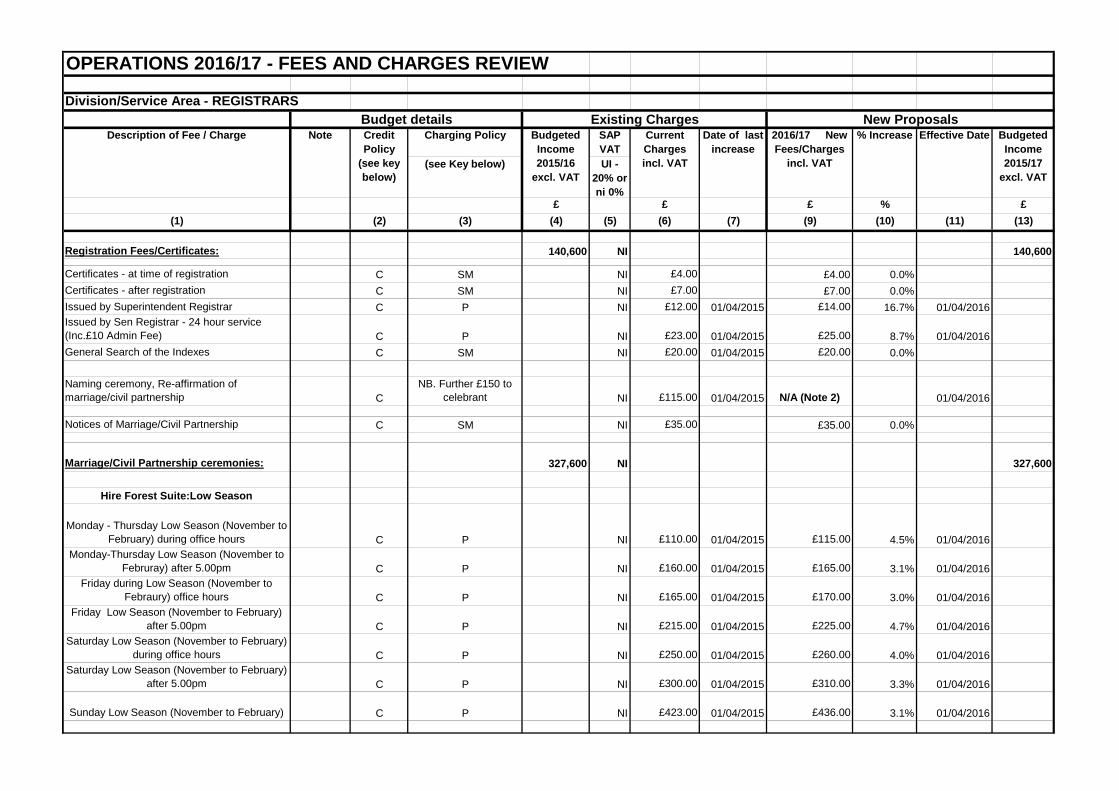
OPERATIONS 2016/17 - FEES AND CHARGES REVIEW Division/Service Area - REGISTRARS
Charging Policy SAP VAT
(see Key below) UI - 20% or ni 0%
£ £ £ % £(1) (2) (3) (4) (5) (6) (7) (9) (10) (11) (13)
Registration Fees/Certificates: 140,600 NI 140,600
Certificates - at time of registration C SM NI £4.00 £4.00 0.0%Certificates - after registration C SM NI £7.00 £7.00 0.0%Issued by Superintendent Registrar C P NI £12.00 01/04/2015 £14.00 16.7% 01/04/2016Issued by Sen Registrar - 24 hour service (Inc.£10 Admin Fee) C P NI £23.00 01/04/2015 £25.00 8.7% 01/04/2016General Search of the Indexes C SM NI £20.00 01/04/2015 £20.00 0.0%
Naming ceremony, Re-affirmation of marriage/civil partnership C
NB. Further £150 to celebrant NI £115.00 01/04/2015 N/A (Note 2) 01/04/2016
Notices of Marriage/Civil Partnership C SM NI £35.00 £35.00 0.0%
Marriage/Civil Partnership ceremonies: 327,600 NI 327,600
Hire Forest Suite:Low Season
Monday - Thursday Low Season (November to February) during office hours C P NI £110.00 01/04/2015 £115.00 4.5% 01/04/2016
Monday-Thursday Low Season (November to Februray) after 5.00pm C P NI £160.00 01/04/2015 £165.00 3.1% 01/04/2016
Friday during Low Season (November to Febraury) office hours C P NI £165.00 01/04/2015 £170.00 3.0% 01/04/2016
Friday Low Season (November to February) after 5.00pm C P NI £215.00 01/04/2015 £225.00 4.7% 01/04/2016
Saturday Low Season (November to February) during office hours C P NI £250.00 01/04/2015 £260.00 4.0% 01/04/2016
Saturday Low Season (November to February) after 5.00pm C P NI £300.00 01/04/2015 £310.00 3.3% 01/04/2016
Sunday Low Season (November to February) C P NI £423.00 01/04/2015 £436.00 3.1% 01/04/2016
Date of last increase
2016/17 New Fees/Charges
incl. VAT
% Increase Effective Date Budgeted Income 2015/17
excl. VAT
Budget details Existing Charges New ProposalsDescription of Fee / Charge Note Credit
Policy (see key below)
Budgeted Income 2015/16
excl. VAT
Current Charges incl. VAT
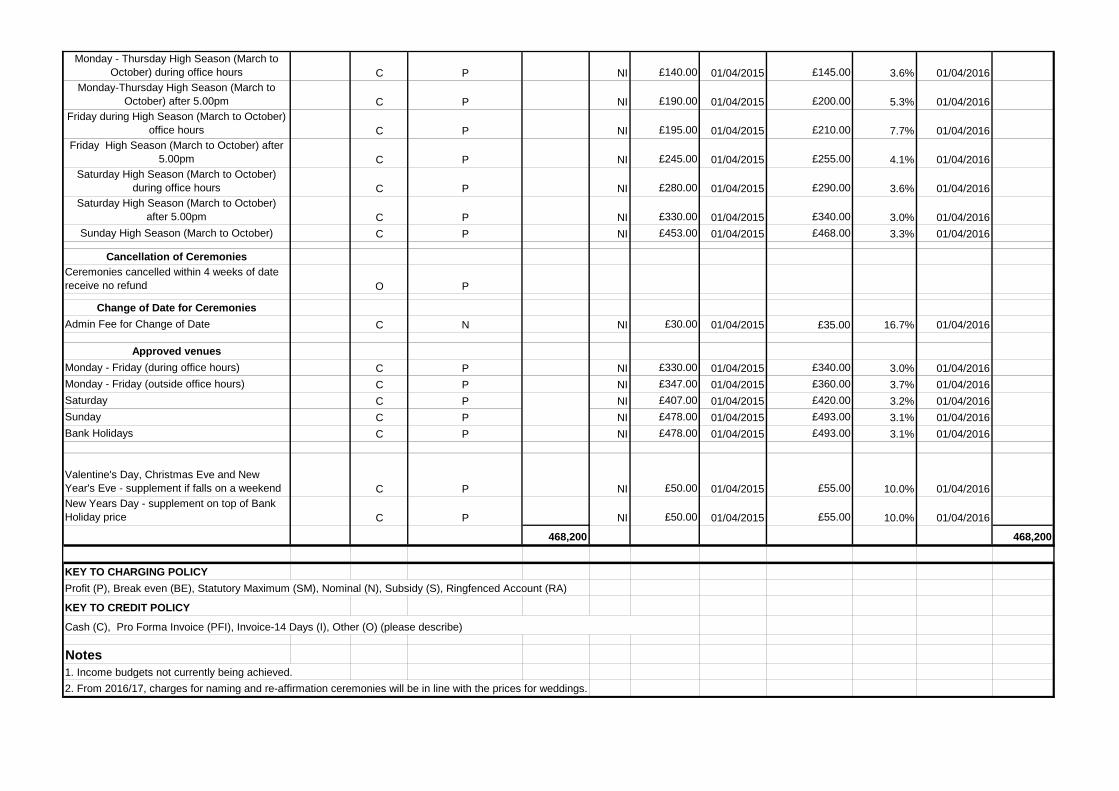
Monday - Thursday High Season (March to October) during office hours C P NI £140.00 01/04/2015 £145.00 3.6% 01/04/2016
Monday-Thursday High Season (March to October) after 5.00pm C P NI £190.00 01/04/2015 £200.00 5.3% 01/04/2016
Friday during High Season (March to October) office hours C P NI £195.00 01/04/2015 £210.00 7.7% 01/04/2016
Friday High Season (March to October) after 5.00pm C P NI £245.00 01/04/2015 £255.00 4.1% 01/04/2016
Saturday High Season (March to October) during office hours C P NI £280.00 01/04/2015 £290.00 3.6% 01/04/2016
Saturday High Season (March to October) after 5.00pm C P NI £330.00 01/04/2015 £340.00 3.0% 01/04/2016
Sunday High Season (March to October) C P NI £453.00 01/04/2015 £468.00 3.3% 01/04/2016
Cancellation of CeremoniesCeremonies cancelled within 4 weeks of date receive no refund O P
Change of Date for CeremoniesAdmin Fee for Change of Date C N NI £30.00 01/04/2015 £35.00 16.7% 01/04/2016
Approved venuesMonday - Friday (during office hours) C P NI £330.00 01/04/2015 £340.00 3.0% 01/04/2016Monday - Friday (outside office hours) C P NI £347.00 01/04/2015 £360.00 3.7% 01/04/2016Saturday C P NI £407.00 01/04/2015 £420.00 3.2% 01/04/2016Sunday C P NI £478.00 01/04/2015 £493.00 3.1% 01/04/2016Bank Holidays C P NI £478.00 01/04/2015 £493.00 3.1% 01/04/2016
Valentine's Day, Christmas Eve and New Year's Eve - supplement if falls on a weekend C P NI £50.00 01/04/2015 £55.00 10.0% 01/04/2016New Years Day - supplement on top of Bank Holiday price C P NI £50.00 01/04/2015 £55.00 10.0% 01/04/2016
468,200 468,200
KEY TO CHARGING POLICYProfit (P), Break even (BE), Statutory Maximum (SM), Nominal (N), Subsidy (S), Ringfenced Account (RA)
Notes1. Income budgets not currently being achieved.2. From 2016/17, charges for naming and re-affirmation ceremonies will be in line with the prices for weddings.
Cash (C), Pro Forma Invoice (PFI), Invoice-14 Days (I), Other (O) (please describe)
KEY TO CREDIT POLICY
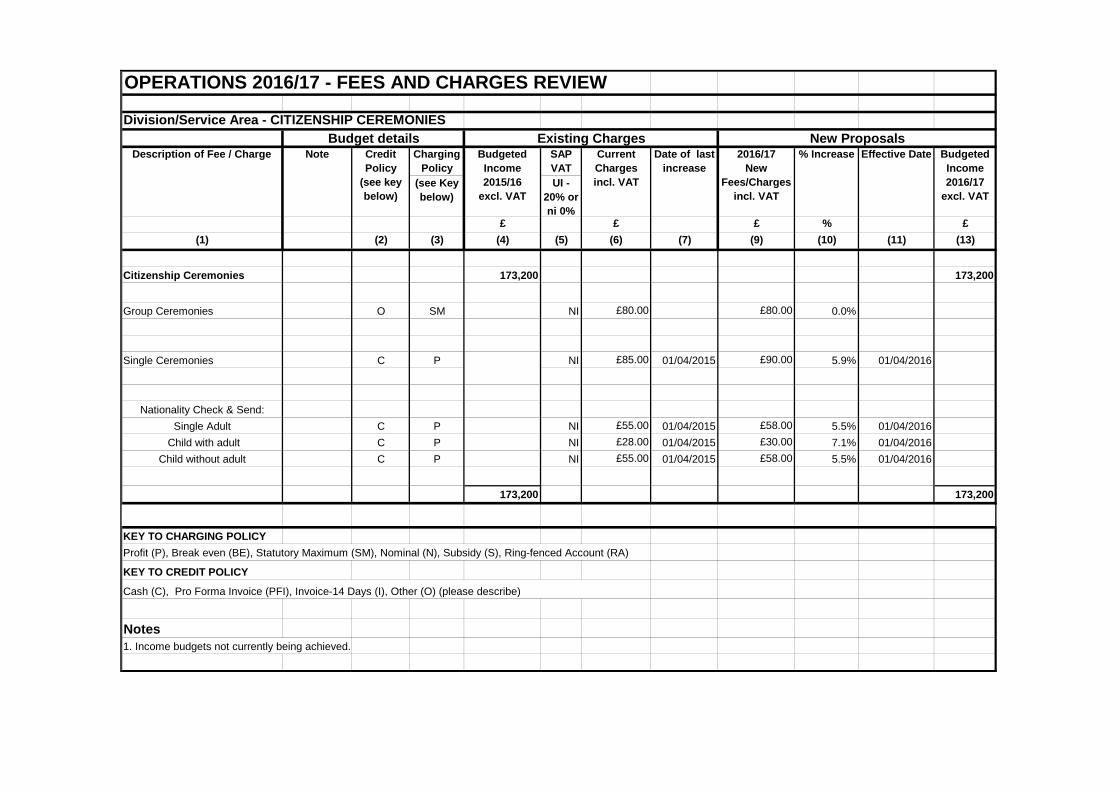
OPERATIONS 2016/17 - FEES AND CHARGES REVIEW Division/Service Area - CITIZENSHIP CEREMONIES
Charging Policy
SAP VAT
(see Key below)
UI - 20% or ni 0%
£ £ £ % £(1) (2) (3) (4) (5) (6) (7) (9) (10) (11) (13)
Citizenship Ceremonies 173,200 173,200
Group Ceremonies O SM NI £80.00 £80.00 0.0%
Single Ceremonies C P NI £85.00 01/04/2015 £90.00 5.9% 01/04/2016
Nationality Check & Send:Single Adult C P NI £55.00 01/04/2015 £58.00 5.5% 01/04/2016
Child with adult C P NI £28.00 01/04/2015 £30.00 7.1% 01/04/2016Child without adult C P NI £55.00 01/04/2015 £58.00 5.5% 01/04/2016
173,200 173,200
KEY TO CHARGING POLICYProfit (P), Break even (BE), Statutory Maximum (SM), Nominal (N), Subsidy (S), Ring-fenced Account (RA)
Notes1. Income budgets not currently being achieved.
Cash (C), Pro Forma Invoice (PFI), Invoice-14 Days (I), Other (O) (please describe)
Date of last increase
2016/17 New
Fees/Charges incl. VAT
% IncreaseCurrent Charges incl. VAT
Budgeted Income 2015/16
excl. VAT
Description of Fee / Charge Effective Date
KEY TO CREDIT POLICY
Budgeted Income 2016/17
excl. VAT
Budget details Existing Charges New ProposalsNote Credit
Policy (see key below)
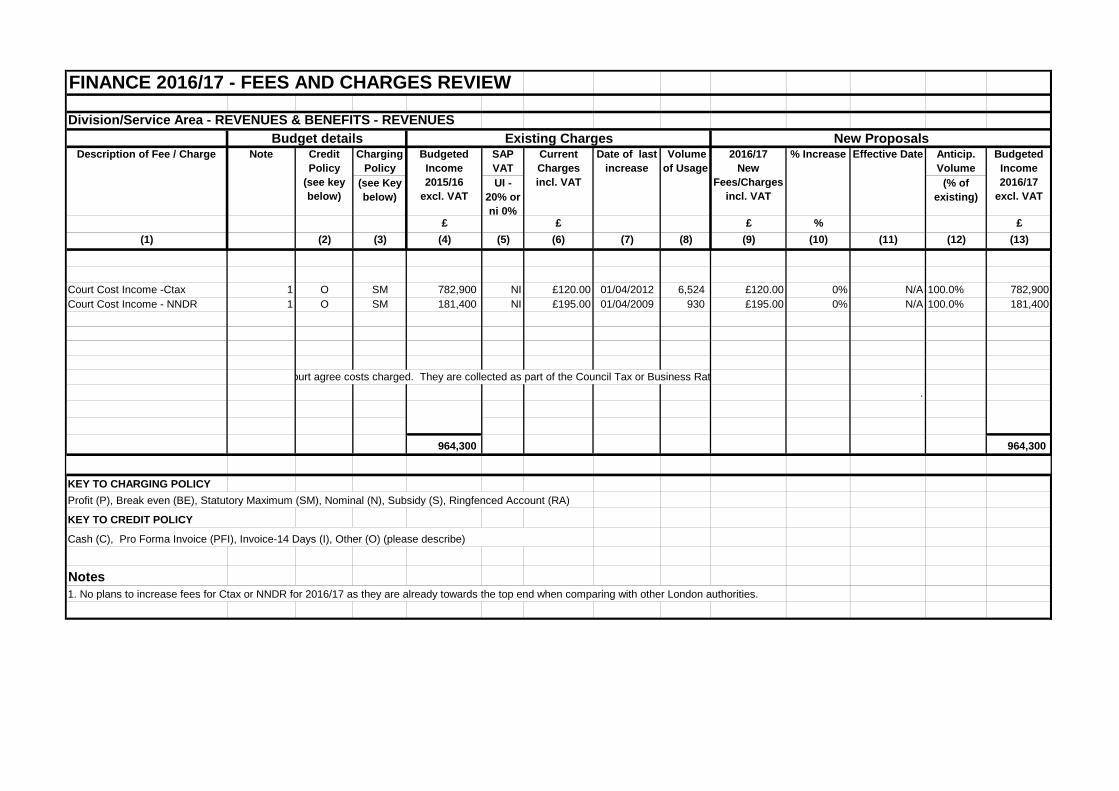
FINANCE 2016/17 - FEES AND CHARGES REVIEW Division/Service Area - REVENUES & BENEFITS - REVENUES
Charging Policy
SAP VAT
Anticip. Volume
(see Key below)
UI - 20% or ni 0%
(% of existing)
£ £ £ % £(1) (2) (3) (4) (5) (6) (7) (8) (9) (10) (11) (12) (13)
Court Cost Income -Ctax 1 O SM 782,900 NI £120.00 01/04/2012 6,524 £120.00 0% N/A 100.0% 782,900Court Cost Income - NNDR 1 O SM 181,400 NI £195.00 01/04/2009 930 £195.00 0% N/A 100.0% 181,400
.
964,300 964,300
KEY TO CHARGING POLICYProfit (P), Break even (BE), Statutory Maximum (SM), Nominal (N), Subsidy (S), Ringfenced Account (RA)
Notes1. No plans to increase fees for Ctax or NNDR for 2016/17 as they are already towards the top end when comparing with other London authorities.
Budget details Existing Charges New ProposalsDescription of Fee / Charge Note Credit
Policy (see key below)
Budgeted Income 2015/16
excl. VAT
Current Charges incl. VAT
Date of last increase
Volume of Usage
2016/17 New
Fees/Charges incl. VAT
% Increase Effective Date Budgeted Income 2016/17
excl. VAT
ourt agree costs charged. They are collected as part of the Council Tax or Business Rat
KEY TO CREDIT POLICY
Cash (C), Pro Forma Invoice (PFI), Invoice-14 Days (I), Other (O) (please describe)
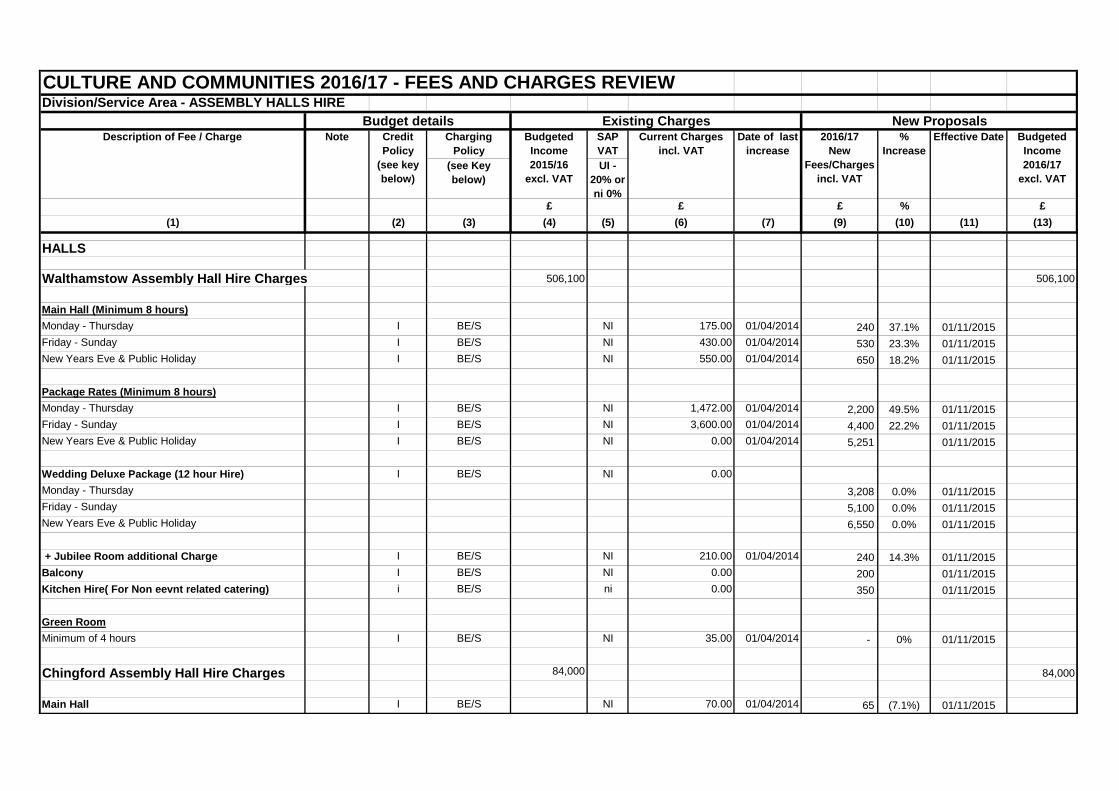
CULTURE AND COMMUNITIES 2016/17 - FEES AND CHARGES REVIEWDivision/Service Area - ASSEMBLY HALLS HIRE
Charging Policy
SAP VAT
(see Key below)
UI - 20% or ni 0%
£ £ £ % £(1) (2) (3) (4) (5) (6) (7) (9) (10) (11) (13)
HALLS
Walthamstow Assembly Hall Hire Charges 506,100 506,100
Main Hall (Minimum 8 hours)Monday - Thursday I BE/S NI 175.00 01/04/2014 240 37.1% 01/11/2015Friday - Sunday I BE/S NI 430.00 01/04/2014 530 23.3% 01/11/2015New Years Eve & Public Holiday I BE/S NI 550.00 01/04/2014 650 18.2% 01/11/2015
Package Rates (Minimum 8 hours)Monday - Thursday I BE/S NI 1,472.00 01/04/2014 2,200 49.5% 01/11/2015Friday - Sunday I BE/S NI 3,600.00 01/04/2014 4,400 22.2% 01/11/2015New Years Eve & Public Holiday I BE/S NI 0.00 01/04/2014 5,251 01/11/2015
Wedding Deluxe Package (12 hour Hire) I BE/S NI 0.00Monday - Thursday 3,208 0.0% 01/11/2015Friday - Sunday 5,100 0.0% 01/11/2015New Years Eve & Public Holiday 6,550 0.0% 01/11/2015
+ Jubilee Room additional Charge I BE/S NI 210.00 01/04/2014 240 14.3% 01/11/2015Balcony I BE/S NI 0.00 200 01/11/2015Kitchen Hire( For Non eevnt related catering) i BE/S ni 0.00 350 01/11/2015
Green RoomMinimum of 4 hours I BE/S NI 35.00 01/04/2014 - 0% 01/11/2015
Chingford Assembly Hall Hire Charges 84,000 84,000
Main Hall I BE/S NI 70.00 01/04/2014 65 (7.1%) 01/11/2015
Date of last increase
2016/17 New
Fees/Charges incl. VAT
% Increase
Budgeted Income 2015/16
excl. VAT
Current Charges incl. VAT
Effective Date Budgeted Income 2016/17
excl. VAT
Budget details Existing Charges New ProposalsDescription of Fee / Charge Note Credit
Policy (see key below)
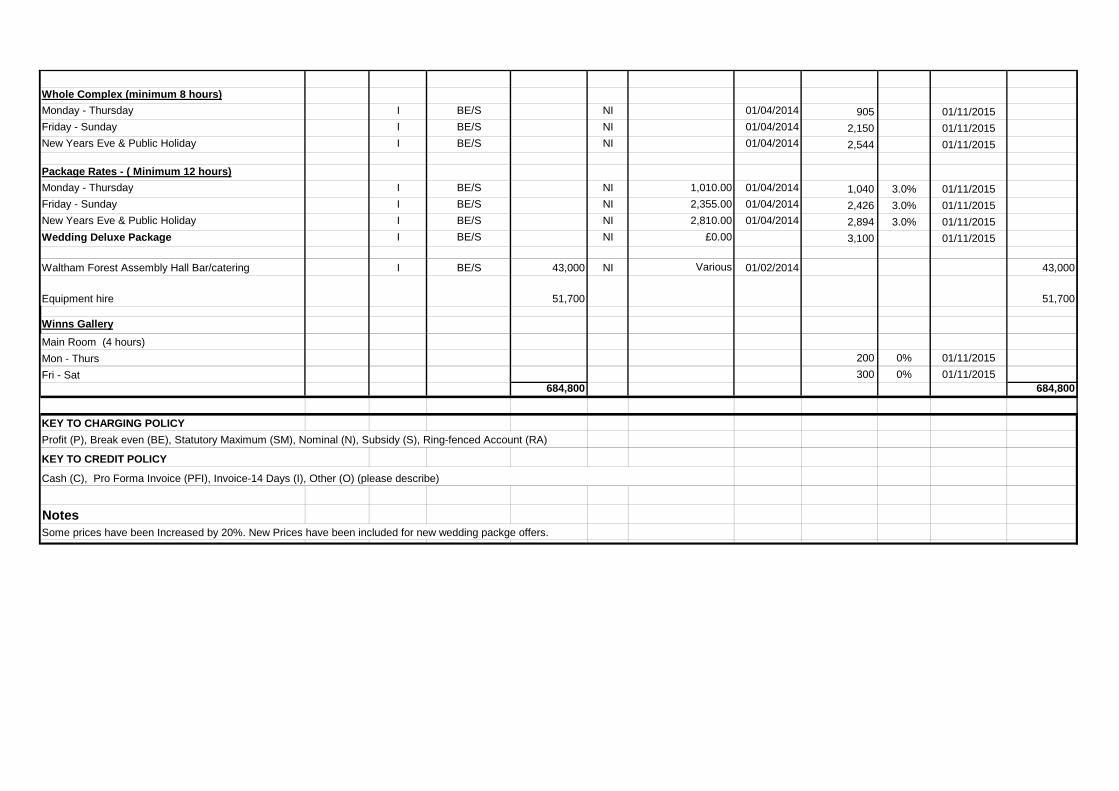
Whole Complex (minimum 8 hours)Monday - Thursday I BE/S NI 01/04/2014 905 01/11/2015Friday - Sunday I BE/S NI 01/04/2014 2,150 01/11/2015New Years Eve & Public Holiday I BE/S NI 01/04/2014 2,544 01/11/2015
Package Rates - ( Minimum 12 hours)Monday - Thursday I BE/S NI 1,010.00 01/04/2014 1,040 3.0% 01/11/2015Friday - Sunday I BE/S NI 2,355.00 01/04/2014 2,426 3.0% 01/11/2015New Years Eve & Public Holiday I BE/S NI 2,810.00 01/04/2014 2,894 3.0% 01/11/2015Wedding Deluxe Package I BE/S NI £0.00 3,100 01/11/2015
Waltham Forest Assembly Hall Bar/catering I BE/S 43,000 NI Various 01/02/2014 43,000
Equipment hire 51,700 51,700
Winns GalleryMain Room (4 hours)Mon - Thurs 200 0% 01/11/2015Fri - Sat 300 0% 01/11/2015
684,800 684,800
KEY TO CHARGING POLICYProfit (P), Break even (BE), Statutory Maximum (SM), Nominal (N), Subsidy (S), Ring-fenced Account (RA)
NotesSome prices have been Increased by 20%. New Prices have been included for new wedding packge offers.
KEY TO CREDIT POLICY
Cash (C), Pro Forma Invoice (PFI), Invoice-14 Days (I), Other (O) (please describe)
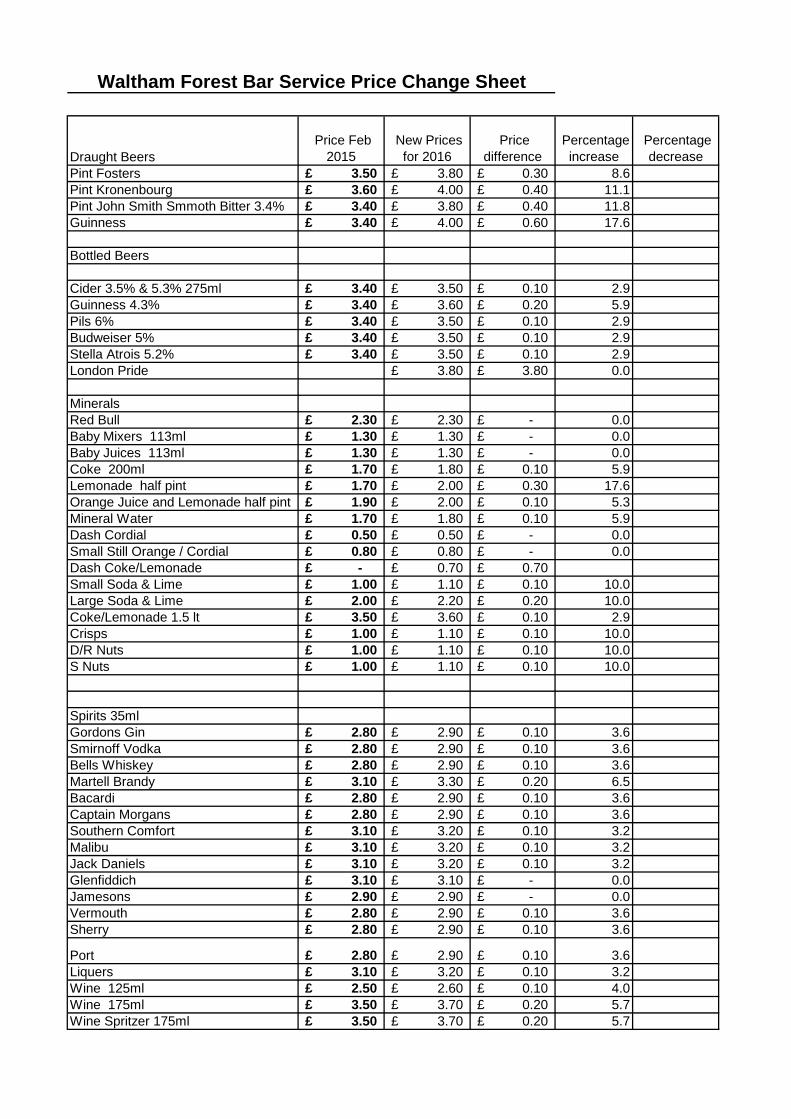
Draught Beers Price Feb
2015 New Prices
for 2016 Price
difference Percentage
increase Percentage
decrease Pint Fosters 3.50£ 3.80£ 0.30£ 8.6Pint Kronenbourg 3.60£ 4.00£ 0.40£ 11.1Pint John Smith Smmoth Bitter 3.4% 3.40£ 3.80£ 0.40£ 11.8Guinness 3.40£ 4.00£ 0.60£ 17.6
Bottled Beers
Cider 3.5% & 5.3% 275ml 3.40£ 3.50£ 0.10£ 2.9Guinness 4.3% 3.40£ 3.60£ 0.20£ 5.9Pils 6% 3.40£ 3.50£ 0.10£ 2.9Budweiser 5% 3.40£ 3.50£ 0.10£ 2.9Stella Atrois 5.2% 3.40£ 3.50£ 0.10£ 2.9London Pride 3.80£ 3.80£ 0.0
MineralsRed Bull 2.30£ 2.30£ -£ 0.0Baby Mixers 113ml 1.30£ 1.30£ -£ 0.0Baby Juices 113ml 1.30£ 1.30£ -£ 0.0Coke 200ml 1.70£ 1.80£ 0.10£ 5.9Lemonade half pint 1.70£ 2.00£ 0.30£ 17.6Orange Juice and Lemonade half pint 1.90£ 2.00£ 0.10£ 5.3Mineral Water 1.70£ 1.80£ 0.10£ 5.9Dash Cordial 0.50£ 0.50£ -£ 0.0Small Still Orange / Cordial 0.80£ 0.80£ -£ 0.0Dash Coke/Lemonade -£ 0.70£ 0.70£ Small Soda & Lime 1.00£ 1.10£ 0.10£ 10.0Large Soda & Lime 2.00£ 2.20£ 0.20£ 10.0Coke/Lemonade 1.5 lt 3.50£ 3.60£ 0.10£ 2.9Crisps 1.00£ 1.10£ 0.10£ 10.0D/R Nuts 1.00£ 1.10£ 0.10£ 10.0S Nuts 1.00£ 1.10£ 0.10£ 10.0
Spirits 35mlGordons Gin 2.80£ 2.90£ 0.10£ 3.6Smirnoff Vodka 2.80£ 2.90£ 0.10£ 3.6Bells Whiskey 2.80£ 2.90£ 0.10£ 3.6Martell Brandy 3.10£ 3.30£ 0.20£ 6.5Bacardi 2.80£ 2.90£ 0.10£ 3.6Captain Morgans 2.80£ 2.90£ 0.10£ 3.6Southern Comfort 3.10£ 3.20£ 0.10£ 3.2Malibu 3.10£ 3.20£ 0.10£ 3.2Jack Daniels 3.10£ 3.20£ 0.10£ 3.2Glenfiddich 3.10£ 3.10£ -£ 0.0Jamesons 2.90£ 2.90£ -£ 0.0Vermouth 2.80£ 2.90£ 0.10£ 3.6Sherry 2.80£ 2.90£ 0.10£ 3.6
Port 2.80£ 2.90£ 0.10£ 3.6Liquers 3.10£ 3.20£ 0.10£ 3.2Wine 125ml 2.50£ 2.60£ 0.10£ 4.0Wine 175ml 3.50£ 3.70£ 0.20£ 5.7Wine Spritzer 175ml 3.50£ 3.70£ 0.20£ 5.7
Waltham Forest Bar Service Price Change Sheet
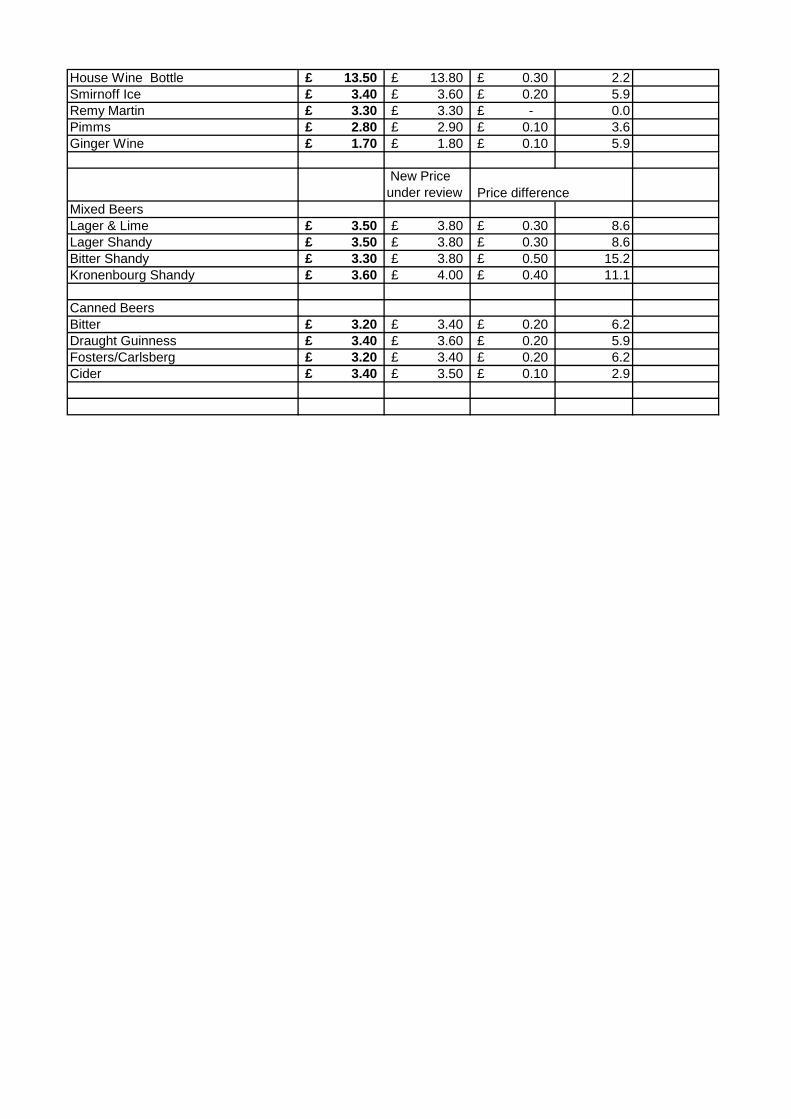
House Wine Bottle 13.50£ 13.80£ 0.30£ 2.2Smirnoff Ice 3.40£ 3.60£ 0.20£ 5.9Remy Martin 3.30£ 3.30£ -£ 0.0Pimms 2.80£ 2.90£ 0.10£ 3.6Ginger Wine 1.70£ 1.80£ 0.10£ 5.9
New Price under review Price difference
Mixed BeersLager & Lime 3.50£ 3.80£ 0.30£ 8.6Lager Shandy 3.50£ 3.80£ 0.30£ 8.6Bitter Shandy 3.30£ 3.80£ 0.50£ 15.2Kronenbourg Shandy 3.60£ 4.00£ 0.40£ 11.1
Canned BeersBitter 3.20£ 3.40£ 0.20£ 6.2Draught Guinness 3.40£ 3.60£ 0.20£ 5.9Fosters/Carlsberg 3.20£ 3.40£ 0.20£ 6.2Cider 3.40£ 3.50£ 0.10£ 2.9
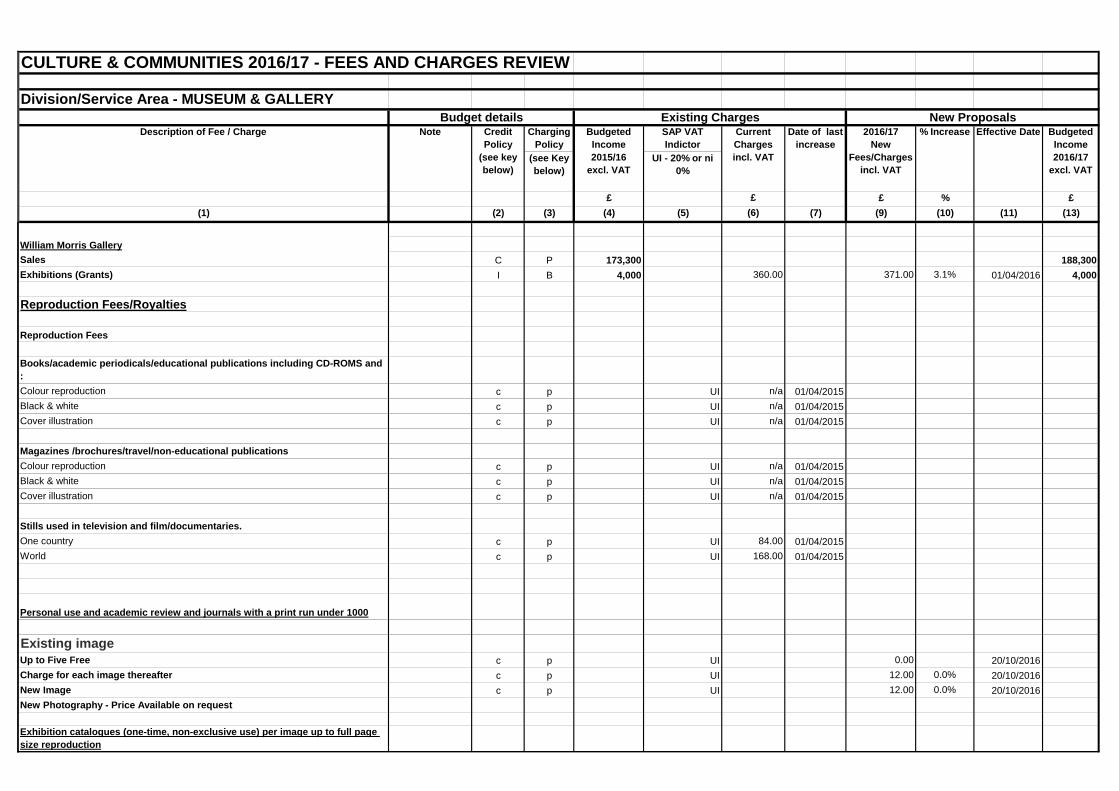
CULTURE & COMMUNITIES 2016/17 - FEES AND CHARGES REVIEW Division/Service Area - MUSEUM & GALLERY
Charging Policy
SAP VAT Indictor
(see Key below)
UI - 20% or ni 0%
£ £ £ % £(1) (2) (3) (4) (5) (6) (7) (9) (10) (11) (13)
William Morris GallerySales C P 173,300 188,300Exhibitions (Grants) I B 4,000 360.00 371.00 3.1% 01/04/2016 4,000
Reproduction Fees/Royalties
Reproduction Fees
Books/academic periodicals/educational publications including CD-ROMS and :Colour reproduction c p UI n/a 01/04/2015Black & white c p UI n/a 01/04/2015Cover illustration c p UI n/a 01/04/2015
Magazines /brochures/travel/non-educational publicationsColour reproduction c p UI n/a 01/04/2015Black & white c p UI n/a 01/04/2015Cover illustration c p UI n/a 01/04/2015
Stills used in television and film/documentaries.One country c p UI 84.00 01/04/2015World c p UI 168.00 01/04/2015
Personal use and academic review and journals with a print run under 1000
Existing imageUp to Five Free c p UI 0.00 20/10/2016Charge for each image thereafter c p UI 12.00 0.0% 20/10/2016New Image c p UI 12.00 0.0% 20/10/2016New Photography - Price Available on request
Exhibition catalogues (one-time, non-exclusive use) per image up to full page size reproduction
Effective Date Budgeted Income 2016/17
excl. VAT
Budget details Existing Charges New ProposalsDate of last
increaseNote % IncreaseCredit
Policy (see key below)
2016/17 New
Fees/Charges incl. VAT
Current Charges incl. VAT
Budgeted Income 2015/16
excl. VAT
Description of Fee / Charge
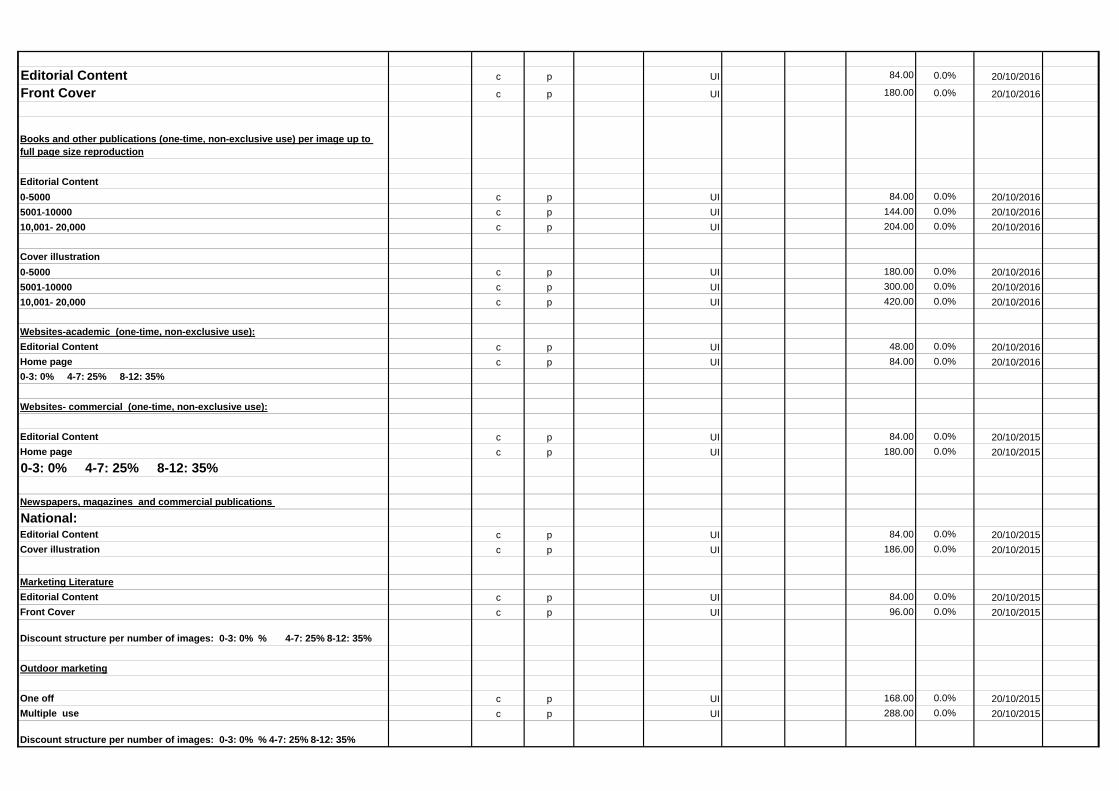
Editorial Content c p UI 84.00 0.0% 20/10/2016
Front Cover c p UI 180.00 0.0% 20/10/2016
Books and other publications (one-time, non-exclusive use) per image up to full page size reproduction
Editorial Content 0-5000 c p UI 84.00 0.0% 20/10/20165001-10000 c p UI 144.00 0.0% 20/10/201610,001- 20,000 c p UI 204.00 0.0% 20/10/2016
Cover illustration 0-5000 c p UI 180.00 0.0% 20/10/20165001-10000 c p UI 300.00 0.0% 20/10/201610,001- 20,000 c p UI 420.00 0.0% 20/10/2016
Websites-academic (one-time, non-exclusive use):Editorial Content c p UI 48.00 0.0% 20/10/2016Home page c p UI 84.00 0.0% 20/10/20160-3: 0% 4-7: 25% 8-12: 35%
Websites- commercial (one-time, non-exclusive use):
Editorial Content c p UI 84.00 0.0% 20/10/2015Home page c p UI 180.00 0.0% 20/10/2015
0-3: 0% 4-7: 25% 8-12: 35%
Newspapers, magazines and commercial publications
National:Editorial Content c p UI 84.00 0.0% 20/10/2015Cover illustration c p UI 186.00 0.0% 20/10/2015
Marketing LiteratureEditorial Content c p UI 84.00 0.0% 20/10/2015Front Cover c p UI 96.00 0.0% 20/10/2015
Discount structure per number of images: 0-3: 0% % 4-7: 25% 8-12: 35%
Outdoor marketing
One off c p UI 168.00 0.0% 20/10/2015Multiple use c p UI 288.00 0.0% 20/10/2015
Discount structure per number of images: 0-3: 0% % 4-7: 25% 8-12: 35%
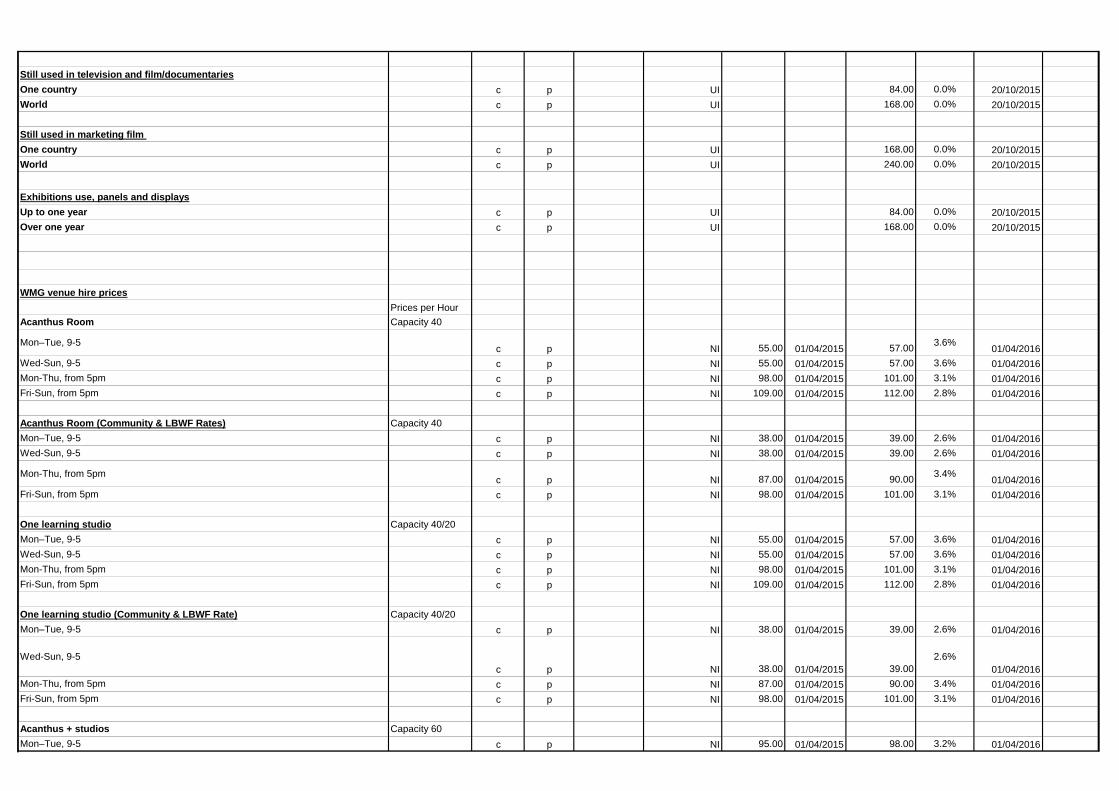
Still used in television and film/documentariesOne country c p UI 84.00 0.0% 20/10/2015World c p UI 168.00 0.0% 20/10/2015
Still used in marketing film One country c p UI 168.00 0.0% 20/10/2015World c p UI 240.00 0.0% 20/10/2015
Exhibitions use, panels and displaysUp to one year c p UI 84.00 0.0% 20/10/2015Over one year c p UI 168.00 0.0% 20/10/2015
WMG venue hire pricesPrices per Hour
Acanthus Room Capacity 40
Mon–Tue, 9-5 c p NI 55.00 01/04/2015 57.00 3.6% 01/04/2016Wed-Sun, 9-5 c p NI 55.00 01/04/2015 57.00 3.6% 01/04/2016Mon-Thu, from 5pm c p NI 98.00 01/04/2015 101.00 3.1% 01/04/2016Fri-Sun, from 5pm c p NI 109.00 01/04/2015 112.00 2.8% 01/04/2016
Acanthus Room (Community & LBWF Rates) Capacity 40Mon–Tue, 9-5 c p NI 38.00 01/04/2015 39.00 2.6% 01/04/2016Wed-Sun, 9-5 c p NI 38.00 01/04/2015 39.00 2.6% 01/04/2016
Mon-Thu, from 5pm c p NI 87.00 01/04/2015 90.00 3.4% 01/04/2016Fri-Sun, from 5pm c p NI 98.00 01/04/2015 101.00 3.1% 01/04/2016
One learning studio Capacity 40/20Mon–Tue, 9-5 c p NI 55.00 01/04/2015 57.00 3.6% 01/04/2016Wed-Sun, 9-5 c p NI 55.00 01/04/2015 57.00 3.6% 01/04/2016Mon-Thu, from 5pm c p NI 98.00 01/04/2015 101.00 3.1% 01/04/2016Fri-Sun, from 5pm c p NI 109.00 01/04/2015 112.00 2.8% 01/04/2016
One learning studio (Community & LBWF Rate) Capacity 40/20Mon–Tue, 9-5 c p NI 38.00 01/04/2015 39.00 2.6% 01/04/2016
Wed-Sun, 9-5c p NI 38.00 01/04/2015 39.00
2.6%01/04/2016
Mon-Thu, from 5pm c p NI 87.00 01/04/2015 90.00 3.4% 01/04/2016Fri-Sun, from 5pm c p NI 98.00 01/04/2015 101.00 3.1% 01/04/2016
Acanthus + studios Capacity 60Mon–Tue, 9-5 c p NI 95.00 01/04/2015 98.00 3.2% 01/04/2016
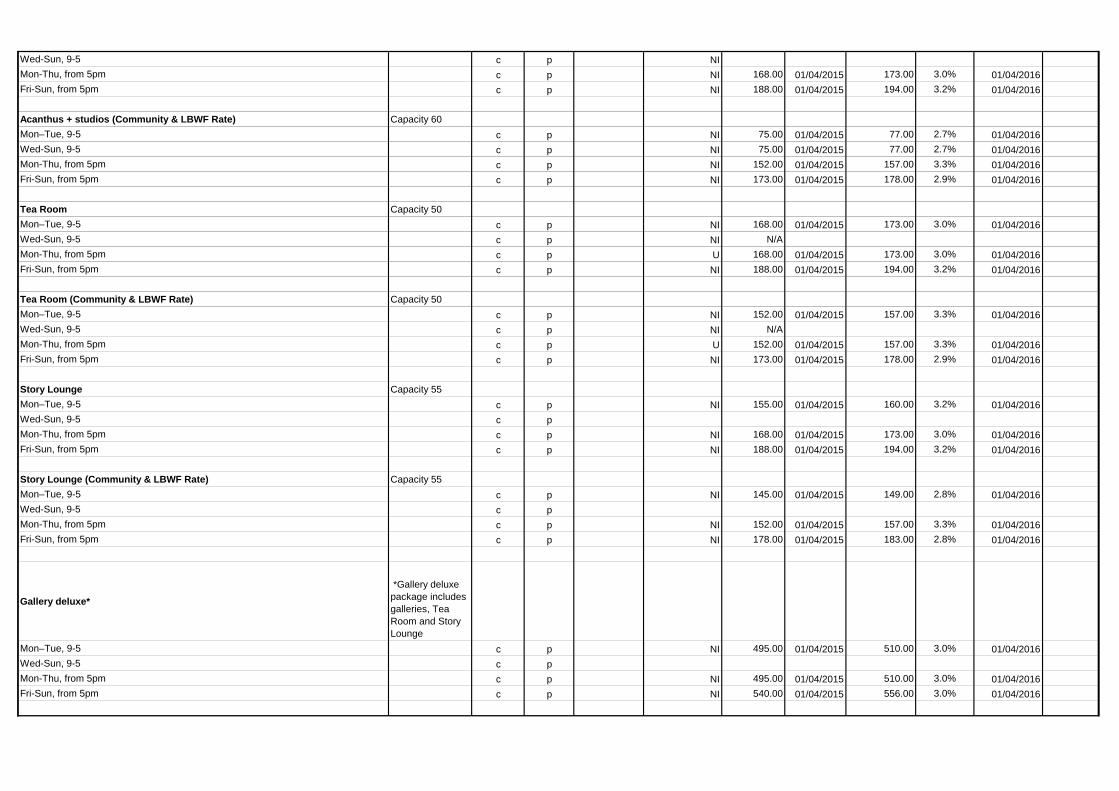
Wed-Sun, 9-5 c p NIMon-Thu, from 5pm c p NI 168.00 01/04/2015 173.00 3.0% 01/04/2016Fri-Sun, from 5pm c p NI 188.00 01/04/2015 194.00 3.2% 01/04/2016
Acanthus + studios (Community & LBWF Rate) Capacity 60Mon–Tue, 9-5 c p NI 75.00 01/04/2015 77.00 2.7% 01/04/2016Wed-Sun, 9-5 c p NI 75.00 01/04/2015 77.00 2.7% 01/04/2016Mon-Thu, from 5pm c p NI 152.00 01/04/2015 157.00 3.3% 01/04/2016Fri-Sun, from 5pm c p NI 173.00 01/04/2015 178.00 2.9% 01/04/2016
Tea Room Capacity 50Mon–Tue, 9-5 c p NI 168.00 01/04/2015 173.00 3.0% 01/04/2016Wed-Sun, 9-5 c p NI N/AMon-Thu, from 5pm c p U 168.00 01/04/2015 173.00 3.0% 01/04/2016Fri-Sun, from 5pm c p NI 188.00 01/04/2015 194.00 3.2% 01/04/2016
Tea Room (Community & LBWF Rate) Capacity 50Mon–Tue, 9-5 c p NI 152.00 01/04/2015 157.00 3.3% 01/04/2016Wed-Sun, 9-5 c p NI N/AMon-Thu, from 5pm c p U 152.00 01/04/2015 157.00 3.3% 01/04/2016Fri-Sun, from 5pm c p NI 173.00 01/04/2015 178.00 2.9% 01/04/2016
Story Lounge Capacity 55Mon–Tue, 9-5 c p NI 155.00 01/04/2015 160.00 3.2% 01/04/2016Wed-Sun, 9-5 c pMon-Thu, from 5pm c p NI 168.00 01/04/2015 173.00 3.0% 01/04/2016Fri-Sun, from 5pm c p NI 188.00 01/04/2015 194.00 3.2% 01/04/2016
Story Lounge (Community & LBWF Rate) Capacity 55Mon–Tue, 9-5 c p NI 145.00 01/04/2015 149.00 2.8% 01/04/2016Wed-Sun, 9-5 c pMon-Thu, from 5pm c p NI 152.00 01/04/2015 157.00 3.3% 01/04/2016Fri-Sun, from 5pm c p NI 178.00 01/04/2015 183.00 2.8% 01/04/2016
Gallery deluxe*
*Gallery deluxe package includes galleries, Tea Room and Story Lounge
Mon–Tue, 9-5 c p NI 495.00 01/04/2015 510.00 3.0% 01/04/2016Wed-Sun, 9-5 c pMon-Thu, from 5pm c p NI 495.00 01/04/2015 510.00 3.0% 01/04/2016Fri-Sun, from 5pm c p NI 540.00 01/04/2015 556.00 3.0% 01/04/2016
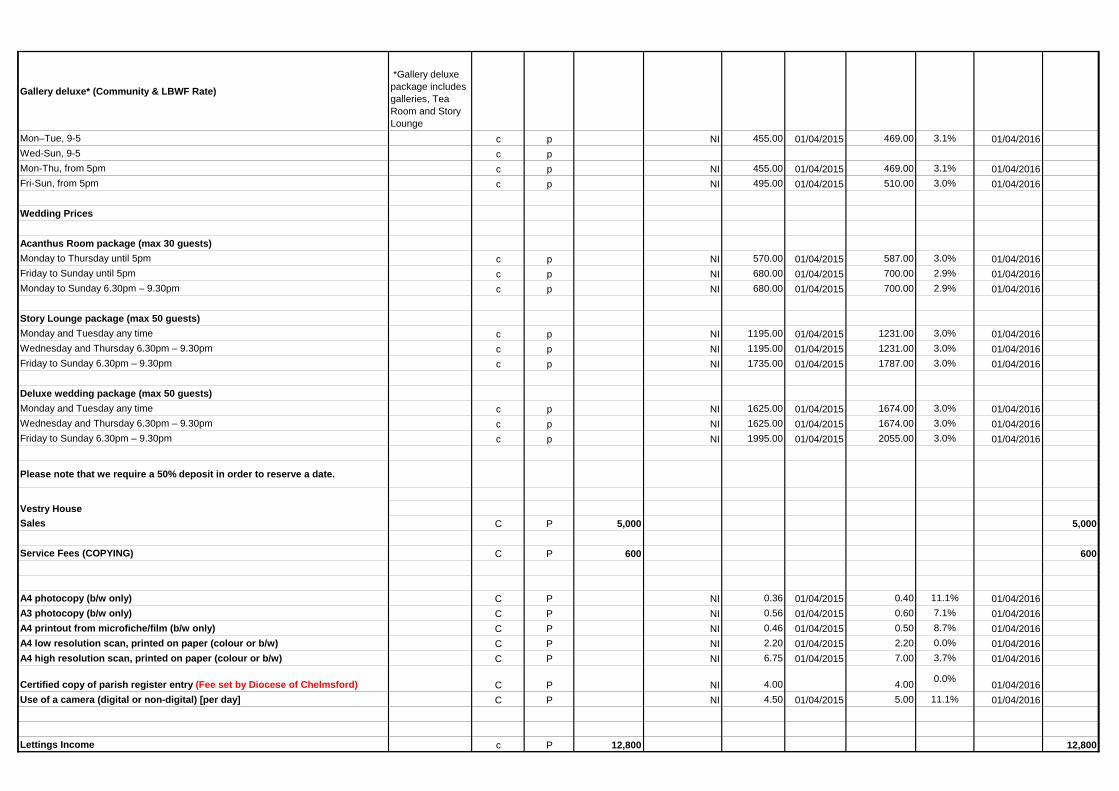
Gallery deluxe* (Community & LBWF Rate)
*Gallery deluxe package includes galleries, Tea Room and Story Lounge
Mon–Tue, 9-5 c p NI 455.00 01/04/2015 469.00 3.1% 01/04/2016Wed-Sun, 9-5 c pMon-Thu, from 5pm c p NI 455.00 01/04/2015 469.00 3.1% 01/04/2016Fri-Sun, from 5pm c p NI 495.00 01/04/2015 510.00 3.0% 01/04/2016
Wedding Prices
Acanthus Room package (max 30 guests)Monday to Thursday until 5pm c p NI 570.00 01/04/2015 587.00 3.0% 01/04/2016Friday to Sunday until 5pm c p NI 680.00 01/04/2015 700.00 2.9% 01/04/2016Monday to Sunday 6.30pm – 9.30pm c p NI 680.00 01/04/2015 700.00 2.9% 01/04/2016
Story Lounge package (max 50 guests)Monday and Tuesday any time c p NI 1195.00 01/04/2015 1231.00 3.0% 01/04/2016Wednesday and Thursday 6.30pm – 9.30pm c p NI 1195.00 01/04/2015 1231.00 3.0% 01/04/2016Friday to Sunday 6.30pm – 9.30pm c p NI 1735.00 01/04/2015 1787.00 3.0% 01/04/2016
Deluxe wedding package (max 50 guests)Monday and Tuesday any time c p NI 1625.00 01/04/2015 1674.00 3.0% 01/04/2016Wednesday and Thursday 6.30pm – 9.30pm c p NI 1625.00 01/04/2015 1674.00 3.0% 01/04/2016Friday to Sunday 6.30pm – 9.30pm c p NI 1995.00 01/04/2015 2055.00 3.0% 01/04/2016
Please note that we require a 50% deposit in order to reserve a date.
Vestry HouseSales C P 5,000 5,000
Service Fees (COPYING) C P 600 600
A4 photocopy (b/w only) C P NI 0.36 01/04/2015 0.40 11.1% 01/04/2016A3 photocopy (b/w only) C P NI 0.56 01/04/2015 0.60 7.1% 01/04/2016A4 printout from microfiche/film (b/w only) C P NI 0.46 01/04/2015 0.50 8.7% 01/04/2016A4 low resolution scan, printed on paper (colour or b/w) C P NI 2.20 01/04/2015 2.20 0.0% 01/04/2016A4 high resolution scan, printed on paper (colour or b/w) C P NI 6.75 01/04/2015 7.00 3.7% 01/04/2016
Certified copy of parish register entry (Fee set by Diocese of Chelmsford) C P NI 4.00 4.00 0.0% 01/04/2016Use of a camera (digital or non-digital) [per day] C P NI 4.50 01/04/2015 5.00 11.1% 01/04/2016
Lettings Income c P 12,800 12,800
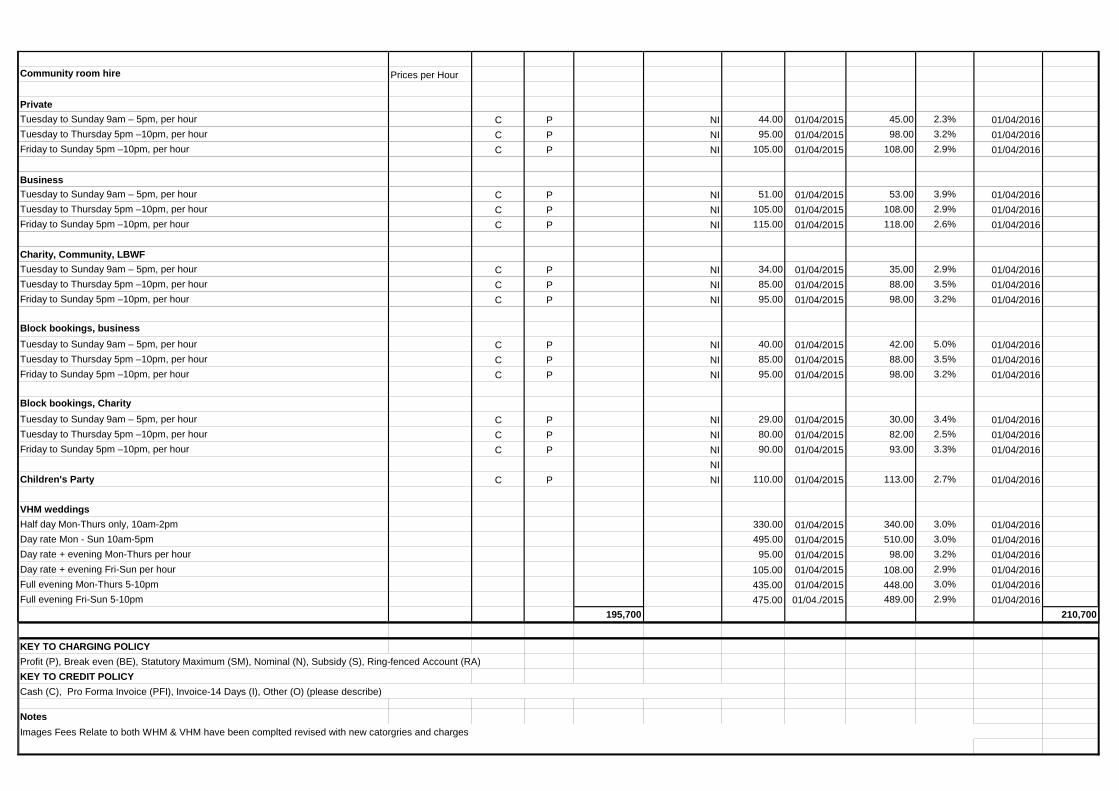
Community room hire Prices per Hour
PrivateTuesday to Sunday 9am – 5pm, per hour C P NI 44.00 01/04/2015 45.00 2.3% 01/04/2016Tuesday to Thursday 5pm –10pm, per hour C P NI 95.00 01/04/2015 98.00 3.2% 01/04/2016Friday to Sunday 5pm –10pm, per hour C P NI 105.00 01/04/2015 108.00 2.9% 01/04/2016
BusinessTuesday to Sunday 9am – 5pm, per hour C P NI 51.00 01/04/2015 53.00 3.9% 01/04/2016Tuesday to Thursday 5pm –10pm, per hour C P NI 105.00 01/04/2015 108.00 2.9% 01/04/2016Friday to Sunday 5pm –10pm, per hour C P NI 115.00 01/04/2015 118.00 2.6% 01/04/2016
Charity, Community, LBWFTuesday to Sunday 9am – 5pm, per hour C P NI 34.00 01/04/2015 35.00 2.9% 01/04/2016Tuesday to Thursday 5pm –10pm, per hour C P NI 85.00 01/04/2015 88.00 3.5% 01/04/2016Friday to Sunday 5pm –10pm, per hour C P NI 95.00 01/04/2015 98.00 3.2% 01/04/2016
Block bookings, business Tuesday to Sunday 9am – 5pm, per hour C P NI 40.00 01/04/2015 42.00 5.0% 01/04/2016Tuesday to Thursday 5pm –10pm, per hour C P NI 85.00 01/04/2015 88.00 3.5% 01/04/2016Friday to Sunday 5pm –10pm, per hour C P NI 95.00 01/04/2015 98.00 3.2% 01/04/2016
Block bookings, CharityTuesday to Sunday 9am – 5pm, per hour C P NI 29.00 01/04/2015 30.00 3.4% 01/04/2016Tuesday to Thursday 5pm –10pm, per hour C P NI 80.00 01/04/2015 82.00 2.5% 01/04/2016Friday to Sunday 5pm –10pm, per hour C P NI 90.00 01/04/2015 93.00 3.3% 01/04/2016
NIChildren's Party C P NI 110.00 01/04/2015 113.00 2.7% 01/04/2016
VHM weddings Half day Mon-Thurs only, 10am-2pm 330.00 01/04/2015 340.00 3.0% 01/04/2016Day rate Mon - Sun 10am-5pm 495.00 01/04/2015 510.00 3.0% 01/04/2016Day rate + evening Mon-Thurs per hour 95.00 01/04/2015 98.00 3.2% 01/04/2016Day rate + evening Fri-Sun per hour 105.00 01/04/2015 108.00 2.9% 01/04/2016Full evening Mon-Thurs 5-10pm 435.00 01/04/2015 448.00 3.0% 01/04/2016Full evening Fri-Sun 5-10pm 475.00 01/04./2015 489.00 2.9% 01/04/2016
195,700 210,700
KEY TO CHARGING POLICYProfit (P), Break even (BE), Statutory Maximum (SM), Nominal (N), Subsidy (S), Ring-fenced Account (RA)
Notes
KEY TO CREDIT POLICYCash (C), Pro Forma Invoice (PFI), Invoice-14 Days (I), Other (O) (please describe)
Images Fees Relate to both WHM & VHM have been complted revised with new catorgries and charges
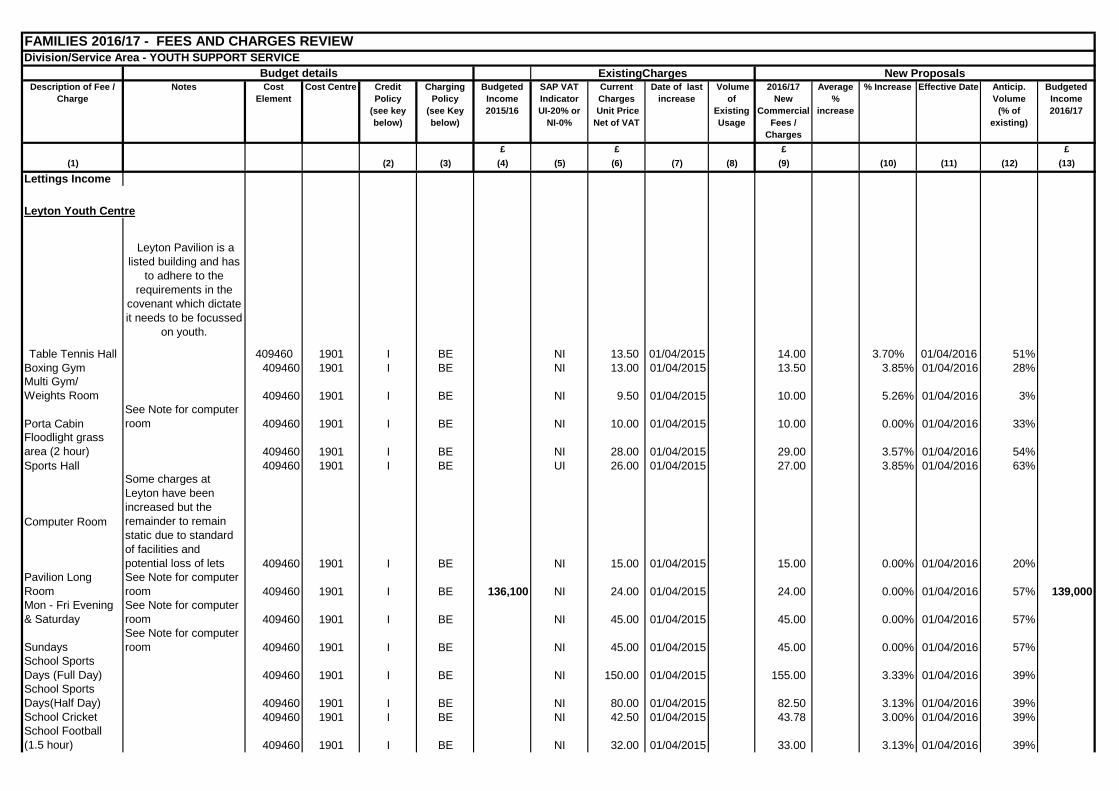
FAMILIES 2016/17 - FEES AND CHARGES REVIEW Division/Service Area - YOUTH SUPPORT SERVICE
Description of Fee / Charge
Notes Cost Element
Cost Centre Credit Policy
(see key below)
Charging Policy
(see Key below)
Budgeted Income 2015/16
SAP VAT Indicator UI-20% or
NI-0%
Current Charges
Unit Price Net of VAT
Date of last increase
Volume of
Existing Usage
2016/17 New
Commercial Fees /
Charges
Average %
increase
% Increase Effective Date Anticip. Volume
(% of existing)
Budgeted Income 2016/17
£ £ £ £(1) (2) (3) (4) (5) (6) (7) (8) (9) (10) (11) (12) (13)
Lettings Income
Leyton Youth Centre
Table Tennis Hall
Leyton Pavilion is a listed building and has
to adhere to the requirements in the
covenant which dictate it needs to be focussed
on youth.
409460 1901 I BE NI 13.50 01/04/2015 14.00 3.70% 01/04/2016 51%Boxing Gym 409460 1901 I BE NI 13.00 01/04/2015 13.50 3.85% 01/04/2016 28%Multi Gym/ Weights Room 409460 1901 I BE NI 9.50 01/04/2015 10.00 5.26% 01/04/2016 3%
Porta CabinSee Note for computer room 409460 1901 I BE NI 10.00 01/04/2015 10.00 0.00% 01/04/2016 33%
Floodlight grass area (2 hour) 409460 1901 I BE NI 28.00 01/04/2015 29.00 3.57% 01/04/2016 54%Sports Hall 409460 1901 I BE UI 26.00 01/04/2015 27.00 3.85% 01/04/2016 63%
Computer Room
Some charges at Leyton have been increased but the remainder to remain static due to standard of facilities and potential loss of lets 409460 1901 I BE NI 15.00 01/04/2015 15.00 0.00% 01/04/2016 20%
Pavilion Long Room
See Note for computer room 409460 1901 I BE 136,100 NI 24.00 01/04/2015 24.00 0.00% 01/04/2016 57% 139,000
Mon - Fri Evening & Saturday
See Note for computer room 409460 1901 I BE NI 45.00 01/04/2015 45.00 0.00% 01/04/2016 57%
SundaysSee Note for computer room 409460 1901 I BE NI 45.00 01/04/2015 45.00 0.00% 01/04/2016 57%
School Sports Days (Full Day) 409460 1901 I BE NI 150.00 01/04/2015 155.00 3.33% 01/04/2016 39%School Sports Days(Half Day) 409460 1901 I BE NI 80.00 01/04/2015 82.50 3.13% 01/04/2016 39%School Cricket 409460 1901 I BE NI 42.50 01/04/2015 43.78 3.00% 01/04/2016 39%School Football (1.5 hour) 409460 1901 I BE NI 32.00 01/04/2015 33.00 3.13% 01/04/2016 39%
Budget details ExistingCharges New Proposals
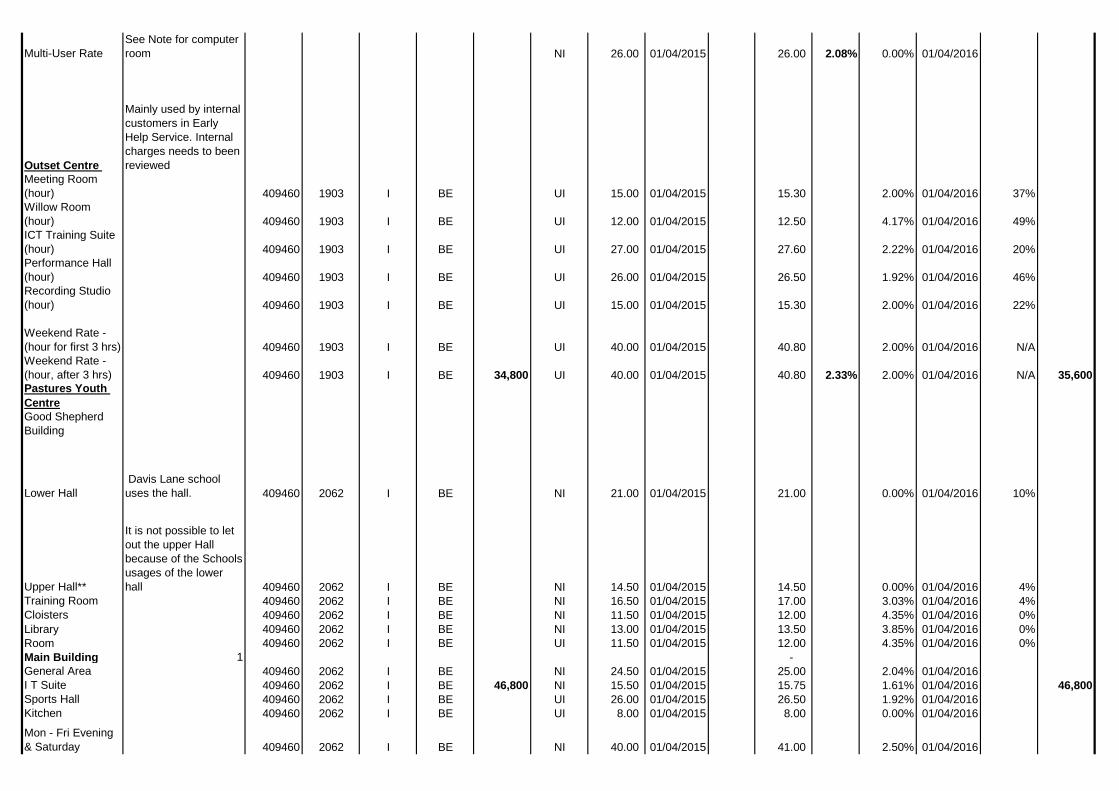
Multi-User RateSee Note for computer room NI 26.00 01/04/2015 26.00 2.08% 0.00% 01/04/2016
Outset Centre
Mainly used by internal customers in Early Help Service. Internal charges needs to been reviewed
Meeting Room (hour) 409460 1903 I BE UI 15.00 01/04/2015 15.30 2.00% 01/04/2016 37%Willow Room (hour) 409460 1903 I BE UI 12.00 01/04/2015 12.50 4.17% 01/04/2016 49%ICT Training Suite (hour) 409460 1903 I BE UI 27.00 01/04/2015 27.60 2.22% 01/04/2016 20%Performance Hall (hour) 409460 1903 I BE UI 26.00 01/04/2015 26.50 1.92% 01/04/2016 46%Recording Studio (hour) 409460 1903 I BE UI 15.00 01/04/2015 15.30 2.00% 01/04/2016 22%
Weekend Rate - (hour for first 3 hrs) 409460 1903 I BE UI 40.00 01/04/2015 40.80 2.00% 01/04/2016 N/AWeekend Rate - (hour, after 3 hrs) 409460 1903 I BE 34,800 UI 40.00 01/04/2015 40.80 2.33% 2.00% 01/04/2016 N/A 35,600Pastures Youth CentreGood Shepherd Building
Lower Hall Davis Lane school uses the hall. 409460 2062 I BE NI 21.00 01/04/2015 21.00 0.00% 01/04/2016 10%
Upper Hall**
It is not possible to let out the upper Hall because of the Schools usages of the lower hall 409460 2062 I BE NI 14.50 01/04/2015 14.50 0.00% 01/04/2016 4%
Training Room 409460 2062 I BE NI 16.50 01/04/2015 17.00 3.03% 01/04/2016 4%Cloisters 409460 2062 I BE NI 11.50 01/04/2015 12.00 4.35% 01/04/2016 0%Library 409460 2062 I BE NI 13.00 01/04/2015 13.50 3.85% 01/04/2016 0%Room 409460 2062 I BE UI 11.50 01/04/2015 12.00 4.35% 01/04/2016 0%Main Building 1 - General Area 409460 2062 I BE NI 24.50 01/04/2015 25.00 2.04% 01/04/2016I T Suite 409460 2062 I BE 46,800 NI 15.50 01/04/2015 15.75 1.61% 01/04/2016 46,800Sports Hall 409460 2062 I BE UI 26.00 01/04/2015 26.50 1.92% 01/04/2016Kitchen 409460 2062 I BE UI 8.00 01/04/2015 8.00 0.00% 01/04/2016
Mon - Fri Evening & Saturday 409460 2062 I BE NI 40.00 01/04/2015 41.00 2.50% 01/04/2016
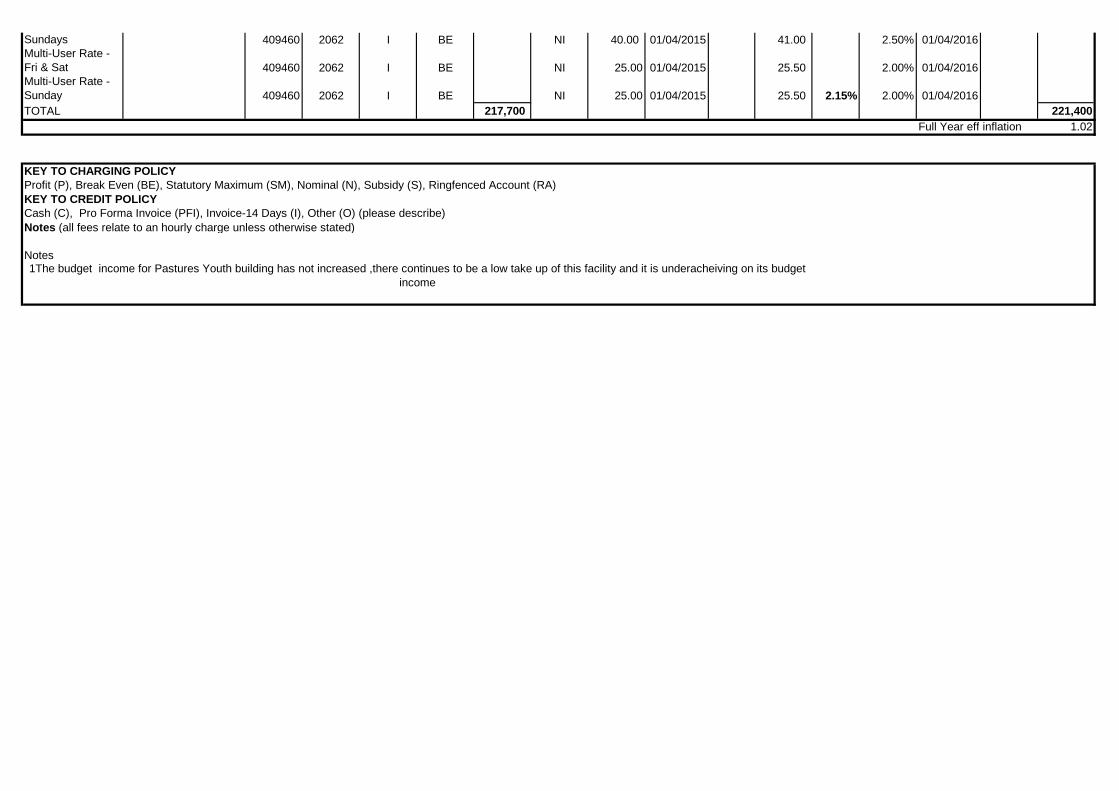
Sundays 409460 2062 I BE NI 40.00 01/04/2015 41.00 2.50% 01/04/2016Multi-User Rate - Fri & Sat 409460 2062 I BE NI 25.00 01/04/2015 25.50 2.00% 01/04/2016Multi-User Rate - Sunday 409460 2062 I BE NI 25.00 01/04/2015 25.50 2.15% 2.00% 01/04/2016TOTAL 217,700 221,400
Full Year effe inflation 1.02
KEY TO CHARGING POLICYProfit (P), Break Even (BE), Statutory Maximum (SM), Nominal (N), Subsidy (S), Ringfenced Account (RA)KEY TO CREDIT POLICYCash (C), Pro Forma Invoice (PFI), Invoice-14 Days (I), Other (O) (please describe)Notes (all fees relate to an hourly charge unless otherwise stated)
1The budget income for Pastures Youth building has not increased ,there continues to be a low take up of this facility and it is underacheiving on its budget income
Notes
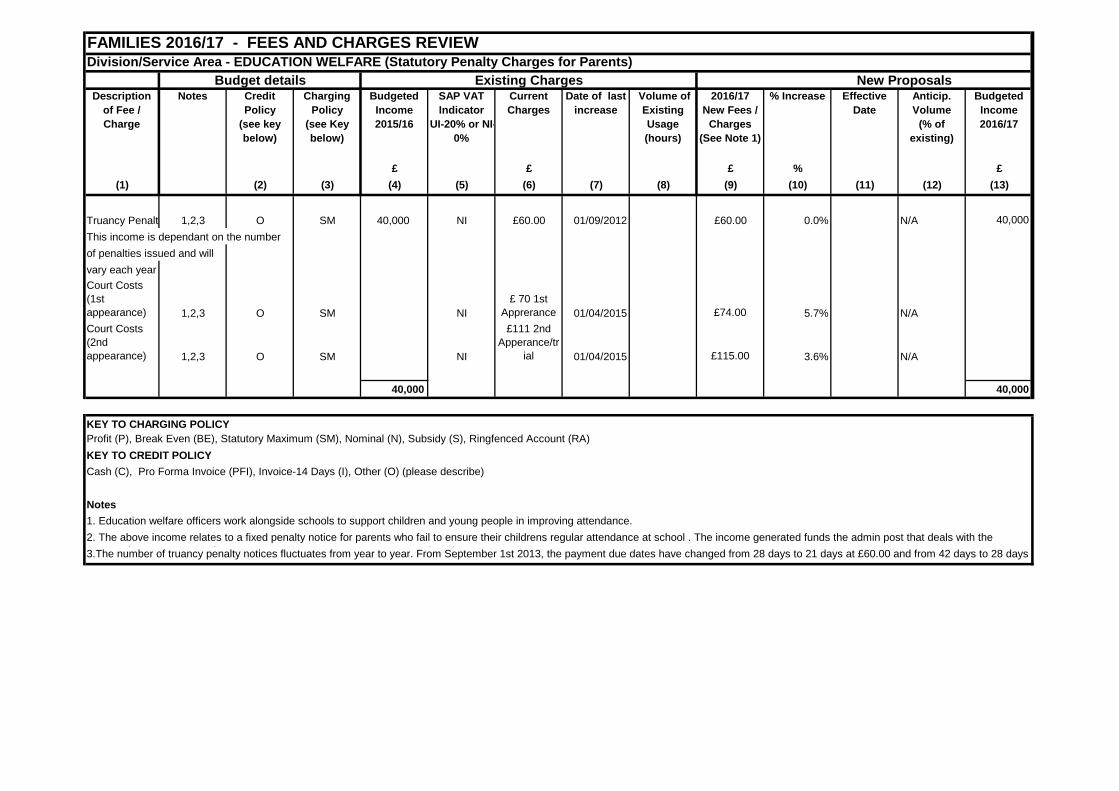
FAMILIES 2016/17 - FEES AND CHARGES REVIEWDivision/Service Area - EDUCATION WELFARE (Statutory Penalty Charges for Parents)
Description of Fee / Charge
Notes Credit Policy
(see key below)
Charging Policy
(see Key below)
Budgeted Income 2015/16
SAP VAT Indicator
UI-20% or NI-0%
Current Charges
Date of last increase
Volume of Existing Usage (hours)
2016/17 New Fees /
Charges (See Note 1)
% Increase Effective Date
Anticip. Volume
(% of existing)
Budgeted Income 2016/17
£ £ £ % £(1) (2) (3) (4) (5) (6) (7) (8) (9) (10) (11) (12) (13)
Truancy Penalt 1,2,3 O SM 40,000 NI £60.00 01/09/2012 £60.00 0.0% N/A 40,000 This income is dependant on the numberof penalties issued and will vary each yearCourt Costs (1st appearance) 1,2,3 O SM NI
£ 70 1st Apprerance 01/04/2015 £74.00 5.7% N/A
Court Costs (2nd appearance) 1,2,3 O SM NI
£111 2nd Apperance/tr
ial 01/04/2015 £115.00 3.6% N/A
40,000 40,000
KEY TO CHARGING POLICYProfit (P), Break Even (BE), Statutory Maximum (SM), Nominal (N), Subsidy (S), Ringfenced Account (RA)KEY TO CREDIT POLICYCash (C), Pro Forma Invoice (PFI), Invoice-14 Days (I), Other (O) (please describe)
Notes
Budget details Existing Charges New Proposals
1. Education welfare officers work alongside schools to support children and young people in improving attendance.2. The above income relates to a fixed penalty notice for parents who fail to ensure their childrens regular attendance at school . The income generated funds the admin post that deals with the
f f f f 3.The number of truancy penalty notices fluctuates from year to year. From September 1st 2013, the payment due dates have changed from 28 days to 21 days at £60.00 and from 42 days to 28 days t £120 00 Aft th 28th d th PN i C ll d d th tt i d lt ith t t d S444 f th Ed ti A t
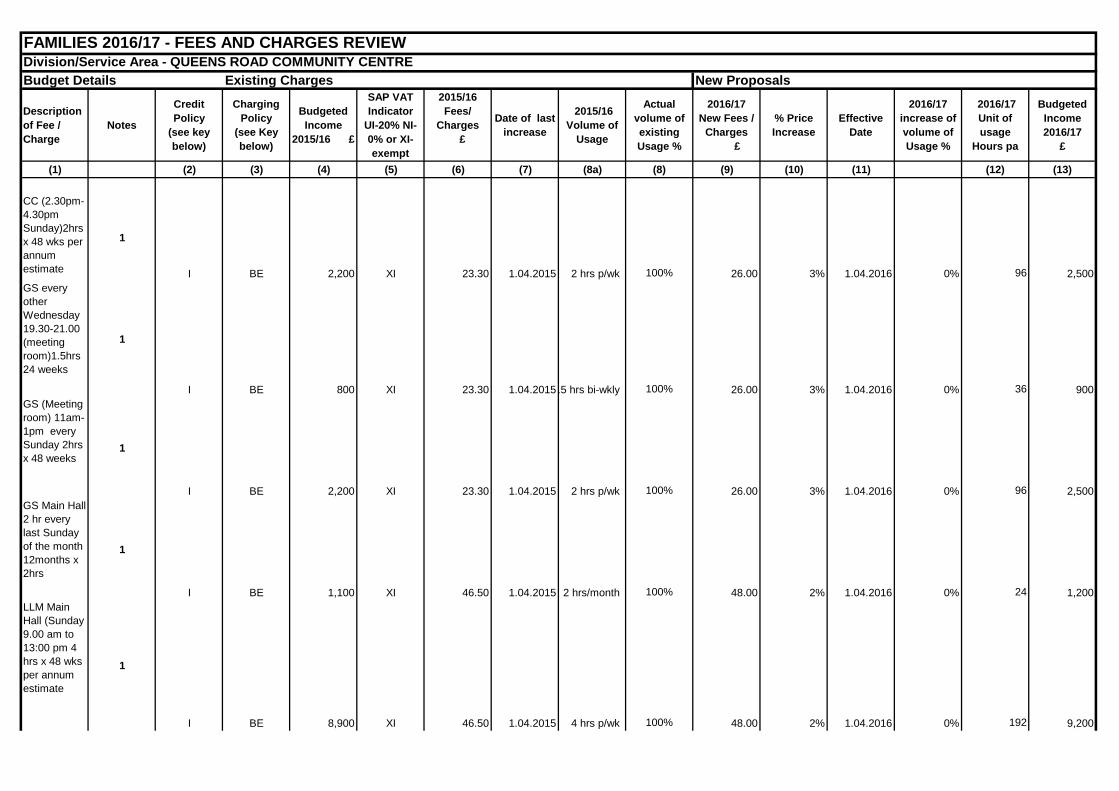
FAMILIES 2016/17 - FEES AND CHARGES REVIEWDivision/Service Area - QUEENS ROAD COMMUNITY CENTREBudget Details
Description of Fee / Charge
Notes
Credit Policy
(see key below)
Charging Policy
(see Key below)
Budgeted Income
2015/16 £
SAP VAT Indicator
UI-20% NI-0% or XI-exempt
2015/16 Fees/
Charges £
Date of last increase
2015/16 Volume of
Usage
Actual volume of existing Usage %
2016/17 New Fees /
Charges £
% Price Increase
Effective Date
2016/17 increase of volume of Usage %
2016/17 Unit of usage
Hours pa
Budgeted Income 2016/17
£
(1) (2) (3) (4) (5) (6) (7) (8a) (8) (9) (10) (11) (12) (13)
CC (2.30pm-4.30pm Sunday)2hrs x 48 wks per annum estimate
1
I BE 2,200 XI 23.30 1.04.2015 2 hrs p/wk 100% 26.00 3% 1.04.2016 0% 96 2,500GS every other Wednesday 19.30-21.00 (meeting room)1.5hrs 24 weeks
1
I BE 800 XI 23.30 1.04.2015 .5 hrs bi-wkly 100% 26.00 3% 1.04.2016 0% 36 900GS (Meeting room) 11am-1pm every Sunday 2hrs x 48 weeks
1
I BE 2,200 XI 23.30 1.04.2015 2 hrs p/wk 100% 26.00 3% 1.04.2016 0% 96 2,500GS Main Hall 2 hr every last Sunday of the month 12months x 2hrs
1
I BE 1,100 XI 46.50 1.04.2015 2 hrs/month 100% 48.00 2% 1.04.2016 0% 24 1,200LLM Main Hall (Sunday 9.00 am to 13:00 pm 4 hrs x 48 wks per annum estimate
1
I BE 8,900 XI 46.50 1.04.2015 4 hrs p/wk 100% 48.00 2% 1.04.2016 0% 192 9,200
New ProposalsExisting Charges
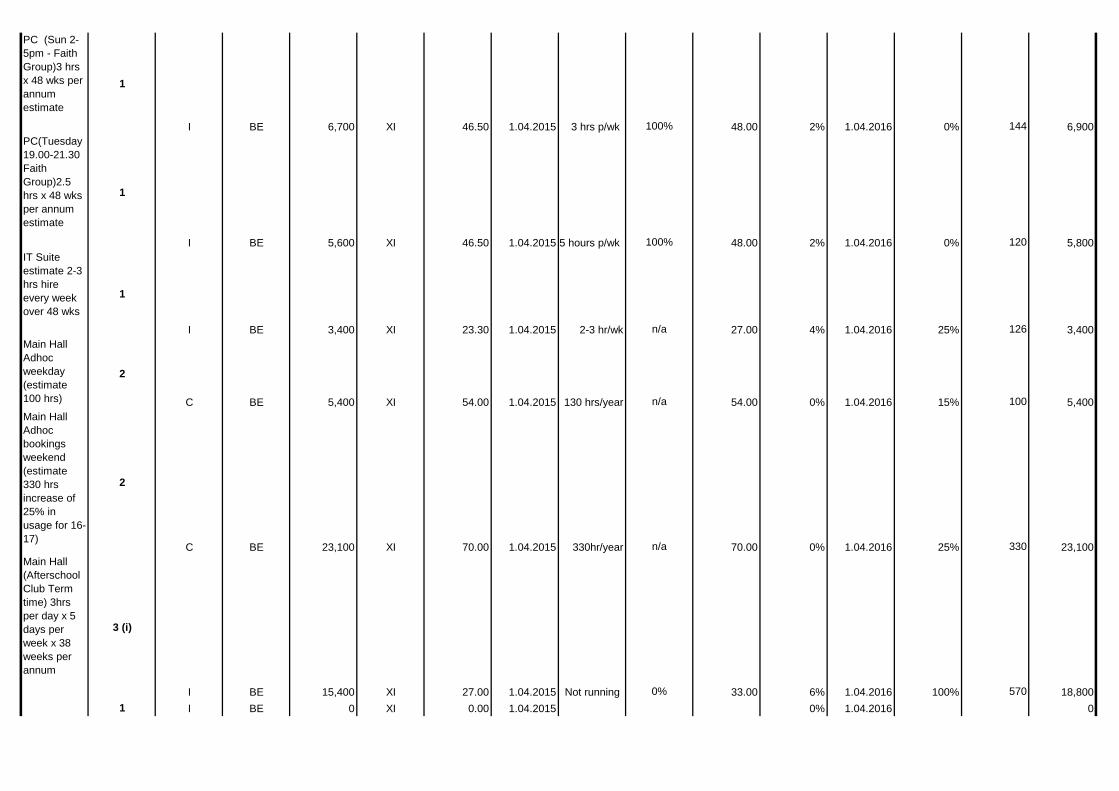
PC (Sun 2-5pm - Faith Group)3 hrs x 48 wks per annum estimate
1
I BE 6,700 XI 46.50 1.04.2015 3 hrs p/wk 100% 48.00 2% 1.04.2016 0% 144 6,900PC(Tuesday 19.00-21.30 Faith Group)2.5 hrs x 48 wks per annum estimate
1
I BE 5,600 XI 46.50 1.04.2015 5 hours p/wk 100% 48.00 2% 1.04.2016 0% 120 5,800IT Suite estimate 2-3 hrs hire every week over 48 wks
1
I BE 3,400 XI 23.30 1.04.2015 2-3 hr/wk n/a 27.00 4% 1.04.2016 25% 126 3,400Main Hall Adhoc weekday (estimate 100 hrs)
2
C BE 5,400 XI 54.00 1.04.2015 130 hrs/year n/a 54.00 0% 1.04.2016 15% 100 5,400Main Hall Adhoc bookings weekend (estimate 330 hrs increase of 25% in usage for 16-17)
2
C BE 23,100 XI 70.00 1.04.2015 330hr/year n/a 70.00 0% 1.04.2016 25% 330 23,100Main Hall (Afterschool Club Term time) 3hrs per day x 5 days per week x 38 weeks per annum
3 (i)
I BE 15,400 XI 27.00 1.04.2015 Not running 0% 33.00 6% 1.04.2016 100% 570 18,8001 I BE 0 XI 0.00 1.04.2015 0% 1.04.2016 0
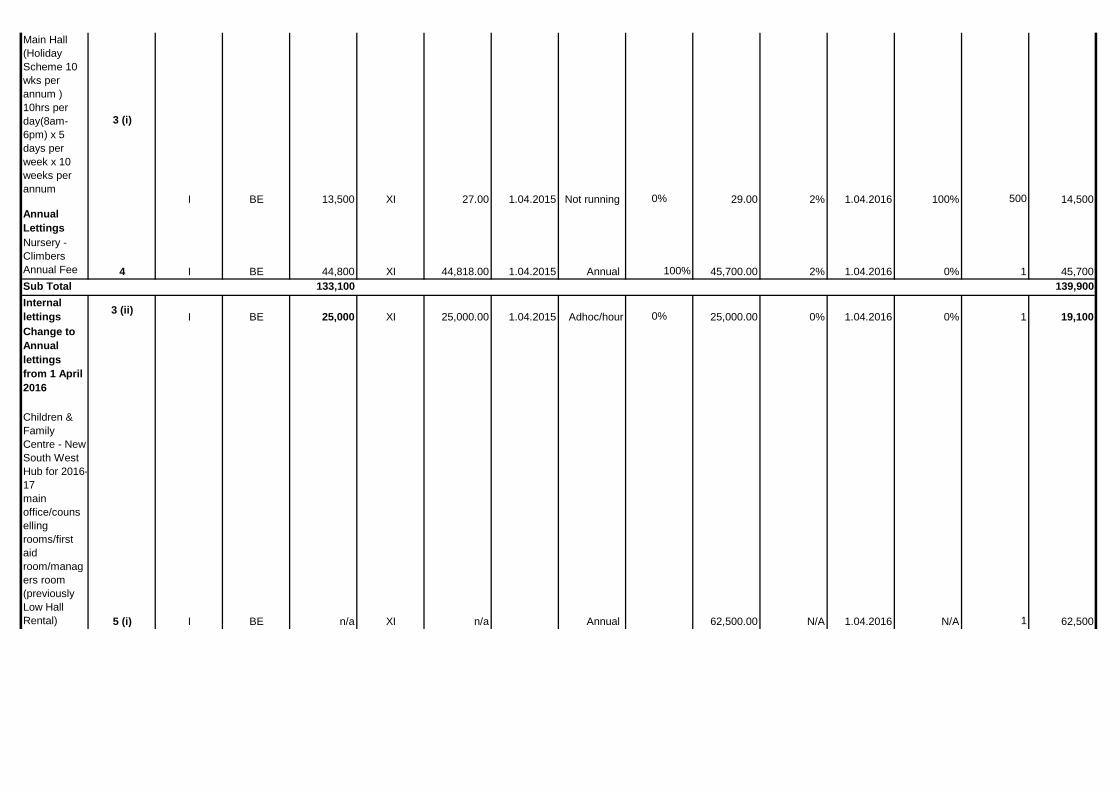
Main Hall (Holiday Scheme 10 wks per annum ) 10hrs per day(8am-6pm) x 5 days per week x 10 weeks per annum
3 (i)
I BE 13,500 XI 27.00 1.04.2015 Not running 0% 29.00 2% 1.04.2016 100% 500 14,500Annual LettingsNursery - Climbers Annual Fee 4 I BE 44,800 XI 44,818.00 1.04.2015 Annual 100% 45,700.00 2% 1.04.2016 0% 1 45,700Sub Total 133,100 139,900Internal lettings 3 (ii) I BE 25,000 XI 25,000.00 1.04.2015 Adhoc/hour 0% 25,000.00 0% 1.04.2016 0% 1 19,100Change to Annual lettings from 1 April 2016
Children & Family Centre - New South West Hub for 2016-17main office/counselling rooms/first aid room/managers room (previously Low Hall Rental) 5 (i) I BE n/a XI n/a Annual 62,500.00 N/A 1.04.2016 N/A 1 62,500
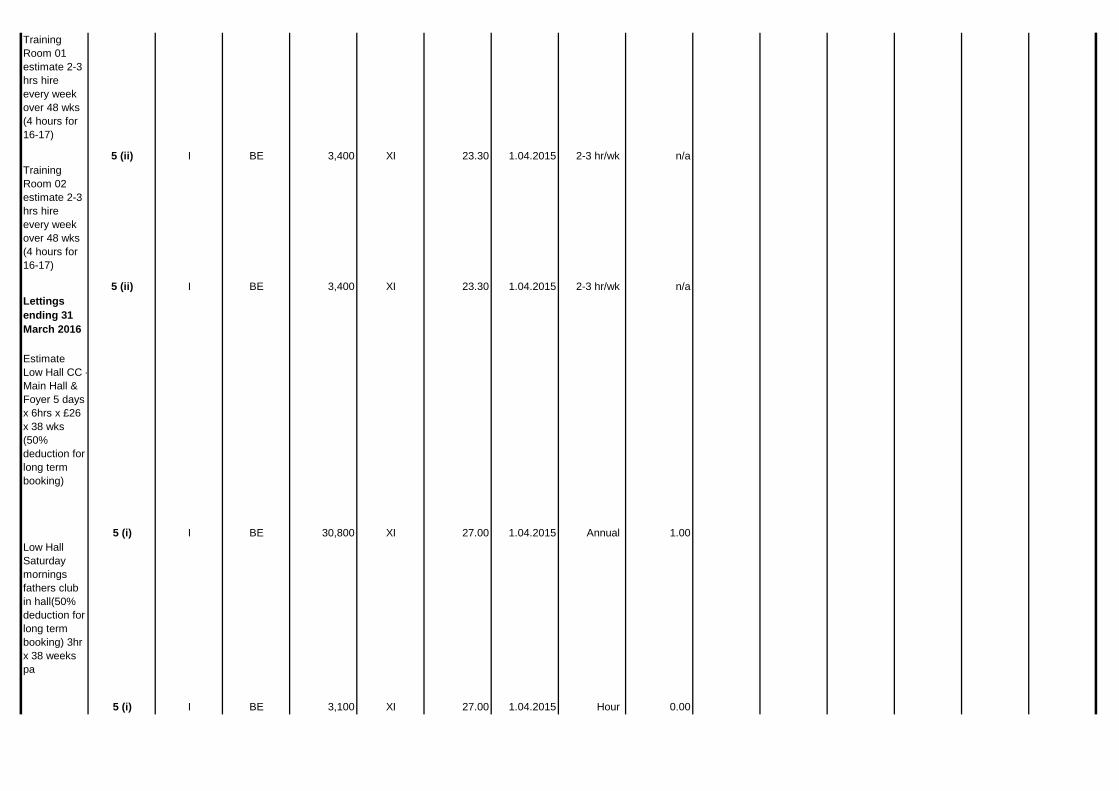
Training Room 01 estimate 2-3 hrs hire every week over 48 wks (4 hours for 16-17)
5 (ii) I BE 3,400 XI 23.30 1.04.2015 2-3 hr/wk n/aTraining Room 02 estimate 2-3 hrs hire every week over 48 wks (4 hours for 16-17)
5 (ii) I BE 3,400 XI 23.30 1.04.2015 2-3 hr/wk n/aLettings ending 31 March 2016
Estimate Low Hall CC - Main Hall & Foyer 5 days x 6hrs x £26 x 38 wks (50% deduction for long term booking)
5 (i) I BE 30,800 XI 27.00 1.04.2015 Annual 1.00Low Hall Saturday mornings fathers club in hall(50% deduction for long term booking) 3hr x 38 weeks pa
5 (i) I BE 3,100 XI 27.00 1.04.2015 Hour 0.00
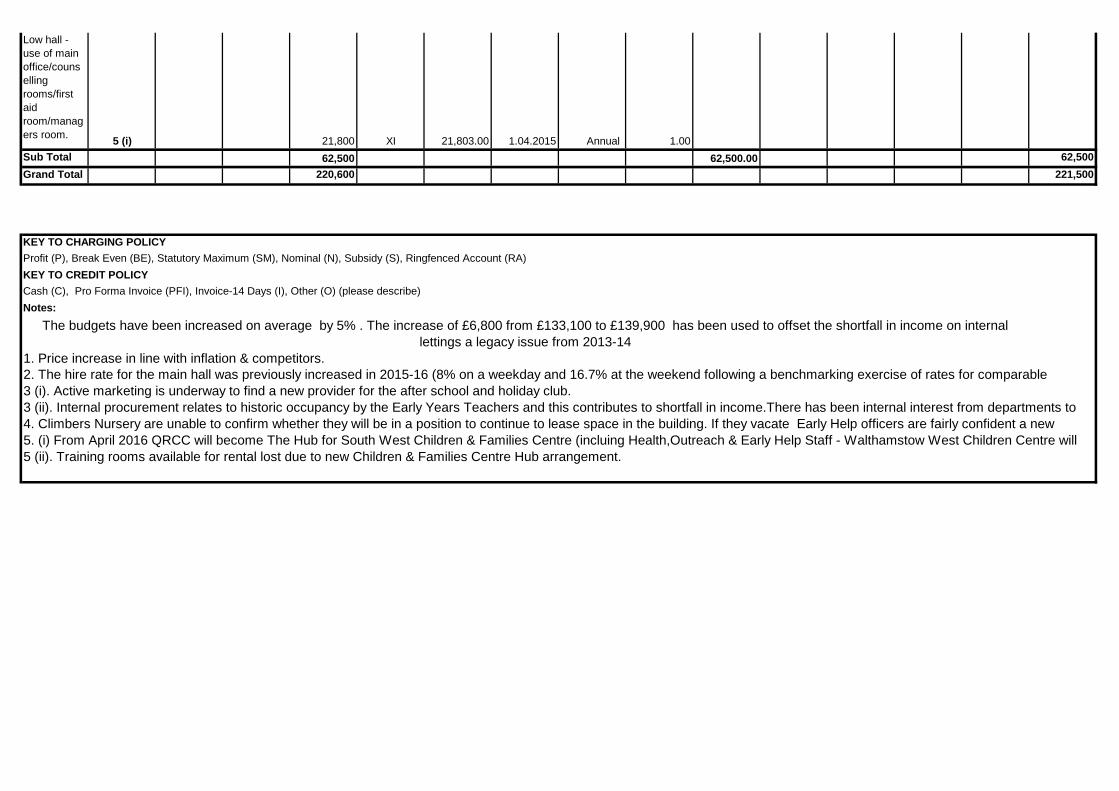
Low hall - use of main office/counselling rooms/first aid room/managers room. 5 (i) 21,800 XI 21,803.00 1.04.2015 Annual 1.00Sub Total 62,500 62,500.00 62,500Grand Total 220,600 221,500
KEY TO CHARGING POLICYProfit (P), Break Even (BE), Statutory Maximum (SM), Nominal (N), Subsidy (S), Ringfenced Account (RA)KEY TO CREDIT POLICYCash (C), Pro Forma Invoice (PFI), Invoice-14 Days (I), Other (O) (please describe)Notes:
The budgets have been increased on average by 5% . The increase of £6,800 from £133,100 to £139,900 has been used to offset the shortfall in income on internal lettings a legacy issue from 2013-14
1. Price increase in line with inflation & competitors.
3 (i). Active marketing is underway to find a new provider for the after school and holiday club.2. The hire rate for the main hall was previously increased in 2015-16 (8% on a weekday and 16.7% at the weekend following a benchmarking exercise of rates for comparable
3 (ii). Internal procurement relates to historic occupancy by the Early Years Teachers and this contributes to shortfall in income.There has been internal interest from departments to 4. Climbers Nursery are unable to confirm whether they will be in a position to continue to lease space in the building. If they vacate Early Help officers are fairly confident a new 5. (i) From April 2016 QRCC will become The Hub for South West Children & Families Centre (incluing Health,Outreach & Early Help Staff - Walthamstow West Children Centre will 5 (ii). Training rooms available for rental lost due to new Children & Families Centre Hub arrangement.
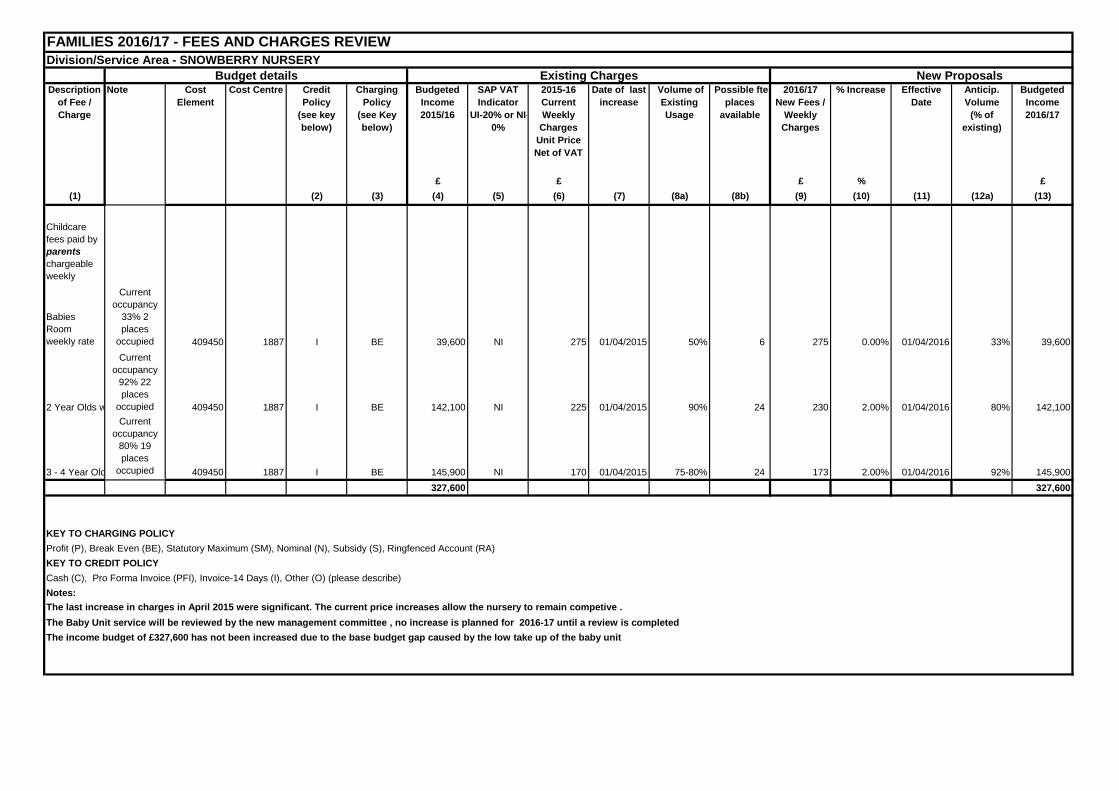
FAMILIES 2016/17 - FEES AND CHARGES REVIEWDivision/Service Area - SNOWBERRY NURSERY
Description of Fee / Charge
Note Cost Element
Cost Centre Credit Policy
(see key below)
Charging Policy
(see Key below)
Budgeted Income 2015/16
SAP VAT Indicator
UI-20% or NI-0%
2015-16 Current Weekly
Charges Unit Price Net of VAT
Date of last increase
Volume of Existing Usage
Possible fte places
available
2016/17 New Fees /
Weekly Charges
% Increase Effective Date
Anticip. Volume
(% of existing)
Budgeted Income 2016/17
£ £ £ % £(1) (2) (3) (4) (5) (6) (7) (8a) (8b) (9) (10) (11) (12a) (13)
Childcare fees paid by parents chargeable weekly
Babies Room weekly rate
Current occupancy
33% 2 places
occupied 409450 1887 I BE 39,600 NI 275 01/04/2015 50% 6 275 0.00% 01/04/2016 33% 39,600
2 Year Olds w
Current occupancy
92% 22 places
occupied 409450 1887 I BE 142,100 NI 225 01/04/2015 90% 24 230 2.00% 01/04/2016 80% 142,100
3 - 4 Year Old
Current occupancy
80% 19 places
occupied 409450 1887 I BE 145,900 NI 170 01/04/2015 75-80% 24 173 2.00% 01/04/2016 92% 145,900327,600 327,600
KEY TO CHARGING POLICYProfit (P), Break Even (BE), Statutory Maximum (SM), Nominal (N), Subsidy (S), Ringfenced Account (RA)KEY TO CREDIT POLICYCash (C), Pro Forma Invoice (PFI), Invoice-14 Days (I), Other (O) (please describe)Notes:The last increase in charges in April 2015 were significant. The current price increases allow the nursery to remain competive .The Baby Unit service will be reviewed by the new management committee , no increase is planned for 2016-17 until a review is completedThe income budget of £327,600 has not been increased due to the base budget gap caused by the low take up of the baby unit
Budget details Existing Charges New Proposals
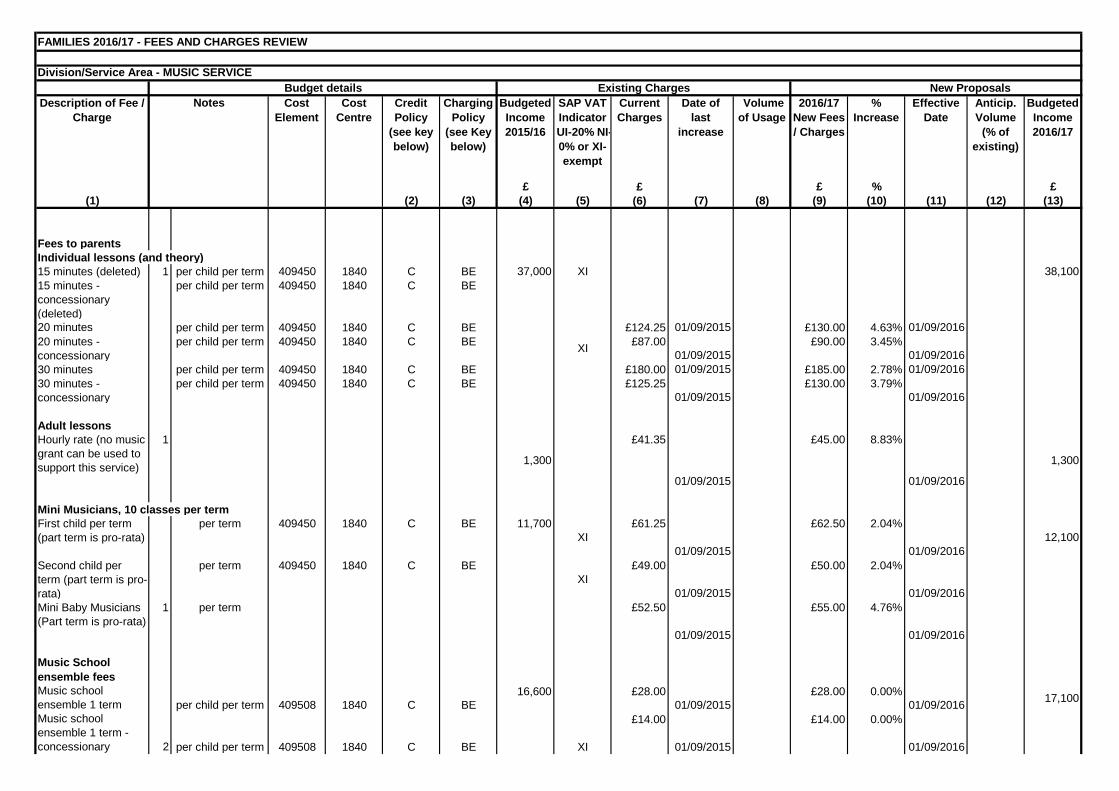
FAMILIES 2016/17 - FEES AND CHARGES REVIEW
Division/Service Area - MUSIC SERVICE New Proposals
Description of Fee / Charge
Cost Element
Cost Centre
Credit Policy
(see key below)
Charging Policy
(see Key below)
Budgeted Income 2015/16
SAP VAT Indicator UI-20% NI-0% or XI-exempt
Current Charges
Date of last
increase
Volume of Usage
2016/17 New Fees / Charges
% Increase
Effective Date
Anticip. Volume
(% of existing)
Budgeted Income 2016/17
£ £ £ % £(1) (2) (3) (4) (5) (6) (7) (8) (9) (10) (11) (12) (13)
Fees to parentsIndividual lessons (and theory)15 minutes (deleted) 1 per child per term 409450 1840 C BE 37,000 XI 38,10015 minutes - concessionary (deleted)
per child per term 409450 1840 C BE
20 minutes per child per term 409450 1840 C BE £124.25 01/09/2015 £130.00 4.63% 01/09/201620 minutes - concessionary
per child per term 409450 1840 C BE XI £87.0001/09/2015
£90.00 3.45%01/09/2016
30 minutes per child per term 409450 1840 C BE £180.00 01/09/2015 £185.00 2.78% 01/09/201630 minutes - concessionary
per child per term 409450 1840 C BE £125.2501/09/2015
£130.00 3.79%01/09/2016
Adult lessons Hourly rate (no music grant can be used to support this service)
1
1,300
£41.35
01/09/2015
£45.00 8.83%
01/09/2016
1,300
Mini Musicians, 10 classes per termFirst child per term (part term is pro-rata)
per term 409450 1840 C BE 11,700XI
£61.25
01/09/2015
£62.50 2.04%
01/09/201612,100
Second child per term (part term is pro-rata)
per term 409450 1840 C BEXI
£49.00
01/09/2015
£50.00 2.04%
01/09/2016Mini Baby Musicians (Part term is pro-rata)
1 per term £52.50
01/09/2015
£55.00 4.76%
01/09/2016
Music School ensemble feesMusic school ensemble 1 term per child per term 409508 1840 C BE
16,600 £28.0001/09/2015
£28.00 0.00%01/09/2016 17,100
Music school ensemble 1 term - concessionary 2 per child per term 409508 1840 C BE XI
£14.00
01/09/2015
£14.00 0.00%
01/09/2016
Budget details Existing ChargesNotes
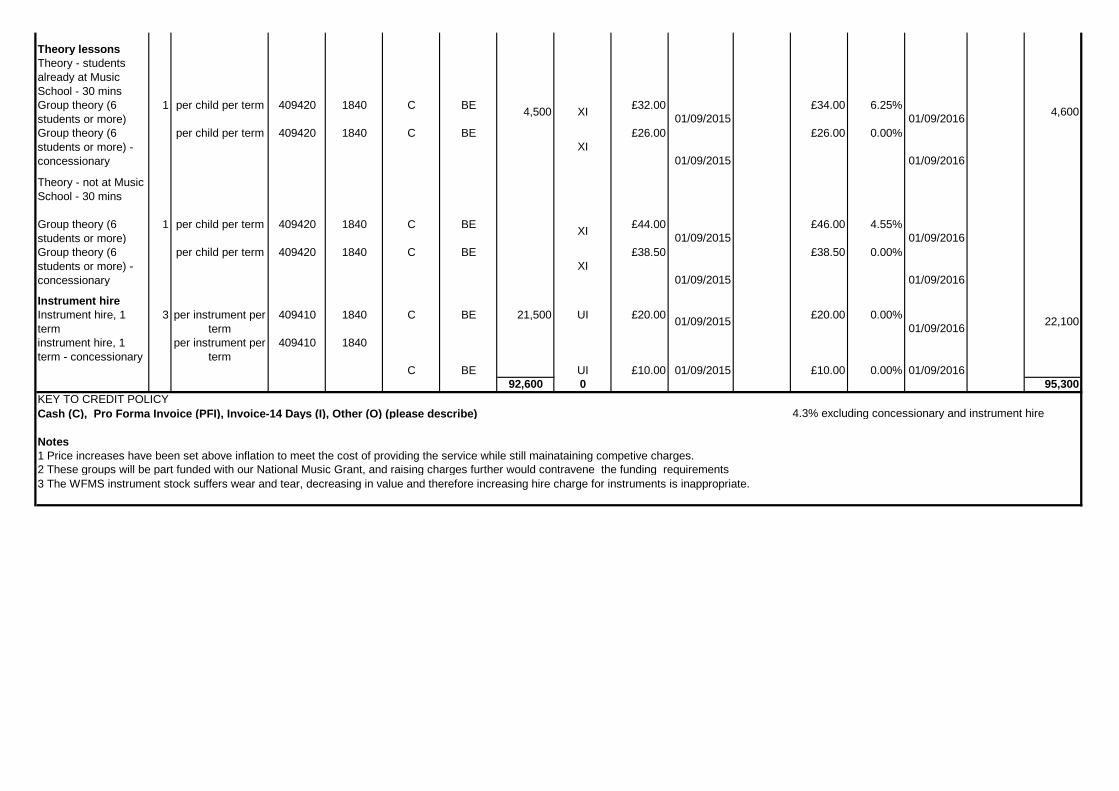
Theory lessonsTheory - students already at Music School - 30 minsGroup theory (6 students or more)
1 per child per term 409420 1840 C BE 4,500 XI £32.0001/09/2015
£34.00 6.25%01/09/2016 4,600
Group theory (6 students or more) - concessionary
per child per term 409420 1840 C BEXI
£26.00
01/09/2015
£26.00 0.00%
01/09/2016
Theory - not at Music School - 30 mins
Group theory (6 students or more)
1 per child per term 409420 1840 C BE XI £44.0001/09/2015
£46.00 4.55%01/09/2016
Group theory (6 students or more) - concessionary
per child per term 409420 1840 C BEXI
£38.50
01/09/2015
£38.50 0.00%
01/09/2016
Instrument hireInstrument hire, 1 term
3 per instrument per term
409410 1840 C BE 21,500 UI £20.00 01/09/2015 £20.00 0.00%01/09/2016 22,100
instrument hire, 1 term - concessionary
per instrument per term
409410 1840
C BE UI £10.00 01/09/2015 £10.00 0.00% 01/09/201692,600 0 95,300
KEY TO CREDIT POLICYCash (C), Pro Forma Invoice (PFI), Invoice-14 Days (I), Other (O) (please describe) 4.3% excluding concessionary and instrument hire
Notes1 Price increases have been set above inflation to meet the cost of providing the service while still mainataining competive charges.2 These groups will be part funded with our National Music Grant, and raising charges further would contravene the funding requirements 3 The WFMS instrument stock suffers wear and tear, decreasing in value and therefore increasing hire charge for instruments is inappropriate.
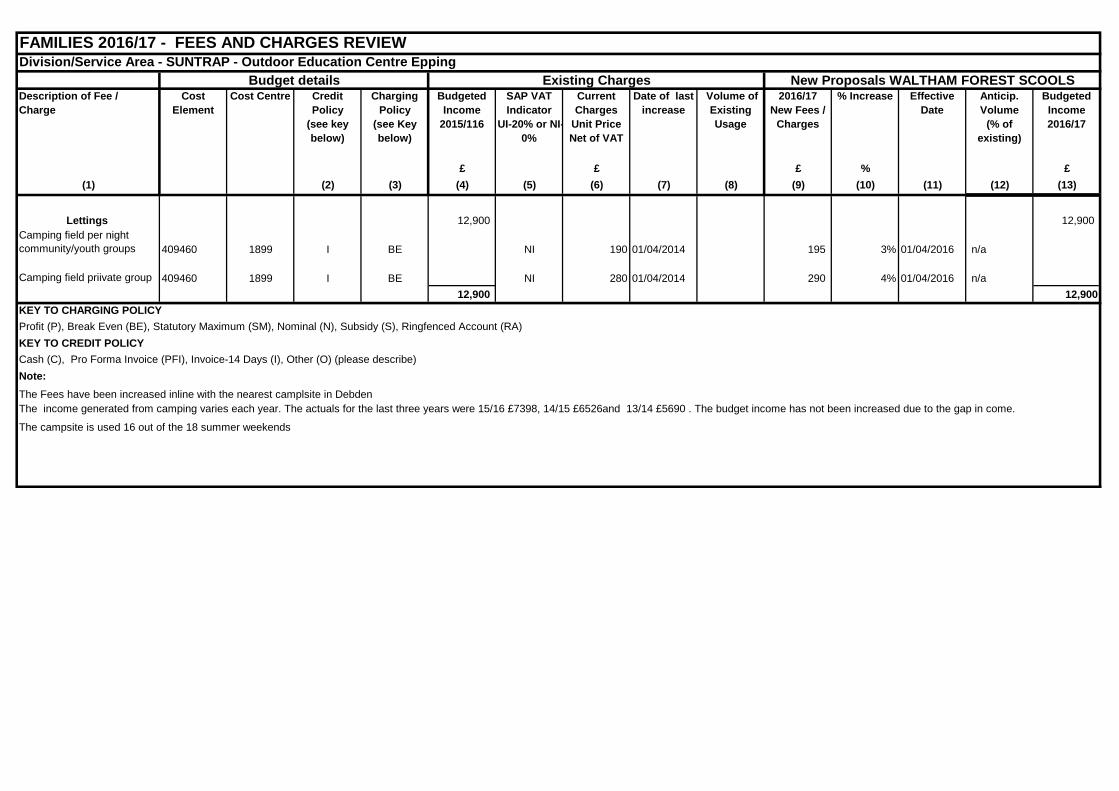
FAMILIES 2016/17 - FEES AND CHARGES REVIEWDivision/Service Area - SUNTRAP - Outdoor Education Centre Epping
Description of Fee / Charge
Cost Element
Cost Centre Credit Policy
(see key below)
Charging Policy
(see Key below)
Budgeted Income
2015/116
SAP VAT Indicator
UI-20% or NI-0%
Current Charges
Unit Price Net of VAT
Date of last increase
Volume of Existing Usage
2016/17 New Fees /
Charges
% Increase Effective Date
Anticip. Volume
(% of existing)
Budgeted Income 2016/17
£ £ £ % £(1) (2) (3) (4) (5) (6) (7) (8) (9) (10) (11) (12) (13)
Lettings 12,900 12,900 Camping field per night community/youth groups 409460 1899 I BE NI 190 01/04/2014 195 3% 01/04/2016 n/a
Camping field priivate group 409460 1899 I BE NI 280 01/04/2014 290 4% 01/04/2016 n/a12,900 12,900
KEY TO CHARGING POLICYProfit (P), Break Even (BE), Statutory Maximum (SM), Nominal (N), Subsidy (S), Ringfenced Account (RA)KEY TO CREDIT POLICYCash (C), Pro Forma Invoice (PFI), Invoice-14 Days (I), Other (O) (please describe)Note:The Fees have been increased inline with the nearest camplsite in DebdenThe income generated from camping varies each year. The actuals for the last three years were 15/16 £7398, 14/15 £6526and 13/14 £5690 . The budget income has not been increased due to the gap in come.
The campsite is used 16 out of the 18 summer weekends
Budget details Existing Charges New Proposals WALTHAM FOREST SCOOLS
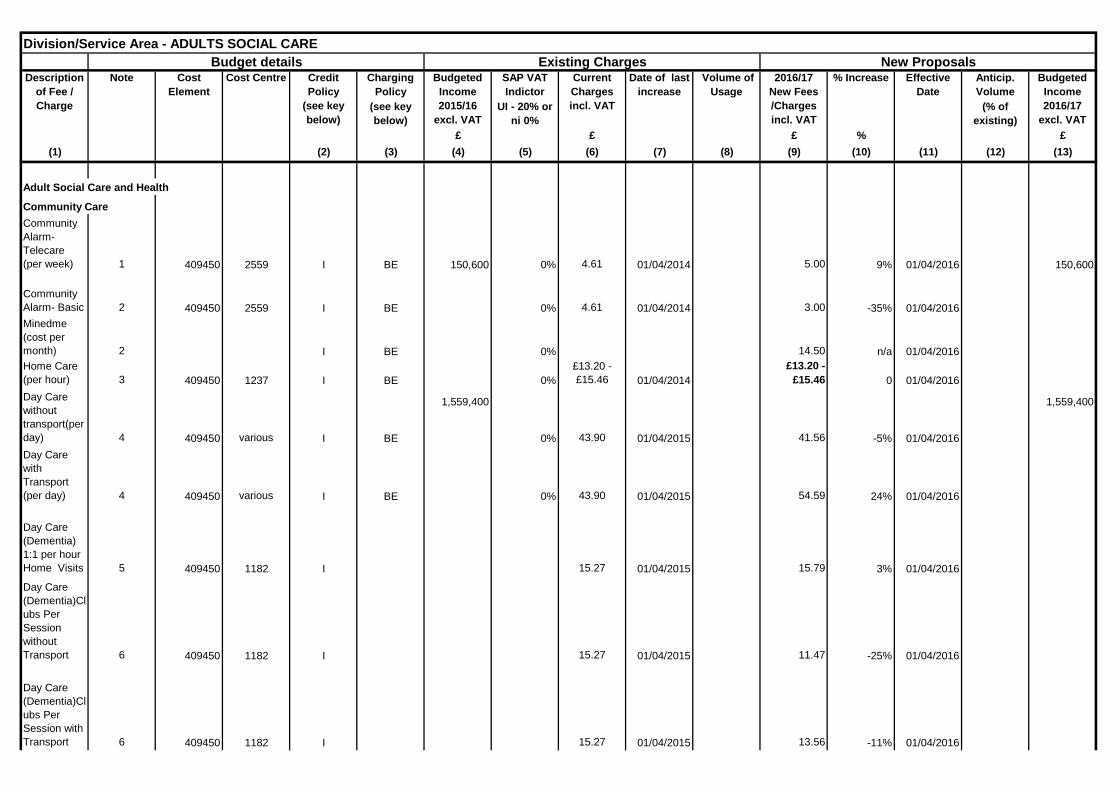
Division/Service Area - ADULTS SOCIAL CARE
Charging Policy
SAP VAT Indictor
Anticip. Volume
(see key below)
UI - 20% or ni 0%
(% of existing)
£ £ £ % £(1) (2) (3) (4) (5) (6) (7) (8) (9) (10) (11) (12) (13)
Adult Social Care and Health
Community CareCommunity Alarm- Telecare (per week) 1 409450 2559 I BE 150,600 0% 4.61 01/04/2014 5.00 9% 01/04/2016 150,600
Community Alarm- Basic 2 409450 2559 I BE 0% 4.61 01/04/2014 3.00 -35% 01/04/2016Minedme (cost per month) 2 I BE 0% 14.50 n/a 01/04/2016Home Care (per hour) 3 409450 1237 I BE 0%
£13.20 - £15.46 01/04/2014
£13.20 - £15.46 0 01/04/2016
Day Care without transport(per day) 4 409450 various I BE 0% 43.90 01/04/2015 41.56 -5% 01/04/2016Day Care with Transport (per day) 4 409450 various I BE 0% 43.90 01/04/2015 54.59 24% 01/04/2016
Day Care (Dementia) 1:1 per hour Home Visits 5 409450 1182 I 15.27 01/04/2015 15.79 3% 01/04/2016
Day Care (Dementia)Clubs Per Session without Transport 6 409450 1182 I 15.27 01/04/2015 11.47 -25% 01/04/2016
Day Care (Dementia)Clubs Per Session with Transport 6 409450 1182 I 15.27 01/04/2015 13.56 -11% 01/04/2016
Budget details Existing Charges New ProposalsDescription
of Fee / Charge
Note Cost Element
Cost Centre Credit Policy
(see key below)
Budgeted Income 2015/16
excl. VAT
Current Charges incl. VAT
Date of last increase
Volume of Usage
2016/17 New Fees /Charges incl. VAT
% Increase Effective Date
Budgeted Income 2016/17
excl. VAT
1,559,400 1,559,400
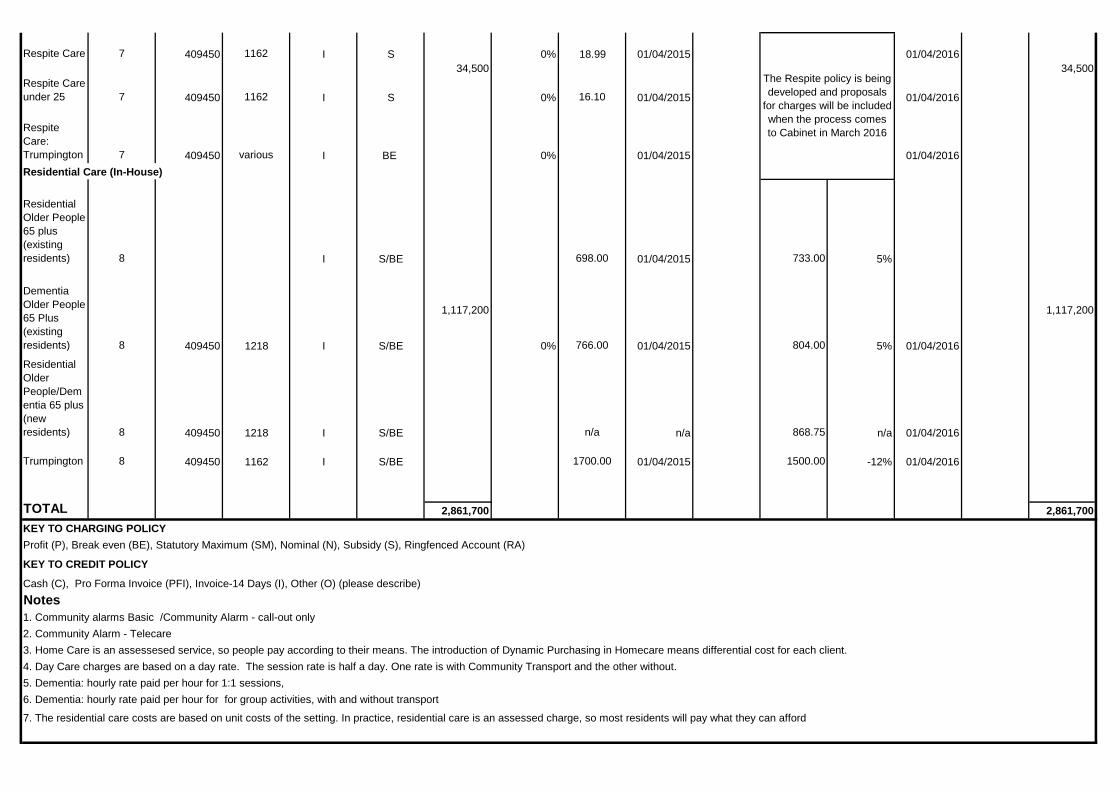
Respite Care 7 409450 1162 I S 0% 18.99 01/04/2015 01/04/2016
Respite Care under 25 7 409450 1162 I S 0% 16.10 01/04/2015 01/04/2016
Respite Care: Trumpington 7 409450 various I BE 0% 01/04/2015 01/04/2016Residential Care (In-House)
Residential Older People 65 plus (existing residents) 8 I S/BE 698.00 01/04/2015 733.00 5%
Dementia Older People 65 Plus (existing residents) 8 409450 1218 I S/BE
1,117,200
0% 766.00 01/04/2015 804.00 5% 01/04/2016
1,117,200
Residential Older People/Dementia 65 plus (new residents) 8 409450 1218 I S/BE n/a n/a 868.75 n/a 01/04/2016
Trumpington 8 409450 1162 I S/BE 1700.00 01/04/2015 1500.00 -12% 01/04/2016
TOTAL 2,861,700 2,861,700KEY TO CHARGING POLICYProfit (P), Break even (BE), Statutory Maximum (SM), Nominal (N), Subsidy (S), Ringfenced Account (RA)
Notes1. Community alarms Basic /Community Alarm - call-out only2. Community Alarm - Telecare3. Home Care is an assessesed service, so people pay according to their means. The introduction of Dynamic Purchasing in Homecare means differential cost for each client.4. Day Care charges are based on a day rate. The session rate is half a day. One rate is with Community Transport and the other without.5. Dementia: hourly rate paid per hour for 1:1 sessions, 6. Dementia: hourly rate paid per hour for for group activities, with and without transport
7. The residential care costs are based on unit costs of the setting. In practice, residential care is an assessed charge, so most residents will pay what they can afford
Cash (C), Pro Forma Invoice (PFI), Invoice-14 Days (I), Other (O) (please describe)
34,500The Respite policy is being developed and proposals
for charges will be included when the process comes to Cabinet in March 2016
34,500
KEY TO CREDIT POLICY
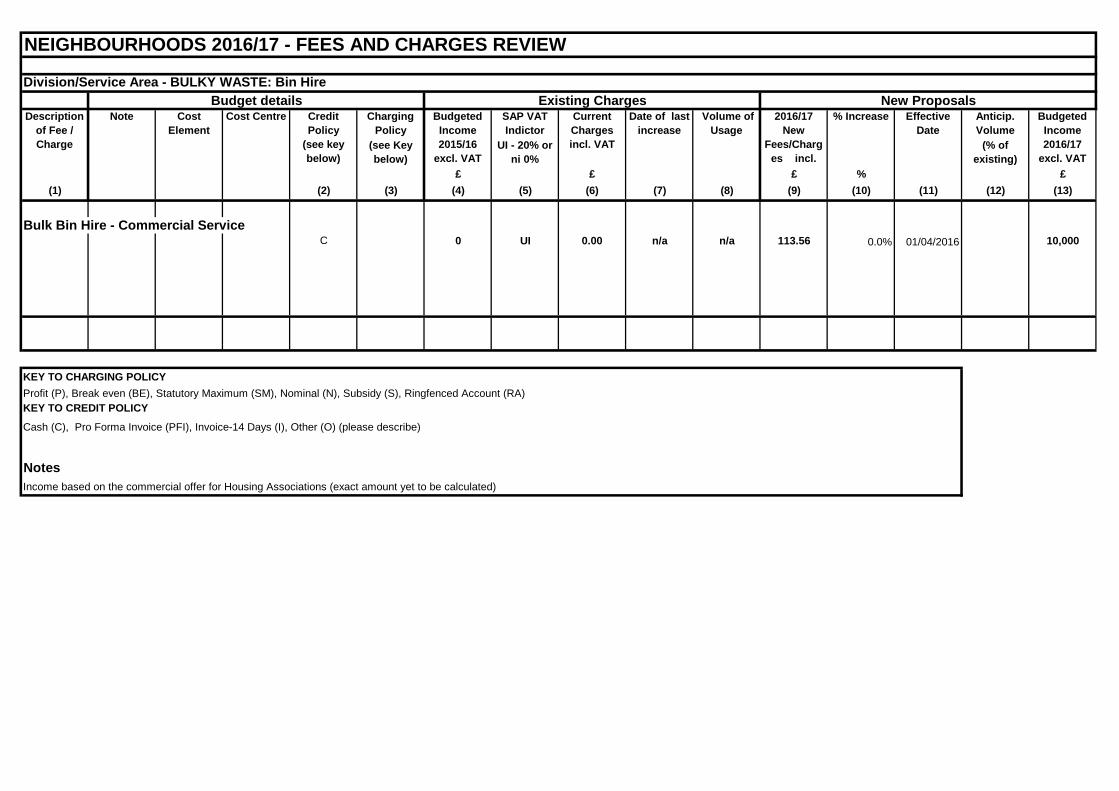
NEIGHBOURHOODS 2016/17 - FEES AND CHARGES REVIEW Division/Service Area - BULKY WASTE: Bin Hire
Charging Policy
SAP VAT Indictor
Anticip. Volume
(see Key below)
UI - 20% or ni 0%
(% of existing)
£ £ £ % £(1) (2) (3) (4) (5) (6) (7) (8) (9) (10) (11) (12) (13)
Bulk Bin Hire - Commercial ServiceC 0 UI 0.00 n/a n/a 113.56 0.0% 01/04/2016 10,000
KEY TO CHARGING POLICYProfit (P), Break even (BE), Statutory Maximum (SM), Nominal (N), Subsidy (S), Ringfenced Account (RA)
NotesIncome based on the commercial offer for Housing Associations (exact amount yet to be calculated)
Effective Date
Budgeted Income 2016/17
excl. VAT
Budget details Existing Charges New ProposalsDescription
of Fee / Charge
Note Cost Element
Cost Centre Credit Policy
(see key below)
KEY TO CREDIT POLICY
Cash (C), Pro Forma Invoice (PFI), Invoice-14 Days (I), Other (O) (please describe)
Date of last increase
Volume of Usage
2016/17 New
Fees/Charges incl.
% IncreaseBudgeted Income 2015/16
excl. VAT
Current Charges incl. VAT
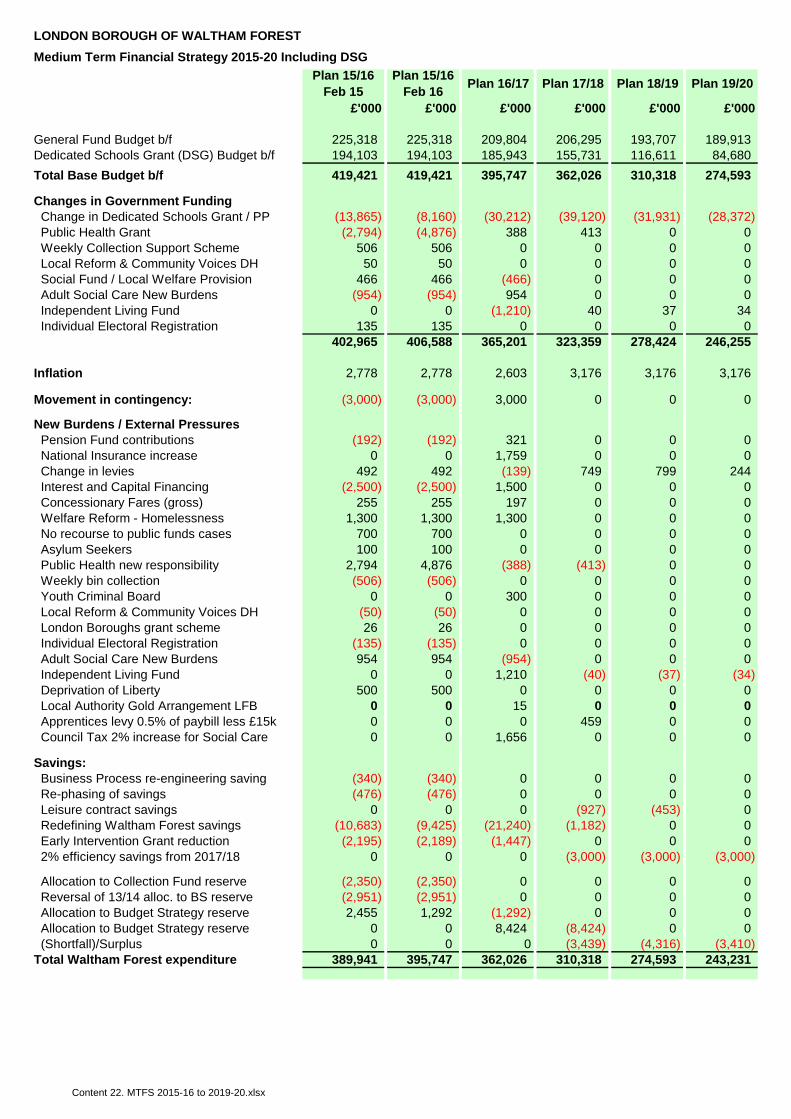
Content 22. MTFS 2015-16 to 2019-20.xlsx
LONDON BOROUGH OF WALTHAM FORESTMedium Term Financial Strategy 2015-20 Including DSG
Plan 15/16 Feb 15
Plan 15/16 Feb 16 Plan 16/17 Plan 17/18 Plan 18/19 Plan 19/20
£'000 £'000 £'000 £'000 £'000 £'000
General Fund Budget b/f 225,318 225,318 209,804 206,295 193,707 189,913Dedicated Schools Grant (DSG) Budget b/f 194,103 194,103 185,943 155,731 116,611 84,680Total Base Budget b/f 419,421 419,421 395,747 362,026 310,318 274,593
Changes in Government Funding Change in Dedicated Schools Grant / PP (13,865) (8,160) (30,212) (39,120) (31,931) (28,372) Public Health Grant (2,794) (4,876) 388 413 0 0 Weekly Collection Support Scheme 506 506 0 0 0 0 Local Reform & Community Voices DH 50 50 0 0 0 0 Social Fund / Local Welfare Provision 466 466 (466) 0 0 0 Adult Social Care New Burdens (954) (954) 954 0 0 0 Independent Living Fund 0 0 (1,210) 40 37 34 Individual Electoral Registration 135 135 0 0 0 0
402,965 406,588 365,201 323,359 278,424 246,255
Inflation 2,778 2,778 2,603 3,176 3,176 3,176
Movement in contingency: (3,000) (3,000) 3,000 0 0 0
New Burdens / External Pressures Pension Fund contributions (192) (192) 321 0 0 0 National Insurance increase 0 0 1,759 0 0 0 Change in levies 492 492 (139) 749 799 244 Interest and Capital Financing (2,500) (2,500) 1,500 0 0 0 Concessionary Fares (gross) 255 255 197 0 0 0 Welfare Reform - Homelessness 1,300 1,300 1,300 0 0 0 No recourse to public funds cases 700 700 0 0 0 0 Asylum Seekers 100 100 0 0 0 0 Public Health new responsibility 2,794 4,876 (388) (413) 0 0 Weekly bin collection (506) (506) 0 0 0 0 Youth Criminal Board 0 0 300 0 0 0 Local Reform & Community Voices DH (50) (50) 0 0 0 0 London Boroughs grant scheme 26 26 0 0 0 0 Individual Electoral Registration (135) (135) 0 0 0 0 Adult Social Care New Burdens 954 954 (954) 0 0 0 Independent Living Fund 0 0 1,210 (40) (37) (34) Deprivation of Liberty 500 500 0 0 0 0 Local Authority Gold Arrangement LFB 0 0 15 0 0 0 Apprentices levy 0.5% of paybill less £15k 0 0 0 459 0 0 Council Tax 2% increase for Social Care 0 0 1,656 0 0 0
Savings: Business Process re-engineering saving (340) (340) 0 0 0 0 Re-phasing of savings (476) (476) 0 0 0 0 Leisure contract savings 0 0 0 (927) (453) 0 Redefining Waltham Forest savings (10,683) (9,425) (21,240) (1,182) 0 0 Early Intervention Grant reduction (2,195) (2,189) (1,447) 0 0 0 2% efficiency savings from 2017/18 0 0 0 (3,000) (3,000) (3,000)
Allocation to Collection Fund reserve (2,350) (2,350) 0 0 0 0 Reversal of 13/14 alloc. to BS reserve (2,951) (2,951) 0 0 0 0 Allocation to Budget Strategy reserve 2,455 1,292 (1,292) 0 0 0 Allocation to Budget Strategy reserve 0 0 8,424 (8,424) 0 0 (Shortfall)/Surplus 0 0 0 (3,439) (4,316) (3,410)Total Waltham Forest expenditure 389,941 395,747 362,026 310,318 274,593 243,231
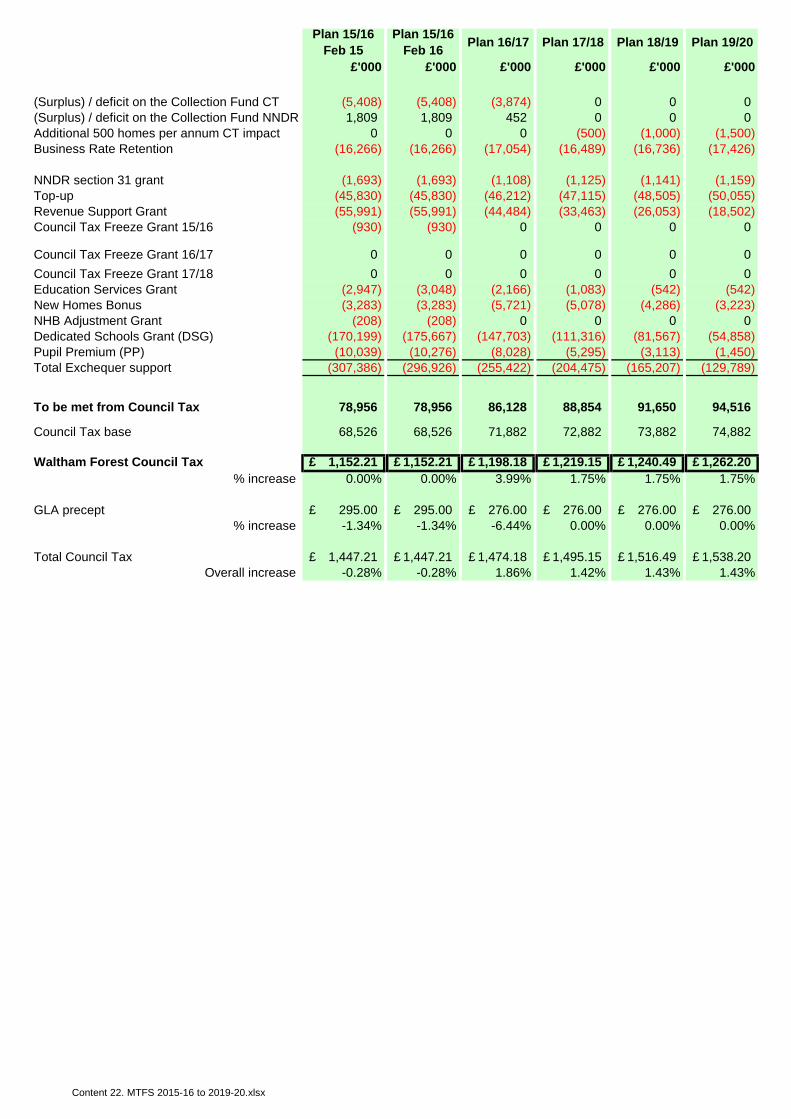
Content 22. MTFS 2015-16 to 2019-20.xlsx
Plan 15/16 Feb 15
Plan 15/16 Feb 16 Plan 16/17 Plan 17/18 Plan 18/19 Plan 19/20
£'000 £'000 £'000 £'000 £'000 £'000
(Surplus) / deficit on the Collection Fund CT (5,408) (5,408) (3,874) 0 0 0(Surplus) / deficit on the Collection Fund NNDR 1,809 1,809 452 0 0 0Additional 500 homes per annum CT impact 0 0 0 (500) (1,000) (1,500)Business Rate Retention (16,266) (16,266) (17,054) (16,489) (16,736) (17,426)
NNDR section 31 grant (1,693) (1,693) (1,108) (1,125) (1,141) (1,159)Top-up (45,830) (45,830) (46,212) (47,115) (48,505) (50,055)Revenue Support Grant (55,991) (55,991) (44,484) (33,463) (26,053) (18,502)Council Tax Freeze Grant 15/16 (930) (930) 0 0 0 0
Council Tax Freeze Grant 16/17 0 0 0 0 0 0Council Tax Freeze Grant 17/18 0 0 0 0 0 0Education Services Grant (2,947) (3,048) (2,166) (1,083) (542) (542)New Homes Bonus (3,283) (3,283) (5,721) (5,078) (4,286) (3,223)NHB Adjustment Grant (208) (208) 0 0 0 0Dedicated Schools Grant (DSG) (170,199) (175,667) (147,703) (111,316) (81,567) (54,858)Pupil Premium (PP) (10,039) (10,276) (8,028) (5,295) (3,113) (1,450)Total Exchequer support (307,386) (296,926) (255,422) (204,475) (165,207) (129,789)
To be met from Council Tax 78,956 78,956 86,128 88,854 91,650 94,516
Council Tax base 68,526 68,526 71,882 72,882 73,882 74,882
Waltham Forest Council Tax 1,152.21£ 1,152.21£ 1,198.18£ 1,219.15£ 1,240.49£ 1,262.20£ % increase 0.00% 0.00% 3.99% 1.75% 1.75% 1.75%
GLA precept 295.00£ 295.00£ 276.00£ 276.00£ 276.00£ 276.00£ % increase -1.34% -1.34% -6.44% 0.00% 0.00% 0.00%
Total Council Tax 1,447.21£ 1,447.21£ 1,474.18£ 1,495.15£ 1,516.49£ 1,538.20£ Overall increase -0.28% -0.28% 1.86% 1.42% 1.43% 1.43%
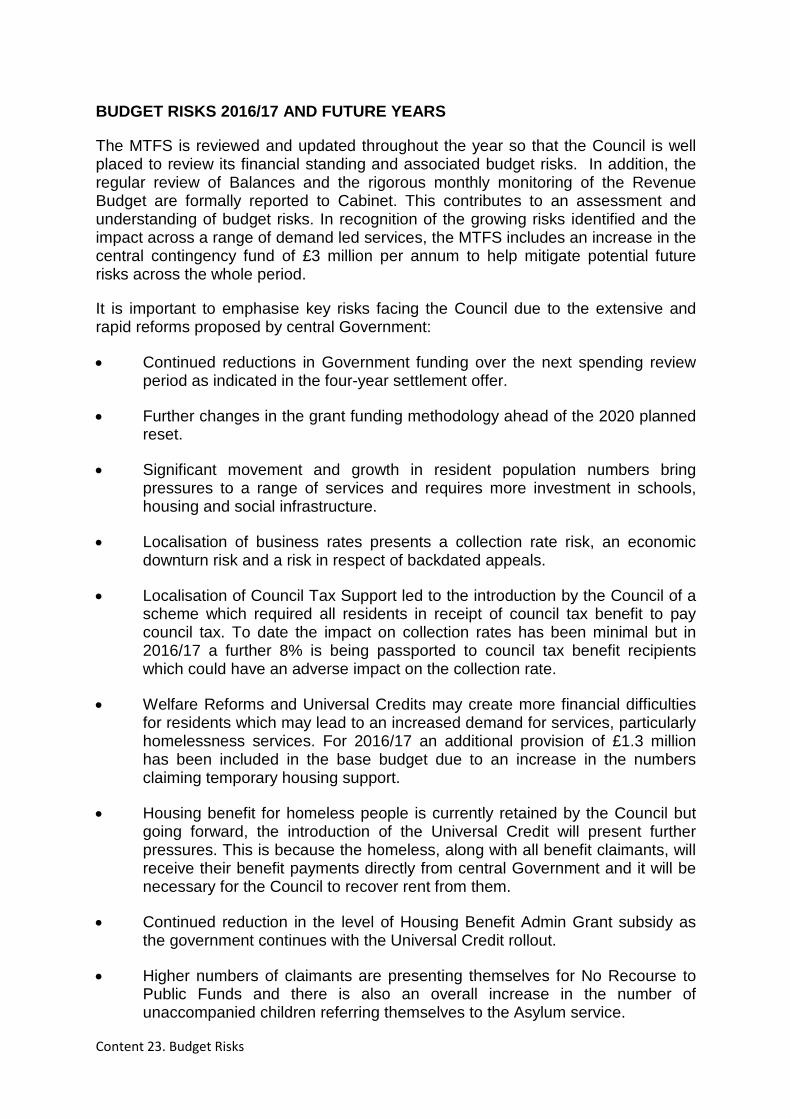
Content 23. Budget Risks
BUDGET RISKS 2016/17 AND FUTURE YEARS
The MTFS is reviewed and updated throughout the year so that the Council is well placed to review its financial standing and associated budget risks. In addition, the regular review of Balances and the rigorous monthly monitoring of the Revenue Budget are formally reported to Cabinet. This contributes to an assessment and understanding of budget risks. In recognition of the growing risks identified and the impact across a range of demand led services, the MTFS includes an increase in the central contingency fund of £3 million per annum to help mitigate potential future risks across the whole period.
It is important to emphasise key risks facing the Council due to the extensive and rapid reforms proposed by central Government:
• Continued reductions in Government funding over the next spending review period as indicated in the four-year settlement offer.
• Further changes in the grant funding methodology ahead of the 2020 planned reset.
• Significant movement and growth in resident population numbers bring pressures to a range of services and requires more investment in schools, housing and social infrastructure.
• Localisation of business rates presents a collection rate risk, an economic downturn risk and a risk in respect of backdated appeals.
• Localisation of Council Tax Support led to the introduction by the Council of a scheme which required all residents in receipt of council tax benefit to pay council tax. To date the impact on collection rates has been minimal but in 2016/17 a further 8% is being passported to council tax benefit recipients which could have an adverse impact on the collection rate.
• Welfare Reforms and Universal Credits may create more financial difficulties for residents which may lead to an increased demand for services, particularly homelessness services. For 2016/17 an additional provision of £1.3 million has been included in the base budget due to an increase in the numbers claiming temporary housing support.
• Housing benefit for homeless people is currently retained by the Council but going forward, the introduction of the Universal Credit will present further pressures. This is because the homeless, along with all benefit claimants, will receive their benefit payments directly from central Government and it will be necessary for the Council to recover rent from them.
• Continued reduction in the level of Housing Benefit Admin Grant subsidy as the government continues with the Universal Credit rollout.
• Higher numbers of claimants are presenting themselves for No Recourse to Public Funds and there is also an overall increase in the number of unaccompanied children referring themselves to the Asylum service.
Content 23. Budget Risks
• The current refugee crisis and the potential impact on housing and social care services.
• The growth in the number of youths held in remand continues to outstrip funding levels.
• NHB and Council Tax Incentive Grants are not permanent funding sources and as part of the local government finance reforms; these grants are replacing demand led allocations. This may lead to more peaks and troughs in the Council’s funding base which will need to be managed in a sustainable way.
• The Care Bill came into force on the 1 April 2015 and it has been assumed that the additional pressure is containable.
• The Government has indicated that there may be a further transfer of services/responsibilities to local authorities in the future and these may not be adequately funded.
• Council Tax base does not grow at the assumed rate of 1500 additional properties per annum due to market and/or difficult economic conditions.
• Collection rate of council tax and business rates falls below assumed rate.
• The pressure in the private rental market due to rising rents continues to generate real pressure for social and affordable housing.
• Significant pressure in acute NHS services may lead to growing pressure on adult social care services.
• The capacity within the Council to continue to deliver and support significant transformational change programmes within a short time horizon.
• The retention of key staff with the necessary skills to support the Council’s change agenda.
GRANT EXIT STRATEGIES
Where grants are ceasing or funding streams for services are reducing, the exit strategies must be adhered to. Any deviation from such strategies will result in overspending which will need to be addressed. Directors will robustly monitor all exit strategies. There are several grants yet to be announced and any reductions must be contained by the services in line with the Budget Strategy.
Content 23. Budget Risks
SAVINGS
In 2011 a four year medium-term financial strategy (MTFS) commenced which aimed to deliver some £65 million on-going savings by 2014/15. This strategy was delivered and evolved, and in March 2014 the Council agreed a medium-term budget strategy aimed to resolve a further funding gap of £45m by 2016/17. This strategy proposed using the Budget Strategy Reserve (BSR) to provide the Redefining Waltham Forest Programme the opportunity to identify transformational savings using cross cutting themes rather than service reductions. The Council has delivered this strategy and agreed the last tranche of savings required in 2015.
A robust approach to setting the previous budgets included the identification of the savings required to close the funding gap through to 2016/17 (Redefining Waltham Forest phases 1 and 2) has put the Council in a strong position for setting the 2016/17 budget and developing a medium-term financial strategy through to 2019/20
Members will be aware that the economic downturn has continued longer than forecast by the Government, which has consequently had difficulties meeting its fiscal objectives set in 2010. This has resulted in further grant reductions to local government within the 2013/14 and 2014/15 settlements. This fiscal reduction programme continued into 2015/16 Spending Round. Following the 2015 Comprehensive Spending Review and Autumn Statement we now have a clearer view of the financial outlook to the end of the decade. The size of the budget gap envisaged in our financial planning when setting the 2015/16 budget has been broadly accurate. It is in this context that the budget plans for 2016/17 have been proposed and the medium-term forecast through to the end of the decade produced. There are still a budget gap that needs to be closed but the continuing Redefining Waltham Forest programme coupled with achievable efficiency savings targets suggests that the Council’s finances remain of a strong footing.
The Council has maintained a robust system of budget monitoring during 2015/16 with a detailed Financial Monitoring Report being presented monthly to Cabinet. Further the Redefining Waltham Forest programme implementation is supported by the Transformation team, which is responsible for monitoring the implementation of the individual projects. This process will continue during 2016/17.
CONTINGENCY
The 2016/17 budget includes a general contingency of £5.9m; this will provide some protection against unanticipated events and pressures.
The 2016/17 Revenue Budget provides for a pay award of 1% from April 2016 and a contingency for a 1.5% increase in prices. Although headline inflation has been higher in recent years, rates are now expected to remain low so the allowance within the budget plan would seem reasonable. For future years pay awards of 1% have been assumed.
PROJECTED 2015/16 OUTTURN
It is anticipated that the 2015/16 Outturn will be managed with the budget.
Content 23. Budget Risks
RESERVES
The Financial Reserves Policy was reviewed and considered by Cabinet in September 2009. Cabinet agreed a minimum level of General Fund balance of £10 million and a maximum of £15 million. The Revenue Budget 2016/17 has been prepared on the basis that at 31 March 2016 the level of General Fund balance will be £14.7 million. It is considered that at 5% of the net general fund expenditure, this level of reserves is satisfactory.
During the planning of the budget for 2016/17, Earmarked Reserves have been reviewed to ensure that they are only retained as necessary. The Reserves Strategy is included as an appendix to the Budget and Council Tax Setting report.
The earmarked reserves include a budget strategy reserve within which a sum of £4m has been assumed for meeting costs of ill Health / Redundancy. This provides a source of funding to cover redundancy costs resulting from the Revenue Budget savings proposals. The Budget Strategy Reserve also provides protection against budget pressures that might arise during the year, manage the budget requirement over the MTFS and a source of investment in initiatives that can generate the savings forecast.
FUTURE YEARS The settlement for 2016/17, has provided indicative figures through to 2019/20 and includes the offer of a four year Revenue Support Grant. This is a positive approach and means a more strategic medium-term approach can be taken to planning savings and using reserves to support the process. The MTFS included with the budget proposals, reflects this approach and although the squeeze on public finances continues financial planning continues to be prudent and robust. The refreshed MTFS estimates the potential funding gap and the budget strategy proposed will allow officers and members time to plan the further savings that will be required in in a way that should maximise the potential to ensure that priorities are protected as far as possible and savings delivered in efficient and innovative ways. CONCLUSION
The Director of Finance considers that the 2016/17 Revenue Budget proposals are, overall, robust and that the adequacy of the proposed financial reserves is satisfactory. There are clearly risks associated with implementing the savings proposals that have been agreed to date, however, because of good planning and management of the budget over recent years these have been significantly mitigated. The project management and monitoring arrangements described in this report must be robustly applied to facilitate the delivery of savings and the identification of corrective action as necessary. There are also other potential risks in 2016/17 including demand pressures and price inflation. The level of reserves, together with the general contingency built into the base budget are judged to be at reasonable levels to meet unforeseen requirements during 2016/17, assuming that implementation of the 2016/17 revenue budget is robustly managed and monitored.