Embed Size (px)
Citation preview

Revenue and profitability on growth track
Jari Rosendal, President and CEO
March 21, 2016
Annual General Meeting 2016

Kemira’s Management Board
Petri Castrén
CFO
Kim Poulsen
Pulp & Paper
Antti Salminen
Municipal &
Industrial
Tarjei Johansen
Oil & Mining
Heidi Fagerholm
CTO
Eeva Salonen
Human Resources
Michael Löffelmann
Projects &Manufacturing
Technology
Esa-Matti Puputti
Operational Excellence
2
Jari Rosendal
President and CEO
March 21, 2016Kemira's Annual General Meeting

Vision: The first choice in chemistry for water intensive industries
REVENUE
(EUR billion)
PULP & PAPER – 60% of revenue
• #1 global chemical supplier in pulp, packaging, board and
paper industry
OIL & MINING – 15% of revenue
• Growing chemical and service provider, #2 in polyacrylamide production
MUNICIPAL & INDUSTRIAL – 25% of revenue
• #1 in raw and waste water treatment chemicals in Europe
and North America
3
2.12.4
2014 2015
EMPLOYEES
2014 2015
4,6854,248
March 21, 2016Kemira's Annual General Meeting

Global megatrends support Kemira’s business
CIRCULAR ECONOMY
• Recycled fiber
• Water reuse
• Nutrient (phosphorus) removal and recovery
RESOURCE EFFICIENCY
• More with less
• More out of less
BIOBASED ECONOMY
• Raw material reuse, waste recovery
4March 21, 2016Kemira's Annual General Meeting

Kemira enables sustainable packaging
FOR PULP & PAPER INDUSTRY
LIGHTER DURABLE PACKAGES
Kemira FennoBond™ enables usage of less
fibers with maintained strength and stiffness
properties.
Our customers generate savings through
raw material efficiency, contributing to lower
transportation costs and reducing CO2
emissions.
-10%
Package weight
5
Example #1
March 21, 2016Kemira's Annual General Meeting

Kemira enables higher oil recovery rate
FOR OIL INDUSTRY
In Chemical Enhanced Oil Recovery 1 %
increase in recovery equals 2 years of oil
production.
With Kemira’s polymer technology
recovery rate improvement up to 15%.
Without polymer
OIL WATER WATER WATER WATER
With Kemira’s polymer technology
OIL OIL OIL OIL WATER
6
Example #2
March 21, 2016Kemira's Annual General Meeting
0
5000
10000
15000
20000
2000 2003 2006 2009 2010 2011 2012 2013 2014 2015
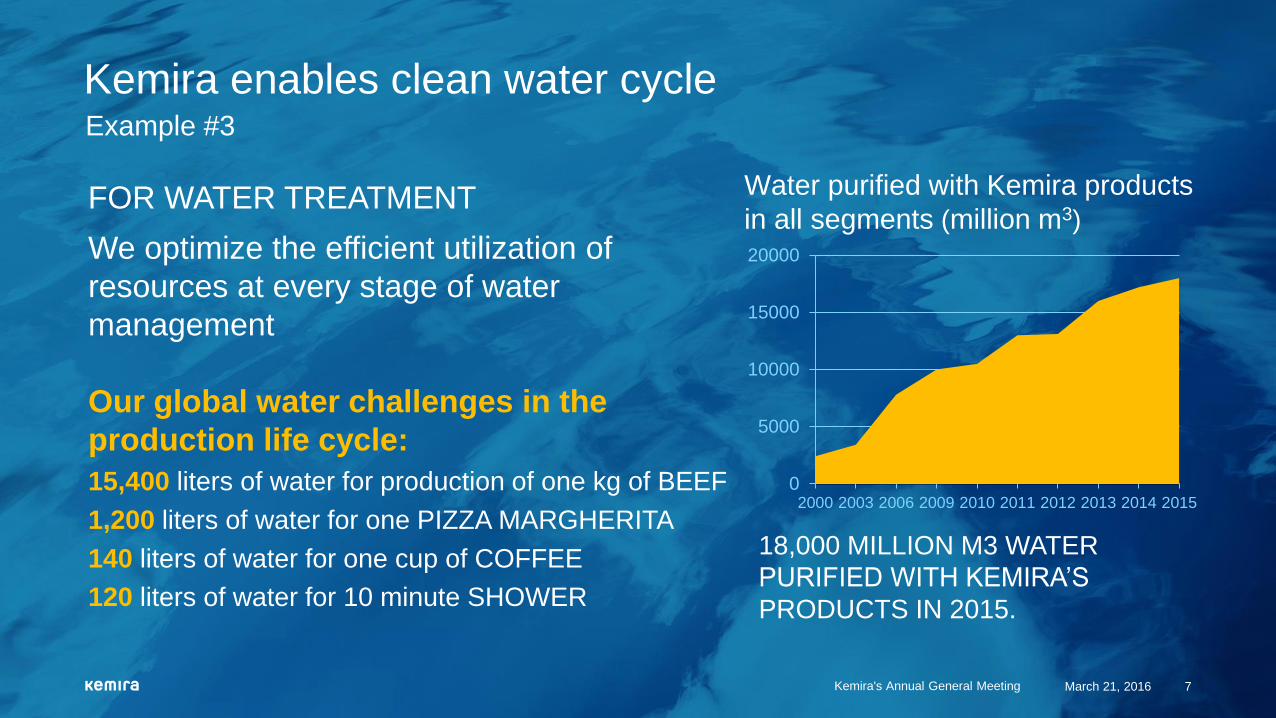
Water purified with Kemira products
in all segments (million m3)
Kemira enables clean water cycle
FOR WATER TREATMENT
We optimize the efficient utilization of
resources at every stage of water
management
Our global water challenges in the
production life cycle:
15,400 liters of water for production of one kg of BEEF
1,200 liters of water for one PIZZA MARGHERITA
140 liters of water for one cup of COFFEE
120 liters of water for 10 minute SHOWER
18,000 MILLION M3 WATER
PURIFIED WITH KEMIRA’S
PRODUCTS IN 2015.
7
Example #3
March 21, 2016Kemira's Annual General Meeting

CARBON INDEX: TARGET 80 BY END 2020
Based on Scope 1 and Scope 2 emissions
Examples of corporate responsibility and sustainability
RECOGNITIONS COMMITMENTS
100
SAFETY TARGET: ACHIEVE ZERO
INJURIES
91918820132012 2014 2015
8.5 7.1 5.8 7.2
2012 2013 2014 2015
8March 21, 2016Kemira's Annual General Meeting

9
Manufacturing
footprint
globally (64 sites):
1,580
AMERICAS 39%
EUR 935 million
ASIA PACIFIC 8%
EUR 190 million
540
EUROPE, MIDDLE EAST
AND AFRICA 53%
EUR 1,250 million
2,570
Employees
R&D and technology centers
Kemira is truly global – sales in more than 100 countries
Polymers and other
process chemicals (25)
Coagulants (30)
Bleaching and pulping (9)
March 21, 2016Kemira's Annual General Meeting

10
Research and
Development
• EUR 32 million into R&D in 2015
• R&D Centres:
• Espoo, Finland
• Atlanta, USA
• Shanghai, China
• Kemira has 1,034 granted patents
• In 2015, 38 own patent filings
protected

Revenue and profitability on growth track
11
2,1372,373
2014 2015
Revenue, EUR million
Operative EBITDA, EUR million
+11%
253
287
2014 2015
+14%
11.8%12.1%
Operative
EBITDA
Margin
March 21, 2016Kemira's Annual General Meeting

Profitable growth
in Pulp & Paper
• Integration of acquisitions well
on track
• Growth through Total Chemistry
Management deals
• Strong market for pulp chemicals,
new capacity built such as the
chlorate plant in Brazil, planning
capacity increases in the Nordics
• Efficiency measures continued
1,1701,417
2014 2015
Revenue, EUR million
Operative EBITDA, EUR million
+21%
137
171
2014 2015
+25%
11.7%12.1%
12
Operative
EBITDA
Margin

Kemira strengthened its position as the market leader in pulp and paper chemicals
13
• Kemira acquired AkzoNobel’s paper chemicals
business for EUR 127 million in May 2015
• The revenue of the acquired business was
EUR 219 million in 2015 (pro forma)
• Kemira is the only chemicals company offering
chemicals to pulp production as well as to each end
product category: board, paper and tissue
• Integration proceeded well
• Targeting annual synergy savings of EUR 15 million
by the end of 2017
March 21, 2016Kemira's Annual General Meeting

Oil & Mining responds
to market decline
• Very difficult market conditions
in shale gas and oil
• Mining remained more stable
• Chemically Enhanced Oil
Recovery and Oil Sands are
growth opportunities
382350
2014 2015
Revenue, EUR million
Operative EBITDA, EUR million
-8%
48
33
2014 2015
-31%
12.7%Operative
EBITDA
Margin 9.6%
14

Robust year for
Municipal & Industrial
• Restructuring done in 2013-
2014 pays off
• Efficiency measures continued
• Solid cash flow generation and
strong ROCE
565606
2014 2015
Revenue, EUR million
Operative EBITDA, EUR million
+7%
68
83
2014 2015
+22%
12.1%13.7%Operative
EBITDA Margin
15Kemira’s Annual General Meeting March 21, 2016

Pulp & Paper 60% of Group’s revenue
All segments delivering growth and improved profitability2017 financial targets: Revenue EUR 2.7 billion, Operative EBITDA 15%, Gearing <60%
Oil & Mining 15% of Group’s revenue
Municipal & Industrial25% of Group’s revenue
Growth target
• 2 * market growth (1.5%)
• Selected bolt-on
acquisitions
Growth target
• Returning to organic
growth in 2016 regardless
of oil price
• Double-digit growth %
over-the-cycle
Growth target
• Steady growth of 2-4%
Profitability target
• In-line with Group target
Profitability target
• Over-the-cycle profitability
above the Group target
Profitability target
• Slightly below Group
target
16March 21, 2016Kemira's Annual General Meeting

Market environment in
2016
9.0 10.0
12.4
15.8
4.7
5.5
2014 2020
P&P
1.5%
O&M M&I
4.0%
2.9%
+3.1%
Source: Management estimation based on various sources
Kemira’s relevant market
EUR billion
17
• Increased use of tissue, board and
pulp driving growth in Pulp
& Paper
• Regulatory enforcements drive
growth in water treatment
• Input costs remain at low level
Positive factors
Challenges
• Modest global GDP growth
• Low oil price impacts negatively
activity in shale oil market

2016 outlook
2016
outlook
Revenue
Operative EBITDA
2014
EUR 253 million
EUR 2.1 billion Increase
Increase
2015
EUR 2.4 billion
EUR 287 million
18

19
VISION:
”The first choice in chemistry for
water intensive industries”
We aim to continue on growth path
We focus on improved profitability
through operational improvements,
leveraging growth and capturing
synergies
March 21, 2016Kemira's Annual General Meeting

Financials 2015
Petri Castrén, CFO
March 21, 2016
Annual General Meeting 2016
20

Financial highlights 2015
• Revenue growth 11% to EUR
2,373 million
• Operative EBITDA improved 14%
to EUR 287 million
• Cash flow from operations
improved to EUR 248 million
• CAPEX excluding acquisitions
increased to EUR 182 million
Key financials 2015
Revenue,
EUR million
2,373
(2,137)
Operative EBITDA,
EUR million
287.3
(252.9)
Operative EBITDA margin 12.1%
(11.8%)
Cash flow from operations,
EUR million
247.6
(74.2)
CAPEX excluding M&A 181.7
(145.7)
21Kemira’s Annual General Meeting March 21, 2016

EUR million 2015 2014
Revenue 2,373.1 2,136.7
Other operating income 7.1 55.2
Operating expenses -2,116.4 -1,939.0
Depreciations, amortizations and impairments -131.2 -100.3
Operating profit 132.6 152.6
Finance costs (net) -30.8 -30.7
Share of profit or loss of associates 0.3 0.2
Profit before tax 102.1 122.1
Income taxes -24.9 -26.3
Net profit for the period 77.2 95.8
Equity owners of the parent 71.0 89.9
Non-controlling interests 6.2 5.9
Earnings per share for net profit attributabe to the equity owners of
the parent company (EUR per share)
0.47 0.59
22
Income statement (IFRS)
March 21, 2016Kemira's Annual General Meeting

Milj. euroa 2015 2014
Goodwill 518 486
Other intangible assets 135 76
Property, plant and equipment 815 706
Shares and other investments 357 345
Inventories 207 197
Receivables 411 366
Cash and cash equivalents 152 119
Total assets 2,595 2,296
Equity 1,193 1,163
Interest-bearing liabilities 794 605
Interest-free liabilities 608 527
Total equity and liabilities 2,595 2,29623
Balance sheet
March 21, 2016Kemira's Annual General Meeting

Key figures
24
EUR million, except ratios 2015 2014
Net debt 642 486
Equity, % 46% 51%
Gearing, % 54% 42%
Net debt / operative EBITDA 2.2 1.9
Operative ROCE, % 9.8% 11.1%
Operative EPS, EUR 0.63 0.63
March 21, 2016Kemira's Annual General Meeting

0.53 0.53 0.53 0.53 0.53
0.00
0.10
0.20
0.30
0.40
0.50
0.60
2011 2012 2013 2014 2015
Dividend per share
Dividend yield
Dividend policy – a stable and competitive dividend
• Board of Directors’ proposal to the AGM
a dividend of EUR 0.53 per share
• Distributable funds of Kemira Oyj were
EUR 684.9 million on December 31, 2015
• For the year 2015 dividend amounted to
EUR 81 million, 84% of operative net profit
• Dividend yield at the end of 2015: 4.9% and
on March 14, 2016: 5.0%
• Average dividend yield in European chemical
sector is 2.6%
25
Dividend yield calculated using the share price at year-end.
4.9%5.4%4.4%4.5%5.8%
March 21, 2016Kemira's Annual General Meeting

Kemira investment case highlights
Leading market position supporting
above-the-market growth
Higher profitability through growth, efficiency and
synergies
Strong operating cash flow supports
investments into growth
Stable and competitive dividend
26