Embed Size (px)
Citation preview

Department of Kinesiology, University of Georgia, 330 River Road, Athens, GA, (706)†
542-4420, [email protected]
Working Paper Series, Paper No. 07-28
Progressive Revenue Sharing in MLB:
The Effect on Player Transfers
Joel G. Maxcy†
October 2007
AbstractThe 1997 collective bargaining agreement between the Major League Baseball owners
and players’ union altered MLB’s system of sharing revenue sharing between clubs. The newsystem, a convoluted cross-subsidization scheme, by design progressively redistributed incomefrom the highest revenue generating clubs toward the lowest revenue-producing clubs. The 2003agreement extended this method of revenue redistribution, but with an increased the tax rate andmodified process. The purpose of the revenue sharing system was to alleviate a growing disparityin revenue generation, which MLB claimed caused competitive imbalance. We examineprogressive revenue sharing theoretically, within the principal-agent framework, and shows thatthe incentive to divest in talent is increased for lower revenue producing clubs. Empirical resultsare supportive. Payroll disparity and competitive imbalance increased modestly from the periodimmediately preceding implementation. Most striking however is the alteration in transfer ratesof players, in particular the increased flow of productive talent away from the lowest revenueclubs. We show conclusively that low revenue producing clubs acted on the increased incentivesto divest in talent.
JEL Classification Codes: J50, L20, L83
Keywords: Sport, revenue redistribution, collective bargaining

Progressive Revenue Sharing in MLB: The Effect on Player Transfers
Joel G. Maxcy
1. Introduction
The 1997 Basic Agreement1 (1997BA), the collective bargaining agreement between the
Major League Baseball (MLB) owners and the players’ union (Major League Baseball Players
Association, MLBPA) considerably altered MLB’s system for collecting and redistributing club
generated revenues. Under the previous system, the sharing of club generated income in MLB
consisted of primarily a small, fixed-percent, of gate receipts due the visiting club.2 A
progressive cross-subsidization system, initially known as the “split pool plan”, replaced the
simple gate sharing method. The innovative system is described as progressive here, because by
design increasingly larger shares of the pooled income—all revenue collected by the league and
designated for redistribution—are awarded to the lowest revenue-producing clubs. The levy on
local revenues was phased in gradually over the length of the 1997BA reaching a maximum of
rate 20% in 2001. The 2003 Basic Agreement (2003BA) extended the basic system of
progressive revenue redistribution through the 2006 season. The tax rate on local revenues
increased to a constant rate of 34% for each year of the term of the 2003BA.
The affirmed purpose of the progressive revenue sharing system was to alleviate a
growing disparity in club specific (local) revenue generation, which MLB has claimed to cause
increased levels of competitive imbalance. MLB Commissioner, Alan “Bud” Selig, was
adamant and persistent with his 1997 declaration that growing revenue disparity distorts
competitive balance and causes severe economic problems because fans in small market cities
1 Though agreed to by MLB and the MLBPA in 1997 revenue sharing provisions of the agreement were retroactive to the 1996 season. 2 The actual home-visitor share was different in each of the two leagues. Fort and Quirk (1995, p. 1286) report that the American League (AL) split was an 80%:20% home team to visiting team ratio; the National League (NL) home team share was 95%.
3
have lost “hope and faith” of a championship. Selig cited as evidence the MLB commissioned
report, completed by the so-called “Blue Ribbon Panel” of experts (hereafter the BRPR),which
showed clubs in the highest payroll quartile had won more than 90% of all playoff games since
1994. Notwithstanding, independent economists have pointed out the fallacies of this report
(Eckard 2001, for example). Throughout both the 1997 and 2003 collective bargaining
negotiations, MLB implored the MLBPA to agree to adopt measures that correct competitive
imbalance. In addition to progressive revenue sharing, a luxury tax on payrolls was implemented
through the 1997BA and continued, albeit in different form, (and renamed the competitive
balance tax) with the 2003BA.
The MLB revenue sharing scheme was innovative because the league collects a fixed
percentage of all net local revenues. This tax on each club’s local revenue is pooled with league-
generated income, primarily national broadcast and licensing revenue, and provides the total
fund, known as the central pool, set for redistribution. The principal-agent framework provides
an appropriate method by which to examine progressive revenue sharing. A basic construction,
defining the league as the principal and the individual clubs (owners) as the agents, shows
institutional changes imposed by progressive revenue sharing bring about a new set of agent
incentives. The intended effect is to restrain the rate of talent acquisition by high-income clubs
by reducing the marginal revenue associated with winning. Simultaneously, the redistributions
provide low-income clubs with additional resources that may assist them in the procurement of
talent and consequently improve competitive balance. Notwithstanding, the subsidy received by
low-revenue clubs is inversely proportional to the amount of local revenue generated; the
unintended consequence is thus, that the incentive to win—conditioned on the principle that wins
and revenue generation are positively correlated—is reduced for low revenue clubs. The
progressive revenue sharing plan effectively increases the marginal tax rate on the lowest
4

revenue producing clubs, decreasing their incentive to produce wins and the corresponding
increases in local revenue.
Conventional wisdom holds that increasing the level of revenue sharing among its clubs
will diminish problems of competitive imbalance in a professional sports league. The economic
effects of pooling and sharing revenues in professional sports leagues has been examined by a
number of writers, beginning with the rigorous economic model of a sports league by Quirk and
El Hodiri (1971).3 The theoretical conclusions, rightly pointed out by Kesenné (2000), are
inconsistent, and often vary given the stated assumptions, such as those placed on owner
behavior. Fort and Quirk (1995) showed that basic gate revenue sharing has no effect on
balance, but does depress player salaries. Others, including Atkinson et al. (1988), Fort and
Quirk (1995), Vrooman (1995 and 1996), Rascher (1997), Marburger (1997), and Kesenné
(2000) each provided substantiation that under certain circumstances revenue sharing improves
competitive balance.4 Syzmanski and Kesenné (2004) conversely, demonstrated that under
reasonable circumstances increased levels of sharing gate revenue may worsen balance.
Empirical tests on the effects of revenue sharing are very scarce and equally
inconclusive. Atkinson et al. (1988) claim their results indicate that the equal revenue sharing of
national television revenue in the National Football League (NFL) is consistent with better
competitive balance. Fort and Quirk (1995) provided evidence that competitive balance as
measured by dispersion of club win percents has changed very little over time in any of the four
major sports leagues. They put forth, that regardless of revenue sharing and other institutional
constraints (except salary-payroll caps) on player labor markets, competitive balance is largely
invariant. An impediment to empirical tests has been that the natural experiment where a
3 For a thorough review of the theoretical literature and much of the empirical work to date, see Sysmanski (2003). 4 There is no particular consistency on exactly what are these circumstances. For example Rascher (1997) and Kessené (2000) show that if owners’ behavior is modeled as utility maximizing rather than profit maximizing revenue sharing improves balance. Atkinson et. al, (1988) on the other hand, claim exactly the opposite, and that utility maximizing behavior in the NFL causes greater imbalance.
5
professional team-sport league has radically altered its revenue sharing plan is heretofore
nonexistent.
Although revenue sharing or cross-subsidization has many potential arrangements,
comparisons across leagues are difficult, if not inappropriate, because of institutional differences
of far greater consequence than the alternative methods of sharing revenue. The standard
revenue sharing practice in US professional sports leagues is traditionally an even (1/n) split of
central or league-collected income—comprised primarily of the revenues generated by national
broadcast contracts, negotiated by the Commissioner’s office. The National Basketball
Association (NBA) and National Hockey League (NHL), prior to 2005-06, shared only league-
generated revenues. The National Football League (NFL), like pre-1996 MLB, combines
league-generated revenue with a home team-disproportionate split of the local gate.5 The NHL
joined MLB by also placing a tax on local revenue as part of a new collective bargaining
agreement negotiated in 2005.
Changes in the distribution of playing talent across clubs are typically evaluated by
assessing disparities in club payrolls over time, or by examination of variation in the statistical
measures of competitive balance, such as the standard deviation of winning percentage. We put
forth the argument that empirical tests that focus on only these factors are too coarse to
illuminate alterations in the distribution of talent that may result from the change of revenue
sharing scheme. Instead, an empirical analysis of player transfers between clubs offers a more
thorough evaluation of alterations the talent flows and distributions brought on by changes in the
revenue sharing method. MLB’s new progressive scheme provides the rare opportunity to test
the effects of revenue sharing given a significant institutional change in league revenue sharing
policy.
5 In the NFL the home team keeps 60% of the gate with the remaining 40% pooled and redistributed in even shares. (Fort and Quirk 1995, p. 1286).
6
The paper proceeds as follows. The next section provides the details of the revenue
sharing aspects of the 1997BA and the 2003BA. The following section offers a theoretical
model comparing the progressive revenue redistribution with the more conventional straight pool
plan and discerns the effects of each scheme on club owners’ incentives. Presentation and
discussion of empirical results on payroll dispersion, competitive balance, and regression
analyses of player transfers comprises section four, which is followed by concluding remarks,
and suggestions for further research.
2. The MLB Revenue Sharing Plan
The 1997BA did not provide for an immediate and full adoption of the split pool revenue
sharing plan. The split pool scheme was phased in gradually over the 1996-1999 seasons and
was fully implemented for the 2000 and 2001 seasons. Under the original formulation of the
split pool method, twenty-percent of all club generated net revenue (primarily gate revenue,
other stadium revenues, and local broadcasting revenue) was pooled with MLB league generated
revenues—those collected directly by MLB, primarily from national broadcasting contracts,
licensing, and royalties—for the purpose of redistribution. The total MLB pooled revenue
(called the central pool) was redistributed so that seventy-five percent was divided equally
among all clubs. The remaining twenty-five percent was redistributed in full to the clubs
generating a below-the-mean amount of local revenue, with the shares received inverse in
proportion to the club’s revenue generation.6
6 The exact wording on the “split pool plan” from the 1997BA follows: (MLB, 1997 p.88)
The "Split Pool Plan" operating at full (100%) implementation, the amount of net payment or net receipt for each Participating Club shall be determined as follows: Each Participating Club contributes 20% of its Net Local Revenue to a putative pool; 75% of that pool is divided equally among all Participating Clubs; the remaining 25% of the pool is divided only among Participating Clubs below the arithmetic mean of Net Local Revenue in proportion to each such Club's
7
Prior to full implementation, a hybrid plan was utilized on a sixty-percent basis for 1996
and 1997; meaning that clubs received 60% of their best possible subsidy. The split pool was
executed at 80% in 1998 and 85% in 1999; signifying that each club’s net tax or subsidy was that
percentage of the full split pool plan.7 The 2003BA modified the split pool so that each club
contributed thirty-four percent of their net local revenue, which was redistributed in even shares.
However, clubs producing below-the-mean levels of local revenue receive progressively higher
shares of the initial central fund— again the revenue collected directly by MLB including
national broadcast revenue and revenue generated by MLB properties. The redistribution
process from the Central Fund Component (CFC) is indistinguishable from the split pool, in that
it provides subsidy payments with an inverse relationship to revenue generation. However, the
CFC share is determined by averaging local revenue over the most recent three-year period
rather than an annual adjustment. Those eligible for the CFC redistribution include all clubs that
received a local pool redistribution payment that was greater than their contribution— designated
distance from said average, with the difference between each Club's payment into the putative pool and its receipt or receipts there from producing the net payment or net receipt for that Club.
Intent of the Plan: (a) NET TRANSFER VALUE. The intent of the revenue sharing plan is to effect a net transfer of Net Local Revenue among Participating Clubs of $70 Million at 100% implementation of the plan, based on 1994 projections. (b) MARGINAL TAX RATE. The maximum marginal tax rate on Payor Clubs under the plan shall not exceed 20% at full (100%) implementation of the plan.
7 During the phase-in period (planned) subsidies exceeded (planned) revenue collections. In 1996 “superstation” payments bridged the gap and from 1997-1999 the difference was made up with a league-collected “luxury tax” placed on teams with the highest payrolls.7 Those teams exceeding a predetermined payroll threshold ($51 Million in 1997, $55 Million in 1998, $59.8Million in 1999) were charged a tax of 35% of their payroll (34% in 1999). Additionally all teams were charged a 2.5% payroll tax for the 1996 and 1997 seasons. Superstation payments are those MLB received from the so-called superstation broadcast networks that televise MLB games nationally include Atlanta-based TBS and Chicago-based WGN.
8
as payee clubs. Payee clubs have produced average net local revenue that is below the league
mean for each of the previous three seasons, to be eligible for the CFC subsidy.8
Both subsidy systems pay the largest shares to clubs that generate the smallest amounts
of local revenue. On the surface this is the goal of an income redistribution plan, but it is not
clear that income redistribution provides the proper incentives for clubs eligible to receive larger
proportional shares to invest in talent and therefore improve competitive balance across the
league. The optimal outcome for a league that generates a positive economic return to a 8 The exact wording on the “Central Fund Component” from the 2003 BA follows: (MLB, 2003 p.102-3)
The revenue sharing plan shall also have a “Central Fund Component” under which a portion of Major League Central Fund money will be reallocated from Payor Clubs to Payee Clubs. The amount of net payment or net receipt under the Central Fund Component for each Club shall be determined as follows: (a) Net Transfer Value. At 100% implementation, the net transfer value of the Central Fund Component, in each revenue sharing year, shall be 41.066% of the net transfer value of the Base Plan in that revenue sharing year. “Net transfer value” shall mean the sum of the amounts transferred from Payor Clubs to Payee Clubs. (b) Contributors and Recipients. During each revenue sharing year, Major League Central Fund money shall be reallocated from Clubs that are Payor Clubs for that revenue sharing year (“Contributors”). Distributions under the Central Fund Component for each revenue sharing year shall be made only to Clubs that: (i) are Payee Clubs for that revenue sharing year, and (ii) have a mean Net Local Revenue for the preceding three revenue sharing years that is below the industry’s mean Net Local Revenue for that three-year period (“Recipients”). (c) Calculation (i) Contributors. To determine the amount of Major League Central Fund money to be reallocated from each Contributor (at 100% implementation), multiply the Contributor’s mean Net Local Revenue for the preceding three revenue sharing years by a fraction, the numerator of which is the net transfer value of the Central Fund Component in that revenue sharing year and the denominator of which is the sum of the means of each Contributor’s Net Local Revenue for the preceding three revenue sharing years. (ii) Recipients. To determine the amount of Major League Central Fund money to be distributed to each Recipient (at 100% implementation), multiply the net transfer value of the Central Fund Component in that revenue sharing year by a fraction, the numerator of which is the difference between the industry’s mean Net Local Revenue for the preceding three revenue sharing years and the Recipient’s mean Net Local Revenue for that period, and the denominator of which is the sum of all such differences for each of the Recipients.
9

marginal improvement in competitive balance logically occurs when clubs at the bottom of the
scale improve their talent stock. The potential problem is the creation of a negative externality
by altering incentives, which encourage lower revenue producing clubs to restrain their
investment in talent in order to collect a larger subsidy. The undesirable consequence is twofold.
First, the overall league-collected pool is smaller because of the lessened local contribution by
such clubs. Second, since winning theoretically produces more revenue, some clubs may choose
not to invest in an adequate (efficient) level of talent and greater competitive imbalance results,
also reducing total league revenue.9 The theoretical model discerns the circumstances where
progressive sharing creates a negative externality.
3. Theoretical Model
Models of straight pool and progressive revenue sharing plans employed by a sports
league are incorporated. The straight pool model is a modification of the model developed by
Atkinson et al (1988) that assumes a league of n clubs, each with separate ownership. The
league objective is profit maximization by way of maximizing the profits of each club so that
(1) . ∏ ∑=
=n
ii
1π
Club profits are simply the difference in total revenues, which includes all retained, locally
generated, revenue plus all monies redistributed to each club through the leagues central fund
CF, and total costs so that
(2) iπ = TRi - TCi.
9 The 2007BA, which runs through the 2011 championship season has purports to have resolved the short term incentive problems of increasing marginal tax rate. The new agreement sets the CFC distribution for each club at a fixed rate throughout the period. The plan reflects a straight pool (see Zimbalist, 2006). All clubs contribute 31% of their net local revenue and the CFC is redistributed so that the overall effect replicates a 48% straight pool.
10

Each club’s local revenue LRi is a function of its win percent w, which is in turn a function of its
talent investment t, and local demand characteristics Di including metropolitan population, per
capita income, and stadium factors. So that
(3) LRi (w(t)Di).
The profit function for a club in a league employing straight pool revenue sharing is modeled as
follows
(4) + μ(ρcti
n
j
jjiii ctCFDtwLRnDtwLR []))(([/))(()1(1
−++−= ∑=
ααπ i) ]
where α is the fraction of revenue each club contributes to the pool. For the sake of simplicity,
only the variable cost of talent is included in the cost function. The talent market is assumed to
have a finite number of players, and thus represents a zero sum game, as talent hired by one club
is denied the others. The variable costs cti are determined as the number of units of talent hired at
a cost of c per unit. For cases where a luxury tax/competitive balance tax is placed on payrolls
exceeding a threshold, the cost function is represented as TC = cti +μ(ρcti), where ρ designates
the tax rate, and μ = 1 for clubs exceeding the payroll threshold and 0 otherwise.
Alternatively, the profit function for clubs in a league employing a progressive sharing
scheme, returning disproportionately large shares to those with below-the-mean local revenues,
is as follows,
(5) )]([]))(([),()1(
]))(([/))(()1(
1
1
ii
n
j
jjii
n
j
jjiii
ctctCFDtwLRLRLR
CFDtwLRnDtwLR
ρμβδαλ
αβαπ
+−+−+
++−=
∑
∑
=
=
where λ = 1 if LR > iLR ; 0 otherwise. The weighting term, δi, indicates that those clubs
receiving a portion of the subsidy pool do not receive equal 1/n shares. The share is larger for
smaller amounts of local revenue generated, so that
11
δi = (f LR − ), 0< δiLR i <1; < 0, and = 1. iLRf ∂∂ / ∑=
m
i 1
δ
Although local revenue is also determined in part by such factors as the effort applied to selling
broadcast rights, stadium signage, luxury boxes, and other marketing efforts, this model will
limit the club’s problem to its choice of a revenue maximizing level of talent to maximize the
objective functions in (4) and (5).
The first order condition for the straight pool plan is
(6) ][)1(1 11
cct
ww
LRnt
wwLR
i
kn
j
n
k i
j
i
jn
j j
i μραα +−∂∂
∂∂
+∂∂
∂∂
− ∑∑∑= ==
= 0
Signing (6) reveals a positive first term offset by negative second and third terms. The
negative second term may provide the necessary disincentive that internalizes the externality
caused by the over investment in talent by the top revenue generating clubs. The negative third
term shows that the luxury tax reduces the incentive to hire talent beyond the payroll threshold.
The first order condition for the progressive redistribution plan is
(7) 0][)1(
)1(
1 1
1 11
=+−∂∂
∂∂
∂∂
∂∂
∂∂
∂∂
−
+∂∂
∂∂
+∂∂
∂∂
−
∑∑
∑∑∑
= =
= ==
cct
wwLR
LRtLw
wLR
LR
tw
wLR
ntw
wLR
i
k
k
jn
j
n
k j
j
i
i
i
i
i
i
i
kn
j
n
k i
j
i
jn
j j
i
μρδδβαλ
αβα
Equation (7) adds an additional term, the product of βαλ )1( − , reflecting the change in
the secondary pool share given a change in talent level for below-the-mean revenue producing
clubs. This term signs negative and indicates a decreased incentive toward talent investment for
the pertinent clubs. The first part of the term shows that increasing talent increases local revenue
and reduces the club’s share of pooled revenue. The second part of the term shows that when a
club increases its level of talent, other clubs’ local revenue decline and their shares of the pool
increase, reducing the amount left over for club i.
12
The progressive redistribution theoretically creates greater incentive for below-the-mean
revenue clubs to divest in talent than is the case for a straight pool system. If low revenue clubs
respond to this incentive, the progressive redistribution plans create an unnecessary negative
externality by increasing competitive imbalance. Nevertheless, for that to happen the gains from
divesting (terms two and three and four) must exceed the returns to investing in talent (term
one). Verification requires empirical tests.
4. Empirical Analysis
A simple test of the hypothesis is an examination of revenue and payroll disparity before
and after the implementation of progressive revenue sharing. Table 1 shows statistics from 1990
through 2005 championship seasons. Reported are calculations of the coefficient of variation on
payroll and total revenue dispersion (after redistribution since 1996) and gate revenue dispersion,
the best available proxy for local revenue variation.10 There is evidence of increased payroll
dispersion throughout the progressive revenue sharing period. The Montreal Expos (Washington
Nationals since 2005), the club with the lowest payroll in four of the six years immediately
following the implementation of progressive revenue sharing, actually cut their club payroll from
$18 million to $8 million dollars between the 1997 and 1998 championship seasons. The Tampa
Bay Devil Rays either had, the lowest, or second from the lowest, club payroll throughout the
duration of the 2003BA; and they nearly halved their payroll from $35Million to $19Million to
start the 2003 season. A recent example of apparently flagrant divestment is the Florida Marlins,
who reduced their payroll from $60Million to $15Million prior to the 2006 championship
season. These examples support the claims of some high-revenue club owners, such as the New
10 Data on MLB club finances, including breakdowns by revenue source is complied from a variety of sources and collected at Rodney Fort’s Sports Business Data Pages. Sources include Financial World 1990-1996, Forbes1997-2005, MLB Commissioner’s Office 2001. The revenue source data are not consistent through the time period in regard to total local revenue by club. It is variously reported only before revenue sharing, only after revenue sharing, or not at all. Total gate revenue produced by each club is reported consistently throughout the period.
13
York Yankees George Steinbrenner, that there is no reinvestment of revenue sharing funds in
talent by the payee club owners, and the result is an inferior product on the field. Nonetheless,
supporters of revenue sharing claim that low payroll clubs are investing more aggressively in
their minor league farm systems and are therefore better able to field more talented clubs over
the long run.11
In general, the payroll statistics provide some support for the proposal that progressive
revenue sharing has caused low revenue producing clubs to reduce their investments in talent.
The coefficient of variation for total revenue since progressive revenue sharing is consistent with
prior averages, indicating that revenue sharing has alleviated growing disparities in revenue
production over the period. However, the coefficient of variation for gate revenue has increased
significantly since the implementation of progressive revenue sharing; this mirrors the trend in
payroll dispersion, implying that gate revenue is an important driver of talent acquisition
decisions.
(INSERT TABLE 1 ABOUT HERE)
Notwithstanding, payroll dispersion when used as a measure of talent distribution in
MLB is problematic. Prior studies have examined this phenomenon. Zimbalist (1992) Quirk
and Fort (1999) and Hall et al. (2002) find very low levels of correlation between payrolls and
winning, though the latter does find that this correlation is stronger since 1994. A likely cause of
this incongruous association is MLB’s multi-tiered labor market, which distorts the connection
between payroll and talent. Only free agent eligible players, those with six or more years of
MLB service, receive a wage reflecting a competitive market. Other players, bound to their
clubs by a contractual reserve clause, earn below their market value.12 Furthermore, a club’s
payroll does not accurately reflect its investment in talent. Investments in scouting and player 11 See Associated Press (2004) for examples of both types of comments. 12 This is well documented in the literature. See Zimbalist (1994) for example.
14
development costs must also be given consideration. Clubs that have invested poorly in player
development, often end up paying more for similar levels of talent, as they are compelled to
invest disproportionately in higher priced free agents.13 Examination of actual on-field
measures of competitive balance provides additional insight.
Vrooman (1996) offers that there are three dimensions by which to gauge competitive
balance. These include closeness of within season competition, discontinuity of club
performance from season to season, and minimal large market dominance (small market
weakness). Quirk and Fort’s (1992) ratio of actual to ideal standard deviation of win percent
(SDWP) is the standard metric used to test the former, and had been used in numerous studies
measuring competitive balance. Season-to-season continuity is a more ambiguous concept, and
calculations of frequency, or dispersion of, championships, playoff appearances, etc. fall into this
category. Quirk and Fort (1992) provide a wealth of historical data of this sort for all four North
American professional sports leagues. Fort (2001) also reports detailed statistics on the
distribution of championships for MLB through 2000.
Consistency of club standings also falls within the category of season-to-season
continuity. Daly and Moore (1981) and Maxcy (2002) employ the Spearman’s Rank Correlation
Coefficient (SRCC) to test year- to-year changes in club standings. Humphreys (2002) provides
a thorough review of other methods that attempt to capture season-to-season change. He also
introduces the Competitive Balance Ratio (CBR) that is a ratio of within season standard
deviation of league win percent, and standard deviation of club win percents of a determined
period of time. Hadley, Ciecka, and Krautmann (2005) develop an inter-seasonal measure of
13 Hall et al. (2002) also identify the uncompetitive aspects of the MLB labor market for the lack of correlation. They offer a somewhat different explanation stating diminished player movement by trade in the free agent era is the crux of the problem. That observation is open for debate. Maxcy (2002) for example finds that the mobility rates of productive players have increased significantly in the free agent era.
15
competitive balance based on a Markov model of a team’s probability of qualifying for
postseason play given the performance of the team in the previous season.
Table 2 shows SDWP and SRCC for each the 1990-2005 championship seasons. Imbalance
shows a statistically significant increase starting in 1997. These findings are consistent with Fort
(2001) and Humphreys’ (2002) CBR results, and Hadley, Ciecka, and Krautmann (2005), who
each detect an statistically significant increase in imbalance since 1995. Once more, the results
impart corroboration that split pool revenue sharing provided improper incentives for low
revenue clubs. Nonetheless, the number of observation years is too few to validate a conclusion,
and coupled with the increased gate revenue dispersion greater levels of imbalance is expected,
regardless of an altered revenue sharing plan. Additionally, the progressive schemes introduced
by each collective bargaining agreement are different enough to warrant separate examination.
(INSERT TABLE 2 ABOUT HERE)
Imbalance as reflected large market dominance/small market weakness is not at the
forefront of economic analysis, although Daly and Moore (1981) and Vrooman (1996) have
given it consideration. In each case, the authors found that increased labor market freedom has
amplified talent flow toward larger markets.14 The issue is the crux of MLB’s case that
competitive imbalance is a growing problem. The BRPR cites as evidence the very limited
ability of clubs outside the top payroll quartiles to obtain post-season success since 1995. Their
results, though not manifestly refutable, rely on a flawed line of reasoning that implies both that
payroll is highly correlated with revenue generation and that the payroll/revenue quartiles are
static in membership. Although there is little doubt that clubs in markets with greater revenue
14 Vrooman offers the curious observation that the increased movement of free agents towards large markets is responsible for improving standard measures of competitive balance. Talented small market clubs are broken up more quickly and brought back to mediocrity. Many of the larger market clubs who sign free agents do so inefficiently and do not obtain gains corresponding to the small market clubs’ losses. The result is that all parties wallow in mediocrity. This provides strong measurements of balance, but may be detrimental to the overall product.
16
potential have historically been more successful, the test here is to determine whether
progressive revenue sharing has augmented the problem.
The definitive empirical examination tracks actual player movement between clubs. The
initial test is to determine whether progressive revenue sharing, in both formulations, has altered
transfer dynamics in MLB, all else constant. The effects of progressive revenue sharing on the
flows of transferring players between clubs, based on revenue characteristics and club quality
separately, for each of the three collective bargaining agreements represented in the sample
period, are further analyzed. Should productive players be more likely to transfer away from,
and less likely to transfer toward, lower revenue producing clubs, all else constant, support is
provided for the hypothesis that progressive revenue sharing brings on negative incentives for
low revenue clubs to procure talent.
The data are derived from the set of 10,270 player-year observations for all MLB
position-players from the 1990 through the 2005 championship seasons. We eliminate the 1,795
players that exited MLB the season immediately following the observation year. The sample is
further restricted to statistically relevant performance statistics by eliminating all observations
representing fewer than thirty plate appearances.15 The analysis presented here also removes all
within-season transfers, so as to focus on only the between-season labor market. The final
analysis represents a total of 6,935 player year observations, and includes 1,790 trades, sales, and
free agent signings completed during the inter-season trading markets each year.16
Club-year characteristics that reveal motivation for participation in the between-season
labor market are the focus of the analysis. The inter-season transfer market, comprised primarily
of trades and free agent signings, is motivated by the club’s assessment of each player’s marginal
15 Players year observations representing for the fifty-one transfers to expansion clubs in 1994 and 1998 are also eliminated because club differences cannot be calculated or estimated. 16 For the inter-season analysis player-year observations individual performance statistics reflect seasonal totals and one observation per player per year.
17
revenue product (MRP). Players move toward their high-value user given this market is
sufficiently lacking restrictions. Without significant disparity in revenue generating potential,
variation in clubs’ current talent quality drives the market. A productive player’s expected
marginal product will be greater for lower performing clubs setting in motion a natural flow of
talent from better to worse performing clubs. Likewise, when variation in revenue generation is
included in the equation, talent flows toward higher revenue producers are expected, because a
player’s expected MRP increases in such cases.
In order to evaluate whether progressive revenue sharing has altered the flow of talent
between teams, the variables win percent and normalized gate revenue for the clubs employing
the player in the seasons surrounding the transfer are incorporated.17 Variables on player
characteristics, performance, and league modifications expected a priori to influence the
likelihood of transfer are included for each observation. Individual player attributes include
measures of performance and playing time, negotiation status, and whether the player has
previously transferred. LOGIT models test the significance of these factors to the probability
that a given player transfers to another club.
(8) TRANSFERit= β0 + β1 FA +β2PRESWITCHit + β3PRODit + β4NLt +
β5TEAMSt + β61997BA + β72003BA + β8WINtit +β9WINtit+1 +β10GATEtit
+β11GATEtit+1+ e.
The variables are defined as follows.
TRANSFERit: A binomial dummy variable, coded 1 if the player-year observation indicates a
transfer to another MLB club with the succeeding observation, 0 otherwise.
FA it: A binomial dummy variable, coded 1 if the player year observation indicates free agent
status at the completion of year t, 0 otherwise. Players with six or more years of MLB service are
17 Gate revenue is chosen as a proxy for local revenue as it is the best revenue source for which data is available throughout the entire sample period.
18

granted free agent status at the end of a current contract and may initiate transfers, while others
may transfer only at club discretion. Free agent status is also granted to significant number of
players following their release by a club. Player transaction records, as reported by
Retrosheet.org, do not distinguish the two types of free agents.
PRESWITCHit: A binomial dummy variable, coded 1 if the player year observation indicates a
previous transfer so that the player was no longer with his original MLB club to start year t, 0
otherwise. A player who has never transferred may have greater firm specific human capital, or
clubs may act irrationally to sunk costs, as they have more player development costs invested in
players trained in their minor league systems. Either scenario yields an a priori positive
coefficient estimate.
PRODit: A vector of variables that indicate the player’s production during the observation year.
Slugging Average (SA) is employed to capture skill independent of club factors. Plate
appearances (PA) (projected to 162 game estimates for the strike-shortened 1994 and 1995
seasons) specify a playing time aspect of performance.
WINtit: The win percent of player i’s year t club in year t.
WINtit+1: The win percent of player i’s year t+1club in year t.
GATEtit: The normalized gate revenue (the ratio of each club’s total gate revenue to the MLB
mean gate revenue for each year t) player i’s year t club in year t.
GATEtit+1: The normalized gate revenue of player i’s year t+1 club in year t.
TEAMSt: The total number of MLB clubs in each observation year. (1990-92, n = 26; 1993-97, n
= 28; 1998-2005, n = 30). An increase in the number of clubs potentially increases the pool of
potential trading partners.
NLt: A binomial dummy variable coded 1 for player-year observations on National League clubs
in year t and 0 for American League clubs. A significant rule difference, potentially affecting
19
talent flows, is that American League clubs employ a designated hitter. The expectation is that
this may increase the flow of older talent, or those otherwise less able to play a fielding position
away from NL clubs.
90-96BA: A dummy variable representing the sample years not effected by progressive revenue
sharing. The years 1990-1996 are coded 1, and coded 0 otherwise.
1997BA: A dummy variable capturing the effects of the 1997 Basic Agreement. The years 1997-
2002 are coded 1, and coded 0 otherwise.
2003BA: A dummy variable capturing the effects of the 2003 Basic Agreement. The years 2003-
2005 are coded 1, and coded 0 otherwise.
e: disturbance term E(e) = 0 and Var (e) = σe2.
The 2005 player year observations include a TRANSFER code for players based on their
club assignment for the 2006 season. Therefore, all between-season trading and signing periods
covered by the 2003BA are included.
To isolate the specific effects of each progressive revenue plan on talent flows, a LOGIT
equation incorporating interaction is constructed.
(9) TRANSFERit= β0 + β1 FA +β2PRESWITCHit + β3PRODit + +β4NLt +
β5TEAMSt + β690-96BA*WINtit + β71997BA*WINtit +
β82003BA*WINtit+β990-96BA*WINtit+1+ β101997BA*WINtit+1+
β112003BA*WINtit+1 + β1290-96BA*GATEtit+ β131997BA*GATEtit +
β142003BA*GATEtit +β1590-96BA*GATEtit+1 + β161997BA*GATEtit+1+
β172003BA*GATEtit+1 +eit.
The variables corresponding to β6 — β17 replace the variables WIN and GATE with
interaction variables created as the product of each WIN and GATE and the binomial value
representing each of the three collective bargaining periods. Negative coefficient estimates for
20
GATEtit indicate the probability of transfer increases for players on lower revenue clubs; and
negative coefficient estimates for GATEtit+1 indicate the probability of transfer decreases for
players moving toward lower revenue clubs. Should the interaction terms corresponding to each
progressive revenue sharing period reveal greater coefficient estimates, there is substantiation
that progressive revenue sharing has amplified the large market dominance/small market failure
dimension of competitive balance. Summary statistics for the all years, and separately for each
collective bargaining period, are reported in Table 3.
(INSERT TABLE 3 ABOUT HERE)
The summary statistics show that transfer rates increased significantly with each
successive collective bargaining period. Statistics are shown for the full sample, and for players
in the top performance quartile each season, as determined by a simple sum of their plate
appearances and slugging average (multiplied by 1,000). The top quartile of productive players
have lower transfer rates, but clearly this group also reflects the trend of increased transfers since
the implementation of the 2003BA. Also of note, when comparing each period, are the
significant variation in the mean performance variables. Performance averages increased
significantly for all groups during the 1997BA period. The 2003BA period shows a modest
decline in slugging average for the top quartile in comparison to the 1997BA period, but
averages continue to exceed the years before progressive revenue sharing. Variation in the win
percent statistics show that on average players transfer to lesser clubs, except during the
1997BA. The gate revenue statistics shows that players transfer to clubs with greater revenue.
This trend is significantly amplified for both groupings of players with the 2003BA.
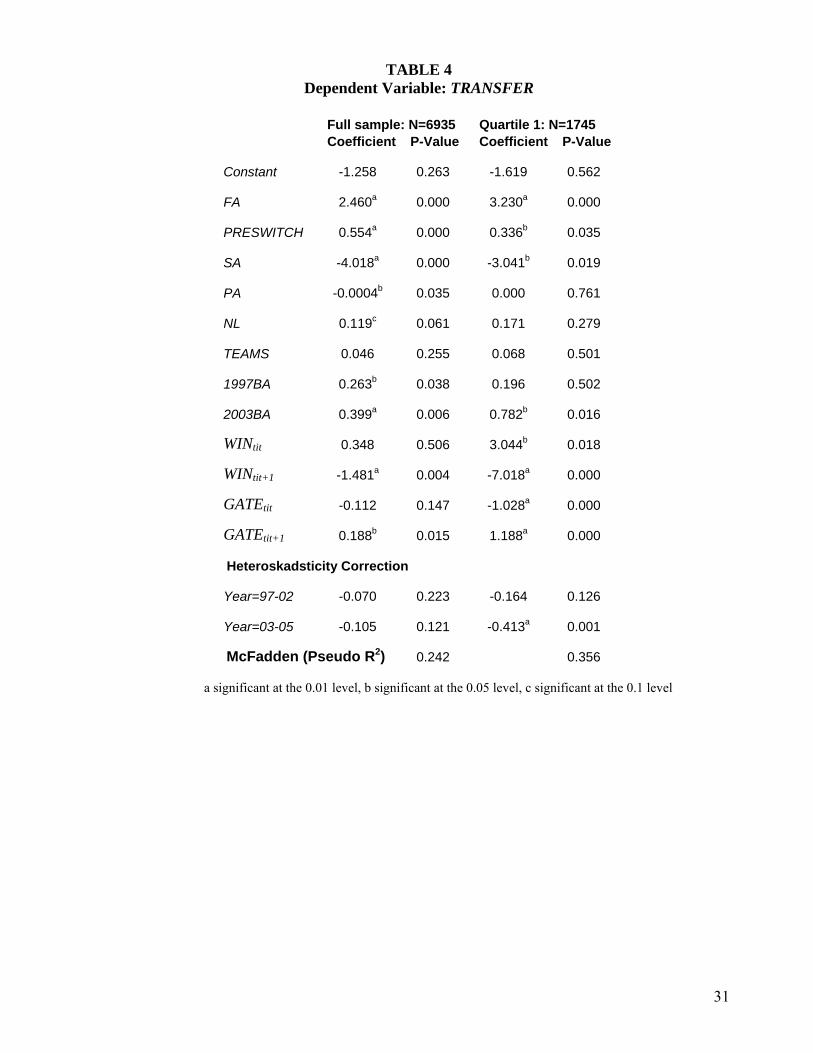
The LOGIT regression estimates for model one are reported in Tables 4. The coefficient
estimates are adjusted for heteroskedacticity. Given that summary statistics reveal considerably
more variation in production and GATE, between collective bargaining periods, the assumption
21
is logical. Although the adjustments do not always yield statistically significant results, each
equation reflects the correction.
(INSERT TABLE 4 ABOUT HERE)
The regression results are consistent with the a priori predictions. Free agents and
players that have previously changed clubs are significantly more likely to transfer. Lower levels
of performance indicate a greater likelihood of transfer. The results imply that players transfer
away from NL clubs and provide tepid evidence that players are more likely to transfer with the
addition of more clubs. The regression coefficient estimates for WIN indicate that players are
more likely to transfer from clubs with higher, to clubs with lower, win percentages and this is
most evident for the most productive quartile. The estimates for GATE indicate that all groupings
of players are more likely to transfer from clubs with lower, to clubs with and higher, gate
revenues. Both results are consistent with an MRP explanation motivating transfers. Positive
coefficient values are consistent for 1997BA and 2003BA indicating that, all else constant, the
probability of transfer has increased with the implementation of progressive revenue sharing,
most visibly for productive players, since the implementation of the 2003 BA.
Model 2 estimates, which include the interaction terms, are shown in Table 5, and reveal
more definitive conclusions about the effects of progressive revenue sharing on talent flows.
First, the movement from higher to lower win percent clubs is amplified considerably with the
2003BA. This in context with the deviation in the GATE coefficient estimates indicates a
categorical alteration of talent flows. Most importantly, the lower club revenue, the more likely
top quartile players are to transfer from that club, in both periods of progressive revenue sharing.
Prior to 1997, there is no indication that the gate revenue of the player’s current team affected
likelihood of transfer. Furthermore, for the entire set of observations, and those in the top
22

quartile, the probability of transfer toward higher gate revenue clubs, indicated by GATEtit+1,
increased significantly with the 1997BA. The moderation of this trend consistent with the
2003BA suggests the reformulated luxury tax of that collective bargaining agreement was
effective. Although the results in Table 5 indicate a definitive alteration of talent flows, there is
no particular explanation for the overall increase in transfer rates. Nonetheless, revealed is a
primary piece of evidence to support the hypothesis that progressive revenue sharing has altered
talent flows in such a way that competitive balance is adversely affected. Since the
implementation of progressive revenue sharing, the most productive talent is more likely to flow
away from lower revenue producing clubs and toward higher revenue producing clubs. Whereas,
prior to 1997, revenue differences between clubs involved in the transfer of a player was not a
significant factor.
The above analysis indicates a significant alteration in the talent movement given the
changes brought about by progressive revenue sharing. Notwithstanding, isolation of the effects
on the lowest revenue producing clubs is in need of further corroboration. Clubs in the lowest
revenue quartile are argued to have the greatest incentive to reduce their level of talent
procurement. For the purpose of isolating these groups, the sample was restricted to transfer
observations only, and dependent variables are developed to indicate the player has transferred
either to or from revenue quartile four. The dependent variable indicates, that given a player has
transferred, the probability of transfer to or from a quartile four team.
(10) REVQnt =β0 + β1 FA +β2PRESWITCHit + β3PRODit + β4NLt + β5TEAMSt + β61997BA
+ β72003BA + β8WINtit +β9WINtit+1 +β10GATEtit +β11GATEtit+1+ e.
Where REVQnt is defined as, respectively:
23

REVQ4t: A dummy variable coded 1 for clubs in the bottom total revenue generating quartile for
the observation year (the lowest six revenue producers in 1990-92 and the lowest seven 1993-
2005) 0 otherwise. The variable indicates that the player transferred from a quartile four club.
REVQ4t+1: A dummy variable coded 1 for the player’s t+1 club when in the bottom revenue
generating quartile for the observation year t. 0 otherwise. The variable indicates that the player
transferred to a quartile four club.
Estimates for these models for all transfer observations and observations for players in
the top two performance quartiles are shown in Tables 6A and 6B.
(INSERT TABLE 6A & 6B ABOUT HERE)
The results provide discernible support for the hypothesis. Table 6A clearly indicates
that since progressive revenue sharing, players that transfer are significantly less likely to move
to quartile four clubs. Table 6B presents a conundrum. Since to progressive revenue sharing,
transferring players are significantly less likely to leave quartile four clubs, although the
difference waned somewhat since the 2003BA. Perhaps this indicates that quartile four clubs
have increasingly fewer players of value to higher revenue clubs. The combination of slowed
movements both toward and away low gate revenue clubs indicates less participation in the inter-
season labor market relative to other clubs, even as overall market activity has increased over
time. This is consistent with the hypothesis that the progressive revenue sharing has created an
incentive for low revenue clubs to divest their talent. Taken as a whole, the results provide
considerable support that the provisions of progressive revenue sharing have clearly altered the
incentives in regard talent procurement for low revenue producers. A corresponding, increase in
payroll dispersion and competitive imbalance over this period provides support for the
hypothesis that the changes were not as intended, by those hoping for an improvement in
24

competitive balance. There is evidence that progressive revenue sharing created a disincentive
to win for low revenue producing clubs.
5. Conclusions and Suggestions for Further Research
The results imply that flow of talent is significantly altered with progressive revenue
sharing. The outcome is a mildly adverse effect on overall competitive balance when compared
to the immediately preceding years. The analysis also presents some challenges. The revenue
dispersion statistics show growing imbalance in gate revenue and improved variation in total
revenue, yet only after redistribution. This brings about additional questions about the
relationship between club revenue sources, incentives to win, and payroll.
Logically the revenue elasticity to winning varies considerably across revenue sources.
Gate revenue is theoretically highly winning-elastic. Local broadcast revenue, given long-term
contracts, is expected to be less elastic. Given profit-maximizing assumptions about owners,
revenue from central sources should be unrelated to winning or perhaps, as has been shown here,
inversely related to winning. Rigorous analysis of the connection between the effect of winning
and the associated incentives toward talent procurement on the various revenue streams and the
correlation between those revenue streams and payroll may yield better-informed conclusions
about the effects of both in-place and proposed revenue sharing plans.
Additionally much analysis of sports leagues has had an implicit single period
orientation. The puzzles of why low revenue clubs actually increase their payroll, why some
middle to high revenue clubs—Cleveland and Baltimore during the studied time period for
example—periodically make significant payroll reductions. Furthermore, the effects of the
luxury tax may be better understood given a multi-period analysis. Intra-season transfers, not
evaluated here, theoretically imply that clubs have routinely shown a willingness to trade present
25
wins for future wins. It is likely that the progressive subsidies have increased the opportunity
cost of present wins for some clubs. Perhaps low revenue clubs took the opportunity to divest
and collect a large subsidy, which is reinvested by developing young talent for the future. Low
revenue clubs such as Minnesota, and Florida, showed considerably improved on-field
performance, since the 2001 season. Others, such as Kansas City and Tampa Bay, wallowed at
the bottom of payroll rankings and the standings throughout the progressive sharing era.
Analysis of talent flows over time by club, and the relationship to winning and various revenue
streams, may shed additional light on these issues.
6. References
Associated Press 2004 “Revenue sharing disparities keep growing: Top MLB clubs continue to
pay more to small-market squads” Accessed from http://www.msnbc.msn.com/
Atkinson, S., Stanley, L., and Tschirhart, J. 1988 (Spring). “Revenue Sharing as an Incentive in
an Agency Problem: an Example from the National Football League.” Rand Journal of
Economics, 9 (1) 27-43.
Daly, G. and Moore, W. 1981 “Externalities, Property Rights, and the Allocation of Resources in
Major League Baseball.” Economic Inquiry. 19 (1) 77-95.
Eckard, E.W. 2001 “Baseball’s Blue Ribbon Economic Report: Solutions in Search of a
Problem” Journal of Sports Economics. 2 (3). 213-227.
Fort R. 2001. “Revenues, Payrolls and Competitive Balance in Major League Baseball,"
Working Paper, Department of Economics, Washington State University.
__________ 2007. Sports business pages. Accessed from rodneyfort.com
26
Fort R. and Quirk, J. 1995 (September). “Cross-Subsidization, Incentives, and Outcomes in
Professional Team Sports.” Journal of Economic Literature. 33 (3). 1265-99.
Hadley, L., Ciecki, J., and Krautmann, A. 2005 (November) “Competitive Balance in the Aftermath of the 1994 Players’ Strike” Journal of Sports Economics. 6 (4) 379-389.
Hall, S., Szymansky, S., and Zimbalist, A. 2002 (April). “Testing Causality between Team
Performance and Payroll: The cases of Major League Baseball and English Soccer”.
Journal of Sports Economics. 3 (2). 149-168.
Humphreys B. 2002 (April). “Alternative measures of Competitive Balance in Sports Leagues”
Journal of Sports Economics. 3. (2) 133-148.
Kesenné, S. 2000 (February). “Revenue Sharing and Competitive Balance in Team Sports.”
Journal of Sports Economics. 1 (1). 56-65.
Lahman, S. 1996-2007. “The Lahman Baseball Database”. Accessed from
http://www.baseball1.com
Levin, R.C., Mitchell, G. J., Volcker, P. A., and Will, G. F. 2000 “The Report of the Independent
Members of the Commissioner’s Blue Ribbon Panel on Baseball Economics” New York:
Major League Baseball.
Major League Baseball. 1997. 1997-2000 (2001) Basic Agreement.
Major League Baseball. 2001 “Updated Supplement to the Report of the Independent Members
of the Commissioner’s Blue Ribbon Panel on Baseball Economics” New York: Major
League Baseball.
Major League Baseball. 2003. 2003-2006 Basic Agreement.
Major League Baseball. 2007. 2007-2011 Basic Agreement.
Marburger, D.R. 1997 (April). “Gate Revenue Sharing and Luxury Taxes in Professional
Sports” Contemporary Economic Policy. 15 (2) 114-123.
27

Maxcy, J.G. 2002 (April), “Rethinking Restrictions on Player Mobility in Major League
Baseball” Contemporary Economic Policy. 20 (2) 145-159.
Quirk, J. and El Houdari, M. 1971 (April/May). “An Economic Model of a Professional Sports
League” Journal of Political Economy 79 (6) 1302-1319.
Quirk, J. and Fort, R. 1992. Pay Dirt: The Business of Professional Team Sport. Princeton NJ:
Princeton University Press.
Rascher, D. 1997. “A Model of a Professional Sports League” in Wallace Hendricks (Ed.)
Advances in the Economics of Sport. Greenwich, CT: JAI Press. 27-76.
Retrosheet.org. 2001-2007, “Directory of Players” Accessed from http://www.retrosheet.org/
Syzmanski, S. 2003 (December) “The Economic Design of Sporting Contests” Journal of
Economic Literature 41 1137–1187
Syzmanski, S. and Kesenné, S. 2004 (March) “Competitive Balance and Gate Revenue Sharing
in Team Sports” The Journal of Industrial Economics 52 (1) 165-177
Vrooman, J. 1995 (July). “A General Theory of Professional Sports Leagues.” Southern
Economic Journal. 61 (4). 971-990.
Vrooman, J. 1996 (October). “The Baseball Players’ Labor Market Reconsidered”. Southern Economic Journal. 63 (2) 339-360. Zimbalist, A. 1994. Baseball and Billions, Second Edition. New York: Harper Collins
Zimbalist, A. 2006. “New MLB labor deal corrects earlier flaws, lays foundation for growth”
Street & Smith’s Sports Business Journal 9 (27, November 6) 27.
28
7. Tables
TABLE 1 Coefficient of Variation
Year Payroll Total Revenue Gate Revenue 1990 0.222 0.304 0.374 1991 0.252 0.289 0.367 1992 0.304 0.281 0.364 1993 0.304 0.256 0.333 1994 0.263 0.292 0.339 1995 0.278 0.387 0.417 1996 0.314 0.300* 0.477 1997 0.339 0.334* 0.525 1998 0.375 0.327* 0.528 1999 0.445 0.329* 0.530 2000 0.393 0.292* 0.525 2001 0.379 0.296* 0.491 2002 0.366 0.291* 0.558 2003 0.396 0.248* 0.578 2004 0.475 0.254* 0.619 2005 0.469 0.210* 0.546
90-2005 0.348 0.293 0.475 90-96 0.277 0.301 0.382
97-05 0.404a 0.281 0.544a
(T Value Difference) -6.27 -0.694 -7.19 * After redistribution of pooled revenues, a significant at the .01 level
TABLE 2 Competitive Balance Measures
Standard Deviation of Win Percent Spearman's Rank Coefficient Year AL NL MLB AL NL MLB 1990 0.057 0.057 0.057 0.171 -0.059 0.065
1991 0.061 0.061 0.061 0.468 -0.374 0.079
1992 0.063 0.066 0.064 0.369 0.157 0.271 1993 0.055 0.093 0.073 -0.020 0.112 0.046 1994 0.068 0.072 0.058 0.527 0.475 0.501
1995 0.083 0.060 0.071 0.189 0.431 0.310 1996 0.069 0.056 0.062 0.673 0.429 0.551 1997 0.062 0.058 0.06 0.490 0.136 0.313 1998 0.081 0.088 0.085 0.234 0.440 0.343 1999 0.076 0.079 0.077 0.835 0.531 0.673 2000 0.054 0.069 0.061 0.512 0.543 0.528 2001 0.095 0.065 0.08 0.714 0.462 0.580 2002 0.106 0.081 0.091 0.732 0.810 0.774 2003 0.098 0.070 0.083 0.835 0.653 0.738 2004 0.083 0.086 0.083 0.415 0.697 0.566 2005 0.081 0.055 0.067 0.789 0.609 0.693
90-2005 0.074 0.070 0.071 0.496 0.378 0.439 90-96 0.065 0.066 0.064 0.340 0.167 0.260 97-05 0.082 0.072 0.076 0.617 0.542 0.579
t-value* -2.32b -0.95 -2.69a -2.46b -2.97a -3.43a
*Difference in means before and after progressive revenue sharing a significant at the 0.01 level, b significant at the 0.05 level,
29
TABLE 3 Summary Statistics
1990-2005 1990-1996 Full Sample Quartile 1 Full Sample Quartile 1
6935
Observations 1745
Observations 2920
Observations 738
Observations Mean SD Mean SD Mean SD Mean SD
TRANSFER 0.258 0.438 0.160 0.367 0.231 0.421 0.150 0.358
FA 0.183 0.387 0.127 0.333 0.180 0.384 0.134 0.341
PRESWITCH 0.498 0.500 0.485 0.500 0.446 0.497 0.427 0.495
SA 0.406 0.093 0.485 0.074 0.393 0.092 0.469 0.071
PA 366.7 212.9 632.5 67.2 357.7 209.8 619.5 69.1
NL 0.509 0.500 0.472 0.499 0.487 0.500 0.442 0.497
TEAMS 28.7 1.517 28.7 1.5 27.2 0.99 27.2 0.99
WINtit 0.499 0.071 0.513 0.069 0.499 0.063 0.509 0.065
WINtit+1 0.498 0.071 0.512 0.069 0.498 0.064 0.508 0.064
GATEtit 0.998 0.470 1.061 0.511 0.998 0.378 1.051 0.404
GATEtit+1 1.001 0.473 1.075 0.511 0.999 0.376 1.051 0.404 1997-2002 2003-2005
Full
Sample Quartile 1 Full Sample Quartile 1
2692
Observations 674
Observations 1323
Observations 333
Observations Mean SD Mean SD Mean SD Mean SD
TRANSFER 0.262 0.440 0.147 0.354 0.310 0.463 0.210 0.408
FA 0.168 0.374 0.111 0.315 0.219 0.414 0.141 0.349
PRESWITCH 0.532 0.499 0.521 0.500 0.542 0.498 0.541 0.499
SA 0.415 0.094 0.499 0.077 0.416 0.089 0.491 0.067
PA 370.1 214.9 640.9 65.6 379.6 214.7 644.2 61.20
NL 0.525 0.499 0.493 0.500 0.526 0.500 0.498 0.501
TEAMS 29.7 0.73 29.7 0.73 30 0.00 30 0.00
WINtit 0.499 0.076 0.515 0.073 0.499 0.076 0.520 0.070
WINtit+1 0.499 0.075 0.515 0.073 0.496 0.078 0.514 0.074
GATEtit 0.999 0.515 1.057 0.540 0.997 0.550 1.092 0.644
GATEtit+1 1.005 0.517 1.077 0.538 0.999 0.563 1.122 0.648
30
31
TABLE 4 Dependent Variable: TRANSFER
Full sample: N=6935 Quartile 1: N=1745 Coefficient P-Value Coefficient P-Value
Constant -1.258 0.263 -1.619 0.562
FA 2.460a 0.000 3.230a 0.000
PRESWITCH 0.554a 0.000 0.336b 0.035
SA -4.018a 0.000 -3.041b 0.019
PA -0.0004b 0.035 0.000 0.761
NL 0.119c 0.061 0.171 0.279
TEAMS 0.046 0.255 0.068 0.501
1997BA 0.263b 0.038 0.196 0.502
2003BA 0.399a 0.006 0.782b 0.016
WINtit 0.348 0.506 3.044b 0.018
WINtit+1 -1.481a 0.004 -7.018a 0.000
GATEtit -0.112 0.147 -1.028a 0.000
GATEtit+1 0.188b 0.015 1.188a 0.000
Heteroskadsticity Correction
Year=97-02 -0.070 0.223 -0.164 0.126
Year=03-05 -0.105 0.121 -0.413a 0.001
McFadden (Pseudo R2) 0.242 0.356
a significant at the 0.01 level, b significant at the 0.05 level, c significant at the 0.1 level

TABLE 5 Dependent Variable: TRANSFER
Full sample: N=6935 Quartile 1: N=1745 Coefficient P-Value Coefficient P-Value
Constant -0.810 0.494 -0.161 0.957
FA 2.469a 0.000 3.138a 0.000
PRESWITCH 0.554a 0.000 0.322b 0.039
SA -4.046a 0.000 -2.624b 0.042
PA -0.0004b 0.033 0.0002 0.881
NL 0.122c 0.057 0.179 0.242
TEAMS 0.038 0.341 0.024 0.814
90BA*WINtit 0.017 0.983 2.655 0.252
97BA*WINtit -0.425 0.543 1.037 0.532
03BA*WINtit 2.055b 0.032 7.968a 0.000
90BA*WINtit+1 -1.201 0.133 -8.130a 0.001
97BA*WINtit+1 -1.049 0.130 -5.330a 0.003
03BA*WINtit+1 -2.410b 0.011 -9.552a 0.000
90BA*GATEtit -0.077 0.608 -0.206 0.528
97BA*GATEtit -0.058 0.619 -1.298a 0.000
03BA*GATEtit -0.276c 0.055 -1.233a 0.000
90BA*GATEtit+1 -0.059 0.713 0.742b 0.033
97BA*GATEtit+1 0.345a 0.003 1.685a 0.000
03BA*GATEtit+1 0.160 0.257 0.920a 0.003
Heteroskadsticity Correction
Year=97-02 -0.064 0.271 -0.243b 0.039
Year=03-05 -0.109 0.108 -0.550a 0.000
McFadden (Pseudo R2) 0.243 0.369
a significant at the 0.01 level, b significant at the 0.05 level, c significant at the 0.1 level

33
TABLE 6A Revenue Quartile Models for
Dependent Variable: Transfers to Quartile 4
Full sample Performance Quartiles 1&2
Coefficient P-Value Coefficient
P-Value
Constant 6.992a 0.002 15.567a 0.000 FA -0.004 0.970 -0.114 0.626 PRESWITCH -0.006 0.963 -0.015 0.953 SA -0.417 0.581 -1.438 0.480 PA -0.0003 0.390 -0.0004 0.660 NL -0.043 0.698 -0.120 0.573 TEAMS -0.041 0.584 -0.273c 0.068 1997BA -1.120a 0.000 -0.808c 0.075 2003BA -0.754b 0.012 -0.320 0.540 WINtit 0.670 0.474 -0.923 0.569 WINtit+1 1.085 0.187 1.387 0.351 GATEtit -0.170 0.235 0.001 0.998 GATEtit+1 -9.371a 0.000 -11.11a 0.000 Heteroskadsticity Correction Year=97-02 -1.029a 0.000 -0.973399a 0.000 Year=03-05 -0.734a 0.001 -1.01847c 0.067
McFadden (Pseudo R2) 0.613 0.658 a significant at the 0.01 level, b significant at the 0.05 level, c significant at the 0.1 level

34
TABLE 6B Revenue Quartile Models for
Dependent Variable: Transfers from Quartile 4
Full sample: N = 1790
Performance Quartiles 1&2 N = 715
Coefficient P-Value Coefficient P-Value Constant 15.43a 0.000 19.81a 0.003 FA 0.163 0.405 0.166 0.613 PRESWITCH -0.166 0.451 -0.108 0.758 SA 0.265 0.818 -2.703 0.291 PA 0.0004 0.457 0.0004 0.799 NL -0.741a 0.001 -0.787b 0.028 TEAMS -0.269b 0.026 -0.348c 0.083 1997BA -1.021a 0.009 -0.906 0.137 2003BA -0.626 0.132 -0.508 0.444 WINtit 1.869 0.225 -2.204 0.451 WINtit+1 0.801 0.579 3.491 0.111 GATEtit -13.54a 0.000 -14.12a 0.000 GATEtit+1 -0.001 0.998 0.130 0.750 Heteroskadsticity Correction Year=97-02 0.147c 0.075 0.149 0.352 Year=03-05 -0.279 0.139 -0.291 0.328
McFadden (Pseudo R2) 0.576 0.602 a significant at the 0.01 level, b significant at the 0.05 level, c significant at the 0.1 level