Embed Size (px)
Citation preview

Revenue Strategies for a
Business Model in TroubleJeff Hughes
Environmental Finance Center
Mary Tiger
Environmental Finance Center
www.efc.unc.edu
How satisfied are you with your rates
and the revenue they generate?
Not a
t all
– n
eed
an ..
.
Not v
ery
– th
ey n
eed a
...
Som
ewhat
– tw
eaks
...
Ver
y –
no ch
anges
n...
33%
10%
36%
21%
1. Not at all – need
an overhaul
2. Not very – they
need a lot of work
3. Somewhat –
tweaks needed
4. Very – no
changes needed

Session objectives
1. Discuss revenue challenges impacting
availability of funds for capital investment
2. Identify strategies for addressing specific
revenue challenges
1. Consistent undercharging and/or operating
losses
2. Revenue vulnerability
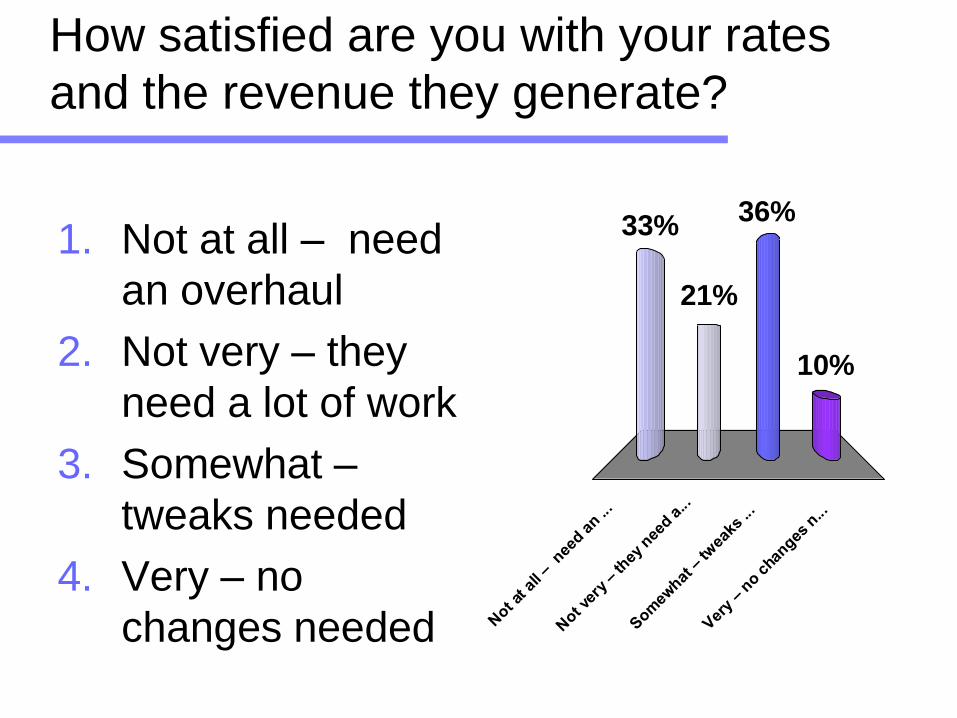
Rates background
Rates (160A-314/153A-277)
Impact charges (160A-314/153A-277)
Assessments (160A, Art.10/153A, Art. 9)
Rates background:
GS 160A-314 /153A-277
A) A city may establish and revise from time to time schedules of rents, rates, fees, charges, and penalties for the use of or the services furnished by any public enterprise……….
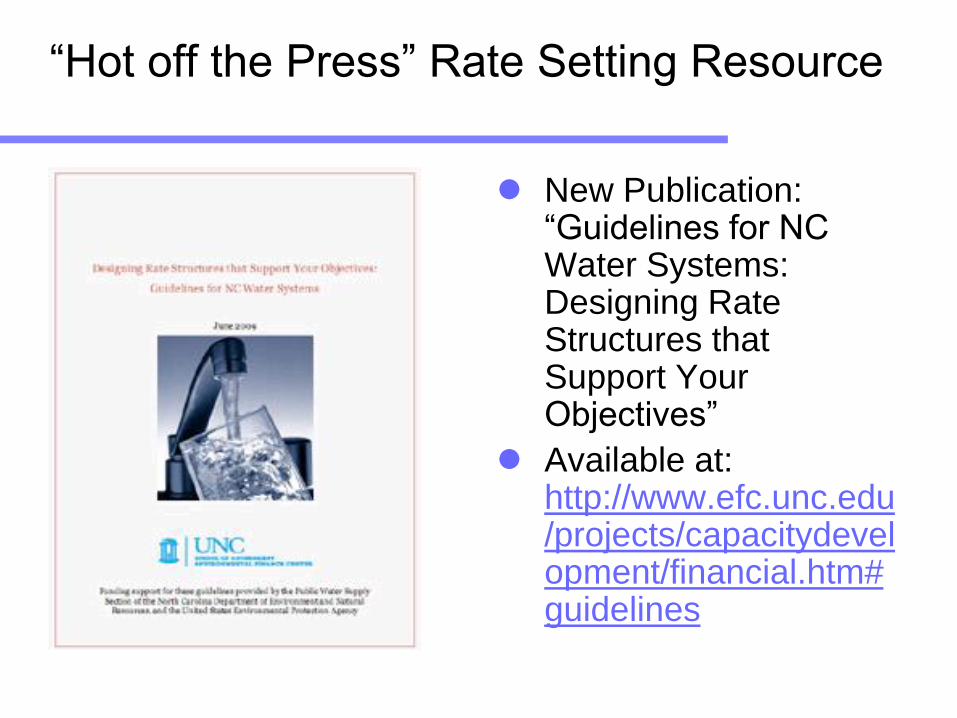
“Hot off the Press” Rate Setting Resource
New Publication: “Guidelines for NC Water Systems: Designing Rate Structures that Support Your Objectives”
Available at: http://www.efc.unc.edu/projects/capacitydevelopment/financial.htm#guidelines
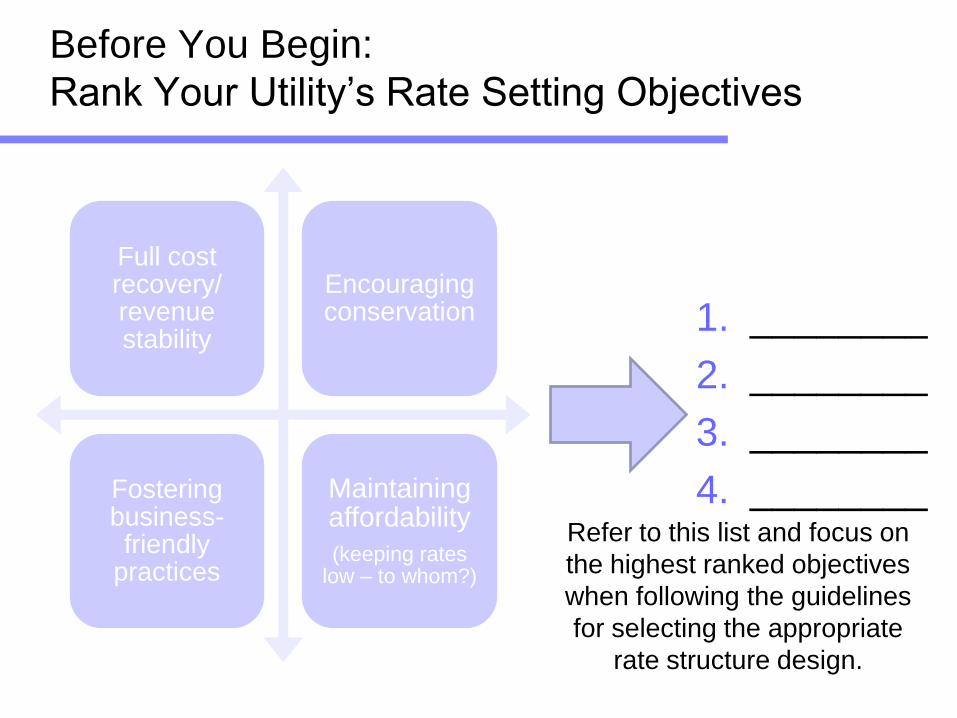
Before You Begin:
Rank Your Utility’s Rate Setting Objectives
1. ________
2. ________
3. ________
4. ________
Full cost recovery/ revenue stability
Encouraging conservation
Fostering business-friendly
practices
Maintaining affordability
(keeping rates low – to whom?)
Refer to this list and focus on
the highest ranked objectives
when following the guidelines
for selecting the appropriate
rate structure design.
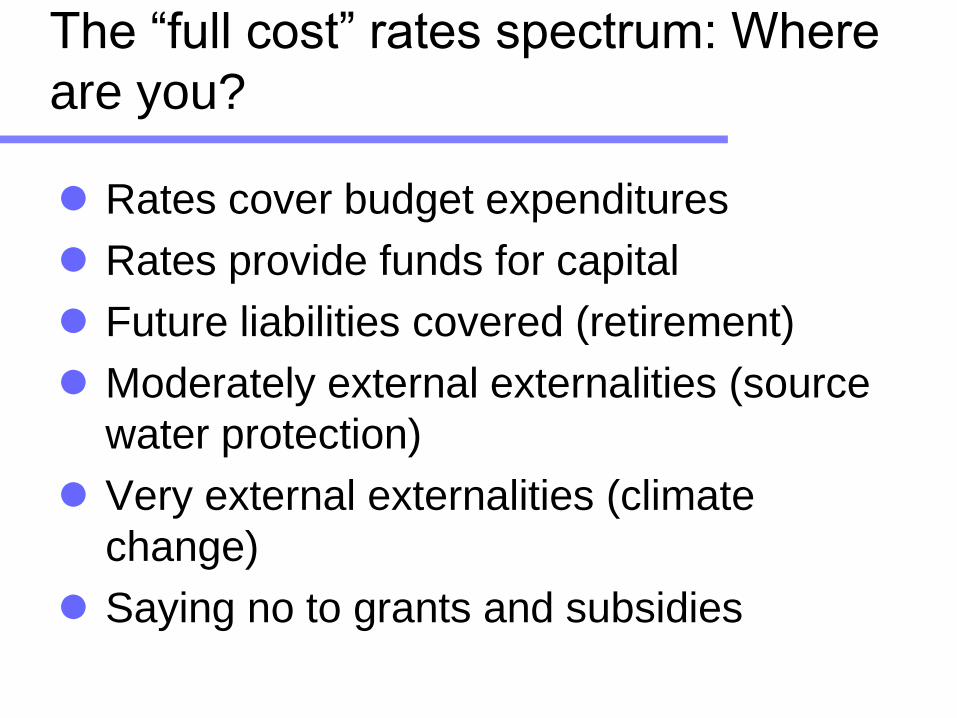
The “full cost” rates spectrum: Where
are you?
Rates cover budget expenditures
Rates provide funds for capital
Future liabilities covered (retirement)
Moderately external externalities (source
water protection)
Very external externalities (climate
change)
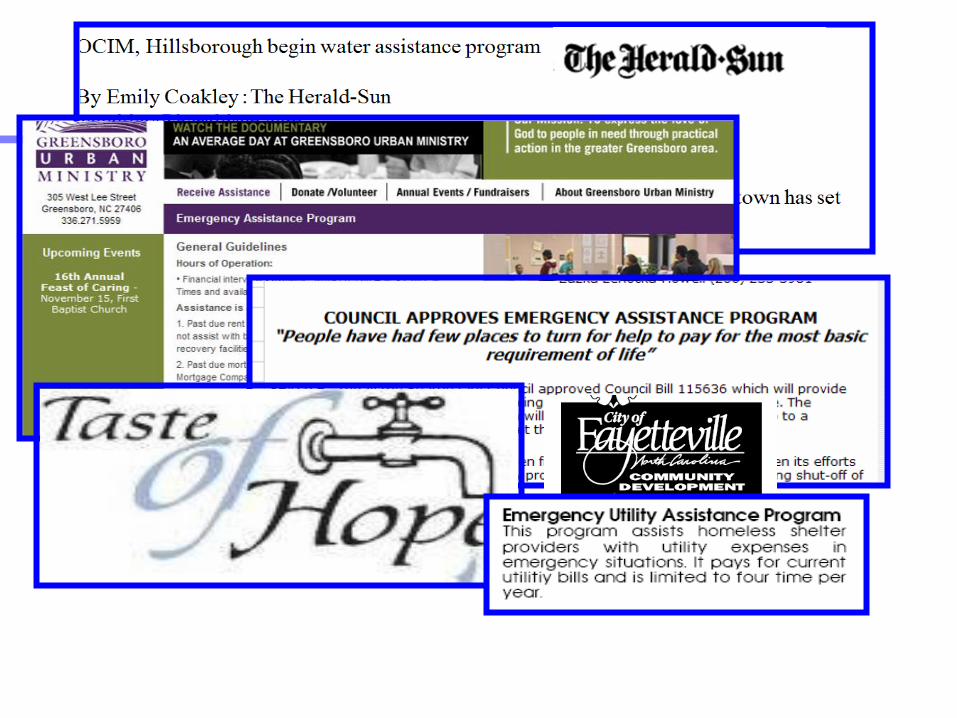
Saying no to grants and subsidies
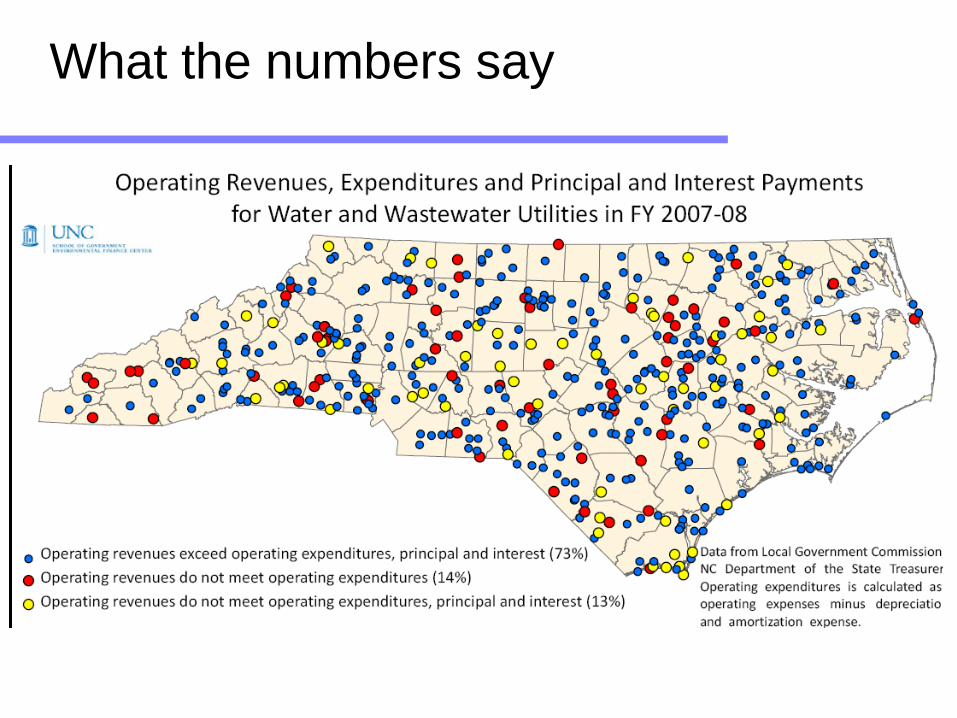
What the numbers say
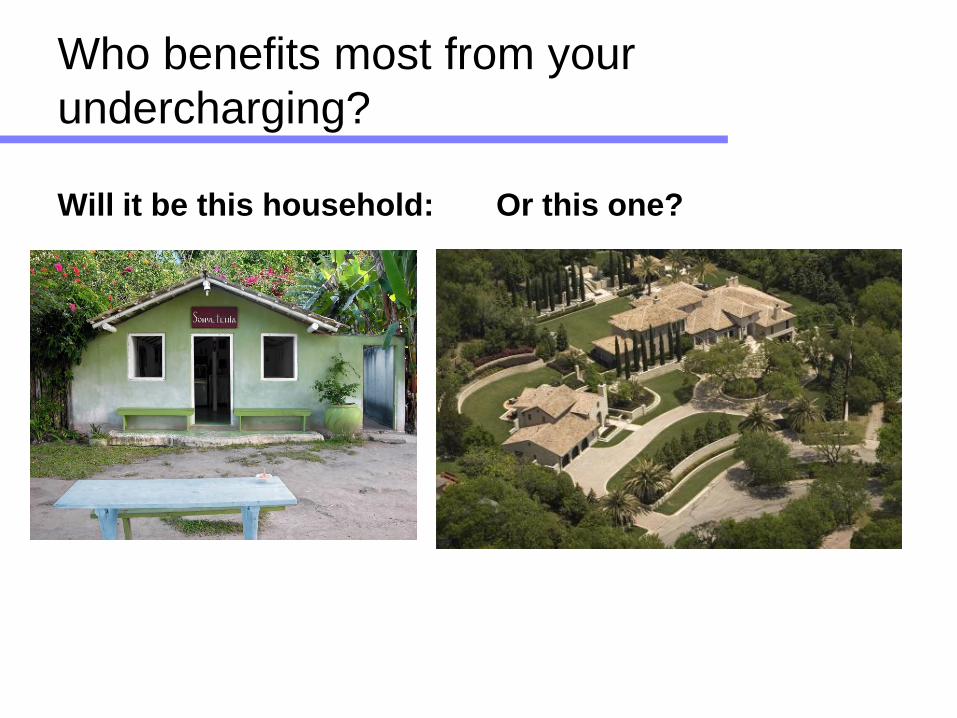
Who benefits most from your
undercharging?
Will it be this household: Or this one?
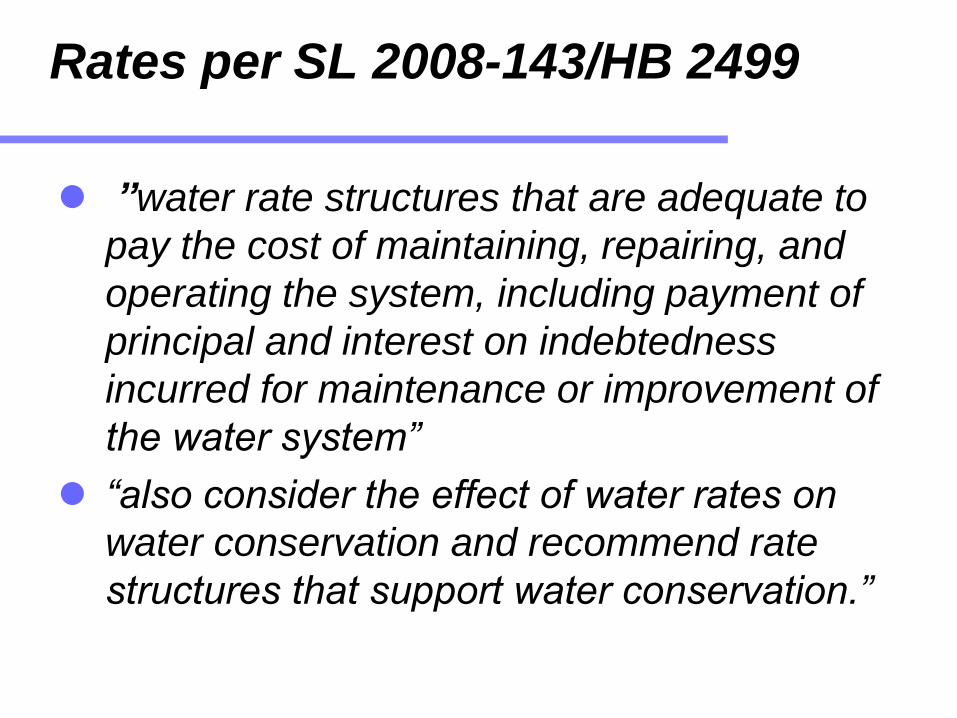
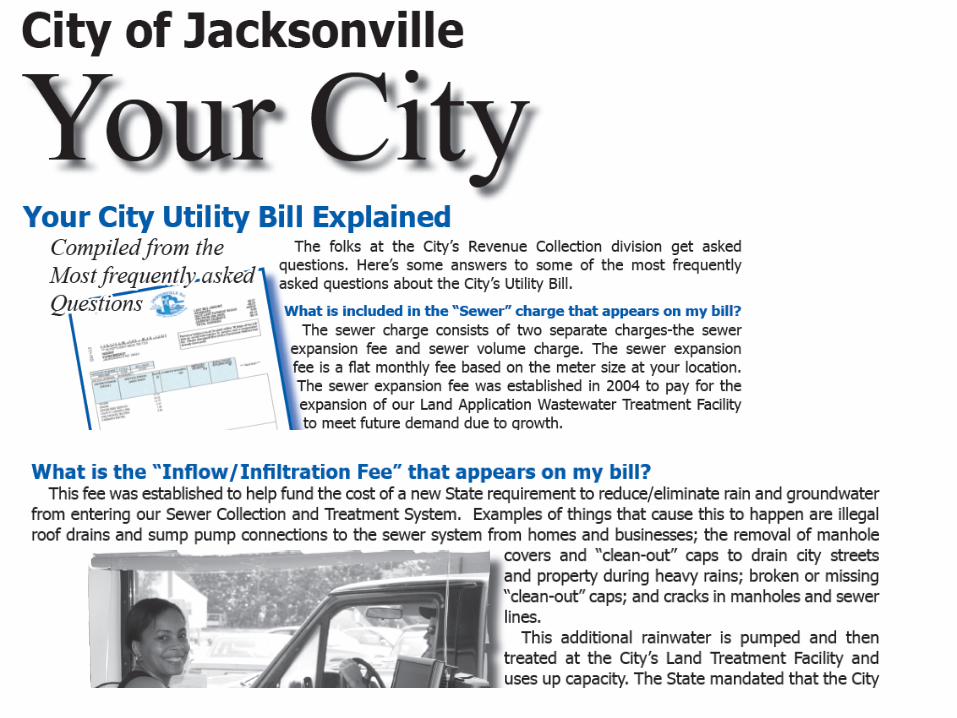
Rates per SL 2008-143/HB 2499
”water rate structures that are adequate to
pay the cost of maintaining, repairing, and
operating the system, including payment of
principal and interest on indebtedness
incurred for maintenance or improvement of
the water system”
“also consider the effect of water rates on
water conservation and recommend rate
structures that support water conservation.”
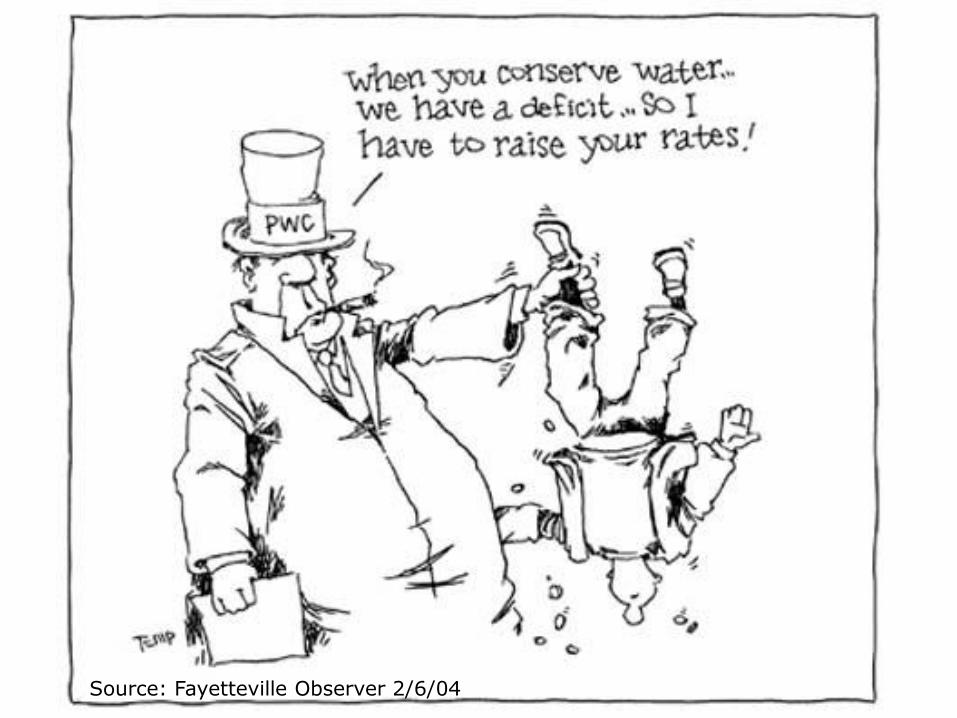
Source: Fayetteville Observer 2/6/04
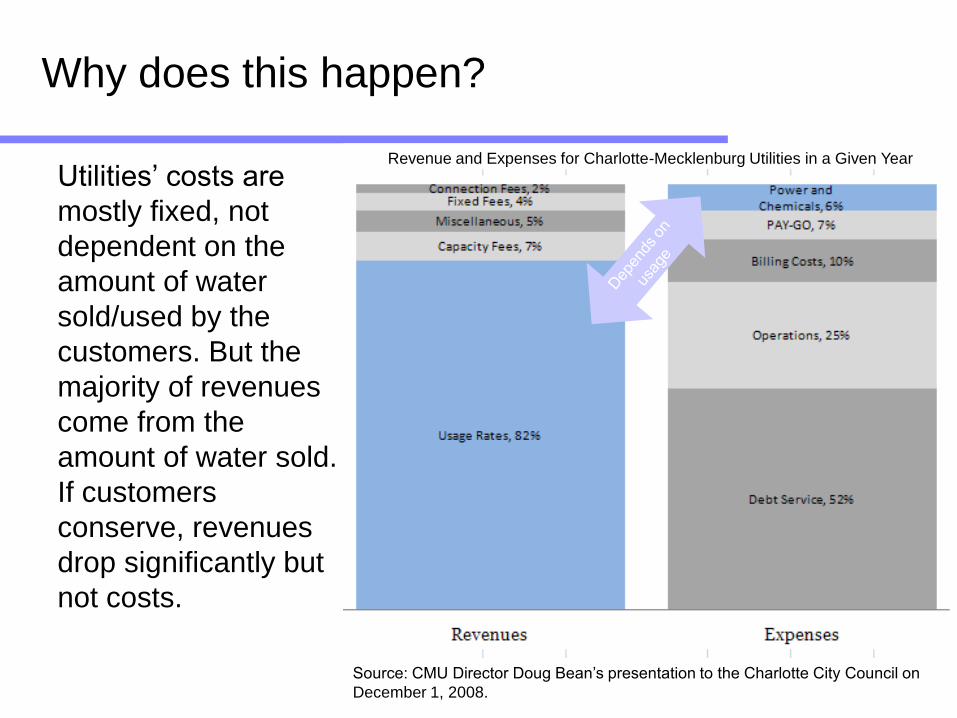
Utilities’ costs are
mostly fixed, not
dependent on the
amount of water
sold/used by the
customers. But the
majority of revenues
come from the
amount of water sold.
If customers
conserve, revenues
drop significantly but
not costs.
Why does this happen?
Revenue and Expenses for Charlotte-Mecklenburg Utilities in a Given Year
Source: CMU Director Doug Bean’s presentation to the Charlotte City Council on
December 1, 2008.
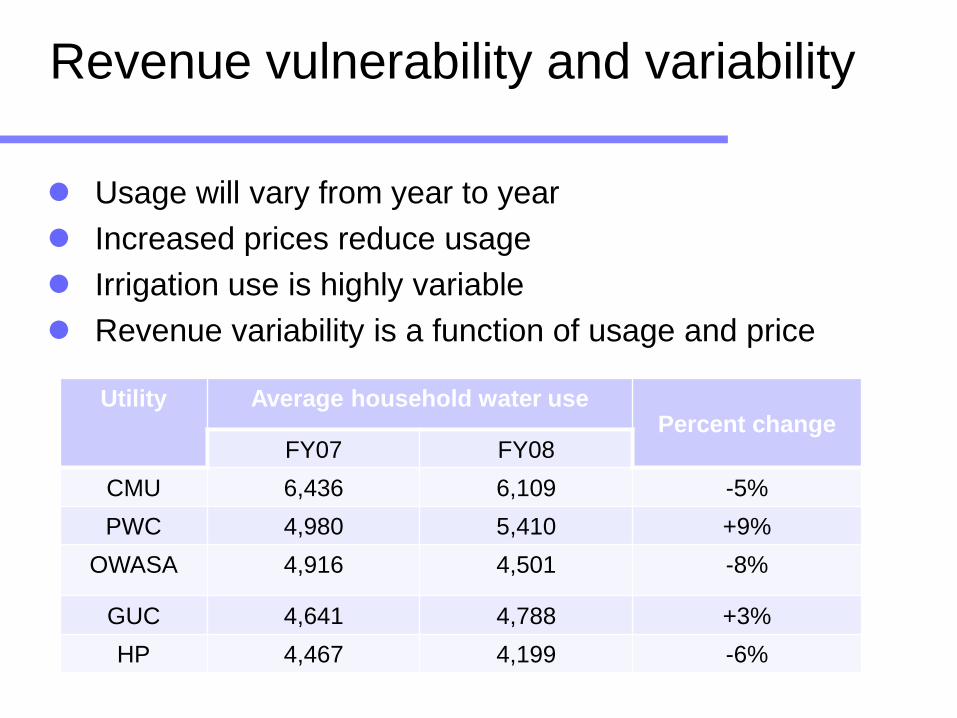
Revenue vulnerability and variability
Usage will vary from year to year
Increased prices reduce usage
Irrigation use is highly variable
Revenue variability is a function of usage and price
Utility Average household water usePercent change
FY07 FY08
CMU 6,436 6,109 -5%
PWC 4,980 5,410 +9%
OWASA 4,916 4,501 -8%
GUC 4,641 4,788 +3%
HP 4,467 4,199 -6%
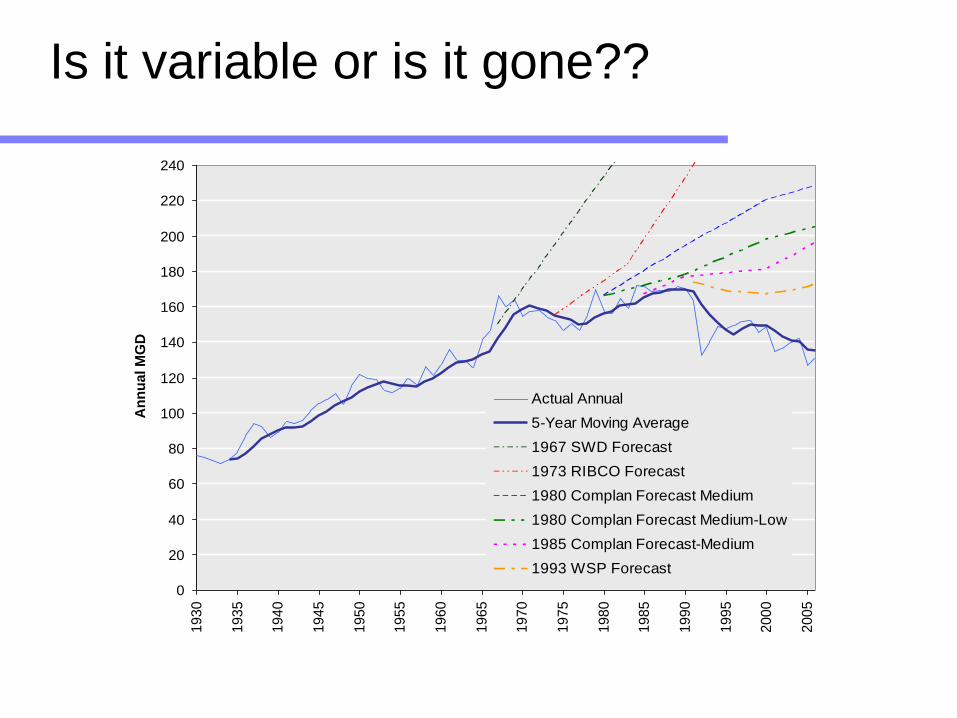
Is it variable or is it gone??
0
20
40
60
80
100
120
140
160
180
200
220
240
1930
1935
1940
1945
1950
1955
1960
1965
1970
1975
1980
1985
1990
1995
2000
2005
An
nu
al M
GD
Actual Annual
5-Year Moving Average
1967 SWD Forecast
1973 RIBCO Forecast
1980 Complan Forecast Medium
1980 Complan Forecast Medium-Low
1985 Complan Forecast-Medium
1993 WSP Forecast
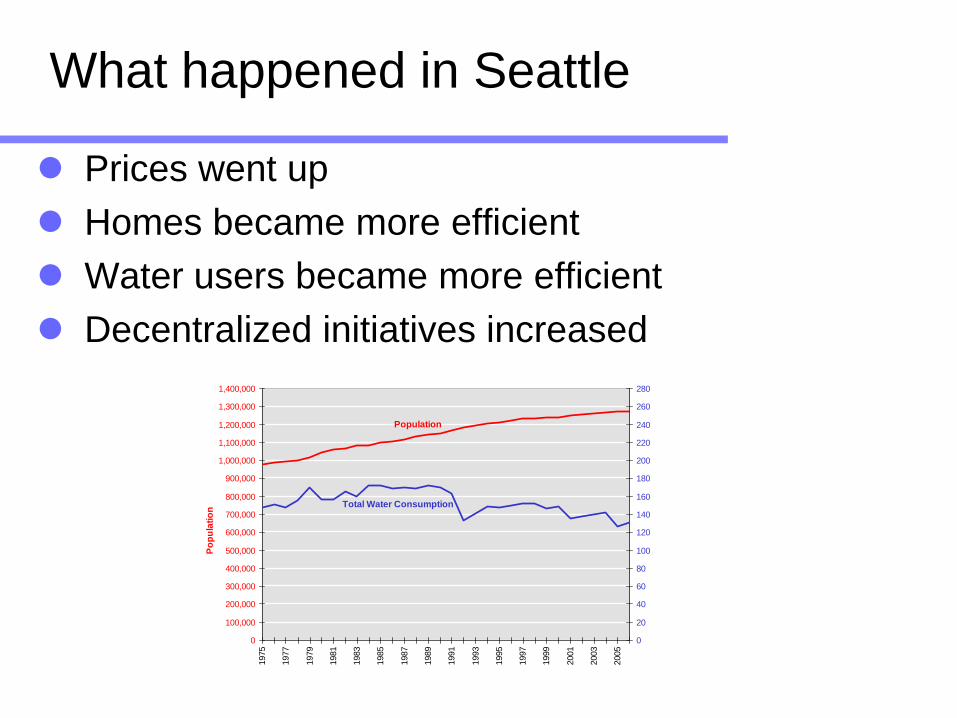
What happened in Seattle
Prices went up
Homes became more efficient
Water users became more efficient
Decentralized initiatives increased
0
100,000
200,000
300,000
400,000
500,000
600,000
700,000
800,000
900,000
1,000,000
1,100,000
1,200,000
1,300,000
1,400,000
1975
1977
1979
1981
1983
1985
1987
1989
1991
1993
1995
1997
1999
2001
2003
2005
0
20
40
60
80
100
120
140
160
180
200
220
240
260
280
Total Water Consumption
Population
Po
pu
lati
on
Basic strategies
Change what you sell
Conservative finance models
Multi-year finance plan
Annual rate adjustments
Customer analysis
Affordability strategies
Well designed increasing block structure and
water budget based rates
Rethinking minimum charges
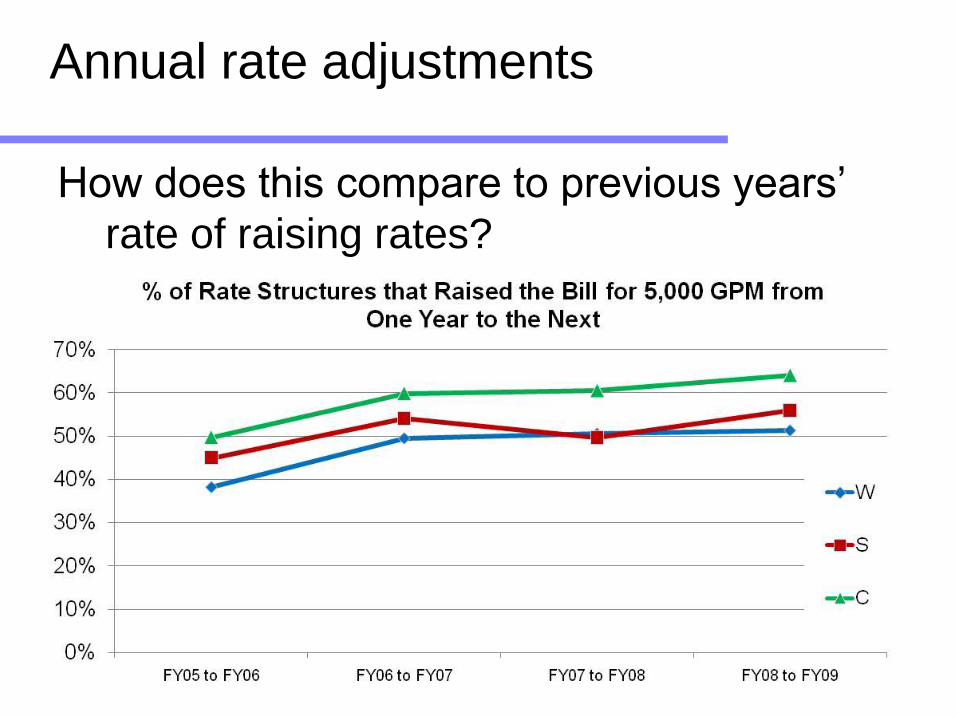
Annual rate adjustments
How does this compare to previous years’
rate of raising rates?

Basic customer analysis
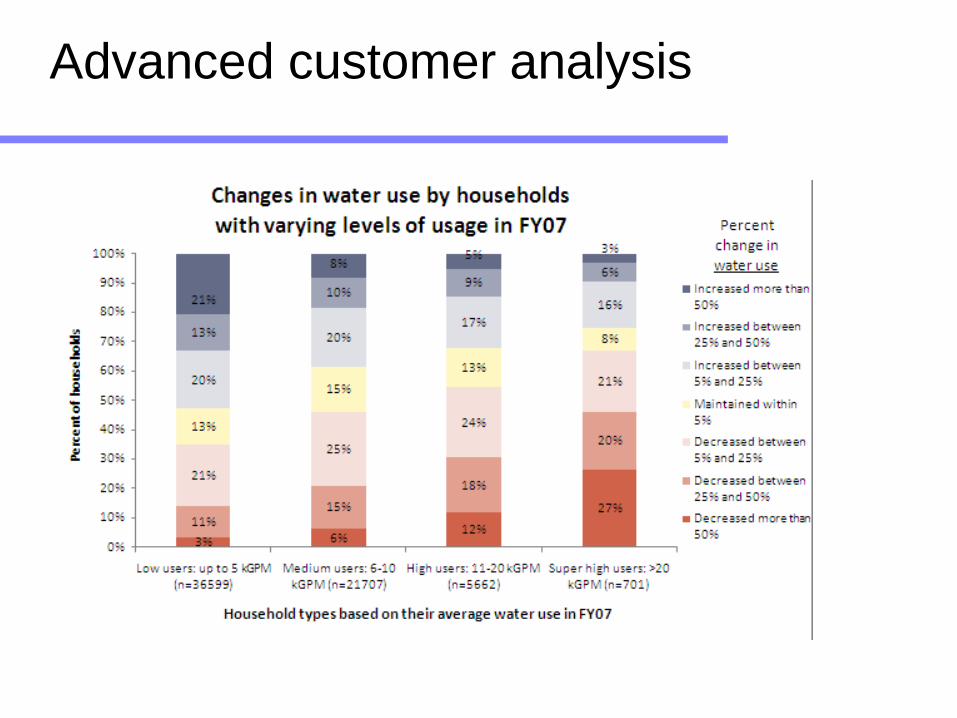
Advanced customer analysis
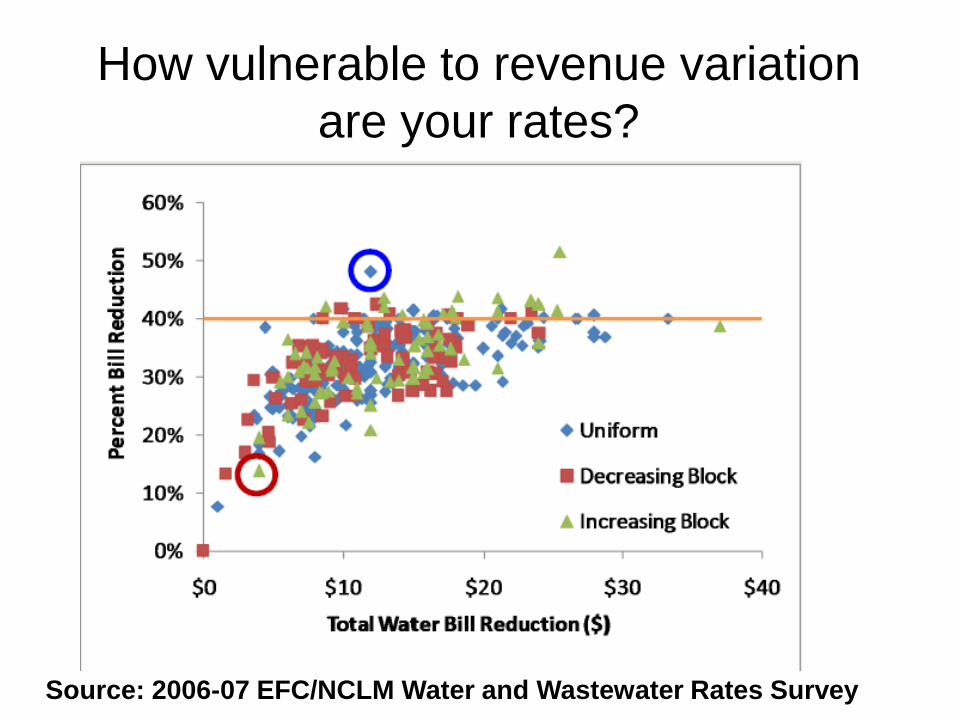
How vulnerable to revenue variation
are your rates?
Source: 2006-07 EFC/NCLM Water and Wastewater Rates Survey
$0
$10
$20
$30
$40
$50
$60
0 1 2 3 4 5 6 7 8 9 10 11 12
Monthly Consumption (in 1,000 gallons)
Mo
nth
ly-E
qu
ivale
nt
Wate
r B
illin
g
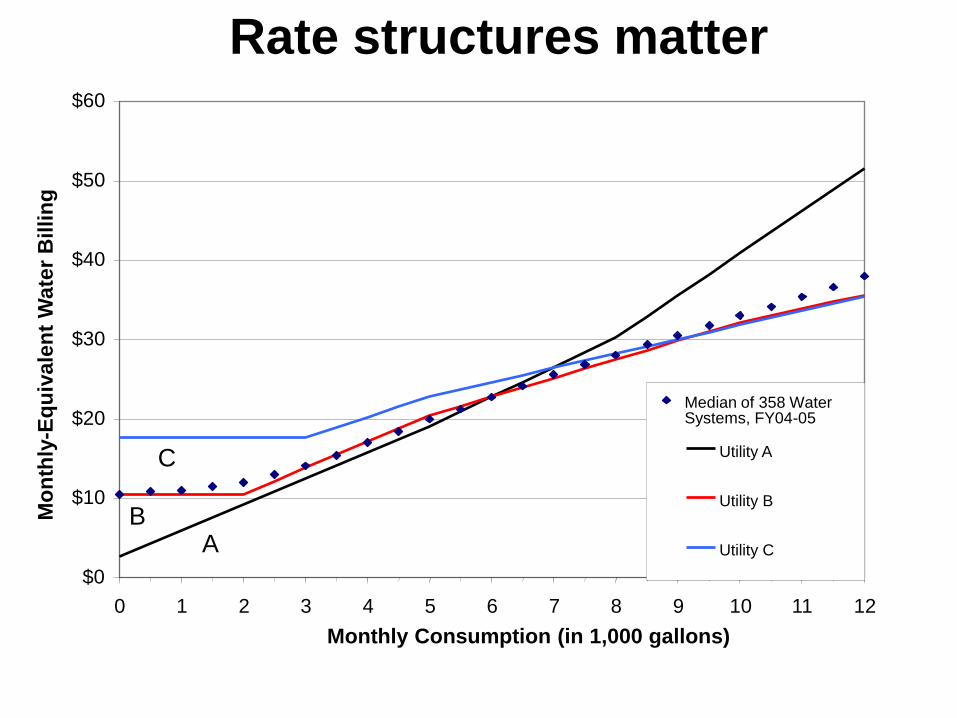
Median of 358 WaterSystems, FY04-05
Utility A
Utility B
Utility CA
C
B
Rate structures matter
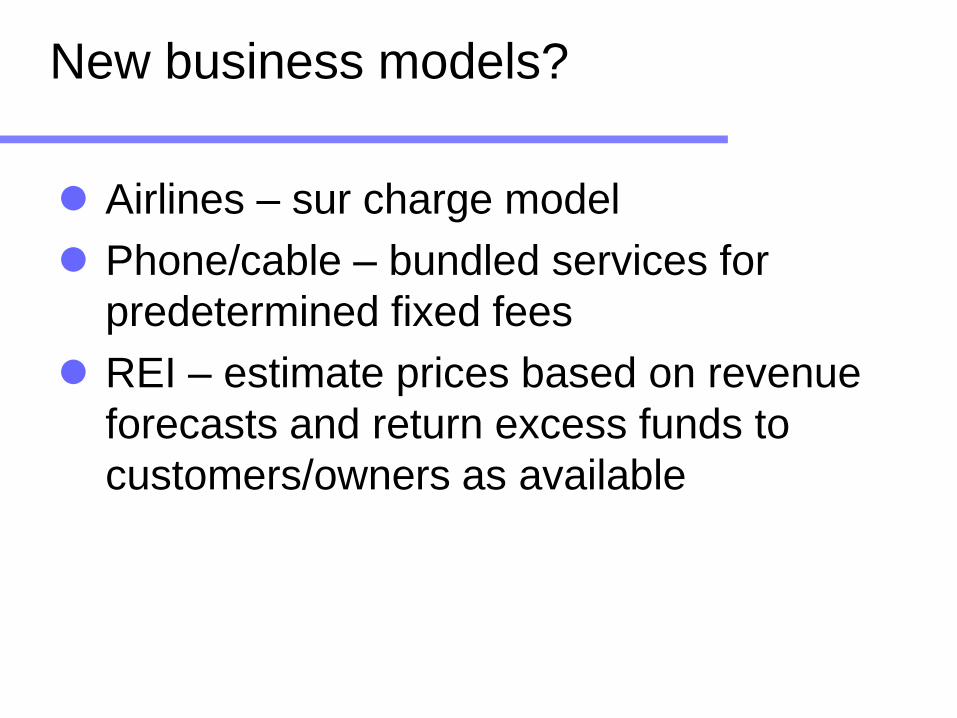
New business models?
Airlines – sur charge model
Phone/cable – bundled services for
predetermined fixed fees
REI – estimate prices based on revenue
forecasts and return excess funds to
customers/owners as available
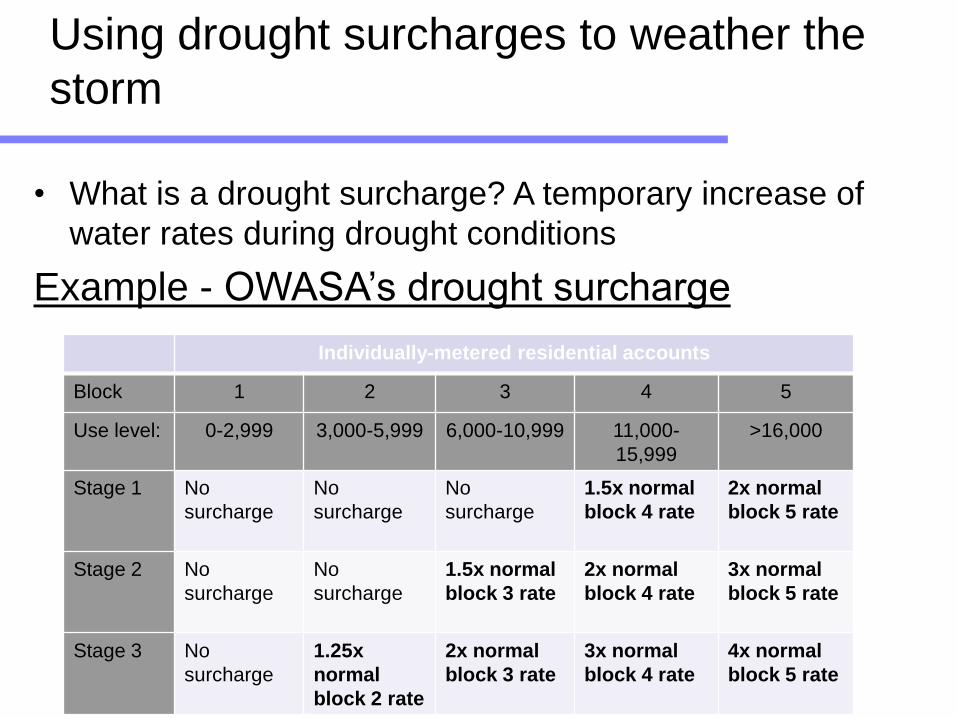
Using drought surcharges to weather the
storm
• What is a drought surcharge? A temporary increase of
water rates during drought conditions
Example - OWASA’s drought surcharge
Individually-metered residential accounts
Block 1 2 3 4 5
Use level: 0-2,999 3,000-5,999 6,000-10,999 11,000-
15,999
>16,000
Stage 1 No
surcharge
No
surcharge
No
surcharge
1.5x normal
block 4 rate
2x normal
block 5 rate
Stage 2 No
surcharge
No
surcharge
1.5x normal
block 3 rate
2x normal
block 4 rate
3x normal
block 5 rate
Stage 3 No
surcharge
1.25x
normal
block 2 rate
2x normal
block 3 rate
3x normal
block 4 rate
4x normal
block 5 rate
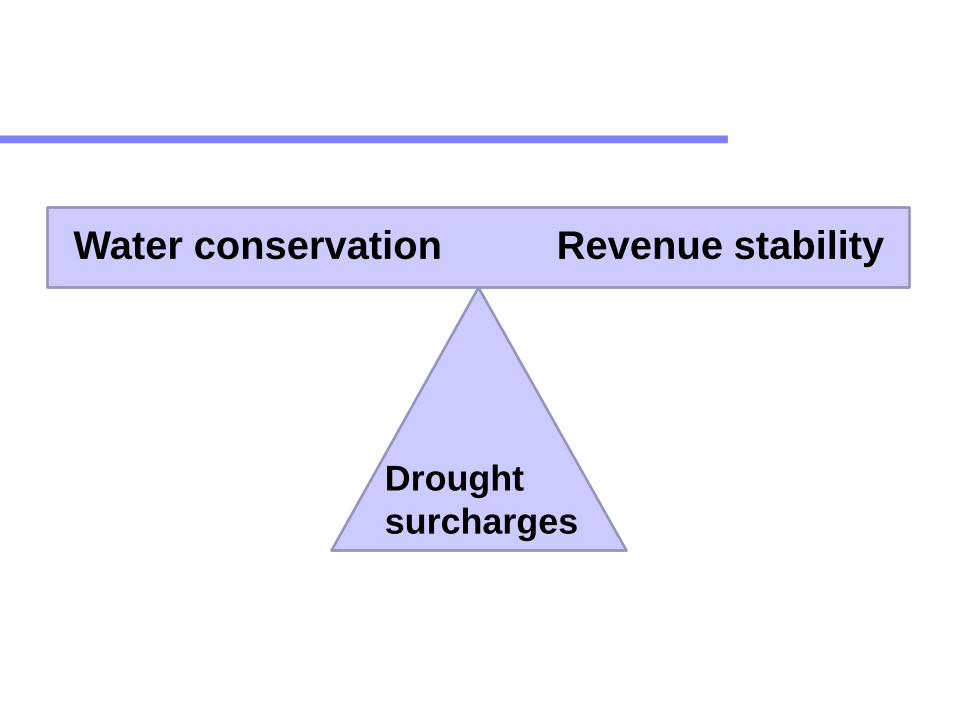
Water conservation Revenue stability
Drought
surcharges
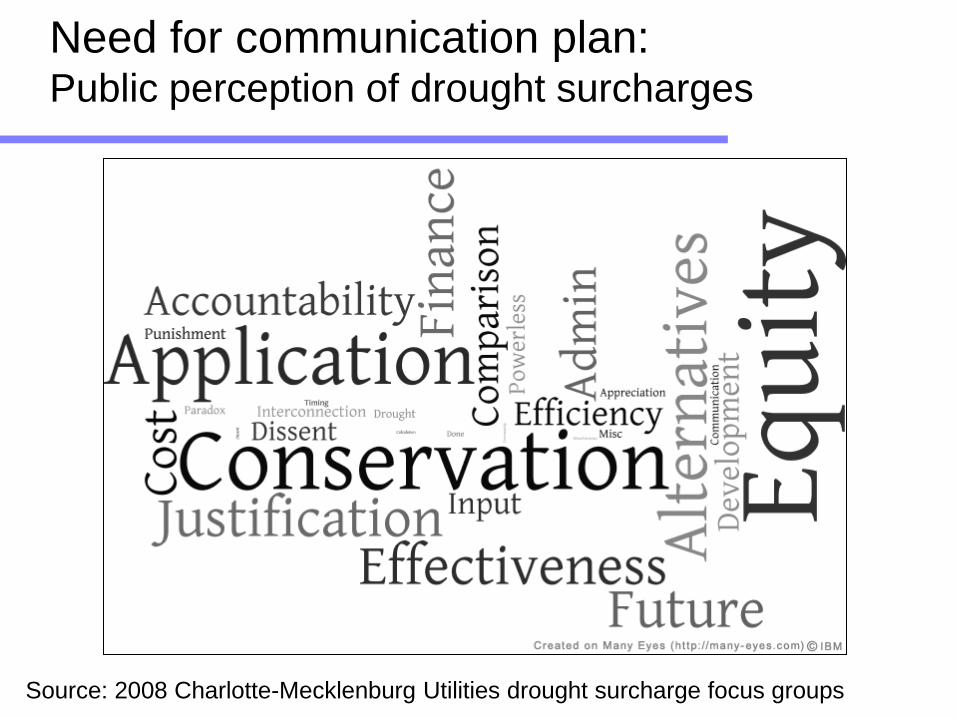
Need for communication plan:Public perception of drought surcharges
Source: 2008 Charlotte-Mecklenburg Utilities drought surcharge focus groups
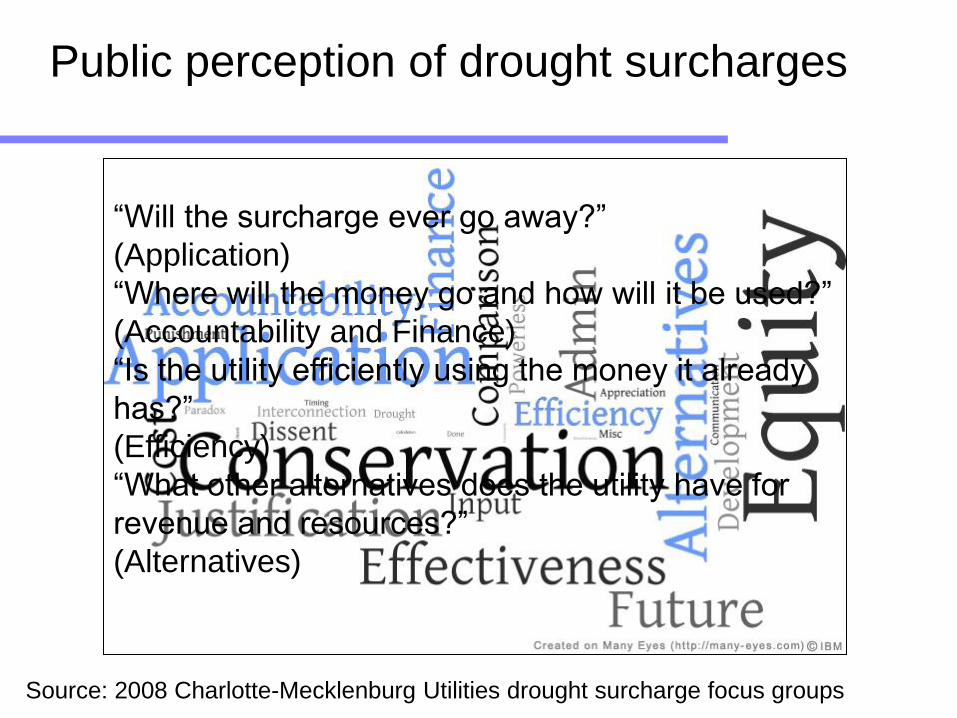
Public perception of drought surcharges
Source: 2008 Charlotte-Mecklenburg Utilities drought surcharge focus groups
“Will the surcharge ever go away?”
(Application)
“Where will the money go and how will it be used?”
(Accountability and Finance)
“Is the utility efficiently using the money it already
has?”
(Efficiency)
“What other alternatives does the utility have for
revenue and resources?”
(Alternatives)
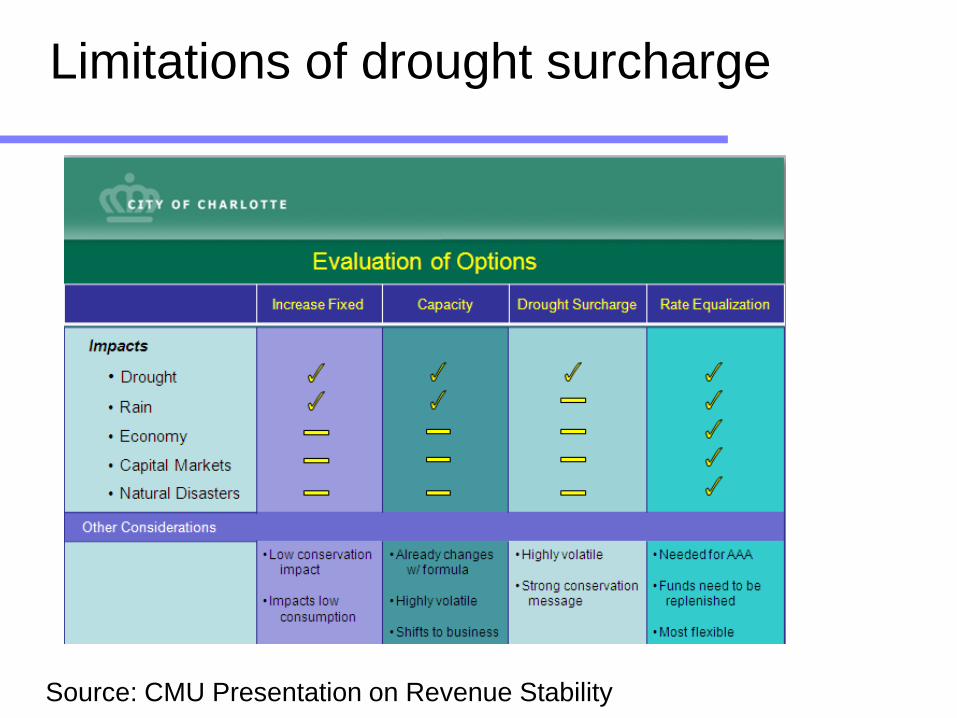
Limitations of drought surcharge
Source: CMU Presentation on Revenue Stability
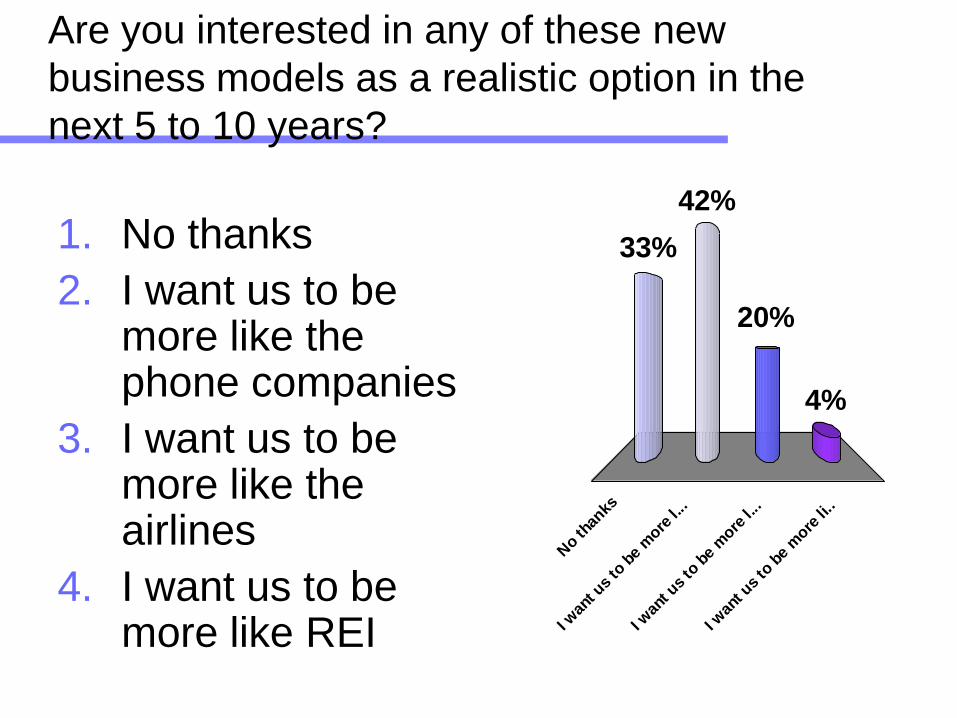
Are you interested in any of these new
business models as a realistic option in the
next 5 to 10 years?
No th
anks
I w
ant u
s to
be
more
l...
I w
ant u
s to
be
more
l...
I w
ant u
s to
be
more
li..
33%
4%
20%
42%
1. No thanks
2. I want us to be more like the phone companies
3. I want us to be more like the airlines
4. I want us to be more like REI
NC Rate Setting Resources
Guide to Billing…, Kara Millonzi Rates Book
EFC Web Resources (data, guidelines, dashboard)
LGC Data
Painful Art of Rate Setting
Rates Course 2/23/2010
Rate Setting Guide
AWWA M1 Guide
Rural Water Association
Consultants
NCLM/EFC Practices Survey (Coming soon!!)
Revenue Strategies for a
Business Model in TroubleJeff Hughes
Environmental Finance Center
Mary Tiger
Environmental Finance Center
www.efc.unc.edu