Embed Size (px)
Citation preview
3.17.2011 Rev. 26 Page 1
REVERSE ELECTRODIALYSIS
PROJECT REPORT
ALEXANDRA EASTES BME/EE MINOR [email protected]
DYLAN HINGEY CMPE/ISM [email protected]
CHIRAG SHARMA BME [email protected]
DANNY TATE BME [email protected]
ULYSSES MORALES CMPE [email protected]

3.17.2011 Rev. 26 Page 2
TABLE OF CONTENTS Motivation for Researching Reverse Electrodialysis ...................................................................... 4
Background: How Does a Concentration Cell Work [10, 12] .......................................................... 9
Specific Aims ................................................................................................................................. 12
Approach ....................................................................................................................................... 13
Cell construction........................................................................................................................ 13
Experimentation ........................................................................................................................ 15
Developing a storage component for the cell ........................................................................... 21
Battery options/charging methods: ...................................................................................... 21
Circuit Design: ........................................................................................................................ 21
Results: .................................................................................................................................. 23
Transfer sensor readings from client to server ......................................................................... 24
Defining the Problem of Data Transfer ................................................................................. 24
Initial Planning and Considerations ....................................................................................... 25
Intermediate and Final Solutions .......................................................................................... 26
Displaying real-time voltage and current readings on a website ............................................. 29
Overview: ............................................................................................................................... 29
Server Setup: ......................................................................................................................... 29
Web Design: ........................................................................................................................... 29
Website Graphs and Table Output: ....................................................................................... 30
Remote Camera monitoring System: .................................................................................... 35
Closure: .................................................................................................................................. 36
Feasibility Conclusion of Reverse Electrodialysis .......................................................................... 37
System block diagram ................................................................................................................... 38
Budget ........................................................................................................................................... 39

3.17.2011 Rev. 26 Page 3
Personnel ...................................................................................................................................... 41
Alexandra Eastes ....................................................................................................................... 41
Dylan Hingey.............................................................................................................................. 42
Ulysses Morales ......................................................................................................................... 43
Chirag Sharma ........................................................................................................................... 44
Danny Tate ................................................................................................................................ 45
References .................................................................................................................................... 46

3.17.2011 Rev. 26 Page 4
MOTIVATION FOR RESEARCHING REVERSE ELECTRODIALYSIS
In the United States, 83% of energy is supplied by petroleum, natural gas and coal, and while
there is controversy regarding the depletion timeline of these major sources of energy, it is
indisputable that additional sources of energy are needed to meet the increasing global energy
demands[1,2]. No single alternative source of energy has proven capable of supplying sufficient
amounts of energy to replace oil, yet technological advancements combined with continued
exploration in the field of renewable energy provide possibilities for the future [9]. In response
to the need to explore additional sources of energy, this project focuses on designing a
concentration cell capable of producing energy from a naturally occurring salinity gradient in
Santa Cruz, CA and determining the feasibility of implementing a full scale power plant using
the aforementioned concentration cell, which generates energy by means of reverse
electrodialysis.
Figure 1 [1]: (Taken from Lawrence Livermore National Lab) Estimated U.S. Energy Use in 2009. The U.S.
relies heavily on non-renewable sources of energy, which are being depleted because of population
growth, price of oil and coal compared to renewable energies and the convenience of infrastructure.
Alternative sources of energy must be explored to provide energy to the United States in the future.
3.17.2011 Rev. 26 Page 5
The process of reverse electrodialysis generates a voltage from an ionic gradient separated by a
semi-permeable membrane, forming a concentration cell [3]. Examples of ionic gradients are
found in human cells [K+ channels] [4], electric eels [electrocytes] [5], and estuaries [river:ocean].
In the latter example, fresh water mixes with ocean water naturally and becomes brackish
water, but this unobstructed diffusion can be harnessed into energy using reverse
electrodialysis. The difference in salinity between river water (low concentration of salt) and
ocean water (high concentration of salt) at an estuary can be separated with a semi-permeable
membrane, resulting in a voltage defined by the difference in saline concentrations. The San
Lorenzo River in Santa Cruz, CA, which flows into the Monterey Bay forming an estuary next to
the Santa Cruz Beach Boardwalk, is the location of interest for this project (Fig. 2).
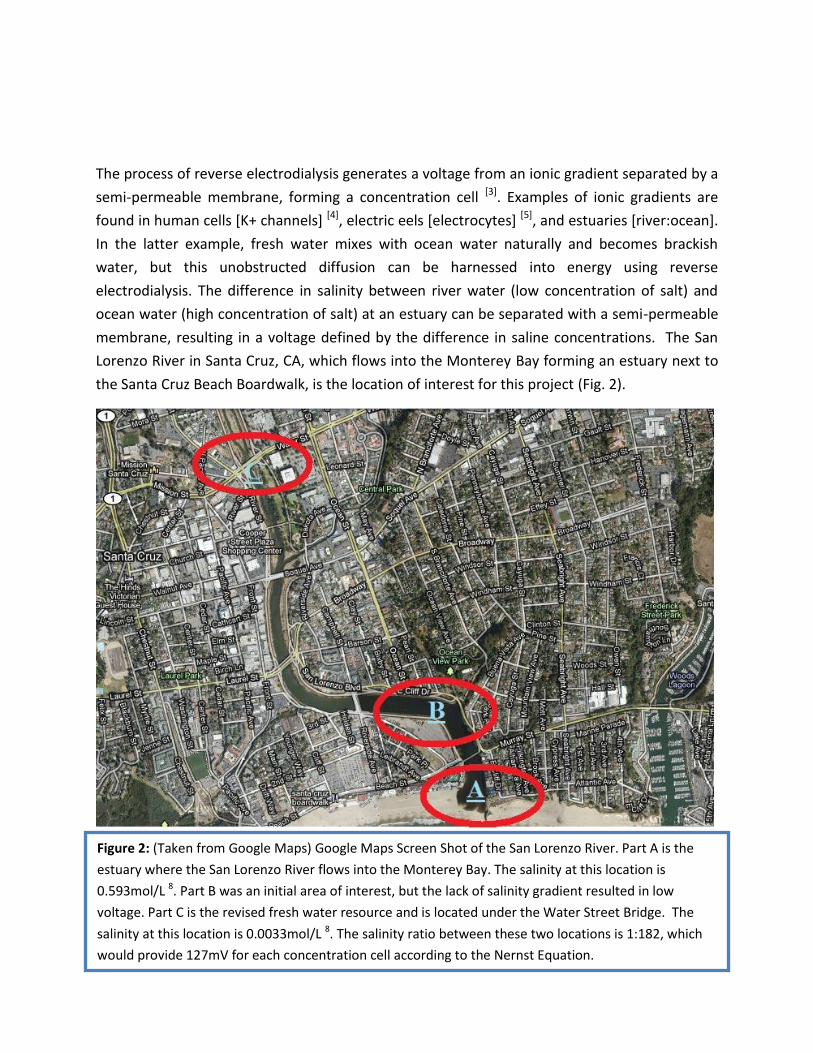
Figure 2: (Taken from Google Maps) Google Maps Screen Shot of the San Lorenzo River. Part A is the
estuary where the San Lorenzo River flows into the Monterey Bay. The salinity at this location is
0.593mol/L 8. Part B was an initial area of interest, but the lack of salinity gradient resulted in low
voltage. Part C is the revised fresh water resource and is located under the Water Street Bridge. The
salinity at this location is 0.0033mol/L 8. The salinity ratio between these two locations is 1:182, which
would provide 127mV for each concentration cell according to the Nernst Equation.

3.17.2011 Rev. 26 Page 6
To determine if the San Lorenzo River and Monterey Bay make a suitable location for a reverse-
electrodialysis power plant, a ten-cell stack of concentration cells will be created and tested for
maximum power output with minimal costs. Voltage sensors (Gamry Ref 600) will track real-
time readings from the ten-cell stack and print the results to a website for off-site monitoring.
The power generated from the ten-cell stack prototype will charge a small battery to
demonstrate the technology’s potential.
Preliminary theoretical research from a 2009 thesis paper from the Netherlands, “Blue Energy:
Electricity production from Salinity Gradients by Reverse Electrodialysis” by Jan Post states that
1m3 of salt water mixing with 1m3 of fresh water, assuming a salinity gradient of 1:50,
generates 1.4MJ (Equation 1) [6].
[ ( )] [ ( )] ( ) (1)
Ci,x = NaCl concentration of water (subscript c- concentrated, d- dilute, b-brackish)
[mol/liter]
V = volume of water [liters]
R = universal gas constant [joule/mol K]
T = absolute temperature [K]
( ) (2)
ΔGx = the free energy from each individual component of the cell
Using data from the United States Geological Survey (USGS), which measured the San Lorenzo
River average annual discharge (flow) between 205-755 m3/sec, and assuming an ideal situation
(1:50 salinity gradient and 100% efficiency), equation 1 can be applied to the San Lorenzo River
resulting in a theoretical power output between 0.289GW-1.057GW [7]. Even with 1% efficiency,
given these theoretical assumptions, there is a 2.5MW potential from the San Lorenzo River
between Branciforte, Santa Cruz and the mouth of the river.
However, Post appears to have miscalculated the energy potential from mixing 1m3 of river
water with 1m3 of ocean water. His calculation used the following parameters in his paper on
page 43: 0.5mol/L (sea water), 0.01mol/L (river water), absolute temperature T=293K, universal

3.17.2011 Rev. 26 Page 7
gas constant R = 8.314J/molK and a volume of 1m3 = 1000 liters for each solution. Breaking
equation 1 into three parts, the free energy of each component can be added together where ci
is the concentration or molarity, V is the volume, and xi is the molarity of the solution (Note: ci
and xi are the same variable, but Post separates them into two difference variables
representing the same value. We respectfully retained the equation exactly as reported in
Post’s thesis to avoid confusion from reference even though it is misleading.)
( ) (3)
=-844,253J
( ) (4)
=-112,182J
( ) (5)
= -1,697,676
( )
= 741,241J +0.74MJ
The corrected value (+0.74MJ) using the same variables as Post is half of his reported
calculation and has a sign reversal. The positive sign that results from a recalculation using
Post’s parameters and free energy equation suggests that energy must be applied to the
system for the reaction to occur, which is inaccurate because a high concentration will
spontaneously diffuse into a lower concentration to achieve equilibrium without adding energy.
The sign change error appears to be a simple mix-up between products and reactants. The
standard free energy of formation can be calculated as follows:
( )
( ) [10] (6)
Following equation 6, the high and low initial concentrations are subtracted from the final
mixed concentration, resulting in a negative free energy and defining the reaction as
spontaneous. Post subtracted the product (mixed solution) from the reactants (unmixed high
and low concentrations). Note that the negative/positive sign in front of the energy (Joules)
refers to how much energy must be inputted into the system for the reaction to occur. A
negative sign means energy can be extracted from a reaction. Calculating the free energy using:
[11] (7)
3.17.2011 Rev. 26 Page 8
= -741,241J -0.74MJ
Changing the energy potential of 1m3 of river water mixing with 1m3 of sea water to the
recalculated 0.74MJ, the maximum theoretical energy from the San Lorenzo River (retaining the
1:50 gradient and 100% efficiency assumptions) is between 151MW-558MW. With 1%
efficiency from this re-calculation, a 1.5MW power plant would be reasonably plausible.
However, the 1:50 assumption, as assumed in Post’s thesis, may underestimate the actual
amount of energy potential in the San Lorenzo River. According to the “San Lorenzo River
Watershed Management Plan” from August 2001, the conductivity of river water from the
Water Street Bridge (Fig. 1, label C) is 439μS and the conductivity of the Monterey Bay is
52,500μS (Fig. 1 label A) [8]. The salinity of these conductivities is calculated to be: 0.00326M
and 0.593M respectively, which results in a salinity gradient of 1:182. Applying these location-
specific molarities and measured temperature of 284K to the Gibbs Free Energy equation above
(equation 7), the San Lorenzo River has a theoretical energy of 928,763 Joules/m3, which is
almost 200,000 Joules more than the initial estimate and brings the maximum theoretical
power potential to 190MW-700MW.
This project focuses on harnessing this theoretical energy by designing and building a prototype
stack of ten concentration cells to use as a test bed for collecting data regarding the saline
energy potential at the estuary between the San Lorenzo River and the Monterey Bay. Voltage
sensors will output real-time data to a website to track cell production and ultimately
determine the feasibility of using reverse-electrodialysis to supplement a small portion of
current energy sources in Santa Cruz, CA.
3.17.2011 Rev. 26 Page 9
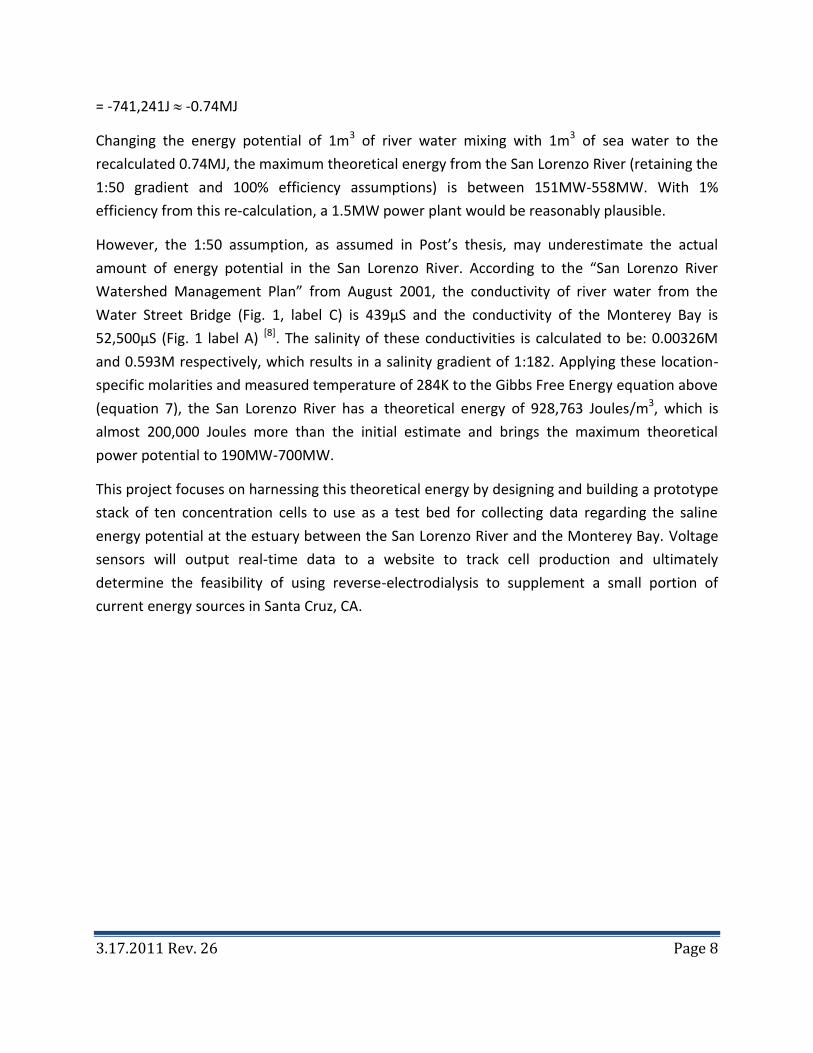
BACKGROUND: HOW DOES A CONCENTRATION CELL WORK [1 0 , 1 2 ]
Two solutions containing the same ions but in different concentrations yield a voltage potential
if separated by a membrane that only allows specific ions to pass through it.. The expected
voltage for each individual cell is calculated from the Nernst equation[10]:
(8)
V = cell potential [volts]
R = Universal Gas Constant: 8.314 [J/molK]
T= Universal Temperature [K]
z= number of valence electrons per ion passed through a membrane
F = Faraday’s constant: 96,485 C/mol
Where V is the cell potential [volts], R is the universal gas constant = 8.314 J/molK, T is absolute
temperature [K], z is the number of electrons transferred for each ion passing through the
membrane *NaCl =1+, F is Faraday’s constant = 96,485 C/mol, and the high and low
concentrations are defined by the molarity of each side of the cell. Using these variables and an
expected concentration gradient of 1:182, as measured from the San Lorenzo River Watershed
Management Update in 2001, each concentration cell is calculated to produce 127mV open
circuit.
This voltage is achieved by allowing specific high concentration ions to diffuse into the low
concentration solution, which is defined by the type of membrane. The membrane of a
concentration cell can be either an anion exchange membrane or a cation exchange membrane.
The anion exchange membrane is slightly positively charged and allows negative ions (anions)
to pass through, while repelling positively charged ions (cations). The cation exchange
membrane does the opposite, attracting positive ions and repelling negative ions. In this
project’s cell, an anion exchange membrane will be used to allow Cl- to flow through the
membrane (Fig. 3A).
Since the anion exchange membrane (AEM) is selective for Cl- and the high concentration is
disposed to spontaneously equilibrate with the low concentration, the Cl- from the high
concentration will flow through the membrane [10, 12]. The movement of Cl- to the low
concentration unbalances the neutral charge of the two solutions. To achieve equilibrium, Ag
3.17.2011 Rev. 26 Page 10
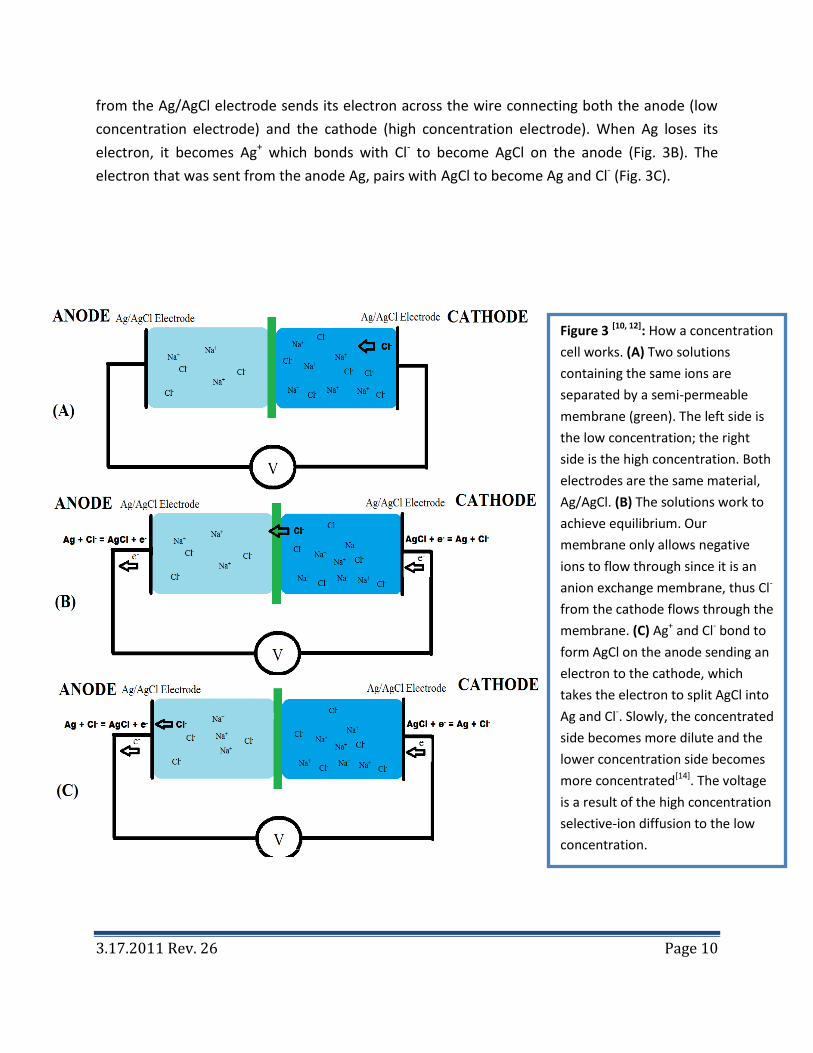
from the Ag/AgCl electrode sends its electron across the wire connecting both the anode (low
concentration electrode) and the cathode (high concentration electrode). When Ag loses its
electron, it becomes Ag+ which bonds with Cl- to become AgCl on the anode (Fig. 3B). The
electron that was sent from the anode Ag, pairs with AgCl to become Ag and Cl- (Fig. 3C).
Figure 3 [10, 12]: How a concentration
cell works. (A) Two solutions
containing the same ions are
separated by a semi-permeable
membrane (green). The left side is
the low concentration; the right
side is the high concentration. Both
electrodes are the same material,
Ag/AgCl. (B) The solutions work to
achieve equilibrium. Our
membrane only allows negative
ions to flow through since it is an
anion exchange membrane, thus Cl-
from the cathode flows through the
membrane. (C) Ag+ and Cl- bond to
form AgCl on the anode sending an
electron to the cathode, which
takes the electron to split AgCl into
Ag and Cl-. Slowly, the concentrated
side becomes more dilute and the
lower concentration side becomes
more concentrated[14]. The voltage
is a result of the high concentration
selective-ion diffusion to the low
concentration.

3.17.2011 Rev. 26 Page 11

3.17.2011 Rev. 26 Page 12
SPECIFIC AIMS
Construct a concentration cell that generates energy to charge a battery using the
salinity gradient between the San Lorenzo River and the Monterey Bay.
Develop a storage component (i.e. battery) for the cell to transfer the energy generated.
Output real-time voltage and current readings to website.
Transfer sensor readings from client to server. This will be done in real-time and
autonomously so that the information available for display on the website is as relevant
as possible.
Determine feasibility of reverse electrodialysis as a realistic alternative to current energy
sources.
3.17.2011 Rev. 26 Page 13
APPROACH
CELL CONSTRUCTION
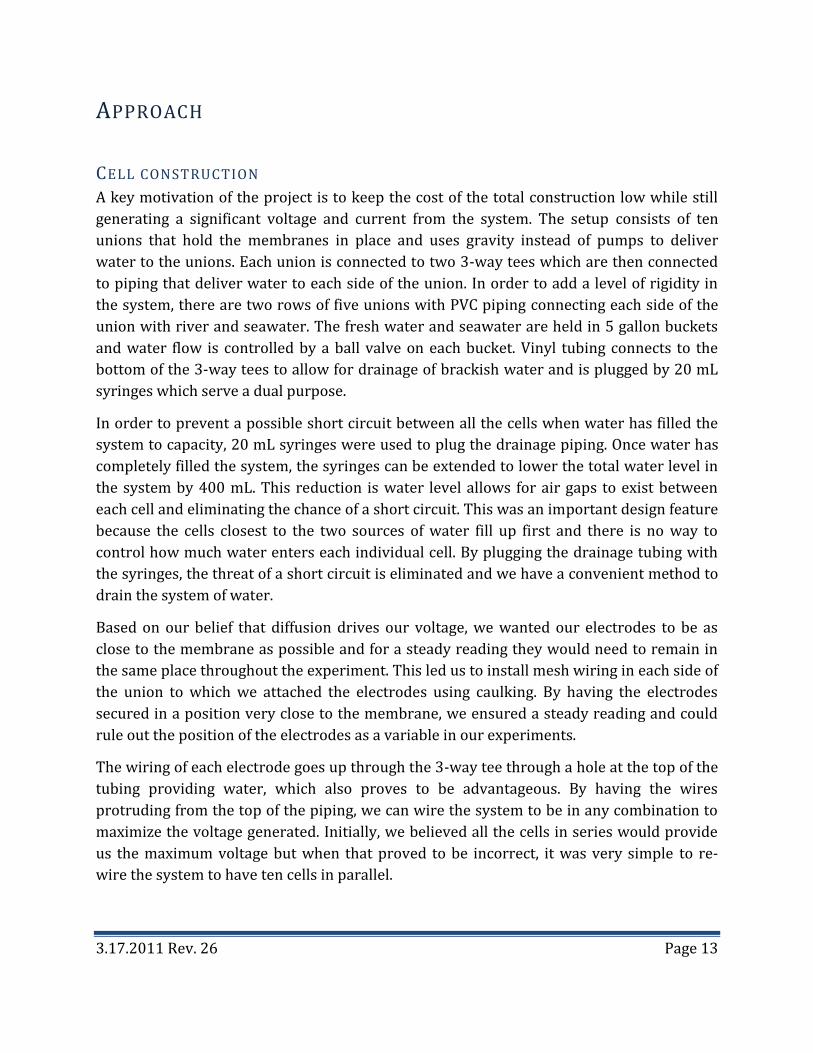
A key motivation of the project is to keep the cost of the total construction low while still
generating a significant voltage and current from the system. The setup consists of ten
unions that hold the membranes in place and uses gravity instead of pumps to deliver
water to the unions. Each union is connected to two 3-way tees which are then connected
to piping that deliver water to each side of the union. In order to add a level of rigidity in
the system, there are two rows of five unions with PVC piping connecting each side of the
union with river and seawater. The fresh water and seawater are held in 5 gallon buckets
and water flow is controlled by a ball valve on each bucket. Vinyl tubing connects to the
bottom of the 3-way tees to allow for drainage of brackish water and is plugged by 20 mL
syringes which serve a dual purpose.
In order to prevent a possible short circuit between all the cells when water has filled the
system to capacity, 20 mL syringes were used to plug the drainage piping. Once water has
completely filled the system, the syringes can be extended to lower the total water level in
the system by 400 mL. This reduction is water level allows for air gaps to exist between
each cell and eliminating the chance of a short circuit. This was an important design feature
because the cells closest to the two sources of water fill up first and there is no way to
control how much water enters each individual cell. By plugging the drainage tubing with
the syringes, the threat of a short circuit is eliminated and we have a convenient method to
drain the system of water.
Based on our belief that diffusion drives our voltage, we wanted our electrodes to be as
close to the membrane as possible and for a steady reading they would need to remain in
the same place throughout the experiment. This led us to install mesh wiring in each side of
the union to which we attached the electrodes using caulking. By having the electrodes
secured in a position very close to the membrane, we ensured a steady reading and could
rule out the position of the electrodes as a variable in our experiments.
The wiring of each electrode goes up through the 3-way tee through a hole at the top of the
tubing providing water, which also proves to be advantageous. By having the wires
protruding from the top of the piping, we can wire the system to be in any combination to
maximize the voltage generated. Initially, we believed all the cells in series would provide
us the maximum voltage but when that proved to be incorrect, it was very simple to re-
wire the system to have ten cells in parallel.

3.17.2011 Rev. 26 Page 14
The original design consisted of around 50 valves to control the flow of water into and out
of the unions but this proved to be extremely costly and not practical for our vision of the
system. In place of this design, Professor Karplus helped us drastically reduce the number
of valves needed and the most current design can be seen in Figure 4.
Figure 4: Revised Cell Design. This design drastically reduces the number of valves needed to control the flow
of water into the 3-way tee. The membrane will be placed in the union and water will be delivered to the 3-
way tee and discharged using Tygon tubing. The tubing used for discharging water will be controlled by
clamps and the main water supply from the two tanks will be controlled by quarter-turn valves.

3.17.2011 Rev. 26 Page 15
EXPERIMENTATION
The initial approach to this project was to stack ten cells in series by alternating concentrations
and membranes. For example, the stack would have the following set-up: ELECTRODE: High :
CEM : Low : AEM : High : CEM : Low : AEM : High : ELECTRODE, where AEM is an anion exchange
membrane and CEM is a cation exchange membrane. The initial results from trying these
alternating cells showed more voltage coming from an individual cell than from the whole
stack. Therefore, the prototype changed into a single membrane type of cell that would
connect serially to other cells via electrodes, not membranes.
Choosing the appropriate membrane to separate the two saline concentrations was the next
experimental task. There were three candidate membranes: Millipore VCWP- Membrane,
Millipore GNWP- Membrane, and Fumasep FAD- Anion Exchange Membrane. To compare the
membranes, a small test cell (0.5cm diameter, 0.7cm depth, 0.196cm2 membrane surface area
and 0.137cm3 volume) was fabricated out of a silicon polymer, poly-dimethylsiloxane (PDMS)
(Fig. 5).
This experiment was performed using water from the Monterey Bay (Fig. 2 label A) and the San
Lorenzo River (Fig. 2 label B). A low gradient was expected from these samples, since the
Figure 5: Dimensions of Test Cell. Each cell half-cell has a depth of 0.7cm and a diameter of 0.5cm. The
volume of the cell is 0.137cm3 and the surface area of cell:membrane is 0.196cm2. The left half-cell is
the low concentration. The right half-cell is the high concentration and the membrane (grey) is
sandwiched between. Platinum wire electrodes are placed on the outer part (away from membrane) of
the cell and two glass slides (one on each side) is pressed against the outer part of the cell to contain the
solutions and electrodes. A binder clip is used to hold the whole cell together during experiments.

3.17.2011 Rev. 26 Page 16
Monterey Bay reaches the low concentration location during high tide. However, maintaining
the same conditions for each experiment, the best of three different membranes could be
determined. Figure 6 shows the experimental set-up.
The results from this experiment are shown in Figure 7. The peaks at the beginning of the graph
are results of noise from a small salinity gradient and noise from removing the platinum
electrodes, quickly rinsing and drying and then placing into the next cell for measurement. The
Fumasep FAD membrane had instructions to soak the membrane in NaCl prior to using the
membrane, so data is included for the FAD membrane from a soaked and non-soaked FAD
membrane.
Figure 6: Membrane Experimental Set-up. Each cell is independent, so there is a total of six individual
cells. Voltage was recorded for three individual cells; one cell for the Fumasep FAD membrane, one cell
for the Millipore GNWP membrane and one cell for the Millipore VCWP membrane. Each cell’s voltage
was recorded one at a time with the same 100k resistor as a load. Electrodes were made of platinum,
and connected to copper wire attached to sensor leads from the Gamry Ref. 600 Potentiostat. Cells
were completely set-up and solutions were injected via syringe after voltage reading script was running.
The FAD and VCWP membranes are anion exchange membranes and the GNWP membrane is a cation
exchange membrane. Each cell was recorded for 600 seconds for a simple peak voltage test.
3.17.2011 Rev. 26 Page 17
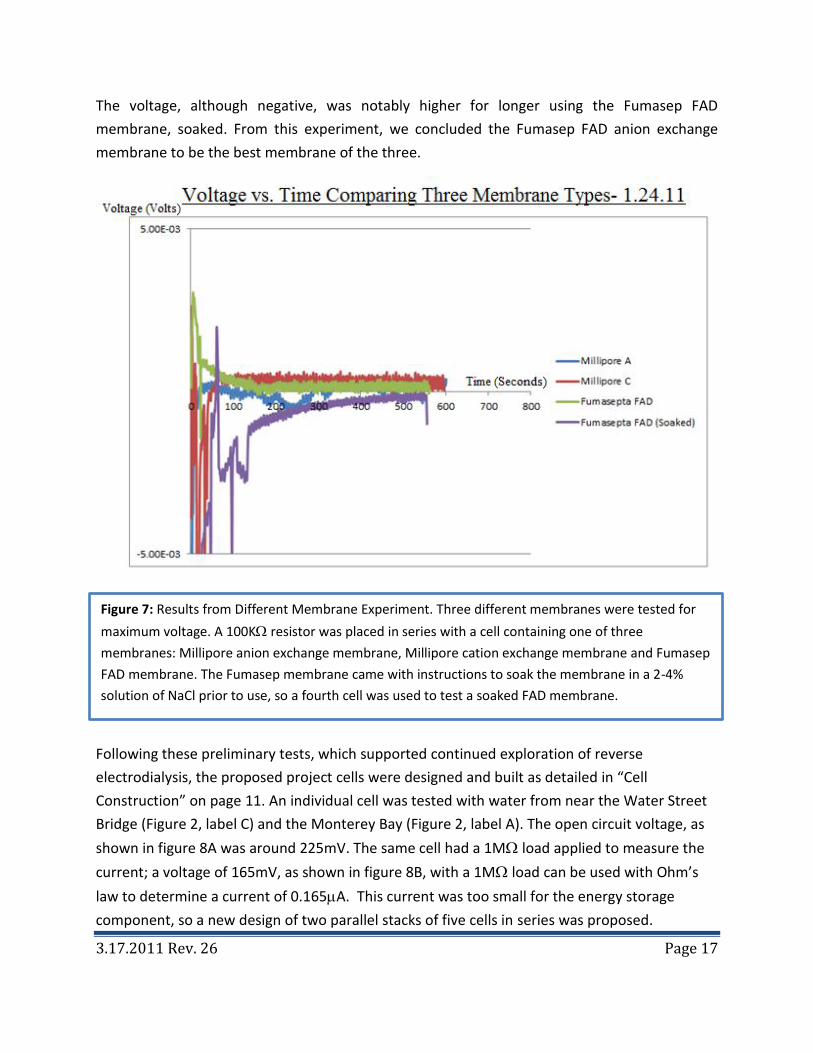
The voltage, although negative, was notably higher for longer using the Fumasep FAD
membrane, soaked. From this experiment, we concluded the Fumasep FAD anion exchange
membrane to be the best membrane of the three.
Following these preliminary tests, which supported continued exploration of reverse
electrodialysis, the proposed project cells were designed and built as detailed in “Cell
Construction” on page 11. An individual cell was tested with water from near the Water Street
Bridge (Figure 2, label C) and the Monterey Bay (Figure 2, label A). The open circuit voltage, as
shown in figure 8A was around 225mV. The same cell had a 1M load applied to measure the
current; a voltage of 165mV, as shown in figure 8B, with a 1M load can be used with Ohm’s
law to determine a current of 0.165A. This current was too small for the energy storage
component, so a new design of two parallel stacks of five cells in series was proposed.
Figure 7: Results from Different Membrane Experiment. Three different membranes were tested for
maximum voltage. A 100K resistor was placed in series with a cell containing one of three
membranes: Millipore anion exchange membrane, Millipore cation exchange membrane and Fumasep
FAD membrane. The Fumasep membrane came with instructions to soak the membrane in a 2-4%
solution of NaCl prior to use, so a fourth cell was used to test a soaked FAD membrane.

3.17.2011 Rev. 26 Page 18
Figure 8, which used platinum electrodes, suggests that with two parallel stacks of five cells in
series, a possible 825mV can be generated with 0.33A of current for a power output of
0.272W. Ten individual cells were constructed with adaptable wiring to test both ten serial
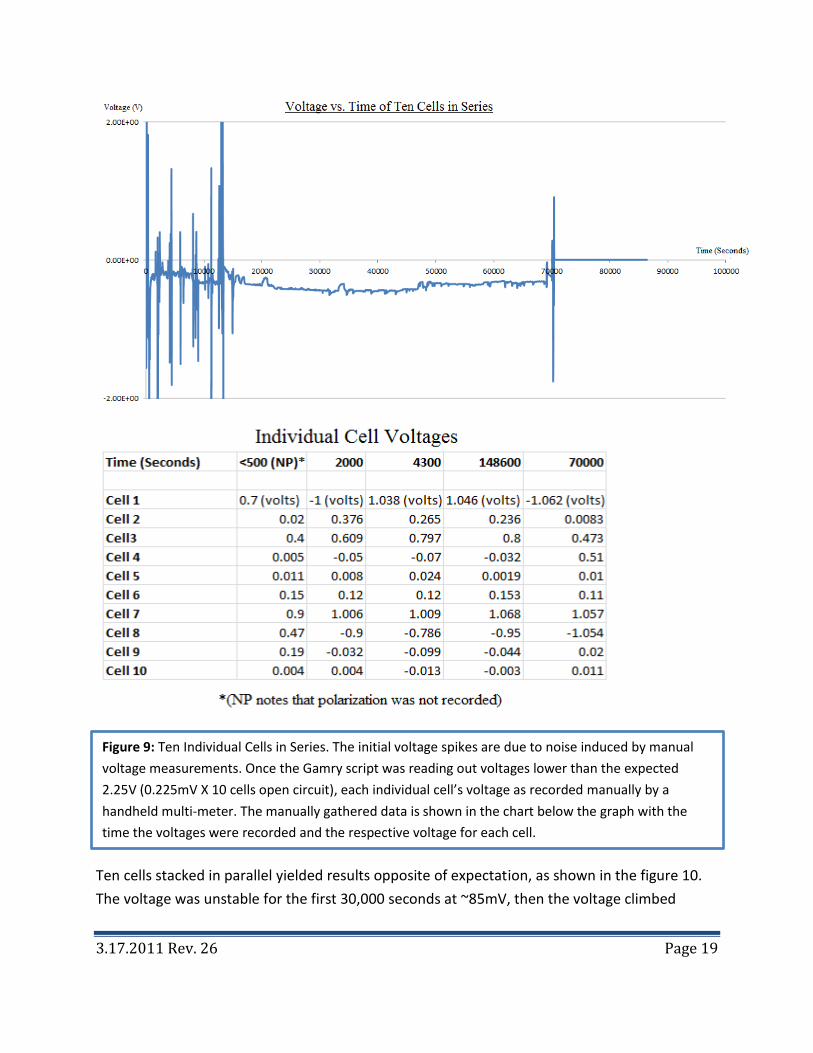
cells and two parallel stacks of five serial cells. The results of ten cells in series, in figure 9,
suggest that the cells do not stack up as expected. Disregarding the spikes, which are due to
manually recorded voltage interference, the average voltage is ~341mV; 15% of what was
expected for ten cells in series (2.25V = 0.225V X 10 cells). The non-uniformity amongst the cells
suggests that these cells do not stack up like batteries. This data was recorded near the end of
the ten-week deadline, so a quick re-wiring of the cells, to stack ten cells in parallel was
proposed to generate 165mV (10 cells in parallel each generating ~165mV with load) and boost
the current.
Figure 8: Results from Individual Cell. A single cell was constructed with a 2” PVC union, two ¾ in 3-
way tees, ¼ in mesh wiring (to hold electrodes in place) and platinum electrodes. (A) The Gamry
potentiostat voltage recording script was started prior to water introduction to the cell, thus the
voltage shows a steep peak at the beginning of the graph. The voltage remained a constant ~-225mV
for 36,000 seconds (10 hours). (B) A 1M load was set in parallel to the cell and the voltage was
recorded across the load. The voltage reached ~-150mV for a constant 30,000 seconds (8 hours, 20
minutes). The script was ended early due to voltage output consistency. A 1M load on a 165mV
source determines a 0.165A current.
3.17.2011 Rev. 26 Page 19
Ten cells stacked in parallel yielded results opposite of expectation, as shown in the figure 10.
The voltage was unstable for the first 30,000 seconds at ~85mV, then the voltage climbed
Figure 9: Ten Individual Cells in Series. The initial voltage spikes are due to noise induced by manual
voltage measurements. Once the Gamry script was reading out voltages lower than the expected
2.25V (0.225mV X 10 cells open circuit), each individual cell’s voltage as recorded manually by a
handheld multi-meter. The manually gathered data is shown in the chart below the graph with the
time the voltages were recorded and the respective voltage for each cell.
3.17.2011 Rev. 26 Page 20
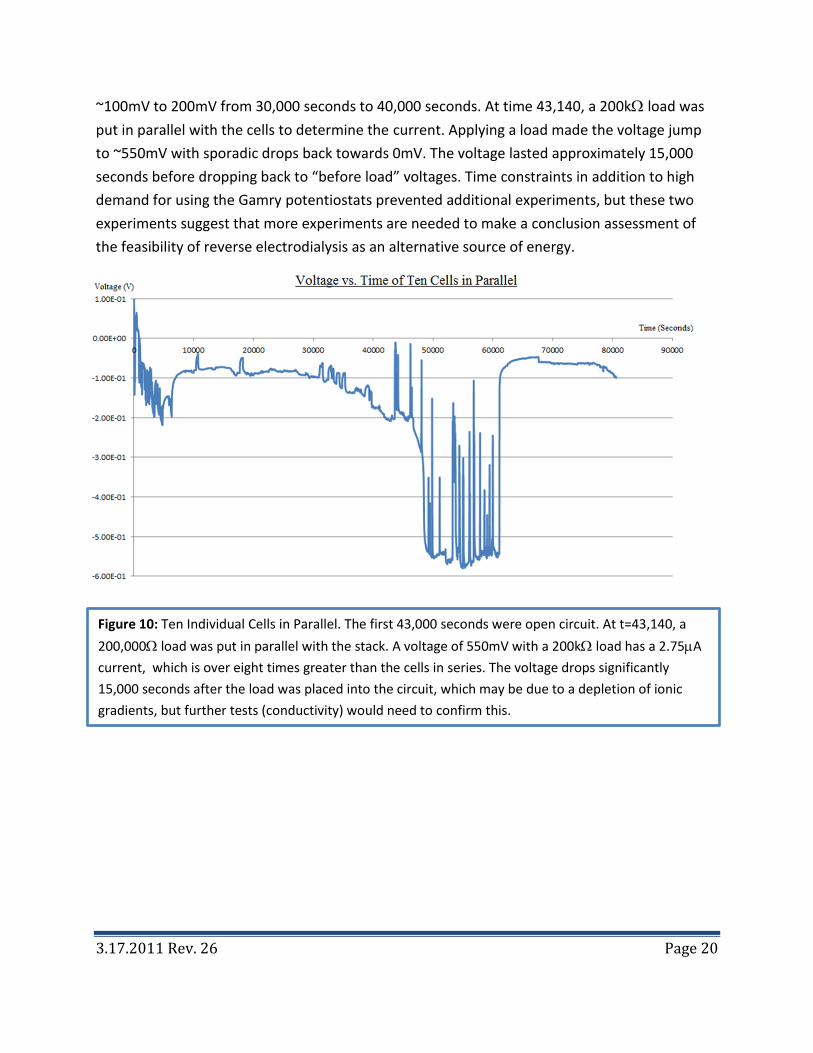
~100mV to 200mV from 30,000 seconds to 40,000 seconds. At time 43,140, a 200k load was
put in parallel with the cells to determine the current. Applying a load made the voltage jump
to ~550mV with sporadic drops back towards 0mV. The voltage lasted approximately 15,000
seconds before dropping back to “before load” voltages. Time constraints in addition to high
demand for using the Gamry potentiostats prevented additional experiments, but these two
experiments suggest that more experiments are needed to make a conclusion assessment of
the feasibility of reverse electrodialysis as an alternative source of energy.
Figure 10: Ten Individual Cells in Parallel. The first 43,000 seconds were open circuit. At t=43,140, a
200,000 load was put in parallel with the stack. A voltage of 550mV with a 200k load has a 2.75A
current, which is over eight times greater than the cells in series. The voltage drops significantly
15,000 seconds after the load was placed into the circuit, which may be due to a depletion of ionic
gradients, but further tests (conductivity) would need to confirm this.

3.17.2011 Rev. 26 Page 21
DEVELOPING A STORAGE COMPONENT FOR THE CE LL
BAT T ER Y O PTION S/CHAR GIN G METHO DS :
The charging method is dependent on the amount of power available from the concentration
cell. Because the cell is predicted to generate very low power, a low charge rate occurs and the
battery will need to be trickle charged. Trickle charging is a constant current applied to the
battery for an indefinite amount of time. Trickle charging does not need any circuitry to detect
charge termination. The battery type was then chosen based on this charging method because
not all battery chemistries can tolerate specific charging methods.
Nickel metal hydride (NiMH) batteries were chosen because NiMH and Nickel cadmium (NiCd)
are the most popular batteries to use when trickle charging. Lead acid batteries were not
considered because while they can tolerate a short duration of trickle charging, extra circuitry is
usually needed to prevent overcharging. While NiCd batteries are the most robust type of
battery with respect to overcharging [13],the recombination process that keeps the voltage at a
safe level when overcharging occurs also causes a shorter battery life. NiCd batteries also suffer
from the the “memory effect”. The “memory effect” is the effect observed when the battery
holds less charge because it had been repeatedly charged after being only partially discharged.
On the other hand, NiMH batteries do not suffer from the “memory effect”. They are
technologically newer and more environmentally friendly without the toxic cadmium found in
NiCd batteries. NiMH batteries are also more common than and are recommended over NiCd.
C IR CUIT DESIGN :
A voltage boost circuit will be implemented to increase the low voltage generated from the cell
to charge a battery with a higher voltage. Storage components, such as capacitors and
inductors, are used to step up the voltage. Once the storage component reaches a certain
voltage, one or more transistors turn on to send power to or from another storage component.
A simple voltage boost circuit is shown in figure 11. At the top, the switch is closed and a
current begins to increase across the inductor. After a fixed amount of time the switch opens,
as seen in the bottom. When the switch is open, the voltage across the switch increases until it
causes the magnetic field across the inductor to collapse as it is trying to maintain the current.
The current is then driven through the diode and into the capacitor until the inductor is
expended. This circuit generates pulses of a greater voltage. However, the low voltage isn’t the
biggest problem in designing the circuit.

3.17.2011 Rev. 26 Page 22
The current generated from the cell is in the microwatts range, which means that the biggest
issue in the circuit design is the loss of current due to the leakage in the components involved. I
picked the components with the lowest leakage current so as not to lose the current generated
from the cell altogether. The circuit shown in figure 12 shows a more complicated boost circuit.
The inductor requires a larger current than is being provided. In figure 12, the cell charges the
capacitor C2 to provide bursts of voltage and current higher than the cell initially provides.
When C2 contains a sufficient amount of voltage to turn on Q2, U1a turns on. In response to
U1a, Q3 turns on and transfers the energy stored in C2 into the inductor. Because the current is
still very small, the inductor chosen needed to be physically larger in order to decrease the
current lost across the inductor. After a certain amount of time, Q3 turns off. The inductor will
Figure 11[15]: Circuit diagram. When the switch is closed a current begins to increase
across the inductor. After a fixed amount of time the switch opens and the voltage across
the switch increases until it causes the magnetic field across the inductor to collapse as it
is trying to maintain the current. The current is then driven through the diode and into
the capacitor until the inductor is expended. This circuit generates pulses of a greater
voltage.
3.17.2011 Rev. 26 Page 23
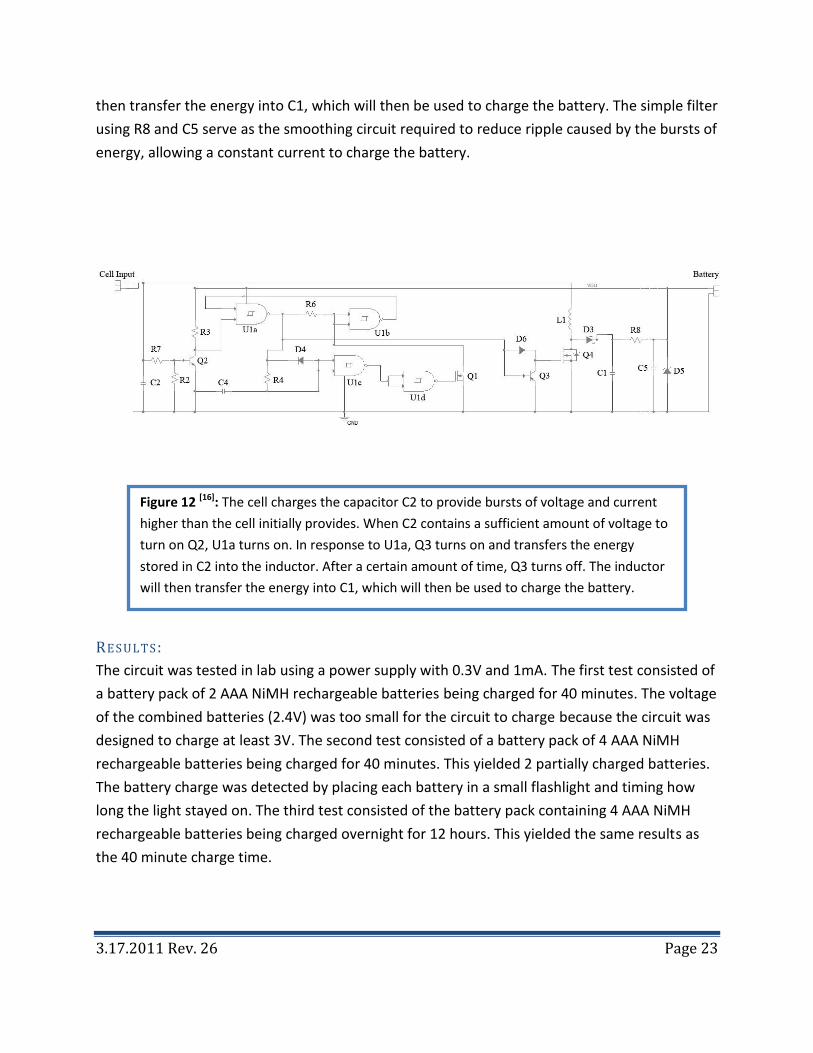
then transfer the energy into C1, which will then be used to charge the battery. The simple filter
using R8 and C5 serve as the smoothing circuit required to reduce ripple caused by the bursts of
energy, allowing a constant current to charge the battery.
RES ULTS :
The circuit was tested in lab using a power supply with 0.3V and 1mA. The first test consisted of
a battery pack of 2 AAA NiMH rechargeable batteries being charged for 40 minutes. The voltage
of the combined batteries (2.4V) was too small for the circuit to charge because the circuit was
designed to charge at least 3V. The second test consisted of a battery pack of 4 AAA NiMH
rechargeable batteries being charged for 40 minutes. This yielded 2 partially charged batteries.
The battery charge was detected by placing each battery in a small flashlight and timing how
long the light stayed on. The third test consisted of the battery pack containing 4 AAA NiMH
rechargeable batteries being charged overnight for 12 hours. This yielded the same results as
the 40 minute charge time.
Figure 12 [16]: The cell charges the capacitor C2 to provide bursts of voltage and current
higher than the cell initially provides. When C2 contains a sufficient amount of voltage to
turn on Q2, U1a turns on. In response to U1a, Q3 turns on and transfers the energy
stored in C2 into the inductor. After a certain amount of time, Q3 turns off. The inductor
will then transfer the energy into C1, which will then be used to charge the battery.
3.17.2011 Rev. 26 Page 24
TRANSFER SENSOR READINGS FROM CLIENT TO S ERVER
DEFINI NG T HE PRO BLEM O F DATA TR AN S FER
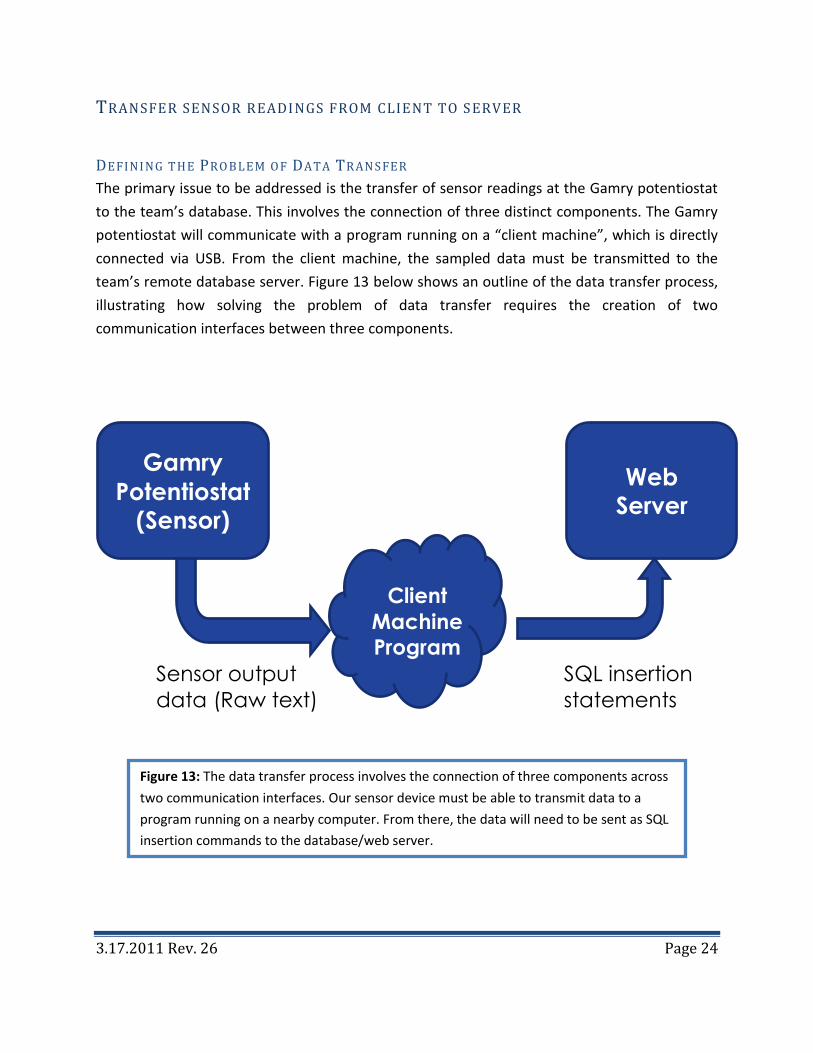
The primary issue to be addressed is the transfer of sensor readings at the Gamry potentiostat
to the team’s database. This involves the connection of three distinct components. The Gamry
potentiostat will communicate with a program running on a “client machine”, which is directly
connected via USB. From the client machine, the sampled data must be transmitted to the
team’s remote database server. Figure 13 below shows an outline of the data transfer process,
illustrating how solving the problem of data transfer requires the creation of two
communication interfaces between three components.
Gamry
Potentiostat (Sensor)
Sensor output
data (Raw text)
Client
Machine
Program
Web
Server
SQL insertion
statements
Figure 13: The data transfer process involves the connection of three components across
two communication interfaces. Our sensor device must be able to transmit data to a
program running on a nearby computer. From there, the data will need to be sent as SQL
insertion commands to the database/web server.

3.17.2011 Rev. 26 Page 25
There are additional needs that should be addressed while implementing these communication
interfaces. This includes the need for data to be sent at a rate as close as possible to real-time.
The data monitoring process must support a rapid sampling rate of one sample per one to two
seconds, and should maintain a secure connection to the team’s database. To support the
continued development of this and similar projects, the process should be implemented as
independently as possible from the operating system.
INITI AL PLAN NING AN D CO NSI DER ATIO NS
To address the need for operating system independence, Python was chosen as the primary
coding language for the client program. Python is fast, and is very good for rapid text and data
parsing. In order to send data from the client machine to the team’s MySQL database, the
Python program will access the sampled data, translate this data into SQL insertion statements,
and send these commands to the server via a direct and secure connection over Ethernet.
One of the difficulties of this part of the project is that a race condition exists within the
interface between the Gamry potentiostat and the Python program. Controlling the Gamry
potentiostat is done through the use of Explain scripts, an open-source scripting language
developed by Gamry. Gamry has provided a set of scripts which do certain common tasks, such
as monitor the voltage across two probes. The Explain script which monitors voltage creates a
file which contains the sampled data. The challenging aspect of this is that the script keeps this
file open during the experiment, which may hinder the Python program’s attempts to view the
data in real-time. To overcome this obstacle, there were a few appealing options. One was to
have the Explain script call the Python script directly, and to pass the voltage sample as a
parameter at the command line. Another solution was to make sure that the file being written
to by the Explain script is closed for a period of time, during which time the Python program will
open, read, and close the same file.
The development of the communication interface between the Python program and the server
was much more straightforward. The Python library “MySQLdb” provides a means of
establishing a secure connection to a MySQL server within the Python program. This approach
is well-documented in online tutorials, and was not expected to be a complex problem.

3.17.2011 Rev. 26 Page 26
INT ER MEDI AT E AND F I NAL SO LUTION S
Communication between the Python program and the database server was finished very fast. A
proof-of-concept was complete within the first two weeks, where the Python program could
randomly generate data values and send corresponding SQL insertion commands to the server.
The development of the interface between the Gamry potentiostat’s Explain script and the
Python program quickly became the more challenging and time-consuming task. The Explain
script language is based on C, although there is no way to execute pure C code from within an
Explain script. Over time, we discovered several other severe limitations of the scripting
language. This includes the fact that while the potentiostat is polling for data, the script cannot
execute any commands. This means that if the potentiostat is continuously polling for data, as
we had planned, the script cannot execute commands except for before and after the data is
gathered. This invalidated our original idea to pass the sampled data value as a launch
parameter to the Python program, since the program would need to be launched between each
sample. Furthermore, Explain script’s handling of strings is very primitive, adding difficulty to
the task of properly formatting the string to launch the Python program.
Through our correspondence with Gamry technicians, we attempted to bypass the ongoing
issue of the script becoming unresponsive during data sampling. They offered various
convoluted techniques, none of which completely solved the problem in a way that would allow
for real-time data transfer. We eventually found a way to repeatedly signal the potentiostat to
start and stop the data polling process. This allowed us to implement the full sequence of
events shown in Figure 14. Due to the Explain script language having such poor support for
string formatting, we decided to use a file-based solution to pass the sampled data to the
Python program, rather than passing the data as a parameter when the Python program is
called.

3.17.2011 Rev. 26 Page 27
Figure 14 shows the complete process that is used within the communication interface
between the potentiostat and the Python program. This process is fully implemented with
Gamry’s Explain script language, and solves the problem of the race condition. The “Wait” step
between samples is two seconds, while the Python program takes only 0.25 seconds to fully
execute from the time it is called. Using this looping Explain script, our system’s performance
can be monitored indefinitely at a rate of one sample per two seconds, until an operator
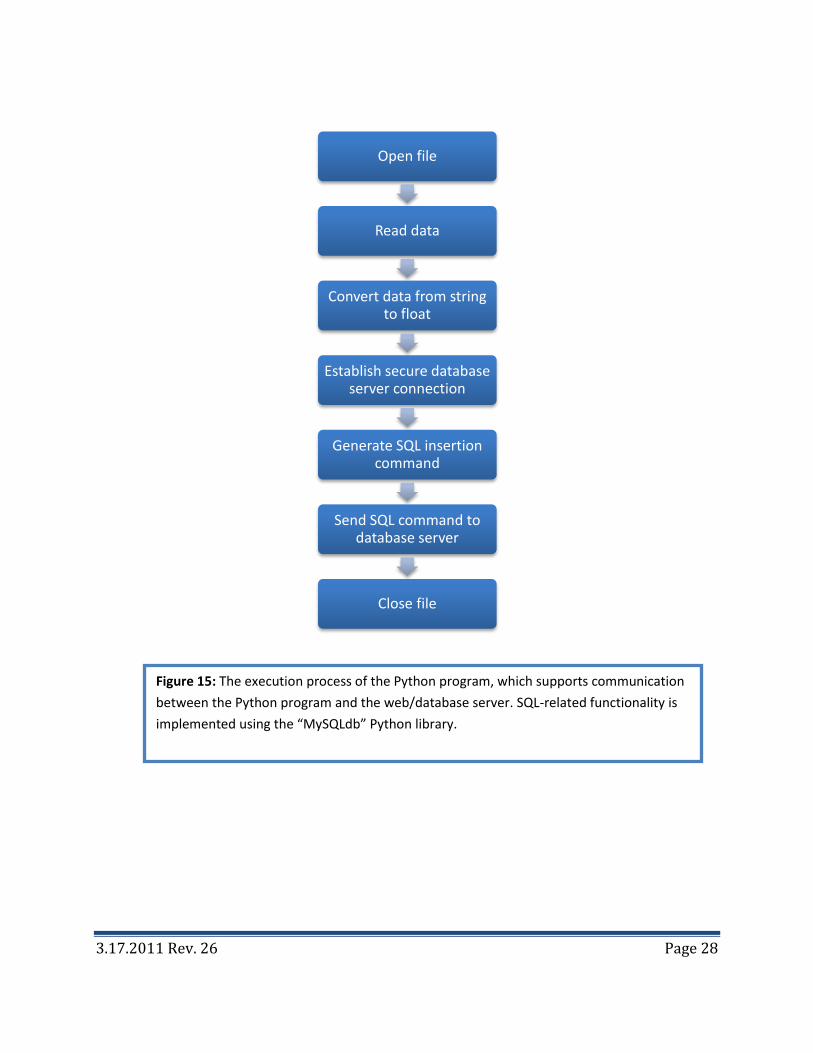
manually stops the script. Although the Python script is very straightforward, it has been
included in Figure 15 below for completeness and reference.
Signal potentiostat active
Open file
Poll for voltage data
Write to file
Close file
Signal potentiostat inactive
Call Python Program
Wait
Loop
Figure 14: The execution process of the Explain script, which supports communication
between the Gamry potentiostat and the Python program. The “Wait” step is used to
avoid a race condition where the Python program and the Explain script compete for the
use of the same data file.
3.17.2011 Rev. 26 Page 28
Open file
Read data
Convert data from string to float
Establish secure database server connection
Generate SQL insertion command
Send SQL command to database server
Close file
Figure 15: The execution process of the Python program, which supports communication
between the Python program and the web/database server. SQL-related functionality is
implemented using the “MySQLdb” Python library.

3.17.2011 Rev. 26 Page 29
DISPLAYING REAL-TIME VOLTAGE AND CURRENT READINGS ON A WEBSITE
OV ERVI EW :
Displaying real-time data on a website will help monitor the concentration cell off-site. This
data will also be saved in the server so that researchers can examine and look at this past
history of current and voltage readings. Our team has developed an interactive design so that
users can specify specific options like dates or style of plot output.
SERV ER SETUP :
In order to display the real-time sensor readings of our project, a LAMP Server has been set up
and configured. A LAMP stack consists of Linux, Apache, MySQL and PHP. This is a powerful and
professional stack used by industry to maintain and run powerful websites. A LAMP server has
been chosen because it runs on Linux, which offers a range variety of open source software that
can be used to complete and expand this project.
Apache is a popular and open source webserver. Apache is running our website which will help
to display static and dynamic pages to the public with useful project progress and sensor data.
Apache has been configured to have the website’s root folder located in the senior design user
account’s home directory on the web server. This will provide easy access for members from
the local machine or through SSH.
MySQL is open source database software that is used to manipulate and output data in a
readable fashion. MySQL has been configured so that it can be accessible from any public and
external ip address. MySQL has been set up to work implicitly with SSH, which will allow users
to manipulate the settings and permissions of databases. Databases in MySQL have been
created and set up to receive and store autonomous data from the client program. These
databases are also used to simultaneously display the data to our website.
WEB DESI GN :
PHP is a scripting language that is used implicitly with MySQL queries to recognize sensor
readings from the client program and to store the data accordingly. A connection has been
established with the database and webserver to retrieve the data into a query and output it to
a dynamic page using PHP.
The website has been created using css, xhtml, php, mysql, jquery, python and javascript. It
includes static and dynamic pages. The static pages provide an overview of the project. The
3.17.2011 Rev. 26 Page 30
dynamic content is composed of real-time plots that have been configured for outputting real-
time data output. To provide the user with this data in a nice comprehensible way we have
integrated ajax(asynchronous javascript and xhtml). Ajax allow us to update specific areas of
our website without updating the whole page.
The website has been given a static ip and a domain name of red.soe.ucsc.edu. This website can
be accessible from any web browser by typing the domain name(url). This domain name can
also be used to access the server through ssh.
WEBSIT E GRAP HS AN D TABLE OUTP UT :
One of the main purposes of the website is to display comprehensible real-time data. Our data
will be displayed on our website via comprehensible graphs and tables. To achieve a user-
friendly interface we have made our website versatile to the point were it is OS and web
browser independent. Our website gives the user two options a flash or no flash data view. This
allows users/clients to view the data even from an iPhone or school computers, which usually
don’t support flash. These real-time graphs are all located at red.soe.ucsc.edu in the results tab.
We use Jighi Jcharts to display real-time flash graphs and charts. We fed in our mysql database
to Jighi, with their user interface we were able to customize the graphs and charts to display
data comprehensively to the user. In Figure 13 and 14 we can see a graph and chart from the
Jcharts output that we got from our stored voltage data. The graphs and tables have display
options, this can allow the user to view data within a range or even specify a custom order for
the tables.
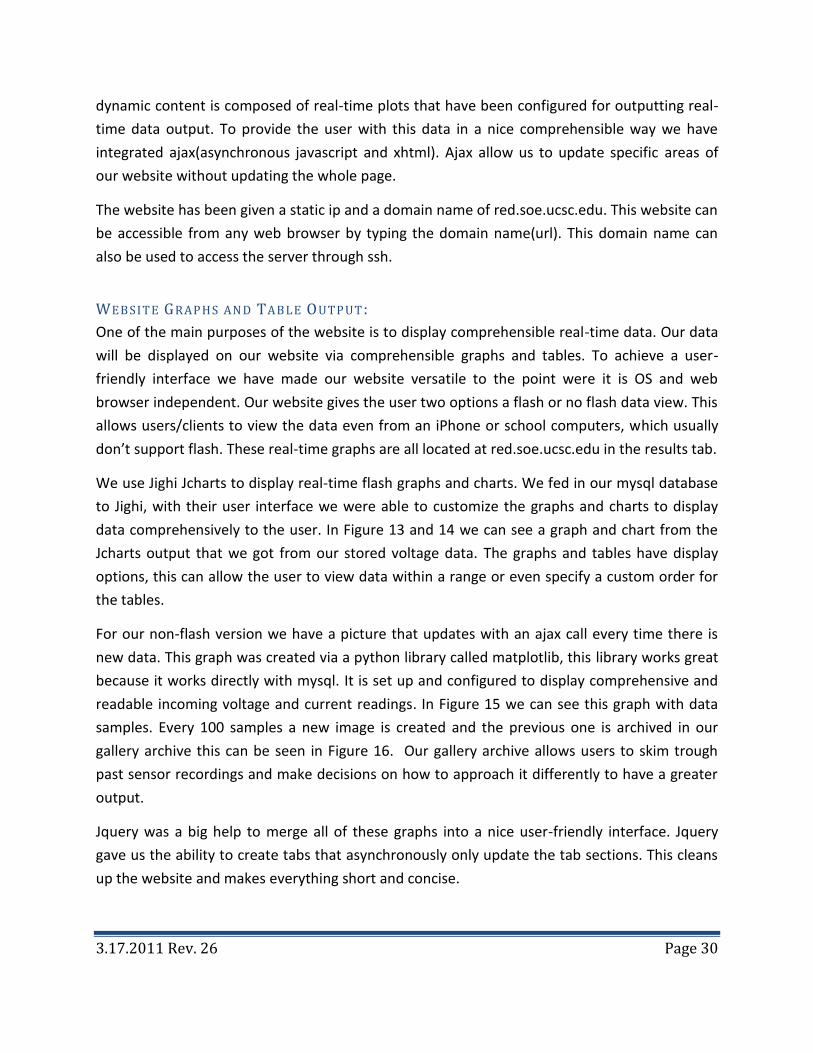
For our non-flash version we have a picture that updates with an ajax call every time there is
new data. This graph was created via a python library called matplotlib, this library works great
because it works directly with mysql. It is set up and configured to display comprehensive and
readable incoming voltage and current readings. In Figure 15 we can see this graph with data
samples. Every 100 samples a new image is created and the previous one is archived in our
gallery archive this can be seen in Figure 16. Our gallery archive allows users to skim trough
past sensor recordings and make decisions on how to approach it differently to have a greater
output.
Jquery was a big help to merge all of these graphs into a nice user-friendly interface. Jquery
gave us the ability to create tabs that asynchronously only update the tab sections. This cleans
up the website and makes everything short and concise.

3.17.2011 Rev. 26 Page 31
Figure 13: Flash graph, this user interface was provided by Jighi. The graph shows Voltage
readings vs Timestamps

3.17.2011 Rev. 26 Page 32
Figure 14: Flash table, this user interface was provided by Jighi. The table shows relevant
rows to Figure 14, it also allows you to view columns by order by clicking on them.
3.17.2011 Rev. 26 Page 33
Figure 15: Non-flash graph, this graph allows users with iPhones or computers that don’t
have flash installed to still view real-time data.

3.17.2011 Rev. 26 Page 34
Figure 16: Non-flash gallery archive, this gallery archive allows users with iPhones or
computers that don’t have flash installed to still view real-time data. This gallery archive
allows us to scroll through past data and view previous recorded results.

3.17.2011 Rev. 26 Page 35
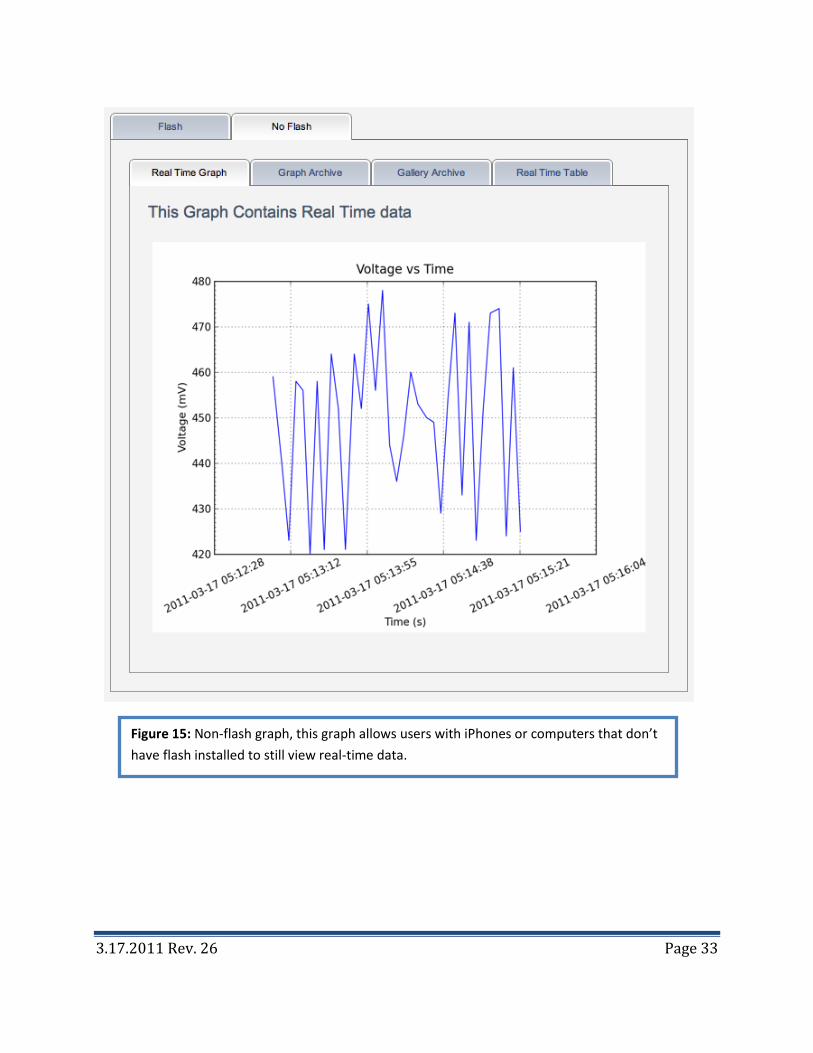
REMO TE CAMERA MONI TORIN G SY ST EM:
The website also serves as a Remote Camera Monitoring system, it allows us to remotely
control a camera through the web browser. This camera allows users and clients to remotely
monitor their sensor readings. For any reason that there is any doubt about the sensor readings
we can watch the physical concentration cell setup to detect leaks, wire disconnections or
unforeseen mishaps.
The remote camera monitoring system has features that allow users to specify different view
options. In Figure 17 we can see the physical user interface on our website, as you can see you
are given the option to pan and tilt the camera to view the concentration cell(or what ever is
present in its location) from different angles.
The camera supports real-time high quality video and audio over the internet. The camera has
been configured to allow two way audio, users can remotely hear what’s going on at the
location of the camera and transfer voice across. The camera is equipped with night vision and
it is also supports ftp uploading and email notification with images triggered by motion
detection or schedule. The motion detection is great because if something occurs in our setup
like an unplugged wire or someone interrupts we will be notified.
Besides ftp uploading you can also have a NAS(Network Address Storage), meaning you can
have a hard drive or usb connected to the camera to record the data via mpeg4 codec.
3.17.2011 Rev. 26 Page 36
CLO S UR E :
As we can see this server implementation setup is a great way to monitor our offsite recordings.
It will serve as a test bench for our researchers to be able to completely monitor their lab setup
efficiently.
Figure 17: Remote Monitoring Camera System. Allows users to pan/tilt and view the
concentration cell in Night Vision mode.

3.17.2011 Rev. 26 Page 37
FEASIBILITY CONCLUSION OF REVERSE ELECTRODIALYSIS
Although the cell’s power output at maximum was 1.51W, the actual amount of water mixing
in each cell was significantly less than 1m3 of fresh water and salt water mixing. [Note: the
dimensions of the cell result in the following approximated volumes: cell (pvc union): 0.0062m2
+ two 3-way tees: 0.0065m2 + 0.0046m2 for a total of 0.0173m2 per cell.] The total amount of
water mixing for this design was 0.0865m2 of fresh water mixing with 0.0865m2 of ocean water.
Using equation 6 and plugging in the experimental cell’s volume, an estimated 80,335J 0.08MJ
is available. Over the course of the 15,000 seconds when the ten cells were in parallel and had a
load to draw a current, 0.0227J were extracted. This is a 0.000028% recovery, which does not
indicate strong alternative energy potential.
Additional experiments would be needed to conclusively deduce that reverse electrodialysis is
not a practical alternative source of energy, however it can be concluded that this particular
design will not provide adequate percent yield of energy.

3.17.2011 Rev. 26 Page 38
SYSTEM BLOCK DIAGRAM
Send measurement data
Read voltage and current (analog)
Energy harvesting
Read voltage and current (digital)
Read voltage and current (analog)
Cell (x2 BME)
Sensors (x1 BME/EE)
Client Program
(x1 CMPE)
Storage (x1 BME/EE)
Web Server
(x1 CMPE)
Figure 13: The block diagram shows how the concentration cell will relay voltage and current information to
the sensors and transfer some of the energy to a storage cell. The sensors will the relay the information
they’ve obtained to the web server by way of the client program so the readings can be displayed on our
website. This will allow for the concentration cell to be monitored remotely.
3.17.2011 Rev. 26 Page 39
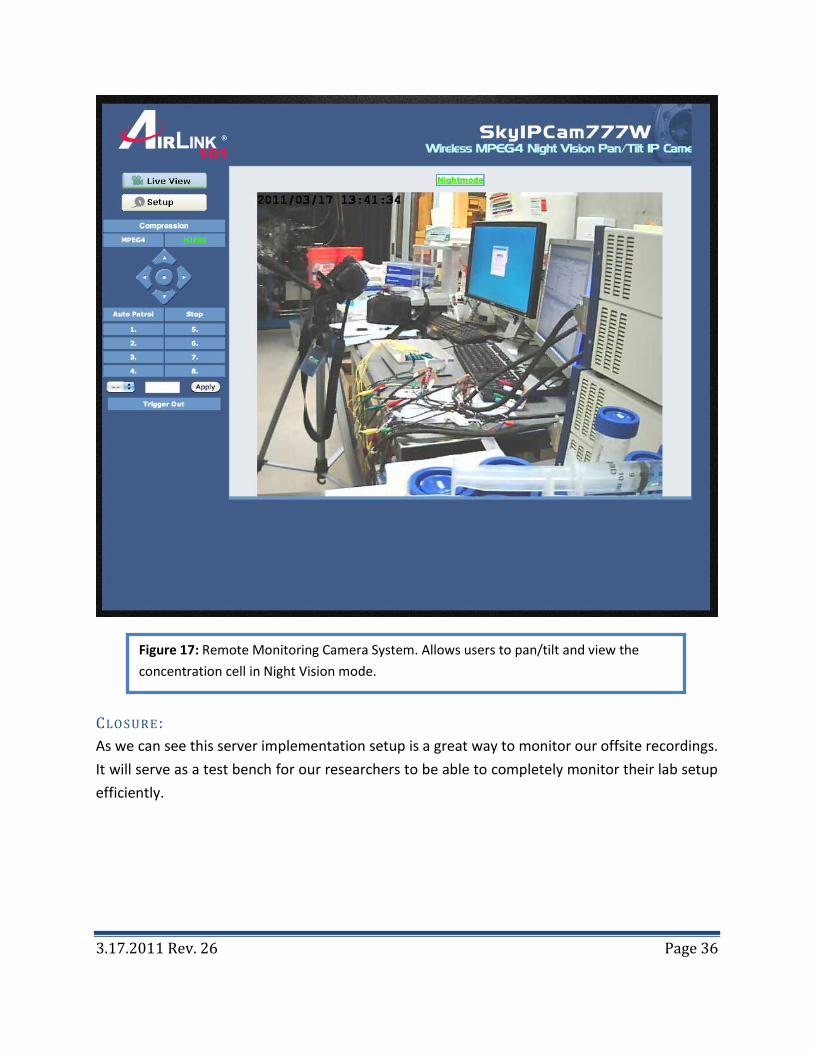
BUDGET
Cell BME (x2)
Components Costs
Anode + Cathode $260 ($8.50 ea.)
Membranes $20 (8 ½ x 11 sheet)
PVC $55
Tubing $60
Valves $20
Total $415
Storage Component EE (x1)
Components Costs
Discrete Components $100
Total $100
3.17.2011 Rev. 26 Page 40
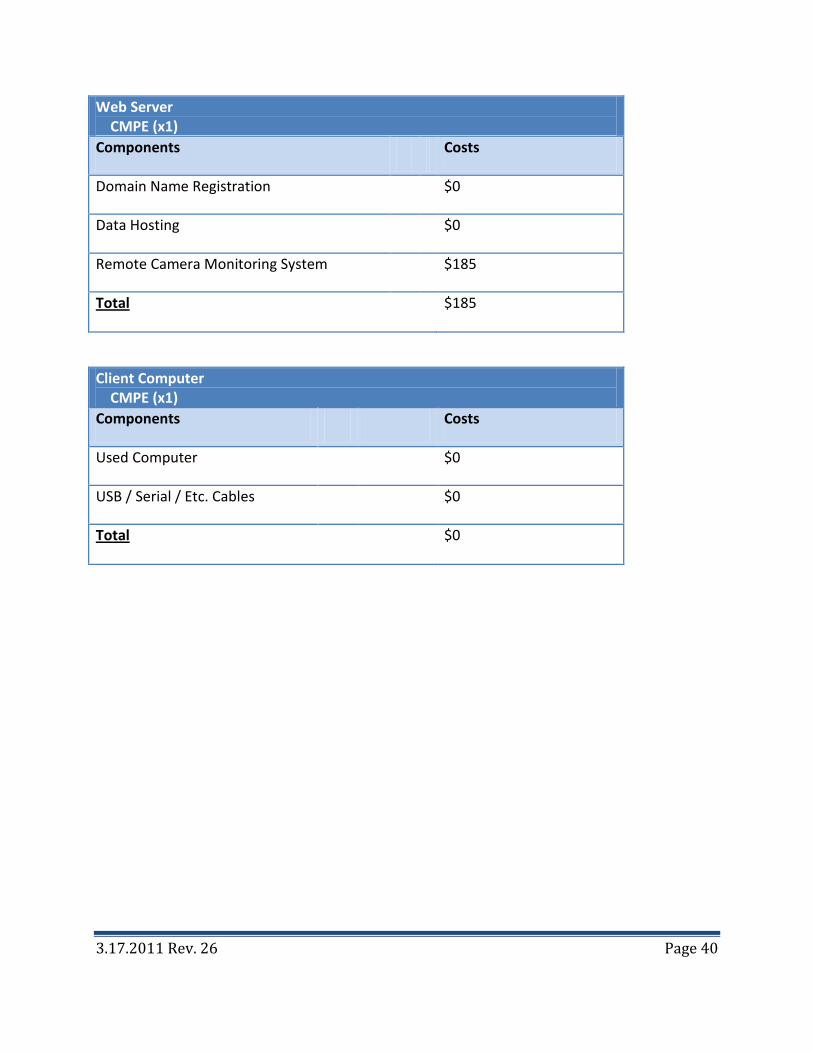
Web Server CMPE (x1)
Components Costs
Domain Name Registration $0
Data Hosting $0
Remote Camera Monitoring System $185
Total $185
Client Computer CMPE (x1)
Components Costs
Used Computer $0
USB / Serial / Etc. Cables $0
Total $0

3.17.2011 Rev. 26 Page 41
PERSONNEL
ALEXANDRA EASTES
Responsibilities:
Responsible for developing a storage component for the energy generated from the cell.
Summarized Biography:
Alex is a bioengineering major with a concentration in bioelectronics and an electrical
engineering minor. She has a broad knowledge of classes from a variety of engineering
backgrounds. She is currently working on redesigning the old EMG (electromyography) system
in Jacob Rosen’s lab for his lower-limb exoskeleton.
Expertise:
Analog electronics
Sensors (biomedical)
Electrochemistry

3.17.2011 Rev. 26 Page 42
DYLAN HINGEY
Responsibilities:
Responsible for facilitating communication between the sensor device and the web server.
Current and voltage data should be continuously collected from the sensor, and must be
transmitted to the server accordingly. This implies the responsibility of creating a client
program which reads in the sensor data, and converts the data into SQL queries. Furthermore,
the program will need to maintain a secure connection with the server so that data is streamed
in real-time.
Summarized Biography:
A student majoring in Computer Engineering: Networks and Information Systems Management,
Dylan’s experience ranges from computer hardware and software, to business and project
management. Skills gained through numerous programming courses and software-related
internships will aid in the carrying out of his responsibilities. Additionally, Dylan’s training in
team-based projects through the Information Systems Management curriculum will be useful in
facilitating collaboration and communication amongst team members.
Expertise:
Database systems
Software development
Computer networks
Hardware systems
Project management

3.17.2011 Rev. 26 Page 43
ULYSSES MORALES
Responsibilities:
Responsible for setting up a web server and completing the web interface that displays voltage
and current. The website will feature dynamic real-time content in the form of updated sensor
data. He will need to use data modeling to display sensor readings in a comprehensive way. If
time permits, he will also be responsible in setting up a Remote Camera Monitoring System.
Summarized Biography:
A Computer Engineering student concentrating in Networks, Ulysses’ experience working with
servers will be a great help in assuring that he completes his duties in this project. He has
designed and maintained websites in the past. He has a great amount of experience using Linux,
this will help with data modeling and server configuration. His skills will also allow him to
expand on the project specifications if there is sufficient time.
Expertise:
Wireless systems
Software development
Database systems
Website development and maintenance
Server communication and development

3.17.2011 Rev. 26 Page 44
CHIRAG SHARMA
Responsibilities:
Responsible for the membrane stack and construction of the part of the cell which will hold the
membrane. Also, Chirag is responsible for conducting the tests to verify that the expected
energy values match the experimental.
Summarized Biography:
A Biomolecular Engineering student, Chirag has prior research experience with membranes and
electrochemistry from working in the Akeson Laboratory. This knowledge will be useful for
making the concentration cell, choosing the membrane and conducting the experiments on the
concentration cell.
Expertise:
Electrochemistry
Salinity gradients in biological systems
Working with membranes

3.17.2011 Rev. 26 Page 45
DANNY TATE
Responsibilities:
Calculate theoretical voltage, power and energy from mixing the San Lorenzo River with the
Monterey Bay. Run experiments for initial prototype cell testing. Combining these theoretical
calculations with experimental results, design and build a functioning concentration cell stack.
Summarized Biography:
Danny is a Bioengineer with a biomolecular concentration. His work with the Quantum
Electronics Group, headed by Professor Ali Shakouri, involves developing a self-recharging
battery powered by ions within humans to provide energy to biomedical devices. He has
worked on this research for two years and has a strong background in power generation form
ionic gradients.
Expertise:
Reverse-electrodialysis
o Power calculations
o Ionic selection
o Technical workings
3.17.2011 Rev. 26 Page 46
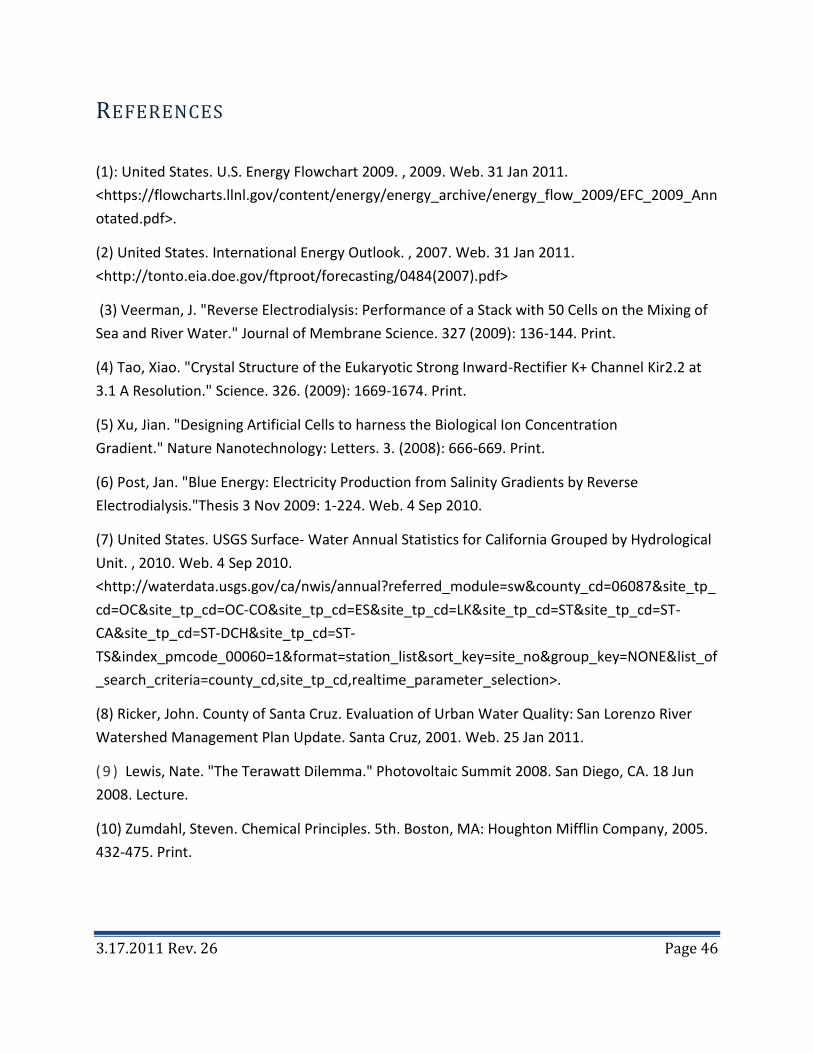
REFERENCES
(1): United States. U.S. Energy Flowchart 2009. , 2009. Web. 31 Jan 2011.
<https://flowcharts.llnl.gov/content/energy/energy_archive/energy_flow_2009/EFC_2009_Ann
otated.pdf>.
(2) United States. International Energy Outlook. , 2007. Web. 31 Jan 2011.
<http://tonto.eia.doe.gov/ftproot/forecasting/0484(2007).pdf>
(3) Veerman, J. "Reverse Electrodialysis: Performance of a Stack with 50 Cells on the Mixing of
Sea and River Water." Journal of Membrane Science. 327 (2009): 136-144. Print.
(4) Tao, Xiao. "Crystal Structure of the Eukaryotic Strong Inward-Rectifier K+ Channel Kir2.2 at
3.1 A Resolution." Science. 326. (2009): 1669-1674. Print.
(5) Xu, Jian. "Designing Artificial Cells to harness the Biological Ion Concentration
Gradient." Nature Nanotechnology: Letters. 3. (2008): 666-669. Print.
(6) Post, Jan. "Blue Energy: Electricity Production from Salinity Gradients by Reverse
Electrodialysis."Thesis 3 Nov 2009: 1-224. Web. 4 Sep 2010.
(7) United States. USGS Surface- Water Annual Statistics for California Grouped by Hydrological
Unit. , 2010. Web. 4 Sep 2010.
<http://waterdata.usgs.gov/ca/nwis/annual?referred_module=sw&county_cd=06087&site_tp_
cd=OC&site_tp_cd=OC-CO&site_tp_cd=ES&site_tp_cd=LK&site_tp_cd=ST&site_tp_cd=ST-
CA&site_tp_cd=ST-DCH&site_tp_cd=ST-
TS&index_pmcode_00060=1&format=station_list&sort_key=site_no&group_key=NONE&list_of
_search_criteria=county_cd,site_tp_cd,realtime_parameter_selection>.
(8) Ricker, John. County of Santa Cruz. Evaluation of Urban Water Quality: San Lorenzo River
Watershed Management Plan Update. Santa Cruz, 2001. Web. 25 Jan 2011.
( 9 ) Lewis, Nate. "The Terawatt Dilemma." Photovoltaic Summit 2008. San Diego, CA. 18 Jun
2008. Lecture.
(10) Zumdahl, Steven. Chemical Principles. 5th. Boston, MA: Houghton Mifflin Company, 2005.
432-475. Print.

3.17.2011 Rev. 26 Page 47
(11) Salzman, W. "Properties of ideal solutions: Mixtures; Partial Molar Quantities; Ideal
Solutions.” N.p., 21 Oct 2004. Web. 31 Jan 2011.
<http://www.chem.arizona.edu/~salzmanr/480a/480ants/mixpmqis/mixpmqis.html>.
(12) "Thermodynamics." Spark Notes. N.p., 2011. Web. 1 Feb 2011.
<http://www.sparknotes.com/chemistry/electrochemistry/thermo/section1.rhtml>.
(13) Simpson, Chester. Battery Charging. National
Semiconductor. http://www.national.com/appinfo/power/files/f7.pdf
(14) Veerman, J., Saakes, M., Metz, S.J., & Harmsen, G.J. “Reverse Electrodialysis: Evaluation fo
Suitable Electrode Systems.” Journal of Applied Electrochemistry. (2010) 40, 1461-1474
(15) "Prototypes Electromagnetic Pistol." Coilgun Systems. Web. 2 Feb. 2011.
<http://www.coilgun.eclipse.co.uk/electromagnetic_pistol_voltage_converter_design.html>
(16) Woolcott, George. “Single Solar Cell.” Electronic Design 28 Sept. 2006: 60.


![Performance of the first Reverse Electrodialysis pilot ......electrodialysis can be suitable for different applications, e.g. for power production from natural salinity gradients [3–9],](https://img.pdfslide.net/doc/110x75/5fe0883e71394432a7504fde/performance-of-the-first-reverse-electrodialysis-pilot-electrodialysis-can.jpg)