Embed Size (px)
Citation preview
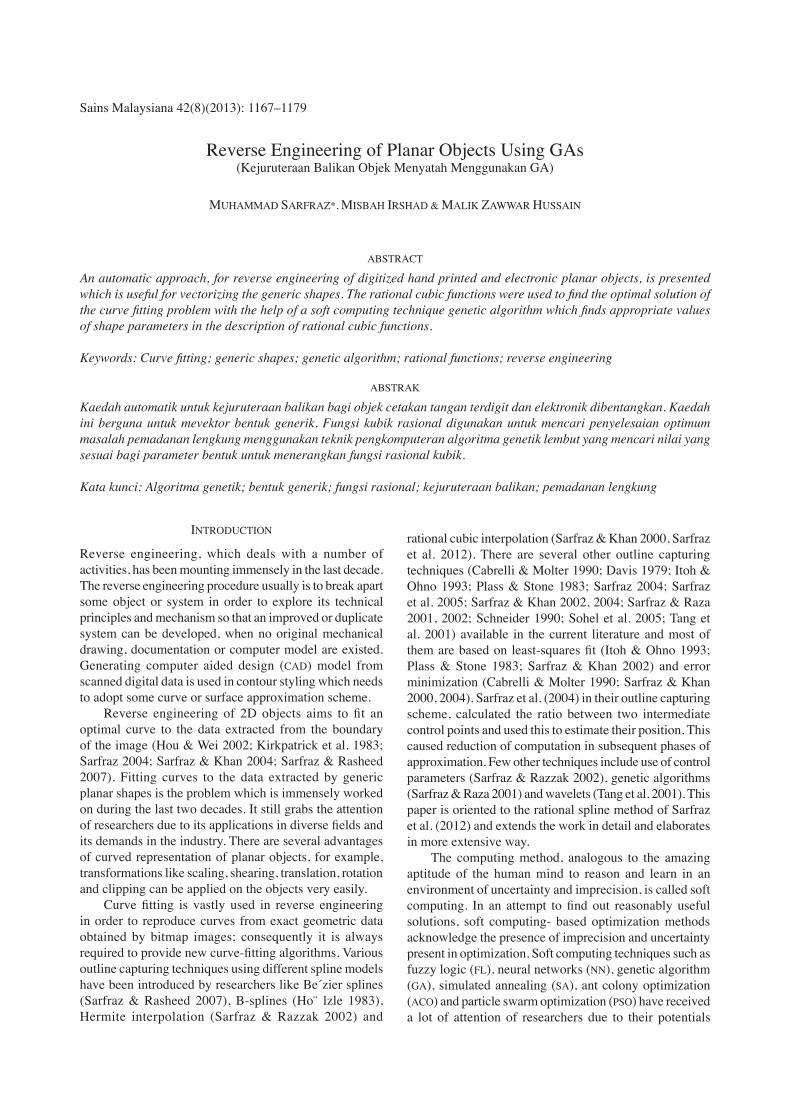
Sains Malaysiana 42(8)(2013): 1167–1179
Reverse Engineering of Planar Objects Using GAs(Kejuruteraan Balikan Objek Menyatah Menggunakan GA)
MUHAMMAD SARFRAZ*, MISBAH IRSHAD & MALIK ZAWWAR HUSSAIN
ABSTRACT
An automatic approach, for reverse engineering of digitized hand printed and electronic planar objects, is presented
of shape parameters in the description of rational cubic functions.
Keywords:
ABSTRAK
Kaedah automatik untuk kejuruteraan balikan bagi objek cetakan tangan terdigit dan elektronik dibentangkan. Kaedah
ini berguna untuk mevektor bentuk generik. Fungsi kubik rasional digunakan untuk mencari penyelesaian optimum
masalah pemadanan lengkung menggunakan teknik pengkomputeran algoritma genetik lembut yang mencari nilai yang
sesuai bagi parameter bentuk untuk menerangkan fungsi rasional kubik.
INTRODUCTION
Reverse engineering, which deals with a number of activities, has been mounting immensely in the last decade. The reverse engineering procedure usually is to break apart some object or system in order to explore its technical principles and mechanism so that an improved or duplicate system can be developed, when no original mechanical drawing, documentation or computer model are existed. Generating computer aided design (CAD) model from scanned digital data is used in contour styling which needs to adopt some curve or surface approximation scheme.
optimal curve to the data extracted from the boundary of the image (Hou & Wei 2002; Kirkpatrick et al. 1983; Sarfraz 2004; Sarfraz & Khan 2004; Sarfraz & Rasheed 2007). Fitting curves to the data extracted by generic planar shapes is the problem which is immensely worked on during the last two decades. It still grabs the attention
its demands in the industry. There are several advantages of curved representation of planar objects, for example, transformations like scaling, shearing, translation, rotation and clipping can be applied on the objects very easily.
in order to reproduce curves from exact geometric data obtained by bitmap images; consequently it is always
outline capturing techniques using different spline models have been introduced by researchers like Be´zier splines (Sarfraz & Rasheed 2007), B-splines (Ho¨ lzle 1983), Hermite interpolation (Sarfraz & Razzak 2002) and
rational cubic interpolation (Sarfraz & Khan 2000, Sarfraz et al. 2012). There are several other outline capturing techniques (Cabrelli & Molter 1990; Davis 1979; Itoh & Ohno 1993; Plass & Stone 1983; Sarfraz 2004; Sarfraz et al. 2005; Sarfraz & Khan 2002, 2004; Sarfraz & Raza 2001, 2002; Schneider 1990; Sohel et al. 2005; Tang et al. 2001) available in the current literature and most of
Plass & Stone 1983; Sarfraz & Khan 2002) and error minimization (Cabrelli & Molter 1990; Sarfraz & Khan 2000, 2004). Sarfraz et al. (2004) in their outline capturing scheme, calculated the ratio between two intermediate control points and used this to estimate their position. This caused reduction of computation in subsequent phases of approximation. Few other techniques include use of control parameters (Sarfraz & Razzak 2002), genetic algorithms (Sarfraz & Raza 2001) and wavelets (Tang et al. 2001). This paper is oriented to the rational spline method of Sarfraz et al. (2012) and extends the work in detail and elaborates in more extensive way. The computing method, analogous to the amazing aptitude of the human mind to reason and learn in an environment of uncertainty and imprecision, is called soft
solutions, soft computing- based optimization methods acknowledge the presence of imprecision and uncertainty present in optimization. Soft computing techniques such as fuzzy logic (FL), neural networks (NN), genetic algorithm (GA), simulated annealing (SA), ant colony optimization (ACO) and particle swarm optimization (PSO) have received a lot of attention of researchers due to their potentials
1168
to deal with highly nonlinear, multidimensional and ill-behaved complex engineering problems (Chandrasekaran et al. 2010). The genetic algorithm has been very powerful tool
the process of natural evolution based on the ‘survival of
from boundary of the image. The process of vectorizing outlines of the images consists of several mathematical and computational stages like: Extracting boundary of the bitmap image, detecting corners from the boundary and
COUNTOUR EXTRACTION AND SEGMENTATION
to extract data from the boundary of the bitmap image or a generic shape. Capturing boundary or outline representation of an object is a way to preserve the complete shape of an object. The objects in an image can also be represented by the interior of shape. Chain coding for boundary approximation and encoding was initially
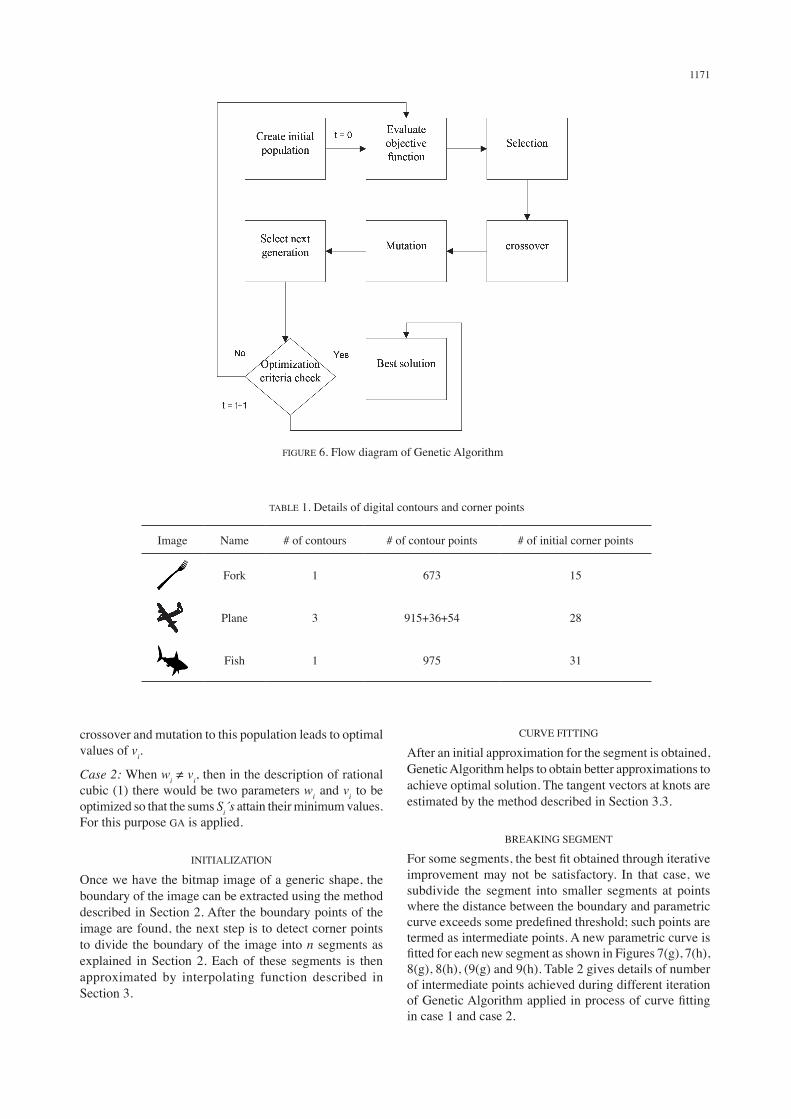
attention over the last three decades. Chain codes represent the direction of the image and help to attain the geometric data from outline of the image. Extracted boundaries of the bitmap images given in Figures 7(a), 8(a) and 9(a) are in Figures 7(b), 8(b) and 9(b), respectively. The second step in reverse engineering of planar objects is segmentation of object boundary before curve
process. Secondly, each shape consists of natural break points (like four corners of a rectangle) and quality of approximation can be improved if boundary is subdivided into smaller pieces at these points. These are normally the discontinuous points to which we do not want to apply any smoothing and like to capture them as such. These points can be determined by a suitable corner detector. Researchers have used various corner detection algorithms for outline capturing (Avrahami & Pratt 1991; Beus & Tiu 1987; Chetrikov & Zsabo 1999; Sarfraz et al. 2006; Teh & Chin 1989). The method proposed in (Chetrikov & Zsabo 1999) was used in this paper. Number of contour points and detected boundary points for different images is given in Table 1. Detected corners of the boundaries shown in Figures 7(b), 8(b) and 9(b) can be seen in Figures 7(c), 4(c) and 5(c), respectively.
RATIONAL CUBIC FUNCTION
A piecewise rational cubic parametric function P C1[ti,
ti+1], with shape parameters v
i, w
i i = 1, …, n is used
boundary of the bitmap image, the rational cubic function t [t
i, t
i+1], i = 1, …, n, as follows:
Pi(t) =
(1)
where F1 and Fi+1 are two corner points (given control
points) of the ith segment of the boundary with = (t – ti)/
hi, wherte h
i = t
i+1 – ti,
Vi = F
i + and W
i = F
i+1 – (2)
where Di, i = 1, …, n
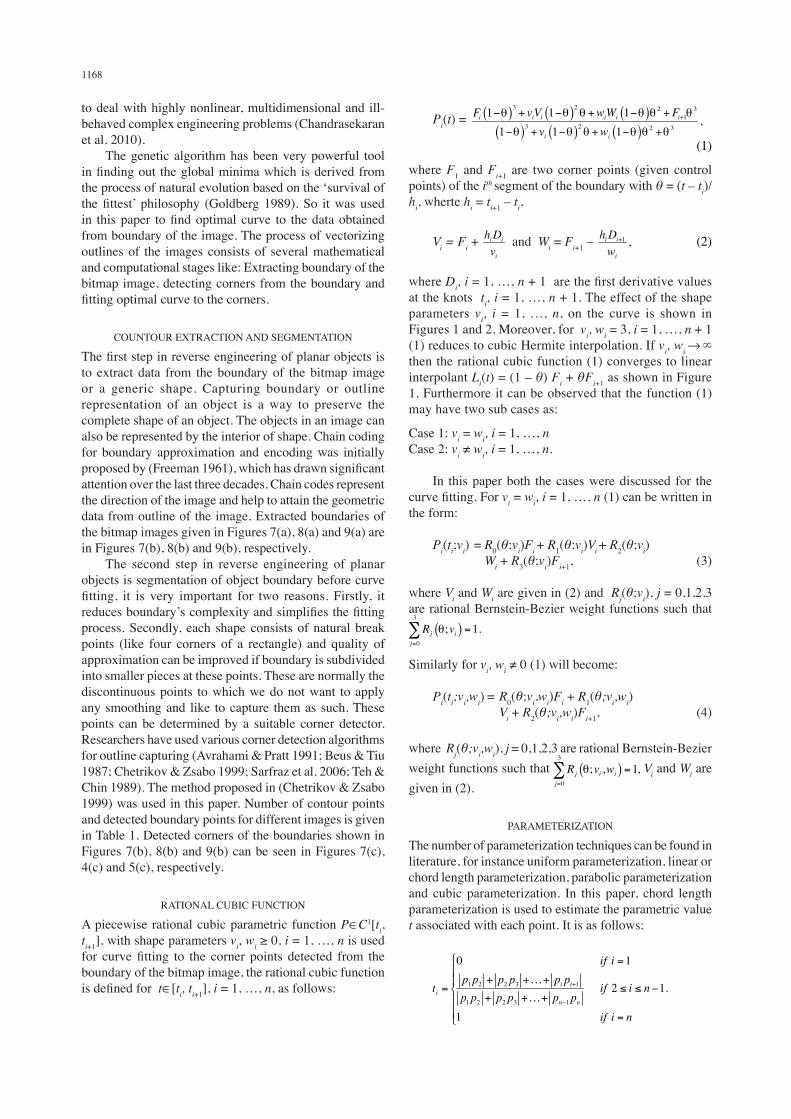
at the knots ti, i = 1, …, n + 1. The effect of the shape
parameters vi, i = 1, …, n, on the curve is shown in
Figures 1 and 2. Moreover, for vi, w
i = 3, i = 1, …, n + 1
(1) reduces to cubic Hermite interpolation. If vi, wi
then the rational cubic function (1) converges to linear interpolant L
i(t) = (1 – ) F
i +
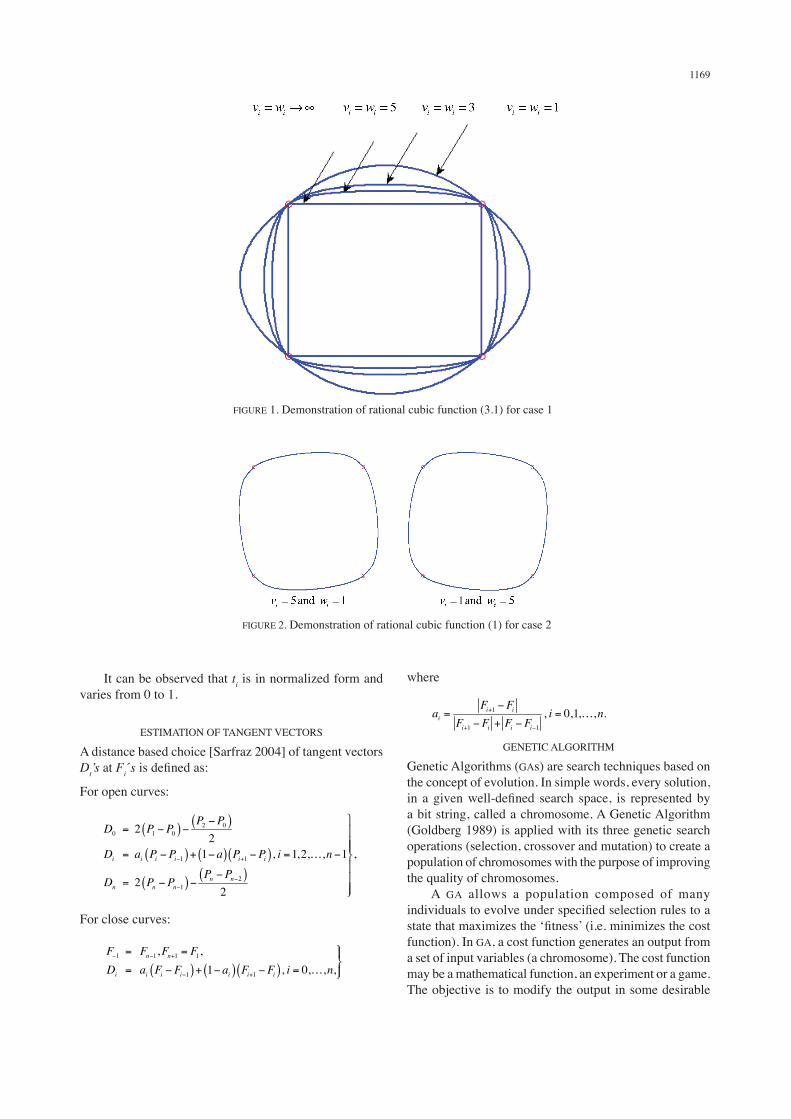
i+1 as shown in Figure 1. Furthermore it can be observed that the function (1) may have two sub cases as:
Case 1: vi = w
i, i = 1, …, n
Case 2: vi w
i, i = 1, …, n.
In this paper both the cases were discussed for the v
i = w
i, i = 1, …, n (1) can be written in
the form:
Pi(t
i;v
i) = R0( ;v
i)F
i + R1( ;v
i)V
i + R2( ;v
i)
Wi + R3( ;v
i)F
i+1, (3) where V
i and W
i are given in (2) and R
j( ;v
i), j = 0,1,2,3
are rational Bernstein-Bezier weight functions such that
Similarly for vi, w
i
Pi(t
i i,w
i) = R0( ;v
i,w
i)F
i + R1( i
,wi)
Vi + R2( i
,wi)F
i+1, (4)
where Rj(
i,w
i), j = 0,1,2,3 are rational Bernstein-Bezier
weight functions such that Vi and W
i are
given in (2).
PARAMETERIZATION
The number of parameterization techniques can be found in literature, for instance uniform parameterization, linear or chord length parameterization, parabolic parameterization and cubic parameterization. In this paper, chord length parameterization is used to estimate the parametric value t associated with each point. It is as follows:
1169
It can be observed that ti is in normalized form and
varies from 0 to 1.
A distance based choice [Sarfraz 2004] of tangent vectors D
t’s at F
i´s
For open curves:
For close curves:
where
GENETIC ALGORITHM
Genetic Algorithms (GAs) are search techniques based on the concept of evolution. In simple words, every solution,
a bit string, called a chromosome. A Genetic Algorithm (Goldberg 1989) is applied with its three genetic search operations (selection, crossover and mutation) to create a population of chromosomes with the purpose of improving the quality of chromosomes. A GA allows a population composed of many
function). In GA, a cost function generates an output from a set of input variables (a chromosome). The cost function may be a mathematical function, an experiment or a game. The objective is to modify the output in some desirable
FIGURE 1. Demonstration of rational cubic function (3.1) for case 1
FIGURE 2. Demonstration of rational cubic function (1) for case 2
1170
variables. The GAof variable values to be optimized; variable values are represented in binary so the binary GA works with bits. The GA works with the binary encodings, but the cost function often requires continuous variables. Whenever the cost function is evaluated, the chromosome must be decoded. An example of a binary encoded chromosome is shown in Figure 3.
As a result of crossover operator the offspring contain parts of both the parents. Crossover operator is demonstrated in Figure 4.
FIGURE 3. Example of binary encoding
The GA starts with a group of chromosomes known as the population. Next, the variables are passed to the cost function for evaluation. Natural selection process leads
with the highest cost. Natural selection occurs at each generation or iteration of the algorithm. Deciding how many chromosomes to keep is somewhat arbitrary. Letting only a few chromosomes survive to the next generation limits the available genes in the offspring. Keeping too many chromosomes allows bad performers a chance to contribute their traits to the next generation. We often keep 50% in the natural selection process. Another approach to natural selection is called thresholding. In this approach all chromosomes that have a cost lower than some threshold survive. The threshold must allow some chromosomes to continue in order to have parents to produce offspring. Otherwise, a whole new
that pass the test. At first, only a few chromosomes may survive. In later generations, however, most of the chromosomes will survive unless the threshold is changed. An attractive feature of this technique is that the population does not have to be sorted. In process of matchmaking, two chromosomes are selected from the mating pool of survived chromosomes to produce two new offspring. There are several schemes for parent selection like roulette wheel, tournament selection and random pairing. The next step after selecting parents is mating to create one or more offspring. Commonly used form of mating is called crossover operator which deals with two parents that produce two offspring. A crossover point is randomly selected between
parent passes its binary code to the left of that crossover
its binary code to the left of the same crossover point to second offspring. Further, the binary code to the right of the
FIGURE 4. Example of crossover operator
FIGURE 5. Example of mutation operator
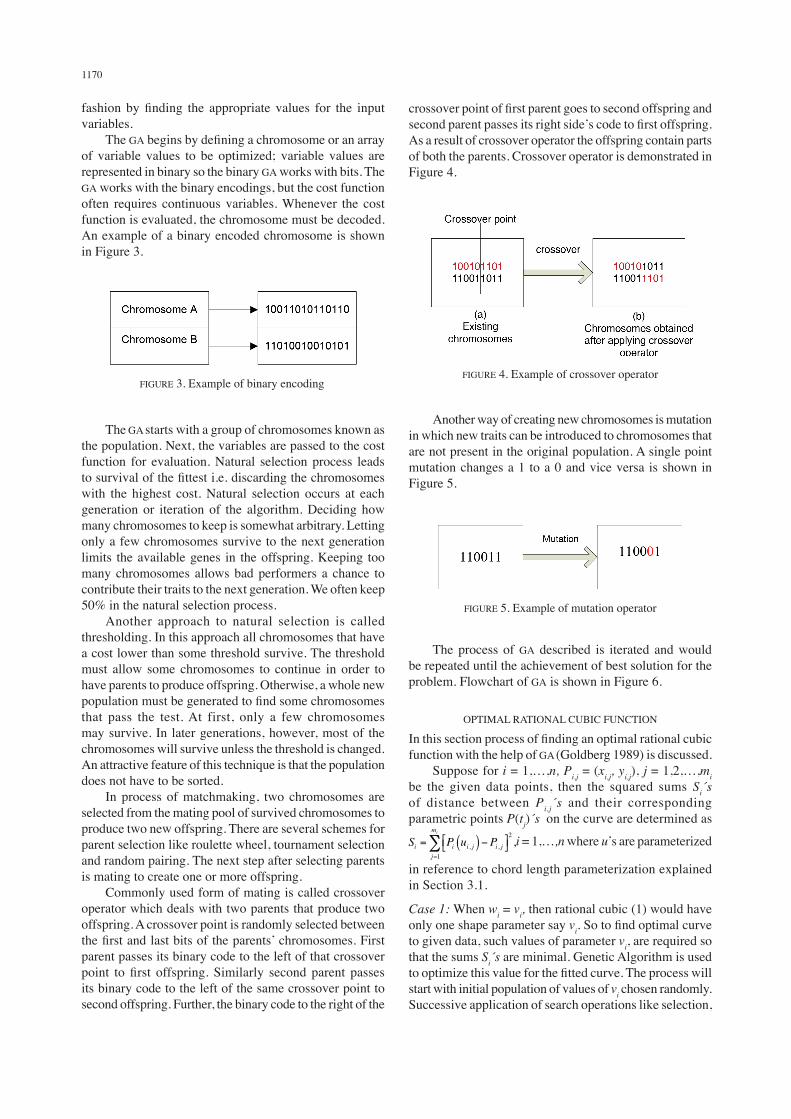
The process of GA described is iterated and would be repeated until the achievement of best solution for the problem. Flowchart of GA is shown in Figure 6.
OPTIMAL RATIONAL CUBIC FUNCTION
function with the help of GA (Goldberg 1989) is discussed. Suppose for i = 1,…,n, P
i,j = (x
i,j, y
i,j), j = 1,2,…,m
i
be the given data points, then the squared sums Si´s
of distance between Pi,j
´s and their corresponding parametric points P(t
j)´s on the curve are determined as
i = 1,…,n where u
in reference to chord length parameterization explained in Section 3.1.
Case 1: When wi = v
i, then rational cubic (1) would have
only one shape parameter say vi
to given data, such values of parameter vi, are required so
that the sums Si´s are minimal. Genetic Algorithm is used
start with initial population of values of vi chosen randomly.
Successive application of search operations like selection,
Another way of creating new chromosomes is mutation in which new traits can be introduced to chromosomes that are not present in the original population. A single point mutation changes a 1 to a 0 and vice versa is shown in Figure 5.
1171
crossover and mutation to this population leads to optimal values of v
i.
Case 2: When wi v
i, then in the description of rational
cubic (1) there would be two parameters wi
and vi
to be optimized so that the sums S
i´s attain their minimum values.
For this purpose GA is applied.
INITIALIZATION
Once we have the bitmap image of a generic shape, the boundary of the image can be extracted using the method described in Section 2. After the boundary points of the image are found, the next step is to detect corner points to divide the boundary of the image into n segments as explained in Section 2. Each of these segments is then approximated by interpolating function described in Section 3.
After an initial approximation for the segment is obtained, Genetic Algorithm helps to obtain better approximations to achieve optimal solution. The tangent vectors at knots are estimated by the method described in Section 3.3.
BREAKING SEGMENT
improvement may not be satisfactory. In that case, we subdivide the segment into smaller segments at points where the distance between the boundary and parametric
termed as intermediate points. A new parametric curve is
8(g), 8(h), (9(g) and 9(h). Table 2 gives details of number of intermediate points achieved during different iteration
in case 1 and case 2.
FIGURE 6. Flow diagram of Genetic Algorithm
TABLE 1. Details of digital contours and corner points
Image Name # of contours # of contour points # of initial corner points
Fork 1 673 15
Plane 3 915+36+54 28
Fish 1 975 31
1172
Algorithm
Step 1: Input the data pointsStep 2: Subdivide the data, by detecting corner points
using the method mentioned in Section 2Step 3: Compute the derivative values at the corner points
by using formula given in Section 3.3Step 4: Fit the rational cubic function of Section 3, to the
corner points found in Step 2Step 5: If the curve, achieved in Step 4, is optimal
then go to Step 7, else find the appropriate
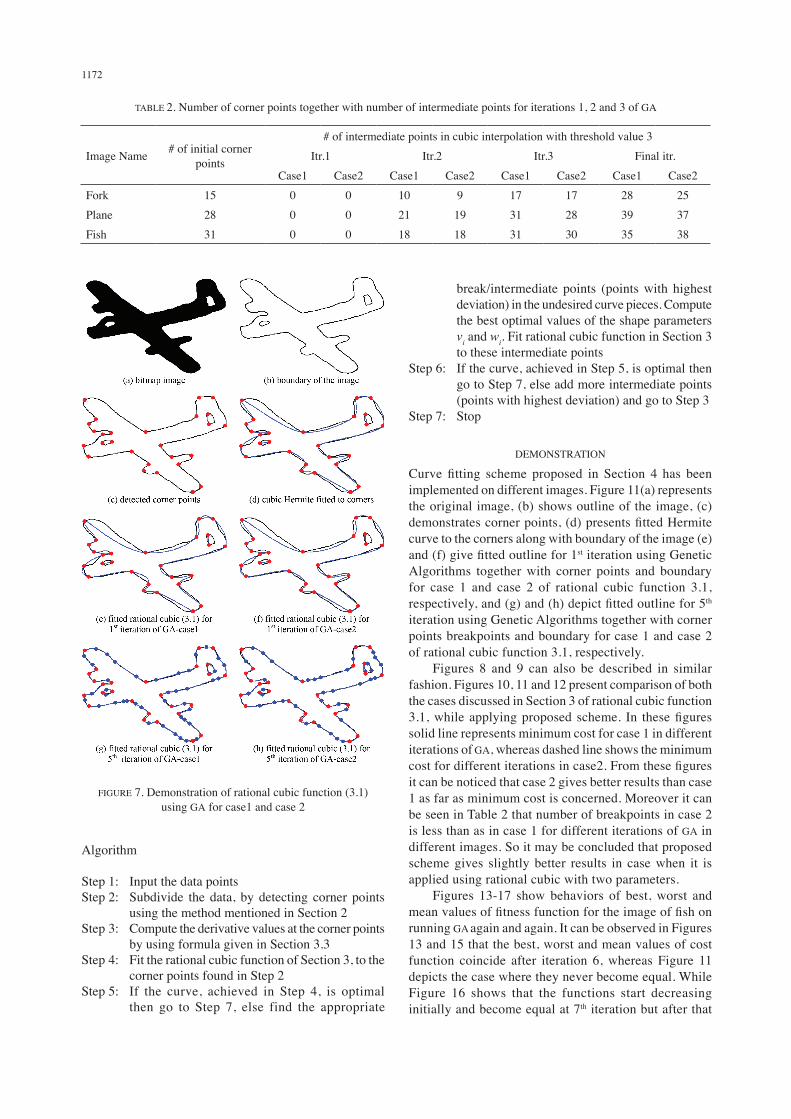
TABLE 2. Number of corner points together with number of intermediate points for iterations 1, 2 and 3 of GA
Image Name # of initial corner points
# of intermediate points in cubic interpolation with threshold value 3Itr.1 Itr.2 Itr.3 Final itr.
Case1 Case2 Case1 Case2 Case1 Case2 Case1 Case2Fork 15 0 0 10 9 17 17 28 25Plane 28 0 0 21 19 31 28 39 37Fish 31 0 0 18 18 31 30 35 38
FIGURE 7. Demonstration of rational cubic function (3.1) using GA for case1 and case 2
break/intermediate points (points with highest deviation) in the undesired curve pieces. Compute the best optimal values of the shape parameters
vi and w
i. Fit rational cubic function in Section 3
to these intermediate pointsStep 6: If the curve, achieved in Step 5, is optimal then
go to Step 7, else add more intermediate points (points with highest deviation) and go to Step 3
Step 7: Stop
DEMONSTRATION
implemented on different images. Figure 11(a) represents the original image, (b) shows outline of the image, (c)
curve to the corners along with boundary of the image (e) st iteration using Genetic
Algorithms together with corner points and boundary for case 1 and case 2 of rational cubic function 3.1,
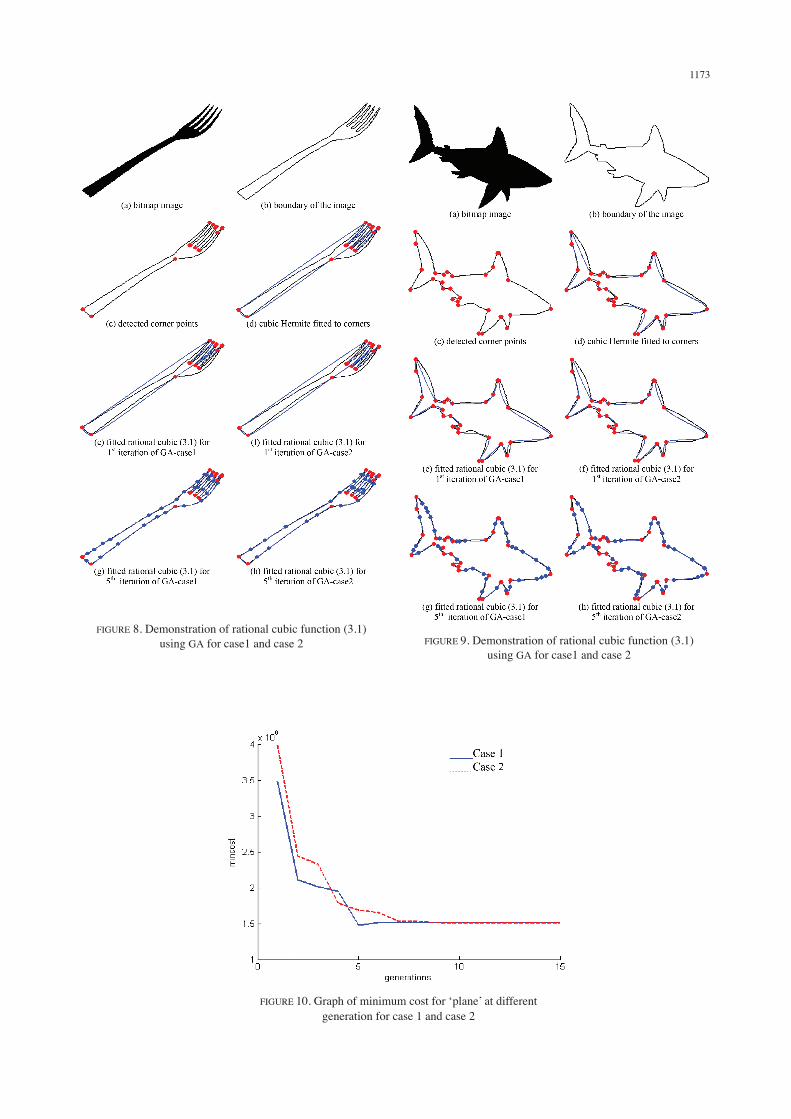
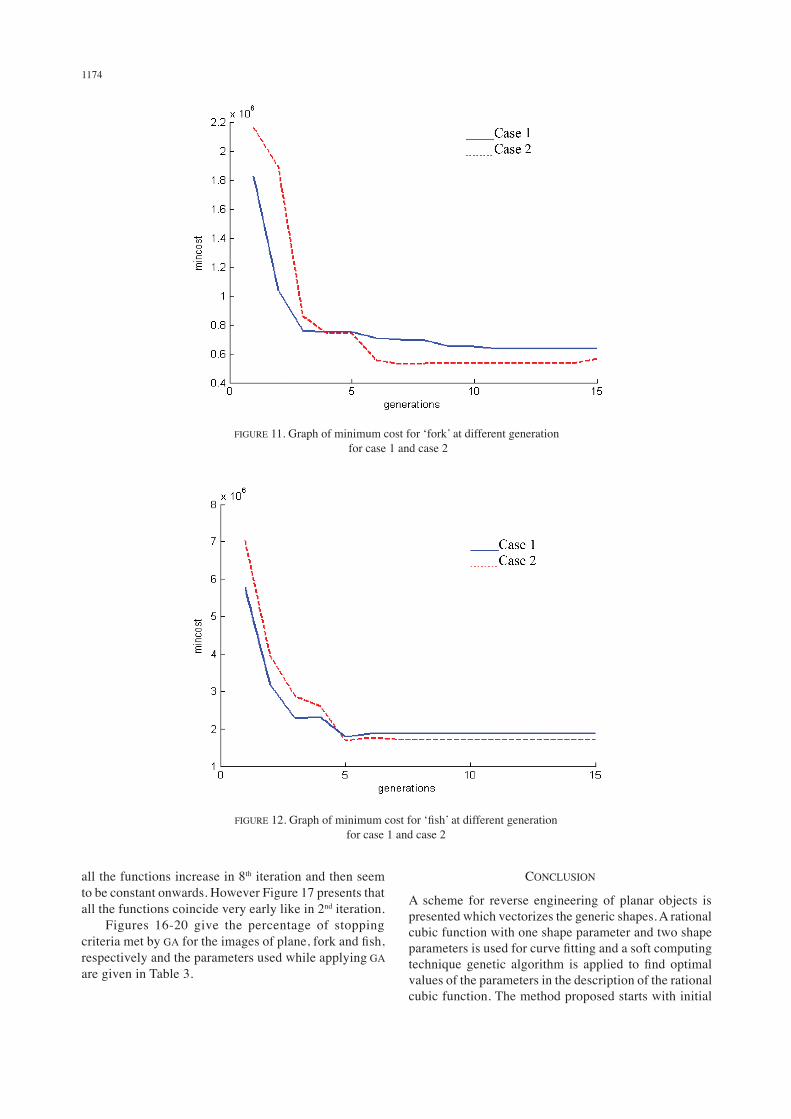
th iteration using Genetic Algorithms together with corner points breakpoints and boundary for case 1 and case 2 of rational cubic function 3.1, respectively. Figures 8 and 9 can also be described in similar fashion. Figures 10, 11 and 12 present comparison of both the cases discussed in Section 3 of rational cubic function
solid line represents minimum cost for case 1 in different iterations of GA, whereas dashed line shows the minimum
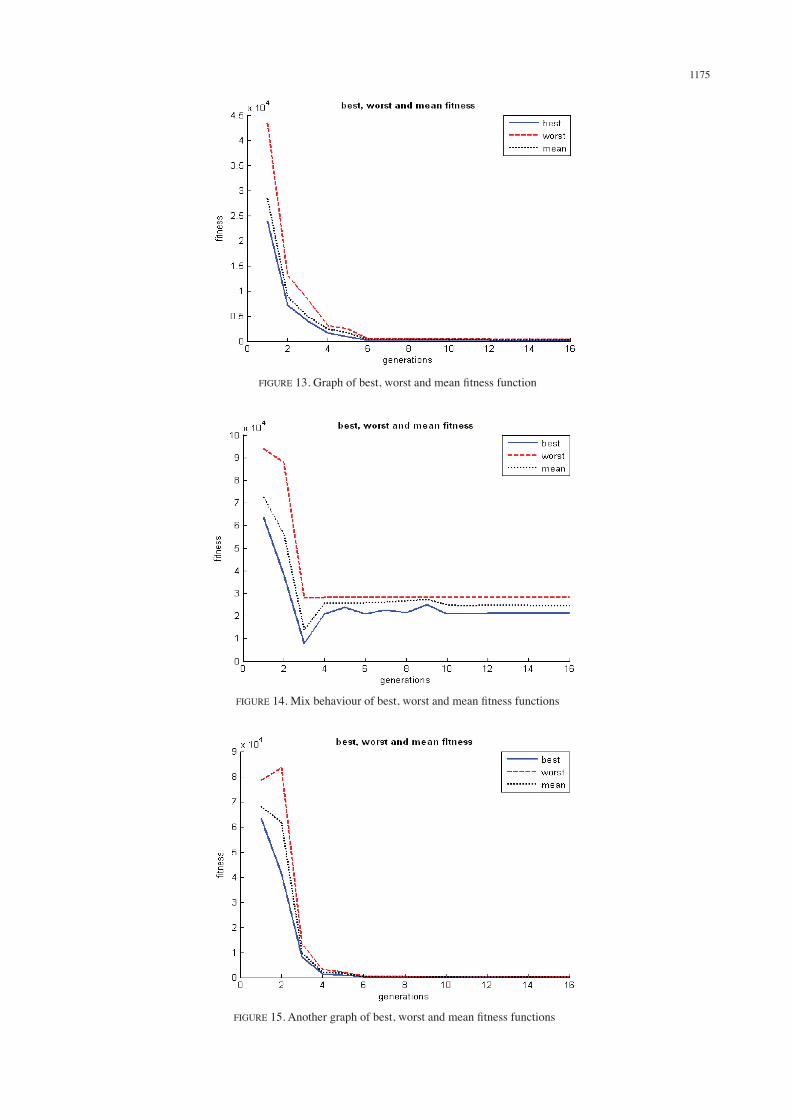
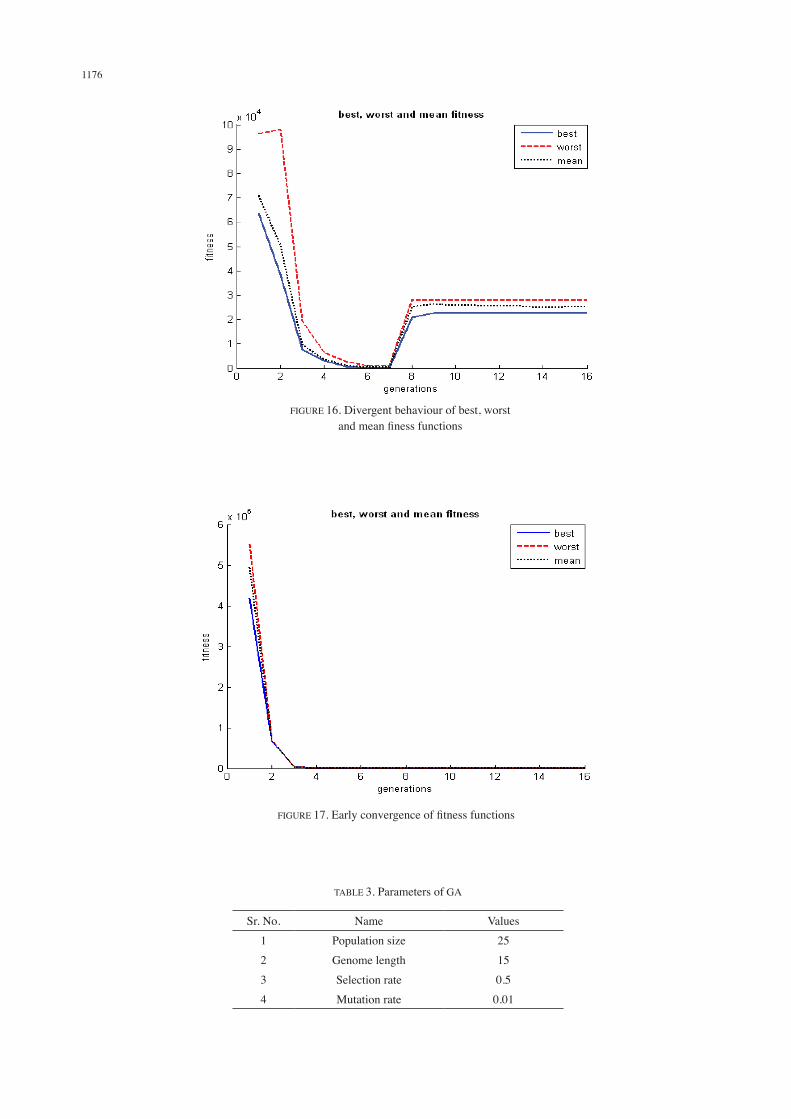
it can be noticed that case 2 gives better results than case 1 as far as minimum cost is concerned. Moreover it can be seen in Table 2 that number of breakpoints in case 2 is less than as in case 1 for different iterations of GA in different images. So it may be concluded that proposed scheme gives slightly better results in case when it is applied using rational cubic with two parameters. Figures 13-17 show behaviors of best, worst and
running GA again and again. It can be observed in Figures 13 and 15 that the best, worst and mean values of cost function coincide after iteration 6, whereas Figure 11 depicts the case where they never become equal. While Figure 16 shows that the functions start decreasing initially and become equal at 7th iteration but after that
1173
FIGURE 8. Demonstration of rational cubic function (3.1) using GA for case1 and case 2 FIGURE 9. Demonstration of rational cubic function (3.1)
using GA for case1 and case 2
FIGURE generation for case 1 and case 2
1174
FIGURE for case 1 and case 2
FIGUREfor case 1 and case 2
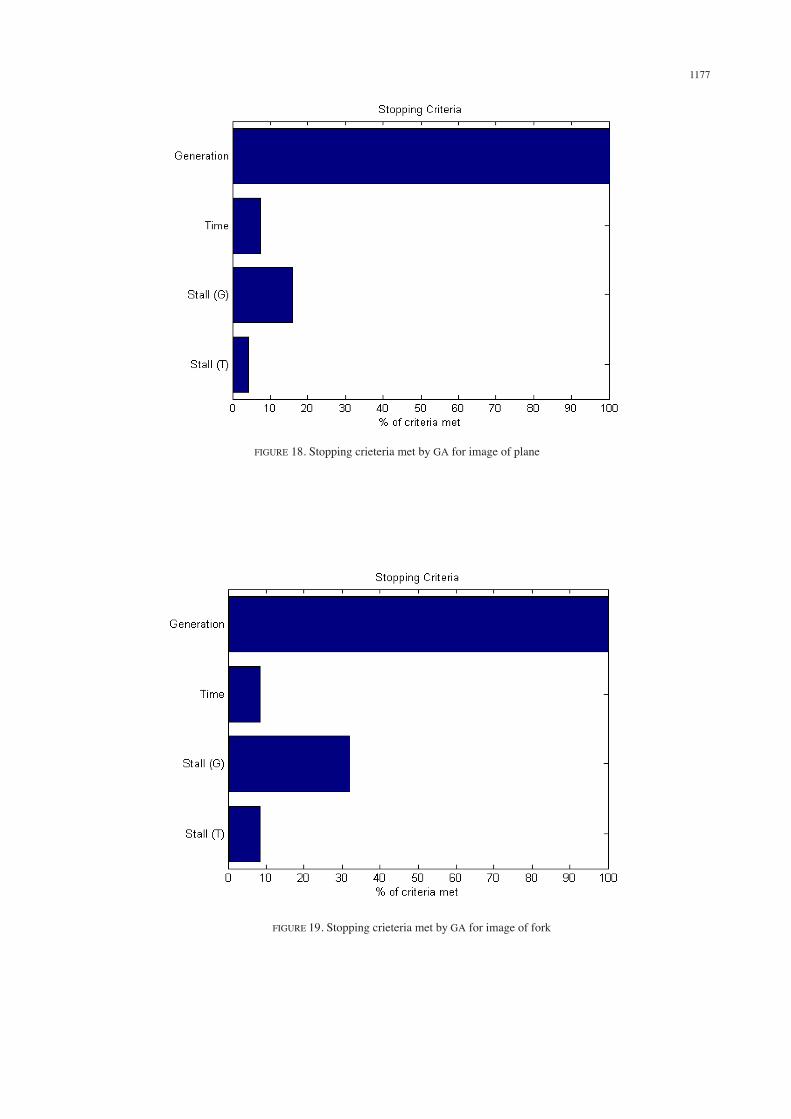
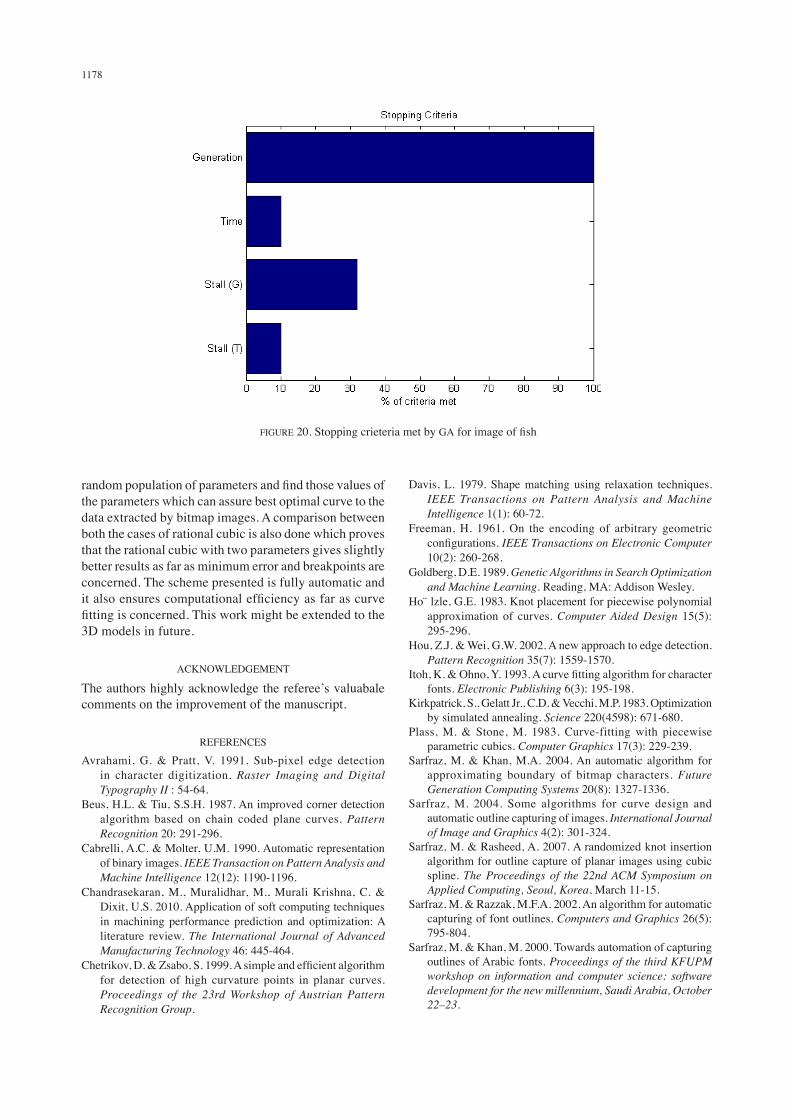
all the functions increase in 8th iteration and then seem to be constant onwards. However Figure 17 presents that all the functions coincide very early like in 2nd iteration. Figures 16-20 give the percentage of stopping criteria met by GArespectively and the parameters used while applying GA are given in Table 3.
CONCLUSION
A scheme for reverse engineering of planar objects is presented which vectorizes the generic shapes. A rational cubic function with one shape parameter and two shape
values of the parameters in the description of the rational cubic function. The method proposed starts with initial
1175
FIGURE
FIGURE
FIGURE
1176
FIGURE 16. Divergent behaviour of best, worst
FIGURE
TABLE 3. Parameters of GA
Sr. No. Name1 Population size 252 Genome length 153 Selection rate 0.54 Mutation rate 0.01
1177
FIGURE 18. Stopping crieteria met by GA for image of plane
FIGURE 19. Stopping crieteria met by GA for image of fork
1178
the parameters which can assure best optimal curve to the data extracted by bitmap images. A comparison between both the cases of rational cubic is also done which proves that the rational cubic with two parameters gives slightly better results as far as minimum error and breakpoints are concerned. The scheme presented is fully automatic and
3D models in future.
ACKNOWLEDGEMENT
comments on the improvement of the manuscript.
REFERENCES
in character digitization. Raster Imaging and Digital
Typography II : 54-64.Beus, H.L. & Tiu, S.S.H. 1987. An improved corner detection
algorithm based on chain coded plane curves. Pattern
Recognition 20: 291-296.Cabrelli, A.C. & Molter, U.M. 1990. Automatic representation
of binary images. IEEE Transaction on Pattern Analysis and
Machine Intelligence 12(12): 1190-1196.Chandrasekaran, M., Muralidhar, M., Murali Krishna, C. &
Dixit, U.S. 2010. Application of soft computing techniques in machining performance prediction and optimization: A literature review. The International Journal of Advanced
Manufacturing Technology 46: 445-464.
for detection of high curvature points in planar curves. Proceedings of the 23rd Workshop of Austrian Pattern
Recognition Group.
Davis, L. 1979. Shape matching using relaxation techniques. IEEE Transactions on Pattern Analysis and Machine
Intelligence 1(1): 60-72.Freeman, H. 1961. On the encoding of arbitrary geometric
IEEE Transactions on Electronic Computer 10(2): 260-268.
Goldberg, D.E. 1989. Genetic Algorithms in Search Optimization
and Machine Learning. Reading, MA: Addison Wesley.Ho¨ lzle, G.E. 1983. Knot placement for piecewise polynomial
approximation of curves. Computer Aided Design 15(5): 295-296.
Hou, Z.J. & Wei, G.W. 2002. A new approach to edge detection. Pattern Recognition 35(7): 1559-1570.
fonts. Electronic Publishing 6(3): 195-198.
by simulated annealing. Science 220(4598): 671-680.Plass, M. & Stone, M. 1983. Curve-fitting with piecewise
parametric cubics. Computer Graphics 17(3): 229-239.Sarfraz, M. & Khan, M.A. 2004. An automatic algorithm for
approximating boundary of bitmap characters. Future
Generation Computing Systems 20(8): 1327-1336.Sarfraz, M. 2004. Some algorithms for curve design and
automatic outline capturing of images. International Journal
of Image and Graphics 4(2): 301-324.Sarfraz, M. & Rasheed, A. 2007. A randomized knot insertion
algorithm for outline capture of planar images using cubic spline. The Proceedings of the 22nd ACM Symposium on
Applied Computing, Seoul, Korea, March 11-15. Sarfraz, M. & Razzak, M.F.A. 2002. An algorithm for automatic
capturing of font outlines. Computers and Graphics 26(5): 795-804.
Sarfraz, M. & Khan, M. 2000. Towards automation of capturing outlines of Arabic fonts. Proceedings of the third KFUPM
workshop on information and computer science: software
development for the new millennium, Saudi Arabia, October
22–23.
FIGURE 20. Stopping crieteria met by GA
1179
Sarfraz, M. & Khan, M.A. 2002. Automatic outline capture of Arabic fonts. Information Sciences 140(3-4): 269-281.
Sarfraz, M., Asim, M.R. & Masood, A. 2004. Capturing outlines using cubic Be´ zier curves. Proceedings of 1st IEEE
International Conference on Information and Communication
Technologies: From Theory to Application, April 19-23. pp. 539-540.
Sarfraz, M. & Raza, S.A. 2001. Capturing outline of fonts using genetic algorithm and splines. The Proceedings of IEEE
International Conference on Information Visualization-IV-
UK, July 25-27.Sarfraz, M., Riyazuddin, M. & Baig, M.H. 2005. Capturing
planar shapes by approximating their outlines. Journal of
Computational and Applied Mathematics 189: 494-512.
Proceedings of
International Conference on Imaging Science, Systems, and
Technology, Las Vegas, Nevada, USA, June 24-27.Sarfraz, M., Masood, A. & Asim, M.R. 2006. A new approach to
corner detection. Computer Vision and Graphics 32: 528-533.
Image Outlines using Rational Spline and Genetic Algorithm, The Proceedings of The International Conference on Image,
Vision and Computing (ICIVC 2012). Shanghai, China, August 25-26, 2012, IASCIT Press Singapore.
digitized curves. Graphics Gems. pp. 612-626.Sohel, F.A., Karmakar, G.C., Dooley, L.S., Arkinstall, J.
2005. Enhanced Be´ zier curve models incorporating local
information. Proceedings of IEEE International Conference
on Acoustics, Speech, and Signal Processing, USA, March
18-23. .Tang, Y.Y., Yang, F. & Liu, J. 2001. Basic processes of chinese
character based on cubic B-spline wavelet transform. IEEE
Transactions on Pattern Analysis and Machine Intelligence 23(12): 1443-1448.
Teh, C.H. & Chin, R.T. 1989. On the detection of dominant points on digital curves. IEEE Transactions on Pattern Analysis and
Machine Intelligence 11(8): 859-873.
Muhammad Sarfraz* Department of Information ScienceKuwait UniversityKuwait
Misbah Irshad & Malik Zawwar HussainDepartment of MathematicsUniversity of the Punjab, LahorePakistan
*Corresponding author; email: [email protected]
Received: 15 June 2012Accepted: 25 January 2013