Embed Size (px)
Citation preview
Robert Mislevy University of Maryland
PADI Technical Report 16 | April 2006
Report Series Published by SRI International
P A D I
PADI | Principled Assessment Designs for Inquiry
Reverse Engineering the NAEP Floating Pencil Task Using the PADI Design System
Kathleen C. Haynie, Kathleen Haynie ConsultingGeneva D. Haertel, SRI InternationalAndrea A. Lash, SRI InternationalEdys S. Quellmalz, SRI InternationalAngela Haydel DeBarger, SRI International

SRI InternationalCenter for Technology in Learning333 Ravenswood AvenueMenlo Park, CA 94025-3493650.859.2000http://padi.sri.com
PADI Technical Report Series EditorsAlexis Mitman Colker, Ph.D., Project ConsultantGeneva D. Haertel, Ph.D., Co-Principal InvestigatorRobert Mislevy, Ph.D., Co-Principal InvestigatorMeredith Ittner and Klaus Krause, Technical Writers/EditorsLynne Peck Theis, Documentation Designer
Copyright © 2006 SRI International and University of Michigan. All Rights Reserved.
Acknowledgment
This material is based on work supported by the National Science Foundation under grant REC-0129331 (PADI Implementation Grant). Disclaimer Any opinions, findings, and conclusions or recommendations expressed in this material are those of the authors and do not necessarily reflect the views of the National Science Foundation.
P R I N C I P L E D A S S E S S M E N T D E S I G N S F O R I N Q U I R Y
T E C H N I C A L R E P O R T 1 6
Reverse Engineering the NAEP Floating Pencil Task Using the PADI Design System
Prepared by:
Kathleen C. Haynie, Kathleen Haynie Consulting
Geneva D. Haertel, SRI International
Andrea A. Lash, SRI International
Edys S. Quellmalz, SRI International
Angela Haydel DeBarger, SRI International
ii
C O N T E N T S
Abstract iv
1.0 Introduction 1 2.0 The PADI Project 2
2.1 Evidence-Centered Design 2 2.2 The PADI Design System 3
3.0 Selection of a Performance Assessment Task 6 3.1 What Is Reverse Engineering? 6 3.2 Task Selection 6 3.3 Description of the Floating Pencil Task 9
4.0 Analysis and Reverse Engineering of Floating Pencil 10 4.1 The Task Model 11
4.1.1 Materials 11 4.1.2 Presentation 12 4.1.3 Work Products 12 4.1.4 Item and Activity Structure 15 4.1.5 Task Model Variables 16
4.2 The Student Model 20 4.2.1 Exploration of Potential Student Models 20 4.2.2 Choice of Student Model 23
4.3 The Evidence Model 25 4.3.1 The Evaluative Submodel 25 4.3.2 Statistical Submodel 26
5.0 Summary and Discussion 30 5.1 Proposed Assessment Argument for Floating Pencil 30 5.2 Considerations for Proposed Assessment Argument 31
References 35 Appendix A—Test Booklet for NAEP Floating Pencil 38 Appendix B—Floating Pencil Task Specification Summary Page 48
iii
F I G U R E S
Figure 1. Assessment Objects in the PADI Design System 4 Figure 2. Activity 1 for Floating Pencil 16 Figure 3. Student Model for Floating Pencil Task Specification 24 Figure 4. Student Model Variable for Floating Pencil Task Specification 24 Figure 5. Evaluation Phase for Floating Pencil Activity 1 26 Figure 6. Observable Variable for Floating Pencil Activity 1 27 Figure 7. Measurement Model for Floating Pencil Activity 1 28 Figure 8. Assessment Argument for Floating Pencil 31
T A B L E S
Table 1. Distribution of NSES Inquiry Skills within the Floating Pencil Task 8 Table 2. Work Products for Floating Pencil 13 Table 3. Scoring Rubric Information for Floating Pencil Items and Item Groups 14 Table 4. Comparison of Content and Inquiry Skills for Fourth- and Eighth-Grade Floating Pencil Tasks 18 Table 5. NAEP Content and Process Codes for Floating Pencil Activities 21
iv
A B S T R A C T
Large-scale science assessments have been criticized for not tapping rich, authentic scientific problems. The use
of evidence-centered design (ECD) principles in large-scale assessment design can potentially improve the
quality of performance assessment tasks for scientific inquiry. The Principled Assessment Designs for Inquiry
(PADI) design system has been used by the PADI team to analyze several well-known science assessments. This
report will discuss the reverse engineering of the National Assessment of Educational Progress (NAEP) Floating
Pencil task. The PADI design system was used as an analytical tool for understanding the characteristics and
underlying assessment argument of this chosen task. Carrying out this work, we grappled with task complexity
and came to understand how science performance assessment tasks might be constructed in the future.
In reverse engineering the Floating Pencil task into an assessment blueprint, our team created a task specification
on the PADI design system. In designing the Floating Pencil task specification, we specified the Task Model,
Student Model, and Evidence Model. In defining the Task Model, we considered what family of tasks Floating
Pencil might be a member of—helping to define the fixed characteristics and Task Model Variables for Floating
Pencil. Our team considered a variety of potential Student Models and chose one based on the NAEP content-
by-process framework (Allen, Carlson, & Zelenak, 1999). The chosen Evidence Model included an evaluative
submodel that mirrored NAEP’s rubric for Floating Pencil (publicly released, see
<http://listserv.aea1.k12.ia.us/science/96sci8.pdf>). We defined unidimensional Rasch Measurement Models for
each Activity within Floating Pencil.
The use of the PADI design system to reverse engineer the Floating Pencil task resulted in the creation of new
assessment knowledge, general and specific to Floating Pencil, for our team and the PADI project. We
considered the coherence and linkages among the Task Model, Student Model, and Evidence Model and
grappled with the underlying assessment argument for Floating Pencil. Reverse engineering the Floating Pencil
task not only contributed to our knowledge of the characteristics of one particular large-scale performance
assessment task, but shed light on how new science performance assessments might be forward engineered.
Introduction 1
1.0 Introduction
Performance assessment tasks for scientific inquiry have been utilized in large-scale reference
examinations, such as the National Assessment of Educational Progress (NAEP) and the Trends
in International Mathematics and Science Study (TIMSS). Since large-scale assessment results
can be used to provide policymakers and the public with information about how U.S. students
perform in different content areas, the intelligent design of these performance assessment
tasks is of paramount importance to the validity of large-scale examinations. The validity of
science performance assessments has received mixed reviews (Bass, Magone, & Glaser, 2002;
Shavelson & Ruiz-Primo, 1998; Shepard et al., 1995). Large-scale science assessments have been
criticized for not tapping rich, authentic scientific problems.
The use of evidence-centered design (ECD) principles in large-scale assessment design can
potentially improve the quality of performance assessment tasks for scientific inquiry. The
Principled Assessment Designs for Inquiry (PADI) design system has been used by the PADI
team to analyze several well-known science assessments. This work has led to understandings
of the complexity of such tasks and of how such tasks might be constructed in the future.
This report will discuss the process by which the PADI design system was used as an analytical
tool for understanding the characteristics of a chosen NAEP performance assessment task. It
was expected that by systematically reverse engineering an inquiry task and its key elements,
we would grapple with task complexity in such a way that new understandings of the design
process for such tasks could emerge. This report will describe how a performance assessment
task was selected and analyzed, via reverse engineering, through the lens of ECD principles. In
addition, this report will discuss the construction of an underlying assessment argument for the
performance assessment task.
2 The PADI Project
2.0 The PADI Project
Principled Assessment Designs for Inquiry was funded in 2002 by the Interagency Education
Research Initiative (IERI). PADI draws on new understandings in cognitive psychology, research
on science inquiry, and recent advances in measurement theory and technology to create a
conceptual framework and supporting web-based software that educators are able to use to
design inquiry assessments. Designing systems for assessing inquiry in science requires
expertise across domains: science content and learning, assessment design, task authoring,
psychometrics, delivery technologies, and systems engineering. The goal of the PADI project is
to provide a conceptual framework for designing inquiry tasks that coordinates such expertise
and provides supporting tools to facilitate use. PADI seeks to provide a practical, theory-based
approach to developing high-quality assessments of science inquiry (Mislevy, Chudowsky, et
al., 2003) by developing multiple components: (1) a system for designing reusable assessment
task templates, organized around schemas of inquiry from research in cognitive psychology
and science education; (2) generally stated rubrics for recognizing and evaluating evidence of
inquiry skills; (3) an organized set of assessment development resources; (4) an initial collection
of design patterns and exemplar templates and task specifications that are either forward or
backward engineered; and (5) scoring engine and reporting tools that support more complex
assessments and their statistical models.
2.1 Evidence-Centered Design
PADI is a special-case implementation of the evidence-centered design (ECD) framework
developed by Mislevy, Steinberg, and Almond (2002). The ECD framework is based on a
construct-centered approach to assessment (e.g., Messick, 1994) and describes the three
components of assessment design: a Student Model,1 an Evidence Model, and a Task Model
(Mislevy, Steinberg, Almond, Haertel, & Penuel, 2003). These components, taken together,
comprise the assessment argument for a given task or assessment. The assessment argument
lays out the links between the constructs one wishes to measure (Student Model), what serves
as evidence of those constructs (Evidence Model), and what prompts students to respond in
ways that can serve as evidence (Task Model). The stronger the links are between evidence and
claims of student competencies, the stronger the likelihood of a valid measure for assessing the
specified constructs.
For a given assessment, the Student Model addresses the question of what complex or set of
knowledge, skills, or other attributes should be assessed. Student Model Variables (SMVs) are
the underlying constructs an assessment is designed to assess. These constructs may be based
on any theory of learning or psychological perspective (e.g., behaviorism, cognitive
psychology, constructivism, situated cognition).
The Evidence Model addresses the question of what student behaviors or performances are
expected to reveal those constructs. The Evidence Model lays out the argument for why and
how the observations from a given task constitute evidence of scores or values on SMVs. The
Evidence Model includes the evaluative submodel and the statistical submodel. The evaluative
submodel provides the rules for evaluating evidence (e.g., a circled letter A on a multiple-
choice item is evaluated as correct), which result in Observable Variables (e.g., a score of 1 is 1 Components of the ECD framework and assessment objects of the PADI design system will be capitalized throughout this report.
The PADI Project 3
given to a student’s Work Product evaluated as correct). The statistical submodel describes a
mathematical function that relates the Observable Variable to the SMV(s) (e.g., a logistic
function models the positive relationship between student ability on an underlying SMV and
the probability of answering an item correctly). Poor “fit” of a model to the empirical data—
when data do not constitute strong evidence for the SMVs—may lead to a change or “update”
of the Student Model.
The Task Model addresses the question of what tasks or situations should elicit the desired
behaviors or performances identified in the Evidence Model. A Task Model describes
circumstances meant to elicit information about what an examinee knows or can do. A Task
Model provides a framework for describing the situation in which examinees act; such
environmental specifications can include instructions, tools, lab materials, and characteristics of
stimulus material that are considered Materials and Presentation. The Task Model also includes
specifications for the form of an examinee’s response (e.g., a written essay, data represented on
a graph), called a Work Product.
2.2 The PADI Design System
A primary deliverable of the PADI project is the specification of a modeling framework for the
assessment of scientific inquiry. The PADI project created a web-based tool, the PADI design
system, for manipulating examples that use this framework. The design system employs the
Example-based Modeling (EMo) system (Schank & Hamel, 2004). A secondary deliverable for
PADI is a library of examples of assessment blueprints. The design system serves as a repository
or library of examples and as an editing tool to create and adapt the library. Some of the more
complete examples in the library may serve as blueprints from which science assessments can
be developed.
The design system employs a divide-and-conquer strategy, separating various parts of an
assessment into chunks, or assessment objects, such as design patterns, templates, Work
Products, Student Models, and so on (Riconscente, Mislevy, Hamel, & PADI Research Group,
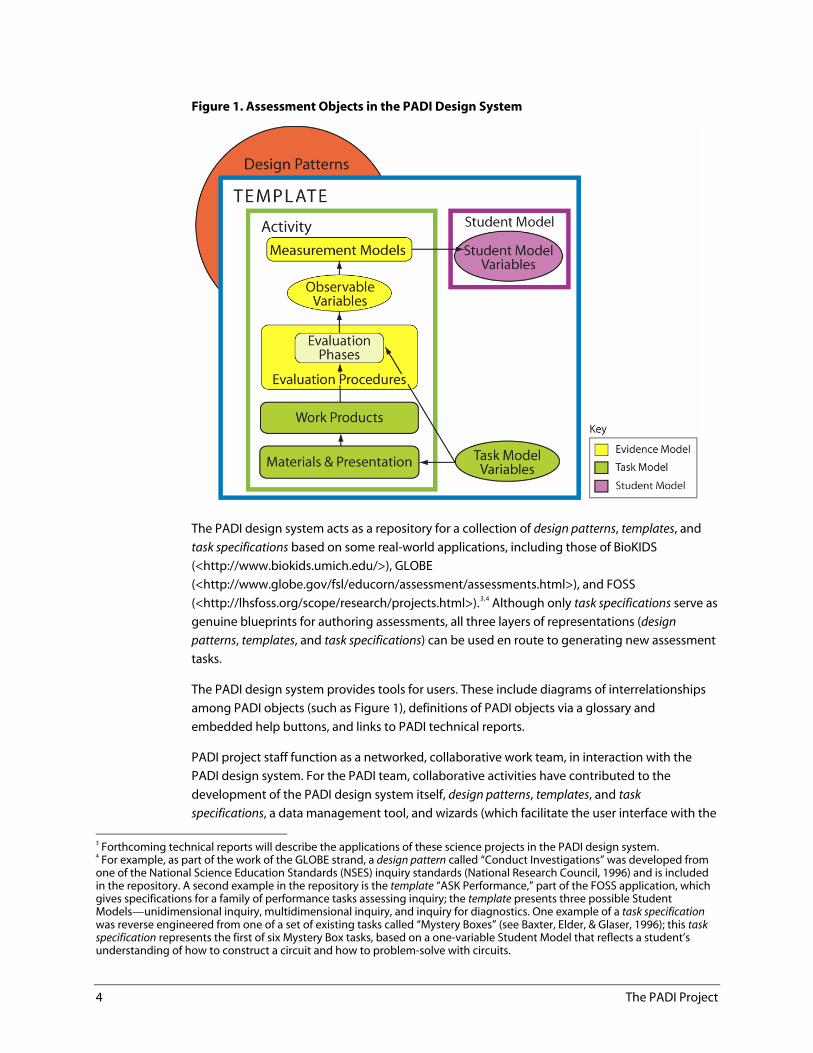
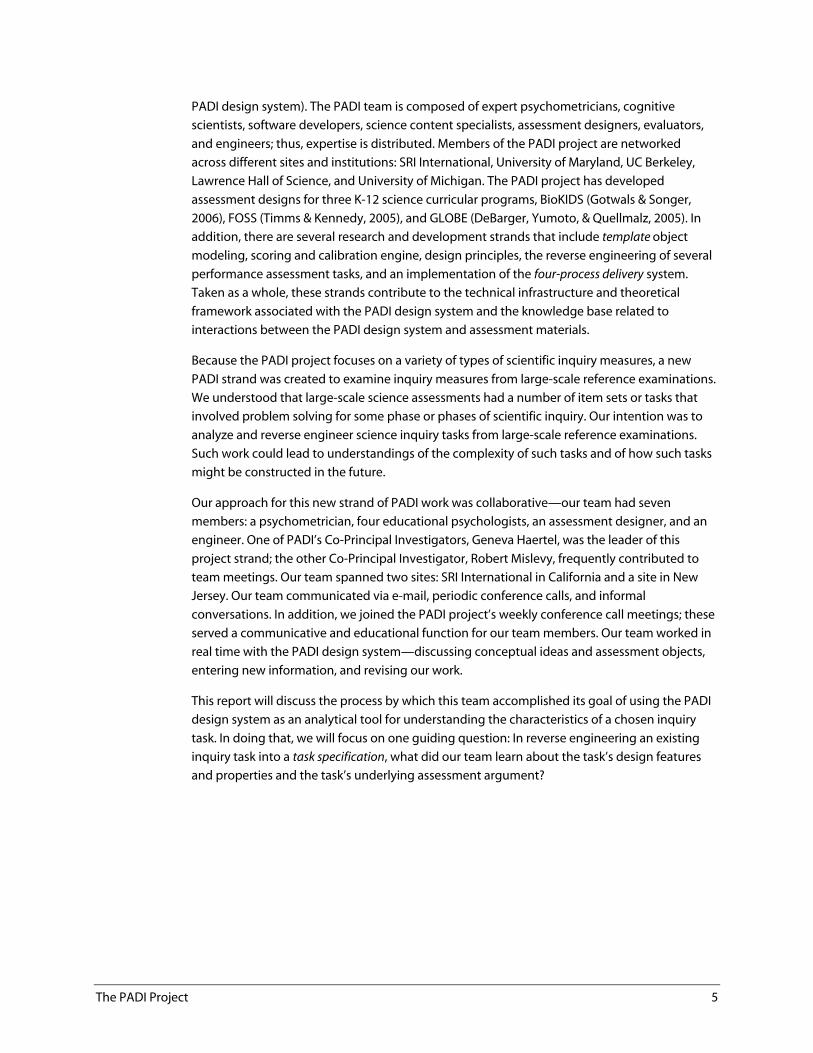
2005). Figure 1 provides an overview of the relationships among these chunks or assessment
objects. Design patterns (the orange object in Figure 1) are abstractions of common assessment
practices, providing a theoretical underpinning for design practices. Design patterns can be
helpful in introducing users to the PADI design system; an empty design pattern invites users to
specify an assessment argument, explicating the relationship between Student, Evidence, and
Task Models in a narrative form. In contrast, a template (the large object outlined in blue in
Figure 1) is a second-layer abstraction that contains more specific information about the
interrelations of Student, Evidence, and Task Models. Templates include the “nuts and bolts”
details of the Activities, Measurement Models, Evaluation Phases, Work Products, Materials and
Presentation, and Task Model Variables. Templates can be relatively abstract, such as when they
represent a large family of tasks, and they can exist in hierarchies of specificity. When a
template is very specific and complete, it is called a task specification, the blueprint that an
authoring system can use to create actual assessment tasks.2 Task specifications may contain
only one specific Student Model and must have fixed settings for all Task Model Variables and
for Materials and Presentation choices.
2 The PADI project does not promise to provide the authoring and delivery procedures that result from using a task specification blueprint. Rather, the authoring and delivery systems are external to the PADI design system.
4 The PADI Project
Figure 1. Assessment Objects in the PADI Design System
The PADI design system acts as a repository for a collection of design patterns, templates, and
task specifications based on some real-world applications, including those of BioKIDS
(<http://www.biokids.umich.edu/>), GLOBE
(<http://www.globe.gov/fsl/educorn/assessment/assessments.html>), and FOSS
(<http://lhsfoss.org/scope/research/projects.html>).3, 4 Although only task specifications serve as
genuine blueprints for authoring assessments, all three layers of representations (design
patterns, templates, and task specifications) can be used en route to generating new assessment
tasks.
The PADI design system provides tools for users. These include diagrams of interrelationships
among PADI objects (such as Figure 1), definitions of PADI objects via a glossary and
embedded help buttons, and links to PADI technical reports.
PADI project staff function as a networked, collaborative work team, in interaction with the
PADI design system. For the PADI team, collaborative activities have contributed to the
development of the PADI design system itself, design patterns, templates, and task
specifications, a data management tool, and wizards (which facilitate the user interface with the
3 Forthcoming technical reports will describe the applications of these science projects in the PADI design system. 4 For example, as part of the work of the GLOBE strand, a design pattern called “Conduct Investigations” was developed from one of the National Science Education Standards (NSES) inquiry standards (National Research Council, 1996) and is included in the repository. A second example in the repository is the template “ASK Performance,” part of the FOSS application, which gives specifications for a family of performance tasks assessing inquiry; the template presents three possible Student Models—unidimensional inquiry, multidimensional inquiry, and inquiry for diagnostics. One example of a task specification was reverse engineered from one of a set of existing tasks called “Mystery Boxes” (see Baxter, Elder, & Glaser, 1996); this task specification represents the first of six Mystery Box tasks, based on a one-variable Student Model that reflects a student’s understanding of how to construct a circuit and how to problem-solve with circuits.
The PADI Project 5
PADI design system). The PADI team is composed of expert psychometricians, cognitive
scientists, software developers, science content specialists, assessment designers, evaluators,
and engineers; thus, expertise is distributed. Members of the PADI project are networked
across different sites and institutions: SRI International, University of Maryland, UC Berkeley,
Lawrence Hall of Science, and University of Michigan. The PADI project has developed
assessment designs for three K-12 science curricular programs, BioKIDS (Gotwals & Songer,
2006), FOSS (Timms & Kennedy, 2005), and GLOBE (DeBarger, Yumoto, & Quellmalz, 2005). In
addition, there are several research and development strands that include template object
modeling, scoring and calibration engine, design principles, the reverse engineering of several
performance assessment tasks, and an implementation of the four-process delivery system.
Taken as a whole, these strands contribute to the technical infrastructure and theoretical
framework associated with the PADI design system and the knowledge base related to
interactions between the PADI design system and assessment materials.
Because the PADI project focuses on a variety of types of scientific inquiry measures, a new
PADI strand was created to examine inquiry measures from large-scale reference examinations.
We understood that large-scale science assessments had a number of item sets or tasks that
involved problem solving for some phase or phases of scientific inquiry. Our intention was to
analyze and reverse engineer science inquiry tasks from large-scale reference examinations.
Such work could lead to understandings of the complexity of such tasks and of how such tasks
might be constructed in the future.
Our approach for this new strand of PADI work was collaborative—our team had seven
members: a psychometrician, four educational psychologists, an assessment designer, and an
engineer. One of PADI’s Co-Principal Investigators, Geneva Haertel, was the leader of this
project strand; the other Co-Principal Investigator, Robert Mislevy, frequently contributed to
team meetings. Our team spanned two sites: SRI International in California and a site in New
Jersey. Our team communicated via e-mail, periodic conference calls, and informal
conversations. In addition, we joined the PADI project’s weekly conference call meetings; these
served a communicative and educational function for our team members. Our team worked in
real time with the PADI design system—discussing conceptual ideas and assessment objects,
entering new information, and revising our work.
This report will discuss the process by which this team accomplished its goal of using the PADI
design system as an analytical tool for understanding the characteristics of a chosen inquiry
task. In doing that, we will focus on one guiding question: In reverse engineering an existing
inquiry task into a task specification, what did our team learn about the task’s design features
and properties and the task’s underlying assessment argument?
6 Selection of a Performance Assessment Task
3.0 Selection of a Performance Assessment Task
The initial goal of our team was to select an inquiry task to analyze and reverse engineer, using
the PADI design system. Over the course of a year, the work of this PADI strand moved through
two stages: (1) the selection of a particular inquiry task to reverse engineer and (2) the analysis
and reverse engineering of the selected task, which resulted in the development of a task
specification. This section describes how we selected a performance assessment task to reverse
engineer. Following that, we will discuss what was learned in analyzing the task and carrying
out the reverse engineering process that resulted in a task specification. These latter stages will
be described through the lens of the ECD framework (i.e., how we developed the Student,
Evidence, and Task Models).
3.1 What Is Reverse Engineering?
Reverse engineering is the process of creating a design or blueprint by analyzing a final
product or system—often via identification of system components and their
interrelationships—and creating representations of that product or system in an enhanced
form or at a higher level of abstraction (e.g., see IEEE, 2003). In reverse engineering an existing
task using the PADI design system, the task is parsed according to the attributes of the
assessment objects that compose the Student, Evidence, and Task Models. Such parsing
requires in-depth analysis of the task and typically results in a “trace” of the analysis work—a
PADI representation in the form of a design pattern, template, or task specification. For example,
using the template form requires defining an Activity (typically based on an item or group of
items) that is composed of a specific Measurement Model, Evaluation Procedures, Work
Product(s), Materials and Presentation, Presentation Logic, and Activity-level Task Model
Variables (see Figure 1). The Measurement Model includes a definition of model type (e.g.,
dichotomous, partial credit), an Observable Variable, SMV(s), a Scoring Matrix, and a Design
Matrix. The Evaluation Procedures include at least one Evaluation Phase in which Task Model
Variables, Input Observable Variable(s) such as Work Products, Output Observable Variable(s),
and Evaluation Action Data (e.g., the mapping of student Work Products onto Observable
Variables) are specified.
3.2 Task Selection
For this PADI strand, the intention of the analysis work was to use the design system to
understand the key characteristics of a selected inquiry task from a large-scale reference
examination. Large-scale science assessments have been criticized for not tapping rich,
authentic scientific problems. We expected that by systematically reverse engineering an
authentic, multistep inquiry task and identifying its key elements (including the underlying
assessment argument), we would grapple with task complexity in such a way that new
understandings of the design process for such tasks could emerge.
Our pool of available items was drawn from large-scale reference examinations. A group of 46
such items from the NAEP, TIMSS, and New Standards science assessments were made
available in June 2005 through the SRI study of middle school science, Validities of Standards-
Based Science Inquiry Assessments: Implementation Study (see Quellmalz et al., 2004; Quellmalz &
Haydel, 2003; and Quellmalz & Kreikemeier, 2002). These items were rated by a panel of science
Selection of a Performance Assessment Task 7
education experts and received ratings for dimensions of inquiry from the National Science
Education Standards.
We arrived at a basis for selecting a set of items or a task to reverse engineer. Our criteria for
selecting a task or set of items included that it
be part of the pool of released NAEP, TIMSS, and New Standards science items,
contain items interconnected in some way as themes, blocks, or performance
assessments, or based on some set of common qualities,
involve multiple steps, and
be considered a complex inquiry task, rather than a simple and easy task.
Items were required to be released (nonsecure) so that our analysis and reverse engineering
work could be documented appropriately and shared with a wide audience. We expected that
this task or set of items would be connected according to some theme, idea, or common
stimulus, thus prompting examinee engagement with some aspect of inquiry. To best measure
a phase or phases of the inquiry process, we expected that this task or set of items would be
complex and require multiple steps. Of the available set of large-scale assessment items, we
wanted to identify the richest possible measure of inquiry.
The available items were analyzed, in terms of their natural groupings or themes (e.g., links to a
common stimulus or common topic), as measures of scientific inquiry. We looked at the
distribution of tasks and item groupings across the NSES inquiry standards5 (National Research
Council, 1996) to see which were more typical measures (e.g., of students’ abilities to conduct
an investigation) and which were less typical measures (e.g., of students’ abilities to identify
questions that can be investigated). For example, many of the available item groupings and
tasks included items coded for NSES inquiry standard B, “Design and conduct a scientific
investigation”; however, none of the available groups included items coded for NSES inquiry
standard G, “Communicate scientific procedures and explanations.” We also considered the
distribution of inquiry skills within tasks or item groupings, to see which groupings covered
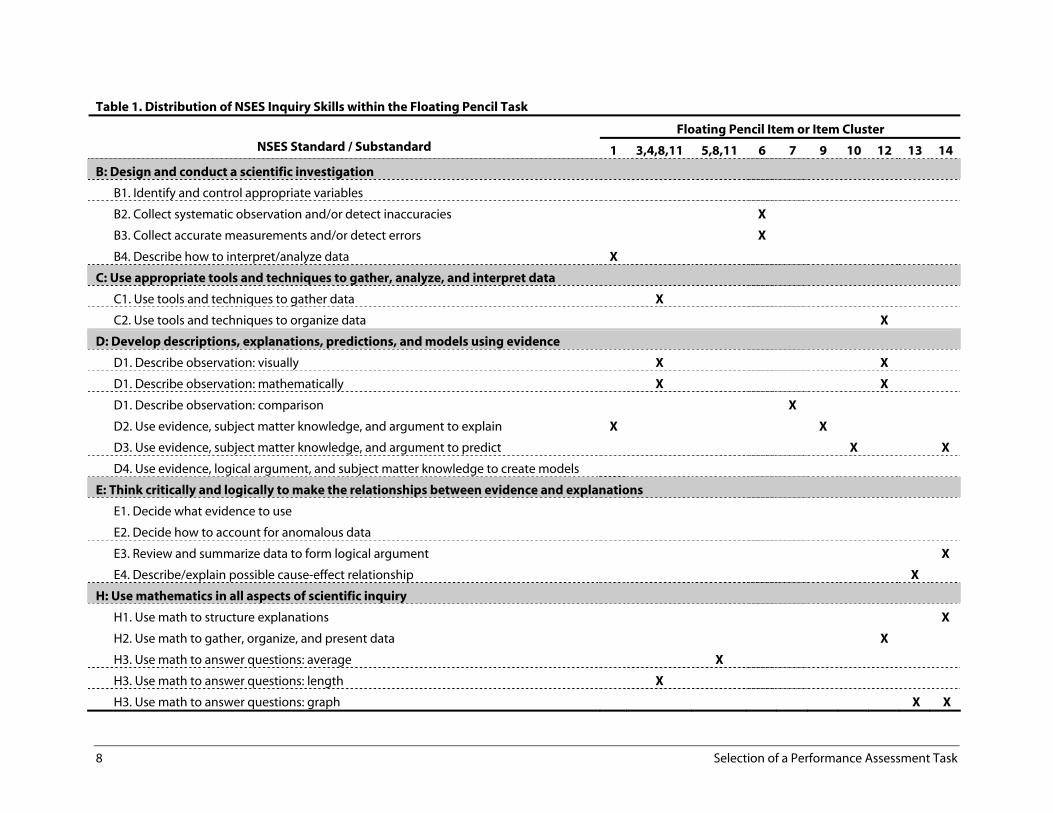
multiple skills and which measured only one skill. For example, Table 1 indicates that the
Floating Pencil task, consisting of 14 items, covered 5 of the 8 NSES inquiry standards (see
Quellmalz & Kreikemeier, 2002).
We selected a set of items—the NAEP Floating Pencil performance assessment for eighth
grade—for analysis and reverse engineering (see Appendix A for a copy of the 14-item test
booklet6). Table 1 indicates that this task is associated with a range of NSES inquiry standards
related to conducting a scientific investigation. All of the items within the task are linked to a
common stimulus. In comparison with other available item groupings, this multistep
performance assessment involves more phases of the inquiry cycle. 5 The NSES inquiry standards refer to eight components of the grades 5–8 Content Standard A, “Abilities Necessary to Do Scientific Inquiry” (National Research Council, 1996, Chapter 6, pp. 145 & 148). For our convenience, we have labeled these eight components of scientific inquiry ability as inquiry standards A through H. Within each inquiry standard, we have denoted and labeled a number of substandards. 6 Note that there are 12-item and 14-item versions of the eighth-grade Floating Pencil task. The 14-item version was made available to SRI International as part of the Validities of Standards-Based Science Inquiry Assessments: Implementation Study (Quellmalz et al., 2004; Quellmalz & Haydel, 2003; Quellmalz & Kreikemeier, 2002). O’Sullivan, Reese, and Mazzeo (1997) provide a summary and description of this task. The 12-item version of the task (items 1-12 of the 14-item version provided in Appendix A) is publicly released and available, for example, at <http://nces.ed.gov/nationsreportcard/itmrls/sampleq/96sci8.pdf>.
8 Selection of a Performance Assessment Task
Table 1. Distribution of NSES Inquiry Skills within the Floating Pencil Task
Floating Pencil Item or Item Cluster NSES Standard / Substandard 1 3,4,8,11 5,8,11 6 7 9 10 12 13 14
B: Design and conduct a scientific investigation
B1. Identify and control appropriate variables
B2. Collect systematic observation and/or detect inaccuracies X
B3. Collect accurate measurements and/or detect errors X
B4. Describe how to interpret/analyze data X
C: Use appropriate tools and techniques to gather, analyze, and interpret data
C1. Use tools and techniques to gather data X
C2. Use tools and techniques to organize data X
D: Develop descriptions, explanations, predictions, and models using evidence
D1. Describe observation: visually X X
D1. Describe observation: mathematically X X
D1. Describe observation: comparison X
D2. Use evidence, subject matter knowledge, and argument to explain X X
D3. Use evidence, subject matter knowledge, and argument to predict X X
D4. Use evidence, logical argument, and subject matter knowledge to create models
E: Think critically and logically to make the relationships between evidence and explanations
E1. Decide what evidence to use
E2. Decide how to account for anomalous data
E3. Review and summarize data to form logical argument X
E4. Describe/explain possible cause-effect relationship X
H: Use mathematics in all aspects of scientific inquiry
H1. Use math to structure explanations X
H2. Use math to gather, organize, and present data X
H3. Use math to answer questions: average X
H3. Use math to answer questions: length X
H3. Use math to answer questions: graph X X
Selection of a Performance Assessment Task 9
3.3 Description of the Floating Pencil Task
For the Floating Pencil performance assessment task, each student is given a test booklet (see
Appendix A), his or her own kit of standardized and safe laboratory materials, and time limits to
complete the task. Standardized laboratory materials include three solutions with varying salt
concentrations, a graduated cylinder, a pencil, and a ruler. The task prompts students to
individually conduct a hands-on investigation in which the experimental procedure has been
specified. Students are asked to carry out a procedure that includes taking two measurements
of the length of a pencil floating above the surface of different liquids (water, a 25% salt
solution, and an unknown solution) contained within a graduated cylinder, averaging the two
measurements, graphing the results, and estimating the salt concentration of the unknown
solution. Students are asked to explain why the pencil floats in water, why it is better to take
two measurements, why the pencil floats at a different level in the salt solution, and how they
determined the salt concentration of the unknown solution. Students also are asked to predict
what would happen if they added more salt to the salt solution.
10 Analysis and Reverse Engineering of Floating Pencil
4.0 Analysis and Reverse Engineering of Floating Pencil
For the Floating Pencil team, our reverse engineering activity is the instantiation of the Floating
Pencil task into the ECD framework using the tools and representational forms of the PADI
design system. The major components of an assessment within the PADI design system are
identified in Figure 1. Some of these components, such as Materials and Presentation or Work
Products, are readily apparent and therefore might represent surface-level characteristics of
the Floating Pencil task. For example, the Floating Pencil test booklet lists the laboratory
materials (Appendix A, page 39); also, we can easily determine the forms of students’ responses
or Work Products (e.g., circled letters for multiple-choice items, numerical responses, written
explanations). Other assessment components are more abstract and require considerable
thought and discussion for their construction. For example, the set of psychological constructs
underlying the Floating Pencil task, called the Student Model, cannot be easily determined
from reading the test booklet. Also, the relationships among Work Products, Observable
Variables, and SMVs are not readily apparent; much discussion must be given to the choice of
the Evaluation Procedures as well as the characteristics of the Measurement Model. Such
assessment objects might represent deep-level characteristics of the Floating Pencil task.
Finally, it should be noted that some assessment objects (e.g., Task Model Variables) might
represent both surface-level characteristics (e.g., the number and types of solutions) and deep-
level characteristics (e.g., cognitive complexity7).
The reverse engineering and analysis of Floating Pencil generally moved from surface-level to
deep-level task characteristics. We initially identified aspects of the Task Model, such as
Materials and Presentation and Work Products, and then analyzed aspects of the Student
Model (e.g., SMVs) and of the Evidence Model (e.g., Evaluation Phases and the Measurement
Model).8 Other PADI strands have conducted their reverse engineering work similarly—
identifying surface characteristics of the task before constructing more abstract assessment
components such as Student Models and Measurement Models.9
Our team carried out some preliminary analyses of the Floating Pencil task using the design
pattern and template forms in the PADI design system. After some initial exploration of
assessment arguments and variable and characteristic features (via the design pattern) and of
Student Models and SMVs (via the template), we decided to model the Floating Pencil task as
specifically as possible by using a task specification. This meant that we intended to eventually
arrive at a specific Student Model, Evaluation Model, Measurement Model, and set of Task
Model Variables (with settings). In what follows, we will explicate our reverse engineering and
analysis work for Floating Pencil that led to the NAEP Floating Pencil task specification. We will
present a logical progression—first discussing the Task Model, followed by the Student Model,
and finally the Evidence Model.
7 Cognitive complexity, for the purpose of this analysis, is defined for a given item by (1) the number of pieces of information needed to reach a solution and (2) the types of processes or data transformations needed to reach a solution. 8 Using Figure 1, objects of the Task Model are colored green, Student Model Variables are colored purple, and components of the Evidence Model are colored yellow. 9 It should be noted that a priori specifications of Student Models can be considered ‘hypotheses’ for testing model fit via empirical analyses; this, as the reader will learn, is the case with Floating Pencil.
Analysis and Reverse Engineering of Floating Pencil 11
4.1 The Task Model
According to the principles of evidence-centered design (Mislevy, Steinberg, & Almond, 2002),
a Task Model provides a framework for describing the situation in which examinees act. Such
environmental specifications can include instructions, tools, lab materials, characteristics of
stimulus material that are considered Materials and Presentation, and other characteristics of
the task itself. Task Model Variables represent some surface-level and deep-level characteristics
of the task and of the items or Activities that comprise the task. In defining the Task Model for
Floating Pencil, our team considered Materials and Presentation, Work Products, the structure
of items and Activities, and Task Model Variables. The relationship among these assessment
objects is shown in Figure 1.
4.1.1 Materials
Identifying the materials for Floating Pencil was a logical place to begin our analysis and
reverse engineering work. Our initial list of materials can be found in the Floating Pencil test
booklet (see Appendix A, page 39)—a graduated cylinder, a short pencil with a thumbtack in
the eraser, a bottle of water, a bottle of salt solution, a bottle of unknown solution, a metric
ruler, and paper towels. Of course, materials also included the Floating Pencil test booklet. Our
team coded information about materials into two areas of the task specification: (1) under
Materials and Presentation Requirements on the summary page (see Appendix B for the
summary page of the task specification), we noted that students were to receive a kit of
laboratory materials and a test booklet, and (2) under template-level Materials and Presentation
on the summary page (Appendix B), we created a new object for each of the laboratory
materials. In creating the new objects, we created a new MIME type, called Laboratory Materials
on the PADI system; one new Materials and Presentation object was created for each of the
laboratory materials, of type Laboratory Materials. We later added more specific information
about the various laboratory materials under Materials and Presentation Settings; for example,
instead of just listing “a bottle of salt solution,” we included the setting “65 ml. of 25% salt
solution in a 100 ml. plastic bottle at room temperature.”
The Floating Pencil team discussed how variations in the laboratory materials could impact the
nature of the task itself. At the most elementary level, a different set of laboratory materials
could change the nature of the task, and variations in a set of laboratory materials could
change the difficulty of the task. For example, the fourth-grade version of Floating Pencil has
materials similar to those of the eighth-grade version, but includes a printed ruler on the test
booklet rather than the physical ruler provided with the eighth-grade version. The fourth-grade
task also includes a red marker that is not included in the eighth-grade task. The printed ruler
eliminates some confusion in taking measurements (e.g., mistakenly holding the ruler upside-
down or backwards); students are instructed to use the red marker to note the water level
before the pencil is added (and are subsequently asked about changes in the water level). In
both cases, the materials used for the fourth-grade version are intended to make the task less
difficult. Even slight variations in laboratory materials could impact task difficulty. For instance,
if one group of students received a ruler with only centimeter markings and another group of
students received a ruler with centimeter and inch markings, the second group of students
might have more difficulty measuring pencil length in centimeters (the markings in inches
would serve as a distractor to proper measurement). Based on these considerations, our team
concluded it was absolutely necessary to standardize task materials and to specify those details
12 Analysis and Reverse Engineering of Floating Pencil
of standardization (e.g., the amount of salt solution, the length and scales of the ruler) in the
task specification.
4.1.2 Presentation
Elements of presentation for Floating Pencil include environmental specifications,
administrative directions, and the task directive or problem-situation description.
Environmental specifications include giving students enough space and light to lay out the
equipment and perform the task, giving students the test booklet and laboratory materials,
and assuring that all materials are standardized according to NAEP’s specifications.
Administrative directions might include communicating the task time limit to the students,
mentioning that students are required to read through and follow the instructions in the test
booklet, and asking students to write their answers directly in the test booklet. In the test
booklet (see Appendix A, page 39), students are given the written direction of checking to see
that they have a complete set of laboratory materials. The task directive or problem-situation
description is given on the next page of the test booklet. This directive includes a warrant for
the Floating Pencil task (that every body of water has some concentration of salt), a description
of the task activities (e.g., observing and measuring how much of the length of a pencil floats
above liquids with different salt concentrations, estimating the salt concentration of an
unknown solution), and further administrative instructions to the students (e.g., writing their
response in the space provided in the test booklet). As with materials, our team coded
information about presentation into two areas of the task specification: (1) under Materials and
Presentation Requirements on the summary page (Appendix B), we summarized information
about the environmental specifications and administrative directions, and (2) under template-
level Materials and Presentation, we used the Problem Situation Description object (which was
created by the GLOBE project) and created and used the Time Limit object.
Variations in the task presentation can impact the difficulty of the task itself. For example, if
students are in an environment with inadequate lighting or space, they might not be able to
give their best performances. Variations in the time limit could impact the speededness of the
task—the extent to which students’ ability to work quickly is a factor on their test performance.
Our team discussed that the provision of some of the task content knowledge in the
directive—that concentrations of salt vary among different bodies of water—makes the task
easier by scaffolding10 that content.
4.1.3 Work Products
Our team identified and considered the Work Products for Floating Pencil. Part of our process
of identifying Work Products included performing the task itself (as examinees) and generating
our own Work Products. Our initial understandings of Floating Pencil Work Products are
examinees’ item responses as recorded in the test booklets. For example, item 1 prompts
examinees to explain why the pencil floats in the water; an examinee’s written explanation is
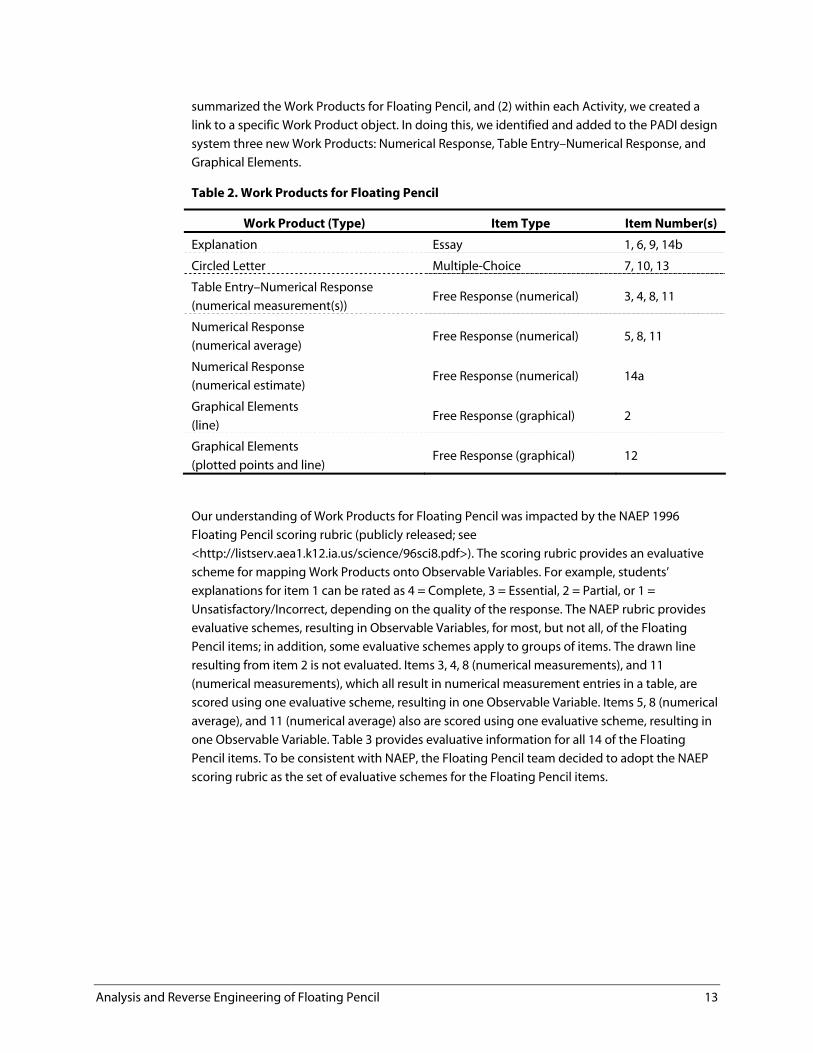
the Work Product. The Work Products for Floating Pencil are presented in Table 2. These
include multiple-choice responses, explanations, numerical responses, and plotted points and
lines drawn on graphs. Our team coded information about Work Products into two areas of the
task specification: (1) under Work Product Summary on the summary page (Appendix B), we
10 Scaffolding is providing examinees with tools, information, or instructions such that a task or Activity previously unreachable by an average examinee becomes reachable.
Analysis and Reverse Engineering of Floating Pencil 13
summarized the Work Products for Floating Pencil, and (2) within each Activity, we created a
link to a specific Work Product object. In doing this, we identified and added to the PADI design
system three new Work Products: Numerical Response, Table Entry–Numerical Response, and
Graphical Elements.
Table 2. Work Products for Floating Pencil
Work Product (Type) Item Type Item Number(s)
Explanation Essay 1, 6, 9, 14b
Circled Letter Multiple-Choice 7, 10, 13
Table Entry–Numerical Response
(numerical measurement(s)) Free Response (numerical) 3, 4, 8, 11
Numerical Response
(numerical average) Free Response (numerical) 5, 8, 11
Numerical Response
(numerical estimate) Free Response (numerical) 14a
Graphical Elements
(line) Free Response (graphical) 2
Graphical Elements
(plotted points and line) Free Response (graphical) 12
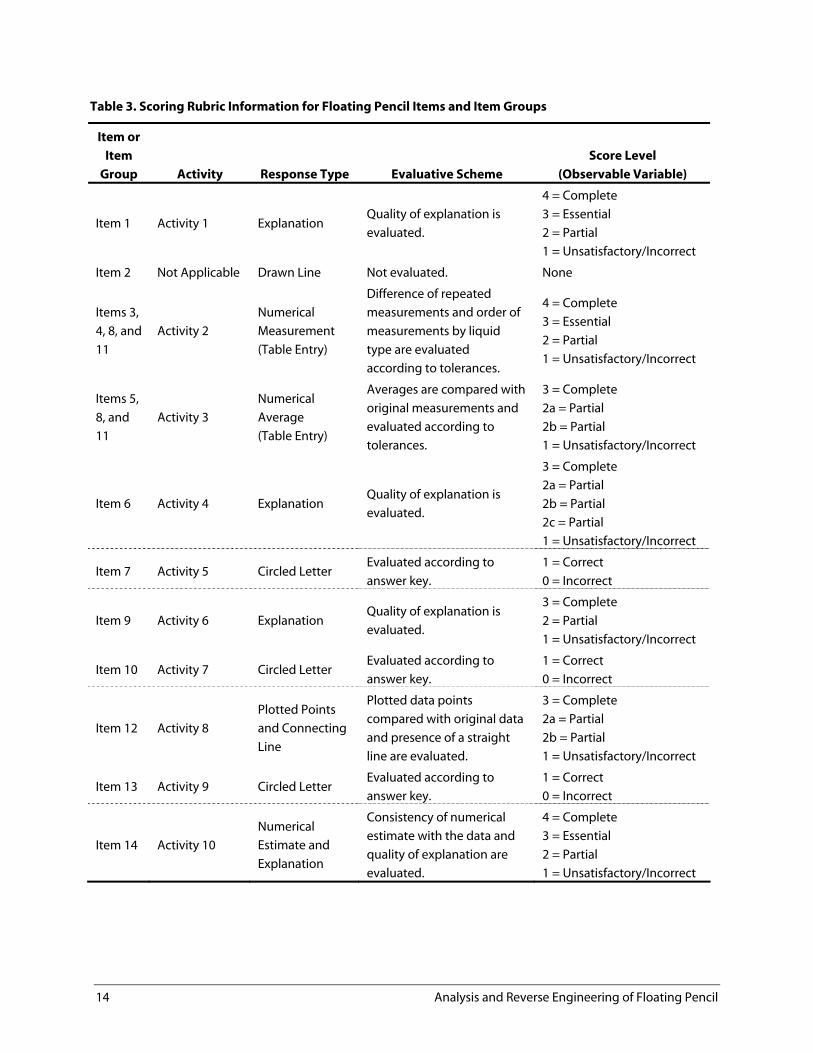
Our understanding of Work Products for Floating Pencil was impacted by the NAEP 1996
Floating Pencil scoring rubric (publicly released; see
<http://listserv.aea1.k12.ia.us/science/96sci8.pdf>). The scoring rubric provides an evaluative
scheme for mapping Work Products onto Observable Variables. For example, students’
explanations for item 1 can be rated as 4 = Complete, 3 = Essential, 2 = Partial, or 1 =
Unsatisfactory/Incorrect, depending on the quality of the response. The NAEP rubric provides
evaluative schemes, resulting in Observable Variables, for most, but not all, of the Floating
Pencil items; in addition, some evaluative schemes apply to groups of items. The drawn line
resulting from item 2 is not evaluated. Items 3, 4, 8 (numerical measurements), and 11
(numerical measurements), which all result in numerical measurement entries in a table, are
scored using one evaluative scheme, resulting in one Observable Variable. Items 5, 8 (numerical
average), and 11 (numerical average) also are scored using one evaluative scheme, resulting in
one Observable Variable. Table 3 provides evaluative information for all 14 of the Floating
Pencil items. To be consistent with NAEP, the Floating Pencil team decided to adopt the NAEP
scoring rubric as the set of evaluative schemes for the Floating Pencil items.
14 Analysis and Reverse Engineering of Floating Pencil
Table 3. Scoring Rubric Information for Floating Pencil Items and Item Groups
Item or
Item
Group Activity Response Type Evaluative Scheme
Score Level
(Observable Variable)
Item 1 Activity 1 Explanation Quality of explanation is
evaluated.
4 = Complete
3 = Essential
2 = Partial
1 = Unsatisfactory/Incorrect
Item 2 Not Applicable Drawn Line Not evaluated. None
Items 3,
4, 8, and
11
Activity 2
Numerical
Measurement
(Table Entry)
Difference of repeated
measurements and order of
measurements by liquid
type are evaluated
according to tolerances.
4 = Complete
3 = Essential
2 = Partial
1 = Unsatisfactory/Incorrect
Items 5,
8, and
11
Activity 3
Numerical
Average
(Table Entry)
Averages are compared with
original measurements and
evaluated according to
tolerances.
3 = Complete
2a = Partial
2b = Partial
1 = Unsatisfactory/Incorrect
Item 6 Activity 4 Explanation Quality of explanation is
evaluated.
3 = Complete
2a = Partial
2b = Partial
2c = Partial
1 = Unsatisfactory/Incorrect
Item 7 Activity 5 Circled Letter Evaluated according to
answer key.
1 = Correct
0 = Incorrect
Item 9 Activity 6 Explanation Quality of explanation is
evaluated.
3 = Complete
2 = Partial
1 = Unsatisfactory/Incorrect
Item 10 Activity 7 Circled Letter Evaluated according to
answer key.
1 = Correct
0 = Incorrect
Item 12 Activity 8
Plotted Points
and Connecting
Line
Plotted data points
compared with original data
and presence of a straight
line are evaluated.
3 = Complete
2a = Partial
2b = Partial
1 = Unsatisfactory/Incorrect
Item 13 Activity 9 Circled Letter Evaluated according to
answer key.
1 = Correct
0 = Incorrect
Item 14 Activity 10
Numerical
Estimate and
Explanation
Consistency of numerical
estimate with the data and
quality of explanation are
evaluated.
4 = Complete
3 = Essential
2 = Partial
1 = Unsatisfactory/Incorrect
Analysis and Reverse Engineering of Floating Pencil 15
4.1.4 Item and Activity Structure
Another aspect of constructing the Task Model involved defining Activities for Floating Pencil.
As the reader may note in Figure 1, Activities constitute the major components of a template or
task specification and are used to structure the generation, collection, and scoring of evidence.
An Activity contains a group of related objects, including Materials and Presentation, Work
Products, Evaluative Phases, Observable Variables, and Measurement Models. Activities can
belong to multiple templates or task specifications, and a template or task specification can have
one or more Activities.11 A task may have several distinct stages of investigation, and such
stages act as a natural partitioning of the task into Activities. As we illustrated in the previous
section, the Floating Pencil task consists of 14 items, some of which are scored together based
on the NAEP scoring rubric. For the purposes of drafting our task specification, we considered
any scored item or group of items scored together as one Activity because the result is a single
Observable Variable. For Floating Pencil, we defined 10 Activities on the basis of the 14 items
(see Table 3, first and second columns).
A critical aspect of structuring the task specification on the PADI design system was defining the
relationship between the Floating Pencil Activities and the task itself. Our team discussed
whether to create one task specification with 10 Activities or 10 separate task specifications,
each with one Activity. Floating Pencil Activities are all dependent on a common task directive
and on a set of physical stimulus materials. In addition, some Floating Pencil Activities are
sequentially dependent—that is, the Work Product from one Activity serves as stimulus
material for a subsequent item. Given these properties, we decided to reverse engineer the
Floating Pencil task into one task specification with 10 Activities.
Our team created 10 Activities in the task specification. Information about Activities is
represented in two areas of the task specification. Under Activities Summary on the summary
page (Appendix B), we noted that the 1996 NAEP scoring rubric was used as the basis for our
definition of an Activity and that the Floating Pencil task has a total of 10 Activities. We then
defined the 10 Activities in the Activities section of the task specification summary page.
Multiple objects were specified for each Activity; these components include Title, Summary,
Measurement Models, Evaluation Procedures, Work Products, Materials and Presentation,
Presentation Logic, and Task Model Variables. Our team defined Measurement Models and
Evaluation Procedures for all Activities.12 Task Model Variables will be considered in the next
section of this report. We also defined Work Products, Materials and Presentation, and
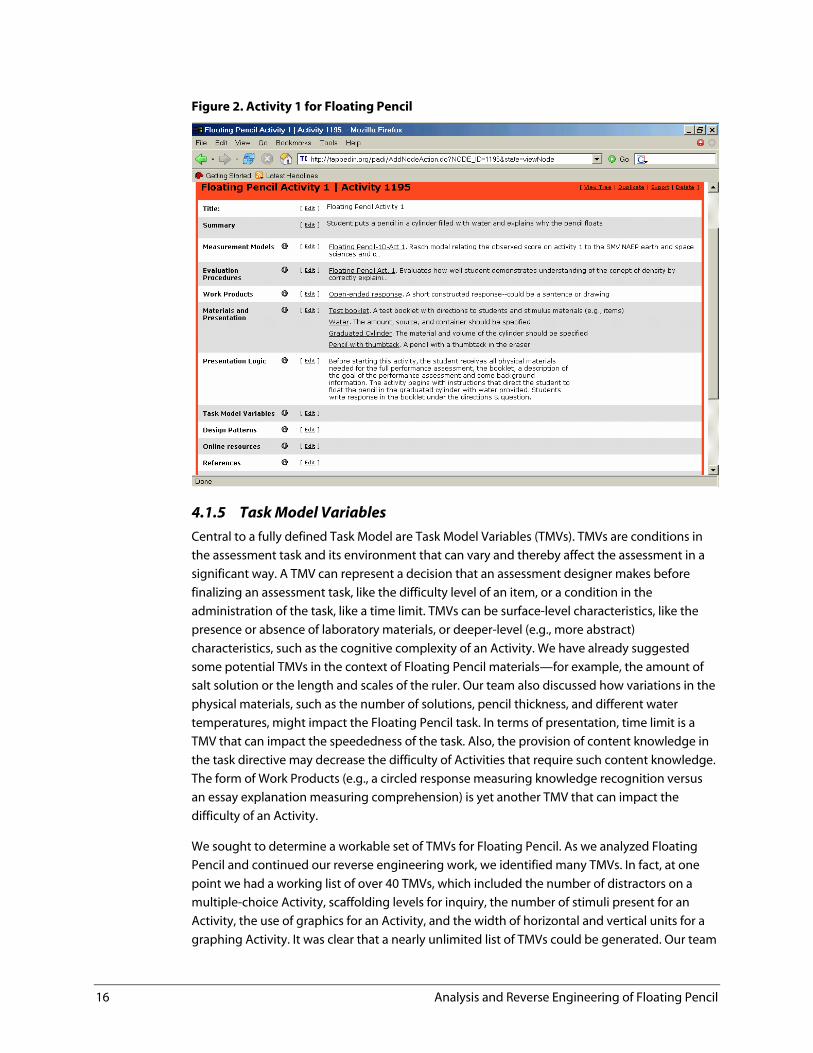
Presentation Logic. For Activity 1 (see Figure 2), the Work Product was defined as Open-Ended
Response. The materials included the test booklet, water, a graduated cylinder, and a pencil
with a thumbtack in the eraser (these are a subset of the materials defined at the task
specification level). The Presentation Logic notes the materials and conditions needed to begin
the task, the Activity-level directions given to the student, and the expectation of a written
student response.
11 The decisions about whether to have several Activities and how to define the scope of an Activity are left to the assessment developer. 12 These will be discussed in subsequent sections of this report.
16 Analysis and Reverse Engineering of Floating Pencil
Figure 2. Activity 1 for Floating Pencil
4.1.5 Task Model Variables
Central to a fully defined Task Model are Task Model Variables (TMVs). TMVs are conditions in
the assessment task and its environment that can vary and thereby affect the assessment in a
significant way. A TMV can represent a decision that an assessment designer makes before
finalizing an assessment task, like the difficulty level of an item, or a condition in the
administration of the task, like a time limit. TMVs can be surface-level characteristics, like the
presence or absence of laboratory materials, or deeper-level (e.g., more abstract)
characteristics, such as the cognitive complexity of an Activity. We have already suggested
some potential TMVs in the context of Floating Pencil materials—for example, the amount of
salt solution or the length and scales of the ruler. Our team also discussed how variations in the
physical materials, such as the number of solutions, pencil thickness, and different water
temperatures, might impact the Floating Pencil task. In terms of presentation, time limit is a
TMV that can impact the speededness of the task. Also, the provision of content knowledge in
the task directive may decrease the difficulty of Activities that require such content knowledge.
The form of Work Products (e.g., a circled response measuring knowledge recognition versus
an essay explanation measuring comprehension) is yet another TMV that can impact the
difficulty of an Activity.
We sought to determine a workable set of TMVs for Floating Pencil. As we analyzed Floating
Pencil and continued our reverse engineering work, we identified many TMVs. In fact, at one
point we had a working list of over 40 TMVs, which included the number of distractors on a
multiple-choice Activity, scaffolding levels for inquiry, the number of stimuli present for an
Activity, the use of graphics for an Activity, and the width of horizontal and vertical units for a
graphing Activity. It was clear that a nearly unlimited list of TMVs could be generated. Our team
Analysis and Reverse Engineering of Floating Pencil 17
then discussed the importance of narrowing our working list of TMVs to those that are
important in describing key aspects of the task. Consider the analogy of a roadmap. A roadmap
covering a wide distance probably would not indicate every potentially salient feature that
exists (e.g., minor roads, every school); the map would be most useful if it included the
important features needed to navigate over long distances (e.g., major highways, airports).
Similarly, we needed to determine a comprehensive set of key TMVs for Floating Pencil. In
doing this, members of our team noted that Floating Pencil was scaffolded procedurally and
that the reading demands were high. We noted that for both content and inquiry we could
consider the level of scaffolding, level of difficulty, and extensiveness. Our team discussed the
research results (Bass, Magone, & Glaser, 2002; Baxter & Glaser, 1998) that identified the task as
content-lean (low content extensiveness) and process-constrained (high scaffolding for
inquiry).
In completing the task specification, we identified the following key TMVs: the physical
materials of the task, the level of inquiry structure (including scaffolding, difficulty, and
extensiveness of inquiry), the level of content structure (also including scaffolding, difficulty,
and extensiveness), the verbal demand of the task, and the cognitive complexity of the task. In
working with the task specification, our team came to understand that some TMVs can be
specific to an Activity (e.g., the form of a Work Product) and others are pertinent to the task as a
whole (e.g., scaffolding for inquiry). Our team coded information about TMVs into four areas of
the task specification, the first three of which are found on the summary page (Appendix B): (1)
under Task Model Variable Summary we noted the key TMVs listed above, (2) under template-
level Task Model Variables we created links to the actual TMV objects representing the
summarized categories, (3) under Task Model Variable Settings we provided the settings for
each of the key TMVs at the task specification level (e.g., the level of inquiry scaffolding was set
as high), and (4) within each Activity under Task Model Variables we linked to some key TMVs
specific to each activity.
There was an ongoing interplay between our consideration of Task Model Variables and our
conception of a family of tasks, of which Floating Pencil was a member. Our consideration of
the research results for Floating Pencil (e.g., inquiry-constrained and content-lean) led us to
consider other multistep performance assessment tasks with lower levels of scaffolding for
inquiry. We began to think about what dimensions might vary across performance assessment
tasks involving laboratory materials. At the core of understanding what can vary across a set of
related tasks and conceptualizing a family of tasks (which could be defined through broader
PADI representations like an abstract template) was this question: “What is the Floating Pencil
task an instance of?” This question stimulated multiple conversations about a family of
performance assessment tasks in which we discussed the basis for and characteristics of a task
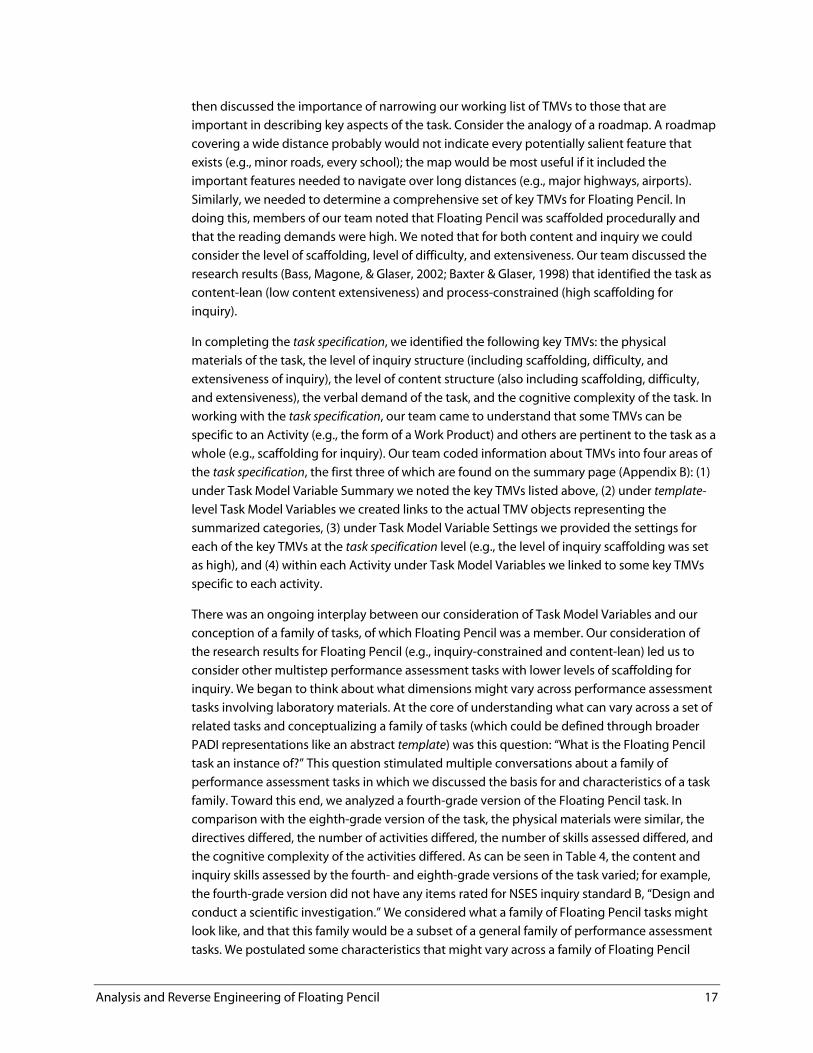
family. Toward this end, we analyzed a fourth-grade version of the Floating Pencil task. In
comparison with the eighth-grade version of the task, the physical materials were similar, the
directives differed, the number of activities differed, the number of skills assessed differed, and
the cognitive complexity of the activities differed. As can be seen in Table 4, the content and
inquiry skills assessed by the fourth- and eighth-grade versions of the task varied; for example,
the fourth-grade version did not have any items rated for NSES inquiry standard B, “Design and
conduct a scientific investigation.” We considered what a family of Floating Pencil tasks might
look like, and that this family would be a subset of a general family of performance assessment
tasks. We postulated some characteristics that might vary across a family of Floating Pencil
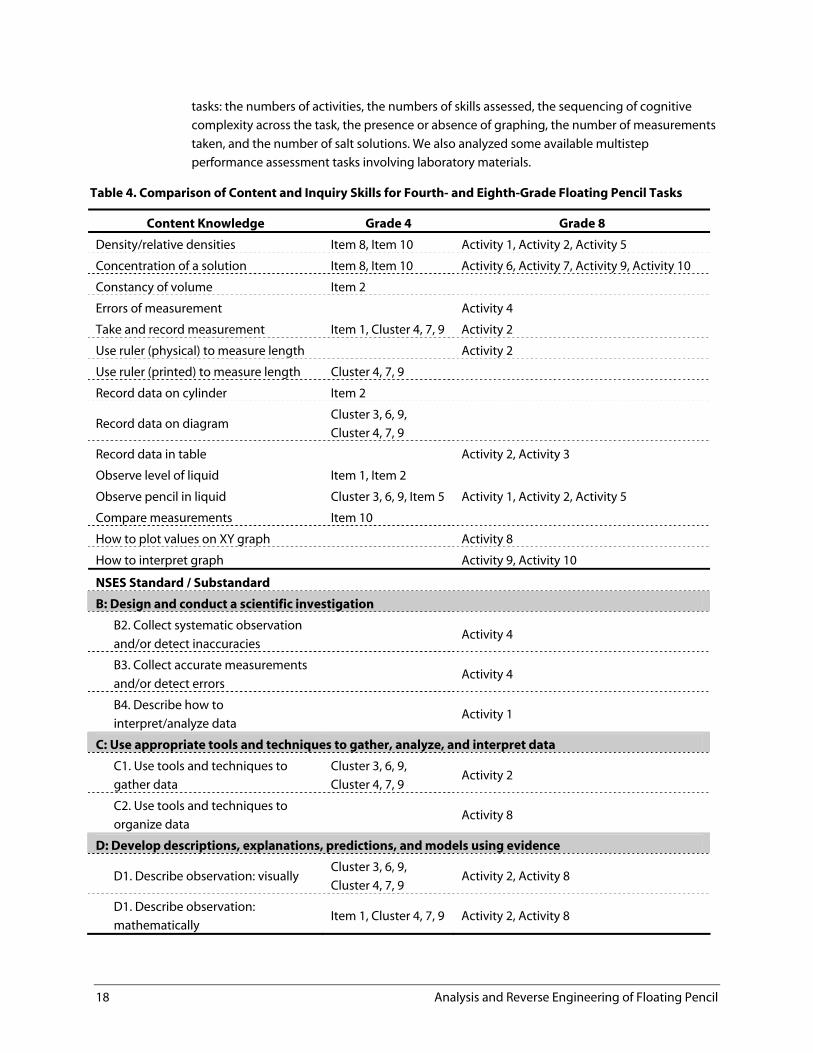
18 Analysis and Reverse Engineering of Floating Pencil
tasks: the numbers of activities, the numbers of skills assessed, the sequencing of cognitive
complexity across the task, the presence or absence of graphing, the number of measurements
taken, and the number of salt solutions. We also analyzed some available multistep
performance assessment tasks involving laboratory materials.
Table 4. Comparison of Content and Inquiry Skills for Fourth- and Eighth-Grade Floating Pencil Tasks
Content Knowledge Grade 4 Grade 8
Density/relative densities Item 8, Item 10 Activity 1, Activity 2, Activity 5
Concentration of a solution Item 8, Item 10 Activity 6, Activity 7, Activity 9, Activity 10
Constancy of volume Item 2 Errors of measurement Activity 4
Take and record measurement Item 1, Cluster 4, 7, 9 Activity 2
Use ruler (physical) to measure length Activity 2
Use ruler (printed) to measure length Cluster 4, 7, 9 Record data on cylinder Item 2
Record data on diagram Cluster 3, 6, 9,
Cluster 4, 7, 9
Record data in table Activity 2, Activity 3
Observe level of liquid Item 1, Item 2 Observe pencil in liquid Cluster 3, 6, 9, Item 5 Activity 1, Activity 2, Activity 5
Compare measurements Item 10 How to plot values on XY graph Activity 8
How to interpret graph Activity 9, Activity 10
NSES Standard / Substandard
B: Design and conduct a scientific investigation
B2. Collect systematic observation
and/or detect inaccuracies Activity 4
B3. Collect accurate measurements
and/or detect errors Activity 4
B4. Describe how to
interpret/analyze data Activity 1
C: Use appropriate tools and techniques to gather, analyze, and interpret data
C1. Use tools and techniques to
gather data
Cluster 3, 6, 9,
Cluster 4, 7, 9 Activity 2
C2. Use tools and techniques to
organize data Activity 8
D: Develop descriptions, explanations, predictions, and models using evidence
D1. Describe observation: visually Cluster 3, 6, 9,
Cluster 4, 7, 9 Activity 2, Activity 8
D1. Describe observation:
mathematically Item 1, Cluster 4, 7, 9 Activity 2, Activity 8
Analysis and Reverse Engineering of Floating Pencil 19
NSES Standard / Substandard Grade 4 Grade 8
D1. Describe observation:
comparison Item 2, Item 5 Activity 5
D2. Use evidence, subject matter
knowledge, and argument to
explain Item 2 Activity 1, Activity 5
D3. Use evidence, subject matter
knowledge, and argument to
predict
Item 8, Item 10,
Item 11 Activity 6, Activity 10
E: Think critically and logically to make the relationships between evidence and explanations
E3. Review and summarize data to
form logical argument Item 10, Item 11 Activity 10
E4. Describe/explain possible cause-
effect relationship Item 10, Item 11 Activity 9
H: Use mathematics in all aspects of scientific inquiry
H1. Use math to structure
explanations Item 10 Activity 10
H2. Use math to gather, organize,
and present data Item 1 Activity 8
H3. Use math to answer questions:
average Activity 3
H3. Use math to answer questions:
length Item 4 Activity 2
H3. Use math to answer questions:
graph Activity 9, Activity 10
We postulated some characteristics of a family of science performance assessment tasks. These
characteristics include tasks that:
Involve standardized, externally supplied laboratory materials that are integral to the
task, serving as stimulus materials among a set of activities.
Provide a motivating question or problem to be investigated.
Require students to work independently, implementing a solution strategy.
Require the use of tools and techniques to gather data.
Require the organization of data in a specified representational form.
Elicit evidence for inquiry skills within particular science content domains.
Could range in levels of verbal demand, difficulty, scaffolding, and cognitive complexity.
Our initial understandings of a potential family of tasks were based largely on the variation of
Task Model Variables across similar and available science performance assessment tasks. These
20 Analysis and Reverse Engineering of Floating Pencil
understandings can begin to shed light on the question of how such tasks might be
constructed in the future. However, to pursue this question in more depth, exploration is
needed of the qualities of potential Student Models (underlying constructs to be measured)
and Evidence Models (how evidence is evaluated and what the psychometric relationship is
between observed evidence and underlying theoretical constructs).
4.2 The Student Model
Conceptually, a Student Model lays out the complex or set of knowledge, skills, or other
attributes to be assessed by a task (Mislevy, Steinberg, & Almond, 2002). SMVs are the
underlying constructs an assessment is designed to measure; also, SMVs are individual
estimates of one facet of student proficiencies. An SMV is a part of at least one, and possibly
more than one, Student Model. SMVs are the latent variables associated with a task—the
knowledge, skills, or abilities the task is designed to elicit in the examinee. These latent
variables can not be observed, and they typically refer to more abstract and theoretical
constructs. An example of a Student Model is drawn from the Mystery Boxes task specification
(Baxter, Elder, & Glaser, 1996) . In this case, the task specification designers wished to measure
students’ abilities to construct a circuit and problem-solve with circuits. A Student Model was
created, called “MB Circuitry Univariate,” that contained one SMV, called “MB SMV Univariate,”
reflecting students’ abilities to construct and problem-solve with circuits.
4.2.1 Exploration of Potential Student Models
A number of Student Models may be considered and used for a given task. For example, task
specifications based on the Mystery Box task employ three different Student Models: MB
Circuitry Univariate, MB Circuitry Multivariate, and MB Circuitry Multivariate with P-S. The SMV
for MB Circuitry Univariate was described previously. The two SMVs for MB Circuitry
Multivariate reflect students’ abilities to identify a correct response from a list of choices and to
provide evidence. MB Circuitry Multivariate with P-S has six SMVs, reflecting students’ abilities
to (1) select a correct answer, (2) provide evidence, (3) explain task-related concepts, (4)
monitor their own progress, (5) plan for solving a task, and (6) strategically solve a task.
Different Student Models may be developed for different purposes. The template ASK
Performance, which gives specifications for a family of performance tasks assessing inquiry,
presents three Student Models: ASK Unidimensional Inquiry, ASK MD Inquiry, and ASK MD
Inquiry for Diagnostics.13 The unidimensional Student Model has one SMV—a variable of
inquiry knowledge from which a single measure of inquiry could be derived (e.g., for reporting
purposes). The multidimensional Student Model has four SMVs, based on different phases of
the scientific inquiry process: design and conduct investigations, gather and organize data,
interpret data, and construct an explanation using evidence. This Student Model was designed
for use in charting student progress in using inquiry methods. Finally, the Inquiry for
Diagnostics model also has four SMVs based on different phases of scientific inquiry; however,
each SMV is divided into six or seven cutpoint-based categories. This Student Model is
intended to produce measures useful for diagnosing student abilities.
Given an existing task to be reverse engineered, the Student Model can be determined though
task analysis. This process involves analyzing the demands of the task in terms of cognitive
13 For more information on the ASK project, see <http://www.lawrencehallofscience.org/foss/newsletters/present/FOSS27.assessing.html>
Analysis and Reverse Engineering of Floating Pencil 21
factors that include types of knowledge required (e.g., particular science content knowledge)
and reasoning processes required (e.g., explanations linking theory and evidence). This process
is informed by any framework or information from the task developer, such as a content-by-
process matrix. Analysis of task demands includes identification of particular skills required for
task completion, such as using tools to collect accurate measurements. The core knowledge,
understanding, and skills required for successful completion of a task form the Student Model.
The components of the Student Model—specific knowledge, skills, and abilities—are defined
as Student Model Variables. Consideration is given to the number and generality of the SMVs.
These determine the grain size of the Student Model and are based on the assessment
argument. For example, if the purpose of the task is to provide pass/fail decisions for individual
science achievement at a national level, one or two SMVs (e.g., science content knowledge and
inquiry ability) may be preferable to a larger set of SMVs.
Initially, our team explored the cognitive demands of each item group or Activity in Floating
Pencil through a number of lenses. First, we took the assessment ourselves, noting the
cognitive demands of each item. For example (see Appendix A), we noted that students would
need to understand the concept of density to provide a correct explanation for item 1 (Activity
1) and know how to do linear interpolation to correctly respond to item 14 (Activity 10).
Second, we used the NSES inquiry standards (National Research Council, 1996) and considered
the specific content and inquiry demands of each Activity. We used the ratings of Floating
Pencil item groups by expert scientists on the NSES inquiry standards (see Table 1), as well as
our own team ratings of content coverage for the items. For example, item 9 (Activity 6) reads,
“Why does the pencil float at a different level in the salt solution than in the water?” and was
rated as inquiry standard D, substandard D2, “Use evidence, subject matter knowledge, and
argument to explain”; the item was considered to require content knowledge of densities,
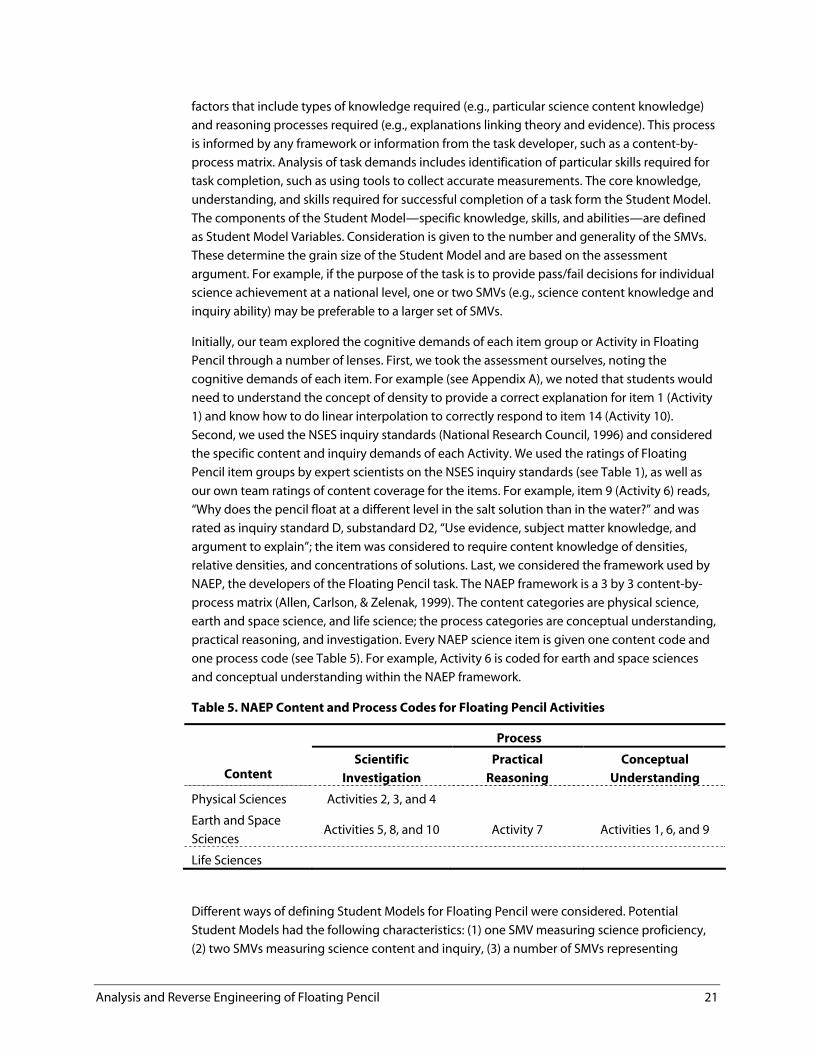
relative densities, and concentrations of solutions. Last, we considered the framework used by
NAEP, the developers of the Floating Pencil task. The NAEP framework is a 3 by 3 content-by-
process matrix (Allen, Carlson, & Zelenak, 1999). The content categories are physical science,
earth and space science, and life science; the process categories are conceptual understanding,
practical reasoning, and investigation. Every NAEP science item is given one content code and
one process code (see Table 5). For example, Activity 6 is coded for earth and space sciences
and conceptual understanding within the NAEP framework.
Table 5. NAEP Content and Process Codes for Floating Pencil Activities
Process
Content Scientific
Investigation
Practical
Reasoning
Conceptual
Understanding
Physical Sciences Activities 2, 3, and 4
Earth and Space
Sciences Activities 5, 8, and 10 Activity 7 Activities 1, 6, and 9
Life Sciences
Different ways of defining Student Models for Floating Pencil were considered. Potential
Student Models had the following characteristics: (1) one SMV measuring science proficiency,
(2) two SMVs measuring science content and inquiry, (3) a number of SMVs representing
22 Analysis and Reverse Engineering of Floating Pencil
instructionally based variables (useful for formative classroom assessment purposes), (4) SMVs
representing the NSES inquiry standards assessed by Floating Pencil, and (5) SMVs based on
the NAEP content-by-process framework. Although the first potential Student Model had the
appeal of providing a potentially powerful measure of scientific proficiency, this model would
not produce information specific to the measurement of scientific inquiry. The second
potential Student Model, measuring content and inquiry, offered no real advantage over
collapsing the content and process codes based on NAEP’s framework since both yield a two-
dimensional content-by-process Student Model. We briefly considered a Student Model that
consisted of specific, instructionally linked SMVs. For example, item 7 reads, “Take the pencil
and put it in the 25% salt solution in the cylinder, eraser-end down. How does the pencil float
in this solution compared to how it floated in the water?” The possible responses are: “a. In the
salt solution, more of the pencil is above the surface” and “b. In the salt solution, more of the
pencil is below the surface.” An SMV that reflects the nature of students’ cognitive abilities
required for item 7 (Activity 5) might be “The ability to interpret observations made during an
investigation.” Measures of student abilities on such SMVs could be used to inform the
teaching of science by making the underlying cognitive abilities clear. This approach to a
Student Model was not pursued, however. Given that Floating Pencil is part of the NAEP
assessment and was to be calibrated with a larger group of NAEP items,14 Student Models were
needed that supported broad categories based on a widely accepted framework.
We also considered Student Models for Floating Pencil based on the NSES inquiry standards.15
This approach had a number of advantages. The NSES inquiry standards (National Research
Council, 1996) are accepted as a benchmark for inquiry practices in the science education
community. The pool of NAEP items available for calibrating along with the Floating Pencil task
already had received expert ratings on the NSES inquiry standards. Also, the standards
differentiate phases of inquiry—a practice that is consonant with the PADI project’s emphasis
on creating blueprints for measuring scientific inquiry. One disadvantage, however, was that
NSES inquiry standards do not explicitly reflect content knowledge (National Research Council,
1996). Our team grappled somewhat with the possible SMVs of a Student Model based on the
NSES inquiry standards. Would each of the eight inquiry standards be considered an SMV?
Would the standards be combined in some logical way to create a smaller number of SMVs?
Would we create SMVs on the basis of the substandards (potentially 24 variables)? The larger
the number of variables to be calibrated, the less precision of measurement was likely.
Therefore, we could not be certain that Student Models with large numbers of SMVs would be
workable.
Ultimately, our team was attracted to the notion of considering Student Models for Floating
Pencil based on the NAEP content-by-process framework (Allen, Carlson, & Zelenak, 1999). This
approach had a number of advantages. The NAEP framework guided the development of NAEP
items and item groups and is widely understood in the assessment community. The content
and process codes were available for the Floating Pencil items/item groups as well as for the
other NAEP items involved in the calibration plans (Allen, Carlson, & Zelenak, 1999). This
approach, however, had some disadvantages. The breadth of categories within the NAEP
framework was not expected to yield measures that reflect the nature of students’ cognitive 14 The Floating Pencil task will be calibrated with other items from the Validities of Standards-Based Science Inquiry Assessments: Implementation Study. 15 Table 1 indicates the alignment between Floating Pencil items/item groupings and the NSES inquiry standards.
Analysis and Reverse Engineering of Floating Pencil 23
processes on the Floating Pencil task; also, NAEP’s process categories (conceptual
understanding, practical reasoning, and scientific investigation) were not likely to yield
measures that differentiated scientific inquiry processes.
4.2.2 Choice of Student Model
For the Floating Pencil task specification, our team chose to base the Student Model on the
NAEP framework. The content and process codes from NAEP’s framework became the
underlying variables of our Student Model. As we developed our Student Model, we
considered a number of issues. We had some discussion as to whether conceptual
understanding was distinct from types of content knowledge and considered dropping
conceptual understanding as a process dimension. Because every NAEP item is coded for one
of three content areas, it did not seem that the conceptual understanding dimension could be
modeled as orthogonal to the content dimensions. We dropped the content area life sciences
from our Student Model because none of the Floating Pencil items and none of the larger
group of items Floating Pencil was to be calibrated with were life sciences items. It was noted
that dropping this content area left us with only a subset of the NAEP framework. Finally, we
defined six SMVs based on every possible content/process combination within the subset:
Conceptual understanding within earth and space sciences
Conceptual understanding within physical sciences
Practical reasoning within earth and space sciences
Practical reasoning within physical sciences
Scientific investigation within earth and space sciences
Scientific investigation within physical sciences
The rationale for defining SMVs in this manner will be discussed in a subsequent section of the
report that considers the Measurement Model.
Our team coded information about the Student Model and SMVs into three areas of the task
specification. The first two are found on the summary page (Appendix B): (1) under Student
Model Summary we noted our use of the NAEP framework and its associated content and
process codes, and (2) under Student Models we created a link to the actual Student Model
named NAEP Floating Pencil Content and Process. The third area is found within the Student
Model, where we defined and linked to the six SMVs listed above (see Figure 3). Figure 4
provides an example of one of the SMVs, conceptual understanding within earth and space
sciences. This SMV is summarized in terms of content (e.g., solid earth, air, water) and in terms
of conceptual understandings (e.g., knowledge of principles, laws, and theories). Objects in
Figure 4 also include minimum and maximum of ability estimates on the standard Item
Response Theory (IRT) scale (defined with a mean of 0 and standard deviation of 1). Although
ability estimates may theoretically range from negative to positive infinity, the range of the
ability estimates is typically restricted to the interval [-3.00, +3.00].
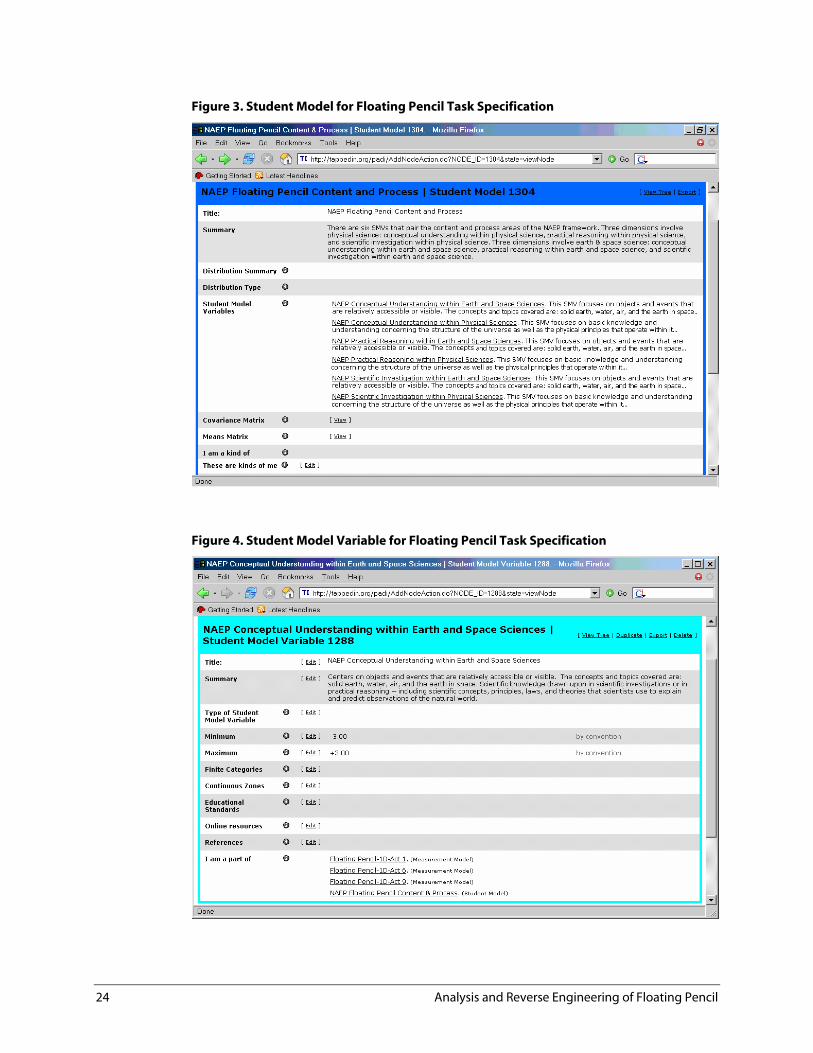
24 Analysis and Reverse Engineering of Floating Pencil
Figure 3. Student Model for Floating Pencil Task Specification
Figure 4. Student Model Variable for Floating Pencil Task Specification
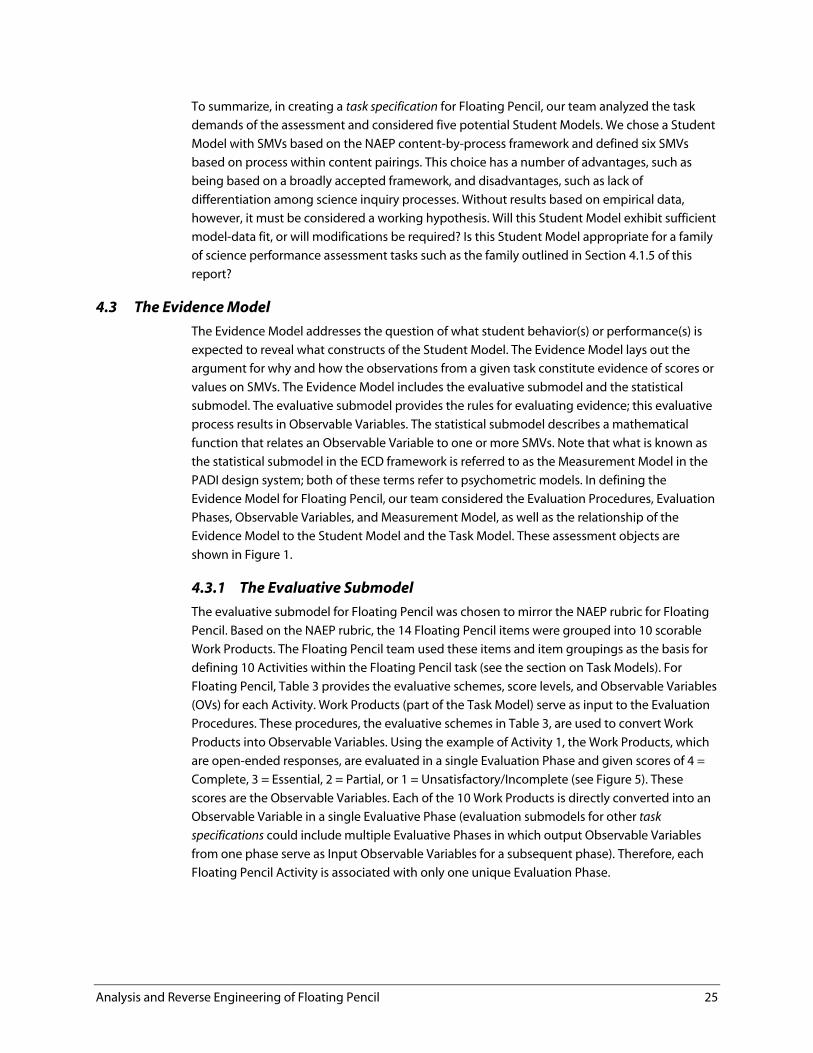
Analysis and Reverse Engineering of Floating Pencil 25
To summarize, in creating a task specification for Floating Pencil, our team analyzed the task
demands of the assessment and considered five potential Student Models. We chose a Student
Model with SMVs based on the NAEP content-by-process framework and defined six SMVs
based on process within content pairings. This choice has a number of advantages, such as
being based on a broadly accepted framework, and disadvantages, such as lack of
differentiation among science inquiry processes. Without results based on empirical data,
however, it must be considered a working hypothesis. Will this Student Model exhibit sufficient
model-data fit, or will modifications be required? Is this Student Model appropriate for a family
of science performance assessment tasks such as the family outlined in Section 4.1.5 of this
report?
4.3 The Evidence Model
The Evidence Model addresses the question of what student behavior(s) or performance(s) is
expected to reveal what constructs of the Student Model. The Evidence Model lays out the
argument for why and how the observations from a given task constitute evidence of scores or
values on SMVs. The Evidence Model includes the evaluative submodel and the statistical
submodel. The evaluative submodel provides the rules for evaluating evidence; this evaluative
process results in Observable Variables. The statistical submodel describes a mathematical
function that relates an Observable Variable to one or more SMVs. Note that what is known as
the statistical submodel in the ECD framework is referred to as the Measurement Model in the
PADI design system; both of these terms refer to psychometric models. In defining the
Evidence Model for Floating Pencil, our team considered the Evaluation Procedures, Evaluation
Phases, Observable Variables, and Measurement Model, as well as the relationship of the
Evidence Model to the Student Model and the Task Model. These assessment objects are
shown in Figure 1.
4.3.1 The Evaluative Submodel
The evaluative submodel for Floating Pencil was chosen to mirror the NAEP rubric for Floating
Pencil. Based on the NAEP rubric, the 14 Floating Pencil items were grouped into 10 scorable
Work Products. The Floating Pencil team used these items and item groupings as the basis for
defining 10 Activities within the Floating Pencil task (see the section on Task Models). For
Floating Pencil, Table 3 provides the evaluative schemes, score levels, and Observable Variables
(OVs) for each Activity. Work Products (part of the Task Model) serve as input to the Evaluation
Procedures. These procedures, the evaluative schemes in Table 3, are used to convert Work
Products into Observable Variables. Using the example of Activity 1, the Work Products, which
are open-ended responses, are evaluated in a single Evaluation Phase and given scores of 4 =
Complete, 3 = Essential, 2 = Partial, or 1 = Unsatisfactory/Incomplete (see Figure 5). These
scores are the Observable Variables. Each of the 10 Work Products is directly converted into an
Observable Variable in a single Evaluative Phase (evaluation submodels for other task
specifications could include multiple Evaluative Phases in which output Observable Variables
from one phase serve as Input Observable Variables for a subsequent phase). Therefore, each
Floating Pencil Activity is associated with only one unique Evaluation Phase.
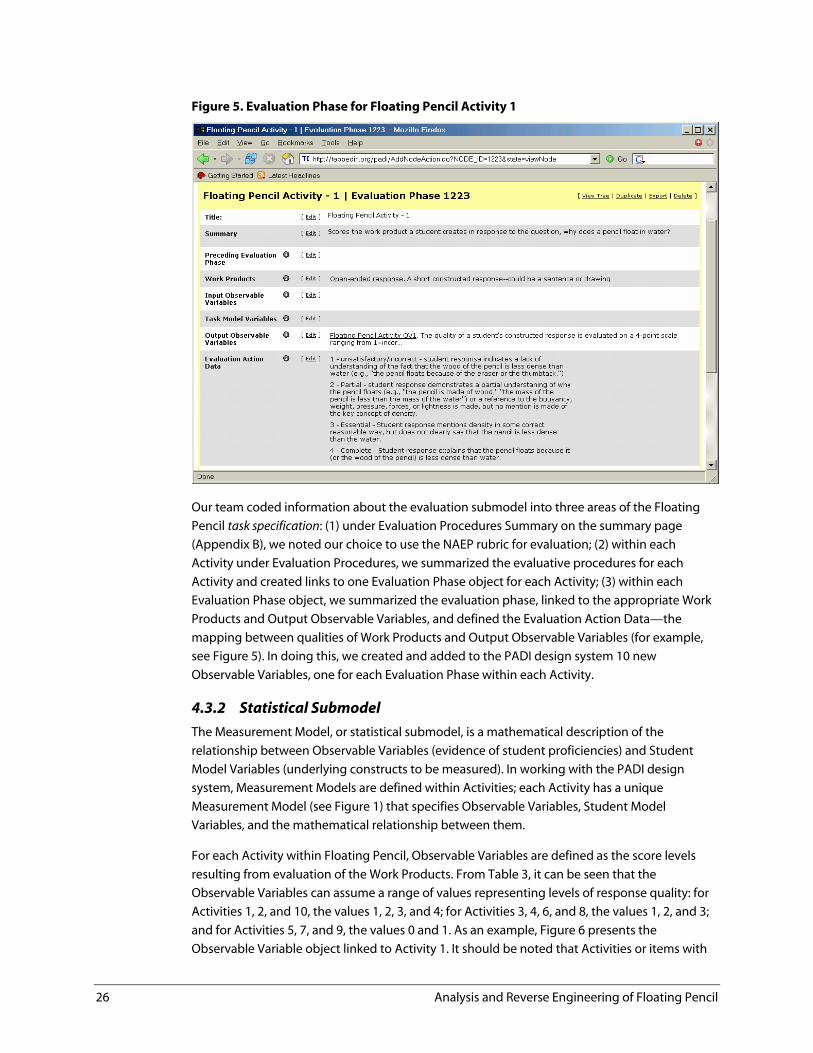
26 Analysis and Reverse Engineering of Floating Pencil
Figure 5. Evaluation Phase for Floating Pencil Activity 1
Our team coded information about the evaluation submodel into three areas of the Floating
Pencil task specification: (1) under Evaluation Procedures Summary on the summary page
(Appendix B), we noted our choice to use the NAEP rubric for evaluation; (2) within each
Activity under Evaluation Procedures, we summarized the evaluative procedures for each
Activity and created links to one Evaluation Phase object for each Activity; (3) within each
Evaluation Phase object, we summarized the evaluation phase, linked to the appropriate Work
Products and Output Observable Variables, and defined the Evaluation Action Data—the
mapping between qualities of Work Products and Output Observable Variables (for example,
see Figure 5). In doing this, we created and added to the PADI design system 10 new
Observable Variables, one for each Evaluation Phase within each Activity.
4.3.2 Statistical Submodel
The Measurement Model, or statistical submodel, is a mathematical description of the
relationship between Observable Variables (evidence of student proficiencies) and Student
Model Variables (underlying constructs to be measured). In working with the PADI design
system, Measurement Models are defined within Activities; each Activity has a unique
Measurement Model (see Figure 1) that specifies Observable Variables, Student Model
Variables, and the mathematical relationship between them.
For each Activity within Floating Pencil, Observable Variables are defined as the score levels
resulting from evaluation of the Work Products. From Table 3, it can be seen that the
Observable Variables can assume a range of values representing levels of response quality: for
Activities 1, 2, and 10, the values 1, 2, 3, and 4; for Activities 3, 4, 6, and 8, the values 1, 2, and 3;
and for Activities 5, 7, and 9, the values 0 and 1. As an example, Figure 6 presents the
Observable Variable object linked to Activity 1. It should be noted that Activities or items with
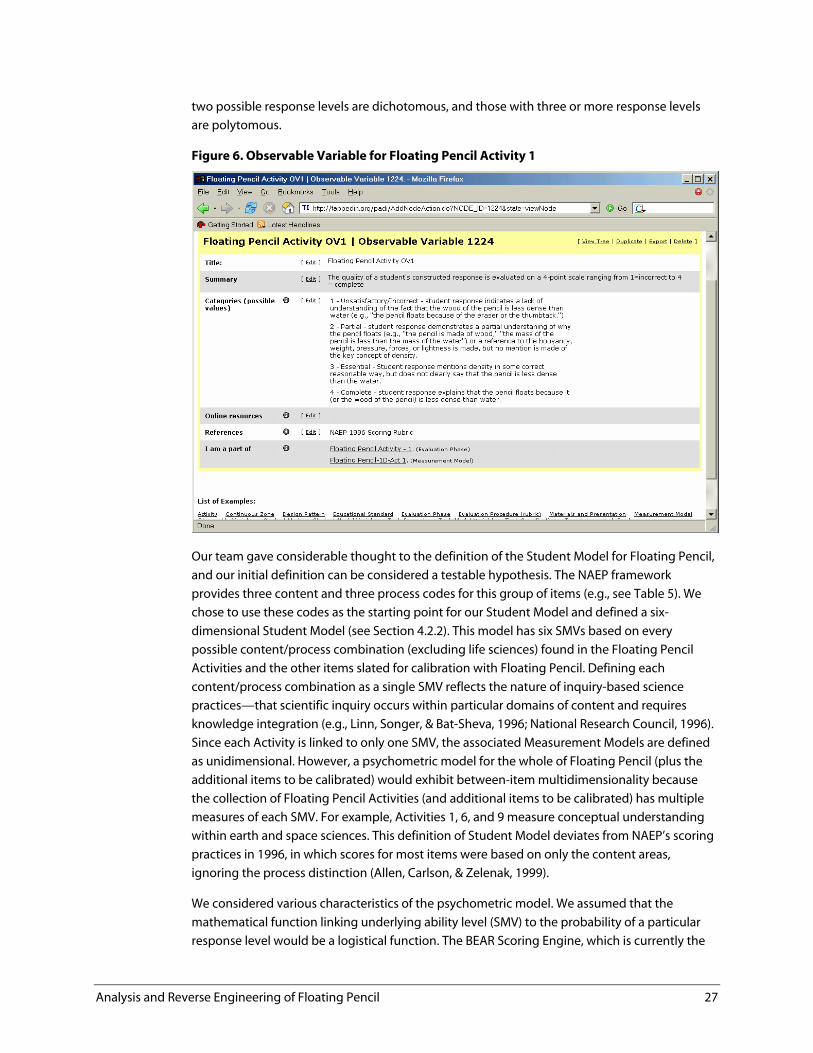
Analysis and Reverse Engineering of Floating Pencil 27
two possible response levels are dichotomous, and those with three or more response levels
are polytomous.
Figure 6. Observable Variable for Floating Pencil Activity 1
Our team gave considerable thought to the definition of the Student Model for Floating Pencil,
and our initial definition can be considered a testable hypothesis. The NAEP framework
provides three content and three process codes for this group of items (e.g., see Table 5). We
chose to use these codes as the starting point for our Student Model and defined a six-
dimensional Student Model (see Section 4.2.2). This model has six SMVs based on every
possible content/process combination (excluding life sciences) found in the Floating Pencil
Activities and the other items slated for calibration with Floating Pencil. Defining each
content/process combination as a single SMV reflects the nature of inquiry-based science
practices—that scientific inquiry occurs within particular domains of content and requires
knowledge integration (e.g., Linn, Songer, & Bat-Sheva, 1996; National Research Council, 1996).
Since each Activity is linked to only one SMV, the associated Measurement Models are defined
as unidimensional. However, a psychometric model for the whole of Floating Pencil (plus the
additional items to be calibrated) would exhibit between-item multidimensionality because
the collection of Floating Pencil Activities (and additional items to be calibrated) has multiple
measures of each SMV. For example, Activities 1, 6, and 9 measure conceptual understanding
within earth and space sciences. This definition of Student Model deviates from NAEP’s scoring
practices in 1996, in which scores for most items were based on only the content areas,
ignoring the process distinction (Allen, Carlson, & Zelenak, 1999).
We considered various characteristics of the psychometric model. We assumed that the
mathematical function linking underlying ability level (SMV) to the probability of a particular
response level would be a logistical function. The BEAR Scoring Engine, which is currently the
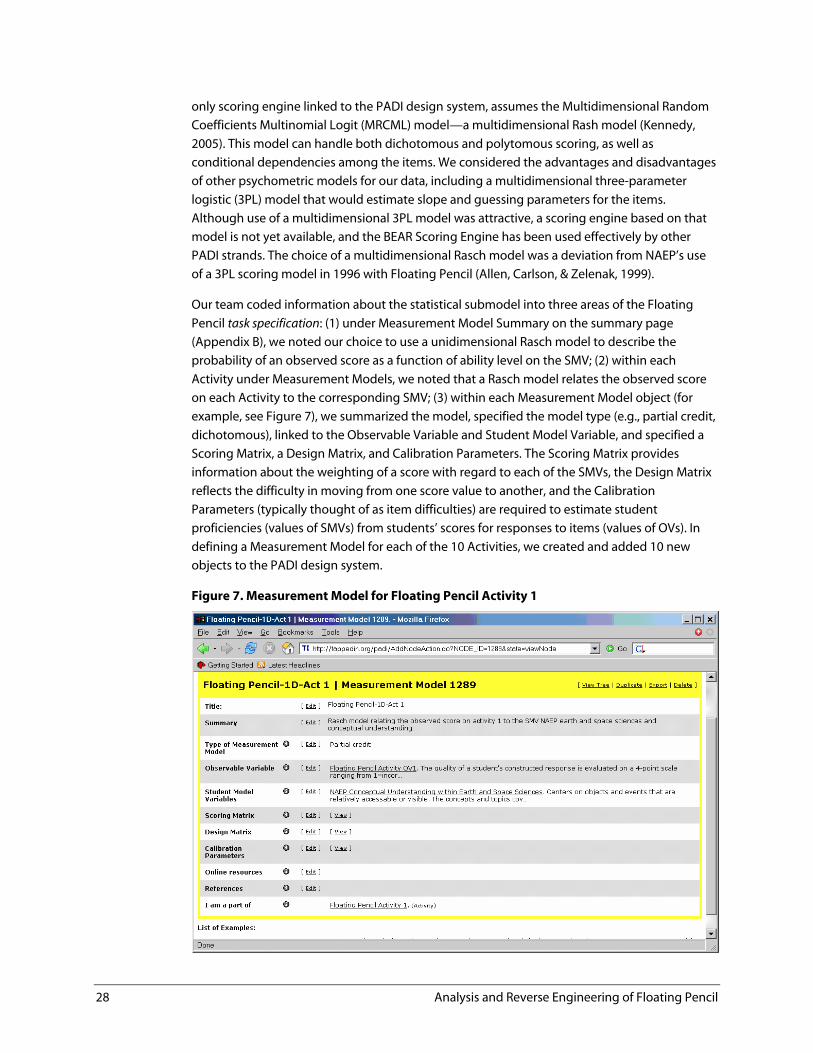
28 Analysis and Reverse Engineering of Floating Pencil
only scoring engine linked to the PADI design system, assumes the Multidimensional Random
Coefficients Multinomial Logit (MRCML) model—a multidimensional Rash model (Kennedy,
2005). This model can handle both dichotomous and polytomous scoring, as well as
conditional dependencies among the items. We considered the advantages and disadvantages
of other psychometric models for our data, including a multidimensional three-parameter
logistic (3PL) model that would estimate slope and guessing parameters for the items.
Although use of a multidimensional 3PL model was attractive, a scoring engine based on that
model is not yet available, and the BEAR Scoring Engine has been used effectively by other
PADI strands. The choice of a multidimensional Rasch model was a deviation from NAEP’s use
of a 3PL scoring model in 1996 with Floating Pencil (Allen, Carlson, & Zelenak, 1999).
Our team coded information about the statistical submodel into three areas of the Floating
Pencil task specification: (1) under Measurement Model Summary on the summary page
(Appendix B), we noted our choice to use a unidimensional Rasch model to describe the
probability of an observed score as a function of ability level on the SMV; (2) within each
Activity under Measurement Models, we noted that a Rasch model relates the observed score
on each Activity to the corresponding SMV; (3) within each Measurement Model object (for
example, see Figure 7), we summarized the model, specified the model type (e.g., partial credit,
dichotomous), linked to the Observable Variable and Student Model Variable, and specified a
Scoring Matrix, a Design Matrix, and Calibration Parameters. The Scoring Matrix provides
information about the weighting of a score with regard to each of the SMVs, the Design Matrix
reflects the difficulty in moving from one score value to another, and the Calibration
Parameters (typically thought of as item difficulties) are required to estimate student
proficiencies (values of SMVs) from students’ scores for responses to items (values of OVs). In
defining a Measurement Model for each of the 10 Activities, we created and added 10 new
objects to the PADI design system.
Figure 7. Measurement Model for Floating Pencil Activity 1
Analysis and Reverse Engineering of Floating Pencil 29
The Measurement Model specified for each item requires that the item scores are conditionally
independent. But this assumption is not likely to be met with the Floating Pencil task since all
items are based on a common set of stimuli (i.e., task directive and physical materials) and
some of the items are sequentially dependent—that is, the Work Product from one Activity
serves as stimulus material for a subsequent item. One way to handle a subset of items that do
not meet the assumption of conditional independence is to “bundle” the items into a single
score, independent from other scores in the larger set. We discussed how to handle “bundling”
Floating Pencil Activities, noting that such “bundling” may produce some “within-bundle”
multidimensionality, depending on the SMVs of the Activities within each bundle. We were
unable to determine conclusively whether NAEP treated the Floating Pencil Activities as
statistically dependent or independent, although we believe that NAEP could not assume
statistical independence, since Floating Pencil items were not included in NAEP IRT scaling
procedures in 1996.
To summarize, the Evidence Model specifies how evidence is to be evaluated and the
psychometric relationship between observed evidence and underlying theoretical constructs.
Our team chose the evaluative submodel for Floating Pencil to mirror the NAEP rubric for
Floating Pencil; on this basis, we grouped the 14 Floating Pencil items into 10 scorable Work
Products. We defined a unidimensional Rasch Measurement Model for each Activity. We noted
that a psychometric model for the whole of Floating Pencil would exhibit between-item
multidimensionality; we also discussed the lack of conditional independence among items and
considered “bundling” Floating Pencil activities. This choice of a psychometric model raises a
number of issues, such as the strength of the relationship between OVs and SMVs and the
adequacy of the Measurement Models. In addition, subsequent consideration should be given
to the adequacy of the Evidence Model for a family of science performance assessment tasks
(of which Floating Pencil is a member).
30 Summary and Discussion
5.0 Summary and Discussion
Our reverse engineering and analysis of the Floating Pencil task was largely an epistemological
process that involved grappling with task complexity in the context of PADI. Our team came to
understand the characteristics and underlying assessment argument of the Floating Pencil
task, the ECD framework within the context of the PADI design system, and the properties of
the PADI design system. Through this process, we also came to new understandings of the
design process for large-scale performance assessment tasks. The developmental needs of the
project and the coupling of work—including the use of team members’ expertise and the
balancing of team and individual learning curves—were managed by the team leaders. The
Web-based PADI design system served as a repository of emerging knowledge, and changes to
our task specification were immediately available to all team members. Our work left a trace in
the form of the NAEP Floating Pencil task specification, contained in the PADI library. The
Floating Pencil team’s work also affected the PADI design system. For example, a number of
new Work Products and Student Model Variables were added to the system to accommodate
the Floating Pencil task. Our team’s work also prompted discussions about the adequacy of the
PADI design system as a development tool (e.g., making additional scoring engines available,
eliminating redundancies within the PADI library).
The purpose of reverse engineering is to create a design or blueprint by analyzing a final
product or system. In the case of reverse engineering an assessment by using the PADI design
system, the final product is the assessment task itself, and the design or blueprint is an object in
the form of a task specification, template, or design pattern. Specifying the design or blueprint
involves explicating the understanding of an underlying assessment argument. In some cases,
the task developer may have previously articulated a clear assessment argument. In other
cases, such as with Floating Pencil, the reverse engineering process includes construction of
this argument.
5.1 Proposed Assessment Argument for Floating Pencil
What is the assessment argument for Floating Pencil? There is no evidence that NAEP explicitly
constructed an assessment argument for Floating Pencil, prior to its administration in 1996.
Throughout the reverse engineering process, we have sought to adhere to NAEP’s purposes
and decisions; therefore, we will consider an assessment argument based on NAEP’s goals for
administering a large-scale reference examination. The Floating Pencil task was one among
many tasks and items administered as part of the NAEP. The NAEP tasks and items were tied to
the NAEP content-by-process framework (Allen, Carlson, & Zelenak, 1999). Student responses
to tasks and items were considered evidence of the scientific content and process skills given in
the framework. Therefore, an assessment argument for Floating Pencil might look something
like the one provided in Figure 8.
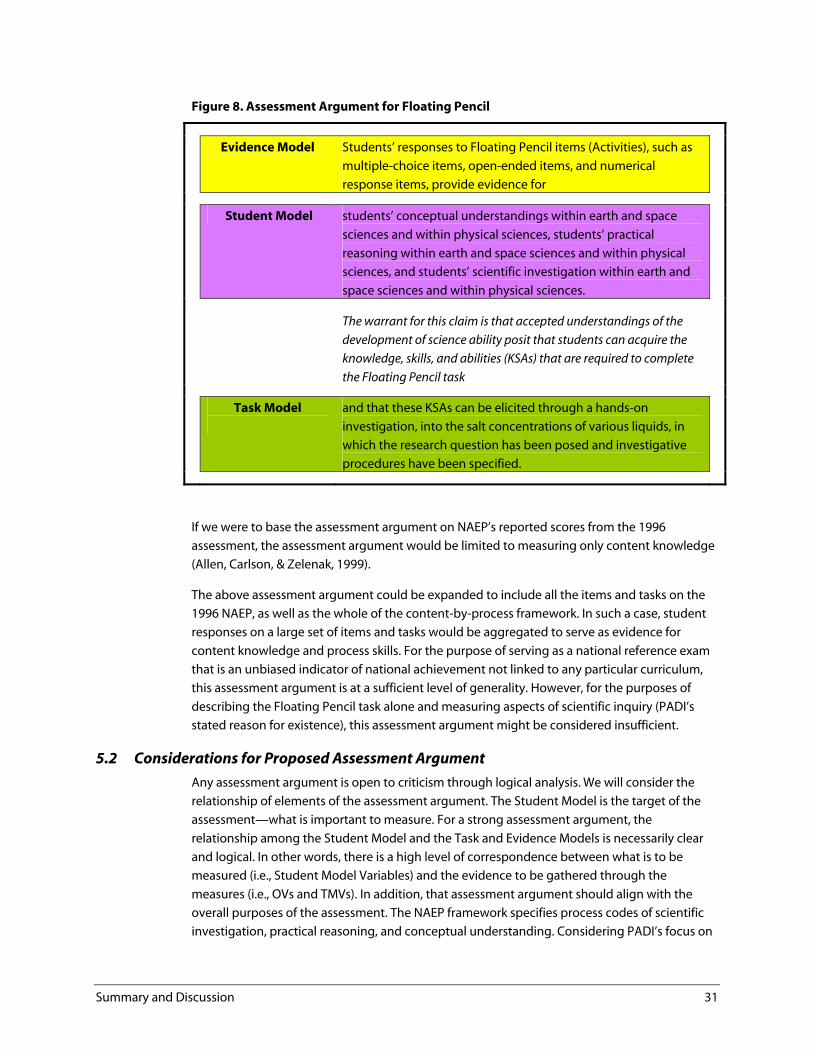
Summary and Discussion 31
Figure 8. Assessment Argument for Floating Pencil
Evidence Model Students’ responses to Floating Pencil items (Activities), such as
multiple-choice items, open-ended items, and numerical
response items, provide evidence for
Student Model students’ conceptual understandings within earth and space
sciences and within physical sciences, students’ practical
reasoning within earth and space sciences and within physical
sciences, and students’ scientific investigation within earth and
space sciences and within physical sciences.
The warrant for this claim is that accepted understandings of the
development of science ability posit that students can acquire the
knowledge, skills, and abilities (KSAs) that are required to complete
the Floating Pencil task
Task Model
and that these KSAs can be elicited through a hands-on
investigation, into the salt concentrations of various liquids, in
which the research question has been posed and investigative
procedures have been specified.
If we were to base the assessment argument on NAEP’s reported scores from the 1996
assessment, the assessment argument would be limited to measuring only content knowledge
(Allen, Carlson, & Zelenak, 1999).
The above assessment argument could be expanded to include all the items and tasks on the
1996 NAEP, as well as the whole of the content-by-process framework. In such a case, student
responses on a large set of items and tasks would be aggregated to serve as evidence for
content knowledge and process skills. For the purpose of serving as a national reference exam
that is an unbiased indicator of national achievement not linked to any particular curriculum,
this assessment argument is at a sufficient level of generality. However, for the purposes of
describing the Floating Pencil task alone and measuring aspects of scientific inquiry (PADI’s
stated reason for existence), this assessment argument might be considered insufficient.
5.2 Considerations for Proposed Assessment Argument
Any assessment argument is open to criticism through logical analysis. We will consider the
relationship of elements of the assessment argument. The Student Model is the target of the
assessment—what is important to measure. For a strong assessment argument, the
relationship among the Student Model and the Task and Evidence Models is necessarily clear
and logical. In other words, there is a high level of correspondence between what is to be
measured (i.e., Student Model Variables) and the evidence to be gathered through the
measures (i.e., OVs and TMVs). In addition, that assessment argument should align with the
overall purposes of the assessment. The NAEP framework specifies process codes of scientific
investigation, practical reasoning, and conceptual understanding. Considering PADI’s focus on
32 Summary and Discussion
scientific inquiry, these process codes may be inadequate. For example, Floating Pencil
Activities 2 through 5, 8, and 10 are all coded as scientific investigation within the NAEP
framework, whereas these Activities are coded as five different aspects of scientific inquiry
based on the NSES inquiry standards (National Research Council, 1996; see Table 1). A
differentiation of scientific inquiry processes is consistent with PADI’s goal of understanding
and measuring scientific inquiry. We have hypothesized that there is a relationship between
the observable student proficiencies elicited by the task (e.g., students’ concepts of density,
measurement skills, data analysis skills) and the underlying SMVs (conceptual understanding,
practical reasoning, and scientific investigation within physical science and earth and space
science). To fully evaluate this hypothesis, the strength and adequacy of this relationship must
be empirically investigated, alternative relationships must be considered, and our chosen
psychometric model must be examined. We have yet to consider the adequacy of this
proposed assessment argument as a basis for forward engineering science performance
assessments.
This analysis leads to a number of considerations:
Are there changes that can be made to better differentiate among science inquiry
processes without abandoning NAEP’s purposes?
Are our proposed Student Models empirically supported? Is our Measurement Model
adequately specified? If so, what can we learn?
In what ways does our reverse engineering work shed light on forward engineering
performance assessment tasks?
As we constructed our Student and Measurement Models, we used NAEP’s framework and
reporting practices as a starting point—stepping forward in ways that might lead to a stronger
assessment argument. On the basis of the NAEP framework, we calculate scores for Floating
Pencil were based on only two content areas: earth and space sciences and physical sciences.
Our proposed Student Model is composed of six SMVs—each a combination of content and
process. Thus, our analyses may have sufficient power to distinguish among process variables
(conceptual understanding, practical reasoning, and scientific investigation) as well as content
variables. In addition, the embedding of process within content is in keeping with actual
practices in the field of science education (National Research Council, 1996). However, the
process variables do not distinguish among phases of scientific inquiry. A further
developmental step might be defining sets of SMVs representing different scientific inquiry
processes, perhaps on the basis of the NSES inquiry standards. A Student Model might be
constructed and tested that contained a set of content variables (e.g., physical sciences and
earth and space sciences) crossed with a set of inquiry variables (e.g., design and conduct a
scientific investigation; use appropriate tools and techniques to gather, analyze, and interpret
data; develop descriptions, explanations, predictions, and models using evidence; and think
critically and logically to make the relationships between evidence and explanations).
Our current Student Model is a testable hypothesis. Data from this version of the Floating
Pencil Assessment task and other large-scale science items were collected from 18 classes of
middle school students. The Floating Pencil items are to be calibrated with a pool of large-scale
science items made available in June 2005 through the SRI study of middle school science,
Summary and Discussion 33
Validities of Standards-Based Science Inquiry Assessments: Implementation Study (see Quellmalz,
et al., 2004; Quellmalz & Haydel, 2003; and Quellmalz & Kreikemeier, 2002). Our empirical work
will involve testing the model fit of these data based on a number of Student Models (e.g., a
two-dimensional model with content and inquiry variables). Empirical analyses will involve
considering the model-data fit of various models and reinterpreting the SMVs. If a model is
empirically supported, what can we learn? Here, we must consider the Task Model for Floating
Pencil. We have made the argument that Floating Pencil is highly scaffolded. Therefore, even
the most powerful and reliable measures of scientific investigation or inquiry will distinguish
only a level of students’ abilities to correctly implement investigative procedures versus
incorrectly implementing procedures, not their abilities to conduct an investigation in which
the experimental procedures have not been specified. Similarly, the task requires limited
content knowledge; therefore, measures of content knowledge are limited to small subsets of
knowledge within physical science or within earth and space sciences. After having tested the
Student Model empirically, we may be able to distinguish among students’ abilities to correctly
implement prespecified investigative procedures and to distinguish among students’ levels of
a limited domain of content knowledge. If the Student Model is not empirically supported, this
could be due to a number of reasons that include: (1) the SMVs may not have a strong enough
relationship to student proficiencies needed for the task; (2) there may be too many SMVs to be
measured accurately; (3) the task may be too highly scaffolded for the student sample, such
that there is little variation among student performances; (4) Task Model Variables not
connected to the Student Model, such as the verbal demand of the task, may cause
measurement error (in this case, these TMVs may serve as alternative hypotheses or
counterclaims to the warrant for the assessment argument); or (5) the Measurement Model is
misspecified.
Our reverse engineering work on Floating Pencil led us to consider the process of forward
engineering additional performance assessment tasks. Toward that end, we have begun to
draft an abstract template, a more generalized blueprint than a task specification, that could
result in the design of multiple new performance assessments for eliciting inquiry skills and
content knowledge. However, more development work is required to fine-tune the Evidence
Model, Student Model, Task Model, and underlying assessment argument for this template. As
this work comes to fruition, a task designer, with guidance from the PADI team, could use the
template to make a number of decisions about potential tasks that would include specifying
Task Model Variables (e.g., physical materials, verbal demand, level of content structure, level of
inquiry structure, and cognitive complexity), Student Model Variables (within a generalized
Student Model), the procedures for evaluating student Work Products, and options for the
psychometric models relating Observable Variables to Student Model Variables.
The use of the PADI design system to reverse engineer the Floating Pencil task resulted in the
creation of new knowledge about assessment, both general and specific, for our team. Since
the principles of ECD are “hard-wired” into the PADI design system, we were supported in
considering the coherence and linkages among the Task Model, Student Model, and Evidence
Model (see Brecht, Mislevy, Haertel, & Haynie, 2005). Reverse engineering the Floating Pencil
task not only contributed to our knowledge of the characteristics of one particular large-scale
performance assessment task, but shed light on how new science performance assessments
might be forward engineered. As our team conducts subsequent empirical analyses of Floating
Pencil data; adjusts Task, Evidence, and Student Models; refines the underlying assessment
34 Summary and Discussion
argument; and develops an abstract template for forward engineering science performance
assessment tasks, we will continue to contribute to the developing knowledge base of task
design through the principles of ECD.
References 35
References
Allen, N. L., Carlson, J. E., & Zelenak, C. A. (1999). The NAEP 1996 technical report (NCES 1999-452).
Washington, DC: National Center for Education Statistics.
Bass, K. M., Magone, M. E., & Glaser, R. (2002). Informing the design of performance assessments
using a content-process analysis of two NAEP science tasks (CSE Technical Report 564). Los
Angeles: National Center for Research on Evaluation, Standards, and Student Testing.
Baxter, G. P., Elder, A. D., & Glaser, R. (1996). Knowledge-based cognition and performance
assessment in the science classroom. Educational Psychologist, 31(2), 133-140.
Baxter, G. P., & Glaser, R. (1998). Investigating the cognitive complexity of science assessments.
Educational Issues and Practice, 17(1), 37-45.
Brecht, J., Mislevy, R., Haertel, G. D., & Haynie, K. C. (2005). The PADI design system as a complex of
epistemic forms and games. Paper presented at the annual meeting of the American
Educational Research Association, Montreal.
DeBarger, A., Yumoto, F., & Quellmalz, E. (2005). GLOBE: Using PADI templates as an alternative
structure for specifying GLOBE investigations and strategies. Paper presented at the annual
meeting of the American Educational Research Association, Montreal.
Gotwals, A. W., & Songer, N. B. (2006). Cognitive predictions: BioKIDS implementation of the PADI
assessment system (PADI Technical Report 10). Menlo Park, CA: SRI International.
IEEE-USA Board of Directors. (2003). Reverse engineering. Position paper of the Institute for
Electrical and Electronics Engineers, Inc., Washington, D.C.
Kennedy, C. (2005). Constructing PADI measurement models for the BEAR scoring engine (PADI
Technical Report 7). Menlo Park, CA: SRI International.
Linn, M. C., Songer, N. B., & Bat-Sheva, E. (1996). Shifts and convergences in science learning and
instruction. In D. Berliner & R. Calfee (Eds.), Handbook of educational psychology (pp. 15-46).
New York: Macmillan.
Messick, S. (1994). The interplay of evidence and consequences in the validation of
performance assessments. Educational Researcher, 23(2), 13-23.
Mislevy, R. J., Chudowsky, N., Draney, K., Fried, R., Gaffney, T., Haertel, G., et al. (2003). Design
patterns for assessing scientific inquiry (PADI Technical Report 1). Menlo Park, CA: SRI
International.
Mislevy, R. J., Steinberg, L. S., & Almond, R. G. (2002). On the structure of educational
assessments. Measurement: Interdisciplinary Research and Perspectives, 1, 3-67.
Mislevy, R. J., Steinberg, L. S., Almond, R. G., Haertel, G. D., & Penuel, W. (2003). Leverage points
for improving educational assessment (PADI Technical Report 2). Menlo Park, CA: SRI
International.
36 References
National Research Council. (1996). National science education standards. Washington, DC:
National Academy Press.
O’Sullivan, C. Y., Reese, C. M., & Mazzeo, J. (1997). NAEP 1996 science: Report card for the nation
and the states. Washington, DC: National Center for Education Statistics.
Quellmalz, E. S., Haertel, G. D., Lash, A. L., Javitz, H., Haydel, A., Colker, A. M., et al. (2004, April).
Evaluating students’ opportunities to learn the science content and inquiry skills measured in large
scale assessments. Paper presented at the annual meeting of the American Educational
Research Association, Chicago, IL.
Quellmalz, E., & Haydel, A. M. (2003, April). Using cognitive analyses to describe students’ science
inquiry and motivation to learn. Paper presented at the annual meeting of the American
Educational Research Association, Chicago, IL.
Quellmalz, E., & Kreikemeier, P. (2002). Validities of science inquiry assessments: A study of the
alignment of items and tasks drawn from science reference exams with the National Science
Education Standards. Paper presented at the annual meeting of the American Educational
Research Association, New Orleans.
Riconscente, M., Mislevy, R. J., Hamel, L., & PADI Research Group. (2005). An introduction to PADI
task templates (PADI Technical Report 3). Menlo Park, CA: SRI International.
Schank, P., & Hamel, L. (2004, November). Collaborative modeling: Hiding ULM and promoting
data examples in EMo. Presented at the Computer-Supported Collaborative Work Conference,
Chicago.
Shavelson, R., & Ruiz-Primo, M. (1998). On the assessment of science achievement: Conceptual
underpinnings for the design of performance assessment (CSE Technical Report 491). Los Angeles:
National Center for Research on Evaluation, Standards, and Student Testing.
Shepard, L., Flexer, R., Hiebert, E., Marion, S., Mayfield, V., & Weston, T. (1995). Effects of
introducing classroom performance assessments on student learning (CSE Technical Report 394).
Los Angeles: National Center for Research on Evaluation, Standards, and Student Testing.
Timms, M., & Kennedy, C. (2005). FOSS: Using PADI to develop an on-line self-assessment system
that supports student science learning. Paper presented at the annual meeting of the American
Educational Research Association, Montreal.
A P P E N D I X A
Test Booklet for NAEP Floating Pencil
38 Appendix A—Test Booklet for NAEP Floating Pencil
Appendix A—Test Booklet for NAEP Floating Pencil
Middle School Science Test
“Floating Pencil”
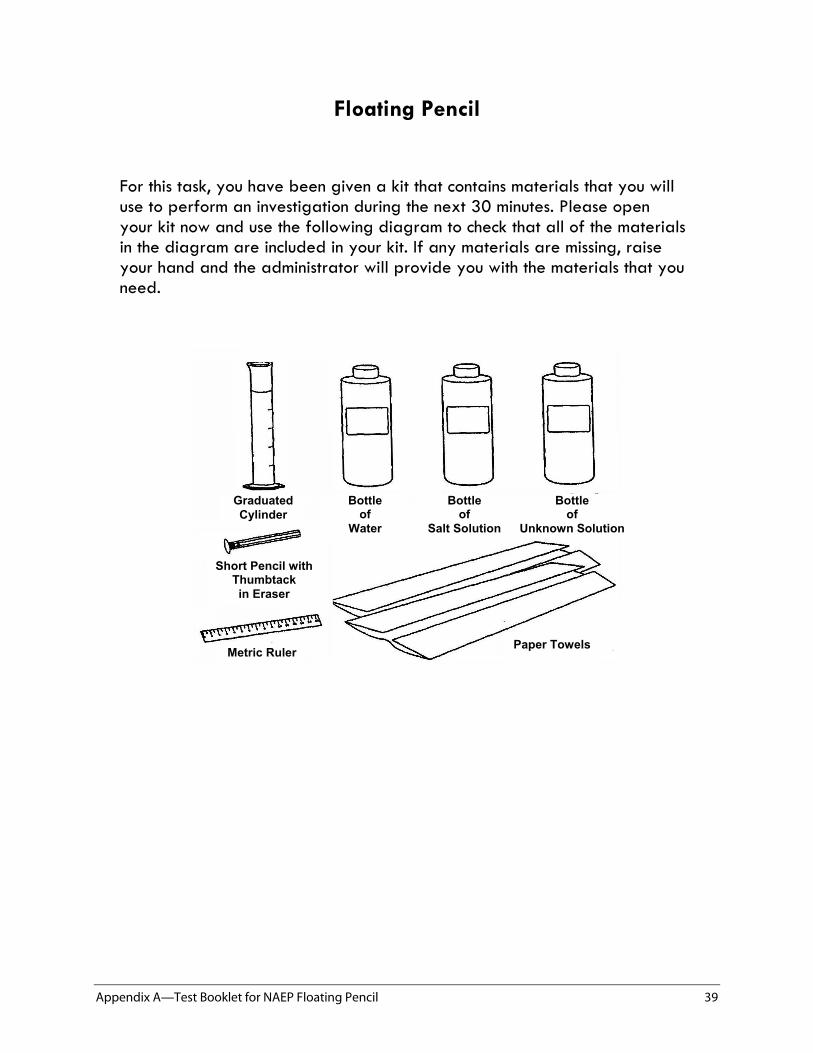
Appendix A—Test Booklet for NAEP Floating Pencil 39
Floating Pencil
For this task, you have been given a kit that contains materials that you will use to perform an investigation during the next 30 minutes. Please open your kit now and use the following diagram to check that all of the materials in the diagram are included in your kit. If any materials are missing, raise your hand and the administrator will provide you with the materials that you need.
Bottleof
Water
Graduated Cylinder
Bottleof
Salt Solution
Bottle of
Unknown Solution
Short Pencil with Thumbtack in Eraser
Metric Ruler Paper Towels
40 Appendix A—Test Booklet for NAEP Floating Pencil
Every body of water in natural ecosystems has salts and other substances dissolved in it. The concentration of dissolved salt varies from less than 0.2 percent in most freshwater streams and lakes to about 3.5 percent in most of the world’s oceans. In this task, you will observe and measure how much of the length of a pencil floats above the water surface in water with very low salt concentration and in water with very high salt concentration. You will then use the same procedures to estimate the salt concentration of an unknown solution. Follow the directions step-by-step and write your answers to the questions in the space provided in your booklet.
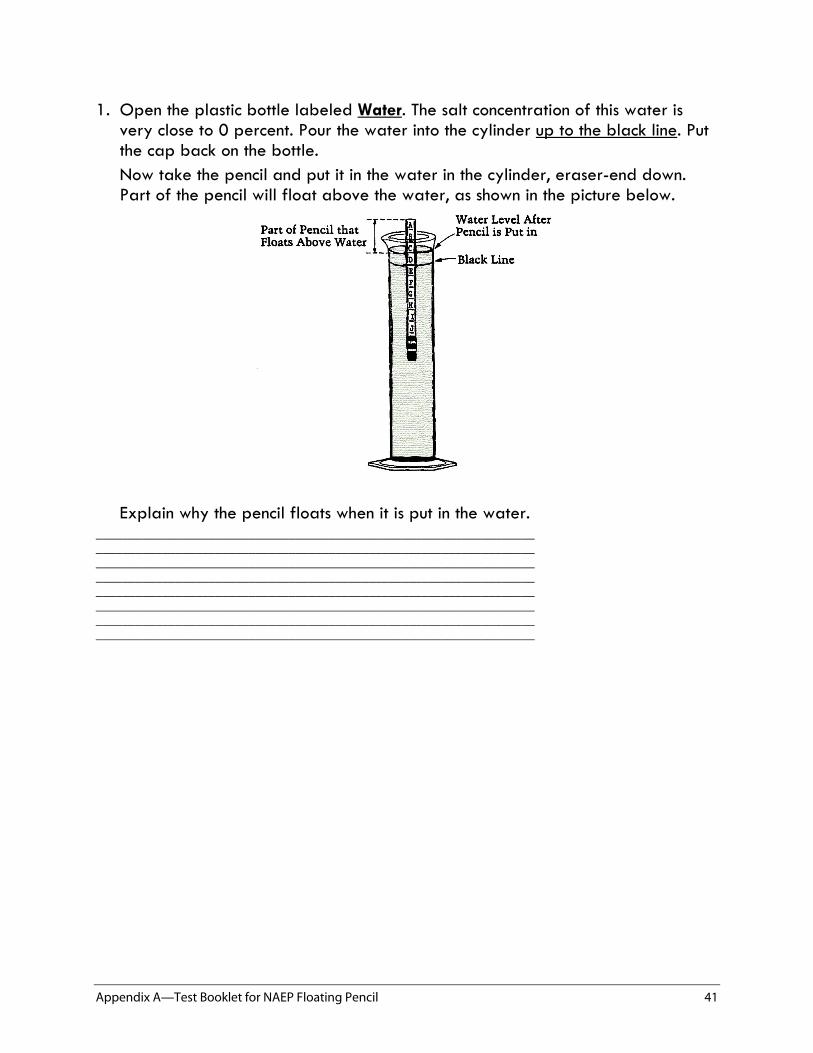
Appendix A—Test Booklet for NAEP Floating Pencil 41
1. Open the plastic bottle labeled Water. The salt concentration of this water is very close to 0 percent. Pour the water into the cylinder up to the black line. Put the cap back on the bottle. Now take the pencil and put it in the water in the cylinder, eraser-end down. Part of the pencil will float above the water, as shown in the picture below.
Explain why the pencil floats when it is put in the water. __________________________________________________________________ __________________________________________________________________ __________________________________________________________________ __________________________________________________________________ __________________________________________________________________ __________________________________________________________________ __________________________________________________________________ __________________________________________________________________
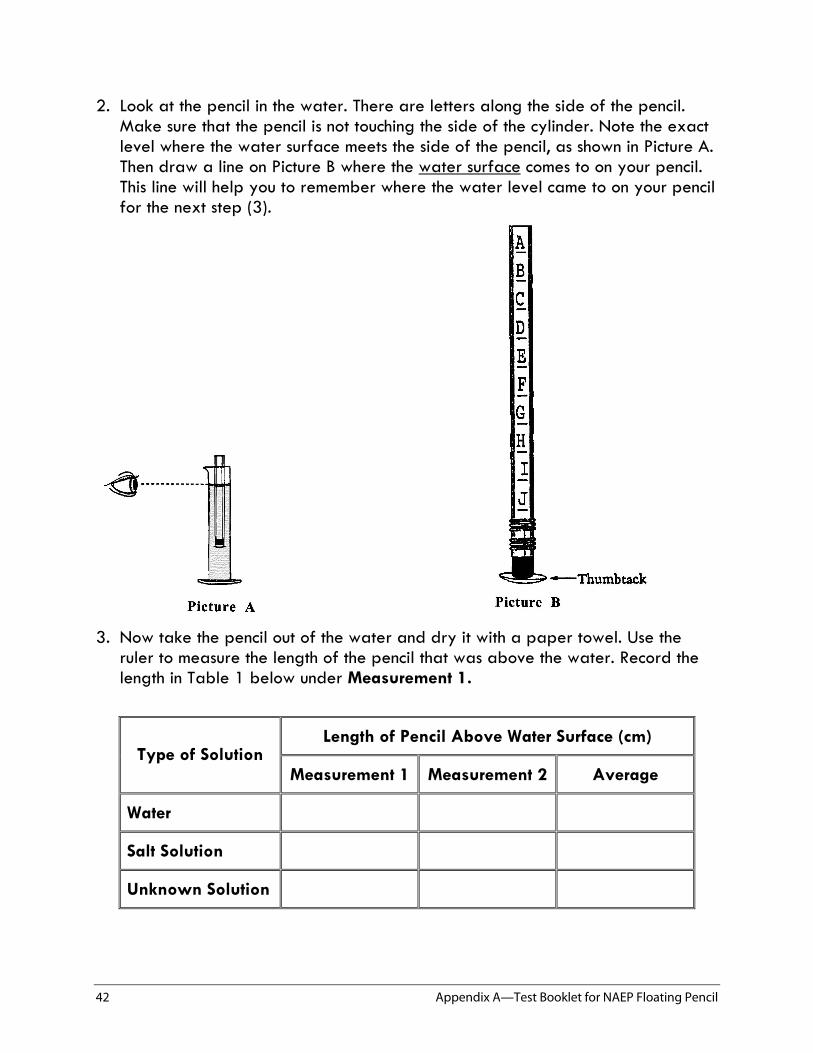
42 Appendix A—Test Booklet for NAEP Floating Pencil
2. Look at the pencil in the water. There are letters along the side of the pencil. Make sure that the pencil is not touching the side of the cylinder. Note the exact level where the water surface meets the side of the pencil, as shown in Picture A. Then draw a line on Picture B where the water surface comes to on your pencil. This line will help you to remember where the water level came to on your pencil for the next step (3).
3. Now take the pencil out of the water and dry it with a paper towel. Use the
ruler to measure the length of the pencil that was above the water. Record the length in Table 1 below under Measurement 1.
Length of Pencil Above Water Surface (cm) Type of Solution
Measurement 1 Measurement 2 Average
Water
Salt Solution
Unknown Solution
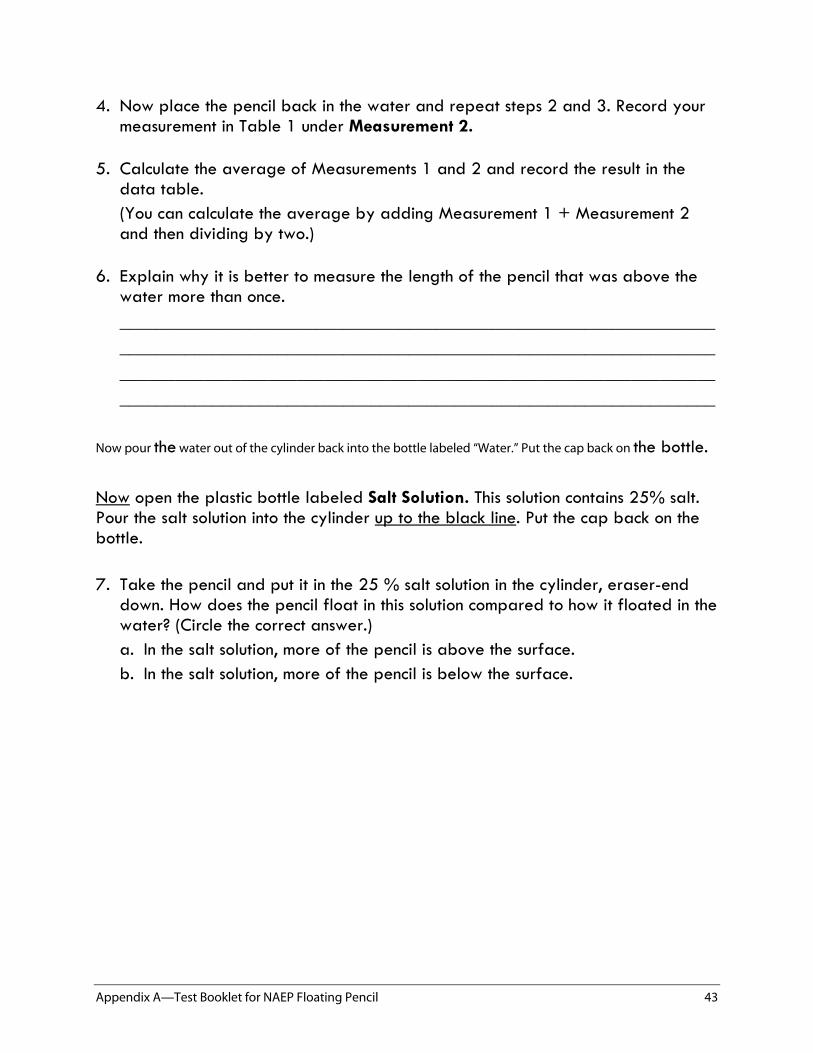
Appendix A—Test Booklet for NAEP Floating Pencil 43
4. Now place the pencil back in the water and repeat steps 2 and 3. Record your measurement in Table 1 under Measurement 2.
5. Calculate the average of Measurements 1 and 2 and record the result in the data table. (You can calculate the average by adding Measurement 1 + Measurement 2 and then dividing by two.)
6. Explain why it is better to measure the length of the pencil that was above the water more than once. ________________________________________________________________ ________________________________________________________________ ________________________________________________________________ ________________________________________________________________
Now pour the water out of the cylinder back into the bottle labeled “Water.” Put the cap back on the bottle.
Now open the plastic bottle labeled Salt Solution. This solution contains 25% salt. Pour the salt solution into the cylinder up to the black line. Put the cap back on the bottle.
7. Take the pencil and put it in the 25 % salt solution in the cylinder, eraser-end down. How does the pencil float in this solution compared to how it floated in the water? (Circle the correct answer.) a. In the salt solution, more of the pencil is above the surface. b. In the salt solution, more of the pencil is below the surface.
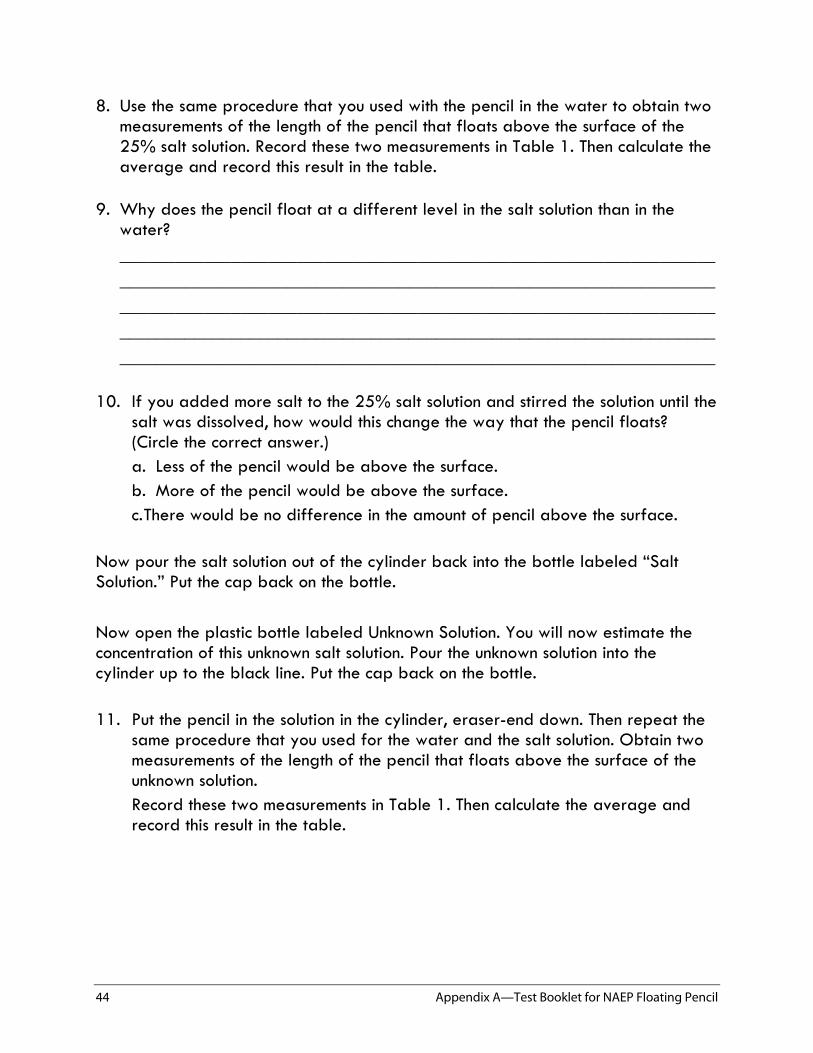
44 Appendix A—Test Booklet for NAEP Floating Pencil
8. Use the same procedure that you used with the pencil in the water to obtain two measurements of the length of the pencil that floats above the surface of the 25% salt solution. Record these two measurements in Table 1. Then calculate the average and record this result in the table.
9. Why does the pencil float at a different level in the salt solution than in the water? ________________________________________________________________ ________________________________________________________________ ________________________________________________________________ ________________________________________________________________ ________________________________________________________________
10. If you added more salt to the 25% salt solution and stirred the solution until the salt was dissolved, how would this change the way that the pencil floats? (Circle the correct answer.) a. Less of the pencil would be above the surface. b. More of the pencil would be above the surface. c. There would be no difference in the amount of pencil above the surface.
Now pour the salt solution out of the cylinder back into the bottle labeled “Salt Solution.” Put the cap back on the bottle.
Now open the plastic bottle labeled Unknown Solution. You will now estimate the concentration of this unknown salt solution. Pour the unknown solution into the cylinder up to the black line. Put the cap back on the bottle.
11. Put the pencil in the solution in the cylinder, eraser-end down. Then repeat the same procedure that you used for the water and the salt solution. Obtain two measurements of the length of the pencil that floats above the surface of the unknown solution. Record these two measurements in Table 1. Then calculate the average and record this result in the table.
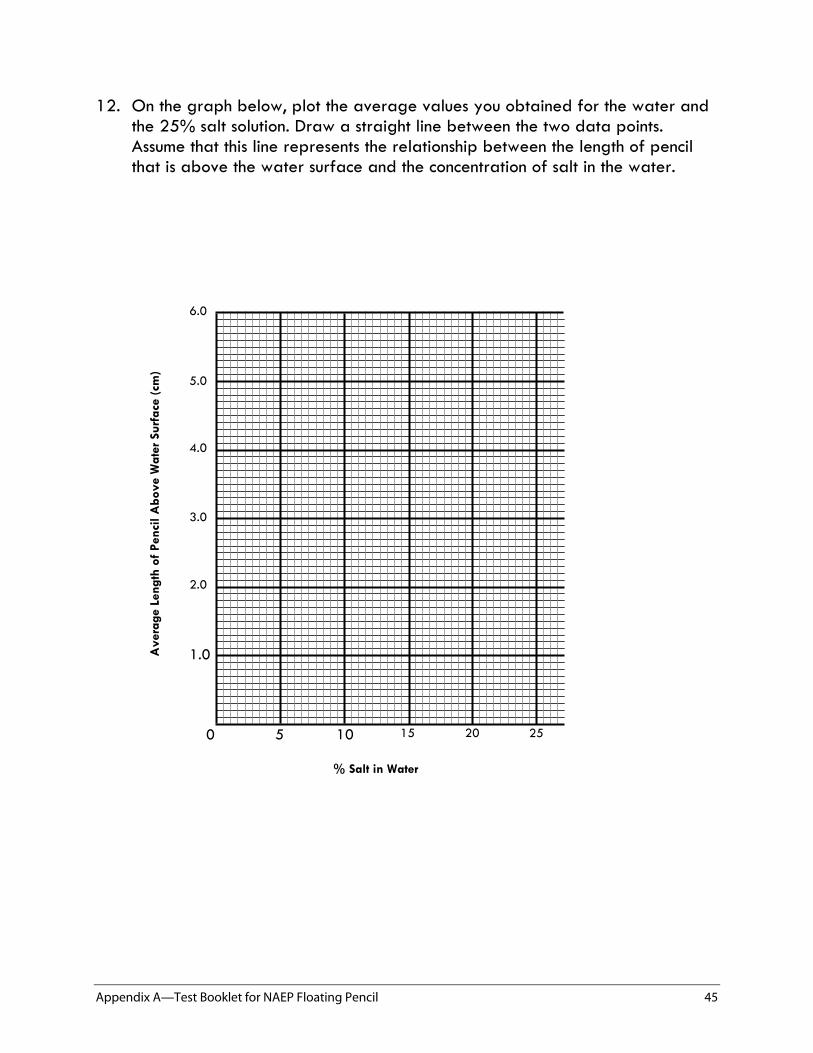
Appendix A—Test Booklet for NAEP Floating Pencil 45
12. On the graph below, plot the average values you obtained for the water and the 25% salt solution. Draw a straight line between the two data points. Assume that this line represents the relationship between the length of pencil that is above the water surface and the concentration of salt in the water.
6.0
5.0
4.0
3.0
2.0
1.0
0 5 10 25 15 20
% Salt in Water
Ave
rage
Len
gth
of P
enci
l Abo
ve W
ater
Sur
face
(cm
)
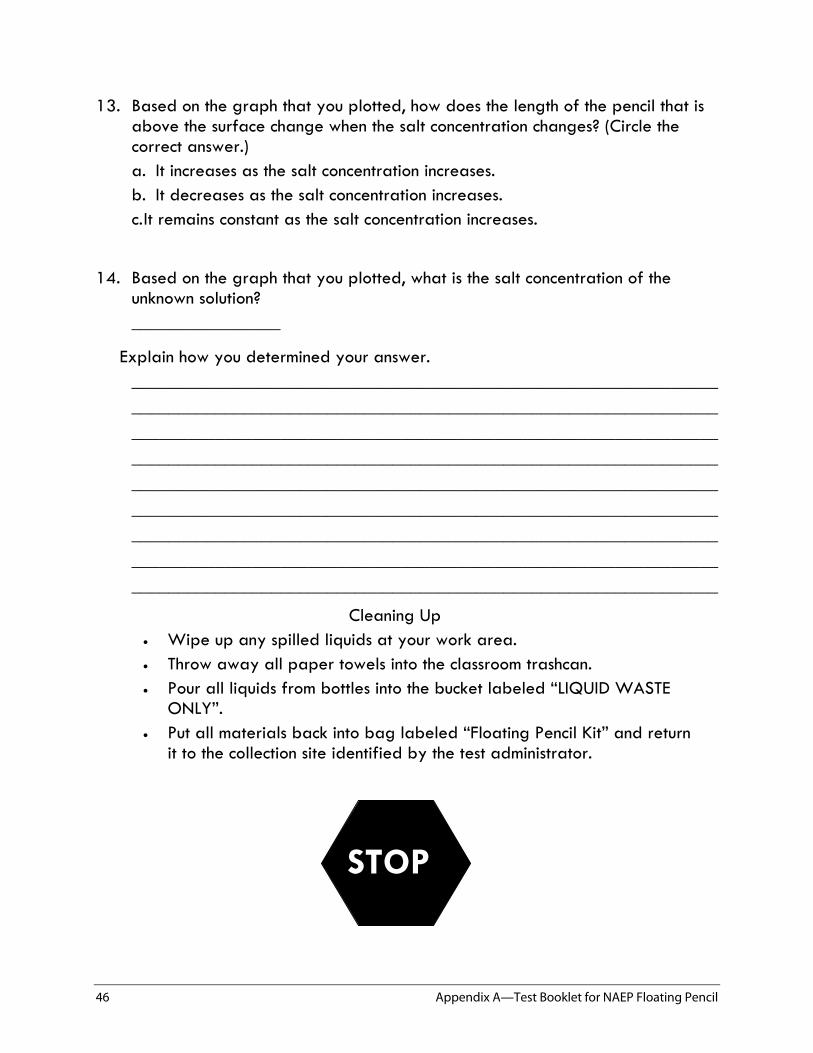
46 Appendix A—Test Booklet for NAEP Floating Pencil
13. Based on the graph that you plotted, how does the length of the pencil that is above the surface change when the salt concentration changes? (Circle the correct answer.) a. It increases as the salt concentration increases. b. It decreases as the salt concentration increases. c. It remains constant as the salt concentration increases.
14. Based on the graph that you plotted, what is the salt concentration of the unknown solution? ________________
Explain how you determined your answer. _______________________________________________________________ _______________________________________________________________ _______________________________________________________________ _______________________________________________________________ _______________________________________________________________ _______________________________________________________________ _______________________________________________________________ _______________________________________________________________ _______________________________________________________________
Cleaning Up • Wipe up any spilled liquids at your work area. • Throw away all paper towels into the classroom trashcan. • Pour all liquids from bottles into the bucket labeled “LIQUID WASTE
ONLY”. • Put all materials back into bag labeled “Floating Pencil Kit” and return
it to the collection site identified by the test administrator.
STOP
A P P E N D I X B
Floating Pencil Task Specification Summary Page
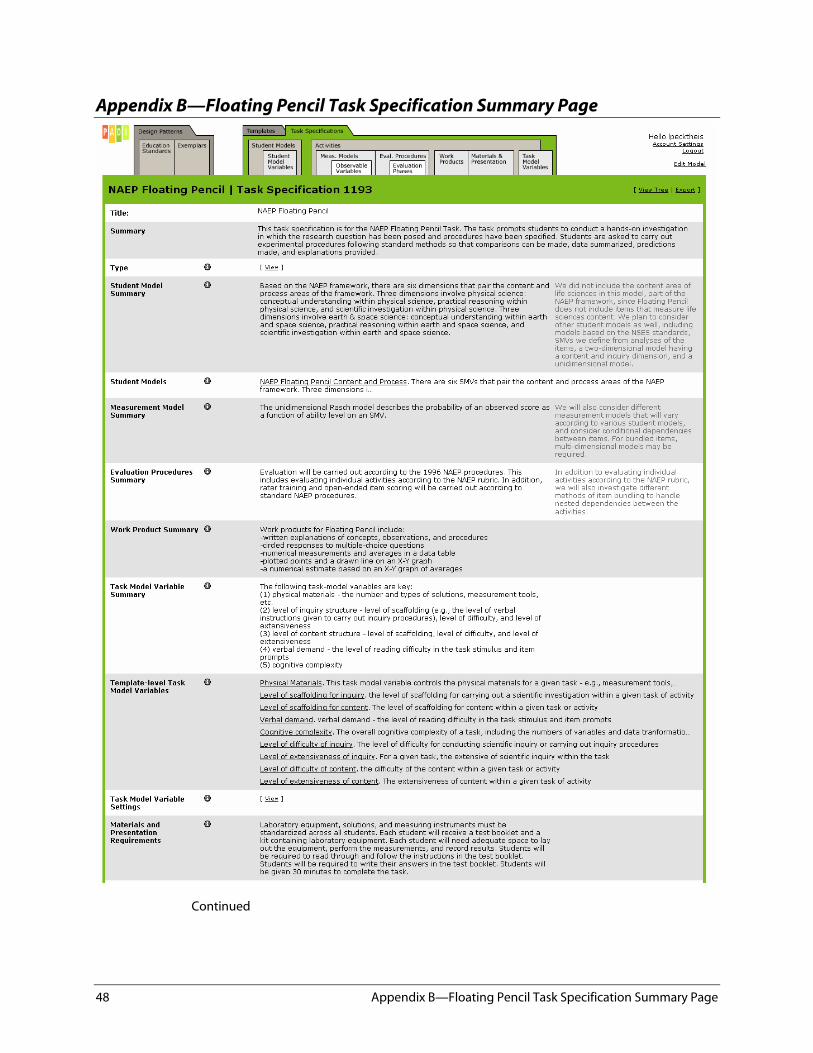
48 Appendix B—Floating Pencil Task Specification Summary Page
Appendix B—Floating Pencil Task Specification Summary Page
Continued
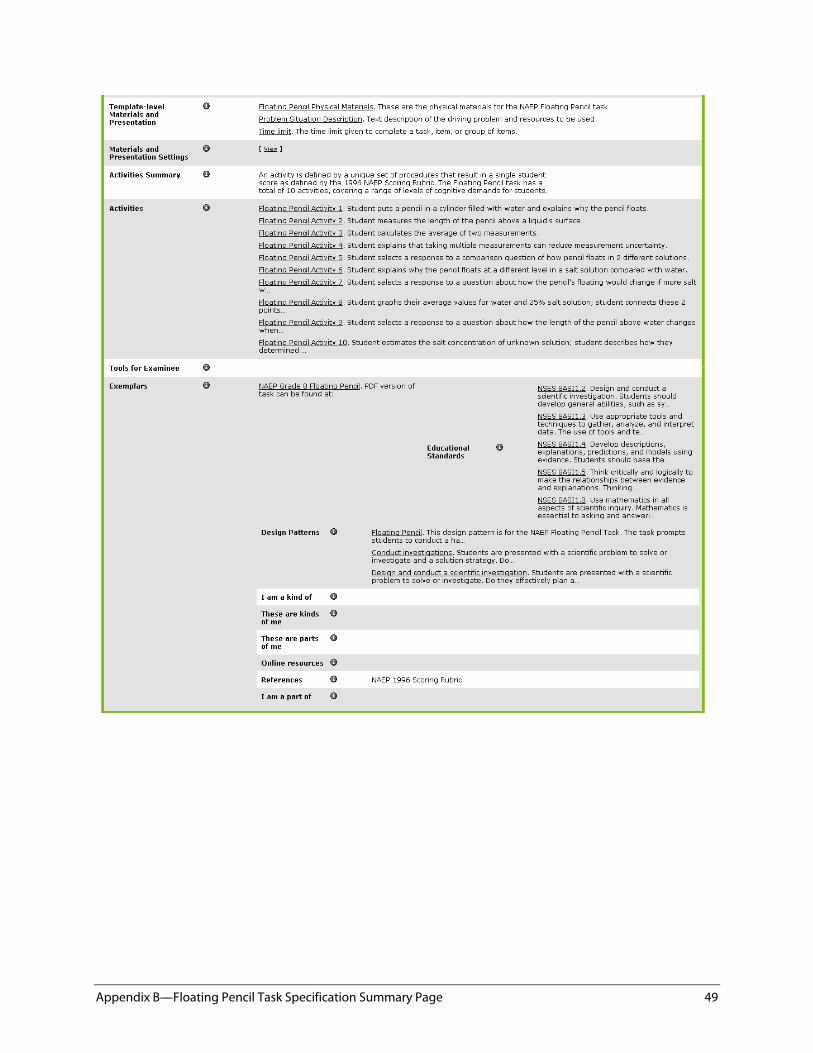
Appendix B—Floating Pencil Task Specification Summary Page 49


SponsorThe National Science Foundation, Grant REC-0129331
Prime GranteeSRI International. Center for Technology in Learning
SubgranteesUniversity of Maryland
University of California, Berkeley. Berkeley Evaluation & Assessment Research (BEAR) Center and The Full Option Science System (FOSS)
University of Michigan. BioKIDs
P A D I
M I C H I G A NM I C H I G A N