Embed Size (px)
Citation preview
In the format provided by the authors and unedited.
© 2017 Macmillan Publishers Limited, part of Springer Nature. All rights reserved.
Page 1 of 32
Supplementary Materials
Reversible Multielectron Redox Chemistry of π-Conjugated N-containing
Heteroaromatic Molecule-based Organic Cathodes
Chengxin Peng,1† Guo-Hong Ning,1† Jie Su,1† Guiming Zhong,2 Wei Tang,1
Bingbing Tian,1 Chenliang Su,1 Dingyi Yu,1 Lianhai Zu5, Jinhu Yang,5 Man-Fai Ng,3
Yong-Sheng Hu,4 Yong Yang,2* Michel Armand,4 and Kian Ping Loh,1*
1 Department of Chemistry, Centre for Advanced 2D Materials and Graphene Research Centre, National
University of Singapore, 3 Science Drive 3, Singapore 117543
2 State Key Laboratory of Physical Chemistry of Solid Surfaces, Department of Chemistry, College of Chemistry
and Chemical Engineering, Collaborative Innovation Center of Chemistry for Energy Materials (iChEM),
Xiamen University, Xiamen 361005, China
3 Institute of High Performance Computing, Agency for Science, Technology and Research, 1 Fusionopolis Way,
#16-16 Connexis, Singapore 138632
4 Key Laboratory for Renewable Energy, Beijing Key Laboratory for New Energy Materials and Devices, Beijing
National Laboratory for Condensed Matter Physics, Institute of Physics, Chinese Academy of Sciences, School of
Physical Sciences, University of Chinese Academy of Sciences, Beijing 100190, China
5 Department of Chemistry, Tongji University, Siping Road 1239, Shanghai 200092, P. R. China
*Corresponding authors: Yong Yang (Y. Yang); Kian Ping Loh (K. Loh)
Email addresses: [email protected]; [email protected]
Reversible multi-electron redox chemistry of π-conjugated N-containing heteroaromatic
molecule-based organic cathodes
SUPPLEMENTARY INFORMATIONVOLUME: 2 | ARTICLE NUMBER: 17074
NATURE ENERGY | DOI: 10.1038/nenergy.2017.74 | www.nature.com/natureenergy 1
© 2017 Macmillan Publishers Limited, part of Springer Nature. All rights reserved.
Page 2 of 32
Supplementary Figures
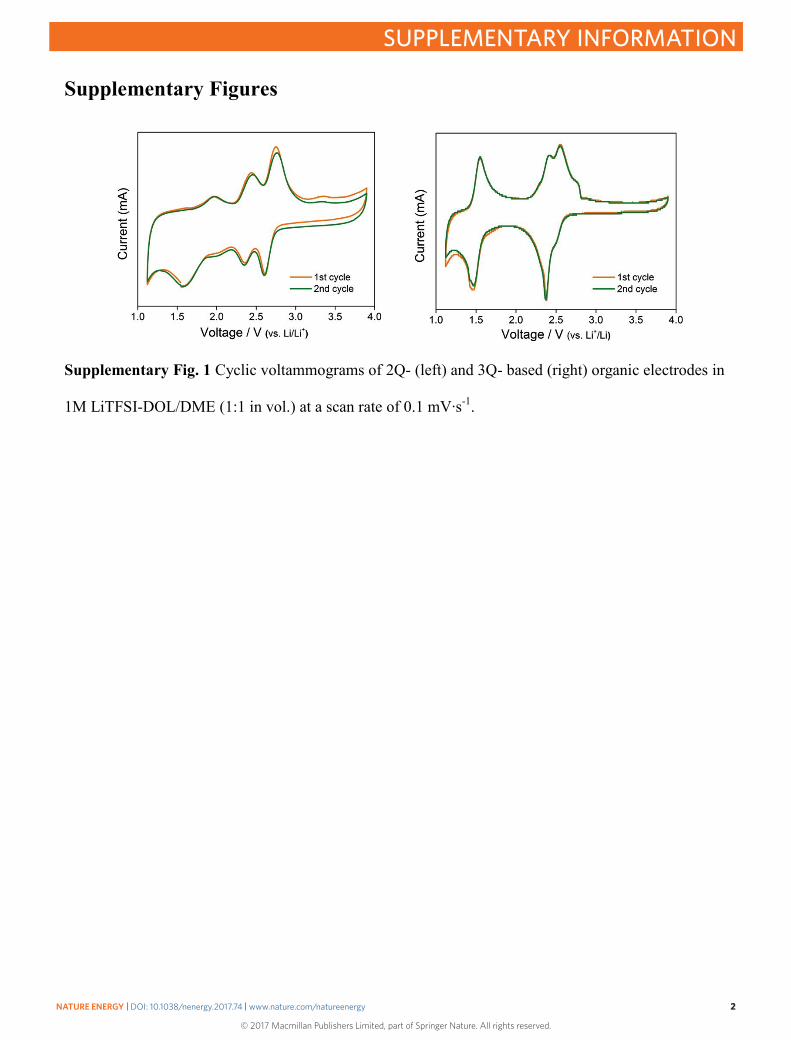
Supplementary Fig. 1 Cyclic voltammograms of 2Q- (left) and 3Q- based (right) organic electrodes in
1M LiTFSI-DOL/DME (1:1 in vol.) at a scan rate of 0.1 mV∙s-1.
NATURE ENERGY | DOI: 10.1038/nenergy.2017.74 | www.nature.com/natureenergy 2
SUPPLEMENTARY INFORMATION
© 2017 Macmillan Publishers Limited, part of Springer Nature. All rights reserved.
Page 3 of 32
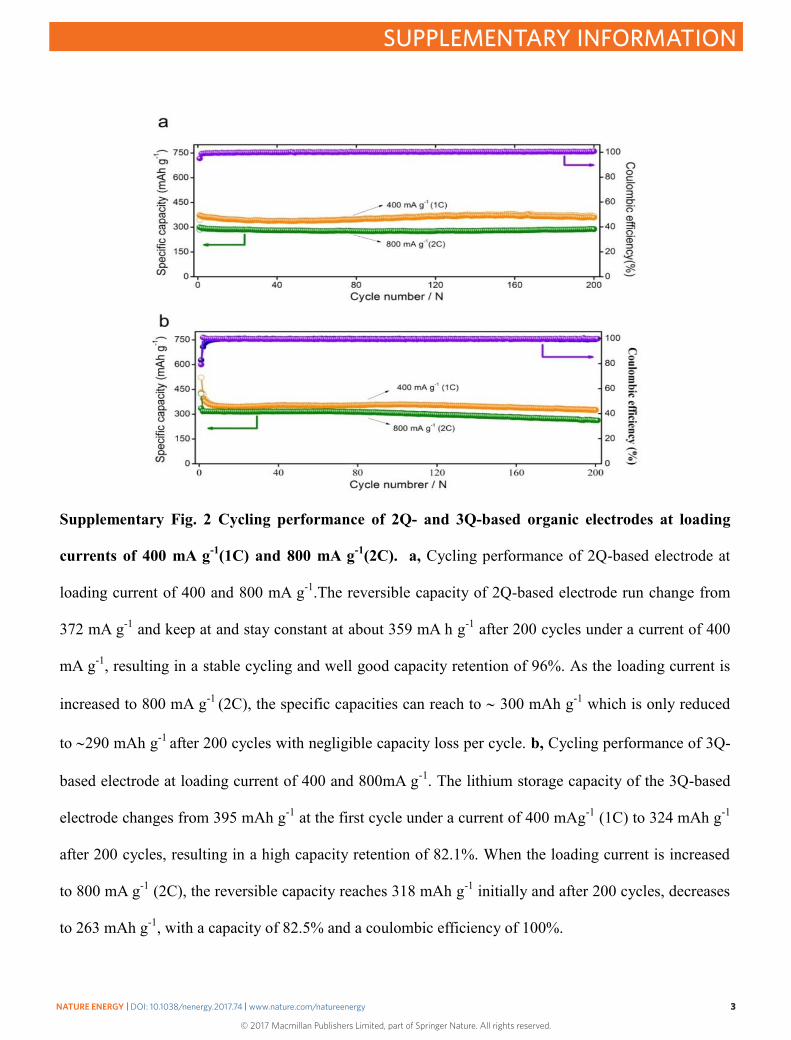
Supplementary Fig. 2 Cycling performance of 2Q- and 3Q-based organic electrodes at loading
currents of 400 mA g-1(1C) and 800 mA g-1(2C). a, Cycling performance of 2Q-based electrode at
loading current of 400 and 800 mA g-1.The reversible capacity of 2Q-based electrode run change from
372 mA g-1 and keep at and stay constant at about 359 mA h g-1 after 200 cycles under a current of 400
mA g-1, resulting in a stable cycling and well good capacity retention of 96%. As the loading current is
increased to 800 mA g-1 (2C), the specific capacities can reach to 300 mAh g-1 which is only reduced
to 290 mAh g-1 after 200 cycles with negligible capacity loss per cycle. b, Cycling performance of 3Q-
based electrode at loading current of 400 and 800mA g-1. The lithium storage capacity of the 3Q-based
electrode changes from 395 mAh g-1 at the first cycle under a current of 400 mAg-1 (1C) to 324 mAh g-1
after 200 cycles, resulting in a high capacity retention of 82.1%. When the loading current is increased
to 800 mA g-1 (2C), the reversible capacity reaches 318 mAh g-1 initially and after 200 cycles, decreases
to 263 mAh g-1, with a capacity of 82.5% and a coulombic efficiency of 100%.
NATURE ENERGY | DOI: 10.1038/nenergy.2017.74 | www.nature.com/natureenergy 3
SUPPLEMENTARY INFORMATION
© 2017 Macmillan Publishers Limited, part of Springer Nature. All rights reserved.
Page 4 of 32
0 5 10 15 200
100
200
300
Ener
gy d
ensi
ty (W
h K
g-1)
Current (C)
3Q 2Q
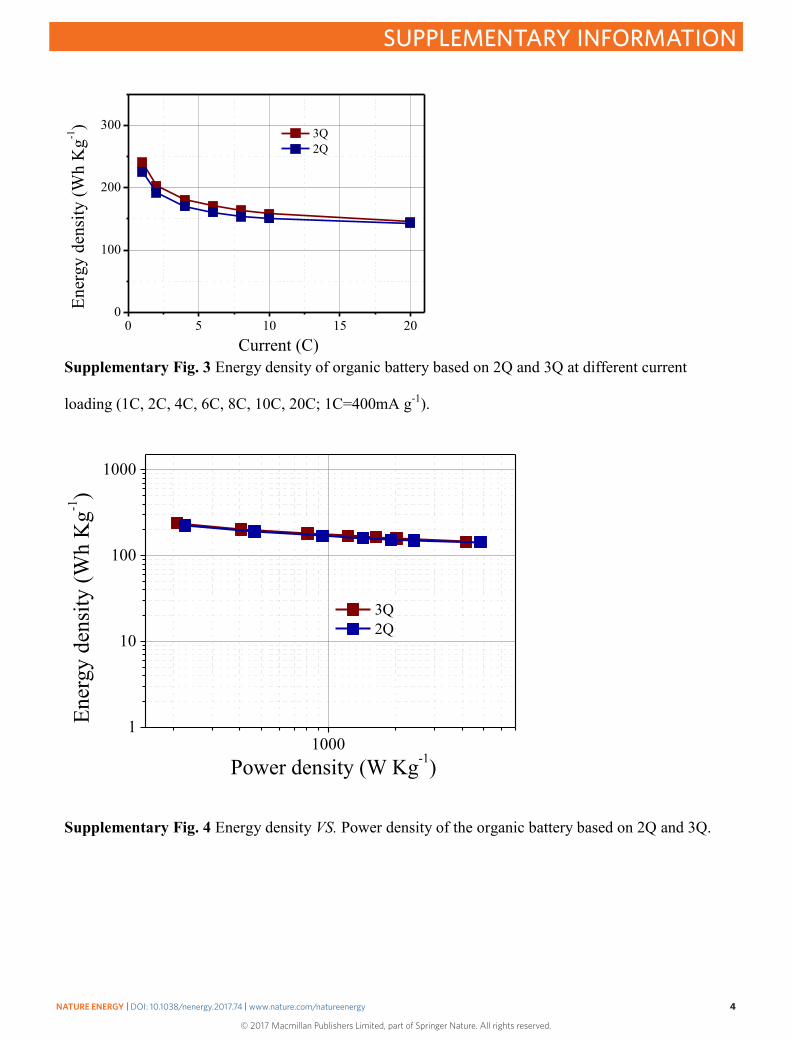
Supplementary Fig. 3 Energy density of organic battery based on 2Q and 3Q at different current
loading (1C, 2C, 4C, 6C, 8C, 10C, 20C; 1C=400mA g-1).
10001
10
100
1000
Ener
gy d
ensi
ty (W
h K
g-1)
Power density (W Kg-1)
3Q 2Q
Supplementary Fig. 4 Energy density VS. Power density of the organic battery based on 2Q and 3Q.
NATURE ENERGY | DOI: 10.1038/nenergy.2017.74 | www.nature.com/natureenergy 4
SUPPLEMENTARY INFORMATION
© 2017 Macmillan Publishers Limited, part of Springer Nature. All rights reserved.
Page 5 of 32
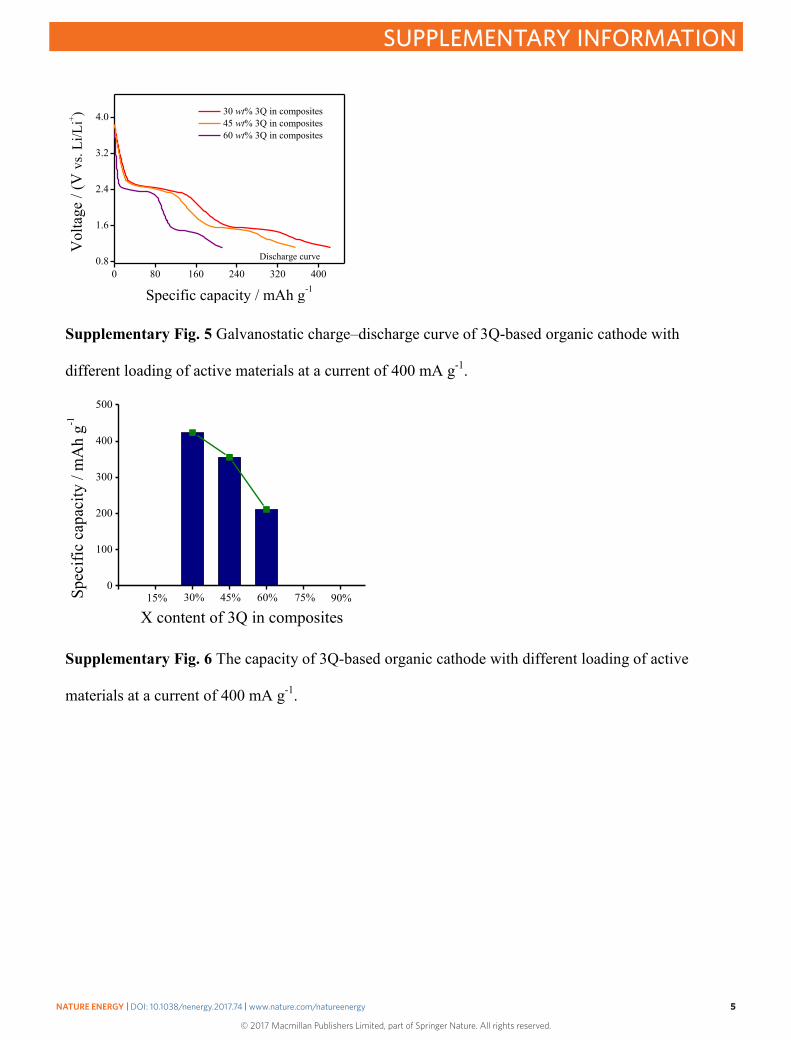
Supplementary Fig. 5 Galvanostatic charge–discharge curve of 3Q-based organic cathode with
different loading of active materials at a current of 400 mA g-1.
Supplementary Fig. 6 The capacity of 3Q-based organic cathode with different loading of active
materials at a current of 400 mA g-1.
0 80 160 240 320 4000.8
1.6
2.4
3.2
4.0 30 wt% 3Q in composites 45 wt% 3Q in composites 60 wt% 3Q in composites
V
olta
ge /
(V v
s. Li
/Li+ )
Specific capacity / mAh g-1
Discharge curve
0
100
200
300
400
500
90%75%60%45%30%Spec
ific
capa
city
/ m
Ah
g-1
X content of 3Q in composites15%
NATURE ENERGY | DOI: 10.1038/nenergy.2017.74 | www.nature.com/natureenergy 5
SUPPLEMENTARY INFORMATION
© 2017 Macmillan Publishers Limited, part of Springer Nature. All rights reserved.
Page 6 of 32
0 10 20 30 40 500
100
200
300
400
500
Discharge Charge
Spe
cific
cap
acity
/ m
Ah
g-1
Cycle number / N
Current: 400 mA g-1
0
20
40
60
80
100
Coulombic efficiency
Coulom
bic efficiency (%)
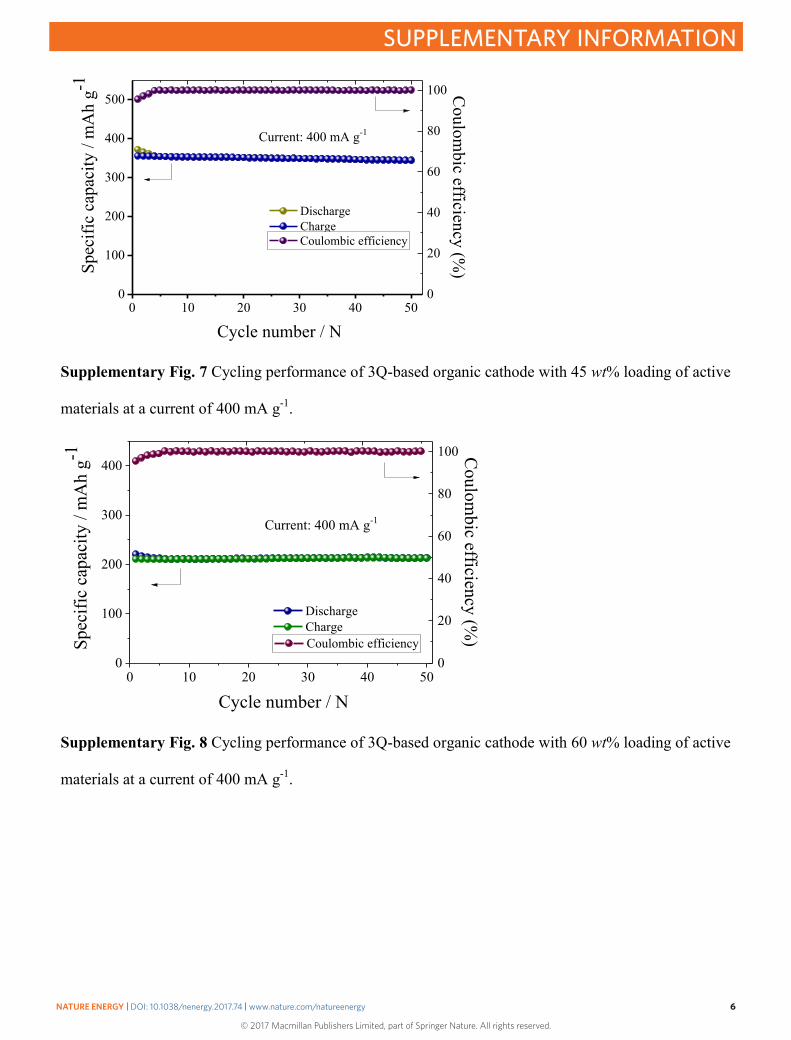
Supplementary Fig. 7 Cycling performance of 3Q-based organic cathode with 45 wt% loading of active
materials at a current of 400 mA g-1.
0 10 20 30 40 500
100
200
300
400
Spe
cific
cap
acity
/ m
Ah
g-1
Cycle number / N
Discharge Charge
0
20
40
60
80
100
Coulombic efficiency
Current: 400 mA g-1
Coulom
bic efficiency (%)
Supplementary Fig. 8 Cycling performance of 3Q-based organic cathode with 60 wt% loading of active
materials at a current of 400 mA g-1.
NATURE ENERGY | DOI: 10.1038/nenergy.2017.74 | www.nature.com/natureenergy 6
SUPPLEMENTARY INFORMATION
© 2017 Macmillan Publishers Limited, part of Springer Nature. All rights reserved.
Page 7 of 32
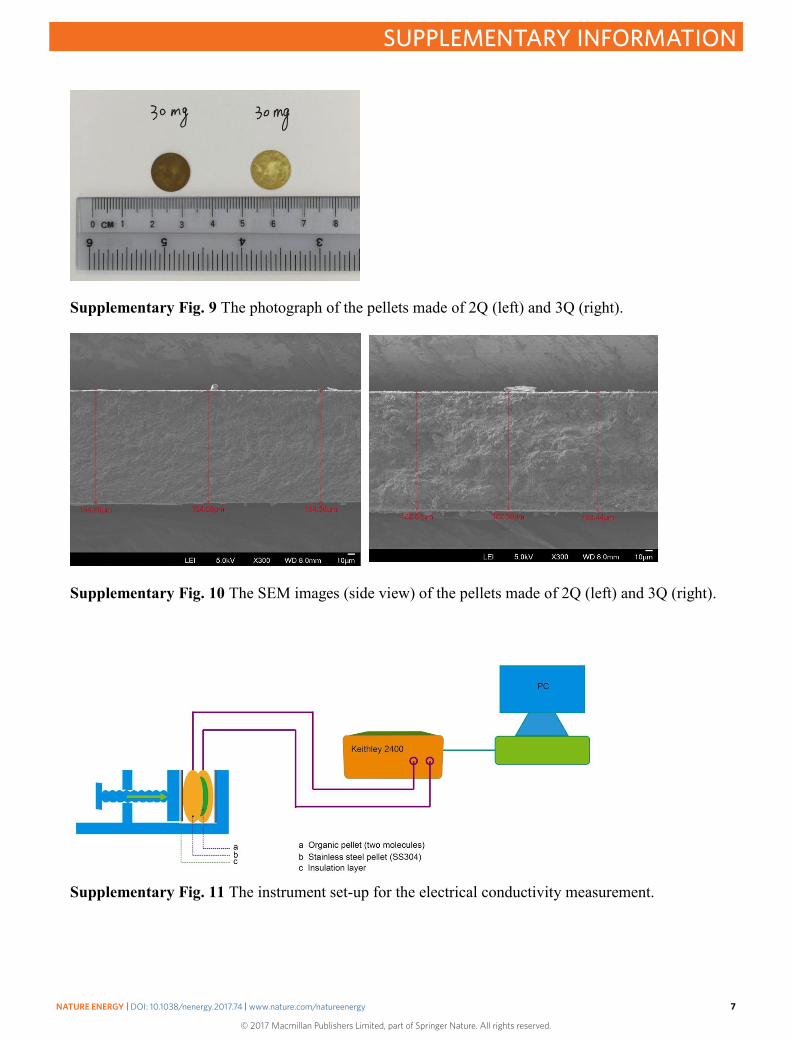
Supplementary Fig. 9 The photograph of the pellets made of 2Q (left) and 3Q (right).
Supplementary Fig. 10 The SEM images (side view) of the pellets made of 2Q (left) and 3Q (right).
Supplementary Fig. 11 The instrument set-up for the electrical conductivity measurement.
NATURE ENERGY | DOI: 10.1038/nenergy.2017.74 | www.nature.com/natureenergy 7
SUPPLEMENTARY INFORMATION
© 2017 Macmillan Publishers Limited, part of Springer Nature. All rights reserved.
Page 8 of 32
-40.0 -20.0 0.0 20.0 40.0
-1.0x10⁻¹⁰
-5.0x10⁻¹¹
0.0
5.0x10⁻¹¹
1.0x10⁻¹⁰
Cur
rent
/ A
Voltage / V
y = a + b*xslope b = 1.83826*10-12
R-square: 0.98789
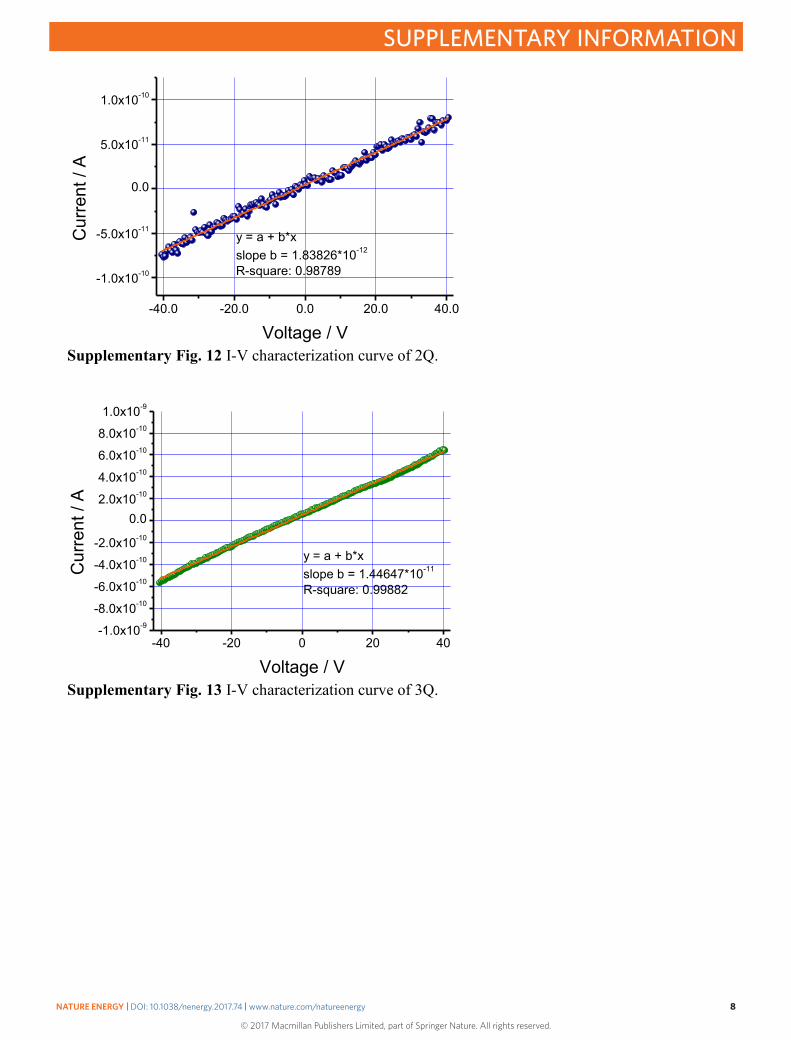
Supplementary Fig. 12 I-V characterization curve of 2Q.
-40 -20 0 20 40-1.0x10⁻⁹
-8.0x10⁻¹⁰
-6.0x10⁻¹⁰
-4.0x10⁻¹⁰
-2.0x10⁻¹⁰
0.02.0x10-10
4.0x10⁻¹⁰
6.0x10⁻¹⁰
8.0x10⁻¹⁰
1.0x10⁻⁹
Cur
rent
/ A
Voltage / V
y = a + b*xslope b = 1.44647*10-11
R-square: 0.99882
Supplementary Fig. 13 I-V characterization curve of 3Q.
NATURE ENERGY | DOI: 10.1038/nenergy.2017.74 | www.nature.com/natureenergy 8
SUPPLEMENTARY INFORMATION
© 2017 Macmillan Publishers Limited, part of Springer Nature. All rights reserved.
Page 9 of 32
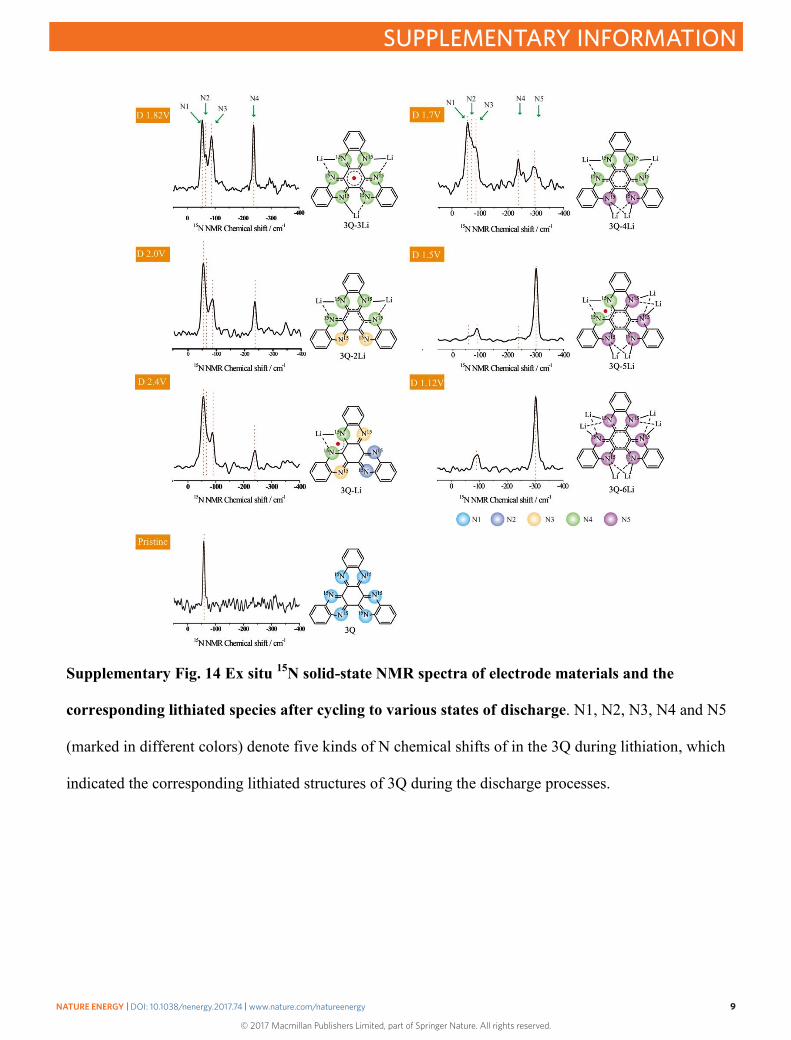
Supplementary Fig. 14 Ex situ 15N solid-state NMR spectra of electrode materials and the
corresponding lithiated species after cycling to various states of discharge. N1, N2, N3, N4 and N5
(marked in different colors) denote five kinds of N chemical shifts of in the 3Q during lithiation, which
indicated the corresponding lithiated structures of 3Q during the discharge processes.
NATURE ENERGY | DOI: 10.1038/nenergy.2017.74 | www.nature.com/natureenergy 9
SUPPLEMENTARY INFORMATION
© 2017 Macmillan Publishers Limited, part of Springer Nature. All rights reserved.
Page 10 of 32
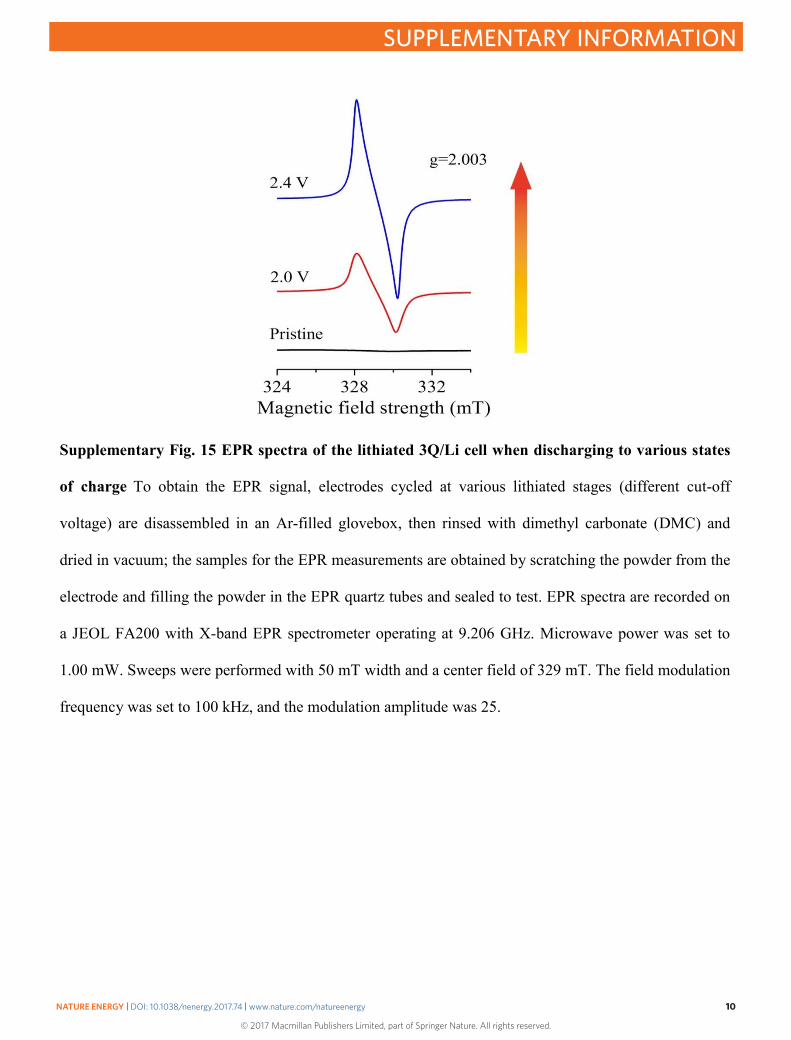
Supplementary Fig. 15 EPR spectra of the lithiated 3Q/Li cell when discharging to various states
of charge To obtain the EPR signal, electrodes cycled at various lithiated stages (different cut-off
voltage) are disassembled in an Ar-filled glovebox, then rinsed with dimethyl carbonate (DMC) and
dried in vacuum; the samples for the EPR measurements are obtained by scratching the powder from the
electrode and filling the powder in the EPR quartz tubes and sealed to test. EPR spectra are recorded on
a JEOL FA200 with X-band EPR spectrometer operating at 9.206 GHz. Microwave power was set to
1.00 mW. Sweeps were performed with 50 mT width and a center field of 329 mT. The field modulation
frequency was set to 100 kHz, and the modulation amplitude was 25.
NATURE ENERGY | DOI: 10.1038/nenergy.2017.74 | www.nature.com/natureenergy 10
SUPPLEMENTARY INFORMATION
© 2017 Macmillan Publishers Limited, part of Springer Nature. All rights reserved.
Page 11 of 32
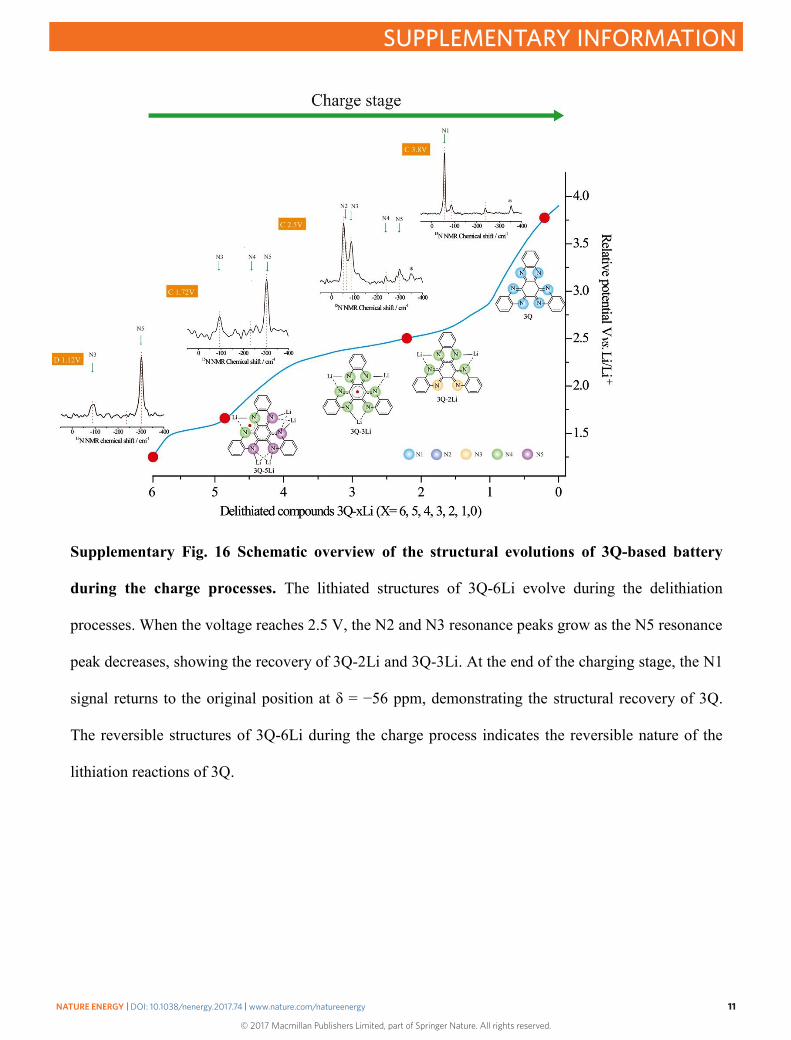
Supplementary Fig. 16 Schematic overview of the structural evolutions of 3Q-based battery
during the charge processes. The lithiated structures of 3Q-6Li evolve during the delithiation
processes. When the voltage reaches 2.5 V, the N2 and N3 resonance peaks grow as the N5 resonance
peak decreases, showing the recovery of 3Q-2Li and 3Q-3Li. At the end of the charging stage, the N1
signal returns to the original position at δ = −56 ppm, demonstrating the structural recovery of 3Q.
The reversible structures of 3Q-6Li during the charge process indicates the reversible nature of the
lithiation reactions of 3Q.
NATURE ENERGY | DOI: 10.1038/nenergy.2017.74 | www.nature.com/natureenergy 11
SUPPLEMENTARY INFORMATION
© 2017 Macmillan Publishers Limited, part of Springer Nature. All rights reserved.
Page 12 of 32
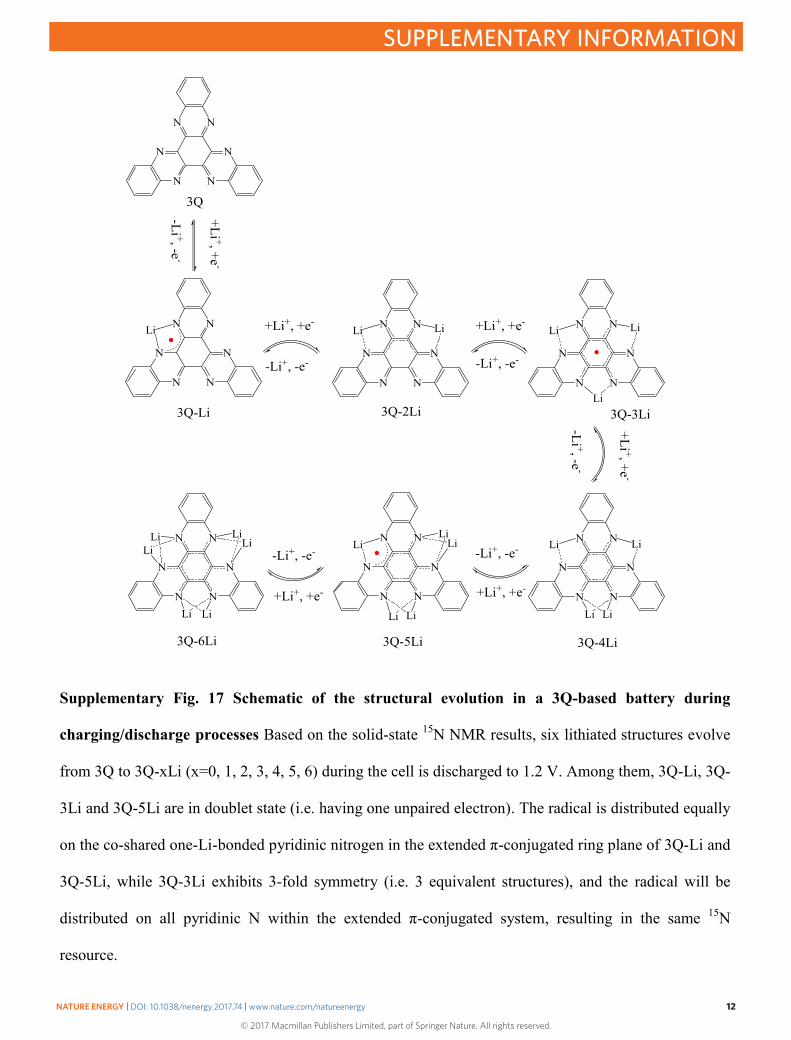
Supplementary Fig. 17 Schematic of the structural evolution in a 3Q-based battery during
charging/discharge processes Based on the solid-state 15N NMR results, six lithiated structures evolve
from 3Q to 3Q-xLi (x=0, 1, 2, 3, 4, 5, 6) during the cell is discharged to 1.2 V. Among them, 3Q-Li, 3Q-
3Li and 3Q-5Li are in doublet state (i.e. having one unpaired electron). The radical is distributed equally
on the co-shared one-Li-bonded pyridinic nitrogen in the extended π-conjugated ring plane of 3Q-Li and
3Q-5Li, while 3Q-3Li exhibits 3-fold symmetry (i.e. 3 equivalent structures), and the radical will be
distributed on all pyridinic N within the extended π-conjugated system, resulting in the same 15N
resource.
NATURE ENERGY | DOI: 10.1038/nenergy.2017.74 | www.nature.com/natureenergy 12
SUPPLEMENTARY INFORMATION
© 2017 Macmillan Publishers Limited, part of Springer Nature. All rights reserved.
Page 13 of 32
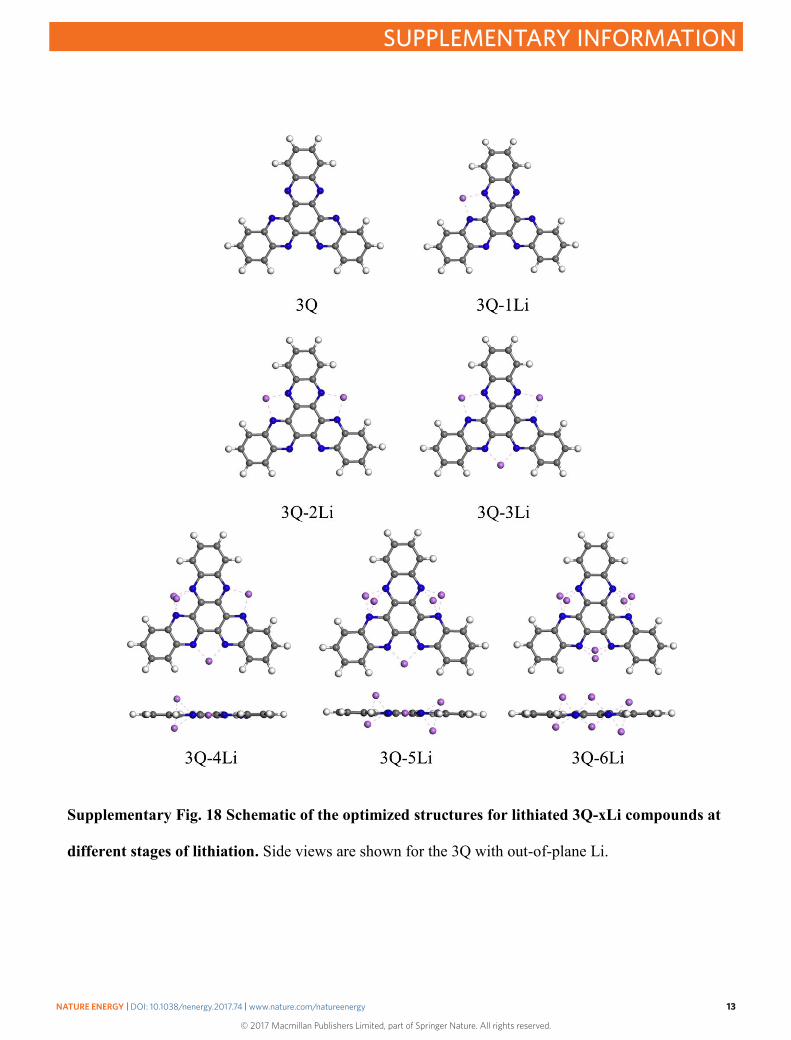
Supplementary Fig. 18 Schematic of the optimized structures for lithiated 3Q-xLi compounds at
different stages of lithiation. Side views are shown for the 3Q with out-of-plane Li.
NATURE ENERGY | DOI: 10.1038/nenergy.2017.74 | www.nature.com/natureenergy 13
SUPPLEMENTARY INFORMATION
© 2017 Macmillan Publishers Limited, part of Springer Nature. All rights reserved.
Page 14 of 32
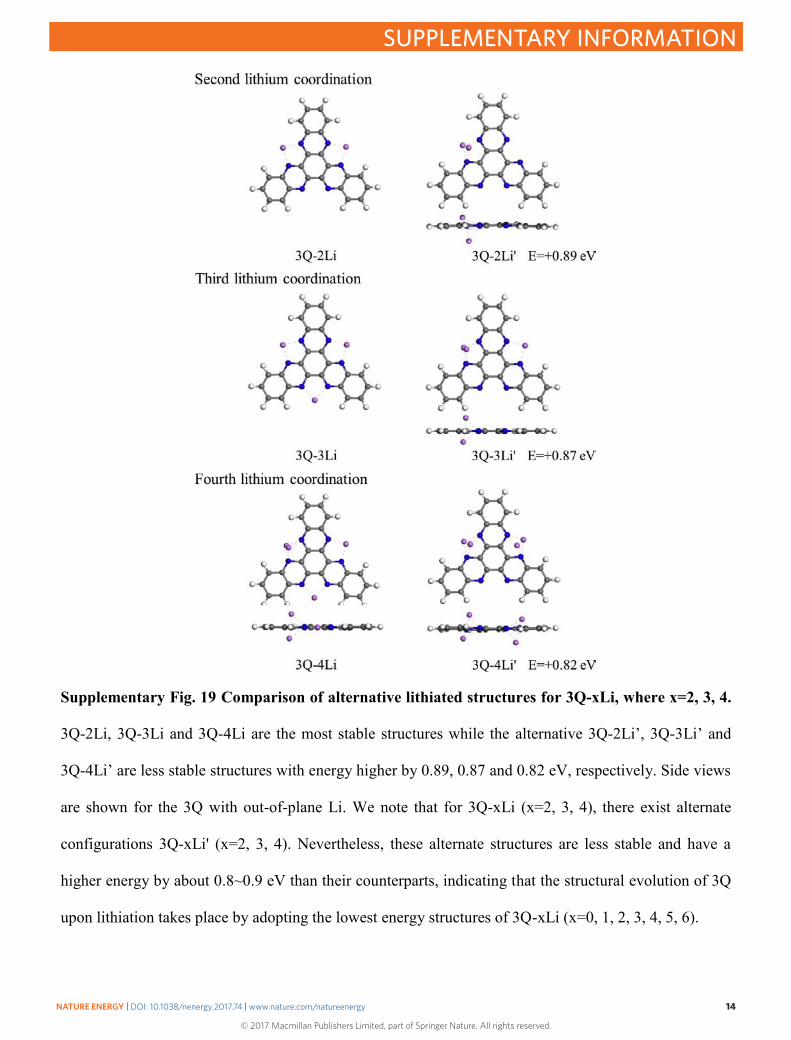
Supplementary Fig. 19 Comparison of alternative lithiated structures for 3Q-xLi, where x=2, 3, 4.
3Q-2Li, 3Q-3Li and 3Q-4Li are the most stable structures while the alternative 3Q-2Li’, 3Q-3Li’ and
3Q-4Li’ are less stable structures with energy higher by 0.89, 0.87 and 0.82 eV, respectively. Side views
are shown for the 3Q with out-of-plane Li. We note that for 3Q-xLi (x=2, 3, 4), there exist alternate
configurations 3Q-xLi' (x=2, 3, 4). Nevertheless, these alternate structures are less stable and have a
higher energy by about 0.8~0.9 eV than their counterparts, indicating that the structural evolution of 3Q
upon lithiation takes place by adopting the lowest energy structures of 3Q-xLi (x=0, 1, 2, 3, 4, 5, 6).
NATURE ENERGY | DOI: 10.1038/nenergy.2017.74 | www.nature.com/natureenergy 14
SUPPLEMENTARY INFORMATION
© 2017 Macmillan Publishers Limited, part of Springer Nature. All rights reserved.
Page 15 of 32
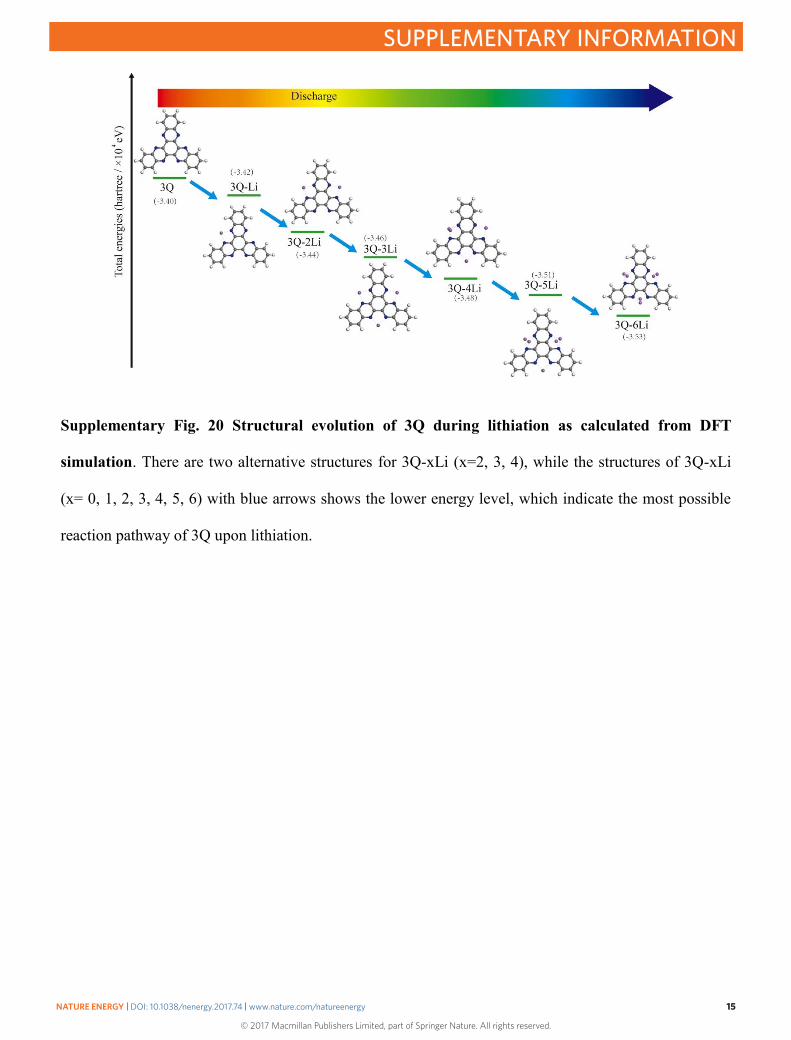
Supplementary Fig. 20 Structural evolution of 3Q during lithiation as calculated from DFT
simulation. There are two alternative structures for 3Q-xLi (x=2, 3, 4), while the structures of 3Q-xLi
(x= 0, 1, 2, 3, 4, 5, 6) with blue arrows shows the lower energy level, which indicate the most possible
reaction pathway of 3Q upon lithiation.
NATURE ENERGY | DOI: 10.1038/nenergy.2017.74 | www.nature.com/natureenergy 15
SUPPLEMENTARY INFORMATION
© 2017 Macmillan Publishers Limited, part of Springer Nature. All rights reserved.
Page 16 of 32
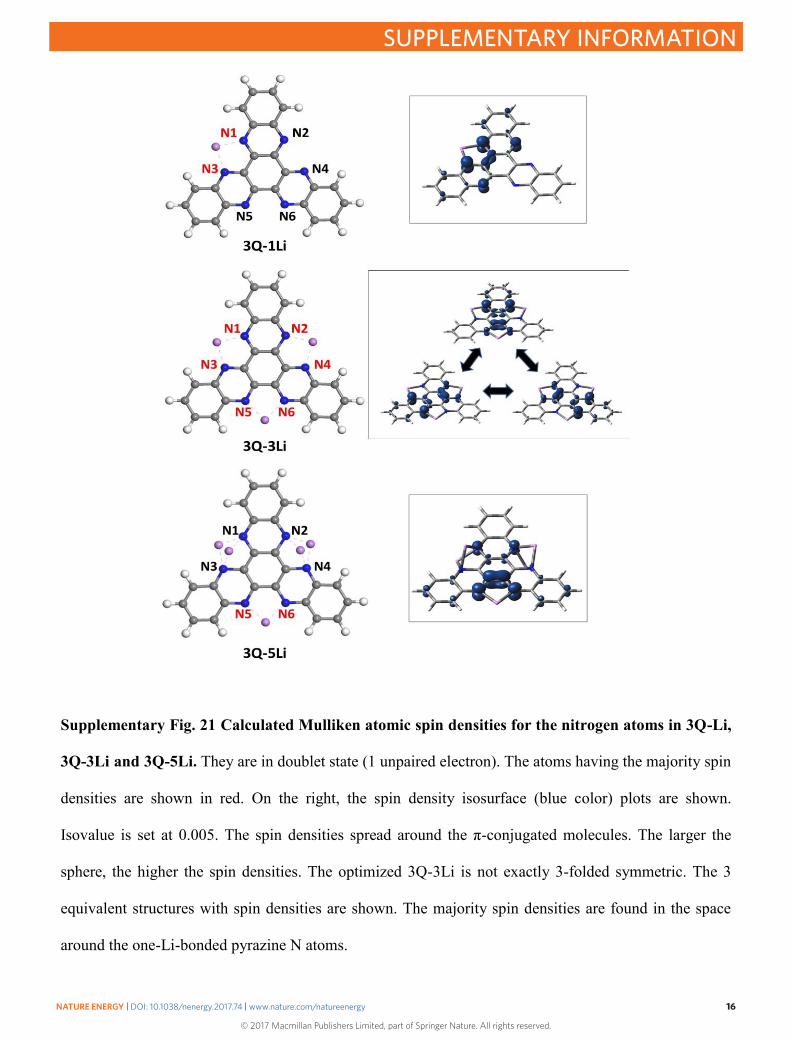
Supplementary Fig. 21 Calculated Mulliken atomic spin densities for the nitrogen atoms in 3Q-Li,
3Q-3Li and 3Q-5Li. They are in doublet state (1 unpaired electron). The atoms having the majority spin
densities are shown in red. On the right, the spin density isosurface (blue color) plots are shown.
Isovalue is set at 0.005. The spin densities spread around the π-conjugated molecules. The larger the
sphere, the higher the spin densities. The optimized 3Q-3Li is not exactly 3-folded symmetric. The 3
equivalent structures with spin densities are shown. The majority spin densities are found in the space
around the one-Li-bonded pyrazine N atoms.
NATURE ENERGY | DOI: 10.1038/nenergy.2017.74 | www.nature.com/natureenergy 16
SUPPLEMENTARY INFORMATION
© 2017 Macmillan Publishers Limited, part of Springer Nature. All rights reserved.
Page 17 of 32
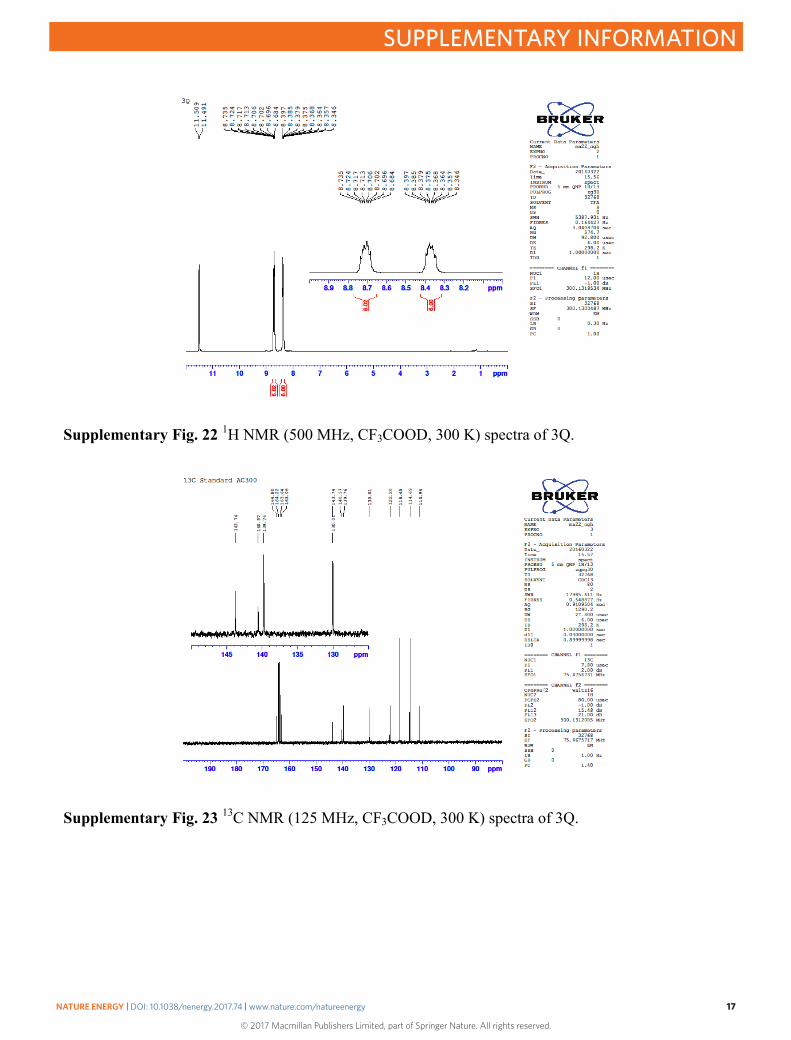
Supplementary Fig. 22 1H NMR (500 MHz, CF3COOD, 300 K) spectra of 3Q.
Supplementary Fig. 23 13C NMR (125 MHz, CF3COOD, 300 K) spectra of 3Q.
NATURE ENERGY | DOI: 10.1038/nenergy.2017.74 | www.nature.com/natureenergy 17
SUPPLEMENTARY INFORMATION
© 2017 Macmillan Publishers Limited, part of Springer Nature. All rights reserved.
Page 18 of 32
4000 3500 3000 2500 2000 1500 1000 500
768 cm-1
3446 cm-1
1493 cm-1
1339 cm-1
1365 cm-1
1077 cm-1
757 cm-1
Tran
smita
nce
(a.u
.)
Wavenumber / cm-1
608cm-1
3Q
4000 3500 3000 2500 2000 1500 1000 500
3458 cm-1
1738 cm-1
1545 cm-1
1501 cm-1
1358 cm-1
1072 cm-1
785 cm-1
Tran
smita
nce
(a. u
.)
Wavenumber / cm-1
762 cm-1
2Q
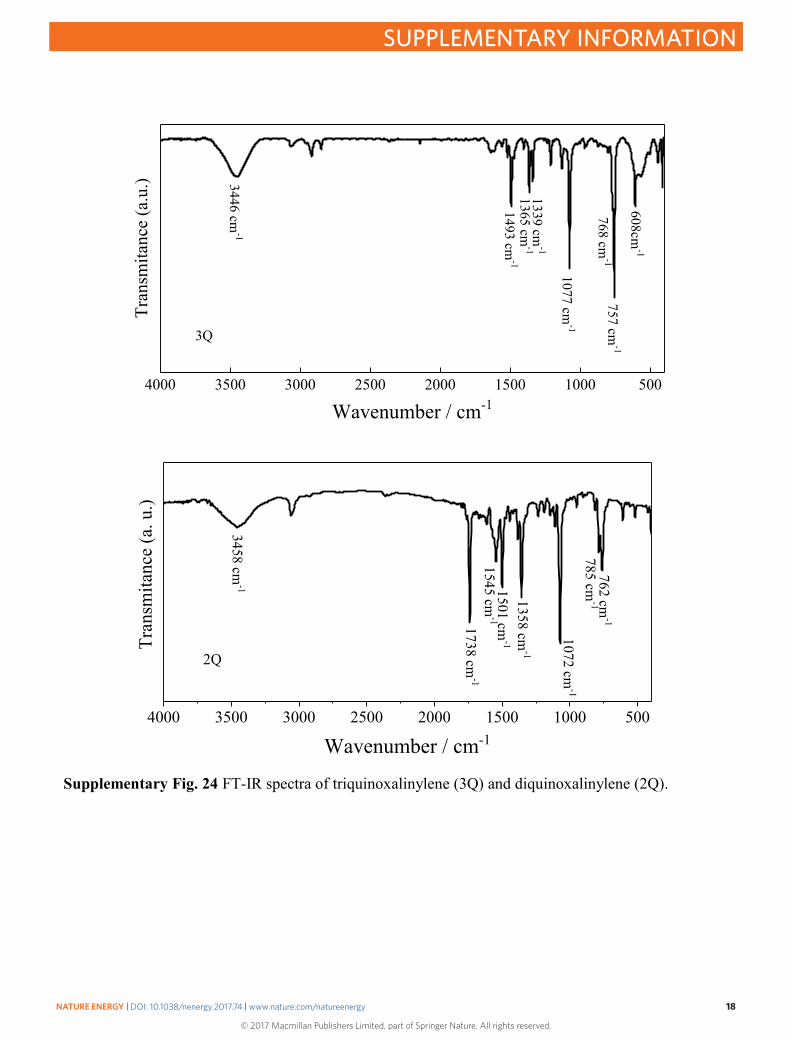
Supplementary Fig. 24 FT-IR spectra of triquinoxalinylene (3Q) and diquinoxalinylene (2Q).
NATURE ENERGY | DOI: 10.1038/nenergy.2017.74 | www.nature.com/natureenergy 18
SUPPLEMENTARY INFORMATION
© 2017 Macmillan Publishers Limited, part of Springer Nature. All rights reserved.
Page 19 of 32
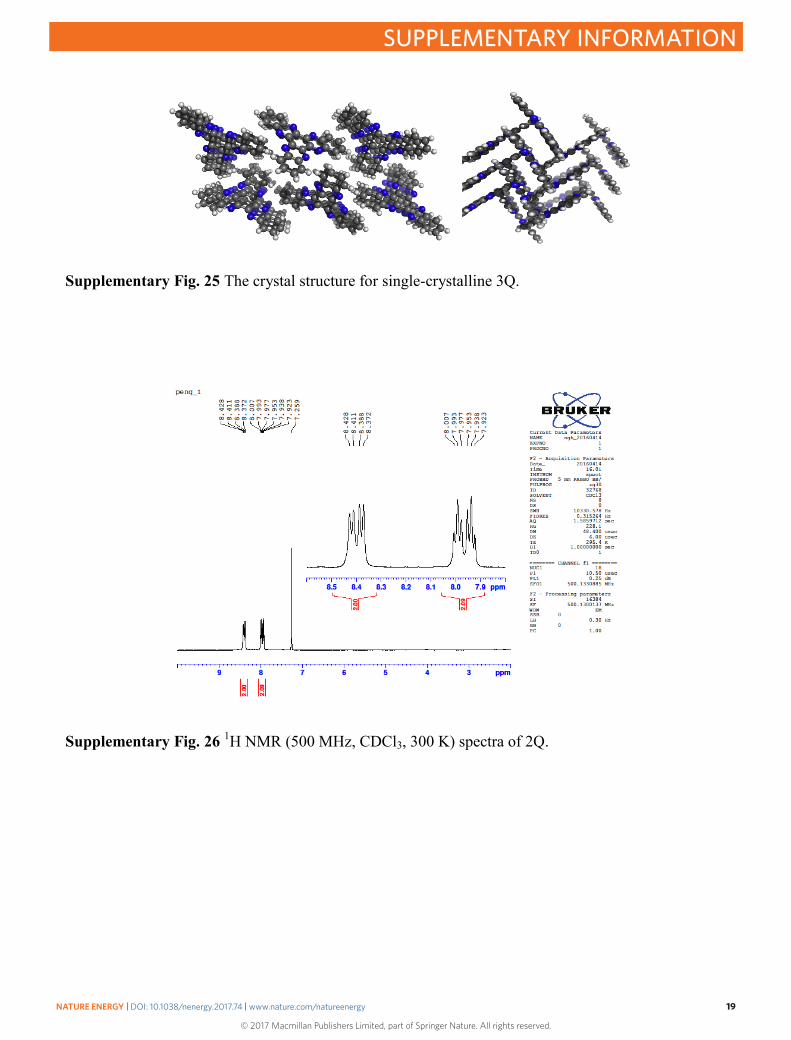
Supplementary Fig. 25 The crystal structure for single-crystalline 3Q.
Supplementary Fig. 26 1H NMR (500 MHz, CDCl3, 300 K) spectra of 2Q.
NATURE ENERGY | DOI: 10.1038/nenergy.2017.74 | www.nature.com/natureenergy 19
SUPPLEMENTARY INFORMATION
© 2017 Macmillan Publishers Limited, part of Springer Nature. All rights reserved.
Page 20 of 32
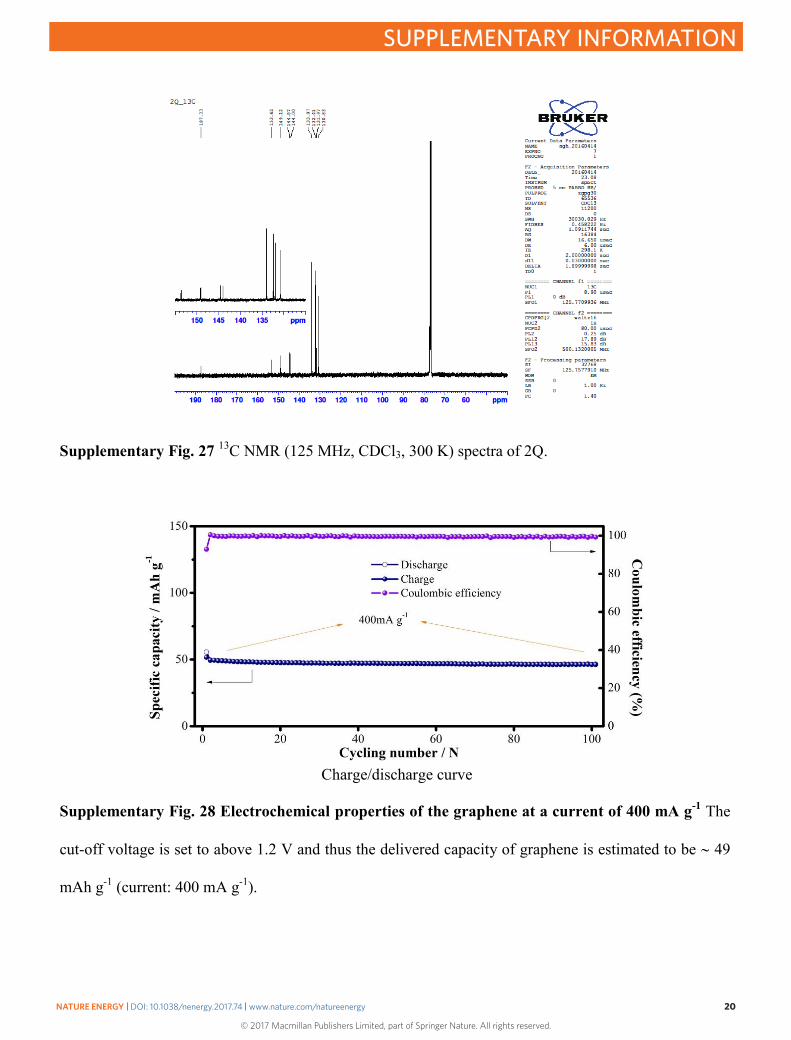
Supplementary Fig. 27 13C NMR (125 MHz, CDCl3, 300 K) spectra of 2Q.
Charge/discharge curve
Supplementary Fig. 28 Electrochemical properties of the graphene at a current of 400 mA g-1 The
cut-off voltage is set to above 1.2 V and thus the delivered capacity of graphene is estimated to be 49
mAh g-1 (current: 400 mA g-1).
NATURE ENERGY | DOI: 10.1038/nenergy.2017.74 | www.nature.com/natureenergy 20
SUPPLEMENTARY INFORMATION
© 2017 Macmillan Publishers Limited, part of Springer Nature. All rights reserved.
Page 21 of 32
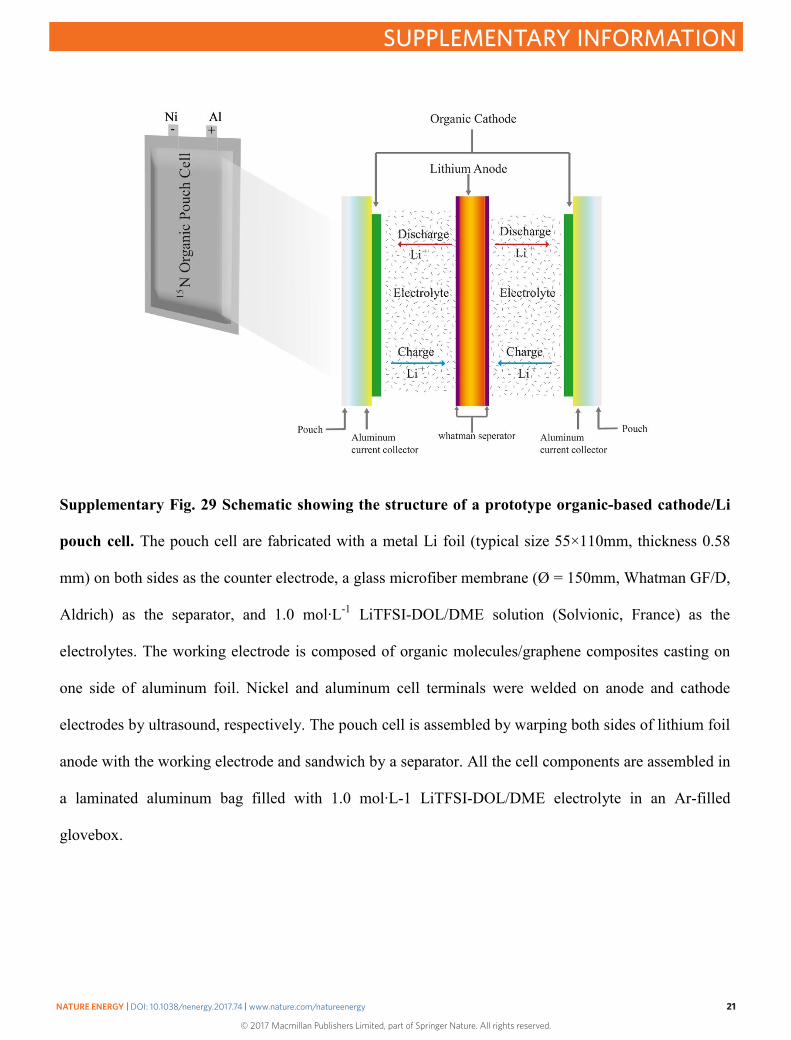
Supplementary Fig. 29 Schematic showing the structure of a prototype organic-based cathode/Li
pouch cell. The pouch cell are fabricated with a metal Li foil (typical size 55×110mm, thickness 0.58
mm) on both sides as the counter electrode, a glass microfiber membrane (Ø = 150mm, Whatman GF/D,
Aldrich) as the separator, and 1.0 mol∙L-1 LiTFSI-DOL/DME solution (Solvionic, France) as the
electrolytes. The working electrode is composed of organic molecules/graphene composites casting on
one side of aluminum foil. Nickel and aluminum cell terminals were welded on anode and cathode
electrodes by ultrasound, respectively. The pouch cell is assembled by warping both sides of lithium foil
anode with the working electrode and sandwich by a separator. All the cell components are assembled in
a laminated aluminum bag filled with 1.0 mol∙L-1 LiTFSI-DOL/DME electrolyte in an Ar-filled
glovebox.
NATURE ENERGY | DOI: 10.1038/nenergy.2017.74 | www.nature.com/natureenergy 21
SUPPLEMENTARY INFORMATION
© 2017 Macmillan Publishers Limited, part of Springer Nature. All rights reserved.
Page 22 of 32
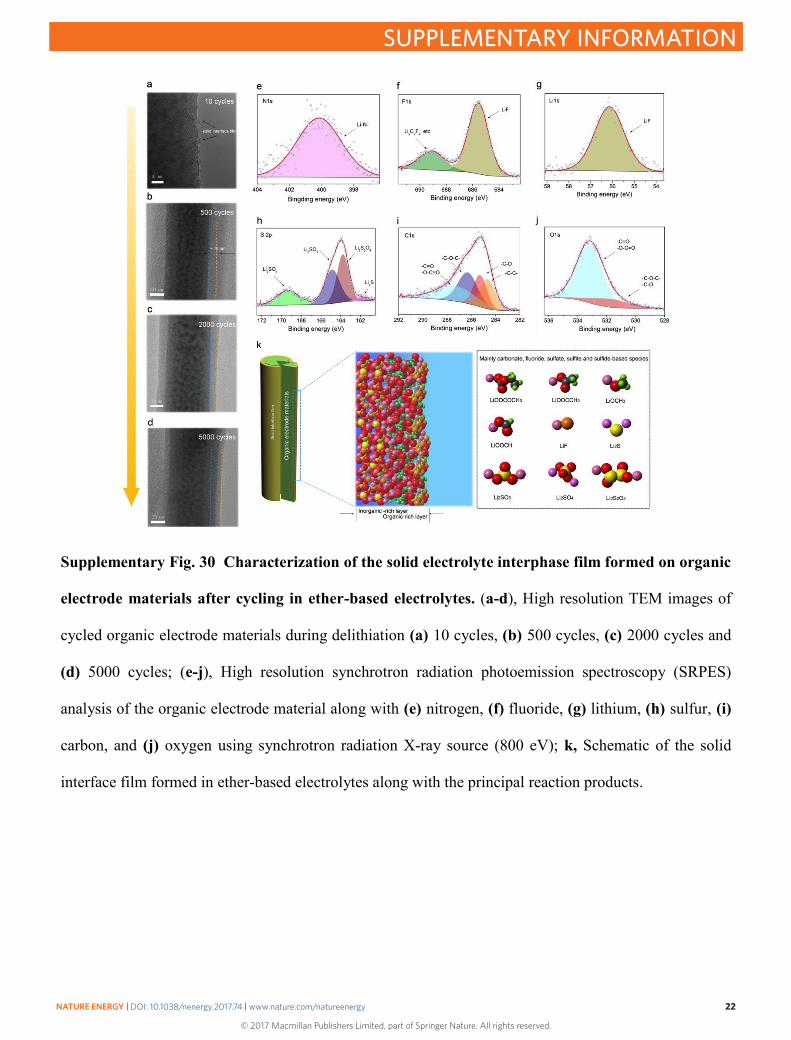
Supplementary Fig. 30 Characterization of the solid electrolyte interphase film formed on organic
electrode materials after cycling in ether-based electrolytes. (a-d), High resolution TEM images of
cycled organic electrode materials during delithiation (a) 10 cycles, (b) 500 cycles, (c) 2000 cycles and
(d) 5000 cycles; (e-j), High resolution synchrotron radiation photoemission spectroscopy (SRPES)
analysis of the organic electrode material along with (e) nitrogen, (f) fluoride, (g) lithium, (h) sulfur, (i)
carbon, and (j) oxygen using synchrotron radiation X-ray source (800 eV); k, Schematic of the solid
interface film formed in ether-based electrolytes along with the principal reaction products.
NATURE ENERGY | DOI: 10.1038/nenergy.2017.74 | www.nature.com/natureenergy 22
SUPPLEMENTARY INFORMATION
© 2017 Macmillan Publishers Limited, part of Springer Nature. All rights reserved.
Page 23 of 32
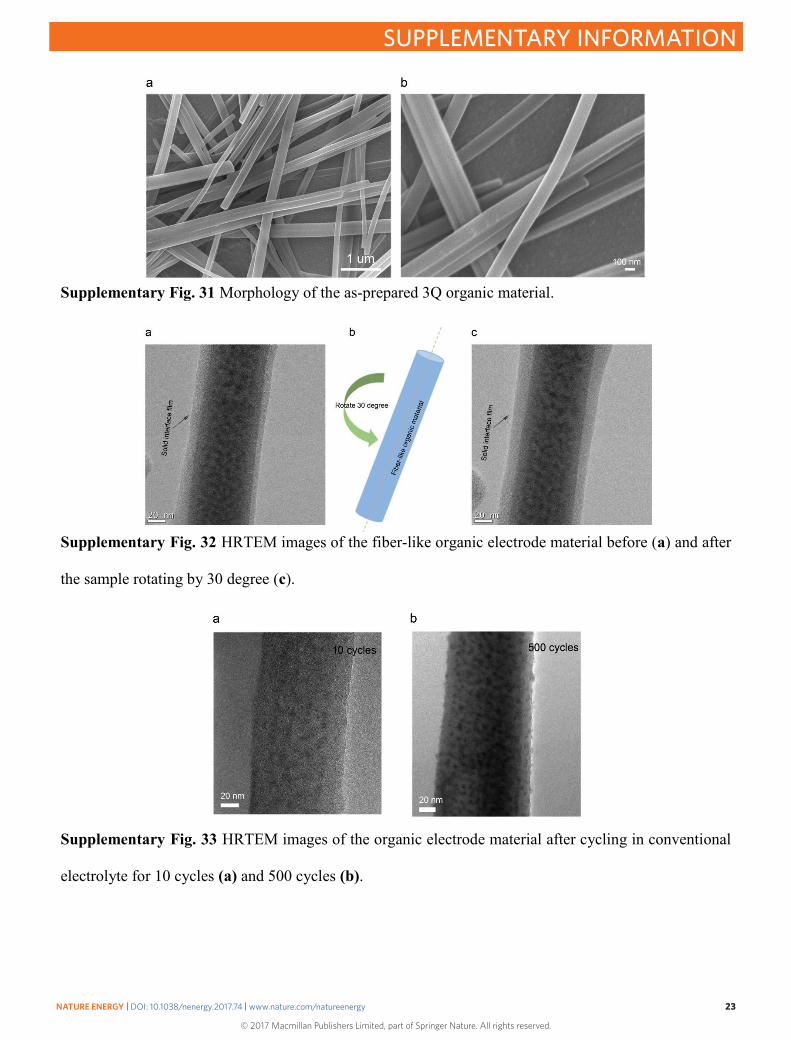
Supplementary Fig. 31 Morphology of the as-prepared 3Q organic material.
Supplementary Fig. 32 HRTEM images of the fiber-like organic electrode material before (a) and after
the sample rotating by 30 degree (c).
Supplementary Fig. 33 HRTEM images of the organic electrode material after cycling in conventional
electrolyte for 10 cycles (a) and 500 cycles (b).
NATURE ENERGY | DOI: 10.1038/nenergy.2017.74 | www.nature.com/natureenergy 23
SUPPLEMENTARY INFORMATION
© 2017 Macmillan Publishers Limited, part of Springer Nature. All rights reserved.
Page 24 of 32
0 20 40 60 80 1000
100
200
300
400
500
Spec
ific
capa
city
(mA
h g-1
)
Cycle number / N
0
20
40
60
80
100
Coulom
bic efficiency (%)
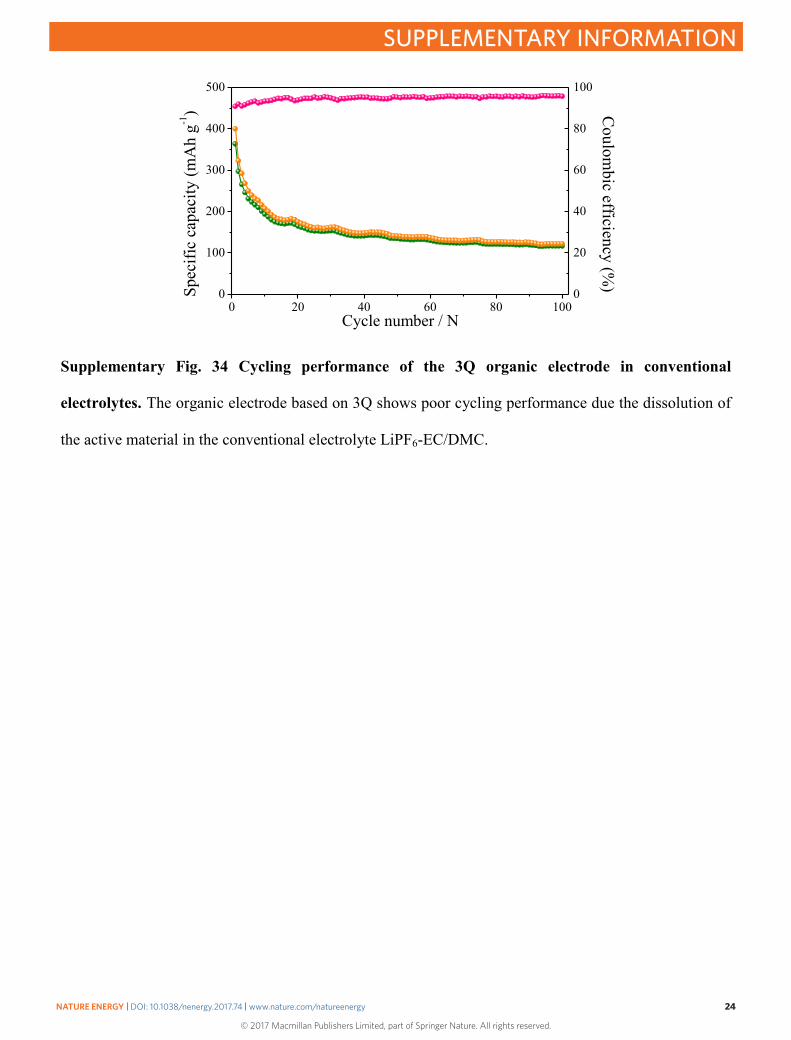
Supplementary Fig. 34 Cycling performance of the 3Q organic electrode in conventional
electrolytes. The organic electrode based on 3Q shows poor cycling performance due the dissolution of
the active material in the conventional electrolyte LiPF6-EC/DMC.
NATURE ENERGY | DOI: 10.1038/nenergy.2017.74 | www.nature.com/natureenergy 24
SUPPLEMENTARY INFORMATION
© 2017 Macmillan Publishers Limited, part of Springer Nature. All rights reserved.
Page 25 of 32
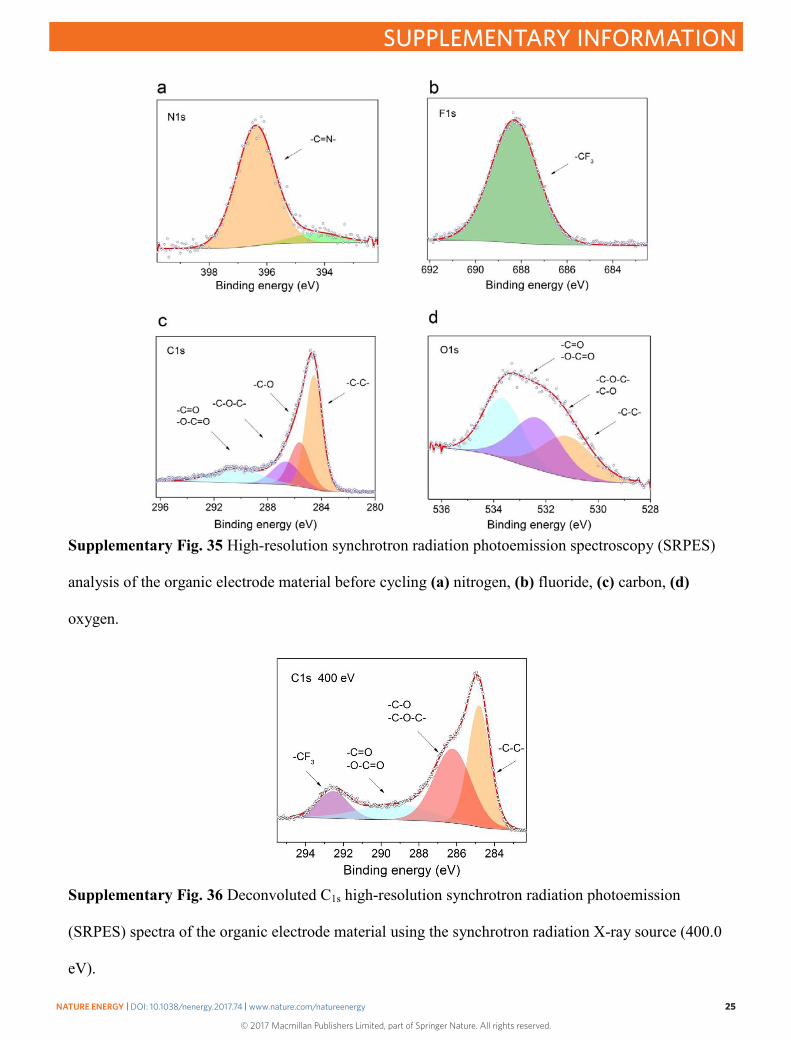
Supplementary Fig. 35 High-resolution synchrotron radiation photoemission spectroscopy (SRPES)
analysis of the organic electrode material before cycling (a) nitrogen, (b) fluoride, (c) carbon, (d)
oxygen.
Supplementary Fig. 36 Deconvoluted C1s high-resolution synchrotron radiation photoemission
(SRPES) spectra of the organic electrode material using the synchrotron radiation X-ray source (400.0
eV).
NATURE ENERGY | DOI: 10.1038/nenergy.2017.74 | www.nature.com/natureenergy 25
SUPPLEMENTARY INFORMATION
© 2017 Macmillan Publishers Limited, part of Springer Nature. All rights reserved.
Page 26 of 32
Supplementary Tables
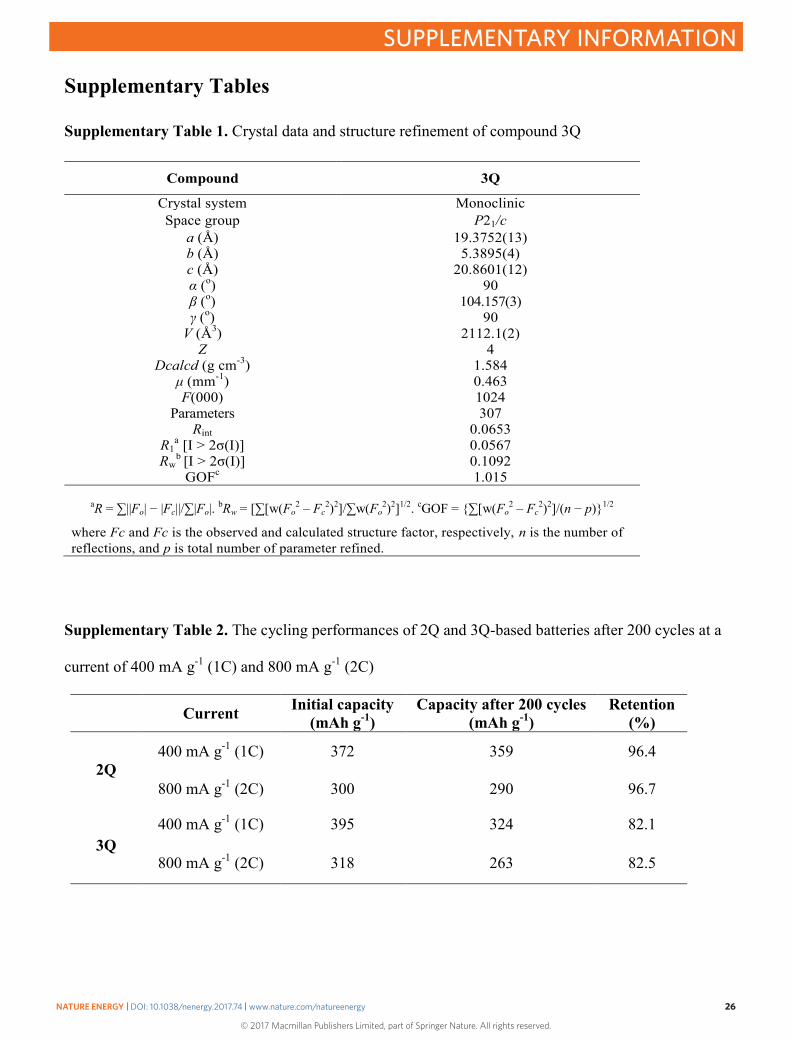
Supplementary Table 1. Crystal data and structure refinement of compound 3Q
Compound 3Q
Crystal system Monoclinic Space group P21/c
a (Å) 19.3752(13) b (Å) 5.3895(4) c (Å) 20.8601(12) α (o) 90 β (o) 104.157(3) γ (o) 90
V (Å3) 2112.1(2) Z 4
Dcalcd (g cm-3) 1.584 μ (mm-1) 0.463 F(000) 1024
Parameters 307 Rint 0.0653
R1a [I > 2σ(I)] 0.0567
Rwb [I > 2σ(I)] 0.1092
GOFc 1.015
aR = ∑||Fo| − |Fc||/∑|Fo|. bRw = [∑[w(Fo2 – Fc
2)2]/∑w(Fo2)2]1/2. cGOF = {∑[w(Fo
2 – Fc2)2]/(n − p)}1/2
where Fc and Fc is the observed and calculated structure factor, respectively, n is the number of reflections, and p is total number of parameter refined.
Supplementary Table 2. The cycling performances of 2Q and 3Q-based batteries after 200 cycles at a
current of 400 mA g-1 (1C) and 800 mA g-1 (2C)
Current Initial capacity (mAh g-1)
Capacity after 200 cycles (mAh g-1)
Retention (%)
2Q 400 mA g-1 (1C) 372 359 96.4
800 mA g-1 (2C) 300 290 96.7
3Q 400 mA g-1 (1C) 395 324 82.1
800 mA g-1 (2C) 318 263 82.5
NATURE ENERGY | DOI: 10.1038/nenergy.2017.74 | www.nature.com/natureenergy 26
SUPPLEMENTARY INFORMATION
© 2017 Macmillan Publishers Limited, part of Springer Nature. All rights reserved.
Page 27 of 32
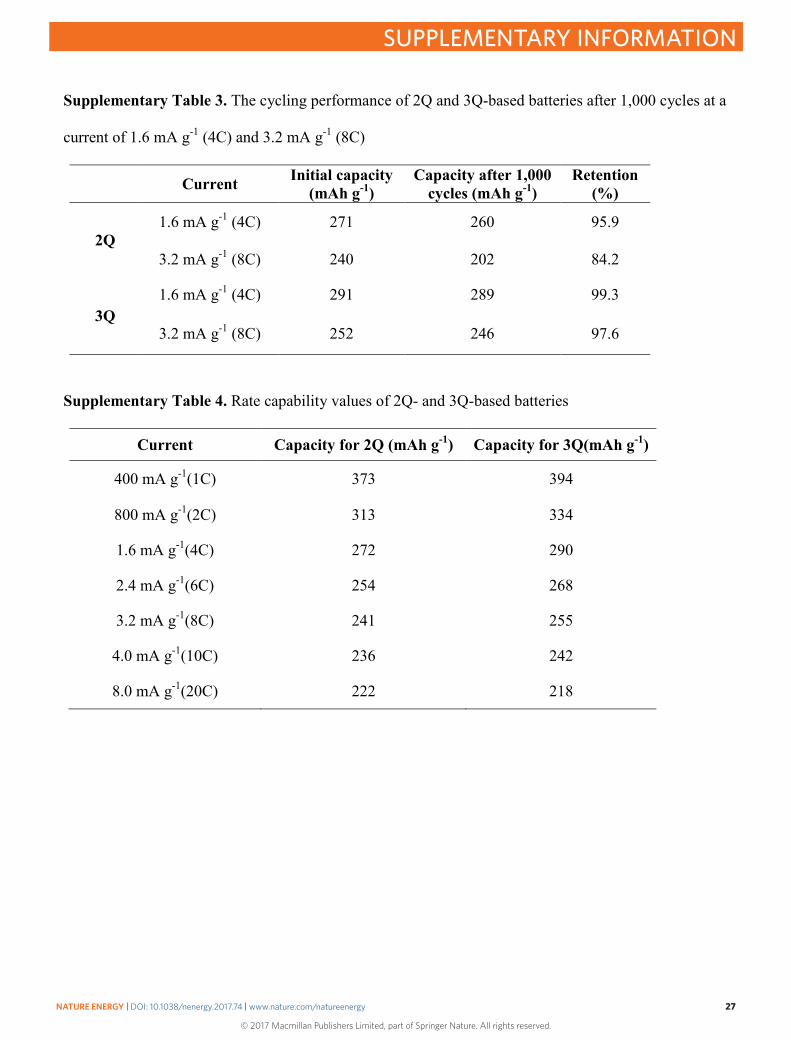
Supplementary Table 3. The cycling performance of 2Q and 3Q-based batteries after 1,000 cycles at a
current of 1.6 mA g-1 (4C) and 3.2 mA g-1 (8C)
Current Initial capacity (mAh g-1)
Capacity after 1,000 cycles (mAh g-1)
Retention (%)
2Q 1.6 mA g-1 (4C) 271 260 95.9
3.2 mA g-1 (8C) 240 202 84.2
3Q 1.6 mA g-1 (4C) 291 289 99.3
3.2 mA g-1 (8C) 252 246 97.6
Supplementary Table 4. Rate capability values of 2Q- and 3Q-based batteries
Current Capacity for 2Q (mAh g-1) Capacity for 3Q(mAh g-1)
400 mA g-1(1C) 373 394
800 mA g-1(2C) 313 334
1.6 mA g-1(4C) 272 290
2.4 mA g-1(6C) 254 268
3.2 mA g-1(8C) 241 255
4.0 mA g-1(10C) 236 242
8.0 mA g-1(20C) 222 218
NATURE ENERGY | DOI: 10.1038/nenergy.2017.74 | www.nature.com/natureenergy 27
SUPPLEMENTARY INFORMATION
© 2017 Macmillan Publishers Limited, part of Springer Nature. All rights reserved.
Page 28 of 32
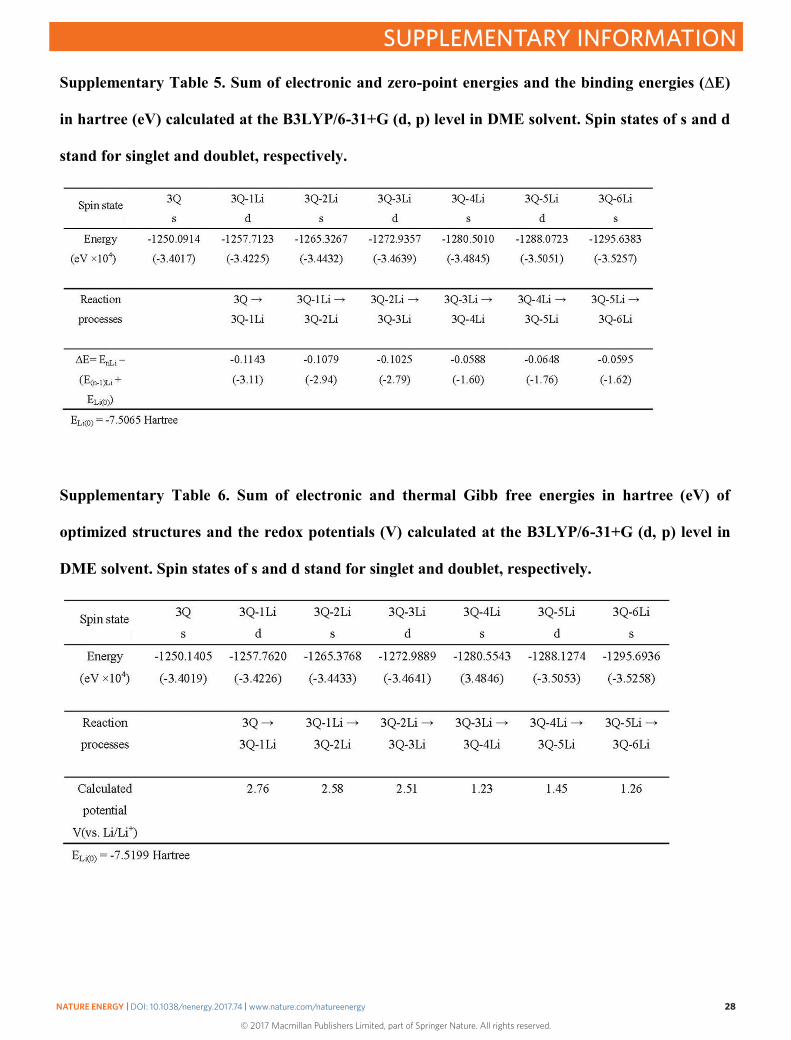
Supplementary Table 5. Sum of electronic and zero-point energies and the binding energies (∆E)
in hartree (eV) calculated at the B3LYP/6-31+G (d, p) level in DME solvent. Spin states of s and d
stand for singlet and doublet, respectively.
Supplementary Table 6. Sum of electronic and thermal Gibb free energies in hartree (eV) of
optimized structures and the redox potentials (V) calculated at the B3LYP/6-31+G (d, p) level in
DME solvent. Spin states of s and d stand for singlet and doublet, respectively.
NATURE ENERGY | DOI: 10.1038/nenergy.2017.74 | www.nature.com/natureenergy 28
SUPPLEMENTARY INFORMATION
© 2017 Macmillan Publishers Limited, part of Springer Nature. All rights reserved.
Page 29 of 32
Supplementary Notes
Supplementary Note 1. Energy density and power density of 2Q and 3Q
In the experiment, the maximum delivery capacity C maximum capacity and the average voltage V average can
be obtained
The energy density of the electrode can be simplified as,
Eelectrode = C maximum capacity × V average
If the auxiliary components of the battery, i.e. current collectors, electrolytes, separators and packing are
taken into consideration, the mass of the electrode is normally calculated to one-third of the totally mass
of battery components. Accordingly, the energy density of the batteries can be estimated as,
Ecell= Eelectrode/ 3
The energy density of the batteries VS. current is shown in Supplementary Fig. 3.
When the discharge time (t) is obtained, the power density of battery is estimated as, P cell = Ecell / t The Ragone plot is shown in Supplementary Fig. 4.
Supplementary Note 2. Electrical conductivity measurement for 2Q and 3Q
(i) Preparation of pellets made of 2Q and 3Q
To measure the electrical conductivity of organic cathodes 2Q and 3Q, the powders of the two
compounds are pressed into a pellet using a compressed module. The two pellets are made under the
same conditions: the weight of 2Q and 3Q are 30 mg, the pressure is ~ 15 MPa (Hydraulic Pellet Press,
Sepcac), and the press time is 5 min. As shown in Supplementary Fig. 9, the diameter of two pellets is
13 mm; From the SEM image in Supplementary Fig. 10, the thickness of the pellets made of 2Q and 3Q
are about 154 and 163 μm, respectively.
(ii) Electrical conductivity measurement
NATURE ENERGY | DOI: 10.1038/nenergy.2017.74 | www.nature.com/natureenergy 29
SUPPLEMENTARY INFORMATION
© 2017 Macmillan Publishers Limited, part of Springer Nature. All rights reserved.
Page 30 of 32
The electrical conductivity of two organic materials was determined by measuring electron transport
through the pressed pellet of the material. The pellets are sandwiched by two stainless steel chips
connected to a Keithley 2400 instrument. The pellets between two stainless steel chips are pressed
tightly to ensure proper electrical contact (Supplementary Fig. 11). The transient current through the
pellets are measured as a function of voltage, from which the resistivity and conductivity of the organic
cathodes based on 2Q and 3Q can be obtained. As shown in Supplementary Fig. 12 and 13 , the slopes
of the I-V curve for 2Q and 3Q are calculated to be about 1.83826 × 10 -12 and 1.44647 × 10 -11 A ∙V-1,
respectively.
The electrical conductivity is calculated using the following formula:
Where
V: the magnitude of the applied voltage;
I: the magnitude of the current density;
S: the area of the pellet (two organic materials 2Q and 3Q), = 3.14× (0.013/2)2 = 0. 000132665
m2;
L: the thickness of the pellet (two organic materials 2Q and 3Q), L (2Q) = 0.000154 m, L (3Q) =
0.000163 m;
ρ: the resistivity of the pellet (two organic materials 2Q and 3Q);
σ: the electrical conductivity of the pellet (two organic materials 2Q and 3Q)
The electrical conductivity is calculated as follows:
σ (2Q) = 2. 13×10-12 S/m;
σ (3Q) = 1.78 ×10⁻¹¹ S/m.
NATURE ENERGY | DOI: 10.1038/nenergy.2017.74 | www.nature.com/natureenergy 30
SUPPLEMENTARY INFORMATION
© 2017 Macmillan Publishers Limited, part of Springer Nature. All rights reserved.
Page 31 of 32
Supplementary Note 3. Crystal Structure for 3Q
A yellow rod like single crystal of C24H12ClN12 (CCDC No. 1511841), approximate dimensions (0.088 x
0.136 x 0.355) mm3, was used for the X-ray crystallographic analysis. The X-ray intensity data were
measured at low temperature (T = 100 K ), using a four circles goniometer Kappa geometry, Bruker
AXS D8 Venture, equipped with a Photon 100 CMOS active pixel sensor detector. A Molybdenum
monochromatized ( = 0.71073 Å) X-Ray radiation was selected for the measurement. Frames were
integrated with the Bruker SAINT software [1] using a narrow-frame algorithm. Integration of the data
using a monoclinic unit cell yielded a total of 8847 reflections to a maximum θ angle of 25.72° (0.82 Å
resolution), of which 4031 were independent (average redundancy 2.195, completeness = 99.8%, Rint =
6.53%, Rsig = 9.58%) and 2619 (64.97%) were greater than 2σ (F2). The final cell constants of a =
19.3752(13) Å, b = 5.3895(4) Å, c = 20.8601(12) Å, β = 104.157(3) °, volume = 2112.1(2) Å3, are based
upon the refinement of the XYZ-centroids of 595 reflections above 20 σ (I) with 4.157° < 2θ < 47.77°.
Data were corrected for absorption effects using the multi-scan method implemented in the program
(SADABS) [2]. The calculated minimum and maximum transmission coefficients (based on crystal size)
are 0.9240 and 0.9800. The model was solved in the centrosymmetric space group P2(1)/c with the aid
of the software SHELXT [3], using a Dual Space method to solve the phase problem expanded in a
triclinic unit cell P1. Refinement of the structure was carried out by least squares procedures on
weighted F2 values using the SHELXL-version 2014/6 [4] included in the WinGx programs for Windows
[5]. Hydrogen atoms were localized on difference Fourier maps but then introduced in the refinement as
fixed contributors in idealized geometry with an isotropic thermal parameters fixed at 20 % higher than
those carbons atoms they were connected.
NATURE ENERGY | DOI: 10.1038/nenergy.2017.74 | www.nature.com/natureenergy 31
SUPPLEMENTARY INFORMATION
© 2017 Macmillan Publishers Limited, part of Springer Nature. All rights reserved.
Page 32 of 32
Supplementary References
1. Saint Program included in the package software: APEX3 5, 2(2015).
2. Krause, L., Herbs-Irmer, R., Sheldrick, G. M. Stalke, D. SADABS. Ver. J. Appl. Crystallogr.
48(2015).
3. SHELXT Sheldrick, G. M. Integrated space-group and crystal-structure determination. Acta
Crystallogr., Sect. A A71, 3-8(2015).
4. SHELXTL Sheldrick, G. M. Ver. Acta Crystallographica. Sect C Structural Chemistry 71, 3-
8(2014).
5. WinGX Farrugia, L. J. J. Appl. Cryst. 32, 837-838(1999).
NATURE ENERGY | DOI: 10.1038/nenergy.2017.74 | www.nature.com/natureenergy 32
SUPPLEMENTARY INFORMATION