Embed Size (px)
Citation preview
Jeffrey N. ANker, W. PAige HAll, OlgA lyANdres, NilAm C. sHAH, JiNg ZHAO ANd riCHArd P. VAN duyNe*Chemistry Department, Northwestern University, 2145 Sheridan Road, Evanston, Illinois 60208-3113, USA
*e-mail: [email protected]
The mirror-like quality of smooth noble-metal films changes markedly when the metal is separated into particles that are smaller than the wavelength of light1–3. Light incident on the nanoparticles induces the conduction electrons in them to oscillate collectively with a resonant frequency that depends on the nanoparticles’ size, shape and composition. As a result of these LSPR modes, the nanoparticles absorb and scatter light so intensely that single nanoparticles are easily observed by eye using dark-field (optical scattering) microscopy2–6. For example, a single 80-nm silver nanosphere scatters 445-nm blue light with a scattering cross-section of 3 × 10⁻² µm2, a millionfold greater than the fluorescence cross-section of a fluorescein molecule, and a thousandfold greater than the cross-section of a similarly sized nanosphere filled with fluorescein to the self-quenching limit4. This phenomenon enables noble-metal nanoparticles to serve as extremely intense labels for immunoassays4,6,7, biochemical sensors8–13 and surface-enhanced spectroscopies14–22. Plasmonic nanoparticles also have significant potential as nanoscale optical switches, waveguides, light sources, microscopes and lithographic tools23–25. A review by Zhang and co-workers on page 435 of this issue highlights the use of plasmonic structures for subwavelength imaging and lithography26. Unlike fluorophores, plasmonic nanoparticles do not blink or bleach, providing a virtually unlimited photon budget for observing molecular binding over arbitrarily long time intervals.
The shape of the nanoparticle extinction and scattering spectra, and in particular the peak wavelength λmax, depends on nanoparticle composition, size, shape, orientation and local dielectric environment27,28. The LSPR can be tuned during fabrication by controlling these parameters with a variety of chemical syntheses29–32 and lithographic techniques33–36. For example, an array of triangular nanoprisms can be fabricated by vapour-depositing metal through
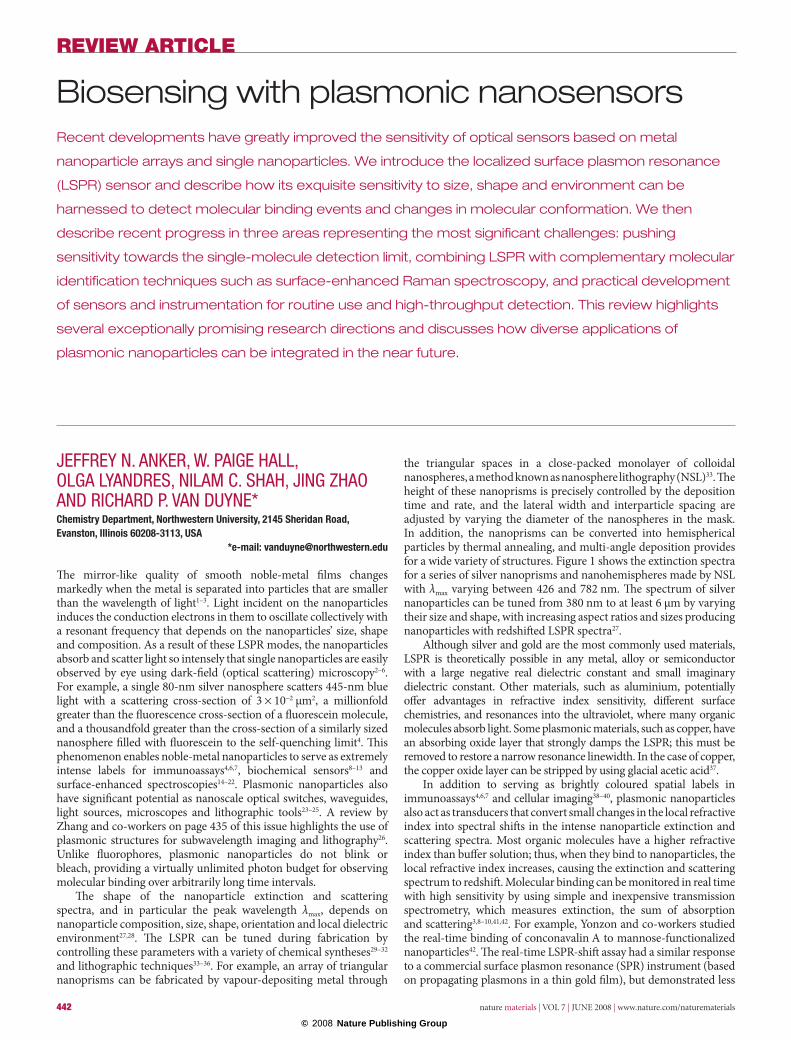
the triangular spaces in a close-packed monolayer of colloidal nanospheres, a method known as nanosphere lithography (NSL)33. The height of these nanoprisms is precisely controlled by the deposition time and rate, and the lateral width and interparticle spacing are adjusted by varying the diameter of the nanospheres in the mask. In addition, the nanoprisms can be converted into hemispherical particles by thermal annealing, and multi-angle deposition provides for a wide variety of structures. Figure 1 shows the extinction spectra for a series of silver nanoprisms and nanohemispheres made by NSL with λmax varying between 426 and 782 nm. The spectrum of silver nanoparticles can be tuned from 380 nm to at least 6 µm by varying their size and shape, with increasing aspect ratios and sizes producing nanoparticles with redshifted LSPR spectra27.
Although silver and gold are the most commonly used materials, LSPR is theoretically possible in any metal, alloy or semiconductor with a large negative real dielectric constant and small imaginary dielectric constant. Other materials, such as aluminium, potentially offer advantages in refractive index sensitivity, different surface chemistries, and resonances into the ultraviolet, where many organic molecules absorb light. Some plasmonic materials, such as copper, have an absorbing oxide layer that strongly damps the LSPR; this must be removed to restore a narrow resonance linewidth. In the case of copper, the copper oxide layer can be stripped by using glacial acetic acid37.
In addition to serving as brightly coloured spatial labels in immunoassays4,6,7 and cellular imaging38–40, plasmonic nanoparticles also act as transducers that convert small changes in the local refractive index into spectral shifts in the intense nanoparticle extinction and scattering spectra. Most organic molecules have a higher refractive index than buffer solution; thus, when they bind to nanoparticles, the local refractive index increases, causing the extinction and scattering spectrum to redshift. Molecular binding can be monitored in real time with high sensitivity by using simple and inexpensive transmission spectrometry, which measures extinction, the sum of absorption and scattering3,8–10,41,42. For example, Yonzon and co-workers studied the real-time binding of conconavalin A to mannose-functionalized nanoparticles42. The real-time LSPR-shift assay had a similar response to a commercial surface plasmon resonance (SPR) instrument (based on propagating plasmons in a thin gold film), but demonstrated less
Biosensing with plasmonic nanosensorsRecent developments have greatly improved the sensitivity of optical sensors based on metal
nanoparticle arrays and single nanoparticles. We introduce the localized surface plasmon resonance
(LSPR) sensor and describe how its exquisite sensitivity to size, shape and environment can be
harnessed to detect molecular binding events and changes in molecular conformation. We then
describe recent progress in three areas representing the most significant challenges: pushing
sensitivity towards the single-molecule detection limit, combining LSPR with complementary molecular
identification techniques such as surface-enhanced Raman spectroscopy, and practical development
of sensors and instrumentation for routine use and high-throughput detection. This review highlights
several exceptionally promising research directions and discusses how diverse applications of
plasmonic nanoparticles can be integrated in the near future.
REVIEW ARTICLE
442 nature materials | VOL 7 | JUNE 2008 | www.nature.com/naturematerials
© 2008 Nature Publishing Group
REVIEW ARTICLE
nature materials | VOL 7 | JUNE 2008 | www.nature.com/naturematerials 443
interference from bulk refractive index. In addition, LSPR possesses greater spatial resolution, both lateral and normal, when compared with SPR. The ultimate lateral spatial resolution is achieved with single nanoparticles.
LSPR-shift assays can also be used for ultrasensitive quantification of proteins. For example, an LSPR-shift assay was used to measure concentrations of amyloid-derived diffusible ligands (ADDLs), a neurotoxin that is thought to be important in the pathology of Alzheimer’s disease43–45, at concentrations down to 100 fM (ref. 9). In the same study, elevated concentrations of ADDLs were detected in brain extract and cerebrospinal fluid of an Alzheimer’s patient in comparison with an ageing control9. Similarly elevated levels of ADDLs were observed in a population of 15 Alzheimer’s patients and 15 ageing controls by using a ‘bio-barcode’ assay that uses plasmonic nanoparticle labels46.
The remainder of this review describes the three most significant challenges for plasmonic biosensors: first, pushing sensitivity towards the single-molecule detection limit; second, combining LSPR with molecular identification techniques such as surface-enhanced Raman spectroscopy (SERS) and laser desorption ionization mass spectrometry; and third, the practical development of sensors and instrumentation for routine and high-throughput detection.
imPrOViNg tHe deteCtiON limit
The LSPR spectral shift (Δλ) in response to changes in refractive index is approximately described as
Δλ ≈ m(nadsorbate − nmedium)(1 − e−2d/ld) (1)
where m is the sensitivity factor (in nm per refractive index unit (RIU)), nadsorbate and nmedium are the refractive indices (in RIU) of the adsorbate and medium surrounding the nanoparticle, respectively, d is the effective thickness of the adsorbate layer (in nm), and ld is the electromagnetic field decay length (in nm)3. LSPR shifts are maximized by optimizing the nanoparticle characteristics, m and ld, as well as the Δn due to molecular adsorption. The former requires careful selection of nanoparticle size, shape and composition, and the latter can be achieved with the use of larger molecules and
resonant labels. In this review we describe how LSPR sensitivity can be enhanced by improving instrumental resolution, using novel nanofabrication techniques, shifting from particle arrays to single-nanoparticle sensors, and carefully choosing resonant labels that couple with the nanoparticle plasmon resonance.
iNstrumeNtAl resOlutiONAdvances in LSPR instrumentation and analysis made by Dahlin and co-workers have allowed the detection of LSPR spectral shifts with a noise level of less than 5 × 10⁻⁴ nm and less than 5 × 10⁻⁶ extinction units for 2-s acquisitions10. We term this high-resolution LSPR (HR-LSPR) spectroscopy. Using plasmonic nanohole arrays functionalized with biotin, Dahlin et al. measured neutravidin binding in real time with a detection limit of less than 0.1 ng cm−2 (ref. 10). This level of precision, comparable to that of commercial SPR sensors, provides a signal-to-noise ratio (S/N) of ~2,000 for typical (molecular mass ~60 kDa) protein-binding reactions.
This improvement in resolution results from collecting more light by using photodiode arrays with high saturation levels to reduce shot noise, and from the use of improved fitting algorithms to calculate λmax in real time. By collecting large numbers of photons, it is possible to determine the LSPR peak position (centroid) with much greater accuracy than either the grating resolution of the spectrometer (a few nanometres for commonly used fibre-coupled portable spectrometers, depending on the slit width and gratings) or the LSPR spectral linewidth full-width at half-maximum (FWHM), which is typically on the order of 100 nm for silver nanoprism arrays. This spectral super-resolution is analogous to spatial super-resolution used to track single fluorescent molecules to nanometre resolution (far better than either the pixel spacing or the diffraction-limited spot size)47,48. The use of photodiode-array spectrometers with high saturation capacities, of order 10 billion photoelectrons per pixel per second, has therefore greatly enhanced LSPR resolution. This high resolution enables the detection of weaker signals, improving the resolution of real-time binding kinetics experiments. An important challenge will be to use HR-LSPR spectroscopy to observe new information about the dynamics of protein conformational changes that cause subtle changes in peak wavelength and shape49. Another challenge will be to apply HR-LSPR spectroscopy to more complex systems such as tracking
95 120 145 145 145150150
565 638 720 747 782497446
48 46 59 55 506270
120
42
426
Wavelength (nm)
400 500 600 700 800 900
Norm
aliz
ed e
xtin
ctio
n
Width
Height
Shapeλmax
© 2
001
MRS
Figure 1 effect of size and shape on lsPr extinction spectrum for silver nanoprisms and nanodiscs formed by nanosphere lithography. the high-frequency signal on the spectra is an interference pattern from the reflection at the front and back surfaces of the mica. reprinted with permission from ref. 132.
© 2008 Nature Publishing Group
444 nature materials | VOL 7 | JUNE 2008 | www.nature.com/naturematerials
REVIEW ARTICLE
the binding and changes in membrane composition of intracellular systems based on single-nanoparticle spectra. Intracellular HR-LSPR spectroscopy and imaging of single nanoparticles will require the use of instruments with high spectral, spatial and temporal resolutions. In addition to inherent tradeoffs between spectral sensitivity and spatial/temporal resolution, sensitivity will be affected by background cellular scattering and extinction. Choosing methods to reduce or account for these background signals will be an important aspect of this work.
iNCreAsiNg tHe seNsitiVity Of lsPrThe sensitivity of LSPR sensors to local changes in refractive index is highly dependent on plasmon characteristics such as spectral linewidth, extinction intensity and electromagnetic-field strength and decay length. Understanding how nanoparticle characteristics affect these LSPR properties and optimizing nanoparticle design are a significant focus of current plasmonics research. The sensitivity of LSPR sensors continues to improve as nanoparticle designs and nanofabrication methods advance.
In general, increasing the aspect ratio (width/height) of NSL-fabricated nanoparticles results in redshifts in λmax, higher m values and longer electromagnetic field decay lengths. In addition, theoretical modelling has shown that sharp nanoparticle features give rise to hot-spots in the electromagnetic fields that increase the sensitivity to local refractive index50 and amplify surface-enhanced spectroscopies14–22. The effective electromagnetic decay length ld can be tuned by changing the thickness and lateral dimensions of arrays of nanoprisms42.
Alternative sensing modalities that use gold nanohole arrays and composite crystalline-metal nanostructures have been shown to exhibit even greater sensitivity in response to refractive index changes. Hicks and co-workers developed a plasmonic structure termed “film over nanowell” by first using reactive ion etching through an NSL sphere mask and removing the spheres to form a nanowell array, and then vapour-depositing a silver film over the nanowells51. The structure exhibited plasmon peaks with a FWHM as narrow as 35 nm (0.13 eV), and good refractive index sensitivity (m = 538 nm RIU−1 or 2 eV RIU−1) with an overall figure of merit (FOM), m/FWHM (where both are measured in eV), of 14.5, surpassing the typical FOM for nanoprism arrays of about 3. Using a similar nanostructure, Henzie and co-workers reported a FOM of more than 23 for ordered arrays of nanoholes in gold fabricated by soft interference lithography52. The high FOM for these arrays, which exhibit a moderate m value
of ~300 nm RIU−1 (0.75 eV RIU−1) is derived primarily from the narrow plasmon linewidth of 14.5 nm (0.032 eV) FWHM. Creatively designed nanostructures such as these demonstrate that the sensitivity of LSPR-based sensors continues to improve as advances are made in nanofabrication techniques.
In addition to increasing m values by controlling nanoparticle size, shape and composition, LSPR sensitivity can be improved by narrowing spectral linewidths and increasing extinction. Polydispersity in nanoparticle size and shape, especially those based on wet synthetic techniques, significantly broadens LSPR extinction bands. The next section will focus on how these issues can be overcome with the use of single-nanoparticle spectroscopy.
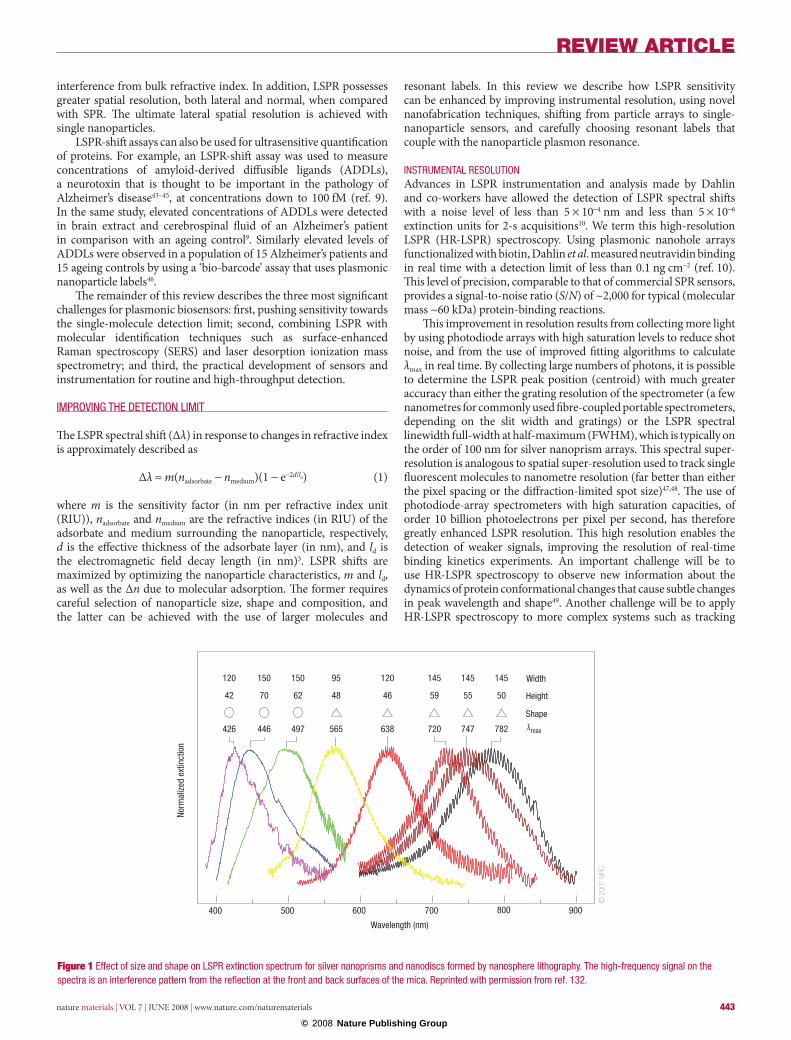
siNgle-NANOPArtiCle seNsOrsMost LSPR spectroscopy has been performed with large ensembles of nanoparticles. However, each nanoparticle in the ensemble could potentially serve as an independent sensor. Indeed, the Van Duyne and Klar labs recently demonstrated an LSPR-shift assay with single nanoparticles11,12,53. Single-nanoparticle sensors offer improved absolute detection limits (total number of molecules detected) and also enable higher spatial resolution in multiplexed assays. In addition, single nanoparticles with especially narrow bandwidths can be selected from a field of view to provide better S/N resolution. Finally, single nanoparticles have promising applications for measurements in solution, or inside cells and tissues where fixed arrays are unable to penetrate38,39,54–57. Figure 2a,b shows the shift in LSPR scattering spectrum from a single silver nanoparticle fixed to a glass coverslip in solvents with increasing refractive index. Figure 2c shows the real-time assembly of an octanethiol self-assembled monolayer (SAM) from a 1 mM ethanolic solution onto a single silver nanoparticle. It was estimated that a fully assembled SAM covering a single silver nanoparticle with a surface area of 14,000 nm2 has 60,000 molecules on its surface. At saturation, octanethiol produced a shift of ~8 nm, for an average shift of 10−4 nm per molecule. A single exponential fit yielded a rate constant of 0.017 s−1, and an initial binding rate of ~1,000 molecules s−1.
Although single nanoparticles enable sensitive chemical detection with high spatial resolution, nanoparticle size must be selected with care to ensure sufficient signal intensity for LSPR-shift assays. Smaller nanoparticles are advantageous in protein labelling and cellular imaging because their smaller surface area reduces non-specific interactions and enables more targeted binding. In addition, smaller
450 500 550 600 650 7000
20
40
60
80 510.2 574.2
588.0 600.8
611.9
1 1.2 1.4 1.6480
520
560
600
640
Wavelength (nm) n
0 100 200 300608
610
612
614
616
618
620
Time (s)
λ max
(nm
)
λ max
(nm
)
λ max
(nm
)
λmax = 203.1*RI + 306.5
© 2
003
ACS
Figure 2 single-nanoprism lsPr. a, resonant rayleigh scattering spectrum from a single silver nanoparticle in various solvent environments (left to right): nitrogen, methanol, propan-1-ol, chloroform and benzene. b, Plot depicting the linear relationship between the solvent refractive index n and the lsPr λmax; the regression equation is λ = 203.1n + 306.5. c, monitoring the real-time adsorption of octanethiol (1 mm) onto a single nanoparticle. At this concentration, the rate constant is estimated to be 0.017 s−1. reprinted with permission from ref. 11.
© 2008 Nature Publishing Group
REVIEW ARTICLE
nature materials | VOL 7 | JUNE 2008 | www.nature.com/naturematerials 445
particles produce more confined electromagnetic fields so they are more sensitive to single molecules, which occupy a greater portion of their sensing region. However, the nanoparticle absorbance and scattering depend strongly on nanoparticle size, scaling with nanoparticle volume for absorbance and with volume squared for scattering. Absorbance and scattering cross-sections become comparable when the nanospheres are about 60 nm in diameter for silver nanospheres and 80 nm in diameter for gold nanospheres6,58, and nanoparticles less than 20 nm in diameter are challenging to observe. Several exciting developments have enabled smaller gold nanoparticles to be observed over extended periods without bleaching54,55,58,59. These techniques have primarily been used to track protein migration inside cells. However, the techniques could also be used to detect binding and conformational changes by using LSPR spectral shifts.
Confocal reflection imaging allows the detection of nanoparticles with diameters as small as 15 nm inside single cells and 5 nm in solution55. To measure the spectra from smaller nanoparticles, it becomes necessary either to rely on interference methods to amplify the scattering signal, or to measure absorbance, which provides a stronger signal than scattering for small particles58. The simplest method to detect nanoparticle absorbance is to track transmission by using bright-field imaging. With bright-field imaging and digitally enhanced contrast, single 10-nm nanoparticles can be tracked at video rate inside cells59,60. However, the S/N for a weakly absorbing particle is limited by noise on the majority of light that is transmitted.
To detect nanoparticle absorbance directly instead of monitoring transmission, one can monitor the temperature increase caused by optically heating the nanoparticles and their surroundings (that is, photothermal imaging)54,61 or one can monitor the pressure wave created during rapid heating with photoacoustic imaging62,63. Photothermal imaging provides high-resolution nanoparticle tracking, whereas photoacoustic imaging has been used for imaging in tissues.
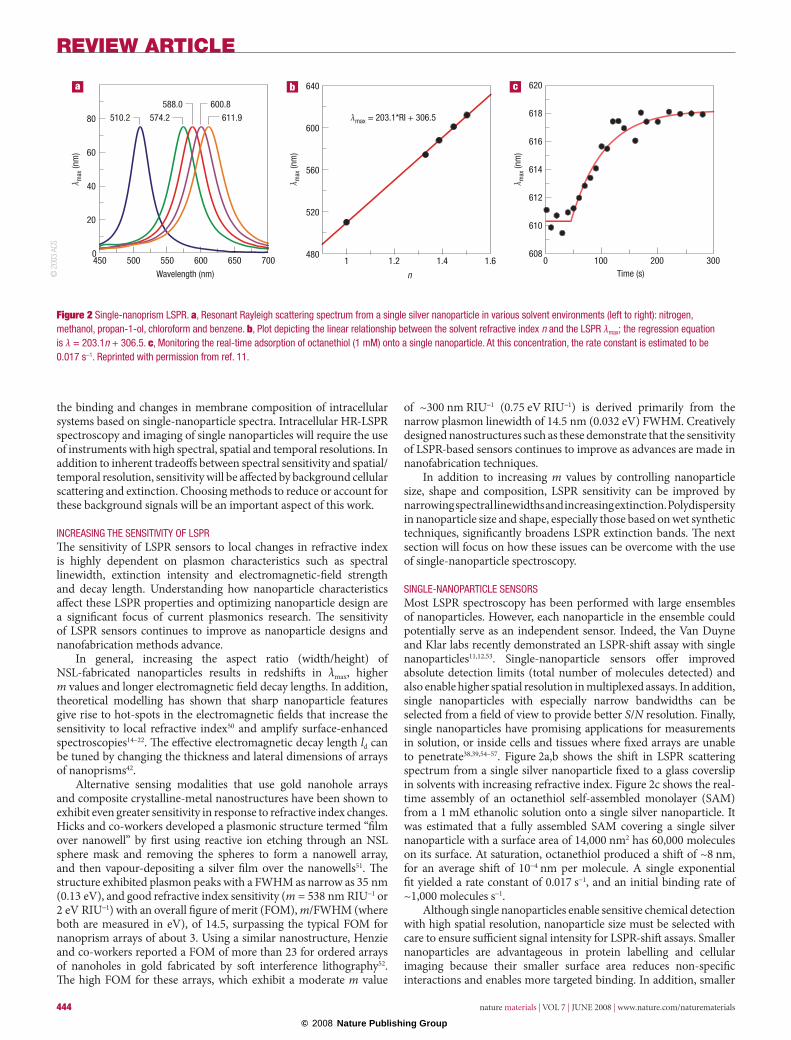
To perform photothermal imaging, a modulated pump laser beam is used to heat the nanoparticles, and a probe beam is used to detect the deflection caused by the thermally induced change in the refractive index. Using photothermal microscopy, single 5-nm gold nanoparticles have been tracked in living cells at video rate (see Fig. 3)54. In addition, the absorption spectrum of single 2-nm gold nanoparticles was acquired by measuring photothermal absorption54. At 37 °C, a temperature increase of 1 K typically leads to a 10−4 change in the refractive index of water; at higher temperatures this thermorefractive coefficient increases. The use of photothermal imaging is extremely promising for following protein trafficking over arbitrarily long time intervals with the use of individual nanoparticle labels. It is also expected that combining photothermal image tracking with LSPR spectroscopy will enable high-resolution information on molecular conformations and interactions to be obtained in the near future.
In addition to passive detection, photothermal effects can be used to heat plasmonic nanoparticles selectively for cancer therapy. Recently, researchers used gold nanoparticles to target cancer cells that overexpressed epidermal growth factor receptor (EGFR) and were thereby able to differentiate between cancer cells and normal cells. The nanoparticles were then used as photothermal agents to kill cancer cells selectively when illuminated by 514-nm light that was near the λmax of the gold nanospheres64. Loo and co-workers used a similar photothermal therapy technique, but they used gold nanoshells with near-infrared resonances and used a near-infrared laser to kill nanoshell-labelled breast cancer cells that overexpressed the HER2 receptor40. Larson and co-workers achieved even greater photothermal selectivity by observing that highly proliferative cells express sufficient EGFR to cause receptor clustering and nanoparticle aggregation, resulting in an absorbance and scattering
redshift. They used anti-EGFR-conjugated gold nanospheres with individual resonances of ~532 nm to target cancer cells, but used a 700-nm laser to selectively heat and kill only cells labelled with nanoparticle aggregates65.
Photoacoustic imaging uses a similarly modulated laser source to heat nanoparticles but detects the light absorption by monitoring the resultant acoustic waves. The method offers the advantages of a deep optical penetration depth using near-infrared-resonant plasmonic nanoparticles, minimal interference from optical scattering, high signal contrast, and simple integration with conventional ultrasound devices62. In addition, multiple functionalities can be integrated
2 µm
Cy5
Gold NP
Anti-lgG
Receptor
Cell membrane
5 nm
Anti-Myc
Signal
Num
ber o
f occ
urre
nces
0
00
1
2
20Time (s)
Sign
al
0
400
500
300
200
100
1 2 3 4
500 nm
© 2
006
BIOP
HYSI
CAL
SOCI
ETY
Figure 3 Photothermal imaging of gold nanoparticles in a living cell. a, Biological construct. NP, nanoparticle. b, Histogram of the signals for 5-nm gold nanoparticles detected on COs7 cells. c, Photothermal image of a portion of a transfected COs7 cell labelled with 5-nm gold nanoparticles detected with S/N ≈ 30. moving nanoparticles during the raster scan of the sample produce characteristic stripe signals. the lines are trajectories recorded with single receptors diffusing on the cell membrane. d, Zoom onto one recorded trajectory. e, time trace of the signal amplitude calculated from the triangulation process while tracking one of the nanoparticles. increased signal fluctuations correspond to the nanoparticle in a fast diffusive state. reprinted with permission from ref. 54.
© 2008 Nature Publishing Group
446 nature materials | VOL 7 | JUNE 2008 | www.nature.com/naturematerials
REVIEW ARTICLE
into the photoacoustic nanoparticle platform, including magnetic properties. Hybrid magnetic–plasmonic nanoparticles can be magnetically pulled or rotated to modulate optical signals and increase contrast66,67. They have also been used as combined photoacoustic, dark-field and magnetic-resonance-imaging contrast agents as well as vehicles for photothermal cancer therapy65.
metHOds tO eNHANCe tHe lsPr sHiftThe previous sections have described methods of improving the sensitivity of nanoparticle structures and spectrometers. A complementary approach to increasing sensitivity, potentially towards the single-molecule limit, is to increase the effective change in refractive index per molecular binding event. This shift can be increased in at least three ways. First, larger molecules produce larger shifts roughly in proportion to the mass of the molecule50,68,69. Thus, proteins and macromolecules produce larger molecular shifts per molecule than small SAM molecules. Second, chromophores that absorb visible light couple strongly with the LSPR of nanoparticles to produce surprisingly large shifts70,71 and can be used to detect small molecules binding to protein receptors72. Third, pairs of nanoparticles that are separated by less than about 2.5 particle radii show plasmonic coupling and marked spectral shifts73,74. The latter two amplification methods are both based on plasmon resonance coupling, described in more detail below.
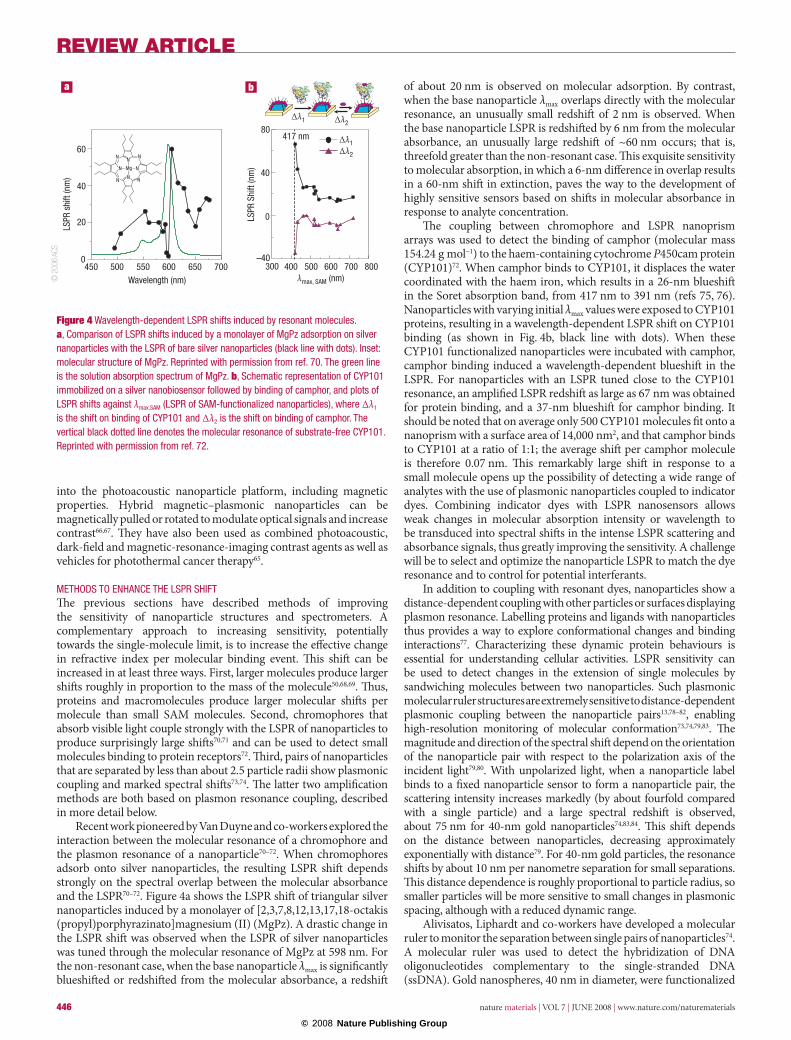
Recent work pioneered by Van Duyne and co-workers explored the interaction between the molecular resonance of a chromophore and the plasmon resonance of a nanoparticle70–72. When chromophores adsorb onto silver nanoparticles, the resulting LSPR shift depends strongly on the spectral overlap between the molecular absorbance and the LSPR70–72. Figure 4a shows the LSPR shift of triangular silver nanoparticles induced by a monolayer of [2,3,7,8,12,13,17,18-octakis(propyl)porphyrazinato]magnesium (II) (MgPz). A drastic change in the LSPR shift was observed when the LSPR of silver nanoparticles was tuned through the molecular resonance of MgPz at 598 nm. For the non-resonant case, when the base nanoparticle λmax is significantly blueshifted or redshifted from the molecular absorbance, a redshift
of about 20 nm is observed on molecular adsorption. By contrast, when the base nanoparticle λmax overlaps directly with the molecular resonance, an unusually small redshift of 2 nm is observed. When the base nanoparticle LSPR is redshifted by 6 nm from the molecular absorbance, an unusually large redshift of ~60 nm occurs; that is, threefold greater than the non-resonant case. This exquisite sensitivity to molecular absorption, in which a 6-nm difference in overlap results in a 60-nm shift in extinction, paves the way to the development of highly sensitive sensors based on shifts in molecular absorbance in response to analyte concentration.
The coupling between chromophore and LSPR nanoprism arrays was used to detect the binding of camphor (molecular mass 154.24 g mol−1) to the haem-containing cytochrome P450cam protein (CYP101)72. When camphor binds to CYP101, it displaces the water coordinated with the haem iron, which results in a 26-nm blueshift in the Soret absorption band, from 417 nm to 391 nm (refs 75, 76). Nanoparticles with varying initial λmax values were exposed to CYP101 proteins, resulting in a wavelength-dependent LSPR shift on CYP101 binding (as shown in Fig. 4b, black line with dots). When these CYP101 functionalized nanoparticles were incubated with camphor, camphor binding induced a wavelength-dependent blueshift in the LSPR. For nanoparticles with an LSPR tuned close to the CYP101 resonance, an amplified LSPR redshift as large as 67 nm was obtained for protein binding, and a 37-nm blueshift for camphor binding. It should be noted that on average only 500 CYP101 molecules fit onto a nanoprism with a surface area of 14,000 nm2, and that camphor binds to CYP101 at a ratio of 1:1; the average shift per camphor molecule is therefore 0.07 nm. This remarkably large shift in response to a small molecule opens up the possibility of detecting a wide range of analytes with the use of plasmonic nanoparticles coupled to indicator dyes. Combining indicator dyes with LSPR nanosensors allows weak changes in molecular absorption intensity or wavelength to be transduced into spectral shifts in the intense LSPR scattering and absorbance signals, thus greatly improving the sensitivity. A challenge will be to select and optimize the nanoparticle LSPR to match the dye resonance and to control for potential interferants.
In addition to coupling with resonant dyes, nanoparticles show a distance-dependent coupling with other particles or surfaces displaying plasmon resonance. Labelling proteins and ligands with nanoparticles thus provides a way to explore conformational changes and binding interactions77. Characterizing these dynamic protein behaviours is essential for understanding cellular activities. LSPR sensitivity can be used to detect changes in the extension of single molecules by sandwiching molecules between two nanoparticles. Such plasmonic molecular ruler structures are extremely sensitive to distance-dependent plasmonic coupling between the nanoparticle pairs13,78–82, enabling high-resolution monitoring of molecular conformation73,74,79,83. The magnitude and direction of the spectral shift depend on the orientation of the nanoparticle pair with respect to the polarization axis of the incident light79,80. With unpolarized light, when a nanoparticle label binds to a fixed nanoparticle sensor to form a nanoparticle pair, the scattering intensity increases markedly (by about fourfold compared with a single particle) and a large spectral redshift is observed, about 75 nm for 40-nm gold nanoparticles74,83,84. This shift depends on the distance between nanoparticles, decreasing approximately exponentially with distance79. For 40-nm gold particles, the resonance shifts by about 10 nm per nanometre separation for small separations. This distance dependence is roughly proportional to particle radius, so smaller particles will be more sensitive to small changes in plasmonic spacing, although with a reduced dynamic range.
Alivisatos, Liphardt and co-workers have developed a molecular ruler to monitor the separation between single pairs of nanoparticles74. A molecular ruler was used to detect the hybridization of DNA oligonucleotides complementary to the single-stranded DNA (ssDNA). Gold nanospheres, 40 nm in diameter, were functionalized
0
20
40
60N
N N
N
N
N N
N
–40
40
80417 nm
0LSPR
Shi
ft (n
m)
λmax, SAM (nm)300 400 500 600 700 800
Wavelength (nm)450 500 550 600 650 700
LSPR
shi
ft (n
m)
Mg
∆λ1
∆λ1
∆λ2
∆λ2
© 2
006
ACS
Figure 4 Wavelength-dependent lsPr shifts induced by resonant molecules. a, Comparison of lsPr shifts induced by a monolayer of mgPz adsorption on silver nanoparticles with the lsPr of bare silver nanoparticles (black line with dots). inset: molecular structure of mgPz. reprinted with permission from ref. 70. the green line is the solution absorption spectrum of mgPz. b, schematic representation of CyP101 immobilized on a silver nanobiosensor followed by binding of camphor, and plots of lsPr shifts against λmax,sAm (lsPr of sAm-functionalized nanoparticles), where Δλ1 is the shift on binding of CyP101 and Δλ2 is the shift on binding of camphor. the vertical black dotted line denotes the molecular resonance of substrate-free CyP101. reprinted with permission from ref. 72.
© 2008 Nature Publishing Group
REVIEW ARTICLE
nature materials | VOL 7 | JUNE 2008 | www.nature.com/naturematerials 447
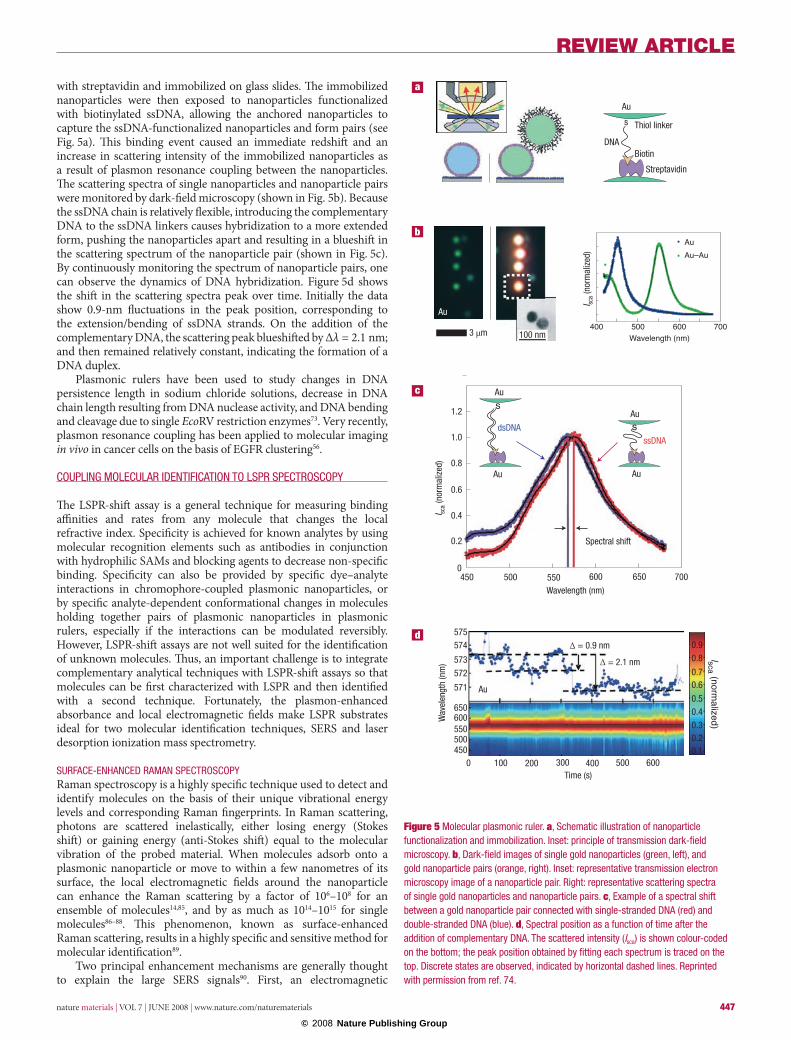
with streptavidin and immobilized on glass slides. The immobilized nanoparticles were then exposed to nanoparticles functionalized with biotinylated ssDNA, allowing the anchored nanoparticles to capture the ssDNA-functionalized nanoparticles and form pairs (see Fig. 5a). This binding event caused an immediate redshift and an increase in scattering intensity of the immobilized nanoparticles as a result of plasmon resonance coupling between the nanoparticles. The scattering spectra of single nanoparticles and nanoparticle pairs were monitored by dark-field microscopy (shown in Fig. 5b). Because the ssDNA chain is relatively flexible, introducing the complementary DNA to the ssDNA linkers causes hybridization to a more extended form, pushing the nanoparticles apart and resulting in a blueshift in the scattering spectrum of the nanoparticle pair (shown in Fig. 5c). By continuously monitoring the spectrum of nanoparticle pairs, one can observe the dynamics of DNA hybridization. Figure 5d shows the shift in the scattering spectra peak over time. Initially the data show 0.9-nm fluctuations in the peak position, corresponding to the extension/bending of ssDNA strands. On the addition of the complementary DNA, the scattering peak blueshifted by Δλ = 2.1 nm; and then remained relatively constant, indicating the formation of a DNA duplex.
Plasmonic rulers have been used to study changes in DNA persistence length in sodium chloride solutions, decrease in DNA chain length resulting from DNA nuclease activity, and DNA bending and cleavage due to single EcoRV restriction enzymes73. Very recently, plasmon resonance coupling has been applied to molecular imaging in vivo in cancer cells on the basis of EGFR clustering56.
COuPliNg mOleCulAr ideNtifiCAtiON tO lsPr sPeCtrOsCOPy
The LSPR-shift assay is a general technique for measuring binding affinities and rates from any molecule that changes the local refractive index. Specificity is achieved for known analytes by using molecular recognition elements such as antibodies in conjunction with hydrophilic SAMs and blocking agents to decrease non-specific binding. Specificity can also be provided by specific dye–analyte interactions in chromophore-coupled plasmonic nanoparticles, or by specific analyte-dependent conformational changes in molecules holding together pairs of plasmonic nanoparticles in plasmonic rulers, especially if the interactions can be modulated reversibly. However, LSPR-shift assays are not well suited for the identification of unknown molecules. Thus, an important challenge is to integrate complementary analytical techniques with LSPR-shift assays so that molecules can be first characterized with LSPR and then identified with a second technique. Fortunately, the plasmon-enhanced absorbance and local electromagnetic fields make LSPR substrates ideal for two molecular identification techniques, SERS and laser desorption ionization mass spectrometry.
surfACe-eNHANCed rAmAN sPeCtrOsCOPyRaman spectroscopy is a highly specific technique used to detect and identify molecules on the basis of their unique vibrational energy levels and corresponding Raman fingerprints. In Raman scattering, photons are scattered inelastically, either losing energy (Stokes shift) or gaining energy (anti-Stokes shift) equal to the molecular vibration of the probed material. When molecules adsorb onto a plasmonic nanoparticle or move to within a few nanometres of its surface, the local electromagnetic fields around the nanoparticle can enhance the Raman scattering by a factor of 106–108 for an ensemble of molecules14,85, and by as much as 1014–1015 for single molecules86–88. This phenomenon, known as surface-enhanced Raman scattering, results in a highly specific and sensitive method for molecular identification89.
Two principal enhancement mechanisms are generally thought to explain the large SERS signals90. First, an electromagnetic
Streptavidin
Biotin
Thiol linker
DNA
AuAu–Au
I sca (
norm
aliz
ed)
700600500400Wavelength (nm)3 µm
Au
100 nm
0.10.20.3
0.40.5
0.60.7
0.80.9
Isca (normalized)
600500400300200100Time (s)
0
700650600550500450
Wavelength (nm)
Wav
elen
gth
(nm
)
0
0.2
0.4
0.6
0.8
1.0
1.2
I sca (
norm
aliz
ed)
450500550600650
571
572
573
574575
Au
Au
Au Au
s
sdsDNAssDNA
Spectral shift
Au
∆ = 0.9 nm
∆ = 2.1 nm
Au
s
Figure 5 molecular plasmonic ruler. a, schematic illustration of nanoparticle functionalization and immobilization. inset: principle of transmission dark-field microscopy. b, dark-field images of single gold nanoparticles (green, left), and gold nanoparticle pairs (orange, right). inset: representative transmission electron microscopy image of a nanoparticle pair. right: representative scattering spectra of single gold nanoparticles and nanoparticle pairs. c, example of a spectral shift between a gold nanoparticle pair connected with single-stranded dNA (red) and double-stranded dNA (blue). d, spectral position as a function of time after the addition of complementary dNA. the scattered intensity (Isca) is shown colour-coded on the bottom; the peak position obtained by fitting each spectrum is traced on the top. discrete states are observed, indicated by horizontal dashed lines. reprinted with permission from ref. 74.
© 2008 Nature Publishing Group
448 nature materials | VOL 7 | JUNE 2008 | www.nature.com/naturematerials
REVIEW ARTICLE
enhancement factor arises because LSPR modes in the metal nanoparticles focus the incident light energy at the nanoparticle surface and also increase the density of states at Stokes-shifted wavelengths. The electromagnetic enhancement factor is typically 105–108 for nanoprisms, but simulations indicate that it can be as large as 1013 for structures such as arrays of nanoprism dimers91. Second, chemical enhancement factors arise from changes in the molecular electronic state or resonant enhancements from either existing molecular excitations or newly formed charge transfer states. When
molecules are excited by light resonant with an electronic absorbance, an additional enhancement factor of ~101–103 is observed in comparison with non-resonant excitation. Single-molecule SERS has been reported for such resonantly excited dyes on a small percentage of ‘hot’ nanoparticles with enhancement factors of up to 1014–1015 in total86−88.
The electromagnetic enhancement in SERS results from Raman excitation and emission coupling with the nanoparticle LSPR modes. Because the LSPR can be easily tuned by changing the size and shape of nanoparticles, LSPR sensors are ideal candidates for a complementary molecular identification platform with SERS. The enhancement is greatest when the LSPR λmax falls between the excitation wavelength and the wavelength of the scattered photon85. For a particular Raman band, the optimal condition is achieved when the LSPR λmax equals the excitation wavelength (in absolute wavenumbers) minus one-half the Stokes shift of the band.
The complementary nature of LSPR and SERS was demonstrated by tuning LSPR substrates to optimize SERS signals. SERS-active substrates were fabricated by drop-coating a layer of nanospheres on a glass or metal substrate and subsequently depositing a 200-nm-thick silver film over nanospheres (AgFON). By varying the diameter of the nanospheres, the LSPR λmax can be tuned to couple with the 750-nm excitation wavelength used in the experiments. Although AgFON substrates have broader LSPR resonances than NSL nanoprism arrays, they provide a large surface area available for binding and detection92. Because 200-nm films are not transparent, LSPR spectra are measured in reflectance mode with the minimum spectral reflectivity corresponding to LSPR λmax. With increasing sphere diameter, the LSPR λmax redshifts, making it more appropriate for near-infrared excitation.
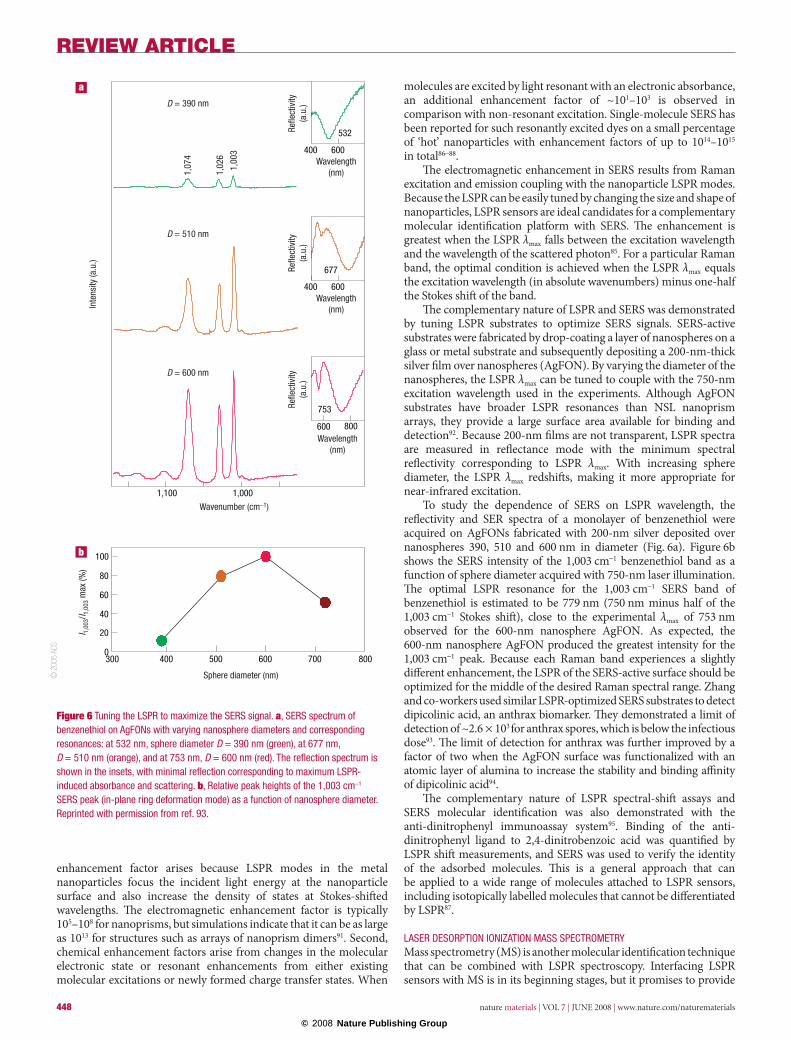
To study the dependence of SERS on LSPR wavelength, the reflectivity and SER spectra of a monolayer of benzenethiol were acquired on AgFONs fabricated with 200-nm silver deposited over nanospheres 390, 510 and 600 nm in diameter (Fig. 6a). Figure 6b shows the SERS intensity of the 1,003 cm−1 benzenethiol band as a function of sphere diameter acquired with 750-nm laser illumination. The optimal LSPR resonance for the 1,003 cm−1 SERS band of benzenethiol is estimated to be 779 nm (750 nm minus half of the 1,003 cm−1 Stokes shift), close to the experimental λmax of 753 nm observed for the 600-nm nanosphere AgFON. As expected, the 600-nm nanosphere AgFON produced the greatest intensity for the 1,003 cm−1 peak. Because each Raman band experiences a slightly different enhancement, the LSPR of the SERS-active surface should be optimized for the middle of the desired Raman spectral range. Zhang and co-workers used similar LSPR-optimized SERS substrates to detect dipicolinic acid, an anthrax biomarker. They demonstrated a limit of detection of ~2.6 × 10³ for anthrax spores, which is below the infectious dose93. The limit of detection for anthrax was further improved by a factor of two when the AgFON surface was functionalized with an atomic layer of alumina to increase the stability and binding affinity of dipicolinic acid94.
The complementary nature of LSPR spectral-shift assays and SERS molecular identification was also demonstrated with the anti-dinitrophenyl immunoassay system95. Binding of the anti-dinitrophenyl ligand to 2,4-dinitrobenzoic acid was quantified by LSPR shift measurements, and SERS was used to verify the identity of the adsorbed molecules. This is a general approach that can be applied to a wide range of molecules attached to LSPR sensors, including isotopically labelled molecules that cannot be differentiated by LSPR87.
lAser desOrPtiON iONiZAtiON mAss sPeCtrOmetryMass spectrometry (MS) is another molecular identification technique that can be combined with LSPR spectroscopy. Interfacing LSPR sensors with MS is in its beginning stages, but it promises to provide
Wavelength(nm)
Wavelength(nm)
Wavelength(nm)
532
400 600
1,100 1,000
Wavenumber (cm–1)
Inte
nsity
(a.u
.)
1,07
4
1,02
6
1,00
3
500 600 700 800
Sphere diameter (nm)
400300
677
400 600
600 800
753
Refle
ctiv
ity(a
.u.)
Refle
ctiv
ity(a
.u.)
Refle
ctiv
ity(a
.u.)
D = 390 nm
D = 510 nm
D = 600 nm
I 1,00
3/I 1,
003
max
(%)
20
0
40
60
80
100
© 2
005
ACS
Figure 6 tuning the lsPr to maximize the sers signal. a, sers spectrum of benzenethiol on AgfONs with varying nanosphere diameters and corresponding resonances: at 532 nm, sphere diameter D = 390 nm (green), at 677 nm, D = 510 nm (orange), and at 753 nm, D = 600 nm (red). the reflection spectrum is shown in the insets, with minimal reflection corresponding to maximum lsPr-induced absorbance and scattering. b, relative peak heights of the 1,003 cm−1 sers peak (in-plane ring deformation mode) as a function of nanosphere diameter. reprinted with permission from ref. 93.
© 2008 Nature Publishing Group
REVIEW ARTICLE
nature materials | VOL 7 | JUNE 2008 | www.nature.com/naturematerials 449
information on unknown molecules adsorbed on LSPR sensor arrays as well as a mechanism for laser desorption ionization based on plasmon-assisted photothermal heating and photoionization.
Early work with continuous films of silver, gold and aluminium demonstrated a remarkable enhancement in metal-ion and peptide signal when the film was illuminated by visible light at the critical angle needed to excite a propagating surface plasmon resonace96–98. Recent work by Chen and co-workers has demonstrated a similar plasmon-assisted laser desorption ionization by using LSPR in nanoparticles99,100. Gold nanorods were fabricated by electrochemically depositing gold in nanoporous alumina templates. When the nanorods were
optically excited by a 532-nm Nd–YAG laser near their resonant absorbance wavelength, molecular desorption and ionization were greatly enhanced in comparison with continuous films. As expected, the MS intensity depended on the length of the nanorods and the polarization of the incident light.
Plasmonic nanoparticles have also been used to enhance MS imaging, although the enhancement mechanisms have not yet been elucidated. Altelaar and co-workers recently demonstrated that sputtering gold nanoparticles onto tissue sections improved the signal strength and image quality of images from both secondary ion mass spectrometry and ultraviolet matrix-assisted laser desorption
1 cm
Nanoparticle layer formed area
Anti-IgA
0.15
0.10
Abso
rban
ce
0.05
0
Anti-IgD
Anti-IgG
Anti-IgM
Anti-CRP
Anti-fibrinogen 0 g
1 mg ml–1
Antigen concentration
Anti-IgAantibody
IgA
0.12
01
1 mg ml–1
100 µg ml–1
100 ng ml–1
100 pg ml–1
100 fg ml–1
Bank (PBS buffer)1 fg ml–1
1 pg ml–1
1 ng ml–1
1 µg ml–1
Sam
ple
conc
entra
tion
2 3 4 5 6 7 8 9 10 11 12 13 14 15 16 17 18 19 20 21 22 23 24 25 26 27 28 29 30
∆ Absorbance
Anti-IgDantibody
Anti-IgGantibody
Anti-IgMantibody
Anti-CRPantibody
Anti-fibrinogenantibody
© 2
006
ACS
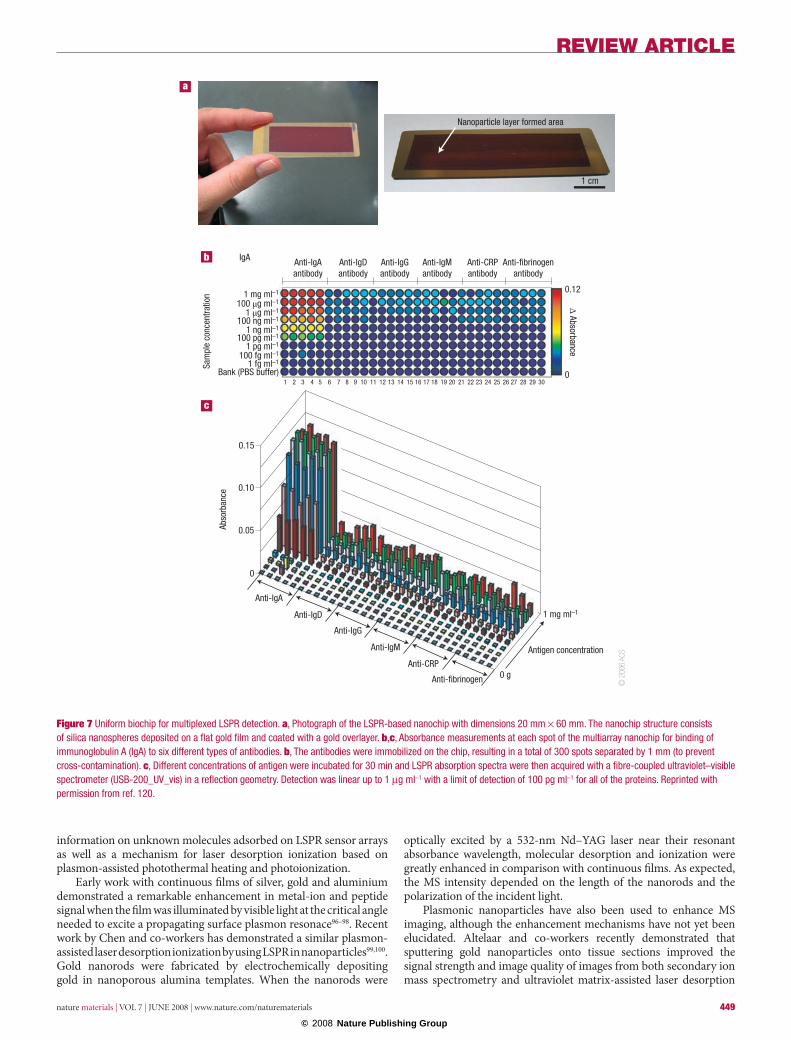
Figure 7 uniform biochip for multiplexed lsPr detection. a, Photograph of the lsPr-based nanochip with dimensions 20 mm × 60 mm. the nanochip structure consists of silica nanospheres deposited on a flat gold film and coated with a gold overlayer. b,c, Absorbance measurements at each spot of the multiarray nanochip for binding of immunoglobulin A (igA) to six different types of antibodies. b, the antibodies were immobilized on the chip, resulting in a total of 300 spots separated by 1 mm (to prevent cross-contamination). c, different concentrations of antigen were incubated for 30 min and lsPr absorption spectra were then acquired with a fibre-coupled ultraviolet–visible spectrometer (usB-200_uV_vis) in a reflection geometry. detection was linear up to 1 µg ml−1 with a limit of detection of 100 pg ml−1 for all of the proteins. reprinted with permission from ref. 120.
© 2008 Nature Publishing Group
450 nature materials | VOL 7 | JUNE 2008 | www.nature.com/naturematerials
REVIEW ARTICLE
ionization mass spectrometry101. In addition, nanoparticles can also improve MS analysis by separating and concentrating analytes by centrifugation102,103. An important challenge will be to integrate these separate developments in MS with advances in plasmonic nanoparticle targeting and sensing to enable targeted MS imaging and multimodal chemical analysis.
PrACtiCAl imPlemeNtAtiONs
The promise of LSPR sensors for measuring molecular concentrations8,9, binding kinetics10,11,42, dye absorbance spectra70–72 and conformational changes49,73,74 has now been firmly established. However, transforming these early sensor designs into robust, practical tools for a wider community is an important challenge that requires the development of uniform, well characterized, highly stable substrates and instruments. A few recent examples are presented to highlight how these goals are being pursued.
Because LSPR-based sensors are by design very sensitive to changes in the characteristics of nanoparticles, uniformity in nanoparticle size, shape and composition improve sensitivity and reliability. Uniform nanoparticles can be produced by using various techniques including nanosphere lithography33, electron-beam lithography35,36 and chemical synthesis29–32. Separation techniques such as electrophoresis can also be used to fractionate a polydisperse suspension into monodisperse subpopulations104,105. In addition to uniformity, it is also important to develop sensors that are stable against solvent annealing106 and photothermal annealing if high laser intensities are used107. To overcome these issues, particles can be pretreated in ethanol, water and bovine serum albumin to pre-anneal them108. The nanoparticles can also be protected by using controlled surface chemistries or by encapsulating them in inert layers such as silica or alumina94,108. These surface chemistries stabilize the sensing platform and provide different affinities, permitting the detection of a wider variety of analytes.
Although some molecules can be detected on bare nanoparticle arrays and bare FONs, many important analytes, such as glucose, have a low affinity for the bare metal surface. In addition, oxidation of the metal surface can limit sensor stability and shelf life109,110. Furthermore, bare nanoparticle surfaces offer limited possibilities for isolating the analyte from complex mixtures. To overcome these limitations, several methods have been used to functionalize substrates for improved affinity and selectivity. Detection is usually facilitated by the use of various coatings ranging from simple alkanes to complex macrocyclic molecules111,112. These molecules are anchored to the noble-metal surface by a thiol group and form a SAM. The SAMs serve many functions including stabilizing the nanoparticles, preventing non-specific binding, selectively binding the analyte of interest, and bringing the analyte to within a few nanometres of the nanostructured surface. In addition, antibodies can be immobilized on the SAM to facilitate protein detection. Research is also being conducted to find alternative surface chemistries to thiol-based SAMs, which often rearrange over timescales ranging from hours to months113,114, and suffer defects due to thermal desorption115 and photooxidation116,117. One method entails encapsulating the nanoparticles in a conformal layer of alumina or titania by using either atomic layer deposition or solution-phase sol–gel deposition. This technique protects the nanoparticle from annealing and broadens the scope of LSPR-based sensors by offering new chemical functionalities. For example, alumina selectively adsorbs polar compounds and is extremely stable against oxidation and high temperatures. Recently, alumina-functionalized AgFON substrates have been used in the quantitative detection of an anthrax biomarker, calcium dipicolinate. The alumina platform also markedly increased the shelf-life of the SERS sensor (more than a year at last count)94. The alumina layer can be further functionalized with self-assembled monolayers by using carboxylic-acid-terminated groups118 and silane chemistry119.
A
B
C
D
E
A
B
C
D
E
0 100 200 300 4000
100
200
300
400
Measured conc (mg/dL)
Pred
icte
d co
nc. (
mg
dl–1
)
5.56 11.11 16.67 22.22
Predicted conc. (mM
)
5.56
11.11
16.67
22.22
Optical windowCollection lens
Focuslens
BP
785 LPSpectrometer
CPUCCD
Ti: sapphire laser
Measured conc. (mM)
400 600 800 1,000Wavelength (nm)
10
20
30
40
Refle
ctan
ce (a
.u)
λmax = 808
λ ex =
785
500 nm
© 2
006
ACS
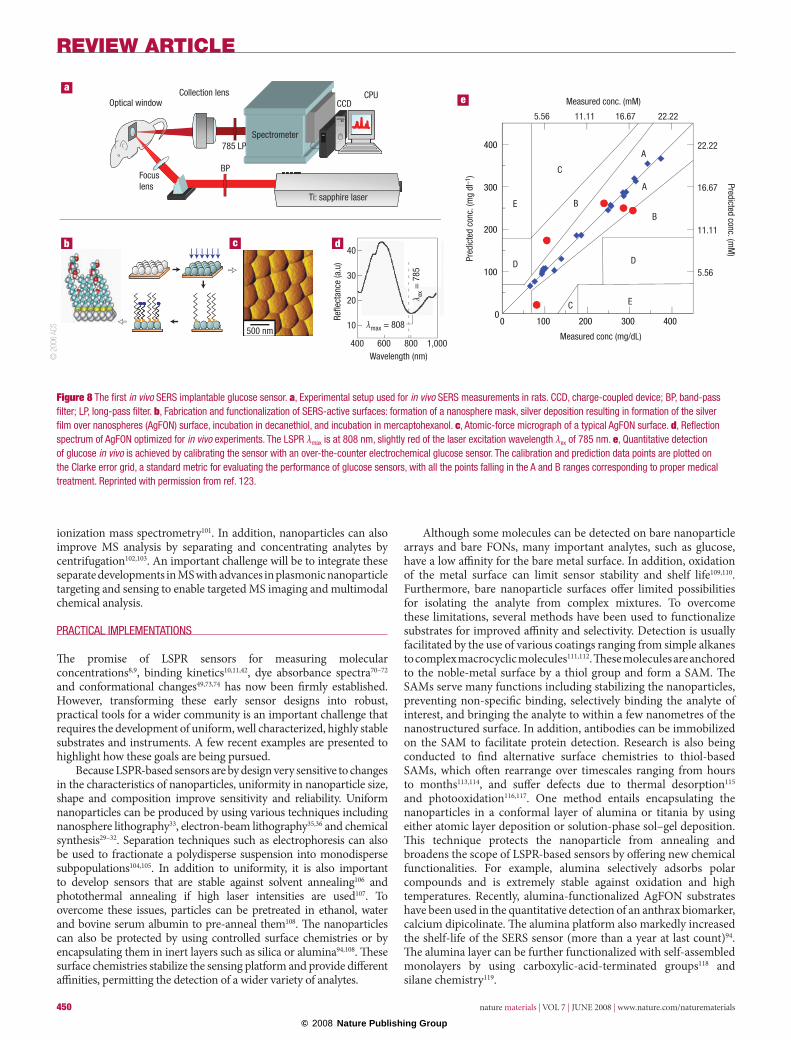
Figure 8 the first in vivo sers implantable glucose sensor. a, experimental setup used for in vivo sers measurements in rats. CCd, charge-coupled device; BP, band-pass filter; lP, long-pass filter. b, fabrication and functionalization of sers-active surfaces: formation of a nanosphere mask, silver deposition resulting in formation of the silver film over nanospheres (AgfON) surface, incubation in decanethiol, and incubation in mercaptohexanol. c, Atomic-force micrograph of a typical AgfON surface. d, reflection spectrum of AgfON optimized for in vivo experiments. the lsPr λmax is at 808 nm, slightly red of the laser excitation wavelength λex of 785 nm. e, Quantitative detection of glucose in vivo is achieved by calibrating the sensor with an over-the-counter electrochemical glucose sensor. the calibration and prediction data points are plotted on the Clarke error grid, a standard metric for evaluating the performance of glucose sensors, with all the points falling in the A and B ranges corresponding to proper medical treatment. reprinted with permission from ref. 123.
© 2008 Nature Publishing Group
REVIEW ARTICLE
nature materials | VOL 7 | JUNE 2008 | www.nature.com/naturematerials 451
Introducing LSPR sensors to a wider proteomics community requires the development of substrates that interface well with high-throughput instruments. Recently, a promising multi-arrayed LSPR biochip sensor for proteomics was developed by Endo and co-workers120,121. This biochip provides rapid, label-free detection of protein concentration in small sample volumes. The biochip is fabricated in three steps: first a gold film is deposited onto a glass substrate, then silica nanospheres are coated onto the gold film, and finally another layer of gold is deposited onto the nanospheres and the underlying gold substrate. To detect proteins, a (4,4′-dithiodibutyric acid) SAM was formed on the core-shell array. Subsequently, six different antibodies were immobilized on the SAM by using a nanolitre dispensing system. Figure 7a is a photograph of the multi-array sensor with a uniform LSPR reflection spectrum across the chip. Different concentrations of specific antigens were dispensed onto the surface and the change in the absorbance at λmax was recorded for each spot. Figure 7b,c shows the change in absorbance for varying concentrations of analyte. The limit of detection for this sensor is 100 pg ml−1, and the sensor response scales linearly with concentration up to 1 µg ml−1. This biochip can potentially be used in a variety of applications including cancer diagnosis and microorganism detection.
In addition to developing high-throughput assays with LSPR nanosensors, another important practical challenge is to develop implantable LSPR-enabled SERS sensors. Such sensors will enable the spectroscopic detection of important analytes in vivo without requiring enzyme-coupled detection schemes. The first in vivo SERS glucose detection was recently developed in the Van Duyne laboratory (see Fig. 8)122,123. AgFON substrates were functionalized with a mixed SAM consisting of decanethiol (DT) and mercaptohexanol (MH). DT/MH has dual hydrophobic and hydrophilic properties; it selectively partitions glucose from interfering analytes and brings glucose closer to the nanostructured surface. The reversibility of the DT/MH AgFON sensor was demonstrated by alternately exposing the sensor to 0 and 100 mM aqueous glucose solutions (pH ≈ 7). The difference spectra demonstrate reversible partitioning and departitioning. Quantitative detection was demonstrated both in vitro and in vivo in a rat by using a partial least-squares chemometric analysis. The sensors provide stable readings in bovine plasma for at least 10 days, and show a response rate to glucose pulses of less than 30 s (ref. 122). A similarly rapid response was measured on an AgFON that had been implanted in a rat for 5 h and subsequently removed and tested in a flow cell123. Figure 8e depicts the in vivo calibration and validation models of a DT/MH-functionalized AgFON substrate implanted into a rat, demonstrating good agreement between SERS and a commercial glucose meter.
The same DT/MH-functionalized AgFON sensor also can detect other analytes, such as lactate. Both glucose and lactate SERS signals were monitored while alternately injecting 100 mM glucose and 100 mM lactate solutions into the flow cell and rinsing the surface with phosphate-buffered saline between each step. The results indicate that both analytes partition and departition successfully from the DT/MH-functionalized SAM124.
Finally, an important challenge for detection in vivo is to develop biocompatible sensors to limit toxicity and biofouling. Studies are underway to test the long-term biocompatibility of the glucose/lactate sensor by using immunohistochemical techniques on tissues near the site of implantation. The use of different surface chemistries, such as a titanium overlayer, is also being explored to improve the biocompatibility of the sensor.
future direCtiONs
In addition to continuing to push forward on the above challenges, there are great opportunities for optimizing single-nanoparticle sensitivity by characterizing and controlling shape. It is known that the corners of nanoparticles and spaces between nanoparticles
create the largest electromagnetic enhancements and are thus most important in LSPR and SERS experiments. New techniques for the rapid characterization of large numbers of individual nanoparticles with LSPR11,38,125,126, SERS16, fluorescence22, atomic force microscopy and electron microscopies16,127 will improve our understanding of how shape features relate to signal enhancements in LSPR and SERS. We also expect that single nanoparticles will increasingly be used as local light sources and chemical sensors in apertureless scanning near-field optical microscopy and chemical imaging128,129. The plasmonic nanoparticles serve as antennas that focus the incident light energy into a region ~20 nm in diameter defined by the nanoparticle size and shape, enabling λ/500 resolution in the information-rich 10-µm band129. Nanoparticles can also be used for high-resolution chemical imaging of surfaces with tip-enhanced Raman scatttering (TERS)130,131. Although currently reported TERS enhancement factors are on the order of 103–106, further optimization is expected to yield enhancement factors at least as high as bulk nanoparticle substrates (106–108) and potentially as high as 1014 when including contributions from resonantly absorbing molecules86,87.
Many practical challenges remain before LSPR biosensors can reach their full potential as analytical tools for chemical quantification, the characterization of binding kinetics, the detection of conformational changes, and molecular identification. However, progress in these areas is continuing rapidly. As novel sensing techniques are developed to increase the instrumental resolution and nanoparticle spectral shift, as fabrication techniques mature and nanoparticles become more uniform and stable, and as more diverse and complementary techniques are integrated, the future for plasmonic biosensors looks bright indeed.
doi:10.1038/nmat2162
references1. Faraday, M. The Bakerian Lecture: experimental relations of gold (and other metals) to light.
Phil. Trans. R. Soc. 147, 145–181 (1857).2. Eustis, S. & El-Sayed, M. A. Why gold nanoparticles are more precious than pretty gold: Noble
metal surface plasmon resonance and its enhancement of the radiative and nonradiative properties of nanocrystals of different shapes. Chem. Soc. Rev. 35, 209–217 (2006).
3. Willets, K. A. & Van Duyne, R. P. Localized surface plasmon resonance spectroscopy and sensing. Annu. Rev. Phys. Chem. 58, 267–297 (2007).
4. Schultz, S., Smith, D. R., Mock, J. J. & Schultz, D. A. Single-target molecule detection with nonbleaching multicolor optical immunolabels. Proc. Natl Acad. Sci. USA 97, 996–1001 (2000).
5. Bohren, C. F. & Huffman, D. R. Absorption and Scattering of Light by Small Particles (Wiley, New York, 1983).
6. Yguerabide, J. & Yguerabide, E. E. Light-scattering submicroscopic particles as highly fluorescent analogs and their use as tracer labels in clinical and biological applications. I. Theory. Anal. Biochem. 262, 137–156 (1998).
7. Nam, J. M., Thaxton, C. S. & Mirkin, C. A. Nanoparticle-based bio-bar codes for the ultrasensitive detection of proteins. Science 301, 1884–1886 (2003).
8. Yonzon, C. R. et al. Towards advanced chemical and biological nanosensors — an overview. Talanta 67, 438–448 (2005).
9. Haes, A. J., Chang, L., Klein, W. L. & Van Duyne, R. P. Detection of a biomarker for Alzheimer’s Disease from synthetic and clinical samples using a nanoscale optical biosensor. J. Am. Chem. Soc. 127, 2264–2271 (2005).
10. Dahlin, A. B., Tegenfeldt, J. O. & Hook, F. Improving the instrumental resolution of sensors based on localized surface plasmon resonance. Anal. Chem. 78, 4416–4423 (2006).
11. McFarland, A. D. & Van Duyne, R. P. Single silver nanoparticles as real-time optical sensors with zeptomole sensitivity. Nano Lett. 3, 1057–1062 (2003).
12. Raschke, G. et al. Biomolecular recognition based on single gold nanoparticle light scattering. Nano Lett. 3, 935–938 (2003).
13. Elghanian, R., Storhoff, J. J., Mucic, R. C., Letsinger, R. L. & Mirkin, C. A. Selective colorimetric detection of polynucleotides based on the distance-dependent optical properties of gold nanoparticles. Science 277, 1078–1081 (1997).
14. Jeanmaire, D. L. & Van Duyne, R. P. Surface Raman spectroelectrochemistry. Part I. Heterocyclic, aromatic, and aliphatic amines adsorbed on the anodized silver electrode. J. Electroanal. Chem. Interface Electrochem. 84, 1–20 (1977).
15. Haynes, C. L., Yonzon, C. R., Zhang, X. & Van Duyne, R. P. Surface-enhanced Raman sensors: Early history and the development of sensors for quantitative biowarfare agent and glucose detection. J. Raman Spectrosc. 36, 471–484 (2005).
16. Dieringer, J. A. et al. Surface enhanced Raman spectroscopy: New materials, concepts, characterization tools, and applications. Faraday Discuss. 132, 9–26 (2006).
17. Haller, K. L. et al. Spatially resolved surface enhanced second harmonic generation: Theoretical and experimental evidence for electromagnetic enhancement in the near infrared on a laser microfabricated Pt surface. J. Chem. Phys. 90, 1237–1252 (1989).
© 2008 Nature Publishing Group

452 nature materials | VOL 7 | JUNE 2008 | www.nature.com/naturematerials
REVIEW ARTICLE
18. Yang, W. H., Hulteen, J. C., Schatz, G. C. & Van Duyne, R. P. A surface-enhanced hyper-Raman and surface-enhanced Raman scattering study of trans-1,2-bis(4-pyridyl)ethylene adsorbed onto silver film over nanosphere electrodes. Vibrational assignments: Experiment and theory. J. Chem. Phys. 104, 4313–4323 (1996).
19. Jensen, T. R., Van Duyne, R. P., Johnson, S. A. & Maroni, V. A. Surface-enhanced infrared spectroscopy: A comparison of metal island films with discrete and non-discrete surface plasmons. Appl. Spectrosc. 54, 371–377 (2000).
20. Moskovits, M. Surface-enhanced spectroscopy. Rev. Mod. Phys 57, 783–826 (1985).21. Aslan, K., Lakowicz, J. R., Szmacinski, H. & Geddes, C. D. Enhanced ratiometric pH sensing using
SNAFL-2 on silver island films: Metal-enhanced fluorescence sensing. J. Fluoresc. 15, 37–40 (2005).22. Chen, Y., Munechika, K. & Ginger, D. S. Dependence of fluorescence intensity on the spectral overlap
between fluorophores and plasmon resonant single silver nanoparticles. Nano Lett. 7, 690–696 (2007).23. Sundaramurthy, A. et al. Toward nanometer-scale optical photolithography: Utilizing the near-field
of bowtie optical nanoantennas. Nano Lett. 6, 355–360 (2006).24. Ozbay, E. Plasmonics: Merging photonics and electronics at nanoscale dimensions. Science
311, 189–193 (2006).25. Atwater, H. The promise of plasmonics. Sci. Am. 296, 56–63 (2007).26. Zhang, X. & Liu, Z. Superlenses to overcome the diffraction limit. Nature Mater. 7, 435-441 (2008).27. Jensen, T. R., Duval Malinsky, M., Haynes, C. L. & Van Duyne, R. P. Nanosphere lithography:
Tunable localized surface plasmon resonance spectra of silver nanoparticles. J. Phys. Chem. B 104, 10549–10556 (2000).
28. Jensen, T. R. et al. Nanosphere lithography: Effect of the external dielectric medium on the surface plasmon resonance spectrum of a periodic array of silver nanoparticles. J. Phys. Chem. B 103, 9846–9853 (1999).
29. Jin, R. et al. Controlling anisotropic nanoparticle growth through plasmon excitation. Nature 425, 487–490 (2003).
30. Nikoobakht, B. & El-Sayed, M. A. Preparation and growth mechanism of gold nanorods (NRs) using seed-mediated growth method. Chem. Mater. 15, 1957–1962 (2003).
31. Burda, C., Chen, X., Narayanan, R. & El-Sayed, M. A. Chemistry and properties of nanocrystals of different shapes. Chem. Rev. 105, 1025–1102 (2005).
32. Wang, H., Brandl, D. W., Le, F., Nordlander, P. & Halas, N. J. Nanorice: A hybrid plasmonic nanostructure. Nano Lett. 6, 827–832 (2006).
33. Haynes, C. L. & Van Duyne, R. P. Nanosphere lithography: A versatile nanofabrication tool for studies of size-dependent nanoparticle optics. J. Phys. Chem. B 105, 5599–5611 (2001).
34. Haynes, C. L., McFarland, A. D., Smith, M. T., Hulteen, J. C. & Van Duyne, R. P. Angle-resolved nanosphere lithography: Manipulation of nanoparticle size, shape, and interparticle spacing. J. Phys. Chem. B 106, 1898–1902 (2002).
35. Hicks, E. M. et al. Controlling plasmon line shapes through diffractive coupling in linear arrays of cylindrical nanoparticles fabricated by electron beam lithography. Nano Lett. 5, 1065–1070 (2005).
36. Barbillon, G. et al. Electron beam lithography designed chemical nanosensors based on localized surface plasmon resonance. Surf. Sci. 601, 5057–5061 (2007).
37. Chan, G. H., Zhao, J., Hicks, E. M., Schatz, G. C. & Van Duyne, R. P. Plasmonic properties of copper nanoparticles fabricated by nanosphere lithography. Nano Lett. 7, 1947–1952 (2007).
38. Lee, K. J., Nallathamby, P. D., Browning, L. M., Osgood, C. J. & Xu, X. H. N. In vivo imaging of transport and biocompatibility of single silver nanoparticles in early development of zebrafish embryos. ACS Nano 1, 133–143 (2007).
39. Xu, X. H. N., Brownlow, W. J., Kyriacou, S. V., Wan, Q. & Viola, J. J. Real-time probing of membrane transport in living microbial cells using single nanoparticle optics and living cell imaging. Biochemistry 43, 10400–10413 (2004).
40. Lin, A. et al. Nanoshell-enabled photonics-based imaging and therapy of cancer. Technol. Cancer Res. Treat. 3, 33–40 (2004).
41. Stuart, D. A., Haes, A. J., McFarland, A. D., Nie, S. & Van Duyne, R. P. Refractive-index-sensitive, plasmon-resonant-scattering, and surface-enhanced Raman-scattering nanoparticles and arrays as biological sensing platforms. Proc. SPIE – Int. Soc. Opt. Eng. 5327, 60–73 (2004).
42. Yonzon, C. R. et al. A comparative analysis of localized and propagating surface plasmon resonance sensors: The binding of concanavalin A to a monosaccharide functionalized self-assembled monolayer. J. Am. Chem. Soc. 126, 12669–12676 (2004).
43. Lacor, P. N. et al. Abeta oligomer-induced aberrations in synapse composition, shape and density provide a molecular basis for loss of connectivity in Alzheimer’s disease. J. Neurosci.27, 796–807 (2007).
44. Gong, Y. et al. Alzheimer’s Disease-affected brain: Presence of oligomeric Aβ ligands (ADDLs) suggests a molecular basis for reversible memory loss. Proc. Natl Acad. Sci. USA 100, 10417–10422 (2003).
45. Hardy, J. & Selkoe, D. J. The amyloid hypothesis of Alzheimer’s disease: Progress and problems on the road to therapeutics. Science 297, 353–356 (2002).
46. Georganopoulou, D. G. et al. Nanoparticle-based detection in cerebral spinal fluid of a soluble pathogenic biomarker for Alzheimer’s disease. Proc. Natl Acad. Sci. USA 102, 2273–2276 (2005).
47. Thompson, R. E., Larson, D. R. & Webb, W. W. Precise nanometer localization analysis for individual fluorescent probes. Biophys. J. 82, 2775–2783 (2002).
48. Yildiz, A. et al. Myosin V walks hand-over-hand: Single fluorophore imaging with 1.5-nm localization. Science 300, 2061–2065 (2003).
49. Hall. W. P. et al. A calcium-modulated plasmonic switch. J. Am. Chem. Soc. 130, 5836–5837 (2008).50. Haes, A. J., Zou, S., Schatz, G. C. & Van Duyne, R. P. Nanoscale optical biosensor: Short range
distance dependence of the localized surface plasmon resonance of noble metal nanoparticles. J. Phys. Chem. B 108, 6961–6968 (2004).
51. Hicks, E. M. et al. Plasmonic properties of film over nanowell surfaces fabricated by nanosphere lithographpy. J. Phys. Chem. B 109, 22351–22358 (2005).
52. Henzie, J., Lee, M. H. & Odom, T. W. Multiscale patterning of plasmonic metamaterials. Nature Nanotech. 2, 549–554 (2007).
53. Van Duyne, R. P., Haes, A. J. & McFarland, A. D. Nanoparticle optics: Sensing with nanoparticle arrays and single nanoparticles. Proc. SPIE 5223, 197–207 (2003).
54. Lasne, D. et al. Single nanoparticle photothermal tracking (SNaPT) of 5-nm gold beads in live cells. Biophys. J. 91, 4598–4604 (2006).
55. Shotton, D. M. Confocal scanning optical microscopy and its applications for biological specimens. J. Cell Sci. 94, 175–206 (1989).
56. Aaron, J. et al. Plasmon resonance coupling of metal nanoparticles for molecular imaging of carcinogenesis in vivo. J. Biomed. Optics 12, 034007- (2007).
57. Xu, X. H. N., Chen, J., Jeffers, R. & Kyriacou, S. Direct measurement of sizes and dynamics of single living membrane transporters using nano-optics. Nano Lett. 2, 175–182 (2002).
58. Dijk, M. A. et al. Absorption and scattering microscopy of single metal nanoparticles. J. Phys. Chem. Chem. Phys. 8, 3486–3495 (2006).
59. Geerts, H., de Brabander, M. & Nuydens, R. Nanovid microscopy. Nature 351, 765–766 (1991).60. De Brabander, M., Nuydens, R., Geuens, G., Moeremans, M. & De Mey, J. The use of
submicroscopic gold particles combined with video contrast enhancement as a simple molecular probe for the living cell. Cell Motil. Cytoskel. 6, 105–113 (1986).
61. Link, S. & El-Sayed, M. A. Shape and size dependence of radiative, non-radiative and photothermal properties of gold nanocrystals. Int. Rev. Phys. Chem. 19, 409–453 (2000).
62. Agarwal, A. et al. Targeted gold nanorod contrast agent for prostate cancer detection by photoacoustic imaging. J. Appl. Phys. 102, 064701 (2007).
63. Mallidi, S., Larson, T., Aaron, J., Sokolov, K. & Emelianov, S. Molecular specific optoacoustic imaging with plasmonic nanoparticles. Opt. Express 15, 6583–6588 (2007).
64. El-Sayed, I. H., Huang, X. & El-Sayed, M. A. Selective laser photo-thermal therapy of epithelial carcinoma using anti-EGFR antibody conjugated gold nanoparticles. Cancer Lett. 239, 129–135 (2006).
65. Larson, T. A., Bankson, J., Aaron, J. & Sokolov, K. Hybrid plasmonic magnetic nanoparticles as molecular specific agents for MRI/optical imaging and photothermal therapy of cancer cells. Nanotechnology 18, 1–8 (2007).
66. Aaron, J. S. et al. Increased optical contrast in imaging of epidermal growth factor receptor using magnetically actuated hybrid gold/iron oxide nanoparticles. Opt. Express 14, 12930–12943 (2006).
67. Liu, G. L., Lu, Y., Kim, J., Doll, J. C. & Lee, L. P. Magnetic nanocrescents as controllable surface-enhanced Raman scattering nanoprobes for biomedical imaging. Adv. Mater. 17, 2683–2688 (2005).
68. Haes, A. J., Zou, S., Schatz, G. C. & Van Duyne, R. P. Nanoscale optical biosensor: The long range distance dependence of the localized surface plasmon resonance of noble metal nanoparticles. J. Phys. Chem. B 108, 109–116 (2004).
69. Whitney, A. V. et al. Localized surface plasmon resonance nanosensor: A high-resolution distance-dependence study using atomic layer deposition. J. Phys. Chem. B 109, 20522–20528 (2005).
70. Haes, A. J., Zou, S., Zhao, J., Schatz, G. C. & Van Duyne, R. P. Localized surface plasmon resonance spectroscopy near molecular resonances. J. Am. Chem. Soc. 128, 10905–10914 (2006).
71. Zhao, J. et al. Interaction of plasmon and molecular resonances for rhodamine 6G adsorbed on silver nanoparticles. J. Am. Chem. Soc. 129, 7647–7656 (2007).
72. Zhao, J. et al. Resonance surface plasmon spectroscopy: Low molecular weight substrate binding to cytochrome P450. J. Am. Chem. Soc. 128, 11004–11005 (2006).
73. Reinhard, B. M., Sheikholeslami, S., Mastroianni, A., Alivisatos, A. P. & Liphardt, J. Use of plasmon coupling to reveal the dynamics of DNA bending and cleavage by single EcoRV restriction enzymes. Proc. Natl Acad. Sci. USA 104, 2667–2672 (2007).
74. Sonnichsen, C., Reinhard, B. M., Liphardt, J. & Alivisatos, A. P. A molecular ruler based on plasmon coupling of single gold and silver nanoparticles. Nature Biotechnol. 23, 741–745 (2005).
75. Lipscomb, J. D. & Gunsalus, I. C. Structural aspects of active-site of cytochrome P-450Cam. Drug Metab. Dispos. 1, 1–5 (1973).
76. Sligar, S. G. Coupling of spin, substrate, and redox equilibria in cytochrome P450. Biochemistry 15, 5399–5406 (1976).
77. Ingber, D. E. Cellular mechanotransduction: putting all the pieces together again. FASEB J. 20, 811–827 (2006).
78. Su, K. H. et al. Interparticle coupling effects on plasmon resonances of nanogold particles. Nano Lett. 3, 1087–1090 (2003).
79. Jain, P. K., Huang, W. & El-Sayed, M. A. On the universal scaling behavior of the distance decay of plasmon coupling in metal nanoparticle pairs: a plasmon ruler equation. Nano Lett. 7, 2080–2088 (2007).
80. Rechberger, W. et al. Optical properties of two interacting gold nanoparticles. Opt. Commun. 220, 137–141 (2003).
81. Jensen, T. R., Schatz, G. C. & Van Duyne, R. P. Nanosphere lithography: Surface plasmon resonance spectrum of a periodic array of silver nanoparticles by UV-vis extinction spectroscopy and electrodynamic modeling. J. Phys. Chem. B 103, 2394–2401 (1999).
82. Fromm, D. P., Sundaramurthy, A., Schuck, P. J., Kino, G. & Moerner, W. E. Gap-dependent optical coupling of single ‘bowtie’ nanoantennas resonant in the visible. Nano Lett. 4, 957–961 (2004).
83. Reinhard, B. M., Siu, M., Agarwal, H., Alivisatos, A. P. & Liphardt, J. Calibration of dynamic molecular rulers based on plasmon coupling between gold nanoparticles. Nano Lett. 5, 2246–2252 (2005).
84. Liu, G. L. et al. A nanoplasmonic molecular ruler for measuring nuclease activity and DNA footprinting. Nature Nanotech. 1, 47–52 (2006).
85. McFarland, A. D., Young, M. A., Dieringer, J. A. & Van Duyne, R. P. Wavelength-scanned surface-enhanced Raman excitation spectroscopy. J. Phys. Chem. B 109, 11279–11285 (2005).
86. Nie, S. & Emory, S. R. Probing single molecules and single nanoparticles by surface-enhanced Raman scattering. Science 275, 1102–1106 (1997).
87. Dieringer, J. A., Ii, R. B. L., Scheidt, K. A. & Van Duyne, R. P. A frequency domain existence proof of single-molecule surface-enhanced Raman spectroscopy. J. Am. Chem. Soc. 129, 16249–16256 (2007).
88. Kneipp, K. et al. Single molecule detection using surface-enhanced Raman scattering (SERS). Phys. Rev. Lett. 78, 1667–1670 (1997).
89. Van Duyne, R. P. in Chemical and Biochemical Applications of Lasers (ed. Moore, C. B.) Vol. 4, 101–184 (Academic, New York, 1979).
90. Zhao, L., Jensen, L. & Schatz, G. C. Pyridine-Ag 20 cluster: A model system for studying surface-enhanced Raman scattering. J. Am. Chem. Soc. 128, 2911–2919 (2006).
91. Zou, S. & Schatz, G. C. Silver nanoparticle array structures that produce giant enhancements in electromagnetic fields. Chem. Rev. Lett. 403, 62–67 (2005).
© 2008 Nature Publishing Group
REVIEW ARTICLE
nature materials | VOL 7 | JUNE 2008 | www.nature.com/naturematerials 453
92. Dick, L. A., McFarland, A. D., Haynes, C. L. & Van Duyne, R. P. Metal film over nanosphere (MFON) electrodes for surface-enhanced Raman spectroscopy (SERS): Improvements in surface nanostructure stability and suppression of irreversible loss. J. Phys. Chem. B 106, 853–860 (2002).
93. Zhang, X., Young, M. A., Lyandres, O. & Van Duyne, R. P. Rapid detection of an anthrax biomarker by surface-enhanced Raman spectroscopy. J. Am. Chem. Soc. 127, 4484–4489 (2005).
94. Zhang, X., Zhao, J., Whitney, A. V., Elam, J. W. & Van Duyne, R. P. Ultrastable substrates for surface-enhanced Raman spectroscopy: Al2O3 overlayers fabricated by atomic layer deposition yield improved anthrax biomarker detection. J. Am. Chem. Soc. 128, 10304–10309 (2006).
95. Yonzon, C. R., Zhang, X. & Van Duyne, R. P. Localized surface plasmon resonance immunoassay and verification using surface-enhanced Raman spectroscopy. Proc. SPIE – Int. Soc. Opt. Eng. 5224, 78–85 (2003).
96. Owega, S., Lai, E. P. C. & Mullett, W. M. Laser desorption ionization of gramicidin S on thin silver films with matrix isolation in surface plasmon resonance excitation. J. Photochem. Photobiol. A 119, 123–135 (1998).
97. Owega, S., Lai, E. P. C. & Bawagan, A. D. O. Surface plasmon resonance-laser desorption/ionization-time-of-flight mass spectrometry. Anal. Chem. 70, 2360–2365 (1998).
98. Lee, I., Callcott, T. A. & Arakawa, E. T. Laser-induced surface-plasmon desorption of dye molecules from aluminum films. Anal. Chem. 64, 476–478 (1992).
99. Chen, L. C., Ueda, T., Sagisaka, M., Hori, H. & Hiraoka, K. Visible laser desorption/ionization mass spectrometry using gold nanorods. J. Phys. Chem. C 111, 2409–2415 (2007).
100. Chen, L. C., Yonehama, J., Ueda, T., Hori, H. & Hiraoka, K. Visible-laser desorption/ionization on gold nanostructures. J. Mass Spectrom. 42, 346–353 (2007).
101. Altelaar, A. F. M. et al. Gold-enhanced biomolecular surface imaging of cells and tissue by SIMS and MALDI mass spectrometry. Anal. Chem. 78, 734–742 (2006).
102. McLean, J. A., Stumpo, K. A. & Russell, D. H. Size-selected (2–10 nm) gold nanoparticles for matrix assisted laser desorption ionization of peptides. J. Am. Chem. Soc. 127, 5304–5305 (2005).
103. Huang, Y. F. & Chang, H. T. Nile Red-adsorbed gold nanoparticle matrixes for determining aminothiols through surface-assisted laser desorption/ionization mass spectrometry. Anal. Chem. 78, 1485–1493 (2006).
104. Xu, X. et al. Size and shape separation of gold nanoparticles with preparative gel electrophoresis. J. Chromatogr. A 1167, 35–41 (2007).
105. Qin, W. J. & Yung, L. Y. L. Nanoparticle-DNA conjugates bearing a specific number of short DNA strands by enzymatic manipulation of nanoparticle-bound DNA. Langmuir 21, 11330–11334 (2005).
106. Duval Malinsky, M., Kelly, L., Schatz, G. C. & Van Duyne, R. P. Chain length dependence and sensing capabilities of the localized surface plasmon resonance of silver nanoparticles chemically modified with alkanethiol self-assembled monolayers. J. Am. Chem. Soc. 123, 1471–1482 (2001).
107. Huang, W., Qian, W. & El-Sayed, M. A. Photothermal reshaping of prismatic Au nanoparticles in periodic monolayer arrays by femtosecond laser pulses. J. Appl. Phys. 98, 114301 (2005).
108. Whitney, A. V., Elam, J. W., Stair, P. C. & Van Duyne, R. P. Toward a thermally robust operando surface-enhanced Raman spectroscopy substrate. J. Phys. Chem. C 111, 16827–16832 (2007).
109. Von Raben, K. U., Chang, R. K., Laube, B. L. & Barber, P. W. Wavelength dependence of surface-enhanced Raman scattering from Ag colloids with adsorbed CN complexes, SO3
2−, and pyridine. J. Phys. Chem. B 88, 5290–5296 (1984).
110. Fornasiero, D. & Grieser, F. Analysis of the visible absorption and SERS excitation spectra of silver sols. J. Chem. Phys. 87, 3213–3217 (1987).
111. Carron, K., Peitersen, L. & Lewis, M. Octadecylthiol-modified surface-enhanced Raman-spectroscopy substrates — a new method for the detection of aromatic-compounds. Environ. Sci. Technol. 26, 1950–1954 (1992).
112. Love, J. C., Estroff, L. A., Kriebel, J. K., Nuzzo, R. G. & Whitesides, G. M. Self-assembled monolayers of thiolates on metals as a form of nanotechnology. Chem. Rev. 105, 1103–1169 (2005).
113. Han, J. W. Temporal stability of thiophene self-assembled monolayers on Au (111). Mol. Cryst. Liq. Cryst. 464, 205–209 (2007).
114. Jeong, Y., Lee, C., Ito, E., Hara, M. & Noh, J. Time-dependent phase transition of self-assembled monolayers formed by thioacetyl-terminated tolanes on Au (111). Jpn. J. Appl. Phys. 45, 5906–5910 (2006).
115. Zhang, Z. S. et al. Heat capacity measurements of two-dimensional self-assembled hexadecanethiol monolayers on polycrystalline gold. Appl. Phys. Lett. 84, 5198–5200 (2004).
116. Lewis, M., Tarlov, M. & Carron, K. Study of the photooxidation process of self-assembled alkanethiol monolayers. J. Am. Chem. Soc. 117, 9574–9575 (1995).
117. Schoenfisch, M. H. & Pemberton, J. E. Air stability of alkanethiol self-assembled monolayers on silver and gold surfaces J. Am. Chem. Soc. 120, 4502–4513 (1998).
118. Thompson, W. R. & Pemberton, J. E. Characterization of octadecylsilane and stearic acid layers on Al2O3 surfaces by Raman spectroscopy. Langmuir 11, 1720–1725 (1995).
119. Arkles, B. in Silicon Compounds: Register and Review 5th edn (eds Anderson, R., Larson, G. L. & Smith, C.) 59–60 (Huls America, Piscataway, New Jersey, 1991).
120. Endo, T. et al. Multiple label-free detection of antigen-antibody reaction using localized surface plasmon resonance-based core-shell structured nanoparticle layer nanochip. Anal. Chem. 78, 6465–6475 (2006).
121. Endo, T., Kerman, K., Nagatani, N., Takamura, Y. & Tamiya, E. Label-free detection of peptide nucleic acid-DNA hybridization using localized surface plasmon resonance based optical biosensor. Anal. Chem. 77, 6976–6984 (2005).
122. Lyandres, O. et al. Real-time glucose sensing by surface-enhanced Raman spectroscopy in bovine plasma facilitated by a mixed decanethiol/mercaptohexanol partition layer. Anal. Chem. 77, 6134–6139 (2005).
123. Stuart, D. A. et al. In vivo glucose measurement by surface-enhanced Raman spectroscopy. Anal. Chem. 78, 7211–7215 (2006).
124. Shah, N. C., Lyandres, O., Walsh, J. T., Glucksberg, M. R. & Van Duyne, R. P. Lactate and sequential lactate-glucose sensing using surface-enhanced Raman spectroscopy. Anal. Chem. 79, 6927–6932 (2007).
125. Liu, G., Doll, J. & Lee, L. High-speed multispectral imaging of nanoplasmonic array. Opt. Express 13, 8520–8525 (2005).
126. Liu, G. L., Long, Y. T., Choi, Y., Kang, T. & Lee, L. P. Quantized plasmon quenching dips nanospectroscopy via plasmon resonance energy transfer. Nature Methods 4, 1015–1017 (2007).
127. Mock, J. J. Shape effects in plasmon resonance of individual colloidal silver nanoparticles. J. Chem. Phys. 116, 6755–6759 (2002).
128. Novotny, L. in Progress in Optics (ed. Wolf, E.) Vol. 50, 137–184 (Elsevier, Amsterdam, 2007).129. Taubner, T., Hillenbrand, R. & Keilmann, F. Performance of visible and mid-infrared scattering-
type near-field optical microscopes. J. Microsc. 210, 311–314 (2003).130. Stöckle, R. M., Suh, Y. D., Deckert, V. & Zenobi, R. Nanoscale chemical analysis by tip-enhanced
Raman spectroscopy. Chem. Rev. Lett. 318, 131–136 (2000).131. Pettinger, B., Ren, B., Picardi, G., Schuster, R. & Ertl, G. Nanoscale probing of adsorbed species by
tip-enhanced Raman spectroscopy. Phys. Rev. Lett. 92, 96101 (2004).132. Haes, J., Haynes, C. L. & Van Duyne, R. P. Nanosphere lithography: Self-assembled photonic and
magnetic materials. Mater. Res. Soc. Symp. 636, D4.8 (2001).
AcknowledgementsThis research was supported by the National Science Foundation (grants EEC-0647560, CHE-0414554,
DMR-0520513 and BES-0507036), the National Cancer Institute (1 U54 CA119341-01), a
Ruth L. Kirschstein National Research Service Award (5 F32 GM077020) to J.N.A., and a
Ryan Fellowship to W.P.H.
© 2008 Nature Publishing Group