Embed Size (px)
Citation preview
Review
Goal: Maximize Value of the Firm
Past Topics Investment Decision (spending money)
Financing Decision (raising money)
Future Topics
“Variations on a Theme”

Today’s Topics
Dividends • Define (CB / Investment variation)
• Div & Value of the Firm
Capital Structure• Define (financing variation)
• Cap Str & Value of the Firm

Dividends
A payment made by a company to the shareholders of the company.

Types of Dividends
Cash Div Regular Cash Div Special Cash Div Stock Div
Stock Repurchase (4 methods)1. Buy shares on the market2. Tender Offer to Shareholders3. Dutch Auction4. Private Negotiation (Green Mail)

Dividend Terms
Record Date
Announcement Date
Payment Date
Ex-Dividend

Dividend Payments
Aug 14 Aug 25 Aug26 Sept 1 Sept 15
Declaration With- Ex-dividend Record Paymentdate dividend date date date
date
Share price falls
Div & Value (M&M Theory)
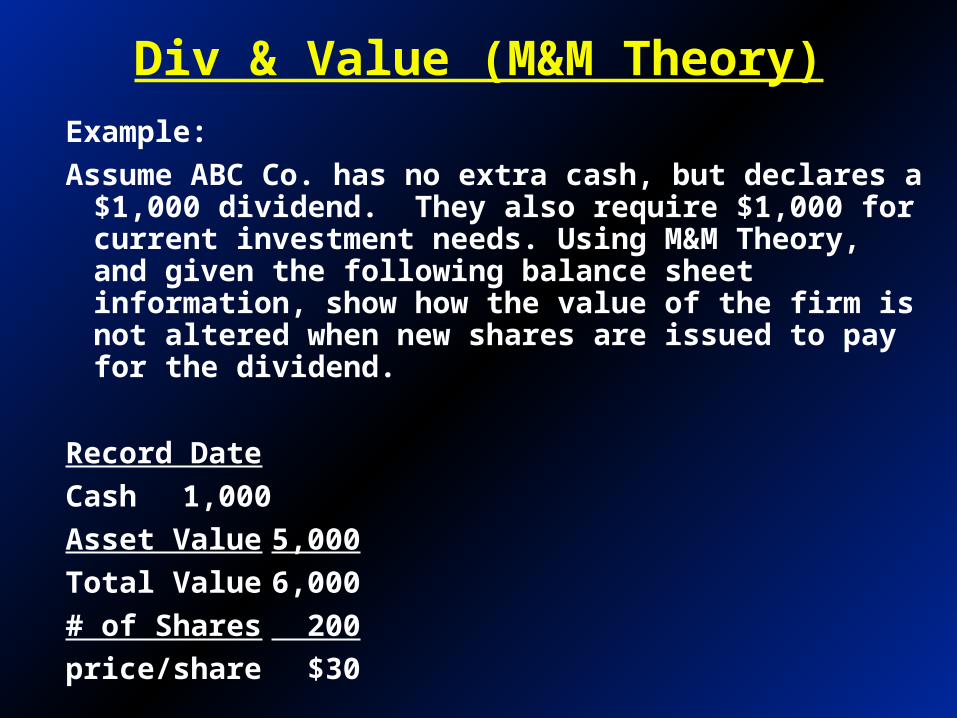
Example:
Assume ABC Co. has no extra cash, but declares a $1,000 dividend. They also require $1,000 for current investment needs. Using M&M Theory, and given the following balance sheet information, show how the value of the firm is not altered when new shares are issued to pay for the dividend.
Record Date
Cash 1,000
Asset Value 5,000
Total Value 6,000
# of Shares 200
price/share $30

Div & Value (M&M Theory)
Example:
Assume ABC Co. has no extra cash, but declares a $1,000 dividend. They also require $1,000 for current investment needs. Using M&M Theory, and given the following balance sheet information, show how the value of the firm is not altered when new shares are issued to pay for the dividend.
Record Date Pmt Date
Cash 1,000 0
Asset Value 5,000 5,000
Total Value 6,000 5,000
# of Shares 200 200
price/share $30 $25

Div & Value (M&M Theory)
Example:
Assume ABC Co. has no extra cash, but declares a $1,000 dividend. They also require $1,000 for current investment needs. Using M&M Theory, and given the following balance sheet information, show how the value of the firm is not altered when new shares are issued to pay for the dividend.
Record Date Pmt Date Post Pmt
Cash 1,000 0 1,000 (40sh @ $25)
Asset Value 5,000 5,000 5,000
Total Value 6,000 5,000 6,000
# of Shares 200 200 240
price/share $30 $25 $25

Div & Value (M&M Theory)
Shareholder Value
Record
Stock 6,000
Cash 0
Total 6,000
Stock = 200 sh @ $30 = 6,000

Div & Value (M&M Theory)
Shareholder Value
Record Pmt
Stock 6,000 5,000
Cash 0 1,000
Total 6,000 6,000
Stock = 200sh @ $25 = 5,000

Div & Value (M&M Theory)
Shareholder Value
Record Pmt Post
Stock 6,000 5,000 6,000
Cash 0 1,000 0
Total 6,000 6,000 6,000
Stock = 240sh @ $25 = 6,000

Dividend Theories
Leftists (M&M) - Div does not effect value
Rightists - Dividends increase value
Middle of the roaders - Leftist theory with some reality thrown in.

Dividends Increase Value
Market Imperfections and Clientele Effect
There are natural clients for high-payout stocks, but it does not follow that any particular firm can benefit by increasing its dividends. The high dividend clientele already have plenty of high dividend stock to choose from.
These clients increase the price of the stock through their demand for a dividend paying stock.

Dividends Increase Value
Dividends as Signals
Dividend increases send good news about cash flows and earnings. Dividend cuts send bad news.
Because a high dividend payout policy will be costly to firms that do not have the cash flow to support it, dividend increases signal a company’s good fortune and its manager’s confidence in future cash flows.
Dividends Decrease Value
Tax Consequences
Companies can convert dividends into capital gains by shifting their dividend policies. If dividends are taxed more heavily than capital gains, taxpaying investors should welcome such a move and value the firm more favorably.
In such a tax environment, the total cash flow retained by the firm and/or held by shareholders will be higher than if dividends are paid.
Taxes and Dividend Policy
Since capital gains are taxed at a lower rate than dividend income, companies should pay the lowest dividend possible.
Dividend policy should adjust to changes in the tax code.

Taxes and Dividend Policy
Rate of Income tax
0% 39.60%Operating Income 100 100Corporate tax (Tc=.35) 35 35After Tax income (paid as div) 65 65Income tax 0 25.7Cash to Shareholder 65 39.3
In U.S., shareholders are taxed twice (figures in dollars)

Taxes and Dividend Policy
Rate of Income tax
15% 33% 47%Operating Income 100 100 100Corporate tax (Tc=.33) 33 33 33After Tax income 67 67 67
Grossed up Dividend 100 100 100Income tax 15 33 47Tax credit for Corp Pmt -33 -33 -33Tax due from shareholder -18 0 14Cash to Shareholder 85 67 53
Under imputed tax systems, such as that in Australia, Shareholders receive a tax credit for the corporate tax the firm pays (figures in Australian dollars)

Capital Sturcture
Review Ch 17 on your own
Overview revisited now

201510% 5(%) shares on Return
2.001.501.00$.50shareper Earnings
2,0001,5001,000$500Income Operating
D C BA
Outcomes
10,000 $Shares of ValueMarket
$10shareper Price
1,000shares ofNumber
Data
Example - Macbeth Spot Removers - All Equity Financed
M&M (Debt Policy Doesn’t Matter)
Expected outcome

3025150%(%) shares on Return
321$0shareper Earnings
500,11,000500$0earningsEquity
500500500$500Interest
000,21,5001,000$500Income Operating
CBA
Outcomes
5,000 $debt of ueMarket val
5,000 $Shares of ValueMarket
$10shareper Price
500shares ofNumber
Data
D
Example
cont.
50% debt
M&M (Debt Policy Doesn’t Matter)

3020100%(%) investment$10 on Return
3.002.001.000 $investment on earningsNet
1.001.001.00$1.0010% @Interest :LESS
4.003.002.00$1.00shares twoon Earnings
DCBA
Outcomes
Example - Macbeth’s - All Equity Financed
- Debt replicated by investors
M&M (Debt Policy Doesn’t Matter)

MM'S PROPOSITION I
If capital markets are doing their job, firms cannot increase value by tinkering with capital structure.
V is independent of the debt ratio.
AN EVERYDAY ANALOGY
It should cost no more to assemble a chicken than to buy one whole.
No Magic in Financial Leverage

Proposition I and Macbeth
2015(%) shareper return Expected
1010($) shareper Price
2.001.50($) shareper earnings Expected Equityand Debt Equal
:Structure Proposed
EquityAll
:StructureCuttent
Macbeth continued

Leverage and Returns
securities all of uemarket val
income operating expectedr assets on return Expected a
EDA r
ED
Er
AD
Dr

M&M Proposition II
15.000,10
1500securities all of uemarket val
income operating expectedr r AE
DAAE rrV
Drr
Macbeth continued

M&M Proposition II
15.000,10
1500securities all of uemarket val
income operating expectedr r AE
DAAE rrV
Drr
20%or 20.
10.15.5000
500015.
Er
Macbeth continued

r
DE
rD
rE
M&M Proposition II
rA
Risk free debt Risky debt

Leverage and Risk
200shares on Return
20($) shareper Earnings:debt % 50
155shares on Return
1.50.50($) shareper Earningsequity All$1,500
Income
$500
Operating
200shares on Return
20($) shareper Earnings:debt % 50
155shares on Return
1.50.50($) shareper Earningsequity All$1,500
Income
$500
Operating
Macbeth continued
Leverage increases the risk of Macbeth shares

Leverage and Returns
EDA B
ED
EB
AD
DB
EDA B
ED
EB
AD
DB
DAAE BBV
DBB DAAE BB
V
DBB

WACC
EDA r
V
Er
V
DrWACC
EDA r
V
Er
V
DrWACC
WACC is the traditional view of capital structure, risk and return.

WACC
.10=rD
.20=rE
.15=rA
BEBABD
Risk
Expected Return
Equity
All assets
Debt
WACC
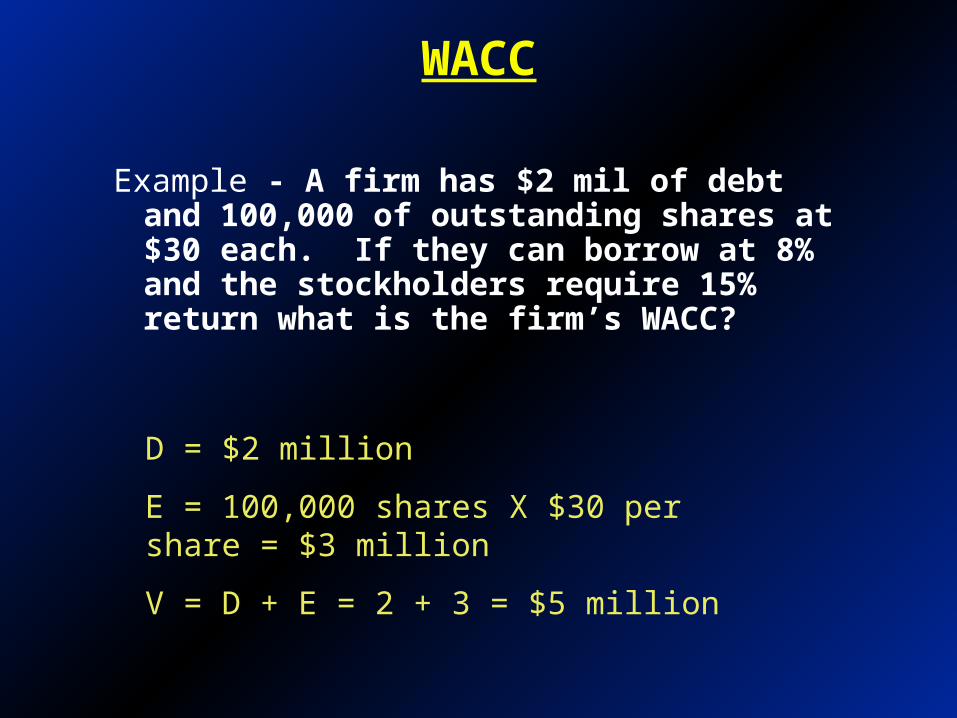
Example - A firm has $2 mil of debt and 100,000 of outstanding shares at $30 each. If they can borrow at 8% and the stockholders require 15% return what is the firm’s WACC?
D = $2 million
E = 100,000 shares X $30 per share = $3 million
V = D + E = 2 + 3 = $5 million

WACC
Example - A firm has $2 mil of debt and 100,000 of outstanding shares at $30 each. If they can borrow at 8% and the stockholders require 15% return what is the firm’s WACC?
D = $2 million
E = 100,000 shares X $30 per share = $3 million
V = D + E = 2 + 3 = $5 million
12.2%or 122.
15.5
308.
5
2
ED r
V
Er
V
DWACC
12.2%or 122.
15.5
308.
5
2
ED r
V
Er
V
DWACC

r
DV
rD
rE
rE =WACC
WACC

r
DV
rD
rE
WACC
WACC (traditional view)