Embed Size (px)
Citation preview

Review Note 20th May, 201120 May, 2011
Financial Performance- Consolidated

756
1,201
0
500
1,000
1,500
2009-10 2010-11
REVENUE Rs. cr
Highlights Q4 - 2010-11
97
179
50
150
2009-10 2010-11
EBIDTA Rs. cr
83%59%
20
63
0
20
40
60
80
2009-10 2010-11
PAT Rs. cr
217%

Financial Performance Q4 – 2010-11
• Company’s textiles and brands & retail segments witnessed very strong volume and price growth leading to impressive 59% growth in revenue for Q4
• EBIDTA margin
Rs crores
For the Q4 2010-11 2009-10 Change
Revenues 1,201 756 59%
Raw Material Consumed 557 237
Employees' Emoluments 109 85
Others 392 257
(Increase) / Decrease in Stock -35 79
EBIDTA 179 97 83%• EBIDTA margin improved 200 basis points to 14.9% from 12.9%
• EBIDTA margin grew by 83% on account of revenue growth and margin improvement
• Profit after tax more than tripled to Rs. 63 crores
EBIDTA 179 97 83%
Margin 14.9% 12.9%
Other Income -3 -4
Intrest & Finance Cost(Net) 68 35
Cash Accruals 107 59 83%
Depreciation 40 43
Profit Before Tax 67 16
Profit After Tax 64 26
Net Profit after Minority Interest 63 20 218%

Highlights FY- 2010-11
3,262
4,090
2,600
3,000
3,400
3,800
4,200 Revenue Rs. cr
411
556
350
450
550
2009-10 2010-11
EBIDTA Rs. Cr
35%
25%
2,600
2009-10 2010-112009-10 2010-11
50
165
0
20
40
60
80
100
120
140
160
180
2009-10 2010-11
PAT Rs. cr
233%
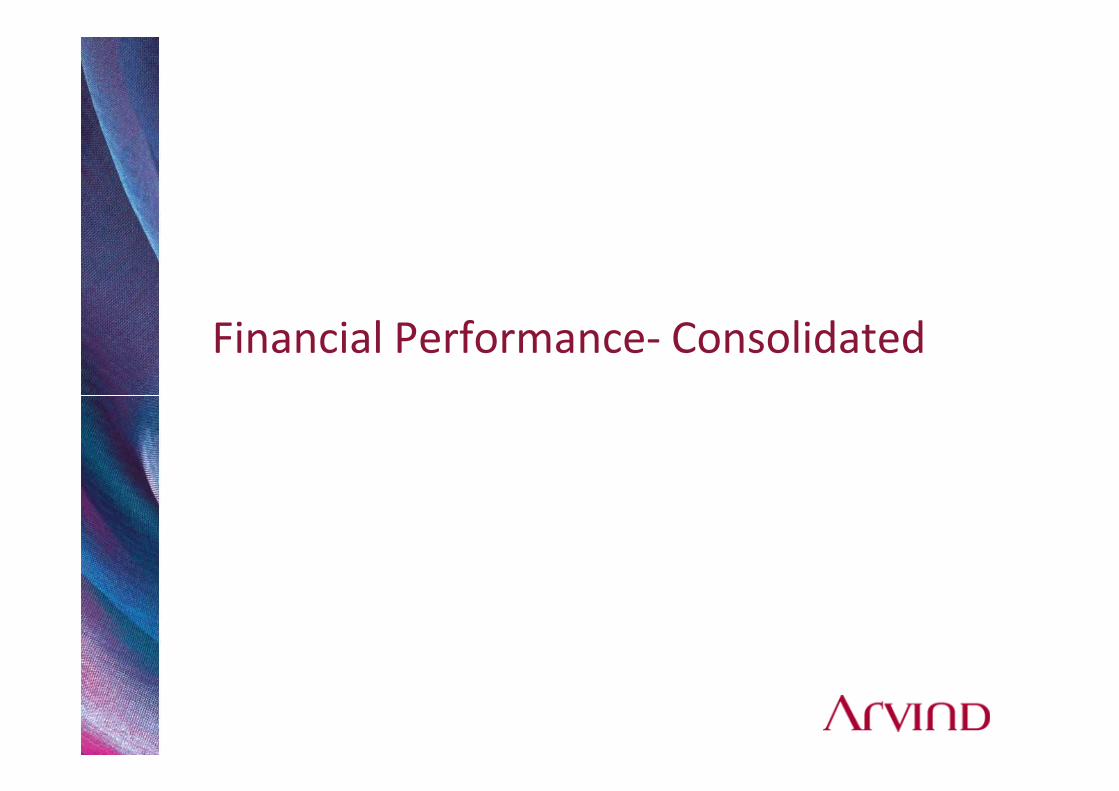
Financial Performance – 2010-11
Rs crores
Mar-31 2011 2010 Change
Revenues 4,090 3,262 25%
Raw Material Consumed 2,040 1,474
Employees' Emoluments 395 342
Others 1,270 1,038
(Increase) / Decrease in Stock -171 -3
EBIDTA 556 412 35%EBIDTA 556 412 35%
Margin 13.6% 12.6%
Other Income 37 21
Intrest & Finance Cost(Net) 245 212
Cash Accruals 348 220 58%
Depreciation 173 173
Profit Before Tax 176 47
Profit After Tax 165 53
Net Profit after Minority Interest 165 50 227%
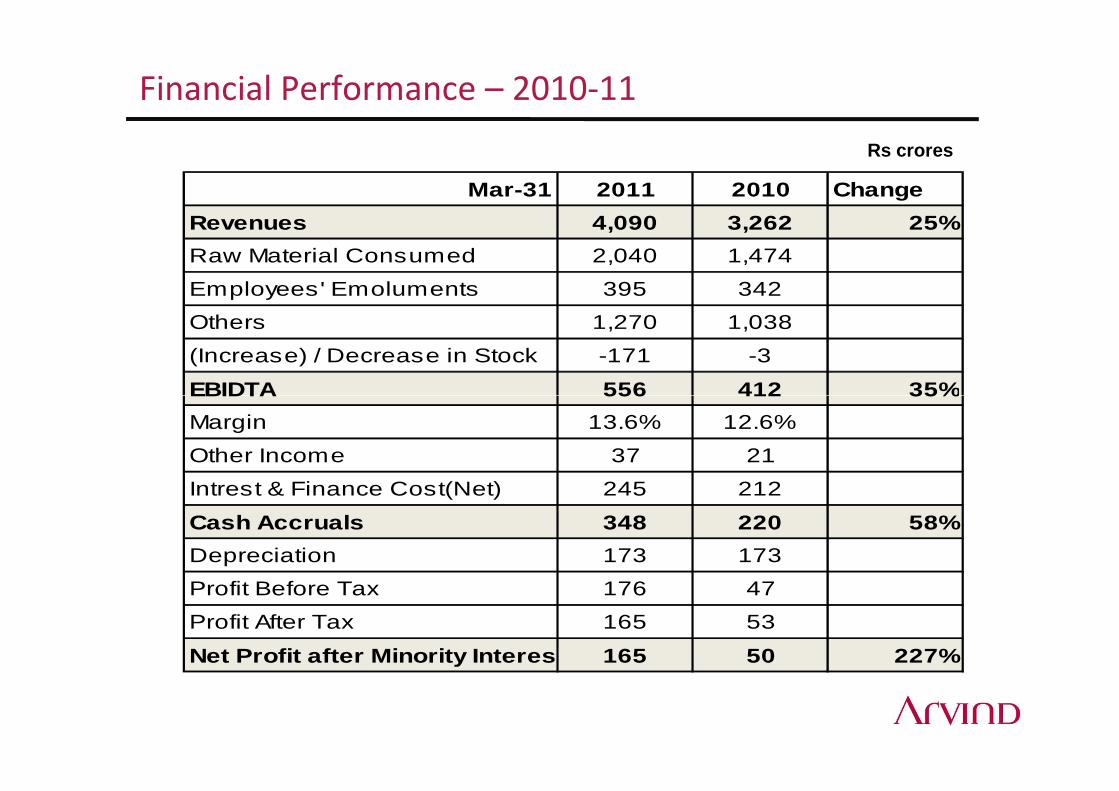
2010-11- Revenue
Textiles
Brands & Retails 18%
Brands - Jvs4%
Others 6%
Textiles
Brands & Retails 16%
Brands - Jvs3%
Others 6%
Compared to FY 2009-10
Brands & Retail Business grew by 47%
Share of apparel & fabric retailing grew to 32% from 28%
Share of domestic revenue grew to 67% from 62%
2010-11 2009-10
Textiles 72% Textiles
75%
Textile Business grew by 20%
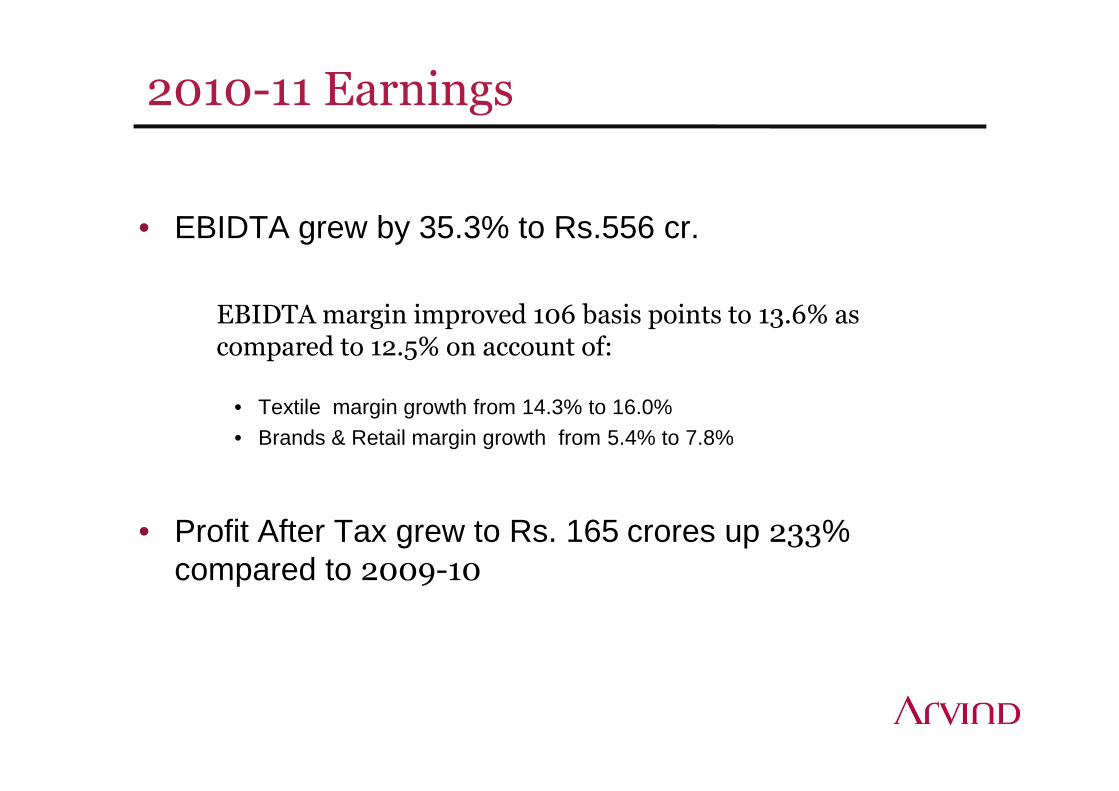
2010-11 Earnings
• EBIDTA grew by 35.3% to Rs.556 cr.
EBIDTA margin improved 106 basis points to 13.6% as compared to 12.5% on account of:
• Textile margin growth from 14.3% to 16.0%• Textile margin growth from 14.3% to 16.0%• Brands & Retail margin growth from 5.4% to 7.8%
• Profit After Tax grew to Rs. 165 crores up 233% compared to 2009-10
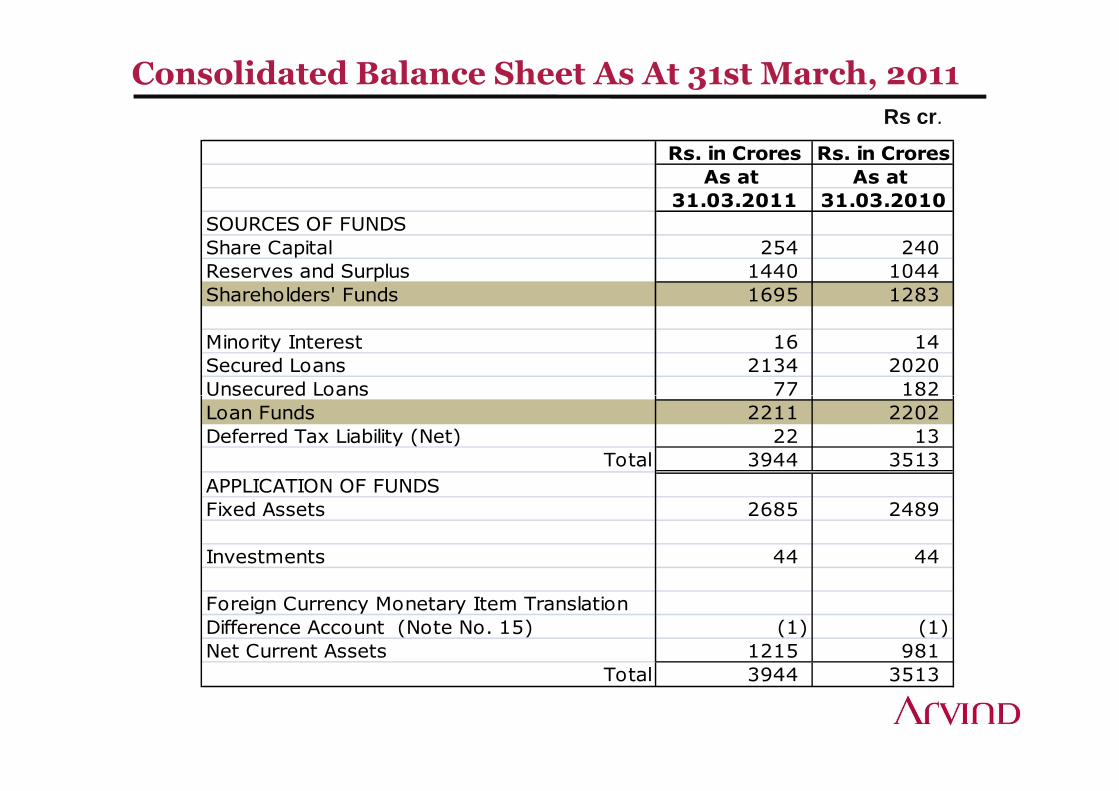
Consolidated Balance Sheet As At 31st March, 2011
Rs cr.
Rs. in Crores Rs. in Crores
As at As at
31.03.2011 31.03.2010
SOURCES OF FUNDS
Share Capital 254 240
Reserves and Surplus 1440 1044
Shareholders' Funds 1695 1283
Minority Interest 16 14
Secured Loans 2134 2020
Unsecured Loans 77 182Unsecured Loans 77 182
Loan Funds 2211 2202
Deferred Tax Liability (Net) 22 13
Total 3944 3513
APPLICATION OF FUNDS
Fixed Assets 2685 2489
Investments 44 44
Foreign Currency Monetary Item Translation
Difference Account (Note No. 15) (1) (1)
Net Current Assets 1215 981
Total 3944 3513

Ratios
2009-10 2010-11
EPS 1.99 6.5
Debt/Equity 1.72 1.31Debt/Equity 1.72 1.31
Debt/EBIDTA 5.10 3.73
ROCE 7.4% 10.6%
ROE 3.9% 8.4%
Revenue growth 19% 25%
Financial Performance-Standalone
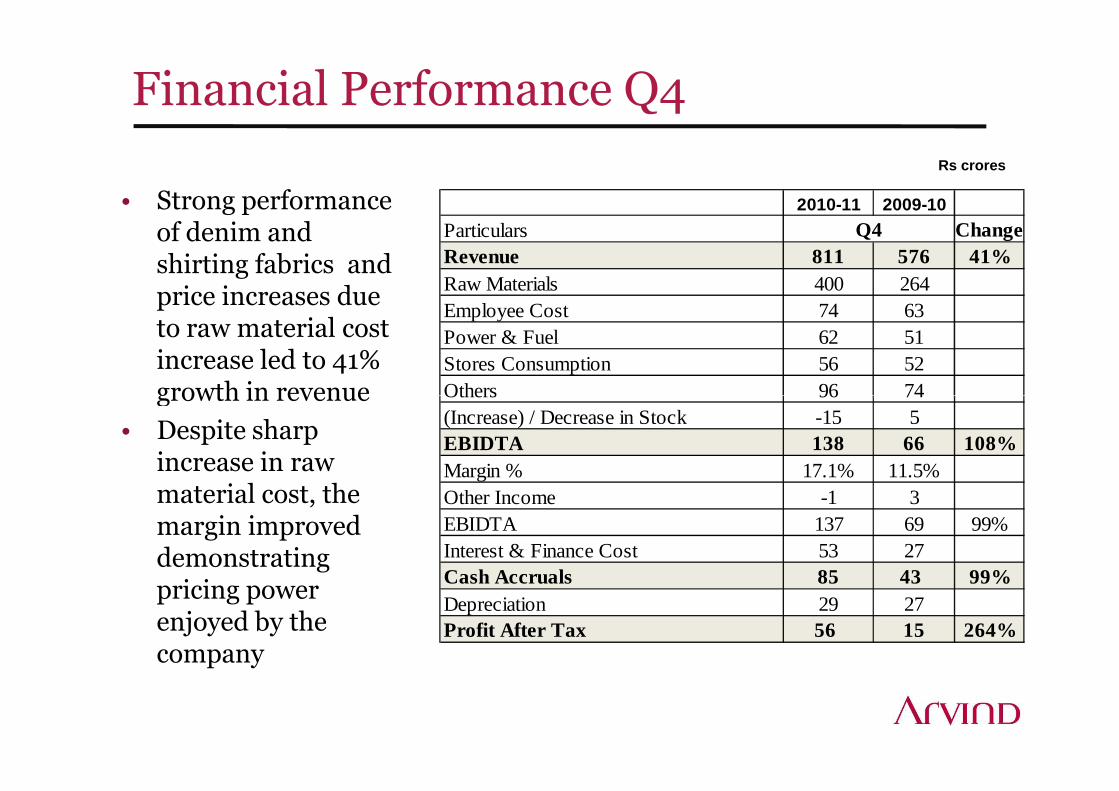
Financial Performance Q4
• Strong performance of denim and shirting fabrics and price increases due to raw material cost increase led to 41% growth in revenue
Rs crores
2010-11 2009-10
Particulars ChangeRevenue 811 576 41%Raw Materials 400 264Employee Cost 74 63Power & Fuel 62 51Stores Consumption 56 52Others 96 74
Q4
growth in revenue
• Despite sharp increase in raw material cost, the margin improved demonstrating pricing power enjoyed by the company
Others 96 74(Increase) / Decrease in Stock -15 5EBIDTA 138 66 108%Margin % 17.1% 11.5%Other Income -1 3EBIDTA 137 69 99%Interest & Finance Cost 53 27Cash Accruals 85 43 99%Depreciation 29 27Profit After Tax 56 15 264%
Financial Performance 2010-11
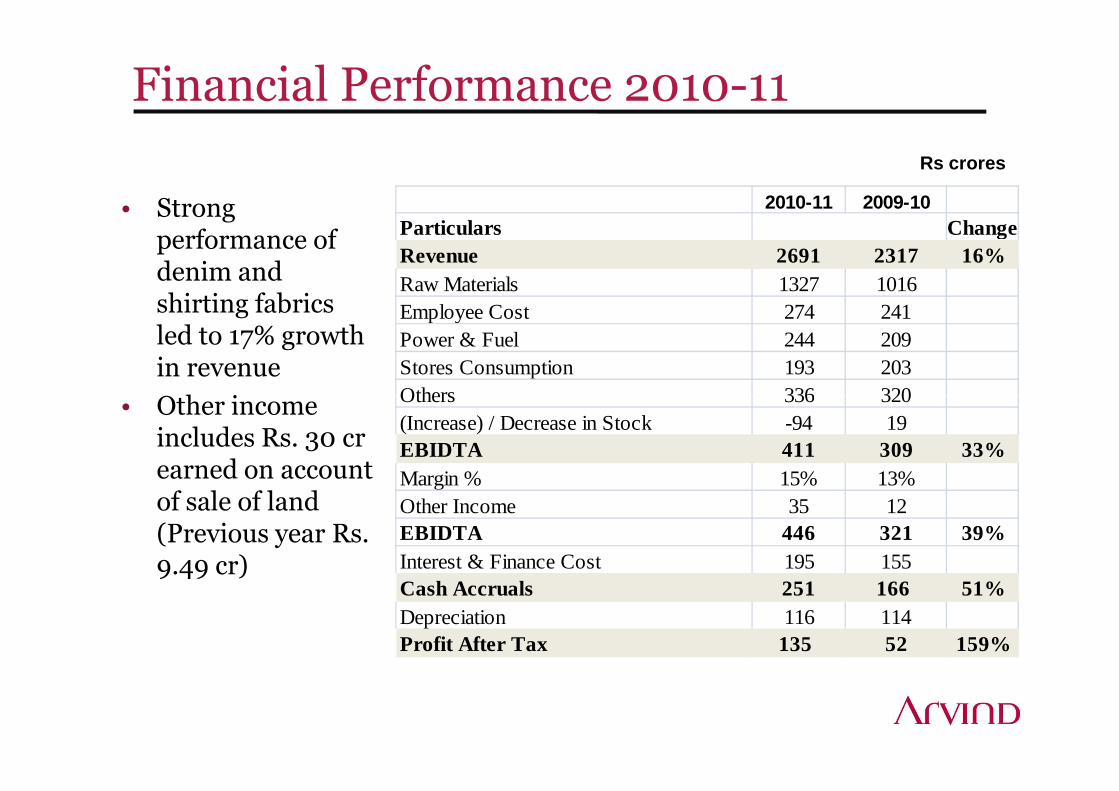
• Strong performance of denim and shirting fabrics led to 17% growth in revenue
• Other income
Rs crores
2010-11 2009-10Particulars ChangeRevenue 2691 2317 16%Raw Materials 1327 1016Employee Cost 274 241Power & Fuel 244 209Stores Consumption 193 203Others 336 320• Other income
includes Rs. 30 cr earned on account of sale of land (Previous year Rs. 9.49 cr)
Others 336 320(Increase) / Decrease in Stock -94 19EBIDTA 411 309 33%Margin % 15% 13%Other Income 35 12EBIDTA 446 321 39%Interest & Finance Cost 195 155Cash Accruals 251 166 51%Depreciation 116 114Profit After Tax 135 52 159%
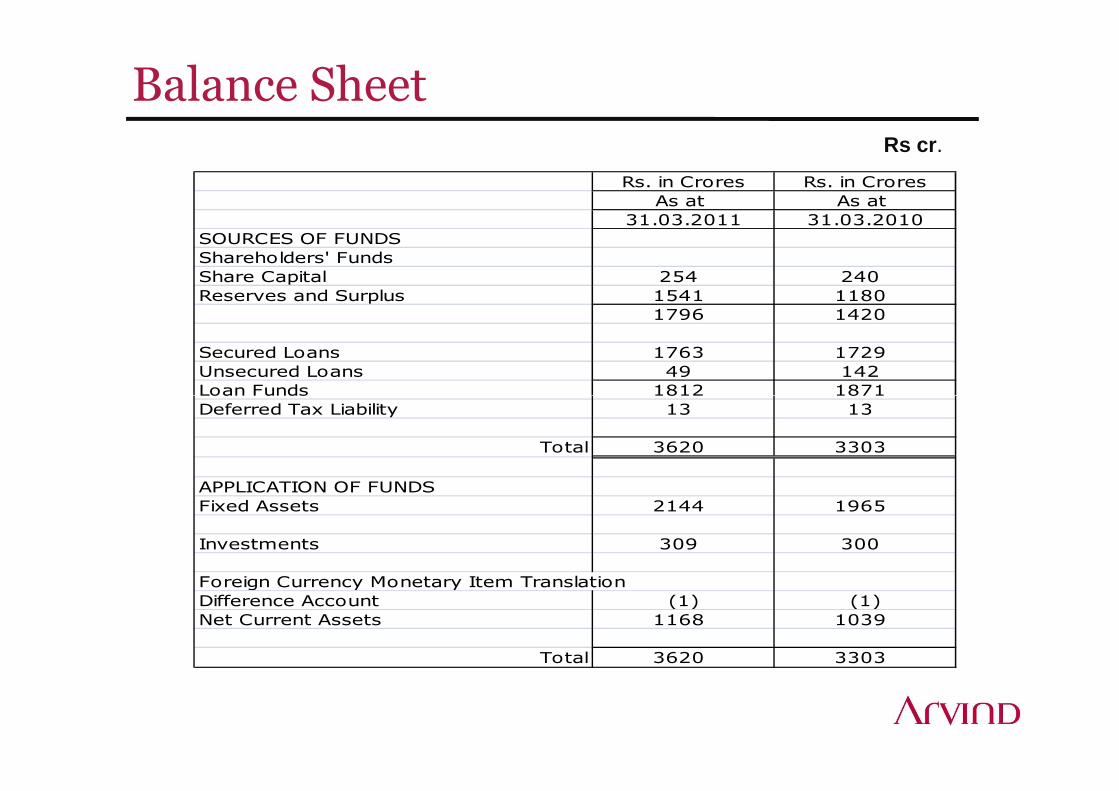
Balance SheetRs cr.
Rs. in Crores Rs. in Crores
As at As at
31.03.2011 31.03.2010
SOURCES OF FUNDS
Shareholders' Funds
Share Capital 254 240
Reserves and Surplus 1541 1180
1796 1420
Secured Loans 1763 1729
Unsecured Loans 49 142
Loan Funds 1812 1871Loan Funds 1812 1871
Deferred Tax Liability 13 13
Total 3620 3303
APPLICATION OF FUNDS
Fixed Assets 2144 1965
Investments 309 300
Foreign Currency Monetary Item Translation
Difference Account (1) (1)
Net Current Assets 1168 1039
Total 3620 3303

Business Analysis
All numbers in this section are consolidated unless specified otherwise

Textiles Business- Revenue Mix
Textile revenue grew by 20% led by robust 29% growth in denim and 20% growth in
Voils , 211Garments, 526
Garments, 458
Shirting / Khaki, 819
Shirting / Khaki, 987
Knits/ Others, 56
Knits/ Others, 109
2449
2935
-13%
20%
20% growth in shirting/khaki fabrics
Denim , 1051
Denim , 1,359
Voils , 179
Internal Sales, -182 Internal Sales, -188
2009-10 2010-11
29%

Key Parameters-2010-11-Textiles
2010-11 2009-10 2010-11 2009-10Exports (Mn Mtrs) 45 43 15 9Domestics (Mn Mtrs) 51 45 52 49Avg Price (Rs / Mtr) 139 116 139 125
Cotton Gas
Denim Shirting
Components 2010-11 2009-10 2010-11 2009-10Cost in Rs./Kg 96 64 15 15
Cotton Gas
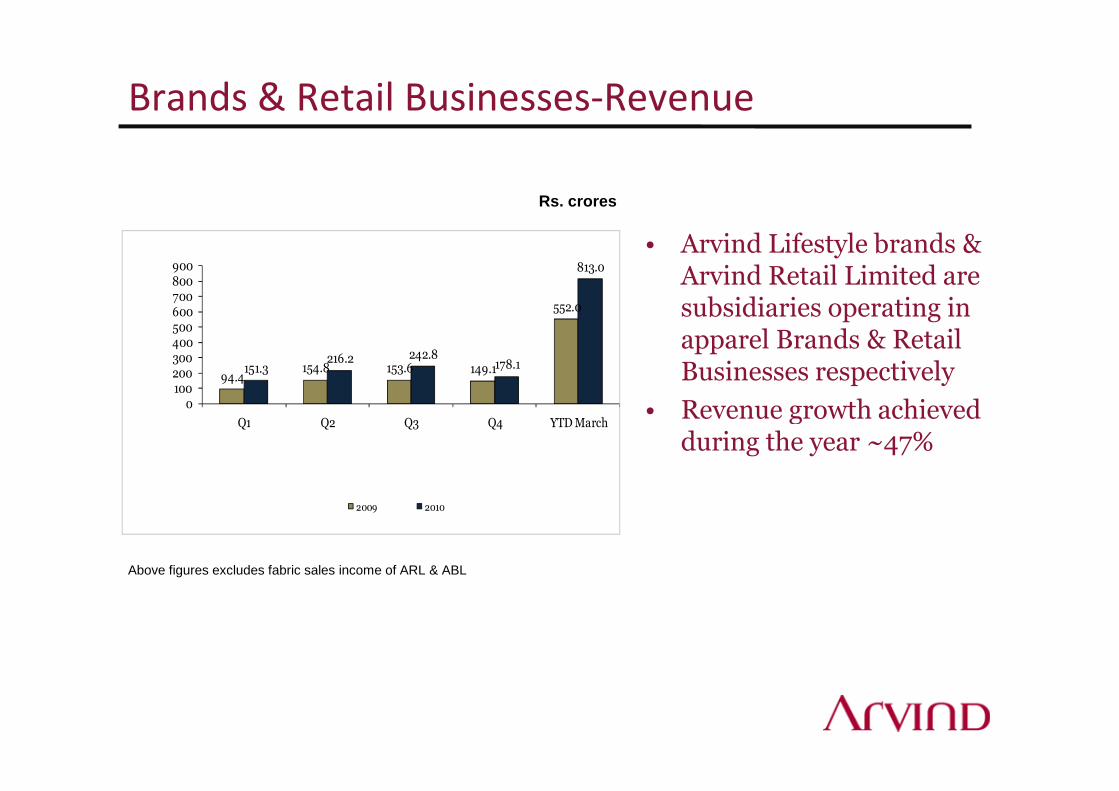
Brands & Retail Businesses-Revenue
• Arvind Lifestyle brands & Arvind Retail Limited are subsidiaries operating in apparel Brands & Retail Businesses respectively
• Revenue growth achieved
Rs. crores
94.4154.8 153.6 149.1
552.0
151.3216.2 242.8
178.1
813.0
100200300400500600700800900
• Revenue growth achieved during the year ~47%
Above figures excludes fabric sales income of ARL & ABL
0100
Q1 Q2 Q3 Q4 YTD March
2009 2010
Revenue
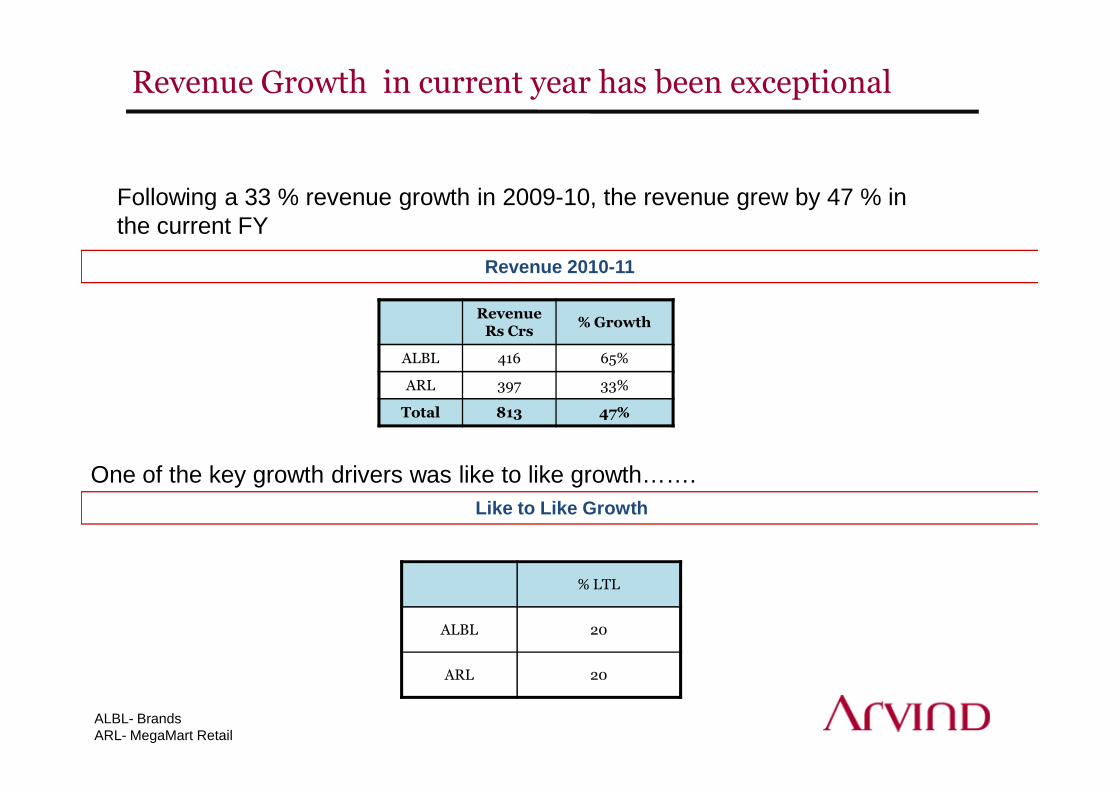
Rs Crs% Growth
ALBL 416 65%
ARL 397 33%
Revenue Growth in current year has been exceptional
Following a 33 % revenue growth in 2009-10, the revenue grew by 47 % in the current FY
Revenue 2010-11
Total 813 47%
% LTL
ALBL 20
ARL 20
One of the key growth drivers was like to like growth…….Like to Like Growth
ALBL- Brands ARL- MegaMart Retail

Outlook 2011-12
Positives:
• Robust demand for fabrics & garments
• Strong growth in Brands & Retail subsidiaries
• Cotton prices correcting to reasonable levels
– Will help reduce the price of fabrics
– Arvind has cotton stock for next few months against which it also has firm
fabrics orders and hence does not expect negatives on its inventoryfabrics orders and hence does not expect negatives on its inventory
– Arvind purchases 40% of its raw materials in form of yarn: The yarn prices
have fallen in tandem with fall in cotton price.
Negatives:
• Increase in Interest cost as rates increase
Outlook
• 20% Revenue growth
• Margin expected to be maintained
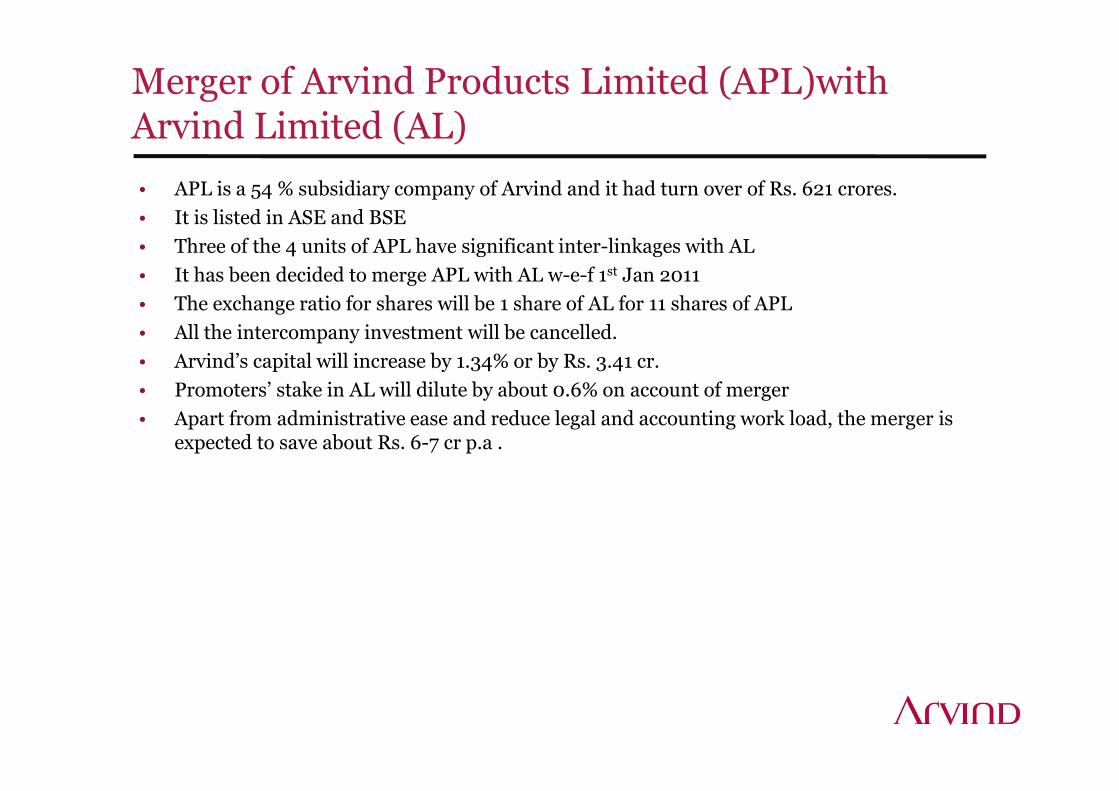
Merger of Arvind Products Limited (APL)with Arvind Limited (AL)
• APL is a 54 % subsidiary company of Arvind and it had turn over of Rs. 621 crores.
• It is listed in ASE and BSE
• Three of the 4 units of APL have significant inter-linkages with AL
• It has been decided to merge APL with AL w-e-f 1st Jan 2011
• The exchange ratio for shares will be 1 share of AL for 11 shares of APL
• All the intercompany investment will be cancelled.
• Arvind’s capital will increase by 1.34% or by Rs. 3.41 cr.
• Promoters’ stake in AL will dilute by about 0.6% on account of merger• Promoters’ stake in AL will dilute by about 0.6% on account of merger
• Apart from administrative ease and reduce legal and accounting work load, the merger is expected to save about Rs. 6-7 cr p.a .
Thank You