Embed Size (px)
Citation preview

Review of Acquisition for the Secretary of State for DefenceAn independent report by Bernard Gray
October 2009
report cover final.indd 1 12/10/2009 10:42
Review of Acquisition for the Secretary of State for Defence
An independent report by Bernard Gray
October 2009

1 1 Review of Acquisition
© Bernard Gray 2009
2 2
Review of Acquisition
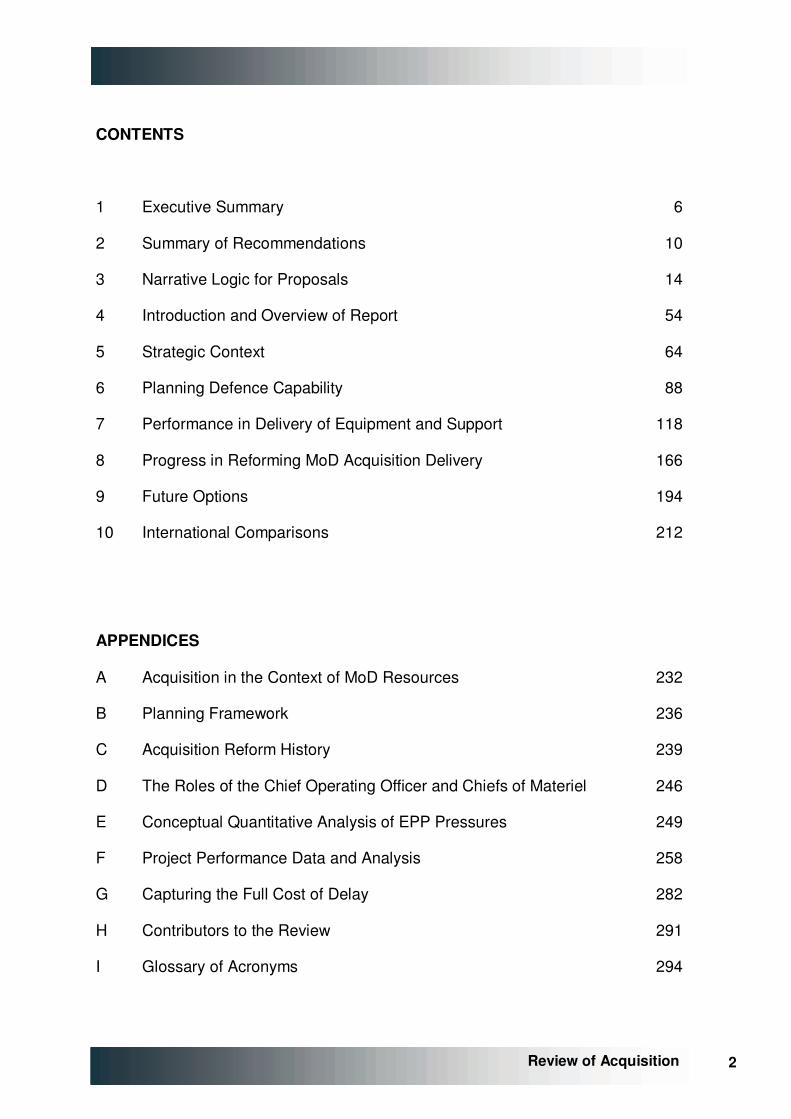
CONTENTS
1 Executive Summary 6
2 Summary of Recommendations 10
3 Narrative Logic for Proposals 14
4 Introduction and Overview of Report 54
5 Strategic Context 64
6 Planning Defence Capability 88
7 Performance in Delivery of Equipment and Support 118
8 Progress in Reforming MoD Acquisition Delivery 166
9 Future Options 194
10 International Comparisons 212
APPENDICES
A Acquisition in the Context of MoD Resources 232
B Planning Framework 236
C Acquisition Reform History 239
D The Roles of the Chief Operating Officer and Chiefs of Materiel 246
E Conceptual Quantitative Analysis of EPP Pressures 249
F Project Performance Data and Analysis 258
G Capturing the Full Cost of Delay 282
H Contributors to the Review 291
I Glossary of Acronyms 294

3 3 Review of Acquisition
4 4
Review of Acquisition
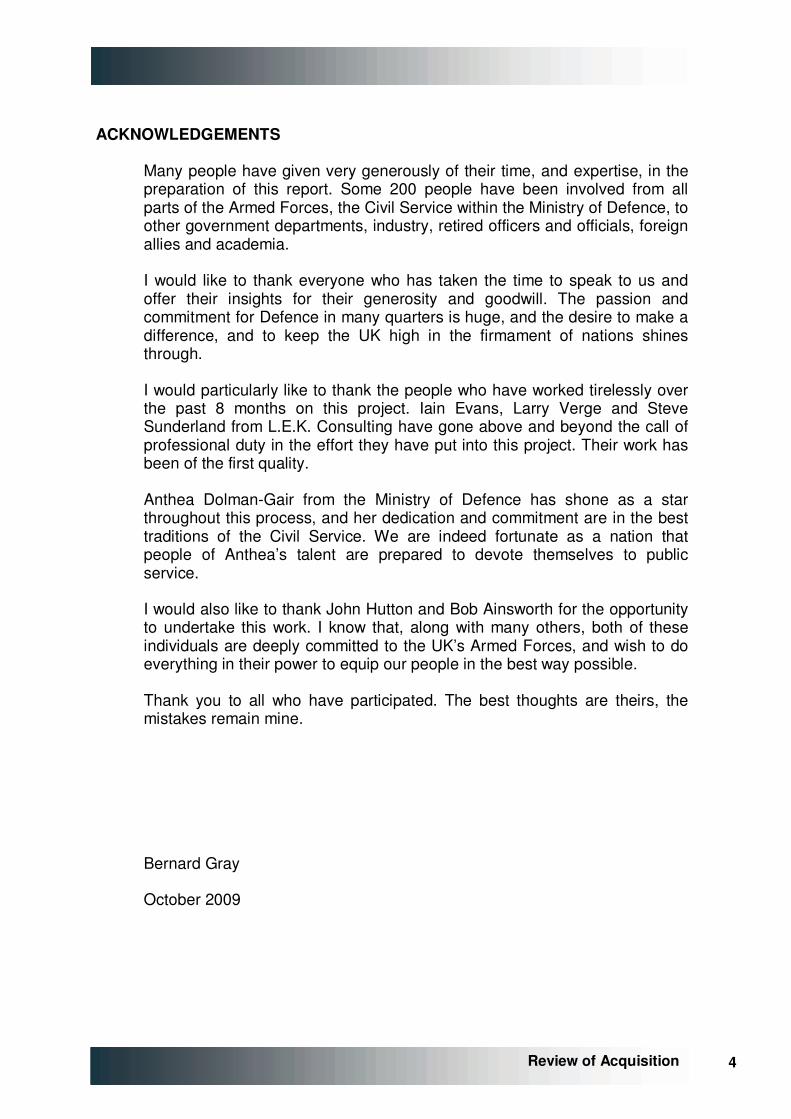
ACKNOWLEDGEMENTS
Many people have given very generously of their time, and expertise, in the preparation of this report. Some 200 people have been involved from all parts of the Armed Forces, the Civil Service within the Ministry of Defence, to other government departments, industry, retired officers and officials, foreign allies and academia.
I would like to thank everyone who has taken the time to speak to us and offer their insights for their generosity and goodwill. The passion and commitment for Defence in many quarters is huge, and the desire to make a difference, and to keep the UK high in the firmament of nations shines through.
I would particularly like to thank the people who have worked tirelessly over the past 8 months on this project. Iain Evans, Larry Verge and Steve Sunderland from L.E.K. Consulting have gone above and beyond the call of professional duty in the effort they have put into this project. Their work has been of the first quality.
Anthea Dolman-Gair from the Ministry of Defence has shone as a star throughout this process, and her dedication and commitment are in the best traditions of the Civil Service. We are indeed fortunate as a nation that people of Anthea’s talent are prepared to devote themselves to public service.
I would also like to thank John Hutton and Bob Ainsworth for the opportunity to undertake this work. I know that, along with many others, both of these individuals are deeply committed to the UK’s Armed Forces, and wish to do everything in their power to equip our people in the best way possible.
Thank you to all who have participated. The best thoughts are theirs, the mistakes remain mine.
Bernard Gray
October 2009

5 5 Review of Acquisition
6 6
Review of Acquisition
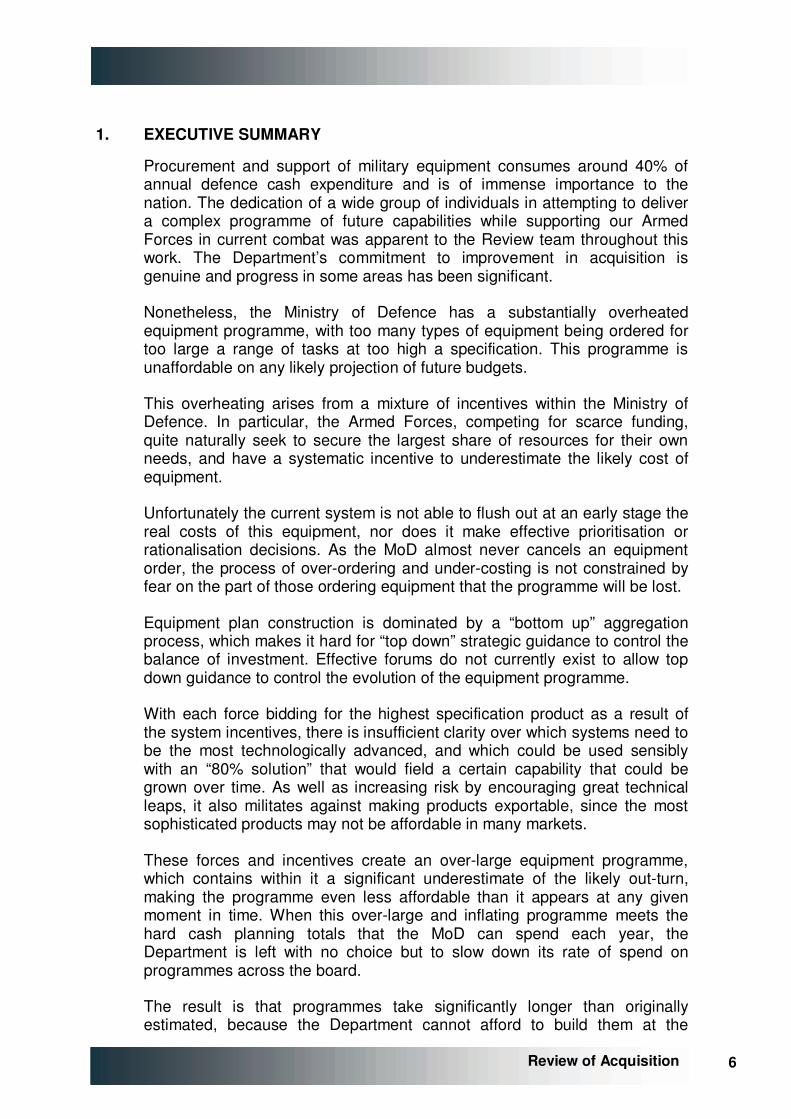
1. EXECUTIVE SUMMARY
Procurement and support of military equipment consumes around 40% of annual defence cash expenditure and is of immense importance to the nation. The dedication of a wide group of individuals in attempting to deliver a complex programme of future capabilities while supporting our Armed Forces in current combat was apparent to the Review team throughout this work. The Department’s commitment to improvement in acquisition is genuine and progress in some areas has been significant.
Nonetheless, the Ministry of Defence has a substantially overheated equipment programme, with too many types of equipment being ordered for too large a range of tasks at too high a specification. This programme is unaffordable on any likely projection of future budgets.
This overheating arises from a mixture of incentives within the Ministry of Defence. In particular, the Armed Forces, competing for scarce funding, quite naturally seek to secure the largest share of resources for their own needs, and have a systematic incentive to underestimate the likely cost of equipment.
Unfortunately the current system is not able to flush out at an early stage the real costs of this equipment, nor does it make effective prioritisation or rationalisation decisions. As the MoD almost never cancels an equipment order, the process of over-ordering and under-costing is not constrained by fear on the part of those ordering equipment that the programme will be lost.
Equipment plan construction is dominated by a “bottom up” aggregation process, which makes it hard for “top down” strategic guidance to control the balance of investment. Effective forums do not currently exist to allow top down guidance to control the evolution of the equipment programme.
With each force bidding for the highest specification product as a result of the system incentives, there is insufficient clarity over which systems need to be the most technologically advanced, and which could be used sensibly with an “80% solution” that would field a certain capability that could be grown over time. As well as increasing risk by encouraging great technical leaps, it also militates against making products exportable, since the most sophisticated products may not be affordable in many markets.
These forces and incentives create an over-large equipment programme, which contains within it a significant underestimate of the likely out-turn, making the programme even less affordable than it appears at any given moment in time. When this over-large and inflating programme meets the hard cash planning totals that the MoD can spend each year, the Department is left with no choice but to slow down its rate of spend on programmes across the board.
The result is that programmes take significantly longer than originally estimated, because the Department cannot afford to build them at the
7 7 Review of Acquisition
originally planned rate. They also cost more than they would otherwise, because the overhead and working capital costs of keeping teams within industry and the MoD working on programmes for a much longer period soaks up additional cash. The MoD also has to bear significant costs in running on old equipment because the new equipment is not yet ready for service.
Across a large range of programmes, this study found that the average programme overruns by 80% or c.5 years from the time specified at initial approval through to in service dates. The average increase in cost of these programmes is 40% or c.£300m. This study also estimates that the “frictional costs” to the Department of this systematic delay are in the range £900m - £2.2bn pa.
As well as costing significant sums, this squeeze on short-term cash expenditure in an effort to manage an over large programme has a number of other undesirable impacts. It reduces funds available for technology demonstration or risk-reduction activities, which might reduce risk in new procurements. It depresses spend in areas such as Research & Technology, where by their nature, budgets tend to be committed less far ahead, and so are vulnerable to a cash squeeze.
Balancing this equipment programme, and keeping it in balance, is clearly a very significant objective of this report. As a result, the report recommends routine Strategic Defence Reviews, to be conducted in the first session of a new Parliament, as a mechanism to ensure periodic “resetting” of the MoD’s plans. The report also recommends a set of detailed changes to keep the Equipment Programme on track between reviews.
The report also finds a blurring of roles and accountability between the “Capability” group, which specifies new equipment on behalf of the MoD, and the Defence Equipment and Support “Delivery” organisation, tasked with taking this specification and turning it into a procurement process. New tools, such as Through Life Capability Management, are designed to allow the MoD to manage and trade off attributes of its equipment, manpower and infrastructure, but they currently lack the hard financial data that would be required to make quantitative decisions.
The report makes recommendations to separate and clarify roles and accountabilities between the MoD Centre and the DE&S and to significantly improve the operation of TLCM.
Defence Equipment and Support, the MoD’s delivery arm, also needs significantly greater skills and tools in a number of areas if it is to be able to deliver effectively on a better-balanced equipment plan. There is a need for a greater level of resources and skills in Programme & Project Management, Finance, Cost Estimating, Engineering and Contracting, as well as a need for better Project Management and Management Information systems.
8 8
Review of Acquisition
When merging the Defence Procurement Agency and the Defence Logistics Organisation into DE&S, the MoD took the decision to remove the entity’s next-steps agency status, and return DE&S to being part of the “core” MoD despite the DPA having achieved its targets on Performance, Cost and Time. This report is concerned by the reduced operational flexibility that this gives DE&S, and by a reduction in clarity that came from the customer-supplier split that the creation of the DPA had produced.
In analysing programme performance for this study, it was found that the programmes managed under the “Smart Acquisition” regime that was part of the creation of the DPA performed significantly better than previous programmes. This report is concerned that the disciplines that came from Smart Acquisition risk being lost under the newer governance arrangements.
Although much needs improvement in the planning and delivery of longer term requirements, it is notable, and to the DE&S’s great credit, that the equipment acquisition system works best when needs are greatest. The UOR process, which is designed to provide battle winning equipment at short notice to current operations, appears able to deliver better trade-offs between performance, cost and time in the interests of ensuring that, by and large, the front line receives the right kit at the right time.
How best to inject key skills and tools into the DE&S organisation is the third main area of concern for this report. This report contends that the most effective way to achieve the objective of creating a world-class programme management organisation in DE&S, would be through a partnership with a private sector programme management organisation, of the type operating in civil engineering and other complex engineering fields.
The suggested route to achieve this is through a Government-Owned, Contractor Operated entity. However, creation of such a Go-Co is a significant and controversial step, and this report recommends that it should be subject to further work over the next 12 months to ensure it does not cut across other defence objectives.
Finally, this report notes that similar pressures to those that exist in the new equipment programme also exist within the support of in-service equipment. The detailed nature of in-service equipment support, and the lack of time to delve into these issues, means that this report has not sought to tackle this area in detail.
It is recommended that significant further work be put in hand to analyse this area further and produce recommendations for further action.

9 9 Review of Acquisition
10 10
Review of Acquisition
2. SUMMARY OF RECOMMENDATIONS
1. Strategic Defence Review to be held in the first session of a new Parliament
a) The requirement for such reviews should be enshrined in statute.
b) The output of the reviews should be fully costed and audited.
c) These costings to include 10 year defence and 20 year equipment budgets.
d) The results of the review, including costings, to be published to Parliament.
e) The PUS, as Accounting Officer, as a key enabler to a realistic defence budget, to be held accountable for overall costings in the strongest possible terms, ideally legally.
2. A rolling 10 year budget should be agreed for the MoD
a) Budget to be enshrined in law, in line with the French example.
b) To encompass manpower, estates, equipment and support funding.
3. An Executive Committee of the Defence Board should be formed to be accountable for an affordable Equipment Programme
a) The Committee is charged with creating and managing an affordable Equipment Plan to be submitted to the Defence Board & Ministers.
b) Membership of this Committee to be the PUS (Chair), CDS, DG Finance, 2nd PUS, VCDS and no other. No alternates.
c) DCDS(Capability) to be responsible for drawing together the plan, in consultation with the DG Strategy and the nominated representative of the DG Finance.
d) The Committee to meet at least quarterly, and to submit its EP to the Defence Board as part of the annual planning process.
e) The costing of the EP and its affordability against the 10 year defence budget should be the responsibility of the MoD DG Finance.
f) All known liabilities to be included within the costed plan.
g) These costings, and the veracity of the estimates, would be subject to independent audit by a major accounting firm. This audit to be published, with the MoD having to pass a “going concern” test of plan against budget.
h) The Defence Board could only accept or reject the EP proposed by the Committee as a whole. No cherry picking.
i) Ministers, the Services, industry and others would be expected to offer direction or views in the process of the formation of the plan, rather than
11 11 Review of Acquisition
after its creation, to ensure a balanced and affordable plan was produced.
j) The PUS, as Accounting Officer, would be accountable to Parliament annually for the affordability and accuracy of the plan. The PUS to become the true “owner” of the equipment plan, enabling the PUS sufficient authority.
4. Clarify roles and create a real customer-supplier relationship between the capability sponsor (MoD centre) and project delivery (DE&S)
a) DCDS(Capability) to be responsible for the creation and control of requirements, and required to control the budget of the agreed EP as a single point of MoD contact with DE&S for equipment.
b) Clear ownership of each project/requirement to be allocated to a single individual within DCDS(Capability) team, including business case formulation.
c) DE&S to be responsible for programme management and delivery against agreed requirements specification and budget.
d) Changes to requirements, programme delays, etc. to be specifically and realistically costed and included in the next iteration of the plan. If any increases threaten affordability (as is likely) cuts must be made elsewhere.
e) Cost of DE&S resources on projects should be tracked and charged.
5. Revise aspects of the Approval process to improve decision making
a) IAB to report to Executive Committee on control of equipment approvals. IAB charged with consideration of the affordability of total programme, not just single projects. Chair of IAB to be taken on by MoD DG Finance.
b) Current Initial Gate/Main Gate approval process to be retained.
c) Scrutiny community to be expanded / up-skilled to provide early advice to IPT Leaders on the preparation of business cases.
d) Mandatory use of parametric data, independent cost estimations and other “should cost” tools to be used as basis of preparation of business cases.
e) Projects pre-Main Gate should be included in the plan at 90th percentile cost.
f) No business case should be accepted, nor requirement included in the overall plan, other than on the basis of costs derived as above.
6. Further cost reductions within in-service support should be pursued vigorously and the aspirations of TLCM should be reappraised
a) Significant further external work should be commissioned as a matter of urgency into the costs and function of in-service equipments.

12 12
Review of Acquisition
b) Once a new Strategic Defence Review has determined the future force structure for the MoD there should be much more use of contracting for availability to be included in initial equipment acquisition to align incentives between manufacturers and MoD.
c) Role of TLCM and Programme Boards to be re-considered. Current structure overly complex and lacking data for decisions.
d) TLCM to focus in first instance on financial modelling of acquisition vs. support costs. Financial models to be acquired to model these variables (cf. British Airways), DGD Commercial to control, reporting to MoD DG Finance.
7. Improve the ability of DE&S to deliver efficiently on new equipment and support
a) Scope and management structure of DE&S
i. Scope of DE&S to be rationalised. DE&S to focus on programme management of acquisition of new equipment and support of in-service equipment.
ii. Other functions, including dockyards, Joint Support Chain, and certain aspects of communications to be hived off into separate entities.
iii. Management structure of DE&S to be revised. Two joint COO 3* positions created to handle IPT workload, CoM roles to be abolished. CDM to be a very senior civilian Programme Management position, recruited externally. Chief of Staff and Chief of Corporate Services roles to be merged.
b) Develop better skills in the workforce
i. Significantly increase programme and project management skills within DE&S at all levels of the organisation.
ii. Increase in resources of central technical staffs available to individual projects as needed.
iii. No person, civil or military, to be appointed to a post of 1* or above without extensive programme management experience.
c) Ensure greater independence from the customer
i. Hard charging interfaces to be created between DE&S and DCDS(Capability) for future equipment programme, and any change requests, and Front Line Commands for in-service support. Full reporting on output delivered for budget input required.
ii. Level of resources and skills of independent cost estimators to be substantially increased.
iii. CDM and the joint COO 3* posts to have full control over appointment of 2* Cluster heads and 1* team leaders, with this control cascading down through DE&S.
iv. Military personnel may be seconded to teams to provide advice on user needs without programme management experience, but may not occupy line management positions in this guise.
13 13 Review of Acquisition
d) Institute a regime of strict financial discipline
i. Levels of resources and influence of Finance Function to be substantially increased. DE&S FD to be recognised as de-facto and de-jure second in command to CDM. DE&S FD to have strong dotted line to MoD DG Finance.
ii. Carrying forward into new FY of planned activity in excess of annual budgets (currently running at over 10% of DE&S spend) to be banned.
e) Improve accountability for project performance
i. Assurance process to be reduced and potentially removed as duplicative of Scrutiny role.
ii. Consistent programme and project management tools to be used across DE&S to ensure transparency of management information and easy migration of staff across teams.
iii. IPT leaders and above to be retained in post for a minimum 4-year double tour. Military officers seeking to serve as line managers must also follow this rule.
iv. Empowerment of cluster heads, and then IPT leaders, to be re-instated, as envisioned in Smart Acquisition.
8. Change the status of DE&S
a) Status of DE&S to be considered. At the very minimum it should become a Trading Fund. If a credible plan for delivery of objectives set out in Recommendation 7 within government ownership cannot be brought forward within 12 months, DE&S to be contractorised as a formal Go-Co.
14 14
Review of Acquisition
3. NARRATIVE LOGIC FOR PROPOSALS
3.1. Preface
This report does not pretend to be exhaustive, or to offer solutions that will cure all ills. There are some important issues, such as the relationship between the Requirements community and Front Line Commands, or the detailed consideration of support cost management, which have been deliberately left to one side because of the pressure of time and resources.
In the way of life, this report dwells on areas where there are problems, not with the intention of saying that everything is broken or that the system as a whole is bad, but simply because it was asked to assess what might be done to improve the process. Inevitably, this leads to a focus on what needs to be fixed.
The Review team would like to make clear at this point, as it has at others, that much good work is going on within the MoD, that the Department is better at many of these activities than other government departments. It is also true that the UK’s allies are by and large complimentary and in some cases envious about what the UK has done to drive reform in this area. Equally, the systemic behaviours described in this report are not the result of bad behaviour by individuals, but of a structural series of incentives that encourage principled individuals to act in a way that does not maximise the outcome for the Ministry of Defence as a whole.
The Review team are full of admiration for many of the people seeking to do their best under such difficult circumstances and while they are at the same time trying to support our Armed Forces in current combat.
What this report does propose to offer, however, is a considered and coherent package of reforms that are specifically designed to improve the efficiency in the delivery and support of defence equipment in the interests of defence as a whole.
It is the strong view of the Review team that these measures would need to be taken together as a package and implemented in full if substantial progress is to be achieved. The incentives causing the current problems are strong and deeply entrenched, and reform could be delayed at many levels within the system, and in many different areas of activity.
It would be possible to improve the situation at one point, only to see the logjam move downstream to the next obstacle. It cannot be said clearly enough that the measures are a package designed to work as a whole. Cherry picking will not resolve the web of entrenched interests.
Ministers and the MoD staff need to give careful consideration to the implementation mechanisms associated with this report, since vested interests will not welcome these changes and may seek to undermine them
15 15 Review of Acquisition
in the implementation and over time. It will be important to know how the Department would intend to implement these reforms to ensure that they become properly entrenched.
If the difficulties are great, the prize is greater. It is a primary duty of Government to defend the nation, and the provision of an effective and coherent set of Armed Forces is an essential prerequisite to discharge that duty.
At any time, making the most of the money going into defence is important. It is all the more so at a time when the challenges facing the UK are substantial, where we stand at a strategic crossroads in defence policy, and where economic conditions severely limit the resources available for the task. If this report, and the actions it engenders, succeeds in transferring resources from the operation of the acquisition machine to the front line, it will have been worth all of the difficulties and sacrifices that reform requires.
3.2. Introduction
The acquisition of military equipment is a subject both deeply abstruse and wearily familiar. It is filled with technical detail and jargon, impenetrable to the outsider, yet it is the also the stuff of screaming headlines. “How can it be that it takes 20 years to buy a ship, or aircraft, or tank?” “Why does it always seem to cost at least twice what was thought?” Even worse, at the end of the wait, “Why does it never quite seem to do what it was supposed to do?” And, since this seems to be the stuff of annual recrimination, “Why has the problem endured for so long?” The issue is a mystery, wrapped in an enigma, shrouded in an acronym.
The problems, and the sums of money involved, have almost lost their power to shock, so endemic is the issue, and so routine the headlines. It seems as though military equipment acquisition is vying in a technological race with the delivery of civilian software systems for the title of “World’s Most Delayed Technical Solution”. Even British trains cannot compete.
Acquisition Reform, as it is generally known, is a subject only about 5 minutes younger than the acquisition of military equipment itself. Within the last 30 years there have been at least three substantial efforts in this direction in the UK, and two in the United States. A hundred years ago the costs of delivering Dreadnoughts were the stuff of newspaper campaigns, and it is likely that 400 years before that Henry VIII’s Treasury had rows with the Navy over the cost and lateness of the Mary Rose.
As well as being endemic, the problem is also widespread: each of the UK’s Armed Services suffers from it, the UK’s allies too report similar problems. Mr Robert Gates, the US Defence Secretary, has recently written a number of papers on poor US experience in this area, in which the words “United States” could be deleted and replaced with the words “United Kingdom” without affecting the sense of the argument one jot. Discussions with France
16 16
Review of Acquisition
reveal that it has almost identical challenges, and Australia recently concluded an investigation into just this issue.
Others doubtless suffer in silence. While data on the acquisition performance of former Soviet bloc programmes is not readily to hand, it would take a brave soul to bet that their performance was better than that of the UK.
If the problem is deeply rooted and pervasive, it is also a fair bet that any genuine attempt to resolve the problem will be difficult to execute. If resolution of the problem were easy, then surely someone, somewhere would have solved it by now? While there are plenty who comment and some who attempt meaningful changes, there is little evidence of genuine success.
Nonetheless, the Review team would like to pay tribute to the work that the staff in defence acquisition and support have done over many years both in delivering equipment and support to the front line, but also in endeavouring to address / avoid this problem. In what has not always been the most glamorous part of defence, thousands of people have worked extremely hard over many years to deliver what is asked of them.
So perhaps a first question might be, is it really a problem at all, or just a fact of life that must be tolerated rather than resolved? Does acquisition delay fit with death and taxes as a burden that must be borne? And anyway, how much damage does it really cause, beyond some embarrassment to Defence Procurement Officials and Ministers called to answer the charges of the National Audit Office and the newspapers?
Let’s start with some facts. For this study, a team from L.E.K. Consulting, a global strategic consulting business, has worked closely with MoD officials to delve deeply into the data within the Ministry of Defence to analyse the position as objectively as possible. From a possible universe of around 150 programmes for which significant data exist, a floating sample of just over 40 where the data are the most complete have been the focus of attention to try to establish patterns.
The overall picture may be familiar, but it does not look pretty. On average, these programmes cost 40% more than they were originally expected to, and are delivered 80% later than first estimates predicted. In sum, this could be expected to add up to a cost overrun of approximately £35bn1, and an average overrun of nearly 5 years.
Moreover, it has not been possible to establish definitively in this study how much of the military capability originally sought was delivered, because that is not easily expressed in quantitative terms, nor is it reliably captured within the MoD’s own management information systems, but there is plenty of evidence of de-scoping of capability in the NAO’s annual report on major projects (e.g., fewer Astute class submarines, fewer Nimrods).
1 Over the life of projects currently approved at Initial Gate
17 17 Review of Acquisition
0
25
50
75
100
125
150
175
200
28
Demonstration &Manufacture
phase forecastduration
Assessment phase forecast
duration
100
Estimate made at Initial Gate
15
39
Changes duringAssessment phase
Demonstration &Manufacture
phase forecastduration
Assessment phase outturn
duration
154
Estimate madeat Main Gate
Changes duringDemonstration and Manufacture phase
Demonstration &Manufacture
phase outturnduration**
Assessment phase outturn
duration
181
Latest forecast / outturn**
Index of project duration (Forecast at Initial Gate50 = 100)
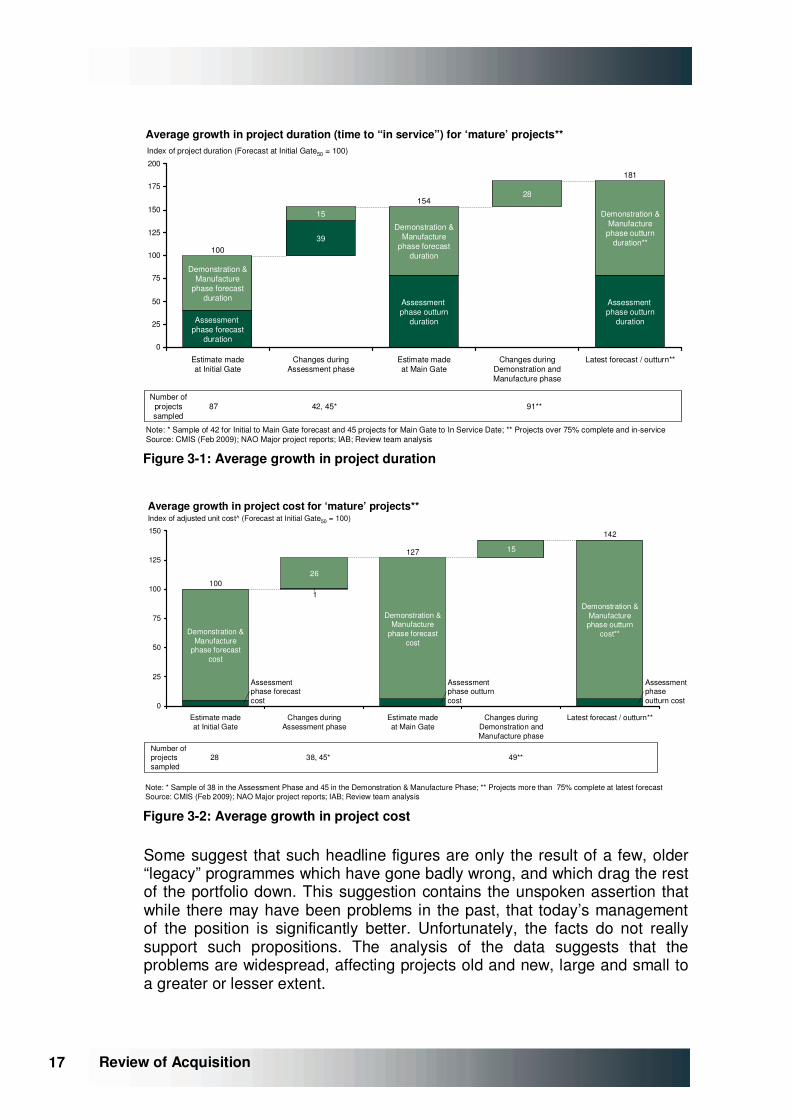
87 42, 45* 91**Number of
projectssampled
Note: * Sample of 42 for Initial to Main Gate forecast and 45 projects for Main Gate to In Service Date; ** Projects over 75% complete and in-serviceSource: CMIS (Feb 2009); NAO Major project reports; IAB; Review team analysis
Average growth in project duration (time to “in service”) for ‘mature’ projects**
Figure �3-1: Average growth in project duration
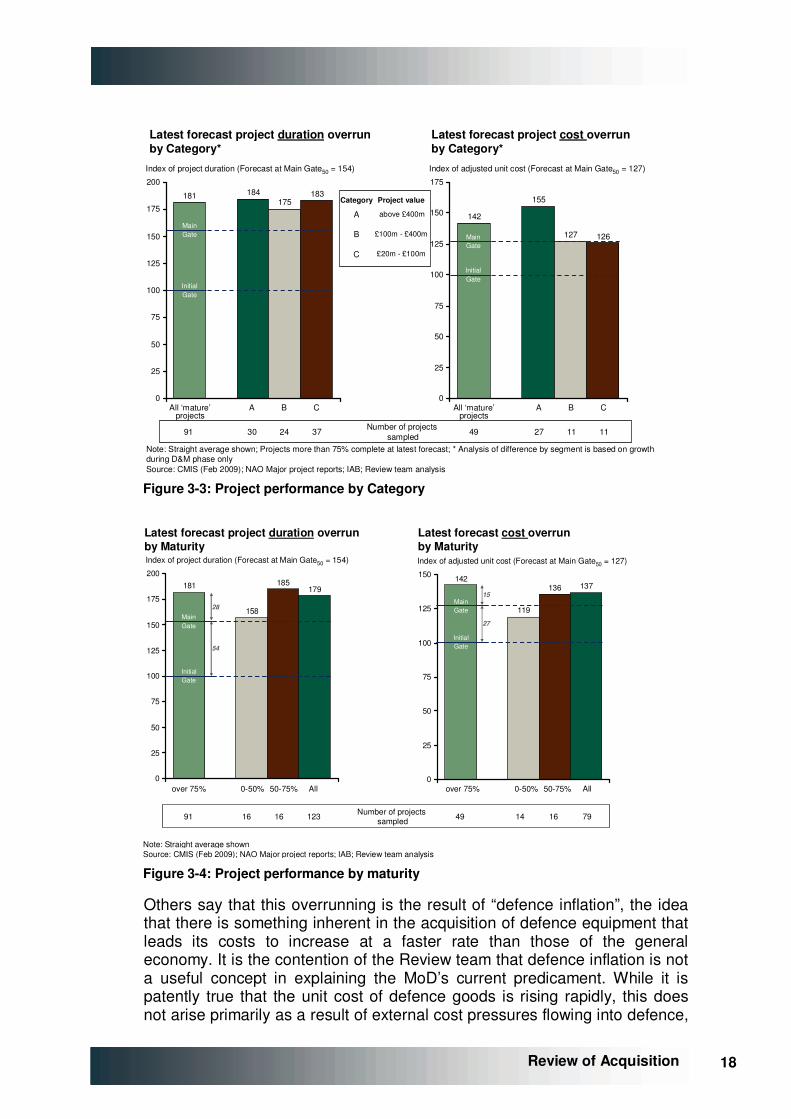
Note: * Sample of 38 in the Assessment Phase and 45 in the Demonstration & Manufacture Phase; ** Projects more than 75% complete at latest forecastSource: CMIS (Feb 2009); NAO Major project reports; IAB; Review team analysis
1
0
25
50
75
100
125
150
Changes duringAssessment phase
142
Demonstration &Manufacture
phase forecastcost
26
Assessment phaseoutturn cost
Assessment phase forecastcost
Demonstration &Manufacturephase outturn
cost**
Changes duringDemonstration and Manufacture phase
100
Estimate madeat Main Gate
Demonstration &Manufacture
phase forecastcost
Estimate made at Initial Gate
127
Latest forecast / outturn**
Assessment phase outturncost
Index of adjusted unit cost^ (Forecast at Initial Gate50 = 100)
15
28 38, 45* 49**Number ofprojectssampled
Average growth in project cost for ‘mature’ projects**
Figure �3-2: Average growth in project cost
Some suggest that such headline figures are only the result of a few, older “legacy” programmes which have gone badly wrong, and which drag the rest of the portfolio down. This suggestion contains the unspoken assertion that while there may have been problems in the past, that today’s management of the position is significantly better. Unfortunately, the facts do not really support such propositions. The analysis of the data suggests that the problems are widespread, affecting projects old and new, large and small to a greater or lesser extent.
18 18
Review of Acquisition
Note: Straight average shown; Projects more than 75% complete at latest forecast; * Analysis of difference by segment is based on growth during D&M phase onlySource: CMIS (Feb 2009); NAO Major project reports; IAB; Review team analysis
181 184175
183
0
25
50
75
100
125
150
175
200
Index of project duration (Forecast at Main Gate50 = 154)
30 24
Latest forecast project duration overrunby Category*
142
155
127 126
0
25
50
75
100
125
150
175
Index of adjusted unit cost (Forecast at Main Gate50 = 127)
Latest forecast project cost overrunby Category*
37 Number of projects sampled91
MainGate
InitialGate
MainGate
InitialGate
All ‘mature’projects
A B C
27 11 1149
All ‘mature’projects
A B C
Category
A
B
C
Project value
above £400m
£100m - £400m
£20m - £100m
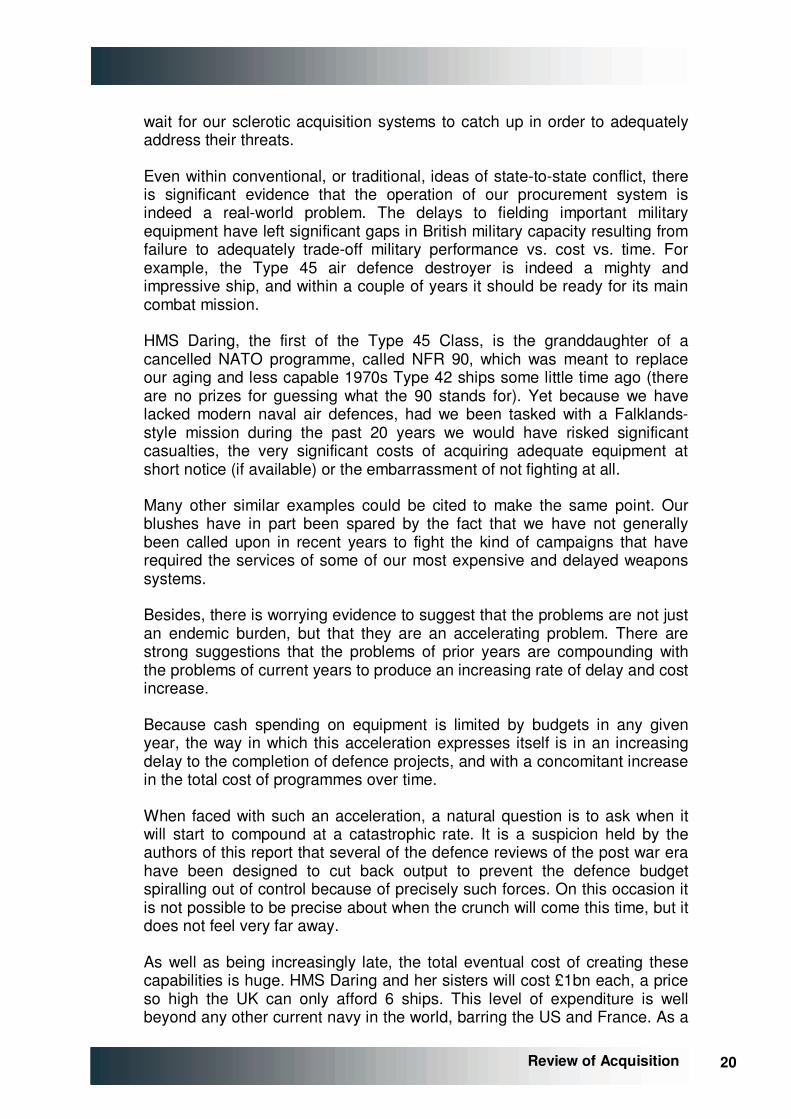
Figure �3-3: Project performance by Category
Note: Straight average shownSource: CMIS (Feb 2009); NAO Major project reports; IAB; Review team analysis
181
158
185179
0
25
50
75
100
125
150
175
200
Index of project duration (Forecast at Main Gate50 = 154)
Latest forecast project duration overrun by Maturity
16 123
Latest forecast cost overrunby Maturity
142
119
136 137
0
25
50
75
100
125
150
Index of adjusted unit cost (Forecast at Main Gate50 = 127)
14 16 7949Number of projects sampled
28
15
1691
MainGate
InitialGate
InitialGate
MainGate
54
27
over 75% 0-50% 50-75% All over 75% 0-50% 50-75% All
Figure �3-4: Project performance by maturity
Others say that this overrunning is the result of “defence inflation”, the idea that there is something inherent in the acquisition of defence equipment that leads its costs to increase at a faster rate than those of the general economy. It is the contention of the Review team that defence inflation is not a useful concept in explaining the MoD’s current predicament. While it is patently true that the unit cost of defence goods is rising rapidly, this does not arise primarily as a result of external cost pressures flowing into defence,

19 19 Review of Acquisition
but rather as a result of the behaviours within defence that cause system costs to be inflated. If the issues were tackled within the defence establishment, defence inflation could be better managed.
A stronger argument is advanced that this is an accounting problem: that the system may be poor at estimating what things are going to cost, and how long they will take to build, but this is just a function of poor initial costing, and that the changes merely reflect realism, rather than poor programme control.
There is some truth to this, but the causes are not what they might seem. As well as the inherent uncertainty of future outcomes, and the difficulties of breaking new technical ground, there are less excusable reasons for poor estimates. Simply put, many participants in the procurement system have a vested interest in optimistically mis-estimating the outcome.
The impact of this behaviour is profound, and the knock-on consequences of serious mis-estimation at the beginnings of programmes have a severe impact on the defence programme as a whole.
This weakness at the beginning of new programmes is fundamental, and its causes are critical to the observed outcomes, as this report will make clear. It is imperative to tackle the way in which this system works. If Government fails to tackle this challenge, then the Review team contends that the delivery of equipment will get later and later, that it will become more and more costly, and the UK will ultimately be unable to field the defences it needs.
Others who argue in defence of the current system say that while the data on poor programme performance may be accurate, that other countries’ performance is equally bad, and therefore the UK is no worse than the rest of the world in this area. This may also be true. While genuinely comparative data are hard to compile, it is easy to concede the point that the UK is no worse than average. Indeed both French and American officials have been complimentary about the UK’s efforts to reform military acquisition over the past decade.
However, the key issue is not comparative. Such overruns are not just accounting entries, but actually cause damage to UK military output - the UK should worry about what it actually does, and not take comfort from the poor performance of others. After all, it would seems a rum argument to assert that being crushed by a falling piano is not really a problem because your friends have also been crushed beside you.
Besides, the UK cannot rely, as perhaps we did during the Cold War, on a balance of delay between Western Powers and any potential adversaries. We are either fighting enemies for whom the delays and bureaucracy experienced by western nations is not a problem, such as in Afghanistan, or we confront new threats which will not wait for our current development timescales to evolve answers, such as the emerging threat of cyber-attack. Those who would attack us in new or unconventional ways are unlikely to
20 20
Review of Acquisition
wait for our sclerotic acquisition systems to catch up in order to adequately address their threats.
Even within conventional, or traditional, ideas of state-to-state conflict, there is significant evidence that the operation of our procurement system is indeed a real-world problem. The delays to fielding important military equipment have left significant gaps in British military capacity resulting from failure to adequately trade-off military performance vs. cost vs. time. For example, the Type 45 air defence destroyer is indeed a mighty and impressive ship, and within a couple of years it should be ready for its main combat mission.
HMS Daring, the first of the Type 45 Class, is the granddaughter of a cancelled NATO programme, called NFR 90, which was meant to replace our aging and less capable 1970s Type 42 ships some little time ago (there are no prizes for guessing what the 90 stands for). Yet because we have lacked modern naval air defences, had we been tasked with a Falklands-style mission during the past 20 years we would have risked significant casualties, the very significant costs of acquiring adequate equipment at short notice (if available) or the embarrassment of not fighting at all.
Many other similar examples could be cited to make the same point. Our blushes have in part been spared by the fact that we have not generally been called upon in recent years to fight the kind of campaigns that have required the services of some of our most expensive and delayed weapons systems.
Besides, there is worrying evidence to suggest that the problems are not just an endemic burden, but that they are an accelerating problem. There are strong suggestions that the problems of prior years are compounding with the problems of current years to produce an increasing rate of delay and cost increase.
Because cash spending on equipment is limited by budgets in any given year, the way in which this acceleration expresses itself is in an increasing delay to the completion of defence projects, and with a concomitant increase in the total cost of programmes over time.
When faced with such an acceleration, a natural question is to ask when it will start to compound at a catastrophic rate. It is a suspicion held by the authors of this report that several of the defence reviews of the post war era have been designed to cut back output to prevent the defence budget spiralling out of control because of precisely such forces. On this occasion it is not possible to be precise about when the crunch will come this time, but it does not feel very far away.
As well as being increasingly late, the total eventual cost of creating these capabilities is huge. HMS Daring and her sisters will cost £1bn each, a price so high the UK can only afford 6 ships. This level of expenditure is well beyond any other current navy in the world, barring the US and France. As a

21 21 Review of Acquisition
result, the export potential for this vessel is, to say the least, limited. The continued delivery of these ships at this cost may seem bizarre, but it is entirely consistent with each of the single Services’ rational desires to retain as much of the available funding as possible.
Where we have been called upon to use our military capabilities in anger, we have been at risk because our plans have not, in some cases, brought forth the equipment needed for the battle. It is a matter of public record that a large amount of the equipment used by the British Army in Afghanistan has been bought through urgent supplementary budget processes, rather than coming from core army stocks.
That may be at least partly excused by the fact that we had not anticipated fighting this kind of campaign in this kind of terrain when we set our plans. But the UK has now been in Afghanistan for over 7 years, and sooner or later the extraordinary ought to become business as usual. Yet the mainstream programme to equip our land forces does not yet reflect this position.
This introduces another question, is the UK buying the right equipment for our current and future needs? Here there is a tug between the real, gritty, difficult combat missions of today in Afghanistan against enemies who fight in a completely different way to us, asymmetric warfare in the jargon, and the longer-range worry about retaining the ability to fight a well-armed modern state at some point in the unknown future.
There is a real debate to be had about this, and a forum is needed to have it. As John Hutton, the former Secretary of State for Defence, implied in a written statement to Parliament on 11th December 2008, it seems likely that we will need to put more focus on the conduct of current operations such as Afghanistan than the system has managed to achieve thus far. Secretary Gates in the US made a very similar point in his budget announcement of 6th April 2009 when he said “every Defense dollar spent to overinsure against a remote or diminishing risk or, in effect, to run up the score in capability where the United States is already dominant is a dollar not available to take care of our people, reset the force, win the wars we are in, and improve capabilities in areas where we are underinvested and potentially vulnerable. That is a risk I will not take”.
This tension is real, and needs to be actively managed. For the UK at least, there is a real concern that being able to try to equip for and conduct current operations, and to fund the development and acquisition needed for long-term retention and regeneration of forces may be too much at current levels of funding. Either we find substantially more money, which, to be polite, seems difficult to imagine in the current economic conditions (and may not even then provide the solution for other reasons, more of which later), or we may be shortly be forced to choose, and the choice will be painful.
So as well as producing equipment late and over cost, there is a concern about whether the system is adapting sufficiently to the changing nature of
22 22
Review of Acquisition
combat in the 21st Century. It would seem that the forward planning system has not proved agile enough to adapt to a rapidly changing geo-political situation, and that the slow pace of western defence acquisition systems is harming our ability to confront emerging military challenges, and to conduct difficult current operations.
Or, as one wag, and expert in defence acquisition, recently observed, “the system is failing to produce the equipment we don’t need.”
To make good the shortcomings of the main equipment procurement programme, the Department has relied on a separate stream of fast-tracked acquisition to meet “urgent operational requirements” (“UOR’s”) Although we have not examined UOR procurement in detail, the Department’s data shows it has broadly delivered specified requirements on time and to budgeted cost. In the face of actual operations, even the most efficient acquisition planning and procurement would leave gaps that would need to be filled urgently. However, given the longevity of current operations, an agile acquisition process would have absorbed more of the extraordinary requirements as they became self-evidently ordinary.
What, then, might be done to improve this situation?
3.3. Strategic context
Some military planners have argued that efforts to update their detailed plans have been hampered by the lack of a new strategic framework in which to set their ideas. There is justice to this charge. The UK’s Strategic Defence Review (“SDR”) of 1998 set out a strategic context that was helpful in forming detailed plans, and was applauded as a result. But even its authors at the time felt that it was a framework that would last for about 5 years. They fully expected it to be replaced by a wholly new SDR in 2002-03, and that was well before the events of 9/11 changed the world.
Of course, the MoD can point at a number of initiatives in this area: the new Chapter for the SDR in 2002, the Defence Industrial Strategy of 2005, and the more broadly framed National Security Strategy of 2008 are examples. But all of these fall short of a coherent re-examination and comprehensive review of the UK’s long-term defence strategy.
In corporate life, no enterprise should persist with a 12 year old strategy without at least re-evaluating it fully on a regular basis. Few who would expect to prosper would even try to do so.
Accordingly, it is the first recommendation of the Review team that a Strategic Defence Review process should be conducted on a regular 4 or at the most 5-year basis, as happens in the United States through the Quadrennial Defence Review process.
23 23 Review of Acquisition
To give such a process maximum legitimacy and longevity, the team would propose that this should happen in the first year of a new Parliament, and should be enshrined in legislation to ensure that incoming governments did not try too easily to slip out of any difficult examinations of these issues.
Some have objected that such processes could be undermined by hung parliaments or short periods between elections, such as occurred in 1974. However, arrangements such as those governing the Boundary Commissions2 could be put in place to ensure that a common sense outcome prevailed.
The one major change that the Review team would propose to the 1998 SDR process would be that the outcome of this review should be fully costed, with the cost implications spelt out at the time of the review. The fact that this was not available to the 1998 review was the most significant weakness in an otherwise strong piece of work.
Some significant components of this 1998 plan, such as the provision of two aircraft carriers, were not fully costed at the time, and where partial cost estimates did exist, they pointed to significant, and unaffordable, bulges in equipment spending beyond the formal 10-year planning horizons of the MoD.
Participants in 1998, including Civil Servants and Military Personnel as well as Ministers, took the view that these problems would be ironed out in time, and that some kind of “bow wave” had existed within the equipment programme for a long time, and that its effects had always in the end been smoothed out.
While this was true, with the benefit of hindsight it now seems clear that the very existence of this bow wave is itself a significant contributor to the problems that have plagued defence procurement over a long period.
In reality, the bow wave allows the MoD to maintain a position that a whole variety of defence capabilities are in the process of being procured. This feels reassuring to the country about the size and scope of Britain’s Armed Forces, but behind this comforting thought is the cold fact is that the budget does not exist, and has arguably not existed since the end of the Second World War, to support this level of ambition.
The policies of successive governments, and a lack of political will to present to the electorate the unpleasant reality of the position, has been a significant force behind this double-think. So too has the fact that the Cold War allowed the fiction to be maintained, because there was no fighting to expose the weaknesses in the system, and because the Warsaw Pact had similar problems. It is equally true that Ministers, the Armed Forces, and Civil Servants did not rush to confront the problem either.
2 The Boundary Commissions are required to conduct a general review of constituency boundaries "not less than eight or more than twelve years" (Parliamentary Constituencies Act of 1986, as amended by Boundary Commissions Act of 1992)
24 24
Review of Acquisition
Such elision may have been acceptable, and even desirable, during the Cold War. The UK, and NATO members generally, confronted an adversary that had similar problems. If called upon to fight on any given day, both sides would have only been able to field a fraction of the military force to which they laid claim. Accordingly, provided the paper tiger was sufficiently convincing, claiming a high level of military force could be claimed to add to general deterrence, and so reduce the likelihood of actual combat.
And there is an argument that this kind of posture preserves flexibility and allows us the option to ramp up efforts if needed. If we have a programme running which has half-built a fast jet fleet or flotilla of frigates, then more resources can quickly be thrown into expanding that programme if the need starts to arise, than if we had abandoned the construction of such systems altogether.
This vestigial Cold War mindset lies behind much of the planned defence equipment spending today. We seek to retain the capacity to regenerate substantial armed force and high-end military technology against the day it might once more be required for a substantial state-on-state conflict. The majority of our defence equipment resources continue to be funnelled into such expensive, and contingent, military assets.
If the UK had deliberately decided to focus only on long-range preparation, and had foresworn current military action short of a direct, immediate, and existential attack on the UK homeland, this might be a viable posture. But this is not the situation today.
UK forces have been in real combat or serious peace enforcement missions in Bosnia, Kosovo, Sierra Leone, Iraq and Afghanistan, to name only the major actions, in the past 15 years. In all of these theatres we have sustained casualties and risked the lives and reputations of our forces. While we have by and large prevailed, in co-operation with allies in most cases, the operations have not been without risks or costs.
Unfortunately, the current level of UK defence resources does not permit us to sustain indefinitely both of these laudable objectives. We cannot fight the kind of unconventional, expeditionary wars that have been the stuff of much of the last decade, at the same time as providing the regeneration capacity across the full width of defence capabilities that keeps many critical military technologies within the UK, at anything like the current level of resources.
Future SDRs should also encompass a coherent framework for the defence industrial base, as the 2005 Defence Industrial Strategy did. As with the rest of the SDR, however, it needs to be fully costed and affordable. While choices made under such a review process might be painful for parts of the industrial sector, the Review team heard from many industrialists that a secure basis for planning would be a prize worth considerable pain.
The lack of a coherent planning framework makes it hard for industry to plan capacity, or to know which capabilities the MoD is interested in pursuing
25 25 Review of Acquisition
within the UK, and which it is content to source on the global market. The Defence Industrial Strategy was a first step towards addressing this concern, but industry leaders have felt frustrated that, while the aims of the DIS were good, the resources available to translate it into practice have been lacking.
A balanced and affordable equipment programme, which gave greater confidence to industry and which was better able to invest in emerging technologies, could therefore benefit industry, even if the adjustment from the current position were difficult.
3.4. Exportability
The export potential of equipment is both an aspiration of the UK defence industry and linked to the development of affordable, lower risk products for the MoD.
Many industry participants commented to the Review team that the acceptability of a piece of equipment to the UK Armed Forces is a key issue in determining whether or not other countries are interested in acquiring particular equipments. Equally well, some commented that the costs of some capabilities fielded by the UK forces were prohibitive for other, smaller countries.
In areas where an “80% solution” is a viable option for the UK forces, the potential export market may be that much larger, and the overheads and development costs of the defence industry covered by greater throughput. There is thus an alignment between the interests of the UK Armed Forces and industry to achieve “good enough” answers to equipment needs that have greater export potential, provided perverse incentives within the UK system can be overcome.
Consideration about how well a particular piece of equipment might fare in the export market is a key issue right back at the design stage in some countries, such as France. Yet this is not considered strongly as a priority in the UK. While the importance of the defence industrial base has been better recognised in recent years it is still questionable as to whether export considerations feature strongly enough in UK thinking.
3.5. Commitment to funding
As part of any future review, this review therefore contends that the UK needs to address the above issues squarely. To ensure that the MoD, and indeed the rest of government, is not able to will the ends but not the means, the Review team proposes that the outputs of the Periodic Defence Reviews should include, under a statutory requirement, detailed and audited long-term budgets which are consistent with realistic overall funding assumptions.

26 26
Review of Acquisition
These budgets should include not only the cost of manning, training, equipping, maintaining and housing our Armed Forces over a 10-year period, but also a 20-year plan of our new defence equipment spending plans. All of these plans should be subject to critical external audit, ideally by a large accounting firm, in addition to the proper attentions of the National Audit Office, and these plans should be submitted to Parliament for scrutiny and approval.
How then to ensure that the long-term plans created by the Defence Review, and the associated annual plans, are affordable, not just over a short period but through the life of the plans, audited, and represent good value for money? The obvious person to do this is the Permanent Under Secretary (“PUS”), in his guise as Accounting Officer of the MoD, in which case a legal duty could arguably appropriately be placed on that role. The major advantage of this is that this provides the PUS the strongest possible framework to balance the department’s budgets and force realism.
In addition, to give the MoD some chance of success, it is the second recommendation of this Review that the MoD’s budgeting should be moved from the current short-term cycles to a 10-year rolling budget. The deal across government should be that the MoD’s programme should be brought into a genuine and transparent long-term balance, reported to Parliament and externally audited, and in return the MoD should be funded on a long-term basis that allows it to manage effectively.
Parenthetically, the Review Team would also assert that this move to long-term budget control should also be used to reduce the excessive accuracy of in-year cash targets. The MoD, in trying to manage multi-billion pound, decade long programmes, is also required to hit short-term cash targets that would be considered impossibly precise in capital intensive industries in the private sector. Whilst the MoD is skilled at it, this targeting produces damaging programme management impacts and is extremely wasteful, both in terms of economic use of the available budget and processing/management effort, over the medium term.
A debate and a rebalancing is therefore needed in the MoD, and this should be conducted on a regular basis, with 5 yearly scale Strategic Defence Reviews and annual strategy update processes to ensure that the Department’s priorities remain well adjusted from now on. Given that the system currently seems significantly out of balance, this review anticipates that the first of these adjustments would be notably challenging.
3.6. Retaining balance between Strategic Defence Reviews
While there were shortcomings in the Strategic Defence Review of 1998, by and large it is still widely viewed as a successful and well-balanced piece of work. What then, has led the situation to deteriorate since then, beyond the failure to update this roadmap?
27 27 Review of Acquisition
The biggest single failure of control has been that the demands of those specifying new military equipment have not been adequately managed and related to available resources.
The Equipment Capability Customer was created by the Strategic Defence Review to bring together the teams specifying the future military needs of the Armed Forces in a single “purple” tri-service military structure designed to optimise the equipment acquisition needs of the Forces as a whole.
Unfortunately, this organisation (now the MoD Capability Sponsor) was denied the ability and authority to exercise proper control over its own budgets at that time, and this created a significant weakness in its structure. It was given power to choose what military capabilities it wanted to order, without being charged with the responsibility for balancing the books.
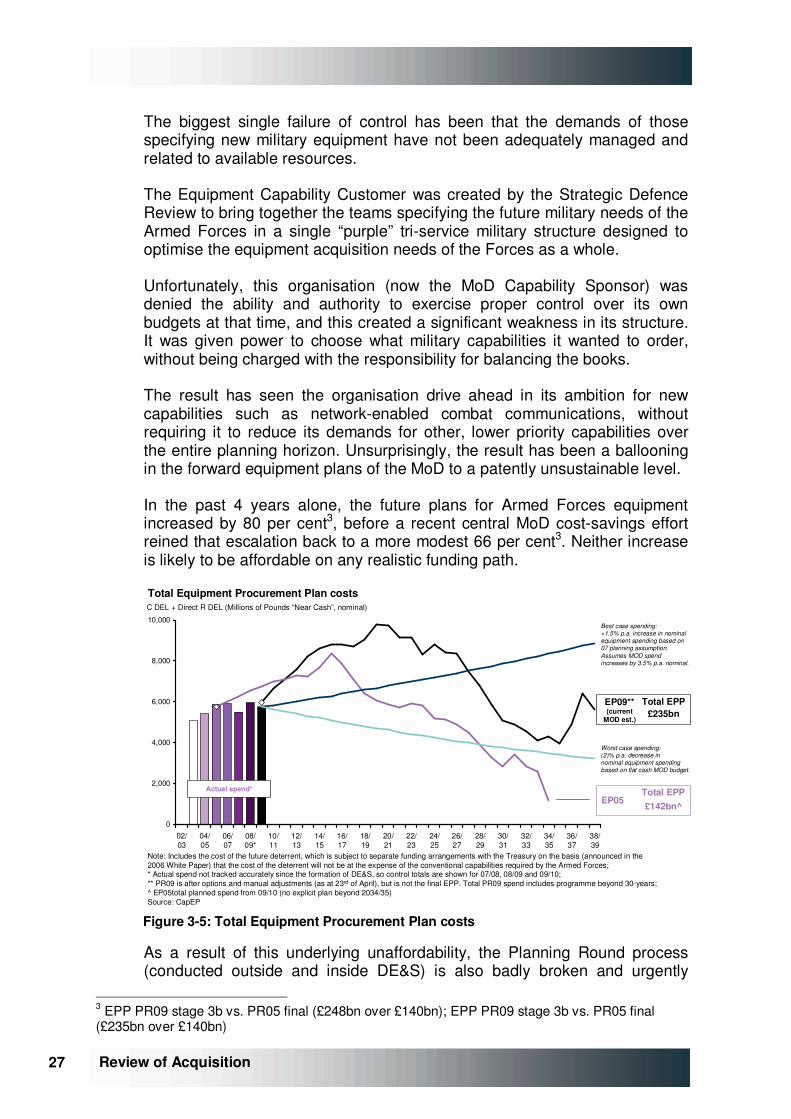
The result has seen the organisation drive ahead in its ambition for new capabilities such as network-enabled combat communications, without requiring it to reduce its demands for other, lower priority capabilities over the entire planning horizon. Unsurprisingly, the result has been a ballooning in the forward equipment plans of the MoD to a patently unsustainable level.
In the past 4 years alone, the future plans for Armed Forces equipment increased by 80 per cent3, before a recent central MoD cost-savings effort reined that escalation back to a more modest 66 per cent3. Neither increase is likely to be affordable on any realistic funding path.
Total Equipment Procurement Plan costs
0
2,000
4,000
6,000
8,000
10,000
02/03
04/05
06/07
08/09*
10/11
12/13
14/15
16/17
18/19
20/21
22/23
24/25
26/27
28/29
30/31
32/33
34/35
36/37
38/39
C DEL + Direct R DEL (Millions of Pounds “Near Cash”, nominal)
Note: Includes the cost of the future deterrent, which is subject to separate funding arrangements with the Treasury on the basis (announced in the2006 White Paper) that the cost of the deterrent will not be at the expense of the conventional capabilities required by the Armed Forces;* Actual spend not tracked accurately since the formation of DE&S, so control totals are shown for 07/08, 08/09 and 09/10;** PR09 is after options and manual adjustments (as at 23rd of April), but is not the final EPP. Total PR09 spend includes programme beyond 30-years;^ EP05total planned spend from 09/10 (no explicit plan beyond 2034/35)Source: CapEP
Actual spend*
Best case spending:+1.5% p.a. increase in nominalequipment spending based on 07 planning assumption.Assumes MOD spend increases by 3.5% p.a. nominal.
£142bn^EP05
Total EPP
Total EPP£235bn
EP09**(current
MOD est.)
Worst case spending:(2)% p.a. decrease in nominal equipment spendingbased on flat cash MOD budget.
Figure �3-5: Total Equipment Procurement Plan costs
As a result of this underlying unaffordability, the Planning Round process (conducted outside and inside DE&S) is also badly broken and urgently
3 EPP PR09 stage 3b vs. PR05 final (£248bn over £140bn); EPP PR09 stage 3b vs. PR05 final (£235bn over £140bn)
28 28
Review of Acquisition
needs fixing. Each April the DE&S team enters the new financial year with plans to conduct activity some 10 per cent greater than the available, and known, budget for that year. As a result, a considerable amount of time and effort goes on through the year to reduce expenditure within that accounting year.
Principally, this “re-profiling” involves the delay of activity from the current year into future years, with a number of unsatisfactory consequences. Firstly, it slows delivery of programmes, secondly it obliges DE&S to seek contract variations from industry on already agreed activity. Because the MoD is acting as a supplicant in seeking this change, it has little negotiating leverage over contractors in this matter. This presents industry with a golden opportunity to redress aspects of contracts and pricing it did not like at earlier points, and to hide any shortcomings in its own performance. Inevitably, this process lengthens time and boosts total eventual costs.
Thirdly, it creates pressures that make projects more likely to experience problems. Activities such as technology demonstrators, risk reduction exercises, the holding of financial contingencies against technical risk; all of these sensible precautions are squeezed by the constant downward pressure on cash spending. The result is that more risk is carried later into programmes where it can do more financial damage than if it had been resolved earlier.
This carrying of financial “risk” and the associated “re-profiling” is partially justified by the MoD in the knowledge that delays to expenditure occur and, as with airlines overbooking flights because they know that not all passengers turn up for the flight, this helps cash management of the organisation. While this used to be true, in practice now the pressure of the programme is causing DE&S to have to delay activity which legitimately could be completed in the specified year. This is a highly pernicious and expensive practice that is very damaging to the output of the organisation. It should simply be stopped. The DE&S should simply be required to enter the financial year with an level of activity consistent with its budget, and its DG Finance and Chief of Defence Materiel held accountable to the Defence Board for so doing. If, in the unlikely event of a cash surplus at the end of any financial year, mechanisms can be devised to roll that cash and activity into the following year.
Apart from a general detachment from budgetary responsibility, any attempt by the Capability Sponsor to control ambition is also bedevilled by the demands of the single Services.
Each of the Services quite naturally wants to ensure it gets the maximum share of available resources to allow it to make the best possible contribution to defence. There is nothing wrong in this per se: the range of defence tasks to which any armed force could contribute is always going to be significantly larger than any realistic funding, and it is only natural to want the resources to do more.

29 29 Review of Acquisition
Even the United States, which spends over 4 per cent of its huge national income on defence, a much greater proportion than any other western country, still faces significant constraints on what it can do. Medium sized countries, such as the UK, are always going to be more constrained still.
So against a background of potentially infinite demand, each of the Armed Services is competing with each of the others for a share of finite resources. Under these circumstances it is not in any one Service’s interest to show restraint in its bids. In a classic Game Theory problem, restraint by one Service is only likely to result in gains for others who do not hold back. Indeed, there is a significant incentive for each of the Services to overbid, expecting the other Services to do the same, and expecting that all will have their bids cut back.
This is perfectly rational behaviour from the perspective of each Service, indeed the Services will feel a moral obligation to specify the best possible solution given that they will be taking people into harm’s way, but this process leads to a poor outcome from the perspective of the MoD as a whole. The result is that each of the Services has an incentive to bid for as many different capabilities, at the highest level of specification, that it can.
However, if the “true” cost of acquiring a capability were stated, in a world where resource is tightly constrained, there is a danger that it might be thought too expensive to have at all. Rather than risk a “no” on the grounds of affordability at the outset, from a game perspective it is much better to get the ball rolling on the basis of an unrealistically low estimate, and then deal with the problem of cost growth later.
This is all the more true in a world where once started, programmes are almost never cancelled4. Under current governance, while underestimating the cost of a programme can lead to criticism and delay in the delivery of the required equipment, it is highly unlikely to lead to forfeiture of the desired equipment.
As a result, the forces have an incentive to bid for as many equipments at as high a specification as they can, they also have an incentive to underestimate the cost of delivering this system. This is at the heart of the problem in the UK, and probably the same can be said of other major western powers in the same position. It is the motor that drives delay.
There is, then something approaching an iron law of nature that says that the ambition of any military organisation is, for argument’s sake, 25 per cent greater than whatever the level of defence funding available to that country happens to be. As resources expand, so does ambition, as the US example neatly demonstrates. And because this ambition is always going to exceed any level of available resources, the kinds of behaviours noted in this report are likely to occur, driving up the overall eventual costs of the system.
4 Less than 5% of projects are cancelled post Initial Gate – projects largely relate to specific capabilities required under defence guidance
30 30
Review of Acquisition
Simply granting the MoD more resources cannot therefore, solve this problem. More resources will probably lead to more military output, but since the ambitions will also expand and the behaviours have not been changed or controlled, the same problems of delay and cost overruns will reassert themselves at the higher level of funding.
These are powerful motivations encouraging each of the Armed Forces to overbid for equipment and underestimate the cost. In part, the creation of the tri-Service Equipment Capability function was designed to try to control these pressures, but in practice this measure has not proved effective. Why?
The MoD Capability Sponsor, as it has now been renamed, is largely composed of officers from each of the single Services who rotate into this joint organisation for a period of time, and then rotate out again to roles within their chosen Service. Their career prospects are largely determined by their seniors within the Service, rather than by defence as a whole.
It does not take much imagination to suppose that each of the Services will make clear to their representatives within the Capability Sponsor what their priorities are, and expect their officers to pursue those goals. Comments received through interviews by the Review team confirm that this is so.
If this pressure to deliver single-Service agendas fails, then above the Capability Sponsor is the Defence Board, on which each of the single Service chiefs sit. So if the head of the Capability Sponsor, the Deputy Chief of Defence Staff (Capability) (“DCDS(Capability)”), passes to the Defence Board recommendations that the individual chiefs do not like, then they can oppose them at the Board. In this role, the single Services appear to have something close to veto power. Certainly, if one chief is implacably opposed to a measure, then it will take unity from the rest of the board to see him off.
The DCDS(Capability) is a senior officer: a three-star Vice Admiral or equivalent, but is nonetheless junior to members of the Defence Board, and not a member of that body. As a result, if several of the 4* members of that board do not care for the plans he brings forward, there is little that one 3* officer can do to object. Besides, as a 3* officer himself, the DCDS(Capability) might still have hopes of promotion, and he is unlikely to make such progress if he is seen to have made life difficult for others.
Even with an independently-minded leader, the odds are stacked against the Capability Sponsor balancing the books. A rough and ready measure says that counting the stars on the shoulders of those admirals, generals and air marshals who can oppose the will of the DCDS(Capability) says that he could stand to lose a fight by 25 stars to 35.
Above the Defence Board sit Ministers, who can also be lobbied if the results of any recommendation from the Requirements community or the Defence Board are not to any individual constituency’s liking. Parliament, Industry, the
5 DCDS(Capability) is a 3* role, 25 stars assumes CDS, VCDS, CGS, First Sea Lord, CAS, CDM
31 31 Review of Acquisition
single Services, the science community, Other Government Departments and others all attempt to influence ministerial decisions even after a recommendation from the Defence Board has been submitted for approval.
The permanent structure thus has much to contend with in trying to exercise will and restraint. Even if the Requirements community and the Defence Board recommend difficult decisions, they can be undermined at a later point. This is hardly an incentive for permanent members of the defence community to stand up and be counted against vested interests.
If any significant change is to be achieved, all constituencies, Political, Military, Industrial and Administrative would have to act in the wider national interest. This is a tall order.
This pressure to overbid has other effects. In particular the budgetary pressure forces each of the Services to push to get as much capability as possible, at as low an apparent cost as possible, into each acquired system. This presses those ordering to go for substantial technological leaps in each new generation of equipment.
The Armed Forces, rightly, fear that if they do not get any particular item of equipment specified to as high a level as possible at the beginning, then they will never get additional funding to upgrade a more limited piece of equipment later. All of the incentives within the MoD system operate against the idea of fielding something now and working to improve it over time.
Yet such “spiral” development is widely recognised as being a worthwhile objective that should be pursued. Often, experience with using a piece of equipment will lead to ideas for its further use which could not have been imagined at the time of its original design. Equally, new and previously unimagined technologies may become available that have application in existing systems, if space and money can be found to incorporate them.
As well as offering flexibility, this approach also reduces technical risk, since each step being taken is not as large as the leaps between generations that happens with current equipments. As a result, an initial capability can be introduced into service more quickly, with lower risk, and experience and emerging technologies can guide further development of this tool.
Many senior figures in the military and in industry are keen on this approach, but unless significant steps are taken to substantially reduce the pressure within the equipment programme, it is unlikely to become a viable way of working.
Allied to this question is the issue of how far to pursue capability in any individual area. It is simply unaffordable for the UK to pursue the highest conceivable level of technological sophistication in every area of military equipment. Yet at present, all of the incentives align to encourage the Services to bid for the highest possible capability in all areas in an undifferentiated way. In some cases, it may well be required to have a
32 32
Review of Acquisition
capability better than any other nation, in others it is not obviously so. The MoD does need better tools for deciding when to accept an “80% solution” to a technical need which is likely to be significantly cheaper and easier to realise than the “100% answer”.
In one particular case cited to the Review team, the technology being sought was described as being “just within the laws of physics”. While it might be necessary to pursue technologies to such limits sometimes, it is an expensive and risky thing to attempt, and it is important to be clear on whether or not such demanding requirements are really necessary.
If the MoD were able to satisfy itself more often that an “80% solution” were a satisfactory outcome, then it would be able to field more capability, more quickly at lower risk. If it had designed in growth potential, it would also possibly add the ability to upgrade such equipment later. This approach would potentially be good for industry, since in many markets, the costs of the most technologically advanced solutions to military issues are prohibitive. However, it will not be easy to alter the incentives that cause the current overly-demanding situation to persist.
So, sensible processes such as “spiral development” and “technology insertion” are heavily discouraged by the current overheated programme. Development risk (and hence cost overrun / delay) could be reduced by introducing equipment into service, with space allocated within it to introduce more sophisticated technologies later, and to learn from using the equipment rather than trying to guess at all ends before the first of type is ever fielded. But bitter experience shows that any restraint shown in this way will be punished by the loss of uncommitted budget to some other more immediate requirement at a later date. “Bid High Spec, Bid Full Spec”, seems to be the encouraged behaviour, however much technical risk that this imposes.
Creating a demonstrably affordable long-term programme would ease these disincentives to incremental development, particularly if the improbable occurred and headroom was left within the programme for future needs with contingency for unexpected overruns.
As well as being substantially outgunned, and subject to powerful forces which tend to over-commit the programme, the DCDS(Capability) does not have all of the tools at his disposal to control the programme. Costs of equipment are not formally targeted beyond a 10 year horizon, despite the fact that many of the most expensive programmes take up to 30 years to complete, and that the MoD can become inextricably engaged in a project well beyond a 10 year plan.
Even within that horizon, the programme is not constrained within affordable limits, programmes that exceed likely funding lines are not tracked, independent cost estimation is a skill which has been eroded over time, and the management information systems and heavy-duty finance skills required to track such a complex programme are not in place.
33 33 Review of Acquisition
Sometimes, even when independent cost estimates do exist, their conclusions have not been used in planning the cost of the equipment programme. There is also evidence that some contractually committed costs have been excluded on the hope that they might be avoided: something that would be anathema in a private-sector body. On occasion, the costs of continuing with some core activities have also been excluded from the planning process, because their costs are inconvenient.
One of the most pernicious elements of the system has been left until last. By and large, consideration of the affordability of any individual new piece of equipment is taken in isolation. The debate at all stages of the project’s life, from initiation, through main approval through into manufacturing, is all framed from the perspective of having the piece of equipment or not, and the shortfall in capability of the Armed Forces that would arise if the equipment were not procured. The costs of the project are almost always considered from this perspective.
Of course, in general it is better to have something than not. Most of the equipment being proposed is useful, and it is desirable to have it. In an ideal world, one would acquire it all. But the real question is not whether any particular piece of equipment has utility, but rather how it ranks in importance against other possible defence uses of that money.
There is a complex system for trying to determine priorities within the MoD system, but this does not seem from the evidence available to be an effective mechanism in forcing choice. Certainly, when the prospect of cancellation looms, the evidence does not suggest that this is viewed from the perspective of relative priority, rather that the system focuses on the issues arising solely on a case-by-case basis, making decisions hard.
All of this suggests a flawed process in need of significant reform and substantial external scrutiny. Radical and robust measures are required if this system, and its powerful incentives to over-commit, are to be restrained. All of the participants in this system: the Armed Forces, the Civil Service, and Ministers, bear responsibility for aspects of this over-ordering.
The third substantial recommendation of the Review team is then to create a body and a set of mechanisms designed to corral these forces.
It is proposed that an Executive Equipment Committee of the Defence Board should be created to oversee this equipment plan. The composition of the Committee should be as follows: Permanent Under Secretary (Chair), Chief of Defence Staff, MoD DG Finance, Vice Chief of Defence Staff, 2nd Permanent Under Secretary, and no other. There should be no alternate members of the Committee.
To ensure the legitimate voice of the Armed Forces are well heard, both the Chief of Defence Staff and Vice Chief are deliberately included in the Executive Committee charged with determining the plan. The Chief of Defence Staff should have a specific role in prioritising the needs of the
34 34
Review of Acquisition
single Services. In order that Finance and the inevitable role of resources are heard too, the DG Finance has a pivotal role.
It should be advised on composition of the plan on a quarterly basis by the DCDS(Capability), the MoD DG Strategy, and by a nominated senior representative of the MoD Finance Function.
It should be created and specifically and statutorily charged, under the same statute as creates the Defence Review structure, with creating a 20 year defence equipment plan which is robust and affordable. The measures of affordability should be spelt out clearly, but in simple terms, plans which are incomplete, or which ignore likely costs, or which do not use independent cost estimation, or which exceed the agreed 10 year MoD budget, or which do not contain an appropriate contingency against technical risk, should be deemed unaffordable.
To avoid the charge that legitimate interests are not being taken into account, then the single Services, Ministers, Other Government Department and Industry should be made party to the construction of the plan prior to its adoption by the Executive Committee. The time for debate is prior to the creation or annual updating of the plan, not after it has been assembled, costed and approved by officials.
This Executive Committee should propose to the Defence Board on an annual basis the balanced and affordable equipment plan, which the Board should then be required to endorse or reject in toto, rather than consider in parts. This measure is designed to prevent specific interest groups from attempting to cherry pick parts of the programme that suit its purposes.
The equipment plan should then be presented to Ministers for approval, with the expectation that Ministers too would accept the constraints of the plan. If Ministers are at this stage minded to vary the recommendations of the Board, then the full costs of any such variations should be brought out, and alternative measures taken to reduce the costs of the programme.
In particular the costing of the equipment programme, including all known liabilities, and the assessment of its affordability against the ten year defence budget should be the responsibility of the MoD DG Finance.
In a similar vein to enabling the Permanent Under Secretary to balance the aspirations and resources available to defence in the Defence Review process, the Permanent Under Secretary, in his guise as Accounting Officer, should then arguably be placed under a duty to Parliament to account annually for the affordability of the programme. This is similar to the “going concern” challenge placed upon private sector boards as a legal requirement, and serious sanctions should apply against its breach, as it does for private sector directors.
This is an extremely important test and control, and one that focuses the minds of directors in the private sector. In line with this experience, the
35 35 Review of Acquisition
Review team also recommends that this annual equipment plan should be audited by an external body, ideally one of the large accounting firms, to ensure an independent opinion that the plan is affordable within the defined 10 year equipment plan.
While it is not possible to know all ends in the public or private sectors, it is possible to legally require the officers of an organisation to show reasonable foresight in the execution of a plan. So, for example, the exclusion of known contractual costs, or plans which patently exceed agreed funding profiles, would not pass the test of affordability, and the Permanent Secretary should not be able to testify that they pass such a test.
This is an onerous responsibility, but it also confers significant power on the role of PUS. In his critical role of squaring the needs of the Armed Forces, Ministers, and the Civil Service, the PUS is uniquely well placed to play the role of chief executive. A power that says, “I cannot accept this over-cost plan because I am under a legal obligation to balance this budget, and this plan does not balance,” is a powerful tool in the PUS’s hands.
The combination of appropriately costed defence reviews, a rolling 10 year budget, and a legally constrained Executive Equipment Committee should make significant progress in ensuring that the equipment programme is well balanced and affordable in both the short and the long-term. This will make it much easier for the procurement organisation and industry to fulfil their roles.
3.7. Clarifying responsibilities and improving approvals
Then there is the issue of changes to requirements, and the costs that they impose on the system. Everyone knows that it is so much easier and much, much cheaper to change something when it is a paper or computer design, than when it is half built in a factory. It is also the case that it is hard to see everything in advance, and so some questions only arise part way into the life of any project. It is equally true that new technologies can arise in the course of a long project, and it would be desirable to inject these into the system that one is acquiring.
This process has to be rigorously controlled, for fear that it can cause the costs and timescale of a project to spiral out of control, and that it can undermine the contracting basis of a project. If, for example, constant changes are made to a system at the request of the military customer, then the contractor has every right to change the price of his product.
It can be difficult to determine whether such cost changes are solely the result of the requirements change, or are used by industry as an opportunity to sweep up other over-runs in cost that have happened elsewhere. If such changes happen frequently within a project, and there is evidence to say that they do, then it makes a mockery of a competitively procured, fixed priced deal. This effect may offer some explanation as to why Target Cost Incentive Fee (“TCIF”) type contracts perform so poorly and why fixed / firm priced
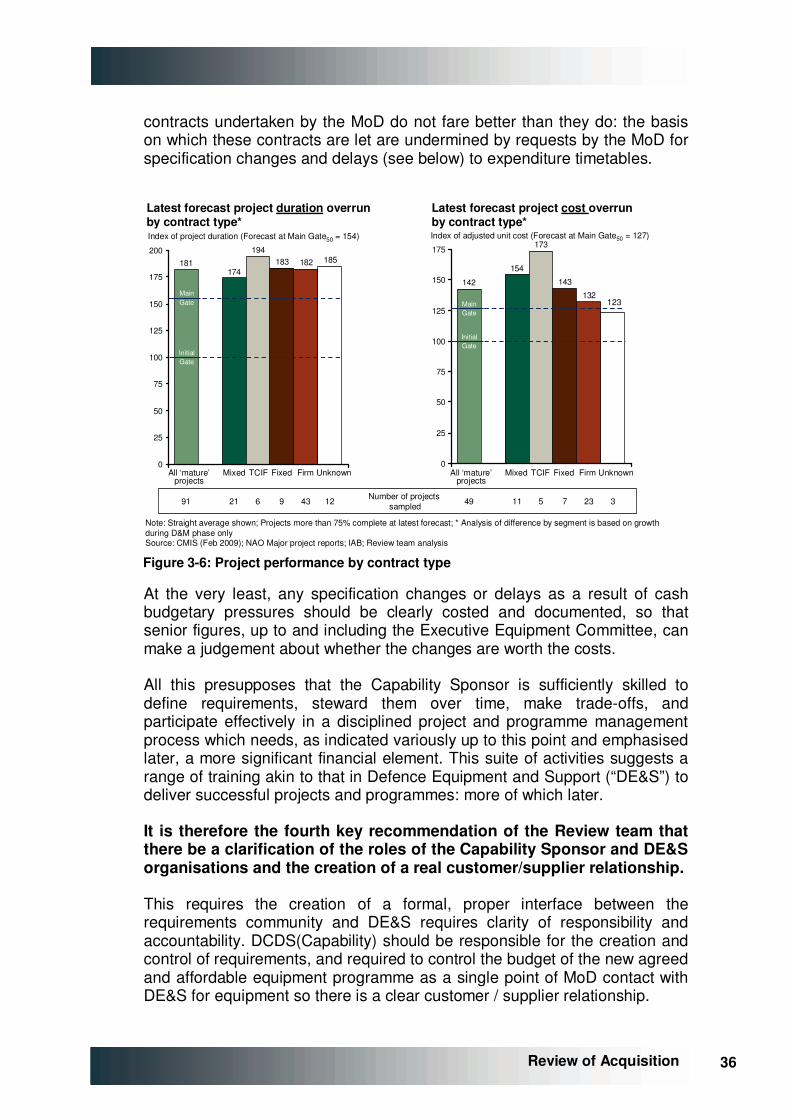
36 36
Review of Acquisition
contracts undertaken by the MoD do not fare better than they do: the basis on which these contracts are let are undermined by requests by the MoD for specification changes and delays (see below) to expenditure timetables.
Note: Straight average shown; Projects more than 75% complete at latest forecast; * Analysis of difference by segment is based on growth during D&M phase onlySource: CMIS (Feb 2009); NAO Major project reports; IAB; Review team analysis
181174
194183 182 185
0
25
50
75
100
125
150
175
200
Index of project duration (Forecast at Main Gate50 = 154)
Latest forecast project duration overrunby contract type*
Latest forecast project cost overrunby contract type*
142
154
173
143
132
0
25
50
75
100
125
150
175
Index of adjusted unit cost (Forecast at Main Gate50 = 127)
Number of projects sampled21 691 9 43 12
All ‘mature’projects
Mixed TCIF Fixed Firm Unknown
MainGate
InitialGate
All ‘mature’projects
Mixed TCIF Fixed Firm Unknown
11 549 7 23 3
123MainGate
InitialGate
Figure �3-6: Project performance by contract type
At the very least, any specification changes or delays as a result of cash budgetary pressures should be clearly costed and documented, so that senior figures, up to and including the Executive Equipment Committee, can make a judgement about whether the changes are worth the costs.
All this presupposes that the Capability Sponsor is sufficiently skilled to define requirements, steward them over time, make trade-offs, and participate effectively in a disciplined project and programme management process which needs, as indicated variously up to this point and emphasised later, a more significant financial element. This suite of activities suggests a range of training akin to that in Defence Equipment and Support (“DE&S”) to deliver successful projects and programmes: more of which later.
It is therefore the fourth key recommendation of the Review team that there be a clarification of the roles of the Capability Sponsor and DE&S organisations and the creation of a real customer/supplier relationship.
This requires the creation of a formal, proper interface between the requirements community and DE&S requires clarity of responsibility and accountability. DCDS(Capability) should be responsible for the creation and control of requirements, and required to control the budget of the new agreed and affordable equipment programme as a single point of MoD contact with DE&S for equipment so there is a clear customer / supplier relationship.
37 37 Review of Acquisition
Within that overall structure, a single individual within the DCDS(Capability)’s team should have ownership of each project / requirement.
DE&S would then become the supplier responsible for programme management and delivery against the agreed requirements specification and budget.
Changes to requirements are inevitable to some degree, and programme delays will also occur, but these should be specifically costed by DE&S and included in the next iteration of the plan by DCDS(Capability) to be tested as to its affordability, which, if threatened would lead to cuts elsewhere.
The project approval process also needs greater clarification as part of this overall process, as well as greater consistency in its application. It is therefore the fifth key recommendation of the Review team that there be revision of the approval processes, with the intention of improving decision making.
The IAB should report to the Executive Committee on control of equipment approvals with a requirement to consider the affordability of the total programme as well as individual projects. The Chair of the IAB should be taken in by the MoD DG Finance.
Business cases should be prepared with a more consistent methodology. Mandatory use should be made of parametric data, independent cost estimates and other “should cost” tools as part of their preparation. The forward programme should reflect the systematic under-forecasting during the early stages and should be costed at the 90th percentile of estimated cost. The scrutiny community should be expanded / upweighted with commercial skills to provide additional early advice to IPT leaders in business case preparation.
The current Initial Gate / Main Gate approval process should be retained and the costs associated with these approvals should be included in the overall plan.
3.8. Time, cost and performance, and Urgent Operational Requirements
At this point, it is worth dwelling on the factors that can be varied in specifying and delivering a defence equipment plan. The three main levers that can be used to change outcomes are to vary time: slowing down or speeding up a programme; to vary cost, putting more or less money into a project; or to change the performance of the equipment, asking for more or less capability from the system in question.
In the mainstream MoD equipment plan, the main variable that is exercised is time. When budgetary pressures arise, as they often do, projects are slowed down, and delivered later, with the military customer deciding not to reduce his required specification. What happens to cost in these
38 38
Review of Acquisition
circumstances is that the short-term cash spend is lowered, while the long-term total cost of delivering the project is increased.
This increase occurs because there are continuing overheads associated with the slowed project. Project teams within the MoD and industry remain engaged even though the project has slowed, industry may have significant working capital tied up in production for longer, and older equipment may have to be kept in-service for longer to make good the gap left by the late arrival of new equipment.
All of these effects serve to reduce the resources available for creating new defence equipment by transferring funds into unproductive overhead. The more this happens, the worse the position becomes. It is impossible to be precise about the exact size of these “frictional costs”. In part this is because delay, and its associated costs, can arise for a number of co-incident reasons: for example, a project might hit a technical hurdle which causes delay, at the same time that there is pressure to reduce in-year spend on this project. In such cases there is no one cause for the delay, and so it is not possible to allocate consequent costs to a single factor.
Equally well, there are a variety of different judgements which may legitimately be made in forming a view about such costs. For example, if a piece of equipment is not available as a result of delay, do we ascribe a cost to the lack of availability of this equipment or not? There are also a number of different methodologies which might be applied to calculate these costs, again complicating the position.
The Review team has selected a methodology and made judgements that lead to the numbers in the report. We have concluded from our work that between £1bn and £2.2bn is being lost each year as a result of the failure to control this overheated equipment programme. The wide range estimated by the team bears witness to the fact that this is not a precise science. Further work might refine these numbers, but even with perfect management information, it would never be possible to ascribe a single value to these costs. What is not in doubt is that there are material sums being consumed.
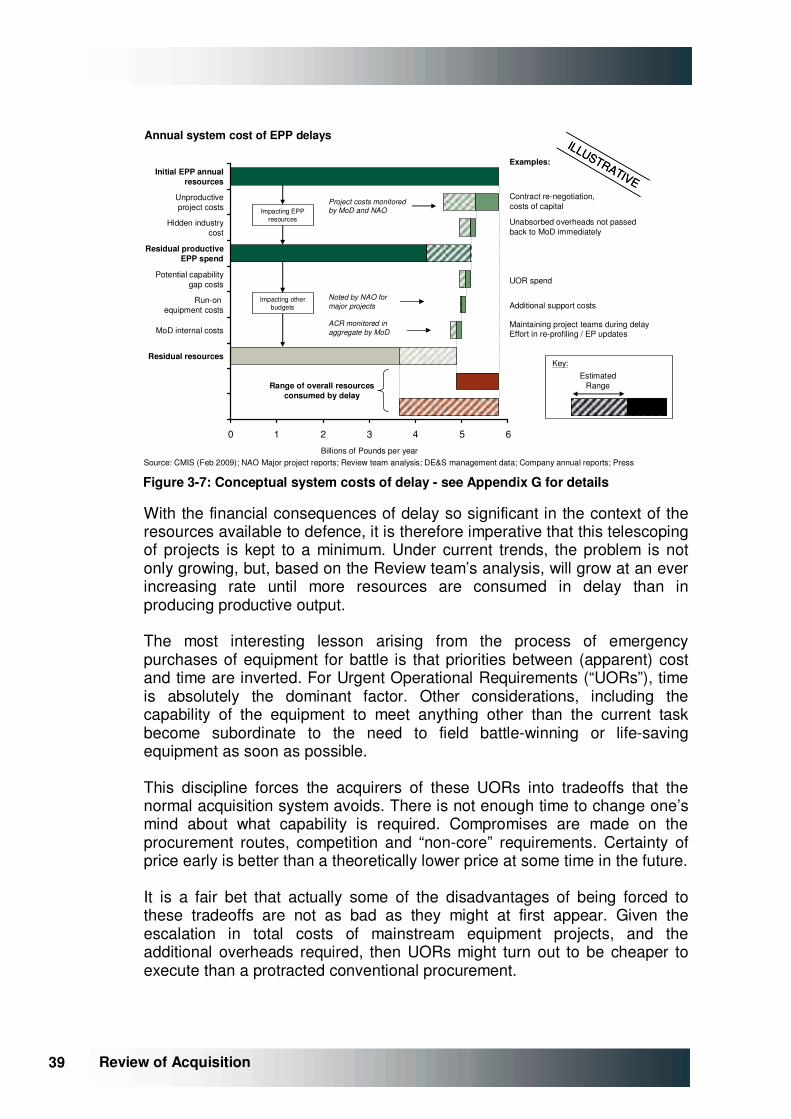
39 39 Review of Acquisition
Annual system cost of EPP delays
0 1 2 3 4 5 6
Initial EPP annualresources
Unproductiveproject costs
Hidden industrycost
Residual productiveEPP spend
Potential capabilitygap costs
Run-on equipment costs
MoD internal costs
Residual resources
Billions of Pounds per year
Project costs monitored by MoD and NAO
ILLUSTRATIVE
ILLUSTRATIVE
Source: CMIS (Feb 2009); NAO Major project reports; Review team analysis; DE&S management data; Company annual reports; Press
ACR monitored in aggregate by MoD
Noted by NAO for major projects
Impacting EPP resources
Impacting other budgets
Examples:
Contract re-negotiation, costs of capital
Unabsorbed overheads not passed back to MoD immediately
UOR spend
Additional support costs
Maintaining project teams during delayEffort in re-profiling / EP updates
Range of overall resourcesconsumed by delay
Key:Estimated
Range
Figure �3-7: Conceptual system costs of delay - see �Appendix G for details
With the financial consequences of delay so significant in the context of the resources available to defence, it is therefore imperative that this telescoping of projects is kept to a minimum. Under current trends, the problem is not only growing, but, based on the Review team’s analysis, will grow at an ever increasing rate until more resources are consumed in delay than in producing productive output.
The most interesting lesson arising from the process of emergency purchases of equipment for battle is that priorities between (apparent) cost and time are inverted. For Urgent Operational Requirements (“UORs”), time is absolutely the dominant factor. Other considerations, including the capability of the equipment to meet anything other than the current task become subordinate to the need to field battle-winning or life-saving equipment as soon as possible.
This discipline forces the acquirers of these UORs into tradeoffs that the normal acquisition system avoids. There is not enough time to change one’s mind about what capability is required. Compromises are made on the procurement routes, competition and “non-core” requirements. Certainty of price early is better than a theoretically lower price at some time in the future.
It is a fair bet that actually some of the disadvantages of being forced to these tradeoffs are not as bad as they might at first appear. Given the escalation in total costs of mainstream equipment projects, and the additional overheads required, then UORs might turn out to be cheaper to execute than a protracted conventional procurement.
40 40
Review of Acquisition
It is worth further reflection about how this time imperative might usefully be employed as a forcing discipline within the mainstream equipment programme.
3.9. Support, whole life costs and Through Life Capability Management
Much of this report is concerned with the incentives leading to problems in the initial acquisition of defence equipment. The pressures on the budget that are caused by an overly-ambitious defence agenda, and a badly overheated, unaffordable equipment programme, also have their impact on the provision of in-service support for equipment.
Unlike the time delay which is the main expression of problems in the new equipment programme, the main way in which problems show in the support of existing equipment is through reduced availability of equipment for use by the forces. Much equipment apparently in the inventory and ready for use would, in reality, need significant time and expenditure to make it ready for combat.
The DE&S has done much good pioneering work in the area of “Contracting for Availability”, where a partnership approach with industry has led to joint teams with a mutual interest in driving down defence costs and improving equipment availability. More should be done to build on this good start, in particular to extend this process into the provision of new equipment, as well as in the support of legacy equipment already in the inventory.
However, the granular nature of supporting existing programmes makes it difficult to draw general conclusions in this area. It has not been possible in the time available to this study to make significant progress in this area.
In recent times the Ministry of Defence has introduced the concept of Through Life Capability Management (“TLCM”) into the handling of the defence programme. This activity seeks to harmonise and maximise defence output by ensuring that all areas of defence activity that have an impact on one another are considered together and that, for the first time, capability delivery is viewed at a more strategic level than just the delivery of individual new equipment projects or individual in-service equipment capabilities.
It takes a capability as a whole and seeks to address issues such as the military doctrine underpinning the use of any capability, provision of new equipment to meet a particular need, the support of such equipment, training and manpower required to run this equipment, and the basing and infrastructure required for any equipment and the associated personnel.
As a general proposition, it is hard to argue with the assertion that managing these related activities in a co-ordinated way is anything other than a good thing. It is in the execution of this assertion that potential problems lie.
41 41 Review of Acquisition
In the first instance, the objective that TLCM is trying to achieve is fearsomely complex and inherently based in financial data.
Programme Boards, under the hierarchy of Capability Planning and Capability Management Groups, have been established to co-ordinate these strands of work. However, it is far from clear that these Boards have the financial and programme data they really need if they are to co-ordinate this activity properly. It is certain that there is insufficient data and no sophisticated financial modelling to allow trades to be made between these areas to minimise costs to defence as a whole. It is simply not possible to balance a financial question against 7 different variables through general conversation alone.
If this system is to have any significant impact, then it needs be populated with such data, and the Financial Management skills required to analyse the information, as a matter of urgency. Without that information, the risk is that the Capability Boards, and TLCM, are reduced to being a limited talking shop.
The second substantial issue with the system as it is currently being rolled out is that it could blur the accountability that previous efforts at reform have tried to engender. Each of the “Lines of Development”, as they are known, are represented on the Capability Board, and each is therefore entitled to an opinion as to what should be done in the provision of new equipment.
Each individual representing a Line of Development is also capable of changing its mind, of coming up with new ideas, of delaying decisions. Given the rapid rotation of staff through posts, it is a fair bet that between each of the quarterly meetings of such Boards, at least one of the Board members is likely to have been replaced in the meanwhile, and a new person will need to be read in, and they will have their own views about what actions should be taken.
Unlike in the case of some private sector entities the Review team has interviewed for this report, the Capability Board structure does not have a single executive empowered to drive decisions and accountable for those choices. Without that, it is hard to see these bodies coming to swift decisions and being happy to be held to account for their actions.
It was a sine qua non of the Smart Acquisition changes of a decade ago that accountability should be improved and clarified through the split of responsibilities between the Requirements group and the Integrated Project Team Leaders in the (now) DE&S. This was a valuable and hard-won improvement, which risks being undermined by some recent changes, including the implementation of TLCM.
Furthermore, a key consequence of effective TLCM may be to increase short-term spending to gain economies in the longer term (i.e., “spend to save”). The current structures and financial environment within the MoD do not provide fertile ground for this type of trade-off to take root.

42 42
Review of Acquisition
The TLCM structure is, therefore, unobjectionable in principle, but fraught with potential pitfalls in practice.
Accordingly, it is the sixth key recommendation of the Review team that a further substantial and externally conducted piece of work be put in hand to understand better how the provision of more efficient in-service support could be delivered. It would be hoped that the output of this work would be available to inform both current and future planning rounds as well as the decisions of a Strategic Defence Review which should be held as the output of the recommendations of this review. It is also recommended that TLCM should be considerably simplified, and financial modelling tools should be imported along with the staff capable of using them to allow the system to make choices. The issue of accountability needs urgent simplification and clarification if it is not to run counter to the objectives of this review.
3.10. Past and future reform of DE&S
The MoD has adapted and changed in remarkable ways. The creation of the Defence Procurement Agency (“DPA”) and the Defence Logistics Organisation (“DLO”) 10 years ago were remarkable organisational changes that affected thousands of people. The fact that they were achieved within a short period and without major disruption to output was a great achievement.
More recently, the merger of the DPA and DLO into DE&S has also gone outstandingly smoothly. All involved deserve significant credit for managing such change without ceasing to deliver on what was asked of them in the day job.
However, it is the seventh key recommendation of the Review team that further significant actions be undertaken to improve the performance of DE&S. Specific actions should include a reduction in the scope of activities and a restructuring of senior management roles, with greater financial discipline, increased internal accountability for project performance, increased access to / development of professional skills, and increased independence from the Requirements community and the Front Line Commands.
Firstly, the Review team recommends that clarity is needed on what DE&S is for: what its senior management needs to focus on. Currently the range of outputs is wide. This report contends too wide given the challenges.
For example, a number of activities appear to have migrated into DE&S as a result of historical accident and inertia, rather than through planned and deliberate intent. Whilst on the face of it there seems to be some logic in having it all under one roof, it is not clear what real benefits in management or economic terms there are in the range of activities as currently constituted. The Naval Dockyards, the Joint Support Chain and certain aspects of communications infrastructure could useful be hived off into

43 43 Review of Acquisition
standalone agencies, rather than complicating the structure of an equipment acquisition and support organisation. This would have the benefit of allowing more (appropriately accountable and responsible) senior management effort in guiding the tough job of delivering military equipment capability.
Secondly, even now the senior management structure of the DE&S looks unbalanced. One three star official, the Chief Operating Officer, is charged with oversight of delivery of the whole equipment programme in both initial acquisition and in-service support. By any standards and under any circumstances, this is a Herculean task if the COO is to stand any chance of overseeing such a large and varied programme with any degree of detailed control.
At the same time three other three star officers, the Chiefs of Materiel, have much more limited roles, which are principally involved in liaison with each of the single Services about their needs. The Chief of Materiel roles have made a valuable contribution in the formation of DE&S and have significantly reduced the inherent risk in such a complex merger. However, there is now widespread agreement, which the Review team has heard from many quarters, that these roles should be phased out to significantly reduce the complexity of the DE&S management structure.
There are three other staff roles, Finance, Chief of Staff and Corporate Services, which could usefully be rationalised. As with any other organisation handling significant sums, and DE&S spends around £14bn a year, Finance should have primacy within the overhead structure, and should have equality with the role of service delivery, in this case the COO.
A rebalancing which saw at least one more three star official charged with delivery of the programme, which eliminated the roles of Chiefs of Materiel, and which rationalised the senior management of the Corporate Centre would seem sensible.
Under current circumstances DE&S and industry are struggling to complete an almost impossible task in trying to keep programmes on time and cost. In essence, these delivery parts of the system are required to squeeze a quart into a pint pot, and are working against a constantly shifting target with unrealistic estimates placed upon them as a result of the senior level incentives to over-bid in the formulation of the overall Equipment Plan. It is small wonder that DE&S struggles to deliver, and perhaps a greater one that they do not seek to place responsibility for problems outside themselves.
To temper sympathy for the organisations involved slightly, both DE&S and industry are partly architects of their own misfortune. Cost estimates for programmes are usually created for the MoD centre inside DE&S with input from industry. So to the extent that these initial assumptions are wrong, DE&S and industry are partly responsible.
There is anecdotal evidence to suggest that teams within DE&S come under pressure to minimise the projected costs of programmes by the
44 44
Review of Acquisition
Requirements community, keen to get specific projects rolling. It can be hard for individual Integrated Project Team leaders to resist pressure from the centre to produce an “acceptable” cost. The risk is of being characterised as an unhelpful person, “not a team player”, or obstructive and negative.
In an organisation such as the MoD, which prides itself on being “can-do”, this is a damaging career charge. Where the DE&S team leader is a serving military officer from the same Service as his counterpart in the Requirements community, the charge can escalate to one of failing to deliver their Service’s proposed equipment, the charge can be fatal for future prospects.
Unhelpfully in this regard, the role of the independent cost estimation community within DE&S has been reduced over the years, and one of the recommendations of the Review team is that the skills and resources in this area should be increased, as the US is currently proposing to do. There are signs DE&S is planning to do this but the Review team maintains this is a crucial enabler, and one which needs to be properly integrated with the mainstream project and programme management activity urgently.
Industry will also be tempted to look on the potential costs of new programmes with a glad eye. Companies may feel that if they do not produce an acceptable estimate of the cost of a capability when manufacturers are being consulted at the early stage of a project’s life, then other competitors may be more obliging at this early concept phase, leading them to have an advantage when it comes time to procure the equipment.
In line with many others, enthusiasts within industry can either deliberately or through mistake minimise the costs and complexities in delivering new technologies. This is unsatisfactory in a number of ways, including giving aid and comfort to a Requirements community seeking to override conservative cost assumptions coming from a DE&S project team.
Yet while one should have at least limited sympathy for the current position of DE&S, the interesting question arises of what would happen if the procurement organisation were asked a more sensible exam question. Could it really deliver a properly costed robust plan?
It is impossible to be completely clear on this point, since no such controlled experiment has taken place. But there is some evidence that the Smart Acquisition6 initiative of 1998 has delivered some benefit. Amongst other things, this process sought to clarify the roles and responsibilities of Requirements setters and Acquirers and to empower the Integrated Project Teams to deliver on stable requirements.
6 Non-Smart projects include projects post 1999 deemed to have followed non-Smart principles, e.g., follow on buys of Non-Smart projects
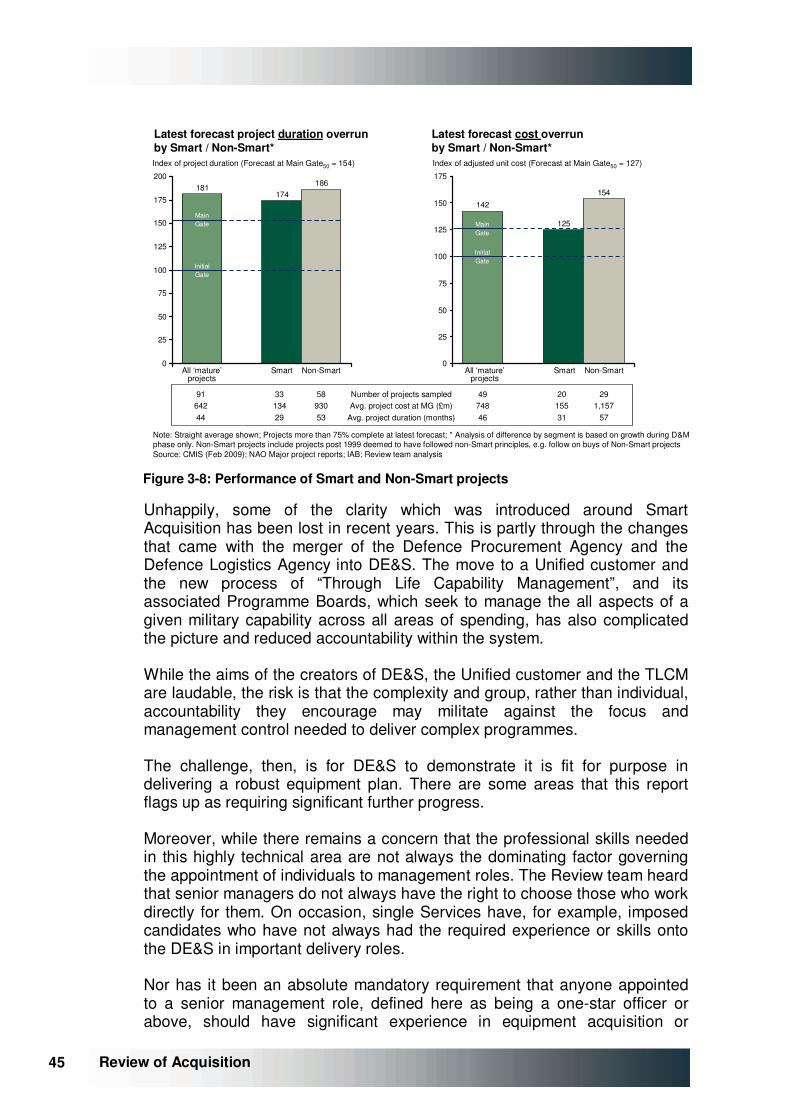
45 45 Review of Acquisition
Note: Straight average shown; Projects more than 75% complete at latest forecast; * Analysis of difference by segment is based on growth during D&M phase only. Non-Smart projects include projects post 1999 deemed to have followed non-Smart principles, e.g. follow on buys of Non-Smart projectsSource: CMIS (Feb 2009); NAO Major project reports; IAB; Review team analysis
181174
186
0
25
50
75
100
125
150
175
200
Index of project duration (Forecast at Main Gate50 = 154)
Number of projects sampledAvg. project cost at MG (£m)
Avg. project duration (months)
Latest forecast project duration overrun by Smart / Non-Smart*
142
125
154
0
25
50
75
100
125
150
175
Index of adjusted unit cost (Forecast at Main Gate50 = 127)
20 155 31
291,157
57
Latest forecast cost overrunby Smart / Non-Smart*
49748 46
3313429
5893053
9164244
MainGate
MainGate
InitialGate
InitialGate
All ‘mature’projects
Smart Non-Smart All ‘mature’projects
Smart Non-Smart
Figure �3-8: Performance of Smart and Non-Smart projects
Unhappily, some of the clarity which was introduced around Smart Acquisition has been lost in recent years. This is partly through the changes that came with the merger of the Defence Procurement Agency and the Defence Logistics Agency into DE&S. The move to a Unified customer and the new process of “Through Life Capability Management”, and its associated Programme Boards, which seek to manage the all aspects of a given military capability across all areas of spending, has also complicated the picture and reduced accountability within the system.
While the aims of the creators of DE&S, the Unified customer and the TLCM are laudable, the risk is that the complexity and group, rather than individual, accountability they encourage may militate against the focus and management control needed to deliver complex programmes.
The challenge, then, is for DE&S to demonstrate it is fit for purpose in delivering a robust equipment plan. There are some areas that this report flags up as requiring significant further progress.
Moreover, while there remains a concern that the professional skills needed in this highly technical area are not always the dominating factor governing the appointment of individuals to management roles. The Review team heard that senior managers do not always have the right to choose those who work directly for them. On occasion, single Services have, for example, imposed candidates who have not always had the required experience or skills onto the DE&S in important delivery roles.
Nor has it been an absolute mandatory requirement that anyone appointed to a senior management role, defined here as being a one-star officer or above, should have significant experience in equipment acquisition or
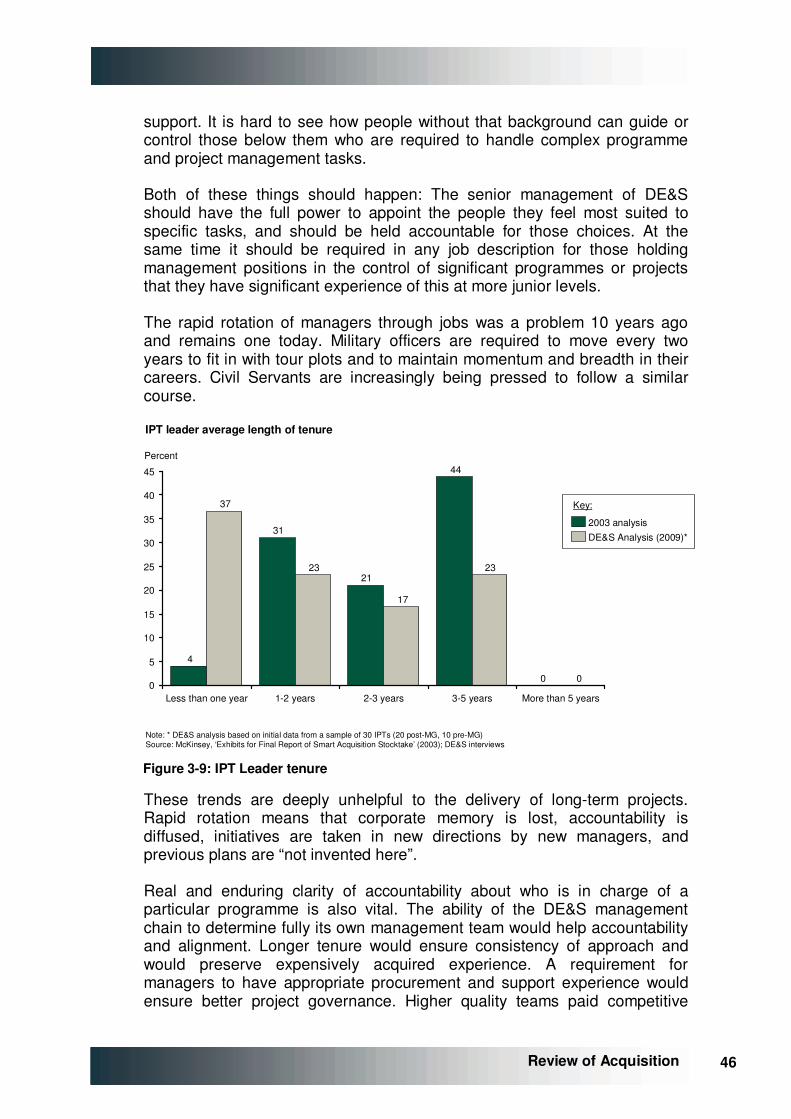
46 46
Review of Acquisition
support. It is hard to see how people without that background can guide or control those below them who are required to handle complex programme and project management tasks.
Both of these things should happen: The senior management of DE&S should have the full power to appoint the people they feel most suited to specific tasks, and should be held accountable for those choices. At the same time it should be required in any job description for those holding management positions in the control of significant programmes or projects that they have significant experience of this at more junior levels.
The rapid rotation of managers through jobs was a problem 10 years ago and remains one today. Military officers are required to move every two years to fit in with tour plots and to maintain momentum and breadth in their careers. Civil Servants are increasingly being pressed to follow a similar course.
Note: * DE&S analysis based on initial data from a sample of 30 IPTs (20 post-MG, 10 pre-MG) Source: McKinsey, ‘Exhibits for Final Report of Smart Acquisition Stocktake’ (2003); DE&S interviews
IPT leader average length of tenure
0
44
21
31
4
0
23
17
23
37
0
5
10
15
20
25
30
35
40
45
Less than one year 1-2 years 2-3 years 3-5 years More than 5 years
2003 analysisDE&S Analysis (2009)*
Percent
Key:
Figure �3-9: IPT Leader tenure
These trends are deeply unhelpful to the delivery of long-term projects. Rapid rotation means that corporate memory is lost, accountability is diffused, initiatives are taken in new directions by new managers, and previous plans are “not invented here”.
Real and enduring clarity of accountability about who is in charge of a particular programme is also vital. The ability of the DE&S management chain to determine fully its own management team would help accountability and alignment. Longer tenure would ensure consistency of approach and would preserve expensively acquired experience. A requirement for managers to have appropriate procurement and support experience would ensure better project governance. Higher quality teams paid competitive
47 47 Review of Acquisition
salaries would allow more migration to and from the wider programme management community in the private sector.
This problem has been highlighted before, and so it is with some trepidation that this report becomes the nth in line (where “n” is a large but undefined number) to recommend change in this situation. It is the recommendation of the Review team that officials and military officers taking line management jobs, defined as IPT Leader or above, in the delivery of new equipment or support should serve double-tours (minimum 4 year terms) in post.
If necessary, mechanisms could be found to assist with promotion problems. More people could be promoted on entry into post, with the explicit understanding that they will serve a double-tour in the role.
Providing military advice from those who need to continue to rotate on a 2-year cycle, or who have no experience of acquisition but whose front line experience is valuable, could be achieved through the appointment of military advisers to IPT Leaders, rather than through someone being part of the line management chain.
Prima facie, there is also a need for more consistent methodology and management tools to be applied across the organisation. A key information consolidation tool used by DE&S is called CMIS, and while it is used for monthly central reporting, it does not appear to be a living, breathing tool within Integrated Project Teams (“IPTs”). IPTs are also free to use whatever programme and project management software tools they wish. The Review team considers that the current management information systems would benefit from standardisation and need further development to facilitate day-to-day delivery by the IPTs.
Shockingly, until recently, there was no mandated requirement as a part of process to have substantial contracts examined and approved by external commercial lawyers before signing. This is a state of affairs that simply would not be tolerated by a private sector company. It is certain that the companies supplying equipment to DE&S will have sought such external, and expensive, legal advice before signing large contracts. It is small wonder that the MoD has struggled at times in the past in attempting to get legal redress for contracts that have gone badly wrong. It is crucial that legal review is implemented.
Comparisons with private sector organisations that also have to handle large project management teams, including for example British Airways and Rolls-Royce, suggest that DE&S teams are large and take a long time to complete their work. BA, for example, would run a competition for a $5bn aircraft order with a full time equivalent team of about 20 people and make the selection within 12 months.
The MoD may argue that such civilian procurements are less particular and bespoke than those in the military, but this is at the least questionable. In the civilian case this team would run the tender process, make a technical

48 48
Review of Acquisition
and financial assessments of competitive bids, ensure that all of the associated aircrew, cabin crew and technical crew training issues were accounted for, model route selection and the impact of newly acquired aircraft on the existing fleet patterns, and ensure that the appropriate infrastructure, such as hangers, were in place.
Importantly, the team has at its disposal sophisticated financial models that allows it to make trade-offs between different areas of cost. So, for example, if the introduction of a new aircraft type into the fleet would reduce fuel consumption but would increase training and infrastructure bills, then the acquiring team could calculate the financial balance of these issues before making a decision.
It is also critical that one person is empowered to run this process and bring the various different constituencies within the airline to agreement. While it might be possible for one internal interest group to appeal over the head of this presiding officer to the Chief Executive or the board, in practice it is extremely rare for this to happen. As a result, the empowered team leader has considerable scope to run the process efficiently and bring matters swiftly to a head.
Once Heads of Terms had been agreed on a deal, BA would seek to sign the contract itself within 30 – 90 days (for airframes), and certainly no longer than 180 days (for engines), after completion of the negotiations, for fear that the collective memory about what had been agreed would be lost.
MoD processes run much longer than this, with competitions and approvals running for several years, and contracts being signed up to a year after initial contractor selection. The teams lack the kind of sophisticated financial models required to make trade offs between different areas “lines of development” in MoD-speak, and there is no one individual empowered to make such choices. Importing of such private sector tools and skills could make a huge difference to team performance at DE&S.
More qualitatively, there is also a need to raise the skill levels within DE&S on very important and valuable programme management, management accounting, cost estimating, contracting, technical and engineering skills. As with any large organisation, there are many good people doing well, a number of skilled individuals working hard, and some less able individuals who may lack the skills to achieve what is by any measure a difficult objective.
In all of these areas the Review team have heard commentary about the need for investment in skills to produce better results. Strong Programme and Project management skills are scarce in the economy as a whole, and DE&S needs to be able to attract more talent to this area.
It has also been observed that strengthening the contracting skills of the organisation will be required if DE&S is to be able to negotiate the more flexible contracts that may be needed with industry in future.
49 49 Review of Acquisition
France has also made a core skill the retention of enough engineering expertise within the DGA, France’s equivalent to DE&S, to try to be able to support project teams in delivery of their objectives.
The MoD has acknowledged the need to do more in this area, and a significant amount of effort has been put into this up-skilling agenda. However, pay levels are lower in project and programme management and financial control than comparable roles in the private sector. This makes it hard to acquire fresh skills and fresh thinking from outside the existing organisation.
One senior DE&S official commented to the Review team that it was impossible to hire the skills needed into his specialism because the HR processes within the MoD did not permit the necessary salaries to be paid within standard public sector payscales. Given that £14bn a year, and the future defence of the UK are at stake, and given that team sizes could be smaller with more skilled team members, this seems a false economy, to put it mildly.
None of this is helpful. The organisation needs a single framework for operating so that it is clear to everyone through the structure what is happening. Common operating systems would allow individuals to move more easily from one project team to another, and make a contribution more quickly to their new team. Common project management tools, with proper transparency of information throughout line management would allow overseeing managers to more quickly gauge the health or otherwise of projects. A common legal framework and external review process would strengthen the MoD’s hand in dealing with sophisticated contractors.
Sophisticated financial modelling tools would allow teams to make trades between initial acquisition, maintenance, training, and infrastructure costs of different possible systems. More, high quality cost estimators and parametric modelling tools would assist in initial costing.
Development of hard interfaces with both the Requirements community for new equipment and the Front Line Commands for support of existing systems would introduce greater clarity and accountability. If changes are made to requirements by the Requirements team, DE&S should produce a bill that makes clear what the cost of change is. Equally, if the Front Line Commands pay DE&S for a certain level of activity in support, DE&S should account properly for the money it receives from its customers. This will need clear processes between DE&S and the MoD centre, but also effective contracts that allow MoD to change and ultimately retain the ability to cancel projects.
3.11. Improving DE&S’ ability to deliver of the plan
This is a long list of potential improvements. How might such a substantial further transformation of the DE&S be achieved? Programmes to improve

50 50
Review of Acquisition
defence acquisition are ongoing, and in recent times have included the Defence Acquisition Change Programme, and the PACE programme focused within DE&S. But these do seem incremental in approach, and in some cases, such as the Through Life Capability Management strand, risks making matters worse by blurring accountability.
Moreover, it is the contention of the Review team that any change needs to be system-wide and significant because trialling or small scale experimentation risks being strangled by the significant forces working to maintain the status quo. It is the Review team’s eighth key recommendation that the mechanism most likely to achieve the required result in terms of professional skills, systems and accountability is the migration of the slimmed down DE&S entity into a Government Owned – Contractor Operated (“Go-Co”) entity.
The introduction of an appropriate private sector management entity to be responsible for the execution of the DE&S’s delivery tasks would have significant benefits. It could lead to the introduction of significant private sector management expertise, and the implementation of enterprise-wide management information and financial control tools that would help improve programme management.
It would also clarify the interfaces between DE&S, industry, the Requirements community and the Front Line Command military users. This arrangement would force each of the participants to formalise and cost significant changes to requirements or timescale.
Provided incentives were appropriately designed, the Go-Co DE&S structure could also create a significant incentive to ensure that the initial costings the DE&S proposed to the Requirements community were more accurate than at present. It could also be made in the contractor’s interests to limit programme slippage or requirements change.
Properly empowered private sector management could also be at liberty to attract, retain and motivate the best possible staff to discharge these important responsibilities.
However, there are a number of significant issues that would need to be addressed. Firstly, the MoD would need to create and retain a significant “intelligent customer” entity, probably within a broadened, more widely skilled Requirements community, that would allow it to properly task, interrogate and control the Go-Co. The role and activities of this intelligent customer over the lifecycle of project would also need to be defined.
Secondly, the basis of migration of staff into the Go-Co, whether temporary or permanent, would need to be established. In particular, the incorporation of military personnel into the structure would require careful thought. It is possible to use a secondment mechanism to achieve these aims as happens now for military placement into private industry, as it would for permanent

51 51 Review of Acquisition
civil service staff, but the ramifications of this would need to be worked through.
The length of contract awarded to the bidder needs careful consideration, as do the incentives associated with the contract. Broadly speaking, a longer contract should incentivise the contractor to invest and populate the system with more of its own or externally hired staff to achieve aims, while at the same time a shorter contract allows greater competitive pressure to be applied by the MoD to the contractor.
At a high level, the initial objectives of incentives are likely to revolve around the introduction of additional skills, tools and disciplines into DE&S, and once these have been introduced, incentives might usefully be refocused on the reduction in the overhead costs of delivering DE&S outputs.
The infusion of sufficient external skills would be a high priority to any such Go-Co, but in some other examples where this remedy has been applied, the new management team does not extend significantly below Board level. Careful thought and discussion with potential contracting partners would be needed to ensure that this injection of management expertise went deep enough within the organisation to create change.
Finally, ensuring the impartiality of any contracting partner would be critical. Conflicts of interest in this area could not be effectively managed by “Chinese Walls” and the contracting partner would be effectively constrained out of bidding for other MoD contracts. There are a number of large scale programme management and project delivery organisations which could be capable of undertaking the task, but some of them are not UK-domiciled, and the security considerations relating to such potential suppliers would need to be thought through carefully.
All of these are significant hurdles, but the existing structure is also substantially flawed. Accordingly, it is the recommendation of the Review team that the Ministry of Defence should be given 12 months to consider whether any other mechanisms short of the construction of a Go-Co could meet the shortfalls identified in this report.
At a very minimum the Review team would suggest that such alternative structures would need to involve the migration of DE&S into a Trading Fund, but the recommendation of the Review team is that if the MoD cannot produce a structure that has been independently verified as addressing the concerns raised here about DE&S structure within a year, and satisfies Ministers that the alternative structure is viable, then the construction of a Go-Co should be undertaken.
3.12. Industry supports change
Much of this report is concerned with processes and incentives within the MoD. However, the MoD does have a symbiotic relationship with the defence
52 52
Review of Acquisition
industry, and it is not sensible to talk about one without discussing the other. First, while constant readjustment of requirements and timing by the MoD does allow industry considerable scope to vary contract terms, it is not in the industry’s long-term interests for the current position to continue. Industry as a whole also suffers from the MoD’s delays and cost increases. It is not in industry’s interests for all projects to slow significantly and costs to rise substantially, since this reduces the potential for export sales and crowds further innovation out of the defence programme.
In the course of the preparation of this report, several key industry leaders expressed a desire to pursue new emerging technologies which have application both within UK and for export. However, development of these technologies has been limited by a lack of cash because of the proportion of resources tied up in “legacy” projects. The heavy downward pressure on short-term expenditure also militates against technology demonstration projects and risk reduction exercises, which could reduce costs for both MoD and industry.
The Review team has detected a strong desire from industry to resolve this set of problems, even at the cost of a significant rationalisation of programmes. One senior industry figure commented that “We [industry] make more money out of the MoD the way things are at present. But we want to put the programme onto a much sounder footing.”
He is not alone in this view. Other industry leaders echoed similar opinions. All worried about the erosion of the Research and Technology base that is a further by-product of the squeeze on spending coming from the overheated programme.
There was also a strong desire to engage with a better prepared customer. Greater professional skills, more timely decisions, and smaller teams were also common themes.
It was interesting, and surprising, to the Review team that industry is keen to change, given that change implies a significant reduction in programmes, as well as its more desirable outcomes.
Despite the symbiotic relationship, and industry's short-term financial interest in the status quo, industry clearly feels that the current situation cannot continue.
Many companies pressed for a reduction in size of DE&S, as its current scale forces industry to match it in resources devoted to programme administration. Others said that they were unclear whether it should exist at all. All argue for substantial reform, in DE&S, and in the setting of the Equipment Programme.

53 53 Review of Acquisition
54 54
Review of Acquisition
4. INTRODUCTION AND OVERVIEW OF REPORT
4.1. Context for the Report
The effectiveness of our military depends critically on the availability of suitable equipment. Around 40% of the MoD’s total annual cash spend on defence, c.£12bn p.a., is consumed in ensuring that this equipment is provided, and, as a result, the efficiency of the MoD in delivering value for money from this spending is key to the defence budget (and defence effectiveness) as a whole.
Problems in delivering equipment capability to time and cost estimates are well documented and remain significant in spite of considerable reform of the acquisition processes and organisations within the Department.
With this in mind, the former Secretary of State for Defence, the Rt. Hon. John Hutton MP, commissioned in December 2008 a review of the way in which the MoD acquires military equipment. This report forms the result of that review.
4.2. The Remit
In December 2008 the Secretary of State for Defence announced to the House of Commons that he had appointed Bernard Gray to lead an independent review of defence acquisition.
The Secretary of State clarified the Review’s terms of reference as follows:
“Within the policy set by the Defence Industrial Strategy, the aim of this review is to examine progress with implementing reforms in the MoD’s Acquisition Change Programme and to make further recommendations to secure better value for money in the identification, commissioning, procurement and whole-life delivery of major acquisition programmes. In particular, the review should recommend further ways of improving the delivery of projects within budget and on time”
It is important to note that the term “acquisition” has a particular meaning within the MoD. It is not a synonym for procurement or purchasing. It refers to the entire “cradle to grave” set of activities and processes to bring defence capabilities into existence, support them over their useful lives and dispose of them when no longer needed.
55 55 Review of Acquisition
4.3. Approach to the Problem
4.3.1. Research Programme
The Review has been conducted over six months, commencing in late December 2008 and running through to the end of June 2009.
During this period, the Review team collected and analysed a wide range of data held within the Department that was relevant to an assessment of the effectiveness of the acquisition process. This ranged from high level planning information, through to individual project performance data. The team has also solicited and considered a range of valuable inputs from a large number of interviews and meetings. These have included over 200 discussions with:
• the Department, including MoD centre, the Capability Sponsor organisation, DE&S and Front Line Commands;
• the Defence industry;
• other UK government departments and public sector bodies;
• defence departments of other nations, in particular the US and France; and
• other relevant commercial organisations.
Further to the perceptions of interviewees, the Review also reflects, where relevant, the Review team’s own experiences in understanding and interacting with the Department during the course of the Review.
A list of contributing parties is included in �Appendix H. The Review team is indebted to them for their valuable contributions.
4.3.2. Key areas investigated by the Review
The Review team has interpreted its remit to include all aspects of the acquisition system (i.e., not just performance of DE&S) and how these impact on the ability of the MoD to procure and support equipments in an effective manner. As such, the Review has sought to understand and consider the implications on acquisition effectiveness of:
• the Defence Board;
• MoD Capability Sponsor;
• DE&S (both “ex-DPA” and “ex-DLO” parts);
• the Investment Approvals Board;
• the annual, Departmental financial planning process; and
• the financial control regime imposed by HM Treasury (“HMT”).
56 56
Review of Acquisition
The Review team has worked to establish a basis of agreed facts with the Department, primarily in the following areas:
• development of the Equipment Programme (both over time, and over the course of annual planning rounds);
• level of time slip in delivering projects vs. Departmental estimates, and drivers of delay;
• level of cost overrun in delivering projects vs. Departmental estimates, and drivers of overruns;
• cost impact of capability specified and approved but not delivered; and
• the system-wide impacts on costs from project delay.
Work has also covered a review of progress against objectives of key Departmental initiatives, including Smart Acquisition, Defence Industrial Strategy (“DIS”) and the recommendations of the Enabling Acquisition Change (“EAC”) study. Furthermore, it has examined change processes and programmes underway in the acquisition system to understand what is intended to be delivered through these activities.
Finally, the Team researched organisation, processes and performance issues from other international defence acquisition efforts, and commercial models of procurement that might be of relevance to the MoD.
Because the Review has been tasked with finding ways to improve acquisition, this report naturally concentrates on the perceived weaknesses of the system as it currently operates and the problems and difficulties encountered by the bodies that perform the necessary activities. However, it should be noted that the MoD acquisition community perform an essential task and do much good work. It is also important to recognise that there have been a number of major changes to the system over that last decade, many of which have been very effectively executed and which led to significant improvements.
4.3.3. Areas not specifically addressed in the Review
Non-equipment support and other activities of DE&S. The Review has sought to understand the delivery of support functions to the Front Line (i.e., DSDA, JSC, BFPO), insofar as they impact / interact with the project and programme delivery activities of DE&S (i.e., those under the Chief Operating Officer). Although these organisations reside organisationally within DE&S the functions being delivered are distinct and although they have significant cost bases in their own right, their activities are peripheral to “core” acquisition of equipment.
Defence Industrial Strategy. The Review has not sought to make recommendations regarding the Defence Industrial Strategy, other than to understand its broad context, objectives and progress. DIS is being

57 57 Review of Acquisition
implemented at a sectoral level, principally within DE&S, and clearly impacts on the acquisition system, but has been taken as a “given” set of objectives (and constraints) for the Department.
Non-Equipment Investment. The Review has primarily focussed on the acquisition and subsequent support of military equipment. It should be noted that the Department also invests a significant sum (c.£3bn p.a., of which c.£800m spent via DE&S) under the auspices of its Non-Equipment Investment Plan (“NEIP”). Much of this spending is currently focussed on delivery of the Department’s Defence Information Infrastructure (“DII”) IT infrastructure which is designed to integrate Head Office and Front Line in the field (and all parts in between) and as such may prove crucial to the delivery of military capability.
4.3.4. Form of recommendations
In the course of diagnosing problems with the acquisition system, the Review Team has identified a number of potential changes which would, in the Team’s opinion, improve the overall performance of the acquisition system. The recommendations address a variety of problems that the Review team perceive to be present in the current system: the general strategic and financial context in which defence acquisition operates; the front-end governance and planning of acquisition; and issues related to back-end delivery of individual projects.
No attempt has been made to prioritise the recommendations, and indeed the form of the problems identified militates against prioritisation. The Review team is of the opinion that they constitute a potential solution only when considered collectively; although individual recommendations are made to solve specific problems, the changes only constitute a solution to the whole problem when considered in aggregate. Partial implementation would not provide the holistic solution that is required and pilot schemes run the danger of being undermined by wider issues and never being fully implemented.
4.4. Reforms of acquisition to date
It is important to recognise that the MoD acquisition system is something of a “moving target”. This section notes the key initiatives which have been undertaken to improve Departmental equipment acquisition performance since 1960.
Reforming defence procurement is by no means a new concept and similar themes of poor cost and time estimating and inadequate de-risking spend during development phases have been highlighted and reiterated since the 1960s. Key reforms before Smart Procurement (described more fully in �Appendix C) include:
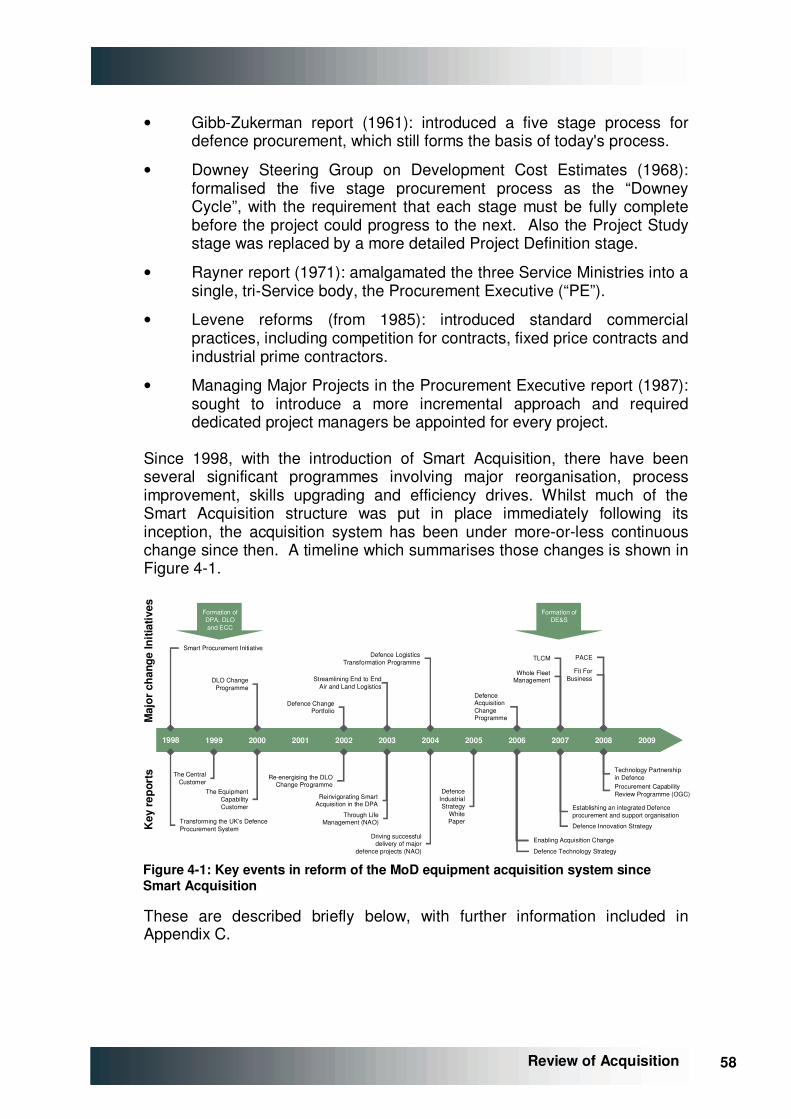
58 58
Review of Acquisition
• Gibb-Zukerman report (1961): introduced a five stage process for defence procurement, which still forms the basis of today's process.
• Downey Steering Group on Development Cost Estimates (1968): formalised the five stage procurement process as the “Downey Cycle”, with the requirement that each stage must be fully complete before the project could progress to the next. Also the Project Study stage was replaced by a more detailed Project Definition stage.
• Rayner report (1971): amalgamated the three Service Ministries into a single, tri-Service body, the Procurement Executive (“PE”).
• Levene reforms (from 1985): introduced standard commercial practices, including competition for contracts, fixed price contracts and industrial prime contractors.
• Managing Major Projects in the Procurement Executive report (1987): sought to introduce a more incremental approach and required dedicated project managers be appointed for every project.
Since 1998, with the introduction of Smart Acquisition, there have been several significant programmes involving major reorganisation, process improvement, skills upgrading and efficiency drives. Whilst much of the Smart Acquisition structure was put in place immediately following its inception, the acquisition system has been under more-or-less continuous change since then. A timeline which summarises those changes is shown in Figure �4-1.
1998 1999 2000 2001 2002 2003 2004 2005 2006 2007 2008 20091998 1999 2000 2001 2002 2003 2004 2005 2006 2007 2008 2009
Defence Industrial Strategy
White Paper
Enabling Acquisition Change
Establishing an integrated Defence procurement and support organisation
Transforming the UK’s Defence Procurement System
Re-energising the DLO Change Programme
Streamlining End to End Air and Land Logistics
Reinvigorating Smart Acquisition in the DPA
Through Life Management (NAO)
Defence Logistics Transformation Programme
Technology Partnership in Defence
Defence Technology Strategy
PACE
Defence Acquisition Change Programme
TLCM
DLO Change Programme
Maj
or c
hang
e In
itiat
ives
Key
rep
orts
Smart Procurement Initiative
Defence Change Portfolio
Formation of DPA, DLO and ECC
Fit For Business
Whole Fleet Management
Driving successful delivery of major
defence projects (NAO)
Procurement Capability Review Programme (OGC)
Defence Innovation Strategy
The Central Customer
The Equipment Capability Customer
Formation of DE&S
Figure �4-1: Key events in reform of the MoD equipment acquisition system since Smart Acquisition
These are described briefly below, with further information included in �Appendix C.
59 59 Review of Acquisition
4.4.1. Late 1990s and early 2000s: Smart Acquisition, formation of DPA\DLO and DLO Change Programme
• Smart Acquisition (1998): On the basis of a fundamental review, the Department sought to improve performance based implementing a range of major initiatives. Significant changes were made to the acquisition process, most visibly the implementation of Initial and Main Gates in the Departmental decision making process and the formation of Integrated Project Teams to deliver individual projects. Further information and appraisal of progress against the “7 Principles of Smart Acquisition” is included at Chapter �8.
• Development of the Procurement Executive into the DPA and formation of the DLO (1999): In keeping with principles of Smart Acquisition and SDR recommendations, the PE was vested with agency status and the three single Service logistics organisations were consolidated to form the DLO.
• DLO Change Programme (2000): Focused on unifying the logistics organisation and its systems, spreading best practice, maximising the benefits of Smart Acquisition, and adopting a common approach to industry. Activities combined with “End to End Air and Land Logistics” in 2004 to form the Defence Logistics Transformation Programme.
4.4.2. More recent initiatives driven by the DIS and EAC report
• Merger of DPA and DLO into DE&S. This has been successfully completed with no obvious detriment to military capability. This process remains ongoing in that collocation and flexible resourcing are still in the process of implementation.
• The development of the Transformation Staircase in support. A number of large contracts for availability have been let (e.g., Tornado ATTAC, Harrier PAC, Sea King) which appear to have delivered very significant savings over historical unit cost rates. Furthermore, a number of PFI contracts for capability have been let (e.g., support vehicle, air-to-air refuelling tanker). This transformation process remains ongoing.
• Initial implementation of the Defence Industrial Strategy (2005): agreeing and deploying changes to acquisition strategies in industrial sectors regarded as strategic.
• Implementation of Through Life Capability Management (“TLCM”) following on from the Enabling Acquisition Change report (2006). TLCM was designed to optimise and synchronise across the 8 Defence Lines of Development (“DLoDs”) thereby reducing cost and improving delivery of military capability. “Phase 4” of the implementation programme (including reorganisation of the “Equipment Capability Customer” into the “MoD Capability Sponsor” and establishment of Programme Boards) commenced during Spring 2009.
60 60
Review of Acquisition
• Implementation of PACE programme within DE&S to deliver improved Performance, Agility, Confidence, and Efficiency as part of the wider Defence Acquisition Change Programme.
A summary of the progress of key initiatives post-Smart Acquisition is included Chapter �8.
4.5. Current MoD Equipment acquisition system
The following section provides a brief overview of the purposes, structure and functions of the MoD equipment acquisition system as it is currently configured.
4.5.1. Purpose
The key activities of the MoD acquisition system are to:
• agree future defence objectives through dialogue with broader Government (primarily through input to the formulation of Defence policy);
• convert these policy objectives into a set of prioritised military effects and capabilities required to deliver these effects;
• translate these required capabilities into tangible and intangible requirements of the Armed Forces, considering the implications for all 8 DLoDs; and
• deliver the requirements against each of the DLoDs in a coherent, affordable manner, delivering value for money for the taxpayer.
The work of this review has primarily focussed on the equipment and support DLoDs, however it should be noted that there are significant interdependencies across the other DLoDs (e.g., training, personnel, infrastructure, etc.). These other DLoDs are very important in ultimately determining what military effect can be accomplished with a given level of resources.
4.5.2. Structures and process
The MoD has created a series of internal structures / organisations to support delivery of the objectives set out in Section �4.5.1. These are set out in Figure �4-2.
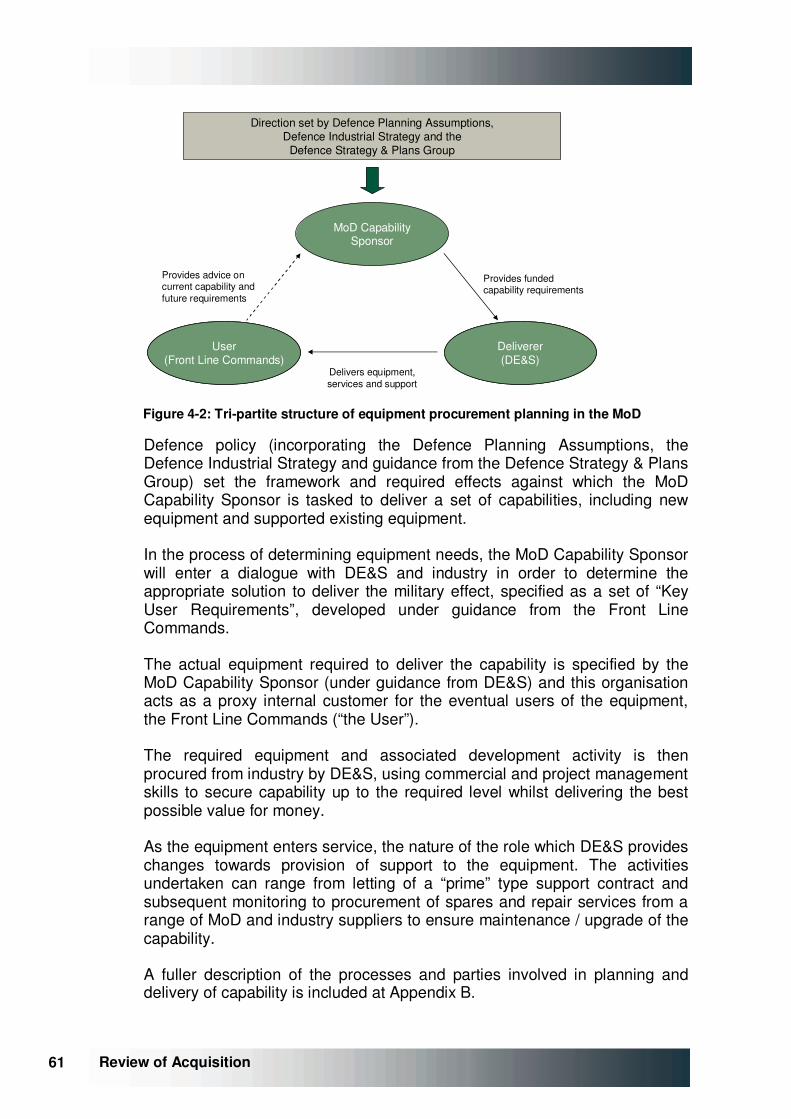
61 61 Review of Acquisition
MoD CapabilitySponsor
User(Front Line Commands)
Deliverer(DE&S)
User(Front Line Commands)
Deliverer(DE&S)
Provides funded capability requirements
Provides advice on current capability and future requirements
Delivers equipment, services and support
Direction set by Defence Planning Assumptions,Defence Industrial Strategy and the
Defence Strategy & Plans Group
Figure �4-2: Tri-partite structure of equipment procurement planning in the MoD
Defence policy (incorporating the Defence Planning Assumptions, the Defence Industrial Strategy and guidance from the Defence Strategy & Plans Group) set the framework and required effects against which the MoD Capability Sponsor is tasked to deliver a set of capabilities, including new equipment and supported existing equipment.
In the process of determining equipment needs, the MoD Capability Sponsor will enter a dialogue with DE&S and industry in order to determine the appropriate solution to deliver the military effect, specified as a set of “Key User Requirements”, developed under guidance from the Front Line Commands.
The actual equipment required to deliver the capability is specified by the MoD Capability Sponsor (under guidance from DE&S) and this organisation acts as a proxy internal customer for the eventual users of the equipment, the Front Line Commands (“the User”).
The required equipment and associated development activity is then procured from industry by DE&S, using commercial and project management skills to secure capability up to the required level whilst delivering the best possible value for money.
As the equipment enters service, the nature of the role which DE&S provides changes towards provision of support to the equipment. The activities undertaken can range from letting of a “prime” type support contract and subsequent monitoring to procurement of spares and repair services from a range of MoD and industry suppliers to ensure maintenance / upgrade of the capability.
A fuller description of the processes and parties involved in planning and delivery of capability is included at �Appendix B.

62 62
Review of Acquisition
4.6. Structure of this Report
Against this background, the following Chapters cover a summary of research, analysis and interview inputs, along with conclusions and recommendations.
Chapter �5, Strategic Context, covers the issues surrounding the high level specification of defence policy and requirements which drive fundamental planning assumptions against which the Department is expected to deliver. It also explores progress with the Department’s Defence Industrial Strategy and Technology Strategy, as well as the topics of exports and cross-border working.
Chapter �6, Planning Defence Capability, covers the Departmental activity in translating requirements into financial plans. It examines the short, medium and longer term planning framework, including the responsibilities, processes, motivations and accountabilities of those involved.
Chapter �7, Performance in Delivery of Equipment and Support, reviews the “downstream” outputs of the Defence acquisition system in terms of capability, cost and time as compared to expectations at the project’s inception. The Review team provide analysis and perspectives on factors contributing to performance shortfalls where these have been identified.
Chapter �8, Progress in Reforming MoD Acquisition Delivery, considers the effectiveness of the key acquisition change initiatives currently underway within the MoD. It also revisits the progress of the Department in achieving the Smart Acquisition principles set out in 1998. It summarises the input collected by the Review team from industry on the strengths and weaknesses of MoD’s acquisition approach, as well as helpful thoughts on how improvements could be achieved.
In Chapter �9, Future Options, the Report turns to examine potential structural options – including those with potential private sector involvement – as alternatives to addressing acquisition issues from within the current organisation and operating framework.
In Chapter �10, International Comparisons, UK defence acquisition is set in an international comparative context. The chapter covers the Team’s research across a number of countries including the US, France, Australia and Canada. It also summarises direct input to the Team from discussions with UK MoD’s counterparts in the US and France. The objective of this work was to understand whether problems in UK acquisition have parallels elsewhere, and if so, whether the UK can learn from others in solving them.
In addition to the body of the Report, a series of appendices are provided with additional detail on a number of subjects, as well as a Glossary of Acronyms in �Appendix I, no doubt of particular use to the non-MoD reader.

63 63 Review of Acquisition
64 64
Review of Acquisition
5. STRATEGIC CONTEXT
5.1. Overview
Defence acquisition is conducted in a complex strategic context. Most importantly, it needs to reflect assessments of current and future threats as well as focused support to current operations. There are also important considerations around support and development of the defence industrial base as well as investment in key technologies for proprietary use or exploitation in export markets. Further important factors include strategies for mutual cooperation across national borders or within international coalition arrangements.
The Review team has focused its attention on the effectiveness of the acquisition organisation and processes in its given strategic context, but was also cognisant that it could be important to consider whether aspects of the strategic framework described above are impacting the effectiveness of the acquisition system itself.
This chapter sets out perspectives in the following areas:
• national defence strategy and its implication for defence capability planning;
• the MoD’s relationship with the Defence industry via the Defence Industrial Strategy;
• defence and broader national technology strategy and policy;
• export strategy; and
• cross-border cooperation and collaboration.
It seeks to draw conclusions on how strategic considerations can be important in driving the performance of the MoD acquisition system, and if changes to any of these could, or should, be considered as part of systematic improvement.
5.2. Changing defence priorities
In the course of its research, the Review team encountered one perspective that appeared to be almost universally held both inside the MoD and outside amongst external stakeholders: current problems in the acquisition system are underpinned by an increasingly out-of-date strategic defence planning framework. The balance of the current and forward plan for equipment procurement is inconsistent with the types of operations which the UK’s Armed Forces are being asked to undertake today and the system is still trying to support too many Cold War capabilities alongside new requirements with decreasing resources.
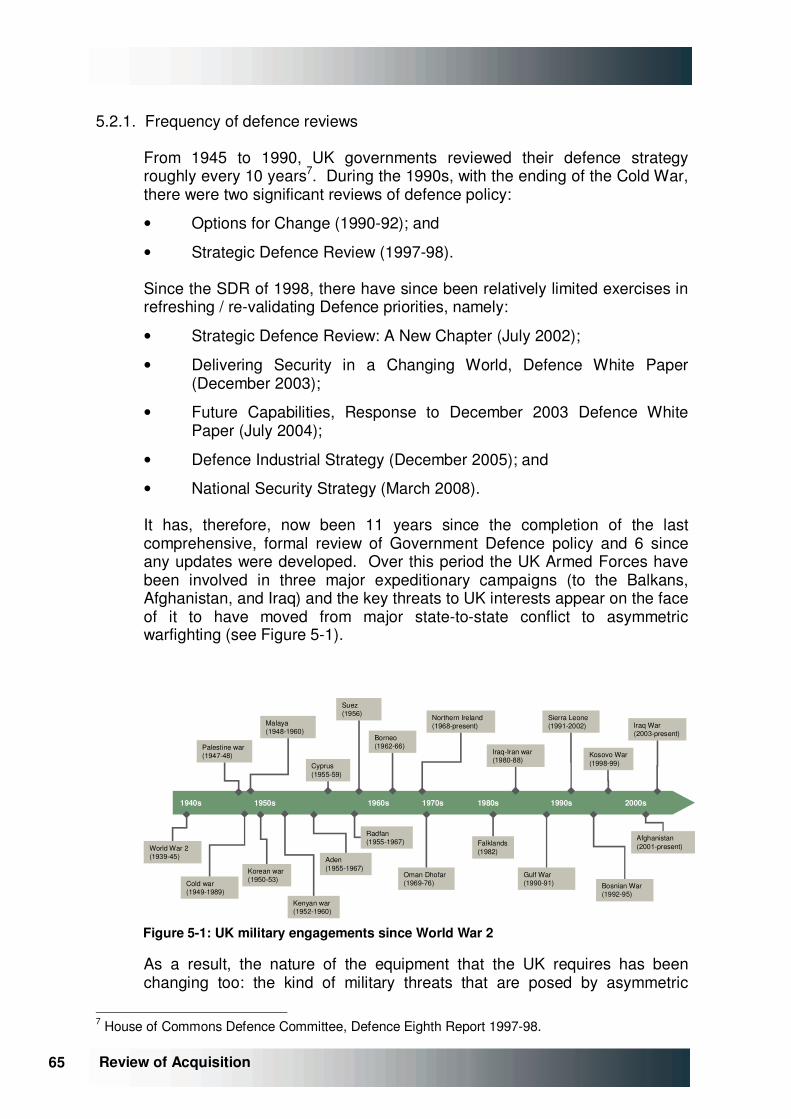
65 65 Review of Acquisition
5.2.1. Frequency of defence reviews
From 1945 to 1990, UK governments reviewed their defence strategy roughly every 10 years7. During the 1990s, with the ending of the Cold War, there were two significant reviews of defence policy:
• Options for Change (1990-92); and
• Strategic Defence Review (1997-98).
Since the SDR of 1998, there have since been relatively limited exercises in refreshing / re-validating Defence priorities, namely:
• Strategic Defence Review: A New Chapter (July 2002);
• Delivering Security in a Changing World, Defence White Paper (December 2003);
• Future Capabilities, Response to December 2003 Defence White Paper (July 2004);
• Defence Industrial Strategy (December 2005); and
• National Security Strategy (March 2008).
It has, therefore, now been 11 years since the completion of the last comprehensive, formal review of Government Defence policy and 6 since any updates were developed. Over this period the UK Armed Forces have been involved in three major expeditionary campaigns (to the Balkans, Afghanistan, and Iraq) and the key threats to UK interests appear on the face of it to have moved from major state-to-state conflict to asymmetric warfighting (see Figure �5-1).
1940s 1950s 1960s 1970s 1980s 2000s
Korean war(1950-53)
Northern Ireland (1968-present)
1990s
Gulf War (1990-91)
Iraq War (2003-present)
World War 2(1939-45)
Falklands (1982)
Palestine war(1947-48) Kosovo War
(1998-99)
Afghanistan (2001-present)
Bosnian War (1992-95)
Sierra Leone (1991-2002)Malaya
(1948-1960)
Cold war (1949-1989)
Kenyan war(1952-1960)
Cyprus(1955-59)
Aden (1955-1967)
Suez(1956)
Radfan(1955-1967)
Borneo(1962-66)
Oman Dhofar(1969-76)
Iraq-Iran war (1980-88)Iraq-Iran war (1980-88)
Figure �5-1: UK military engagements since World War 2
As a result, the nature of the equipment that the UK requires has been changing too: the kind of military threats that are posed by asymmetric
7 House of Commons Defence Committee, Defence Eighth Report 1997-98.
66 66
Review of Acquisition
conflicts are not the same as those posed by hostile states. In particular, whilst it may previously have been sufficient to determine spending by seeking to counter the capability of a potential enemy, it is no longer possible to construct an equipment plan on that basis.
5.2.2. 1998 Strategic Defence Review: key thrusts and issues
The last UK Strategic Defence Review, following fourteen months of preparation and consultation, was presented to Government in July 1998. It identified that, at the time, there was no direct military threat the UK or Western Europe and that future conflicts were likely to come from religious conflict, competition for scarce resources, drugs, terrorism and crime. In the context of a post Cold War environment the review called for a more flexible, mobile, responsive fighting force and made a number of key recommendations:
• enhance joint capabilities – a strategy for increased cooperation between forces and rapid response;
• plug the gap – enhanced capability of Defence Medical Services and remedies for weaknesses in Logistics;
• modernise the services – commitment to defence hardware through to 2015 (notably two new aircraft carriers and confirmation of 232 Eurofighter aircraft);
• make the world a safer place – deterring and preventing conflict and crisis;
• care for our people and society – recruit, train and equip the best people; and
• make every penny count – introduction of Smart Procurement, joint Defence Storage and Distribution Agency (DSDA) and new 4* Chief of Defence Logistics.
The defence guidance resulting from the Strategic Defence Review of 1998 was considered to be ambitious within the constraints of MoD funding 11 years ago and big efficiency savings had to be assumed to bridge the gap. As a result the financial implications of requirements decisions made at the time were made with a relatively poor understanding of the likely consequences for required spending or the financial / defence outputs trade-offs required to ensure the Armed Forces remained affordable.
5.2.3. Balance of investment by conflict type
Given the long timescales over which many UK equipments are developed and delivered, there is a significant danger is that the equipment entering
67 67 Review of Acquisition
service meets a capability need that is no longer relevant to de facto UK defence policy8.
This exact problem was identified in the US acquisition programme by the incoming Obama administration. Announcing the US Defence Budget in April 2009, the Secretary of Defense stated that:
“…every Defense dollar spent to overinsure against a remote or diminishing risk or, in effect, to run up the score in capability where the United States is already dominant is a dollar not available to take care of our people, reset the force, win the wars we are in, and improve capabilities in areas where we are underinvested and potentially vulnerable. That is a risk I will not take…” 9
Criticisms have been levelled against existing UK acquisition plans echo these concerns: the Institute for Public Policy Research (ippr), a UK think-tank, in their June 2009 report on National Security in the UK10 pointed to the following major Defence programmes that in their view required reconsideration: Future Aircraft Carrier (CVF), Joint Combat Aircraft, Type 45 Destroyer, Astute and Typhoon11.
Similarly in 2007, the Royal United Services Institute (RUSI)12 questioned whether these same large platforms, and Nimrod MRA4 in addition, were still relevant to today’s asymmetric warfare environment. Furthermore, RUSI questioned whether more cost effective solutions were available to meet the needs that the Department planned to satisfy through the A400m and FRES projects.
In total, the six projects13 whose usefulness was called into question by RUSI account for around 40% of planned spend14 appearing in the Department’s EPP over the next 5 years. This figure should not be interpreted as potential savings that are available, but rather an indication as to just how much of current expenditure was originally planned for Cold War style conflict (or goes well beyond realistic, anticipated capability needs). These observations also highlight that it is imperative to ensure that the Equipment Plan remains relevant to evolving capability needs; otherwise, the amount of money being wasted could be immense.
It should be emphasised that the provision of effective, useful defence capability is a very long-term process involving development and co-ordination of eight different Defence Lines of Development (“DLoDs”). For example, Typhoon was conceived in the early 1970s as a replacement for
8 Further issues relating to the long acquisition cycle times include risk of technical obsolescence and requirements creep leading to cost inflation. 9 Secretary of Defense Robert Gates Press Briefing, (6 Apr 2009) 10 Shared Responsibilities - A National Security Strategy for the United Kingdom, ippr (Jun 09) 11 ippr stated that Typhoon would have been recommended for reconsideration if the Government had not already committed to Tranche 3 12 The Underfunded Equipment Programme - Where Now?, RUSI Defence Systems (Feb 2007) 13 The spend attributed to the CVF programme includes the MASC project and Type 45 programme includes PAAMS project 14 Based on the PR09 EPP stage 2b post options and manual adjustments
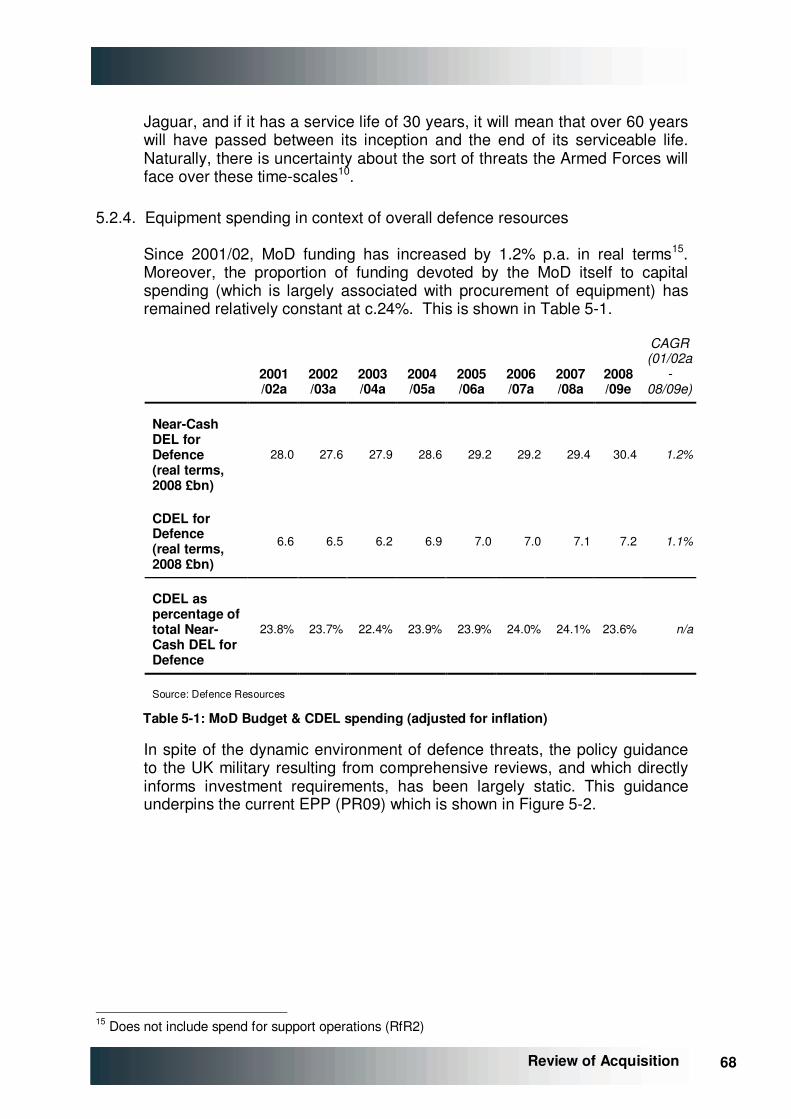
68 68
Review of Acquisition
Jaguar, and if it has a service life of 30 years, it will mean that over 60 years will have passed between its inception and the end of its serviceable life. Naturally, there is uncertainty about the sort of threats the Armed Forces will face over these time-scales10.
5.2.4. Equipment spending in context of overall defence resources
Since 2001/02, MoD funding has increased by 1.2% p.a. in real terms15. Moreover, the proportion of funding devoted by the MoD itself to capital spending (which is largely associated with procurement of equipment) has remained relatively constant at c.24%. This is shown in Table �5-1.
2001 /02a
2002 /03a
2003 /04a
2004 /05a
2005 /06a
2006 /07a
2007 /08a
2008 /09e
CAGR (01/02a
-08/09e)
Near-Cash DEL for Defence (real terms, 2008 £bn)
28.0 27.6 27.9 28.6 29.2 29.2 29.4 30.4 1.2%
CDEL for Defence (real terms, 2008 £bn)
6.6 6.5 6.2 6.9 7.0 7.0 7.1 7.2 1.1%
CDEL as percentage of total Near-Cash DEL for Defence
23.8% 23.7% 22.4% 23.9% 23.9% 24.0% 24.1% 23.6% n/a
Source: Defence Resources
Table �5-1: MoD Budget & CDEL spending (adjusted for inflation)
In spite of the dynamic environment of defence threats, the policy guidance to the UK military resulting from comprehensive reviews, and which directly informs investment requirements, has been largely static. This guidance underpins the current EPP (PR09) which is shown in Figure �5-2.
15 Does not include spend for support operations (RfR2)
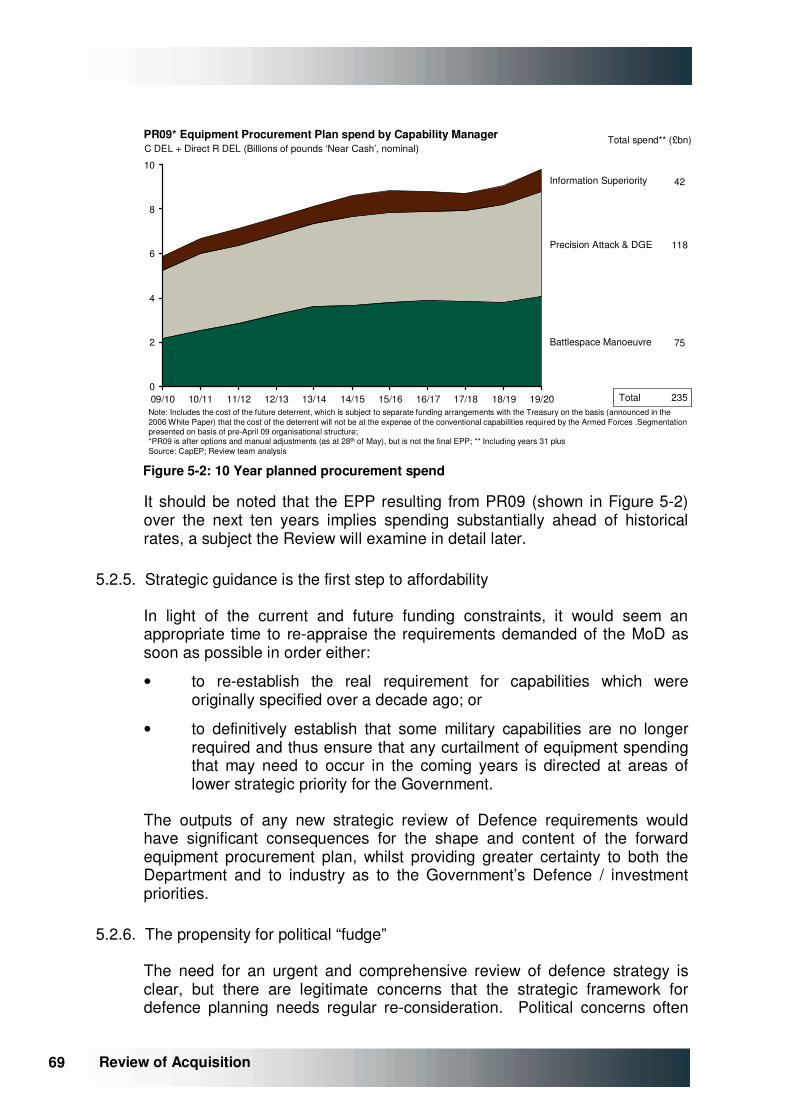
69 69 Review of Acquisition
PR09* Equipment Procurement Plan spend by Capability Manager
Note: Includes the cost of the future deterrent, which is subject to separate funding arrangements with the Treasury on the basis (announced in the2006 White Paper) that the cost of the deterrent will not be at the expense of the conventional capabilities required by the Armed Forces .Segmentation presented on basis of pre-April 09 organisational structure; *PR09 is after options and manual adjustments (as at 28th of May), but is not the final EPP; ** Including years 31 plusSource: CapEP; Review team analysis
0
2
4
6
8
10
Battlespace Manoeuvre
Precision Attack & DGE
Information Superiority
19/2018/1917/1816/1715/1614/1513/1412/1311/1210/1109/10
C DEL + Direct R DEL (Billions of pounds ‘Near Cash’, nominal)Total spend** (£bn)
Total 235
42
75
118
Figure �5-2: 10 Year planned procurement spend
It should be noted that the EPP resulting from PR09 (shown in Figure �5-2) over the next ten years implies spending substantially ahead of historical rates, a subject the Review will examine in detail later.
5.2.5. Strategic guidance is the first step to affordability
In light of the current and future funding constraints, it would seem an appropriate time to re-appraise the requirements demanded of the MoD as soon as possible in order either:
• to re-establish the real requirement for capabilities which were originally specified over a decade ago; or
• to definitively establish that some military capabilities are no longer required and thus ensure that any curtailment of equipment spending that may need to occur in the coming years is directed at areas of lower strategic priority for the Government.
The outputs of any new strategic review of Defence requirements would have significant consequences for the shape and content of the forward equipment procurement plan, whilst providing greater certainty to both the Department and to industry as to the Government’s Defence / investment priorities.
5.2.6. The propensity for political “fudge”
The need for an urgent and comprehensive review of defence strategy is clear, but there are legitimate concerns that the strategic framework for defence planning needs regular re-consideration. Political concerns often
70 70
Review of Acquisition
militate against this. Decisions around cuts in force structures, equipment programmes or infrastructure are rarely popular with the electorate and / or industry and have proved too easy to defer. Other countries have instituted regular SDRs or equivalent, on a defined timetable. For example in broadly the same time period since the UK’s last comprehensive strategic review the US’ quadrennial review process has led to reviews in 1997, 2001 and 2006, with a further review established for 201016. Arguably because the US is compelled to revisit these difficult questions regularly it is less a party political question than when governments are forced to make even more difficult, unpalatable decisions driven by crisis.
As noted above, another aspect of defence reviews subject to political “fudge” is the tendency to duck the need to properly cost the strategies that are proposed. This is particularly troublesome for long range affordability planning around the equipment programme and needs to be addressed in any future process proposal.
5.2.7. Absence of long-term funding guidance
The absence of long-term funding guidance for military acquisition poses further problems for effective defence planning. The current annual or triennial CSR process in the UK is not commensurate with planning and delivery of major capital projects which may be delivered over a ten year timeframe, and have significant financial implications (through force structure, contracted support arrangements, etc.) beyond even this horizon. Other countries have started to implement alternative approaches which recognise the mis-match and realistically set expectations of the defence community in the longer term.
For example, French plans are formulated in the context of known forward budgets. Every six years a law, known as the Loi de Programmation Militaire (“LPM”), is passed by the French parliament. The law sets targets (for example on staff numbers and on the volume of equipment to be delivered) and fixes military expenditure for each of the next six years. In this way, the budgets for equipment acquisition, manpower and various other cost centres are specified over the medium-term. The LPM therefore constitutes an agreement between the finance ministry and the French MoD regarding the outputs that must be delivered for a specified level of financial commitment. Some flexibility is retained within this framework, as variations from the plan are still allowed, although any changes must always be introduced with reference to the extant LPM.
Budgets are not set on a rolling basis, so the LPM does not always provide the acquisition community with accurate long-term funding expectations. It does, however, provide a stable funding environment for acquisition planning
16 Secretary of Defense has been mandated since 2001 to conduct a QDR "every four years, during a year evenly divisible by four" and to submit the report to Congress "not later than September 30 of the year in which the review is conducted"
71 71 Review of Acquisition
for many years, and therefore permits acquisition activities to be prosecuted with greater certainty than would otherwise be the case.
An alternative approach, which does provide funding certainty over the long-term, has recently been instituted by the Australian Department of Defence. A White Paper was published in May 2009, setting out the strategy for the Australian Defence Force until 2030. In parallel with these strategic plans the Australian Government, made the following funding commitments17:
• 5.5% nominal growth in defence budget to 2017-18; and
• 4.7% nominal growth in defence budget from 2018-19 to 2030.
These arrangements were explicitly agreed to ensure that the Australian Department of Defence can make long-term plans and to "remove the need for Defence to constantly adjust its expenditure parameters to suit short-term fluctuations in the broader economy”18.
In contrast, the MoD’s planning process has become a short-term book-balancing exercise, with the long-term plan far adrift from reasonable views of future funding. Although a framework for medium-term funding stability is highly desirable, it is only likely to be agreed to by Government if the forward spending plans are constrained to fit within this affordability envelope, and currently the process for ensuring affordability is far off course. This is discussed more fully in Chapter �6.
5.3. MoD relationship with the UK Defence industry
Acquisition of military equipment requires an effective partnership between the MoD and industry since the Department itself neither conducts detailed design work, nor undertakes any production of the equipment that it procures. The presence of an advanced defence industry in the UK provides a means by which the MoD can readily access technical expertise and ensures that innovations can consistently be incorporated into equipment for use by the UK Armed Forces.
Besides delivering required military capability, industrial providers of military equipment also help generate employment – both directly and through the large network of suppliers with whom they engage. Typically, these manufacturing jobs are in highly skilled sectors and, as such, are the types of employment that the government seeks to ensure are maintained in the UK. The investments made by industrial providers in order to meet the UK’s military requirements also lead to technology developments that can be leveraged more generally and can generate exports of highly value-added goods that contribute significantly to the balance of payments.
17 Funding commitments expressed before the costs of major overseas operations. 18 Defence White Paper – Defending Australia in the Asia Pacific Century (May 2009)
72 72
Review of Acquisition
The UK’s Defence industry, therefore, plays an important role not only in the MoD’s acquisition process, but also in the nation’s overall economic prosperity. In this context, this Review has sought take industrial consequences of acquisition into account and has engaged with industry directly to ensure that their views are appropriately represented and balanced with those of the Department.
In the next section the formal arrangements which frame the relationship between the MoD and industry, the Defence Industrial Strategy (DIS) is considered, and its merits and the success of its delivery are discussed.
5.4. Defence Industrial Strategy
Published as a white paper in December 2005 the Defence Industrial Strategy (DIS) set out to address the relationship between the MoD and the UK Defence industry in a time of industry consolidation.
5.4.1. Key objectives of the Defence Industrial Strategy
The DIS developed a framework of six guiding principles for the MoD:
• Appropriate sovereignty – maintain appropriate sovereignty over industrial skills and capability in critical areas
• Through-life capability management – develop architectures that increase sustainability through incremental enhancements
• Maintaining key and rapid industrial capabilities and skills – sustain key knowledge across supply chain where there is no longer a sustainable production profile
• Intelligent customers-intelligent suppliers: the importance of systems engineering – preserve systems engineering knowledge
• Value for defence – driving value for money, whilst retaining a focus on national industry
• Change on both sides – improvement by both MoD, the Government and Industry
The DIS considered that sector industry strategies were of particular importance in uncompetitive market sectors where fixed costs are significant. As a result the DIS considers a number of UK Defence industrial sectors and the cross-cutting capabilities that exist within them, including Systems Engineering, Maritime, Armoured Fighting Vehicle, Fixed-Wing, Helicopters, General Munitions, Complex Weapons, C4ISTAR, CBRN Force Protection, Counter Terrorism, Technology Priorities and Test and Evaluation.
DIS reaffirmed the Smart Acquisition principles and set out a number of further key initiatives which led to the subsequent publication of the seminal
73 73 Review of Acquisition
Enabling Acquisition Change report (see Chapter �8 for further detail). These initiatives were stated as:
• primacy of through-life considerations;
• coherence of defence spread across research, development, procurement and support; and
• successful management of acquisition at the Departmental level.
The DIS aimed to achieve change from both sides by also presenting industry with better guidance:
• plan for through-life capability management;
• invest in growing and maintaining a systems engineering capability in the UK;
• encourage greater levels of communication and transparency between Industry and the MoD;
• embrace open systems architecture principles and incremental acquisition approaches; and
• foster better understanding of both Industry and MoD objectives and working practices.
The DIS also highlighted the vital role technology research and development needed to play in meeting the challenges of future conflicts. These needs became the objectives of the Defence Technology Strategy (DTS, 2006) and Defence Innovation Strategy (2007).
5.4.2. Progress in achieving DIS objectives
Since the publication of the DIS in December 2005 there has been significant progress in five of the key sector strategies (maritime, rotary wing, complex weapons, fixed wing and land). These are beginning to result in noticeable benefits to the defence programme as a whole.
The Maritime Change Programme (“MCP”) has been at the core of implementing DIS as its origin pre-dates DIS and it was one of the key drivers for developing a Defence Industrial Strategy. It will be implemented through a number of key initiatives:
• A 15 year Terms of Business Agreement19 (“TOBA”) with BVT Surface Fleet Limited, a Surface Ship Joint Venture between BAE Systems and VT Group, to focus on both current production and long-term support. Anticipated net benefits of £700-1,100m over next 15 years.
19 The TOBAs are a key part of the MCP and will include commitments from the MoD to industry on supply scope and sustainment of Key Industrial Capabilities. In return, the MoD expects commitments from industry to rationalise infrastructure and resources.

74 74
Review of Acquisition
• A 15 year TOBA with Babcock Marine that agrees scope share as UK’s sole provider of submarine support services in return for anticipated efficiency savings of £600m in submarine and surface support over 11 years.
• An alliance between BVT and Babcock Marine for efficient delivery of surface ship support in the UK.
• Submarine Enterprise Collaboration Agreement that includes BAE Systems Submarines, Babcock Marine and Rolls-Royce. An exception under the Competition Act has been awarded based on the justification of maintaining national industry capability.
The Rotary Wing Sector strategy has been realised through the AugustaWestland Partnering Agreement that was established alongside the DIS. It has been successful in implementing a number of innovative solutions, particularly focusing on through life cost savings, for helicopter support, future upgrade and development.
Team Complex Weapons is a concept that defines a programme of ongoing activity designed to react to current technology and user needs. A number of successful pilot projects have been implemented and it is estimated that over 10 years Team CW will deliver over £1bn of benefits.
The Fixed Wing Air Sector Strategy has been recently reformed to represent a strategy that still retains a focus on BAE Systems for future support, but that is also looking at the future offshore JCA. Notable savings have been achieved to date in support and upgrade contracts (see Section �7.9 for progress with Contracting for Availability).
The Armoured Fighting Vehicle Strategy has been expanded into a Land Industry Sector Strategy that addresses the global market for land equipment. It will be made up of a number of sub-sectors, of which AFV will be one, as will Individual Soldier System and Battlefield Infrastructure Strategies.
With these limited set of sector level implementation strategies for DIS the Department is making good but slow progress. However, to a certain degree, DIS militates against the effective operation of competition in key areas of equipment acquisition with the consequence of increasing costs by deliberately moving to ensure sustained, efficient, onshore industrial capability.
5.4.3. DIS renewal
Although consideration of the Defence Industrial Policy is outside the remit of this Review, it does have bearing on the affordability and costing debate. The DIS essentially mandates certain industrial strategies to be implemented by the Department in fulfilling its requirements. These have cost implications for the Equipment Programme, in a similar way to capability requirements
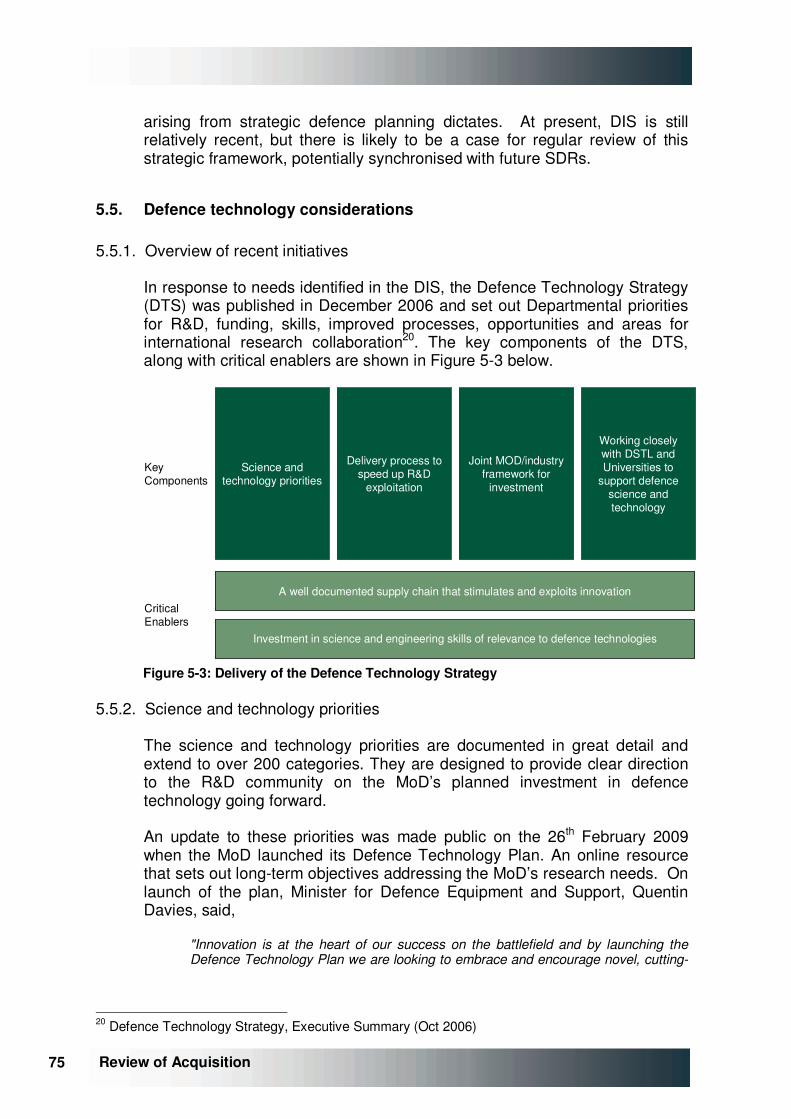
75 75 Review of Acquisition
arising from strategic defence planning dictates. At present, DIS is still relatively recent, but there is likely to be a case for regular review of this strategic framework, potentially synchronised with future SDRs.
5.5. Defence technology considerations
5.5.1. Overview of recent initiatives
In response to needs identified in the DIS, the Defence Technology Strategy (DTS) was published in December 2006 and set out Departmental priorities for R&D, funding, skills, improved processes, opportunities and areas for international research collaboration20. The key components of the DTS, along with critical enablers are shown in Figure �5-3 below.
Science and technology priorities
Delivery process to speed up R&D
exploitation
Joint MOD/industry framework for
investment
Working closely with DSTL and Universities to
support defence science and technology
A well documented supply chain that stimulates and exploits innovation
Investment in science and engineering skills of relevance to defence technologies
A well documented supply chain that stimulates and exploits innovation
Investment in science and engineering skills of relevance to defence technologies
Critical Enablers
Key Components
Figure �5-3: Delivery of the Defence Technology Strategy
5.5.2. Science and technology priorities
The science and technology priorities are documented in great detail and extend to over 200 categories. They are designed to provide clear direction to the R&D community on the MoD’s planned investment in defence technology going forward.
An update to these priorities was made public on the 26th February 2009 when the MoD launched its Defence Technology Plan. An online resource that sets out long-term objectives addressing the MoD’s research needs. On launch of the plan, Minister for Defence Equipment and Support, Quentin Davies, said,
"Innovation is at the heart of our success on the battlefield and by launching the Defence Technology Plan we are looking to embrace and encourage novel, cutting-
20 Defence Technology Strategy, Executive Summary (Oct 2006)
76 76
Review of Acquisition
edge ideas to provide our future forces with the latest technological advances so they can stay one step ahead of the enemy.”21
5.5.3. Delivery process to speed up R&D exploitation
A new delivery process to speed up R&D exploitation from end-to-end engaging all stakeholders was recommended. A recommendation that was iterated in the October 2007 review of R&D that found that MoD’s R&D is not currently managed as a coherent whole22. A revised three channel research delivery process was defined in the MoD Research and Development Handbook, May 200723.
The Enabling Research Channel is sponsored by Science Innovation Technology (SIT) and focuses on delivery new technology and should generally take projects up to TRL 3.
The Capability and Management Channel is sponsored by ECC and provides technical and capability management skills.
The Technology Development Channel, sponsored by DE&S, typically takes technology from TRL 3 to 6, at which point it should then be transferred to the relevant IPT and be funded through the Equipment Plan. This channel should focus on cross-cutting technologies and open system architectures to allow technology to be used across a number of IPTs or clusters.
5.5.4. Joint MoD/industry framework for investment
In order to drive promising developing technologies through to a mature state, as recommended in DIS, a Joint MoD/industry framework for investment was specified. The department recognised that self-financed R&D in the defence sector is currently far less than in the civil sector and the MoD should be looking to industry for more support. It is accepted that industrial investment in defence R&D might be more difficult during the more inventive concept stage, albeit potentially very lucrative, but industry was expected to be more involved with the less risky applied development and demonstration stages.
An approach for meeting this requirement was detailed in Technology Partnership in Defence, a report published by the National Defence Industries Council (NDIC) in September 200824. The report recommended:
• transparent strategic engagements between MoD and industry particularly in terms of budget and planning horizons;
21 MoD unveils future UK defence tech research plan, Equipment and Logistics news article (27 Feb 2009) 22 Maximising Defence Capability Through R&D (Oct 2007) 23 MoD R&D Handbook Interim Draft Release Issue 1 (10 May 2007) 24 Technology Partnership in Defence, National Defence Industries Council (NDIC), (Sep 2008)
77 77 Review of Acquisition
• build on the clear engagement principles that were put in place as part of implementing the Centre for Defence Enterprise. A Programme launched in May 2008 designed to encourage more investment in R&D by industry25. It invites proposals for all forms of defence innovations, which if successful will lead to contracts and funding; and
• widespread use of open systems and architectures will facilitate the rapid and cost effective introduction of new technologies into existing defence systems. MoD to own the high level architectural function of the system of systems.
5.5.5. Working closely with DSTL and universities to support defence science and technology
Working closely with DSTL and universities to support defence science and technology was considered a key component of delivering the DTS. The DSTL were closely involved in the “Competition of Ideas” initiative (see Section �5.5.6), providing key senior staff to assess competition bids.
At the same time, the DSTL is leading the implementation of the “Communities of Practice” initiative that is aimed a improving the UK skills base, particularly in key capability sectors26.
5.5.6. Well documented supply chain that stimulates and exploits innovation
MoD endorsed a belief that a well documented supply chain that stimulates and exploits innovation is a critical enabler of technological innovation. The result was the “Competition of Ideas”, a process to seek innovative solutions to defence problems, attracted over 450 proposals was launched 30th July 200727.
On the same day, the “Grand Challenge” was also launched where teams were invited to submit solutions to meet a defined capability need27. The MoD aimed to build on the success of both of these programmes through the creation of the Centre for Defence Enterprise.
5.5.7. Investment in science and engineering skills of relevance to defence technologies
The DIS identified the need for investment in science and engineering skills of relevance to Defence technologies. As a consequence of the DTS doctoral and postdoctoral research schemes have been created in association with the DSTL, industry and universities.
25 Centre for Defence Enterprise opens, Defence Policy and Business news article (29 May 2008) 26 DSTL Annual Report and Accounts 2007/08 27 Challenge is on to find Britain's best technology innovators (VIDEO), Equipment and Logistics news article (31 Jul 2007)
78 78
Review of Acquisition
5.5.8. Defence innovation strategy
The Innovation Strategy published in December 2007 built on both the Defence Industrial Strategy and the Defence Technology Strategy. It identified the main challenges to innovation in delivery of defence capability in terms of five distinct pillars28:
• Sharing the vision for defence capability: Communicate challenges in a way that promotes innovative responses to meeting capability.
• Capability and technology road mapping: Develop a Defence Technology Plan to share capability and technology plans with all stakeholders.
• Smarter systems engineering: Design systems with flexibility and upgrades in mind.
• Improved business models: Work with NDIC to develop business models that encourage innovation.
• Need for speed: improved responsiveness to allow exploitation of innovative defence technology.
5.5.9. Observations
The Review team considers a detailed review of Defence Technology Strategy and associated relationships with industry, academia and other government organisations outside of its scope; however, the initiatives described above appear coherent and consistent with the DIS.
The report returns later in Chapters �6 and �7 to the subject of technology management and risk mitigation as they impact the acquisition system. The Defence innovation strategy provides guidance on important aspects of brining technology through to application without excessive risk or delay, but, as this report will later discuss, issues around technology “over-reach” and lack of “incremental” approaches appear to feature all too regularly in projects that are passing through the programme.
5.6. Potential for exports
5.6.1. Market context
After the end of the Cold War, volumes of international arms transfers declined significantly – in 2002, it was only 38% of the 1982 peak, according to the Stockholm International Peace Research Institute (SIPRI)29. Since
28 Innovation Strategy, Ministry of Defence (Dec 2007) 29 SIPRI data on arms transfers are presented in the form of Trend Indicator Values (“TIVs”). This metric seeks to measure the military implications of arms transfers by evaluating the technical parameters of weapons transferred between nations. Weapons are assigned an indexed value according to their performance. These values reflect the military resource value of the weapon in relation to other weapons relative to some pre-determined benchmark. Although the units of TIVs

79 79 Review of Acquisition
2002, volumes have recovered somewhat, though the arms trade remains significantly smaller in scale than was previously the case and declined in 2008, relative to 2007 (Figure �5-4).
SIPRI data on actual deliveries of major conventional weapons indicate that approximately 80 per cent of the volume of exports between 2003 and 2007 was accounted for by the five largest suppliers—the US, Russia, Germany, France and the UK, as shown in Table �5-2.
0
10,000
20,000
30,000
40,000
50,000
1982 83 84 85 86 87 07 08
Rest of the world
Top 5 exporters
Trend Indicator Values (TIVs)
88 89 90 91 92 93 94 95 96 97 98 99 00 01 02 03 04 05 06
Volume of arms exports (1982-2008)*
Note: Top 5 exporters includes US, Russia, Germany, France and UK; * Figures are SIPRI Trend Indicator Values (TIVs) expressed in US$ m. at constant (1990) prices Source: SIPRI Arms Transfer Database Figure �5-4: Volume of arms exports 1982-2008
Major recipients (share of supplier’s transfers)
Supplier
Share of total global
arms exports (%)
Total number of recipients 1st 2nd 3rd
US 31 69 S. Korea (15)%
Israel (13%)
UAE (11%)
Russia 25 46 China (42%) India (21%) Algeria (8%)
Germany 10 47 Turkey (15%)
Greece (13%)
S. Africa (12%)
France 8 39 UAE (32%)
Singapore (13%)
Greece (12%)
UK 4 37 US (21%) India (14%) Chile (9%) Note: The dominance of these five nations is long established: the same participants accounted for 84% (by volume) of all exports over the period 1980–1984. As remains the case, the US and the USSR (now Russia) both play a significantly larger part in the transfer of military hardware than smaller European nations Source: SIPRI
Table �5-2: Top 5 global suppliers of major conventional weapons and their largest recipients (2004-08)
are monetary (US$ m. at constant (1990) prices), TIVs do not represent the financial value of goods transferred; rather, they provide an indication of the volume of arms transferred between two trading partners.
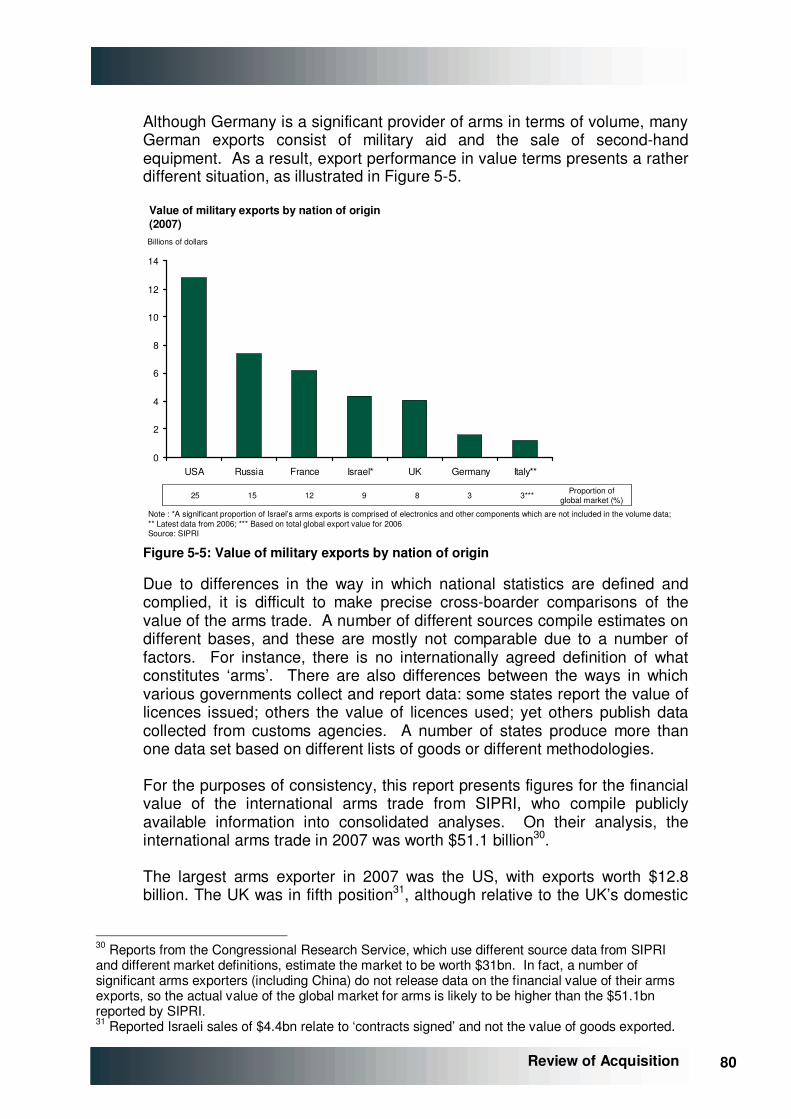
80 80
Review of Acquisition
Although Germany is a significant provider of arms in terms of volume, many German exports consist of military aid and the sale of second-hand equipment. As a result, export performance in value terms presents a rather different situation, as illustrated in Figure �5-5.
Value of military exports by nation of origin(2007)
Note : *A significant proportion of Israel’s arms exports is comprised of electronics and other components which are not included in the volume data; ** Latest data from 2006; *** Based on total global export value for 2006Source: SIPRI
Proportion ofglobal market (%)25 15 12 9 8 3 3***
0
2
4
6
8
10
12
14
USA Russia France Israel* UK Germany Italy**
Billions of dollars
Figure �5-5: Value of military exports by nation of origin
Due to differences in the way in which national statistics are defined and complied, it is difficult to make precise cross-boarder comparisons of the value of the arms trade. A number of different sources compile estimates on different bases, and these are mostly not comparable due to a number of factors. For instance, there is no internationally agreed definition of what constitutes ‘arms’. There are also differences between the ways in which various governments collect and report data: some states report the value of licences issued; others the value of licences used; yet others publish data collected from customs agencies. A number of states produce more than one data set based on different lists of goods or different methodologies.
For the purposes of consistency, this report presents figures for the financial value of the international arms trade from SIPRI, who compile publicly available information into consolidated analyses. On their analysis, the international arms trade in 2007 was worth $51.1 billion30.
The largest arms exporter in 2007 was the US, with exports worth $12.8 billion. The UK was in fifth position31, although relative to the UK’s domestic
30 Reports from the Congressional Research Service, which use different source data from SIPRI and different market definitions, estimate the market to be worth $31bn. In fact, a number of significant arms exporters (including China) do not release data on the financial value of their arms exports, so the actual value of the global market for arms is likely to be higher than the $51.1bn reported by SIPRI. 31 Reported Israeli sales of $4.4bn relate to ‘contracts signed’ and not the value of goods exported.

81 81 Review of Acquisition
spend on the procurement of military equipment, however, export performance appears rather better, as shown in Figure �5-6.
0
10
20
30
40
50
60
70
US UK France Germany Italy Russia Israel*
Export value as percentage of procurement spend 2006Percent
Export value as percentage of GDP2006
Note: * Israeli army procurement spend not disclosedSource: SIPRI; NATO; IMF; Globalsecurity.org; Review team analysis
2.10
0.15
Israel0.00
0.10
0.05
0.20
0.70
Percent
US UK France Germany Italy Russia
n/a
Figure �5-6: Military exports relative to size of exporter
Military exports account for more than 0.15% of GDP in both the UK and France, which is higher than many other nations, with the notable exceptions of Russia and Israel. Relative to domestic spend on military procurement, the UK is roughly in line with other major military powers in Europe (which typically lie between 30% and 50%), but significantly ahead of the US. France outperforms the UK, exporting goods worth c.40% of its own procurement budget; if the UK were to develop its export market to the same degree, an additional £600-£900m in sales would be generated every year.
0.0
0.5
1.0
1.5
2.0
2.5Ammunition
1.53
2001
0.94
02
0.99
03
1.39
04
1.39 1.36
06
2.07
07
Optical Equipment and TrainingSimulators
Guns, Small Arms and Parts
Armoured Fighting Vehicles and Parts
Warships*
Guided Weapons, Missiles and Parts
Military Aircraftand Parts
Billions of pounds
05
Value of UK Military export deliveriesby type
Note: *The large increase in the value of identified exports in the Warships category in 2007 is due to the overseas delivery of threeOffshore Patrol VesselsSource: DASA
0.0
0.5
1.0
1.5
2.0
2.5Latin America and Caribbean
1.53
2001
0.94
02
0.99
03
1.39
04
1.39 1.36
06
2.07
07
Other Africa
Middle East and North Africa
Asia and Far East
NATO countries and Other Europe*
Billions of pounds
05
Value of UK Military export deliveriesby destination
Figure �5-7: UK military exports by type and destination
82 82
Review of Acquisition
The bulk of the value of UK military exports can be accounted for by sales to foreign governments of military aircraft and parts (see Figure �5-7), predominantly long-term deals to supply Hawk-60 aircraft to the U.S. and Hawk-100 aircraft to India. UK sales in other categories of equipment typically accounted for only 25-40% of exports, around half of which is sales of guided weapons and missiles. UK export sales since 2007 have remained reasonably strong, including:
• sales of 66 Hawk trainers and 20 Jaguar combat aircraft to India (of which delivery started in 2007);
• further sales of Typhoon fast jets to Saudi Arabia32; and
• agreements to provide the governments of Oman and Trinidad and Tobago with warships.
5.6.2. Commentary
The export potential of the military equipment that the MoD develops is rarely given due consideration as part of the requirements setting and procurement process. Yet increased foreign military sales have the potential to deliver direct benefits to the MoD’s efforts to procure military goods efficiently due to:
• the potential for joint funding and risk sharing in development;
• increased production volumes over which to amortise development and overhead costs, leading to reduced unit costs; and
• improved delivery against the Defence Industrial Strategy objectives.
In addition, additional exports could deliver a number of broader economic and diplomatic benefits:
• the provision / maintenance of jobs, particularly highly skilled jobs, in the UK;
• help the UK’s balance of payments; and
• an additional lever that would strengthen the UK’s negotiating position in the context of foreign policy, thereby assisting in delivering broader diplomatic and strategic objectives.
It has been asserted that the MoD currently lacks the skills and organisation to implement such a ‘French-style’ policy. In particular, the significant use of service personnel within the capability and procurement functions may hinder progress due to the single Service agenda and rotation issues associated with their use in line reporting roles for new equipment procurement (see Chapters �7 and �8). Also, improving export performance
32 Saudi Arabia does not feature as a major recipient of UK exports in Table �5-2 because these data do not include spares and components. Also, delivery of Typhoon aircraft is still pending and so not included here.
83 83 Review of Acquisition
would require close co-operation between the requirements setting and capability communities and industry, for which MoD is currently ill-prepared.
5.7. Cross-border cooperation and joint acquisition
A number of UK acquisition projects that are currently underway involve collaboration with other nations to jointly procure equipment for use by the military forces of all of the participants. The potential economic benefits of acquiring equipment in this way are significant:
• fixed development costs can be defrayed amongst a number of partners, generating economies of scale and associated reductions in unit costs that would not be otherwise be realised. This has led the UK to participate in some smaller scale collaborative projects, including NLAW (light anti-armour missile), GMLRS (guided multiple launch rocket system); and
• projects that are very large and which could not realistically be undertaken independently by the UK; in such circumstances, collaboration affords access to technologies and capabilities that would otherwise be out of reach. This means the set of collaborative projects in which the MoD is involved are high-profile such as Typhoon, A400(M) and PAAMS on the Type 45 destroyer.
The potential benefits of collaboration are most evident on large, expensive projects with significant technical challenges to be overcome. Equally, these projects tend have a high profile; any delay or overrun on these projects is likely to be very visible and embarrassing to the MoD.
The inherent difficulties in ensuring that all participants in any collaboration have their interests aligned is widely held to be at the root cause of many problems and, more generally, the view across the MoD and the wider defence industry is that such problems are a characteristic of all collaborative projects to a greater or lesser extent.
It is certainly the case that the divergence between the objectives of the various partners has led to problems on some projects. However, the question of whether the poor reputation of collaborative projects is warranted across the board remains open. This study has not examined the relative performance of collaborative projects in detail; the small sample and the specific issues raised in relation to each project render any such analysis relatively meaningless on a statistical basis.
However, the term ‘collaboration’ describes a concept that actually spans a range of practices. At one extreme, the workshare agreements integral to the development and production of the Typhoon fast jets require very close collaboration between international teams in order to overcome problems of integration – and also entail resolving governance issues between nations. At the other extreme lie projects such as the UK’s participation in the C-17 programme in which the UK purchases a military off-the-shelf (“MOTS”)
84 84
Review of Acquisition
product manufactured primarily for the US DoD and the UK’s support needs are subsumed into the US’s agreement with Boeing. Arrangements in which there are senior and junior partners who determine to a greater or lesser extent the direction of any project may be considered to be somewhere in between these two extremes (e.g., NLAW with Sweden).
A criticism frequently directed at the ‘true’ collaboration of the type entered into on the Typhoon programme is that the approach is focussed on sharing employment and expertise and appears, at least first sight, to be far removed from one which aspires to minimise cost and maximise efficiency and military capability. However, other types of arrangement with the UK as a ‘junior partner’ have also been condemned because they do not provide the UK with enough leverage to influence the direction of a project.
Some of the benefits of collaboration can be achieved without the associated risks by purchasing MOTS equipment. In many instances, this may be an appropriate approach to adopt; indeed a recent review of acquisition practices in Australia33 has determined that it would be beneficial to maximise its MOTS purchases, at the expense of developing its own, bespoke equipment. MOTS purchases are now the “default option” for the Australian armed forces and the benefits of customised developments over MOTS equipment must be demonstrated through a clear business case before any alternative paths – whether independent or collaborative – can be considered (see Chapter �10 for further detail on other nations’ efforts to seek better value from their military acquisitions).
5.8. Industry perspectives
• Industry recognises the need for a strategic review of defence, with a desire for decisions to be made so that clarity and certainty can be reinforced in the acquisition process.
• However, concerns were raised that a strategic defence review may lead to a significant and permanent reduction in UK defence industrial capability.
• Broadly, industry welcomed the original DIS but commonly felt it was not properly funded and so has not made as much progress as would be liked (except possibly in marine). However, there is no real support for an update to the DIS (or DIS v2).
• Furthermore exportability of equipment made on a bespoke basis for the UK MoD was a key concern.
33 Defence Procurement and Sustainment Review, D. Mortimer (Sep 2008)
85 85 Review of Acquisition
5.9. Conclusions and recommendations
5.9.1. Key observations
• The current UK defence planning framework is seriously in need of updating, in light of the changing environment over the past decade.
• Defence reviews involve difficult and often unpopular choices to be made by government but nonetheless need to be done regularly.
• The UK’s level of ambition around capability is significantly out-of-balance with resources available on any realistic short-, medium- or long-term basis.
• Defence planning has to be conducted in tandem with costing of the options. Historically it has proved too easy to over-commit to capability because the affordability issues only materialise further out.
• Government funding commitments (e.g., 3 year CSR cycles) are too short-term for defence capability strategic planning, although given the current affordability issues with the Equipment Plan, longer term commitments are unlikely to be sanctioned.
• The current system of funding and precise in-year cash targets fail recognise the inherent variability that arises in capital expenditure programmes; this forces value-destroying short-term cash management manipulation to hit targets.
5.9.2. Recommendations
Recommendation 1
Strategic Defence Review to be held in the first session of a new Parliament
a) The requirement for such reviews should be enshrined in statute.
b) The output of the reviews should be fully costed and audited.
c) These costings to include 10 year defence and 20 year equipment budgets.
d) The results of the review, including costings, to be published to Parliament.
e) The PUS, as Accounting Officer, as a key enabler to a realistic defence budget, to be held accountable for overall costings in the strongest possible terms, ideally legally.
86 86
Review of Acquisition
Recommendation 2
A rolling 10 year budget should be agreed for the MoD
a) Budget to be enshrined in law, in line with the French example.
b) To encompass manpower, estates, equipment and support funding.
5.9.3. Commentary
The need for a new SDR has been widely recognised both inside and outside the Department and should be relatively non-controversial. Other measures may see more opposition, but they need to be implemented as a “package” – a theme that recurs throughout these recommendations. Taken together these steps should provide a much better basis for ensuring the MoD acquisition planning and resource allocation is based on up-to-date thinking about threats and capabilities required for the near and longer term.
In order to determine appropriate intervals between SDRs, a process similar to the one used by Boundary Commission could be adopted. The Boundary Commission is mandated by Parliament to undertake a general review of the geographic boundary defining each parliamentary constituency every 8 to 12 years. This interval has been determined in such a way as to ensure that reviews cover two parliaments and give enough time for any recommendations made to be acted upon34.
Furthermore, it should be noted that a new SDR is likely to influence (and be influenced by) the wider framework of Government policy. These include industrial policy, export policy and technology strategy. Consideration of the impacts on these policy areas within the SDR framework needs to be explicit.
In addition, the Review team considers that further emphasis and accountability is required to ensure that the current and future cost implications of defence policy (and subsequent decisions affecting each of the DLoDs) are affordable in the context of the funding realistically available. One mechanism to achieve this is to require the Department's Accounting Officer, the PUS, should explicitly form a reliable view on the long-term affordability of the outcome of future Strategic Defence Reviews. In order to ensure compliance and primacy of this consideration the requirement to form
34 Exact timings of the general reviews are variable. They are based on reviews of the electoral wards used for local elections, which are conducted on a rolling basis. An advisory board of the Boundary Committee recommend when these reviews should commence in order that all wards are re-assessed at the time that the Boundary Commission wants to conduct its general review. Once all of the local reviews are complete, the changes are rolled up and implemented in the parliamentary constituency review. In this way, changes in the demographics of each local ward are also reflected in the national Parliament.
87 87 Review of Acquisition
and express this view should be framed in the strongest possible terms, ideally as a legal requirement to Parliament.
The requirement for costing is particularly important. Defence reviews have traditionally been focused more on cost savings than on cost of future capabilities. They have provided a platform for manpower and infrastructure rationalisation, along with a rationale for cancellation of some current or planned equipment. As noted earlier, the 1998 SDR failed to consider the financial impact of some of its recommendations relating to future capability requirements, even though the near term cost impacts of the review on overall defence expenditure were favourable. Problems with the affordability of today’s equipment plan can, in part, be traced back to that shortcoming.
Recommendation No. 2 goes hand in hand with No. 1 and also dovetails with recommendations that follow on Equipment Plan affordability (see Chapter �6). A credibly costed long-term defence plan deserves a long-term funding commitment from government.
The current EP process lacks credibility in the Treasury. It is tacitly understood that the Plan is trying to cover too many bases in terms of strategic defence capabilities, so is unaffordable over anything other than the very short-term. Figure �6-3 in the next chapter shows this very clearly. Also, Departmental expenditure on equipment is viewed as always understated because of inevitable overruns from technical issues or estimate optimism. Currently from a Treasury perspective, the EP is anything but a stable long-term plan that the Treasury would want to commit to long tem. The Department is seen to be always overcommitted so there must be external control to reign in expenditure every year.
88 88
Review of Acquisition
6. PLANNING DEFENCE CAPABILITY
6.1. Overview
This chapter sets out:
• the process through which forward defence equipment procurement and support expenditure are planned; and
• issues around this process, including the underlying factors driving escalating affordability pressures.
This chapter goes on to make recommendations as to how the problems identified in the planning of procurement and support of defence equipment could be overcome.
6.2. The Planning Round Process
Planning for equipment procurement and support is part of a Department-wide Planning Round (“PR”) process that covers all expenditure categories, over periods ranging from 30 years for equipment, 10 years for support and non-equipment investment and 4 years for manpower and other costs.
The Planning Round is managed by the Defence Resources area in MoD centre with appropriate inputs regarding equipment procurement and support provided by the Head of the Equipment Plan, the Capability Equipment Plan (“CapEP”) department, Centre Resources & Planning and single Service representatives. �Appendix B provides further detail on the how the plans are put together from the components of expenditure across the Department.
Plans are produced annually35. For each planning round a staged approach is used to produce cost projections necessary to enable the Capability Sponsor and Top Level Budget (“TLB”) holders to align planning activities and manage projections to affordable36 levels where necessary.
There are typically 3 key stages37:
• Stage 1: TLB holders evaluate and re-validate plans from the final plans in the prior year and engage in a re-costing of these plans to account for any variances that may have occurred.
• Stage 2: TLB holders seek to align cost projections with their control totals, through internal re-prioritisation and provide proposals for extra funding that cannot be resolved internally to the TLB.
35 Re-planning of the equipment plans is intended to be biennial process, but has fallen into an annual planning cycle with the rest of the Department. See Appendix A for further details 36 Affordable: i.e., within the constraints of the Control Totals set for the year. 37 In PR09 a short stage 0 was introduced to enable the Capability Sponsor and Capability Planning Group stakeholders to update the Master Data Assumption Lists (MDAL) which provide a common basis for stage 1 re-costing
89 89 Review of Acquisition
• Stage 3: The Centre leads a process to “balance the books” through obtaining costed proposals from each TLB (understanding the need for any inter-TLB transfers, in the form of costed savings and enhancement options).
The proposals and projected costings derived from Stage 3 provide the basis for final costing decisions made by the Joint Capabilities Board (“JCB”), the Defence Strategy and Plans Group (“DSPG”), the Defence Board (“DB”) and Ministers.
Once Ministerial endorsement of the programme has been received, final Control Totals are issued to the TLBs and they are then required to submit a final iteration of cost projections for the given planning round.
The entire process typically takes one year to complete. The current planning round PR09 commenced in April 2008 and Control Totals for each TLB were issued in June 2009.
6.3. The Equipment Plan
6.3.1. Overview
The Equipment Plan (“EP”) is the term used to describe the combination of the Equipment Procurement Plan (“EPP”) and the Equipment Support Plan (“ESP”). It forms the single largest block of expenditure within the overall Defence Plan, and CDM acts as the budget holder for in-year expenditure.
6.3.2. Data Sources
In order to gain a comprehensive view of how the EP has developed and what has driven the changes between planning rounds the data held in the PB&F38 accounting system has been interrogated by the Review team with the assistance of the CapEP team. PB&F is used, in part, to support the planning round process. It gives those involved the ability to cost and re-cost plans and submit these costings through budgetary hierarchies in a consistent and controlled process.
Within PB&F there are three planning models:
• the Short Term Plan (“STP”) model which is used to cost TLB plans, including DE&S operating costs, and the non-equipment investment plan (“NEIP”);
• the EPP model used to cost the Equipment Procurement Plan; and
• the ESP model used to cost the equipment support resources.
38 Planning Budgeting and Forecasting

90 90
Review of Acquisition
Within the PB&F structure, individual cost lines for projects or parts of projects are given unique accounting codes, these are referred to within the MoD as “P9 lines”. This allows linkage of the same activities across planning rounds or aggregation of expenditure into projects, programmes, DE&S clusters or the Capability Sponsor’s Capability Areas.
The Review team has conducted an analysis of the historical EP using data from old planning rounds. It should be noted that four years of historical data were considered for the EPP, but only two years for the ESP because it was not prepared in a comparable format prior to 2007/08.
Due to delays in the latest Planning Round process, the final EPP was not available to the Review team at the time of writing39. Work has been based on the latest version available which incorporates the impact of the Equipment Exam, the options taken during the planning round, and a number of “manual adjustments” reflecting further planning decisions not otherwise incorporated in the plan.
6.3.3. Governance of the EP
The way in which the EP is currently governed is summarised graphically in Figure �6-1.
IAB DCDS (Capability)
DE&S Front Line Commands
Ministers
Defence Board
DG Strategy
Forward Investment Programme
Strategic input on future equipment needs
Suggested EPIndividual
project approvals
Approved plan
� IG/MG approvals process
� Approves projects mindful of programme affordability
Strategic Guidance
Planning for Portfolio of
Projects
Programme and Project Focus
Delivery and Output Focus
Balance of investment guidance
Industry
Other Government Departments
Figure �6-1: Governance of the Equipment Plan
The EP is compiled by the Capability Sponsor (CS) a “purple” (i.e., multi-Service) organisation, led by DCDS(Capability). It is then incorporated by DG Strategy into the overall Defence Programme, which is submitted to the Defence Board for approval on an annual basis.
The IAB approves individual projects in a manner that is “consistent with the Department’s strategic investment plans approved by the Board”.
39 Analysis and reporting finalised during May/June 2009
91 91 Review of Acquisition
Ministers are subject to influence from other Government Departments and industry, who also have input into DE&S (through the CoMs) and FLCs.
6.4. Equipment Procurement Plan (EPP)
6.4.1. Formulation of the EPP
The EPP is the forward plan for equipment procurement, consisting mostly of capital expenditure (CDEL) along with other resource expenditure that is not capitalised40. It is compiled annually in line with planning round guidelines by the Capability Sponsor (CS) and the Heads of Capability (HoCs) who take responsibility for their respective areas of oversight.
The objectives of the EPP are:
• to create a balanced and coherent programme that is affordable within the Comprehensive Spending Review (“CSR”) settlements for the Department; and
• to set firm control totals (“CTs”) as a basis for two years of in-year management and indicative CTs for future years.
Spending on each project is subject to considerable uncertainty, and the forecast expenditure profiles held in the EPP are set to the 50th percentile estimate of costs. These are the values which are considered just as likely to be over-estimates as they are under-estimates. Business cases submitted to the Investment Approvals Board ("IAB") usually include an explicit assessment of the uncertainty around project costs by presenting values such as '10%' and '90%' estimates - the estimated costs that will not be exceeded with a 10% or 90% probability, respectively.
When project business cases are approved, the IAB authorises 'not to exceed' ("NTE") values, which correspond to the amount of money that the Department is permitted to spend on the project without having to obtain any further IAB approval. Historically, NTE values varied between the 'most likely' cost and a level around the 75% probability estimate, depending on the type of case. In early 2008, however, the process was standardised and the 'most likely' cost is now adopted as the NTE in all but the most exceptional cases.
The annual Major Project Reports ("MPRs") publish NTE41 values as the costs that are approved at Main Gate. Variance data in the MPR are also presented relative to NTE values, though Risk Differentials are also reported explicitly. In this report, all variances are considered relative to the 'most likely' estimates.
40 Projects in the initial stages of development (CA in the CADMID cycle) typically cannot capitalise expenditure. 41 Where a 'Not to Exceed' parameter is greater than 50% it should represent the worst case scenario should all foreseen risks arise; this can be referred to as the project's Risk Differential, i.e., amount of risk that is allowed for in the approval.'
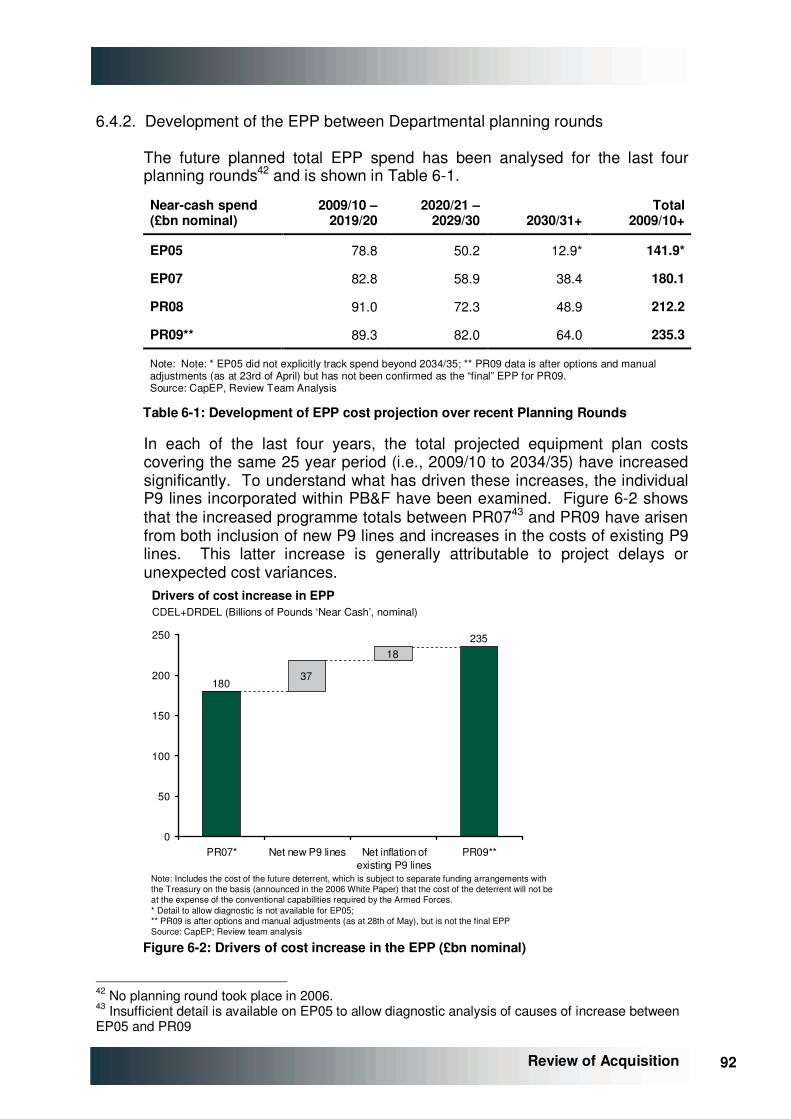
92 92
Review of Acquisition
6.4.2. Development of the EPP between Departmental planning rounds
The future planned total EPP spend has been analysed for the last four planning rounds42 and is shown in Table �6-1.
Near-cash spend (£bn nominal)
2009/10 – 2019/20
2020/21 – 2029/30 2030/31+
Total 2009/10+
EP05 78.8 50.2 12.9* 141.9*
EP07 82.8 58.9 38.4 180.1
PR08 91.0 72.3 48.9 212.2
PR09** 89.3 82.0 64.0 235.3
Note: Note: * EP05 did not explicitly track spend beyond 2034/35; ** PR09 data is after options and manual adjustments (as at 23rd of April) but has not been confirmed as the “final” EPP for PR09. Source: CapEP, Review Team Analysis
Table �6-1: Development of EPP cost projection over recent Planning Rounds
In each of the last four years, the total projected equipment plan costs covering the same 25 year period (i.e., 2009/10 to 2034/35) have increased significantly. To understand what has driven these increases, the individual P9 lines incorporated within PB&F have been examined. Figure �6-2 shows that the increased programme totals between PR0743 and PR09 have arisen from both inclusion of new P9 lines and increases in the costs of existing P9 lines. This latter increase is generally attributable to project delays or unexpected cost variances.
Note: Includes the cost of the future deterrent, which is subject to separate funding arrangements with the Treasury on the basis (announced in the 2006 White Paper) that the cost of the deterrent will not be at the expense of the conventional capabilities required by the Armed Forces.* Detail to allow diagnostic is not available for EP05;** PR09 is after options and manual adjustments (as at 28th of May), but is not the final EPPSource: CapEP; Review team analysis
Drivers of cost increase in EPP
0
50
100
150
200
250
PR07* Net new P9 lines Net inflation ofexisting P9 lines
PR09**
CDEL+DRDEL (Billions of Pounds ‘Near Cash’, nominal)
180
23518
37
Figure �6-2: Drivers of cost increase in the EPP (£bn nominal)
42 No planning round took place in 2006. 43 Insufficient detail is available on EP05 to allow diagnostic analysis of causes of increase between EP05 and PR09
93 93 Review of Acquisition
Across the two year period from PR07 to PR09, the average annual rate of addition to the EPP (to its stage 3b iteration) from new P9 lines44 is £19bn, and a further £9bn p.a. is added from net increases to the cost of projects already in the EPP.
The creation of a “new” P9 line does not always correspond to funding that has been added into the equipment plan, as individual projects do not necessarily map exactly onto P9 lines consistently over time. Existing P9 lines are frequently merged together or split apart, making detailed analysis of evolving spending plans and commitments very difficult.
Because of the way in which funding lines are managed, it is therefore possible for apparently ‘new’ funding to have previously been recognised in the plan under a different a different P9 code. This issue is particularly problematic with equipment in the complex weapons area, where additional phases of existing / legacy projects are introduced as new P9 lines, despite the fact that some of the associated spend was accounted for within existing projects45. There is no simple way to audit the way in which project funding is transferred between P9 lines on a year to year basis.
Table �6-2 identifies a number of P9 lines that are known to correspond to major new projects which have been added to the EPP since PR07.
New P9 line added Description
Successor Platform (P900455000)
Next generation of nuclear deterrent submarine
Application and infrastructure development (P900493000)
Future Business Group funding for ISS (of which 99% beyond 10 years)
New generation nuclear propulsion plant (P900459000)
Successor platform nuclear propulsion plant
Command and control (P900456000)
Successor platform command and control system
Core production capability (New core factory) (P900458000)
Regeneration of the Submarine Nuclear Core Manufacturing Capability
Note: Values shown are after options and manual adjustments (as at 28th May), but are not necessarily the final EPP Source: CapEP, Review team analysis
Table �6-2: Key projects added since PR07
Similar problems are encountered with the analysis of cost growth on existing P9 lines. It is not possible to identify what has driven cost growth on existing P9 lines; in some instances, growth is directly related to cost overruns on the associated projects; in others, cost growth is driven by the
44 Net of deleted P9 lines. 45 Specifically, a number of Complex Weapons projects (including the 100kg Family and the 50kg Family Surface Attack, the CAMM Family of air defence missiles, the Hellfire Replacement and the Watchkeeper Training & Technology Insert) have been introduced to the EPP as distinct P9 lines since EP07. Some funding for each of these projects was previously included on other P9 lines, but it is not possible to ascertain by how much.
94 94
Review of Acquisition
inclusion of funding for replacement equipment or other future capability enhancements that were not previously included. The Review team has identified a subset of the P9 lines that have significantly increased their net costs from 2009/10 onwards between PR07 and stage 3b of PR09 (without regard for the cause of the increase). These include:
• Maritime underwater future capability (P900020100)
• Support vehicles46 (SV) (P900130300) • “Specialist” (P900041200) – CISR equipment for special forces
• Future surface combatant (P900005700) • MASC (P900050500)
• Future aircraft carrier (CVF) (P900007200)
• Future rapid effect system (FRES) (P900025900)
Recent EPP annual expenditures have been running at levels just under £6bn per annum. Clearly, adding over £25bn to the plan per year on any sustained basis will extend the time required to complete work significantly, assuming an expenditure cap of the order of £6bn p.a. going forward.
6.4.3. “Bow wave” and recent affordability issues
Figure �6-3 shows the projected total spend to 2024/25 for each of the last four planning rounds, as well as showing the actual47 spend in-year.
0
2
4
6
8
10
C DEL + Direct R DEL (Billions of Pounds “Near Cash”)
Total Equipment Procurement costs
Actual EPP spend*
EP05
EP08
EP07
PR09**
16/1714/15 18/19 20/21 22/23 24/2510/1102/03 04/05 06/07 08/09* 12/13Note: Includes the cost of the future deterrent, which is subject to separate funding arrangements with the Treasury on the basis (announced in the2006 White Paper) that the cost of the deterrent will not be at the expense of the conventional capabilities required by the Armed Forces;* Actual EPP spend not tracked accurately since the formation of DE&S, so control totals are shown instead for 07/08, 08/09 and 09/10;** PR09 is after options and manual adjustments (as at 23rd of April), but is not the final EPPSource: CapEP
Figure �6-3: Total Equipment Procurement Plan costs over time
46 Cost growth has been primarily driven by SV replacement 47 Since the formation of DE&S, outturn spend on EPP procurement is no longer tracked explicitly; it is only possible to determine the total EP spend. Various methods of estimation are possible, but results appear unreliable, so control total targets have been shown for 2007/08 and 08/09 as a proxy for actual spend.
95 95 Review of Acquisition
A pattern is evident in each planning round which shows a large forecast increase during the immediate future years (namely the first 10 years) before falling back, creating a “bow wave” effect, the steepness of which has been increasing over time48.
The level of difficulty in dealing with short to medium term affordability is illustrated by recent interventions in the process. These include:
• Move to Annual Planning Rounds. Since 2004/05 the PR process for the EPP was intended to be biennial, but the extent of annual drift is such that it has been done annually since 2007
• Commitment Control Regime (CCR); this an extra level of approval which ensures that new commitments are further reviewed prior to obligations being entered into
• Equipment Examination: An equipment examination was also undertaken during PR09 to relieve pressure and reprioritising spending. The consequences were announced in December 2008 and incorporate some significant changes in priorities for equipment procurement, including:
− a commitment to deliver the Warrior Capability Sustainment as quickly as possible;
− a decision to delay to FRES Utility Vehicle so as to ensure more rapid entry into service of the FRES Scout;
− engine upgrade for 12 Lynx Mk9 helicopters to increase available helicopter hours49; and
− delay to the in-service date of the Aircraft Carriers50 by 1-2 years, bringing it into line with that of the Joint Combat Aircraft.
6.4.4. Future affordability issues
Moving into 2010/11 the ‘bow wave’ still exists, although appears to be mitigated by c.£900m due to actions taken in PR09, allowing for no further cost increases or slip on projects already in the plan.
Table �6-3 shows the EPP spend in the context of the forecast defence spend.
48 A “fall back” in planned spending in the longer term only appears because no plans have explicitly been included towards the end of the plan yet. Correspondents in the acquisition community believe that this gap will inevitably be filled and that the “bow wave” effect is therefore actually an illusion. 49 Using £70m from the Treasury Reserve. First aircraft to be available by end of 2009 50 Referred to within the Department as CVF
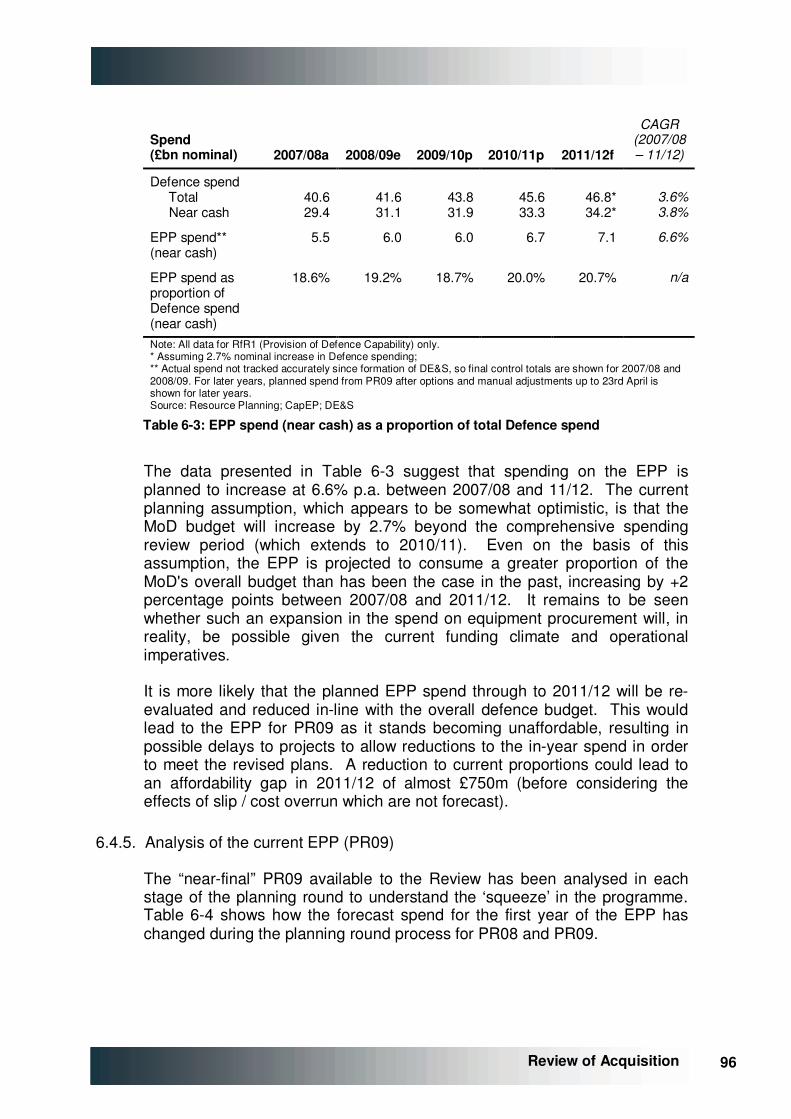
96 96
Review of Acquisition
Spend (£bn nominal) 2007/08a 2008/09e 2009/10p 2010/11p 2011/12f
CAGR (2007/08 – 11/12)
Defence spend Total Near cash
40.6 29.4
41.6 31.1
43.8 31.9
45.6 33.3
46.8* 34.2*
3.6% 3.8%
EPP spend** (near cash)
5.5 6.0 6.0 6.7 7.1 6.6%
EPP spend as proportion of Defence spend (near cash)
18.6% 19.2% 18.7% 20.0% 20.7% n/a
Note: All data for RfR1 (Provision of Defence Capability) only. * Assuming 2.7% nominal increase in Defence spending; ** Actual spend not tracked accurately since formation of DE&S, so final control totals are shown for 2007/08 and 2008/09. For later years, planned spend from PR09 after options and manual adjustments up to 23rd April is shown for later years. Source: Resource Planning; CapEP; DE&S
Table �6-3: EPP spend (near cash) as a proportion of total Defence spend
The data presented in Table �6-3 suggest that spending on the EPP is planned to increase at 6.6% p.a. between 2007/08 and 11/12. The current planning assumption, which appears to be somewhat optimistic, is that the MoD budget will increase by 2.7% beyond the comprehensive spending review period (which extends to 2010/11). Even on the basis of this assumption, the EPP is projected to consume a greater proportion of the MoD's overall budget than has been the case in the past, increasing by +2 percentage points between 2007/08 and 2011/12. It remains to be seen whether such an expansion in the spend on equipment procurement will, in reality, be possible given the current funding climate and operational imperatives.
It is more likely that the planned EPP spend through to 2011/12 will be re-evaluated and reduced in-line with the overall defence budget. This would lead to the EPP for PR09 as it stands becoming unaffordable, resulting in possible delays to projects to allow reductions to the in-year spend in order to meet the revised plans. A reduction to current proportions could lead to an affordability gap in 2011/12 of almost £750m (before considering the effects of slip / cost overrun which are not forecast).
6.4.5. Analysis of the current EPP (PR09)
The “near-final” PR09 available to the Review has been analysed in each stage of the planning round to understand the ‘squeeze’ in the programme. Table �6-4 shows how the forecast spend for the first year of the EPP has changed during the planning round process for PR08 and PR09.
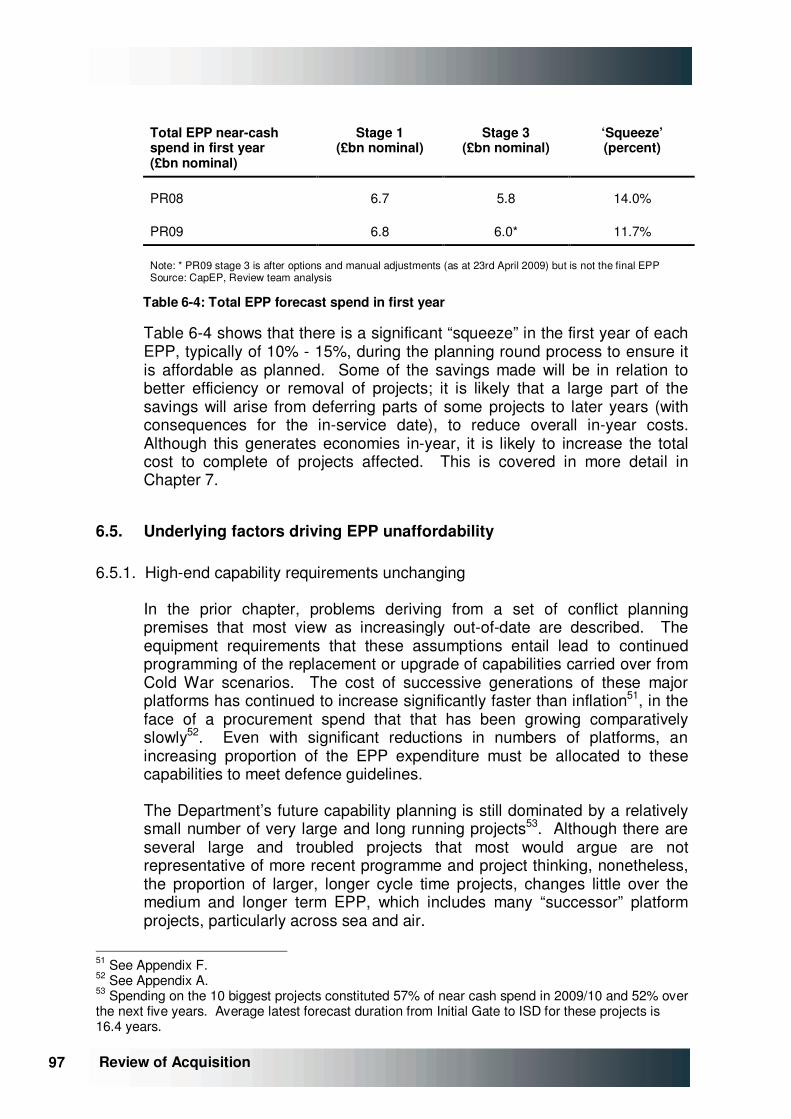
97 97 Review of Acquisition
Total EPP near-cash spend in first year (£bn nominal)
Stage 1 (£bn nominal)
Stage 3 (£bn nominal)
‘Squeeze’ (percent)
PR08 6.7 5.8 14.0%
PR09 6.8 6.0* 11.7%
Note: * PR09 stage 3 is after options and manual adjustments (as at 23rd April 2009) but is not the final EPP Source: CapEP, Review team analysis
Table �6-4: Total EPP forecast spend in first year
Table �6-4 shows that there is a significant “squeeze” in the first year of each EPP, typically of 10% - 15%, during the planning round process to ensure it is affordable as planned. Some of the savings made will be in relation to better efficiency or removal of projects; it is likely that a large part of the savings will arise from deferring parts of some projects to later years (with consequences for the in-service date), to reduce overall in-year costs. Although this generates economies in-year, it is likely to increase the total cost to complete of projects affected. This is covered in more detail in Chapter �7.
6.5. Underlying factors driving EPP unaffordability
6.5.1. High-end capability requirements unchanging
In the prior chapter, problems deriving from a set of conflict planning premises that most view as increasingly out-of-date are described. The equipment requirements that these assumptions entail lead to continued programming of the replacement or upgrade of capabilities carried over from Cold War scenarios. The cost of successive generations of these major platforms has continued to increase significantly faster than inflation51, in the face of a procurement spend that that has been growing comparatively slowly52. Even with significant reductions in numbers of platforms, an increasing proportion of the EPP expenditure must be allocated to these capabilities to meet defence guidelines.
The Department’s future capability planning is still dominated by a relatively small number of very large and long running projects53. Although there are several large and troubled projects that most would argue are not representative of more recent programme and project thinking, nonetheless, the proportion of larger, longer cycle time projects, changes little over the medium and longer term EPP, which includes many “successor” platform projects, particularly across sea and air.
51 See �Appendix F. 52 See �Appendix A. 53 Spending on the 10 biggest projects constituted 57% of near cash spend in 2009/10 and 52% over the next five years. Average latest forecast duration from Initial Gate to ISD for these projects is 16.4 years.
98 98
Review of Acquisition
On top of these ‘legacy’ platform projects, the recognition of the need to equip our forces with the capability to fight the kind of asymmetric battles foreseen in the last strategic defence review twelve years ago means that a series of other projects must also be undertaken. Together, these conflicting requirements result in an overload to the EPP, which is designed to deliver capabilities for at least two very different scenarios without the funding to match.
6.5.2. Single Service optimisation and gaming
Discussions with a wide range of parties within the Department highlighted concerns that competing “single Service agendas” were an important factor in overstretching available resources.
The EPP is compiled by the Capability Sponsor (CS) a “purple” (i.e., multi-Service) organisation, led by DCDS(Capability). As noted in Section �4.5.2, the Capability Sponsor is explicitly responsible for putting together a coherent and affordable plan for pan-Service equipment and support, for the near, medium and longer term.
The EPP is then incorporated by DG Strategy into the Defence Programme to be submitted to the Defence Board for approval on an annual basis. Within this, the single Service chiefs on the Board are pivotal. They are the formal experts on military requirements and capability and they have significant informal power as well. As a result they have close to, if not actual, veto rights. Each of them has strong incentives on two important dimensions:
• first, to get key programmes for their Service into the plan. Once a programme is in the plan it is rarely cancelled even if it is subsequently delayed; and
• second, to overbid for their Service’s share of the plan.
The plan is built up from specific programme areas, overseen by Heads of Capability (HoCs) who are generally drawn from the single Service appropriate for that programme54. There is a strong sense that the HoCs try to achieve the “best”, “most capable” outcome for each of their programmes. This is entirely understandable and laudable. “If people’s lives are at risk we should be trying to get them the most capable equipment” is a common refrain. In addition, while the CS is a “purple” organisation, the single Service HoCs’ future will be determined by their single Service superiors according to single Service criteria. Hence, the EP is being shaped both bottom-up and top-down with single Service agendas front of mind.
Although DCDS (Capability) recommends the programme to the Defence Board, he is not in a position to reconcile the medium to longer term affordability problem (although it is likely that this would be worse without his
54 As at April 2009, 68% of HoCs and above within the Capability Sponsor were drawn from single service backgrounds.
99 99 Review of Acquisition
intervention). He is outranked by all the military members of the Defence Board, including his own single Service chief. His task therefore is to recommend a programme that is acceptable to the Defence Board including each of the single Service chiefs.
Some of the single-Service motivations are entirely good ones; the more spent on a particular Service will deliver a more effective Service better able to meet the demands made upon it. If each Service overbids then the compromise that time finally enforces is almost certain to be better for each Service than where one Service doesn’t overbid but the others do. Here the outcome for the Service that doesn’t overbid is inevitably going to be worse. As a result overbidding is an entirely rational and dominant strategy and the current behaviour is institutionally stable, within the current framework.
Furthermore, it would not matter if more money were allocated to solve affordability problems within the current structure. Each Service would have plenty of additional projects each of which would be shown to deliver “good” incremental outcomes. Each Service would bid for the additional resource and, in combination, would promptly lead once again to an unaffordable programme.
6.5.3. Decision makers and incentives
The requirements community that sponsors projects in front of the IAB comprises a significant component of military personnel54. As discussed, the dynamic of military careers is such that the single Service allegiance (and performance against the needs / desires of the single Service) is of significant importance to career progression.
Although the EPP (and to some extent the ESP) are managed by the Capability Sponsor, it is fundamentally the IAB (and ultimately the DB) who control access to funding at an individual project level for all but the smallest projects. The IAB relies on Service personnel not exercising their single Service agendas in the approval of equipment. However, the DB exercises primacy over the IAB and has a number of characteristics:
• military personnel exercise control, all of whom have the same incentives to deliver capability for their own Service; and
• influence is sufficiently concentrated that each of the Service heads in effect has a veto over the progress of any individual project.
This leads to a situation where mutual benefit appears to be optimised by no veto being exercised (i.e., each Service has all its projects, or at least its key projects, authorised).
6.5.4. Entry-ism
At this point it is also worth noting that there is more than one way to overbid. Whilst programme costs are often genuinely uncertain when they go in the

100 100
Review of Acquisition
plan, nevertheless there is a lot of evidence that they are systematically overbid in two ways:
• first by simply having unrealistically low costs; or
• second, by going in the plan with a simplified capability that is then subsequently enhanced, with implications for total programme costs.
This is the phenomenon widely recognised at the MoD as “entry-ism”. There is undoubtedly considerable risk in up-front estimation for major projects with unproven or undeveloped technologies, but it is in the interests of no one involved in the equipment planning process to adopt a conservative approach to cost or risk identification. As described above, the military stakeholders will have little or no accountability for downstream cost increases, but will be judged on ability to further their single Service objectives. The cycle times for major projects are invariably long enough that given civil service rotation frequency, blame is unlikely to fall on those involved at the outset. Even industry finds it in its best interest to advocate unrealistic costings, until later in the project lifecycle when costs need to be firmed up.
This phenomenon can be observed widely outside defence wherever major, technically challenging infrastructure projects are attempted It is described in a thoughtful research paper by the World Bank on the causes of underestimation or overrun of costs over a wide range of project types and geographies.55 In their words “Understated costs and overstated benefits = project approval”.
The low probability that projects will be cancelled once they have advanced beyond Initial Gate is another important aspect of the acquisition programming that makes entry-ism so ingrained56. By this stage, in addition to the military agenda (which still reflects justification based on Defence policy), it is highly likely constituency politics, BERR, and industry will have been mobilised in support, taking any go/no go decision out of the Department’s sole control.
6.5.5. Equipment specification
The very long cycle times for major equipment procurements encourage maximum technical “stretch” (i.e., big leap development) to try to ensure that a platform or system will be as capable as possible when delivered many years in the future. Technical stretch on major defence equipments has a long and well documented history of correlation with large cost and time overruns. Estimating what the project should cost and how long it should take becomes harder the further it moves from actual experience of similar projects.
55 World Bank Policy Research Working Paper 3781, (Dec 2005) 56 Of the 40 projects that have passed Initial Gate since April 2004 (start of CMIS) only one has been cancelled. Overall, less than 5% of the 165 projects that have been active since 2004 have been cancelled
101 101 Review of Acquisition
In addition to misestimating the “should cost” levels, if the domain experience of customer and supplier are lacking, compared to what might be considered adequate for the technical sophistication of the task, it is likely that project performance will deteriorate further. Issues of project performance are examined in more detail in Chapter �7.
In addition to the risk of overruns in time and cost associated with “big leap” projects, this approach to acquisition also tends to encourage incremental “improvements” to projects that are underway. These arise from a combination of:
• changes or developments in technology, which are very likely over the long cycle time of a major project. To not continuously upgrade the in-progress project risks delivering brand new, but outdated equipment; and
• issues that arise from the interaction of the project with other acquisition activity, such as requirements to retrofit systems to be compatible with other newer capabilities.
There is widespread recognition of this “big leap” problem both within the Department and in other countries’ defence procurement efforts in spite of efforts being to move to more incremental approaches.
Regular and smaller step changes in equipment capability are recognised in the AOF57 as an alternative approach to managing technology development and rapid delivery, but there is limited evidence that such alternative approaches are used to any great extent. Incremental acquisition is recommended for programmes where full funding is not immediately available (or a limited initial delivery is mandated), or where time to delivery is short. Given the nature of the MoD approvals process, and the way in which delays are routinely introduced in order to meet cost and/or performance needs, and that in competition for scare resources in an overheated EP, a promise of a ‘better tomorrow’ is not attractive to the military customer, it would seem that incremental acquisition does not offer many advantages from a programme management point of view under current arrangements. This being the case, project teams have little to gain by promising such an approach.
In a further twist of entry-ism, Service chiefs know that a consequence of the overheated EPP is that, if they do not get approval for the full range of capabilities at the outset, then funding is unlikely to be available for upgrades at a later stage. As a result, sensible developments such as spiral development and technology insertion are heavily discouraged.
Spiral development has been the "preferred" acquisition strategy in the DoD since 200058. The latest defence procurement reforms passed by Congress
57 “Selection of the most appropriate acquisition lifecycle strategy (traditional / incremental / evolutionary / hybrid) is a key factor in determining the long-term success of a military capability and providing the required capability to the user when it is needed” – AOF (Jul 2008) 58 DoD Directive 5000.1, ‘The Defense Acquisition System’ (Oct 2000)
102 102
Review of Acquisition
in May 2009 demand requirements to be structured in a way that will allow for incremental, evolutionary or spiral development. Further to this, the recent Defence acquisition review conducted in Australia by Mortimer59 proposes that “off the shelf” becomes the default option for military equipment purchases.
In a rapidly changing world, greater acquisition agility through reducing acquisition cycle times is critical in delivering greater responsiveness to the needs of the FLCs. It allows for a more flexible equipment programme and more effective exploitation of technological developments.
The need reduce acquisition cycle times has been widely identified over the past ten years. Smart Procurement originally intended to reduce the average cycle time by 30-45% (from over 20 years at the time to 11-14 years). More recently, the Defence Acquisition Change Programme recognised the need to reduce cycle times, although in 2008 the DACP programme board decided not to launch a further top-level change programme to specifically address this objective.
A further concern around equipment specification is lack of consideration of exportability in capability specification. This is often a direct consequence of the Department specifying bespoke or highly-specific equipment which is ideal from its perspective, but is not competitive in the export market. Although downstream exports of capabilities developed for UK use generally do not directly impact the initial cost to the Department, they are a very important component of reducing the cost to the UK of sustaining defence industrial partners, and defraying development costs for new capabilities.
In contrast the French DGA has export as one of its three key objectives (“Missions”). This and international cooperation are explicit political tools for promoting political and industrial interests, as well as practical ways of defraying cost on major projects.
6.5.6. Knock-on impacts to the rest of the EPP
Cost growth associated with underestimating and excessive technical risk is compounded by knock-on impacts to other projects. As costs rise for some projects, or their patterns of expenditure move due to delay, other projects need to be “re-profiled” to keep the programme affordable, at least in the near term. This project shuffling and reprioritisation is almost certainly suboptimal, and additional costs of overhead, working capital and contracting penalties will be incurred in the process. A significant proportion of these costs will find their way into the EPP over time, in the form of modest, but relatively continuous increases in the cost to completion.
Although delay impacts may appear second order, when applied over a significant proportion of the forward EPP over successive years, they will have a growing detrimental impact on near term productive output, as more
59 ‘Going to the next level’, D. Mortimer, (2008)
103 103 Review of Acquisition
and more of the in-year resources are required to cover the overheads and standing costs for delivery capability that is shifted out in time.
6.5.7. Lack of accountability for affordability and financial planning
The current situation of divided and delegated responsibility for the delivery and affordability of the EPP and ESP leads to lack of clarity on accountability for the affordability (and delivery of value for money) from the equipment programme as a whole for years beyond “Year 0” (i.e., the current year).
This results in a situation where the managers of the programme (i.e., the MoD Capability Sponsor) are unable to exercise restraint in curtailing the programme in out years. This leads to unrealistic forecast spending levels being embedded in DE&S and industry thinking at levels lower down the organisation, which are then revised on a year to year basis through the planning round process in order to ensure the Year 0 projection is affordable.
More generally, financial responsibility is dispersed across the Department, being split between DG Strategy (who deals with long-term strategic planning), DG Finance (whose planning horizon is much shorter) and the finance functions that exist within each TLB. The introduction of the dual DG Finance and DG Strategy roles is a recent innovation, which was only introduced in 2008. Previously the plan was submitted to the Defence Board, as part of the wider defence programme, by DG Finance (with an annexe from DCDS(EC), as was)
The separation of long-term planning from more routine, shorter-term budgeting has the potential to strengthen the financial oversight applied to the Equipment Plan and to some extent this may serve to diminish the single-Service pressures that have lead to the generation of such an overheated EP. But since DG Strategy is neither responsible for the EP in the way that DCDS(Cap) is, nor the budget holder who determines where money is actually spent, it seems unlikely that this change will resolve all of the problems that are identified elsewhere in this chapter.
6.6. An accelerating problem without radical and regular pruning
6.6.1. Average delays continue to grow
The behavioural factors described above have been apparent to many inside and outside the Department for some time. Gaming, entry-ism, and technical over-reach extend back over many decades of defence procurement under various equipment acquisition models. These causes of plan overheating and unaffordability have been kept in check by periodic cutbacks in current or planned expenditure through strategic defence reviews or in some cases, drop out of major programmes for other reasons.
The elapsed time since the last defence review is long by historical standards (see Chapter �5). This is consistent with an observed level of

104 104
Review of Acquisition
overheating from behavioural factors which has become extreme. As noted in the analysis of successive EPPs above, the level of annual growth in the forward plan is significantly above the average annual expenditure either historically or prospectively. By definition this means that further delay is inevitable as the peaks are re-profiled to fit the annual expenditure limit. Without significant deletions from the plan, the delivery times of productive output continue to be more and more delayed, as the level of current annual expenditure remains broadly flat.
6.6.2. Delays lead to increased costs
Analysis of time and cost data shows a good correlation between drift in project completion date and upward cost inflation. The causal effects in this relationship are complex and interconnected: cost drift may be driven by technical problems and schedule slip; it may be driven by deliberate re-profiling and with additional costs from standing overheads. Whatever the source, however, the implication of the analysis is that stretching expenditure over longer timeframes is likely to cause the costs to completion to grow, with no additional productive output associated with this extra cost (see Section �7.7).
6.6.3. Accelerating decline of EPP productivity
Slippage in time and cost in the EPP tends to receive most attention when associated with major programme problems. The analysis of a broad range of projects across the EPP highlights, however, a fairly continuous growth in completion time and cost across the program, albeit at a relatively slow rate.
The implications of a modest slippage in time, if allowed to continue year on year, could be very significant on the productivity and cost of productive output from the programme. To illustrate, dynamics of cost and time within the EPP can be simulated using simple mathematical modelling:
• the EPP can be represented by a “stock” of future expenditure aggregated from all the component projects within it;
• in-year expenditure (to meet “control total”) represents an outflow from stock. This level is virtually fixed; and
• additions to the EPP in any year (less any cancellations) are an inflow to stock. These amounts are lumpy, but in the first instance need to average to around the level of outflows or stock will build.
As noted earlier, the EPP “stock” has been growing, and in general, the levels of planned annual expenditure exceed the amount available to spend. Without cancellation of significant expenditure, this situation implies ongoing delay will be required, and the average time to completion will continue to extend.
Taking account of the observation that delay correlates to cost increase, the stock value of unexpended projects will grow year on year simply from delay,

105 105 Review of Acquisition
and all this growth will be cost without any increase in productive output. Even more disturbing is that all this extra unproductive spend (i.e., standing costs from waiting) will need to be covered within the yearly expenditure, before funding for the productive output with which it is associated can be accommodated. The mathematical analysis of this model indicates that as long as there is delay in the programme, this problem of unproductive spend is growing exponentially, and as a consequence the productive output per year is declining at an accelerating rate. �Appendix E reflects the Review team’s further analysis of this issue.
6.6.4. Implications
This “run away” scenario described above will be a consequence of either direct cost increases within the EPP (say from mis-estimation), which can only be accommodated by delay of some elements of EPP spend when real cost levels materialise, or from the delay itself, either unavoidable, or from re-profiling.
In reality, in each planning round, programme costs and available expenditures are brought back into temporary balance either through trimming capability within projects in the plan, or occasionally, through outright cancellation of projects. The current problems in balancing the plan have been made more acute by lack of significant corrective action through cancellation for an extended period, which itself has been a function of the lack of a strategic defence review. The future scenario also looks bleak with EPP planned expenditure significantly in excess of likely affordable levels for at least the next 10 years.
The unaffordability problem with the EPP is driven by deep-rooted causes. Left unchecked by regular or radical pruning, cost and average time to deliver productive output will grow at an exponential rate. At present the system appears to have been broadly accepting of increasing delays as a solution to the problem. This masks the inefficiencies both within the EPP, but also within the Department and the industrial base that are not directly captured in the project costings.
6.7. The Equipment Support Plan (ESP)
The report now turns its attention to the ESP and the factors driving unaffordability within the support programme.
6.7.1. Formulation of the ESP
Since 2008, the Equipment Support Plan has been constructed in a three stage process analogous to that used for the EPP, described in Section �6.260. However, the agencies responsible for the programming differ between in-service and new equipment: the support of new equipment is
60 Prior to PR08, the planning process for equipment support involved a two-step process.
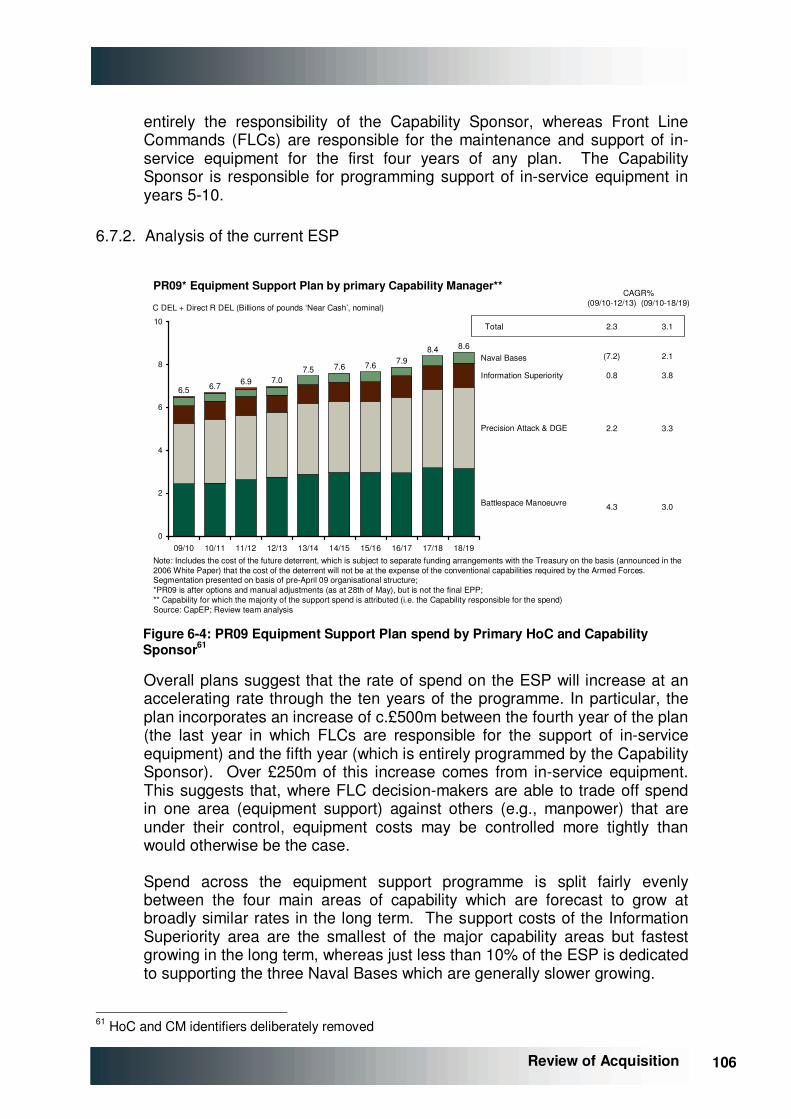
106 106
Review of Acquisition
entirely the responsibility of the Capability Sponsor, whereas Front Line Commands (FLCs) are responsible for the maintenance and support of in-service equipment for the first four years of any plan. The Capability Sponsor is responsible for programming support of in-service equipment in years 5-10.
6.7.2. Analysis of the current ESP
0
2
4
6
8
10
C DEL + Direct R DEL (Billions of pounds ‘Near Cash’, nominal)
Battlespace Manoeuvre
Precision Attack & DGE
Information Superiority
Naval Bases
18/19
8.6
17/18
8.4
16/17
7.9
15/16
7.6
14/15
7.6
13/14
7.5
12/13
7.0
11/12
6.9
10/11
6.7
09/10
6.5
PR09* Equipment Support Plan by primary Capability Manager**
Note: Includes the cost of the future deterrent, which is subject to separate funding arrangements with the Treasury on the basis (announced in the2006 White Paper) that the cost of the deterrent will not be at the expense of the conventional capabilities required by the Armed Forces. Segmentation presented on basis of pre-April 09 organisational structure;*PR09 is after options and manual adjustments (as at 28th of May), but is not the final EPP;** Capability for which the majority of the support spend is attributed (i.e. the Capability responsible for the spend)Source: CapEP; Review team analysis
CAGR%(09/10-12/13) (09/10-18/19)
(7.2) 2.1
4.3 3.0
0.8 3.8
2.2 3.3
2.3 3.1Total
Figure �6-4: PR09 Equipment Support Plan spend by Primary HoC and Capability Sponsor61
Overall plans suggest that the rate of spend on the ESP will increase at an accelerating rate through the ten years of the programme. In particular, the plan incorporates an increase of c.£500m between the fourth year of the plan (the last year in which FLCs are responsible for the support of in-service equipment) and the fifth year (which is entirely programmed by the Capability Sponsor). Over £250m of this increase comes from in-service equipment. This suggests that, where FLC decision-makers are able to trade off spend in one area (equipment support) against others (e.g., manpower) that are under their control, equipment costs may be controlled more tightly than would otherwise be the case.
Spend across the equipment support programme is split fairly evenly between the four main areas of capability which are forecast to grow at broadly similar rates in the long term. The support costs of the Information Superiority area are the smallest of the major capability areas but fastest growing in the long term, whereas just less than 10% of the ESP is dedicated to supporting the three Naval Bases which are generally slower growing.
61 HoC and CM identifiers deliberately removed

107 107 Review of Acquisition
6.7.3. Development of the ESP over time
The first ESP that programmed a full ten years of spend was issued at the end of PR08. As indicated in Table �6-5, the total near-cash spend over the nine years covered in both plans increased by £2.8bn between the end of PR08 and stage 3b of PR09. This c.4% increase is less than the cost growth in the EPP.
PR08 (Final version)
PR09 (Stage 3b –not final ESP)
Total near-cash spend 2009/10-17/18 (£bn)
63.8 66.1
Note: PR09 ESP data is after options and manual adjustments to 28th May, but is not the final ESP Source: CapEP, Review team analysis
Table �6-5: Planned spend in ESPs issued in successive planning rounds
Although efficiency gains (for example those derived from moving up the ‘transformation staircase’ described in Chapter �7) may lead to cost reductions in some areas, these benefits are smaller than increases that arise elsewhere. The underlying causes of the increased cost of delivering the ESP have not been explored by the Review team, although some of the likely contributory factors are discussed in the next section.
The way in which the planned spend has to be ‘squeezed’ through planning rounds is illustrated in Figure �6-5. The data presented there suggest that the amount of resource that is required may, in fact, actually be substantially greater than that which is available: at the end of Stage 1 in PR09, the total required spend on equipment support was almost £70bn.
9
8
7
6
10
0
08 Final**
09 Stage 3b*
09 Stage 2
09 Stage 1
18/1917/1815/1613/1411/122009/10
Development of the PR09 ESPCDEL + DRDEL (Billions of Pounds ‘Near Cash’, nominal)
Note : * After options and manual adjustments (as at 28th May 2009), but not final ESP as stage 3c, which includes application of a “block adjustment” as in PR08, yet to complete** PR08 final subject to unallocated “block adjustment” which forced the ESP to meet Control TotalSource: CapEP
63.8
66.1
69.5
67.3
2009/10 - 2017/18total spend (£bn)
Figure �6-5: Equipment Support Plan spend by stage of planning round.
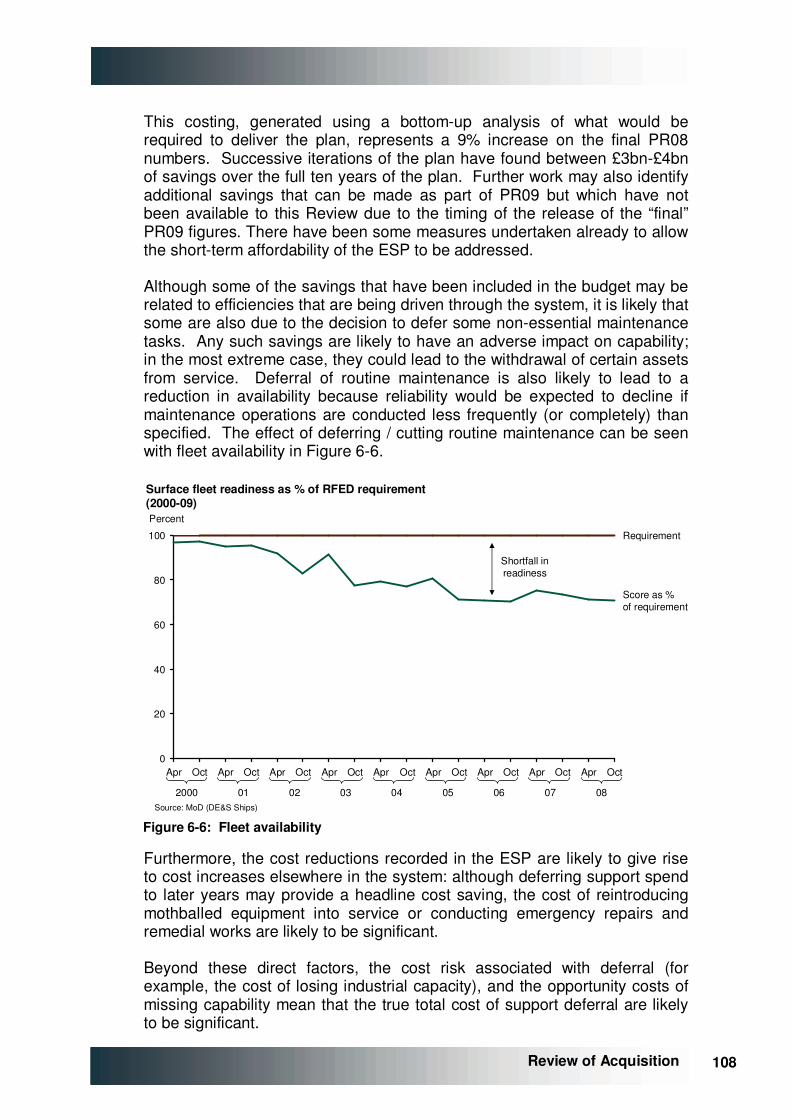
108 108
Review of Acquisition
This costing, generated using a bottom-up analysis of what would be required to deliver the plan, represents a 9% increase on the final PR08 numbers. Successive iterations of the plan have found between £3bn-£4bn of savings over the full ten years of the plan. Further work may also identify additional savings that can be made as part of PR09 but which have not been available to this Review due to the timing of the release of the “final” PR09 figures. There have been some measures undertaken already to allow the short-term affordability of the ESP to be addressed.
Although some of the savings that have been included in the budget may be related to efficiencies that are being driven through the system, it is likely that some are also due to the decision to defer some non-essential maintenance tasks. Any such savings are likely to have an adverse impact on capability; in the most extreme case, they could lead to the withdrawal of certain assets from service. Deferral of routine maintenance is also likely to lead to a reduction in availability because reliability would be expected to decline if maintenance operations are conducted less frequently (or completely) than specified. The effect of deferring / cutting routine maintenance can be seen with fleet availability in Figure �6-6.
0
20
40
60
80
100
Apr Oct Apr Oct Apr Oct Apr Oct Apr Oct Apr Oct Apr Oct Apr Oct Apr Oct
Score as %of requirement
Requirement
Percent
Surface fleet readiness as % of RFED requirement(2000-09)
Source: MoD (DE&S Ships)
Shortfall inreadiness
2000 01 02 03 04 05 06 07 08
Figure �6-6: Fleet availability
Furthermore, the cost reductions recorded in the ESP are likely to give rise to cost increases elsewhere in the system: although deferring support spend to later years may provide a headline cost saving, the cost of reintroducing mothballed equipment into service or conducting emergency repairs and remedial works are likely to be significant.
Beyond these direct factors, the cost risk associated with deferral (for example, the cost of losing industrial capacity), and the opportunity costs of missing capability mean that the true total cost of support deferral are likely to be significant.
109 109 Review of Acquisition
6.8. Factors driving ESP affordability issues
6.8.1. Inability to further rationalise defence requirements
Although significant progress has been made in driving efficiencies from support operations across a relatively wide range of areas, a key driver of support costs is the complexity and range of platforms and equipment that remain in-service. As described before, the lack of clear direction on future capabilities has made it difficult to take decisions to take equipment out-of-service, to scale back infrastructure or rationalise force structure, which would have beneficial knock-on effects on support costs.
6.8.2. Knock-on effects of delay in the EPP
Delays in delivery of new capabilities also means extension of support to older, less reliable equipment, or sometimes extended “double running” periods during the transition. The NAO MPR captures incremental costs of support from delays in bringing new projects on stream, although only in relation to the largest projects. It is likely the effect of delay in the EPP has a systematic and negative impact on support costs, although this is difficult to quantify. This is considered in more detail in Chapter �7.
6.8.3. Overbidding and “silting up” of the ESP
Two behavioural issues were described that contribute to problems in developing an affordable ESP from the bottom-up, both resulting from the incentives placed upon individuals by the ESP management process.
As noted, there has been an ongoing affordability issue with the ESP, which has resulted in a more-or-less across the board reduction in near term available funding. This has then resulted in a process of institutionalised “overbidding” which mirrors the behaviours described in the EPP. In this case, however, there is a tendency to request sufficient funds for a level of equipment availability and maintenance that is supported by “ideal” or recommended requirements for the capability concerned (i.e., as high as can be justified). This is done with the view that after an inevitable blanket reduction in funds, the result should still be sufficient for minimum operational needs and maintenance levels. Although there appears to be a significant affordability issue with ESP, it is by no means clear how big this actually is, given this behaviour, or whether the levels of overbidding or under-resourcing are similar by capability area. The Capability Sponsor, who might be a position to judge this across capability areas have no formal role in trading-off within the ESP over the first four years, so affordability adjustments appear to reduce to a blanket and relatively uniform reduction.
Some discussions also suggested there were “gaming” motivations behind moving support arrangements to long-term availability based contracts. Although these are not “fixed costs” in the sense that they can contractually vary with requirement levels, they are committed to within ranges which are

110 110
Review of Acquisition
perceived to be relatively narrow. When savings need to be delivered across support expenditure, it is easier to cut harder on spend that is outside these arrangements. This movement of significant levels of the ESP toward availability or similar contractual structures is often referred to as the “silting up” of the ESP. This reflects a view that the proportion of the plan that is more easily varied (and hence vulnerable) has been decreasing over time, and affordability concessions are falling on an ever decreasing base of traditional support costs.
6.8.4. Level of management input and scrutiny
As noted, the ESP is programmed by Front Line Command in years 1 – 4 and by the Capability Sponsor thereafter, out to year 10. One of the roles for Programme Boards is to take a more holistic view of support costs associated with capability areas within their remits over the life of existing, replacement and future planned equipment. The emphasis on programming in the near term is to meet operational needs in terms of equipment availability, generally based on historical spend levels required to achieve a given set of outputs. This is overlaid with specific change initiatives for elements of the spend, such as new contracting for availability contracts, which will have received scrutiny to ensure they are value-enhancing as projects.
In the 4 – 10 year planning horizon, the ESP receives only moderate levels of attention from Capability Sponsor. An increasing focus on TLCM and Programme management could change this over time, but it appears that most of the detail of the plan and its drivers are not considered. Assumptions around changes from new equipment or capabilities are factored in, although these are generally viewed as indicative only, unless the support solutions are fully mature.
6.8.5. Implications
The support of existing equipment is a very significant commitment of Department resources, of similar magnitude to the cost of providing new equipment. Major reforms and improvements in efficiency have been delivered and more are planned.
However, under the current arrangements where single Service agendas predominate, the ESP appears to be locked into ‘planning by extrapolation’. There appears to be no formalised process for:
• reviewing drivers of cost within the plan across capabilities to understand how tradeoffs might be made; or
• to identify where support might be rationalised with minimum impact on capability.

111 111 Review of Acquisition
These factors suggest that there is a real danger that the ESP will continue to grow in spite of specific initiatives to cut costs. This will mean that output targets will have to be further reduced or expenditures deferred.
This risks building up an ESP “bow wave” of deferred maintenance spend or risk (along the same lines as deferred project expenditure in the EPP), which will need to be addressed at some point in order to maintain / deliver capability.
In both the EPP and ESP time is being traded off to meet cost constraints, with increases in longer term or shorter term capability risk, respectively.
6.9. Other problems with the current planning and financial control processes
Earlier sections of this report have referred to a number of important issues around the working of the MoD acquisition process and organisation, such as the behavioural biases towards optimism and consistent project performance shortfalls, particularly in timeliness. Wide ranging discussions with stakeholders and others parties with experience or insight have highlighted a number of other issues with the system which, in their view are detrimental to the efficiency and effectiveness of acquisition, and are either not being addressed by current change programmes, or in some cases, are being exacerbated by transformation underway. These are described below.
6.9.1. Departmental planning round process is onerous and fails to deliver a timely, affordable and realistic plan
From a DE&S perspective the planning round process is perceived to be over-extended and enormously intensive of time. By way of example, the current, “accelerated” planning round (PR09) commenced in April 2009 with the intention of concluding after 9 months in December 2009. It has been estimated that c.1,000 man-years of effort are required each year for the annual planning round process within DE&S alone62.
Despite the considerable effort involved, and clear deadlines, the PR cycle invariably results in the production of a late budget for the following year63, resulting in ‘blight’ at the beginning of the financial year. It is also insufficiently developed, resulting in changes to planned spending during the course of the year. This is particularly acute at year end, where the EPP and ESP (via DE&S / CDM) are perceived to be the areas of the Departmental budget most rapidly able to make savings or accelerate spending in order to meet higher level, Departmental Control Totals.
62 Excludes time incurred within the MoD Capability Sponsor and amongst other senior MoD centre personnel 63 the Control Totals for 2009/10 had not been issued 2 months into the financial year
112 112
Review of Acquisition
6.9.2. “Over management” of spend in-year to meet Control Totals
DE&S is financially governed through annual Control Totals on RDEL and CDEL (see �Appendix A for further detail), and the consequences of breaching these at Departmental level are severe. Therefore, appropriately, significant management effort is devoted to meeting these Control Total targets.
However, as issues around underlying affordability increase the challenge of meeting Control Totals, the level of management effort required to manage money “in-year” has increased significantly. Introduction of the commitment control regime (“CCR”) and reduced levels of financial delegation (both to the Department and within the Department) are further evidence of the increasing pressures on near term cash management.
The consequence of this increased management effort is not only evident in demands on management time and accounting resources, but also has potentially damaging consequences for projects, long-term costs and output (see cost and time delays in Chapter �7).
6.9.3. Practical issues around the EPP process
Further to the issues raised with the Departmental Planning Round process, there were a number of further concerns raised around the level of complexity and ultimate value of the equipment procurement planning process as it is currently carried out:
• information is compiled at a very detailed level of disaggregation (cf., c.1,500 Resource Account Codes) which is too granular for sensible scrutiny beyond the first year;
• it is very difficult to generate “what if” scenarios over the medium and longer term, other than via the detailed Options process incorporated in the annual Planning Rounds;
• the process for prioritisation of expenditure, and principles by which expenditure will be prioritised, is not clear (especially beyond the largest projects); and
• the base information is not coded or linked in most useful ways to allow easier analysis of the plan, e.g., − “committed” vs. “uncommitted” expenditure; and
− support and capital for capabilities not clearly linked.
There was also a general feeling, consistent with that regarding the Planning Round process, that the process was so cumbersome and time consuming and the affordability issues so critical, that the EPP had become a year round activity (rather than the originally proposed biennial process) consuming significant departmental resources both in the MoD Capability Sponsor and DE&S.
113 113 Review of Acquisition
6.10. Conclusions and recommendations
6.10.1. Key observations
• The lack of an up-to-date and realistic set of defence planning assumptions has resulted in significant over-programming, with no realistic prospect of delivering the current EPP plan even under optimistic levels of future funding.
• Cutting back programmes could bring the EPP back into balance, but this is likely to be temporary as there are serious and deep-rooted behavioural and organisational issues that will drive again towards un-affordability unless they can be dealt with.
• The combined impact of over-programming and under-costing is an EPP where time to deliver output slips continuously as in-year expenditure is constrained. Time slippage correlates strongly to cost increases, and left unchecked, these unproductive costs of delay will rise at an exponential rate, with productive output moving in the opposite direction.
• There are also enduring affordability pressures within the ESP. There is some relief of cost pressure from ongoing transformation projects (e.g., Contracting for Availability), but the benefits of these are struggling to offset ongoing inflation and other forces at work.
• The process for building up the ESP needs to be done in a way that has clearer information and regular scrutiny across the capability areas to allow more intelligent tradeoffs, and to identify and potentially rationalise very high cost / low effect support expenditures.
• The EP is not currently as useful as it could be as a functional management tool for long-term financial planning because component funding lines do not correspond to individual projects and plans are not comprehensive over its full 30 year span.
6.10.2. Recommendations
Recommendation 3
An Executive Committee of the Defence Board should be formed to be accountable for an affordable Equipment Programme
a) The Committee is charged with creating and managing an affordable Equipment Plan to be submitted to the Defence Board & Ministers.
b) Membership of this Committee to be the PUS (Chair), CDS, DG Finance, 2nd PUS, VCDS and no other. No alternates.
c) DCDS(Capability) to be responsible for drawing together the plan, in consultation with the DG Strategy and the nominated
114 114
Review of Acquisition
representative of the DG Finance.
d) The Committee to meet at least quarterly, and to submit its EP to the Defence Board as part of the annual planning process.
e) The costing of the EP and its affordability against the 10 year defence budget should be the responsibility of the MoD DG Finance.
f) All known liabilities to be included within the costed plan.
g) These costings, and the veracity of the estimates, would be subject to independent audit by a major accounting firm. This audit to be published, with the MoD having to pass a “going concern” test of plan against budget.
h) The Defence Board could only accept or reject the EP proposed by the Committee as a whole. No cherry picking.
i) Ministers, the Services, industry and others would be expected to offer direction or views in the process of the formation of the plan, rather than after its creation, to ensure a balanced and affordable plan was produced.
j) The PUS, as Accounting Officer, would be accountable to Parliament annually for the affordability and accuracy of the plan. The PUS to become the true “owner” of the equipment plan, enabling the PUS sufficient authority.
6.10.3. Practical working of the Executive Committee
The proposed Executive Committee is responsible for delivering an affordable investment programme to the Defence Board through the portfolio management of the Equipment Plan, Figure �6-7 as shows. The IAB continues to approve individual projects and the DCDS(Capability) is responsible for the Equipment Plan.
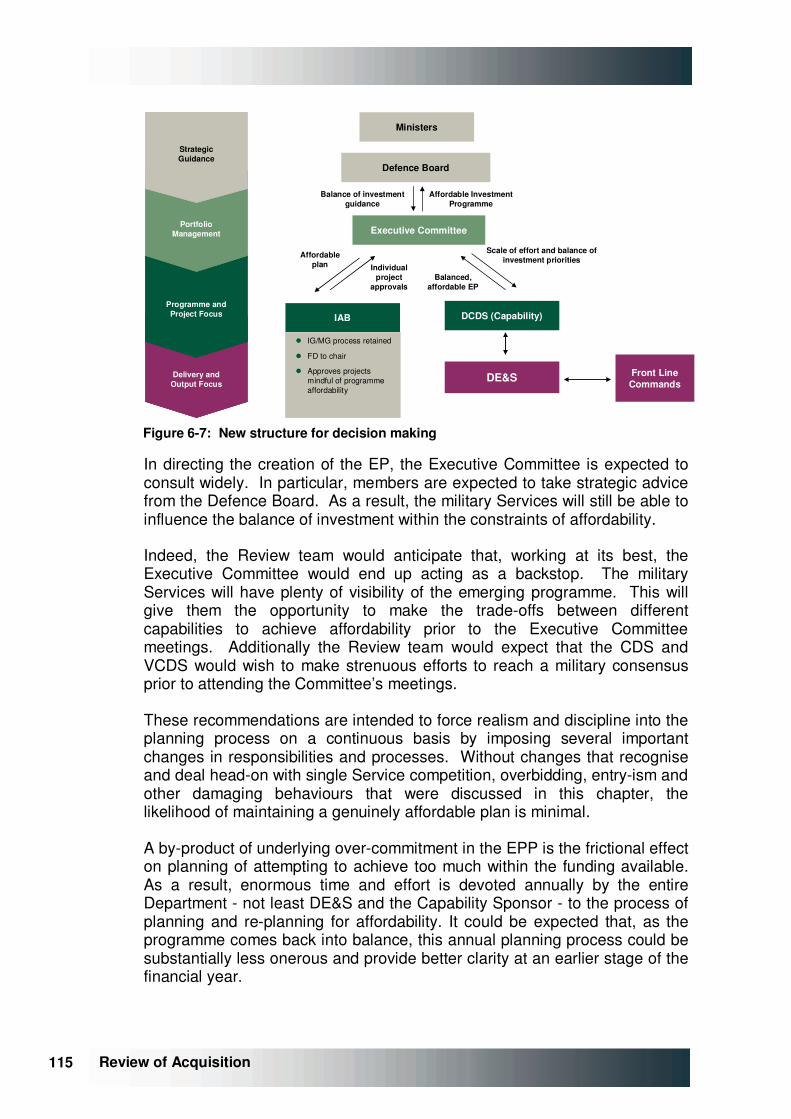
115 115 Review of Acquisition
IAB DCDS (Capability)
DE&S Front Line Commands
Ministers
Defence Board
Executive Committee
Affordable Investment Programme
Scale of effort and balance of investment priorities
Balanced, affordable EP
Individual project
approvals
Affordable plan
� IG/MG process retained
� FD to chair
� Approves projects mindful of programme affordability
Strategic Guidance
Portfolio Management
Programme and Project Focus
Delivery and Output Focus
Balance of investment guidance
Figure �6-7: New structure for decision making
In directing the creation of the EP, the Executive Committee is expected to consult widely. In particular, members are expected to take strategic advice from the Defence Board. As a result, the military Services will still be able to influence the balance of investment within the constraints of affordability.
Indeed, the Review team would anticipate that, working at its best, the Executive Committee would end up acting as a backstop. The military Services will have plenty of visibility of the emerging programme. This will give them the opportunity to make the trade-offs between different capabilities to achieve affordability prior to the Executive Committee meetings. Additionally the Review team would expect that the CDS and VCDS would wish to make strenuous efforts to reach a military consensus prior to attending the Committee’s meetings.
These recommendations are intended to force realism and discipline into the planning process on a continuous basis by imposing several important changes in responsibilities and processes. Without changes that recognise and deal head-on with single Service competition, overbidding, entry-ism and other damaging behaviours that were discussed in this chapter, the likelihood of maintaining a genuinely affordable plan is minimal.
A by-product of underlying over-commitment in the EPP is the frictional effect on planning of attempting to achieve too much within the funding available. As a result, enormous time and effort is devoted annually by the entire Department - not least DE&S and the Capability Sponsor - to the process of planning and re-planning for affordability. It could be expected that, as the programme comes back into balance, this annual planning process could be substantially less onerous and provide better clarity at an earlier stage of the financial year.
116 116
Review of Acquisition
There are probably other structures or arrangements that could accomplish similar effects, but those suggested above fulfil the important following principles:
• single Service gaming or non-cooperation must be curtailed;
• there must be genuine high level responsibility and accountability for programming within the Department’s means;
• costing must be realistic and conservative and externally verified; and
• the Defence Board must still retain its ultimate approving role.

117 117 Review of Acquisition
118 118
Review of Acquisition
7. PERFORMANCE IN DELIVERY OF EQUIPMENT AND SUPPORT
7.1. Overview
The previous chapter identified a range of issues with the planning of defence equipment procurement and support. This chapter considers the performance in delivering equipment procurement and support projects. It sets out:
• project performance data relating to both the Assessment phase (Initial Gate to Main Gate) and the Demonstration/Manufacture phase (post Main Gate);
• factors contributing to time and cost overruns in new equipment procurement;
• potential lessons that can be learnt from UOR procurement;
• equipment support considerations, including progress in contracting for availability, moving up the “Transformation Staircase” and implementing TLCM; and
• progress on efficiency improvements in non-IPT led support provision.
This chapter goes on to make recommendations as to how the issues identified in the performance in delivery of equipment and support could be remedied.
7.2. Analytical approach
In attempting to analyse Departmental performance on the five dimensions outlined Section 7.1, the Review team set out to assemble the widest possible data set to ensure any conclusions were as sound as possible. This work was undertaken with the assistance of the Department, particularly the Corporate Approvals, Performance and Risk (“CAPR”) group within DE&S, who provided many man-hours of assistance in collecting current and historical project information. In addition, Sec(EC) at MoD centre provided the team with access to a range of additional historical information on project approvals and business cases that were not available on more current systems within DE&S.
Performance analysis of the Department’s equipment project portfolio appears to be well-trodden ground, through the NAO Major Project Report completed annually and the CMIS system Key Performance Indicators (“KPIs”) that are regularly reported within the Department. The Review team’s objectives were to draw on both these sources, whilst ensuring that our analysis was based on:
• the broadest possible sample of projects (not just major projects or current projects);
119 119 Review of Acquisition
• cost, time and capability data that captured the “full picture” of these variables, including the impact of capability tradeoffs over the course of projects that may not be reflected in a simple analysis of costs (e.g., reduction in unit numbers or capabilities within a project to contain costs); and
• relatively mature projects, in view of the team’s early observation that cost and time slip in projects almost invariably escalate toward the end, so including immature projects is likely to flatter the performance picture, as these young projects are likely to deteriorate later in life.
Given this approach, our results may diverge from more limit or anecdotal performance measures familiar to the Department, but the Team believes this approach presents the most realistic and robust assessment of performance that could have been assembled within the timescale of the Review.
7.2.1. Sample of projects under analysis
Data on individual project performance has been sourced directly from DE&S’ CMIS system as at February 2009, with support from DE&S’ CAPR team, and supplemented with data from:
• projects tracked through the NAO Major Projects Reports but not present in the CMIS system;
• business cases / review notes / approval notes held by Sec(EC); and
• c.50 interviews with DE&S’ IPTs.
This gives rise to a total sample of projects under consideration of c.170, which is more comprehensive than either those tracked as part of the Departmental Strategic Objective (40 - 50) or those monitored historically by the NAO (i.e., largest 20 post Main Gate projects, 10 pre-Main Gate projects in each year).
As noted, information is generally presented for “mature” projects only (i.e., those where more than 75% of time has elapsed between Main Gate approval and forecast in-service date) and the sample of projects changes between analyses as a consequence of data availability.
Furthermore, comparisons have generally been made using forecasts at the 50% level at Initial Gate, Main Gate and latest forecast.
There are two key phases of the CADMID64 cycle which this Review has considered separately in order to maximise the sample of projects available for analysis (see Figure �7-1):
• 1 – Assessment phase, taken here as the period between Initial Gate and Main Gate approvals
64 Concept, Assessment, Demonstration, Manufacture, In-service, Disposal cycle
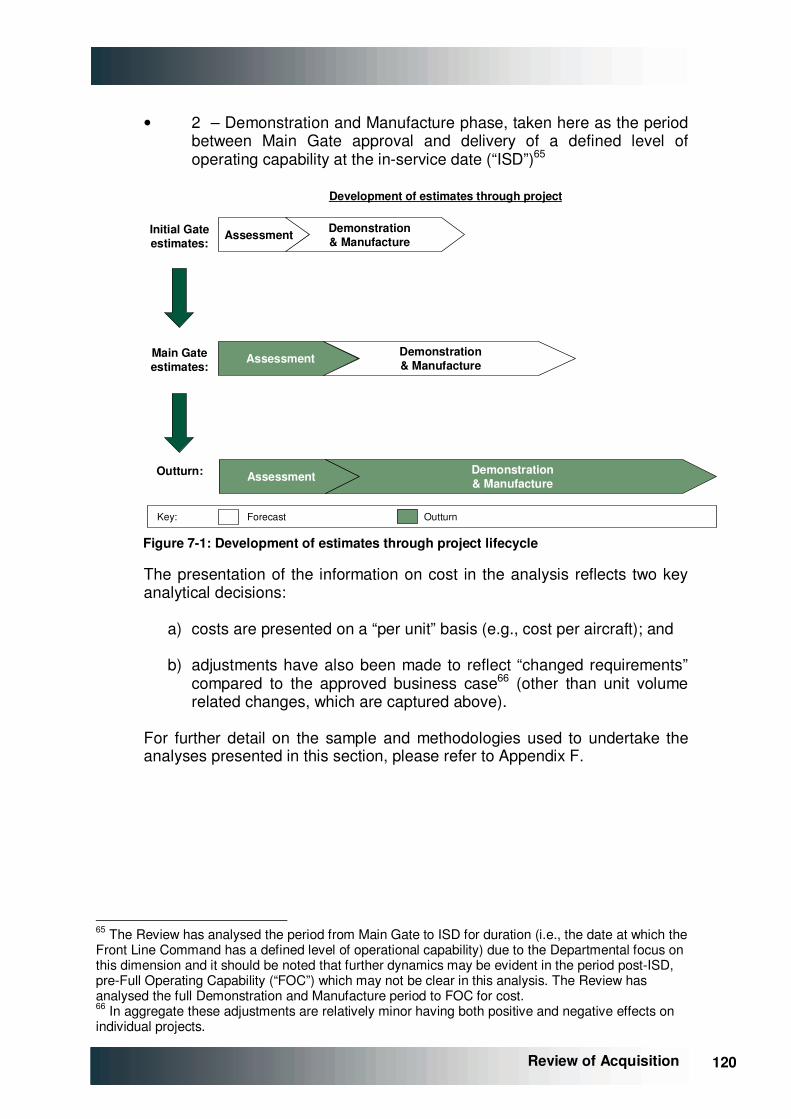
120 120
Review of Acquisition
• 2 – Demonstration and Manufacture phase, taken here as the period between Main Gate approval and delivery of a defined level of operating capability at the in-service date (“ISD”)65
Initial Gateestimates:
Main Gateestimates:
Outturn:
Assessment Demonstration& Manufacture
Assessment Demonstration& Manufacture
Assessment Demonstration& Manufacture
Development of estimates through project
Key: Forecast Outturn Figure �7-1: Development of estimates through project lifecycle
The presentation of the information on cost in the analysis reflects two key analytical decisions:
a) costs are presented on a “per unit” basis (e.g., cost per aircraft); and
b) adjustments have also been made to reflect “changed requirements” compared to the approved business case66 (other than unit volume related changes, which are captured above).
For further detail on the sample and methodologies used to undertake the analyses presented in this section, please refer to �Appendix F.
65 The Review has analysed the period from Main Gate to ISD for duration (i.e., the date at which the Front Line Command has a defined level of operational capability) due to the Departmental focus on this dimension and it should be noted that further dynamics may be evident in the period post-ISD, pre-Full Operating Capability (“FOC”) which may not be clear in this analysis. The Review has analysed the full Demonstration and Manufacture period to FOC for cost. 66 In aggregate these adjustments are relatively minor having both positive and negative effects on individual projects.
121 121 Review of Acquisition
7.3. Performance during the Assessment phase (Initial Gate to Main Gate)
7.3.1. Duration and costs of the Assessment phase
Table �7-1 sets out the findings of the analysis of outturn performance of projects during Assessment phase in terms of cost and time as compared to the estimates made at Initial Gate.
Average duration (months, IG50 - MG50)
Average cost of AP (£m)
Estimate at Initial Gate50 26 39
Straight average increase on a project-by-project basis to Main Gate50
+95% (25 months)
+25% (£10m)
Sample size 42 38
Source: CMIS, Review team analysis
Table �7-1: Assessment phase duration and cost
From the data set out in Table �7-1 it is clear that there is significant delay being incurred during the Assessment phase, 25 months on average (+95% of Initial Gate estimate).
Table �7-1 also demonstrates with regard to the cost of Assessment phase that costs appeared to increase by 25% versus the Initial Gate estimate. It should be remembered that the cost of Assessment phase is generally relatively small in comparison with average whole lifecycle costs.
Analysis suggests that average outturn Assessment phase duration has been decreasing over time, with the average AP duration shown to be less than 2 years for projects that passed Initial Gate since April 2004 (Table �7-2). This does however only include projects that have passed Main Gate, and as a result will exclude some long running projects that are still in AP. As a result the samples are likely to be biased with longer running projects appearing in the older segments.
Initial Gate pre
FY200067 IG date
FY2000 - 04 IG date
FY2005 - 09 All IG dates
Average outturn duration of Assessment phase – (IG50 – MG50)
64 months 40 months 19 months 45 months
Sample size 20 24 10 54
Note: Sample size is larger than in Table �7-1 as includes projects for which there is no IG forecast data Source: CMIS, Review team analysis
Table �7-2: Trend in Assessment phase duration over time 67 Non-Smart projects
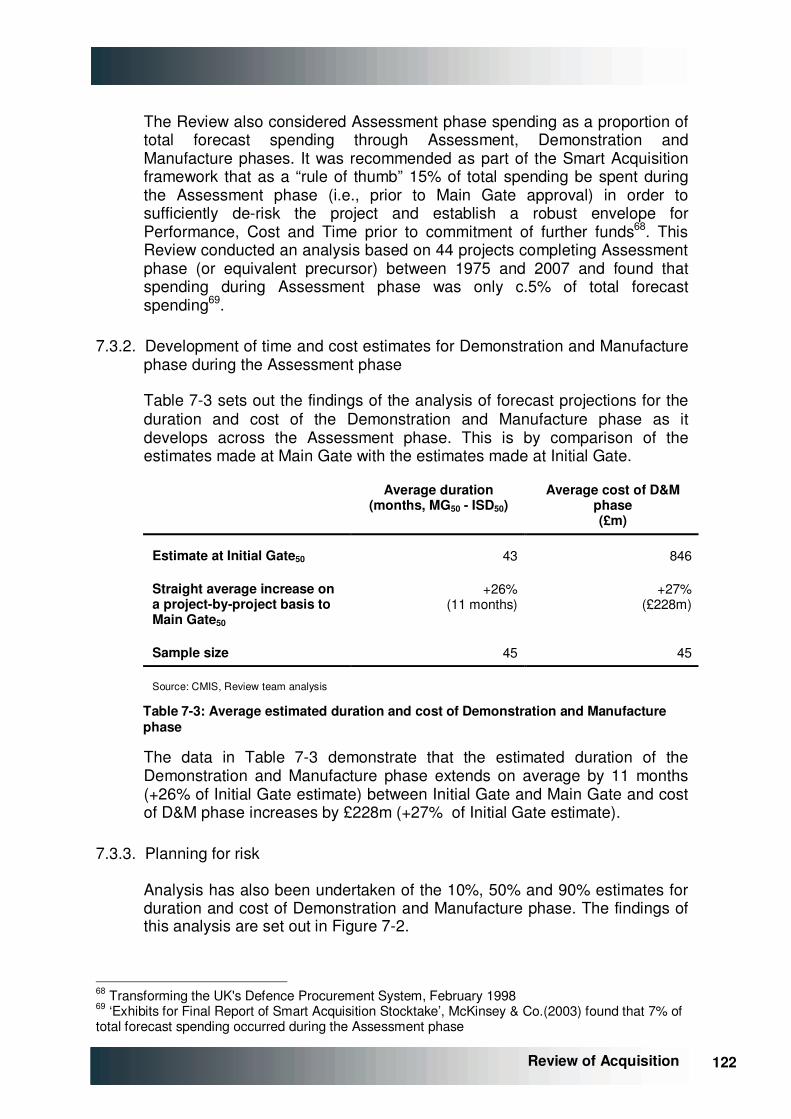
122 122
Review of Acquisition
The Review also considered Assessment phase spending as a proportion of total forecast spending through Assessment, Demonstration and Manufacture phases. It was recommended as part of the Smart Acquisition framework that as a “rule of thumb” 15% of total spending be spent during the Assessment phase (i.e., prior to Main Gate approval) in order to sufficiently de-risk the project and establish a robust envelope for Performance, Cost and Time prior to commitment of further funds68. This Review conducted an analysis based on 44 projects completing Assessment phase (or equivalent precursor) between 1975 and 2007 and found that spending during Assessment phase was only c.5% of total forecast spending69.
7.3.2. Development of time and cost estimates for Demonstration and Manufacture phase during the Assessment phase
Table �7-3 sets out the findings of the analysis of forecast projections for the duration and cost of the Demonstration and Manufacture phase as it develops across the Assessment phase. This is by comparison of the estimates made at Main Gate with the estimates made at Initial Gate.
Average duration (months, MG50 - ISD50)
Average cost of D&M phase (£m)
Estimate at Initial Gate50 43 846
Straight average increase on a project-by-project basis to Main Gate50
+26% (11 months)
+27% (£228m)
Sample size 45 45
Source: CMIS, Review team analysis
Table �7-3: Average estimated duration and cost of Demonstration and Manufacture phase
The data in Table �7-3 demonstrate that the estimated duration of the Demonstration and Manufacture phase extends on average by 11 months (+26% of Initial Gate estimate) between Initial Gate and Main Gate and cost of D&M phase increases by £228m (+27% of Initial Gate estimate).
7.3.3. Planning for risk
Analysis has also been undertaken of the 10%, 50% and 90% estimates for duration and cost of Demonstration and Manufacture phase. The findings of this analysis are set out in Figure �7-2.
68 Transforming the UK's Defence Procurement System, February 1998 69 ‘Exhibits for Final Report of Smart Acquisition Stocktake’, McKinsey & Co.(2003) found that 7% of total forecast spending occurred during the Assessment phase
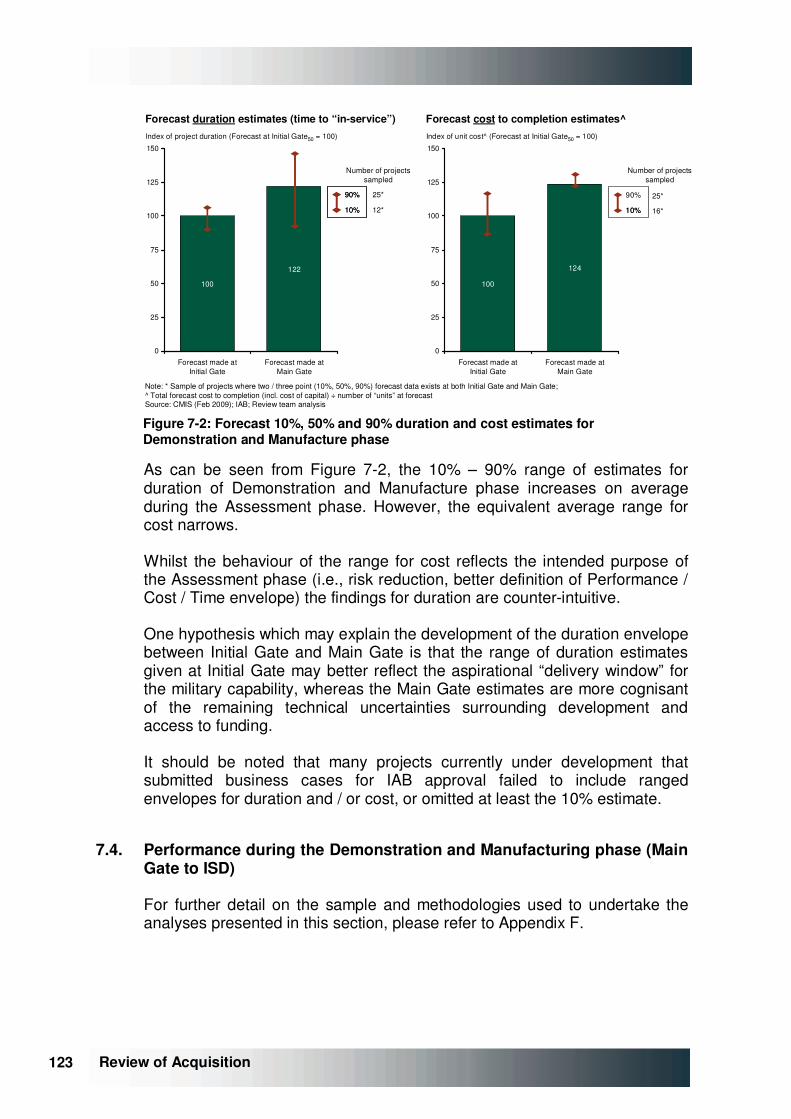
123 123 Review of Acquisition
Note: * Sample of projects where two / three point (10%, 50%, 90%) forecast data exists at both Initial Gate and Main Gate; ^ Total forecast cost to completion (incl. cost of capital) ÷ number of “units” at forecastSource: CMIS (Feb 2009); IAB; Review team analysis
Forecast cost to completion estimates^Forecast duration estimates (time to “in-service”)
0
25
50
75
100
125
150
124
100
Forecast made atInitial Gate
Forecast made at Main Gate
Index of unit cost^ (Forecast at Initial Gate50 = 100)
0
25
50
75
100
125
150
122
100
Forecast made atInitial Gate
Forecast made at Main Gate
Index of project duration (Forecast at Initial Gate50 = 100)
90%
10%
90%
10%
90%
10% 16*10%
25*
12*
25*
Number of projectssampled
Number of projectssampled
Figure �7-2: Forecast 10%, 50% and 90% duration and cost estimates for Demonstration and Manufacture phase
As can be seen from Figure �7-2, the 10% – 90% range of estimates for duration of Demonstration and Manufacture phase increases on average during the Assessment phase. However, the equivalent average range for cost narrows.
Whilst the behaviour of the range for cost reflects the intended purpose of the Assessment phase (i.e., risk reduction, better definition of Performance / Cost / Time envelope) the findings for duration are counter-intuitive.
One hypothesis which may explain the development of the duration envelope between Initial Gate and Main Gate is that the range of duration estimates given at Initial Gate may better reflect the aspirational “delivery window” for the military capability, whereas the Main Gate estimates are more cognisant of the remaining technical uncertainties surrounding development and access to funding.
It should be noted that many projects currently under development that submitted business cases for IAB approval failed to include ranged envelopes for duration and / or cost, or omitted at least the 10% estimate.
7.4. Performance during the Demonstration and Manufacturing phase (Main Gate to ISD)
For further detail on the sample and methodologies used to undertake the analyses presented in this section, please refer to �Appendix F.
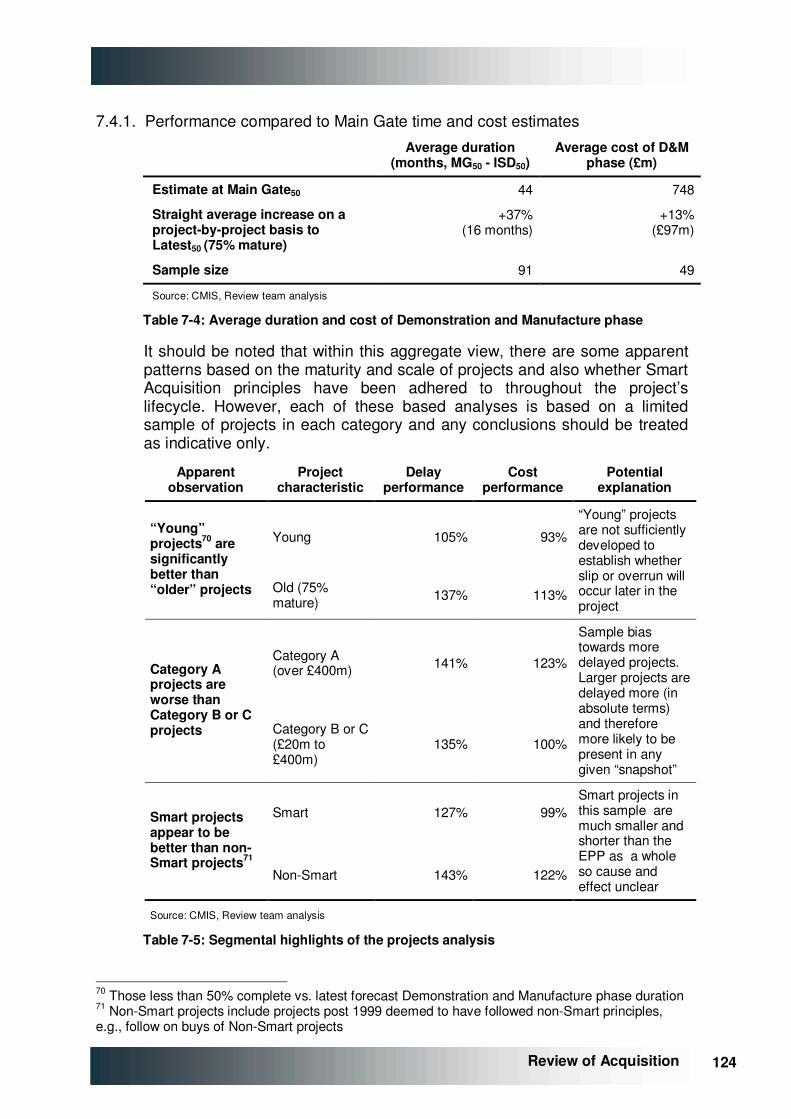
124 124
Review of Acquisition
7.4.1. Performance compared to Main Gate time and cost estimates
Average duration (months, MG50 - ISD50)
Average cost of D&M phase (£m)
Estimate at Main Gate50 44 748
Straight average increase on a project-by-project basis to Latest50 (75% mature)
+37% (16 months)
+13% (£97m)
Sample size 91 49
Source: CMIS, Review team analysis
Table �7-4: Average duration and cost of Demonstration and Manufacture phase
It should be noted that within this aggregate view, there are some apparent patterns based on the maturity and scale of projects and also whether Smart Acquisition principles have been adhered to throughout the project’s lifecycle. However, each of these based analyses is based on a limited sample of projects in each category and any conclusions should be treated as indicative only.
Apparent observation
Project characteristic
Delay performance
Cost performance
Potential explanation
Young 105% 93% “Young” projects70 are significantly better than “older” projects Old (75%
mature) 137% 113%
“Young” projects are not sufficiently developed to establish whether slip or overrun will occur later in the project
Category A (over £400m) 141% 123% Category A
projects are worse than Category B or C projects Category B or C
(£20m to £400m)
135% 100%
Sample bias towards more delayed projects. Larger projects are delayed more (in absolute terms) and therefore more likely to be present in any given “snapshot”
Smart 127% 99% Smart projects appear to be better than non-Smart projects71
Non-Smart 143% 122%
Smart projects in this sample are much smaller and shorter than the EPP as a whole so cause and effect unclear
Source: CMIS, Review team analysis
Table �7-5: Segmental highlights of the projects analysis
70 Those less than 50% complete vs. latest forecast Demonstration and Manufacture phase duration 71 Non-Smart projects include projects post 1999 deemed to have followed non-Smart principles, e.g., follow on buys of Non-Smart projects
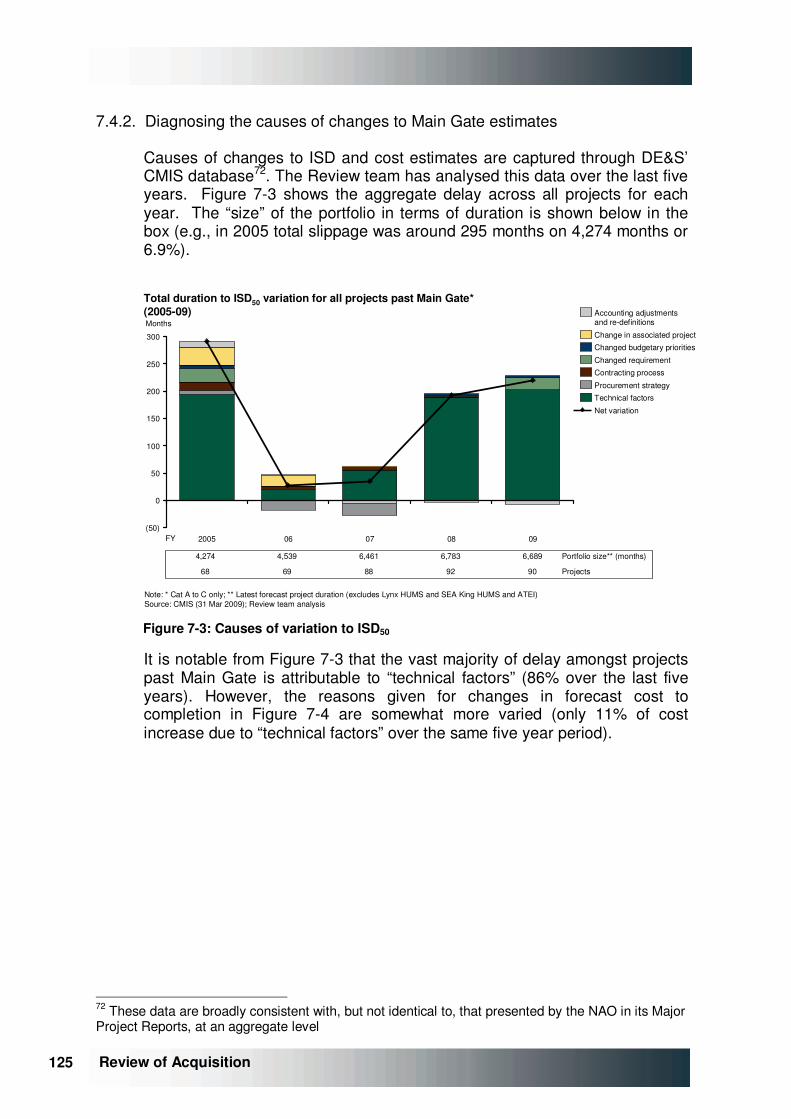
125 125 Review of Acquisition
7.4.2. Diagnosing the causes of changes to Main Gate estimates
Causes of changes to ISD and cost estimates are captured through DE&S’ CMIS database72. The Review team has analysed this data over the last five years. Figure �7-3 shows the aggregate delay across all projects for each year. The “size” of the portfolio in terms of duration is shown below in the box (e.g., in 2005 total slippage was around 295 months on 4,274 months or 6.9%).
2005 06 07 08 09
Accounting adjustments and re-definitions
Change in associated project
Contracting process
Procurement strategy
Technical factors
Net variation
0
100
Changed requirement
150
200
250
300
50
Months
(50)
Changed budgetary priorities
FY
Total duration to ISD50 variation for all projects past Main Gate*(2005-09)
Note: * Cat A to C only; ** Latest forecast project duration (excludes Lynx HUMS and SEA King HUMS and ATEI)Source: CMIS (31 Mar 2009); Review team analysis
Portfolio size** (months)4,274 4,539 6,461 6,783 6,689
68 69 88 92 90 Projects
Figure �7-3: Causes of variation to ISD50
It is notable from Figure �7-3 that the vast majority of delay amongst projects past Main Gate is attributable to “technical factors” (86% over the last five years). However, the reasons given for changes in forecast cost to completion in Figure �7-4 are somewhat more varied (only 11% of cost increase due to “technical factors” over the same five year period).
72 These data are broadly consistent with, but not identical to, that presented by the NAO in its Major Project Reports, at an aggregate level
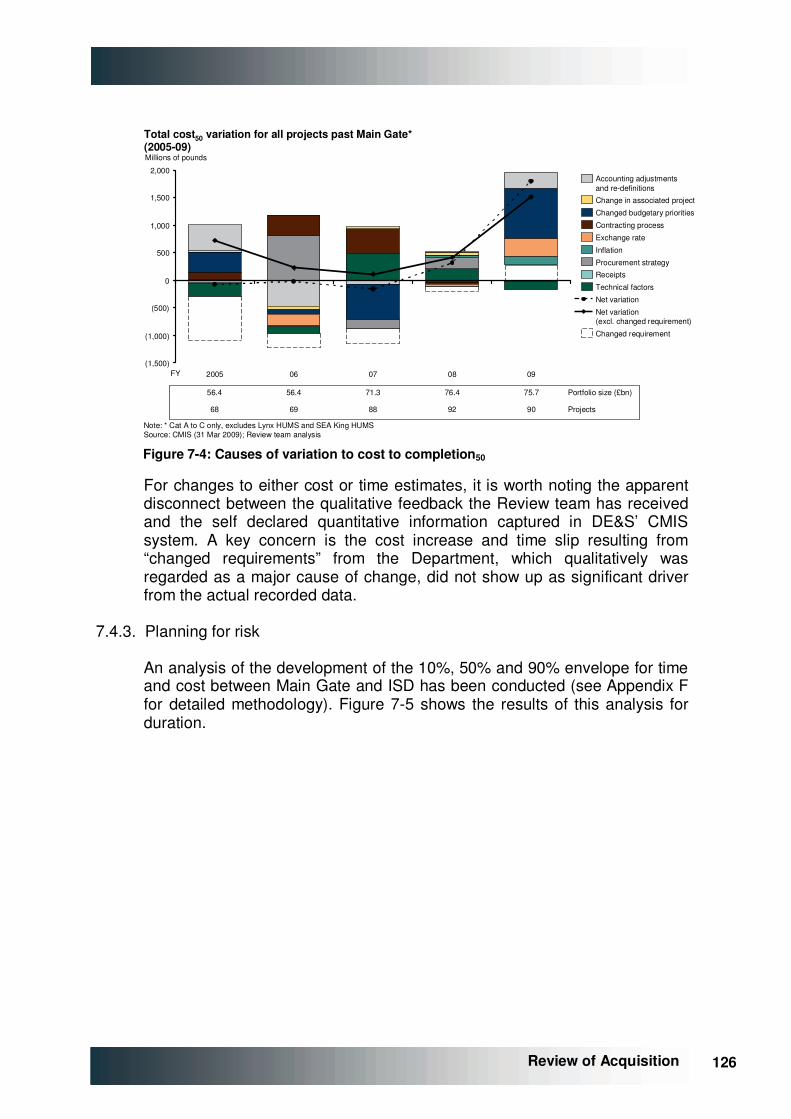
126 126
Review of Acquisition
2,000Accounting adjustments and re-definitions
Change in associated project
Changed budgetary priorities
Contracting process
Exchange rate
Inflation
Procurement strategy
Receipts
Technical factors
Net variation
Net variation(excl. changed requirement)
Changed requirement
0
1,000
1,500
500
(1,000)
(1,500)
(500)
2005 06 07 08 09
Millions of pounds
FY
Total cost50 variation for all projects past Main Gate*(2005-09)
Note: * Cat A to C only, excludes Lynx HUMS and SEA King HUMSSource: CMIS (31 Mar 2009); Review team analysis
Portfolio size (£bn)56.4 56.4 71.3 76.4 75.7
68 69 88 92 90 Projects
Figure �7-4: Causes of variation to cost to completion50
For changes to either cost or time estimates, it is worth noting the apparent disconnect between the qualitative feedback the Review team has received and the self declared quantitative information captured in DE&S’ CMIS system. A key concern is the cost increase and time slip resulting from “changed requirements” from the Department, which qualitatively was regarded as a major cause of change, did not show up as significant driver from the actual recorded data.
7.4.3. Planning for risk
An analysis of the development of the 10%, 50% and 90% envelope for time and cost between Main Gate and ISD has been conducted (see �Appendix F for detailed methodology). Figure �7-5 shows the results of this analysis for duration.

127 127 Review of Acquisition
70
80
90
100
110
120
130
140
150
0 20 40 60 80 100
Average inflation of forecast duration between MG and ISD*Duration Index (MG50=100)
* Only for those 23 projects that whose latest ISD forecast is before the date of latest forecast (2/2/2009) and the first forecast was made within 40% of the time between MG and ISDSource: CMIS (Feb 2009); Review team analysis
10% risk
50% risk
90% risk
Proportion complete (from MG relative to ISD)
0
Unclear as to why risk envelope does not
collapse to zero at ISD
23*Total9C8B6A
nCategory
23*Total9C8B6A
nCategory
Figure �7-5: Development of 10%, 50%, 90% duration envelope post Main Gate approval
Figure �7-5 shows that whilst the 50% estimate for the duration of the Demonstration and Manufacture phase increases primarily during the latter stages of the average project, the range of uncertainty surrounding the timing of delivery of capability does not significantly reduce over the same period. The Team’s view is that this reflects the relatively low importance placed on risk estimation and monitoring.
7.5. Whole project duration and cost performance
7.5.1. Initial Gate to Main Gate plus Main Gate to ISD
By combining the analyses undertaken on projects which have completed their Assessment phases with analyses undertaken on projects which are largely “mature” in their Demonstration and Manufacture phases, it is possible to build a picture of the overall performance of the acquisition system.
Between Initial Gate and ISD the expected duration of Initial Gate to ISD for the average project increases by 81% (see Figure �7-6) and the average total cost of the Assessment, Demonstration and Manufacture phases increases by 42% (see Figure �7-7).
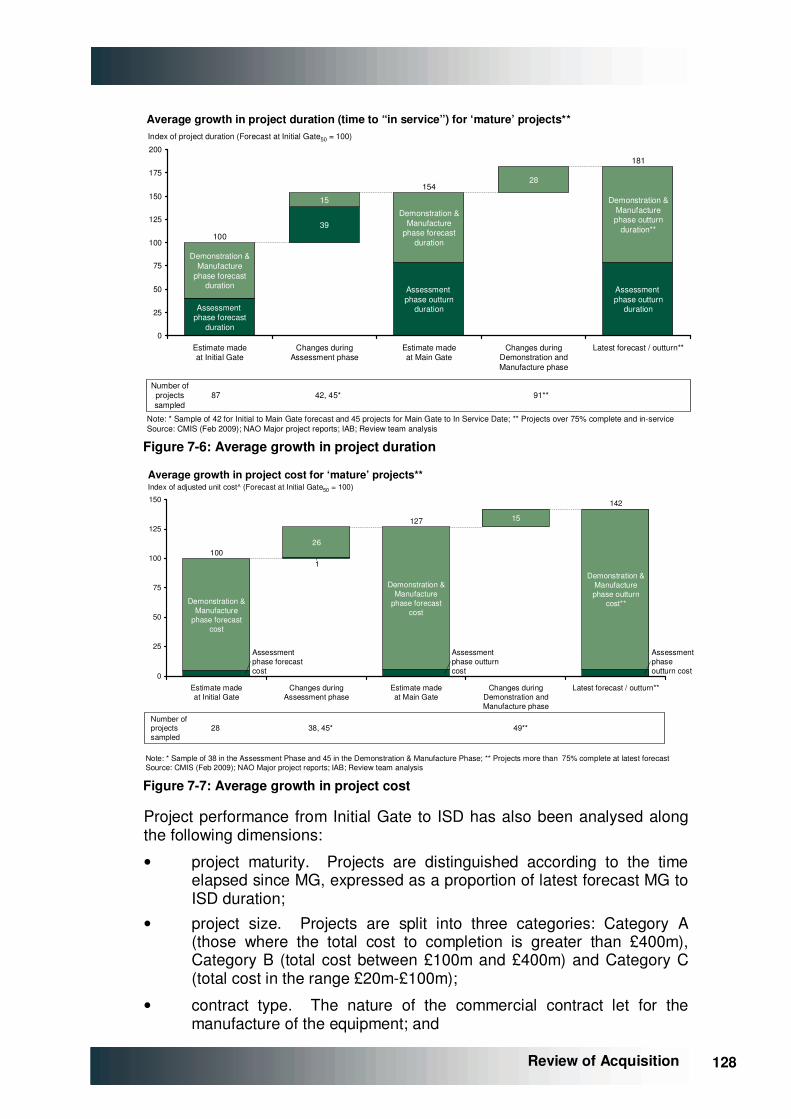
128 128
Review of Acquisition
0
25
50
75
100
125
150
175
200
28
Demonstration &Manufacture
phase forecastduration
Assessment phase forecast
duration
100
Estimate made at Initial Gate
15
39
Changes duringAssessment phase
Demonstration &Manufacture
phase forecastduration
Assessment phase outturn
duration
154
Estimate madeat Main Gate
Changes duringDemonstration and Manufacture phase
Demonstration &Manufacturephase outturn
duration**
Assessment phase outturn
duration
181
Latest forecast / outturn**
Index of project duration (Forecast at Initial Gate50 = 100)
87 42, 45* 91**Number ofprojectssampled
Note: * Sample of 42 for Initial to Main Gate forecast and 45 projects for Main Gate to In Service Date; ** Projects over 75% complete and in-serviceSource: CMIS (Feb 2009); NAO Major project reports; IAB; Review team analysis
Average growth in project duration (time to “in service”) for ‘mature’ projects**
Figure �7-6: Average growth in project duration
Note: * Sample of 38 in the Assessment Phase and 45 in the Demonstration & Manufacture Phase; ** Projects more than 75% complete at latest forecastSource: CMIS (Feb 2009); NAO Major project reports; IAB; Review team analysis
1
0
25
50
75
100
125
150
Changes duringAssessment phase
142
Demonstration &Manufacture
phase forecastcost
26
Assessment phaseoutturn cost
Assessment phase forecastcost
Demonstration &Manufacturephase outturn
cost**
Changes duringDemonstration and Manufacture phase
100
Estimate madeat Main Gate
Demonstration &Manufacture
phase forecastcost
Estimate made at Initial Gate
127
Latest forecast / outturn**
Assessment phase outturncost
Index of adjusted unit cost^ (Forecast at Initial Gate50 = 100)
15
28 38, 45* 49**Number ofprojectssampled
Average growth in project cost for ‘mature’ projects**
Figure �7-7: Average growth in project cost
Project performance from Initial Gate to ISD has also been analysed along the following dimensions:
• project maturity. Projects are distinguished according to the time elapsed since MG, expressed as a proportion of latest forecast MG to ISD duration;
• project size. Projects are split into three categories: Category A (those where the total cost to completion is greater than £400m), Category B (total cost between £100m and £400m) and Category C (total cost in the range £20m-£100m);
• contract type. The nature of the commercial contract let for the manufacture of the equipment; and

129 129 Review of Acquisition
• Smart / Non-Smart73.
In order to maximise the size of the samples on which segmental analyses are performed, average project performance from IG to MG is assumed across all projects. Segmental variations are only considered in performance after projects have been through Main Gate.
Figure �7-8 shows how project performance varies with maturity.
Note: Straight average shownSource: CMIS (Feb 2009); NAO Major project reports; IAB; Review team analysis
181
158
185179
0
25
50
75
100
125
150
175
200
Index of project duration (Forecast at Main Gate50 = 154)
Latest forecast project duration overrun by Maturity
16 123
Latest forecast cost overrunby Maturity
142
119
136 137
0
25
50
75
100
125
150
Index of adjusted unit cost (Forecast at Main Gate50 = 127)
14 16 7949Number of projects sampled
28
15
1691
MainGate
InitialGate
InitialGate
MainGate
54
27
over 75% 0-50% 50-75% All over 75% 0-50% 50-75% All
Figure �7-8: Project performance by maturity
Segmenting projects by post Main Gate maturity highlights the apparent better performance of “young” projects. This can be put down to two factors:
1) insufficient time has elapsed for delays and cost overruns to have yet materialised in the younger projects; and
2) even if overruns have occurred, project teams are more likely to declare delays and cost overruns as the project approaches ISD.
Because of these issues, results presented elsewhere in this report, specifically the ‘average’ duration and cost overrun analyses shown in Figure �7-6 and Figure �7-7, relate only to the performance of “mature” projects (i.e., those that are more than 75% complete - see Appendix �F.7).
The impact of project size (as determined by total expected cost to completion at Initial Gate) on performance is shown in Figure �7-9 below.
73 Non-Smart projects include projects post 1999 deemed to have followed non-Smart principles, e.g., follow-on buys of non-Smart projects.
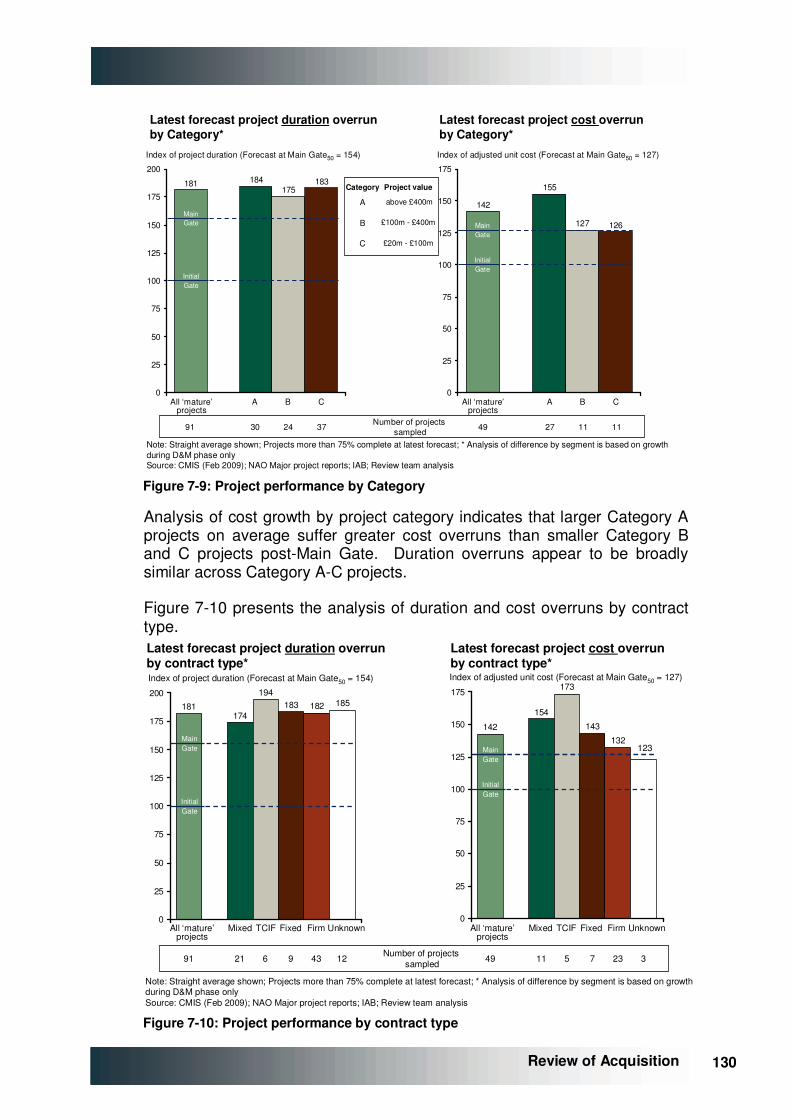
130 130
Review of Acquisition
Note: Straight average shown; Projects more than 75% complete at latest forecast; * Analysis of difference by segment is based on growth during D&M phase onlySource: CMIS (Feb 2009); NAO Major project reports; IAB; Review team analysis
181 184175
183
0
25
50
75
100
125
150
175
200
Index of project duration (Forecast at Main Gate50 = 154)
30 24
Latest forecast project duration overrunby Category*
142
155
127 126
0
25
50
75
100
125
150
175
Index of adjusted unit cost (Forecast at Main Gate50 = 127)
Latest forecast project cost overrunby Category*
37 Number of projects sampled91
MainGate
InitialGate
MainGate
InitialGate
All ‘mature’projects
A B C
27 11 1149
All ‘mature’projects
A B C
Category
A
B
C
Project value
above £400m
£100m - £400m
£20m - £100m
Figure �7-9: Project performance by Category
Analysis of cost growth by project category indicates that larger Category A projects on average suffer greater cost overruns than smaller Category B and C projects post-Main Gate. Duration overruns appear to be broadly similar across Category A-C projects.
Figure �7-10 presents the analysis of duration and cost overruns by contract type.
Note: Straight average shown; Projects more than 75% complete at latest forecast; * Analysis of difference by segment is based on growth during D&M phase onlySource: CMIS (Feb 2009); NAO Major project reports; IAB; Review team analysis
181174
194183 182 185
0
25
50
75
100
125
150
175
200
Index of project duration (Forecast at Main Gate50 = 154)
Latest forecast project duration overrunby contract type*
Latest forecast project cost overrunby contract type*
142
154
173
143
132
0
25
50
75
100
125
150
175
Index of adjusted unit cost (Forecast at Main Gate50 = 127)
Number of projects sampled21 691 9 43 12
All ‘mature’projects
Mixed TCIF Fixed Firm Unknown
MainGate
InitialGate
All ‘mature’projects
Mixed TCIF Fixed Firm Unknown
11 549 7 23 3
123MainGate
InitialGate
Figure �7-10: Project performance by contract type
131 131 Review of Acquisition
Performance in terms of duration overrun appears to be broadly similar across all contract types, with Target Cost Incentive Fee (“TCIF”) projects suffering the greatest overruns. Projects with TCIF contracts also perform the worst in terms of cost overrun, with Firm contracts showing the least average overrun. It is important to note, however, both Firm and Fixed project costs are likely to include a greater contingency for risk in their original estimates and so may not represent the best value for money even if the overrun relative to MG estimates is generally less significant.
Figure �7-11 compares the average performance of mature projects which were run following the principles of Smart Procurement with those which were not.
Note: Straight average shown; Projects more than 75% complete at latest forecast; * Analysis of difference by segment is based on growth during D&M phase only. Non-Smart projects include projects post 1999 deemed to have followed non-Smart principles, e.g. follow on buys of Non-Smart projectsSource: CMIS (Feb 2009); NAO Major project reports; IAB; Review team analysis
181174
186
0
25
50
75
100
125
150
175
200
Index of project duration (Forecast at Main Gate50 = 154)
Number of projects sampledAvg. project cost at MG (£m)
Avg. project duration (months)
Latest forecast project duration overrun by Smart / Non-Smart*
142
125
154
0
25
50
75
100
125
150
175
Index of adjusted unit cost (Forecast at Main Gate50 = 127)
20 155 31
291,157
57
Latest forecast cost overrunby Smart / Non-Smart*
49748 46
3313429
5893053
9164244
MainGate
MainGate
InitialGate
InitialGate
All ‘mature’projects
Smart Non-Smart All ‘mature’projects
Smart Non-Smart
Figure �7-11: Performance of Smart and Non-Smart projects
On average, mature Smart projects outperform non-Smart projects in terms of both cost and duration overrun between IG and ISD.
7.5.2. Initial Gate to ISD (“straight through”)
A similar analysis has been undertaken using a more limited set of projects which are now relatively mature (more than 75% complete) and for which Initial Gate50 estimates are available.
For further detail on the sample and methodologies used to undertake the analyses presented in this section, please refer to �Appendix F.
Table �7-6 sets out the results of the analysis of the mature projects for which Initial Gate50 estimates of duration and cost are available.
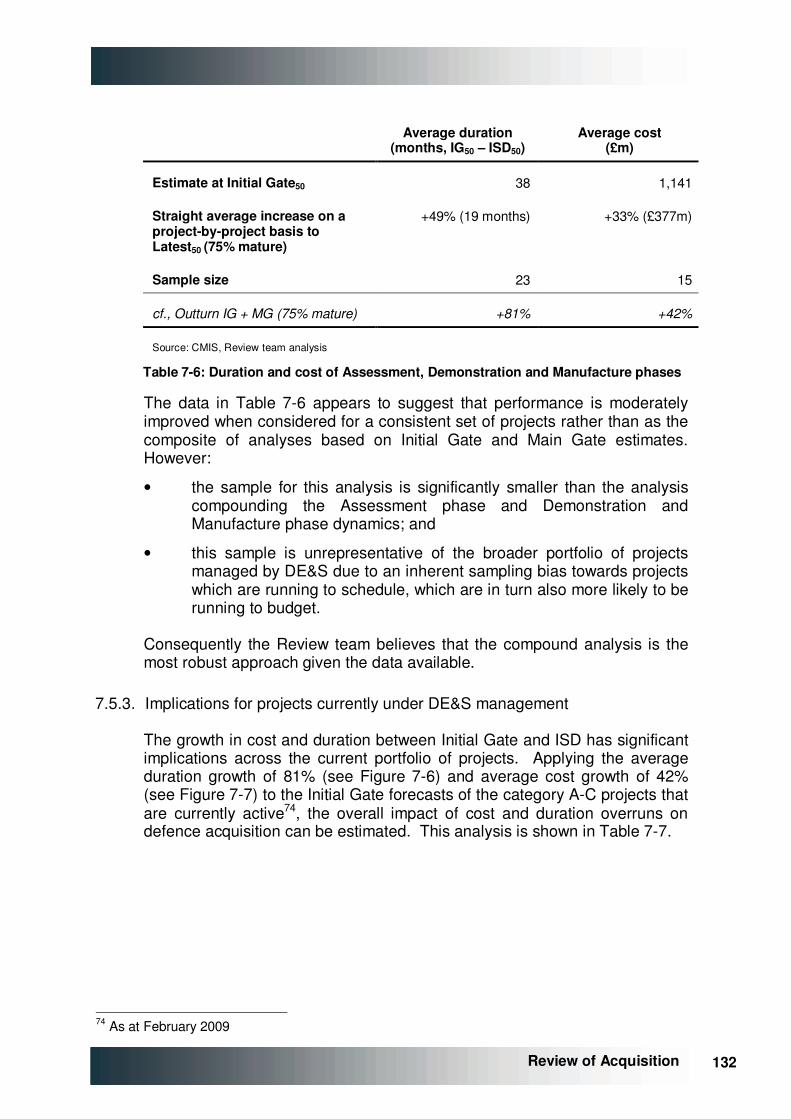
132 132
Review of Acquisition
Average duration (months, IG50 – ISD50)
Average cost (£m)
Estimate at Initial Gate50 38 1,141
Straight average increase on a project-by-project basis to Latest50 (75% mature)
+49% (19 months) +33% (£377m)
Sample size 23 15
cf., Outturn IG + MG (75% mature) +81% +42%
Source: CMIS, Review team analysis
Table �7-6: Duration and cost of Assessment, Demonstration and Manufacture phases
The data in Table �7-6 appears to suggest that performance is moderately improved when considered for a consistent set of projects rather than as the composite of analyses based on Initial Gate and Main Gate estimates. However:
• the sample for this analysis is significantly smaller than the analysis compounding the Assessment phase and Demonstration and Manufacture phase dynamics; and
• this sample is unrepresentative of the broader portfolio of projects managed by DE&S due to an inherent sampling bias towards projects which are running to schedule, which are in turn also more likely to be running to budget.
Consequently the Review team believes that the compound analysis is the most robust approach given the data available.
7.5.3. Implications for projects currently under DE&S management
The growth in cost and duration between Initial Gate and ISD has significant implications across the current portfolio of projects. Applying the average duration growth of 81% (see Figure �7-6) and average cost growth of 42% (see Figure �7-7) to the Initial Gate forecasts of the category A-C projects that are currently active74, the overall impact of cost and duration overruns on defence acquisition can be estimated. This analysis is shown in Table �7-7.
74 As at February 2009
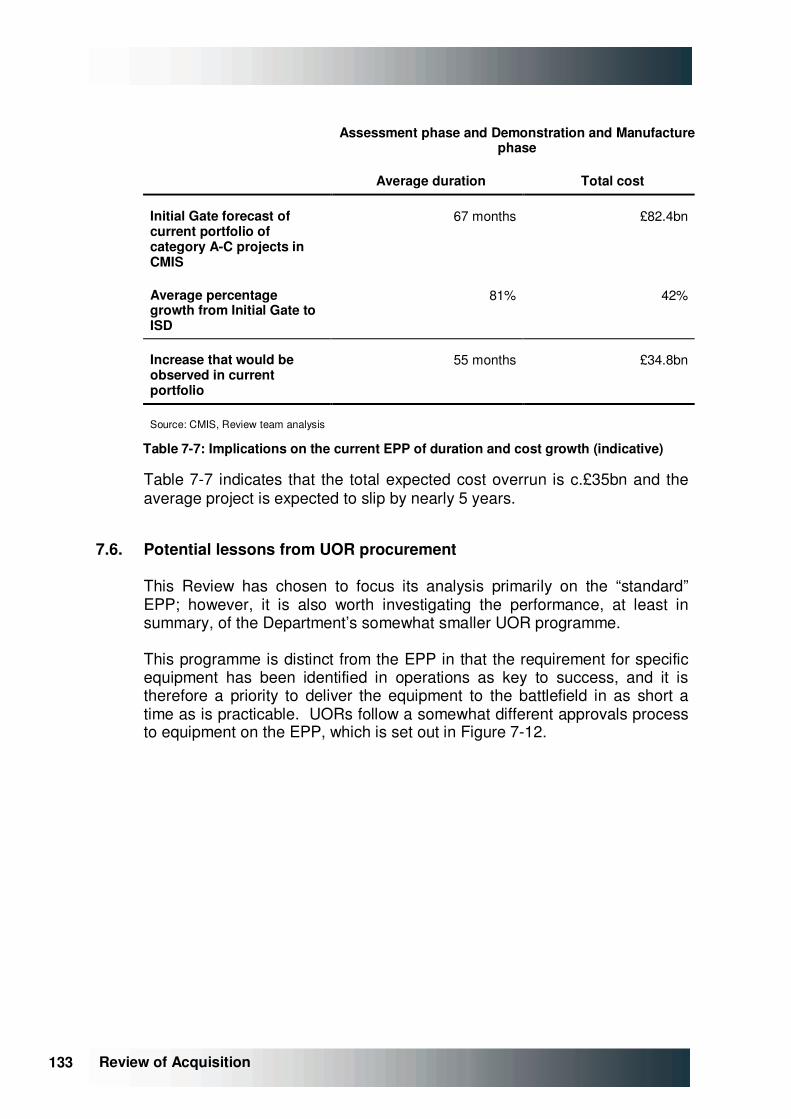
133 133 Review of Acquisition
Assessment phase and Demonstration and Manufacture
phase
Average duration Total cost
Initial Gate forecast of current portfolio of category A-C projects in CMIS
67 months £82.4bn
Average percentage growth from Initial Gate to ISD
81% 42%
Increase that would be observed in current portfolio
55 months £34.8bn
Source: CMIS, Review team analysis
Table �7-7: Implications on the current EPP of duration and cost growth (indicative)
Table �7-7 indicates that the total expected cost overrun is c.£35bn and the average project is expected to slip by nearly 5 years.
7.6. Potential lessons from UOR procurement
This Review has chosen to focus its analysis primarily on the “standard” EPP; however, it is also worth investigating the performance, at least in summary, of the Department’s somewhat smaller UOR programme.
This programme is distinct from the EPP in that the requirement for specific equipment has been identified in operations as key to success, and it is therefore a priority to deliver the equipment to the battlefield in as short a time as is practicable. UORs follow a somewhat different approvals process to equipment on the EPP, which is set out in Figure �7-12.
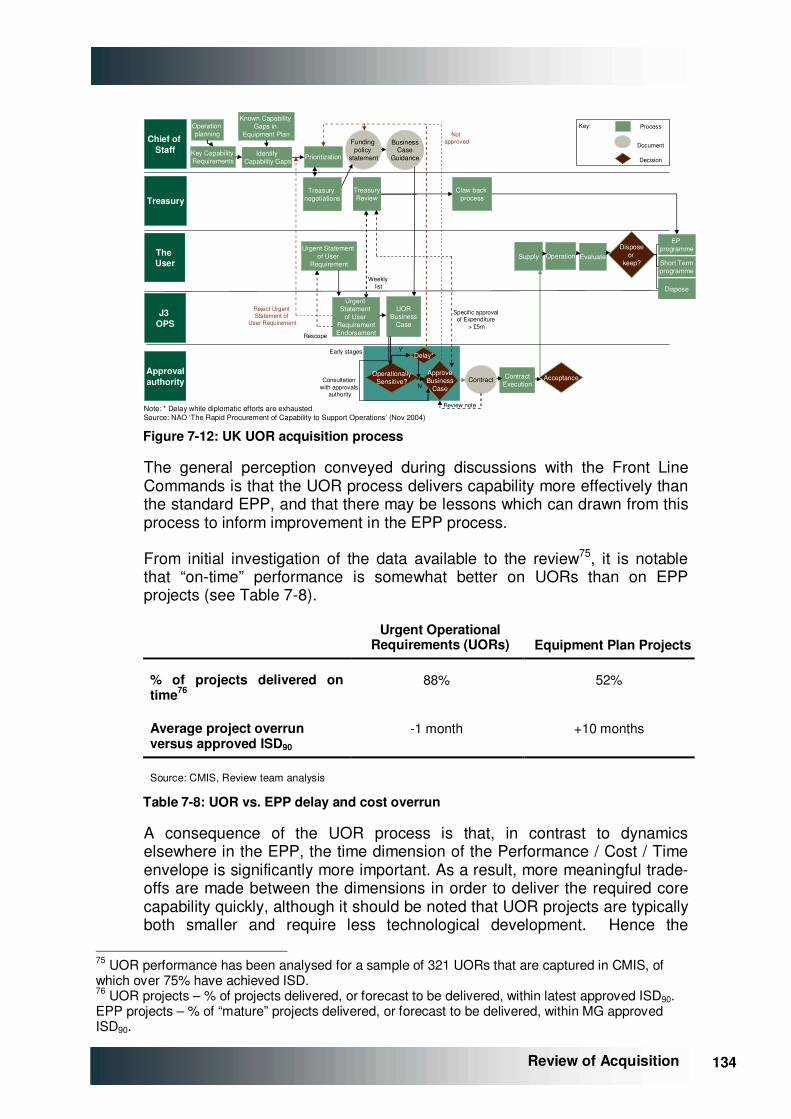
134 134
Review of Acquisition
Chief of Staff
The User
Treasury
J3 OPS
Approval authority
Operation planning
Key Capability Requirements
IdentifyCapability Gaps
Known Capability Gaps in
Equipment Plan
Prioritization
Urgent Statement of User
Requirement
Funding policy
statement
BusinessCase
Guidance
Urgent Statement
of User RequirementEndorsement
UORBusiness
Case
OperationallySensitive?
ApproveBusiness
CaseContract Contract
ExecutionAcceptance
Supply
Delay*
Operation EvaluateDispose
or keep?
EP programme
Short Termprogramme
Dispose
Claw back process
TreasuryReview
Treasury negotiations
Review note
Not approved
Reject Urgent Statement of
User Requirement
Rescope
Specific approval of Expenditure
> £5m
Weekly list
Consultation with approvals
authority
Process
Document
Key:
Decision
Early stages Y
N
Note: * Delay while diplomatic efforts are exhaustedSource: NAO ‘The Rapid Procurement of Capability to Support Operations’ (Nov 2004) Figure �7-12: UK UOR acquisition process
The general perception conveyed during discussions with the Front Line Commands is that the UOR process delivers capability more effectively than the standard EPP, and that there may be lessons which can drawn from this process to inform improvement in the EPP process.
From initial investigation of the data available to the review75, it is notable that “on-time” performance is somewhat better on UORs than on EPP projects (see Table �7-8).
Urgent Operational
Requirements (UORs) Equipment Plan Projects
% of projects delivered on time76
88% 52%
Average project overrun versus approved ISD90
-1 month +10 months
Source: CMIS, Review team analysis
Table �7-8: UOR vs. EPP delay and cost overrun
A consequence of the UOR process is that, in contrast to dynamics elsewhere in the EPP, the time dimension of the Performance / Cost / Time envelope is significantly more important. As a result, more meaningful trade-offs are made between the dimensions in order to deliver the required core capability quickly, although it should be noted that UOR projects are typically both smaller and require less technological development. Hence the
75 UOR performance has been analysed for a sample of 321 UORs that are captured in CMIS, of which over 75% have achieved ISD. 76 UOR projects – % of projects delivered, or forecast to be delivered, within latest approved ISD90. EPP projects – % of “mature” projects delivered, or forecast to be delivered, within MG approved ISD90.
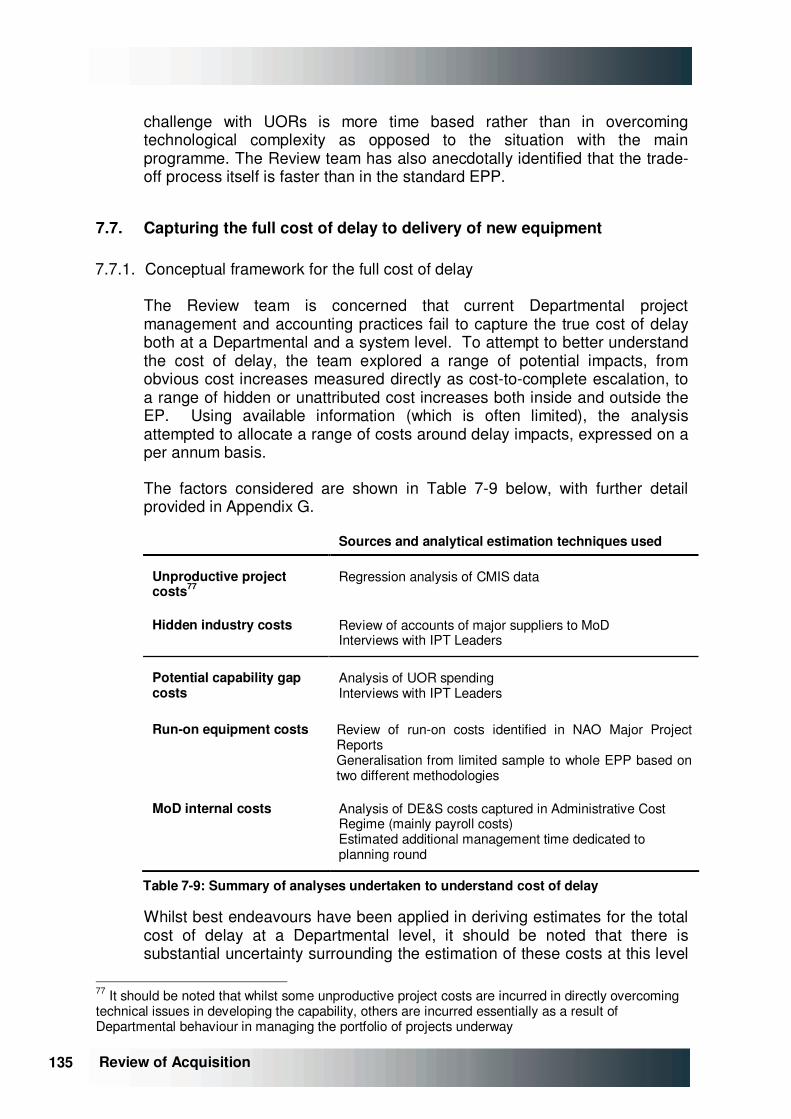
135 135 Review of Acquisition
challenge with UORs is more time based rather than in overcoming technological complexity as opposed to the situation with the main programme. The Review team has also anecdotally identified that the trade-off process itself is faster than in the standard EPP.
7.7. Capturing the full cost of delay to delivery of new equipment
7.7.1. Conceptual framework for the full cost of delay
The Review team is concerned that current Departmental project management and accounting practices fail to capture the true cost of delay both at a Departmental and a system level. To attempt to better understand the cost of delay, the team explored a range of potential impacts, from obvious cost increases measured directly as cost-to-complete escalation, to a range of hidden or unattributed cost increases both inside and outside the EP. Using available information (which is often limited), the analysis attempted to allocate a range of costs around delay impacts, expressed on a per annum basis.
The factors considered are shown in Table �7-9 below, with further detail provided in �Appendix G.
Sources and analytical estimation techniques used
Unproductive project costs77
Regression analysis of CMIS data
Hidden industry costs Review of accounts of major suppliers to MoD Interviews with IPT Leaders
Potential capability gap costs
Analysis of UOR spending Interviews with IPT Leaders
Run-on equipment costs Review of run-on costs identified in NAO Major Project Reports Generalisation from limited sample to whole EPP based on two different methodologies
MoD internal costs Analysis of DE&S costs captured in Administrative Cost Regime (mainly payroll costs) Estimated additional management time dedicated to planning round
Table �7-9: Summary of analyses undertaken to understand cost of delay
Whilst best endeavours have been applied in deriving estimates for the total cost of delay at a Departmental level, it should be noted that there is substantial uncertainty surrounding the estimation of these costs at this level
77 It should be noted that whilst some unproductive project costs are incurred in directly overcoming technical issues in developing the capability, others are incurred essentially as a result of Departmental behaviour in managing the portfolio of projects underway

136 136
Review of Acquisition
arising from the need to generalise from relatively few examples in each case. The summary of estimates presented in Table �7-10 are, therefore, highly indicative.
£m p.a. Low estimate High estimate
Unproductive project costs 500 1,200
Hidden industry costs 100 350
Potential capability gap costs 110 250
Run-on equipment costs 100 130
MoD internal costs 110 220
Estimated annual cost of delay 920 2,150
Source: Review team estimates
Table �7-10: Estimates of cost of delay (indicative)
The results appear startling, particularly given that the annual expenditure on the EPP is only around £6bn. Some of the costs, however, appear in cost centres outside the EPP so are effectively hidden costs. Unproductive project costs from delay in the year may also not show up within the year, though they will need to be covered eventually to get the same level of capability. Hence the inputs of £6bn per year will not produce £6bn of productive output as planned, but a level reduced by unproductive cost increases. These impacts are illustrated in Figure �7-13 below. For intended productive input of £6bn in expenditure, the effect post-delay may be a level as low as £4bn that will prove valuable, once unproductive costs across the system are taken into account.
Annual system cost of EPP delays
0 1 2 3 4 5 6
Initial EPP annualresources
Unproductiveproject costs
Hidden industrycost
Residual productiveEPP spend
Potential capabilitygap costs
Run-on equipment costs
MoD internal costs
Residual resources
Billions of Pounds per year
Project costs monitored by MoD and NAO
ILLUSTRATIVE
ILLUSTRATIVE
Source: CMIS (Feb 2009); NAO Major project reports; Review team analysis; DE&S management data; Company annual reports; Press
ACR monitored in aggregate by MoD
Noted by NAO for major projects
Impacting EPP resources
Impacting other budgets
Examples:
Contract re-negotiation, costs of capital
Unabsorbed overheads not passed back to MoD immediately
UOR spend
Additional support costs
Maintaining project teams during delayEffort in re-profiling / EP updates
Range of overall resourcesconsumed by delay
Key:Estimated
Range
Figure �7-13: Conceptual system costs of delay

137 137 Review of Acquisition
7.8. Factors contributing to time and cost overruns in new equipment procurement
Through interviews with DE&S personnel and elsewhere, the Review has identified a number of factors that contribute to the systematic under-estimation of cost and duration at Initial Gate and then again at Main Gate.
7.8.1. Indistinct interface between customer and supplier
To deliver capability, the Capability Sponsor organisation and DE&S need to work closely together to ensure that User needs and perspectives are considered alongside the industrial, technical and financial constraints that arise in meeting these needs. However, in practice, close working has translated into lack of clear project ownership and has diluted accountability for poor project performance. Within the wider Defence community DE&S is often seen as “most responsible” for project difficulties, however the seeds of the problem were often sown in the planning and optimistic initial costings incorporated into the MoD’s long term planning systems, providing DE&S with an almost impossible task to deliver to time and budget from the outset. As a result, and as already discussed in Chapter �6, it is often not clear whether overruns are down to this mis-estimation, ineffective project management, supplier failings, or a combination of all three.
Furthermore, anecdotal evidence suggests that the close working relationship between DE&S and the Capability Sponsor means that change requests are often accepted by DE&S after internal approvals have been granted against an agreed specification (and contracts signed with industry), leading to further overruns that become associated with DE&S. The lack of reliable data relating to changed requirements, noted earlier in this chapter, supports this hypothesis.
It is worth noting that the current situation has not always prevailed. Prior to the formation of DE&S and the “Unified Customer” the core new equipment project delivery functions for the MoD were largely undertaken by the DPA which operated based on a clear customer / supplier relationship with the rest of the MoD. This arrangement was driven by Smart Procurement changes:
“The role of the PE should be that of a supplier of equipment procurement services, a role which requires clear definition of the customer-supplier relationships with the centre and the Single Service, and which allows the Procurement Executive to move to Trading Fund status”78
Ultimately agency status, rather than a trading fund, was used to provide the procurement function with the required degree of autonomy. The performance of the DPA against its Key Performance Indicators (as set by the Department) is shown in Figure �7-14.
78 “Transforming the U.K.’s Defence Procurement System”, MoD, (Feb 98)
138 138
Review of Acquisition
5.7
3.9
0
2
4
6
8
10
7.2
2.4
0.9 0.7 0.5
Months per project
9899
0
10
20
30
40
50
60
70
80
90
100
99 99 99 97 99
Target
DPA results
Percent
Note: *DSO population Key Target ResultsSource: DPA Annual Reports; DE&S internal KPI reports
05/0
6
06/0
7
03/0
4
2002
/03
04/0
5
Equipment performance in year –Percentage of KURs being met, average per project
Average percentage cost growth in year
Average programme slippage in year
5.6
0.7
0.00.2
5.4
2.7
(2.2)
0
10
2
4
6
8
(2)
(4)
Percent
07/0
8*
08/0
9*
05/0
6
06/0
7
03/0
4
2002
/03
04/0
5
07/0
8*
08/0
9*
05/0
6
06/0
7
03/0
4
2002
/03
04/0
5
07/0
8*
08/0
9*
DE&S results
Figure �7-14: DPA and DE&S Key Performance Indicators
Performance against cost and time KPIs improved significantly between 2002/03 and 2006/07 during the DPA’s existence, eventually exceeding targets on all dimensions. In addition KUR performance remained high..
However, the perception of the rest of the MoD was that it failed to adequately incentivise the DPA to optimise outputs against “second order” MoD goals (i.e. those against which its performance was not explicitly and transparently measured). The organisation suffered from a perception that it was adversarial in its dealings with the rest of the MoD, was generally un-responsive and was delivering the wrong equipment (despite apparently good performance on delivering KURs). In reality, how much of this perception was genuinely the fault of the DPA and how much was a result of failures of the FLCs and MoD centre organisation in realism and stable specification is unclear.
The subsequent changes to the MoD’s acquisition system which resulted in the creation of the “Unified Customer” and which reabsorbed the DPA into the MoD in April 2007 were meant to create “one team” but had the adverse effect of blurring the division between the customer and supplier in the relationship with consequences for clarity of purpose and accountability.
As a result, functions that were in principle meant to be the main responsibility of one are now performed by the other or both. Specifically, DE&S finds itself in a position where it is able to trade off capability against other factors and where it is therefore partly free to determine the capability that is ultimately delivered (even though this is the explicit role of the Capability Sponsor).
139 139 Review of Acquisition
7.8.2. Lack of independent review at project approval points
It is widely recognised, both at MoD centre and within DE&S, that the estimates of cost made at concept initiation (and subsequently at Initial Gate) are unrealistically optimistic.
Under the current approval process for major projects (i.e., Category A or B), business cases are presented to the IAB having been formulated primarily between IPT and DEC / Head of Capability. These business cases are subject to prior scrutiny from Sec(EC), the Defence Equipment & Support Investment Board (“DESIB”) and validation by the DE&S internal assurance processes. Exceptionally large projects may also be required to gain approval by the full Defence Board.
Anecdotal evidence suggests that there has been limited appetite from project teams for independent review of cost / time to deliver estimates. Moreover, the Review team has been told by a wide range of parties that much of the oversight / assurance / scrutiny which is mandated during the run up to IAB submission can be of relatively low value (i.e., “box ticking” rather than “expert review”).
DE&S is generally under pressure to deliver more for less, and in some cases, deliver the impossible. Push back on unrealistic expectations from the Capability Sponsor is difficult, particularly once momentum has taken hold of a project. Single Service loyalties permeate down through the DE&S organisation, creating the same perverse incentives as noted in Chapter �6, when putting together the EP. The result is frequent over-specification and under-pricing of Initial Gate (and to a lesser extent Main Gate) business case submissions.
If more realistic estimates of time and cost were available, particularly at Initial Gate, it is likely that alternative means of delivering equipment may have been considered. In some cases, questions as to whether the equipment was affordable at all may even have been raised.
Since business case submissions are rarely subject to independent review, and since incentives on DE&S to provide realistic estimates are relatively weak, it should come as no particular surprise that cost estimates increase as projects mature.
DE&S continues to maintain an in-house, semi-independent cost estimation capability (CAAS team79). Input from this group has until recently generally only been called upon on an ad hoc basis. In 2008, the “independent” validation of cost models and cost estimates was mandated for category A and B projects at both Initial Gate and Main Gates. However, this initiative remains in its early stages. The Review team heard from a number of sources that it had been difficult historically for “independent” cost checks to
79 Cost Assurance and Analysis Services, a DE&S team whose main function is the provision of cost estimation models / semi-independent cost estimates to IPTs
140 140
Review of Acquisition
gain traction, particularly when the results contradicted internal team estimates or threatened the approvals process. A number of high level “benchmark” costings for projects undertaken by the Department have indicated significant underestimates of cost by IPTs80. These benchmark costs were borne out by eventual project performance.
7.8.3. High development risk solutions
It has previously been observed (see Chapter �6) that the Department is incentivised to over-specify equipment in order to ensure that sufficient capability is eventually delivered despite funding constraints. Furthermore, alternative acquisition techniques which have the potential to mitigate the consequences of high technical risk (e.g., spiral / incremental / sub-system acquisition techniques) are militated against due to the relatively uncertain long-term funding environment (i.e., uncertainty over the eventual release of money for the scheduled upgrade programme).
As a result, in order to make the capability leap from “old” to “new” equipment and deliver a technical advantage, the technical risk of equipment projects embarked upon by the Department is generally very high, frequently alongside significant overall system integration risks.
The challenge that technical development presents is often not recognised in advance and is compounded by the relatively poor active management of risk during the project. As a result, at the point of Main Gate (or even contract award) the level of risk is not always fully recognised within the cost estimates.
Additionally, as is now widely recognised, the MoD is unable to divest itself fully of development risk through contract structuring because:
• either the contractors recognise the risk and the price escalates to unaffordable levels as a result; and / or
• the MoD fundamentally requires the capability and will pay to fund its development whatever the contract structure notionally in place.
The perception amongst interviewees was that the MoD endeavours to contract for procurement of equipment whilst very significant levels of technical risk remain to be explored / quantified. Some characterised this as embedding technology development within the core project, rather than before it (as is the intention of the CADMID process). The consequence of inadequate recognition of technical risk is that the duration / cost estimates established at Main Gate are generally proven to be optimistic.
The Department has an established way to benchmark the technology and system integration risk for each project: Technology Readiness Levels (“TRLs”) and System Readiness Levels (“SRLs”). The TRL assessment system was originally devised by NASA, with the intention of reducing overall
80 e.g., HVR study in February 2005
141 141 Review of Acquisition
project risk and the likelihood of project delay due to immature technology. The system operates a 9 level grading system reflecting the technical maturity (or conversely risk) associated with a system. For further information see �Appendix F.
TRLs are usually applied to individual subsystems of a project (e.g., software protocols within a hardware platform). To supplement TRLs, the MoD has devised the SRL scale which has been used on some projects to cover risks associated with integrating individual subsystems.
Some business cases going to IAB for approval provide TRL and SRL estimates. Projects seeking Main Gate approval from the IAB are recommended to have a TRL of 7, although it should be noted that a number of projects have been approved despite incorporating less mature technologies (i.e., lower TRL scores). In practice, the Review team had difficulty finding evidence for any widespread use of TRL/SRLs: fewer than 15 instances were identified across the mature project sample.
Where TRL is available, analysis has been undertaken to understand the impact of TRL on time / cost overrun (see Figure �7-15).
Note: Projects more than 75% complete at latest forecastSource: CMIS (Feb 2009); IPT Interviews; IAB; Review team analysis
Forecast duration vs. TRLN = 14
495TRL > 7
14
3
7
n
119All
123TRL = 7
131TRL < 7
Straight avg. adj. duration change (%)
495TRL > 7
14
3
7
n
119All
123TRL = 7
131TRL < 7
Straight avg. adj. duration change (%)
0
50
100
150
200
250
0 1 2 3 4 5 6 7 8 9
TRL at MG
Forecast duration (Main Gate50 = 100)
Increasing maturity
Figure �7-15: Demonstration and Manufacture phase duration overrun vs. TRL at Main Gate
These data show that although there is a relatively weak link between TRL assessed at Main Gate and slip versus Main Gate duration estimates thereafter, projects where TRL was assessed at 8 or 9 appear to perform significantly better than those with TRLs of 7 or below.
142 142
Review of Acquisition
7.8.4. Uncertainty or change in projects (DE&S to industry and MoD centre to DE&S)
MoD centre has been unable to provide either DE&S or industry with sufficient certainty around requirements or timing to deliver equipment projects efficiently.
This lack of certainty manifests itself in a number of ways which together characterise the current system of acquisition:
• funding uncertainty (in-year / year-to-year management);
• timing shifts (e.g., multi-year programme delays); and
• mid-project requirements creep.
Funding uncertainty arises from EPP over-programming / overheat (fully described in Chapter �6), combined with inadequate “contingency” to cope with a short-term overspend in one project without adverse consequences for another. These effects result in short-term adjustments to plan (i.e., in-year, year-to-year) being required to ensure that Departmental control totals are met.
Timing shifts result from a wider change to the requirement for capability at a certain date, either due to a revised view of the threat which the capability is designed to address, or, more often, upcoming affordability constraints. Examples of projects / sectors impacted by affordability constraints include the deliberate delay introduced to the CVF (carrier) and FRES programmes.
Mid-project requirements creep itself derives from a number of factors. The primary reason is that the long lead times associated with delivery of capability (due to the technical complexity involved, see Section �7.8.3) means that better performing technologies become available before entry into service, which specifiers are tempted to try and incorporate in some way. The close linkages between the requirements community, industry and DE&S also “permit” ongoing changes to occur without appropriate consideration being given to cost.
Regardless of cause, neither DE&S nor industry are able to predict with certainty the MoD’s ability to fund or desire to develop a specific capability in a certain timeframe. Optimisation to develop the capability at lowest possible cost is therefore impossible.
7.8.5. MoD is unable to take full advantage of fixed and firm priced contracts
Whilst analysis shows that fixed and firm price contracts generally outperform other types in terms of cost overrun (see �Appendix F), it is clear to all involved that once a capability requirement has been identified as essential, the fundamental risk associated with failing to deliver that capability, lies with the MoD.
143 143 Review of Acquisition
Furthermore, the cancellation of contracts is difficult, and will typically incur considerable costs. The MoD is in a weak negotiating position if a contractor is in a situation where walking away is an economically viable proposition, e.g., if cost overruns become too great.
It should also be noted that the behaviour of the MoD can also lead to overruns on fixed and firm price contracts. Given the uncertain funding environment on a year-to-year basis and the relatively long project development lead times during which time requirements can (and generally will) evolve, the MoD can often be in a position where it is a supplicant in requesting contract changes - giving the contractor an opportunity to recoup underperformance in their side of the contract.
7.8.6. Perception that on-time delivery of equipment is relatively unimportant
Outside the UOR process (as set out in Section �7.6) time is clearly perceived to be the least important factor of the Performance Cost Time envelope. This consideration has been reflected qualitatively through the Review’s programme of interviews but also in the rate of overrun in time (c.80%) vs. cost (c.40%). This is a rational reaction for two reasons; the fact that most equipments under development as part of the ordinary EPP are not required “in anger” immediately on planned delivery into service (otherwise they would likely become a UOR) and the perceived costs of slippage in time are relatively small, confined for most projects to the increased estimates for cost of capital, reflected in IRDEL (which is widely considered the lowest priority DEL). As described in Section �7.7, the full cost of delay is actually substantially greater than may be immediately realised by IPTs.
Since time is under-valued, trade-offs between time and cost or time and performance are almost never made in order to accelerate the deployment of a capability. This is because any such benefit is outweighed by “apparent” penalties in the form of cost and performance.
7.8.7. Short-term constraints on optimising for long-term value for money
Throughout the Review team’s discussions there has been a consistent picture presented of “save to spend” – i.e., short-term savings being realised in order to meet annual Control Total targets, but leading to an increase in long-term costs (or risk to long-term capability / costs).
It is worth noting that current Departmental incentives and procedures have resulted in some specific, large scale instances of poor decision making on a value for money basis81 but which have been necessary in context of Departmental / HMT controls and incentives.
81 e.g., delay to CVF in December 2008 saved £110m in-year (2009/10) in near-cash, nominal terms, over stage 1 PR09 estimates but has been estimated to increase costs by £1.0bn in near cash, nominal terms (as in the EPP). The estimated impact on costs including cost of capital is c.£1.0bn (unaudited financial year end figure).
144 144
Review of Acquisition
7.8.8. DE&S process and skills issues
There are further factors identified in the course of the Team’s research around project management skills, processes and ways of working which also contribute to performance difficulties. These are covered in Chapter �8.
7.9. Equipment support considerations
7.9.1. Support and TLCM framework
Around half of the money that DE&S spends on equipment relates to support. In addition to investigating the effectiveness with which the DE&S procures equipment, it is therefore also important to understand its effectiveness with regards the provision of support.
Business models for equipment support have seen significant evolution and development over the past decade. Historically, the externally contracted aspects of support were spares purchase and occasional “return to OEM” upgrades or updates with the balance of effort provided internally by the Department. Over time this has evolved to “whole life” procurement and support, which explicitly considers support costs, processes, and commercial assignments as part of the initial equipment procurement decision making. A further level of sophistication takes into account other factors which impact the costs of using the equipment to deliver a military capability – training, for example, or manpower. This approach, called Through Life Capability Management (TLCM), is an evolution of the principle of Whole Life Costing where every aspect of new and existing military capability is planned and managed coherently across all DLoDs from cradle to grave. This evolution of support models is illustrated in Figure �7-16.
CA D MProcurement /
support
Whole Life Cost
Through Life Capability
Management
I
I
C A D M I D
C A D M I D
Other DLoDs (e.g., personnel, training)
Trade-off across procurement and support
Trade-off across procurement, support and other DLoDsUnified Customer
D
Figure �7-16: Evolution of Capability Management
The Department is moving along a transformation pathway to TLCM at various rates across the capability structure. The following sections describe progress and issues identified in the Team’s review of these areas.
145 145 Review of Acquisition
7.9.2. Equipment support context
Historically, responsibility for equipment support resided with the three single-Service logistics commands. A recognition that this dispersion of responsibility was leading to inefficiencies prompted the Department to re-organise the provision of the support functions and in 2000 led to the creation of the Defence Logistics Organisation (DLO), which was charged with the maintenance and upgrade of all military equipment and coordinated its storage and distribution.
The DLO set itself the target of achieving a 20% overall reduction in support costs by April 2006, to be achieved through both internal re-structuring of the ‘enabling’ layer and, from April 2005, through changes to the way in which the organisation delivered support to in-service equipment.
With the merger of the DLO and the DPA in April 2007, responsibility for support now resides with DE&S.
However, budgetary responsibility for equipment support planning remains fragmented with FLCs having budgetary responsibility for years 1 to 4 of the ESP, and the relevant Head of Capability within the MoD Capability Sponsor responsible for years 5 to 10 of the ESP. This situation is designed to give recognition to the fact that FLCs draw together all eight DLoDs to generate Force Elements at Readiness. Please refer to Chapter �6 and �Appendix B for further detail. Further, the FLCs are responsible for delivering much of the routine maintenance when equipment is deployed on operations.
Despite the fact that annual spend on equipment support is roughly in line with that on equipment procurement, the support area has been the subject of considerably less scrutiny from NAO and others outside the MoD. To some extent, this is probably because performance analysis for support arrangements is intrinsically difficult due to innate differences between every situation and supplier contract. The paucity of data that are held centrally on both the nature and the performance of support operations render the task even more challenging.
As a result, it is difficult to establish the extent to which the numerous change programmes conducted under the auspices of the DLO or DE&S have been successful. Besides the organisational changes described above, many of the processes by which equipment support is actually delivered have also been significantly re-designed: the Department is currently in the process of implementing a “Transformation Staircase” whereby support arrangements are migrated from traditional “spares-and-maintenance” type arrangements to Contracting for Availability (“CfA”) or Contracting for Capability (“CfC”). The amount of support activity that has been outsourced to industry for delivery has therefore increased significantly over the past ten years.
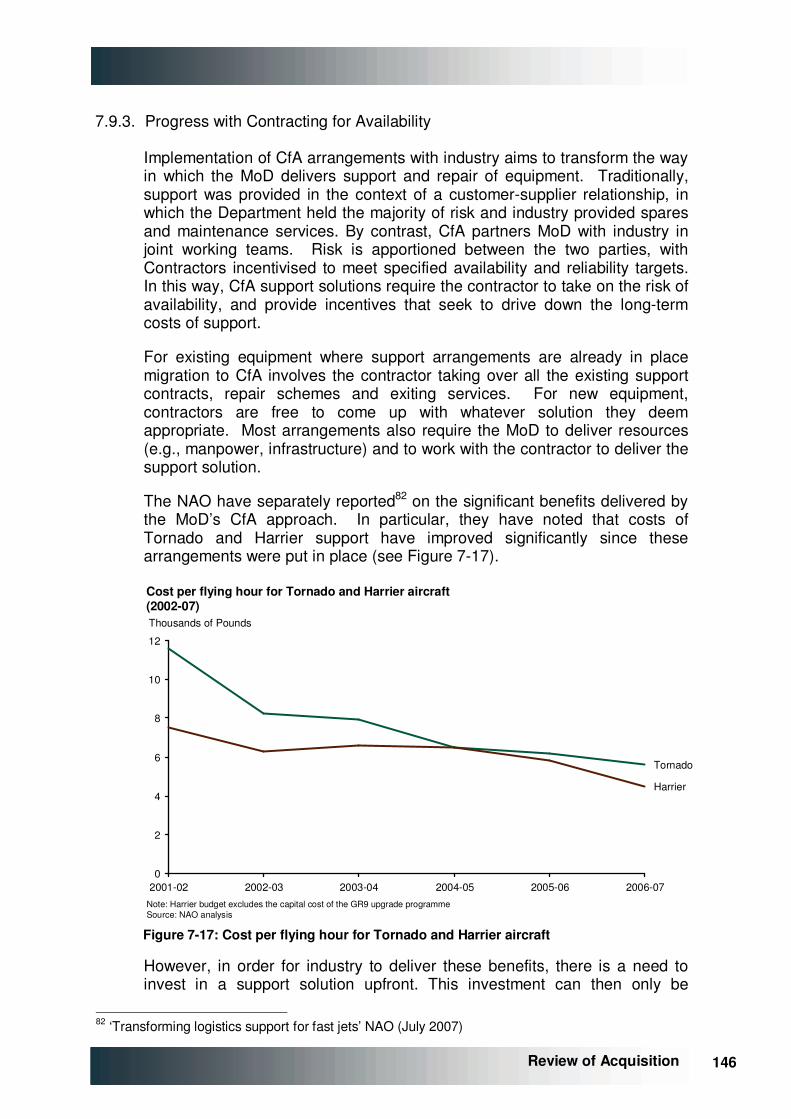
146 146
Review of Acquisition
7.9.3. Progress with Contracting for Availability
Implementation of CfA arrangements with industry aims to transform the way in which the MoD delivers support and repair of equipment. Traditionally, support was provided in the context of a customer-supplier relationship, in which the Department held the majority of risk and industry provided spares and maintenance services. By contrast, CfA partners MoD with industry in joint working teams. Risk is apportioned between the two parties, with Contractors incentivised to meet specified availability and reliability targets. In this way, CfA support solutions require the contractor to take on the risk of availability, and provide incentives that seek to drive down the long-term costs of support.
For existing equipment where support arrangements are already in place migration to CfA involves the contractor taking over all the existing support contracts, repair schemes and exiting services. For new equipment, contractors are free to come up with whatever solution they deem appropriate. Most arrangements also require the MoD to deliver resources (e.g., manpower, infrastructure) and to work with the contractor to deliver the support solution.
The NAO have separately reported82 on the significant benefits delivered by the MoD’s CfA approach. In particular, they have noted that costs of Tornado and Harrier support have improved significantly since these arrangements were put in place (see Figure �7-17).
Cost per flying hour for Tornado and Harrier aircraft(2002-07)
Note: Harrier budget excludes the capital cost of the GR9 upgrade programmeSource: NAO analysis
0
2
4
6
8
10
12
2001-02 2002-03 2003-04 2004-05 2005-06 2006-07
Tornado
Harrier
Thousands of Pounds
Figure �7-17: Cost per flying hour for Tornado and Harrier aircraft
However, in order for industry to deliver these benefits, there is a need to invest in a support solution upfront. This investment can then only be
82 ‘Transforming logistics support for fast jets’ NAO (July 2007)

147 147 Review of Acquisition
recovered over the duration of the contract. As a result, contracts delivering significant efficiencies will also tend to be long (10 – 15 years). The MoD will then have to provide guarantees around the minimum levels of activity to be provided, which provides a clear constraint on the MoD’s activities (before incurring “inefficient” financial penalties) and therefore potentially reduces the MoD’s flexibility in meeting changing defence priorities83.
With regards to new equipment, industry will both procure and provide the support provision for a given equipment contract (or suite of contracts). As such, if put in place during the early phases of the CADMID cycle, CfA is also able provide suitable incentives to contractors during the CADM phases to reduce in-service support costs through appropriate investment during initial design and manufacture.
7.9.4. Issues with moving up the Transformation Staircase
In the equipment support area there has been significant progress in moving towards CfA where the Department considers it appropriate for equipment that is already in-service (i.e., changes to the traditional methods of support), but progress towards PFI/CfC is limited to a few cases where new capability is to be introduced (e.g., FSTA – air to air refuelling). These measures appear to have delivered significant savings (£1bn p.a.84), albeit not sufficient to offset overall cost growth within the ESP. Further progress up the Transformation Staircase from Spares and Maintenance towards CfA / CfC support arrangements will be limited by a number of factors:
• MoD Acquisition system
− in-year financial pressures, resulting from the overheated EPP and ESP, significantly curtail “discretionary” spending – including relatively small investments with payback periods of greater than one year, but which would still be beneficial on an NPV / value for money basis; and
− visibility over through-life support costs for new equipment varies according to the size of the technology increment (e.g., Typhoon vs. support vehicles). Therefore the appropriate balance of risk between MoD and contractors is unclear at contract point for procurement of the capital equipment making value for money difficult / impossible to demonstrate definitively at Main Gate.
• MoD Commercial skills
− limited availability of commercial skills to support large contract negotiation in the support area (see also Chapter �8); and
83 An alternative view has also been heard by this Review: that the apparent flexibility in the existing system does not really exist due to wider MoD cost / capability considerations. The Review team finds this assertion credible but has not further investigated due to time constraints. 84 MoD Annual Report and Accounts 2007-08
148 148
Review of Acquisition
− support solutions can be de-risked through a series of incremental additions to ensure flexibility around costs and capability.
• MoD Information and understanding gaps
− MoD frequently has no clear understanding of the link between support costs (i.e., inputs) and the military outputs (e.g., flying hours achieved);
− limited availability of the type of robust data that would be required to develop long-term cost models within the availability contracts and the analysis of the available data are inadequate; and
− loss of MoD visibility over spares holding / inventory / logistics arrangements where they are provided by industry (although the capability risk continues to reside with the MoD).
• MoD resources: MoD needs to provide resources to support contract. Inability to deliver these resources results in CfA contractors being able to avoid obligations (cf., Tornado ATTAC contract where the RAF will only be able to provide 84% of the manpower requirement until May 09).
7.9.5. Complications in delivering efficient support for new equipment
The MoD typically procures equipment that incorporates new technology and is of a bespoke design. As a result, the support requirements and cost to deliver the capability on an efficient and enduring basis is hard to estimate (and, given the level of technical uncertainty in major projects is probably unknowable for many projects).
Nevertheless, the Review team’s impression is that support is seldom a key consideration when procurement decisions are taken. Although a central purpose of the EAC reforms was to consider whole life costs more effectively, there remain few credible, formal processes85 by which plans are mandated to take whole life costs into account other than through Initial Gate and Main Gate business cases.
Current arrangements incentivise the under-estimation of support costs rather than the generation of accurate estimates. Whilst it may be desirable to move towards a decision making process that is based on whole life cost considerations, it is likely to be difficult to do so for practical reasons relating to the technical complexities and inherent uncertainties surrounding many projects, as discussed above. Worryingly, it has been reported to the Review team that if ‘true’ support costs were known, they may be sufficiently significant that the whole project would be rendered unaffordable and the equipment would not be purchased – a ‘failure’ in the eyes of the project
85 Through Life Management Plan and Inventory Planning go towards this. Programme Boards (recently implemented) may play a further role

149 149 Review of Acquisition
sponsor. Any under-estimation of support costs will obviously have an impact on ESP and wider MoD affordability over the long-term.
7.9.6. Financial control and flexibility across support and procurement
Aspects of the financial control and resource categorisations create issues in managing the equipment and support expenditures at DE&S.
Figure �7-18 schematically illustrates the expenditure of the Department by DEL category and budget holder.
Manpower, estates, etc.
EPPCDELcontrol
DirectRDELcontrol
HMT
MOD budget
DE&S ACR*£1.3bn
ESP
CDEL£1.6bn
DirectRDEL£4.3bn
Direct RDEL:£0.9bn
CDEL£5.0bn
Note: Indirect RDEL not shown in annual spend figures; Further £300m spending of non-equipment plan costs that are too small for approval into the NEIP (e.g. long-term partnering agreement with QinetiQ, Joint Supply Chain equipment costs) are also managed by DE&S; * Includes Manpower, Overheads and NNP
DRDEL£16.4bn
CDEL £0.5bn
Direct RDEL:£0.5bn
NEIP
CDEL:£0.3bn
DE&S spend
Figure �7-18: Financial interaction of support with procurement
Although CDEL and DRDEL Control Totals exist for both EPP and ESP DEL, DE&S manages to the aggregate CDEL and DRDEL CTs – not the EPP and ESP separately86.
The financial control arrangements serve to:
• make it difficult to trade off between capital and non-capital spending over life for equipment (i.e., ‘spend to save’); and
• make it relatively easy to shift monies within year between the EPP and ESP within a DEL category.
The implications of this are considered further below.
86 In fact, on an in-year basis the separation between EPP and ESP disappears and is subsumed by a Control Total for DE&S / CDM as a whole
150 150
Review of Acquisition
7.9.7. Trading off between procurement and support costs over the life of a given piece of equipment
Minimising the whole life cost of new equipment involves trading off capital and operating expenses. However, the present structure, with two separate budgets for procurement and support (the EPP and ESP, respectively), each of which is planned to its own control total and different budget holders (FLC vs. DEC / Head of Capability area), means that it is difficult to undertake such trading.
Furthermore, the Department has no mechanism to monitor whole life cost / cost of ownership once a project has been approved at Main Gate. Although estimating total equipment costs over a 25+ year life cycle will inevitably be imprecise, failing to monitor whole life costings during development will potentially lead to poor value for money.
During the development and manufacture phases, significant cost pressures frequently need to be overcome in order to remain within approved project expenditure levels. This can set up pressures for IPTs to trade off project capital costs for higher subsequent support costs to remain within the equipment procurement limits.
The same incentives can also work within industry. Where contractors do not have fixed / firm price CfA arrangements in place during the design phase for equipment the contractor is actually incentivised to produce a less supportable design so as to generate more support work at a later date.
Also, neither IPTs nor industry have any great incentives to “engineer-in” higher cost up front solutions to provide greater reliability or availability later in life (given the relative lack of emphasis on whole life cost compared with initial procurement cost in the approvals and contracting process).
7.9.8. Trading off between procurement and support spending in-year
In-year, there is a single budget holder (CDM) with responsibility across both EPP and ESP programmes for delivery of new equipment and support to existing equipment.
It is therefore possible to “borrow” from the ESP to pay for the EPP, and vice versa. In reality, the two areas are now integrated to such an extent that verifiably articulating actual Departmental spending against either the ESP or the EPP is not possible.
This situation gives DE&S considerable flexibility over the deployment of financial resources in-year across both new equipment and support to existing equipment. But it also leads to considerable complexity in understanding true progress with delivering new capabilities whilst supporting existing ones.
151 151 Review of Acquisition
In their recent health check of TLCM87, the OGC recognised that the current level of overheat in the equipment programme as a whole militates against making short-term spending commitments which are easily justified by reference to long-term benefits. This observation echoes concerns raised in discussions with staff from DE&S.
The Review team has also noted concerns voiced by the FLC that the ESP is effectively a “black box” with no easy way for customers to monitor what was spent and for what purpose. In particular, this gives rise to the suspicion that monies are routinely diverted to other areas for which DE&S is financially responsible.
7.10. From Project Management to Capability Management
The MoD Acquisition organisation is undergoing a further stage of transformation to incorporate a broader base of resources in its management of defence capabilities.
The fundamental principles of Through Life Capability Management (TLCM) extend back to those of Smart Acquisition, of which they were key element. Initially the Department sought to introduce Through-Life Management (“TLM”) as a series of individual initiatives. In mid-2002, TLM was identified as a corporate change programme in its own right and the NAO undertook a review of TLM in 200388.
The implementation of Through Life Capability Management (TLCM) principles, which incorporates the management of military capability across all DLoDs, was the rationale for commissioning the 2006 Enabling Acquisition Change report (“EAC report”) and implementation of TLCM formed a core component of the Defence Acquisition Change Plan (“DACP”). The recommendations contained in the EAC report pertaining to the adoption of TLCM aim to:
• take account of full life costs; and
• consider the implications in delivering the desired capability across all eight Defence Lines of Development (DLoDs).
Key perceived benefits of TLCM include:
• ability to reduce cost / improve capability delivery through synchronisation of planning assumptions, resources, etc. across all of the DLoDs;
• improved coherency between both new and in-service equipment in related capability areas; and
• more effective management of capability through life (equipment upgrade vs. new, investment timing, user needs, etc.).
87 Healthcheck on TLCM project (25 Mar 2009) 88 ‘Through-Life Management’, NAO (May 2003)
152 152
Review of Acquisition
7.10.1. Progress to date with TLCM
In relation to TLCM, DACP initially focused on embedding TLCM principles in each stage of the acquisition process. A fuller implementation of TLCM envisaged significant changes both to the way the Department planned for the future and in its organisation. As at mid 2009 it can clearly be said that most (if not all) of the EAC report’s “tangible” recommendations in respect of TLCM have been implemented by the Department, including the merger in April 2007 of the DPA and the DLO into a single organisation, DE&S.
However, there remains considerable room for progress on some of the report’s less tangible recommendations (e.g., increase the realism in planning defence capability). The introduction of TLCM across the MoD is, therefore, widely considered “work in progress”.
The Department is now in the early stages of “Phase 4” of TLCM deployment. A key objective of this phase of work is to aggregate related projects into coherent Through Life Capability programmes.
To achieve the programme based approach envisioned for Phase 4, a number of organisational actions have been taken in 2009:
• the MoD Centre requirements organisation (previously the ECC) has been restructured into the MoD Capability Sponsor;
• Capability Planning Groups (“CPG”) and Capability Management Groups (“CMG”) have been established to formulate approved Strategies and Plans for their capability areas (i.e., translation of policy into plan);
• Programme Boards (“PB”) for c.40 programmes have been established in order to “ensure delivery of an agreed and coherent combination of DLoDs and projects, within programme approvals and available resources, in order to enable the User to generate Force Elements at Readiness and Sustainability”89. The PBs are typically chaired by the MoD Heads of Capability (broadly the old DEC posts), with representation from all DLoD Owners (normally drawn from the User), SIT, Defence Resources (as required), Sub-Group leads (as required), Industry where required and Programme Support Function Leaders; and
• Programme Support Functions (“PSF”) have been designated, comprising a standing team provided by DE&S to deliver information, analysis, options and recommendations along with a secretariat function to the Programme Board.
89 Programme Board Generic Terms of Reference, Acquisition Operating Framework

153 153 Review of Acquisition
7.10.2. Potential barriers to further progress with TLCM
Despite the Department’s progress to date in implementing TLCM, there remain significant barriers to the continued development of this approach. These include:
• complexity of organisational structure impeding transition. To many participants in the acquisition community, the complexity of what is intended appears significant, and there are concerns that the desired outcomes, whilst theoretically valid, are a level of change too great for an organisation that has been in “change mode” non-stop for a decade. In particular, the role of Programme Boards appears to be unclear for many outside MoD Centre or the senior management of DE&S. The changes that underpin the “Unified Customer” appear to be coming from the MoD Capability Sponsor with varying degrees of vigour, depending on the capability area.
• effective management of so many bilateral interfaces by the subordinate IPT (i.e., with PB, CPG, CMG, MoD Capability Sponsor, FLC, DE&S operating centre, DE&S corporate centre) whilst delivering large, technically challenging projects;
• divided budgetary responsibilities across the capability area. Management of money between budgets to optimise for capability will remain very challenging either in-year, or in planned future years;
• accounting systems and management information not currently aligned to “capabilities”;
• the incremental administrative overhead incurred by DE&S operating centres and IPTs because of the new programme oversight bodies (in addition to existing MoD structures); and
• the perceived relevance of TLCM to each of the parties involved.
Further to the concerns listed above it is worth noting again that the current level of overheat in the equipment programme as a whole militates against making short-term spending commitments which are easily justified by reference to long-term benefits. These local difficulties prevail against the principles of TLCM.
7.11. Industry perspectives on the MoD acquisition process
• Industry was keen to emphasise the potential for alternative acquisition processes that de-risked the individual technological leaps required (e.g., incremental / evolutionary / spiral acquisition). Industry was comfortable with capabilities designed for later upgrades and the use of “technological insertion” (i.e., modular designs).
• As regards MoD processes, the Review team heard consistently negative feedback about the MoD bidding processes. The key issues
154 154
Review of Acquisition
raised were that the process itself was far too long and as a result too expensive.
7.12. Progress on efficiency improvements in non-IPT led support provision
The Review team also found a number of further DE&S initiatives outside the IPT-led areas which are aimed at reducing overall equipment support costs.
7.12.1. Joint Support Chain (JSC) reform
The JSC plays a key role in linking DE&S to the Armed Forces, ensuring there is adequate support for the equipment and personnel on the front line.
There are currently 6 business areas within the JSC:
• Supply Chain Support (SCS): provides specialised support services, policy formulation, programmed change and authoritative guidance in supply chain disciplines
• Commodities Cluster: ensures the front line is equipped with fuels, clothing, food and medical supplies
• DSCOM: ensures a timely delivery of materiel and support to the front-line
• DSDA: storage, distribution and processing organisation
• British Forces Post Office (BFPO): mail and post office counter services to forces personnel and their dependents
• Disposal Services Authority (DSA): provides disposals and sales service
As part of PACE initiative90, the JSC will to undergo a number of reforms over the next four years. These changes aspire to create a seamless, end-to-end (E2E) JSC, which works more closely with a number of other areas within DE&S and the MoD to ensure effective through-life planning.
The new structure will consist of the following components:
• Operations Support Function: management of the end to end supply chain, which DSCOM will be responsible for running
• Supply Chain Management91: provide clear JSC strategy and planning capability for key stakeholders (IPTs, MoD centre)
• Through-Life Support team92: provide policy, assurance, guidance and advice to aid effective and affordable through life support solutions to be developed
90 Performance, Agility, Confidence & Efficiency initiative, for further detail see Chapter �8 and �Appendix C 91 Renaming of SCS as at April 2009
155 155 Review of Acquisition
• Logistics Network Enabled Capability (Logs NEC) Programme Team: a new approach for delivering, managing and exploiting E2E information from OEM to 1st line
• Integrated Provider Group (IPG): merger of DSDA, BFPO and DSA
• Commodities: unchanged from current structure
• Business Support Group (BSG): support and advise Director JSC, provide strategic direction and coherence for the operating centre and functional direction, advice and support to business units
7.12.2. Reform of Inventory Planning & Management
Introduction of inventory planning has been made mandatory for IPTs, with the intention of optimising inventory on a through life basis to maximise availability and equipment sustainability within constrained Departmental resources.
A suite of new stock accounting systems, the DE&S Stock Accounting Collation Systems (“DSACS”) has recently been introduced. The implementation has been considerably complicated by the need for integration with legacy systems and phased migration of DE&S onto the DII IT platform. The system, which is now fully deployed, has the potential to provide significant improvements in transparency of stock holding by the MoD.
An internal audit / assurance process of IPT inventory plans has been in place since April 2008. Under this process IPTs are measured upon quality / robustness of the plan in place for inventory control and supported by the JSC (as was) in developing fit for purpose models of inventory requirements to meet “best practice” standards. However, improvement in IPT coverage of inventory planning has been slow, and there appears to be significant scope for improvement in many inventory plans.
Actions are underway to improve management reporting of inventory and place greater focus on improving inventory management practices. A new ‘Management by Facts’ tool, referred to as the DIET (Defence Inventory Effective Transformation) project, aims to track number of metrics each month to understand the inventory planning performance of IPTs. Key measures will include the availability of requested items, the value of the inventory held and the percentage of disposals made.
These initiatives will go some way towards reducing inventory costs within IPTs and in turn overall support costs. Although the Team has not carried out any independent review of these programmes, it appears to be the case that there is scope for significant efficiencies to be extracted from the MoD’s inventory planning and management practices.
92 Joined JSC team from DGS&E as at April 2009
156 156
Review of Acquisition
7.12.3. DSCOM reform
DSCOM is the element within the JSC that is responsible for ensuring the timely delivery of available materiel to the Front-line by planning and acquiring agreed storage, transport and travel services for DE&S. Performance relative to IPT requests are tracked on a monthly basis.
However, the tracking of this performance is can problematic as a result of two key factors:
• Underlying IT systems are complex and out-of-date: Within the logistics area there are three legacy systems (one for each Service) each of which is supported by a number of smaller systems. In total around c.140 IS are used across the logistic environment, a “spider’s web” of systems which overlap in capabilities and is fragile in terms of performance and data integrity.
• IPTs frequently codify equipment and spare parts incorrectly. Discussions with staff at DSCOM suggest when parts are requested data flows render it virtually impossible to track them down. Often leads to the JSC failing to support in-service equipment adequately.
These issues have constrained the ability of the JSC to improve inventory management to any significant extent.
Some of the management information / data issues may be addressed through the forthcoming deployment of the Enterprise Data Warehouse (“EDW”) which seeks to consolidate data from around the MoD. The introduction of the EDW system will provide a central data repository for DE&S, making it easier for all DE&S and FLC staffs to use the same data set to manage Inventory and assess JSC performance
More stringent enforcement of “Purple Gate” materiel acceptance requirements with suppliers and IPTs should improve the ability of the supply chain to support UOR equipments whilst in-service.
7.12.4. DSDA reform
Defence Storage and Distribution Agency (DSDA) was created as a result of the 1998 SDR. DSDA sits within the Joint Support Chain in DE&S with a role to manage storage, processing and distribution tasks on behalf of its main customer base, the IPTs. In addition, DSDA has the capability to undertake repair and refurbishment, processing and testing of materiel, as well as operating the reverse supply chain93.
In 2005, the MoD chose the in-house proposal put forward by DSDA to meet the Future Defence Supply Chain Initiative (FDSCi). Major changes were
93 The reverse supply chain is defined as the process by which surplus, repairable, damaged or waste materiel is returned for reallocation, reclamation, repair or disposal
157 157 Review of Acquisition
subsequently instructed in order to achieve savings of c.£50m p.a. by 2010. The changes included:
• 40% reduction in headcount; and
• three site closures: Stafford (by end 2007), Llangennech (by mid-2008), Longtown (by mid 2009).
DSDA has produced savings of approximately £60m p.a. since 2005.
However, DSDA recognises that there is scope for further improvements in efficiency and effectiveness. A recent initiative by the Treasury, the Operational Efficiency Programme (OEP)94, has proposed a new business model for DSDA to make better use of the resources available.
A number of actions are to be implemented, including:
• merger of DSDA, British Forces Post Office and the Disposals Services Authority (DSA) into a single Integrated Provider Group (IPG) in order to rationalise overheads and take advantage of potential synergies; and
• introduction of shadow charging to IPTs, to ensure internal customers become responsible for the costs that are borne by DSDA on their behalf.
For example, in these discussions it was noted that within the last 5 years only c.35% of the materiel stored moved and there is an increasingly large number of product lines stored (c.1.4m lines), many are or relate to equipment that is no longer in use.
The DSDA service is currently “free” to the IPTs (i.e., no charge is placed on the IPT) and spares / inventory is not charged against the RDEL control total until used. Therefore there appear to be inadequate incentives for the “owners” of inventory (the IPTs) to minimise their stockholdings for the benefit of the wider system. If IPTs were charged for the cost of storing (and distributing) materiel, it may lead to a more efficient use of the service. In addition the merger with DSA is intended to allow IPT to dispose of those assets no longer required in a more efficient manner.
Reforms within DSDA remain ongoing and there is still potential for further commercial opportunities which will take the form of partnering and growing third party revenues95.
94 Operational Efficiency Programme: final report, HM Treasury (Apr 09) 95 This is a response to the contracting for availability scheme which will mean that DSDA is no longer the primary logistics supplier for the MoD, and will be required to co-operate and compete with other companies and will need to be in a position to exploit outsourcing opportunities
158 158
Review of Acquisition
7.13. Key observations on procurement performance
• Departmental equipment project performance remains relatively poor, with delays of c.80% and cost increases of c.40% vs. initial estimates. It is notable that cost and duration escalation appear to be recognised primarily when projects are relatively mature (over 75% duration expired between Main Gate approval and latest forecast ISD).
• Whilst the Department measures performance vs. Main Gate, projects are accepted onto the Equipment Programme based on Initial Gate estimates. Therefore the cost increase from Initial Gate is of material concern.
• Within the average data for mature projects96 it should be recognised that:
− large projects (spend / duration) appear more likely to be subject to significantly greater delays and cost overruns than average; and
− projects which have benefited from the application of Smart Acquisition principles throughout their lifecycle appear somewhat less likely to be late and over the estimated cost defined in the Main Gate business case (although the causality of this benefit remains uncertain due to the nature of “Smart” projects available for analysis).
• DE&S’ management of risk (through maintenance of the 10%, 50%, 90% estimates for duration and cost) appears to be relatively poor.
• It is not clear from the data which are currently tracked by the Department that the consequences of changes to requirements for new equipment are being appropriately captured and considered prior to the change being accepted. Changed requirements were reported to be a significant issue in the qualitative research process that the Review team has undertaken, but the evidence is less obvious in the self-declared quantitative data which exists within the Department. The Review team believes that significant data anomalies exist; this undermines somewhat the Review team’s confidence in the self-declared quantitative information on causes of change to cost and time estimates.
• The UOR process is perceived by the Front Line Commands to be working, an assertion that is supported by the limited analysis which the Review has conducted. The increased importance afforded to the time dimension in the Performance / Cost / Time envelope during UOR procurement appears to force more meaningful trade-offs with cost and/or performance.
• The full cost of delay on projects in the EPP is not being captured by the Department and is significantly greater than the costs monitored by the NAO in the Major Projects Reports. Unmonitored costs are
96 Those more than 75% complete or in-service
159 159 Review of Acquisition
significant at a Departmental level although challenging to estimate due to limitations of the data
− Departmental costs associated with the run-on of existing equipments, and those costs incurred within DE&S (primarily costs associated with maintaining project teams longer than necessary) are not currently tracked in any systematic way.
− it is clear that the costs imposed on industry as a result of delay and opportunity costs from delays to equipments in the EPP are significant, but they are subject to considerable uncertainty.
• A large number of factors exist from relatively early in a project’s lifecycle that later lead to delay and increased costs. This includes the failure of the Department to consider whole life costs on a regular basis throughout the CADM phase of the CADMID cycle. These effectively hide true costs and store up problems for later in a projects life (including support costs whilst in-service) and are incentivised by the network of user / customer / supplier relationships as it currently exists between FLCs, MoD Capability Sponsor, DE&S and industry.
7.14. Conclusions and recommendations: Customer-Supplier relationships
7.14.1. Key observations
This chapter has outlined a series of issues around the underlying causes of programme overheat and poor performance in terms of project outputs from DE&S. These are interrelated, and it is difficult to ascribe “blame” to one part of the organisation or the other for failings of the system. Specifically:
• current budgetary arrangements allocate the EPP resources in-year to DE&S, rather than the Capability Sponsor as customer. This removes incentives for MoD centre to focus on the performance of the delivery organisation (DE&S) against requirements and encourages extensive changes or delays without responsibility for the consequences on costs or contractual arrangements;
• the acquisition process is partly responsible for system performance problems and DE&S’s role in the process is ambiguous:
− it acts in concert with the customer to do its best to provide reasonable outputs from an overall equipment programme that is fundamentally unaffordable, and individual projects that are often unstable in terms of specification and timing; and
− it is also judged both inside and outside the Department for delivery of projects via contracts with industry to time, budget and acceptable performance.
• it is difficult to judge the performance of DE&S on a stand-alone basis because it is providing a “soft” service to the customer in accommodating unrealistic expectations and extensive changes
160 160
Review of Acquisition
without push back or appropriate contractual change mechanisms; and
• costs of delay or change that arise from programme unaffordability or lack of project “lock down” are not measured in any systematic way. Internal costs (e.g., standing DE&S resources during a project delay) are effectively free goods. External costs may or may not arise depending on the contractual arrangements, although it is likely that excess costs borne by industry will eventually be reflected in future MoD business.
7.14.2. Recommendations
Recommendation 4
Clarify roles and create a real customer-supplier relationship between the capability sponsor (MoD centre) and project delivery (DE&S)
a) DCDS(Capability) to be responsible for the creation and control of requirements, and required to control the budget of the agreed EP as a single point of MoD contact with DE&S for equipment.
b) Clear ownership of each project/requirement to be allocated to a single individual within DCDS(Capability) team, including business case formulation.
c) DE&S to be responsible for programme management and delivery against agreed requirements specification and budget.
d) Changes to requirements, programme delays, etc. to be specifically and realistically costed and included in the next iteration of the plan. If any increases threaten affordability (as is likely) cuts must be made elsewhere.
e) Cost of DE&S resources on projects should be tracked and charged.
7.14.3. Commentary
The problems described above are the inevitable consequence of the systemic problems described earlier in this chapter and in Chapter �6 (e.g., overheated programme, immature technical solutions, constant changing and shuffling of requirements). To cope with these problems whilst delivering a reasonable set of outcomes, the central customer and DE&S have had to work together without excessive finger pointing around the inevitable shortcomings in capability delivery. As noted elsewhere, systematic delay has been the “acceptable” consequence of this troubled process.
161 161 Review of Acquisition
The original Smart Acquisition principles set out a model for acquisition with a clear distinction between customer and project deliverer. The recommendations above would reassert this principle, but in the context of an affordable, stable and technically realistic EP. The relationship would move firmly toward a “hard boundary”:
• the customer would specify firm requirements to DE&S and hold the funding for successful delivery against these projects. It would also accept full time and cost responsibility for changes to projects that it initiates itself. These costs should include indirect and MoD internal costs; and
• DE&S should be measured on delivery against these clarified requirements. With the clarity proposed, it would be unable to pass blame for some performance shortcoming back to the “system”, as it can legitimately do today.
Again, it should be emphasised that “un-blurring” the boundary between the Capability Sponsor and DE&S will only work in the context of a successful implementation of changes proposed to the upstream planning and resourcing issues.
7.15. Conclusions and recommendations: Shortcomings in the project approval process
7.15.1. Key observations
Chapter �6 and this chapter refer to issues around project and programme decision-making processes, including capital project approvals, associated support expenditures, and, more recently, cross-DLoD initiatives. Key issues include the following:
• project approvals are based on business cases embedding costings that systematically prove optimistic, and on affordability assessments that are based on an unaffordable EPP; and
• the process of bringing projects to the IAB is cumbersome, often wastes too much time, and appears to be used as a de facto throttling process on overall EP commitment levels.

162 162
Review of Acquisition
7.15.2. Recommendations
Recommendation 5
Revise aspects of the Approval process to improve decision making
a) IAB to report to Executive Committee on control of equipment approvals. IAB charged with consideration of the affordability of total programme, not just single projects. Chair of IAB to be taken on by MoD DG Finance.
b) Current Initial Gate/Main Gate approval process to be retained.
c) Scrutiny community to be expanded / up-skilled to provide early advice to IPT Leaders on the preparation of business cases.
d) Mandatory use of parametric data, independent cost estimations and other “should cost” tools to be used as basis of preparation of business cases.
e) Projects pre-Main Gate should be included in the plan at 90th percentile cost.
f) No business case should be accepted, nor requirement included in the overall plan, other than on the basis of costs derived as above.
7.15.3. Commentary
IAB Role. Given the recommendations set out earlier, the IAB’s mandate and approach would need to be adjusted to fit into the arrangements around a new Executive Committee considering affordability, as well as the external costing checks and balances. This is intended to ensure that there is consistency in framing project plans for inclusion in the EPP with the process for approval to actually commit to this expenditure. Also it is clear the IAB should move away from a process that examines a sequence of isolated projects as they arise to a role which is more tied to the shape of the evolving equipment plan, including the periodic review of projects that have already been approved.
Scrutiny. The role of scrutiny is important in shaping the business cases that are eventually presented for consideration. Concerns that its functions are potentially duplicated by assurance activities within DE&S are considered elsewhere, but there would appear to be a case for considering a more streamlined “cradle to grave” support and challenge activity to the acquisition community. DE&S should be providing reliable input to business cases, but ultimately, the Capability Sponsor is seeking approval to commit funds and, under proposals here, would be the budget holder as well. The cost and “do-ability” inputs from DE&S are, however, central to the business case. If these prove unreliable or overoptimistic, the Capability Sponsor is exposed.
163 163 Review of Acquisition
Hence the role of Scrutiny would need to be clarified as one of providing the support to the Sponsor to ensure the inputs it is receiving have been adequately vetted.
Cost Inputs. In terms of “should cost” or parametric modelling, there are a number of approaches that could be adopted and the detail of this element of the recommendation would need to be considered further. However, there are a number of criteria that should be adopted:
• the source of costings should be scrupulously independent of MoD influence;
• the processes for deciding on cost inputs or input ranges should be clearly mandated, with a bias toward conservatism. This should be implemented and monitored outside of both the Capability Sponsor and DE&S; and
• the costings need to take account of risk in terms of cost range, as well as time to complete.
7.16. Conclusions and recommendations: Support of In-Service Equipment
7.16.1. Key observations
Detailed evaluation of the performance of the organisation in managing the very considerable expenditure on equipment support was not possible within the timeframe of the Review, but the Team did analyse high level trends and seek input from a reasonably wide range of individuals involved in the planning, contracting and operational aspects of support. Although further work needs to be undertaken in this area, important conclusions emerge:
• In conjunction with industry, the MoD has developed and deployed innovative CfA and CfC support solutions over the last decade for equipments both new and in-service. These have generally led to significant reductions in cost vs. “traditional” models.
• The extent to which equipment support costs can be further reduced using these techniques remains unclear, but the scale of cost reduction seen in example CfA type arrangements and the currently limited number of these contracts suggests that considerable further savings may be available (given suitable DE&S skills to deliver the contracts).
• However, existing contracts are perceived to suffer two drawbacks, which will need to be addressed before further major progress can be made:
− there is a perception that they are inflexible, and lead to “silting up” of the programme with cost; and
164 164
Review of Acquisition
− there is concern regarding inadequate integration with support delivery elsewhere in the MoD (e.g., inventory visibility through management information systems).
• Although this Review has not conducted a thorough audit of business areas such as DSDA and JSC, it appears clear that severe issues with management information are impeding the ability to improve affordability elsewhere in the programme. The introduction of shadow charges by DSDA may serve to improve inventory control policies by IPTs.
• TLCM is attempting to extend decision-making beyond the current IAB project and equipment-centric process to a programme and cross-DLoD framework. This undoubtedly is correct theoretical approach, but many members of the acquisition community are concerned that TLCM is too complex and risks further blurring the responsibilities and accountabilities for major expenditures.
• Current processes struggle to embed effective consideration of Through Life Cost of equipment (up-front plus ongoing support) and decisions appear to still be driven by the up-front capital commitment.
7.16.2. Recommendations
Recommendation 6
Further cost reductions within in-service support should be pursued vigorously and the aspirations of TLCM should be reappraised
a) Significant further external work should be commissioned as a matter of urgency into the costs and function of in-service equipments.
b) Once a new Strategic Defence Review has determined the future force structure for the MoD there should be much more use of contracting for availability to be included in initial equipment acquisition to align incentives between manufacturers and MoD.
c) Role of TLCM and Programme Boards to be re-considered. Current structure overly complex and lacking data for decisions.
d) TLCM to focus in first instance on financial modelling of acquisition vs. support costs. Financial models to be acquired to model these variables (cf. British Airways), DGD Commercial to control, reporting to MoD DG Finance.
7.16.3. Commentary
From discussions across the Department and in industry it is clear that savings to date due to support process reform and improvement may have
165 165 Review of Acquisition
only “scratched the surface”. The support area has suffered historically from a lack of clear information, which holds up the identification of cost saving opportunities and other efficiency improvements. There needs to be a clear priority within the department to drive forward improvements or else risk knock-on pressures from an ESP that is set to grow substantially in the face of Departmental funding pressure.
The recommendations relating to TLCM are not meant to imply that defence planning should remain based on DLoD silos, but rather that the implementation of wider planning and optimisation processes could deflect attention away from significant problems in optimising across equipment and support. Longer term benefits of optimisation across all defence expenditure should remain an objective of the acquisition process, which could be realised once information systems and other organisational and process changes advocated here have been fully developed and implemented.

166 166
Review of Acquisition
8. PROGRESS IN REFORMING MOD ACQUISITION DELIVERY
8.1. Overview
In this chapter, the Review seeks to reflect upon the changes of the past decade, and the impact that they have had on DE&S’s performance (and that of its predecessor bodies). The extent to which these initiatives solved the problems that they sought to address is also considered. It also discusses the way in which DE&S interacts with industry, with a view to determining the nature of the improvements which need to be made in that regard. The chapter concludes with recommendations about the further changes that the Review considers to be necessary if DE&S is to become a top performing manager of acquisition delivery for the Department.
8.2. “Smart Acquisition”
8.2.1. Key principles reviewed
In earlier sections, the relative performance of projects conducted under the “Smart Acquisition” framework was presented. Here, the extent to which Smart Acquisition was implemented as conceived is considered. This assessment is based on discussions with a wide range of individuals from MoD Centre, the Capability Sponsor, the User, DE&S and industry, supplemented where appropriate by further specific analysis.
Smart Acquisition had at its core seven key principles:
• revise the front-end process of project delivery to deliver robust requirements and increased value for money over the whole life of the equipment;
• restructure the organisation around focused Integrated Project Teams;
• introduce streamlined approvals and oversight mechanisms to deliver improved scrutiny, whilst reducing delays;
• implement powerful contractor incentives to reward co-operation in capturing savings and penalties to punish non-cooperation;
• simplify procurement processes for smaller projects;
• clarify accountabilities, roles and organisational structures across the acquisition community; and
• restructure in-service support.
Each of these principles is considered in turn.
167 167 Review of Acquisition
1. Revise the front-end process to deliver robust requirements and increased value for money over the whole life of the equipment
This first principle set out some key parameters of the CADMID Assessment process intended to take potential projects from concept through to potential Main Gate approval. The assessment phase was supposed to constitute a relatively “low hurdle” for entry, but was expected to screen out or risk-reduce projects before proceeding to full implementation. Specific objectives for the Assessment process included:
• increasing the proportion of spend at the front-end before “locking down” major expenditure post Main Gate (a rough guideline of 15% of total project spend was suggested);
• implementing a revised and clarified risk-reduction process;
• ensuring that trade-offs between performance, cost and time are made appropriately; and
• introducing design-to-cost principles.
Chapter �7 considered the effectiveness of the Assessment process based on analysis of project data. This analysis shows that up-front expenditure has been significantly below the indicative target, few projects are screened out or significantly reshaped, and technical risk levels remain very high heading into Main Gate.
Aside from what the data show, discussions with the acquisition community about the effectiveness of the Assessment phase process confirmed that it is not working as intended. They believe it serves primarily as a preparatory stage for projects that were highly unlikely to be cancelled, rather than a screening or refinement process. Initial Gate appears to act as a “mini-Main Gate” rather than the low hurdle intended. From time to time, the Assessment phase is also used as a throttle on large expenditure commitments, held up by various process and decision-taking activities until they are deemed to be affordable – a sort of holding pattern rather than a legitimate phase of work to clarify requirements.
2. Restructure the organisation around focused Integrated Project Teams
“IPTs” were intended to include all key internal stakeholders and industry as full members. Further, it was anticipated that they would:
• provide consistency and continuity of approach throughout the project life-cycle;
• ensure close and effective involvement of stakeholders in decision making; and
• ensure clear responsibility and accountability for delivery of projects.
168 168
Review of Acquisition
Discussions across the acquisition community confirmed that this principle of Smart Acquisition had been firmly embraced and implemented post-1998. These organisational changes produced a structure across the old DPA and DLO with around 110 IPTs, with flat reporting structures up to the top of these organisations.
However, post-DE&S formation, this structure has now evolved into 9 operating centres, with various structures of teams reporting in. Some of these structures are simply amalgamations of old project and support IPTs in a given area; others have been reorganised more radically to reflect new ways of working (e.g., in Complex Weapons) or better reflect the common links across activities in the cluster (e.g., Ships and Submarines where teams often handle a set of activities over a range of similar platforms).
There was a clear divergence of views within DE&S on these changes. Those involved in IPTs delivering new equipment (i.e., ex-DPA) generally held the view that organisational changes were a backward step because they inserted new layers of management and risked loss of focus and accountability. Those outside of these teams felt that clustering was beneficial in reducing the strong silo tendencies associated with independent IPTs and provided greater input and oversight from more experienced management with broader perspectives than just those from an individual project.
3. Introduce streamlined approvals and oversight mechanisms to deliver improved scrutiny, whilst reducing delays
At the core of the approvals process there was to be clearly defined single approval point at the end of the Assessment phase – i.e., the Main Gate approval. Additional ongoing oversight was to be provided by the customer, and by independent technical and financial scrutineers attached to project teams on a full- or part-time basis.
Although the Main Gate process has become a cornerstone of the acquisition process, the scrutiny and related assurance processes have developed into what most view as an increasingly onerous and unproductive set of processes and organisational “checks and balances”. These certainly do not streamline oversight nor do they provide genuine independent financial or technical input. These issues are discussed more fully later in this chapter.
4. Implement powerful contractor incentives to reward co-operation in capturing savings and penalties to punish non-cooperation
There were mixed views on how much progress had been made in achieving this objective, although most believed time and experience were bringing benefits. In particular, there was increasing emphasis on seeking the right balance with industry in terms of partnership, competition and risk sharing, although the actual results in terms of financial and other benefits varied
169 169 Review of Acquisition
widely. Some further considerations from industry are described where relevant in other chapters of this report.
5. Simplify procurement processes for smaller projects
This was defined (at the time) as the customer taking full responsibility for key decisions at the Main Gate stage for projects <£50m, only referring projects >£100m to 2* level for approval, although the general thrust was for different approaches for projects with different scales of complexity and risk. This would allow more attention to be given to larger expenditures with higher levels of risk.
Feedback from both DE&S and MoD Centre suggests that things moved in this direction following the formal launch of Smart Acquisition, but have now swung back to a point where small projects follow nearly as complex a process of assurance, scrutiny and approvals as larger ones.
Increased delegation of project approvals have been largely reversed, as the system appears to be increasingly aimed at slowing down / throttling expenditure, irrespective of the circumstances.
6. Clarify accountabilities, roles and organisational structures across the acquisition community
Central to the required changes was clear definition of a budget-holding customer for each IPT across every stage of its project life-cycle. The role of the then Procurement Executive was to be a supplier of equipment procurement services, which required clear definition of the customer-supplier relationships. This was intended to be a precursor to a move toward Trading Fund status.
There were to be two distinct customers:
• one, central, customer makes trade-offs across capabilities and equipments; these customers should be arranged around 12-15 cross functional capability groups, each led by a senior Capability Manager who has significant delegated financial authority; and
• the other customer, involved only later in the process, is the end user.
In general, the Smart Acquisition transformation initiatives were viewed as having improved the processes and accountabilities considerably, but a number of shortcomings were described. These include:
• budget-holding is not delegated to the Customer. DE&S is the TLB holder for both EPP and ESP expenditure in-year, and the ECC and Front Line are not operating contractually with DE&S on a financial basis;
• DE&S is not sufficiently “arms length” from its customers to be held accountable for problems in project delivery. For example, requirements from the ECC / MoD Capability Sponsor often change in

170 170
Review of Acquisition
the course of live projects, and DE&S does not seem empowered to push back where these changes have significant consequences on time or budget. They are more inclined to “keep the customer happy” almost irrespective of the consequences on either the equipment programme or on performance of individual projects;
• interface with the User is still relatively unclear to many participants in the new equipment procurement. The introduction of Chiefs of Materiel in the DE&S structure is viewed as confusing and of questionable value; and
• conversely, project teams within DE&S that are principally delivering support are well aligned to the User, but less clear on the roles of the MoD Capability Sponsor in planning or programming of support.
It should be noted that there are change programmes and other initiatives underway which may help to address some of these issues (particularly in relation to TLCM implementation), but there are currently no moves to amend budget responsibility or to encourage more autonomy for DE&S to put trade-offs back to the customer for resolution, and to be judged on its merits in delivering what has been agreed.
7. Restructure in-service support
Support in 1998 was viewed as fragmented and high-cost. The following enhancements were identified:
• manage risk, as far as is possible, within the private sector;
• decrease stockholdings by introducing best practice supply chain management techniques;
• rationalise and centralise storage and distribution with tasks outsourced wherever possible;
• fully consolidate the supplier base for the purchase of routine items, with less public sector involvement and fully implemented tri-Service rationalisation; and
• develop a consolidated IT strategy that delivers the required management information necessary to drive the implementation of best practice across all three Services.
It should be noted that these were conceived in the context of a distinct procurement organisation and separate support and logistics entities, but are nonetheless, still broadly relevant post-formation of DE&S.
At a high level, it has taken some time to make progress on these initiatives and there is much still to be done, not least in developing a consolidated IT strategy which can deliver reliable information around the business to assist in further improvement. Further comments on support are contained in Chapter �7.
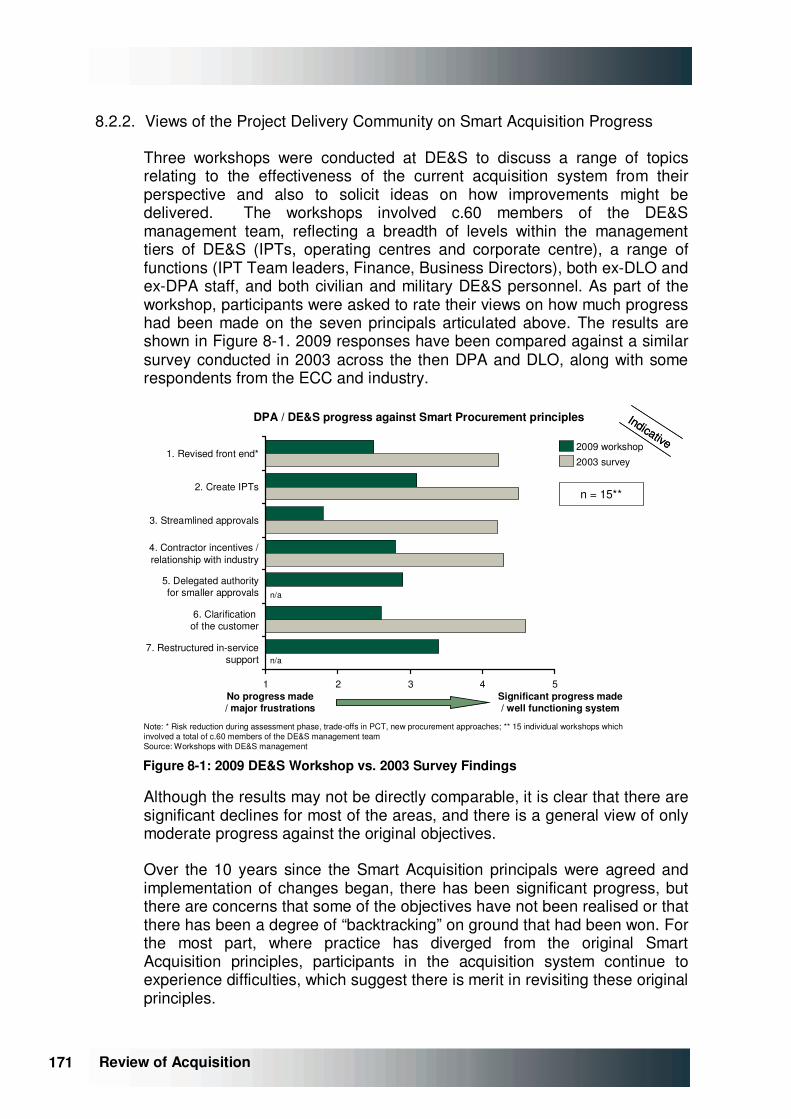
171 171 Review of Acquisition
8.2.2. Views of the Project Delivery Community on Smart Acquisition Progress
Three workshops were conducted at DE&S to discuss a range of topics relating to the effectiveness of the current acquisition system from their perspective and also to solicit ideas on how improvements might be delivered. The workshops involved c.60 members of the DE&S management team, reflecting a breadth of levels within the management tiers of DE&S (IPTs, operating centres and corporate centre), a range of functions (IPT Team leaders, Finance, Business Directors), both ex-DLO and ex-DPA staff, and both civilian and military DE&S personnel. As part of the workshop, participants were asked to rate their views on how much progress had been made on the seven principals articulated above. The results are shown in Figure �8-1. 2009 responses have been compared against a similar survey conducted in 2003 across the then DPA and DLO, along with some respondents from the ECC and industry.
Note: * Risk reduction during assessment phase, trade-offs in PCT, new procurement approaches; ** 15 individual workshops which involved a total of c.60 members of the DE&S management teamSource: Workshops with DE&S management
No progress made/ major frustrations
Significant progress made/ well functioning system
DPA / DE&S progress against Smart Procurement principles Indicative
Indicative
1 2 3 4 5
2009 workshop
7. Restructured in-servicesupport
6. Clarification of the customer
5. Delegated authorityfor smaller approvals
4. Contractor incentives /relationship with industry
2003 survey
3. Streamlined approvals
2. Create IPTs
1. Revised front end*
n/a
n/a
n = 15**
Figure �8-1: 2009 DE&S Workshop vs. 2003 Survey Findings
Although the results may not be directly comparable, it is clear that there are significant declines for most of the areas, and there is a general view of only moderate progress against the original objectives.
Over the 10 years since the Smart Acquisition principals were agreed and implementation of changes began, there has been significant progress, but there are concerns that some of the objectives have not been realised or that there has been a degree of “backtracking” on ground that had been won. For the most part, where practice has diverged from the original Smart Acquisition principles, participants in the acquisition system continue to experience difficulties, which suggest there is merit in revisiting these original principles.

172 172
Review of Acquisition
8.3. Key strategic initiatives post-Smart Procurement: DIS, EAC and DACP
8.3.1. Overview
The first major change subsequent to the introduction of Smart Procurement was the Defence Industrial Strategy (DIS), which was published in December 2005. The DIS reaffirmed Smart Acquisition principles but additionally highlighted the primacy of through life considerations and the need for successful management of acquisition at the Departmental level (see Section �5.4).
In response to the DIS, the Enabling Acquisition Change (EAC) study was undertaken. The objective of this study was to assess whether changes should be made to “the MoD’s structures, organisation, process of culture and behaviours in order to facilitate good Through Life Capability Management”97. The resulting report was published in June 2006.
The concepts developed in the DIS and the recommendations made in the EAC report have since been implemented across the MoD through the Defence Acquisition Change Programme (DACP). Although the programme finished in April 2009, several of its important component parts continue outside of the DACP framework.
8.3.2. DACP
Phase 1 of the DACP, which was completed in April 2007, focussed on implementing the recommendations of the EAC report. The changes that were instituted related mainly to organisational and process change, including:
• forming DE&S;
• establishing the MOD Unified Customer framework in which DE&S interacts with the Requirements Community, Front Line Commands, Science Innovation and Technology TLB and MoD centre; and
• creating the Defence Commercial Directorate to provide strategic leadership on commercial issues for the MoD across all defence issues.
Phase 1 of DACP and was divided into ten key workstreams:
• Acquisition Operating Framework – enable a consistent approach to the way acquisition business is conducted through a framework that supports clear guidance, processes, procedures and continuous improvement;
97 Enabling Acquisition Change, MoD (Jun 06)
173 173 Review of Acquisition
• Planning Process – improve MOD planning process to increase realism and to enable a strategic view of the defence budget across 10 years, including support costs for new and existing capability;
• Approvals & Scrutiny – make commercial decisions on a through life capability basis;
• Relations with Industry – enable a business culture where it becomes normal to share plans, information, aspirations and expectations with industry;
• Governance – have flexible commercial and business models that support appropriate acquisition approaches;
• Research & Development – become more agile in approach to pull through of R&D & streamlined acquisition cycles;
• Through Life Capability Management – establish TLCM in the MOD sponsor organisation;
• Targets & Performance Management – ensure that MOD’s Acquisition Targets encourage TLCM so that management can continue to focus on cost control and timelines and at the same time identify and address systemic issues across Acquisition;
• People Skills & Behaviour – enable and incentivise behaviour change and the development of skills necessary to deliver defence acquisition business; and
• An Integrated Procurement & Support Organisation – fit for purpose on 2nd April 2007, which will then be optimised to deliver sustainable procurement and support capability for operations.
Following the completion of Phase 1, the requirement for more effective delivery of equipment and better skills in the workforce was recognised. DACP aimed to provide, inter alia, greater unity of purpose across acquisition and improved programme and project delivery through:
• a more cohesive, flexible approach to problems, underpinned by core processes consistently applied;
• slicker approval processes, well planned, with fewer people and higher added value by each person;
• professional leaders and specialist staff – both military and civilian – in a leaner, but more professional and high-performing, acquisition corps.
People, Skills and Behaviour (PSB) and Knowledge Management were the two cross-cutting, enabling workstreams in DACP. PSB sought to:
• Individuals – embed Defence Values for Acquisition (DVfA) and close the skills gap.
174 174
Review of Acquisition
• Teams – provide acquisition Leadership, embed TLCM across MoD Unified Customer, agree a strategy for joint work with industry on behaviours and DVfA.
• Organisations – standardise Departmental behaviours, support Role of the Military in Acquisition (ROMIA) implementation.
Planning and TLCM (see Section �7.10) and DE&S PACE programme (see below) were workstreams of DACP.
8.4. Current Change Programmes impacting DE&S
8.4.1. DE&S PACE
Previously one of the four main workstreams of DACP, PACE was designed to enable DE&S to implement changes in a way that was coherent and properly aligned with activities in other parts of the MoD. It also ensured that that centrally led projects were rolled-out across the organisation in a co-ordinated way.
PACE was launched in March 2008 and has three core projects that are due to end by Q1 2012:
• Capability delivery - drawing together related projects into co-ordinated programmes (strongly linked to TLCM and Programme Board agenda).
• Flexible resourcing - a more agile way of working than previously at DE&S where tasks are assigned to people based on priority, making more effective use of the existing skills in the business. In practice, more fluid staffing across business areas is intended.
• Collocation - consolidation of over half the total DE&S staff at Abbey Wood and Corsham. Major staff / post movements are envisaged from Andover, Whyton, Ensleigh, and Foxhill.
PACE is anticipated to deliver significant efficiency savings. A major part of these savings will be due to absolute reductions in staff numbers: 7000 posts will be eliminated by 2012, of the 27,000 in March 2008. And that is on top of the 15% reduction already delivered by flexible resourcing between April 2007 and September 2008. Considerable savings will also be derived from the elimination of overheads due to collocation.
Another component of PACE, more pertinent to the present study, is the initiative to upskill the workforce. This initiative lead to the appointment of Skills Directors, who have been tasked with implementing skills plans and improving skills capabilities across a number of key acquisition disciplines. Following the introduction of PACE, levels of achievement against key training targets have improved markedly.

175 175 Review of Acquisition
The process of attempting to upskill the DE&S workforce through the PACE initiative is ongoing, and it is recognised that the process will take some time to complete. The PACE programme also acknowledges that performance improvements cannot be delivered simply by improving staff skills; systems and incentives also need to be in place to allow staff to utilise new skills within their working practices.
8.4.2. Commercial change and “Fit For Business”
In 1998 Smart Procurement identified need for changes in the MoD’s commercial relationship with industry. This was further reinforced in 2006 when the EAC report defined one of the key characteristics of a high performing acquisition system as “a strong relationship with industry partners to deliver long-term value for money based on trust, openness and a clear alignment of incentive”.
The EAC report found that the quality of relationships with Industry throughout the Department varied that transparency of forward equipment plans and partnering arrangements were comparatively immature and recommended that “a strong commercial team should be built around the Defence Commercial Director to spread good commercial practice, developing a consistent and effective due diligence function”.
Previously part of DACP, Fit For Business (FFB) was a programme which started in January 2008 and which formally concluded in March 2009 to create a framework for, and bring coherence to, a number of existing commercial business change initiatives across the MoD98. Focused on the Commercial function of the MoD both inside and outside of DE&S, its objective was to produce a vision, strategy and five-year delivery plan for improvement. One of its key objectives was to recognise the link between delivery of the Defence Industrial Strategy and improved commercial behaviours by the Department.
Workstreams incorporated under the programme have included:
• Commercial Community
• Professionalism
• Processes and Policies
• e-Procurement
• Book of Business
• Commercial Tools
• Commercial and Business Awareness
• Industry Engagement
• Performance measurement 98 Procurement Capability Review Improvement Plan, MoD (Mar 2009)
176 176
Review of Acquisition
• Standardised contracting
FFB sought to address the variability the quality of the department’s commercial relationship through its skills initiatives and the standardisation of contracts and process. One change that this has instituted has been to establish two new senior (two-star) posts in Defence Commercial Directorate with responsibility for MoD’s industrial relationships and commercial services in January and April 2009, respectively.
The embryonic FFB plan was reviewed by OGC in June 2008, at which point it was determined that FFB had the potential to address many of the OGC’s recommendations for “Procurement Capability”. The same review also concluded that strong Departmental commitment would be required to ensure its delivery.
8.4.3. Commercial change at DE&S
Against this context, DE&S set itself a series of strategic objectives in 2007-08. One of these related specifically to improving its commercial relationships. The department articulated three improvements which it considered to be necessary if that objective was to be achieved. These were:
• better recognition and alignment of risk and reward in agreements between the Department and industry;
• implementation of TLCM; and
• a move towards contracting for availability.
The need to undertake further work so that the approach to risk and reward could be optimised has been recognised by both the MoD and industry. Industry perceives high levels of risk in the MoD acquisition business, although its own project performance against firm or fixed price contracts is also a key determinant of profitability. Long timescales mean that a whole range of factors change during the lifetime of a programme or even a decision-making cycle, introducing risk including cancellation, requirements change, funding changes and delays. Partnering relationships, designed for mutual benefit, that recognise that risk is shared and reward performance against clear targets, were identified as being more attractive to industry.
Chapter �7 described in greater detail the anticipated benefits of TLCM, including better through life planning and more stable programmes. A consequence of these changes would be a more transparent programme around which Industry would be better able to make investment decisions.
177 177 Review of Acquisition
8.5. Acquisition delivery effectiveness: Main areas for further action
8.5.1. Overview
As noted earlier in the Report, DE&S is still a young organisation and there remains much to be done in implementing an ambitious programme of change. These changes are themselves taking place in an even more wide reaching transformation process across the rest of the Department. The Review team recognises the complexity and scale of what is in progress, but has stepped back from the myriad initiatives and programmes to reflect on the following:
1. Will changes underway create a genuine best-practice acquisition delivery organisation when compared to others undertaking similar tasks?
2. Do staff within the DE&S organisation believe changes underway will address shortcomings?
3. Do informed and relevant sources outside the DE&S organisation believe shortcomings can and will be addressed?
The Review team has addressed these questions through a combination of research and extensive discussions (including c.50 interviews with project delivery teams inside DE&S). Based on this assessment the Team has synthesised its concerns around five key themes:
• structural issues around the scope and management of DE&S;
• weak programme and project management skills;
• a lack of independence in conducting its business;
• an underweight financial function; and
• lack of accountability for project performance.
Each of these concerns will be considered in turn.
8.5.2. Structural issues around scope and management
The DPA and DLO were merged in April 2007 in a process that represented a major organisational change. The change was organised quickly and implemented during period of deployed operations yet was completed without major disruption to delivery of capability. This achievement should be seen as a success.
The merger of the DPA and DLO into DE&S created a very large organisation. Although staff numbers have been reduced since 2007, the scope of activities undertaken by DE&S remains very broad. It includes, for example, a much wider range of activities than simply those undertaken by support IPTs, including significant operational, logistical and communications activities.
178 178
Review of Acquisition
Whilst some of these activities could be considered “support” activities and whilst they do obtain some funding from the ESP, they are operationally-driven and provide services to Front Line Commands (or, in some cases, services to contractors working for IPTs, e.g., DSDA is a parts storage agency serving contractors that are delivering equipment support activities). As a result, this Review now finds a DE&S organisation where the delineation of activities delivering logistics support to the front line and providing support services (e.g., Naval Bases, JSC) are operationally clear and distinct from those delivering new equipment and procurement of equipment support activity (i.e., DE&S COO area).
The extent to which genuine benefit derives from putting all these activities together in one organisation is unclear. The benefit of grouping the activities was also questioned by the EAC Report, which recommended the transfer of non-core elements such as parts of the supply chain and/or the naval bases (on the analogy of Strike Command’s ownership of Main Operating Bases).
The Review has not considered in detail possible changes resulting from “hiving off” activities as described above. Nevertheless, separating these “non-project” activities would, in the Team’s view, be the most effective way to focus attention on delivering the changes required to the project delivery activities.
Were the JSC and other support oriented units be separated from the project delivery part of DE&S, it is likely that rationalisation of the overhead and support structures in Abbey Wood would be appropriate. This could include the combination of activities under the Chief of Staff and Chief of Corporate Services, for example, although there are likely to be simplifications and savings beyond this which should be identified and implemented.
DE&S’s breadth of operational scope is reflected in its management structure, which lacks focus on the core area of project management for equipment procurement and support. This lack of focus means that it is not structured in the most suitable way to deliver a programme of c.£12bn p.a.99 on equipment procurement and support.
Within COO’s area, there is consistency of activity and structure. However, the Review team considers that the span of activity that is currently grouped under a single 3* COO post is probably too extensive.
Whilst the Chief of Materiel role has proven useful to ensure continuity during the organisational transition, there has been confusion surrounding the COM roles (evidenced by COO's note to DE&S staff of August 2008, included at �Appendix D), and the Review team's discussions in the first half of 2009 clearly suggest that the continued rationale for the role remains unclear to most of the organisation more than two years after the merger. The Chiefs of Materiel (and supporting organisation) have the potential to create unnecessary distance between FLCs and delivery teams in COO’s area (and further exacerbating the reporting burden), without adding significant
99 c.£6bn EPP and c.£6bn ESP.
179 179 Review of Acquisition
coordination / delivery assurance ability. Feedback garnered by the Review suggests that the role of the Chiefs of Materiel appears to be a confusing and unnecessary layer in the organisational structure which necessarily imports a further single Service bias into the organisation. At best, the CoMs play only a modest part in procurement and support contracting activities. The Joint Support Chain activities appear to function well with direct interfaces with FLCs; CoMs would therefore appear to be superfluous in facilitating efficiencies in that area.
Finally, and in line with thinking elsewhere on skill requirements appropriate for the task, it would appear obvious that the head of the project organisation should have extensive experience in running project-based organisations of similar size and complexity. Enforcing such a requirement renders unlikely that such an individual could be recruited from within the Armed Forces or the Department.
8.5.3. Weak programme and project management skills within DE&S
There is a widespread perception in industry and within DE&S that the Department is unwilling / unable to offer appropriate financial incentives to attract, retain and incentivise skilled personnel of a calibre commensurate with the scale and complexity of the projects which DE&S is tasked to deliver. As a result the skill levels and qualifications held by project staff are often surprisingly limited, given the projects that they are managing. In some instances, project delivery staff themselves also reported that they felt inadequately prepared for the role they had been assigned.
These problems are exacerbated by the current rotation system for military personnel and civil servants, which has created a situation where mobility is prized / required, and tenure is short. Frequent changes of roles render it very difficult for staff to build up the range of relevant skills or develop deep expertise in relevant areas. Skill areas in which DE&S staff and others voiced concerns include:
• project management;
• legal; and
• commercial, including contract structuring and negotiation.
Some interviewees also suggested DE&S often showed poor understanding of / responsiveness to industry requirements.
A key concern of the Review team is the proportion of military personnel within the DE&S organisation tasked with complex project delivery. There is no doubt that the acquisition process is informed by military personnel embedded in DE&S, specifically contributing to the delivery of equipment fit for military requirements. However, currently around 25%100 of staff in DE&S COO’s area are military personnel, many of whom have not previously had
100 1,888 of 7,887 as at AP11 2008/09
180 180
Review of Acquisition
experience of, or demonstrated aptitude for, procurement of significant capital equipments. This scale of involvement by military personnel, combined with the mandated rotation of these personnel, is highly likely to result in skill shortfalls.
The Review has also heard in discussions (with both DE&S staff and industry) that DE&S is too often ill equipped to lead commercial negotiations, feeling “outgunned” and “under-experienced” in comparison to industry partners. Also, the Department often fails to cross-pollinate key learnings from one negotiation to the next (e.g., through use of a subset of the same personnel, close communication, actively seeking advice).
The development of more effective commercial relationships between the Department and Industry, initially envisaged as part of Smart Procurement reform in 1998 and subsequently repeatedly reinforced in other reports and initiatives, has clearly had some positive impact in guiding the Department’s relationships with industry. However, the Review has also found it equally clear that DE&S / the Department is not yet perceived as a savvy, commercial operator in its dealings with industry and is unable to derive the benefits commensurate with this.
In a June 2008 review of attempts to improve the relationship between the MoD and its suppliers, the OGC concluded101 that the success of the reforms had been undermined by two factors: senior MoD executives’ variable levels of engagement; and a failure to “consistently capture the benefit delivered. The report also raised a concern that the improvements did not flow down to key elements of the supply chain.
Whilst positive change to commercial arrangements proceeded most obviously under the banner of FFB, and continues to be developed under initiatives for the new Commercial Services Directorate, it is notable that the problem has proven intractable for the last decade and several organisational structures and may require more fundamental review of the organisation and incentives in order to attract, retain and then organically develop commercial skills of a calibre commensurate with the scale, complexity and importance of the projects which the Department handles.
DE&S operates using business reviews of a standard format, and the recent introduction of Programme Boards (under the broader banner of TLCM) may serve to standardise some processes and tools. Additionally, some common management information systems are well used (e.g., CMIS database, PB&F accounting system).
However, it was notable the systems and methods used to produce inputs to these high level reporting systems were different at IPT level, and invisible to the DE&S corporate centre.
101 Procurement Capability Review Programme – Ministry of Defence’, OGC (Jun 08)
181 181 Review of Acquisition
The usefulness of a number of the high level systems was limited (e.g., for UORs where data reliability within CMIS is reported to be poor). The causes noted were lack of timely reporting of information or lack of useful standardised reports at an IPT level.
Any further development of management information systems should endeavour to:
• seek to develop standardised reporting tools around best current practices, to maximise the usefulness of the tool;
• mitigate the level of duplicate data entry required to minimise reporting burden and ensure consistency between data sets (i.e., enter once, use multiple); and
• maintain flexibility such that new reports / tools can be developed to support one-off analyses and new ways of working.
8.5.4. Lack of independence
It has previously been noted that the merger of the former DPA and DLO organisations was achieved with remarkable speed and effectiveness, particularly given the significant operational demands on the new DE&S organisation. The principal objective of the merger was to bring together the commissioning of new equipment (DPA) with its subsequent support (DLO) so as to provide a better platform for through life management. This objective has been largely achieved.
At the time of the merger, and in order to avoid instituting an ‘us-and-them’ type of attitude, it was determined that DE&S should be an integral part of the MoD and not an agency (as was previously the arrangement for the DPA). This is contrary to the changes recommended as part of the Smart procurement initiative, which sought to clarify the distinct roles of the requirements and the acquisition communities, and put in place appropriate organisational structures.
Since cost estimates and technical specifications are subject to influence from both Heads of Capability and the military, DE&S is not sufficiently ‘arm’s length’ to be held fully accountable for problems in project delivery. Moreover, the MoD now has fewer semi-independent "expert" cost estimators, such as those in the DE&S CAS team, even than it did during the 1990s (c.50 vs. c.90 in the 1990s).
It is recognised, however, that military input to the acquisition process remains important. In the absence of the CoMs, it would be particularly important to ensure that the Armed Forces have input to the acquisition process in order that user needs are adequately taken into account. But this should be the limit of military influence; as described in Section �8.5.2, project management roles should be limited to those with project management experience.
182 182
Review of Acquisition
The alternative scenario, and one encountered by the Review team under DE&S’s current arrangements, is that military staff can occupy line management positions. Since their future career prospects are determined by single Service agendas, incentives (in the context of future career development) could be intension with, or even contrary to, the project’s best interests. For instance, a narrow view of ‘successful’ project delivery could be one in which outstanding platform performance is delivered to a user regardless of cost. The alternative definition of success (in which appropriate trade-offs are made between performance, cost and time) is more likely to optimise the outputs of the entire acquisition system.
Similar logic could be applied to all positions in DE&S which are responsible for project delivery. For this reason, responsibility for making appointments should be delegated to the appointee’s direct report and should remain independent of military influence. The current situation, in which forces outside of DE&S determine the career trajectories of project managers within DE&S is highly damaging and should be stopped.
8.5.5. Underweight financial function
Within DE&S, only around 250 people work under the Director Finance, supervising a spend of around £14bn p.a.. Although there are more financial managers within IPT and cluster structures, the finance function as a whole is felt to be under-resourced to carry any real clout in the department. The finance function’s influence is also considered generally weak in comparison to its role in other organisations. Furthermore, financial professionals within the organisation at all levels find themselves outranked in decision processes – for example, Director Finance within DE&S is a 2* role on a 3* board and DG Finance is a 3* on a 4* board. As a result, important decisions can be made without due regard for their financial implications.
Financial discipline needs to be imposed upon DE&S for two distinct reasons. On the one hand, project costs need to be controlled more tightly in order to reduce overruns and, hopefully, reduce project delivery costs in the long-term. DE&S also needs to track the costs associated with its own operations more effectively in order to drive efficiencies.
Since its finance function is weak, DE&S is not able to adequately challenge flawed cost assumptions in the business cases of the projects that it takes on. This problem is exacerbated by the fact that Capability Sponsors do not hold budgets themselves; as a result, they do not suffer any consequences of project overruns. Rather, the blame is apportioned to DE&S, whilst the responsibility for the cost overruns may well actually lie with the unrealistic original estimates or requirements “creep”.
One solution to this problem would be to allocate budgetary responsibility to the Capability Sponsor102, who would then be held accountable for initial costings. By introducing a ‘hard’ interface between the sponsor and DE&S, it
102 Or FLC in the case of support for in-service equipment.
183 183 Review of Acquisition
would also be possible to incorporate an arrangement by which the customer is explicitly charged for any variations in the project specifications. This approach is entirely consistent with normal commercial practice, and has the benefit of incentivising the customer to determine their needs and state them explicitly at an early stage of the project’s lifecycle. This is generally recognised103 as good project management practice, and is therefore behaviour that ought to be encouraged.
If hard charging interfaces were introduced, DE&S would be required to account for the activities that it undertakes as part of its project management remit in much greater detail. In practice, this means that the use of resources would be tracked to activities, which would force the organisation to recognise where its costs lay. Having done this, DE&S would be better able to explore the opportunities for potential efficiency gains. It would also enable more efficient management oversight and control of DE&S’s activities.
Anecdotally, the Review team understands that DE&S starts the financial year with planned activity in excess of its budget by 10% as a matter of course. This reflects poor financial control and is also a function of overrunning planning round processes.
8.5.6. Poor accountability for project performance
Relatively short tenure of staff in key positions of responsibility
A key concern is the continuity of staff in positions of responsibility. Whilst the benefits of short tenure accrue mainly to staff (primarily appearance of career mobility, breadth of skill set), the dis-benefits would appear to accrue mainly to DE&S and the MoD, including:
• lack of accountability for project performance over the long-term;
• increased reporting / briefing burden (as new senior personnel within and outside the IPT are educated);
• loss of context and knowledge; and
• loss of working relationships.
Figure �8-2 shows an analysis of tenure in post104 for 30 team leaders of large projects being managed by DE&S alongside similar data obtained from 2003105. It is clear from this analysis that the tenure of project leaders has decreased significantly since 2003, from c.3 years on average to less than 2 years on average.
103 See, for example, the discussion in Section �8.2. 104 Self declared tenure in current role as at April 2009, some respondents may have had significant prior experience in the same team but in a different role. 105 Exhibits for Final Report of Smart Acquisition Stocktake (8 Aug 2003)
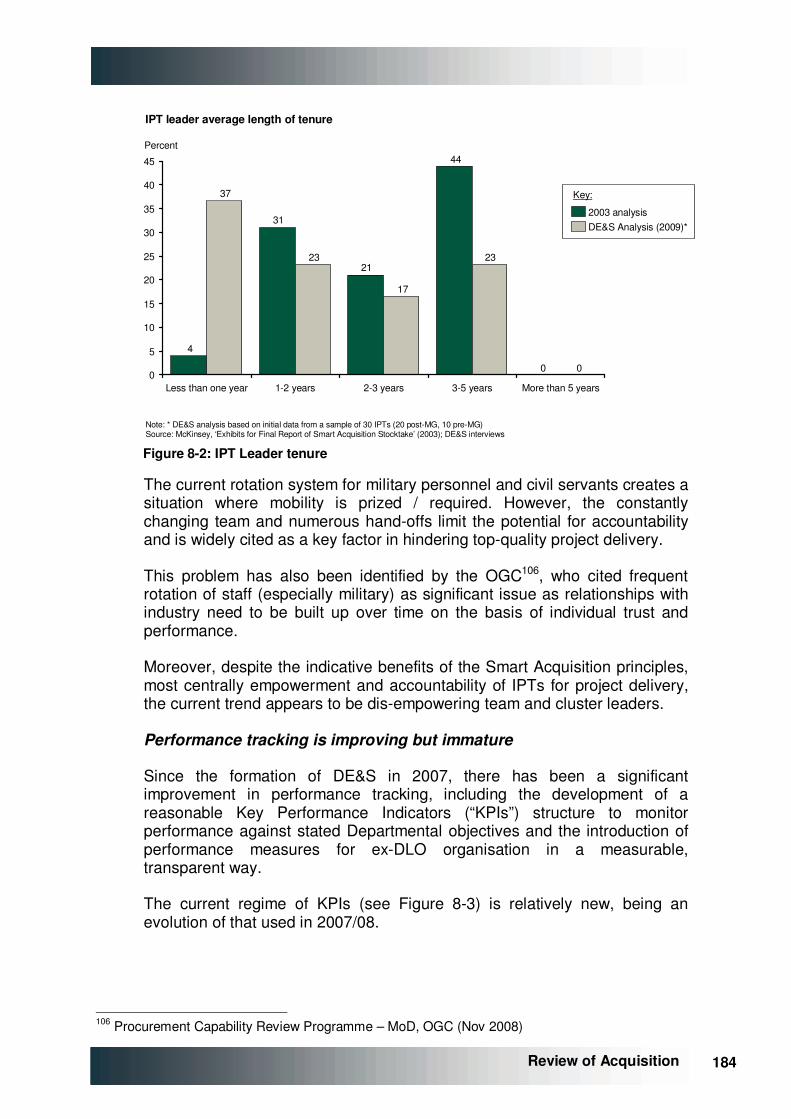
184 184
Review of Acquisition
Note: * DE&S analysis based on initial data from a sample of 30 IPTs (20 post-MG, 10 pre-MG) Source: McKinsey, ‘Exhibits for Final Report of Smart Acquisition Stocktake’ (2003); DE&S interviews
IPT leader average length of tenure
0
44
21
31
4
0
23
17
23
37
0
5
10
15
20
25
30
35
40
45
Less than one year 1-2 years 2-3 years 3-5 years More than 5 years
2003 analysisDE&S Analysis (2009)*
Percent
Key:
Figure �8-2: IPT Leader tenure
The current rotation system for military personnel and civil servants creates a situation where mobility is prized / required. However, the constantly changing team and numerous hand-offs limit the potential for accountability and is widely cited as a key factor in hindering top-quality project delivery.
This problem has also been identified by the OGC106, who cited frequent rotation of staff (especially military) as significant issue as relationships with industry need to be built up over time on the basis of individual trust and performance.
Moreover, despite the indicative benefits of the Smart Acquisition principles, most centrally empowerment and accountability of IPTs for project delivery, the current trend appears to be dis-empowering team and cluster leaders.
Performance tracking is improving but immature
Since the formation of DE&S in 2007, there has been a significant improvement in performance tracking, including the development of a reasonable Key Performance Indicators (“KPIs”) structure to monitor performance against stated Departmental objectives and the introduction of performance measures for ex-DLO organisation in a measurable, transparent way.
The current regime of KPIs (see Figure �8-3) is relatively new, being an evolution of that used in 2007/08.
106 Procurement Capability Review Programme – MoD, OGC (Nov 2008)
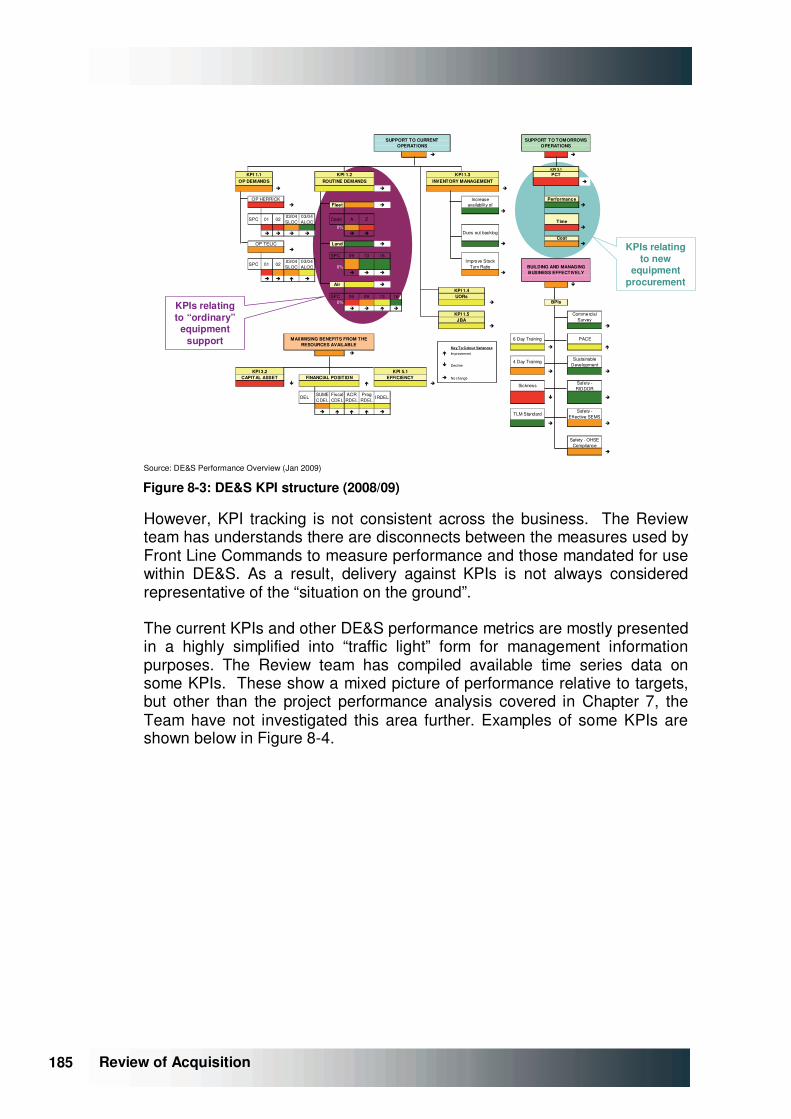
185 185 Review of Acquisition
Source: DE&S Performance Overview (Jan 2009)
� Amber
� Yellow Green
� �
�
� � �
� Fleet � �
�
SPC 01 0203/04 SLOC
03/04 ALOC
Code A Z
44% Red 0% �
� � � � � �
Land � � �
�
SPC 09 13 16
SPC 01 0203/04 SLOC
03/04 ALOC 0%
0% Red � � � �
� � � �Air � �
SPC 05 09 13 160% Red �
� � � �
� �
Key To Colour Variances � �
� � Improvement
� Decline
� �
� No change� � �
DELSUME CDEL
Fiscal CDEL
ACR RDEL
Prog RDEL
IRDEL � �
0%
� � � � �
� �
�
Safety - OHSE Compliance
TLM StandardSafety -
Effective SEMS
Cost
BUILDING AND MANAGING BUSINESS EFFECTIVELY
BPIs
Commercial Survey
KPI 1.4UORsGreen
KPI 1.5
KPI 1.1 KPI 1.2
SUPPORT TO CURRENT OPERATIONS
Amber
OP DEMANDS INVENTORY MANAGEMENTKPI 1.3
JBA
KPI 5.1FINANCIAL POSITION EFFICIENCY
MAXIMISING BENEFITS FROM THE RESOURCES AVAILABLE
KPI 3.2CAPITAL ASSET
6 Day Training PACE
Sustainable Development
4 Day Training
Sickness Safety - RIDDOR
r
Improve Stock Turn Ratio
OP HERRICK
OP TELICA
Increase availability of
SUPPORT TO TOMORROWS OPERATIONS
KPI 3.1PCT
Performance
Time
Dues out backlog
ROUTINE DEMANDS
Yellow
KPIs relating to new
equipment procurement
KPIs relating to “ordinary”
equipment support
Figure �8-3: DE&S KPI structure (2008/09)
However, KPI tracking is not consistent across the business. The Review team has understands there are disconnects between the measures used by Front Line Commands to measure performance and those mandated for use within DE&S. As a result, delivery against KPIs is not always considered representative of the “situation on the ground”.
The current KPIs and other DE&S performance metrics are mostly presented in a highly simplified into “traffic light” form for management information purposes. The Review team has compiled available time series data on some KPIs. These show a mixed picture of performance relative to targets, but other than the project performance analysis covered in Chapter �7, the Team have not investigated this area further. Examples of some KPIs are shown below in Figure �8-4.
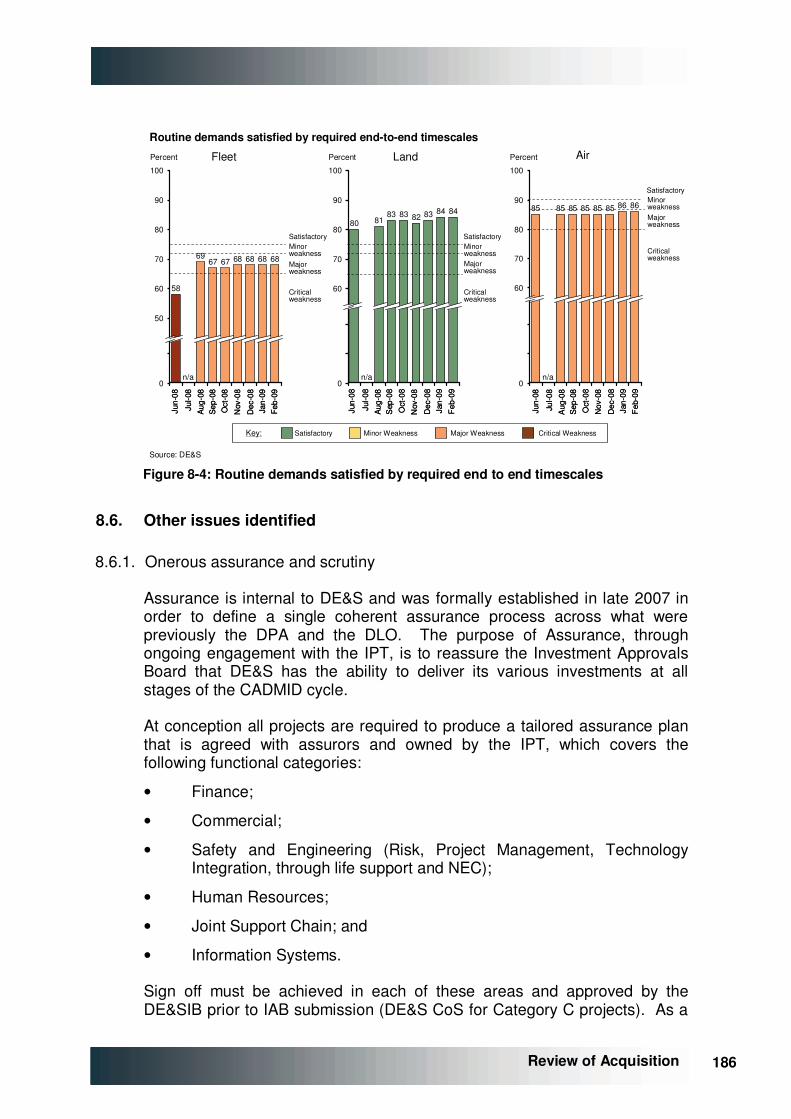
186 186
Review of Acquisition
70
100
80
50
90
Percent
60 58
67 68 68 68
n/a
6967 68
0
Source: DE&S
Routine demands satisfied by required end-to-end timescales
0
60
100
70
90
8080
n/a
83
Percent
82 83 8481
8483
Fleet Land
858585
70
86
0
60
90
100
80
Percent
8585
n/a
85 86
Air
SatisfactoryMinor weaknessMajor weakness
Critical weakness
SatisfactoryMinor weaknessMajor weakness
Critical weakness
SatisfactoryMinor weaknessMajor weakness
Critical weakness
Dec
-08
Jan-
09Fe
b-09
Aug
-08
Jun-
08
Sep
-08
Jul-0
8
Oct
-08
Nov
-08
Dec
-08
Jan-
09Fe
b-09
Aug
-08
Jun-
08
Sep
-08
Jul-0
8
Oct
-08
Nov
-08
Dec
-08
Jan-
09
Feb
-09
Aug
-08
Jun-
08
Sep
-08
Jul-0
8
Oct
-08
Nov
-08
Dec
-08
Jan-
09
Feb
-09
Aug
-08
Jun-
08
Sep
-08
Jul-0
8
Oct
-08
Nov
-08
Dec
-08
Jan-
09F
eb-0
9
Aug
-08
Jun-
08
Sep
-08
Jul-0
8
Oct
-08
Nov
-08
Dec
-08
Jan-
09F
eb-0
9
Aug
-08
Jun-
08
Sep
-08
Jul-0
8
Oct
-08
Nov
-08
Satisfactory Minor Weakness Major Weakness Critical WeaknessKey:
Figure �8-4: Routine demands satisfied by required end to end timescales
8.6. Other issues identified
8.6.1. Onerous assurance and scrutiny
Assurance is internal to DE&S and was formally established in late 2007 in order to define a single coherent assurance process across what were previously the DPA and the DLO. The purpose of Assurance, through ongoing engagement with the IPT, is to reassure the Investment Approvals Board that DE&S has the ability to deliver its various investments at all stages of the CADMID cycle.
At conception all projects are required to produce a tailored assurance plan that is agreed with assurors and owned by the IPT, which covers the following functional categories:
• Finance;
• Commercial;
• Safety and Engineering (Risk, Project Management, Technology Integration, through life support and NEC);
• Human Resources;
• Joint Support Chain; and
• Information Systems.
Sign off must be achieved in each of these areas and approved by the DE&SIB prior to IAB submission (DE&S CoS for Category C projects). As a

187 187 Review of Acquisition
result, this constitutes an onerous task which IPTs must undertake, for little perceived benefit.
By contrast, Scrutiny provides an independent, expert and critical analysis of investment proposals, once approved by DE&S but prior to submission to the IAB107. The Scrutiny team sit within MoD Centre and provide a notionally independent assessment prior to IAB submission of whether the evidence submitted supports the business case proposal.
Scrutiny tends to take a wider view than the assurance process and considers factors such as value for money, future planning and whether the proposal is relevant to current requirements. Each scrutiny team is made up of around 5 scrutineers and a scrutiny function has existed in some form since before the introduction of Smart Acquisition.
The scrutiny process is generally viewed as effective and valuable within DE&S, but there are a number of issues raised around the assurance system:
• low level of value add to the process (“checking homework rather than guiding thought”);
• onerous process to engage parties outside the IPT and direct chain of command; and
• too many parties involved to provide potential roadblocks to project progress (many of whom are not incentivised to deliver the equipment in the way that the IPT is tasked to).
8.6.2. Inadequate management information
Through both discussion with DE&S and of its own experience the Review team has noted that:
• the overall quality, comprehensiveness and timeliness of management information is poor; and
• information is often inconsistent or requires significant effort to “pull together” for useful analysis or decision-making.
General Concerns with DE&S MIS. There are very wide ranging and sometimes severe limitations when using current information systems (e.g.,
− no integration with Excel;
− limited periods of availability;
− lead times of weeks to “roll over” systems to reflect new information;
107 DE&S Standing Instruction No.21 – Through Life Investment Assurance Framework, V.2.0, November 2008
188 188
Review of Acquisition
− further weeks for diagnostic tools / information to become available; and
− multiple data entry required across systems that are not integrated such as CMIS, PB&F/Powerplay, Excel and other IPT level systems.
As a result of these and other shortcomings, there is no single version of the “truth” visible at corporate level108 and an industry of active “information management” is needed to interpret/audit financial data between IPT, DE&S operating centre, DE&S corporate centre, MoD Centre and other interested parties (e.g., Ministers). The need for this industry is reinforced by what many consider to be relatively weak financial skills at IPT level within DE&S.
CMIS. Whilst the quality and usefulness of management information regarding project delivery is no doubt better since the commissioning of the CMIS database in 2004, it is also the case that significant further improvement could be achieved to improve the speed and robustness of corporate / management decision making. There are concerns about the quality of inputs to the CMIS system which are referred to elsewhere (including Chapter �7) and the system does not easily tie-up to the Planning Round data for various reasons.
Business Cases and Core Approvals Documentation. There are also issues around consistency / quality of business cases and similar core documents which extend beyond DE&S. The IAB, for instance, receives business cases at Initial Gate and Main Gate, and further information and review notes through the course of many projects. However, the Review team analysis found that the format for these communications is not standardised and where consistency does exist it is generally limited to the key headings of the business case. This is after the considerable effort expended in various assurance and scrutiny processes which have preceded submission to the IAB.
Furthermore, it is notable that there is currently no single repository of information submitted to the key equipment decision making body, the IAB (i.e., Initial Gate / Main Gate business cases, Information Notes, Review Notes submitted) which further illustrates the point that approvals are still highly project based, and disembodied from the planning process and the review of projects post-approval (other than by exception).
Issues with MIS beyond DE&S. The Review team also heard / experienced at first hand significant further concerns around the ability to draw together information that would allow improved decision-making or better performance monitoring of activities that were being delivered. These included:
108 This is reinforced by the considerable effort required at IPT level to satisfy National Audit Office requirements
189 189 Review of Acquisition
• the use of different systems, accounting and data structures and conventions in different parts of the Department that cannot easily be linked to form a coherent view (e.g., CMIS with PB&F / Powerplay);
• lack of alignment between in-year management of expenditure and planning systems (i.e., definitive outturn spend against EPP and ESP is no longer possible since dissolution of DPA / DLO); and
• ability to tie changes in equipment plan to other key DLoDs for full financial impact analysis of scenarios or modifications (other than via the laborious Planning Round Options process).
8.6.3. Confusion around the industry interface
One of the fundamental design principles around which the acquisition organisation is structured is that DE&S should provide the MoD’s main interface with industry, particularly in terms of commercial relationships in project and programme delivery.
Industry, however, have other important interactions with the Department and government more broadly. These range from longer range strategic direction of capability requirements that impact on industrial strategy, conceptual and R&D interaction that is upstream of formalised assessment work, through to policy on international industrial co-operation or exports to achieve foreign policy objectives.
It has proved difficult and sometimes frustrating for DE&S to attempt to “speak for the Department” when industry has proved adept at using its other points of contact to work around DE&S to further its interests, particularly regarding current or potential project work. The effect of this can be to undermine DE&S’s own strategy vis-à-vis industry, which may then impact the value that the Department can derive from an effective commercial strategy.
The effectiveness of DE&S’s interactions with industry is therefore of central importance in determining its overall performance and in large part the nature of these relationships is determined by the MoD policy context.
Confusion appears to be compounded by the role of Commercial at the DGD Commercial departmental level and the commercial function embedded within DE&S. Whilst this organisational construct fits within a “Unified Customer” model of operation, it potentially confuses the primacy of DE&S in dialog with industry. This in time can serve to blur boundaries of accountability and responsibility.
190 190
Review of Acquisition
8.7. Conclusions and recommendations
8.7.1. Key observations
• It is not clear that the MoD initiatives that have been launched to address current weaknesses, will deliver the necessary improvements sufficiently rapidly (or at all).
• Despite indications that Smart Acquisition has led to an improvement in delivery performance of new equipment, there has been backtracking on the principles of Smart Acquisition. Progress on key dimensions is now significantly worse than in 2003. This is particularly notable with the integration of skills in integrated project teams and in streamlining of the approvals and oversight process. However, it should be recognised that many of the underlying changes which have caused the backtracking are deliberate attempts by the Department to optimise acquisition on other dimensions (e.g., professionalization, overhead (ACR) cost reduction, TLCM).
• DE&S’ PACE initiative remains ongoing. The processes of collocation, flexible resourcing and headcount reduction entailed by the initiative will continue to deliver savings in the operating costs of DE&S, but may also cause considerable disruption / risk as teams supporting delivery of key capabilities are reorganised.
• “Fit For Business” lacks credibility in up-skilling the Defence acquisition organisation to deal with industry on the basis of equals. The initiative, and more importantly the commercial function as a whole, appears to lack leadership and a clear path to achieving a more capable vision that is substantially different from initiatives which have gone before, and only gone part way to delivering the aspiration of the Department.
• The current situation at DE&S is widely recognised to have some critical weaknesses in regard to acquisition of new equipment, including:
− shortage of programme management skills;
− weak influence from finance function;
− poor management information and use of information;
− poor cost estimating capability; and
− rapid staff rotation inhibiting skills build up and reducing accountability.
• The presence of military personnel in line management project delivery positions creates a conflict of interest within DE&S itself.
• Responsibilities and interfaces between the delivery community (DE&S) and the requirements community, and the delivery community and the User are unclear.

191 191 Review of Acquisition
• There is limited commercial focus on delivery of equipment within the forecast performance / cost / time envelope (due to other constraining factors).
• PACE initiative (and others in the acquisition system) will incrementally improve the situation over the course of time. However, improvement will be slow and incremental since the required skills are not really valued by the organisation and incentives for its development are not strong enough.
• There is substantial duplication of assurance / scrutiny effort between IAB DE&SIB submissions. Assurance process is perceived as overly onerous given level of “value add”. The commitment control regime has added further challenge to the approvals regime, and has led to a (deliberate) slow-down in spending.
• The wider Departmental management information systems associated with the acquisition system (particularly PB&F, CMIS) are not adequately supporting management in understanding current performance, e.g., delivery against EPP / ESP, or in considering options to ameliorate future issues.
8.7.2. Recommendations
Recommendation 7
Improve the ability of DE&S to deliver efficiently on new equipment and support
a) Scope and management structure of DE&S
i. Scope of DE&S to be rationalised. DE&S to focus on programme management of acquisition of new equipment and support of in-service equipment.
ii. Other functions, including dockyards, Joint Support Chain, and certain aspects of communications to be hived off into separate entities.
iii. Management structure of DE&S to be revised. Two joint COO 3* positions created to handle IPT workload, CoM roles to be abolished. CDM to be a very senior civilian Programme Management position, recruited externally. Chief of Staff and Chief of Corporate Services roles to be merged.
b) Develop better skills in the workforce
i. Significantly increase programme and project management skills within DE&S at all levels of the organisation.
ii. Increase in resources of central technical staffs available to individual projects as needed.
iii. No person, civil or military, to be appointed to a post of 1* or above without extensive programme management experience.
192 192
Review of Acquisition
c) Ensure greater independence from the customer
i. Hard charging interfaces to be created between DE&S and DCDS(Capability) for future equipment programme, and any change requests, and Front Line Commands for in-service support. Full reporting on output delivered for budget input required.
ii. Level of resources and skills of independent cost estimators to be substantially increased.
iii. CDM and the joint COO 3* posts to have full control over appointment of 2* Cluster heads and 1* team leaders, with this control cascading down through DE&S.
iv. Military personnel may be seconded to teams to provide advice on user needs without programme management experience, but may not occupy line management positions in this guise.
d) Institute a regime of strict financial discipline
i. Levels of resources and influence of Finance Function to be substantially increased. DE&S FD to be recognised as de-facto and de-jure second in command to CDM. DE&S FD to have strong dotted line to MoD DG Finance.
ii. Carrying forward into new FY of planned activity in excess of annual budgets (currently running at over 10% of DE&S spend) to be banned.
e) Improve accountability for project performance
i. Assurance process to be reduced and potentially removed as duplicative of Scrutiny role.
ii. Consistent programme and project management tools to be used across DE&S to ensure transparency of management information and easy migration of staff across teams.
iii. IPT leaders and above to be retained in post for a minimum 4-year double tour. Military officers seeking to serve as line managers must also follow this rule.
iv. Empowerment of cluster heads, and then IPT leaders, to be re-instated, as envisioned in Smart Acquisition.
8.7.3. Commentary
If implemented, the Review team believes that the list of actions provided above would ensure that DE&S is able to adequately prosecute its core activity of delivering on a portfolio of complex equipment and support contracts. Some of the failings that these actions seek to address have already been identified, and in some cases initiatives have been launched to tackle them. However, it is not clear that the existing initiatives will provide the necessary pace and depth of change. Instead, systemic changes are required ensure that these improvements can successfully be instituted across DE&S; the nature of these changes is outlined in Chapter �9.

193 193 Review of Acquisition
194 194
Review of Acquisition
9. FUTURE OPTIONS
9.1. Overview
Chapter �8 identified a number of problems relating to the way in which the DE&S manages the process by which it acquires military equipment. A relatively long list of actions was provided which, if implemented, would make DE&S more focused and skilled around its core activity of delivering a portfolio of complex equipment and support contracts.
A few of the changes recommended are amplifications of initiatives that are already in progress, or relate to issues long recognised in the Department. Most, however, reflect fundamental gaps or shortcomings in the DE&S operating framework. At a high level these issues arise, in the view of the Review team, from DE&S operating with an organisational construct skill set and business model that would struggle to perform at levels typically expected of private sector providers of similar project delivery services.
It is the Review team’s view that the imperatives for change in the DE&S operating model identified in Chapter �8, i.e.,
• greater independence;
• better skills;
• financial discipline; and
• improved accountability,
could be better addressed – individually and in a mutually reinforcing way – by business separation of the core DE&S project delivery activity and by injection of substantial commercial know-how.
In this chapter, a number of alternative options for the way in which DE&S could be managed are considered, including changes to the scope of DE&S operations and approaches which involve wholesale “commercialisation” and “contractorisation”. The potential benefits and drawbacks of alternative structural or organisational frameworks are analysed and recommendations are made as to the future option that is most likely to deliver the required improvements.
Fundamental reappraisals of the arrangements under which the organisation operates have been undertaken before.
One of the key recommendations of Smart Acquisition was to ensure there was a clear customer-supplier relationship between the Equipment Capability function at MoD centre as customer and the Procurement Executive as supplier. This was to be fostered initially through a redesign of processes and organisational roles and interfaces. When that process was completed effectively, a further step was envisaged, which would have seen
195 195 Review of Acquisition
the Procurement Executive move from an agency of government to a Trading Fund109, providing even greater autonomy and accountability. In the end, this step was never implemented, and with the merger of the DPA and DLO into DE&S, the agency status of the DPA was removed.
In 2006, the EAC programme considered the possibility of changing the scope of DE&S’s work by moving activities relating to the management of the supply chain and naval bases into a separate organisation. It also considered privatisation of procurement and support activities, but recommended against this option. It did however recognise the potential benefits of private sector involvement in bringing appropriate skills to support DE&S core project management activities:
“We recommend merging the Defence Procurement Agency and Defence Logistics Organisation to create an integrated procurement and support organisation, whose core function would be delivery of equipment and support for operations to the Front Line. It should be a centre for excellence in portfolio and project management, drawing on the private sector where relevant skills cannot be cost effectively maintained in-house.”110
Given the constraints of time, the Team’s work in this area does not provide a comprehensive assessment of, nor detailed evaluations of, implementation issues for preferred options. It does, however, explore in outline some plausible ways forward.
9.2. Objectives of a new DE&S operating model
To provide clarity around what could be gained from altering the structural options the Review team considered that the following desirable outcomes should be facilitated or reinforced by any changes that are made.
Greater independence
• Organisation to deal at arms length with customer.
• Organisation designed so military has no “control” or career influence over top management or key staff responsible for project delivery.
• Cost and technical feasibility inputs / advice to be scrupulously independent of the Capability Sponsor and influence from the military and industry.
• No role (other than advisory) in IAB project approvals.
Better skills
• Project and programme management personnel with commercially “benchmarked” skills for the scale and complexity of work being undertaken (including flexibility on pay, recruitment, etc.).
109 Transforming the UK’s Defence Procurement System, MoD (Feb 1998) 110 Enabling Acquisition Change, Enabling Acquisition Change Team Leader (Jun 2006)
196 196
Review of Acquisition
• Consistent and best-practice programme and project management tools to be used across DE&S to ensure quality and transparency of management information, as well as easy migration of staff across teams.
Financial discipline
• “Hard charging” regime: Capability Sponsor / FLCs hold budgets; changes / variations costed and agreed as normal commercial practice.
• Levels of resources and influence of finance function to be substantially increased.
• Resources to be tracked to activity, managed for efficiency and charged to the customer.
Improved accountability
• Key project leadership and team roles to have “event driven” rotation on projects, not “tours of duty”; probably four year minimums in any case.
• Clear project management responsibility, performance monitoring and related reward/incentive structures, as typical practice in major commercial project management firms.
These objectives mirror most of the recommendations from Chapter �8. The structural options discussed here are viewed as the means to achieve them with greatest certainty and sustainability.
9.3. Structural models for delivery of public services
A variety of structural options have been applied to public service bodies, with varying degrees of involvement from the private sector. Table �9-1 shows the breadth of available options, ranging from Department of State to full privatisation.
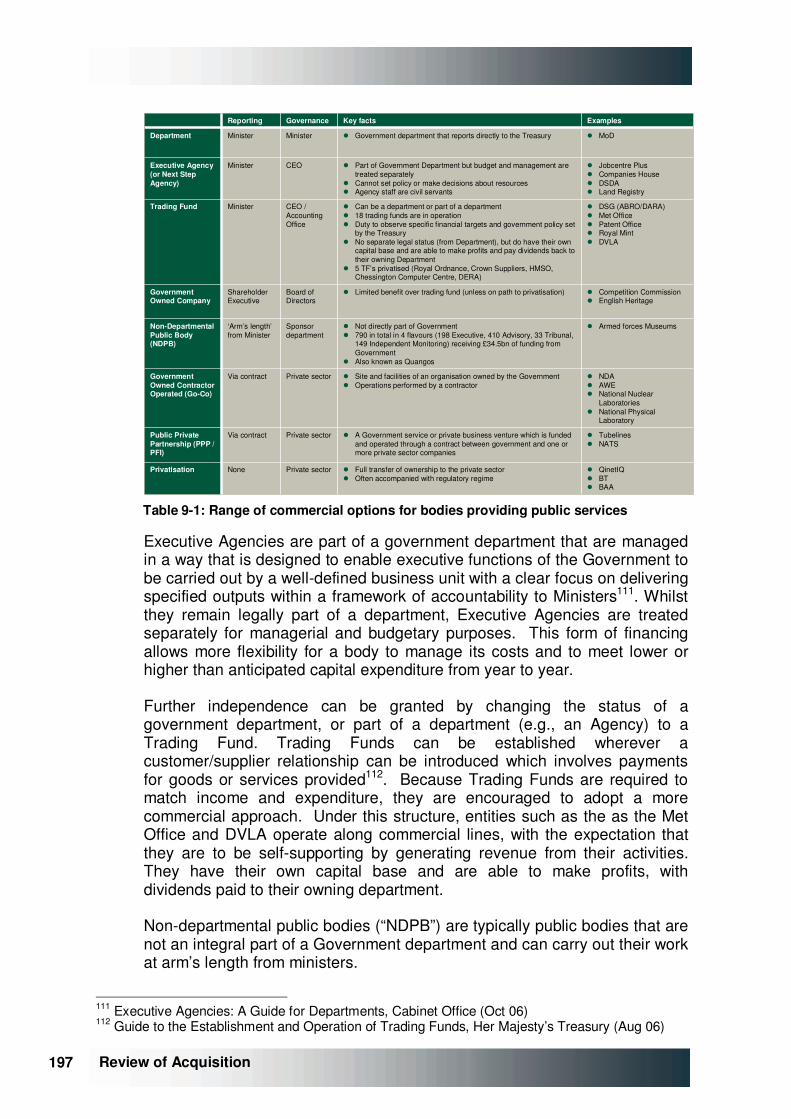
197 197 Review of Acquisition
� QinetIQ� BT� BAA
� Full transfer of ownership to the private sector� Often accompanied with regulatory regime
Private sectorNonePrivatisation
� Tubelines� NATS
� A Government service or private business venture which is fundedand operated through a contract between government and one or more private sector companies
Private sectorVia contractPublic Private Partnership (PPP / PFI)
� Competition Commission� English Heritage
� Limited benefit over trading fund (unless on path to privatisation)Board of Directors
Shareholder Executive
Government Owned Company
� NDA� AWE� National Nuclear
Laboratories� National Physical
Laboratory
� Site and facilities of an organisation owned by the Government� Operations performed by a contractor
Private sectorVia contractGovernment Owned Contractor Operated (Go-Co)
� Armed forces Museums� Not directly part of Government � 790 in total in 4 flavours (198 Executive, 410 Advisory, 33 Tribunal,
149 Independent Monitoring) receiving £34.5bn of funding from Government
� Also known as Quangos
Sponsor department
‘Arm’s length’from Minister
Non-Departmental Public Body(NDPB)
� DSG (ABRO/DARA)� Met Office� Patent Office� Royal Mint� DVLA
� Can be a department or part of a department � 18 trading funds are in operation� Duty to observe specific financial targets and government policy set
by the Treasury� No separate legal status (from Department), but do have their own
capital base and are able to make profits and pay dividends back to their owning Department
� 5 TF’s privatised (Royal Ordnance, Crown Suppliers, HMSO, Chessington Computer Centre, DERA)
CEO / Accounting Office
MinisterTrading Fund
� Jobcentre Plus� Companies House� DSDA� Land Registry
� Part of Government Department but budget and management are treated separately
� Cannot set policy or make decisions about resources� Agency staff are civil servants
CEOMinisterExecutive Agency (or Next Step Agency)
� MoD� Government department that reports directly to the TreasuryMinisterMinisterDepartment
ExamplesKey factsGovernanceReporting
Table �9-1: Range of commercial options for bodies providing public services
Executive Agencies are part of a government department that are managed in a way that is designed to enable executive functions of the Government to be carried out by a well-defined business unit with a clear focus on delivering specified outputs within a framework of accountability to Ministers111. Whilst they remain legally part of a department, Executive Agencies are treated separately for managerial and budgetary purposes. This form of financing allows more flexibility for a body to manage its costs and to meet lower or higher than anticipated capital expenditure from year to year.
Further independence can be granted by changing the status of a government department, or part of a department (e.g., an Agency) to a Trading Fund. Trading Funds can be established wherever a customer/supplier relationship can be introduced which involves payments for goods or services provided112. Because Trading Funds are required to match income and expenditure, they are encouraged to adopt a more commercial approach. Under this structure, entities such as the as the Met Office and DVLA operate along commercial lines, with the expectation that they are to be self-supporting by generating revenue from their activities. They have their own capital base and are able to make profits, with dividends paid to their owning department.
Non-departmental public bodies (“NDPB”) are typically public bodies that are not an integral part of a Government department and can carry out their work at arm’s length from ministers.
111 Executive Agencies: A Guide for Departments, Cabinet Office (Oct 06) 112 Guide to the Establishment and Operation of Trading Funds, Her Majesty’s Treasury (Aug 06)
198 198
Review of Acquisition
At the other end of the spectrum there exists the option of full privatisation. Privatisation involves the transfer of ownership of a public body from government to the private sector. It is then answerable to shareholders and is forced to run along entirely commercial principals.
Public-Private Partnerships (“PPP”), on the other hand, are arrangements whereby a publicly owned facility or service is funded and operated through a partnership between the public and private sectors. In the UK, most PPPs are funded via Public Finance Initiatives (“PFI”), in which the private sector provides the initial capital investment in return for future ‘rental’ payments from public sector. This model is also frequently implemented in situations where it is believed that the private sector can bring superior management and/or operational skills to public services, and ultimately benefit to taxpayers. DE&S manages a number of PFI projects for the MoD.
The Government owned - Contractor operated (“Go-Co”) model could be considered a form of PPP since it permits the Government to retain ownership of the assets of a department whilst introducing management skills from the private sector. Instead of injecting financial capital into a public sector organisation or project, the private sector injects intellectual capital. This structural model is widely used in the US, but is still relatively new in the UK. The way in which Go-Cos typically operate will be described presently.
9.3.1. Experience with the DPA (1999-2007)
Following the 1998 Strategic Defence Review and the introduction of Smart Procurement a number of structural changes were made within UK defence procurement. Procurement activities, previously co-ordinated by the Procurement Executive (PE), were transferred to the Defence Procurement Agency (DPA) in 1999. At the same time, planning and delivery of support activities were centralised in a new tri-service body, the Defence Logistics Organisation (DLO).
Whilst the PE had been a part of the MoD, the DPA was formally established as an independent agency on the road to trading fund status. One benefit of this transformation was that it afforded the DPA greater financial freedom to pursue its objectives. Less tangibly, but importantly, the move was designed to establish a direct customer / supplier relationship. As has been shown in Chapter �7, under the DPA cost and time performance improved and performance against KURs remained broadly stable at a high level.
9.4. Government owned - Contractor operated (Go-Co) Structures
9.4.1. Overview
Go-Co entities are typically Government facilities run by the private sector either for profit or not-for-profit, depending on their specific circumstances. The Government retains ownership of the assets (e.g., a laboratory or
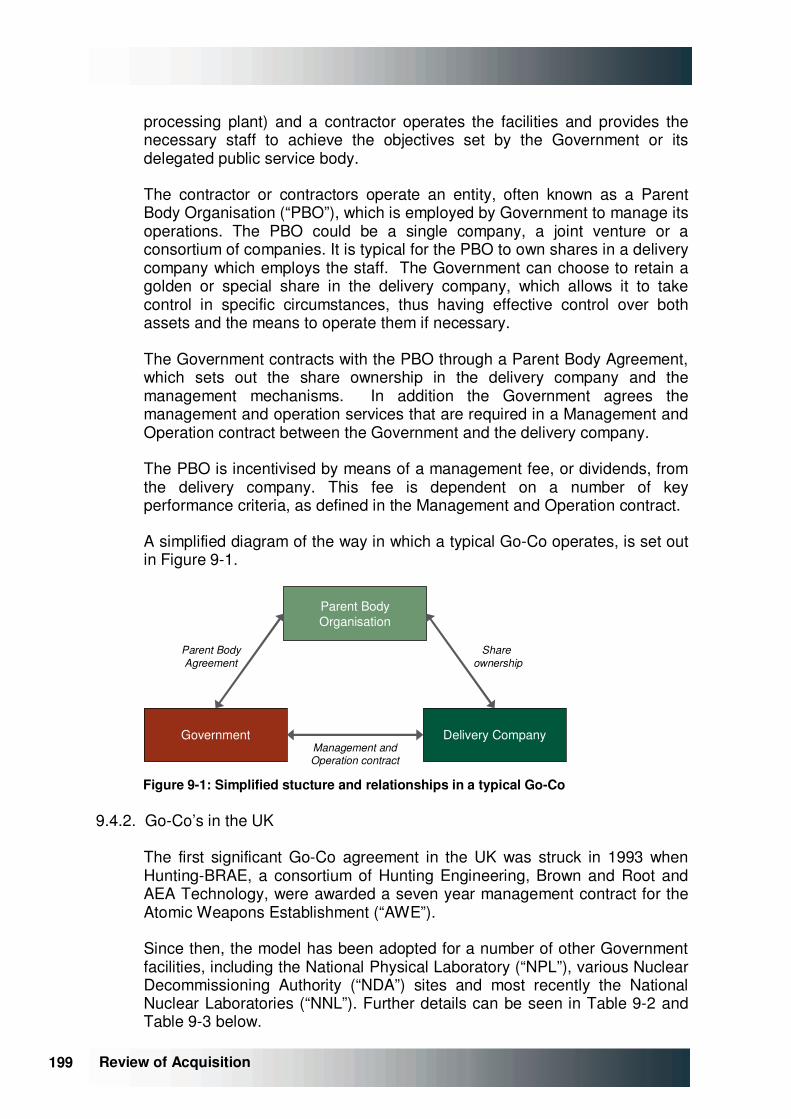
199 199 Review of Acquisition
processing plant) and a contractor operates the facilities and provides the necessary staff to achieve the objectives set by the Government or its delegated public service body.
The contractor or contractors operate an entity, often known as a Parent Body Organisation (“PBO”), which is employed by Government to manage its operations. The PBO could be a single company, a joint venture or a consortium of companies. It is typical for the PBO to own shares in a delivery company which employs the staff. The Government can choose to retain a golden or special share in the delivery company, which allows it to take control in specific circumstances, thus having effective control over both assets and the means to operate them if necessary.
The Government contracts with the PBO through a Parent Body Agreement, which sets out the share ownership in the delivery company and the management mechanisms. In addition the Government agrees the management and operation services that are required in a Management and Operation contract between the Government and the delivery company.
The PBO is incentivised by means of a management fee, or dividends, from the delivery company. This fee is dependent on a number of key performance criteria, as defined in the Management and Operation contract.
A simplified diagram of the way in which a typical Go-Co operates, is set out in Figure �9-1.
Parent Body Organisation
Government Delivery Company
Share ownership
Management and Operation contract
Parent BodyAgreement
Figure �9-1: Simplified stucture and relationships in a typical Go-Co
9.4.2. Go-Co’s in the UK
The first significant Go-Co agreement in the UK was struck in 1993 when Hunting-BRAE, a consortium of Hunting Engineering, Brown and Root and AEA Technology, were awarded a seven year management contract for the Atomic Weapons Establishment (“AWE”).
Since then, the model has been adopted for a number of other Government facilities, including the National Physical Laboratory (“NPL”), various Nuclear Decommissioning Authority (“NDA”) sites and most recently the National Nuclear Laboratories (“NNL”). Further details can be seen in Table �9-2 and Table �9-3 below.
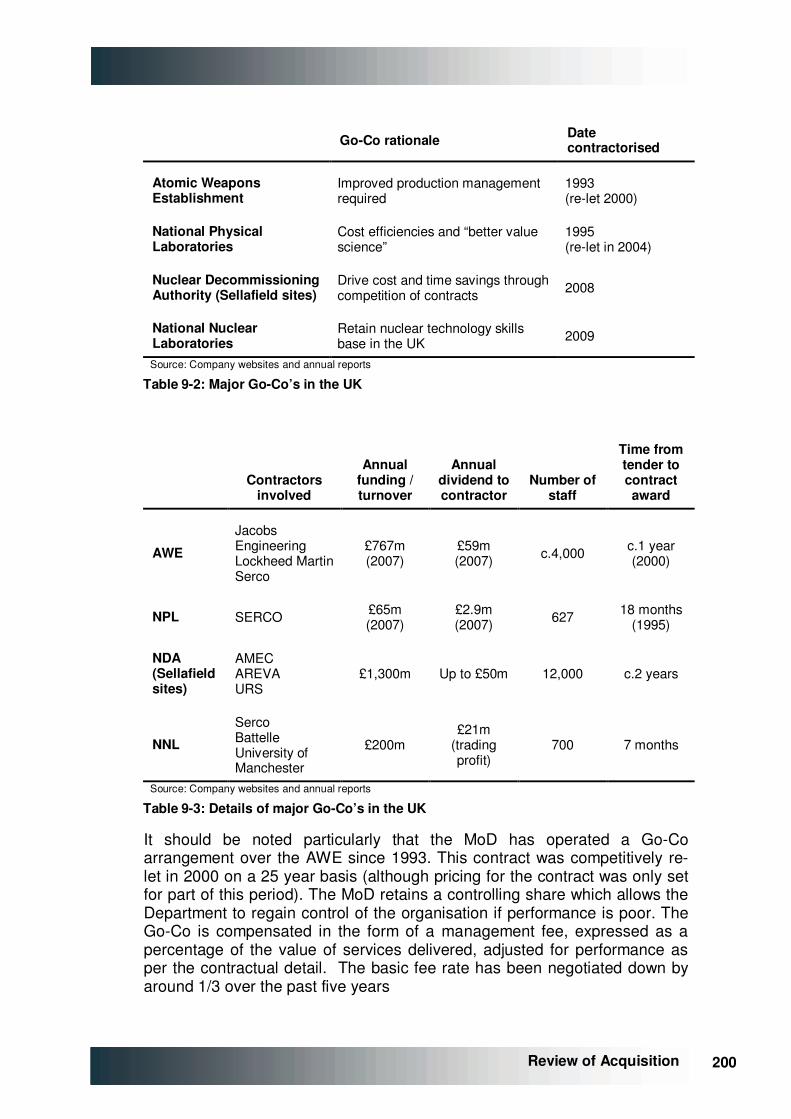
200 200
Review of Acquisition
Go-Co rationale Date contractorised
Atomic Weapons Establishment
Improved production management required
1993 (re-let 2000)
National Physical Laboratories
Cost efficiencies and “better value science”
1995 (re-let in 2004)
Nuclear Decommissioning Authority (Sellafield sites)
Drive cost and time savings through competition of contracts 2008
National Nuclear Laboratories
Retain nuclear technology skills base in the UK 2009
Source: Company websites and annual reports
Table �9-2: Major Go-Co’s in the UK
Contractors involved
Annual funding / turnover
Annual dividend to contractor
Number of staff
Time from tender to contract award
AWE
Jacobs Engineering Lockheed Martin Serco
£767m (2007)
£59m (2007) c.4,000 c.1 year
(2000)
NPL SERCO £65m (2007)
£2.9m (2007) 627 18 months
(1995)
NDA (Sellafield sites)
AMEC AREVA URS
£1,300m Up to £50m 12,000 c.2 years
NNL
Serco Battelle University of Manchester
£200m £21m
(trading profit)
700 7 months
Source: Company websites and annual reports
Table �9-3: Details of major Go-Co’s in the UK
It should be noted particularly that the MoD has operated a Go-Co arrangement over the AWE since 1993. This contract was competitively re-let in 2000 on a 25 year basis (although pricing for the contract was only set for part of this period). The MoD retains a controlling share which allows the Department to regain control of the organisation if performance is poor. The Go-Co is compensated in the form of a management fee, expressed as a percentage of the value of services delivered, adjusted for performance as per the contractual detail. The basic fee rate has been negotiated down by around 1/3 over the past five years
201 201 Review of Acquisition
The Review team's discussions with the IPT managing the AWE contract suggest that recent experience with this partnership arrangement has been very positive with the contractor delivering to a high standard within a set of systems and strategic requirements. The AWE has also significantly benefitted from draw down of relevant skills from the parent body organisations (e.g., implementation of Earned Value Management) and experience in recruitment and retention of appropriate senior staff has been positive.
From the MoD's perspective the most significant challenges in operating the contract have been developing an "eyes on, hands off" style of monitoring and control with the contractor and the demonstration of ongoing value for money at contract re-pricing points (without competitively re-letting the contract). Fee rates have been gradually reduced over the life of the contract.
9.4.3. Go-Co’s in the US
The Go-Co structure has its origins in the US defence industry. During WWII, Go-Co arrangements were used to maintain the munitions industry and Go-Co plants have been the primary supplier of the nation’s military munitions since that time113. In addition to munitions, Go-Co’s are used to operate radar and navigational facilities, electronics and communications facilities, equipment factories, and military sealift capability.
The US Department of Energy (“DoE”) has Go-Co agreements with outside bodies to operate its 19 national laboratories and technology centres. These are run by universities, non-profit institutions, and commercial enterprises. For example, Los Alamos National Laboratory is operated by a consortium composed of the University of California, Bechtel Corporation, BWX Technologies and Washington Group International.
In the US around $18bn each year is spent funding Go-Co defence and research related contracts114. Around 60%, of this is spent by the DoE on R&D facilities.
9.4.4. Strengths and weaknesses
The experience of Go-Co agreements, both in the US and the UK, has highlighted some strengths and weaknesses of implementing it as an operating model (as shown in Table �9-4).
113 M.J. Connor, Military Law Review, vol 131, p1 (1991) 114 Average annual funding for operation of Government-owned facilities over FY04-07, of which 60% is contracted by the DoE for Go-Co R&D facilities (source: FedSpending.org)
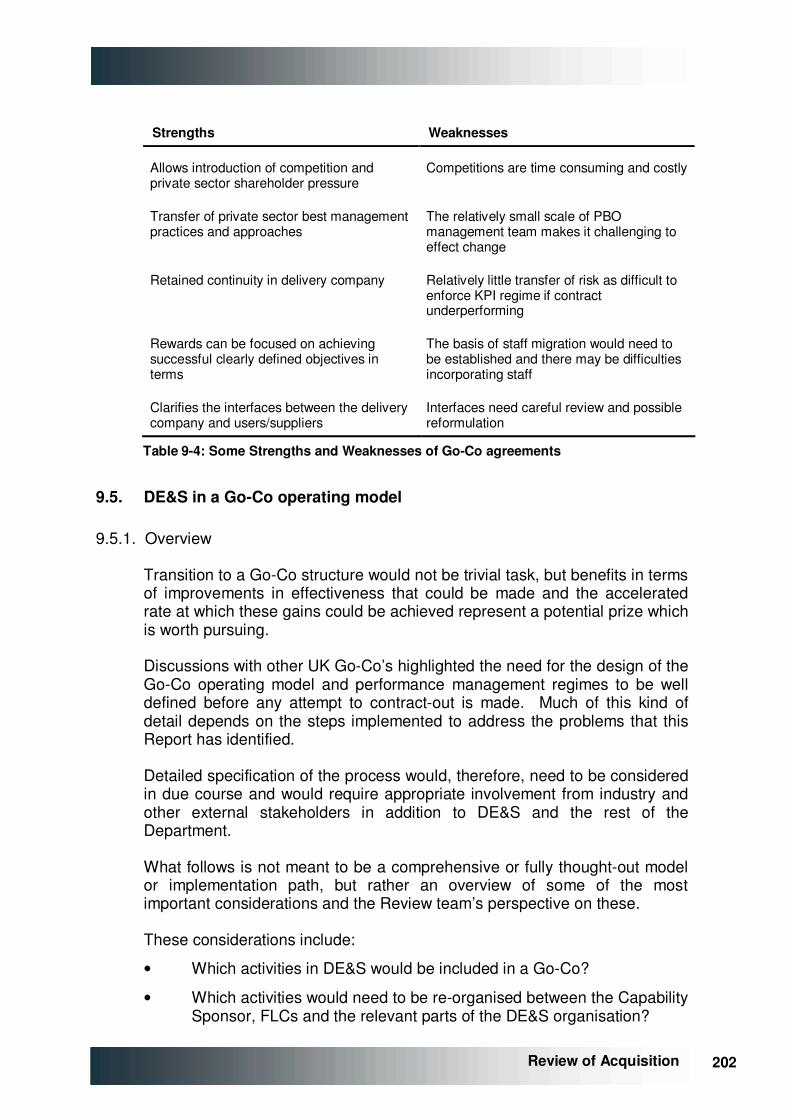
202 202
Review of Acquisition
Strengths Weaknesses
Allows introduction of competition and private sector shareholder pressure
Competitions are time consuming and costly
Transfer of private sector best management practices and approaches
The relatively small scale of PBO management team makes it challenging to effect change
Retained continuity in delivery company Relatively little transfer of risk as difficult to enforce KPI regime if contract underperforming
Rewards can be focused on achieving successful clearly defined objectives in terms
The basis of staff migration would need to be established and there may be difficulties incorporating staff
Clarifies the interfaces between the delivery company and users/suppliers
Interfaces need careful review and possible reformulation
Table �9-4: Some Strengths and Weaknesses of Go-Co agreements
9.5. DE&S in a Go-Co operating model
9.5.1. Overview
Transition to a Go-Co structure would not be trivial task, but benefits in terms of improvements in effectiveness that could be made and the accelerated rate at which these gains could be achieved represent a potential prize which is worth pursuing.
Discussions with other UK Go-Co’s highlighted the need for the design of the Go-Co operating model and performance management regimes to be well defined before any attempt to contract-out is made. Much of this kind of detail depends on the steps implemented to address the problems that this Report has identified.
Detailed specification of the process would, therefore, need to be considered in due course and would require appropriate involvement from industry and other external stakeholders in addition to DE&S and the rest of the Department.
What follows is not meant to be a comprehensive or fully thought-out model or implementation path, but rather an overview of some of the most important considerations and the Review team’s perspective on these.
These considerations include:
• Which activities in DE&S would be included in a Go-Co?
• Which activities would need to be re-organised between the Capability Sponsor, FLCs and the relevant parts of the DE&S organisation?
203 203 Review of Acquisition
• What role would the contractor or external commercial partners be expected to provide?
• How does the new model work across the CADMID cycle?
• How does the new model evolve over time?
• What are the commercial implications for the Department and industry?
9.5.2. Boundaries
There are important considerations about where to draw the organisational boundaries of the Go-Co. In terms of activities, there is merit in keeping them focused. The Report has already described issues around the breadth of activity currently within DE&S and potential benefits from redrawing the boundaries around project delivery and management more clearly. This would suggest a Go-Co might focus most appropriately on this core set of project delivery activities, where most of the problems around skills, processes and blurred interfaces have been raised. The Naval Bases, JSC, and part of the communications activities would be better held outside the Go-Co.
9.5.3. Scope of activities and the Intelligent Customer
In order to specify the scope of activities that the Go-Co would be expected to undertake, the customer interface between MoD and the Go-Co would need careful review and possible reformulation.
The Go-Co’s primary interface for equipment procurement with the MoD would be with the Intelligent Customer (“IC”) organisation, which would be charged with capability planning, project and programme investment decisions, formulation of business cases and monitoring of Go-Co performance. It would be the TLB for equipment procurement expenditure It is likely that the IC would be built from the Capability Sponsor organisation, which would need to be enhanced if it is properly interrogate and control the Go-Co. Concretely, this means that the MoD would need to develop both technical expertise and financial skills outside of the Go-Co, including an improved cost estimation function, if it is to fulfil its role adequately.
The Go-Co would be principally concerned with the effective management of procurement and support projects which had been specified and approved by the IC. This means Go-Co is the “deliverer”, not the “decider” and is not part of a “unified customer” construct as DE&S is now.
In addition it would be expected to provide support to the IC in providing pre-approval inputs or services, including independent cost estimates, industry inputs on options, technical feasibility, etc. which may be required to supplement the IC’s own enhanced internal knowledge base or resources.
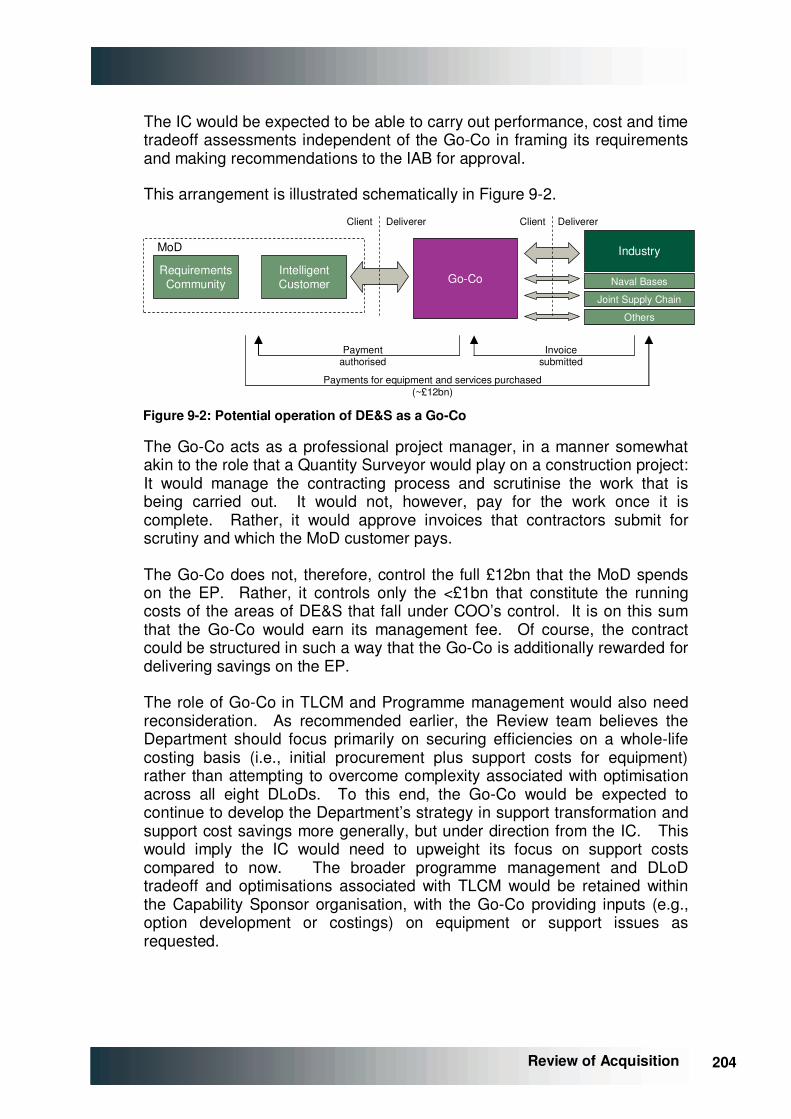
204 204
Review of Acquisition
The IC would be expected to be able to carry out performance, cost and time tradeoff assessments independent of the Go-Co in framing its requirements and making recommendations to the IAB for approval.
This arrangement is illustrated schematically in Figure �9-2.
RequirementsCommunity
IntelligentCustomer
MoD
Go-Co
Industry
Client Deliverer Client Deliverer
Payments for equipment and services purchased(~£12bn)
Invoicesubmitted
Paymentauthorised
Naval Bases
Joint Supply Chain
Others
Figure �9-2: Potential operation of DE&S as a Go-Co
The Go-Co acts as a professional project manager, in a manner somewhat akin to the role that a Quantity Surveyor would play on a construction project: It would manage the contracting process and scrutinise the work that is being carried out. It would not, however, pay for the work once it is complete. Rather, it would approve invoices that contractors submit for scrutiny and which the MoD customer pays.
The Go-Co does not, therefore, control the full £12bn that the MoD spends on the EP. Rather, it controls only the <£1bn that constitute the running costs of the areas of DE&S that fall under COO’s control. It is on this sum that the Go-Co would earn its management fee. Of course, the contract could be structured in such a way that the Go-Co is additionally rewarded for delivering savings on the EP.
The role of Go-Co in TLCM and Programme management would also need reconsideration. As recommended earlier, the Review team believes the Department should focus primarily on securing efficiencies on a whole-life costing basis (i.e., initial procurement plus support costs for equipment) rather than attempting to overcome complexity associated with optimisation across all eight DLoDs. To this end, the Go-Co would be expected to continue to develop the Department’s strategy in support transformation and support cost savings more generally, but under direction from the IC. This would imply the IC would need to upweight its focus on support costs compared to now. The broader programme management and DLoD tradeoff and optimisations associated with TLCM would be retained within the Capability Sponsor organisation, with the Go-Co providing inputs (e.g., option development or costings) on equipment or support issues as requested.

205 205 Review of Acquisition
9.5.4. Role of the contractor
Having determined the boundaries around its activity, the nature of its interfaces and reorganised resources as necessary, options around the type of contractor “intervention” in the DE&S need to be considered. These could include:
• relatively high level and thin external resourcing from outside, with a mandate to design and embed appropriate change within the reshaped Go-Co resource base and processes;
• establishment of critical information systems necessary for “best practice” management of the organisation;
• deeper resourcing in areas of critical weakness (e.g., risk management in larger projects);
• identification of opportunities to further focus activities in the Go-Co by outsourcing activities; and
• a combination of the above, probably in the sequence indicated.
Clearly, it will be necessary to ensure that any commercial participant in the Go-Co agreement has no vested interest in any of the projects being undertaken. In order to ensure that no conflicts of interest were introduced to the system, contractors would certainly have to be prevented from bidding for any equipment procurement or support project. Given that a contractor would require access to militarily sensitive information (as well as commercially sensitive information), the Go-Co partner would have to be chosen carefully and the selection process will have to include a number of specific controls.
9.5.5. The new model across the CADMID cycle
The principal focus of the Go-Co construct is to improve performance of project and programme management activities, which account for c.£12bn p.a. of expenditure across procurement and support (i.e., the Go-Co would be focused on demonstration and manufacture phases, and on in-service support). The migration of skills between Go-Co and the Intelligent Customer would be organised to allow the Capability Sponsor to be more “self-standing” in early stage capability work (i.e., pre-concept into assessment phases). Resources from the Go-Co could still be drawn upon to assist with younger projects (for example to run assessment phase competitions or to provide independent cost estimates) but, as projects mature, the weight of resourcing would shift back to the Go-Co (as is currently the case with DE&S post Main Gate projects). It would also be expected that staff from either side of the “hard boundary” could be seconded to early or late stage teams, as appropriate, to ensure continuity over the CADMID cycle.
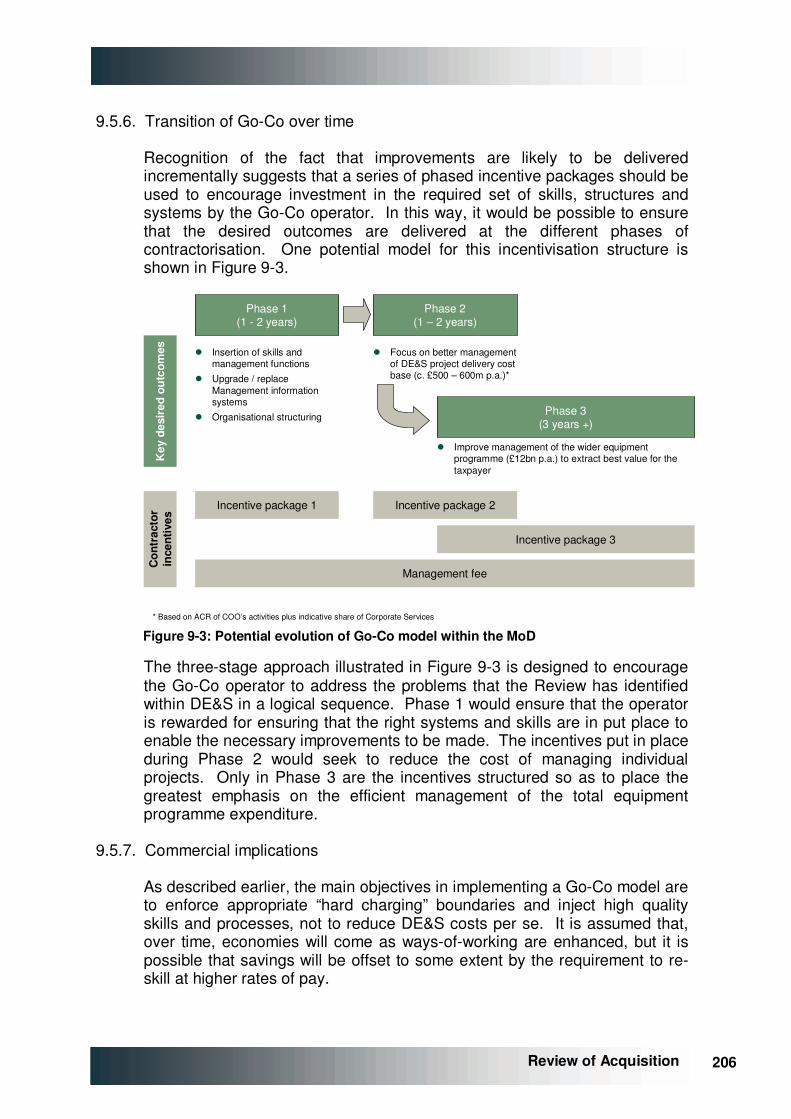
206 206
Review of Acquisition
9.5.6. Transition of Go-Co over time
Recognition of the fact that improvements are likely to be delivered incrementally suggests that a series of phased incentive packages should be used to encourage investment in the required set of skills, structures and systems by the Go-Co operator. In this way, it would be possible to ensure that the desired outcomes are delivered at the different phases of contractorisation. One potential model for this incentivisation structure is shown in Figure �9-3.
Phase 1(1 - 2 years)
� Insertion of skills and management functions
� Upgrade / replace Management information systems
� Organisational structuring
Phase 2(1 – 2 years)
� Focus on better management of DE&S project delivery cost base (c. £500 – 600m p.a.)*
Phase 3(3 years +)
� Improve management of the wider equipment programme (£12bn p.a.) to extract best value for the taxpayer
Incentive package 1 Incentive package 2
Incentive package 3
Key
des
ired
out
com
esC
ontr
acto
rin
cent
ives
Management fee
* Based on ACR of COO’s activities plus indicative share of Corporate Services Figure �9-3: Potential evolution of Go-Co model within the MoD
The three-stage approach illustrated in Figure �9-3 is designed to encourage the Go-Co operator to address the problems that the Review has identified within DE&S in a logical sequence. Phase 1 would ensure that the operator is rewarded for ensuring that the right systems and skills are in put place to enable the necessary improvements to be made. The incentives put in place during Phase 2 would seek to reduce the cost of managing individual projects. Only in Phase 3 are the incentives structured so as to place the greatest emphasis on the efficient management of the total equipment programme expenditure.
9.5.7. Commercial implications
As described earlier, the main objectives in implementing a Go-Co model are to enforce appropriate “hard charging” boundaries and inject high quality skills and processes, not to reduce DE&S costs per se. It is assumed that, over time, economies will come as ways-of-working are enhanced, but it is possible that savings will be offset to some extent by the requirement to re-skill at higher rates of pay.
207 207 Review of Acquisition
At a high level, the commercial model proposed would provide fees for services, plus incentives, and would not be expected to be structured as markups or similar arrangements on contract values handled (i.e., the c.£12bn of contractor payments).
From the perspective of industry, the Go-Co transition is not designed to “tighten screws” on suppliers, but to provide a more consistent, professional and transparent contracting interface with the Customer.
9.6. Alternative Structural Models
There are a number of inherent difficulties in determining the conditions under which the Go-Co might operate, particularly those relating to the basis upon which staff (both civilian and military) could migrate their employment contracts into the Go-Co. This may mean that other solutions are deemed to be more suitable. Some alternative structural models are therefore discussed briefly below.
9.6.1. Trading Fund
A solution that was recommended as part of Smart Acquisition was to see the Procurement Executive move to a Trading Fund. It would be possible, at least in principle, to establish DE&S as a trading fund that performs the same functions as at present. The Fund would then have to establish a formal customer supplier relationship with the MoD, and DE&S would charge the MoD for the project management services it provides.
The Chief Executive of the Trading Fund, potentially CDM in the case of DE&S, is accountable for the day to day management of the Trading Fund and its financial performance. The fund would be required to produce an annual report and accounts as agreed with the Treasury.
The 2003 Review of Trading Fund Policy115 identified a number of benefits from operating as a Trading Fund that would be attractive to DE&S:
• improved focus on outputs and performance;
• a change in culture within the organisation towards being value-driven; and
• increased commercial thinking, cost cutting and more efficient ways of operating.
These benefits are similar to those anticipated from running DE&S as a Go-Co. However, the major drawback of a Trading Fund structure is its lack of private sector involvement. Although it does encourage commercial thinking, it will not result in the introduction of best practice skills and techniques from industry. Its employees remain civil servants with resulting issues around
115 Review of Trading Fund Policy, Her Majesty’s Treasury (Oct 03)
208 208
Review of Acquisition
pay and external hiring. The rate of change that is likely to materialise is therefore likely to be slower than would be the case as a Go-Co.
9.6.2. Service Aggregator Model
Another potential approach suggested to the Team by an industry participant is to employ a “Service Aggregator” to act as an interface between customer and all contracting parties. Essentially, the Aggregator would take on a range of processes that currently form a large part of the activity within DE&S, apply best practice, management tools, scale benefits, etc. to drive efficiency and effectiveness. The key roles of a Service Aggregator could include:
• Customer management – improve efficiency of day to day operations
• Supplier management – establish effective sourcing strategy that focuses on both current and long-term business
• Integration management – support industry to integrate with the customer at all stages of the supply chain
• Implementation management – ensuring that the end user requirements are being met and improve flow of information
This model could be implemented in a number of ways, but would require many of the same evaluations of boundaries, process re-design and systems changes outlined for a Go-Co.
9.6.3. Strategic Partner
There is also a potentially feasible approach available whereby the MoD contracts with an expert private sector organisation as a strategic partner to bring in private sector experience and methodologies in project and programme management at project, programme and organisational levels. The strategic partner would not manage DE&S directly and would act only in an advisory role.
With the changes described earlier to the role and responsibilities of DE&S in any event (i.e., simplification of scope, improved management focus and clarification of the customer / supplier boundary with an upgraded Capability Sponsor) the core procurement activity is envisaged as more straightforward to operate. There should, therefore, be an adequate number of suitably qualified programme management organisations to support a credible competitive letting process for the position of strategic partner.
However, there are a number of significant potential drawbacks to attempting a strategic partnering approach to address the issues identified with DE&S:
• there is a danger that by being only in an advisory role, the advice of the partner will be ignored if DE&S management are not actively engaged in driving a change agenda. In all likelihood, because the

209 209 Review of Acquisition
underlying incentives (remunerative and structural) for DE&S personnel would not be altered in this arrangement there will be a predisposition to take very little risk in implementing the reforms and processes advised by the strategic partner which will impede both the speed and extent of change possible; and
• the business models of the most credible candidates for selection as strategic partners (i.e., those with successful track records in large, complex, novel project delivery) are not generally based on providing consulting services, but rather on taking responsibility for delivery of results in complex and risky project or programme management roles. This could undermine any partnering approach by having implicit incentives to give the MoD the less capable staff (as more capable staff may be deployed to better effect elsewhere in the partner organisation).
9.6.4. Other Models
Other options for private sector involvement are possible, and could be considered either transitional or end states. Two examples follow:
Outsourcing functional groups is a proven contracting and procurement model that should deliver efficiency and cost savings in key areas. However, it may not tackle the underlying issues preventing change if these are at an organisational level. Like the options engaging a sole contractor, there is a risk of creating private sector monopolies unless teams can be split up. There may also be resistance among staff over terms and conditions and pensions.
Contracting out individual projects is a manageable and credible option that will target private sector project and programme experience onto specific projects. Advantageously, the capability of the partner can be different for each project, depending on the requirements. Targeting individual projects means there is the threat of falling into a piecemeal approach which fails to tackle the underlying cultural issues. Projects may also be ‘set up to fail’.
9.7. Conclusions and recommendations
9.7.1. Key observations
• This report has raised a wide range of issues around DE&S skills, processes and working interfaces. In order to address these issues, the organisation needs to undergo profound change. Previous reforms to the organisational construct have not delivered the necessary changes. This suggests that the problems are structural. In order to implement significant reforms, alternative approaches are likely to be more successful and faster than simply “remodelling” the existing DE&S structure and ways-of-working.
210 210
Review of Acquisition
• The core project delivery activities of DE&S should be organised into a separate organisation, which operates at arms-length from the rest of the Department. This separate entity should be free to develop best-in-class skills and processes for its core tasks. It would be rewarded on the basis of successfully achieving clearly defined objectives related to the delivery of projects on time and on budget.
• The injection of greater external commercial skills and undertaking deeper changes to the way in which DE&S is organised would likely be better options than continuing the path of internally-driven reform and improvement. Recent observations by the House of Commons Committee Defence Committee concur, with one report116 stating that “DE&S needs to indentify key posts where good experience in the various special skills is required now, and develop a strategy for drawing in such experienced staff from outside DE&S”.
• It is likely that involvement of the private sector in this process would be desirable, at the very least to help with skills and knowledge transfer, and possibly more deeply to speed more fundamental change. Anticipated benefits associated with such ‘commercialisation’ or ‘contractorisation’ models include:
− the injection of skills and processes that are unlikely to be easily developed internally;
− clear realignment of interfaces and incentives to correct some of the issues raised in earlier chapters, such as “blurring” between DE&S and the Centre or undue military influence; and
− an acceleration of change processes and efficiency gains through external, commercially-driven management practices.
• In view of security concerns, both commercial and military, commercial partners in the Go-Co agreement will need to be selected carefully.
9.7.2. Recommendations and Considerations
Recommendation 8
Change the status of DE&S
a) Status of DE&S to be considered. At the very minimum it should become a Trading Fund. If a credible plan for delivery of objectives set out in Recommendation 7 within government ownership cannot be brought forward within 12 months, DE&S to be contractorised as a formal Go-Co.
116 Defence Equipment 2008: Government response to the Committee’s Tenth Report of Session 2007-08, House of Commons Defence Committee (Jun 08)

211 211 Review of Acquisition
212 212
Review of Acquisition
10. INTERNATIONAL COMPARISONS
10.1. Overview
This chapter describes the international context for UK Defence acquisition, with the specific intention of understanding both the performance of the MoD in equipment acquisition relative to its international peers and to inform thinking as to the kinds of potential solutions that have been proposed and / or adopted elsewhere. As such, the implications of this chapter are largely reflected in observations and recommendations made elsewhere in this report.
For these purposes, the Review has primarily focussed on “similar” Defence systems for which good information is generally available in the public domain (e.g., audit reports and other statistics, formal reviews, policy papers, etc.) – namely the US, France, Australia, and Canada. However, the Review team has also has undertaken a number of conversations with parties involved in various roles in other countries' military acquisition systems (most notably the US and France) to ensure that appropriate context and detail can be reflected here.
10.2. UK defence in an international context
10.2.1. Scale of forces, equipment and support spending
The UK has the fourth largest national defence expenditure in the world with net cash expenditure in 2007-08 of £33.5bn117 ($66bn118). With a defence budget of $660bn, equivalent to the next 45 highest spending nations combined, the US has the largest budget, followed by China ($145bn) and Russia ($85bn), as shown in Figure �10-1.
117 MoD Annual Report 2007-08, p294 118 In real terms FY09 US Dollars
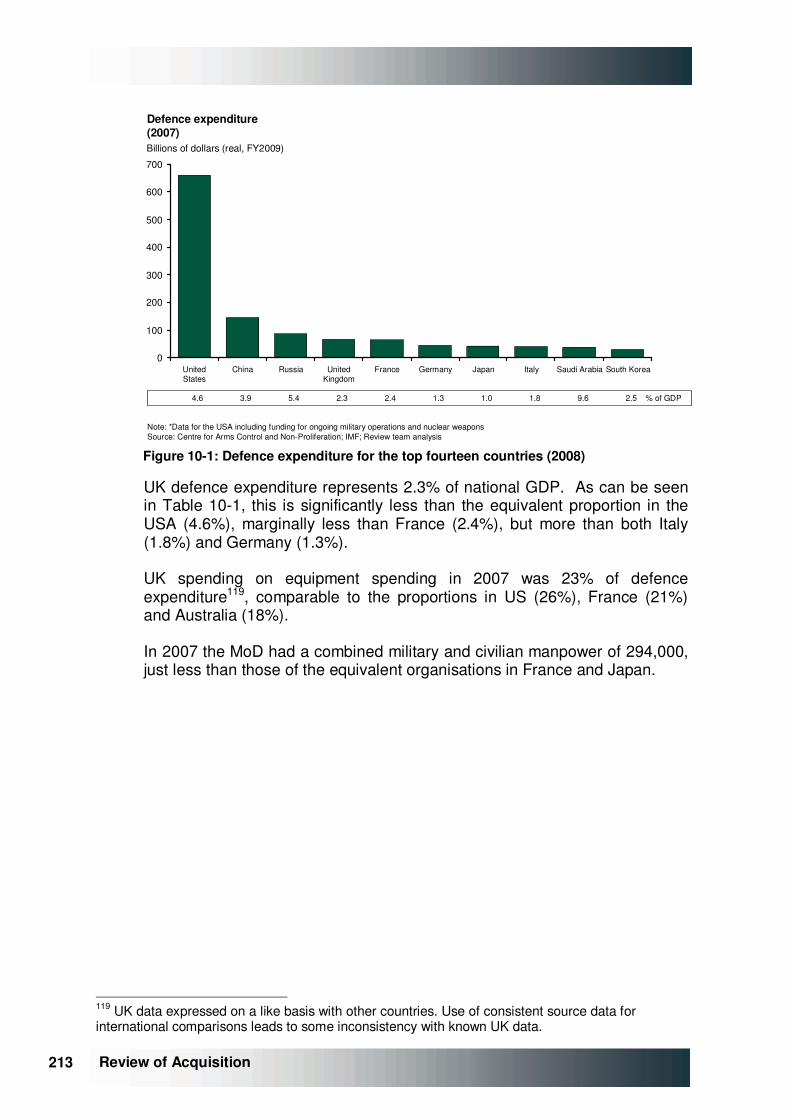
213 213 Review of Acquisition
Defence expenditure(2007)
Note: *Data for the USA including funding for ongoing military operations and nuclear weaponsSource: Centre for Arms Control and Non-Proliferation; IMF; Review team analysis
0
100
200
300
400
500
600
700
United States
China Russia United Kingdom
France Germany Japan Italy Saudi Arabia South Korea
Billions of dollars (real, FY2009)
% of GDP4.6 3.9 5.4 2.3 2.4 1.3 1.0 1.8 9.6 2.5
Figure �10-1: Defence expenditure for the top fourteen countries (2008)
UK defence expenditure represents 2.3% of national GDP. As can be seen in Table �10-1, this is significantly less than the equivalent proportion in the USA (4.6%), marginally less than France (2.4%), but more than both Italy (1.8%) and Germany (1.3%).
UK spending on equipment spending in 2007 was 23% of defence expenditure119, comparable to the proportions in US (26%), France (21%) and Australia (18%).
In 2007 the MoD had a combined military and civilian manpower of 294,000, just less than those of the equivalent organisations in France and Japan.
119 UK data expressed on a like basis with other countries. Use of consistent source data for international comparisons leads to some inconsistency with known UK data.
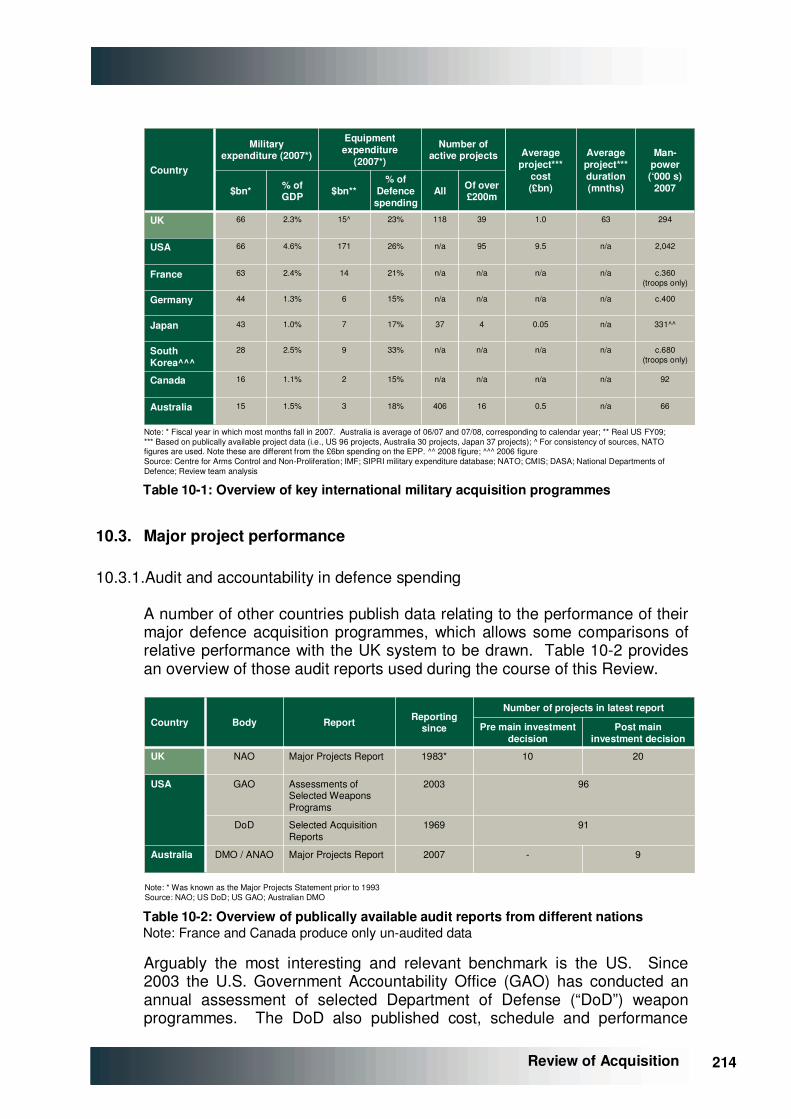
214 214
Review of Acquisition
92n/an/an/an/a15%21.1%16Canada
c.680(troops only)
n/an/an/an/a33%92.5%28South Korea^^^
66n/a0.51640618%31.5%15Australia
331^^
c.400
c.360(troops only)
2,042
294
Man-power(‘000 s)
2007
37
n/a
n/a
n/a
118
All
n/a
n/a
n/a
n/a
63
Average project*** duration (mnths)
0.05
n/a
n/a
9.5
1.0
Average project***
cost(£bn)
4
n/a
n/a
95
39
Of over £200m
Number of active projects
17%
15%
21%
26%
23%
% of Defence
spending
Equipment expenditure
(2007*)
Military expenditure (2007*)
71.0%43Japan
61.3%44Germany
142.4%63France
1714.6%66USA
15^2.3%66UK
$bn**% of GDP$bn*
Country
Note: * Fiscal year in which most months fall in 2007. Australia is average of 06/07 and 07/08, corresponding to calendar year; ** Real US FY09; *** Based on publically available project data (i.e., US 96 projects, Australia 30 projects, Japan 37 projects); ^ For consistency of sources, NATO figures are used. Note these are different from the £6bn spending on the EPP. ^^ 2008 figure; ^^^ 2006 figureSource: Centre for Arms Control and Non-Proliferation; IMF; SIPRI military expenditure database; NATO; CMIS; DASA; National Departments of Defence; Review team analysis Table �10-1: Overview of key international military acquisition programmes
10.3. Major project performance
10.3.1. Audit and accountability in defence spending
A number of other countries publish data relating to the performance of their major defence acquisition programmes, which allows some comparisons of relative performance with the UK system to be drawn. Table �10-2 provides an overview of those audit reports used during the course of this Review.
962003Assessments of Selected Weapons Programs
GAOUSA
9
20
Post main investment decision
Pre main investment decision
-
91
10
Number of projects in latest report
2007Major Projects ReportDMO / ANAOAustralia
1969
1983*
Reporting since
Selected Acquisition Reports
Major Projects Report
Report
DoD
NAO
Body
UK
Country
Note: * Was known as the Major Projects Statement prior to 1993Source: NAO; US DoD; US GAO; Australian DMO Table �10-2: Overview of publically available audit reports from different nations Note: France and Canada produce only un-audited data
Arguably the most interesting and relevant benchmark is the US. Since 2003 the U.S. Government Accountability Office (GAO) has conducted an annual assessment of selected Department of Defense (“DoD”) weapon programmes. The DoD also published cost, schedule and performance
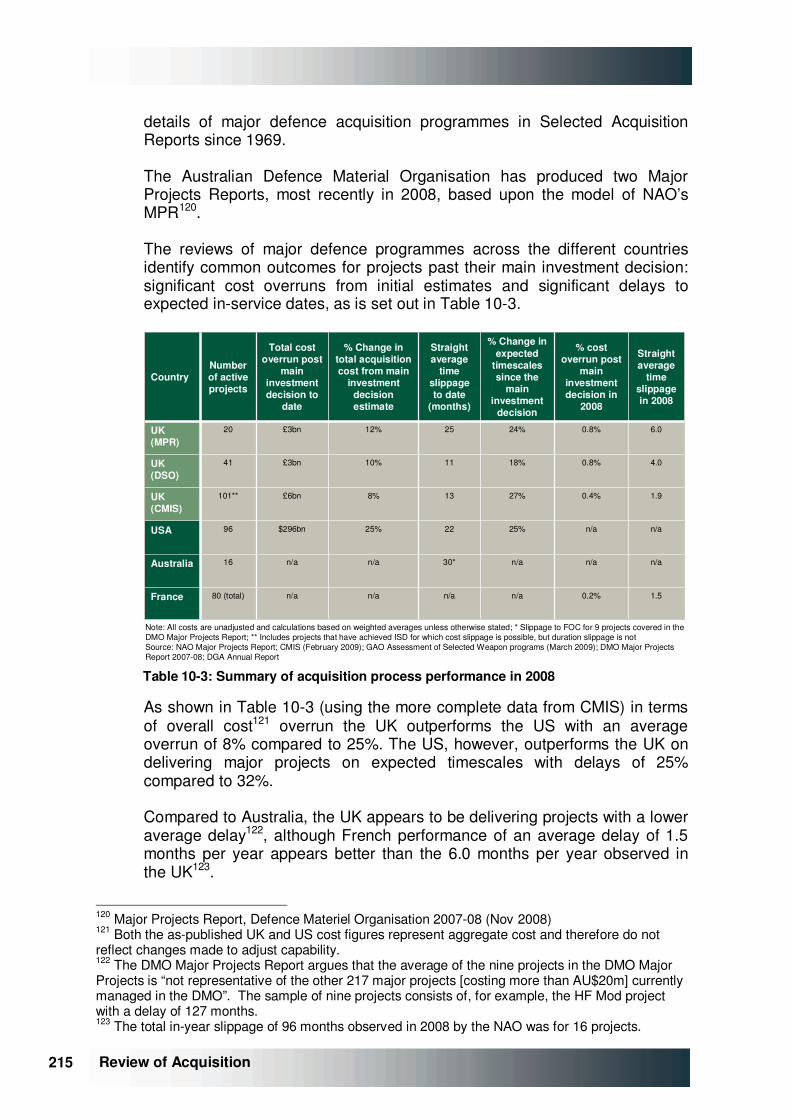
215 215 Review of Acquisition
details of major defence acquisition programmes in Selected Acquisition Reports since 1969.
The Australian Defence Material Organisation has produced two Major Projects Reports, most recently in 2008, based upon the model of NAO’s MPR120.
The reviews of major defence programmes across the different countries identify common outcomes for projects past their main investment decision: significant cost overruns from initial estimates and significant delays to expected in-service dates, as is set out in Table �10-3.
4.00.8%18%1110%£3bn41UK(DSO)
n/a
n/a
25%
27%
24%
% Change in expected
timescales since the
main investment
decision
1.90.4%138%£6bn101**UK(CMIS)
1.5
n/a
n/a
6.0
Straight average
time slippage in 2008
n/a
n/a
$296bn
£3bn
Total cost overrun post
main investment decision to
date
Number of active projects
0.2%n/an/a80 (total)France
n/a30*n/a16Australia
n/a22 25%96USA
0.8%2512%20UK (MPR)
% cost overrun post
main investment decision in
2008
Straight average
time slippage to date
(months)
% Change in total acquisition cost from main
investment decision estimate
Country
Note: All costs are unadjusted and calculations based on weighted averages unless otherwise stated; * Slippage to FOC for 9 projects covered in the DMO Major Projects Report; ** Includes projects that have achieved ISD for which cost slippage is possible, but duration slippage is notSource: NAO Major Projects Report; CMIS (February 2009); GAO Assessment of Selected Weapon programs (March 2009); DMO Major Projects Report 2007-08; DGA Annual Report Table �10-3: Summary of acquisition process performance in 2008
As shown in Table �10-3 (using the more complete data from CMIS) in terms of overall cost121 overrun the UK outperforms the US with an average overrun of 8% compared to 25%. The US, however, outperforms the UK on delivering major projects on expected timescales with delays of 25% compared to 32%.
Compared to Australia, the UK appears to be delivering projects with a lower average delay122, although French performance of an average delay of 1.5 months per year appears better than the 6.0 months per year observed in the UK123.
120 Major Projects Report, Defence Materiel Organisation 2007-08 (Nov 2008) 121 Both the as-published UK and US cost figures represent aggregate cost and therefore do not reflect changes made to adjust capability. 122 The DMO Major Projects Report argues that the average of the nine projects in the DMO Major Projects is “not representative of the other 217 major projects [costing more than AU$20m] currently managed in the DMO”. The sample of nine projects consists of, for example, the HF Mod project with a delay of 127 months. 123 The total in-year slippage of 96 months observed in 2008 by the NAO was for 16 projects.
216 216
Review of Acquisition
10.4. Defence acquisition issues in the US
10.4.1. Acquisition organisation
It is possible to draw some parallels regarding experience of project performance in the US defence acquisition system and that in the UK.
Procurement has historically been performed by the individual services, although in recent years there have been increasing moves towards joint capabilities integration and development.
The Joint Requirements Oversight Council (“JROC”) reviews programmes and directs the Functional Capabilities Board (“FCB”) assessment of capabilities gaps and proposals. The Office of the Under Secretary of Defense for Acquisition, Technology and Logistics (“USD(AT&L)”) oversees defence acquisition across the various organisations involved.
Contract support is provided by the Defense Contract Management Agency (“DCMA”), who work directly with suppliers, selecting contractors, writing contracts and monitoring contractors’ performance. Logistics support is provided by the Defense Logistics Agency (“DLA”).
10.4.2. Approval system description
The standard ‘deliberate’ procurement process is defined by six phases (with UK equivalents): Capabilities Assessment (Concept phase); Material Solution Analysis (Assessment phase); Technology Development; Integrated System Design (part of Demonstration phase); System Capability and Manufacturing Process Demonstration (part of Demonstration phase); and Production & Deployment (Manufacturing phase). An overview is given in Figure �10-2.
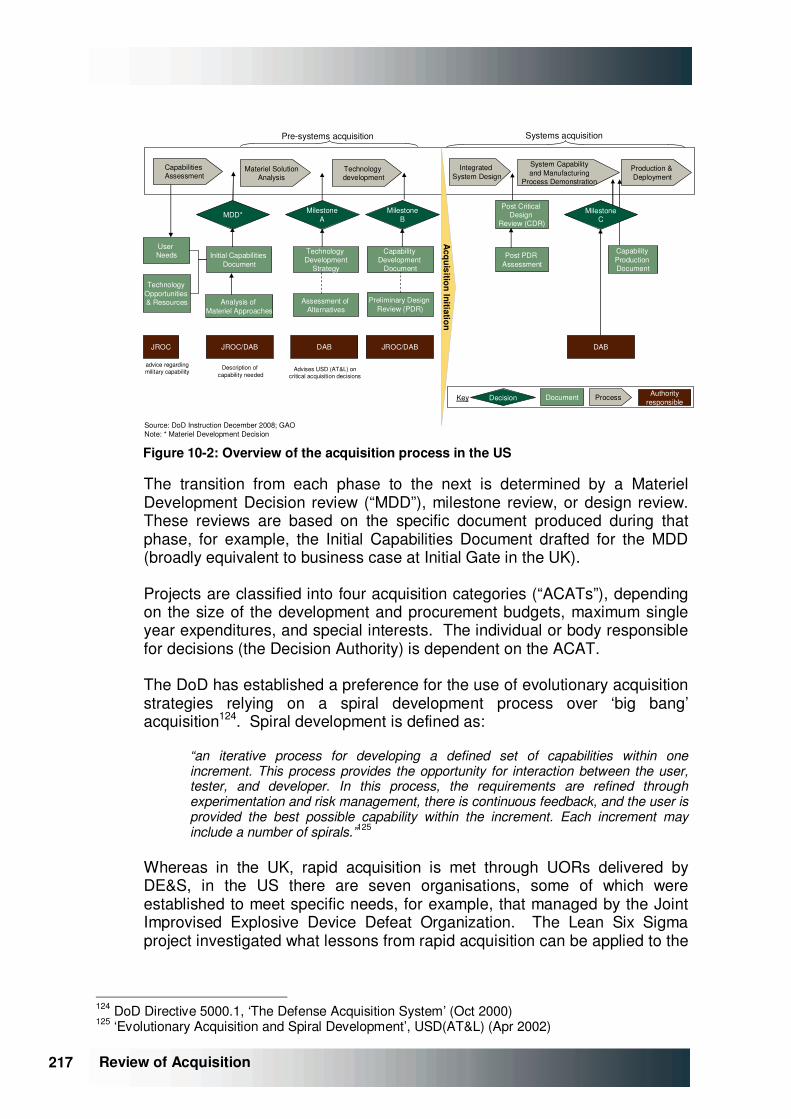
217 217 Review of Acquisition
Capabilities Assessment
Materiel SolutionAnalysis
Technology development
Integrated System Design
Production & Deployment
Milestone BMDD*
DecisionKey Document Process
Source: DoD Instruction December 2008; GAONote: * Materiel Development Decision
Initial Capabilities Document
Capability Development
Document
Capability Production Document
Analysis of Materiel Approaches
JROC/DAB
Technology Development
Strategy
Assessment of Alternatives
User Needs
Technology Opportunities & Resources
JROC
Milestone A
JROC/DABA
cquisition Initiation
Preliminary Design Review (PDR)
Post PDR Assessment
Post Critical Design
Review (CDR)
System Capability and Manufacturing
Process Demonstration
Milestone C
Authority responsible
DAB DAB
advice regarding military capability
Description of capability needed
Advises USD (AT&L) on critical acquisition decisions
Pre-systems acquisition Systems acquisition
Figure �10-2: Overview of the acquisition process in the US
The transition from each phase to the next is determined by a Materiel Development Decision review (“MDD”), milestone review, or design review. These reviews are based on the specific document produced during that phase, for example, the Initial Capabilities Document drafted for the MDD (broadly equivalent to business case at Initial Gate in the UK).
Projects are classified into four acquisition categories (“ACATs”), depending on the size of the development and procurement budgets, maximum single year expenditures, and special interests. The individual or body responsible for decisions (the Decision Authority) is dependent on the ACAT.
The DoD has established a preference for the use of evolutionary acquisition strategies relying on a spiral development process over ‘big bang’ acquisition124. Spiral development is defined as:
“an iterative process for developing a defined set of capabilities within one increment. This process provides the opportunity for interaction between the user, tester, and developer. In this process, the requirements are refined through experimentation and risk management, there is continuous feedback, and the user is provided the best possible capability within the increment. Each increment may include a number of spirals.”125
Whereas in the UK, rapid acquisition is met through UORs delivered by DE&S, in the US there are seven organisations, some of which were established to meet specific needs, for example, that managed by the Joint Improvised Explosive Device Defeat Organization. The Lean Six Sigma project investigated what lessons from rapid acquisition can be applied to the
124 DoD Directive 5000.1, ‘The Defense Acquisition System’ (Oct 2000) 125 ‘Evolutionary Acquisition and Spiral Development’, USD(AT&L) (Apr 2002)
218 218
Review of Acquisition
‘deliberate’ process in order to reduce cycle times. Evolutionary acquisition is the preferred DoD strategy for rapid acquisition of mature technology126.
One of the main differences with the UK is the practice of the Quadrennial Defense Review (“QDR”), which establishes the strategic direction for the DoD and reviews the organisational structures, processes and procedures to assess whether they will be effective in following this strategy. As stated in the 2006 preface, the QDR “is not a programmatic or budget document”127. The QDR directs the capability assessment decisions over the period.
10.4.3. Recent initiatives to improve acquisition system performance
The scale of the US military acquisition is significantly different to that of any other nation; the number of participants in the process is accordingly larger too. Perceptions of the root problems with the US’s acquisition processes are correspondingly divergent. There is, however, common recognition amongst commentators that projects run over time and over budget, and that poor project management performance can be blamed on structural factors including insufficient numbers of appropriately skilled acquisition professionals in the DoD. Although articulated in a variety of different ways, two systemic features are repeatedly cited as problems.
The first is that requirements are often over-specified, which means that immature technologies are too often incorporated into designs. Inevitably, this leads to real challenges in the delivery of a project. The second undesirable feature of the current system that is routinely criticised is the fundamental inability of the acquisition community to provide adequate cost estimates at the outset of a project. An unavoidable consequence of this problem is that projects cannot be delivered to the time, budget and performance criteria set out at initiation.
There is a consensus within the DoD - whether the Defense Secretary, his staff in the individual services128 or the acquisition community itself - that these two problems are critical failures of the US system. Both problems have also been identified by a broad spectrum of commentators outside of the department: the Senate Armed Services Committee (“SASC”)129: and its sister committee in the House of Representatives130 recognised them, for instance. GAO special reports in 2006 and 2008 also found that programmes often enter system development with immature technologies and continue past design reviews before design maturity131. The same reports were critical of assurance processes too. Overall, the GAO’s
126 DoD Instruction: Operation of the Defense Acquisition System 5000.02 (Dec 2008) 127 Quadrennial Defense Review Report 2006, DoD (Feb 2006) 128 Acquisition Improvement Plan, US Air Force (May 2009) 129 SASC Hearing on Acquisition of Major Weapons Systems and the Levin/McCain Acquisition Reform (Mar 2009) 130 House Armed Services Committee hearings (May 2009) 131 ‘Major Weapon Systems Continue to Experience Cost and Schedule Problems under DoD’s Revised Policy’, GAO (Apr 2006); ‘Fundamental Changes Are Needed to Improve Weapon Program Outcomes’, GAO (Sept 2008)
219 219 Review of Acquisition
damning conclusion was that the system permitted the initiation of programmes with unexecutable business cases, which would inevitably fail. The GAO was also critical of the ‘stovepiping’ in the capability requirements system, leading to a system that approves 90% of requirements and fosters unhealthy inter-service rivalries, which suggests there should be a greater role for the JROC.
Industry has an even greater number of voices than government but broadly recognises the same core issues and supports the need for acquisition reform along the lines the US government proposes. Its unique slants include the need for more dialogue between industry and government and streamlining of the over-burdensome acquisition process. The Aerospace Industries Association has recommended132 in November 2008 that the new Administration and Congress focus on three themes:
• promote fairness in contracting and financial policies;
• promote reform of the acquisition system; and
• promote competitiveness and efficiency of the Defence and Aerospace industry.
So, the problems with acquisition processes are widely recognised and the need for change generally accepted. In May 2009 President Obama commented that, “we’re going to save money by eliminating unnecessary defense programs that do nothing to keep us safe, but rather prevent us from spending money on what does keep us safe.” Aside from proposals to scale-back current procurement programmes (such as the cancellation of the $13bn VH-71 Presidential Helicopter program), the administration is seeking to implement organisational change. Indeed, one of the stated objectives for the DoD’s 2010 budget is to begin a fundamental overhaul of the DoD’s approach to procurement, acquisition, and contracting.
Defense Secretary Robert Gates explicitly placed the trading off of capability and cost at the centre of the New National Defense Strategy133. To inform that trading off, the department’s acquisition systems are to focus on three issues134:
• more use of competitive prototyping when appropriate, leading to more mature technology insertion and a better understanding of requirements;
• improved cost estimating, taking into account realistic levels of risk and move away from ‘success-orientated’ cost estimates that assume ‘everything will go right’; and
132 ‘U.S. Defense Acquisition: An Agenda for Positive Reform’, Aerospace Industries Association (Nov 2008) 133 ‘A Balanced Strategy: Reprogramming the Pentagon for a New Age’, Robert M. Gates (Jan/Feb 2009) 134 Address to the Armed Services Committee (May 6 2009)
220 220
Review of Acquisition
• conduct technology readiness assessments at each stage of process to ensure technologies are ready before introducing into a new system.
This new focus comes on top of major changes to the processes governing the acquisition process that were announced in December 2008. These changes include:
• the introduction of a mandatory acquisition process entry point, the MDD, to ensure that all available materiel options are considered when solutions to a capability need are first considered135;
• more frequent and effective programme reviews to assess progress – notably two key engineering reviews (the Preliminary Design Review and the Critical Design Review);
• configuration steering boards – implemented to preclude destabilising requirements changes, which have traditionally contributed to increased costs and extended schedules; and
• more effective test and evaluation – test activity integrated into every acquisition development phase.
The DoD has also recently announced plans to increase the acquisition workforce by 20,000 (16%) to 147,000 by 2015 (i.e., back to 1998 levels), including converting 11,000 specialists from contractor support positions to full-time government employees. This initiative aims to readdress the balance of contractorisation after the DoD heavily outsourced its acquisition and contracting operations in the late 1990s to support an increase in workload and a ‘sharp decrease’ in personnel numbers.
Conclusion: The US recognises the need to put significant effort into improving acquisition performance. There is acknowledgement of the need to use mature technologies more often; improve the acquisition workforce; stabilise funding for major programmes; and improve requirements control (both at outset and during later phases).
10.5. Defence acquisition issues in France
10.5.1. Acquisition organisation
In contrast with the US, and to a lesser extent the UK, the French Ministry of Defence has a simple structure. The Minister of Defence is supported by three senior staff: the Chief of the Defence Staff (“CDS”), who is responsible for capability related decisions (both in terms of requirements and deployment); a General Secretary of the Administration, who is responsible for matters relating to the budget, legal affairs and other support functions; and the Chief Executive of the Délégation générale pour l’armement
135 Testimony of Deputy USD (AT&L), Committee on Homeland Security and Governmental Affairs (Sep 2008)
221 221 Review of Acquisition
(“DGA”). The DGA is the part of the ministry that acquires military equipment for all three of the French armed forces. In addition to its responsibilities relating to the research and development of force equipment, it is also charged with formulating and technical and industrial policies.
The support of in-service equipment (and the associated logistic support) is conducted by single-service organisations under the direction of CDS136. However, all those support organisations have DGA personnel on their teams, and design authority resides with the DGA throughout the life cycle of a system.
The DGA’s mission is clearly articulated. It has three components:
• to prepare for future defence systems requirements;
• to equip the armed forces today; and
• to promote exports.
The organisational structure of the DGA mirrors these objectives, with an arrangement that is split into three divisions (and a supporting ‘enabling layer’). The largest division deals with operations, including the delivery of equipment (‘weapon system’) projects. Two others deal with issues relating to arms export, and to weapons procurement strategy (including industrial policy).
The delivery function is arranged into multi-disciplinary project teams, akin to the IPTs that are familiar to those versant in the UK acquisition system. These teams draw on expertise (e.g., programme management, technical expertise and materiel testing) from throughout the DGA in order to manage all aspects of the programme. One particularity of the French system is the emphasis that is placed on the technical function that informs the running of specific programmes; the organisation employs more than 5,500 ‘technical experts’. The DGA also has a system in place for responding rapidly to urgent operational requirements as they arise. In this regard, the DGA’s role in delivering equipment to satisfy urgent operational needs is similar to that of DE&S in managing the UOR process for the UK’s armed forces.
A particular emphasis is given to international co-operation: alternative procurement strategies must be demonstrated to be improvements over collaborative solutions. In this way, the DGA promotes France’s industrial and broader national interests across international borders.
DGA’s forward budget, the Loi de Programmation Militaire (LPM), is constrained by having some status in law passed by the French parliament. The law sets targets (for example on staff numbers and on the volume of equipment to be delivered) and fixes military expenditure for each of the next six years.
136 Nor does the DGA manage programmes in the equivalent to the ‘concept phase’ stages prior to the Assessment phase, which are managed within individual services.
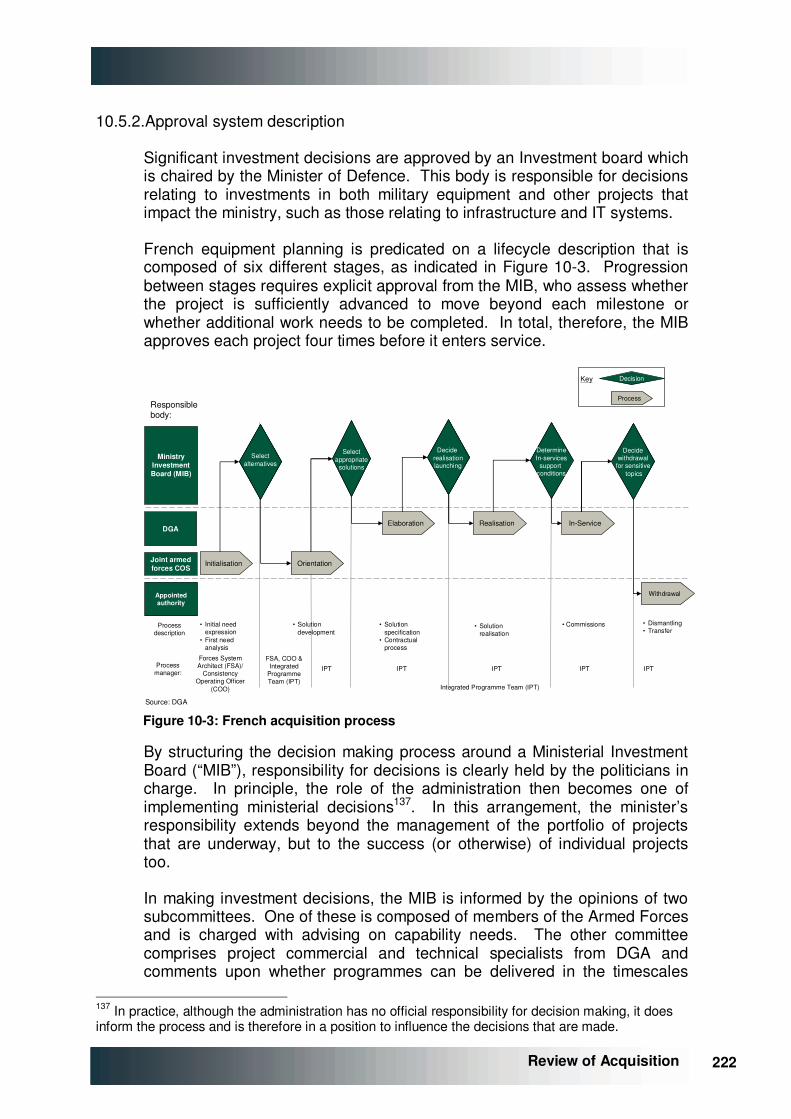
222 222
Review of Acquisition
10.5.2. Approval system description
Significant investment decisions are approved by an Investment board which is chaired by the Minister of Defence. This body is responsible for decisions relating to investments in both military equipment and other projects that impact the ministry, such as those relating to infrastructure and IT systems.
French equipment planning is predicated on a lifecycle description that is composed of six different stages, as indicated in Figure �10-3. Progression between stages requires explicit approval from the MIB, who assess whether the project is sufficiently advanced to move beyond each milestone or whether additional work needs to be completed. In total, therefore, the MIB approves each project four times before it enters service.
DGA
Initialisation Orientation
In-Service
Appointed authority
Joint armed forces COS
Source: DGA
Process
DecisionKey
Forces System Architect (FSA)/
Consistency Operating Officer
(COO) Integrated Programme Team (IPT)
Ministry Investment Board (MIB)
Responsible body:
Process manager:
Process description
• Initial need expression
• First need analysis
• Solution development
• Solution specification
• Contractualprocess
• Solutionrealisation
• Commissions • Dismantling• Transfer
Elaboration
Withdrawal
Realisation
Selectalternatives
Selectalternatives
Selectappropriate
solutions
Selectappropriate
solutions
Decide realisationlaunching
Decide realisationlaunching
DetermineIn-services
support conditions
DetermineIn-services
support conditions
Decide withdrawal
for sensitive topics
Decide withdrawal
for sensitive topics
FSA, COO & Integrated
Programme Team (IPT)
IPT IPT IPT IPT IPT
Figure �10-3: French acquisition process
By structuring the decision making process around a Ministerial Investment Board (“MIB”), responsibility for decisions is clearly held by the politicians in charge. In principle, the role of the administration then becomes one of implementing ministerial decisions137. In this arrangement, the minister’s responsibility extends beyond the management of the portfolio of projects that are underway, but to the success (or otherwise) of individual projects too.
In making investment decisions, the MIB is informed by the opinions of two subcommittees. One of these is composed of members of the Armed Forces and is charged with advising on capability needs. The other committee comprises project commercial and technical specialists from DGA and comments upon whether programmes can be delivered in the timescales
137 In practice, although the administration has no official responsibility for decision making, it does inform the process and is therefore in a position to influence the decisions that are made.
223 223 Review of Acquisition
and budgets available. The minister is therefore explicitly responsible for trading off aspirational objectives against practical concerns.
10.5.3. Recent initiatives to improve acquisition system performance
The approvals structure described above is a recent innovation, having been implemented following the publication of a defence white paper in the summer of 2008. The white paper led to budgets set for 6 and 12 years, and the identification three specific areas where the acquisition organisation needed to improve:
• budget planning;
• technical management; and
• co-ordination of procurement and support activities.
In response to the challenges, a variety of changes were suggested. The first set of changes involved changed financial processes. These included:
• new rules for setting out and explaining the budget to Parliament;
• revised budgetary architecture empowering programme managers;
• an improved performance management regime with a greater emphasis on financial and risk management;
• new reporting cycle to increase visibility and senior management oversight:
− monthly management accounts
− quarterly reports on performance, cost and time to the minister of defence
− annual reports on all projects to parliament; and
• reinforced governance for investment decisions (the MIB and supporting subcommittees).
Multidisciplinary teams, ‘Integrated Programme Teams’, were also introduced using matrix management to populate with appropriate skills, with the aspiration that they would extend to become through life entities wherever possible (e.g., on new equipment programmes).
Another set of changes related to the introduction of consistent project and programme management practices across the DGA; and further rationalisation of DGA operational overheads has also been undertaken (including the reduction of headcount and geographical footprint)
Other observations on French defence acquisition:
• there are fewer senior decision makers for acquisition than in the UK; and
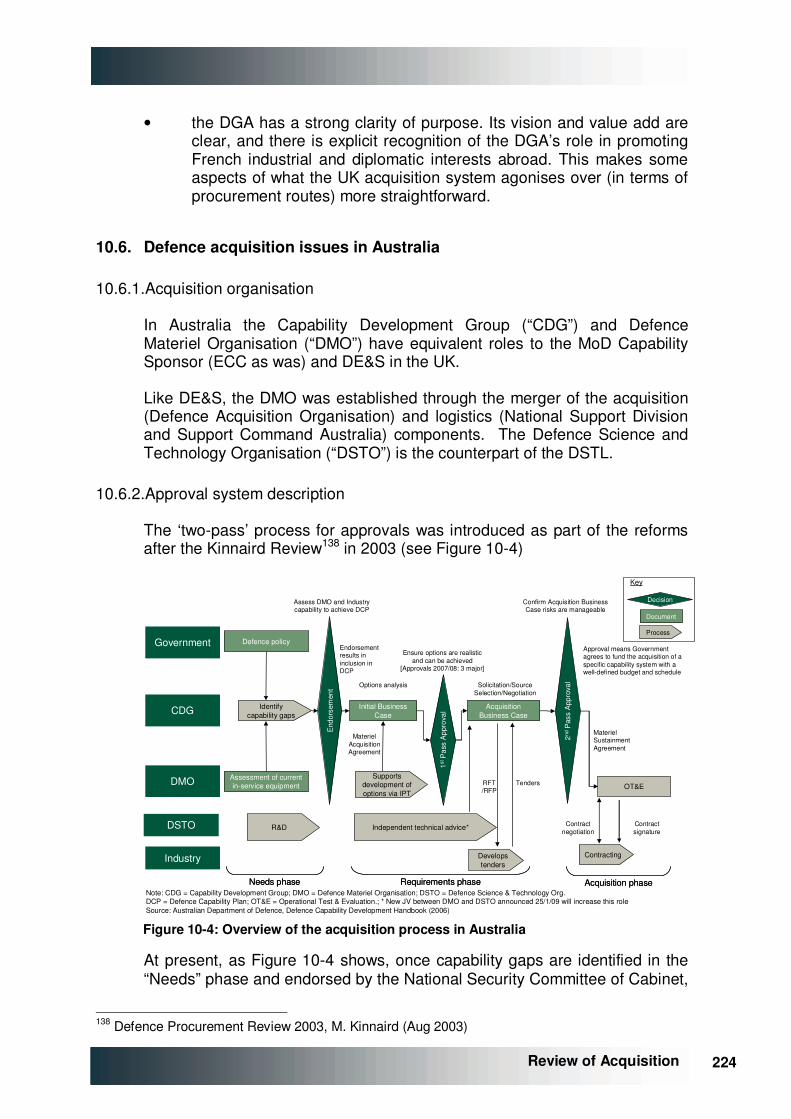
224 224
Review of Acquisition
• the DGA has a strong clarity of purpose. Its vision and value add are clear, and there is explicit recognition of the DGA’s role in promoting French industrial and diplomatic interests abroad. This makes some aspects of what the UK acquisition system agonises over (in terms of procurement routes) more straightforward.
10.6. Defence acquisition issues in Australia
10.6.1. Acquisition organisation
In Australia the Capability Development Group (“CDG”) and Defence Materiel Organisation (“DMO”) have equivalent roles to the MoD Capability Sponsor (ECC as was) and DE&S in the UK.
Like DE&S, the DMO was established through the merger of the acquisition (Defence Acquisition Organisation) and logistics (National Support Division and Support Command Australia) components. The Defence Science and Technology Organisation (“DSTO”) is the counterpart of the DSTL.
10.6.2. Approval system description
The ‘two-pass’ process for approvals was introduced as part of the reforms after the Kinnaird Review138 in 2003 (see Figure �10-4)
Note: CDG = Capability Development Group; DMO = Defence Materiel Organisation; DSTO = Defence Science & Technology Org.DCP = Defence Capability Plan; OT&E = Operational Test & Evaluation.; * New JV between DMO and DSTO announced 25/1/09 will increase this roleSource: Australian Department of Defence, Defence Capability Development Handbook (2006)
Defence policy
Identify capability gaps
Assessment of current in-service equipment
Initial Business Case
End
orse
men
t
Acquisition Business Case
OT&E
Assess DMO and Industry capability to achieve DCP
1stP
ass
App
rova
l
Ensure options are realistic and can be achieved
[Approvals 2007/08: 3 major]
Government
CDG
DMO
Industry
2nd
Pas
s A
ppro
val
Confirm Acquisition Business Case risks are manageable
Approval means Government agrees to fund the acquisition of a specific capability system with a well-defined budget and schedule
Endorsement results in inclusion in DCP
Needs phaseNeeds phase Requirements phaseRequirements phase
Supports development of options via IPT
Develops tenders
RFT/RFP
Tenders
Materiel Acquisition Agreement
Materiel Sustainment Agreement
Acquisition phaseAcquisition phase
Options analysis Solicitation/Source Selection/Negotiation
DSTO
Contracting
Contract negotiation
Contract signature
R&D Independent technical advice*
Document
Process
Decision
Key
Figure �10-4: Overview of the acquisition process in Australia
At present, as Figure �10-4 shows, once capability gaps are identified in the “Needs” phase and endorsed by the National Security Committee of Cabinet,
138 Defence Procurement Review 2003, M. Kinnaird (Aug 2003)
225 225 Review of Acquisition
they achieve entry into the Defence Capability Plan (“DCP”). A ten-year view of the DCP is published approximately every two years with the aim of providing Industry “with sufficient guidance to enable broad business planning”139. Updates to the DCP are published in the (alternate) off-years.
At the First Pass approval stage, an Initial Business Case for each realistic option that addresses the capability gap is considered. It is expected that the options presented will include at least one off-the-shelf (“OTS”) option where such an option exists140, as recommended by Kinnaird. Mortimer recommended stronger consideration of OTS options, with any decisions to move beyond the requirements of an OTS solution being based “on a rigorous cost-benefit analysis of the additional capability sought against the cost and risk of doing so”.
The Rapid Acquisition Program allows low-risk projects to undergo an accelerated acquisition process with a combined First and Second Pass Approval stage. For example, four Boeing C-17 Globemaster III aircraft141 were acquired under the Rapid Acquisition Program in 2006. Rapid acquisition accounted for £169m in 2007-08, almost 10% of the DMO acquisition budget142 (cf., 13% on UORs in UK in 2008).
10.6.3. Recent initiatives to improve acquisition system performance
In 2008, the Mortimer review143 considered the reforms that followed Kinnaird to both assess whether they had fully achieved the desired outcomes and to develop new proposals. The Mortimer review (2008) identified five principal areas of concern:
• Inadequate project management resources in the CDG;
• The inefficiency of the process leading to government approvals for new projects;
• Shortages in DMO personnel;
• Delays due to inadequate industry capacity; and
• Difficulties in the introduction of equipment into full service.
Mortimer made 46 recommendations to address these issues. In terms of capability planning, these included increasing the rigour with which projects are assessed for entry into the DCP and streaming of the standard ‘two-pass’ process, with responsibility for simpler acquisitions delegated and bypassing the first stage once capability requirement is agreed. For capability acquisition, the upweighting of importance of Capability Managers within CDG and greater alignment of contracting with commercial practice were recommended. Mortimer also recommended that it should be
139 Defence Capability Plan 2006-16: Public Version (Jun 2006) 140 DMO Acquisition and Sustainment Manual (Dec 2007) 141 Project AIR 8000 phase 3 142 Defence Annual Report 2007-08, Department of Defence (Oct 2008) 143 Defence Procurement and Sustainment Review, D. Mortimer (Sep 2008)
226 226
Review of Acquisition
mandated that the Chief Executive Officer of DMO must have significant private sector and commercial experience and that General Manager – Commercial position should be created to deal with strategic commercial issues.
Further to this, the Australian Department of Defence published a strategic defence white paper in May 2009144, its first since 2000. It sets out the strategic defence policy goals and derives broad capability priorities, informed by a force structure review. The Government also committed to funding to the defence white paper until 2030145:
• 5.5% nominal growth in defence budget to 2017-18; and
• 4.7% nominal growth in defence budget from 2018-19 to 2030.
10.7. Defence acquisition issues in Canada
10.7.1. Acquisition organisation
The Department of National Defence (“DND”) and Public Works and Government Services Canada (“PWGSC”) are jointly responsible for conducting the acquisition process. Within DND, the Canadian Forces (“CF”) are responsible for defining their requirements, while the Materiel Group is in charge of delivering the solution. Industry Canada (“IC”) are accountable for industrial and regional benefits of defence procurement.
10.7.2. Approval system description
As shown in Figure �10-5, the approvals process for defence procurement has three phases: a Needs phase, a Project Definition phase and an Implementation phase146.
144 Defending Australia in the Asia Pacific Century: Force 2030 (May 2009) 145 Excluding the net costs of major overseas operations 146 ‘Procurement and associated processes’, Standing Committee on National Defence (Feb 2008)
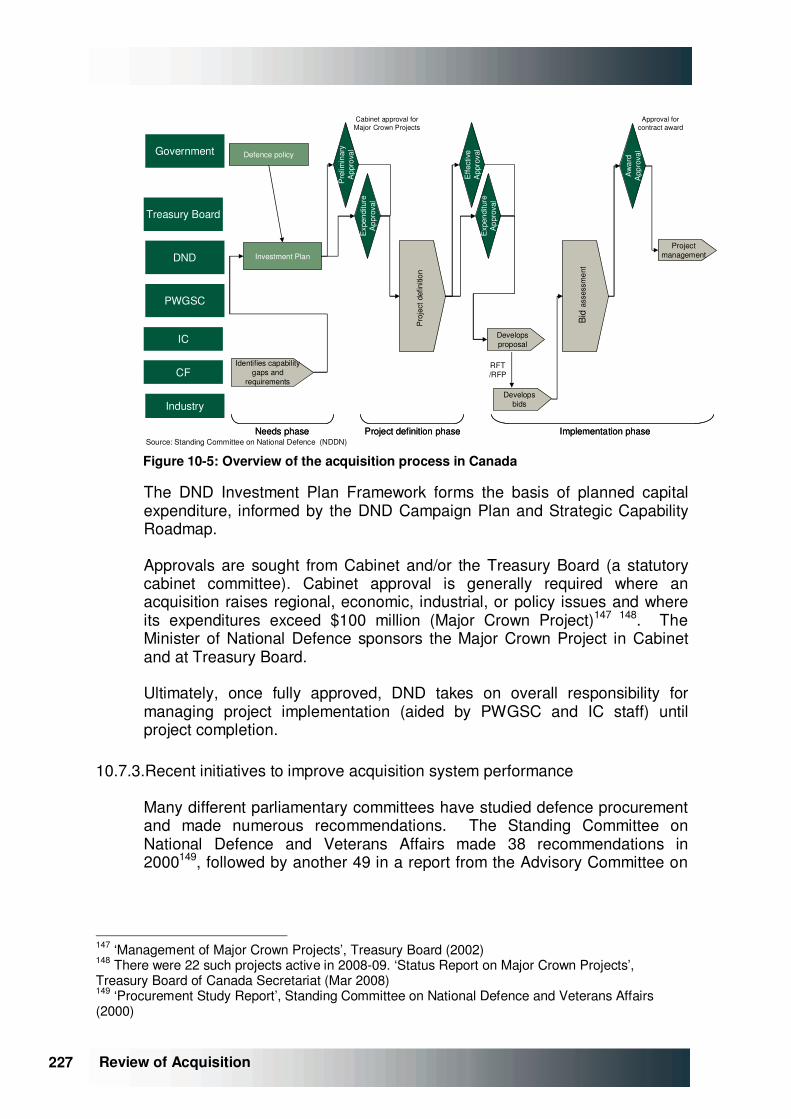
227 227 Review of Acquisition
Source: Standing Committee on National Defence (NDDN)
Defence policy
Investment Plan
Pre
limin
ary
App
rova
l
Cabinet approval for Major Crown Projects
Government
DND
PWGSC
Industry
Needs phaseNeeds phase
CFIdentifies capability
gaps and requirements
Project definition phaseProject definition phase
Exp
endi
ture
A
ppro
val
Treasury Board
Effe
ctiv
e A
ppro
val
Exp
endi
ture
A
ppro
val
IC
Develops bids
Develops proposal
RFT/RFP
Aw
ard
App
rova
l
Approval for contract award
Project management
Implementation phaseImplementation phase
Bid
ass
essm
ent
Pro
ject
def
initi
on
Figure �10-5: Overview of the acquisition process in Canada
The DND Investment Plan Framework forms the basis of planned capital expenditure, informed by the DND Campaign Plan and Strategic Capability Roadmap.
Approvals are sought from Cabinet and/or the Treasury Board (a statutory cabinet committee). Cabinet approval is generally required where an acquisition raises regional, economic, industrial, or policy issues and where its expenditures exceed $100 million (Major Crown Project)147 148. The Minister of National Defence sponsors the Major Crown Project in Cabinet and at Treasury Board.
Ultimately, once fully approved, DND takes on overall responsibility for managing project implementation (aided by PWGSC and IC staff) until project completion.
10.7.3. Recent initiatives to improve acquisition system performance
Many different parliamentary committees have studied defence procurement and made numerous recommendations. The Standing Committee on National Defence and Veterans Affairs made 38 recommendations in 2000149, followed by another 49 in a report from the Advisory Committee on
147 ‘Management of Major Crown Projects’, Treasury Board (2002) 148 There were 22 such projects active in 2008-09. ‘Status Report on Major Crown Projects’, Treasury Board of Canada Secretariat (Mar 2008) 149 ‘Procurement Study Report’, Standing Committee on National Defence and Veterans Affairs (2000)
228 228
Review of Acquisition
Administrative Efficiency in 2003150, and 55 in a Government-Wide Review of Procurement by Public Works and Government Services Canada in 2005151.
These recommendations focused on making the approvals process more adaptable to the level of scrutiny required, producing regular updates to the combat planning assumptions, bringing the evaluation of off-the-shelf products in line with other government departments, and developing the skills of managers (e.g., through certification).
More recently, the Parliamentary Standing Committee on National Defence undertook a review of procurement and associated processes in 2008152. A proposal for a single organisation (‘Defence Procurement Canada’) combining the procurement resources from DND and the contracting resources of PWGSC was rejected. The ten recommendations made focused on the transparency and accountability of the procurement process, requesting that a national defence capability plan be made public.
Following this report, the Canada First Defence Strategy was launched by the Canadian Government in May 2008 with the intention of outlining clear missions and capabilities to ensure Canadian Forces have the necessary manpower, equipment and support available for the next 20 years153. The investments required to implement the Canada First Defence Strategy are supported by an increase in long-term funding by on average 2.7% p.a. (0.6% in real terms) to 2027-28. This is intended to reverse the trend of the significant cuts to defence funding in the 1990s which resulted in an overall decline of the Forces’ equipment affecting all three services, for example, the disposal of one of three replenishment ships and one of four destroyers; the elimination of almost half the aircraft in the Air Force, and a significant portion of its fighting and utility vehicles from the Army. Over the last two years, the Canadian Government has committed resources to rebuilding the Forces and made decisions related to the most urgent equipment needs.
10.8. Potential lessons from Defence acquisition practice in other countries
• US Quadrennial Review – forces governments on a regular basis to address the difficult defence capability questions and to act;
• France export mission – explicit recognition of DGA’s role in promoting French industrial and diplomatic interests abroad;
• French funding situation – stable funding environment and legally binding nature of LPM covering 5 year periods to help constrain budgetary commitments; ministerial ownership of investment decisions; aims to increase transparency in project performance.
150 ‘Achieving Administrative Efficiency’, Advisory Committee on Administrative Efficiency (Aug 2003) 151 Final Report of Parliamentary Secretary’s Task Force on Government-Wide Review of Procurement (2005) 152 ‘Procurement and associated processes’, Standing Committee on National Defence (Feb 2008) 153 ‘Canada First Defence Strategy’, DND (May 2008)
229 229 Review of Acquisition
10.9. Key observations
• Judged by military spending the UK is a major military power, with a major programme of procuring new equipments to support its Defence aspirations.
• The headline performance (in terms of cost and time) of the UK MoD in managing its major projects appears to be neither particularly better, nor particularly worse than its peers.
• The underlying issues faced by the MoD’s international peers are also broadly those the MoD faces – affordability of aspirations and delays to delivery / cost overrun of new equipment.
• Most of the UK’s peers have launched reviews with the intention of addressing these issues. Recommendations resulting from these reviews have included:
− review balance of defence capabilities needed to fight the range of asymmetric to Cold War opponents (US);
− launch of major acquisition reform agenda (US);
− changes to defence procurement strategy to ensure exportability and increase international cooperation (France);
− default options for procurement being “off the shelf” (Australia);
− civilianisation of the procurement body (Australia); and
− increased financial / commercial skills (Australia).
• Elements of UK’s Smart Procurement initiative, including the ‘Purple’ or joint capability management / requirements organisation and multi-disciplinary project output based teams have been replicated elsewhere.
• Current efforts to up-skill defence acquisition workforces, ongoing in the UK, are also evident elsewhere.
• No evidence yet of a ‘magic formula’ for acquisition reform that has been shown to deliver its intended benefits – only time will tell in all these cases.

230 230
Review of Acquisition
Appendices

231 231 Review of Acquisition
232 232
APPENDICES
Review of Acquisition
APPENDIX A. ACQUISITION IN THE CONTEXT OF MOD RESOURCES
A.1. Overview of Public Expenditure Budgeting
Since 2001/02 government departmental budgets have been set and monitored under a resource budgeting framework, which applies Generally Accepted Accounting Practice (“GAAP”) to departmental transactions154. Under this framework, Requests for Resources (“RfRs”) are presented to Parliament and resources are granted to each department based on an accruals, rather than cash, basis. Three Requests for Resources are typically granted to the MoD every year:
• RfR1: Provision of Defence Capability. Provides for expenditure primarily to meet the costs of the Department's operational, support and logistics services, and providing the equipment capability required by Defence policy;
• RfR2: Operations and Peace-Keeping. Provides for the consumption of resources in support of activity in Afghanistan and Iraq; and
• RfR3: War Pensions and Allowances, etc. Provides for the payment of war disablement and war widows' pensions.
In granting resources, Parliament specifies Departmental Expenditure Limits (“DELs”), which are used to control the amount of money that each Department can spend. These caps determine the budgets for all expenditure on programmes which deliver its Departmental objectives as well as the amount of money available for the associated administrative tasks. Under an accruals-based system, DELs cover both cash items (capital and operational expenditure) and non-cash items (such as depreciation, cost of capital charges, and provisions).
Resources granted by Parliament also cover non-discretionary commitments that are managed by Departments, but over which they have relatively little control. This category of expenditure includes demand-led items such as social security benefits and tax credits. Given the lack of control that Departments can exercise over this type of spend, it would be unreasonable to include these items within their general expenditure limits. But the associated financial commitments do still need to be included in the Government’s overall budget planning process. These commitments are therefore identified as Annually Managed Expenditure (“AME”), and are not subject to same controls as DELs.
In the context of the MoD, RfR3 is provided to cover AME for War Pensions and Allowances, whilst grants under RfR1 and RfR2 provide resources which
154 Resource accounting measures expenditure when it accrues rather than when the cash is spent. They do not include, as an in-year cost, prepayments for goods and services not consumed in that year but they will include resources consumed, regardless whether the resources consumed are to be paid for in later years or where they have been pre-financed in earlier periods. It also includes non-cash costs such a movements in provisions and charges for bad debts.
233 233
APPENDICES
Review of Acquisition
are subject to DELs. Being concerned with controllable expenditure, this report only studies activities that are included in DEL. Furthermore, most acquisition activity undertaken by the MoD is conducted as a part of normal operations. Unless otherwise stated, data in this report therefore relate solely to resources provided under RfR1.
The total DEL for each department is distinguished into three component parts, each of which is subject to its own expenditure limit:
• Capital DEL (“CDEL”). Expenditure which is capitalisable and can subsequently depreciated in line with Departmental policies. For the MoD, this comprises equipment procurement and capital investment in equipment, support, infrastructure and estates;
• Direct Resource DEL (“DRDEL”). Consists of costs incurred in providing the Department’s services. For the MoD, this includes items such as pay, non-capitalised equipment support costs, fuel and administrative expenses; and
• Indirect Resource DEL (“IRDEL”). Covers non-cash items, primarily the cost of capital (notionally charged at 3.5% p.a. within MoD) and depreciation.
Together, CDEL and DRDEL comprise the ‘near-cash’ spend that is generally most closely tracked by departments themselves. Within the MoD, DELs are further broken down into expenditure limits for the constituent parts of the Department. IRDEL, on the other hand, is monitored across the Department as a whole, but is not controlled at a more granular level.
A.2. Structure of MoD Top Level Budget Holders
In order to deliver defence outputs effectively, the MoD is organised around eight cost centres, each of which is responsible for the delivery of specific outputs. These outputs are either elements of military capability or services which support the delivery of military capability, as indicated in schematically in Figure �A-1155.
155 A number of agencies and trading funds also operate within the MoD. These are not considered here.
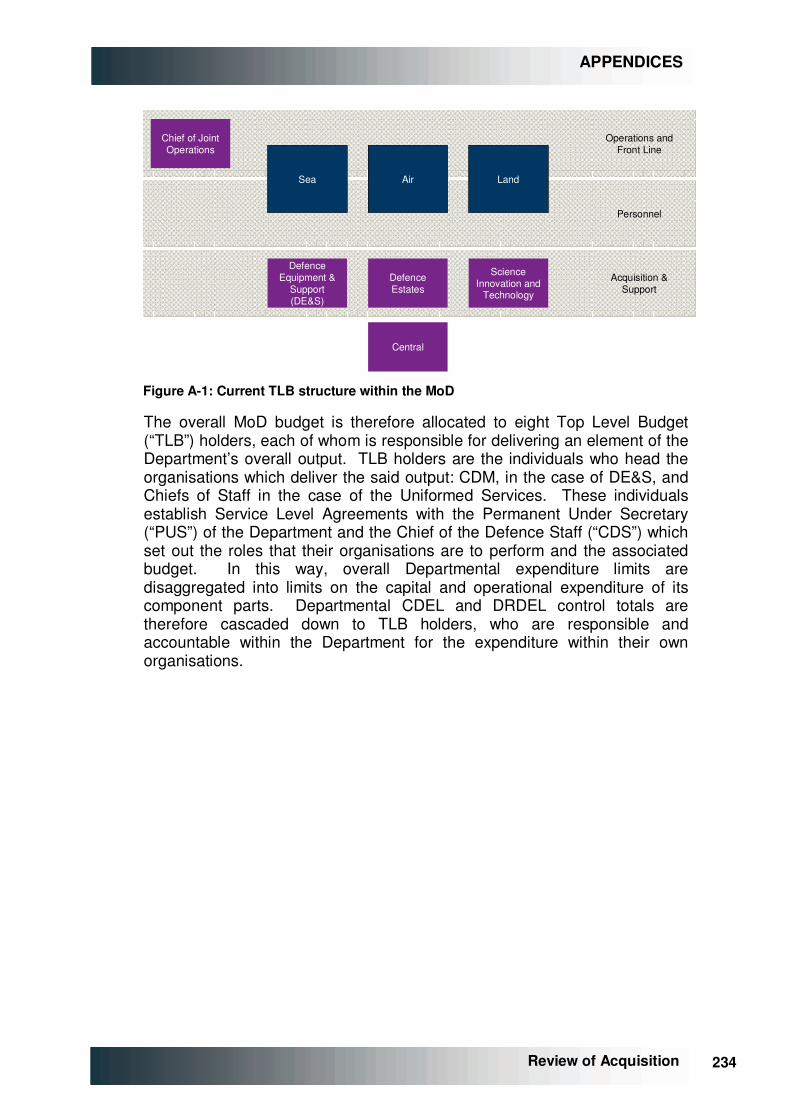
234 234
APPENDICES
Review of Acquisition
Chief of Joint Operations
Sea Air Land
Defence Equipment &
Support (DE&S)
Defence Estates
Science Innovation and
Technology
Central
Operations and Front Line
Personnel
Acquisition & Support
Figure �A-1: Current TLB structure within the MoD
The overall MoD budget is therefore allocated to eight Top Level Budget (“TLB”) holders, each of whom is responsible for delivering an element of the Department’s overall output. TLB holders are the individuals who head the organisations which deliver the said output: CDM, in the case of DE&S, and Chiefs of Staff in the case of the Uniformed Services. These individuals establish Service Level Agreements with the Permanent Under Secretary (“PUS”) of the Department and the Chief of the Defence Staff (“CDS”) which set out the roles that their organisations are to perform and the associated budget. In this way, overall Departmental expenditure limits are disaggregated into limits on the capital and operational expenditure of its component parts. Departmental CDEL and DRDEL control totals are therefore cascaded down to TLB holders, who are responsible and accountable within the Department for the expenditure within their own organisations.
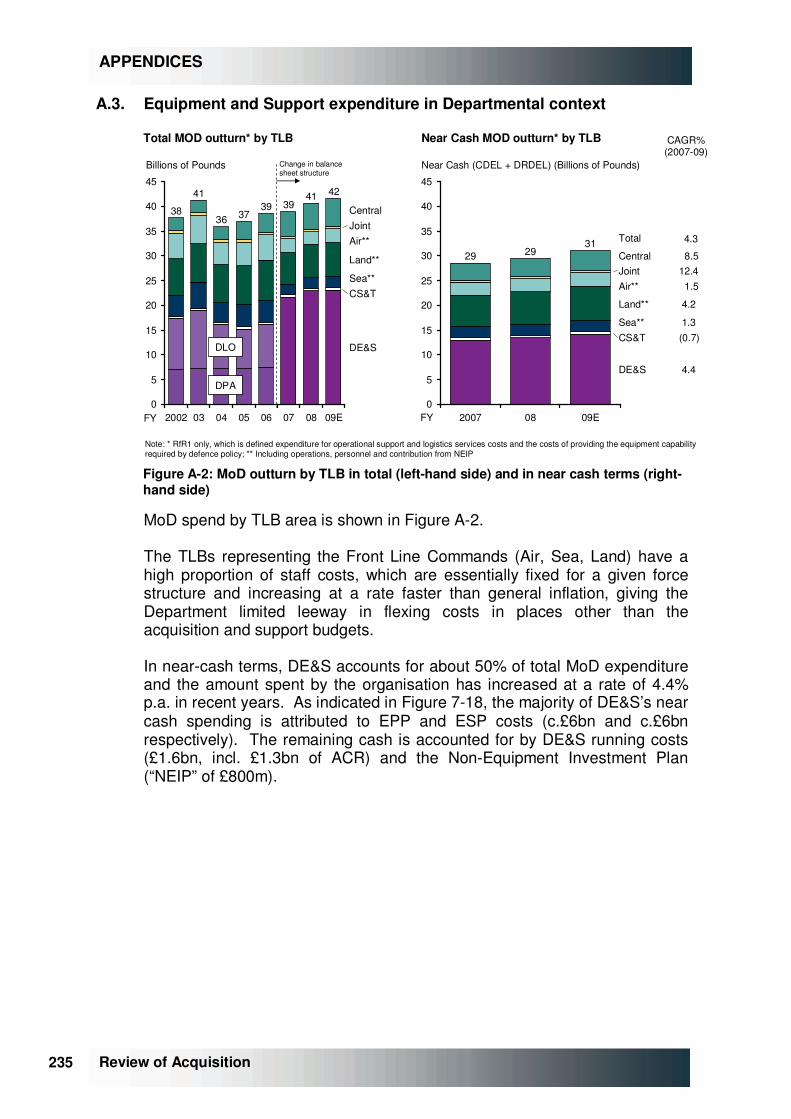
235 235
APPENDICES
Review of Acquisition
A.3. Equipment and Support expenditure in Departmental context
Total MOD outturn* by TLB
Note: * RfR1 only, which is defined expenditure for operational support and logistics services costs and the costs of providing the equipment capability required by defence policy; ** Including operations, personnel and contribution from NEIP
0
5
10
15
20
25
30
35
40
4541
08
42
09E
CentralJointAir**
Land**
Sea**CS&T
DE&S
04
37
05
39
06
39
07
38
2002
41
03
36
Billions of Pounds
DPA
DLO
Total
Change in balance sheet structure
0
5
10
15
20
25
30
35
40
45
29
2007
29
08
31
09E
Central 8.5Joint 12.4Air** 1.5
Land** 4.2
Sea** 1.3CS&T (0.7)
DE&S 4.4
Near Cash (CDEL + DRDEL) (Billions of Pounds)
Near Cash MOD outturn* by TLB
FYFY
4.3
CAGR%(2007-09)
Figure �A-2: MoD outturn by TLB in total (left-hand side) and in near cash terms (right-hand side)
MoD spend by TLB area is shown in Figure �A-2.
The TLBs representing the Front Line Commands (Air, Sea, Land) have a high proportion of staff costs, which are essentially fixed for a given force structure and increasing at a rate faster than general inflation, giving the Department limited leeway in flexing costs in places other than the acquisition and support budgets.
In near-cash terms, DE&S accounts for about 50% of total MoD expenditure and the amount spent by the organisation has increased at a rate of 4.4% p.a. in recent years. As indicated in Figure �7-18, the majority of DE&S’s near cash spending is attributed to EPP and ESP costs (c.£6bn and c.£6bn respectively). The remaining cash is accounted for by DE&S running costs (£1.6bn, incl. £1.3bn of ACR) and the Non-Equipment Investment Plan (“NEIP” of £800m).
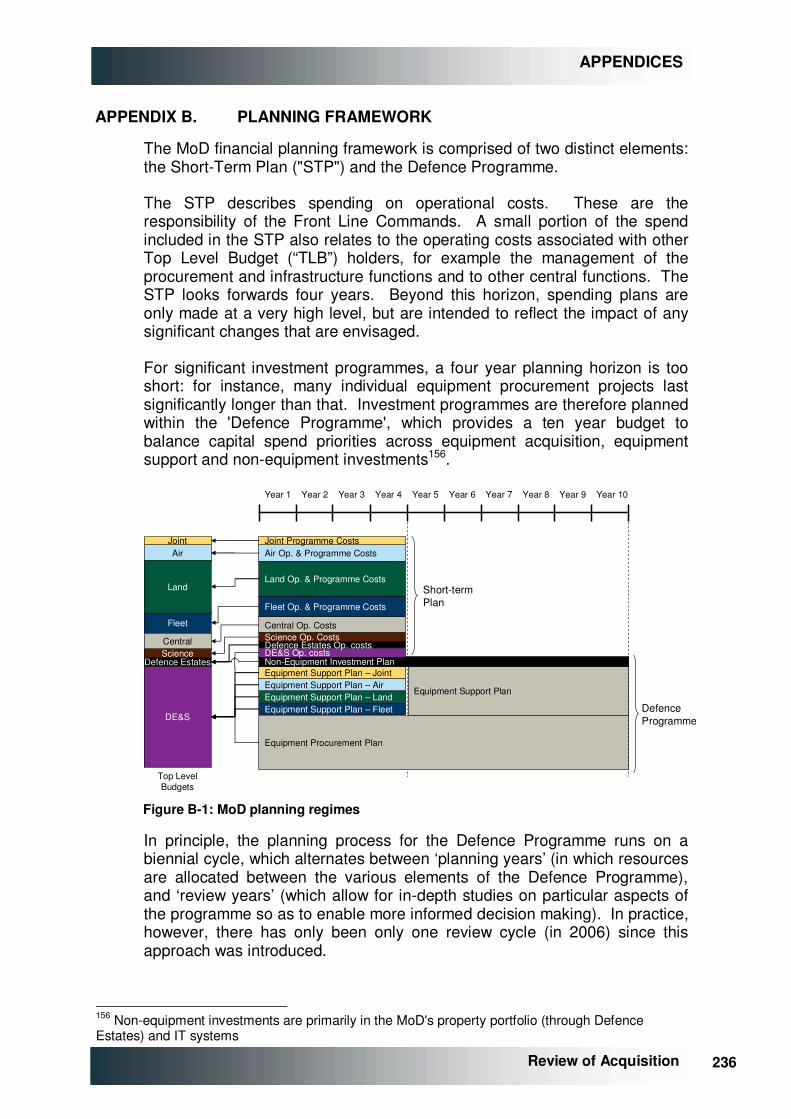
236 236
APPENDICES
Review of Acquisition
APPENDIX B. PLANNING FRAMEWORK
The MoD financial planning framework is comprised of two distinct elements: the Short-Term Plan ("STP") and the Defence Programme.
The STP describes spending on operational costs. These are the responsibility of the Front Line Commands. A small portion of the spend included in the STP also relates to the operating costs associated with other Top Level Budget (“TLB”) holders, for example the management of the procurement and infrastructure functions and to other central functions. The STP looks forwards four years. Beyond this horizon, spending plans are only made at a very high level, but are intended to reflect the impact of any significant changes that are envisaged.
For significant investment programmes, a four year planning horizon is too short: for instance, many individual equipment procurement projects last significantly longer than that. Investment programmes are therefore planned within the 'Defence Programme', which provides a ten year budget to balance capital spend priorities across equipment acquisition, equipment support and non-equipment investments156.
Year 1 Year 10
Top LevelBudgets
DE&S
Fleet
Air
Central
Joint
Land
ScienceDefence Estates
Equipment Procurement Plan
Equipment Support Plan
Equipment Support Plan – Fleet
Year 2 Year 3 Year 4 Year 5 Year 6 Year 7 Year 8 Year 9
Equipment Support Plan – LandEquipment Support Plan – AirEquipment Support Plan – JointNon-Equipment Investment Plan
Fleet Op. & Programme Costs
Air Op. & Programme Costs
Central Op. Costs
Joint Programme Costs
Land Op. & Programme Costs
Science Op. Costs
DE&S Op. costsDefence Estates Op. costs
Short-termPlan
DefenceProgramme
Figure �B-1: MoD planning regimes
In principle, the planning process for the Defence Programme runs on a biennial cycle, which alternates between ‘planning years’ (in which resources are allocated between the various elements of the Defence Programme), and ‘review years’ (which allow for in-depth studies on particular aspects of the programme so as to enable more informed decision making). In practice, however, there has only been only one review cycle (in 2006) since this approach was introduced.
156 Non-equipment investments are primarily in the MoD's property portfolio (through Defence Estates) and IT systems
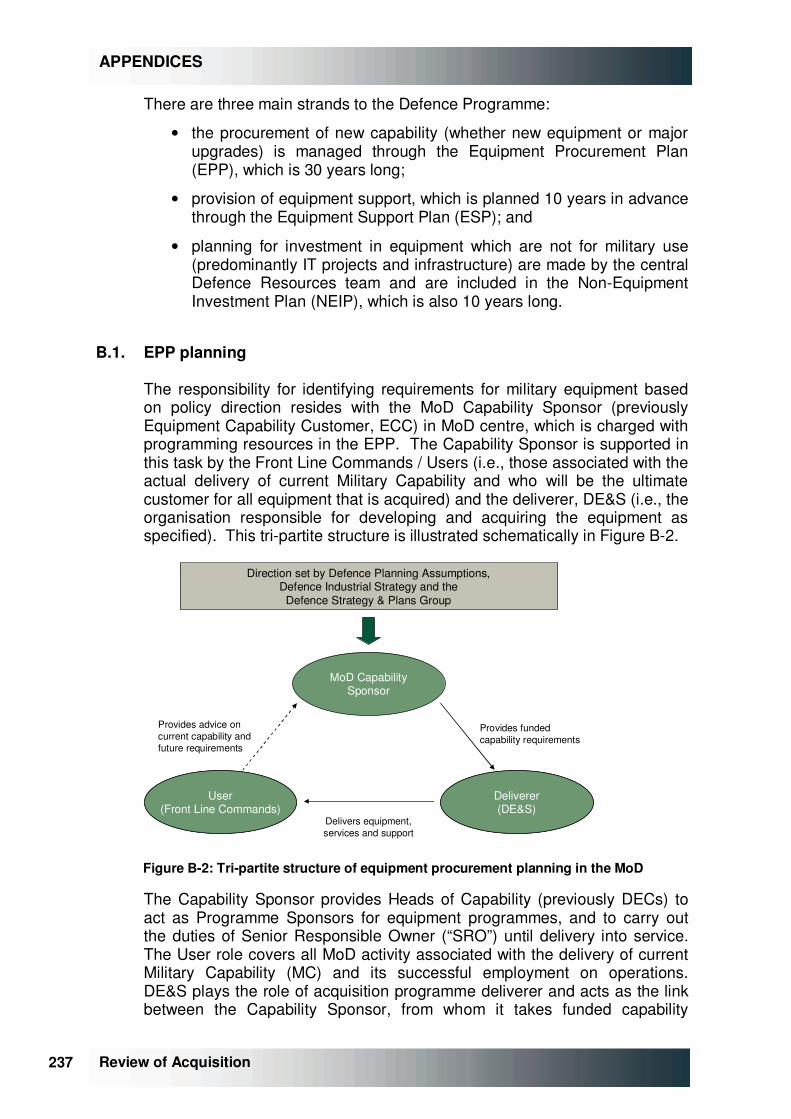
237 237
APPENDICES
Review of Acquisition
There are three main strands to the Defence Programme:
• the procurement of new capability (whether new equipment or major upgrades) is managed through the Equipment Procurement Plan (EPP), which is 30 years long;
• provision of equipment support, which is planned 10 years in advance through the Equipment Support Plan (ESP); and
• planning for investment in equipment which are not for military use (predominantly IT projects and infrastructure) are made by the central Defence Resources team and are included in the Non-Equipment Investment Plan (NEIP), which is also 10 years long.
B.1. EPP planning
The responsibility for identifying requirements for military equipment based on policy direction resides with the MoD Capability Sponsor (previously Equipment Capability Customer, ECC) in MoD centre, which is charged with programming resources in the EPP. The Capability Sponsor is supported in this task by the Front Line Commands / Users (i.e., those associated with the actual delivery of current Military Capability and who will be the ultimate customer for all equipment that is acquired) and the deliverer, DE&S (i.e., the organisation responsible for developing and acquiring the equipment as specified). This tri-partite structure is illustrated schematically in Figure �B-2.
MoD CapabilitySponsor
User(Front Line Commands)
Deliverer(DE&S)
User(Front Line Commands)
Deliverer(DE&S)
Provides funded capability requirements
Provides advice on current capability and future requirements
Delivers equipment, services and support
Direction set by Defence Planning Assumptions,Defence Industrial Strategy and the
Defence Strategy & Plans Group
Figure �B-2: Tri-partite structure of equipment procurement planning in the MoD
The Capability Sponsor provides Heads of Capability (previously DECs) to act as Programme Sponsors for equipment programmes, and to carry out the duties of Senior Responsible Owner (“SRO”) until delivery into service. The User role covers all MoD activity associated with the delivery of current Military Capability (MC) and its successful employment on operations. DE&S plays the role of acquisition programme deliverer and acts as the link between the Capability Sponsor, from whom it takes funded capability
238 238
APPENDICES
Review of Acquisition
requirements, and support to the User, to whom it delivers equipment and an associated support solution that is ready for service.
B.2. ESP planning
Although the delivery of support activities is also managed by teams within DE&S, the planning process for these functions is somewhat different to that used for procurement.
Responsibility for the support of in-service equipment is split between Front Line Commands (who plan for the first four years) and the Head of Capability (who is responsible for the following six years).
For new equipment, all planning relating to support remains with the Head of Capability until it has been in-service for four years. After that, the equipment is considered to be in-service and its support is managed as such. Therefore over time all equipment support planning will transition to the Head of Capability.
B.3. Approvals and oversight
Given the quantity of money spent on the equipment procurement and support of military equipment, the management of these activities are subject to considerable oversight by senior MoD personnel. All equipment procurement projects involving more than £100m total spend (Cat A and B) require explicit approval from the Investment Approvals Board (IAB) at Initial Gate and Main Gate (and whenever there is a material change to the project)157. The IAB consists of CSA, VCDS, DG Finance, CDM, D CLS and DGD Commercial. For very large projects further approval will be sought at Defence Board or pan-Government level.
For equipment procurement projects in the range £20m-£100m (Cat C) only approval from the DE&S Investment Board (DESIB) is required (though this board must also endorse larger projects which also require external approval). Spending decisions are delegated to project leaders only for projects that cost less than £20m in total (Cat D).
Projects subject to approval by the IAB require scrutiny from Sec(EC)158 in advance and are also now mandated to receive commercial due diligence (as part of recent changes).
157 IAB is able to delegate authority for Cat B projects to its two-star representatives. 158 Sec(EC) forms one part of the overall MoD centre scrutiny process. Other parties involved include Director Scrutiny and members of Commercial.
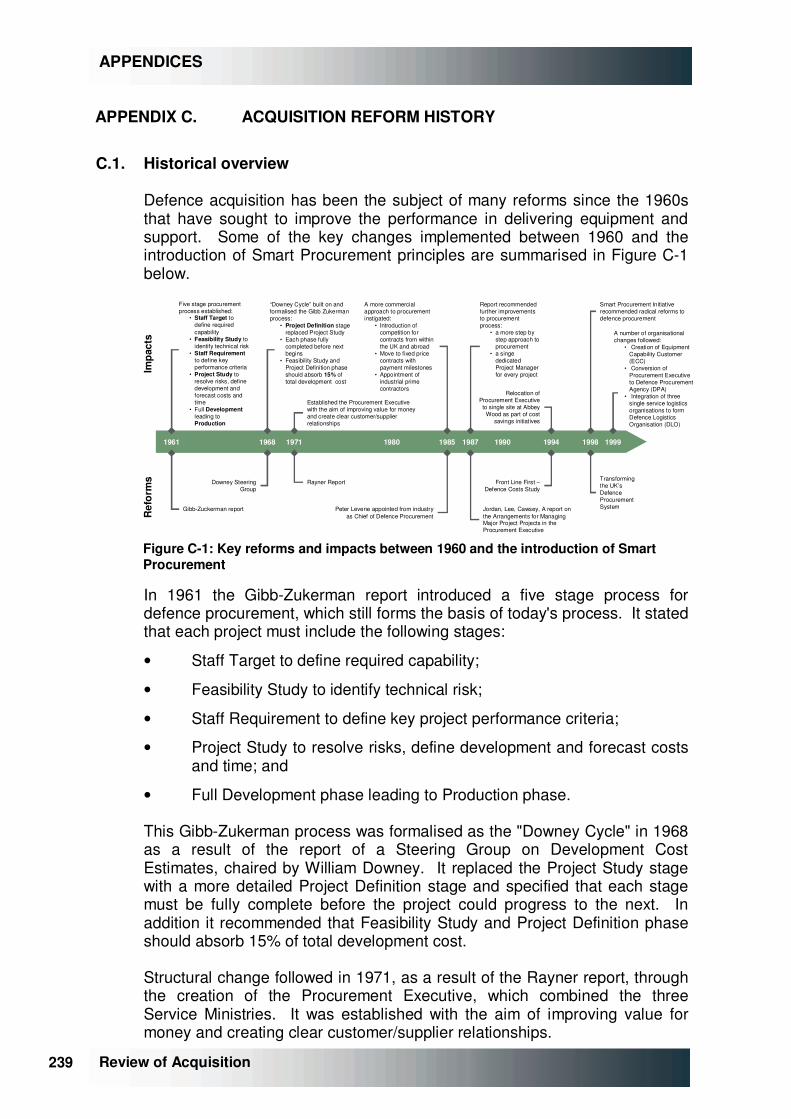
239 239
APPENDICES
Review of Acquisition
APPENDIX C. ACQUISITION REFORM HISTORY
C.1. Historical overview
Defence acquisition has been the subject of many reforms since the 1960s that have sought to improve the performance in delivering equipment and support. Some of the key changes implemented between 1960 and the introduction of Smart Procurement principles are summarised in Figure �C-1 below.
Impa
cts
Ref
orm
s
1990198019711961
Gibb-Zuckerman report
1968
Downey Steering Group
Rayner Report
1985
Peter Levene appointed from industry as Chief of Defence Procurement
1987
Jordan, Lee, Cawsey, A report on the Arrangements for Managing Major Project Projects in the Procurement Executive
Five stage procurement process established:
• Staff Target to define required capability
• Feasibility Study to identify technical risk
• Staff Requirementto define key performance criteria
• Project Study to resolve risks, define development and forecast costs and time
• Full Developmentleading to Production
“Downey Cycle” built on and formalised the Gibb Zukerman process:
• Project Definition stage replaced Project Study
• Each phase fully completed before next begins
• Feasibility Study and Project Definition phase should absorb 15% of total development cost
Established the Procurement Executive with the aim of improving value for money and create clear customer/supplier relationships
A more commercial approach to procurement instigated:
• Introduction of competition for contracts from within the UK and abroad
• Move to fixed price contracts with payment milestones
• Appointment of industrial prime contractors
1994
Front Line First –Defence Costs Study
1998
Report recommended further improvements to procurement process:
• a more step by step approach to procurement
• a singe dedicated Project Manager for every project
Relocation of Procurement Executive to single site at Abbey
Wood as part of cost savings initiatives
Transforming the UK’s Defence Procurement System
1999
Smart Procurement Initiative recommended radical reforms to defence procurement
A number of organisational changes followed:
• Creation of Equipment Capability Customer (ECC)
• Conversion of Procurement Executive to Defence Procurement Agency (DPA)
• Integration of three single service logistics organisations to form Defence Logistics Organisation (DLO)
Figure �C-1: Key reforms and impacts between 1960 and the introduction of Smart Procurement
In 1961 the Gibb-Zukerman report introduced a five stage process for defence procurement, which still forms the basis of today's process. It stated that each project must include the following stages:
• Staff Target to define required capability;
• Feasibility Study to identify technical risk;
• Staff Requirement to define key project performance criteria;
• Project Study to resolve risks, define development and forecast costs and time; and
• Full Development phase leading to Production phase.
This Gibb-Zukerman process was formalised as the "Downey Cycle" in 1968 as a result of the report of a Steering Group on Development Cost Estimates, chaired by William Downey. It replaced the Project Study stage with a more detailed Project Definition stage and specified that each stage must be fully complete before the project could progress to the next. In addition it recommended that Feasibility Study and Project Definition phase should absorb 15% of total development cost.
Structural change followed in 1971, as a result of the Rayner report, through the creation of the Procurement Executive, which combined the three Service Ministries. It was established with the aim of improving value for money and creating clear customer/supplier relationships.
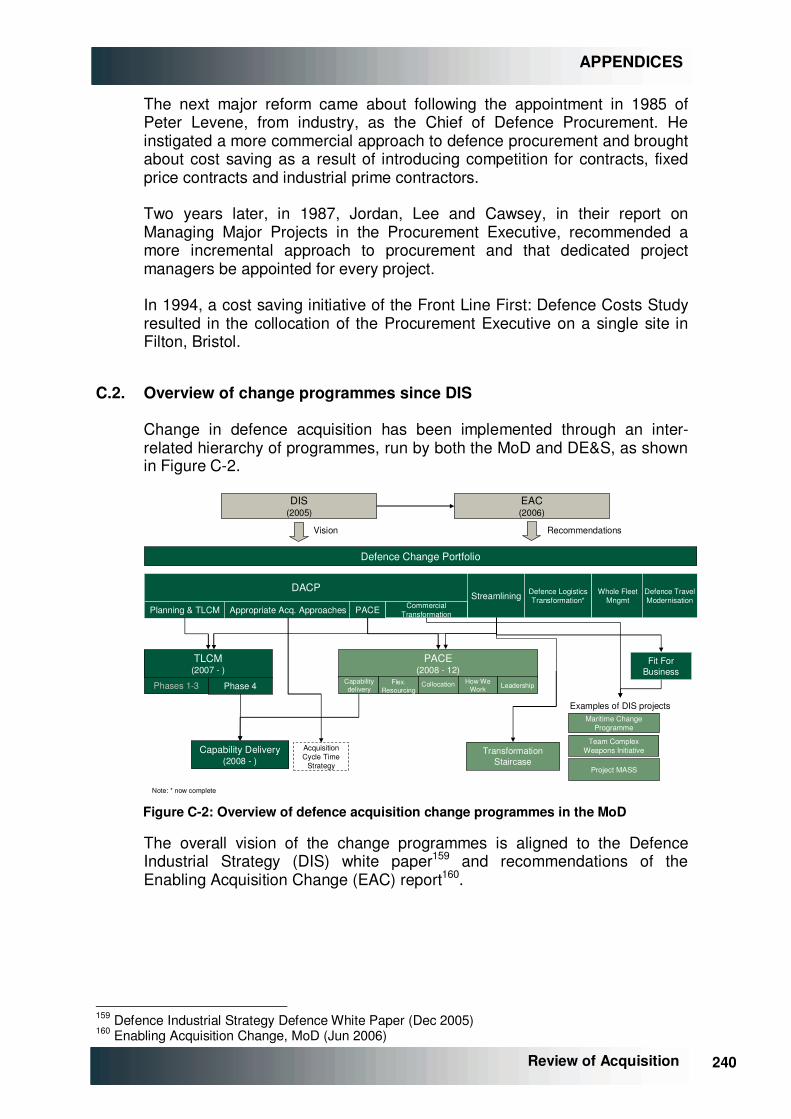
240 240
APPENDICES
Review of Acquisition
The next major reform came about following the appointment in 1985 of Peter Levene, from industry, as the Chief of Defence Procurement. He instigated a more commercial approach to defence procurement and brought about cost saving as a result of introducing competition for contracts, fixed price contracts and industrial prime contractors.
Two years later, in 1987, Jordan, Lee and Cawsey, in their report on Managing Major Projects in the Procurement Executive, recommended a more incremental approach to procurement and that dedicated project managers be appointed for every project.
In 1994, a cost saving initiative of the Front Line First: Defence Costs Study resulted in the collocation of the Procurement Executive on a single site in Filton, Bristol.
C.2. Overview of change programmes since DIS
Change in defence acquisition has been implemented through an inter-related hierarchy of programmes, run by both the MoD and DE&S, as shown in Figure �C-2.
DACP
TLCM(2007 - )
Capability Delivery(2008 - )
PACE(2008 - 12)
DIS(2005)
EAC(2006)
RecommendationsVision
Transformation Staircase
Defence Logistics Transformation*
Planning & TLCM Appropriate Acq. Approaches PACE Commercial Transformation
Fit For Business
Phase 4Phases 1-3 Capability delivery
Flex. Resourcing
Collocation
Maritime Change Programme
Team Complex Weapons Initiative
Project MASS
Acquisition Cycle Time
Strategy
Examples of DIS projects
Streamlining
Defence Change Portfolio
Whole Fleet Mngmt
Defence Travel Modernisation
How We Work Leadership
Note: * now complete Figure �C-2: Overview of defence acquisition change programmes in the MoD
The overall vision of the change programmes is aligned to the Defence Industrial Strategy (DIS) white paper159 and recommendations of the Enabling Acquisition Change (EAC) report160.
159 Defence Industrial Strategy Defence White Paper (Dec 2005) 160 Enabling Acquisition Change, MoD (Jun 2006)
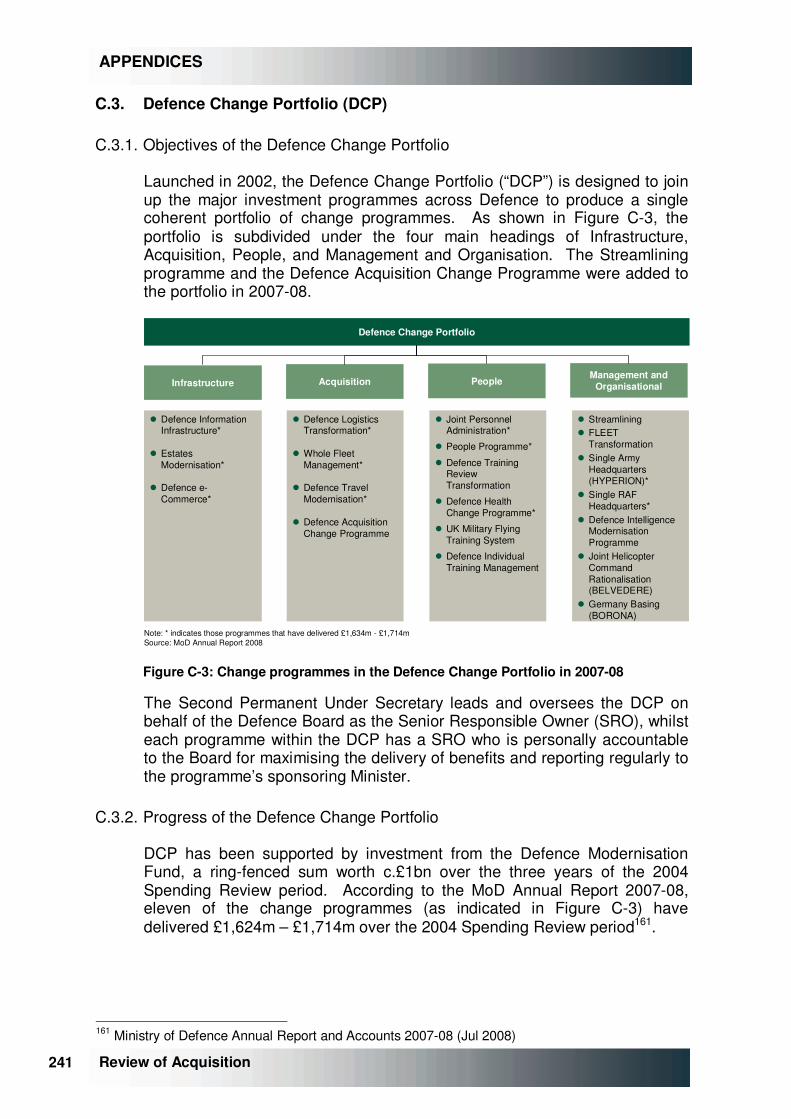
241 241
APPENDICES
Review of Acquisition
C.3. Defence Change Portfolio (DCP)
C.3.1. Objectives of the Defence Change Portfolio
Launched in 2002, the Defence Change Portfolio (“DCP”) is designed to join up the major investment programmes across Defence to produce a single coherent portfolio of change programmes. As shown in Figure �C-3, the portfolio is subdivided under the four main headings of Infrastructure, Acquisition, People, and Management and Organisation. The Streamlining programme and the Defence Acquisition Change Programme were added to the portfolio in 2007-08.
� Defence Information Infrastructure*
� Estates Modernisation*
� Defence e-Commerce*
Acquisition PeopleManagement and
Organisational
� Defence Logistics Transformation*
� Whole Fleet Management*
� Defence Travel Modernisation*
� Defence Acquisition Change Programme
� Joint Personnel Administration*
� People Programme*
� Defence Training Review Transformation
� Defence Health Change Programme*
� UK Military Flying Training System
� Defence Individual Training Management
� Streamlining� FLEET
Transformation� Single Army
Headquarters (HYPERION)*
� Single RAF Headquarters*
� Defence Intelligence Modernisation Programme
� Joint Helicopter Command Rationalisation (BELVEDERE)
� Germany Basing (BORONA)
Defence Change Portfolio
Infrastructure
Note: * indicates those programmes that have delivered £1,634m - £1,714mSource: MoD Annual Report 2008
Figure �C-3: Change programmes in the Defence Change Portfolio in 2007-08
The Second Permanent Under Secretary leads and oversees the DCP on behalf of the Defence Board as the Senior Responsible Owner (SRO), whilst each programme within the DCP has a SRO who is personally accountable to the Board for maximising the delivery of benefits and reporting regularly to the programme’s sponsoring Minister.
C.3.2. Progress of the Defence Change Portfolio
DCP has been supported by investment from the Defence Modernisation Fund, a ring-fenced sum worth c.£1bn over the three years of the 2004 Spending Review period. According to the MoD Annual Report 2007-08, eleven of the change programmes (as indicated in Figure �C-3) have delivered £1,624m – £1,714m over the 2004 Spending Review period161.
161 Ministry of Defence Annual Report and Accounts 2007-08 (Jul 2008)
242 242
APPENDICES
Review of Acquisition
C.4. Defence Acquisition Change Programme (DACP)
C.4.1. Objectives of the Defence Acquisition Change Programme
The Defence Acquisition Change Programme (DACP) builds upon the principles of Smart Acquisition and the establishment of the Equipment Capability Customer (ECC). The programme was established in the summer of 2006, and was intended to deliver the changes needed to facilitate Through Life Capability Management (TLCM) as identified in the DIS and recommendations from the EAC report.
DACP was originally intended to remove remaining financial, organisational and process barriers that separate new equipment capability procurement from equipment support considerations through:
• merger of the DPA and DLO;
• re-emphasis on Through Life Management Planning; and
• reassignment of programming responsibilities for equipment and equipment support over a longer, 10 year period.
It is also hoped that DACP will identify opportunities for more effective partnering with Industry, increasing MoD commercial awareness and streamlining approvals for the majority of projects, whilst applying greater scrutiny to major investment decisions. The DACP is responsible for implementing the majority of internal change programmes that resulted from the DIS.
C.4.2. Progress of the Defence Acquisition Change Programme
The initial phase of work focused on the EAC recommendations was completed in April 2007. Subsequently, DACP’s remit was extended to incorporate a series of new objectives and the structure was refined to cover four workstreams and two cross cutting activities, as shown in Figure �C-4.
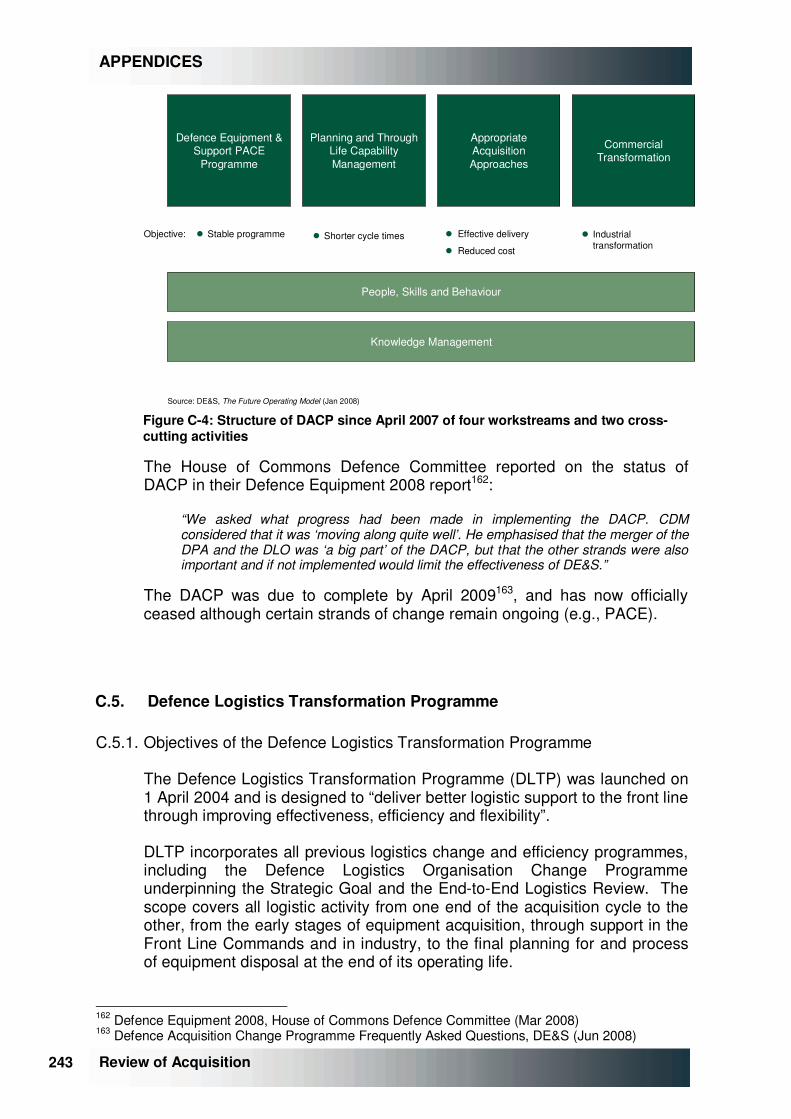
243 243
APPENDICES
Review of Acquisition
Defence Equipment & Support PACE
Programme
Planning and Through Life Capability Management
Appropriate Acquisition Approaches
Commercial Transformation
People, Skills and Behaviour
Knowledge Management
Objective: � Stable programme � Shorter cycle times � Effective delivery
� Reduced cost
� Industrial transformation
Source: DE&S, The Future Operating Model (Jan 2008) Figure �C-4: Structure of DACP since April 2007 of four workstreams and two cross-cutting activities
The House of Commons Defence Committee reported on the status of DACP in their Defence Equipment 2008 report162:
“We asked what progress had been made in implementing the DACP. CDM considered that it was ‘moving along quite well’. He emphasised that the merger of the DPA and the DLO was ‘a big part’ of the DACP, but that the other strands were also important and if not implemented would limit the effectiveness of DE&S.”
The DACP was due to complete by April 2009163, and has now officially ceased although certain strands of change remain ongoing (e.g., PACE).
C.5. Defence Logistics Transformation Programme
C.5.1. Objectives of the Defence Logistics Transformation Programme
The Defence Logistics Transformation Programme (DLTP) was launched on 1 April 2004 and is designed to “deliver better logistic support to the front line through improving effectiveness, efficiency and flexibility”.
DLTP incorporates all previous logistics change and efficiency programmes, including the Defence Logistics Organisation Change Programme underpinning the Strategic Goal and the End-to-End Logistics Review. The scope covers all logistic activity from one end of the acquisition cycle to the other, from the early stages of equipment acquisition, through support in the Front Line Commands and in industry, to the final planning for and process of equipment disposal at the end of its operating life.
162 Defence Equipment 2008, House of Commons Defence Committee (Mar 2008) 163 Defence Acquisition Change Programme Frequently Asked Questions, DE&S (Jun 2008)
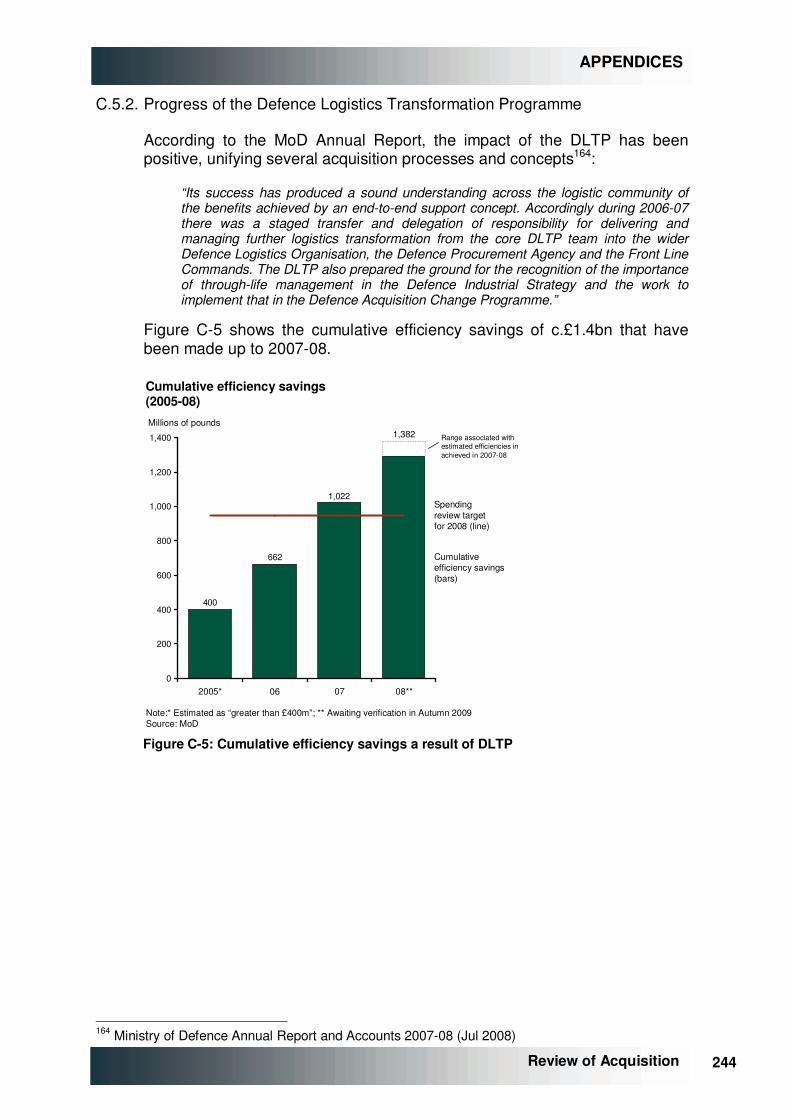
244 244
APPENDICES
Review of Acquisition
C.5.2. Progress of the Defence Logistics Transformation Programme
According to the MoD Annual Report, the impact of the DLTP has been positive, unifying several acquisition processes and concepts164:
“Its success has produced a sound understanding across the logistic community of the benefits achieved by an end-to-end support concept. Accordingly during 2006-07 there was a staged transfer and delegation of responsibility for delivering and managing further logistics transformation from the core DLTP team into the wider Defence Logistics Organisation, the Defence Procurement Agency and the Front Line Commands. The DLTP also prepared the ground for the recognition of the importance of through-life management in the Defence Industrial Strategy and the work to implement that in the Defence Acquisition Change Programme.”
Figure �C-5 shows the cumulative efficiency savings of c.£1.4bn that have been made up to 2007-08.
662
400
1,022
0
200
400
600
800
1,000
1,200
1,400
08**
Cumulative efficiency savings (bars)
1,382
Spending review target for 2008 (line)
Millions of pounds
2005* 06 07
Cumulative efficiency savings (2005-08)
Note:* Estimated as “greater than £400m”; ** Awaiting verification in Autumn 2009Source: MoD
Range associated with estimated efficiencies in achieved in 2007-08
Figure �C-5: Cumulative efficiency savings a result of DLTP
164 Ministry of Defence Annual Report and Accounts 2007-08 (Jul 2008)
245 245
APPENDICES
Review of Acquisition
C.6. PACE
C.6.1. Objectives of the PACE programme
PACE – Performance, Agility, Confidence and Efficiency – was launched by DE&S in March 2008 to implement DACP changes effectively in DE&S. It is intended to transform DE&S post-merger into “a more effective organisation, capable of achieving its mission and making its contribution to the Defence acquisition agenda”165. The three core projects of Capability Delivery, Flexible Resourcing and Collocation are due to finish by Q1 2012. These are supplemented by two enduring workstrands of Leadership and How We Work.
The Capability Delivery project now aims to embed Phase 4 of TLCM into DE&S through grouping related projects (new and in-service) together into co-ordinated programmes, managing across all DLoDs. These will be overseen by Programme Boards with the intention of making better, more coherent and informed decisions.
Flexible Resourcing aims to introduce a system of assigning tasks to staff according to business priorities and provide greater opportunities for people to develop skills and experience. It was initially piloted in three areas and is now being rolled out across the whole of DE&S.
Collocation aims to bring together teams and offer improved working environment practices. DE&S operated from more than 60 bases in the UK. Following collocation initiatives, Abbey Wood will become the definitive centre for DE&S acquisition functions, with DE&S withdrawing from seven locations. Collocation aims to produce estimated savings of c.£560 million over 25 years.
The greater effectiveness of DE&S will enable the workforce to be reduced from c.27,000 in 2007-08 to c.20,000 by 2012.
C.6.2. Progress of the PACE programme
By the end of Phase 1 of the Project, DE&S will already have moved around 1,000 posts from Andover to Abbey Wood.
165 Blueprint: The Future Operating Model, DE&S (Jan 2008)
246 246
APPENDICES
Review of Acquisition
APPENDIX D. THE ROLES OF THE CHIEF OPERATING OFFICER AND CHIEFS OF MATERIEL
As a result of confusion over the role of CoMs, the following text was issued as guidance by the DE&S Chief Operating Officer in August 2008:166
Firstly I will set out the role that CoMs fulfil with respect to cluster/IPT business and how I see the COO-CoM interaction working. I have deliberately kept the discussion at the 3* role level for clarity; it goes without saying that the teams are the means by which we achieve everything we deliver under the direction of the cluster DG.
Overall the role of the CoMs is to provide the strategic bridge across the unified MoD customer to ensure that the right focus is being applied at all times to delivering what the FLC requires both in the short-term and long-term. My job as COO is to ensure that user defined requirements (procurement or support) are being delivered within the agreed funding and against the agreed timeline. As such I see it as a legitimate role of the CoMs to provide me (and therefore you) with challenge from a customer perspective, and to provide us with a strategic conduit for communication of constraints, options, solutions etc to the highest levels within the MoD unified customer organisation. This supplements, rather than cutting across, my relationship with DCDS(EC).
D.1. What the CoMs are doing
• Strategic Customer Relationship Management. This activity is the heartland of the CoM role and touches all the activities they perform. In this role they are interacting continuously at the highest levels in the unified customer to sustain a current picture of FLC needs and challenges and to provide the FLC with a current picture of our constraints and challenges. To this end they are ‘accountable’ for our delivery performance. With their position on their respective Service and FLC boards, this is a powerful role that we should exploit to the full particularly when considering cross-cutting DG issues.
• Planning Round. I have the responsibility for ensuring that cluster/IPT input to the PR is tautly and realistically costed and programmed against the stated user requirement. The CoMs provide the strategic brokerage with the unified customer and will therefore be seeking my assurance that the costings/programme are taut and realistic. We have collective responsibility to work on potential equipment and support solutions to the financial/capability challenges we face. We will be co-chairing the forthcoming PR 3* screenings.
• Joint Business Agreements. The role of the CoMs is to provide the strategic brokerage of the JBAs with the FLC and provide a domain
166 ‘The Roles of the Chief Operating Officer (COO) and Chiefs of Materiel (CoMs)’, COO (August 2008)
247 247
APPENDICES
Review of Acquisition
view. My role is to ensure that we are not making commitments beyond our resource allocation, but at the same time are accepting a reasonable degree of efficiency challenge and prudence in risk provisioning.
• Industry Sector Strategies. There are a number of industry sector strategies in various states of maturity at the moment. Principally, these sector strategies are the responsibility of DCD167 (overarching MoD industry/commercial strategy) and myself (delivery of most of the benefits, and harmonisation with project delivery strategy) and he and I will cooperate extremely closely on their evolution with the relevant 2*s. However, it is very clear that none of these sector strategies can succeed without the blessing, and in most cases, active participation of the FLC. I see the CoMs playing a key role in brokering issues with the FLC at strategic level – some of which require the FLC to make quite radical changes. As such the CoMs and I will both sit on the top governance fora of these sector strategies.
• Safety. The CoMs role is to provide assurance that the critical DE&S-FLC safety interface is managed in a manner that ensures this link does not contribute to a breakdown in end to end safety.
• Specific Operational Roles. As you are aware, each of the CoMs has an operational role in managing a substantial part of DE&S business for which they are directly responsible to CDM for ensurance of delivery. My interaction with the CoMs in these areas would be via IBAs where relevant.
• Main Board Role. At Main Board level each of the 3*s ‘owns’ a Strategic Risk and this will require direct interaction with DGs and their teams.
• CDM deputising. From time to time and for specific pre agreed areas of DE&S responsibility (e.g., CoM Air’s role as the OCCAR BoS member), CDM will direct the CoMs to deputise for him on specific issues which time constraints and priorities require him to delegate (as he would potentially to any Board member). Equally, there are times when the external face of DE&S is best represented by a senior Serviceman and in these instances the CoM will need to be fully engaged in the business under debate. It will be clear when CoMs are engaged on such a delegated activity.
• Support to Operations. A key task the CoMs are engaged in is providing the interface with the FLC in support of current operations.
D.2. What the CoMs will not be doing
It is also important for you to understand what the CoMs will not be doing:
• Creating additional briefing requirements unless absolutely essential for them to perform their roles. CDM has directed that the default
167 Has since been re-titled as DGD Commercial
248 248
APPENDICES
Review of Acquisition
should be no written briefs unless specifically requested. There will certainly be no systematic/routine requirement for briefing to CoMs i.e. briefing requests will be issue specific. It is legitimate to question briefing needs (as it is for briefings to me); sometimes briefing is not always initiated by the Principal!
• Providing direction to clusters/teams. The line management chain is clear and straightforward and will be respected. It is however perfectly correct that the CoMs should have direct interaction with teams and clusters and their challenge and influence is entirely legitimate. I have no intention of being the ‘man in the loop’ on what should be a dynamic engagement, especially on matters relating to current operations.
• Providing instruction on movement of resources (human or financial) within clusters/teams. This will continue to be carried out strictly in accordance with the delegations in place. Although, again, the CoMs have a legitimate role in explaining to FLCs where DE&S pressures may affect outputs.
• Providing any direction or commitments to industry on any matters related to the business of my clusters/teams. The CoMs should continue however to sustain their industry engagement to keep themselves well appraised of current industry dynamics and emergent ideas and thinking.
D.3. COO-CoM Modus Operandi
Whilst we have opportunity to represent our respective areas at Main Board fora, it is our intention to have a close and dynamic relationship. We are not going to get precious about the inevitable grey areas between our roles; we are on the same team. The core of our roles is unambiguous as set out above, and will be respected by all parties. We will be meeting regularly, both one to one, and with our fellow 3*s and the relationship between us will inevitably, and positively, continue to evolve. As you can see, there will also be occasions (e.g., PRs, sector strategy fora) where we would expect to work with you together.
D.4. And Finally
I think the new delegations matrix when established will further assist in reinforcing the above, but I think it should be quite clear anyway from my note above. I would ask you to ping me with any areas that you do not think I have picked up here and I will address them. Please can you also ensure that all teams are made fully aware of this clarification of the COO-CoMs relationship.

249 249
APPENDICES
Review of Acquisition
APPENDIX E. CONCEPTUAL QUANTITATIVE ANALYSIS OF EPP PRESSURES
E.1. Introduction
A conceptual quantitative analysis of the Equipment Plan Programme (“EPP”) was undertaken by the Review team to determine the consequences on capability and timing of maintaining ‘affordability’.
The EPP presents a 30-year view of the planned spend on equipment procurement. As noted in Chapter �6, the total spend in the EPP has been growing, and in general, the levels of planned annual expenditure exceed the amount available to spend. As shown in Chapter �7, the costs and duration of projects have historically evolved over time, with a general pattern of significant increases. It is therefore reasonable to expect that (for whatever reason) the “outturn” future spend on projects will not be exactly as planned in the current EPP. Without cancellation of significant expenditure, this situation implies ongoing delay will be required, with the average time to completion of projects continuing to extend.
This Appendix incorporates three approaches to exploring the pressures in the EPP:
• a conceptual analytical approach used to assess the scale of the affordability problem and the implications on ‘productive’ spend;
• a conceptual numerical approach with more refined assumptions will be used to look at the interaction between cost overruns and delays in the EPP; and
• an analysis of how the current shape of the EPP could evolve.
E.2. Conceptual analytical approach
A conceptual analytical approach can be used to model the scale of the affordability problem. The dynamics of cost and time within the EPP can be simulated using simple mathematical modelling. As described in the cost of delay analysis in Chapter �7, delays to projects (whether driven by budgetary constraints, technical difficulties, time mis-estimation or some other factor) will give rise to additional costs, demanding ‘inefficient’ spend that does not directly contribute to delivering the required capability. For instance, delaying a project means that the IPT will be running for longer than originally anticipated and industrial capacity previously earmarked for the project may lie idle (or be used in less efficient ways). Money spent meeting the associated costs will necessarily be unproductive.
Depending on the drivers of ‘inefficient’ expenditure, in one extreme it is possible that this spend will have to be consumed immediately. Alternatively, in the other extreme, this additional expenditure will be deferred across the lifetime of the project. For example, spend on additional net support costs will not be incurred until after the original ISD. A significant
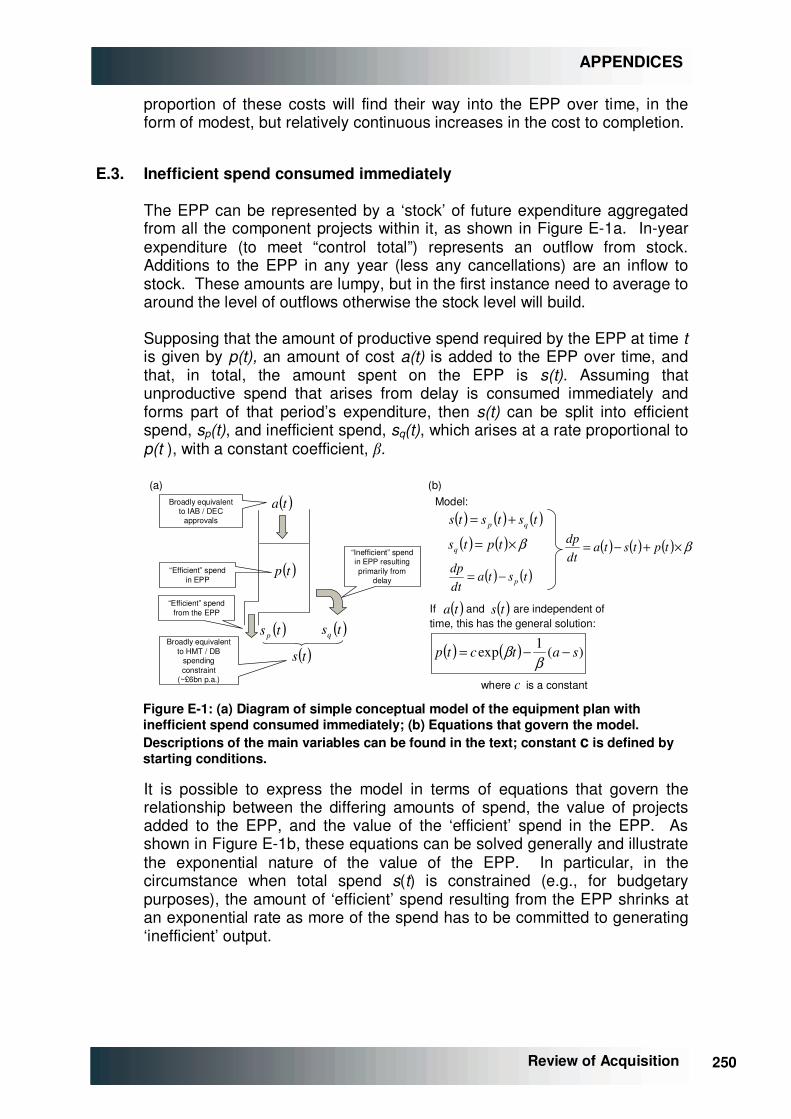
250 250
APPENDICES
Review of Acquisition
proportion of these costs will find their way into the EPP over time, in the form of modest, but relatively continuous increases in the cost to completion.
E.3. Inefficient spend consumed immediately
The EPP can be represented by a ‘stock’ of future expenditure aggregated from all the component projects within it, as shown in Figure �E-1a. In-year expenditure (to meet “control total”) represents an outflow from stock. Additions to the EPP in any year (less any cancellations) are an inflow to stock. These amounts are lumpy, but in the first instance need to average to around the level of outflows otherwise the stock level will build.
Supposing that the amount of productive spend required by the EPP at time t is given by p(t), an amount of cost a(t) is added to the EPP over time, and that, in total, the amount spent on the EPP is s(t). Assuming that unproductive spend that arises from delay is consumed immediately and forms part of that period’s expenditure, then s(t) can be split into efficient spend, sp(t), and inefficient spend, sq(t), which arises at a rate proportional to p(t ), with a constant coefficient, �.
( ) ( )tstadtdp
p−=“Efficient” spend in EPP
Model:
time, this has the general solution:( )tsq
( )ts
( )taBroadly equivalent to IAB / DEC
approvals
( )tp
( ) ( ) ( )tststs qp +=
( ) ( ) β×= tptsq ( ) ( ) ( ) β×+−= tptstadtdp
( ) ( ) )(1
exp satctp −−=β
β
( )ts( )taIf and are independent of
Broadly equivalent to HMT / DB
spending constraint
(~£6bn p.a.)
( )tsp
“Inefficient” spend in EPP resulting primarily from
delay
(a) (b)
where is a constant c
“Efficient” spend from the EPP
Figure �E-1: (a) Diagram of simple conceptual model of the equipment plan with inefficient spend consumed immediately; (b) Equations that govern the model. Descriptions of the main variables can be found in the text; constant c is defined by starting conditions.
It is possible to express the model in terms of equations that govern the relationship between the differing amounts of spend, the value of projects added to the EPP, and the value of the ‘efficient’ spend in the EPP. As shown in Figure �E-1b, these equations can be solved generally and illustrate the exponential nature of the value of the EPP. In particular, in the circumstance when total spend s(t) is constrained (e.g., for budgetary purposes), the amount of ‘efficient’ spend resulting from the EPP shrinks at an exponential rate as more of the spend has to be committed to generating ‘inefficient’ output.
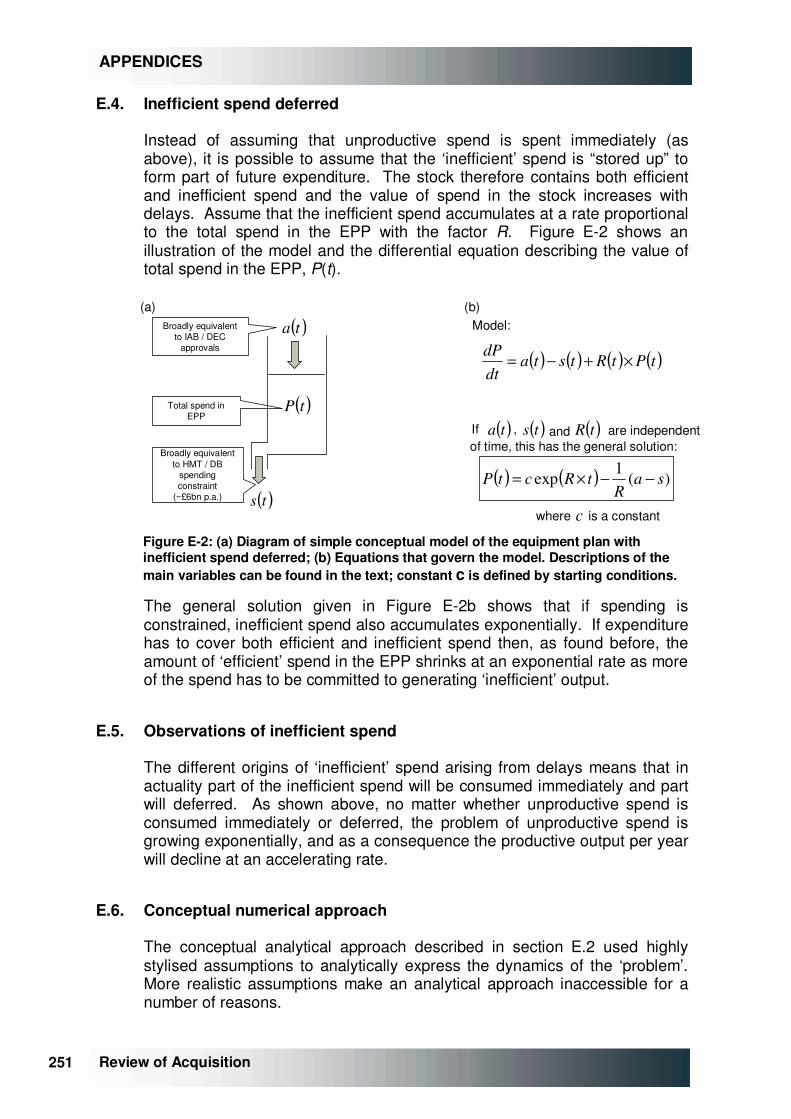
251 251
APPENDICES
Review of Acquisition
E.4. Inefficient spend deferred
Instead of assuming that unproductive spend is spent immediately (as above), it is possible to assume that the ‘inefficient’ spend is “stored up” to form part of future expenditure. The stock therefore contains both efficient and inefficient spend and the value of spend in the stock increases with delays. Assume that the inefficient spend accumulates at a rate proportional to the total spend in the EPP with the factor R. Figure �E-2 shows an illustration of the model and the differential equation describing the value of total spend in the EPP, P(t).
Total spend in EPP
Model:
of time, this has the general solution:
( )taBroadly equivalent to IAB / DEC
approvals
( )tP( )ts( )taIf , are independent
Broadly equivalent to HMT / DB
spending constraint
(~£6bn p.a.)
(a) (b)
( )ts
( ) ( ) ( ) ( )tPtRtstadtdP ×+−=
and ( )tR
( ) ( ) )(1
exp saR
tRctP −−×=
where is a constant c Figure �E-2: (a) Diagram of simple conceptual model of the equipment plan with inefficient spend deferred; (b) Equations that govern the model. Descriptions of the main variables can be found in the text; constant c is defined by starting conditions.
The general solution given in Figure �E-2b shows that if spending is constrained, inefficient spend also accumulates exponentially. If expenditure has to cover both efficient and inefficient spend then, as found before, the amount of ‘efficient’ spend in the EPP shrinks at an exponential rate as more of the spend has to be committed to generating ‘inefficient’ output.
E.5. Observations of inefficient spend
The different origins of ‘inefficient’ spend arising from delays means that in actuality part of the inefficient spend will be consumed immediately and part will deferred. As shown above, no matter whether unproductive spend is consumed immediately or deferred, the problem of unproductive spend is growing exponentially, and as a consequence the productive output per year will decline at an accelerating rate.
E.6. Conceptual numerical approach
The conceptual analytical approach described in section �E.2 used highly stylised assumptions to analytically express the dynamics of the ‘problem’. More realistic assumptions make an analytical approach inaccessible for a number of reasons.
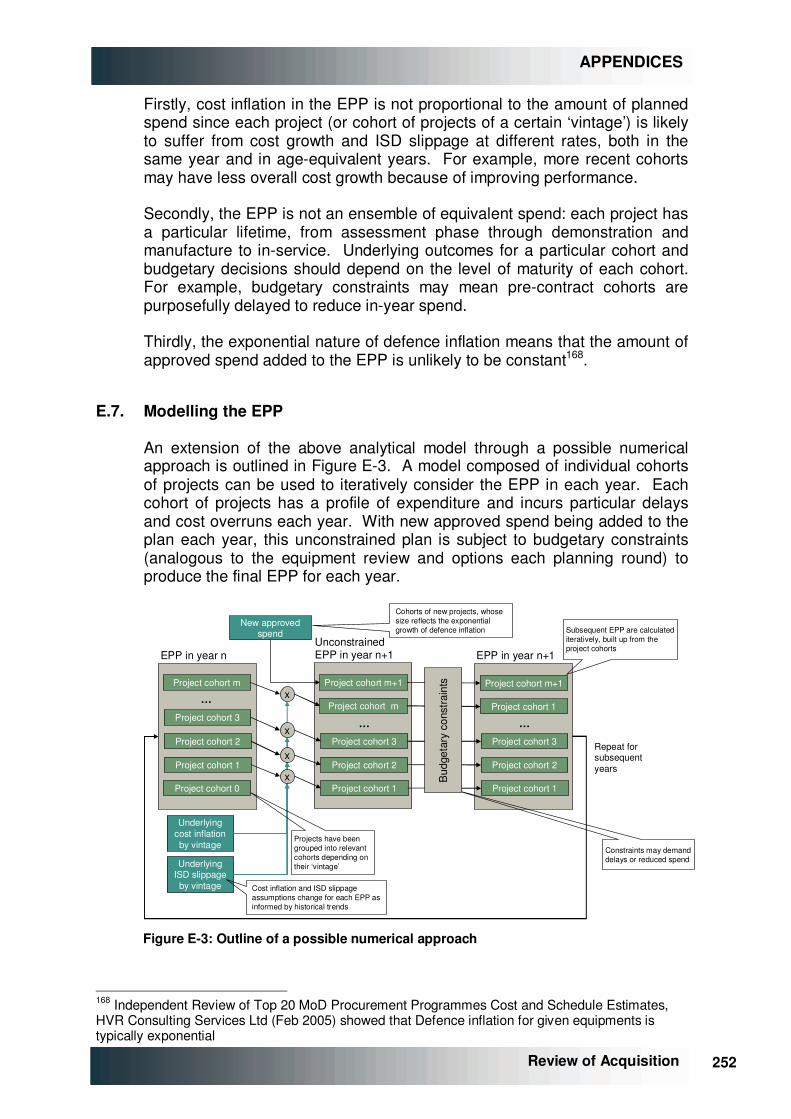
252 252
APPENDICES
Review of Acquisition
Firstly, cost inflation in the EPP is not proportional to the amount of planned spend since each project (or cohort of projects of a certain ‘vintage’) is likely to suffer from cost growth and ISD slippage at different rates, both in the same year and in age-equivalent years. For example, more recent cohorts may have less overall cost growth because of improving performance.
Secondly, the EPP is not an ensemble of equivalent spend: each project has a particular lifetime, from assessment phase through demonstration and manufacture to in-service. Underlying outcomes for a particular cohort and budgetary decisions should depend on the level of maturity of each cohort. For example, budgetary constraints may mean pre-contract cohorts are purposefully delayed to reduce in-year spend.
Thirdly, the exponential nature of defence inflation means that the amount of approved spend added to the EPP is unlikely to be constant168.
E.7. Modelling the EPP
An extension of the above analytical model through a possible numerical approach is outlined in Figure �E-3. A model composed of individual cohorts of projects can be used to iteratively consider the EPP in each year. Each cohort of projects has a profile of expenditure and incurs particular delays and cost overruns each year. With new approved spend being added to the plan each year, this unconstrained plan is subject to budgetary constraints (analogous to the equipment review and options each planning round) to produce the final EPP for each year.
EPP in year n
Project cohort m
Project cohort 3
Project cohort 2
Project cohort 1
…Project cohort 1
EPP in year n+1
Project cohort m+1x
Underlying cost inflation by vintage
Underlying ISD slippage by vintage
Projects have been grouped into relevant cohorts depending on their ‘vintage’
Cost inflation and ISD slippage assumptions change for each EPP as informed by historical trends
New approved spend Subsequent EPP are calculated
iteratively, built up from the project cohorts
Repeat for subsequent years
Cohorts of new projects, whose size reflects the exponential growth of defence inflation
Project cohort m
Project cohort 3
Project cohort 2
Project cohort 1
…
Unconstrained EPP in year n+1
Project cohort m+1
Constraints may demand delays or reduced spend
x
x
xProject cohort 0
Project cohort 3
Project cohort 2
Project cohort 1
…
Bud
geta
ry c
onst
rain
ts
Figure �E-3: Outline of a possible numerical approach
168 Independent Review of Top 20 MoD Procurement Programmes Cost and Schedule Estimates, HVR Consulting Services Ltd (Feb 2005) showed that Defence inflation for given equipments is typically exponential
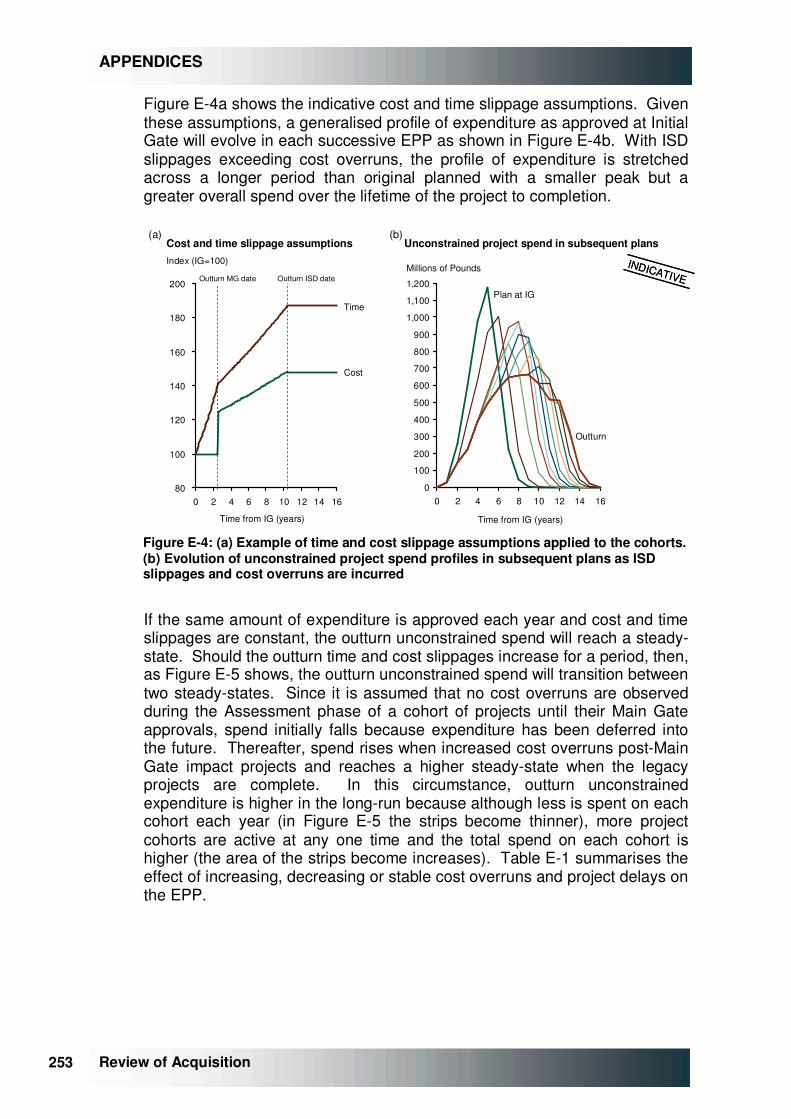
253 253
APPENDICES
Review of Acquisition
Figure �E-4a shows the indicative cost and time slippage assumptions. Given these assumptions, a generalised profile of expenditure as approved at Initial Gate will evolve in each successive EPP as shown in Figure �E-4b. With ISD slippages exceeding cost overruns, the profile of expenditure is stretched across a longer period than original planned with a smaller peak but a greater overall spend over the lifetime of the project to completion.
Unconstrained project spend in subsequent plans
Plan at IG
Outturn
80
100
120
140
160
180
200
0 2 4 6 8 10 12 14 16
Time from IG (years)
Cost and time slippage assumptionsIndex (IG=100)
Time
Cost
Outturn MG date Outturn ISD date
0
100
200
300
400
500
600
700
800
900
1,000
1,100
1,200
0 2 4 6 8 10 12 14 16
Millions of Pounds
Time from IG (years)
INDICATIVEINDICATIVE
(a) (b)
Figure �E-4: (a) Example of time and cost slippage assumptions applied to the cohorts. (b) Evolution of unconstrained project spend profiles in subsequent plans as ISD slippages and cost overruns are incurred
If the same amount of expenditure is approved each year and cost and time slippages are constant, the outturn unconstrained spend will reach a steady-state. Should the outturn time and cost slippages increase for a period, then, as Figure �E-5 shows, the outturn unconstrained spend will transition between two steady-states. Since it is assumed that no cost overruns are observed during the Assessment phase of a cohort of projects until their Main Gate approvals, spend initially falls because expenditure has been deferred into the future. Thereafter, spend rises when increased cost overruns post-Main Gate impact projects and reaches a higher steady-state when the legacy projects are complete. In this circumstance, outturn unconstrained expenditure is higher in the long-run because although less is spent on each cohort each year (in Figure �E-5 the strips become thinner), more project cohorts are active at any one time and the total spend on each cohort is higher (the area of the strips become increases). Table �E-1 summarises the effect of increasing, decreasing or stable cost overruns and project delays on the EPP.
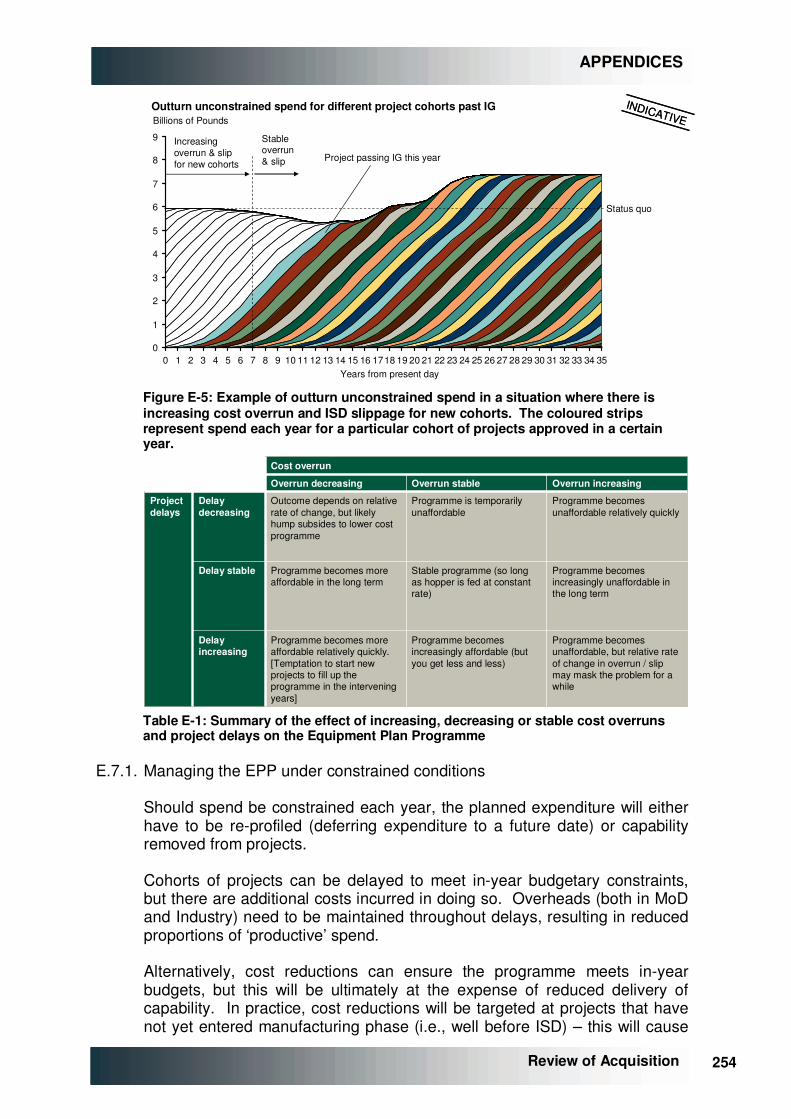
254 254
APPENDICES
Review of Acquisition
Increasing overrun & slip for new cohorts
0
1
2
3
4
5
6
7
8
9
1 2 3 4 5 6 7 8 9 10 11 12 13 14 15 16 170 19 20 21 22 23 24 25 26 27 28 29 30 31 32 33 34 35
Billions of Pounds
18
Outturn unconstrained spend for different project cohorts past IG
Years from present day
Project passing IG this year
Status quo
Stable overrun & slip
INDICATIVEINDICATIVE
Figure �E-5: Example of outturn unconstrained spend in a situation where there is increasing cost overrun and ISD slippage for new cohorts. The coloured strips represent spend each year for a particular cohort of projects approved in a certain year.
Project delays
Cost overrun
Programme becomes unaffordable, but relative rate of change in overrun / slip may mask the problem for a while
Programme becomes increasingly affordable (but you get less and less)
Programme becomes more affordable relatively quickly. [Temptation to start new projects to fill up the programme in the intervening years]
Delay increasing
Programme becomes increasingly unaffordable in the long term
Stable programme (so long as hopper is fed at constant rate)
Programme becomes more affordable in the long term
Delay stable
Programme becomes unaffordable relatively quickly
Programme is temporarily unaffordable
Outcome depends on relative rate of change, but likely hump subsides to lower cost programme
Delay decreasing
Overrun increasingOverrun stableOverrun decreasing
Table �E-1: Summary of the effect of increasing, decreasing or stable cost overruns and project delays on the Equipment Plan Programme
E.7.1. Managing the EPP under constrained conditions
Should spend be constrained each year, the planned expenditure will either have to be re-profiled (deferring expenditure to a future date) or capability removed from projects.
Cohorts of projects can be delayed to meet in-year budgetary constraints, but there are additional costs incurred in doing so. Overheads (both in MoD and Industry) need to be maintained throughout delays, resulting in reduced proportions of ‘productive’ spend.
Alternatively, cost reductions can ensure the programme meets in-year budgets, but this will be ultimately at the expense of reduced delivery of capability. In practice, cost reductions will be targeted at projects that have not yet entered manufacturing phase (i.e., well before ISD) – this will cause
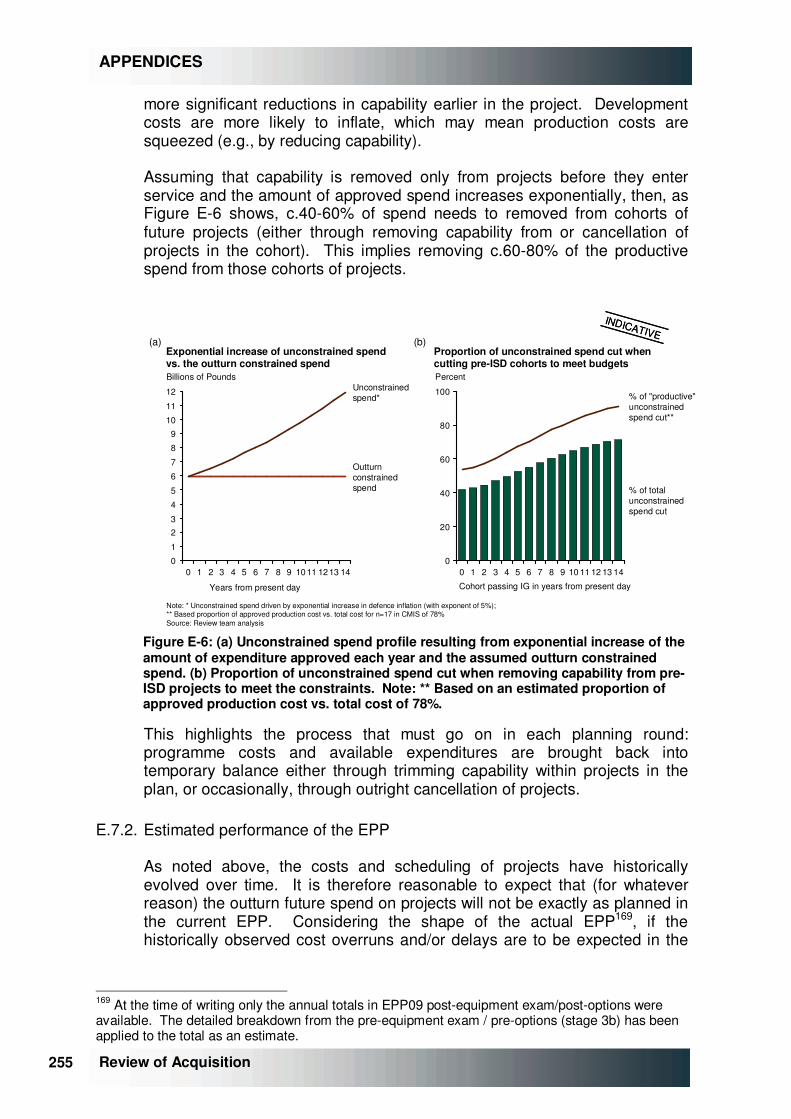
255 255
APPENDICES
Review of Acquisition
more significant reductions in capability earlier in the project. Development costs are more likely to inflate, which may mean production costs are squeezed (e.g., by reducing capability).
Assuming that capability is removed only from projects before they enter service and the amount of approved spend increases exponentially, then, as Figure �E-6 shows, c.40-60% of spend needs to removed from cohorts of future projects (either through removing capability from or cancellation of projects in the cohort). This implies removing c.60-80% of the productive spend from those cohorts of projects.
Exponential increase of unconstrained spend vs. the outturn constrained spend
0
1
23
4
5
6
7
8
9
10
11
12
5 6 74
Billions of Pounds
0 1
Outturnconstrainedspend
Unconstrainedspend*
2 3 9 14108 1311 120
20
40
60
80
100
Percent
109
% of totalunconstrainedspend cut
% of "productive"unconstrainedspend cut**
1413121187654310 2
Years from present day Cohort passing IG in years from present day
Proportion of unconstrained spend cut when cutting pre-ISD cohorts to meet budgets
Note: * Unconstrained spend driven by exponential increase in defence inflation (with exponent of 5%);** Based proportion of approved production cost vs. total cost for n=17 in CMIS of 78%Source: Review team analysis
(a) (b)
INDICATIVEINDICATIVE
Figure �E-6: (a) Unconstrained spend profile resulting from exponential increase of the amount of expenditure approved each year and the assumed outturn constrained spend. (b) Proportion of unconstrained spend cut when removing capability from pre-ISD projects to meet the constraints. Note: ** Based on an estimated proportion of approved production cost vs. total cost of 78%.
This highlights the process that must go on in each planning round: programme costs and available expenditures are brought back into temporary balance either through trimming capability within projects in the plan, or occasionally, through outright cancellation of projects.
E.7.2. Estimated performance of the EPP
As noted above, the costs and scheduling of projects have historically evolved over time. It is therefore reasonable to expect that (for whatever reason) the outturn future spend on projects will not be exactly as planned in the current EPP. Considering the shape of the actual EPP169, if the historically observed cost overruns and/or delays are to be expected in the
169 At the time of writing only the annual totals in EPP09 post-equipment exam/post-options were available. The detailed breakdown from the pre-equipment exam / pre-options (stage 3b) has been applied to the total as an estimate.
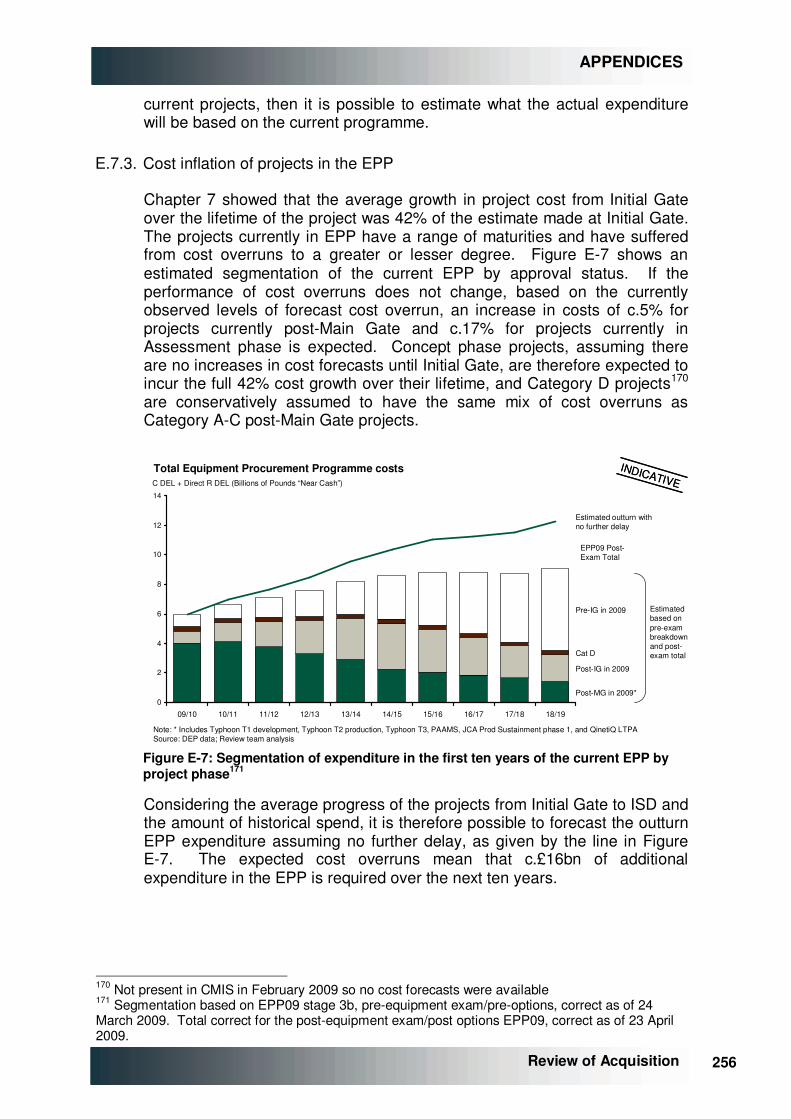
256 256
APPENDICES
Review of Acquisition
current projects, then it is possible to estimate what the actual expenditure will be based on the current programme.
E.7.3. Cost inflation of projects in the EPP
Chapter �7 showed that the average growth in project cost from Initial Gate over the lifetime of the project was 42% of the estimate made at Initial Gate. The projects currently in EPP have a range of maturities and have suffered from cost overruns to a greater or lesser degree. Figure �E-7 shows an estimated segmentation of the current EPP by approval status. If the performance of cost overruns does not change, based on the currently observed levels of forecast cost overrun, an increase in costs of c.5% for projects currently post-Main Gate and c.17% for projects currently in Assessment phase is expected. Concept phase projects, assuming there are no increases in cost forecasts until Initial Gate, are therefore expected to incur the full 42% cost growth over their lifetime, and Category D projects170 are conservatively assumed to have the same mix of cost overruns as Category A-C post-Main Gate projects.
Total Equipment Procurement Programme costs
Note: * Includes Typhoon T1 development, Typhoon T2 production, Typhoon T3, PAAMS, JCA Prod Sustainment phase 1, and QinetiQ LTPASource: DEP data; Review team analysis
0
2
4
6
8
10
12
14
11/1209/10
Estimated outturn withno further delay
12/13 13/1410/11
C DEL + Direct R DEL (Billions of Pounds “Near Cash”)
16/1715/1614/15 17/18 18/19
Pre-IG in 2009
Cat D
Post-IG in 2009
Post-MG in 2009*
Estimated based on pre-exam breakdown and post-exam total
EPP09 Post-Exam Total
INDICATIVEINDICATIVE
Figure �E-7: Segmentation of expenditure in the first ten years of the current EPP by project phase171
Considering the average progress of the projects from Initial Gate to ISD and the amount of historical spend, it is therefore possible to forecast the outturn EPP expenditure assuming no further delay, as given by the line in Figure �E-7. The expected cost overruns mean that c.£16bn of additional expenditure in the EPP is required over the next ten years.
170 Not present in CMIS in February 2009 so no cost forecasts were available 171 Segmentation based on EPP09 stage 3b, pre-equipment exam/pre-options, correct as of 24 March 2009. Total correct for the post-equipment exam/post options EPP09, correct as of 23 April 2009.
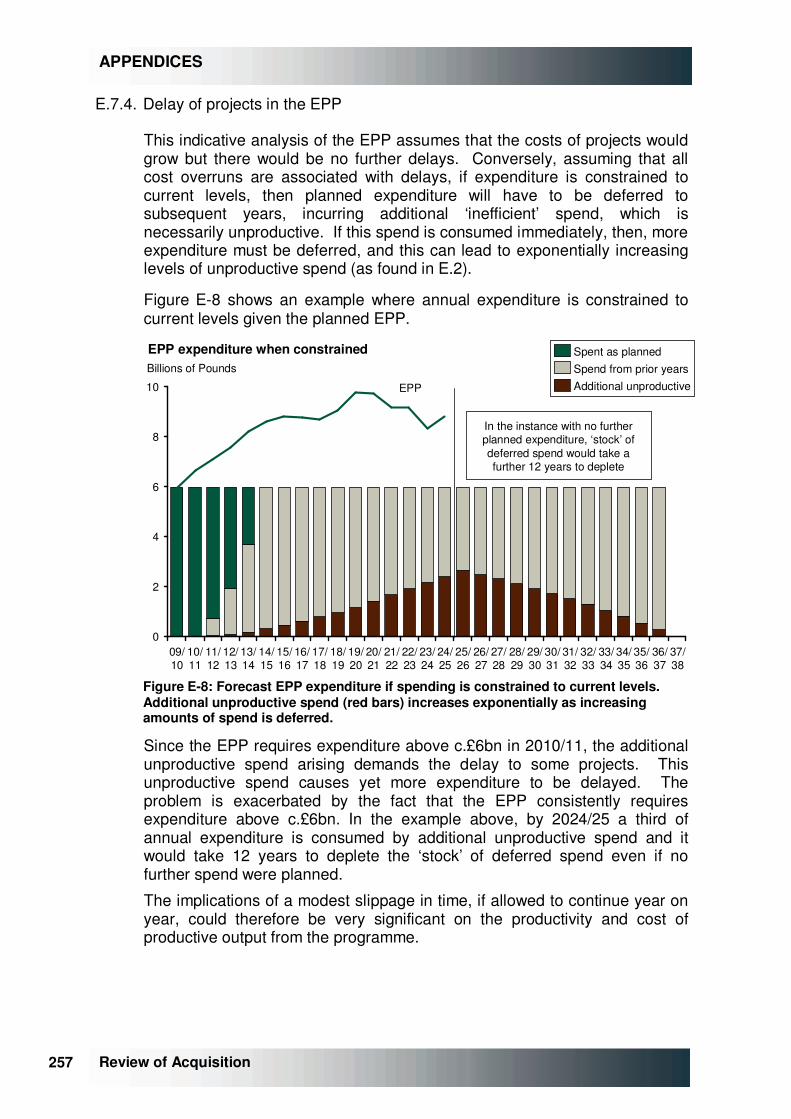
257 257
APPENDICES
Review of Acquisition
E.7.4. Delay of projects in the EPP
This indicative analysis of the EPP assumes that the costs of projects would grow but there would be no further delays. Conversely, assuming that all cost overruns are associated with delays, if expenditure is constrained to current levels, then planned expenditure will have to be deferred to subsequent years, incurring additional ‘inefficient’ spend, which is necessarily unproductive. If this spend is consumed immediately, then, more expenditure must be deferred, and this can lead to exponentially increasing levels of unproductive spend (as found in �E.2).
Figure �E-8 shows an example where annual expenditure is constrained to current levels given the planned EPP.
0
2
4
6
8
10
25/26
24/25
34/35
31/32
30/31
28/29
35/36
32/33
29/30
33/34
36/37
14/15
15/16
16/17
11/12
12/13
13/14
26/27
27/28
37/38
09/10
10/11
Billions of PoundsSpent as planned
23/24
18/19
17/18
22/23
Additional unproductive
21/22
Spend from prior years
20/21
19/20
EPP expenditure when constrained
In the instance with no further planned expenditure, ‘stock’ of deferred spend would take a further 12 years to deplete
EPP
Figure �E-8: Forecast EPP expenditure if spending is constrained to current levels. Additional unproductive spend (red bars) increases exponentially as increasing amounts of spend is deferred.
Since the EPP requires expenditure above c.£6bn in 2010/11, the additional unproductive spend arising demands the delay to some projects. This unproductive spend causes yet more expenditure to be delayed. The problem is exacerbated by the fact that the EPP consistently requires expenditure above c.£6bn. In the example above, by 2024/25 a third of annual expenditure is consumed by additional unproductive spend and it would take 12 years to deplete the ‘stock’ of deferred spend even if no further spend were planned.
The implications of a modest slippage in time, if allowed to continue year on year, could therefore be very significant on the productivity and cost of productive output from the programme.
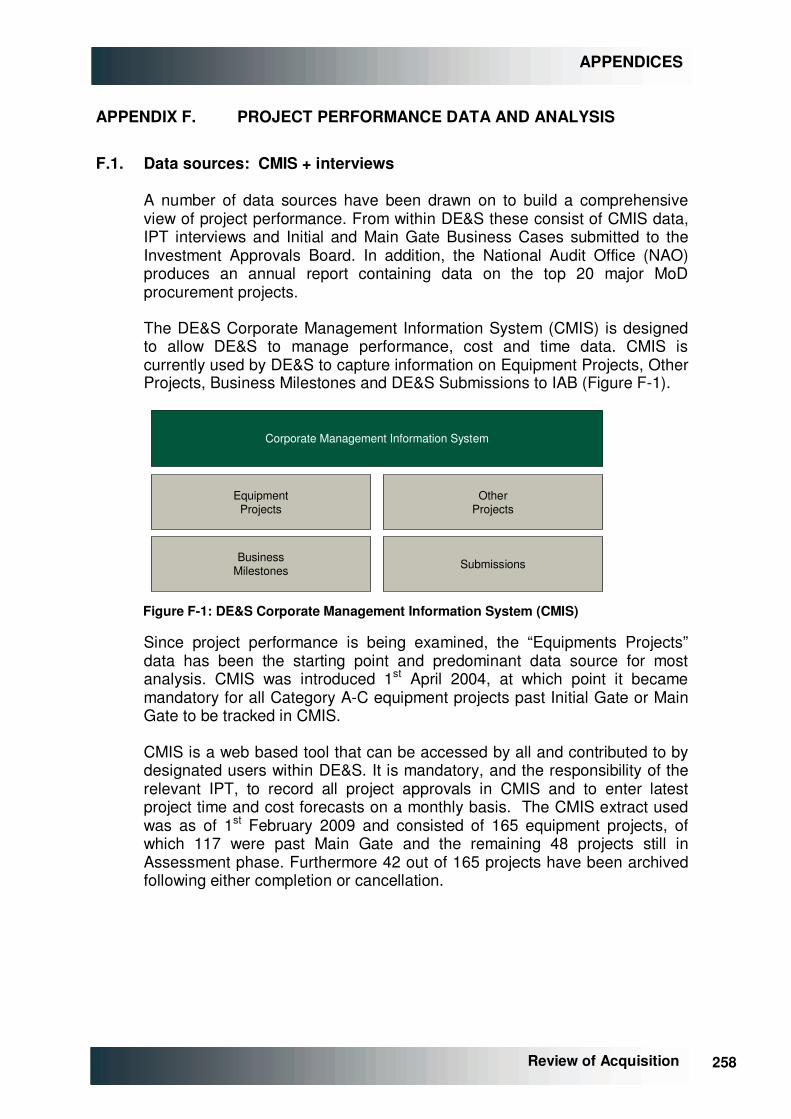
258 258
APPENDICES
Review of Acquisition
APPENDIX F. PROJECT PERFORMANCE DATA AND ANALYSIS
F.1. Data sources: CMIS + interviews
A number of data sources have been drawn on to build a comprehensive view of project performance. From within DE&S these consist of CMIS data, IPT interviews and Initial and Main Gate Business Cases submitted to the Investment Approvals Board. In addition, the National Audit Office (NAO) produces an annual report containing data on the top 20 major MoD procurement projects.
The DE&S Corporate Management Information System (CMIS) is designed to allow DE&S to manage performance, cost and time data. CMIS is currently used by DE&S to capture information on Equipment Projects, Other Projects, Business Milestones and DE&S Submissions to IAB (Figure �F-1).
Corporate Management Information System
EquipmentProjects
OtherProjects
BusinessMilestones Submissions
Figure �F-1: DE&S Corporate Management Information System (CMIS)
Since project performance is being examined, the “Equipments Projects” data has been the starting point and predominant data source for most analysis. CMIS was introduced 1st April 2004, at which point it became mandatory for all Category A-C equipment projects past Initial Gate or Main Gate to be tracked in CMIS.
CMIS is a web based tool that can be accessed by all and contributed to by designated users within DE&S. It is mandatory, and the responsibility of the relevant IPT, to record all project approvals in CMIS and to enter latest project time and cost forecasts on a monthly basis. The CMIS extract used was as of 1st February 2009 and consisted of 165 equipment projects, of which 117 were past Main Gate and the remaining 48 projects still in Assessment phase. Furthermore 42 out of 165 projects have been archived following either completion or cancellation.
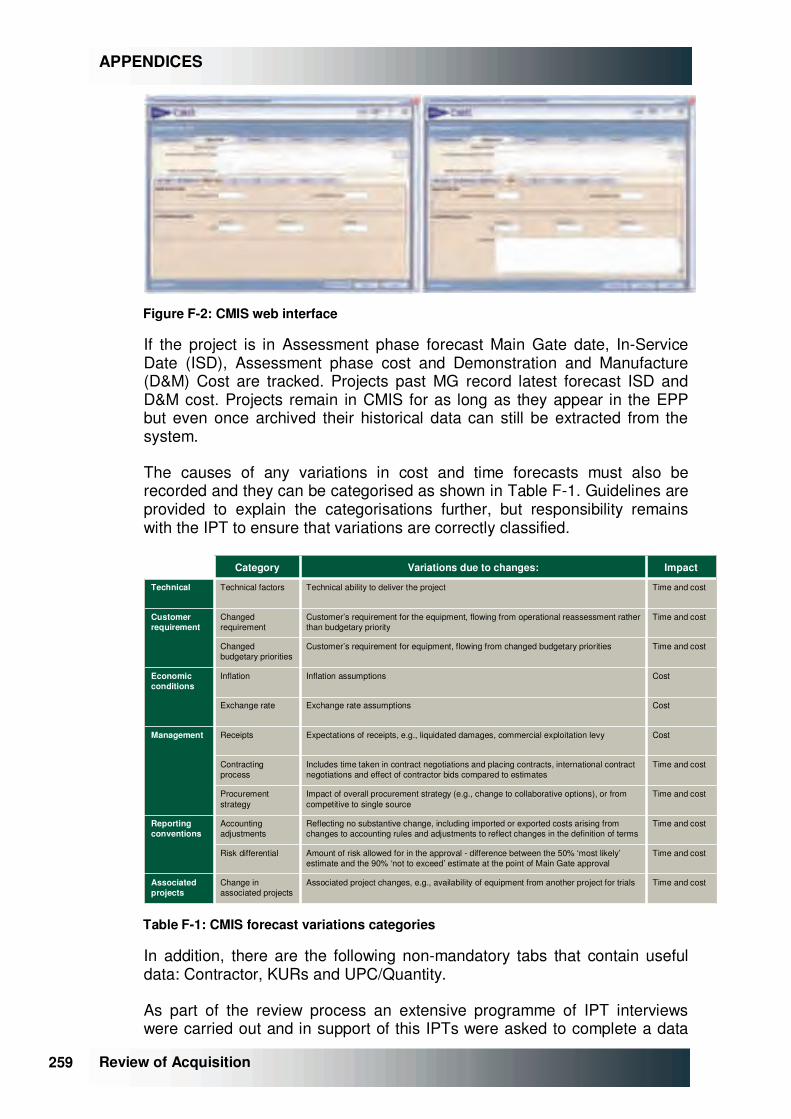
259 259
APPENDICES
Review of Acquisition
Figure �F-2: CMIS web interface
If the project is in Assessment phase forecast Main Gate date, In-Service Date (ISD), Assessment phase cost and Demonstration and Manufacture (D&M) Cost are tracked. Projects past MG record latest forecast ISD and D&M cost. Projects remain in CMIS for as long as they appear in the EPP but even once archived their historical data can still be extracted from the system.
The causes of any variations in cost and time forecasts must also be recorded and they can be categorised as shown in Table �F-1. Guidelines are provided to explain the categorisations further, but responsibility remains with the IPT to ensure that variations are correctly classified.
Associatedprojects
Reportingconventions
Management
Economicconditions
Customerrequirement
Technical
Time and costAmount of risk allowed for in the approval - difference between the 50% ‘most likely’estimate and the 90% ‘not to exceed’ estimate at the point of Main Gate approval
Risk differential
Time and cost
Time and cost
Time and cost
Time and cost
Cost
Cost
Cost
Time and cost
Time and cost
Time and cost
Impact
Reflecting no substantive change, including imported or exported costs arising from changes to accounting rules and adjustments to reflect changes in the definition of terms
Accounting adjustments
Impact of overall procurement strategy (e.g., change to collaborative options), or from competitive to single source
Procurement strategy
Associated project changes, e.g., availability of equipment from another project for trialsChange in associated projects
Includes time taken in contract negotiations and placing contracts, international contract negotiations and effect of contractor bids compared to estimates
Contracting process
Expectations of receipts, e.g., liquidated damages, commercial exploitation levyReceipts
Exchange rate assumptionsExchange rate
Inflation assumptionsInflation
Customer’s requirement for equipment, flowing from changed budgetary prioritiesChanged budgetary priorities
Customer’s requirement for the equipment, flowing from operational reassessment rather than budgetary priority
Changed requirement
Technical ability to deliver the projectTechnical factors
Variations due to changes:Category
Table �F-1: CMIS forecast variations categories
In addition, there are the following non-mandatory tabs that contain useful data: Contractor, KURs and UPC/Quantity.
As part of the review process an extensive programme of IPT interviews were carried out and in support of this IPTs were asked to complete a data
260 260
APPENDICES
Review of Acquisition
template. This has been valuable in expanding the sample of projects for which unit data is available at Initial Gate, Main Gate and Latest forecast. It has also proved to be a key source of TRL (Technical Readiness Level) data.
The final source of data from within the organisation has come from reviewing Initial Gate and Main Gate Business Case submissions to the IAB. The business cases are able to provide both IG and MG forecast data and add to the unit and TRL data. They also provide a very good insight into the project scope and help to understand any significant changes that might have occurred between IG and MG
F.2. NAO process
The Department is required to report to annually to Parliament details on its performance in delivering Major Defence Equipment Projects in the previous year, the Departmental Major Projects Report (MPR). The report details the 20 largest post Main Gate projects in terms of value within the Equipment Plan and reports on delivery to performance, cost and time. The information comprises detailed Project Summary Sheets, validated by the National Audit Office (NAO), and an overarching commentary by the Department. The Departmental Report is published prior to the summer recess.
The NAO subsequently publishes its Major Projects Report, usually in November, this provides an analysis of the results, reasons underpinning any reported change and recommendations about how this might be addressed. The Major Projects Report is usually the subject of a Public Accounts Committee (“PAC”) hearing.
The Departmental Project Summary Sheets have formed the basis of project data prior to 2004 that cannot be extracted from CMIS. In addition they have been used to fill gaps, especially where fields are not mandatory in CMIS, e.g., UPC/Quantities.
F.3. Data cleansing
Utilising data from a number of sources has required a high level of quality control to ensure consistency throughout. This has been considered from two different angles: firstly ensuring that the data is factually correct and secondly checking that for individual projects it is appropriate to assess performance in a standard manner; excluding those projects where is not deemed appropriate. (For a full list of projects and in which samples they appear refer to Section �F.15.)
For the top 20 Major Projects covered by the NAO it can be assumed that this data is correct as it has undergone a rigorous audit process and it can be used to verify the current and historical CMIS data. However, for projects that do not appear in the NAO it has been necessary to verify any uncertainties where possible with DE&S. This process has undergone a
261 261
APPENDICES
Review of Acquisition
number of iterations and the following corrections have been made to errors arising from data entry issues in CMIS:
• corrections to Main Gate approval dates;
• removal of duplicate projects; and
• corrections to forecasts.
The second aspect of ensuring that appropriate comparisons are being made was considered for both the Assessment phase and Demonstration & Manufacture phase separately.
Some projects are still loosely defined when they receive Initial Gate approval and as a result the scope can change significantly during the Assessment phase, thus for such projects IG to MG comparisons are relatively meaningless. These significant changes in scope have been identified through IPT interviews or by identifying outliers in the analysis and subsequently verifying that there has been a change in scope.
Moreover a number of projects have been excluded from the analysis of Performance during the Demonstration & Manufacture phase:
• three projects excluded due to missing or inconsistent data:
� unknown Main Gate date;
� no ISD as ‘support style’ project to deliver ongoing capability; or
� no Demonstration & Manufacture stage as capability met by UOR.
• three NAO Major Projects excluded as they do not appear in CMIS and dropped out of the NAO Major Project Reports before reaching completion.
F.4. Adjusting for changes in capability
The capability that a project actually delivers is often significantly different from the capability that was specified when the project was originally planned and approved. This will be the case if, for example, the customer specifies new requirements once a project is underway. In certain situations, trading out capability renders it possible to meet cost and/or time constraints that would otherwise be impossible; in such circumstances, changes may be deliberately introduced by programme managers.
In order to understand project performance accurately, it is necessary to make adjustments to take account of such changes. Whilst any change is likely to impact project duration and project cost, the impact on duration is generally thought to be less significant and more difficult to determine. For this reason, this study has not sought to make any adjustments to the duration data. The cost to complete a project, however, is likely to be highly
262 262
APPENDICES
Review of Acquisition
sensitive to changes to the scope of the project, and it has been deemed necessary to make the appropriate corrections.
In order to determine how to correct for these changes, there are two distinct aspects to capability that need to be considered: those which are volume-related; and those which are functionality-related. In other words, the capability that a project delivers is related not only to the number of units that are produced, but also to the level of performance that each unit is capable of meeting.
For projects in the Assessment phase, relatively little data is captured on the cost changes associated to changes in the scope of a project. As a result, the functionality-related changes are ignored and the only corrections that are made concern volume-related aspects of capability. The adjusted cost change172 is calculated as shown in Equation �F-1. In order to maximise the sample size, no volume changes have been assumed unless specific information has been received to the contrary.
MG IG to fromgrowth cost M&D %100
unitsIG cost M&Dforecast IG
unitsMG cost M&Dforecast MG
=��
���
�
��
���
�
Equation �F-1: Adjusted D&M cost growth during Assessment phase
More information is available regarding projects that have received Main Gate approval. For these projects, detailed data describing the variations in cost since Main Gate are captured (Table �F-1). As a result, fully adjusted unit costs can be calculated as follows: given the latest forecast cost to completion, adding back the cost variations that are associated with changed functionality (but not those associated with changing volumes, nor those which are not related to changes in capability), means that it is possible to deduce the cost of delivering the project at Main Gate functionality but current volumes, as indicated in Figure �F-3. By comparing the resulting unit cost with the unit cost implied by the conditions approved at Main Gate, a unit cost overrun which is adjusted for changes in capability can be calculated.
172 The adjustment is made to the cost of the Demonstration and Manufacture phases of the project; no corrections are applied to the cost of the Assessment phase.

263 263
APPENDICES
Review of Acquisition
1,300
3,309
3,055
2,3502,500
0
500
1,000
1,500
2,000
2,500
3,000
3,500
IG cost(estimate)
150
Change in forecast
MG cost
(341)
Volume change
(254)
Functionality change
Other cost changes
Current forecast
254
Functionality change
Capability adjusted cost
Millions of pounds
Example project
# unitsCost / unit(£m)
55
45
50
47
25
122
25
132
Capability change
+181%
Figure �F-3: Cost adjustment methodology
Adjusting for changes in project capability in this way has a significant impact on the rates of cost overrun, as shown in Figure �F-4. In all instances, adjusted unit cost is higher than the corresponding unadjusted figures. This shows that, although projects on average overrun on cost, the overrun delivers less capability than was approved (at both Initial Gate and Main Gate)
Note: * Projects that are 75% complete or greaterSource: CMIS (Feb 2009); NAO Major project reports
MG forecast D&M cost as a % of IG forecast D&M cost – adjusted versus un-adjusted cost
Latest forecast D&M cost as a % of MG forecast D&M cost – adjusted versus un-adjusted cost*
n = 45n = 45
120127
0
25
50
75
100
125
150
Un-adjusted Adjusted
Index (IG =100)n = 49n = 49
113
103
0
25
50
75
100
125
Un-adjusted Adjusted
Index (IG =100)
Figure �F-4: Adjusted versus un-adjusted cost growth for Assessment phase (LHS) and D&M phase (RHS)
In addition to cost and duration forecasts, project Key User Requirements (“KURs”) are also tracked in CMIS. These can be analysed to give an indication of whether the KURs, as defined at Main Gate, were met or are forecast to be met.
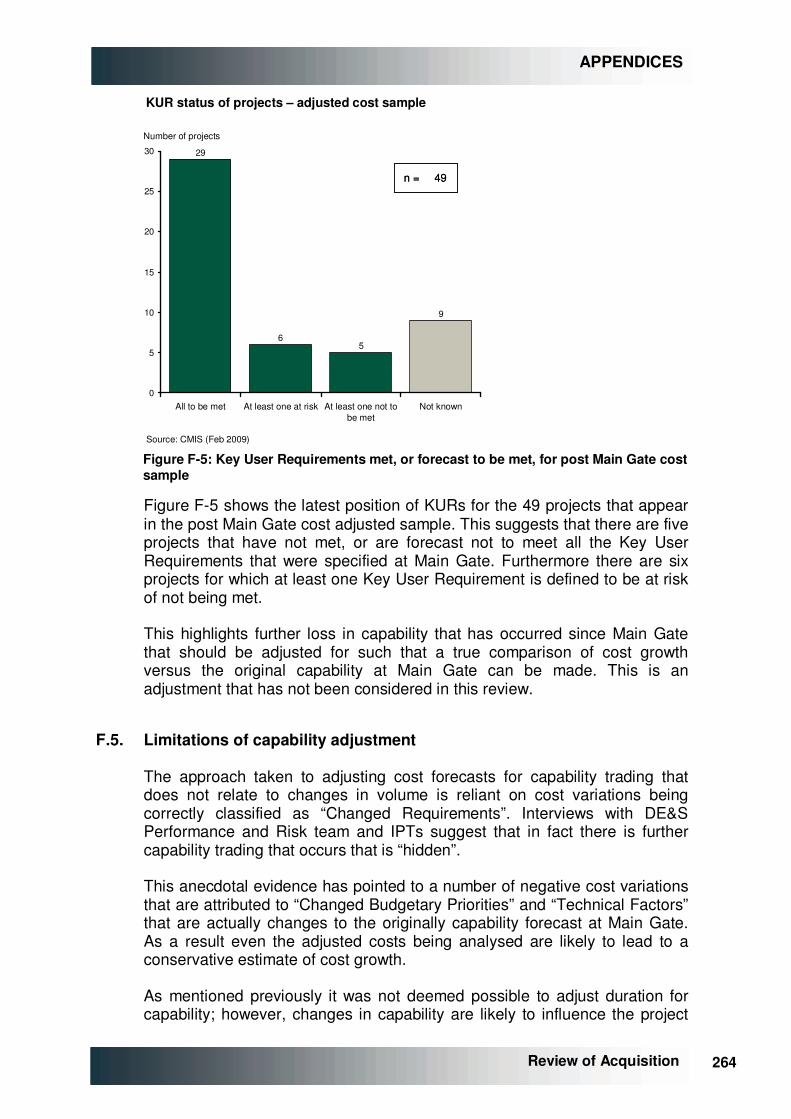
264 264
APPENDICES
Review of Acquisition
Source: CMIS (Feb 2009)
9
56
29
0
5
10
15
20
25
30
Not knownAt least one not to be met
At least one at riskAll to be met
Number of projects
KUR status of projects – adjusted cost sample
n = 49n = 49
Figure �F-5: Key User Requirements met, or forecast to be met, for post Main Gate cost sample
Figure �F-5 shows the latest position of KURs for the 49 projects that appear in the post Main Gate cost adjusted sample. This suggests that there are five projects that have not met, or are forecast not to meet all the Key User Requirements that were specified at Main Gate. Furthermore there are six projects for which at least one Key User Requirement is defined to be at risk of not being met.
This highlights further loss in capability that has occurred since Main Gate that should be adjusted for such that a true comparison of cost growth versus the original capability at Main Gate can be made. This is an adjustment that has not been considered in this review.
F.5. Limitations of capability adjustment
The approach taken to adjusting cost forecasts for capability trading that does not relate to changes in volume is reliant on cost variations being correctly classified as “Changed Requirements”. Interviews with DE&S Performance and Risk team and IPTs suggest that in fact there is further capability trading that occurs that is “hidden”.
This anecdotal evidence has pointed to a number of negative cost variations that are attributed to “Changed Budgetary Priorities” and “Technical Factors” that are actually changes to the originally capability forecast at Main Gate. As a result even the adjusted costs being analysed are likely to lead to a conservative estimate of cost growth.
As mentioned previously it was not deemed possible to adjust duration for capability; however, changes in capability are likely to influence the project

265 265
APPENDICES
Review of Acquisition
duration and as a result estimates for growth in duration versus forecasts are likely to be conservative.
Furthermore, the duration of projects as defined by IG to ISD can be impacted by a change in ISD definition. In a number of instances the quantities required to meet ISD have been reduced and as a result the monitored project duration (MG-ISD) will reduce. In addition, some ISD definitions appear to be very loosely defined potentially allowing for ‘shortening’ to occur that is not visible. This is not something that has been addressed within this review.
F.6. Performance during the Assessment phase (pre-Main Gate) – Samples
Category A to C projects recorded in the CMIS database and NAO Major Project Reports have been used as a starting point for all Assessment phase analysis samples. Where appropriate these have been supplemented using data from IPT interviews, NAO Major Project Reports and the Investment Approvals Board (IAB).
Outturn Assessment phase duration can be calculated for all projects that have now passed Main Gate, and for which the date of both Main Gate and Initial Gate date are known, a sample of 42 projects173. Outturn Assessment phase cost data is not available in CMIS; but data presented in the NAO Major Project Reports and extracted from IAB submissions has resulted in a sample of 38 projects where both the IG forecast cost and the outturn AP cost is known.
The documents submitted by each project at Initial Gate are expected to forecast an In-Service Date as well as a Main Gate date, although this is not always the case. The submissions are also supposed to forecast the total cost of the Demonstration and Manufacture phases. Where available, these forecasts can be compared with those that are made as part of the Main Gate approvals process in order to ascertain how much slippage (of both time and cost) occurs during Assessment phase (section �F.6). The size of this sample size is constrained by the number of projects past MG for which IG forecasts of MG-ISD duration and D&M phase cost are available. In addition, there are a number of projects which are not suitable either because the project is a follow-on buy or because the scope has changed during the Assessment phase to such an extent that comparisons are unreasonable (see section �F.3). The necessary cost forecasts are available for only 45 projects; a sample of 45 projects is available for analysis of duration slippage (see Figure �F-6).
This reduces further to a sample of 25 projects for which at least the 90% forecast risk range forecast is available at IG and MG for both cost and duration.
173 This number excludes projects where the scope is understood to have changed so significantly that the work undertaken during the Assessment phase is fundamentally different to that which was envisaged at Initial Gate (see Section �F.3).
266 266
APPENDICES
Review of Acquisition
Source: CMIS (Feb 2009); IAB; NAO Major project reports
25
4545
12165
0
25
50
75
100
125
150
175
200
(10)
IG forecast D&M
duration unavailable
Fundamental change in scope
from IG to MG
Fundamental change in scope
from IG to MG
Follow on buy /
straight to MG
(54)
IG to MG cost sample
(13)
IG to MG duration sample
Additional NAO Major
Projects
(53)
IG forecast D&M cost
unavailable
(48)
(20)
(7)(15)
Two point forecasts
unavailable for cost or duration
IG to MG risk range
sample
Number of projects
(6)
Not past MG
CMIS projects
Sample sizes used for Initial Gate to Main Gate analysis
Non-Smart
Non-Smart
Figure �F-6: Samples sizes used for Assessment phase evolution of post MG cost and time estimates
F.7. Performance during the Demo/Manufacturing phase (MG to ISD) – Samples
Similarly, the 165 category A to C projects recorded in the CMIS database have been used as a starting point for all post Main Gate analysis samples. However, in this case an additional 12 projects appearing in NAO Major Project Reports prior to 2004 but not in CMIS can be included in the sample. Of the CMIS projects 48 are not past MG and cannot be included. Furthermore, there are 6 projects that have to be excluded due to either irresolvable inconsistencies with the data or because reasonable comparisons cannot be made (Section �F.3).
This results in a sample of 123 projects for which both latest forecast and Main Gate forecast data is available (Figure �F-7). This sample is used in the analysis of slippage in forecast Main Gate to In-Service Date duration following Main Gate approval.
As discussed in Section �F.4 the cost forecasts can be adjusted for any changes in capability following approval. Doing so requires the variations in forecast cost to be known, in particular any “Changed Requirement” variations. For projects which achieved Main Gate approval prior to the launch of CMIS in April 2004, and which were not covered by the NAO’s Major Project Reports during that time, information about cost variation is missing and it is not possible to adjusted for capability. This is the case for 39 of the 123 projects.
In order to calculate unit costs, it is also necessary to know the number of units approved both at Main Gate and at the time of the latest cost forecast. For 5 of the remaining projects, this data is unavailable. This results in a
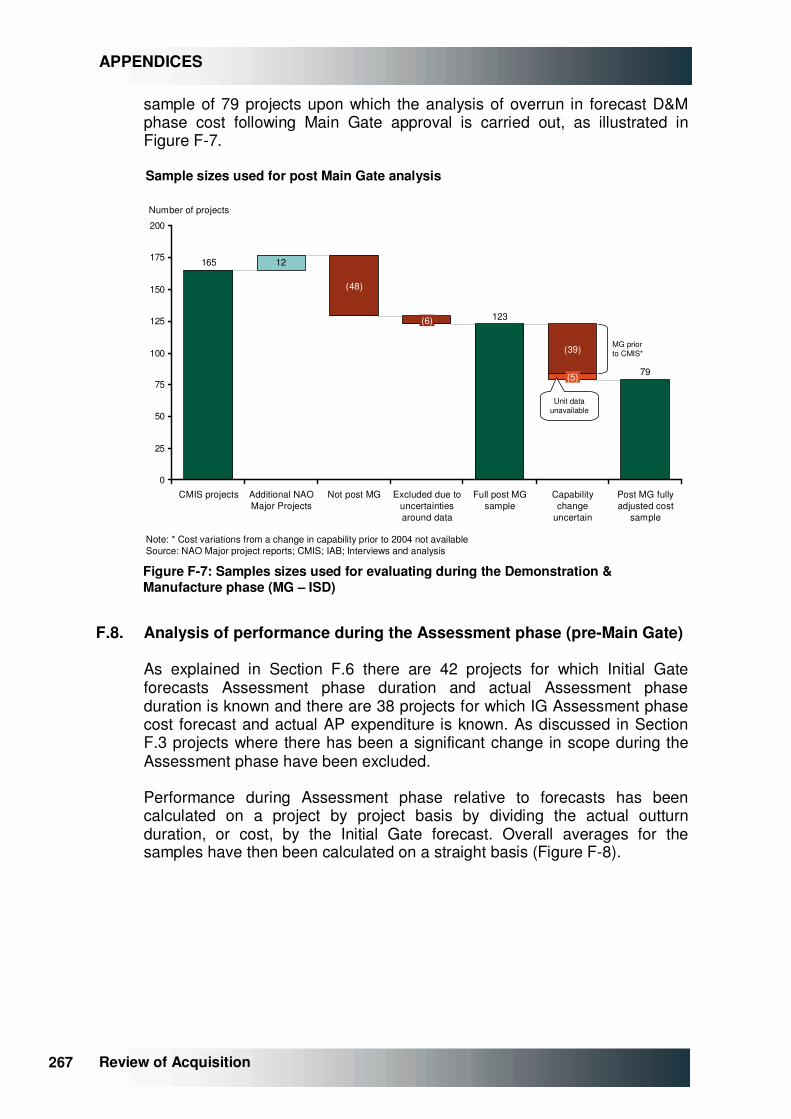
267 267
APPENDICES
Review of Acquisition
sample of 79 projects upon which the analysis of overrun in forecast D&M phase cost following Main Gate approval is carried out, as illustrated in Figure �F-7.
Note: * Cost variations from a change in capability prior to 2004 not availableSource: NAO Major project reports; CMIS; IAB; Interviews and analysis
12
79
123
165
0
25
50
75
100
125
150
175
200
(6)
Full post MG sample
Excluded due to uncertainties around data
CMIS projects Additional NAO Major Projects
(48)
Not post MG
(39)
(5)
Capability change
uncertain
Post MG fully adjusted cost
sample
Number of projects
Sample sizes used for post Main Gate analysis
Unit data unavailable
MG prior to CMIS*
Figure �F-7: Samples sizes used for evaluating during the Demonstration & Manufacture phase (MG – ISD)
F.8. Analysis of performance during the Assessment phase (pre-Main Gate)
As explained in Section �F.6 there are 42 projects for which Initial Gate forecasts Assessment phase duration and actual Assessment phase duration is known and there are 38 projects for which IG Assessment phase cost forecast and actual AP expenditure is known. As discussed in Section �F.3 projects where there has been a significant change in scope during the Assessment phase have been excluded.
Performance during Assessment phase relative to forecasts has been calculated on a project by project basis by dividing the actual outturn duration, or cost, by the Initial Gate forecast. Overall averages for the samples have then been calculated on a straight basis (Figure �F-8).
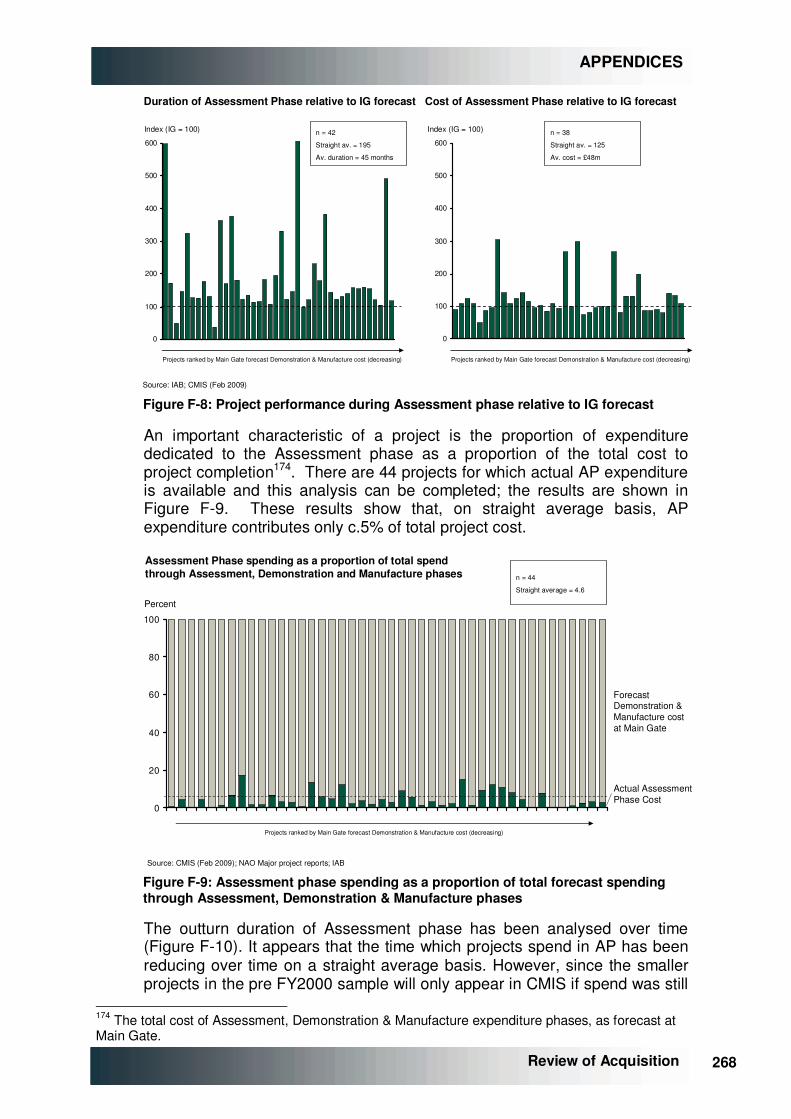
268 268
APPENDICES
Review of Acquisition
Source: IAB; CMIS (Feb 2009)
0
100
200
300
400
500
600
Index (IG = 100)
0
100
200
300
400
500
600
Index (IG = 100)
Cost of Assessment Phase relative to IG forecastDuration of Assessment Phase relative to IG forecast
n = 42
Straight av. = 195
Av. duration = 45 months
n = 38
Straight av. = 125
Av. cost = £48m
Projects ranked by Main Gate forecast Demonstration & Manufacture cost (decreasing) Projects ranked by Main Gate forecast Demonstration & Manufacture cost (decreasing)
Figure �F-8: Project performance during Assessment phase relative to IG forecast
An important characteristic of a project is the proportion of expenditure dedicated to the Assessment phase as a proportion of the total cost to project completion174. There are 44 projects for which actual AP expenditure is available and this analysis can be completed; the results are shown in Figure �F-9. These results show that, on straight average basis, AP expenditure contributes only c.5% of total project cost.
0
20
40
60
80
100
Forecast Demonstration & Manufacture cost at Main Gate
Actual Assessment Phase Cost
Percent
Source: CMIS (Feb 2009); NAO Major project reports; IAB
Projects ranked by Main Gate forecast Demonstration & Manufacture cost (decreasing)
Assessment Phase spending as a proportion of total spend through Assessment, Demonstration and Manufacture phases n = 44
Straight average = 4.6
Figure �F-9: Assessment phase spending as a proportion of total forecast spending through Assessment, Demonstration & Manufacture phases
The outturn duration of Assessment phase has been analysed over time (Figure �F-10). It appears that the time which projects spend in AP has been reducing over time on a straight average basis. However, since the smaller projects in the pre FY2000 sample will only appear in CMIS if spend was still
174 The total cost of Assessment, Demonstration & Manufacture expenditure phases, as forecast at Main Gate.

269 269
APPENDICES
Review of Acquisition
occurring post April 2004, the sample is likely to be skewed towards overrunning projects. Additionally, the FY2005-09 sample will not include projects that have not yet past Main Gate (if, for example, they are overrunning). This sample may also, therefore, be subject to bias. Nonetheless, there does appear to be a trend of Assessment phase duration decreasing over time.
Source: CMIS (Feb 2009); NAO Major project reports; IAB
64
40
19
45
0
20
40
60
80
Straight Average
Pre FY 2000FY 2000 - 04FY 2005 - 09All
Months
20n =
Duration of Assessment Phase – trend over time
541024
Initial Gate Date
Key:
Figure �F-10: Outturn duration of Assessment phase – trend over time
Furthermore the changes in post Main Gate forecasts over the Assessment phase have been analysed. The analysis is based upon a sample of 45 projects where the necessary cost forecasts are available and a sample of 45 projects for duration (See Section �F.6 and Figure �F-6).
In this case the costs have been adjusted for any changes in capability that can be identified through changes in the number of units approved for delivery. For detailed explanation of cost adjustment see Section �F.4.
The growth in forecasts have been calculated in a similar manner to above by firstly calculating the growth on an project basis, by diving the Main Gate forecast by the forecast at Initial Gate. Both the straight average of MG forecast relative to IG forecast and the average weighted by Main Gate forecast D&M cost have been calculated (Figure �F-11, Figure �F-12).
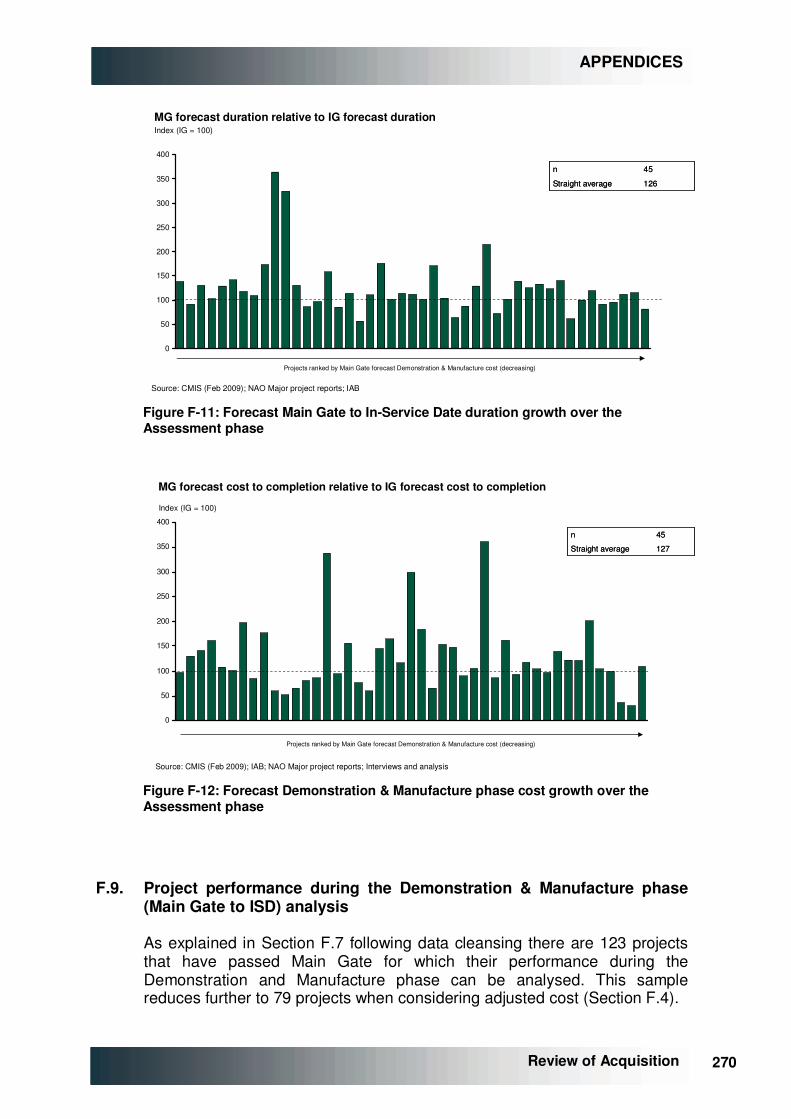
270 270
APPENDICES
Review of Acquisition
Source: CMIS (Feb 2009); NAO Major project reports; IAB
0
50
100
150
200
250
300
350
400
Index (IG = 100)MG forecast duration relative to IG forecast duration
126Straight average
45n
126Straight average
45n
Projects ranked by Main Gate forecast Demonstration & Manufacture cost (decreasing)
Figure �F-11: Forecast Main Gate to In-Service Date duration growth over the Assessment phase
Source: CMIS (Feb 2009); IAB; NAO Major project reports; Interviews and analysis
0
50
100
150
200
250
300
350
400
Index (IG = 100)
MG forecast cost to completion relative to IG forecast cost to completion
127Straight average
45n
127Straight average
45n
Projects ranked by Main Gate forecast Demonstration & Manufacture cost (decreasing)
Figure �F-12: Forecast Demonstration & Manufacture phase cost growth over the Assessment phase
F.9. Project performance during the Demonstration & Manufacture phase (Main Gate to ISD) analysis
As explained in Section �F.7 following data cleansing there are 123 projects that have passed Main Gate for which their performance during the Demonstration and Manufacture phase can be analysed. This sample reduces further to 79 projects when considering adjusted cost (Section �F.4).
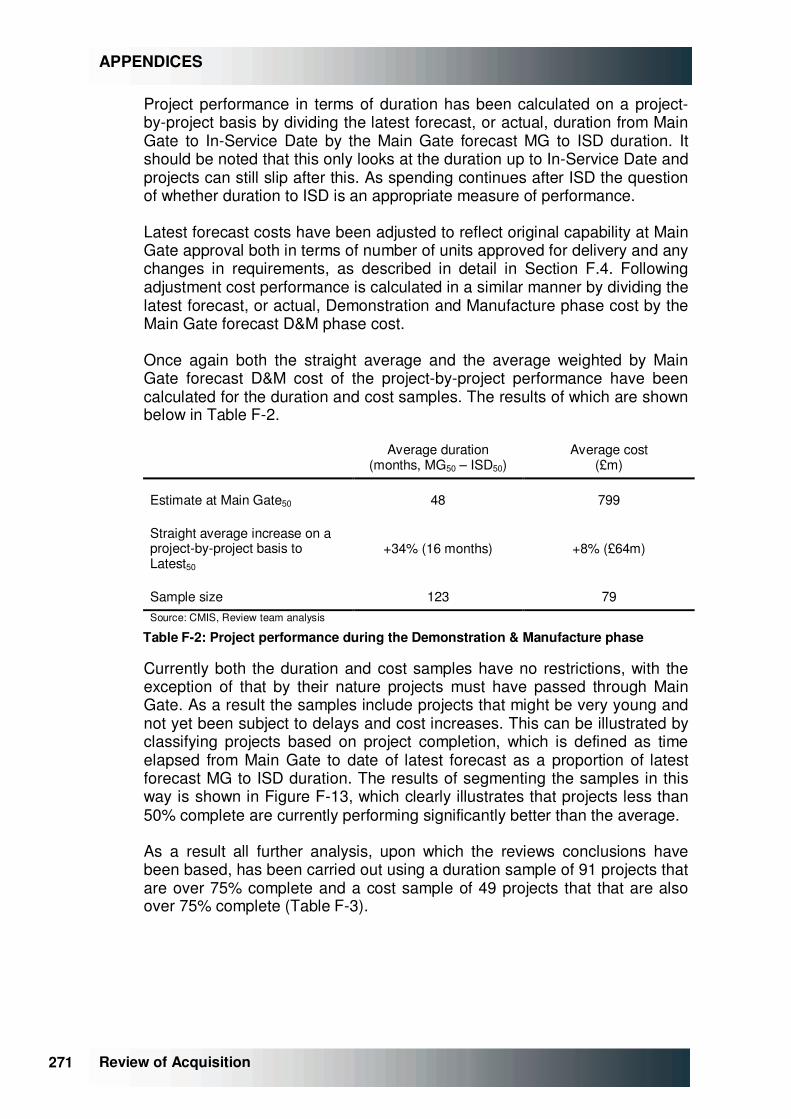
271 271
APPENDICES
Review of Acquisition
Project performance in terms of duration has been calculated on a project-by-project basis by dividing the latest forecast, or actual, duration from Main Gate to In-Service Date by the Main Gate forecast MG to ISD duration. It should be noted that this only looks at the duration up to In-Service Date and projects can still slip after this. As spending continues after ISD the question of whether duration to ISD is an appropriate measure of performance.
Latest forecast costs have been adjusted to reflect original capability at Main Gate approval both in terms of number of units approved for delivery and any changes in requirements, as described in detail in Section �F.4. Following adjustment cost performance is calculated in a similar manner by dividing the latest forecast, or actual, Demonstration and Manufacture phase cost by the Main Gate forecast D&M phase cost.
Once again both the straight average and the average weighted by Main Gate forecast D&M cost of the project-by-project performance have been calculated for the duration and cost samples. The results of which are shown below in Table �F-2.
Average duration (months, MG50 – ISD50)
Average cost (£m)
Estimate at Main Gate50 48 799
Straight average increase on a project-by-project basis to Latest50
+34% (16 months) +8% (£64m)
Sample size 123 79 Source: CMIS, Review team analysis
Table �F-2: Project performance during the Demonstration & Manufacture phase
Currently both the duration and cost samples have no restrictions, with the exception of that by their nature projects must have passed through Main Gate. As a result the samples include projects that might be very young and not yet been subject to delays and cost increases. This can be illustrated by classifying projects based on project completion, which is defined as time elapsed from Main Gate to date of latest forecast as a proportion of latest forecast MG to ISD duration. The results of segmenting the samples in this way is shown in Figure �F-13, which clearly illustrates that projects less than 50% complete are currently performing significantly better than the average.
As a result all further analysis, upon which the reviews conclusions have been based, has been carried out using a duration sample of 91 projects that are over 75% complete and a cost sample of 49 projects that that are also over 75% complete (Table �F-3).

272 272
APPENDICES
Review of Acquisition
Average duration (months, MG50 - ISD)50
Average cost of D&M phase (£m)
Estimate at Main Gate50 44 748
Straight average increase on a project-by-project basis to Latest50
(75% mature)
+37% (16 months) +13% (£97m)
Sample size 91 49 Source: CMIS, Review team analysis
Table �F-3: Average duration and cost of Demonstration and Manufacture phase
Note: Straight average shownSource: CMIS (Feb 2009); NAO Major project reports; IAB; Review team analysis
180
158
183177
0
25
50
75
100
125
150
175
200
Index of project duration (Forecast at Main Gate50 = 155)
Latest forecast project duration overrun by Maturity
16 123 14 16 7949Number of projects sampled
25
1691
MainGate
InitialGate
55
over 75% 0-50% 50-75% All
Latest forecast project cost overrunby Maturity
143
119
136 137
0
25
50
75
100
125
150
Index of adjusted unit cost (Forecast at Main Gate50 = 128)
15
InitialGate
MainGate
28
over 75% 0-50% 50-75% All
Figure �F-13: Project duration and cost overrun for projects post Main Gate
Furthermore the samples can be segmented by project Category, which allows for the effect of size to be considered (Figure �F-14).
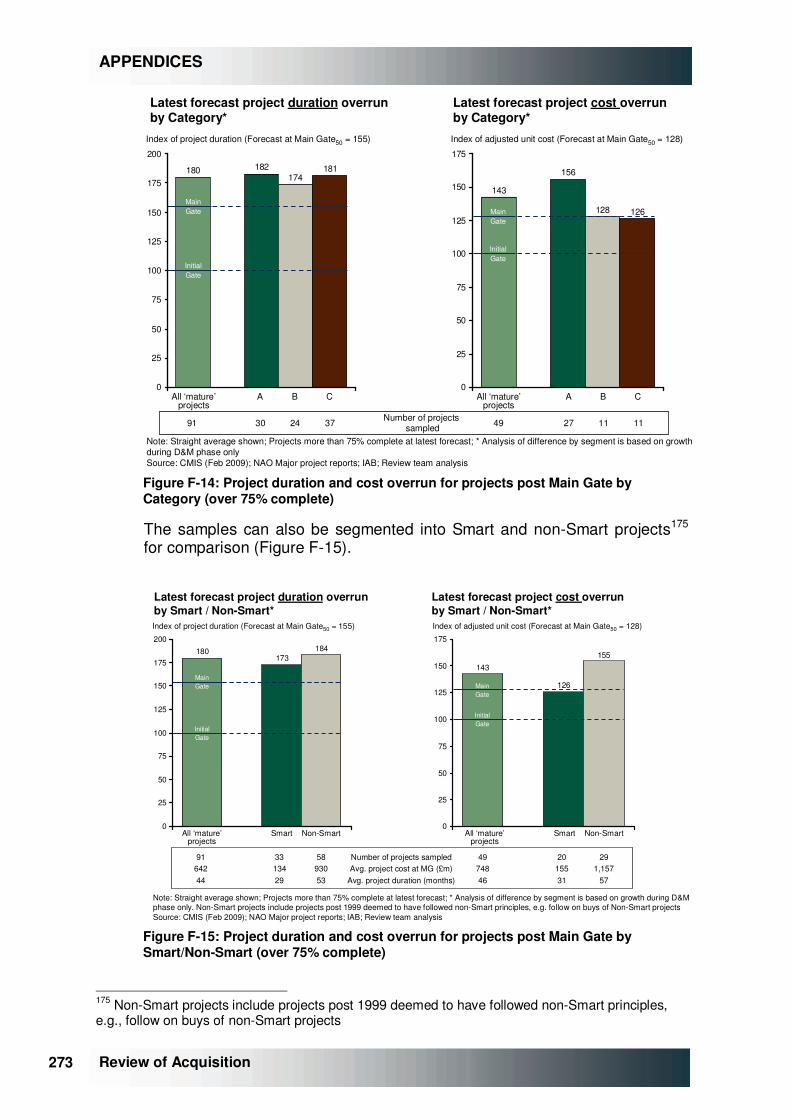
273 273
APPENDICES
Review of Acquisition
Note: Straight average shown; Projects more than 75% complete at latest forecast; * Analysis of difference by segment is based on growth during D&M phase onlySource: CMIS (Feb 2009); NAO Major project reports; IAB; Review team analysis
180 182174
181
0
25
50
75
100
125
150
175
200
Index of project duration (Forecast at Main Gate50 = 155)
30 24
Latest forecast project duration overrunby Category*
143
156
128 126
0
25
50
75
100
125
150
175
Index of adjusted unit cost (Forecast at Main Gate50 = 128)
Latest forecast project cost overrunby Category*
37 Number of projects sampled91
MainGate
InitialGate
MainGate
InitialGate
All ‘mature’projects
A B C
27 11 1149
All ‘mature’projects
A B C
Figure �F-14: Project duration and cost overrun for projects post Main Gate by Category (over 75% complete)
The samples can also be segmented into Smart and non-Smart projects175 for comparison (Figure �F-15).
Note: Straight average shown; Projects more than 75% complete at latest forecast; * Analysis of difference by segment is based on growth during D&M phase only. Non-Smart projects include projects post 1999 deemed to have followed non-Smart principles, e.g. follow on buys of Non-Smart projectsSource: CMIS (Feb 2009); NAO Major project reports; IAB; Review team analysis
Number of projects sampledAvg. project cost at MG (£m)
Avg. project duration (months)
Latest forecast project duration overrun by Smart / Non-Smart*
143
126
155
0
25
50
75
100
125
150
175
Index of adjusted unit cost (Forecast at Main Gate50 = 128)
20 155 31
291,157
57
Latest forecast project cost overrunby Smart / Non-Smart*
49748 46
3313429
5893053
9164244
MainGate
InitialGate
All ‘mature’projects
Smart Non-Smart All ‘mature’projects
Smart Non-Smart
180173
184
0
25
50
75
100
125
150
175
200
Index of project duration (Forecast at Main Gate50 = 155)
MainGate
InitialGate
Figure �F-15: Project duration and cost overrun for projects post Main Gate by Smart/Non-Smart (over 75% complete)
175 Non-Smart projects include projects post 1999 deemed to have followed non-Smart principles, e.g., follow on buys of non-Smart projects
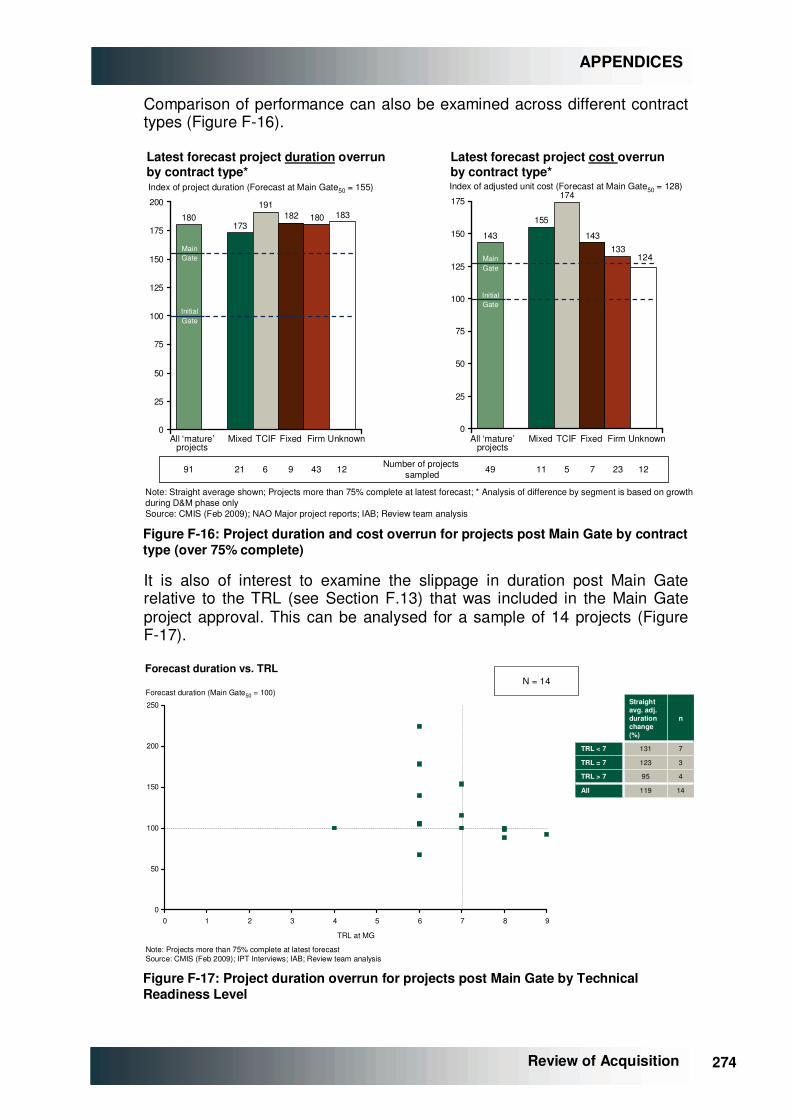
274 274
APPENDICES
Review of Acquisition
Comparison of performance can also be examined across different contract types (Figure �F-16).
Note: Straight average shown; Projects more than 75% complete at latest forecast; * Analysis of difference by segment is based on growth during D&M phase onlySource: CMIS (Feb 2009); NAO Major project reports; IAB; Review team analysis
180173
191182 180 183
0
25
50
75
100
125
150
175
200
Index of project duration (Forecast at Main Gate50 = 155)
Latest forecast project duration overrunby contract type*
Latest forecast project cost overrunby contract type*
143
155
174
143133
0
25
50
75
100
125
150
175
Index of adjusted unit cost (Forecast at Main Gate50 = 128)
Number of projects sampled21 691 9 43 12
All ‘mature’projects
Mixed TCIF Fixed Firm Unknown
MainGate
InitialGate
All ‘mature’projects
Mixed TCIF Fixed Firm Unknown
11 549 7 23 12
124MainGate
InitialGate
Figure �F-16: Project duration and cost overrun for projects post Main Gate by contract type (over 75% complete)
It is also of interest to examine the slippage in duration post Main Gate relative to the TRL (see Section �F.13) that was included in the Main Gate project approval. This can be analysed for a sample of 14 projects (Figure �F-17).
Note: Projects more than 75% complete at latest forecastSource: CMIS (Feb 2009); IPT Interviews; IAB; Review team analysis
Forecast duration vs. TRLN = 14
495TRL > 7
14
3
7
n
119All
123TRL = 7
131TRL < 7
Straight avg. adj. duration change (%)
495TRL > 7
14
3
7
n
119All
123TRL = 7
131TRL < 7
Straight avg. adj. duration change (%)
0
50
100
150
200
250
0 1 2 3 4 5 6 7 8 9
TRL at MG
Forecast duration (Main Gate50 = 100)
Figure �F-17: Project duration overrun for projects post Main Gate by Technical Readiness Level

275 275
APPENDICES
Review of Acquisition
F.10. End-to-end project performance analysis
In additional to looking at project performance during Assessment phase and Demonstration & Manufacture phase separately it is possible for a smaller subset of projects to examine performance straight through from Initial Gate to latest forecast completion.
Since this is limited to a subset of projects post Main Gate that are over 75% and have Initial Gate Forecasts for both Assessment phase and Demonstration & Manufacture the sample for duration is only 23 projects and for cost it is only 15 projects.
As previously the performance is calculated on a project-by-project basis by dividing the latest forecast, or actual, performance across from Initial Gate to completion by the Initial Gate forecast for Initial Gate to completion. Likewise, the costs are adjusted for capability as before. The results of this analysis, along with the straight average can be seen below (Figure �F-18).
The results should be interpreted with caution, however, as fairly small samples might not be representative of reality overall.
Note: Projects that are 75% complete or greaterSource: IAB; CMIS (Feb 2009)
0
50
100
150
200
250
300
Index (IG = 100)
0
50
100
150
200
250
300
Index (IG = 100)
Duration of IG-ISD relative to IG forecast Adjusted cost of IG-Completion relative to IG forecast
n = 15
Straight av. = 133
n = 23
Straight av. = 149
Projects ranked by Main Gate forecast Demonstration & Manufacture cost (decreasing) Projects ranked by Main Gate forecast Demonstration & Manufacture cost (decreasing)
Figure �F-18: Percentage duration and cost overrun from IG forecast to latest forecast (over 75% complete)
In all instances where a hypothesis has been made the statistical significance has been tested. Two types of tests have been used: The two tailed t-test to test whether a mean of a sample population is statistically significant from a null mean and the one tailed t-test to test the significance of a difference in a specified direction between two means from independent samples with unequal variances.
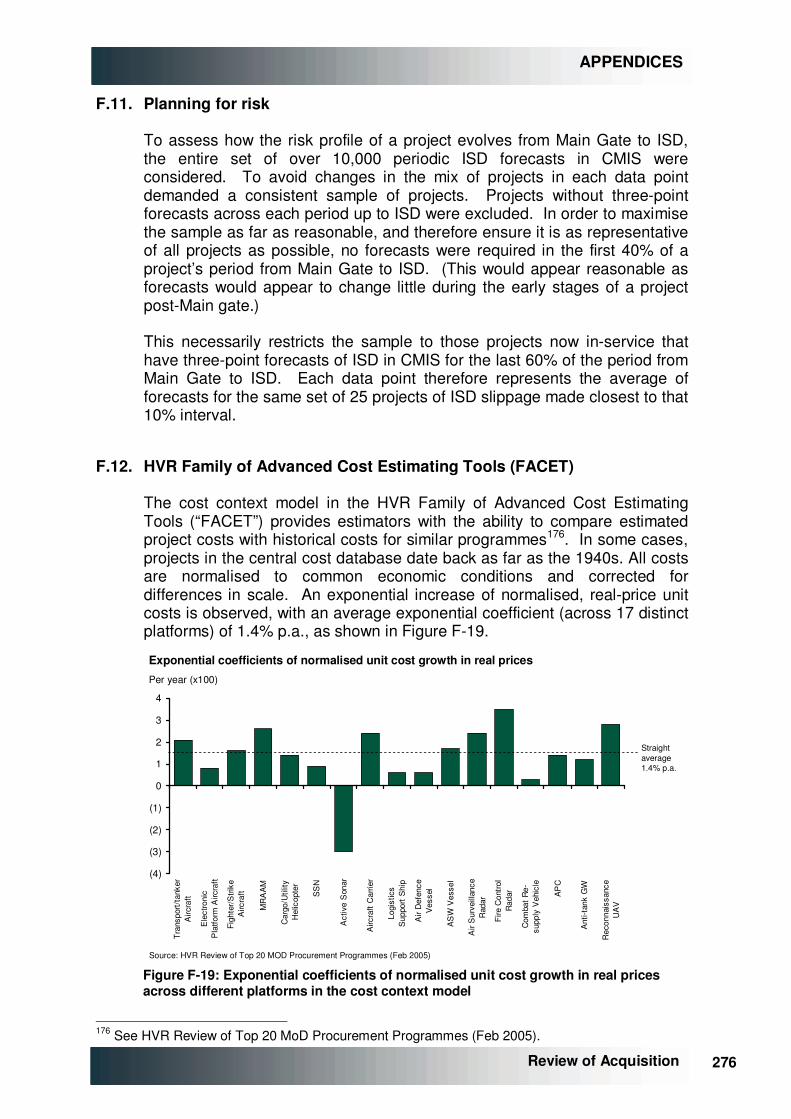
276 276
APPENDICES
Review of Acquisition
F.11. Planning for risk
To assess how the risk profile of a project evolves from Main Gate to ISD, the entire set of over 10,000 periodic ISD forecasts in CMIS were considered. To avoid changes in the mix of projects in each data point demanded a consistent sample of projects. Projects without three-point forecasts across each period up to ISD were excluded. In order to maximise the sample as far as reasonable, and therefore ensure it is as representative of all projects as possible, no forecasts were required in the first 40% of a project’s period from Main Gate to ISD. (This would appear reasonable as forecasts would appear to change little during the early stages of a project post-Main gate.)
This necessarily restricts the sample to those projects now in-service that have three-point forecasts of ISD in CMIS for the last 60% of the period from Main Gate to ISD. Each data point therefore represents the average of forecasts for the same set of 25 projects of ISD slippage made closest to that 10% interval.
F.12. HVR Family of Advanced Cost Estimating Tools (FACET)
The cost context model in the HVR Family of Advanced Cost Estimating Tools (“FACET”) provides estimators with the ability to compare estimated project costs with historical costs for similar programmes176. In some cases, projects in the central cost database date back as far as the 1940s. All costs are normalised to common economic conditions and corrected for differences in scale. An exponential increase of normalised, real-price unit costs is observed, with an average exponential coefficient (across 17 distinct platforms) of 1.4% p.a., as shown in Figure �F-19.
(4)
(3)
(2)
(1)
0
1
2
3
4
Tra
nspo
rt/t
anke
rA
ircra
ft
Ele
ctro
nic
Pla
tform
Airc
raft
Figh
ter/
Stri
keA
ircra
ft
MR
AA
M
Car
go/U
tility
Hel
icop
ter
SS
N
Act
ive
Son
ar
Airc
raft
Car
rier
Logi
stic
sS
uppo
rt S
hip
Air
Def
ence
Ves
sel
AS
W V
esse
l
Air
Sur
veill
ance
Rad
ar
Fire
Con
trol
Rad
ar
Com
bat
Re-
supp
ly V
ehic
le
AP
C
Ant
i-tan
k G
W
Rec
onna
issa
nce
UA
V
Exponential coefficients of normalised unit cost growth in real pricesPer year (x100)
Source: HVR Review of Top 20 MOD Procurement Programmes (Feb 2005)
Straightaverage1.4% p.a.
Figure �F-19: Exponential coefficients of normalised unit cost growth in real prices across different platforms in the cost context model
176 See HVR Review of Top 20 MoD Procurement Programmes (Feb 2005).

277 277
APPENDICES
Review of Acquisition
It has been suggested that an inherent feature of defence equipment means that their costs to increase faster than the rate of inflation observed in the general economy177. The Review team contend that defence inflation is at best a dependent variable, being the result of behaviours in the defence procurement community178.
F.13. Technology Readiness Levels
TRLs are a technology management tool that provides an indication of the technical maturity of a project by identifying risk associated with technology and system integration. They assist in reducing overall project risk and the likelihood of project delay due to immature technology in the Development and Manufacture phases of the acquisition lifecycle. An overview of TRLs is given in Figure �F-20.
TRL1
TRL2
TRL3
TRL4
TRL5
TRL6
TRL7
TRL8
TRL9 Actual Technology system qualified through successful mission operations
Actual Technology system completed and qualified through test and demonstration through successful mission operations
Technology systems prototype demonstrationin an operational environment
Technology system/subsystem model or prototype demonstrationin a relevant environment
Technology component and/or basic technology subsystem validationin a relevant environment
Technology component and/or basic technology subsystem validation in a laboratory environment
Analytical and experimental critical function and/or characteristic proof-of-concept
Technology concept and/or application formulated
Basic principles observed and reportedBasic Technology Research
Research to prove feasibility
Technology development
Technology demonstration
Technology system/ subsystemdevelopment
Technology system test, Qualification and operation
Source: AOF website Figure �F-20: Overview of Technology Readiness Levels
A TRL assessment is useful leading up to a major decision point, with evidence from the assessment supporting a business case. In the case of the MoD:
• at Initial Gate, IPTs need to estimate the programme and resources and required to ensure that technologies will be suitably mature at the end of assessment phase;
177 ‘Is Defence inflation really as high as claimed?’, D. Kirkpatrick, RUSI Defence Systems (Oct 2008) 178 See, for example, ‘Defence Inflation: Reality or Myth’, M Chalmers, J. Dowdy et al., RUSI Defence Systems (Jun 2009)
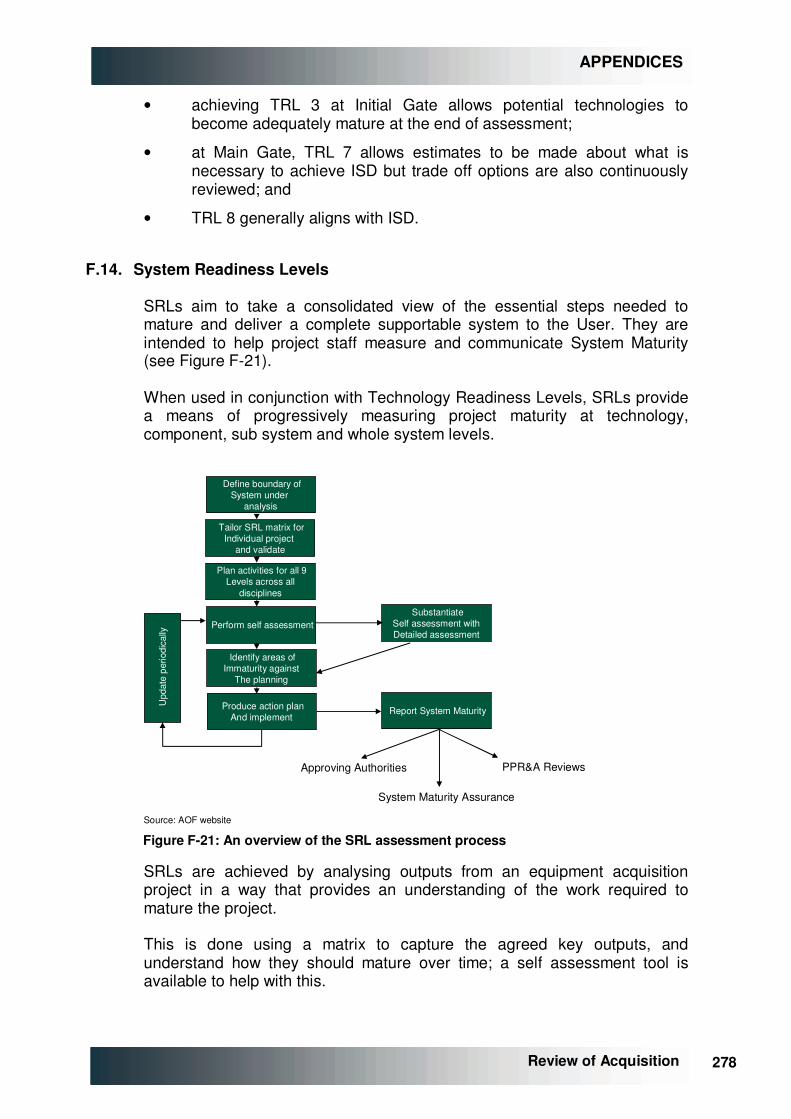
278 278
APPENDICES
Review of Acquisition
• achieving TRL 3 at Initial Gate allows potential technologies to become adequately mature at the end of assessment;
• at Main Gate, TRL 7 allows estimates to be made about what is necessary to achieve ISD but trade off options are also continuously reviewed; and
• TRL 8 generally aligns with ISD.
F.14. System Readiness Levels
SRLs aim to take a consolidated view of the essential steps needed to mature and deliver a complete supportable system to the User. They are intended to help project staff measure and communicate System Maturity (see Figure �F-21).
When used in conjunction with Technology Readiness Levels, SRLs provide a means of progressively measuring project maturity at technology, component, sub system and whole system levels.
Define boundary of
System under analysis
Tailor SRL matrix forIndividual project
and validate
Plan activities for all 9Levels across all
disciplines
Perform self assessment
Identify areas ofImmaturity against
The planning
SubstantiateSelf assessment withDetailed assessment
Report System Maturity
Upd
ate
perio
dica
lly
Produce action planAnd implement
Approving Authorities PPR&A Reviews
System Maturity Assurance
Source: AOF website Figure �F-21: An overview of the SRL assessment process
SRLs are achieved by analysing outputs from an equipment acquisition project in a way that provides an understanding of the work required to mature the project.
This is done using a matrix to capture the agreed key outputs, and understand how they should mature over time; a self assessment tool is available to help with this.
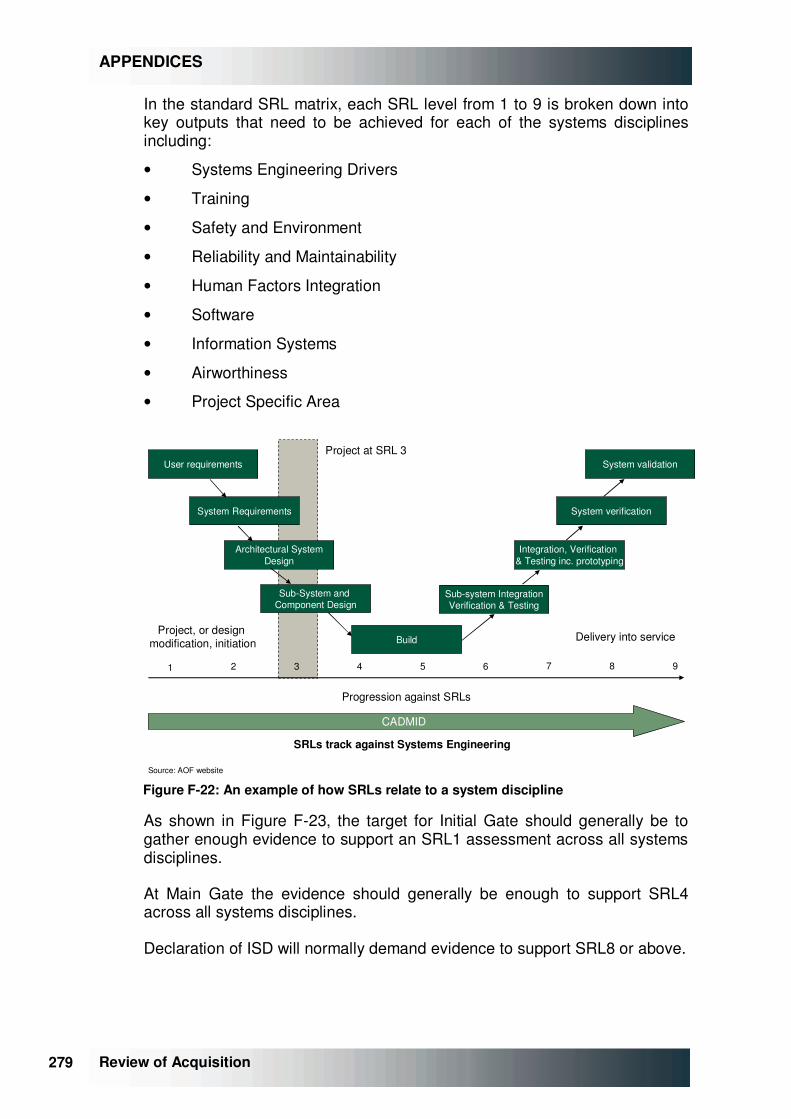
279 279
APPENDICES
Review of Acquisition
In the standard SRL matrix, each SRL level from 1 to 9 is broken down into key outputs that need to be achieved for each of the systems disciplines including:
• Systems Engineering Drivers
• Training
• Safety and Environment
• Reliability and Maintainability
• Human Factors Integration
• Software
• Information Systems
• Airworthiness
• Project Specific Area
User requirements
System Requirements
Architectural SystemDesign
Sub-System and Component Design
Build
Sub-system IntegrationVerification & Testing
Integration, Verification & Testing inc. prototyping
System verification
System validation
1 2 3 4 5 6 7 8 9
Project, or design modification, initiation Delivery into service
Progression against SRLs
Project at SRL 3
CADMID
SRLs track against Systems Engineering
Source: AOF website Figure �F-22: An example of how SRLs relate to a system discipline
As shown in Figure �F-23, the target for Initial Gate should generally be to gather enough evidence to support an SRL1 assessment across all systems disciplines.
At Main Gate the evidence should generally be enough to support SRL4 across all systems disciplines.
Declaration of ISD will normally demand evidence to support SRL8 or above.
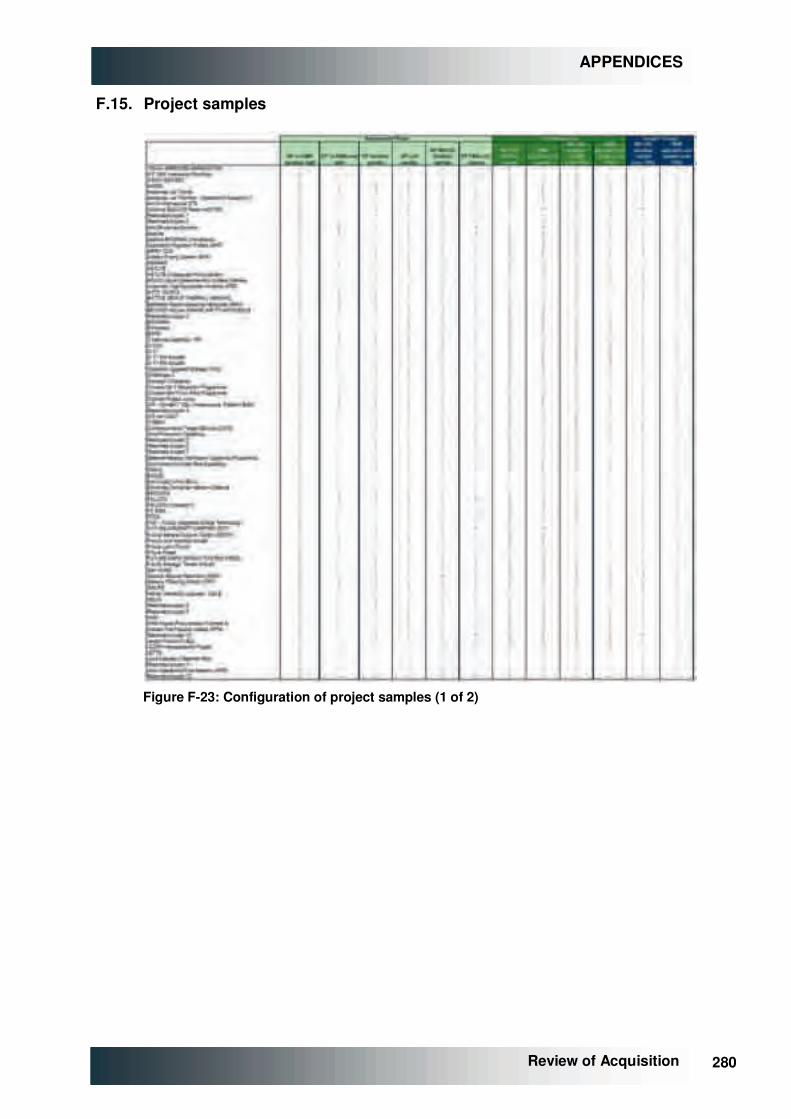
280 280
APPENDICES
Review of Acquisition
F.15. Project samples
Figure �F-23: Configuration of project samples (1 of 2)
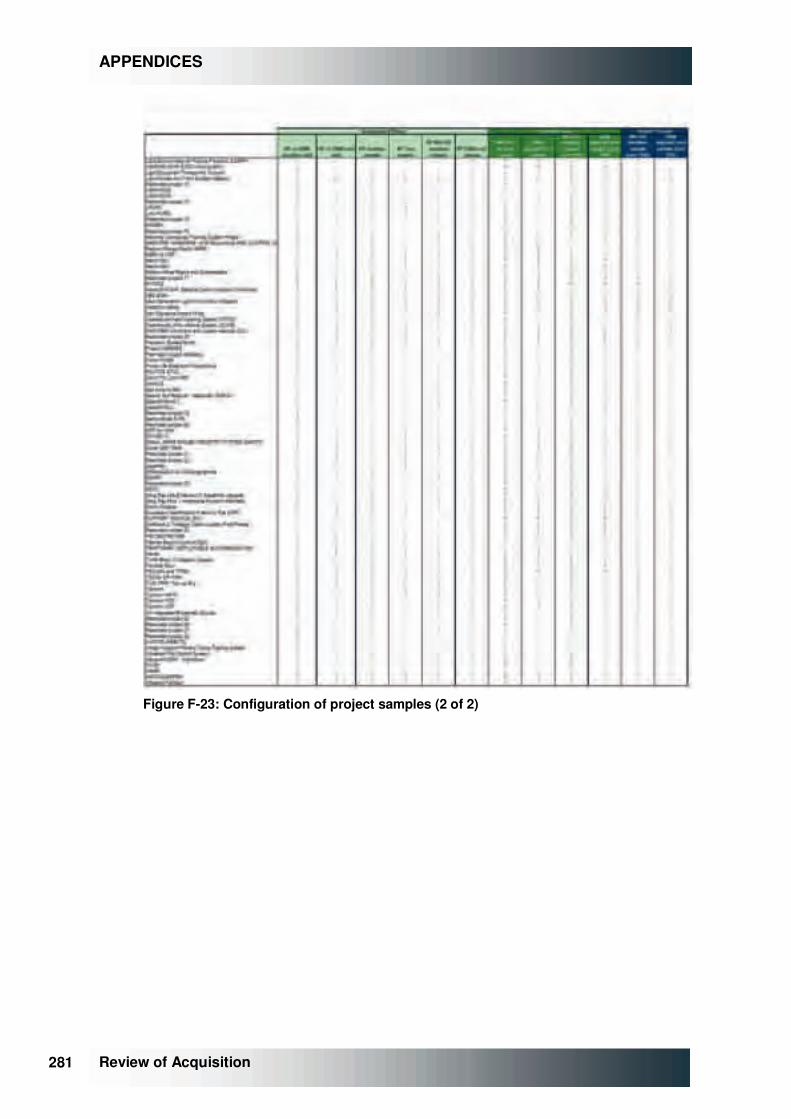
281 281
APPENDICES
Review of Acquisition
Figure �F-23: Configuration of project samples (2 of 2)

282 282
APPENDICES
Review of Acquisition
APPENDIX G. CAPTURING THE FULL COST OF DELAY
G.1. Introduction
The Review team has considered five major areas where delays in delivery of new equipment lead to additional costs and have a significant consequence for the “productive Defence output” available from the MoD:
• unproductive output embedded in the equipment programme (“unproductive project costs”) – captured by MoD reporting through NAO and management information on CMIS;
• industry costs (“Hidden industry cost”) – invisible to the MoD;
• opportunity costs arising from gaps in capability (“Potential capability gap costs”) – invisible until realised;
• support costs for existing equipment (“Run on equipment costs”) – not tracked, other than through the NAO Major Projects Report; and
• project costs arising outside the project budget (“Other direct project costs”) – overall level tracked by MoD in aggregate, but not in relation to specific projects so no good idea of “efficient level”.
These costs arise across a number of budget areas (primarily DE&S in-year, Capability Sponsor and FLCs beyond year 0). Although “caused” by the equipment procurement programme (c.£6bn near cash), the base on which they apply is debatable, and they could be applicable against a wider MoD budget given significant support and non-cash impacts179.
The Review team has estimated these costs in ranges as shown in Table �G-1. The significant ranges arise because the costs are neither simple to identify nor generalise. In either high or low case, the Review team believes that the majority of cost of delay is borne in the EPP in the form of “unproductive project costs”.
179 Cost of capital (i.e., non-cash) component of unproductive project costs could be considered against Government spending – funding costs arise at central government level (notional 3.5% charge on capital only levied against MoD)
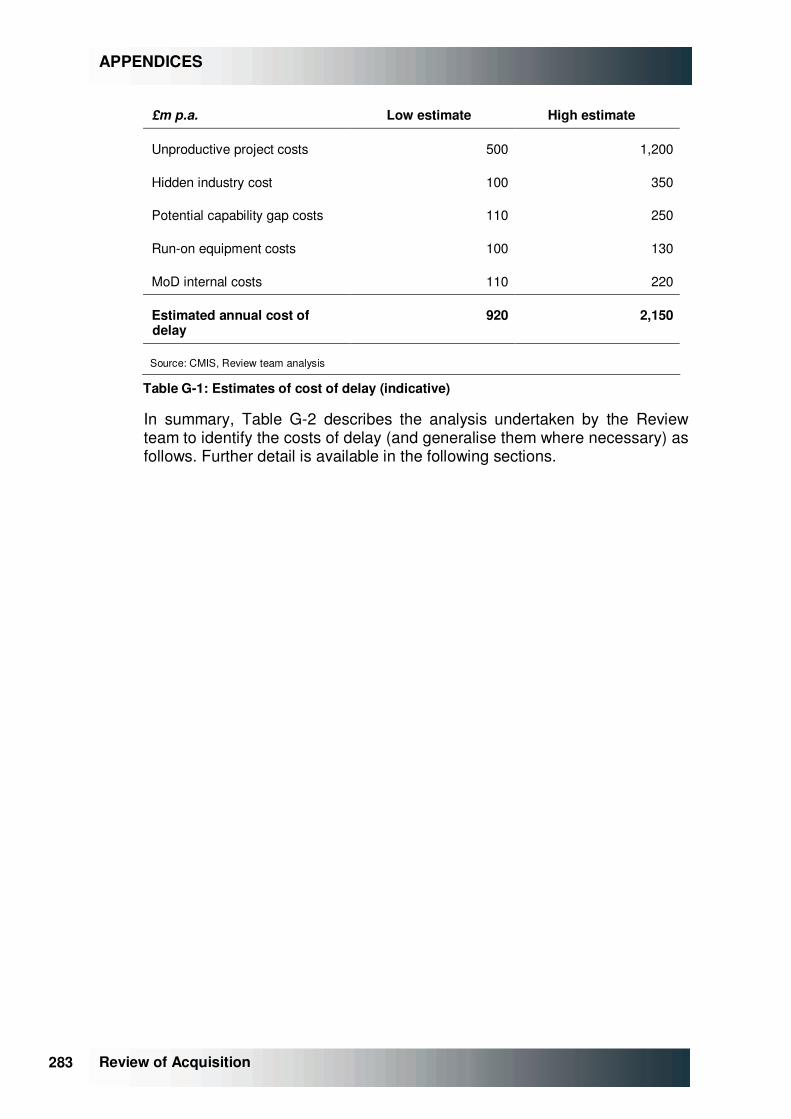
283 283
APPENDICES
Review of Acquisition
£m p.a. Low estimate High estimate
Unproductive project costs 500 1,200
Hidden industry cost 100 350
Potential capability gap costs 110 250
Run-on equipment costs 100 130
MoD internal costs 110 220
Estimated annual cost of delay
920 2,150
Source: CMIS, Review team analysis
Table �G-1: Estimates of cost of delay (indicative)
In summary, Table �G-2 describes the analysis undertaken by the Review team to identify the costs of delay (and generalise them where necessary) as follows. Further detail is available in the following sections.
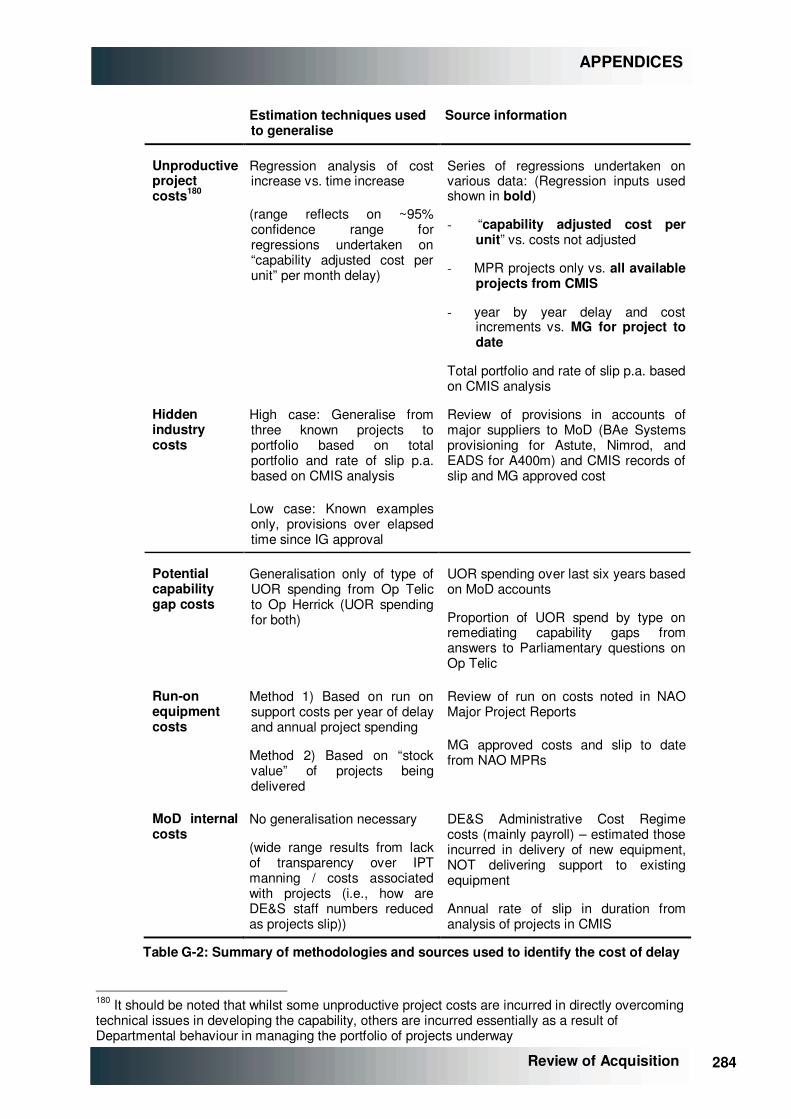
284 284
APPENDICES
Review of Acquisition
Estimation techniques used to generalise
Source information
Unproductive project costs180
Regression analysis of cost increase vs. time increase
(range reflects on ~95% confidence range for regressions undertaken on “capability adjusted cost per unit” per month delay)
Series of regressions undertaken on various data: (Regression inputs used shown in bold)
- “capability adjusted cost per unit” vs. costs not adjusted
- MPR projects only vs. all available projects from CMIS
- year by year delay and cost increments vs. MG for project to date
Total portfolio and rate of slip p.a. based on CMIS analysis
Hidden industry costs
High case: Generalise from three known projects to portfolio based on total portfolio and rate of slip p.a. based on CMIS analysis
Low case: Known examples only, provisions over elapsed time since IG approval
Review of provisions in accounts of major suppliers to MoD (BAe Systems provisioning for Astute, Nimrod, and EADS for A400m) and CMIS records of slip and MG approved cost
Potential capability gap costs
Generalisation only of type of UOR spending from Op Telic to Op Herrick (UOR spending for both)
UOR spending over last six years based on MoD accounts
Proportion of UOR spend by type on remediating capability gaps from answers to Parliamentary questions on Op Telic
Run-on equipment costs
Method 1) Based on run on support costs per year of delay and annual project spending
Method 2) Based on “stock value” of projects being delivered
Review of run on costs noted in NAO Major Project Reports
MG approved costs and slip to date from NAO MPRs
MoD internal costs
No generalisation necessary
(wide range results from lack of transparency over IPT manning / costs associated with projects (i.e., how are DE&S staff numbers reduced as projects slip))
DE&S Administrative Cost Regime costs (mainly payroll) – estimated those incurred in delivery of new equipment, NOT delivering support to existing equipment
Annual rate of slip in duration from analysis of projects in CMIS
Table �G-2: Summary of methodologies and sources used to identify the cost of delay
180 It should be noted that whilst some unproductive project costs are incurred in directly overcoming technical issues in developing the capability, others are incurred essentially as a result of Departmental behaviour in managing the portfolio of projects underway

285 285
APPENDICES
Review of Acquisition
G.2. Unproductive project costs
The Review has endeavoured to estimate the scale of cost associated with delays in the Equipment Programme.
Unproductive project costs are the direct and indirect costs captured within the budget for the particular project, for example, those arising from contract re-negotiation (direct) or changes to the cost of capital charge (indirect).
Considering only projects that are pre-ISD181 where a forecast of adjusted cost overrun has been determined, as shown in Figure �G-1, suggests a relationship between percentage cost overrun182 relative to MG50 approved cost and ISD slippage (in months).
Latest forecast of adjusted cost overrun and ISD slippage for pre-ISD projects
Note: * Standard errorSource: NAO Major Projects Reports; CMIS (February 2009)
0 20 40 60 80 100
Latest forecast ISD slippage since MG (months)
0
100
120
20
40
60
80
(20)
(40)
Latest forecast adjusted cost overrun since MG (%)
Gradient = 0.51 ± 0.10* %/month
n 29R-sq 47.4%t-stat(s) 5.0t-test @ 95% 2.0
Figure �G-1: Latest forecast of adjusted cost overrun and ISD slippage for pre-ISD projects since Main Gate
Regression indicates that:
• cost to the MoD increases at c.0.5% of MG approved cost per month of delay. Statistically, it is possible to say with c.95% confidence that the cost of delay per month is in the range 0.3% – 0.7% of MG approved cost per month of delay; and
• forecast adjusted cost overruns not associated with forecast ISD slippages (i.e., the intercept of the line in Figure �G-1) are statistically not different from zero at 95% probability. Therefore, it can statistically stated that cost overruns are generally associated with delay, and do not generally arise independent of delay.
181 In-service projects are excluded to avoid the influence of cost overruns declared where there can by definition be no slippage of ISD 182 Assessed as per unit costs, adjusted for capability
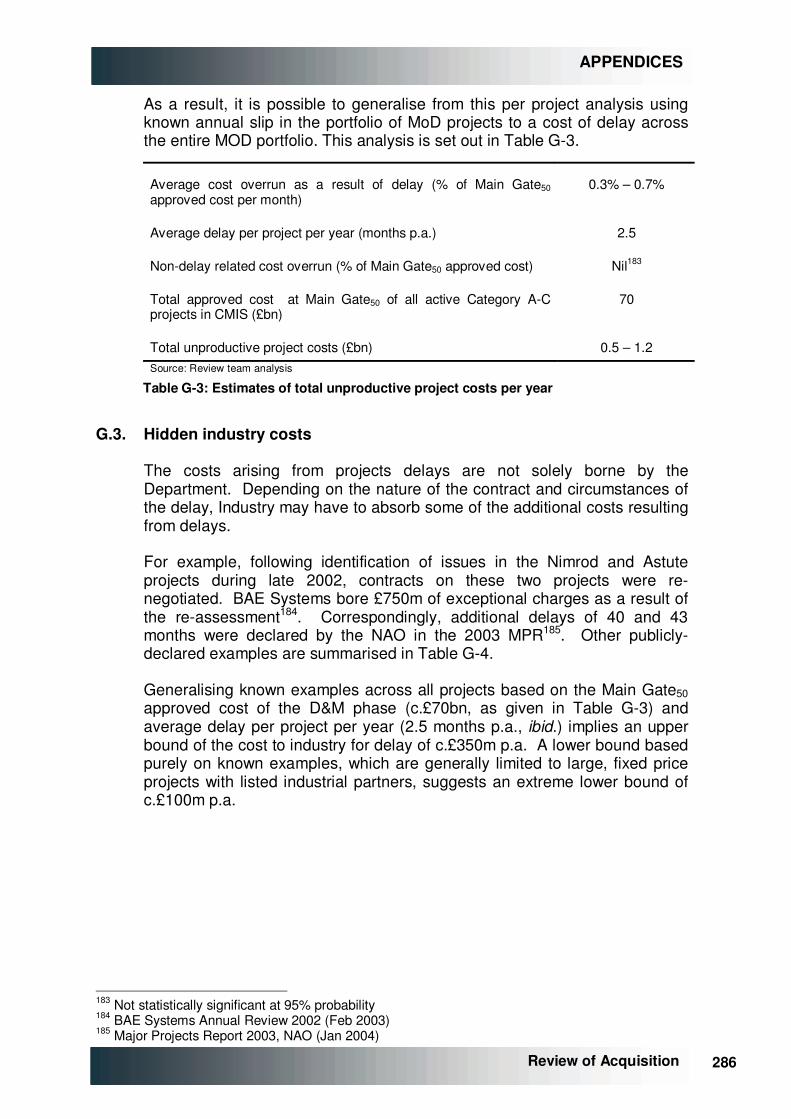
286 286
APPENDICES
Review of Acquisition
As a result, it is possible to generalise from this per project analysis using known annual slip in the portfolio of MoD projects to a cost of delay across the entire MOD portfolio. This analysis is set out in Table �G-3.
Average cost overrun as a result of delay (% of Main Gate50 approved cost per month)
0.3% – 0.7%
Average delay per project per year (months p.a.) 2.5
Non-delay related cost overrun (% of Main Gate50 approved cost) Nil183
Total approved cost at Main Gate50 of all active Category A-C projects in CMIS (£bn)
70
Total unproductive project costs (£bn) 0.5 – 1.2 Source: Review team analysis
Table �G-3: Estimates of total unproductive project costs per year
G.3. Hidden industry costs
The costs arising from projects delays are not solely borne by the Department. Depending on the nature of the contract and circumstances of the delay, Industry may have to absorb some of the additional costs resulting from delays.
For example, following identification of issues in the Nimrod and Astute projects during late 2002, contracts on these two projects were re-negotiated. BAE Systems bore £750m of exceptional charges as a result of the re-assessment184. Correspondingly, additional delays of 40 and 43 months were declared by the NAO in the 2003 MPR185. Other publicly-declared examples are summarised in Table �G-4.
Generalising known examples across all projects based on the Main Gate50 approved cost of the D&M phase (c.£70bn, as given in Table �G-3) and average delay per project per year (2.5 months p.a., ibid.) implies an upper bound of the cost to industry for delay of c.£350m p.a. A lower bound based purely on known examples, which are generally limited to large, fixed price projects with listed industrial partners, suggests an extreme lower bound of c.£100m p.a.
183 Not statistically significant at 95% probability 184 BAE Systems Annual Review 2002 (Feb 2003) 185 Major Projects Report 2003, NAO (Jan 2004)

287 287
APPENDICES
Review of Acquisition
Project
Manufacture phase
contract
Latest forecast
delay
Estimated cost to industry
(% of MG50 forecast)
Cost per month of delay as % of
MG50
Nimrod MRA4
Fixed / TCIF 92 months £800m (28%) 0.3%
Astute Fixed / TCIF 57 months £250m (10%) 0.2%
A400m Fixed 50 - 100 months186
c.£200m187 (8%) 0.1%
Average 0.2%
Source: CMIS; Company annual reports; Press; Review teams
Table �G-4: Examples of hidden industry costs arising from delay
G.4. Potential capability gap costs
There is an opportunity cost associated with project delay to meet the ‘capability gap’. ‘Spot markets’ may have to be accessed to rapidly fulfil operational requirements. Specific examples are given in Figure �G-2.
� Capability gap in strategic airlift prior to the availability of the planned replacement A400(M) aircraft primarily caused by the retirement of the C130(K) fleet and compounded by ongoing operations in landlockedAfghanistan and delays to FSTA programme*
� A C-17 military off-the-shelf (MOTS) solution extended from Boeing and the USAF (aircraft 5 & 6)
A400(M)
Watchkeeper� Aerial surveillance capability required for operations in Afghanistan and Iraq
� UOR purchase of Hermes 450 in June 2007 prior to introduction ofWatchkeeper
Note: * FTSA – air to air refuelling tanker which has some airlift capabilitySource: Review team interviews; MoD press releases; Press articles; Oanda; CMIS (February 2009); US DSCA
Terrier� More heavily armoured high mobility excavator required to support
operations in Afghanistan
� UOR purchase of 13 JCBs in October 2008 to replace the retiring CET fleet, but prior to introduction of delayed Terriers
Situation Cost
� c.£260m
� ~£55m
� £6.2m, excl. modification cost
FRES� Protected patrol capability (due to be provided by delayed FRES programme)
urgently required for operations in Afghanistan
� Initial UOR order of 108 Mastiff vehicles started entering service in December 2006, further 174 ordered with c.130 delivered to July 2009
� c.£200m(estimated within a wider package of protected mobility)
Figure �G-2: Examples of “opportunity costs” associated with capability gaps caused by delay
186 Approximate range based on press commentary since the 24 month delay reported in NAO’s 2008 Major Projects Report. MoD’s own estimate remains commercially sensitive at this stage 187 UK share based on order of 25 aircraft
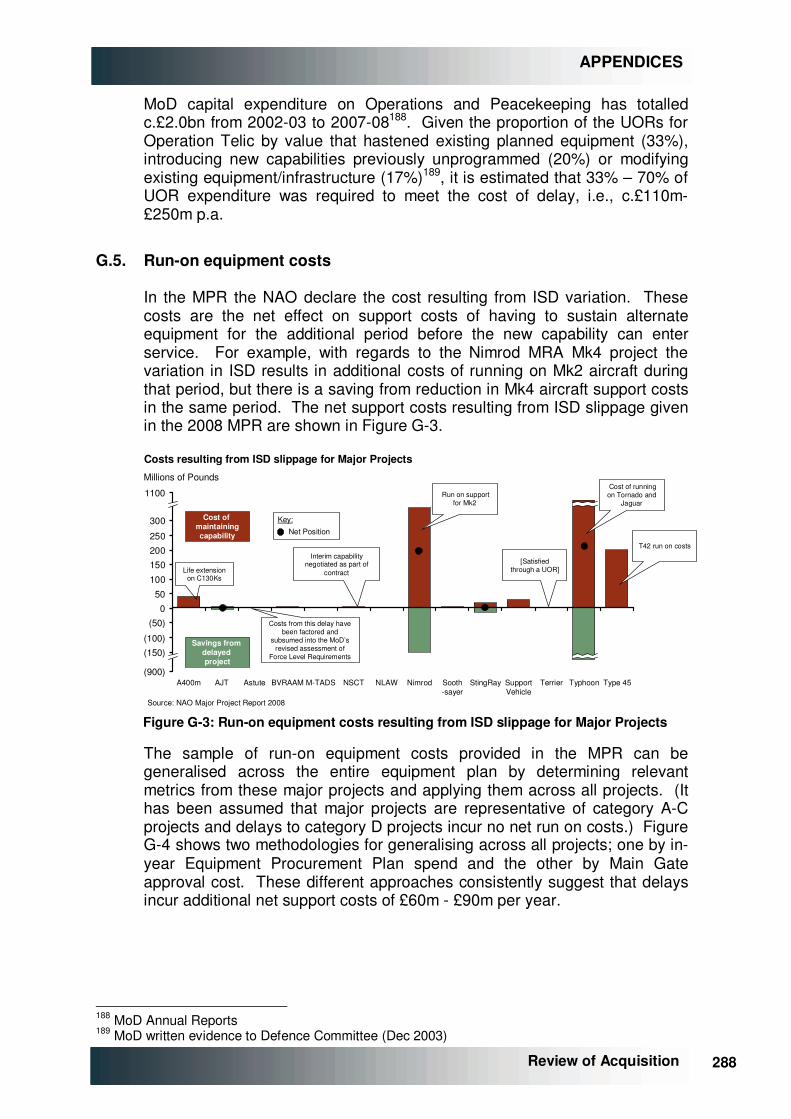
288 288
APPENDICES
Review of Acquisition
MoD capital expenditure on Operations and Peacekeeping has totalled c.£2.0bn from 2002-03 to 2007-08188. Given the proportion of the UORs for Operation Telic by value that hastened existing planned equipment (33%), introducing new capabilities previously unprogrammed (20%) or modifying existing equipment/infrastructure (17%)189, it is estimated that 33% – 70% of UOR expenditure was required to meet the cost of delay, i.e., c.£110m-£250m p.a.
G.5. Run-on equipment costs
In the MPR the NAO declare the cost resulting from ISD variation. These costs are the net effect on support costs of having to sustain alternate equipment for the additional period before the new capability can enter service. For example, with regards to the Nimrod MRA Mk4 project the variation in ISD results in additional costs of running on Mk2 aircraft during that period, but there is a saving from reduction in Mk4 aircraft support costs in the same period. The net support costs resulting from ISD slippage given in the 2008 MPR are shown in Figure �G-3.
BVRAAM
(150)
(50)
(900)
Millions of Pounds
A400m
(100)
AJT Astute M-TADS NSCT NLAW Nimrod Sooth-sayer
StingRay Support Vehicle
Terrier Typhoon Type 45
0
1100
100
150200250
300
50
Cost of maintainingcapability
Source: NAO Major Project Report 2008
Costs resulting from ISD slippage for Major Projects
[Satisfied through a UOR]
Interim capability negotiated as part of
contract
Run on support for Mk2
Cost of running on Tornado and
Jaguar
Savings from delayed project
Life extension on C130Ks
T42 run on costs
Costs from this delay have been factored and
subsumed into the MoD’s revised assessment of
Force Level Requirements
Net Position
Key:
Figure �G-3: Run-on equipment costs resulting from ISD slippage for Major Projects
The sample of run-on equipment costs provided in the MPR can be generalised across the entire equipment plan by determining relevant metrics from these major projects and applying them across all projects. (It has been assumed that major projects are representative of category A-C projects and delays to category D projects incur no net run on costs.) Figure �G-4 shows two methodologies for generalising across all projects; one by in-year Equipment Procurement Plan spend and the other by Main Gate approval cost. These different approaches consistently suggest that delays incur additional net support costs of £60m - £90m per year.
188 MoD Annual Reports 189 MoD written evidence to Defence Committee (Dec 2003)
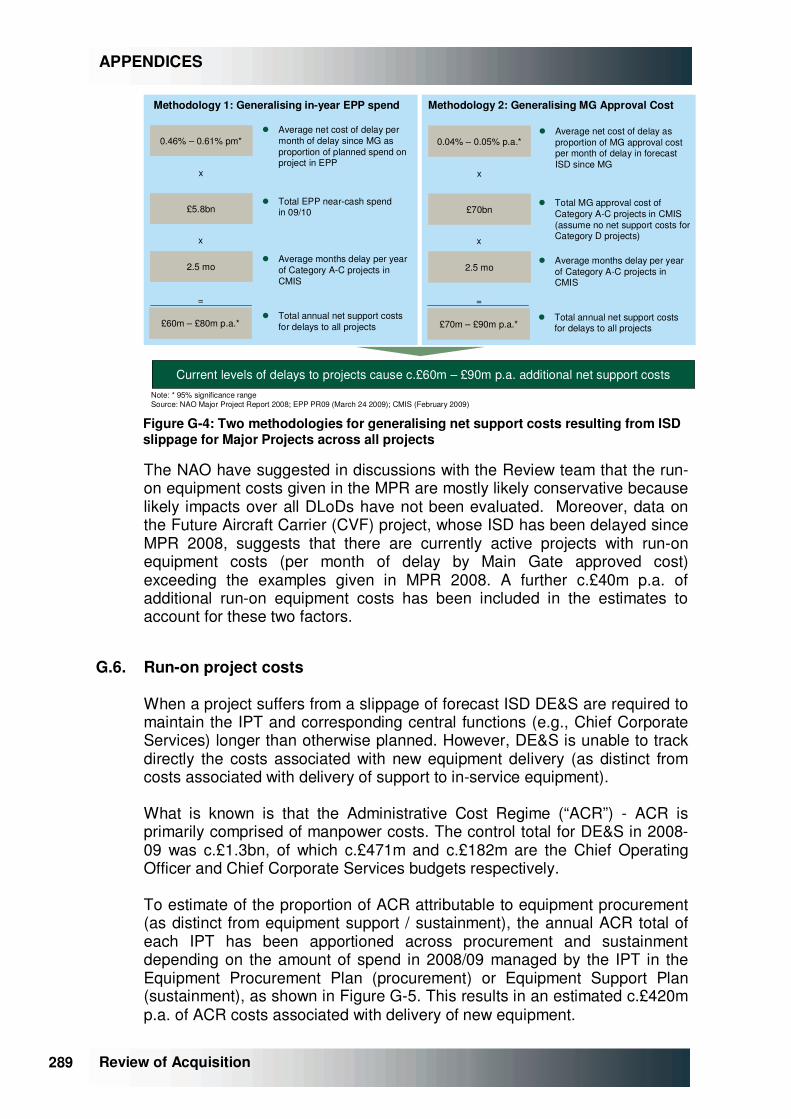
289 289
APPENDICES
Review of Acquisition
� Average net cost of delay as proportion of MG approval cost per month of delay in forecast ISD since MG
0.04% – 0.05% p.a.*
£70bn
2.5 mo
� Total MG approval cost of Category A-C projects in CMIS(assume no net support costs for Category D projects)
� Average months delay per year of Category A-C projects in CMIS
x
x
=
£70m – £90m p.a.*� Total annual net support costs
for delays to all projects
Note: * 95% significance rangeSource: NAO Major Project Report 2008; EPP PR09 (March 24 2009); CMIS (February 2009)
0.46% – 0.61% pm*
£5.8bn
2.5 mo
x
x
=
£60m – £80m p.a.*
� Average net cost of delay per month of delay since MG as proportion of planned spend on project in EPP
� Total EPP near-cash spend in 09/10
� Average months delay per year of Category A-C projects in CMIS
� Total annual net support costs for delays to all projects
Methodology 2: Generalising MG Approval CostMethodology 1: Generalising in-year EPP spend
Current levels of delays to projects cause c.£60m – £90m p.a. additional net support costs
Figure �G-4: Two methodologies for generalising net support costs resulting from ISD slippage for Major Projects across all projects
The NAO have suggested in discussions with the Review team that the run-on equipment costs given in the MPR are mostly likely conservative because likely impacts over all DLoDs have not been evaluated. Moreover, data on the Future Aircraft Carrier (CVF) project, whose ISD has been delayed since MPR 2008, suggests that there are currently active projects with run-on equipment costs (per month of delay by Main Gate approved cost) exceeding the examples given in MPR 2008. A further c.£40m p.a. of additional run-on equipment costs has been included in the estimates to account for these two factors.
G.6. Run-on project costs
When a project suffers from a slippage of forecast ISD DE&S are required to maintain the IPT and corresponding central functions (e.g., Chief Corporate Services) longer than otherwise planned. However, DE&S is unable to track directly the costs associated with new equipment delivery (as distinct from costs associated with delivery of support to in-service equipment).
What is known is that the Administrative Cost Regime (“ACR”) - ACR is primarily comprised of manpower costs. The control total for DE&S in 2008-09 was c.£1.3bn, of which c.£471m and c.£182m are the Chief Operating Officer and Chief Corporate Services budgets respectively.
To estimate of the proportion of ACR attributable to equipment procurement (as distinct from equipment support / sustainment), the annual ACR total of each IPT has been apportioned across procurement and sustainment depending on the amount of spend in 2008/09 managed by the IPT in the Equipment Procurement Plan (procurement) or Equipment Support Plan (sustainment), as shown in Figure �G-5. This results in an estimated c.£420m p.a. of ACR costs associated with delivery of new equipment.
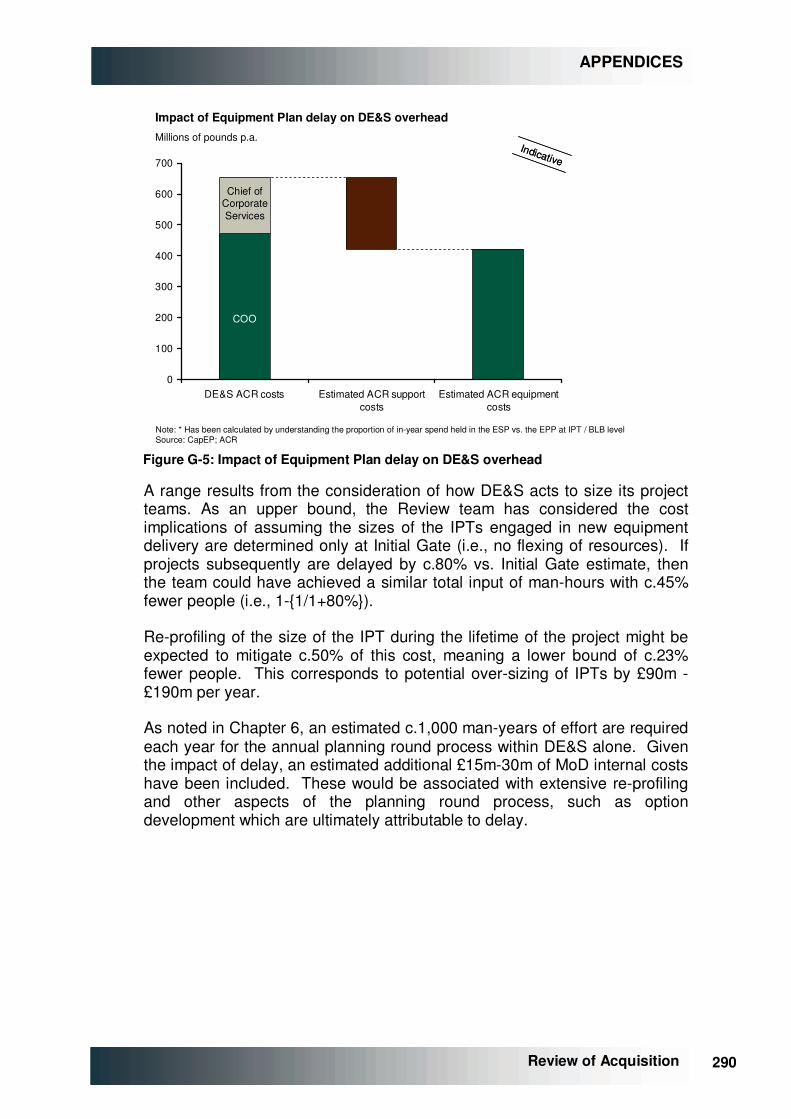
290 290
APPENDICES
Review of Acquisition
Impact of Equipment Plan delay on DE&S overhead
Note: * Has been calculated by understanding the proportion of in-year spend held in the ESP vs. the EPP at IPT / BLB levelSource: CapEP; ACR
IndicativeIndicative
0
100
200
300
400
500
600
700
DE&S ACR costs Estimated ACR supportcosts
Estimated ACR equipmentcosts
Millions of pounds p.a.
COO
Chief ofCorporateServices
Figure �G-5: Impact of Equipment Plan delay on DE&S overhead
A range results from the consideration of how DE&S acts to size its project teams. As an upper bound, the Review team has considered the cost implications of assuming the sizes of the IPTs engaged in new equipment delivery are determined only at Initial Gate (i.e., no flexing of resources). If projects subsequently are delayed by c.80% vs. Initial Gate estimate, then the team could have achieved a similar total input of man-hours with c.45% fewer people (i.e., 1-{1/1+80%}).
Re-profiling of the size of the IPT during the lifetime of the project might be expected to mitigate c.50% of this cost, meaning a lower bound of c.23% fewer people. This corresponds to potential over-sizing of IPTs by £90m - £190m per year.
As noted in Chapter �6, an estimated c.1,000 man-years of effort are required each year for the annual planning round process within DE&S alone. Given the impact of delay, an estimated additional £15m-30m of MoD internal costs have been included. These would be associated with extensive re-profiling and other aspects of the planning round process, such as option development which are ultimately attributable to delay.

291 291
APPENDICES
Review of Acquisition
APPENDIX H. CONTRIBUTORS TO THE REVIEW
The Review team has solicited and considered a range of valuable inputs from a large number of interviews and meetings. These have included over 200 discussions with:
• the Department, including MoD centre, the Capability Sponsor organisation, DE&S and Front Line Commands;
• the Defence industry;
• other UK government departments and public sector bodies;
• defence departments of other nations, in particular the US and France; and
• other relevant commercial organisations.
H.1. MoD interviews Team / Department
Secretary of State
MinSDAR
MinDES
MinAF
Permanent Under Secretary (PUS)
Chief of the Defence Staff (CDS)
2nd Permanent Under Secretary (2nd PUS)
Vice Chief of Defence Staff (VCDS)
Chief of the Naval Staff (CNS)
Chief of the General Staff (CGS)
Chief of the Air Staff (CAS)
Chief of Defence Materiel (CDM)
Chief Scientific Advisor
Defence Board Non Executive Director
Chief Operating Officer (DE&S)
Chief of Staff (DE&S)
DE&S Chief of Materiel – Land
DE&S Chief of Materiel – Fleet
DE&S Chief of Materiel – Air
DE&S Non Executive Director
Deputy Chief Defence Staff (Capability)
Director General Change
Director General Commercial
292 292
APPENDICES
Review of Acquisition
Team / Department
Director General Finance
Director General of Military Operations
Director General Strategy
ACDS Strategy and Plans
Director of Capability Resources
Director Precision Attack
Director of Science and Technology
Director of Science and Technology Operations
Director Scrutiny and Approvals
Director Security Policy
Director Strategy and Resources
DE&S Corporate Approvals and Risk
Head of Capability Improvement
Head of Commercial (MoD)
Head of Industrial Policy (MoD)
Land Command (various)
Navy Command (various)
Air Command (various)
H.2. Other Government and Public Sector interviews Department / Body
Cabinet Office
Her Majesty’s Treasury
Home Office
Department for Business, Enterprise & Regulatory Reform (BERR)
Department for Innovation, Universities and Skills (DIUS)
National Audit Office (NAO)
Nuclear Decommissioning Authority (NDA)
293 293
APPENDICES
Review of Acquisition
H.3. External interviews Company / Organisation
Atkins
Atos Origin
Babcock
BAE Systems
Bechtel
Boeing
British Airways
Defence Manufacturers Association
EADS
Finnmechanica
General Dynamics
National Defence Industries Council
QinetiQ
Rolls-Royce
Serco
Society for British Aerospace Companies
Thales
VT
Furthermore, the team would like to thank all participants in the extensive DE&S interview programme and workshops at Abbey Wood. The interview programme covered a wide range of IPTs across all eight clusters under COO. In addition, a number of meetings were conducted with staff in parts of DE&S that do not fall under COO’s control including D Finance, the Defence Storage and Distribution Agency, Joint Support Chain, ISS and Commercial.
294 294
APPENDICES
Review of Acquisition
APPENDIX I. GLOSSARY OF ACRONYMS
Acronym Meaning ACAT Acquisition Categories (USA) ACR Administrative Cost Regime ALM Air & Littoral Manoeuvre AME Annually Managed Expenditure AOF Acquisition Operating Framework AP Assessment Phase AWE Above Water Effects (capability area) or Atomic Weapons Establishment BFPO British Forces Post Office BM Battlespace Manoeuvre BSG Business Support Group BoS Board of Supervisors CADMID Concept – Assessment – Demonstration – Manufacture – In-service – Disposal CAGR Compound Annual Growth Rate CapEP Capability Equipment Plan CAPR Corporate Analysis Performance and Risk CAAS Cost Analysis and Assurance Services CAS Cost Assurance Service CBRN Chemical, Biological, Radiological & Nuclear CCII Command Control & Information Infrastructure CCR Commitment Control Regime CDEL Capital Departmental Expenditure Limit CDM Chief of Defence Materiel CDS Chief of the Defence Staff CfA Contracting for Availability CfC Contracting for Capability CLS Contractor Logistic Support CMIS Corporate Management Information System CMG Capability Management Group CoM Chief of Materiel COO Chief Operating Officer CoS Chief of Staff CPG Capability Planning Group CS Capability Sponsor CSA Chief Scientific Adviser CSR Comprehensive Spending Review CST Corporate Science & Technology CT Control Total CVF Future Aircraft Carrier DACP Defence Acquisition Change Programme DAES Directorate of Analysis, Experimentation and Simulation DB Defence Board DCD Defence Commercial Director. Now DGD Commercial DCDS(C) Deputy Chief of Defence Staff (Capability) DCDS(EC) Deputy Chief of Defence Staff (Equipment Capability). Now DCDS(Capability) DCLS Director Central Legal Services DCP Defence Change Portfolio DE&S Defence Equipment & Support DEC Director of Equipment Capability DEL Departmental Expenditure Limit DESIB Defence Equipment & Support Investment Board DET Deterrent DGA Délégation générale pour l’armement (France)
295 295
APPENDICES
Review of Acquisition
Acronym Meaning DGE Director General Equipment DIET Defence Inventory Effective Transformation DII Defence Information Infrastructure DIS Defence Industrial Strategy DLO Defence Logistics Organisation DLoD Defence Lines of Development DLTP Defence Logistics Transformation Programme D&M Demonstration and Manufacture DMO Defence Materiel Organisation (Australia) DoD Department of Defence (USA/Australia) DPA Defence Procurement Agency DRDEL Direct Resource Departmental Expenditure Limit DSA Disposal Services Authority DSACS DE&S Stock Accounting Collation Systems DSCOM Defence Supply Chain Operations and Movements DSDA Defence Storage and Distribution Agency DSPG Defence Strategy & Plans Group DSTL Defence Science Technology Laboratory DTA Deep Target Attack DTS Defence Technology Strategy DVfA Defence Values for Acquisition EAC Enabling Acquisition Change ECC Equipment Capability Customer ELS Expeditionary Logistics & Support EP Equipment Plan (i.e., EPP + ESP) EPP Equipment Procurement Plan ESP Equipment Support Plan FACET Family of Advanced Cost Estimating Tools FCO Foreign and Commonwealth Office FDSCi Future Defence Supply Chain Initiative FFB Fit For Business FLC Front Line Command FOC Full Operating Capability FSTA Future Strategic Tanker Aircraft GAO Government Accountability Office (USA) GM Ground Manoeuvre Go-Co Government Owned – Contractor Operated HoC Head of Capability HMT Her Majesty's Treasury IAB Investment Approvals Board IBA International Business Agreement IG Initial Gate IOC Initial Operating Capability IPG Integrated Provider Group IPT Integrated Project Team IRDEL Indirect Resource Departmental Expenditure Limit IS Information Superiority ISD In-Service Date ISS Information Systems and Services ISTAR Intelligence, Surveillance, Target Acquisition & Reconnaissance JBA Joint Business Agreement JCB Joint Capabilities Board JSC Joint Support Chain KPI Key Performance Indicator LPM Loi de Programmation Militaire (France) MCP Maritime Change Programme

296 296
APPENDICES
Review of Acquisition
Acronym Meaning MG Main Gate MoD Ministry of Defence MOTS Military off-the-shelf MPR Major Project Report NAO National Audit Office NB Naval Bases NDA Nuclear Decommissioning Authority NDIC National Defence Industries Council NDPB Non-Departmental Public Bodies NEC Network Enabled Capability NEIP Non Equipment Investment Plan NNL National Nuclear Laboratories NPL National Physical Laboratories NPV Net Present Value NTE Not To Exceed OCCAR Organisation Conjointe de Coopération en matière d'ARmement OEP Operational Efficiency Programme OGC Office of Government Commerce PA Precision Attack PAC Public Accounts Committee PACE Performance Agility Confidence Efficiency PB Programme Boards PB&F Planning Budgeting and Forecasting accounting system PBO Parent Body Organisation PE Procurement Executive PFI Private Finance Initiative PPP Public Private Partnership PPR&A Project Performance & Assurance PPSG Policy and Programmes Steering Group PR Planning Round (typically followed by year in which conducted, e.g., PR09) PWGSC Public Works and Government Services Canada (Canada) PUS Permanent Under Secretary QDR Quadrennial Defence Review (USA) RDEL Resource Departmental Expenditure Limit SCS Supply Chain Support SDR Strategic Defence Review Sec(EC) Secretariat for Equipment Capability SIT Science Innovation Technology SP Special Projects (Counter-terrorism & Special Forces) SRL System Readiness Level SRO Senior Responsible Owner STP Short Term Plan TA Theatre Airspace TLB Top Level Budget TLCM Through Life Capability Management TOBA Terms of Business Agreement TRL Technology Readiness Level UOR Urgent Operational Requirement UWE Under Water Effects VCDS Vice Chief of Defence Staff

297 Review of Acquisition
© Bernard Gray 2009


![IMMEDIATE Ministry of Defence [Acquisition Wing ... Make-II Procedure.pdfIMMEDIATE Ministry of Defence [Acquisition Wing Secretariat] Subject: Amendment to Defence Procurement Procedure](https://img.pdfslide.net/doc/110x75/5f0aea3d7e708231d42df762/immediate-ministry-of-defence-acquisition-wing-make-ii-immediate-ministry-of.jpg)