Embed Size (px)
Citation preview

A PEL Company
REPORT
REVIEW OF AIR QUALITY ASSESSMENT ISSUES FOR
POULTRY OPERATIONS IN QUEENSLAND
DEEDI
Job No: 5324
10 January 2011

5324 Summary Report for Consultation ii
REVIEW OF AIR QUALITY ASSESSMENT ISSUES FOR POULTRY OPERATIONS IN QUEENSLAND
DEEDI | PAEHolmes Job 5324
PROJECT TITLE: REVIEW OF AIR QUALITY ASSESSMENT
ISSUES FOR POULTRY OPERATIONS IN
QUEENSLAND
JOB NUMBER: 5324
PREPARED FOR: DEEDI
PREPARED BY: Robin Ormerod
APPROVED FOR RELEASE: Robin Ormerod
DISCLAIMER & COPYRIGHT: This report is subject to the copyright
statement located at www.paeholmes.com ©
Queensland Environment Pty Ltd trading as
PAEHolmes ABN 86 127 101 642
DOCUMENT CONTROL
VERSION DATE PREPARED BY REVIEWED BY
01 10.01.11 Robin Ormerod G Galvin
Queensland Environment Pty Ltd trading as
PAEHolmes ABN 86 127 101 642
BRISBANE:
Level 1, La Melba, 59 Melbourne Street South Brisbane Qld 4101
PO Box 3306 South Brisbane Qld 4101
Ph: +61 7 3004 6400
Fax: +61 7 3844 5858
SYDNEY
ADELAIDE
PERTH
Email: [email protected]
Website: www.paeholmes.com

5324 Summary Report for Consultation iii
REVIEW OF AIR QUALITY ASSESSMENT ISSUES FOR POULTRY OPERATIONS IN QUEENSLAND
DEEDI | PAEHolmes Job 5324
DISCLAIMER
PAEHolmes acts in all professional matters as a faithful advisor to the Client and exercises all
reasonable skill and care in the provision of its professional services.
Reports are commissioned by and prepared for the exclusive use of the Client. They are subject
to and issued in accordance with the agreement between the Client and PAEHolmes. PAEHolmes
is not responsible for any liability and accepts no responsibility whatsoever arising from the
misapplication or misinterpretation by third parties of the contents of its reports.
Except where expressly stated, PAEHolmes does not attempt to verify the accuracy, validity or
comprehensiveness of any information supplied to PAEHolmes for its reports.
Reports cannot be copied or reproduced in whole or part for any purpose without the prior written
agreement of PAEHolmes.
Where site inspections, testing or fieldwork have taken place, the report is based on the
information made available by the client or their nominees during the visit, visual observations
and any subsequent discussions with regulatory authorities. The validity and comprehensiveness
of supplied information has not been independently verified and, for the purposes of this report, it
is assumed that the information provided to PAEHolmes is both complete and accurate. It is
further assumed that normal activities were being undertaken at the site on the day of the site
visit(s), unless explicitly stated otherwise.

5324 Summary Report for Consultation iv
REVIEW OF AIR QUALITY ASSESSMENT ISSUES FOR POULTRY OPERATIONS IN QUEENSLAND
DEEDI | PAEHolmes Job 5324
TABLE OF CONTENTS
1 INTRODUCTION 1 1.1 Scope of Work 1
2 BACKGROUND TO AIR QUALITY ASSESSMENT FOR POULTRY FARMS 2
3 S FACTOR METHOD REVIEW 3 3.1 Summary of Changes 3 3.2 Application of S Formula 5
4 GUIDANCE ON MODELLING FOR MEAT CHICKEN FARMS 6 4.1 Background 6 4.2 Model Selection 7 4.3 Meteorological Inputs 8 4.4 Emission Inputs 9
4.4.1 Principles 9 4.4.2 Outline of Odour Emissions Estimation 9
4.5 Geophysical Data 12 4.6 Receptor Data 12 4.7 Assessment Criteria 13 4.8 Outputs and Reporting 13
5 ACCREDITATION OF CONSULTANTS 14 5.1 Background 14 5.2 Proposal 14
6 REFERENCES 16

5324 Summary Report for Consultation v
REVIEW OF AIR QUALITY ASSESSMENT ISSUES FOR POULTRY OPERATIONS IN QUEENSLAND
DEEDI | PAEHolmes Job 5324
LIST OF TABLES
Table 3.1: Values of S1 Receptor Factor ........................................................... 4
Table 3.2: Values of S3 Terrain Weighting Factor ............................................... 5
Table 6.1: Shed Ventilation as a Percentage of Maximum Ventilation ................. 10
LIST OF FIGURES
Figure 4-1: Example of Emissions Estimation and Sample Data ......................... 11
Figure 4-1: Example of Emissions Profile (10 m3/hr/bird and K = 2. No. of birds = 40,000 at
placement) ............................................................................................ 12

5324 Summary Report for Consultation 1
REVIEW OF AIR QUALITY ASSESSMENT ISSUES FOR POULTRY OPERATIONS IN QUEENSLAND
DEEDI | PAEHolmes Job 5324
1 INTRODUCTION
PAEHolmes was engaged by the Queensland Department of Employment, Economic
Development and Innovation (DEEDI) to review and update the methodology for separation
distance determination relating to meat chicken operations in Queensland, to provide
recommendations on best practice approaches for assessments and to consider the issue of
accreditation for practitioners.
The approach to assessing new meat chicken farms in Queensland allows for either a readily-
applied separation distance formula approach (the ‘S Formula’ method) for simpler cases or
detailed plume dispersion modelling, primarily focused on odour, for larger farms and more
complex cases where the S Formula method is not adequate. Ensuring that the
methodologies are suitable and assessments are of a reliable standard is a key concern to
stakeholders including government, the poultry industry and communities potentially affected
by emissions from poultry operations.
The methodology under review was originally developed by FSA Consulting Pty Ltd (FSA) in
2005 under contract to the Department of Environment and Resource Management. The
original document, Best Practice Technical Guide for the Meat Chicken Industry in
Queensland, included an appendix entitled Calculating Separation and Buffer Distances.
1.1 Scope of Work
The scope of work for this contract was to verify and adjust aspects of the methodology for
calculating separation distances and buffer distances in relating to development of new and
expansion of existing intensive meat chicken farms that are determined to be undertaking a
material change of use. It included consideration of the following:
Meteorological profiles for the areas where the industry may expand;
A wind frequency reduction factor;
A receptor factor based on population density;
Replacing the farm management factor with a single factor of best practice design and
operation; and
Investigating the terrain weighting factor taking into account different meteorological
areas in Queensland.
The work included:
Considering changes to separation distance method put forward by Council of Mayors
South East Queensland and Sustainable Poultry Alliance;
Developing guidelines for best practice methodology for preparing meteorological data
and odour modelling, and best practice guide for dispersion modelling;
Preparing a list of requirements for accreditation of consultants with the necessary skills
to advise new entrants to the chicken meat industry;
Developing and delivering a workshop to industry on technical development and
recommendations, and report summary findings to Poultry Roundtable; and
Providing a report summarising the study findings.

5324 Summary Report for Consultation 2
REVIEW OF AIR QUALITY ASSESSMENT ISSUES FOR POULTRY OPERATIONS IN QUEENSLAND
DEEDI | PAEHolmes Job 5324
2 BACKGROUND TO AIR QUALITY ASSESSMENT FOR
POULTRY FARMS
Air quality assessment is a routine requirement for many development applications across a
broad spectrum of industries. In the case of the poultry industry, most particularly the meat
chicken industry, odour has been long recognised as a major limiting factor on farm size and
siting in areas where land use conflicts can arise. In southeast Queensland especially, urban
and rural residential populations are expanding rapidly in localities where meat chicken
production has traditionally located close to processing plants. Increased production through
larger and more numerous farms has been required to meet growing demand. Substantial
pressures have consequently been applied to both the industry and sensitive land uses as
available buffers have been challenged.
Hence, the determination of suitable planning controls and approval mechanisms to strike a
suitable balance between industry and community concerns has been a requirement for many
years and is now in need of review as the science advances and issues affecting sound
decision-making remain.
Odour tends to be the most restrictive of the air quality issues relating to poultry farms,
although dust is recognised as a significant issue as well. However, there is greater attention
to odour modelling as it is generally the limiting factor. That is, if a farm complies with the
relevant odour criteria normally it can comply with the dust criteria.
Often, odour modelling and assessment is required for proposals involving new or expanded
farms. Dust modelling and assessment is sometimes required. A difficulty with this need for
modelling-based assessments is that air quality modelling is technically specialised and
complex, and consequently can be both difficult to do well and to explain clearly to a diverse
group of stakeholders.
To enable rapid and simple assessments of impact, it is desirable to have a readily applied
formula that does not require the time, expense and detailed work involved in modelling.
However, such a simple, generalised method also needs to be conservative in order to avoid
underestimating required separation distances in any circumstance. Also, with the increasing
scale and complexity of meat chicken operations, a simple formula begins to fail and so above
a certain farm size it is not feasible to use a generic approach. Hence, although a simple
formula is useful it also has limitations that must be recognised.
The S Factor method was originally devised in Queensland for the feedlot industry and has
been adopted for other intensive livestock industries in Queensland and some other states. In
2005, FSA Consulting was engaged by DERM to develop a Best Practice guidance document
for the meat chicken industry, including the S Factor method (FSA_Consulting 2005).
This report addresses some of the details contained in the FSA report and provides updated
recommendations based on review and analysis of aspect of the S Factor method conducted
jointly by PAEHolmes and FSA.
We also include recommendations on best practice for odour modelling associated with meat
chicken farms and on accreditation of consultants to provide some measure of assurance
about the reliability and quality of assessments being performed on behalf of the industry.

5324 Summary Report for Consultation 3
REVIEW OF AIR QUALITY ASSESSMENT ISSUES FOR POULTRY OPERATIONS IN QUEENSLAND
DEEDI | PAEHolmes Job 5324
3 S FACTOR METHOD REVIEW
3.1 Summary of Changes
The FSA report recommended the calculation of separation distances and buffer zones for
each sensitive land use and property boundary in the form:
Separation Distance/Buffer Zone (D) = N0.6 x S1 x S2 x S3 x S4
where:
N = Maximum number of birds divided by 1,000.
0.6 = Meat chicken farm exponent determined using the results of modelling.
S1= Meat chicken farm design and management factor for estimating the relative
odour potential for the development.
S2 = Meat chicken farm sensitive land use/buffer zone factor for estimating the
relative odour impact potential of a development.
S3 = Meat chicken farm surface roughness factor for estimating the potential changes
to odour dispersion due to changes in the earths surface.
S4 = Terrain weighting factor for estimating the potential changes to odour dispersion
in situations where meteorological conditions may be influenced by local terrain
influences.
The general S Factor approach presented in the FSA report has been retained but details have
been reviewed, in particular:
the original S1 for farm design and management has been deleted and a constant value
applied in its place on the basis that all new or expanded farms are expected to comply
with the criteria for best practice detailed in the FSA report;
S2, S3 and S4 have been replaced by new factors S1, S2 and S3, respectively;
the land use factor (now S1) has been revised to remove the boundary buffer
calculations to achieve consistency with the Queensland odour guideline (QEPA 2004);
the land use factor (now S1) has been revised to reflect the need for adequate
protection against nuisance in areas where the risk of odour nuisance is greatly
increased by virtue of higher population densities and community expectations;
the surface roughness factor (now S2) remains unchanged; and
the terrain factor (now S3) has been examined through a process of dispersion
modelling under a variety of topographic situations and has been revised;
The revised S Factor method is as follows:
Separation Distance (D) = N0.63 x S1 x S2 x S3
where:
N = Maximum number of birds divided by 1,000.

5324 Summary Report for Consultation 4
REVIEW OF AIR QUALITY ASSESSMENT ISSUES FOR POULTRY OPERATIONS IN QUEENSLAND
DEEDI | PAEHolmes Job 5324
0.63 = Exponent determined using the results of modelling.
S1 = Sensitive receptor factor for estimating the relative odour impact potential of a
development.
S2 = Surface roughness factor for estimating the potential changes to odour
dispersion due to changes in the earth’s surface.
S3 = Terrain weighting factor for estimating the potential changes to odour dispersion
in situations where meteorological conditions may be influenced by local terrain
influences.
The revised values for S1 and S3 are contained in Table 3.1 and Table 3.2, respectively. The
values of S1 reflect the results of dispersion modelling for various locations and also take into
account risk-weighted impacts in a manner similar to that which applies in the New South
Wales odour performance criteria. Effectively, the S1 value of 30 for a residence in a
compatible zone is consistent with the Queensland Odour Guideline for general application,
while the S1 value of 50 provides a form of protection equivalent to that which applies to
urban populations in NSW.
Table 3.1: Values of S1 Receptor Factor
Sensitive Receptor Type Value
Sensitive receptor (compatible zone) 30
Sensitive receptor (non compatible zone) 50
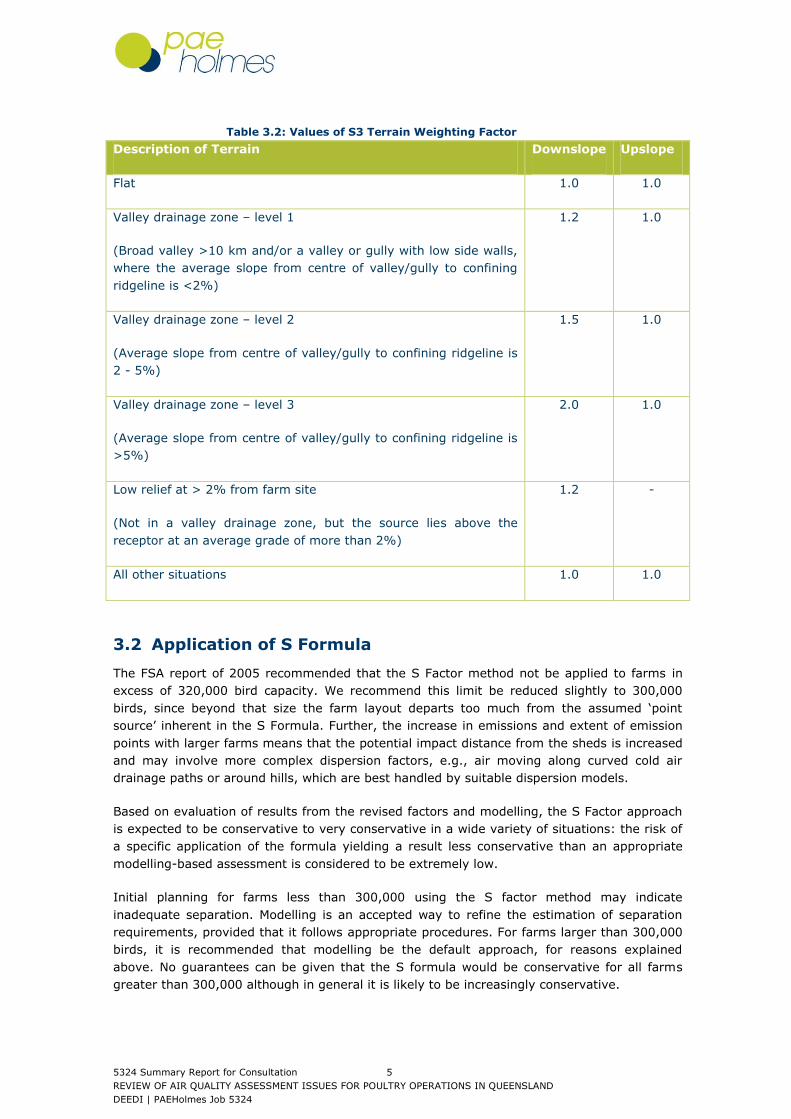
The terrain weighting factors have been considered on the basis of dispersion modelling using
CALPUFF. Model results for a variety of locations reveal that there is so much site-specific
variability in dispersion patterns that it is not possible to reliably assign S3 values to more
detailed terrain descriptions than those provided in Table 3.2 below.
The proposed S3 values are broadly consistent with the long-standing factors developed for
feedlots, but provide some additional refinement in relation to valley drainage zones and do
not allow for a reduction factor (i.e., S3 of less than 1.0), to avoid the possibility of non-
conservative estimates from the S Factor calculation.
5324 Summary Report for Consultation 5
REVIEW OF AIR QUALITY ASSESSMENT ISSUES FOR POULTRY OPERATIONS IN QUEENSLAND
DEEDI | PAEHolmes Job 5324
Table 3.2: Values of S3 Terrain Weighting Factor
Description of Terrain Downslope Upslope
Flat 1.0 1.0
Valley drainage zone – level 1
(Broad valley >10 km and/or a valley or gully with low side walls,
where the average slope from centre of valley/gully to confining
ridgeline is <2%)
1.2 1.0
Valley drainage zone – level 2
(Average slope from centre of valley/gully to confining ridgeline is
2 - 5%)
1.5 1.0
Valley drainage zone – level 3
(Average slope from centre of valley/gully to confining ridgeline is
>5%)
2.0 1.0
Low relief at > 2% from farm site
(Not in a valley drainage zone, but the source lies above the
receptor at an average grade of more than 2%)
1.2 -
All other situations 1.0 1.0
3.2 Application of S Formula
The FSA report of 2005 recommended that the S Factor method not be applied to farms in
excess of 320,000 bird capacity. We recommend this limit be reduced slightly to 300,000
birds, since beyond that size the farm layout departs too much from the assumed ‘point
source’ inherent in the S Formula. Further, the increase in emissions and extent of emission
points with larger farms means that the potential impact distance from the sheds is increased
and may involve more complex dispersion factors, e.g., air moving along curved cold air
drainage paths or around hills, which are best handled by suitable dispersion models.
Based on evaluation of results from the revised factors and modelling, the S Factor approach
is expected to be conservative to very conservative in a wide variety of situations: the risk of
a specific application of the formula yielding a result less conservative than an appropriate
modelling-based assessment is considered to be extremely low.
Initial planning for farms less than 300,000 using the S factor method may indicate
inadequate separation. Modelling is an accepted way to refine the estimation of separation
requirements, provided that it follows appropriate procedures. For farms larger than 300,000
birds, it is recommended that modelling be the default approach, for reasons explained
above. No guarantees can be given that the S formula would be conservative for all farms
greater than 300,000 although in general it is likely to be increasingly conservative.

5324 Summary Report for Consultation 6
REVIEW OF AIR QUALITY ASSESSMENT ISSUES FOR POULTRY OPERATIONS IN QUEENSLAND
DEEDI | PAEHolmes Job 5324
Modelling of odour from meat chicken farms is relatively complex and critically dependent on
factors such as model selection, emissions estimation, meteorological data quality and
interpretation of results. These issues are considered in the recommendations on best
practice for modelling that have been prepared for this project.
4 GUIDANCE ON MODELLING FOR MEAT CHICKEN FARMS
4.1 Background
Often, odour modelling and assessment is required for proposals involving new or expanded
farms. Dust modelling and assessment is sometimes required. A difficulty with this is that air
quality modelling is technically specialised and complex, and consequently can be both
difficult to do well and difficult to explain clearly to a diverse group of stakeholders.
A dispersion model takes information on emissions and the meteorological conditions that
dictate how those emissions are dispersed in the atmosphere. Typically a full year of hourly
data is used and for each hour the model calculates the plume concentrations at points
affected under the specific weather conditions at that time. The assessment of impacts uses
statistical summaries of the hourly model calculations for the whole year.
There is no standard methodology for poultry farm odour or dust modelling, so there can be
confusing differences between one assessment and another. The main aspects of modelling
and assessment are:
selecting and applying a dispersion model;
identifying and defining emission sources;
estimating emission rates;
defining the local terrain and ground cover;
developing a meteorological dataset to use in the model; and
comparing model results to assessment criteria, such as those set out in regulatory
odour guidelines.
In relation to the first item above, model selection is an important issue in most cases,
because the two models most commonly used in Australia, AUSPLUME and CALPUFF, have
very different methods of calculating plume behaviour. These differences become critically
important in conditions of very light wind and temperature inversions, which are common in
most parts of southeast Queensland.
Defining emission sources, i.e., poultry sheds, is not done uniformly by all consultants.
Recent research has demonstrated that under some conditions the plumes emitted from
sheds can rise to some extent when they are warmer than the surrounding air (Dunlop
2010). Consequently, a modelling approach that takes plume buoyancy into account would be
more realistic than the alternative approach which ignores this effect. Both approaches are in
use.
The estimation of emission rates is done in a number of different ways, some of which
attempt a more detailed simulation of the variations in emissions over the hours of the year
than others. Although it is evident from recent research that some of the variation in
emissions cannot be readily explained with current data, there is nevertheless a broad and
useful relationship between odour emissions and several key factors including bird mass, bird

5324 Summary Report for Consultation 7
REVIEW OF AIR QUALITY ASSESSMENT ISSUES FOR POULTRY OPERATIONS IN QUEENSLAND
DEEDI | PAEHolmes Job 5324
age, ambient temperature and shed ventilation rate (Dunlop, Gallagher et al. 2010),
consistent with the general basis of some emissions estimation models in use.
Terrain, land use and vegetation information is used in the two main models in different
ways. The information is used to account for ways in which the land surface affects the
behaviour of air flowing over it. Terrain features sufficient to steer the airflow, such as in
valley cold air drainage conditions, cannot be simulated in AUSPLUME but can in CALPUFF.
Although not important in every case, this is often a factor in determining critical odour
impacts.
Meteorological data is a fundamental driver of a dispersion model and must be as accurate
and representative as possible for best results. There are substantial differences between the
meteorological data requirements for AUSPLUME and CALPUFF. AUSPLUME requires a
relatively simple set of hourly data for a single site representative of the area under
consideration. On the other hand, CALPUFFa uses a 3-dimensional grid of data across the
whole area under consideration, at levels ranging from the surface to thousands of metres
above the ground. Clearly, such detailed data cannot be measured directly and methods that
blend data from measurements with sophisticated meteorological modelling, such as TAPM
(Hurley 2008), are often used to generate the required data.
4.2 Model Selection
Selecting the most suitable model is an important step and needs to take into account the
most relevant factors. The following factors are considered to be most important in the
selection process:
Very light wind conditions. The Gaussian plume equation that forms the basis of
AUSPLUME calculates downwind concentration as a function of the inverse of the wind
speed, so when wind speed is low, the result can be unrealistically high. CALPUFF
does not suffer from this limitation, although like any model the accurate treatment
of dispersion in very light winds remains problematic in certain respects. Comparison
of the two models shows that in southeast Queensland there are many areas where
the frequency of very light winds is high and AUSPLUME results differ widely from
those of CALPUFF, which is technically better formulated for these conditions.
Effects of terrain on plume behaviour. Plumes are transported and dispersed by
the wind, so wind behaviour is a critical factor. AUSPLUME is a steady-state model,
which does not allow for the variation of wind direction or speed over the modelled
area at a given time, whereas CALPUFF can simulate the diversion of plumes due to
drainage flows or hills, provided that input data is of a suitable quality. Hence, in
areas where terrain affects are likely to be significant CALPUFF is a more suitable
model. Further, AUSPLUME relies on data for a single point in space, which may be a
weather station remote from the site. Consequently, the data used in AUSPLUME may
not reflect the details of the site-specific conditions. On the other hand, a well-
constructed meteorological model (used to run CALPUFF) can incorporate localised
flow features.
a CALPUFF can in fact be run in a mode which uses the simple AUSPLUME meteorological file,
but generally this mode is not used and instead the 3-D capabilities of CALPUFF are
employed.

5324 Summary Report for Consultation 8
REVIEW OF AIR QUALITY ASSESSMENT ISSUES FOR POULTRY OPERATIONS IN QUEENSLAND
DEEDI | PAEHolmes Job 5324
Plume buoyancy. The emissions from tunnel ventilated sheds are at times warmer
than the ambient air and hence are positively buoyant. Although temperature excess
may be only a few degrees, it can be sufficient to lead to plume rise, which is a factor
in plume dispersion (Dunlop 2010). Because the endwall fans usually direct air
horizontally, buoyant plumes do not behave as they would from a vertical stack. The
formulation of CALPUFF enables this to be simulated, but AUSPLUME does not (yet)
have the appropriate ‘switch’, requiring some manipulation of the source data to
achieve the best result. It is relevant to note also that plume rise will only be
significant under very light wind conditions.
Considering these most relevant factors, we recommend that CALPUFF be regarded as the
‘default’ model for use in odour assessments for meat chicken farms. The use of AUSPLUME
may be suitable in locations where the frequency of very light winds (<2 m/s) is low.
4.3 Meteorological Inputs
The input of meteorological data to a dispersion model is a critical requirement. Data must be
complete, quality assured and representative of the modelled area, in both time and space.
The accompanying report ‘Best Practice Guidance for the Queensland Poultry Industry –
Plume Dispersion Modelling and Meteorological Processing’ details regulatory and other
guidance on the selection of meteorological data.
In locations where the nearest weather station may not be representative of the site it is
preferable to use a prognostic meteorological model to create a dataset for use in a model.
Models such as TAPM (Hurley 2008), MM5 (Grell, Dudhia et al. 1994) and WRF (Michalakes,
Dudhia et al. 2004) are used for this purpose and are recommended, subject to input settings
being suitable.
An important aspect of meteorological data is demonstration that it is either a representative
set of measurements, or that model results are validated against nearby weather station
data.
Increasingly, regulatory guidance on modelling refers to the need for consideration of multi-
year periods to account for changes from year to year in weather conditions. If one year is
selected, as is the usual practice, it is highly desirable to provide an analysis to indicate
whether that year is typical or atypical and to consider the implications for predicted odour
levels.
It is noted that at the time of writing this report, a draft technical recommendation on
meteorological data preparation for CALPUFF has been prepared for the NSW Department of
Environment, Climate Change and Water (DECCW)b by the developers of CALPUFF. We would
recommend that once this guidance is finalised (expected to be early 2011) it be used as a
primary reference for this purpose.
b Now the NSW Office of Environment & Heritage (OEH)
5324 Summary Report for Consultation 9
REVIEW OF AIR QUALITY ASSESSMENT ISSUES FOR POULTRY OPERATIONS IN QUEENSLAND
DEEDI | PAEHolmes Job 5324
4.4 Emission Inputs
4.4.1 Principles
Emission sources for dispersion modelling must be identified by location and type (point
source, volume source, area source or line source). For each source, data on physical
characteristics (dimensions, flow rates, etc.) must be entered and emission rates assigned.
Odour emissions from meat chicken farms are highly variable (Dunlop, Gallagher et al. 2010)
but there are several readily quantified factors controlling a large part of the variation, i.e.,
bird mass and age, ambient temperature and shed ventilation rate. Because routine
modelling requires hourly input data, it is possible and desirable to estimate odour emissions
on an hourly basis and so emissions models that simulate the changing effects of those
factors over time are the best way to model odour impacts as accurately as possible.
The separate report on Modelling Guidance provides details of a recommended approach to
emissions estimation that has been used and accepted for several years. The model is not
perfect, as variability in emissions due to other factors has been identified (Dunlop, Gallagher
et al. 2010). This has been addressed by recommending that the baseline emissions for
estimation purposes assumes that a best practice farm equates to a K factor of 2. The K
factor was originally developed by PAEHolmes in an attempt to account for inter-farm
variations in design and management and was originally thought to be around 1 for the best
case. Results of odour sampling from modern well managed farms since then have usually
returned values between 1 and 2. Occasional higher (and lower) values should be considered
in light of the quite large uncertainty in odour data, arising simply from the method of
measurement.
4.4.2 Outline of Odour Emissions Estimation
The estimation of odour emissions is a key part of any odour assessment. For poultry farms
key factors that should be included in the emissions estimation include:
Number of birds placed
Batch length
Cleanout days
Thinning regime
The weight of the birds through the batch
Maximum ventilation rate and changes in ventilation over a batch
Design and management practices.
A typical grow-out cycle will consist of a 6 – 8 week growing period (dependent on the bird
size required for market) followed by a 1 – 2 week clean-out of the sheds, disinfecting and
maintenance. Normally, four to six batches of birds are raised each year. During the grow-out
period, some birds are removed, usually once or twice, at or after day 30. This is to both
meet market requirements for bird size and also to manage the bird density in line with
industry standards.
The odour emission rate, the key factor in determining potential downwind impact, is the
product of the in-shed odour concentration and the ventilation rate. The concentration of
5324 Summary Report for Consultation 10
REVIEW OF AIR QUALITY ASSESSMENT ISSUES FOR POULTRY OPERATIONS IN QUEENSLAND
DEEDI | PAEHolmes Job 5324
odour in the shed tends to increase as the birds grow and is minimised by tight control of
litter moisture and bird health. A review of both existing farms and those proposed indicates
that most farms ventilate at a maximum ventilation rate of about10 m3/hr/bird.
Ventilation is used to mange internal shed temperatures. Optimal shed temperature
decreases with bird age, ranging from about 31-34C when chickens are first brought into the
shed down to about 18-21C (apparent temperaturec) by week 5 (Jiang and Sands 2000).
While very young, the chickens will normally be restricted to no more than 50% of the shed
(brooding section) until old enough to maintain body temperature. Heaters are required to
maintain optimal temperatures during the brooding phase.
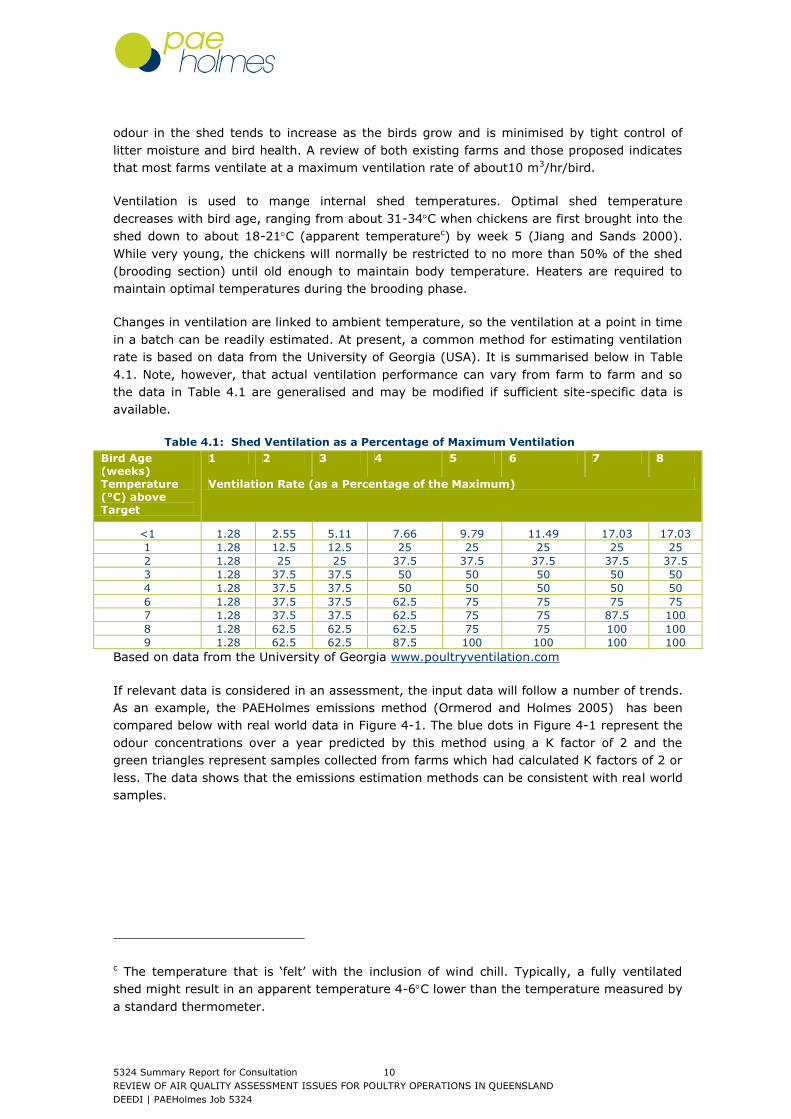
Changes in ventilation are linked to ambient temperature, so the ventilation at a point in time
in a batch can be readily estimated. At present, a common method for estimating ventilation
rate is based on data from the University of Georgia (USA). It is summarised below in Table
4.1. Note, however, that actual ventilation performance can vary from farm to farm and so
the data in Table 4.1 are generalised and may be modified if sufficient site-specific data is
available.
Table 4.1: Shed Ventilation as a Percentage of Maximum Ventilation
Bird Age (weeks)
1 2 3 4 5 6 7 8
Temperature (°C) above Target
Ventilation Rate (as a Percentage of the Maximum)
<1 1.28 2.55 5.11 7.66 9.79 11.49 17.03 17.03
1 1.28 12.5 12.5 25 25 25 25 25
2 1.28 25 25 37.5 37.5 37.5 37.5 37.5
3 1.28 37.5 37.5 50 50 50 50 50
4 1.28 37.5 37.5 50 50 50 50 50
6 1.28 37.5 37.5 62.5 75 75 75 75
7 1.28 37.5 37.5 62.5 75 75 87.5 100
8 1.28 62.5 62.5 62.5 75 75 100 100
9 1.28 62.5 62.5 87.5 100 100 100 100
Based on data from the University of Georgia www.poultryventilation.com
If relevant data is considered in an assessment, the input data will follow a number of trends.
As an example, the PAEHolmes emissions method (Ormerod and Holmes 2005) has been
compared below with real world data in Figure 4-1. The blue dots in Figure 4-1 represent the
odour concentrations over a year predicted by this method using a K factor of 2 and the
green triangles represent samples collected from farms which had calculated K factors of 2 or
less. The data shows that the emissions estimation methods can be consistent with real world
samples.
c The temperature that is ‘felt’ with the inclusion of wind chill. Typically, a fully ventilated
shed might result in an apparent temperature 4-6C lower than the temperature measured by
a standard thermometer.

5324 Summary Report for Consultation 11
REVIEW OF AIR QUALITY ASSESSMENT ISSUES FOR POULTRY OPERATIONS IN QUEENSLAND
DEEDI | PAEHolmes Job 5324
Figure 4-1: Example of Emissions Estimation and Sample Data
An example of predicted odour emissions during a typical batch is shown below in Figure 4-2.
From the data it can be seen that the batch length is approximately 56 days with thinning
occurring at around days 34, 40 and 48. The hourly emissions data should show a general
increase as total mass increases, some small reductions with thinning, as well as daily
variation reflecting hour-to-hour changes in ventilation.

5324 Summary Report for Consultation 12
REVIEW OF AIR QUALITY ASSESSMENT ISSUES FOR POULTRY OPERATIONS IN QUEENSLAND
DEEDI | PAEHolmes Job 5324
Figure 4-2: Example of Emissions Profile (10 m3/hr/bird and K = 2. No. of birds =
40,000 at placement)
4.5 Geophysical Data
Geophysical inputs for models include terrain information, land use or surface roughness data
and other information, depending on the model employed. For best results, these data need
to be as accurate as possible and suitably resolved in spatial terms. In some cases, default
databases of terrain data and vegetation or land use are not of adequate resolution or
accuracy to bring out local features that might influence meteorology and plume behaviour,
and so it is important that terrain is resolved to 100 metres or better. On-line databases, e.g.
satellite-derived terrain from NASA, are available and recommended. Databases for land use
or vegetation type and soil type which may be required are recommended for optimum model
performance.
Improved data sources and data settings for these types of model inputs continue to be
developed and it is recommended that improvements be tracked to ensure best practice
approaches are used.
4.6 Receptor Data
The receptors in models are the locations of points of interest, usually residences and other
sensitive sites as described regulatory guidance. It is important that all sensitive receivers are
accurately identified and incorporated into the model. Models are run on the basis of a regular
grid of receptor points but these points may not coincide with all sensitive locations. Separate
discrete receptors can and should be included in model setup.

5324 Summary Report for Consultation 13
REVIEW OF AIR QUALITY ASSESSMENT ISSUES FOR POULTRY OPERATIONS IN QUEENSLAND
DEEDI | PAEHolmes Job 5324
4.7 Assessment Criteria
Modelled odour levels should be assessed against the following criteria:
o 2.5 OU, 99.5%, 1 hour average for a sensitive receptor in a compatible zone;
o 1.0 OU, 99.5%, 1 hour average for a sensitive receptor in a non-compatible zone.
The 1 OU recommendation for sensitive receptors in a non-compatible zone is more stringent
than the default of 2.5 OU set out in the Queensland Odour Guideline (QEPA 2004). It takes
into account a risk-based odour assessment procedure, such as that used in New South
Wales. The value of 1 OU (99.5%, 1 hour average) is approximately equivalent to the odour
performance criterion for urban areas in New South Wales (2 OU, 99%, 1 second).
Odour has been identified as the principal community amenity concern for meat chicken
farms. Hence the focus of separation distance determination is the limiting of the potential
for nuisance odours. Both experience in the southeast Queensland region and the scientific
literature in recent years have identified the fact that sensitivity to odour in some
communities, particularly those not traditionally associated with livestock production, may not
be adequately addressed by existing assessment criteria.
The Queensland Odour Guideline is generally regarded as a very useful reference point for
odour assessment in the State and the criteria have been applied successfully in many
instances. However, there is some evidence that for meat chicken farms compliance with the
default criteria, whether in fact or because of modelling errors, does not always seem to
satisfy the aim of avoiding undue annoyance.
Growing population, changing demographics and lifestyle expectations have all contributed to
increasing pressures on odour-generating activities such as meat chicken farming in the
region. Accordingly, the recommended odour criteria for meat chicken farms are aimed at
taking a long-term protective view of environmental values for residents near meat chicken
farm developments and providing some buffering for model uncertainty.
4.8 Outputs and Reporting
The separate Modelling Guidance report provides recommendations on output formatting and
interpretation, as well as basic requirements for reporting. It is important that the rationale
for selection of a methodology, details of model inputs and clear explanation of results and
their implications is included in a report. It is also highly desirable that model input files or
summaries of inputs are provided for verification by third parties.
Refer to the Modelling Guidance report for specific details and recommendations.
5324 Summary Report for Consultation 14
REVIEW OF AIR QUALITY ASSESSMENT ISSUES FOR POULTRY OPERATIONS IN QUEENSLAND
DEEDI | PAEHolmes Job 5324
5 ACCREDITATION OF CONSULTANTS
5.1 Background
Air quality modelling for poultry farms is technically specialised and complex, and
consequently can be both demanding to do well and difficult to explain clearly to a diverse
group of stakeholders. Further, odour and other environmental issues are often contentious
and assessments are often challenged in legal appeals, which are expensive. Hence, it is
important that assessments are as technically robust as possible. This requires that
assessments are prepared by suitably qualified and experienced practitioners so that they
meet the needs of stakeholders with minimum dispute and cost.
One way of helping to achieve such a situation is to require consultants preparing odour and
air quality assessments for poultry farms to be accredited by a suitable responsible body.
There are various accreditation and certification programs for scientists and engineers who
provide consulting services. These programs cover a wide range of complexity and
requirements for entry but are generally run by professional bodies such as Engineers
Australia (EA), the Clean Air Society of Australia & New Zealand (CASANZ), the American
Meteorological Society (AMS) and many others. Within each of these organisations there are
different levels of recognition of a practitioner’s professional status.
Membership of a professional organisation is a necessary but not sufficient requirement to
attain a status such as a Chartered Engineer (EA), Accredited Professional (CASANZ) or
Certified Consulting Meteorologist (AMS). The Victorian branch of CASANZ plans to develop
an accreditation system specifically for dispersion modellers.
Common to many accreditation schemes are the following elements:
Need for suitable tertiary qualifications
Membership of a relevant professional body
Demonstration of relevant knowledge and experience provided via a written test or
assignment and interview
References from other practitioners or parties acceptable to the accreditation body,
with reference to both technical and ethical standards
Demonstration of ongoing involvement in relevant activities to maintain accreditation
Sanction and appeal processes relating to misconduct or disqualification.
5.2 Proposal
It is proposed that the accreditation program for air quality practitioners submitting
assessments for poultry farms to responsible authorities in Queensland be as simple and
effective as can be reasonably achievedd. The suggested approach is as follows:
Establish a small panel responsible for the accreditation process. Potential
membership could be from DEEDI, DERM, local government, industry, community and
relevant professional organisation, or some combination of these. Membership of
three people would probably be sufficient given the scope.
d Note that many assessments are prepared by a small team of consultants. It is proposed
that only the ‘lead consultant’ representing the work need be accredited.

5324 Summary Report for Consultation 15
REVIEW OF AIR QUALITY ASSESSMENT ISSUES FOR POULTRY OPERATIONS IN QUEENSLAND
DEEDI | PAEHolmes Job 5324
Establish accreditation scope. It is suggested that this be defined around the
capability of a consultant to competently, independently and ethically deal with odour
(and other air quality) assessment needs for the poultry industry, acting impartially
for any party that might require the expertise of the consultant.
Establish entry requirements. It is suggested that these include the following:
o Science or engineering Bachelors degree or higher, with substantial
components relating to at least three of: atmospheric science, mathematics,
physics, computer modelling, chemistry, livestock production and/or their
applications (e.g., chemical engineering in the case of chemistry);
o At least 5 years’ experience in air quality consulting, including a substantial
involvement in odour and air quality assessments in the intensive livestock
industry, or, at least 2 year’s consulting experience if there has also been at
least 4 years of regulatory or research involvement in intensive livestock
odour assessment;
o Nomination of two referees, at least one being a peer from outside the
applicant’s organisation;
o Membership of the Clean Air Society of Australia & New Zealand and its Odour
Special Interest Group, or another body that has a substantial and recognised
role for professionals that is relevant and equivalent;
o Completion of a written task demonstrating relevant competence and
judgement, either a body of consulting reports or a small thesis assignment
on the topic of odour assessment for poultry. This work may be subject to
independent review at the discretion of the panel;
o Attendance at an interview with the accreditation panel (or a quorum thereof)
if deemed necessary by the panel;
o Panel endorsement based on the evidence presented by the above.
Establish grounds for revoking accreditation and an appeals process. The grounds
may include professional misconduct or unethical behaviour that compromises the
confidence in work produced by the consultant.
Establish a process for renewal of accreditation, based on demonstrating a minimum
level of involvement in relevant consulting work (or in a regulatory or research role if
the consultant has spent time outside consulting in the period since previous renewal
or initial accreditation). It is suggested that a 3-year renewal period apply.

5324 Summary Report for Consultation 16
REVIEW OF AIR QUALITY ASSESSMENT ISSUES FOR POULTRY OPERATIONS IN QUEENSLAND
DEEDI | PAEHolmes Job 5324
6 REFERENCES
Dunlop, M., Duperouzel, D., Pott, L. (2010). Separation Distances for Broiler Farms: Verifying
methods including the effects of thermal buoyancy, Rural Industries Research and Development Corporation.
Dunlop, M., E. Gallagher, et al. (2010). "Odour emissions from tunnel-ventilated broiler sheds: case study of nine Queensland farms." Animal Production Science 50(6): 546-551.
FSA_Consulting (2005). Best practice guide for the meat chicken industry in Queensland -
Final Draft. Grell, G., J. Dudhia, et al. (1994). A description of the fifth-generation Penn State/NCAR
Mesoscale Model (MM5). NCAR Tech. Note TN-398+ STR: 122. Hurley, P. (2008). TAPM V4. Part 1: Technical Description, CSIRO Marine and Atmospheric
Research Paper.
Jiang, J. and J. Sands (2000). "Odour and ammonia emission from broiler farms." RIRDC Pub. 00/2, Barton, ACT: Rural Industries Research and Development Corporation.
Michalakes, J., J. Dudhia, et al. (2004). The weather research and forecast model: Software architecture and performance, Citeseer.
Ormerod, R. and G. Holmes (2005). Description of PAE Meat Chicken Farm Odour Emissions Model. PAEHolmes_Brisbane.
QEPA (2004). Odour Impact Assessment for Developments. State of Queensland, Environmental Protection Agency and Queensland Parks and Wildlife Service.