Embed Size (px)
Citation preview
© Frontier Economics Pty. Ltd., Australia.
Review of Australia Post’s volume and
input cost forecasts A REPORT PREPARED FOR THE ACCC
May 2010

Public version May 2010 | Frontier Economics i
Final Contents
Review of Australia Post’s volume and
input cost forecasts
Executive Summary iii
1 Introduction 1
1.1 Background 1
1.2 Process of this review 3
1.3 This report 3
2 Volume forecasts 5
2.1 Background 5
2.2 Baseline forecasts derived by Diversified Specifics 6
2.3 Forecasts derived by Australia Post 12
2.4 Conclusions 17
3 Cost forecasts 19
3.1 Introduction 19
3.2 Information supplied by Australia Post 19
3.3 Cost structure and forecasts 20
3.4 Input cost forecasts 21
3.5 Relationship between costs and volumes 25
3.6 Conclusions on cost forecasts 28
4 References 30
ii Frontier Economics | May 2010 Public version
Contents Final
Review of Australia Post’s volume and
input cost forecasts
Figures
Figure 1: Small letters – Diversified Specifics’ forecasts 11
Figure 2: Large letters – Diversified Specifics’ forecasts 11
Figure 3: Other small letters – Australia Post’s forecasts 15
Figure 4: Pre-sort small letters – Australia Post’s forecasts 16
Figure 5: Other large letters – Australia Post’s forecasts 16
Figure 6: Pre-sort large letters – Australia Post’s forecasts 17
Figure 7: Domestic reserved letters – volume, revenue and cost forecasts 20
Figure 8: Forecast cost base for reserved services, by type of cost 21
Figure 9: Comparison of changes in volumes and costs (deflated by CPI) for
reserved services 21
Figure 10: Reserved service labour costs and FTEs, actual and forecast 23
Figure 11: Australia Post’s labour prices 23
Figure 12: Forecast FTEs 23
Figure 13: Contractor costs and volumes – reserved services 24
Figure 14: Depreciation – actual and forecast across reserved and aggregate
services 25
Tables
Table 1: Letter volume demand – Small letters 14
Table 2: Letter volume demand – Large letters 14
Public version May 2010 | Frontier Economics iii
Final Executive Summary
Executive Summary
Frontier Economics (Frontier) has been engaged by the Australian Competition
and Consumer Commission (ACCC) to provide an independent assessment of
the demand and input cost forecasts used by Australia Post in its April 2010 Price
Notification (the Notification).
In the Notification, Australia Post proposes to raise the price of certain „reserved
services‟ over which it has a statutory monopoly. We were asked by the ACCC to
consider Australia Post‟s methodological forecasting practices as well as the
forecasts themselves. The current Notification follows a Draft Notification that
was lodged in July 2009 and objected to by the ACCC in December 2009. One
important reason for the rejection was because the volume and cost forecasts
used by Australia Post were not transparently derived and did not appear
reasonable with reference to historical trends.
Australia Post has adopted a more sophisticated approach to forecasting mail
demand for this Notification. Its consultant, Diversified Specifics, has derived
baseline econometric forecasts, based on best practice time series techniques for
mail volume forecasting. Australia Post has then augmented these baseline
forecasts using internal, business-specific knowledge. While these developments
herald a significant improvement in methodology, we have some concerns about
the way the new forecasts have been derived:
● Based on the materials provided to us, the econometric analysis has some
shortcomings. We do not know the quantitative significance of these
shortcomings on the baseline forecasts, but we believe the analysis would
benefit from further examination.
● The way that the forecasts have been augmented by Australia Post is
problematic:
There is little or no justification provided for the size of specific
augmentations.
It is not clear whether the augmentations are adopted because the
econometric models omit relevant relationships (perhaps because of data
unavailability), or because the relationships embedded in the models are
expected to deviate from historical trends.
On the costs side, there have been substantial reductions forecast in operating
costs compared with the forecasts in the July 2009 Draft Notification. In nominal
terms, costs are expected to remain steady from 2008/09, rather than increasing
at their historic rate. In real terms, this implies cost declines and is more
consistent with our expectation that costs should fall in line with volumes. The
material provided on cost-volume relationships gives a plausible explanation of
likely changes in costs, but the specific values referred to appear low relative to

iv Frontier Economics | May 2010 Public version
Introduction
international benchmarks, and are not supported with quantitative evidence. Our
concerns expressed in our analysis of the Draft Notification regarding
transparency of the forecasts remain. There is no obvious linkage between
changes in specific cost drivers (e.g. GDP growth) with the cost forecasts, and
therefore it is difficult to assess how different assumptions about those factors
would influence costs.
Public version May 2010 | Frontier Economics 1
Final Introduction
1 Introduction
Frontier Economics (Frontier) has been engaged by the Australian Competition
and Consumer Commission (ACCC) to provide an independent assessment of
the demand and other inputs used by Australia Post in its April 2010 price
notification.
This report follows a November 2009 report (November report) that we
prepared for the ACCC in response to price changes proposed in Australia Post‟s
July 2009 draft price notification.
As with our previous consultancy, the purpose of this consultancy is to critically
assess the approach taken by Australia Post to forecasting future mail volumes,
operating costs and other input data. In the ACCC‟s consultancy specification,
Frontier‟s tasks are listed as follows:
● Review the approach taken by Australia Post to forecasting future mail
volumes and operating costs.
● Consider whether Australia Post has appropriately accounted for the effect of
reduced mail volumes on Australia Post‟s costs (i.e. consider the extent to
which Australia Post‟s costs are volume variable).
● Provide adjusted forecasts with the associated justification and methodology
if Frontier‟s views about Australia Post‟s forecast volumes and operating
costs differ from Australia Post‟s forecasts.
It was agreed that Frontier should focus on critiquing Australia‟s Posts
forecasting methods and the likely accuracy of its forecasts. Any adjusted
forecasts, if necessary, would be developed under a subsequent consultancy
agreement.
1.1 Background
To increase the prices of its reserved letter services in accordance with the Trade
Practices Act 1974 (the TPA), Australia Post must provide the ACCC with a
locality notice specifying the proposed price increases, and receive a response
from the ACCC stating that it has no objection to the proposed price increases,
or price increases that are less than those proposed by Australia Post.
Australia Post provided a draft notification to the ACCC in July 2009, proposing
price changes to take effect from January 2010. The ACCC‟s draft report on this
notification objected to the proposed price increases.
In response to the ACCC‟s rejection of its proposed price increases, Australia
Post supplied a further notification in April 2010, with price changes to take
effect from 28 June 2010. This notice was supported by an accompanying
2 Frontier Economics | May 2010 Public version
Introduction
document Supporting Information to Australia Post’s Notification of Domestic Reserved
Letter Service Price Changes, 1 April 2010.
The price changes that are the subject of the April 2010 notification are the same
as those originally proposed in July 2009 which outlined Australia Post‟s proposal
to increase the prices of letter services over which it has a statutory monopoly
(reserved services). In particular, Australia Post proposed to increase the basic
postage rate by 5c to 60c.
Australia Post‟s reserved services extend to the collection, within Australia, of
letters for delivery within Australia and the delivery of letters within Australia,
with the exceptions of letters weighing more than 250g, and letters that are
carried for a charge at least four times the basic postage rate.
As Australia Post is seeking a price increase for services over which it has a
monopoly, it is imperative that any price increases are properly justified and
supported by robust data and analysis.
1.1.1 Frontier’s November 2009 report conclusions
As noted above, Frontier‟s November report commented on the cost and
volume forecasts in Australia Post‟s draft notification. In the November report,
we concluded that:
● Australia Post has an incentive to under-forecast volumes as lower
expectations of future demand support the case for increasing letter prices.
● Australia Post‟s methods for forecasting volumes were not based on a
rigorous framework designed to produce accurate forecasts; rather, they
evolved from commercial decision-making, and the various processes of
derivation and review were not clearly and transparently documented. They
were also not based on any statistical modelling, although some account has
been taken of econometric work on drivers of Australia Post‟s demand. Nor
were the forecasts amenable to sensitivity analysis on the key expected drivers
of demand. Given a lack of formal methodology for developing the forecasts,
it was difficult to critically assess their veracity.
● The modelling work of Australia Post‟s consultants, Diversified Specifics,
was not specifically designed for forecasting mail volumes, but was used to
inform Australia Post about historical trends. Although the work itself may
have had value, it was difficult to place this work into context because it did
not explicitly link to Australia Post‟s forecasts.
As for its demand forecasts, Australia Post‟s input cost forecasts (usually
consisting of a quantity variable and possibly a price variable, such as FTEs
and wages to derive labour costs) were not derived or checked using a
statistical methodology. This made it difficult to assess the input cost
Public version May 2010 | Frontier Economics 3
Final Introduction
forecasts, and we consequently examined the forecasts primarily against
historical trends.
The input cost forecasts were broadly in line with historical trends. However,
given the forecast declines in letter volumes, this was problematic. It implied
little to no relationship between the forecast lower volumes and Australia
Post‟s costs, which was not consistent with international experience.
1.2 Process of this review
This review considers the new information provided by Australia Post in its April
2010 Notification to support the proposed price increases. Our task has been to
assess whether the new approaches taken to forecasting volumes and input costs
by Australia Post are reasonable for a regulated firm using a building-block
pricing model.
In undertaking this task, we have:
● Reviewed the material on volumes and input costs in the Notification and
supporting material provided to us by Australia Post.
● Requested some further information from Australia Post.
● Conducted a review of the econometric analysis performed by Diversified
Specifics to forecast baseline mail volumes. This included:
Reviewing Diversified Specifics March 2010 report that provides an
overview of the development of the models.
Reviewing Diversified Specifics modelling outputs provided in a number
of supporting documents, including the results of structural break testing,
variables selection, and unit root and cointegration testing.
Performing quality assurance of the forecasting models by reproducing
the modelling results based on the raw data provided to us.
● Reviewed and analysed the following data:
Volume forecasts generated by Australia Post, including the use of
augmentations to the baseline econometric forecasts.
Cost and quantity of input forecasts generated by Australia Post.
1.3 This report
The remainder of this report is structured as follows:
● In section 2, we analyse the volume forecasts used by Australia Post in the
Notification.

4 Frontier Economics | May 2010 Public version
Introduction
● In section 3, we analyse the input forecasts used by Australia Post in the
Notification.
Public version May 2010 | Frontier Economics 5
Final Volume forecasts
2 Volume forecasts
2.1 Background
As discussed in the introduction to this report, Frontier was engaged by the
ACCC to review mail volume forecasts in Australia Post‟s July 2009 Draft
Notification. A key finding was that Australia Post‟s forecasting methodology
was not transparent and therefore not amenable to a critical review. We were
sympathetic to its views that forecasting mail demand was difficult in an
environment of falling volumes, when, historically, volumes had been rising.
However, we concluded that a two-stage forecasting framework could be
adopted which could increase forecasting integrity and give Australia Post an
opportunity to use its specific market intelligence in the forecasts.
In the first of the two stages, an econometric model would be used to produce
baseline volume forecasts. The second stage would entail adjusting the baseline
forecasts to reflect Australia Post‟s market intelligence about anticipated
behavioural changes that were not captured in the econometric model.1
Australia Post has adopted our recommended approach in its April 2010
Notification. Its forecasting process consisted of:
“development of several dynamic econometric models to provide baseline
volume forecasts; and
augmentation of these baseline forecasts to incorporate management opinion
and further market intelligence.”2
The high-level approach adopted by Australia Post is now in line with the
internationally-accepted leading practices in mail volume forecasting.
In the following analysis, we set out our investigation of Australia Post‟s
implementation of the forecasting methodology. We provide comments on both
the econometric analysis used to derive the baseline forecasts, and the
augmentations to these forecasts applied by Australia Post. We also recommend
some changes and extensions that could be adopted to improve the forecasts.
1 Frontier Economics, “Review of Australia Post‟s volume and input cost forecasts,” November 2009.
2 April 2010 Notification, p.9.
6 Frontier Economics | May 2010 Public version
Volume forecasts
2.2 Baseline forecasts derived by Diversified
Specifics
Australia Post‟s baseline forecasts were developed by Diversified Specifics using
an error correction modelling framework. As noted in Frontier‟s 2009 report
(p.32), this modelling framework is the foremost approach in forecasting mail
volumes. It provides for a long term equilibrium relationship between mail
volume and the main mail volume drivers, while also allowing for short term
dynamics in the modelled relationship.
Although Diversified Specifics has now adopted a sophisticated approach to mail
volume forecasting, the specific details of the modelling implementation are
important. In the following sections, we review the overall modelling approach
and the specific details of its econometric analyses.
2.2.1 Modelling approach
The approach used by Diversified Specifics to develop the econometric models
used to produce the baseline volume forecasts for each of the four letter types
consists of the following successive steps:
testing for structural breaks and selection of the estimation period
variable selection
testing for non-stationarity of the variables and testing for cointegration
estimating a vector error correction model (VECM).
In the first step, Diversified Specifics posited a preliminary long run static (LRS)
model for each letter type and tested it for a structural break within the sample
period.3 Where a structural break coincided with a known change in postal office
practices, such as the closure of the unbarcoded pre-sort service, Diversified
Specifics included a dummy variable to account for the break. Where a structural
break occurred at a time point with no obvious explanation, Diversified Specifics
truncated the sample at the break point and only used the later period in further
analysis.
We understand (from the background materials provided to us) that the models
resulting from this step were then taken as the starting point for the next step –
variable selection.4 Using insights from its previous mail volume studies,
3 We discuss this step in more detail below.
4 However, this does not seem to be the case for “other large letter” volumes. The preliminary LRS
model, which was used to test for structural breaks, included a dummy variable for the economic
downturn and was estimated over the 2001Q2 to 2009Q3 period. When performing variable
selection, Diversified Specifics started with a model that excluded the dummy variable for the
economic downturn and was estimated over the period 2001Q3 to 2009Q3.
Public version May 2010 | Frontier Economics 7
Final Volume forecasts
Diversified Specifics tested the four preliminary LRS models by including
alternative and additional variables to derive the preferred specification for each
model. Diversified Specifics chose the preferred LRS model for each letter type
based on data availability, diagnostic tests and common sense checks.
Diversified Specifics‟ first two steps, in which the preferred LRS model for each
letter type is determined, were undertaken before the selected variables were
tested for stationarity and cointegration.5 This is not the commonly accepted
approach to time series modelling, as it could lead to incorrect inferences about
the relationship between the dependent and explanatory variables. Specifically,
the critical values of the tests for structural breaks used by Diversified Specifics
are incorrect when using non-stationary data,6 as are the critical values of t-
statistics used to decide on the inclusion/exclusion of variables.7 Hence, the
decisions made by Diversified Specifics in regard to the appropriate estimation
period and the inclusion or exclusion of variables from the preferred model are
based on invalid tests.
Our view is that the correct approach would have been to first establish that non-
stationary time series are cointegrated (i.e. that there is a long run relationship
between the variables of interest), and then rely on the t-statistics in the VECM
to select a preferred model; or, alternatively, to use one of the non-VECM
approaches discussed in Lim and Martin.8 We acknowledge that this could be
laborious work if the number of potential explanatory variables is large. As an
alternative, differencing all variables (to make them stationary) and then testing
their explanatory power could potentially have provided insight into which
variables are good candidates for the inclusion into the preferred model. Without
performing a considerable amount of additional analysis, it is difficult to assess
whether a different model would have been selected as the preferred model for
each letter type if either of our suggested approaches were followed.
2.2.2 Structural Breaks9
Using the econometric package, EViews, Diversified Specifics performed the
Quandt-Andrews (Q-A) test to test for structural breaks in the parameters of the
5 In its March 2010 report (p. 6), Diversified Specifics states that “[o]nce the preferred log run model
has been selected all member variables are then checked for non-stationarity via a series of unit root
checks and ultimately cointegration.”
6 See Hansen, B. (1992), “Tests for parameter instability in regressions with I(1) processes”, Journal of
Business and Economic Statistics, 10, 321-335.
7 See, for example, Franses, P. (1998), Time Series Models for Business and Economic Forecasting, p.201.
8 Lim, G. and Martin, V. (1995), “Regression-based cointegration estimators with applications”.
Journal of Economic Studies, 20(1), 3-22.
9 This section presents our review of the modelling results reported in the document titled “10 02 28
Structural Break Tests for AP (Sent).”
8 Frontier Economics | May 2010 Public version
Volume forecasts
preliminary LRS models. This is a standard approach in applied econometrics to
testing for unknown breaks.10 EViews enables the parameters included in a
model to be tested for breaks individually or together. Diversified Specifics used
the latter approach.
When variables are tested together, the joint null hypothesis of no structural
break in any of the parameters is tested against the alternative hypothesis that at
least one of the parameters has a break over the sample period. Hence, the
inference from rejecting the null hypothesis is that there is a break in at least one
of the parameters, but the test does not identify the specific parameter(s).
Additional tests could be performed in EViews to investigate this. Such tests
could have important policy implications as they could identify, for example,
whether in addition to a shift in the level of the dependent variable, there has
been a change in one of the slope parameters, such as the price elasticity.
After identifying a break date with the Q-A test, Diversified Specifics‟ approach
was to account for any structural break which coincided with a known change in
postal office practices, such as the closure of the unbarcoded pre-sort service, by
including a dummy variable in the LRS model, thus explicitly assuming that the
break occurred only in the intercept. It is unclear whether Diversified Specifics
tested for breaks in any of the other parameters in the models, and/or why they
decided against allowing for such breaks. Without such an explanation, the
approach seems inconsistent with the Q-A test performed (where all variables
were tested for a break together, rather than individually).
Box 1 summarises key structural-break modelling issues specific to each letter
type.
Box 1: Summary of specific modelling issues
Other small letters
Testing for additional structural breaks using a sequence of Chow tests is based on a
criterion that is inconsistent with how the break date is determined using the Q-A test.
Structural breaks are controlled for differently - one break is controlled for by including a
binary variable to allow for a shift in the intercept, while the second break is controlled by
truncating the sample. No explanation is provided to justify different modelling approaches.
Pre-sort small letters
Structural break modelled in the preliminary LRS model (1999Q4) is different from the
structural break identified with the Q-A test (2002Q3).
10 As mentioned earlier, the critical values for the standard Q-A test require that the variables in the
equation are stationary. Diversified Specifics‟ subsequent testing for unit roots indicates that this is
not a valid assumption for any of the letter types. While this is cause for concern in its own right, we
put this issue to one side to focus on other concerns we have with the way Diversified Specifics
tested for structural breaks.
Public version May 2010 | Frontier Economics 9
Final Volume forecasts
Other large letters
The preliminary LRS model used for structural break testing already includes two dummy
variables for structural breaks in the intercept. This approach is inconsistent with the
approach employed for other letter types where the preliminary LRS model had no dummy
variables.
Additional structural break testing is done by sequentially truncating the sample by one
quarter until the sample period yields statistically significant estimates. This is not a standard
way of testing for structural breaks.
Pre-sort large letters
Replicating Diversified Specifics’ structural break analysis using the Q-A test in EViews 6, we
find the breakpoint at the same date as Diversified Specifics. However, unlike Diversified
Specifics, we find the result to be statistically significant.11
A more technically detailed discussion of the issues above was provided to the ACCC as part
of our draft report.
Source: Frontier Economics
2.2.3 VECM
Once Diversified Specifics established the preferred LRS model for each letter
type, it undertook a sequence of standard tests to develop a preferred VECM for
each letter type. Specifically, Diversified Specifics first tested variables included in
the LRS models for stationarity. Finding those variables to be difference
stationary, Diversified Specifics proceeded to test whether there were
cointegrating relations among the variables included in each model. Testing for
cointegration was done by specifying VECMs with different deterministic
components (i.e. intercept and trend) and, subsequently, different lag structures.
For each letter type, the VECM with one cointegrating vector was selected as the
preferred model.
Frontier reviewed the modelling results and has no issues with the analyses
performed.
2.2.4 Assumptions - GDP and CPI forecasts
In deriving volume forecasts, Diversified Specifics used forecasts for non-farm
gross domestic product (GDP) growth rate and consumer price index (CPI)
provided by Australia Post. From the information provided in the Notification
(p. 14), it is not clear how Australia Post derived those forecasts.12 Rather than
11 We obtain different values to Diversified Specifics for the maximum Wald F-statistic. The difference
in the values of the maximum Wald test statistics for the Q-A test is most likely due to a coding
error for this test reported by EViews; a patch is available on the company‟s website.
12 Australia Post states that its major sources of information were the Reserve Bank of Australia,
Access Economics, and the Commonwealth Treasury, while it also considered information from the
International Monetary Fund, the Organisation for Economic Co-operation and Development, the
National Australia Bank and The Economist.
10 Frontier Economics | May 2010 Public version
Volume forecasts
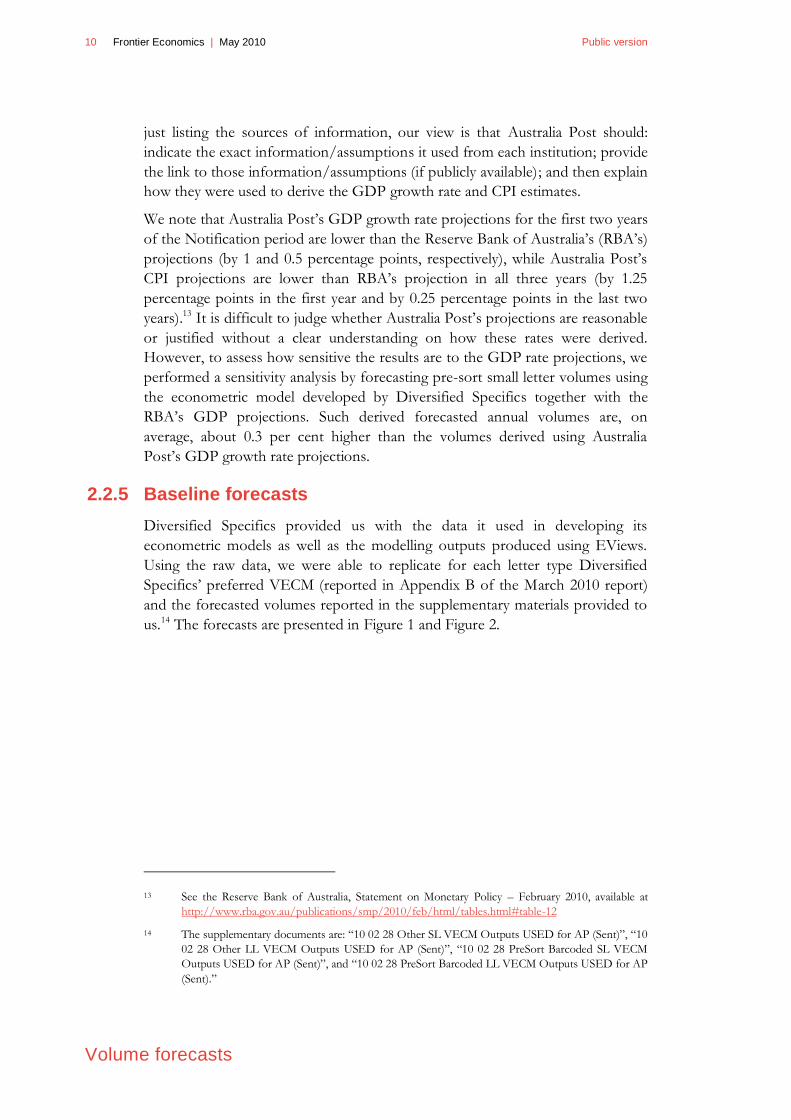
just listing the sources of information, our view is that Australia Post should:
indicate the exact information/assumptions it used from each institution; provide
the link to those information/assumptions (if publicly available); and then explain
how they were used to derive the GDP growth rate and CPI estimates.
We note that Australia Post‟s GDP growth rate projections for the first two years
of the Notification period are lower than the Reserve Bank of Australia‟s (RBA‟s)
projections (by 1 and 0.5 percentage points, respectively), while Australia Post‟s
CPI projections are lower than RBA‟s projection in all three years (by 1.25
percentage points in the first year and by 0.25 percentage points in the last two
years).13 It is difficult to judge whether Australia Post‟s projections are reasonable
or justified without a clear understanding on how these rates were derived.
However, to assess how sensitive the results are to the GDP rate projections, we
performed a sensitivity analysis by forecasting pre-sort small letter volumes using
the econometric model developed by Diversified Specifics together with the
RBA‟s GDP projections. Such derived forecasted annual volumes are, on
average, about 0.3 per cent higher than the volumes derived using Australia
Post‟s GDP growth rate projections.
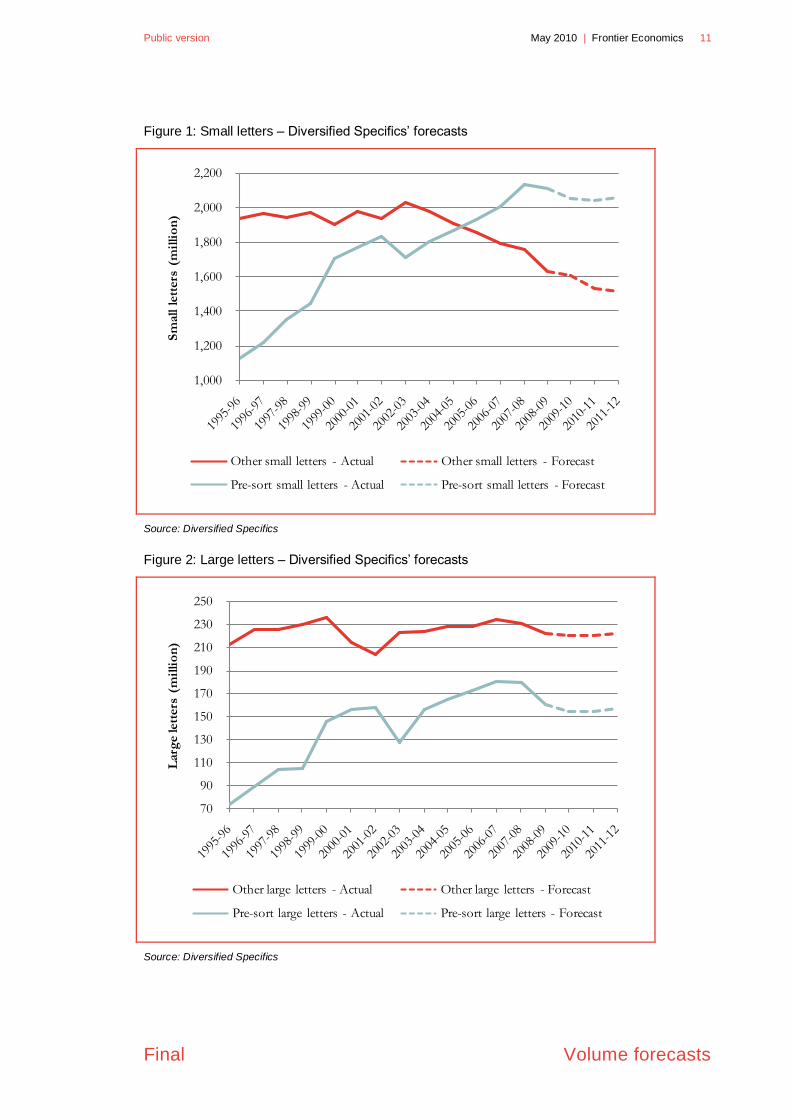
2.2.5 Baseline forecasts
Diversified Specifics provided us with the data it used in developing its
econometric models as well as the modelling outputs produced using EViews.
Using the raw data, we were able to replicate for each letter type Diversified
Specifics‟ preferred VECM (reported in Appendix B of the March 2010 report)
and the forecasted volumes reported in the supplementary materials provided to
us.14 The forecasts are presented in Figure 1 and Figure 2.
13 See the Reserve Bank of Australia, Statement on Monetary Policy – February 2010, available at
http://www.rba.gov.au/publications/smp/2010/feb/html/tables.html#table-12
14 The supplementary documents are: “10 02 28 Other SL VECM Outputs USED for AP (Sent)”, “10
02 28 Other LL VECM Outputs USED for AP (Sent)”, “10 02 28 PreSort Barcoded SL VECM
Outputs USED for AP (Sent)”, and “10 02 28 PreSort Barcoded LL VECM Outputs USED for AP
(Sent).”
Public version May 2010 | Frontier Economics 11
Final Volume forecasts
Figure 1: Small letters – Diversified Specifics’ forecasts
Source: Diversified Specifics
Figure 2: Large letters – Diversified Specifics’ forecasts
Source: Diversified Specifics
1,000
1,200
1,400
1,600
1,800
2,000
2,200 S
mall l
ett
ers
(m
illi
on
)
Other small letters - Actual Other small letters - Forecast
Pre-sort small letters - Actual Pre-sort small letters - Forecast
70
90
110
130
150
170
190
210
230
250
Larg
e lett
ers
(m
illi
on
)
Other large letters - Actual Other large letters - Forecast
Pre-sort large letters - Actual Pre-sort large letters - Forecast
12 Frontier Economics | May 2010 Public version
Volume forecasts
2.3 Forecasts derived by Australia Post
2.3.1 Baseline forecasts for 2009/10
Information provided in Appendix 3 of the Notification suggests that Australia
Post did not rely on econometric modelling to derive forecasts for the four letter
types for 2009/10, the first year in the price notification period. Other than
noting that it considered the actual volumes for the first six months of 2009/10
when forecasting volumes for the entire financial year (p. 8), Australia Post did
not provide any explanation as to how the volume forecasts for the year were
derived.
Following the submission of the Notification, Australia Post provided new
forecasts for 2009/10 which were based on nine months of actual volumes. The
difference between these forecasts and the forecasts in the Notification is
relatively small, ranging in magnitude (in absolute terms) from 0.01 per cent to
1.17 per cent across the four letter types. Although this comparison does not
clarify Australia Post‟s forecasting methodology, it does provide some confidence
that the forecasts for 2009/10 provided in the Notification are realistic.
2.3.2 Baseline forecasts for 2010/11 and 2011/12
Approach
Australia Post did not use the forecasted volumes from Diversified Specifics‟
econometric model as its baseline estimates. Rather, for each year it calculated
the annual growth rate in Diversified Specifics‟ forecasted volumes, and then
applied that growth rate to the forecast for the prior year‟s letter volume to
calculate an “econometric baseline” forecast for the next year. Using growth rates
from the econometric model, rather than the estimated volumes from the
econometric model, is a reasonable approach as long as the baseline volumes in
the initial forecast year, to which the growth rates are applied, are transparent and
justified.
As noted in the previous section, it is not transparent how the baseline volumes
in the initial forecast year (i.e. 2009/10) were derived; however, based on the
additional information provided those forecasts appear realistic.
Assumptions
For other small letters, Diversified Specifics produced three volume forecasts by
changing the assumption on the growth rate of the nominal price (which was
treated as an exogenous variable). The assumptions were: (1) no increase in the
nominal price; (2) increase in the nominal price in April 2010; and (3) increase in
the nominal price in July 2010. Australia Post used this last series when
calculating the average annual growth rate in volumes.
Public version May 2010 | Frontier Economics 13
Final Volume forecasts
For the pre-sort small and pre-sort large letter types, Diversified Specifics
produced two forecasts: (1) assuming no change in the consumer discretionary
index; and (2) assuming that the consumer discretionary index will continue to
decline at the same annual average rate of 8.83 per cent as it has since 2000/01.
Australia Post used the former series (with the conservative assumption of no
change in the index) when calculating the average annual change in letter
volumes.
The assumptions used in forecasting volumes are reasonable.
2.3.3 Adjusted forecasts
To derive the final forecast volumes for each letter type, Australia Post adjusted
the baseline forecast volumes to reflect management opinion and market
intelligence that could not have been captured in the econometric model.
We note the following issues with Australia Post‟s approach:
● Although Australia Post did provide an overview of the factors it considered
in deriving the adjustments (see p.10 and pp.39-40 in the Notification), it is
not transparent how Australia Post quantified the effect of each factor.
Australia Post should have provided a more detailed explanation of how the
adjustments were calculated, what assumptions were used, and the basis for
those assumptions.15 It should also have distinguished between factors that
were not captured in the econometric model (for example, due to data issues)
and the factors that were included in the model in some form (such as
technological change), but where Australia Post believes that the prior
relations between the mail volumes and those factors are likely to change
over the notification period. A more detailed explanation is necessary for the
following reasons:
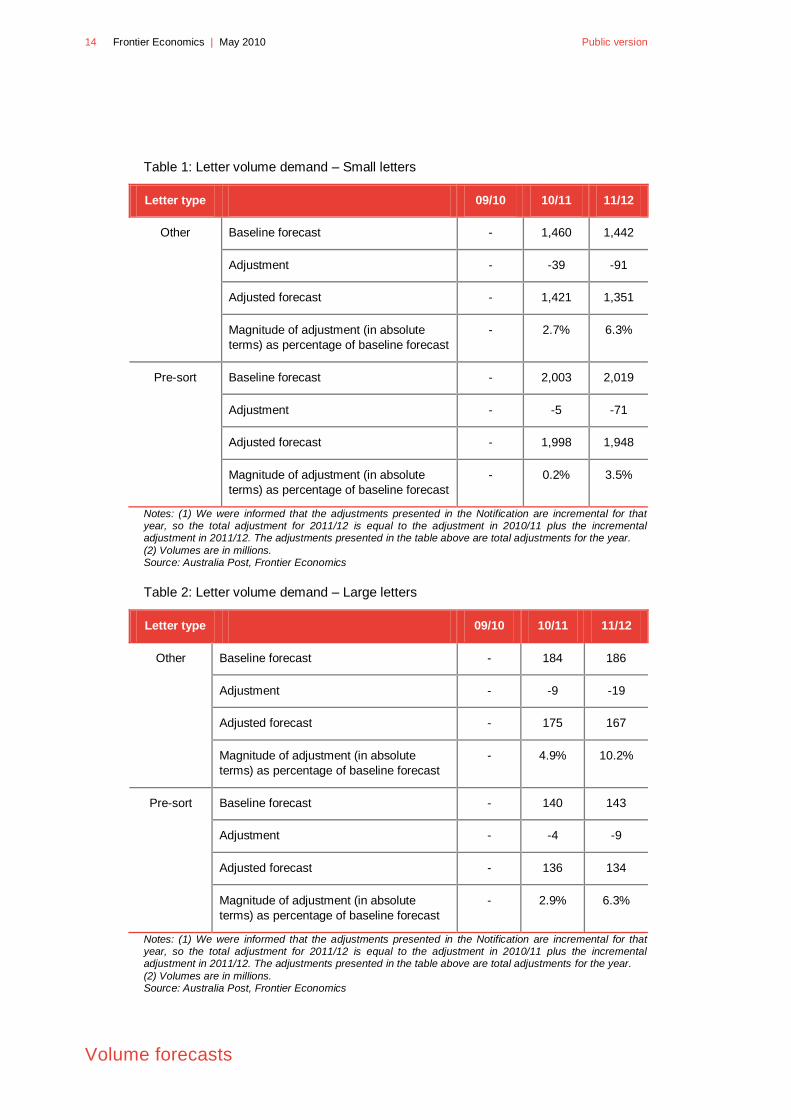
The magnitude of the adjustments is non-trivial. In 2011/12 the total
adjustment for each letter type ranges from 3.5 per cent (pre-sort small
letters) to 10.2 per cent (other large letters) of the Australia Post
econometric baseline forecast (see Table 1 and Table 2).
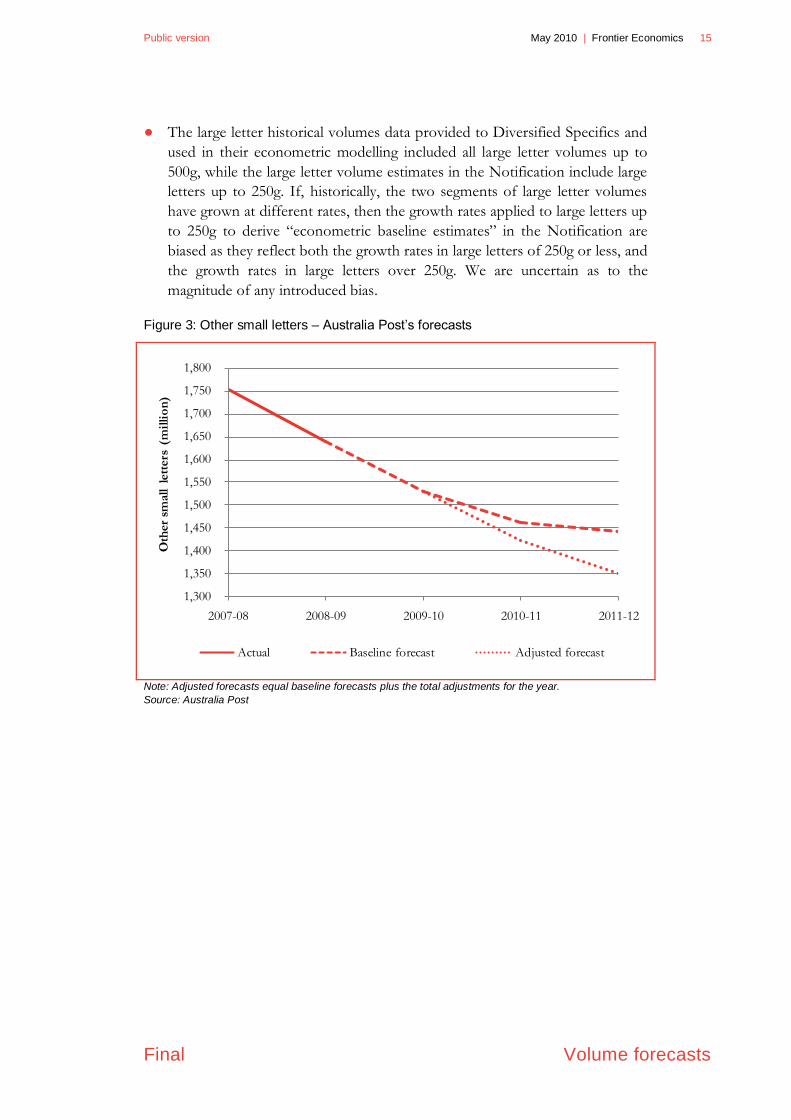
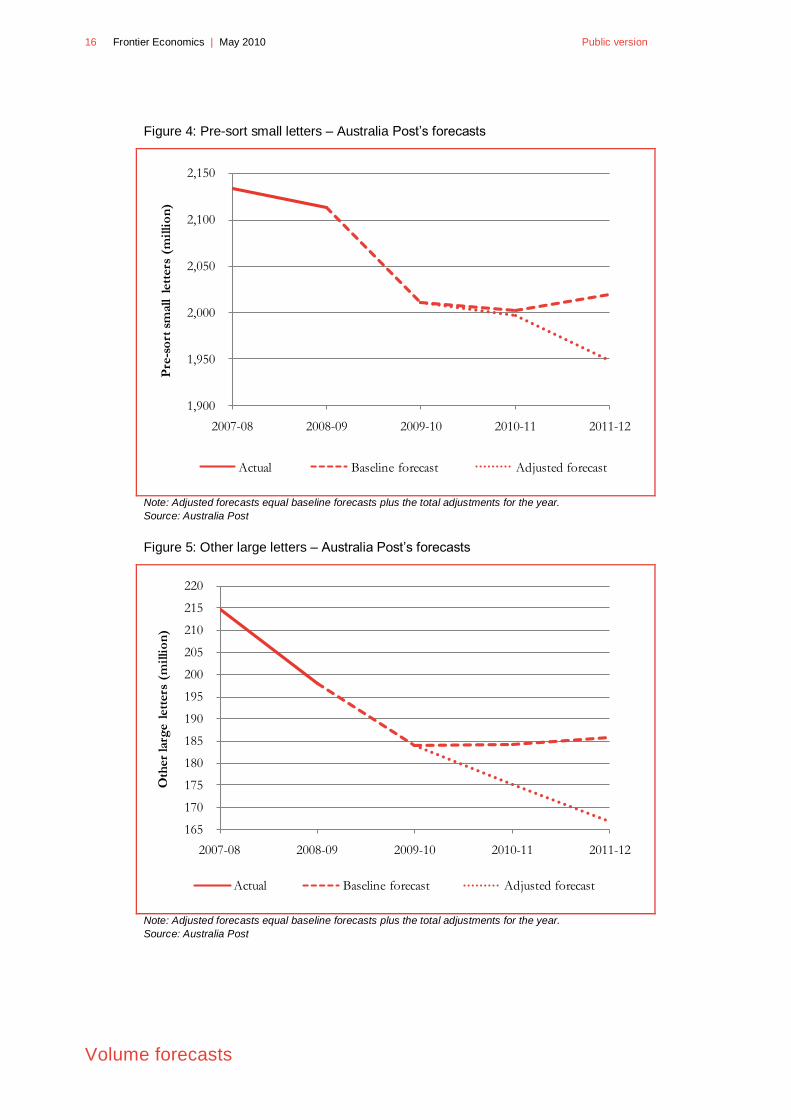
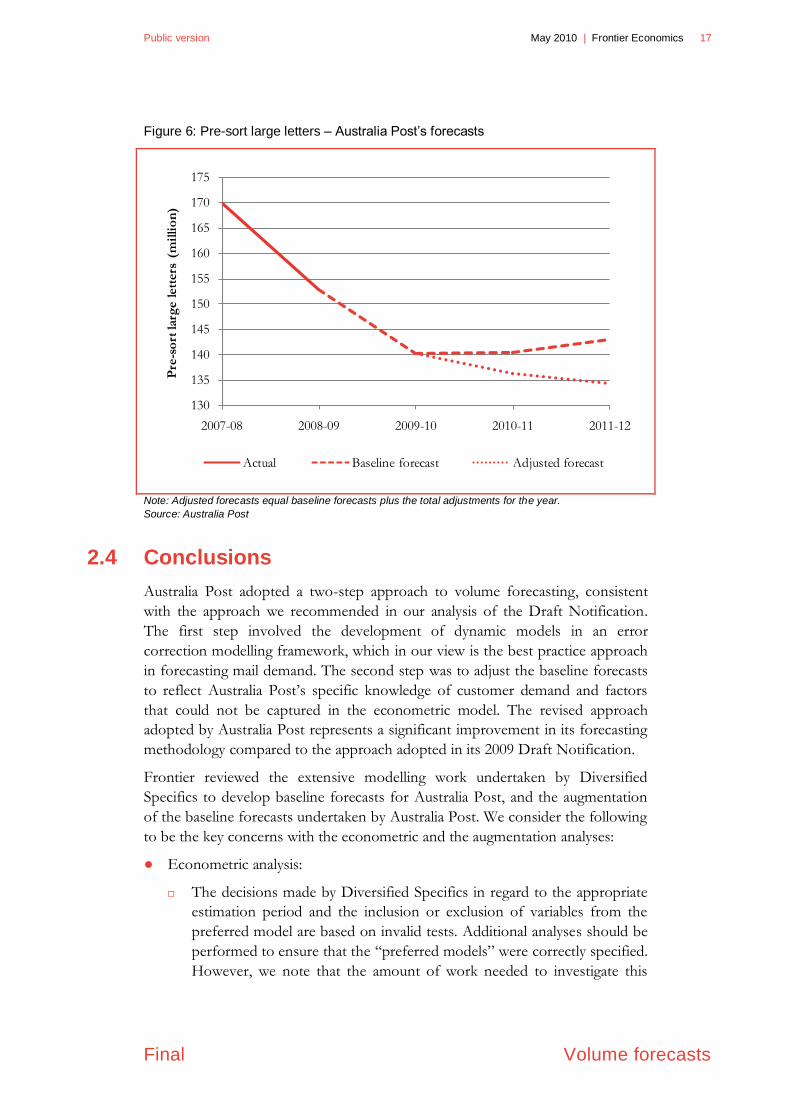
The sign and the magnitude of the adjustments result in a continuous
decrease in letter volumes over the notification period across all four
letter types even though the econometric model predicts an increase in
some cases (see Figure 3 to Figure 6).
15 For example, Australia Post augmented the 2010/11 baseline estimate for pre-sort letters by 35
million letters to reflect expected increase in volumes resulting from the Federal elections. It would
be informative to know whether this estimate is based on a contract that Australia Post is in the
process of negotiating with the Federal Government, or whether it is based on the past experience.
14 Frontier Economics | May 2010 Public version
Volume forecasts
Table 1: Letter volume demand – Small letters
Letter type 09/10 10/11 11/12
Other Baseline forecast - 1,460 1,442
Adjustment - -39 -91
Adjusted forecast - 1,421 1,351
Magnitude of adjustment (in absolute
terms) as percentage of baseline forecast
- 2.7% 6.3%
Pre-sort Baseline forecast - 2,003 2,019
Adjustment - -5 -71
Adjusted forecast - 1,998 1,948
Magnitude of adjustment (in absolute
terms) as percentage of baseline forecast
- 0.2% 3.5%
Notes: (1) We were informed that the adjustments presented in the Notification are incremental for that year, so the total adjustment for 2011/12 is equal to the adjustment in 2010/11 plus the incremental adjustment in 2011/12. The adjustments presented in the table above are total adjustments for the year.
(2) Volumes are in millions. Source: Australia Post, Frontier Economics
Table 2: Letter volume demand – Large letters
Letter type 09/10 10/11 11/12
Other Baseline forecast - 184 186
Adjustment - -9 -19
Adjusted forecast - 175 167
Magnitude of adjustment (in absolute
terms) as percentage of baseline forecast
- 4.9% 10.2%
Pre-sort Baseline forecast - 140 143
Adjustment - -4 -9
Adjusted forecast - 136 134
Magnitude of adjustment (in absolute
terms) as percentage of baseline forecast
- 2.9% 6.3%
Notes: (1) We were informed that the adjustments presented in the Notification are incremental for that year, so the total adjustment for 2011/12 is equal to the adjustment in 2010/11 plus the incremental adjustment in 2011/12. The adjustments presented in the table above are total adjustments for the year.
(2) Volumes are in millions. Source: Australia Post, Frontier Economics
Public version May 2010 | Frontier Economics 15
Final Volume forecasts
● The large letter historical volumes data provided to Diversified Specifics and
used in their econometric modelling included all large letter volumes up to
500g, while the large letter volume estimates in the Notification include large
letters up to 250g. If, historically, the two segments of large letter volumes
have grown at different rates, then the growth rates applied to large letters up
to 250g to derive “econometric baseline estimates” in the Notification are
biased as they reflect both the growth rates in large letters of 250g or less, and
the growth rates in large letters over 250g. We are uncertain as to the
magnitude of any introduced bias.
Figure 3: Other small letters – Australia Post’s forecasts
Note: Adjusted forecasts equal baseline forecasts plus the total adjustments for the year.
Source: Australia Post
1,300
1,350
1,400
1,450
1,500
1,550
1,600
1,650
1,700
1,750
1,800
2007-08 2008-09 2009-10 2010-11 2011-12
Oth
er s
mal
l le
tter
s (m
illi
on
)
Actual Baseline forecast Adjusted forecast
16 Frontier Economics | May 2010 Public version
Volume forecasts
Figure 4: Pre-sort small letters – Australia Post’s forecasts
Note: Adjusted forecasts equal baseline forecasts plus the total adjustments for the year.
Source: Australia Post
Figure 5: Other large letters – Australia Post’s forecasts
Note: Adjusted forecasts equal baseline forecasts plus the total adjustments for the year.
Source: Australia Post
1,900
1,950
2,000
2,050
2,100
2,150
2007-08 2008-09 2009-10 2010-11 2011-12
Pre
-so
rt s
mall le
tters
(m
illi
on
)
Actual Baseline forecast Adjusted forecast
165
170
175
180
185
190
195
200
205
210
215
220
2007-08 2008-09 2009-10 2010-11 2011-12
Oth
er
larg
e l
ett
ers
(m
illi
on
)
Actual Baseline forecast Adjusted forecast
Public version May 2010 | Frontier Economics 17
Final Volume forecasts
Figure 6: Pre-sort large letters – Australia Post’s forecasts
Note: Adjusted forecasts equal baseline forecasts plus the total adjustments for the year.
Source: Australia Post
2.4 Conclusions
Australia Post adopted a two-step approach to volume forecasting, consistent
with the approach we recommended in our analysis of the Draft Notification.
The first step involved the development of dynamic models in an error
correction modelling framework, which in our view is the best practice approach
in forecasting mail demand. The second step was to adjust the baseline forecasts
to reflect Australia Post‟s specific knowledge of customer demand and factors
that could not be captured in the econometric model. The revised approach
adopted by Australia Post represents a significant improvement in its forecasting
methodology compared to the approach adopted in its 2009 Draft Notification.
Frontier reviewed the extensive modelling work undertaken by Diversified
Specifics to develop baseline forecasts for Australia Post, and the augmentation
of the baseline forecasts undertaken by Australia Post. We consider the following
to be the key concerns with the econometric and the augmentation analyses:
● Econometric analysis:
The decisions made by Diversified Specifics in regard to the appropriate
estimation period and the inclusion or exclusion of variables from the
preferred model are based on invalid tests. Additional analyses should be
performed to ensure that the “preferred models” were correctly specified.
However, we note that the amount of work needed to investigate this
130
135
140
145
150
155
160
165
170
175
2007-08 2008-09 2009-10 2010-11 2011-12
Pre
-so
rt larg
e l
ett
ers
(m
illi
on
)
Actual Baseline forecast Adjusted forecast
18 Frontier Economics | May 2010 Public version
Volume forecasts
issue is likely to be considerable as testing for structural breaks and
variable selection with non-stationary variables is not a straightforward
exercise.
In modelling small pre-sort letters, Diversified Specifics controlled for a
structural break at the date different than the one identified by the Q-A
test. Controlling for a structural break identified by the Q-A test would
have resulted in different parameter estimates and, therefore, different
forecasts.
● Augmentation analysis:
Australia Post has not transparently quantified the effect of each factor
considered in deriving the adjustments for the baseline forecasts and
whether their inclusion is justified.
It is not clear from the Notification to what extent the adjustments were
necessary because the volume-drivers were not captured in the model,
and to what extent the adjustments were needed because Australia Post
expects that the prior relations between the mail volumes and those
volume-drivers are likely to change over the notification period.
Public version May 2010 | Frontier Economics 19
Final Cost forecasts
3 Cost forecasts
3.1 Introduction
As with our approach to volume forecasts, we assess the cost forecasts on the
basis that Australia Post‟s methodology for forecasting costs should meet certain
standards. These forecasts should ideally:
● be clear in their derivation, with key assumptions documented (along with the
basis for making them)
● bear some relationship to historical trends, and, where they do not, there
should be a detailed explanation about the reasons for, and quantitative
significance of, any expected deviations
● allow for some flexibility, so that sensitivity analysis can be conducted (e.g.
using different macroeconomic forecasts).
In the following sections, we outline how the forecasts are presented and used in
the Notification. Then we turn to an examination of the forecasts themselves.
Similar to our approach in our November 2009 report, we:
● identify the major cost categories and identify how these are likely to change
over the forecast period
● compare these forecasts to relevant benchmarks or historical data
● identify the relationships that are implied between costs and volumes
● assess the material presented in support of the claimed cost volume
relationships.
3.2 Information supplied by Australia Post
The ACCC seeks a detailed description and analysis of the forecasts produced by
Australia Post, including consideration of whether it has sufficiently accounted
for cost-volume relationships and analysis of how the forecasts compare to
relevant benchmarks.
Australia Post says its new information focuses primarily on demonstrating the
efficiency of Australia Post‟s cost base, rather than justifying its cost forecasts
(see p. 13). This provides context for the lack of historical cost data in the
Notification. However, Australia Post was able to provide us with revised data
series including the historical data that was supplied to us in preparing our
November report.
20 Frontier Economics | May 2010 Public version
Cost forecasts
Compared to the 2009 draft notification, there is considerably more material
describing and quantifying the relationship between costs and volumes, and its
budgeting/forecasting method.
3.3 Cost structure and forecasts
Before turning to the forecasts of costs, it is useful to outline the cost trends and
the structure of Australia Post‟s cost base – both by function (retail, transport,
sorting and delivery) and by type (labour, capital and other). This is for three
reasons:
● it allows for focus on the more important categories of costs
● the relevant cost drivers for each function are likely to be quite different. In
particular, some functions are likely to be volume-sensitive (particularly mail
sorting) while other functions may not be (e.g. delivery costs tend to be more
sensitive to the number of delivery points in Australia Post‟s network)
● the trends give an indication of how costs are forecast to vary with volumes.
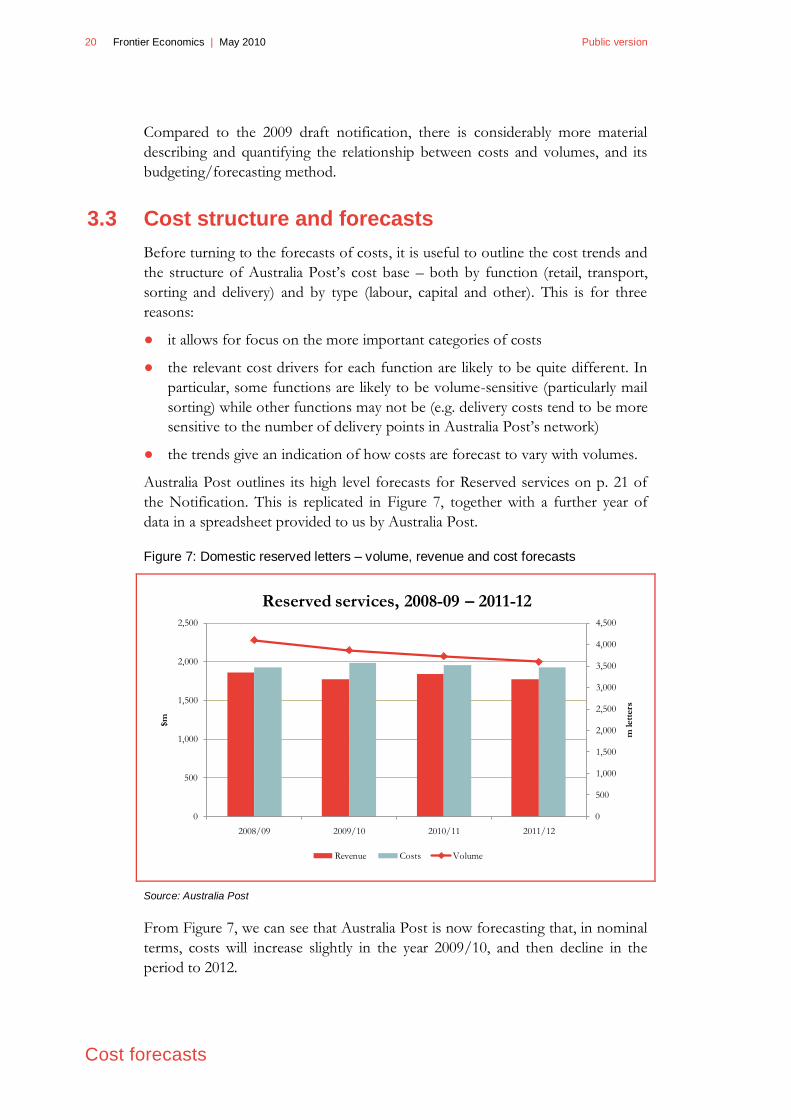
Australia Post outlines its high level forecasts for Reserved services on p. 21 of
the Notification. This is replicated in Figure 7, together with a further year of
data in a spreadsheet provided to us by Australia Post.
Figure 7: Domestic reserved letters – volume, revenue and cost forecasts
Source: Australia Post
From Figure 7, we can see that Australia Post is now forecasting that, in nominal
terms, costs will increase slightly in the year 2009/10, and then decline in the
period to 2012.
0
500
1,000
1,500
2,000
2,500
3,000
3,500
4,000
4,500
0
500
1,000
1,500
2,000
2,500
2008/09 2009/10 2010/11 2011/12
m lett
ers
$m
Reserved services, 2008-09 – 2011-12
Revenue Costs Volume
Public version May 2010 | Frontier Economics 21
Final Cost forecasts
Australia Post does not provide a breakdown of costs by expense type until the
year 2009/10. From this point until 2011/12, small declines in cost are forecast.
Further detail as to the source of these cost declines are in
Figure 8.
Figure 8: Forecast cost base for reserved services, by type of cost
Source: Australia Post
Overall, a key point of interest is whether the aggregate volume trend is closely
reflected in cost trends. There have clearly been cost reduction strategies
implemented since the July 2009 Draft Notification, which forecast nominal cost
increases along with volume falls. Figure 7 indicates a total fall in volumes of over
12 per cent is accompanied by a 0.1 per cent reduction in nominal costs.
However, in real terms, the cost reduction is 6.6 per cent – around 50 per cent of
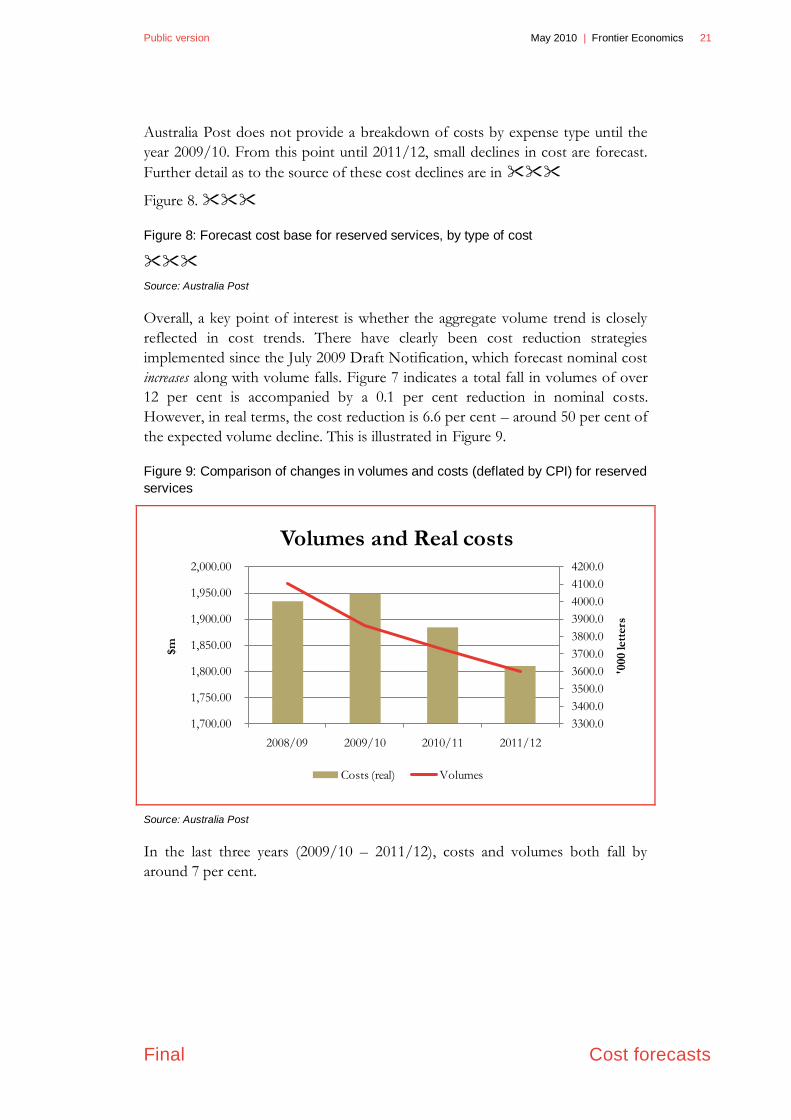
the expected volume decline. This is illustrated in Figure 9.
Figure 9: Comparison of changes in volumes and costs (deflated by CPI) for reserved
services
Source: Australia Post
In the last three years (2009/10 – 2011/12), costs and volumes both fall by
around 7 per cent.
3300.0
3400.0
3500.0
3600.0
3700.0
3800.0
3900.0
4000.0
4100.0
4200.0
1,700.00
1,750.00
1,800.00
1,850.00
1,900.00
1,950.00
2,000.00
2008/09 2009/10 2010/11 2011/12
'000 lett
ers
$m
Volumes and Real costs
Costs (real) Volumes
22 Frontier Economics | May 2010 Public version
Cost forecasts
3.4 Input cost forecasts
3.4.1 Overall approach
We suggested in the introduction to this section that the process of cost
forecasting should be subject to some scrutiny. The forecasting process adopted
should give some assurance that Australia Post‟s expenditures are prudent and
efficient, and will remain so over time.
We argued in our November 2009 report that for regulated businesses
forecasting approaches should be transparent and able to be effectively reviewed
by a third party. Such processes are relatively standard in regulatory processes.
Australia Post addresses its Corporate Plan and general budgeting process in
section 5.1 of the Notification. Australia Post suggests that the budget process (p.
14):
provides a structured and transparent approach to cost management based on
clear accountabilities for targeted savings across the management hierarchy,
and direct traceability for the fundamental cost drivers in the budget base.
Notwithstanding these claims, the information on costs provided by Australia
Post does not give much specific detail about how the cost forecasts have been
constructed, and/or what assumptions underlie them. For example, from Tables
5 and 6 and surrounding text we know that: Australia Post has assumed certain
values for CPI, GDP and wage growth; that these assumptions are related in
some way to forecasts produced by, inter alia, the Reserve Bank of Australia,
Access Economics and the Commonwealth Treasury; and that “the outcome of
future wage negotiations will trend in a similar way to changes in the ABS labour
data” (p. 14). However, we do not know exactly how the CPI, GDP and wage
growth figures have been calculated, whether alternative parameter values would
affect any of the cost estimates, or how Australia Post believes that future wage
growth will be consistent with the ABS labour data.
This limits our ability to scrutinise the forecasts. The best we can do is to review
historic trends for cost categories and to identify the quantitative significance of
deviations from trends, and the acceptability of any provided explanation for
such deviations (including whether the forecast cost change is consistent with
forecast volume changes).
We further note that, notwithstanding issues with the transparency of the
methodology, Australia Post‟s forecasts could have been supported with
reference to benchmarking on the efficiency of its costs over time, such as
benchmarking against international postal service operators or other regulated
industry sectors. We understand that such analysis was part of its Draft
Notification in 2009, but the ACCC did not consider this analysis demonstrated
that Australia Post has been, and is presently, one of the world‟s most productive
postal operators. No new material was submitted as part of this Notification.
Public version May 2010 | Frontier Economics 23
Final Cost forecasts
We now turn to the particular categories of costs and how these are forecast to
change.
3.4.2 Operations and maintenance costs
Labour
A large proportion of reserved service costs – over 60% – are labour related.
Forecasts for labour quantities and costs were provided by Australia Post for
reserved services16. These are shown in the figure below, together with historical
trend data that was initially derived by Australia Post‟s consultant, Economic
Insights, using data provided to it for earlier TFP studies.
Figure 10: Reserved service labour costs and FTEs, actual and forecast
The chart reveals that:
●
● Labour prices are forecast to increase in nominal terms.
● .
Labour prices, defined as labour costs divided by FTEs, are highlighted in Figure
11. Australia Post notes at p.14 of the Notification that it has an agreement with
relevant staff associations to provide wage increases up until December 2010.
Beyond this point it assumes that the outcomes of wage negotiations will trend in
a similar was to changes in the ABS labour data. To confirm this, we mapped a
simple linear trend onto historic wage trends. This indicates that Australia Post‟s
forecast changes to labour prices are consistent with historic trends – .
Figure 11: Australia Post’s labour prices
In Figure 12, we further examine the source and scale of the FTE reductions.
. This is important in the context of the cost and volume relationships
that are discussed in Section 3.5.
Figure 12: Forecast FTEs
16 Spreadsheet „Reserved Service History and FTEs 2010.xls‟.
24 Frontier Economics | May 2010 Public version
Cost forecasts
Contractors
Australia Post uses a range of contractors to deliver mail.
In our November report, we noted that historic data on contract costs suggested
that these have been rising faster than labour costs generally, although the rate of
increase in costs is forecast to fall slightly. We had a concern that the reasons
given by Australia Post at that time (effectively, that contract costs were
increasing due to higher input costs (wages, fuel, etc) and a tightening labour
market) did not provide a justification for future cost rises. Given the general
downturn in postal volumes, this seemed a key area where cost restraint must be
exercised.
In Figure 13, contractor volumes and costs are reproduced. Costs are forecast to
increase between 2008/09 to 2011/12, which is a
improvement compared to the forecasts in the July 2009 Draft Notification,
which forecast cost increases . In real terms, the Notification forecasts
essentially . These cost trends must be seen in the context of falling
volumes, but also continued increases in delivery points over time.
Figure 13: Contractor costs and volumes – reserved services
3.4.3 Depreciation
Australia Post notes that Depreciation expense within the Notification is
unchanged from the Draft Notification. These allocations are not updated as
frequently as other cost items.
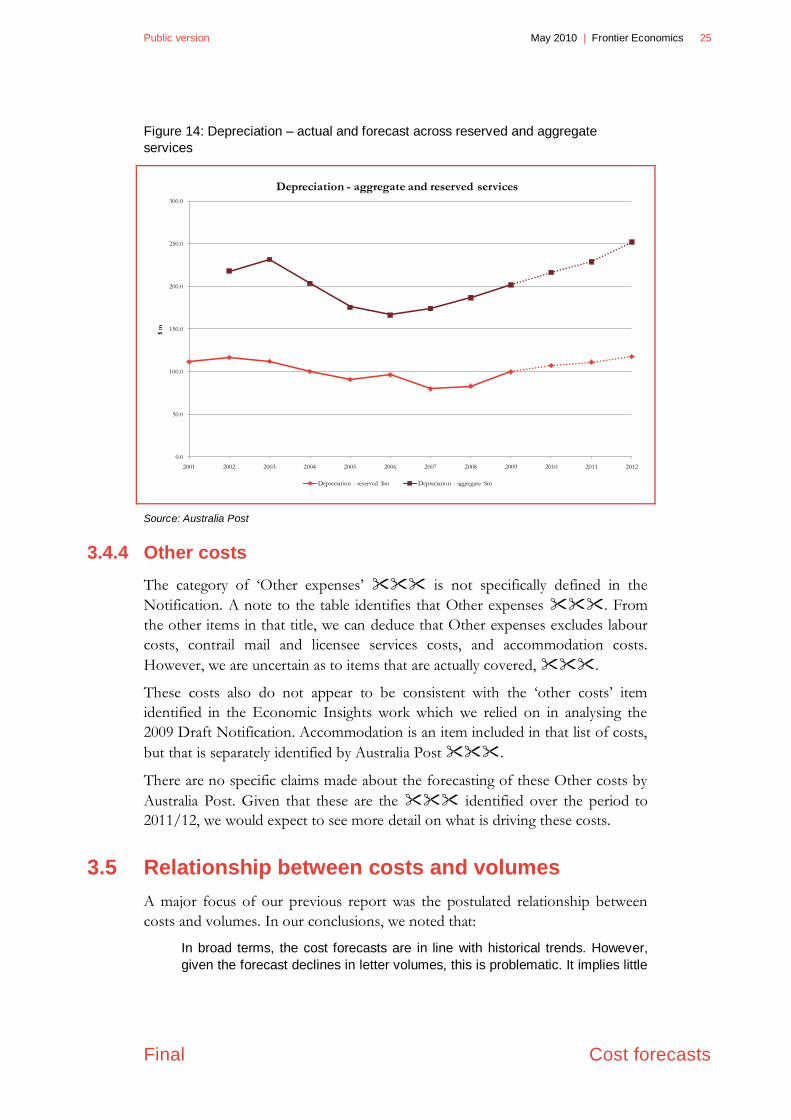
For completeness, we show the historic and forecast depreciation data both at an
aggregate level and for reserved services in Figure 14. Earlier periods in the series
show a decline in depreciation in both data sets. Since that time, the trend is
clearly upwards, commencing its upswing from the 2006/07 financial year. The
forecast levels do not look out of line with these more recent trends.
Public version May 2010 | Frontier Economics 25
Final Cost forecasts
Figure 14: Depreciation – actual and forecast across reserved and aggregate
services
Source: Australia Post
3.4.4 Other costs
The category of „Other expenses‟ is not specifically defined in the
Notification. A note to the table identifies that Other expenses . From
the other items in that title, we can deduce that Other expenses excludes labour
costs, contrail mail and licensee services costs, and accommodation costs.
However, we are uncertain as to items that are actually covered, .
These costs also do not appear to be consistent with the „other costs‟ item
identified in the Economic Insights work which we relied on in analysing the
2009 Draft Notification. Accommodation is an item included in that list of costs,
but that is separately identified by Australia Post .
There are no specific claims made about the forecasting of these Other costs by
Australia Post. Given that these are the identified over the period to
2011/12, we would expect to see more detail on what is driving these costs.
3.5 Relationship between costs and volumes
A major focus of our previous report was the postulated relationship between
costs and volumes. In our conclusions, we noted that:
In broad terms, the cost forecasts are in line with historical trends. However,
given the forecast declines in letter volumes, this is problematic. It implies little
0.0
50.0
100.0
150.0
200.0
250.0
300.0
2001 2002 2003 2004 2005 2006 2007 2008 2009 2010 2011 2012
$ m
Depreciation - aggregate and reserved services
Depreciation - reserved $m Depreciation - aggregate Sm
26 Frontier Economics | May 2010 Public version
Cost forecasts
to no relationship between the forecast lower volumes and Australia Post’s
costs.
Such an outcome would only be plausible if costs were completely inelastic to
volume, and our reading of Australia Post’s statements is that while much of
the network cost is fixed due to the need to maintain regulated delivery
standards, some cost savings are possible, particularly in the medium term.
Overseas studies of delivery and sorting functions also indicate that while there
are economies of density (that is, costs fall proportionally less than volumes),
there should be some reduction in costs from lower volumes.
3.5.1 Cost volume relationships in the Notification
As we have identified in section 3.3, Australia Post is now forecasting a
significant cost response to the lower expected volumes, with costs declining in
real terms by around half the expected volume decline.
In the Notification, Australia Post also provides a range of material on
relationships between costs and volumes, including an Appendix 6 which
contains parameters (said to be used for budgetary purposes) for potential cost
variability by function. This material is said to go to short run relationships
between costs and volumes, with a recognition (p. 22) that cost volume
elasticities can be expected to increase as a wider range of operational responses
to declining volumes come into play.
Cost volume elasticities in Appendix 6 for particular functions are given as:
● Processing – 25% (i.e. a 1% increase in volume will increase processing costs
by 0.25%).
● Delivery – 30%.
Breakdowns of cost variability by particular processing and delivery sub-activities
are also provided. However, no specific justifications of particular parameter
values are provided. Rather, a general analysis of the kinds of relationship that
might be expected between costs and volumes for the functions (sales,
processing, transport and delivery) is provided in section 5.5. of the Notification:
● Sales & Acceptance and Transport functions are considered minimally
variable with volumes, as Sales & Acceptance costs are driven by standards
relating to a minimum number of retail outlets, and Transport is driven by
delivery standards on distance and frequency.
● Processing costs are variable in relation to those letters that are manually
sorted or otherwise not processed by barcodes.
● Delivery costs are variable in relation to the „indoor‟ component relating to
round sorting and sequencing, but less so in relation to the „outdoor‟
component (delivery to street addresses).
Public version May 2010 | Frontier Economics 27
Final Cost forecasts
The material provided by Australia Post indicates that the variabilities or
elasticities that are identified are consistent with the view that we expressed in
our November report that it is implausible that costs would not fall in response
to volume falls. The question then is whether the particular parameters adopted
by Australia Post constitute a sufficient response to the forecast volume declines.
3.5.2 Appropriateness of particular cost volume parameters
used
Australia Post‟s analyses in section 5.5 and in Appendix 6 do not establish the
appropriateness of the particular parameter values. These parameter values would
ideally be established using statistical analysis or by benchmarking with
international postal operators (to the extent that international operators have a
similar cost structure).
Australia Post refers (p. 23) to work that is being done for it by consultants on
cost-volume elasticities. Until this work is complete, it is difficult to comment on
the validity of the cost-volume elasticities claimed for various functions in
Appendix 6.
On the parameters themselves, it is difficult to be definitive about how the
parameters used affect the Notification. Australia Post has not provided a
detailed breakdown of costs by function for this notification. However, Australia
Post did provide a breakdown by function for the 2009 Draft Notification, which
indicated that processing costs were per cent of costs and delivery
constituted about .
Assuming no cost variability for other functions, if volumes fall by 1 per cent, the
cost volume elasticities for process and delivery costs indicate that total costs
should fall by around 0.14 per cent. This appears to be less than the volume
response actually forecast by Australia Post, which is somewhere between 0.5 and
1 depending on the base year chosen. That is, for each 1 per cent of forecast
volume decline, costs are forecast to decline between 0.5 per cent and 1 per cent.
Compared to international studies, the elasticity of around 0.14 put forward by
Australia Post appears low. As we suggested in our November report,
international studies (which tend to focus on individual functions rather than
total costs) appear to support elasticities below 1, but substantially greater than 0.
A number of studies referred to put these elasticities between 0.60-0.70.17
Australia Post suggests in the Notification that international studies are specific
to the data used, and have generally been estimated over periods of rising rather
than declining letter volume. It may be difficult to translate these studies into
17 See e.g. Bozzo (2009), NERA (2004) and Moriarty et al (2006).
28 Frontier Economics | May 2010 Public version
Cost forecasts
Australia conditions, but this view is not universally shared. Cohen et al (2004)18
suggests that for Postal systems with more than 200 pieces per capita, cost
variability and cost behaviours are remarkably similar across postal systems. It is
correct that most cost studies have taken place in an environment of volume
increases; however, Australia Post has not provided evidence as to how this
would influence the determination of appropriate cost-volume elasticities, or
whether this has influenced its choice of cost-volume elasticities in Appendix 6.
A final issue with overseas studies is that they commonly estimate long-run cost
elasticities, rather than short-run elasticities. They therefore represent the
situation achieved once there has been time to respond to changes in volume by
varying labour and capital that may be fixed in the short term. This seems to be a
legitimate reason for the short-run elasticities used to be less than in international
studies. Australia Post further claims, however, that “in current network
circumstances where the volume declines have been greater for the products with
higher proportions of variable processing costs…there is a challenge to sustain
the current rates of cost variability as volumes decline.” (p. 22) No evidence is
provided on why it is expected that further volume reductions are expected in
categories which have a higher proportion of fixed costs (such as pre-sort
categories). In fact, from Appendix 3, it appears that volumes for non-pre-sort
categories are forecast to fall more than for pre-sort. That would seem contrary to
Australia Post‟s claim.
On the whole, it is positive that Australia Post has explicitly identified and used
cost-volume elasticities in its cost forecasting. This contrasts with its July 2009
Draft Notification in which it made no reference to the existence of such
elasticities, and merely assumed increasing costs in line with historic cost trends.
The suggested elasticities and the accompanying text do provide a plausible
explanation of existing short-run cost-volume relationships. However, there is no
reviewable information supplied to support these relationships, meaning that they
must be taken as indicative at best. Further – and like other elements of the
forecasts – these are not related to particular forecasts in a transparent way.
3.6 Conclusions on cost forecasts
● Australia Post‟s process of cost forecasting retains certain deficiencies that we
identified in our report on the Draft Notification in 2009. In particular,
forecasts are internally developed and while certain factors are pointed to in
justifying particular forecasts, the linkages between the factors and the
forecasts themselves are not transparent.
18 Although Cohen et al (2004) suggests that for Postal systems with more than 200 pieces per capita,
cost variability and cost behaviours are remarkably similar across postal systems.
Public version May 2010 | Frontier Economics 29
Final Cost forecasts
● That said, the forecasts indicate that Australia Post has identified a number of
areas where cost savings can be made in response to the drop in volumes.
● Australia Post‟s actions appear a suitable response to an environment of
declining volumes, particularly when costs are considered in real terms.
Aggregate costs are forecast to fall by around 6 per cent against volume falls
of 12 per cent between 2008/09 – 2011/12. This response is also improved
by considering only the three years between 2009/10 – 2011/12.
● It is positive that Australia Post has explicitly identified and used cost-volume
elasticities in its cost forecasting. The elasticities suggested and the
accompanying text do provide a plausible explanation of existing short-run
cost-volume relationships. However:
the elasticities used appear low in comparison to those derived from
international studies (and low in relation to Australia Post‟s actual
forecasts).
there is no reviewable information supplied to support these
relationships, meaning that they must be taken as indicative at best.
Further – and like other elements of the forecasts – these are not related
to particular forecasts in a transparent way.
30 Frontier Economics | May 2010 Public version
References
4 References
Bozzo, A.T. (2009), “United States Postal Service mail processing operations”, in
M. Crew and P. Kleindorfer (eds), Progress in the Competition Agenda in the Postal and
Delivery Sector, Edward Elgar.
Cohen et al., The Role Of Scale Economies In The Cost Behavior Of Posts, Mimeo,
December 2004.
Fenster, L, D. Monaco, E. Pearsall and S. Xenakis, (2008) “Are there economies
of scale in mail processing? Getting the answers from a large-but-dirty sample”,
in M. Crew and P. Kleindorfer (eds), Competition and Regulation in the Postal and
Delivery Sector, Edward Elgar.
Franses, P. (1998), Time Series Models for Business and Economic Forecasting,
Cambridge University Press, p.201.
Hansen, B. (1992), “Tests for parameter instability in regressions with I(1)
processes”, Journal of Business and Economic Statistics, 10, 321-335.
Lim, G. and Martin, V. (1995), “Regression-based cointegration estimators with
applications”, Journal of Economic Studies, 20(1), 3-22.
Moriarty, Yorke, Harmin, Cubbin, Meschi & Smith, “Economic analysis of the
efficiency of Royal Mail and the implications for regulatory policy”, pp. 165-182,
in M. Crew and P. Kleindorfer (eds), Liberalization of the Postal and Delivery Sector,
Edward Elgar, 2006.
NERA (2004), Economics Of Postal Services: Final Report: A Report to the European Commission DG-MARKT, London.

Frontier Economics Pty Ltd in Australia is a member of the Frontier Economics network, which
consists of separate companies based in Australia (Brisbane, Melbourne & Sydney) and Europe
(Brussels, Cologne, London & Madrid). The companies are independently owned, and legal
commitments entered into by any one company do not impose any obligations on other companies
in the network. All views expressed in this document are the views of Frontier Economics Pty Ltd.
Disclaimer
None of Frontier Economics Pty Ltd (including the directors and employees) make any representation or warranty as to the accuracy or completeness of this report. Nor shall they have any liability (whether arising from negligence or otherwise) for any representations (express or implied) or information contained in, or for any omissions from, the report or any written or oral communications transmitted in the course of the project.

FRONTIER ECONOMICS NETWORK
BRISBANE | MELBOURNE | SYDNEY | BRUSSELS | COLOGNE | LONDON | MADRID
Frontier Economics Pty Ltd 395 Collins Street Melbourne Victoria 3000
Tel: +61 (0)39620 4488 Fax:+61 (0)3 9620 4499 www.frontier-economics.com
ACN: 087 553 124 ABN: 13 087 553 124