Embed Size (px)
Citation preview

1
Review of Council Tax Reduction schemes in England in 2021/22
Prepared by Carla Ayrton, Josh Holden and Peter Kenway from
In conjunction with
2
About this report
The data used in this analysis about local Council Tax Reduction/Support (CTR) schemes was
collected by NPI and entitledto in early 2021. Each local authority’s website was reviewed to
find out if there was a change to their CTR scheme between 2020/21 and 2021/22. If so, the
details of the scheme are updated in our rolling dataset.
About New Policy Institute
The New Policy Institute is a progressive think tank that produces research on poverty and
disadvantage. It works broadly, studying the labour market, the social security system,
housing, local government and economic policy. NPI is an independent organisation that
relies on project funding.
About entitledto
entitledto is the leading provider of online benefit calculation software in the UK. We
believe everyone living in the UK should be able to understand their legitimate benefit
entitlements. We’ve been operating since 2000, and provide our calculators not just
through our web site www.entitledto.co.uk but also to over 200 organisations. Our clients
include local authorities, housing associations, leading charities as well as other websites
that choose to provide benefit calculators to support their users to understand their
entitlements.
3
Introduction
Council Tax Benefit (CTB), the national system of support for Council Tax bills, was localised
and replaced in England by what is now known as Council Tax Reduction or Support
(referred to as CTR) in April 2013. Such schemes reduce, sometimes to zero, the amount of
Council Tax which a household has to pay.
While Scotland and Wales each brought in nationwide schemes to replace CTB, English
councils were left to devise their own schemes for working-age residents. The full protection
for pensioners provided by CTB remained a requirement of each local scheme. Councils
were advised to devise schemes that encouraged work and which protected the vulnerable;
however, defining ‘vulnerable’ was at the discretion of each local authority.
In its first year, 2013-14, central government funding for CTR was cut by 10% compared with
what had been paid to councils the year before for CTB. From April 2014, funding for CTR
was incorporated into the yearly central government grant that each local authority
received, meaning it was no longer separately identifiable.
During this period, Universal Credit (UC) has also been introduced and is now operational in
every local authority area in England. Around 60% of working-age benefit recipients in
England now claim UC rather than any one of the six ‘legacy’ benefits that UC replaced.1 This
has caused difficulties for local authorities in the administration of CTR. For example, local
authorities receive a high number of ‘change of circumstance’ notifications from the UC
system which causes CTR to be recalculated frequently. This is one reason why some local
authorities have introduced income banded CTR schemes. Under such schemes, small
changes in income (from benefits, earnings or other) do not usually change the amount of
CTR.2
The data used in this analysis about local CTR schemes was collected by NPI and entitledto
in early 2021. Each local authority’s website was reviewed to find out if there was a change
to their CTR scheme between 2020/21 and 2021/22. If so, the details of the scheme are
updated in our rolling dataset.
Key changes to CTR schemes
There are three key changes that have been made since 2013/14 which mean that low-
income residents who had a full reduction in their Council Tax liability under CTB must now
pay at least some part of it. By ‘Council Tax liability’, we mean the amount of Council Tax
1 House of Commons Library (2021) Constituency data: Universal Credit rollout as of November 2020. 2 New Policy Institute (2019) An Independent Review of the Department of Finance’s Rate Rebate Scheme. Northern Ireland Department of Finance: Land and Property Services.

4
that a household would normally pay. This is mainly determined by: the level of Council Tax
set by the local authority; the Council Tax band that the home is in (one of A to H); and
whether there is only one adult in the household (in which case a 25% discount normally
applies). The three key changes are as follows:
The introduction of a minimum payment which refers to the proportion of Council
Tax liability that all working-age residents are required to pay, regardless of income.
If no minimum payment exists, claimants may be entitled to ‘full’ CTR, equal to the
value of their Council tax liability, leaving them with nothing to pay.
The introduction of a band cap which involves limiting the amount of CTR for those
in higher banded properties so that it does not exceed the amount provided to those
in lower value properties.
The introduction of income banded schemes. These schemes assess the income of
claimants and, depending on the income band a claimant falls in, they have to pay a
certain proportion of their Council Tax bill. What is new about such schemes is not
that the amount of CTR can change with income – older CTR schemes and CTB
contained this feature too – but that changes in income which nevertheless remain
in the same income band do not trigger a change in CTR.
Changes to CTR schemes in April 2021/22
There are now only 44 out of 309 English local authorities who have neither introduced a
minimum payment, a band cap or a banded scheme. These schemes are those that are
closest to CTB.
In 2021/22 there were relatively few changes to CTR schemes. Eleven local authorities
changed their minimum payment or band cap. Four schemes became harsher in some way,
but five lowered their minimum payment. Three of these introduced an income banded
scheme and removed the minimum payment for claimants in the first of these bands.
Nine income banded schemes were introduced in 2021/22 meaning that 23% (72 out of
309) of local authorities are currently operating income banded schemes. Nine of these are
for UC claimants only while the rest are for all CTR claimants.
13 local authorities who have introduced a banded scheme have increased their minimum
payment compared with 2017/18 – the year before most of the banded schemes were
introduced. 22 local authorities who have introduced a banded scheme have reduced (or
removed completely) their minimum payment compared with 2017/18. This means some
local authorities are using the move to a banded scheme to increase the support for those in
the first band – those with the lowest incomes.

5
Figure 1 shows the number of local authorities with no minimum payment in each year since
2013/14. From a low point in 2018/19 when only 62 had no minimum payment, this number
rose to 74 in 2021/22. Compared with 2017/18, as the large majority of banded schemes
have been introduced since then, 46 local authorities have reduced their minimum
payments or removed them completely. 22 of these are local authorities who have
introduced a banded scheme. 30 councils have increased their minimum payment since
2017/18 and 13 of these are now banded schemes.
Figure 1. Local authorities without a minimum payment
Source: NPI Analysis of entitledto CTR scheme data, 2021/22
Figure 2 counts the number of local authorities by the size of their minimum payment.
Although the number of schemes with no minimum payment (0%) has increased recently,
the most common minimum payment group remains (as in April 2018), 20 to 29%, with 117
councils in this group. There are 22 councils with a minimum payment of 30% or more.

6
Figure 2. Local authority minimum payments by group in 2021/22
Source: NPI Analysis of entitledto CTR scheme data, 2021/22
As these figures show, since localisation there has been a great deal of variation across
England. In some local authorities, low-income households continue to be exempt from
paying Council Tax whilst in other local authorities they are required to pay up to 50% of
their bill. Table 1 shows the average minimum Council Tax payments for couples and singles
claiming CTR for local authorities with a 20%, 25% and 30% minimum payment and the
three local authorities with the highest minimum payments – Redbridge, Mid Sussex and
North Lincolnshire.

7
Table 1. Local authorities, their minimum payments and the minimum amount of Council Tax CTR claimants must pay
Local Authority (LA) Minimum payment (MP) Minimum annual payment –
Couple
Average of LAs with 20% MP 20% £309
Average of LAs with 25% MP 25% £385
Average of LAs with 30% MP 30% £436
Redbridge 38% £6213
Mid Sussex 40% £695
North Lincolnshire 50% £679
Source: NPI Analysis of entitledto CTR scheme data 2021/22
Income banded schemes
As noted above there are now an increasing number of banded schemes in operation. There
was already a large amount of variation between local authorities and the introduction of
banded schemes has increased this. Schemes have different bands, take into account
different types of income and different levels of support for each band.
There is usually a trade-off to be made between simplicity and fairness. Some banded
schemes are very simple. For example, St Albans’ scheme assigns claimants to one of six
bands depending on their net earnings from work. Claimants then have to pay a set monthly
contribution – nothing in the first band, £35 per week in the second band, and up to £225
per week in the highest band. These weekly payments are not related to family size or the
amount of Council Tax due. Other local authorities have tried to take into account family
circumstances. Kensington and Chelsea use family size and the Council Tax Band of the
home as well as income (not just earnings) to assign claimants to one of more than 800
bands to calculate their CTR.
Although the majority of income banded schemes were only introduced in the last four
years, some councils have already made changes to their schemes. Some have introduced
more bands, for different family types, after realising that certain family types, for example
lone parents, were being disadvantaged. Others have simplified their schemes by reducing
the number of bands. One local authority who previously had a banded scheme for UC
3 This is the average payment distributed across the Council Tax bands for each local authority. For Redbridge, this average falls between band C and D, for Mid Sussex this is between bands B and C and for North Lincolnshire between bands A and B.

8
claimants only is now applying this to all claimants. More councils with UC only schemes
may follow this example as the UC caseload grows.
Many banded schemes have placed claimants on ‘relevant’ benefits (usually income related)
and maximum UC in the lowest band, sometimes offering them full support. There are also
a number of councils who have a separate band for those on disability benefits or for lone
parents, which offers a higher level of support than for other family types. Income banded
schemes can be a way of increasing protection for those with the lowest incomes (or some
other characteristic) while making those with some other income – such as earnings – pay a
higher proportion of their Council Tax bill.
Impact on claimants
Claimant numbers
The previous section reviewed the key changes to CTR schemes in 2021/22. In this section,
we estimate the impact these changes have had on claimants. We start by looking at the
total number of claimants and then at the impacts the changing minimum payments and
band caps have had.
Figure 3 shows that the total number of CTR claimants fell year-by-year between 2013/14
and 2019/20. There are two reasons for this. The first is that fewer people were eligible to
claim CTR, due to a combination of rising employment and schemes becoming less
generous. The second is that the take-up rate may be falling. This is the number of actual
benefit recipients compared with the number who would be receiving it if everyone took up
their entitlement. The last data published on CTB take-up was in 2012 using 2009/10 data.4
Since localisation and the move to CTR, no statistics or information on take-up have been
published, but there are reasons to think the falling number of CTR claimants is at least in
part to do with falling take-up. For one, it is harder to publicise 309 individual schemes and
residents may be less aware of each CTR scheme than they were of CTB. More importantly,
under CTB claimants filled in one form for Housing Benefit (HB) and CTB combined, meaning
most people eligible for HB would automatically claim CTB if they were eligible. Now that HB
is being replaced by UC, there is a separate form for CTR and fewer people are aware of it.
4 Department for Work and Pensions (2012) Income Related Benefits: Estimates of Take-Up in 2009-10. Available at: https://assets.publishing.service.gov.uk/government/uploads/system/uploads/ attachment_data/file/222914/tkup_first_release_0910.pdf

9
Figure 2. Number of CTR, Universal Credit and legacy benefit claimants over time
Source: MHCLG, Live tables on local government finance – Local Council Tax support (three quarter average in
2020/21) and DWP, Stat-Xplore, Benefit Combination (Out-of-Work) by Quarter, May for the year shown.
There is data to support this suggestion. In 2009/10, social and private rented tenants (who
may be entitled to HB) had fairly high take-up rates for CTB (87 to 94% and 77 to 89%,
respectively) whereas owner-occupiers who were not eligible to claim HB had low take-up
rates of 36 to 41%.5 A recent review of CTR in Wales found that a quarter of claimants
thought an application for CTR was included as part of UC while 29% of UC claimants did not
know if they received CTR (compared with 14% of legacy benefit respondents).6
As figure 3 shows, the steady fall in the number of CTR claimants stopped in 2020/21, with
the number of claimants increasing for the first time since 2013/14 because of the Covid-19
pandemic. Figure 3 also shows the number of claimants of out-of-work benefits (UC and the
predecessor Jobseeker’s Allowance combined). Since most people who are entitled to out-
of-work benefits would also be entitled to CTR, it is striking the number of CTR claimants has
not risen in line with out-of-work claimants. Between 2019/20 and 2020/21, the number of
out-of-work claimants rose by 53% whereas the number of CTR claimants rose by just 10%.
This disparity suggests that there are a large number of out-of-work UC claimants (who
accounted for all of the increase) not claiming CTR even though they may be eligible.
5 Department for Work and Pensions (2012) Income Related Benefits: Estimates of Take-Up in 2009-10. 6 Aston,J et al. (2020). Understanding the impact of Universal Credit on the Council Tax Reduction Scheme and Rent Arrears in Wales. Cardiff: Welsh Government, GSR report number 47/2020.

10
Reduced CTR
While the previous section discussed the falling number of claimants and take-up rate, this
section analyses the impact of the changes for those who are still eligible and are currently
claiming CTR.
All the tables and figures in this section have a smaller number of CTR claimants than figure
3 above which shows the total number of CTR claimants in 2021. This is because around
460,000 claimants live in areas without a minimum payment, a band cap or income banded
scheme so they do not pay significantly more than they would have done under CTB. These
claimants are not included in the analysis because we calculate average increases based on
those claimants who now have to pay more Council Tax than under CTB.
Table 2 shows the number of claimants who are estimated to have reduced CTR compared
with what they would have had under CTB. This means that they now have to make a
contribution towards their Council Tax bill – an increase compared with CTB.
Table 2. Total number of claimants with reduced CTR and estimated average increase in payment due as a result.
Source: NPI Analysis of entitledto CTR scheme data 2021/22
Region Total number of claimants
Average annual increase in
Council Tax paid under CTR
(compared with CTB)
Number of local
authorities in region
Number of local
authorities with no
minimum payment
North East 150,000 £174 12 1
North West 350,000 £218 39 12
Yorkshire and Humberside
260,000 £269 21 4
East Midlands 150,000 £217 35 7
West Midlands 270,000 £245 30 5
East of England 190,000 £260 45 6
Inner London 150,000 £208 14 6
Outer London 160,000 £407 19 6
South East 240,000 £327 64 18
South West 170,000 £290 30 9
England 2,100,000 £260 309 74
11
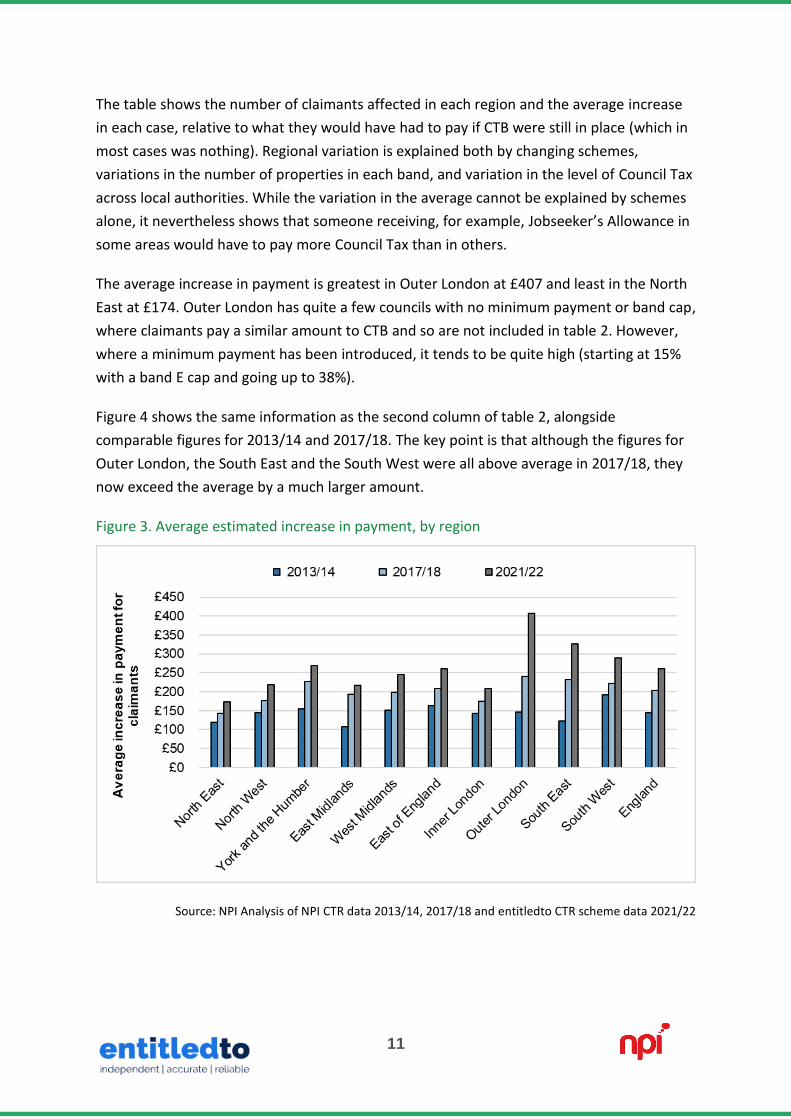
The table shows the number of claimants affected in each region and the average increase
in each case, relative to what they would have had to pay if CTB were still in place (which in
most cases was nothing). Regional variation is explained both by changing schemes,
variations in the number of properties in each band, and variation in the level of Council Tax
across local authorities. While the variation in the average cannot be explained by schemes
alone, it nevertheless shows that someone receiving, for example, Jobseeker’s Allowance in
some areas would have to pay more Council Tax than in others.
The average increase in payment is greatest in Outer London at £407 and least in the North
East at £174. Outer London has quite a few councils with no minimum payment or band cap,
where claimants pay a similar amount to CTB and so are not included in table 2. However,
where a minimum payment has been introduced, it tends to be quite high (starting at 15%
with a band E cap and going up to 38%).
Figure 4 shows the same information as the second column of table 2, alongside
comparable figures for 2013/14 and 2017/18. The key point is that although the figures for
Outer London, the South East and the South West were all above average in 2017/18, they
now exceed the average by a much larger amount.
Figure 3. Average estimated increase in payment, by region
Source: NPI Analysis of NPI CTR data 2013/14, 2017/18 and entitledto CTR scheme data 2021/22
12
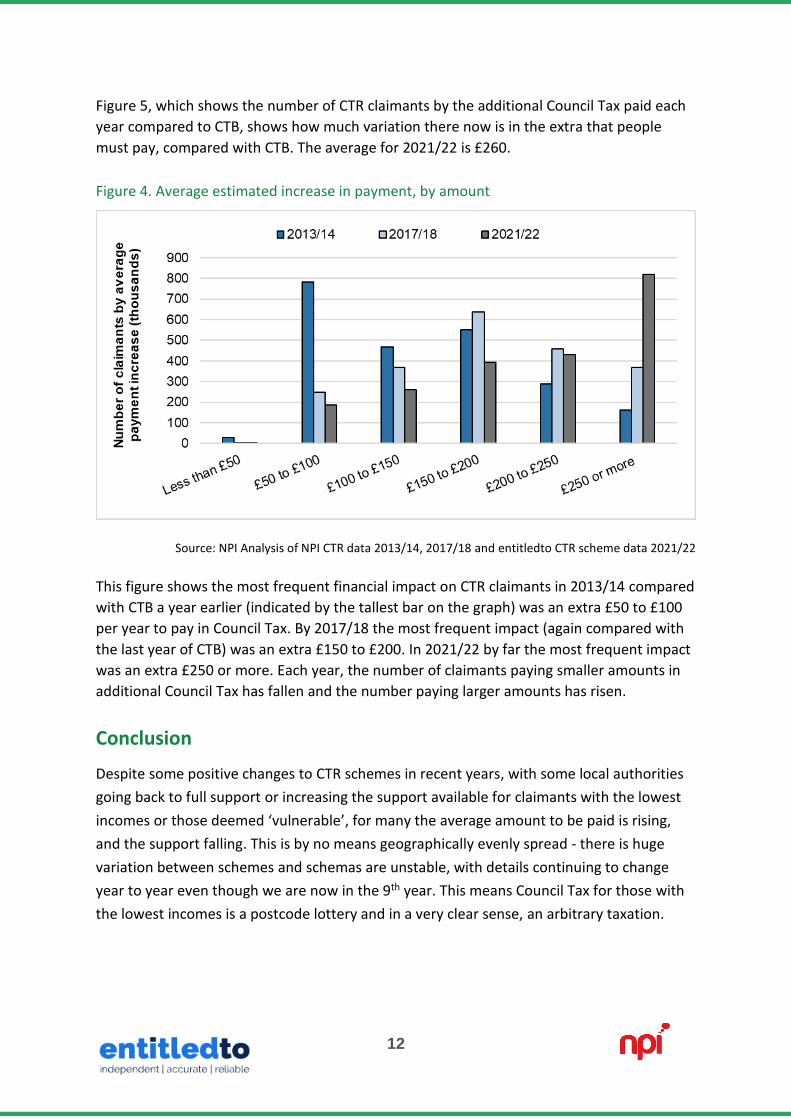
Figure 5, which shows the number of CTR claimants by the additional Council Tax paid each
year compared to CTB, shows how much variation there now is in the extra that people
must pay, compared with CTB. The average for 2021/22 is £260.
Figure 4. Average estimated increase in payment, by amount
Source: NPI Analysis of NPI CTR data 2013/14, 2017/18 and entitledto CTR scheme data 2021/22
This figure shows the most frequent financial impact on CTR claimants in 2013/14 compared
with CTB a year earlier (indicated by the tallest bar on the graph) was an extra £50 to £100
per year to pay in Council Tax. By 2017/18 the most frequent impact (again compared with
the last year of CTB) was an extra £150 to £200. In 2021/22 by far the most frequent impact
was an extra £250 or more. Each year, the number of claimants paying smaller amounts in
additional Council Tax has fallen and the number paying larger amounts has risen.
Conclusion
Despite some positive changes to CTR schemes in recent years, with some local authorities
going back to full support or increasing the support available for claimants with the lowest
incomes or those deemed ‘vulnerable’, for many the average amount to be paid is rising,
and the support falling. This is by no means geographically evenly spread - there is huge
variation between schemes and schemas are unstable, with details continuing to change
year to year even though we are now in the 9th year. This means Council Tax for those with
the lowest incomes is a postcode lottery and in a very clear sense, an arbitrary taxation.

13
Are you thinking of changing your CTR scheme?
Whatever changes you are considering to your existing CTR scheme entitledto can help you
in one of three ways:
Modelling your data: By combining our calculation engine with your LA data we can
estimate the cost/distributional effect of reform options, be that adopting another LA’s
scheme or a new design, for both your authority and residents.
Evaluating alternatives: Assisting you in setting up policy options for alternative schemes
using examples of either existing or new scheme details.
Monitoring the market: Providing details of what other LAs are doing so you can see which
policy options, if any, may be appropriate for your council.

14
Get in touch
We’d like to hear from you
Contact us today if you would like to find out
more about this report or our other services
[email protected] [email protected]
www.entitledto.co.uk/organisations www.npi.org.uk
0161 980 6276 020 7250 8354