Embed Size (px)
Citation preview
Study by ERDA on review of DPR of KESCO
REVIEW OF
DETAILED PROJECT REPORT
OF
KESCO
DATED 23rd FEB 2005
Study by ERDA on review of DPR of KESCO DATED 23rd FEB 2005
ii
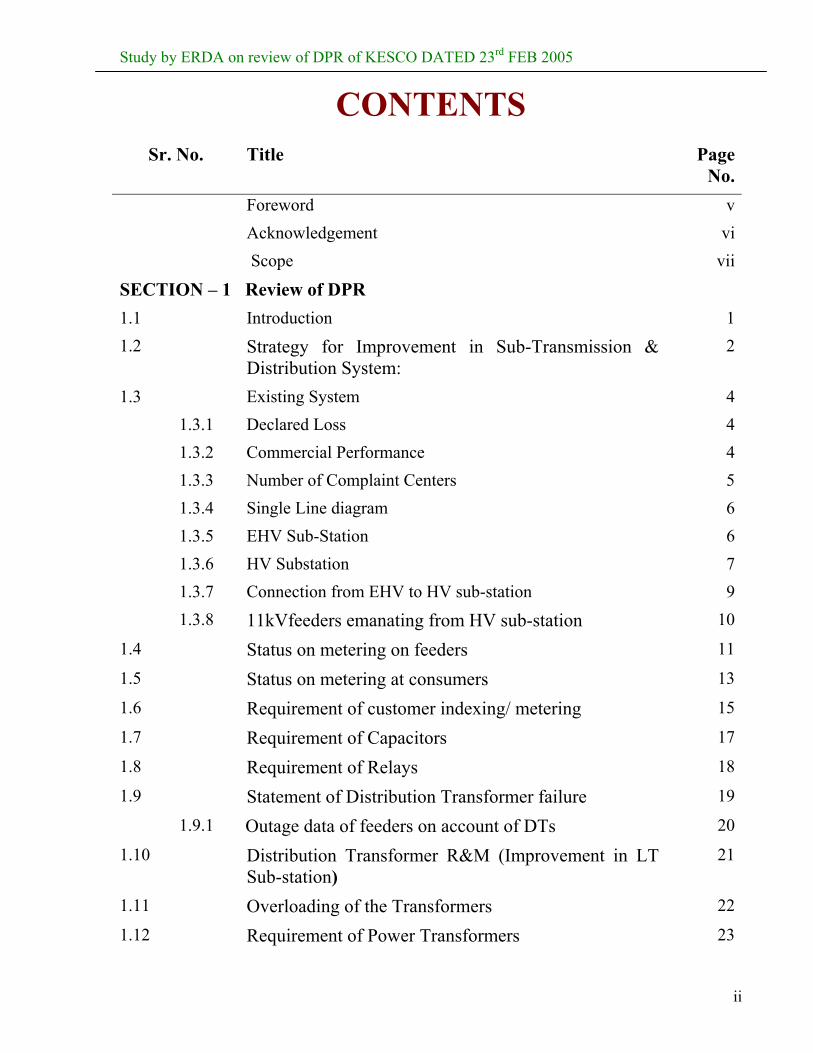
CONTENTS Sr. No. Title Page
No. Foreword v Acknowledgement vi Scope vii
SECTION – 1 Review of DPR 1.1 Introduction 11.2 Strategy for Improvement in Sub-Transmission &
Distribution System: 2
1.3 Existing System 4 1.3.1 Declared Loss 4 1.3.2 Commercial Performance 4 1.3.3 Number of Complaint Centers 5 1.3.4 Single Line diagram 6 1.3.5 EHV Sub-Station 6 1.3.6 HV Substation 7 1.3.7 Connection from EHV to HV sub-station 9 1.3.8 11kVfeeders emanating from HV sub-station 10
1.4 Status on metering on feeders 11
1.5 Status on metering at consumers 13
1.6 Requirement of customer indexing/ metering 15
1.7 Requirement of Capacitors 17
1.8 Requirement of Relays 18
1.9 Statement of Distribution Transformer failure 19
1.9.1 Outage data of feeders on account of DTs 20
1.10 Distribution Transformer R&M (Improvement in LT Sub-station)
21
1.11 Overloading of the Transformers 22
1.12 Requirement of Power Transformers 23
Study by ERDA on review of DPR of KESCO DATED 23rd FEB 2005
iii
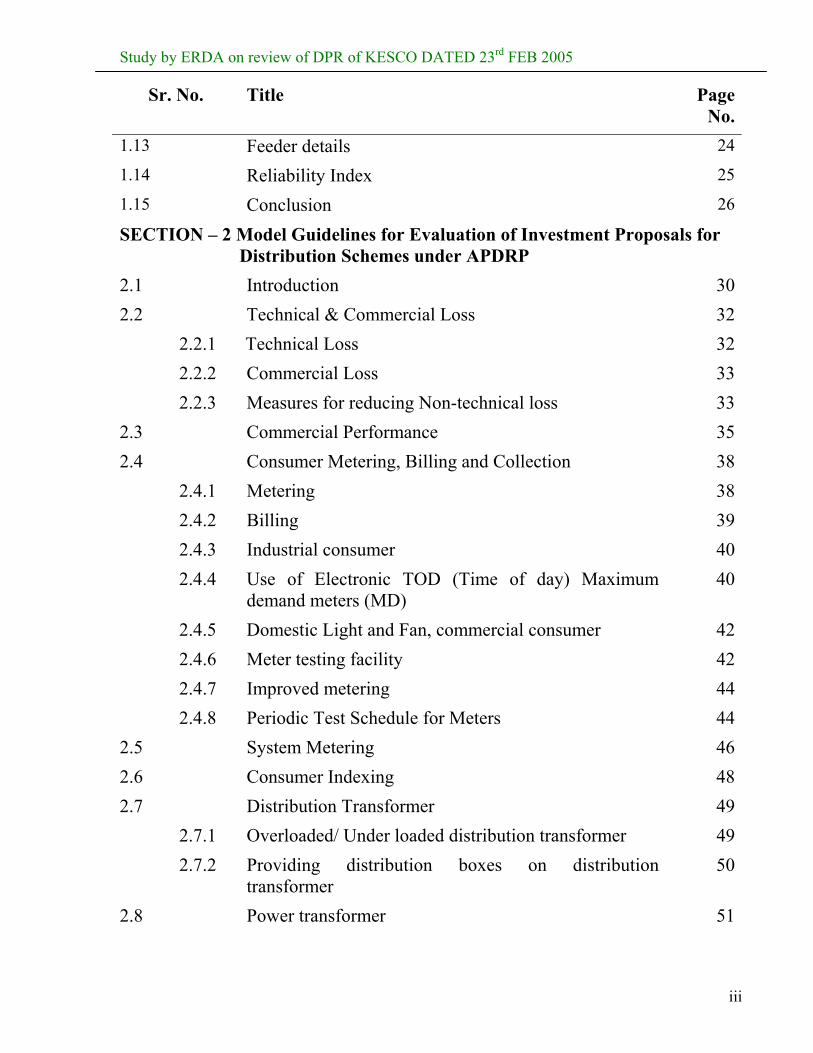
Sr. No. Title Page No.
1.13 Feeder details 24
1.14 Reliability Index 25
1.15 Conclusion 26
SECTION – 2 Model Guidelines for Evaluation of Investment Proposals for Distribution Schemes under APDRP
2.1 Introduction 302.2 Technical & Commercial Loss 32 2.2.1 Technical Loss 32 2.2.2 Commercial Loss 33 2.2.3 Measures for reducing Non-technical loss 332.3 Commercial Performance 352.4 Consumer Metering, Billing and Collection 38 2.4.1 Metering 38 2.4.2 Billing 39 2.4.3 Industrial consumer 40 2.4.4 Use of Electronic TOD (Time of day) Maximum
demand meters (MD) 40
2.4.5 Domestic Light and Fan, commercial consumer 42 2.4.6 Meter testing facility 42 2.4.7 Improved metering 44 2.4.8 Periodic Test Schedule for Meters 442.5 System Metering 462.6 Consumer Indexing 482.7 Distribution Transformer 49 2.7.1 Overloaded/ Under loaded distribution transformer 49 2.7.2 Providing distribution boxes on distribution
transformer 50
2.8 Power transformer 51
Study by ERDA on review of DPR of KESCO DATED 23rd FEB 2005
iv
Sr. No. Title Page No.
2.8.1 Overloading/ new power transformer 512.9 Capacitors 52 2.9.1 Requirement of capacitors 52 2.9.2 Installation of Capacitors 52 2.9.3 LT Capacitor 52 2.9.4 Pedestal mounted HT capacitor 532.10 Renovation, Strengthening & New substation (feeder
up gradation) 55
2.10.1 Creation of new substation 582.11 Guidelines for system development 612.12 System Studies 632.13 Optimum Utilization of Resources 662.14 Procedural Clearance 682.15 Cost benefits 70
2.16 Documents to be provided with DPR 712.17 Conclusion 73
Study by ERDA on review of DPR of KESCO DATED 23rd FEB 2005
v
FOREWORD
In the initial stage of power development in the country, power supply facilities
and Transmission & Distribution (T&D) systems were built mainly catering to
urban areas/ towns to feed mostly domestic and commercial loads. After
independence, with the importance given to power development in the five-year
plan programmes, the extent and reach of electricity has undergone dramatic
changes. With thrust on programme for rural electrification and large-scale
energization of pump sets from 3rd five year plan onwards, the sub-transmission
and distribution networks were expanded rapidly. However, this expansion was
very often without adequate studies to evolve optimal network and this resulted in
characterizing distribution systems with poor voltage regulation and increased
losses. With the implementation of APDRP programme the much needed
improvement in the distribution sector has started taking place. Utilities have
drawn out plans for the augmentation of their distribution and sub transmission
system. Many times the investment required is large. The project report submitted
by the utilities has to be evaluated by the funding agency in terms of the benefits to
the consumers and returns to the power suppliers. The evaluation should be done in
a comprehensive manner to cover all the technical and commercial aspects keeping
in view the global standards and the targeted benchmarks
This report gives comments on the DPR submitted by KESCO to UPERC. This
report is made into two sections. The Section-1 gives a detailed review of the DPR
and Section-2 gives the guidelines for evaluation of proposals under APDRP.
Study by ERDA on review of DPR of KESCO DATED 23rd FEB 2005
vi
Scope A) The scope of the study was to examine the schemes submitted by
UPPCL/DISCOMS for the following:
1. For their completeness
2. Optimum utilization of resources
3. Techno economics
4. Procedural clearances
5. System studies
6. Cost benefits
7. Observations furnished to licensees
8. Interact with licensee to analyze existing system status and its
inadequacies; reasonable assessment of load growth, reduction of
losses/ voltage profile improvement, and reliability
9. The APDRP scheme shall be examined for – increase in revenue
realization, increase in metered energy, billing and commercial losses
and outages; whether it meets growth in demand, and optimum cost/
benefit analysis.
B) Based on best expertise and resources available with ERDA, ERDA
has developed Model Guidelines for Commission to examine the capital
expenditure and prudence of investment schemes in APDRP Project/ DPR
submitted by UPPCL/DISCOMS, from the standpoint of (i) Technical
prudence and (ii) Financial prudence.

Study by ERDA on review of DPR of KESCO DATED 23rd FEB 2005
vii
SECTION 1
Study by ERDA on review of DPR of KESCO DATED 23rd FEB 2005
viii
REVIEW OF DPR
Study by ERDA on review of DPR of KESCO DATED 23rd FEB 2005
1
Introduction
The detailed project report submitted by KESCO to UPERC for APDRP project
has been referred to ERDA for examination. ERDA has carried out in depth
study of the DPR and examined all the proposals made in the DPR based on the
data submitted by KESCO and the prevalent guidelines. ERDA has also taken
into account its experience as an Advisor Cum Consultant (ACC) for the
APDRP project in the Sabarmati circle of Gujarat Electricity Board and its
experience acquired during the field work for energy auditing services for Agra
(UPPCL) and Kanpur (KESCO) to UPERC while assessing the DPR. The
project report has been examined for its completeness, optimum utilization of
resources, techno-economics and cost benefits
1.1
Study by ERDA on review of DPR of KESCO DATED 23rd FEB 2005
2
1.2 Strategy for Improvement in Sub-Transmission & Distribution System
The formulation of a project report for upgradation of system for the
identified circle should be taken up in two phases:
•Short Term Plan
• Long Term Plan
Short Term Plan:
In the prevailing situation of mounting energy losses, Priority attention need
to be given to achieve the objective of loss reduction especially for reduction
of commercial losses as well as technical losses in the short-term plan. The
short-term plan shall cover the measures required for immediate
improvement and reduction of losses and shall be based upon the
information/ data readily available with the utilities. The works identified as
short term should be completed within 1 to 2 years.
Long Term Plan:
The long term plan will cover all the measures for improvement of quality
and reliability of power supply and reduction of T & D losses in the circle by
upgradation, strengthening and improvement of the sub transmission &
distribution system in a circle to meet the load demand for next 5 years. The
proposal will be prepared through the proper analysis of the system based
on detailed system studies.
In the DPR submitted by KESCO, completion period given is 24 months.
Hence, it is clear that in the DPR is for short-term plan.
Study by ERDA on review of DPR of KESCO DATED 23rd FEB 2005
3
The broad activities/ works for preparation of a short-term plan are:
• Energy Accounting/ Energy Audit
•Network documentation-Single Line Diagram/ Geographical map up to 11
kV level
• Estimation of T & D losses/ Segregation of losses
•Technical power loss reduction
• Commercial power loss reduction
• Preparation of cost estimates
• Financial Analysis
In the report submitted by KESCO final benefits are given and no basis of
arriving at these figures of benefits are given. Normally, it is expected from
the consultant to give detailed working of each sample where the basis for
computation of benefits is also given. These details are very important
because in absence of these details, problems may occur at the time of
implementation of the project and its assessments when the work is
completed.
Study by ERDA on review of DPR of KESCO DATED 23rd FEB 2005
4
1.3 Existing System
1.3.1 Declared Losses:
The declared Technical loss is 8 % and it is within the permissible limits and
effort has to be made to reduce the level of commercial loss in the
system. The main factors responsible for high-energy losses are:
> Theft/ pilferage by consumers
> Illegal connections from distribution line
> Illegal use of energy/ under billing
> Defective meters
> At site Calibration of Consumer Meters
> Lack of accountability
> Lack of scientific management principles and human resource
development
> Complicated legal process
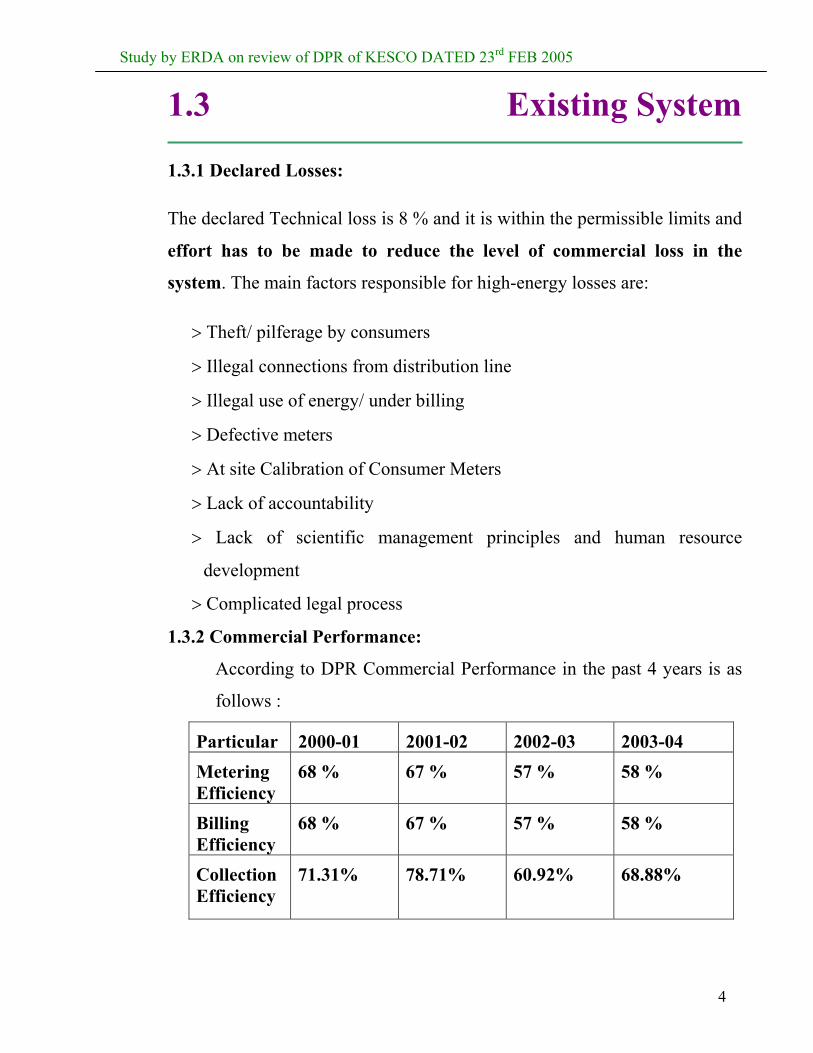
1.3.2 Commercial Performance:
According to DPR Commercial Performance in the past 4 years is as
follows :
Particular 2000-01 2001-02 2002-03 2003-04 Metering Efficiency
68 % 67 % 57 % 58 %
Billing Efficiency
68 % 67 % 57 % 58 %
Collection Efficiency
71.31% 78.71% 60.92% 68.88%
Study by ERDA on review of DPR of KESCO DATED 23rd FEB 2005
5
Efforts have been made to increase all the above three efficiencies as
quickly as possible. The significance of the metering efficiency is that all
meters installed at the consumer end should be in running condition so that
true energy is metered.
Replacement of defective meters and collection must be given top priority to
get fast result.
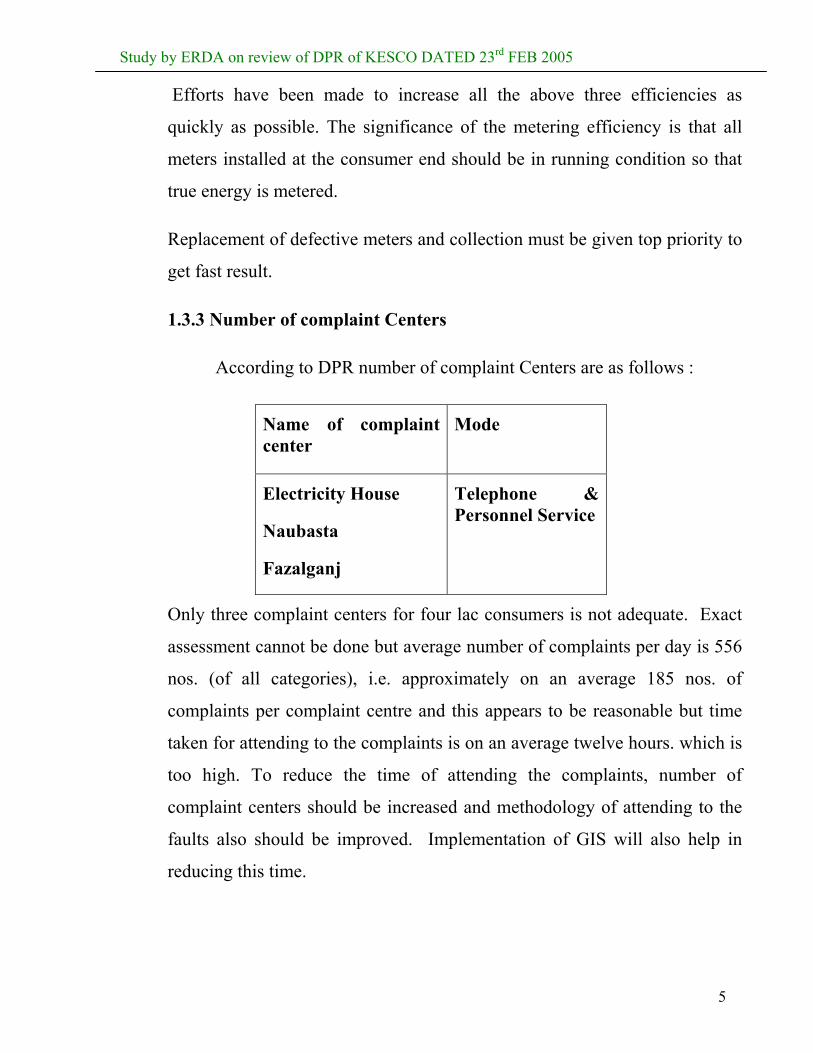
1.3.3 Number of complaint Centers
According to DPR number of complaint Centers are as follows :
Name of complaint center
Mode
Electricity House
Naubasta
Fazalganj
Telephone & Personnel Service
Only three complaint centers for four lac consumers is not adequate. Exact
assessment cannot be done but average number of complaints per day is 556
nos. (of all categories), i.e. approximately on an average 185 nos. of
complaints per complaint centre and this appears to be reasonable but time
taken for attending to the complaints is on an average twelve hours. which is
too high. To reduce the time of attending the complaints, number of
complaint centers should be increased and methodology of attending to the
faults also should be improved. Implementation of GIS will also help in
reducing this time.
Study by ERDA on review of DPR of KESCO DATED 23rd FEB 2005
6
1.3.4 Single Line Diagram:
The technical data of the circle should include electrical single line diagram
of the system, physical diagram showing geographic location of sub station
and line, single line diagram for each EHV & HV substation, Geographical
diagram showing location of HV sub station, routing of 11 kV feeders and
location of distribution transformer for the feeders which have been
proposed for inclusion.
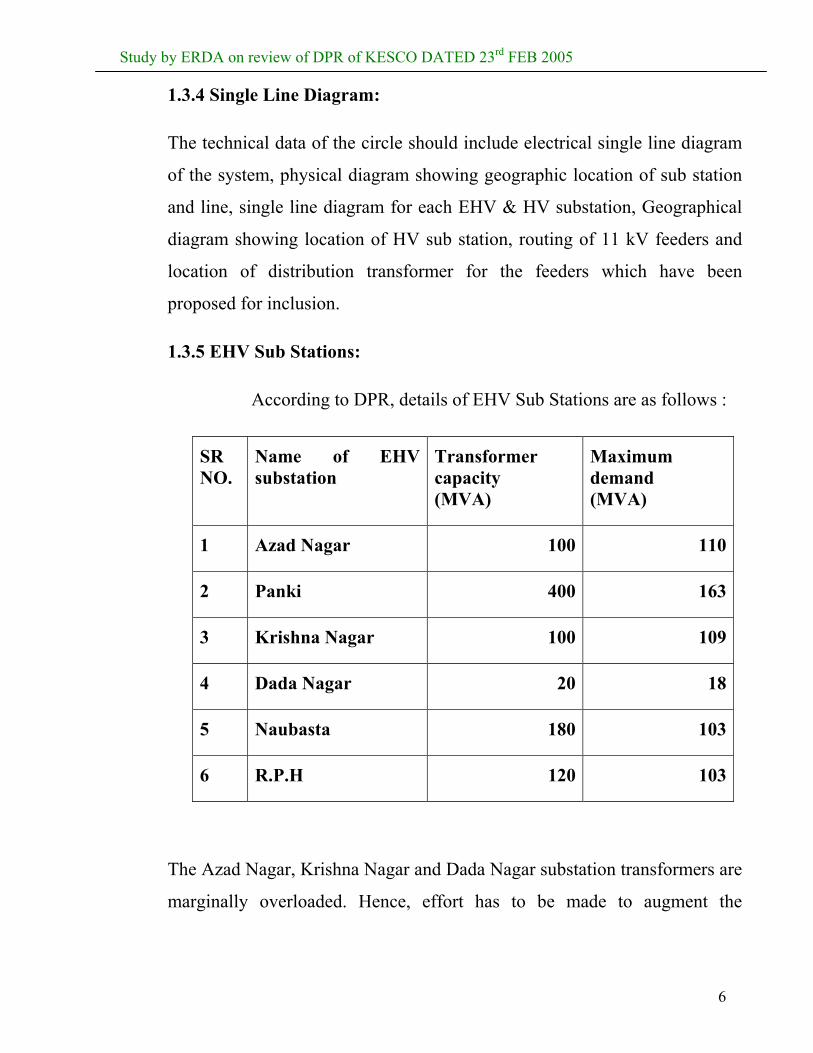
1.3.5 EHV Sub Stations:
According to DPR, details of EHV Sub Stations are as follows :
SR NO.
Name of EHV substation
Transformer capacity (MVA)
Maximum demand (MVA)
1 Azad Nagar 100 110
2 Panki 400 163
3 Krishna Nagar 100 109
4 Dada Nagar 20 18
5 Naubasta 180 103
6 R.P.H 120 103
The Azad Nagar, Krishna Nagar and Dada Nagar substation transformers are
marginally overloaded. Hence, effort has to be made to augment the
Study by ERDA on review of DPR of KESCO DATED 23rd FEB 2005
7
capacity, ensure better reliability of power. These substations are managed
and controlled by UPPCL.
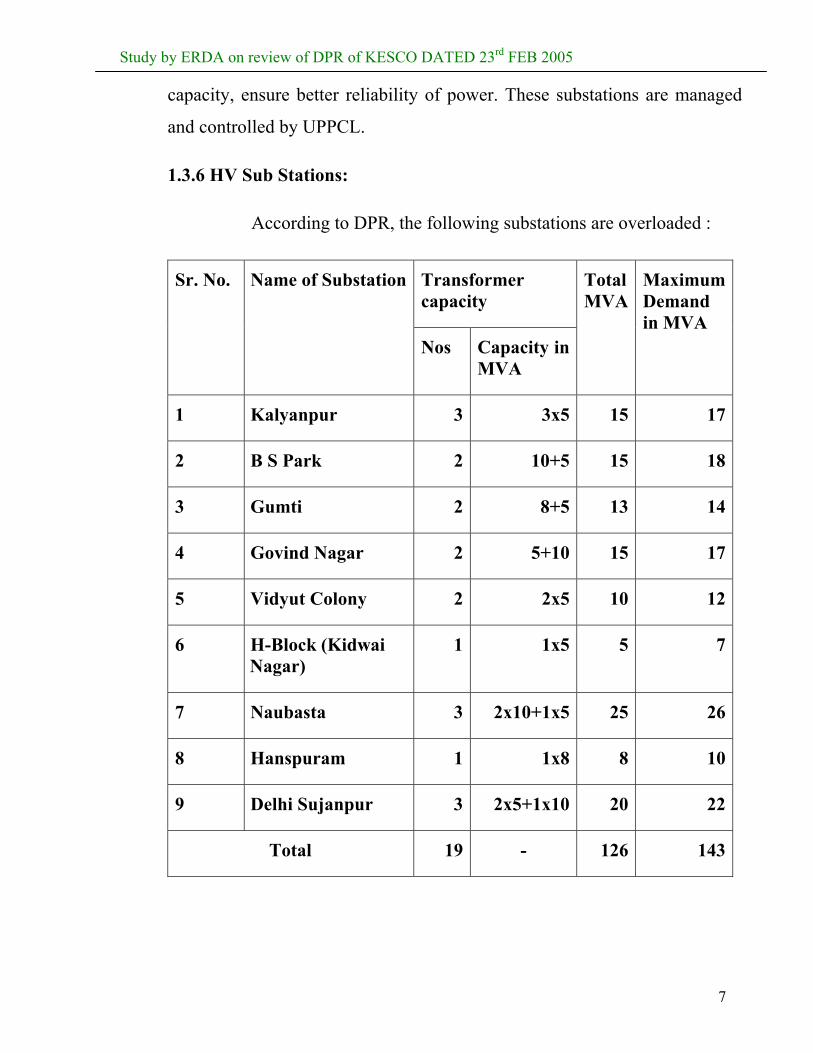
1.3.6 HV Sub Stations:
According to DPR, the following substations are overloaded :
Transformer capacity
Sr. No. Name of Substation
Nos Capacity in MVA
Total MVA
Maximum Demand in MVA
1 Kalyanpur 3 3x5 15 17
2 B S Park 2 10+5 15 18
3 Gumti 2 8+5 13 14
4 Govind Nagar 2 5+10 15 17
5 Vidyut Colony 2 2x5 10 12
6 H-Block (Kidwai Nagar)
1 1x5 5 7
7 Naubasta 3 2x10+1x5 25 26
8 Hanspuram 1 1x8 8 10
9 Delhi Sujanpur 3 2x5+1x10 20 22
Total 19 - 126 143
Study by ERDA on review of DPR of KESCO DATED 23rd FEB 2005
8
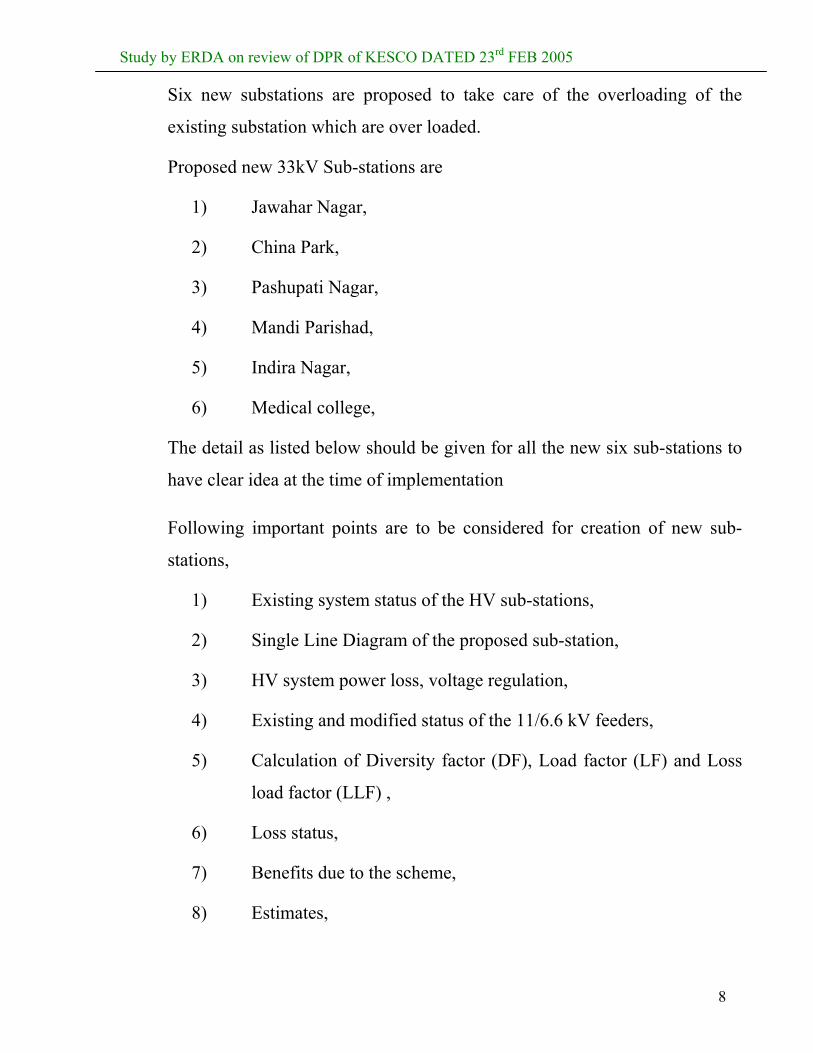
Six new substations are proposed to take care of the overloading of the
existing substation which are over loaded.
Proposed new 33kV Sub-stations are
1) Jawahar Nagar,
2) China Park,
3) Pashupati Nagar,
4) Mandi Parishad,
5) Indira Nagar,
6) Medical college,
The detail as listed below should be given for all the new six sub-stations to
have clear idea at the time of implementation
Following important points are to be considered for creation of new sub-
stations,
1) Existing system status of the HV sub-stations,
2) Single Line Diagram of the proposed sub-station,
3) HV system power loss, voltage regulation,
4) Existing and modified status of the 11/6.6 kV feeders,
5) Calculation of Diversity factor (DF), Load factor (LF) and Loss
load factor (LLF) ,
6) Loss status,
7) Benefits due to the scheme,
8) Estimates,
Study by ERDA on review of DPR of KESCO DATED 23rd FEB 2005
9
9) 11/6.6 kV feeder map with existing position,
10) 11/6.6 kV feeder map with modified proposed position
The augmentation of power transformer capacity will take place for above
substations. Also from data submitted by KESCO it is found that
approximately 50 % of transformers are loaded beyond 80 % and above as
per 2.3 of DPR, hence augmentation can also be proposed for the same.
1.3.7 Connection from EHV to HV Sub-Station
In most of the feeders, the conductor used is Dog and cable of the size 240
mm2 hence the loading is within the limits. According to ERDA study, there
are about seven cases only where the voltage regulation is poor. For
improvement of voltage regulation, nine feeders are proposed in the DPR.
The details of all should be given as listed below:
1) Annual load growth
2) Existing system status HV substation details,
3) HV substation and feeder details before and after modification
i.e. loading and voltage regulation
4) Losses before modification
5) Existing distribution system without modification and after
modifications,
6) Benefits due to scheme,
7) Estimate,
8) Expected % voltage regulation and losses status after
modification
Study by ERDA on review of DPR of KESCO DATED 23rd FEB 2005
10
1.3.8 11kV feeders emanating from HV sub-station
The power factor (pf) worked out from the readings of MW and MVA will
not be exact but will give indicative idea of the system. The calculated pf. is
in the range of 0.8 to 0.85, which is poor and can be improved by providing
reactive power compensation, which will reduce the losses and also will
improve the voltage regulation
Study by ERDA on review of DPR of KESCO DATED 23rd FEB 2005
11
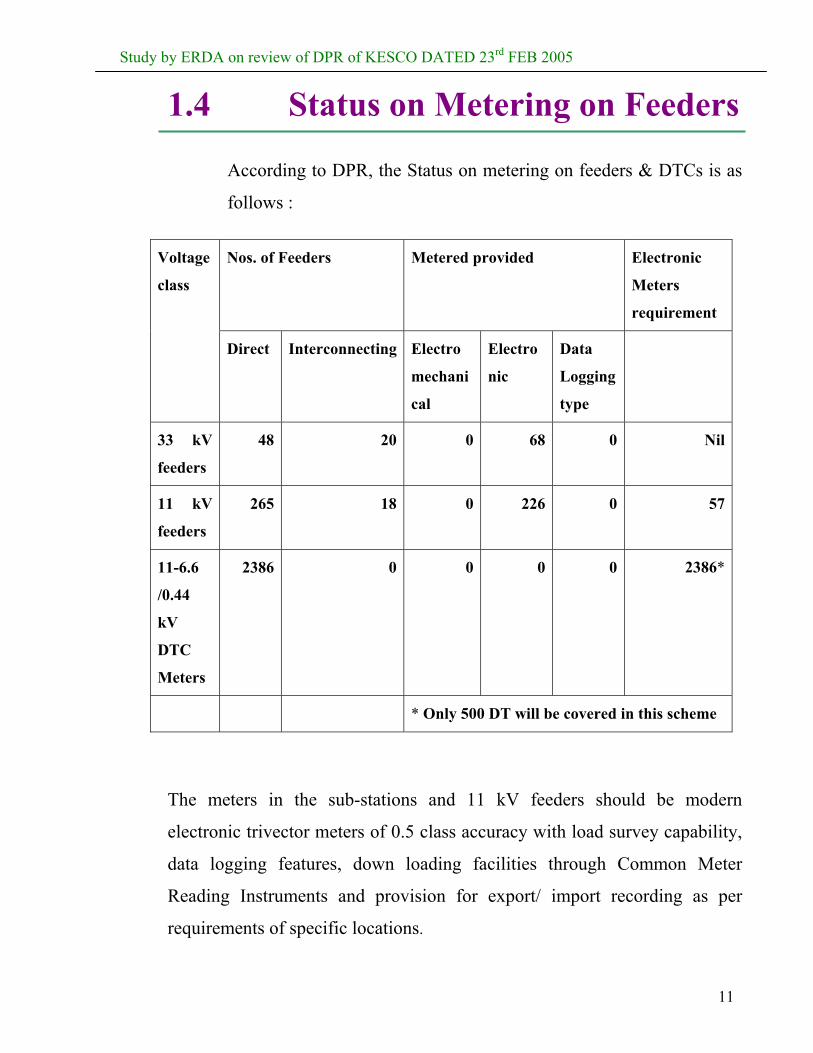
1.4 Status on Metering on Feeders
According to DPR, the Status on metering on feeders & DTCs is as
follows :
Nos. of Feeders Metered provided Electronic
Meters
requirement
Voltage
class
Direct Interconnecting Electro
mechani
cal
Electro
nic
Data
Logging
type
33 kV
feeders
48 20 0 68 0 Nil
11 kV
feeders
265 18 0 226 0 57
11-6.6
/0.44
kV
DTC
Meters
2386 0 0 0 0 2386*
* Only 500 DT will be covered in this scheme
The meters in the sub-stations and 11 kV feeders should be modern
electronic trivector meters of 0.5 class accuracy with load survey capability,
data logging features, down loading facilities through Common Meter
Reading Instruments and provision for export/ import recording as per
requirements of specific locations.
Study by ERDA on review of DPR of KESCO DATED 23rd FEB 2005
12
DT meters considered is only 500 in the DPR. If this is raised to 750, it will
give faster results of energy Accounting and pin pointing the loopholes. The
improvement of metering of the DTs will not directly help in reduction of
losses but will be helpful through Energy Accounting.
Study by ERDA on review of DPR of KESCO DATED 23rd FEB 2005
13
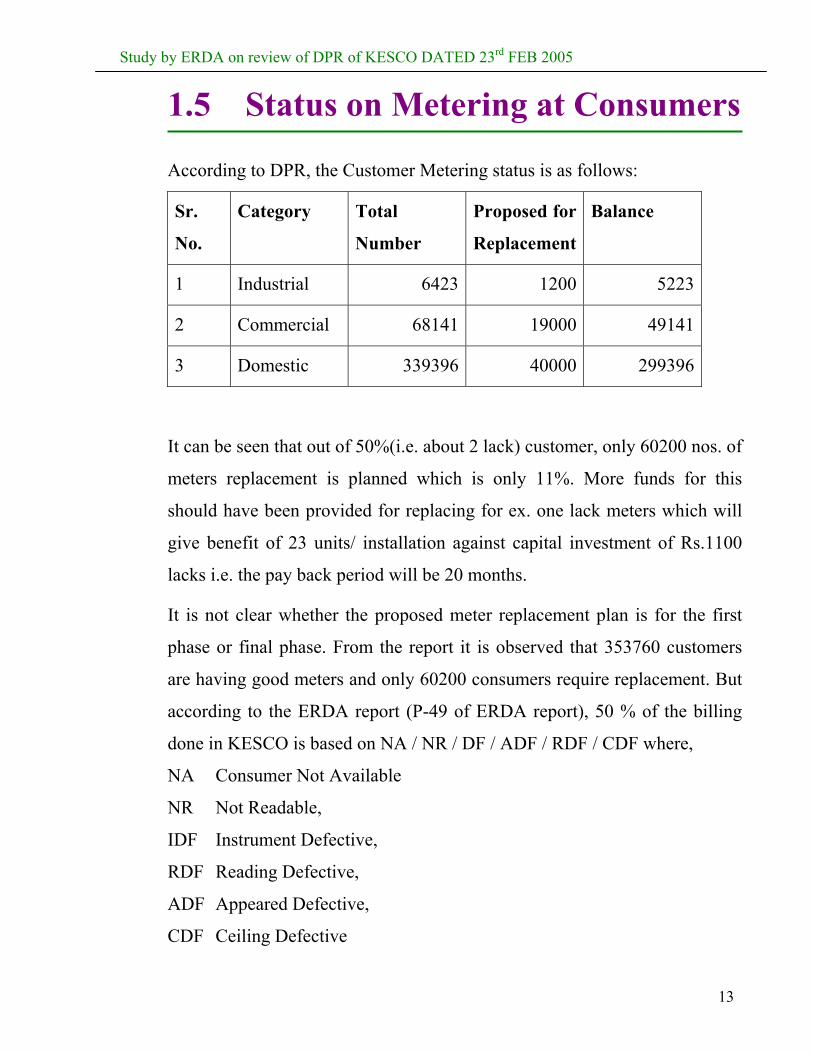
1.5 Status on Metering at Consumers
According to DPR, the Customer Metering status is as follows:
Sr.
No.
Category Total
Number
Proposed for
Replacement
Balance
1 Industrial 6423 1200 5223
2 Commercial 68141 19000 49141
3 Domestic 339396 40000 299396
It can be seen that out of 50%(i.e. about 2 lack) customer, only 60200 nos. of
meters replacement is planned which is only 11%. More funds for this
should have been provided for replacing for ex. one lack meters which will
give benefit of 23 units/ installation against capital investment of Rs.1100
lacks i.e. the pay back period will be 20 months.
It is not clear whether the proposed meter replacement plan is for the first
phase or final phase. From the report it is observed that 353760 customers
are having good meters and only 60200 consumers require replacement. But
according to the ERDA report (P-49 of ERDA report), 50 % of the billing
done in KESCO is based on NA / NR / DF / ADF / RDF / CDF where,
NA Consumer Not Available
NR Not Readable,
IDF Instrument Defective,
RDF Reading Defective,
ADF Appeared Defective,
CDF Ceiling Defective

Study by ERDA on review of DPR of KESCO DATED 23rd FEB 2005
14
In light of this, the replacement of meters has to be stepped up to have
quicker result with lesser investment. The Commercial and Industrial
connections should be given priority.
Study by ERDA on review of DPR of KESCO DATED 23rd FEB 2005
15
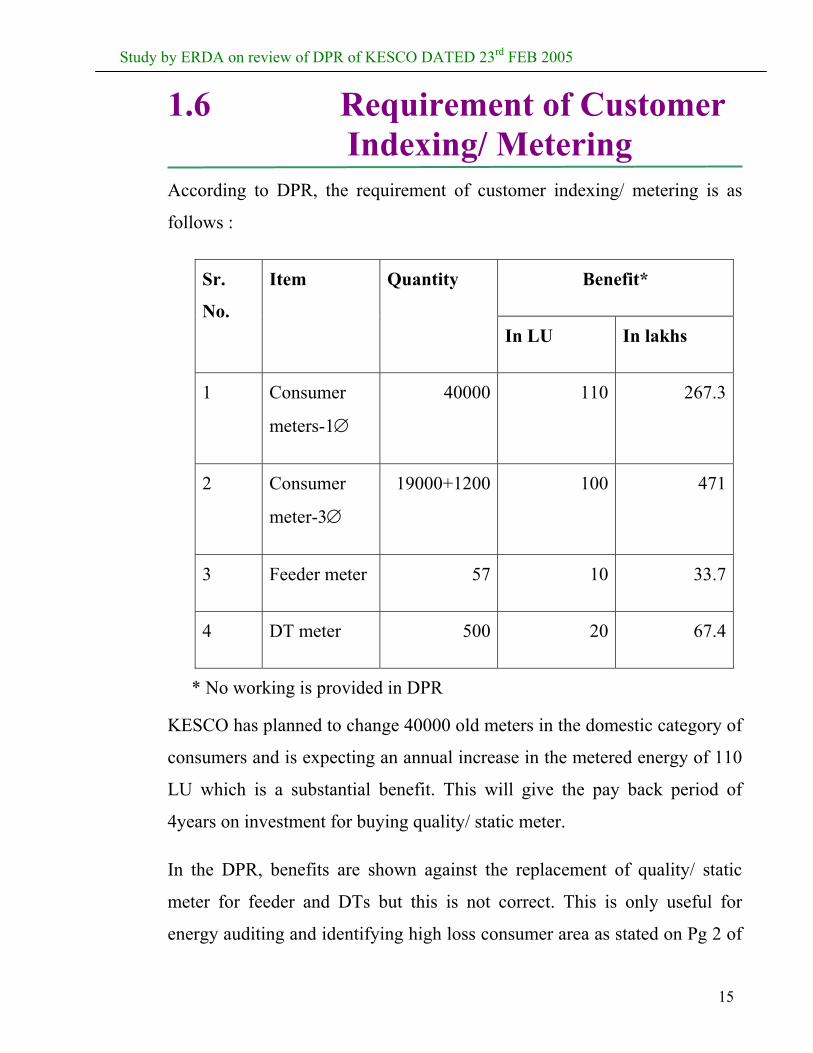
1.6 Requirement of Customer Indexing/ Metering
According to DPR, the requirement of customer indexing/ metering is as
follows :
Benefit* Sr.
No.
Item Quantity
In LU In lakhs
1 Consumer
meters-1∅
40000 110 267.3
2 Consumer
meter-3∅
19000+1200 100 471
3 Feeder meter 57 10 33.7
4 DT meter 500 20 67.4
* No working is provided in DPR
KESCO has planned to change 40000 old meters in the domestic category of
consumers and is expecting an annual increase in the metered energy of 110
LU which is a substantial benefit. This will give the pay back period of
4years on investment for buying quality/ static meter.
In the DPR, benefits are shown against the replacement of quality/ static
meter for feeder and DTs but this is not correct. This is only useful for
energy auditing and identifying high loss consumer area as stated on Pg 2 of
Study by ERDA on review of DPR of KESCO DATED 23rd FEB 2005
16
APDRP report for KESCO, while in the same report a benefit of Rs 101.1
lack is shown.
Under the benefit column the basis of the benefit in LU and Rs. Lac is to be
explained for each category. According to the clarification now received
form the KESCO this is their rough assessment. It is felt that this does not fit
in properly. Some scientific reasoning is required.
From the data given in the table that the pay back period is less than two
years, hence it is recommended to divert more funds for this activity for
quick return.
Study by ERDA on review of DPR of KESCO DATED 23rd FEB 2005
17
1.7 Requirements of Capacitors
It is reported that there is no requirement of Capacitors but as can be
computed from table 2.6 P-17 of DPR that the power factor of the system is
between 0.80 and 0.85 this means that adequate compensation is not
available at load centers. In ideal system the power factor is maintained at
0.9 to 0.95 by providing required reactive power compensation which will
improve the quality of power and will reduce losses and improve the voltage
regulation.
It is also seen that the power factor or the MVA readings are not the meter
readings but assessed readings by assuming one of the factor i.e. MVA or pf.
Study by ERDA on review of DPR of KESCO DATED 23rd FEB 2005
18
1.8 Requirement of Relays
In this report this is shown as “ not required “ but for new Power
Transformers and new feeders protection relays are required and the Table
8.1 should be completed as this also will be required at the time of
implementation unless cost of Power Transformers proposed includes this.
Study by ERDA on review of DPR of KESCO DATED 23rd FEB 2005
19
1.9 Statement of Distribution Transformer Failure
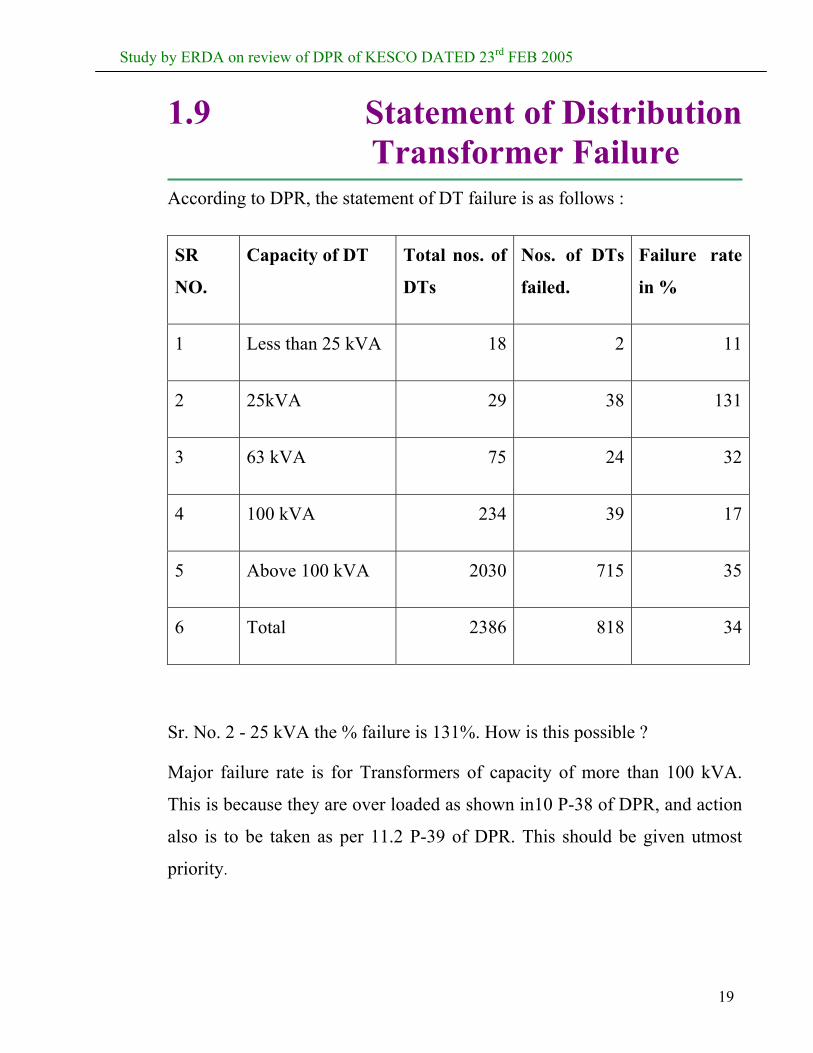
According to DPR, the statement of DT failure is as follows :
SR
NO.
Capacity of DT Total nos. of
DTs
Nos. of DTs
failed.
Failure rate
in %
1 Less than 25 kVA 18 2 11
2 25kVA 29 38 131
3 63 kVA 75 24 32
4 100 kVA 234 39 17
5 Above 100 kVA 2030 715 35
6 Total 2386 818 34
Sr. No. 2 - 25 kVA the % failure is 131%. How is this possible ?
Major failure rate is for Transformers of capacity of more than 100 kVA.
This is because they are over loaded as shown in10 P-38 of DPR, and action
also is to be taken as per 11.2 P-39 of DPR. This should be given utmost
priority.
Study by ERDA on review of DPR of KESCO DATED 23rd FEB 2005
20
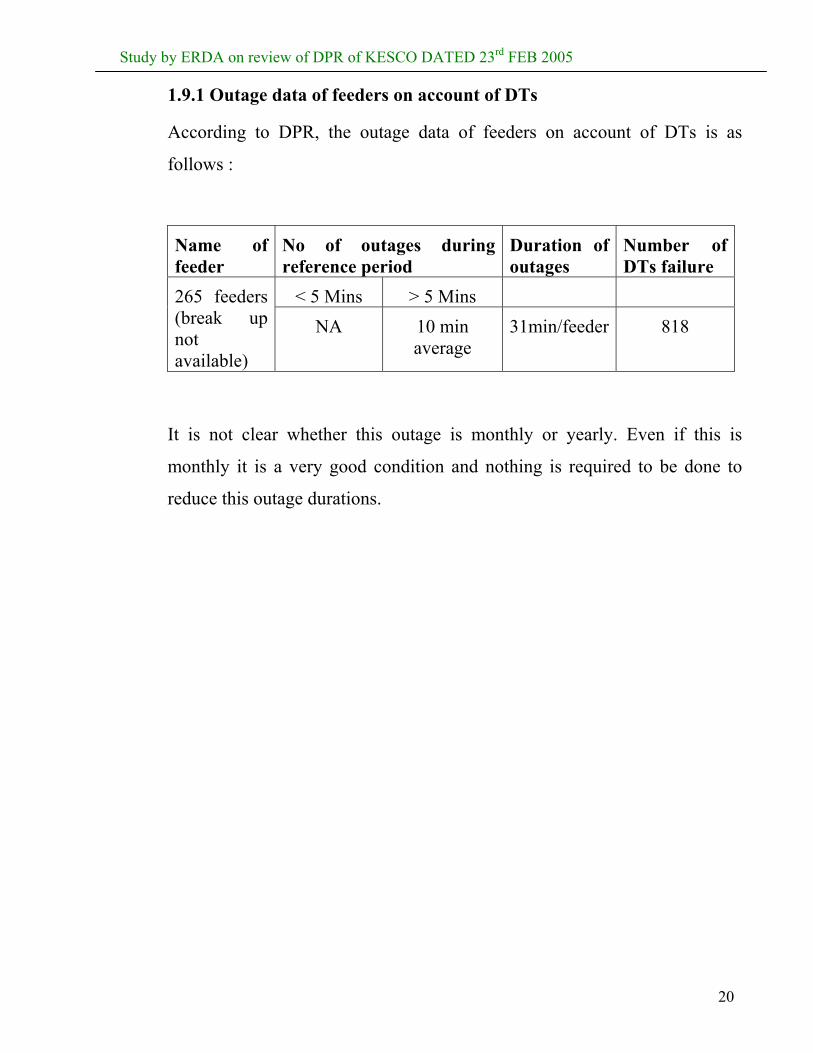
1.9.1 Outage data of feeders on account of DTs
According to DPR, the outage data of feeders on account of DTs is as
follows :
Name of feeder
No of outages during reference period
Duration of outages
Number of DTs failure
< 5 Mins > 5 Mins 265 feeders (break up not available)
NA 10 min average
31min/feeder 818
It is not clear whether this outage is monthly or yearly. Even if this is
monthly it is a very good condition and nothing is required to be done to
reduce this outage durations.
Study by ERDA on review of DPR of KESCO DATED 23rd FEB 2005
21
1.10 Distribution Transformer R&M (Improvement in LT Sub-Station)
It is stated that by providing earthing there will be a benefit of the order of
Rs. 14.5 lac. How this benefit is achieved is not explained. No supporting
calculations are available in the report. The configuration of LT distribution
lines is not received. In the absence of these details and some additional
information required about the grounding of the neutral, (whether it is
grounded at the transformer or is a multiple grounding earth system) the
verification of this benefit cannot be done .
Study by ERDA on review of DPR of KESCO DATED 23rd FEB 2005
22
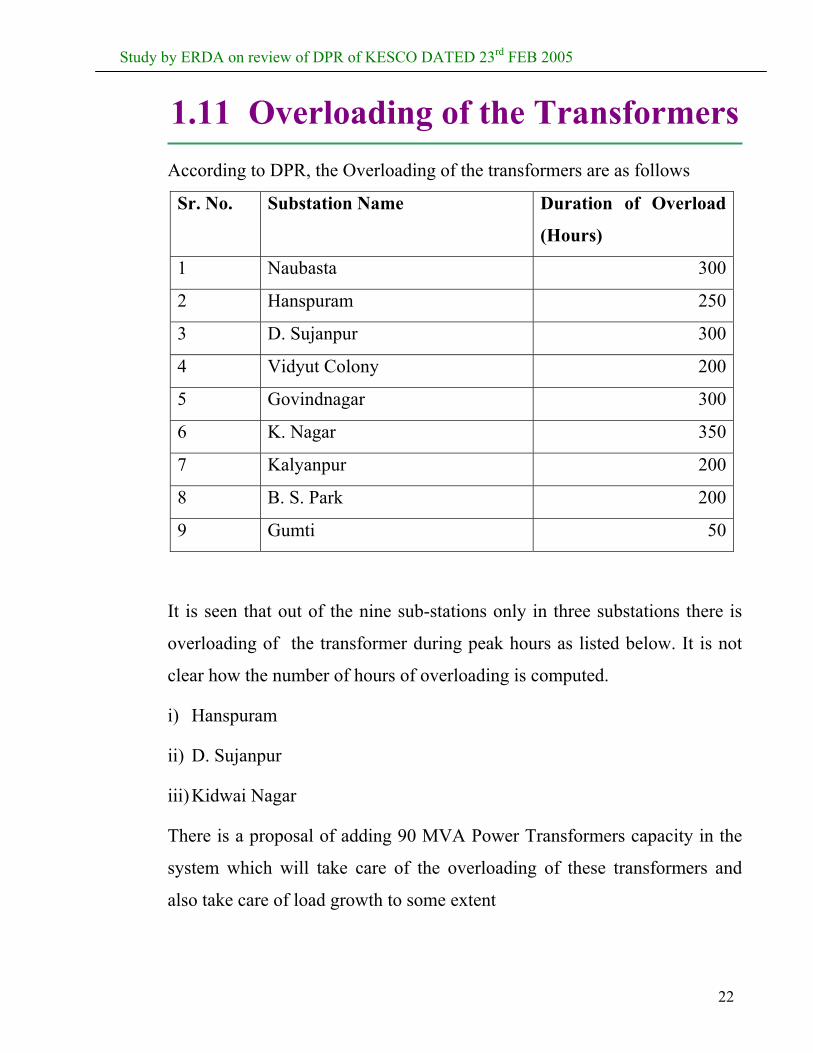
1.11 Overloading of the Transformers According to DPR, the Overloading of the transformers are as follows
Sr. No. Substation Name Duration of Overload
(Hours)
1 Naubasta 300
2 Hanspuram 250
3 D. Sujanpur 300
4 Vidyut Colony 200
5 Govindnagar 300
6 K. Nagar 350
7 Kalyanpur 200
8 B. S. Park 200
9 Gumti 50
It is seen that out of the nine sub-stations only in three substations there is
overloading of the transformer during peak hours as listed below. It is not
clear how the number of hours of overloading is computed.
i) Hanspuram
ii) D. Sujanpur
iii) Kidwai Nagar
There is a proposal of adding 90 MVA Power Transformers capacity in the
system which will take care of the overloading of these transformers and
also take care of load growth to some extent
Study by ERDA on review of DPR of KESCO DATED 23rd FEB 2005
23
1.12 Requirement of Power Transformers
The augmentation of power transformer will be done in nine substations as
given in the DPR submitted by KESCO. It is also proposed that nine new
power transformers will be installed at these substations. The annual load
growth rate of KESCO has been taken as per ARR of KESCO as 5% in FY-
04, considering the load and energy pattern of KESCO for the last financial
year. By augmentation of power transformers & new power transformers
possibility of overloading can be reduced.
The revised cost of the 10.0 MVA Transformers shown as 17.0 lac is also on
the lower side. This may be checked.
Study by ERDA on review of DPR of KESCO DATED 23rd FEB 2005
24
1.13 Feeder Details (a) The strengthening cost of 33 kV feeder is given as Rs. 17.9 Lac/ kM
The cost of a new 33 kV line is Rs. 7.66 Lac./ kM, This discrepancy is
not explainable.
(b) The cost of 11 kV new line is taken as Rs. 22 Lac./ kM, which is too
high.
(c) The cost of 11 kV line re-conductoring is taken as Rs 1.6 Lac/ kM but in
absence of the knowledge of the size of the conductor it is not possible to
comment on this.
(d) If this includes the use of higher size conductor and adding supports, if
required, the cost shown appears to be less.
(e) New LT lines using (ABC conductors) are configured for three wire
systems but the conductor size is not specified.
Study by ERDA on review of DPR of KESCO DATED 23rd FEB 2005
25
1.14 Reliability Index Normally after implementation of the APDRP, the Reliability is expected to
have improved and to demonstrate this the Reliability Index working is
necessary and this is not specified in the report.
Study by ERDA on review of DPR of KESCO DATED 23rd FEB 2005
26
1.15 Conclusion The DPR review has brought out the following observations:
1. Acceptable bench mark norms for losses are not specified and the
projected loss reduction due to implementation of suggested schemes
may not be realistic.
2. While computing the increased revenue due to system improvements
and suggestions, the norms used and computation methodology are
not given.
3. The cost figures used for new feeders, strengthening of feeders new
transformers and substations appear to be on the high side.
Accordingly the overall investment required for implementing the
proposed schemes should be checked.
4. No importance is given to improvement of power factor in the report.
Higher power factor means lower losses. It is, therefore, necessary to
assess the quantum of additional reactive power requirement to
improve the power factor.
5. Increasing the percentage of metered energy and replacing old and
defective meters with electronic / quality meters will result in higher
billed energy and reduce the non technical losses. This benefit is
achieved in the shortest possible time and so it is desirable for short-
term plan for system improvement. Therefore, more emphasis should
be placed on the use of new meters.
6. The schemes proposed in the DPR for system improvement are in
general acceptable. They fall in line with prevailing philosophy.
Study by ERDA on review of DPR of KESCO DATED 23rd FEB 2005
27
However, the number of feeders considered for strengthening and the
number of new meters or meters replacement proposed and the
suggested number of transformers with higher rating to reduce the
possibilities of overloads and thus by improving the reliability of the
system and reduce the system outages requires a review.
If this scheme is restricted due to financial constraints, then the
present DPR should be considered as phase 1 of the plan for overall
system improvement.
7. To avoid any further delay in implementation of the proposed
schemes, it is suggested that the DPR as it is submitted may be
approved and the requested amount be sanctioned to enable KESCO
to start the work immediately

Study by ERDA on review of DPR of KESCO DATED 23rd FEB 2005
28
SECTION 2
Study by ERDA on review of DPR of KESCO DATED 23rd FEB 2005
29
MODEL GUIDELINES FOR
EVALUATION OF
INVESTMENT PROPOSALS
FOR DISTRIBUTION
SCHEMES UNDER
APDRP
Study by ERDA on review of DPR of KESCO DATED 23rd FEB 2005
30
2.1 Introduction
In the initial stage of power development in the country, power supply
facilities and Transmission and Distribution (T&D) systems were built
mainly for catering to urban areas/ towns to feed mostly domestic and
commercial loads. After independence, with the thrust given to power
development in the five-year plan programmes, the extent and reach of
electricity has undergone dramatic changes. With the thrust on programme
for rural electrification and large-scale energization of pump sets from the
3rd five-year plan onwards, the sub-transmission and distribution networks
were expanded rapidly. However, this expansion was very often without
adequate studies to evolve optimal network, size and location of sub-
stations, adequacy of back-up sub-transmission etc. Further the rise in
industrial and agricultural pumping load increased the reactive power
requirements. Adequate attention has not been given to compensate this
reactive demand, which resulted in poor voltage regulation and increased
losses. Hence, distribution systems are characterized by high T&D losses,
poor voltage conditions, frequent interruptions/ outages etc.
The sub transmission and distribution system was completely neglected and
haphazard expansion was done without any planning which resulted in
extremely poor quality of system with high losses in the system . Ministry of
Power (MOP) decided to give top priority for the improvement of
distribution sector and came out with a scheme known as Accelerated Power
Development Programme (APDP), which is now termed as Accelerated
Power Development and Reforms Programme (APDRP). MOP initially
identified 63 distribution circles belonging to different states for improving/
Study by ERDA on review of DPR of KESCO DATED 23rd FEB 2005
31
strengthening of the sub-transmission and distribution networks in such a
manner so as to develop centers of excellence within the utility to enable the
state to replicate the same latter in their entire distribution system.
In 4 years of this program there was substantial improvement in the
performance of the identified distribution circles and therefore MOP
extended this programme to cover more circle and the present DPR is the
result of that.
As a normal practice the DPRs are required to be vetted by an independent
consultant. Accordingly, ERDA is given this responsibility to evaluate the
investment proposal from Techno-economic criterion.
Study by ERDA on review of DPR of KESCO DATED 23rd FEB 2005
32
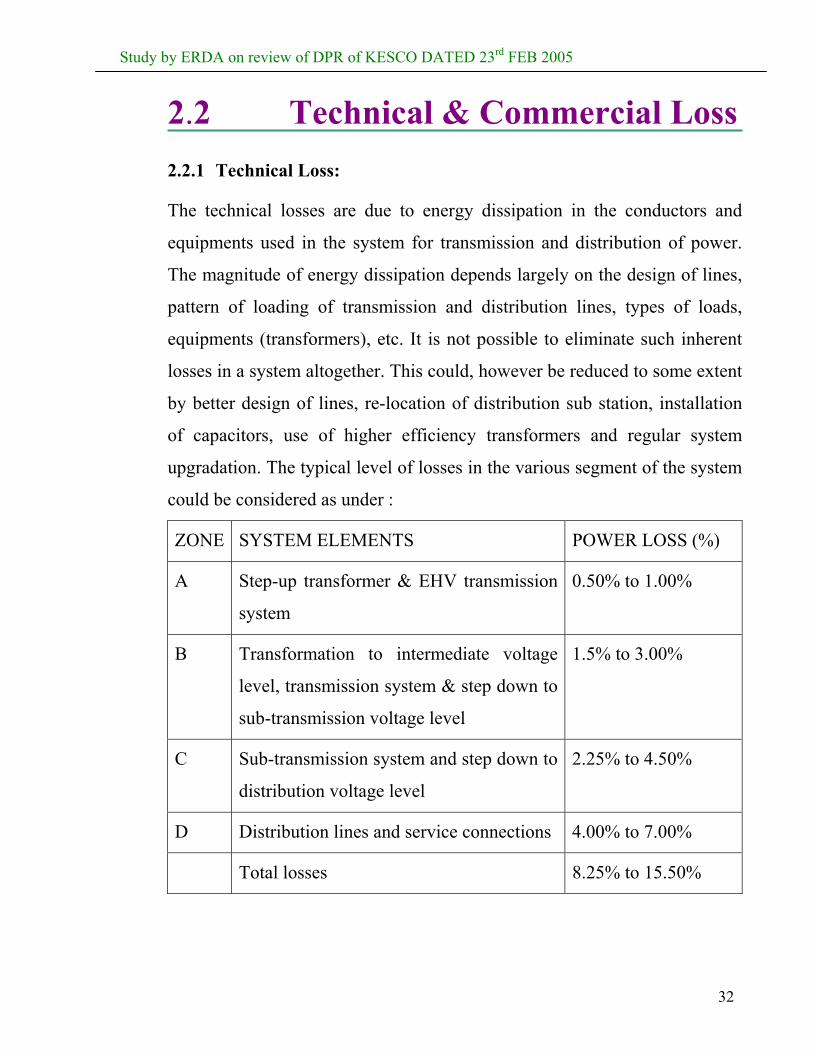
2.2 Technical & Commercial Loss 2.2.1 Technical Loss:
The technical losses are due to energy dissipation in the conductors and
equipments used in the system for transmission and distribution of power.
The magnitude of energy dissipation depends largely on the design of lines,
pattern of loading of transmission and distribution lines, types of loads,
equipments (transformers), etc. It is not possible to eliminate such inherent
losses in a system altogether. This could, however be reduced to some extent
by better design of lines, re-location of distribution sub station, installation
of capacitors, use of higher efficiency transformers and regular system
upgradation. The typical level of losses in the various segment of the system
could be considered as under :
ZONE SYSTEM ELEMENTS POWER LOSS (%)
A Step-up transformer & EHV transmission
system
0.50% to 1.00%
B Transformation to intermediate voltage
level, transmission system & step down to
sub-transmission voltage level
1.5% to 3.00%
C Sub-transmission system and step down to
distribution voltage level
2.25% to 4.50%
D Distribution lines and service connections 4.00% to 7.00%
Total losses 8.25% to 15.50%
Study by ERDA on review of DPR of KESCO DATED 23rd FEB 2005
33
These losses depend on the pattern and nature of demand, load density and
the capability and configuration of system; equipment used and vary for
various system elements. However, systems where total percentage loss lies
beyond these range of values should become a matter of serious concern and
further study and analysis should be carried out. Targets for reduction of
technical losses should accordingly be fixed, measures identified and action
taken to accomplish the same within the given time period
2.2.2 Commercial Loss:
Commercial or unaccounted losses are caused by theft of energy, meter
tempering, defective meters, meter reading errors, error in estimation of
unmetered supply etc. While it may be difficult to accurately segregate this
loss into various elements, there is absolutely no reason why unaccounted/
commercial losses, especially theft of energy and deficiencies in metering
cannot be eliminated.
2.2.3 Measures for reducing non-technical losses:
(1) Set up vigilance squads comprising engineers and police officers for
conducting surprise check at the consumer premises to detect
pilferage of energy and intensify surprise inspections/ raids, to detect
cases of malpractices and pilferage of energy.
(2) A multidisciplinary vigilance set up in the utilities with personnel
having engineering, legal and police experience should be established
to provide knowledge and expertise in framing suitable policies and
mechanisms for detection and follow up action on cases involving
theft of energy.
(3) The special vigilance groups for tracing the unauthorized consumers
and direct tapping from lines may inspect the feeders periodically.
Study by ERDA on review of DPR of KESCO DATED 23rd FEB 2005
34
(4) Severe penalties may be imposed for tampering with the meter seal
etc.
(5) Initiate publicity campaign to depict theft of electricity as a social and
economic crime and inform the public regarding provisions in
electricity laws in this regard.
(6) The monthly consumption of industrial consumers should be carefully
watched and any major variation in consumption should be analyzed
and investigated for possible reasons.
(7) Installation of tamper-proof meter boxes and use of tamper proof
numbered seals.
Study by ERDA on review of DPR of KESCO DATED 23rd FEB 2005
35
2.3 Commercial Performance For good commercial performance, the following should be on higher side in
the range 80 to 100 %.
(i) Metering Efficiency
(ii) Billing Efficiency
(iii) Collection efficiency
(1) Metering Efficiency:
It is defined as the ratio of metered energy to actual energy consumed.
The significance of the metered energy is that all the meter installed at
the consumers end should be in running condition so that energy
assessed should be as accurate as possible.
(2) Billing Efficiency:
It is defined as the ratio of billed energy to the metered energy.
(3) Collection Efficiency:
It is defined as the ratio of revenue collected to amount billed.
For proper energy billing, revenue collection and analysis of large volume of
energy related data, it is necessary to install “Computerized system” at each
billing center.
The system should have an on-line browsing consumers’ ledger, apart from
other facilities.
It may have the facility to carry out the following functions:
Study by ERDA on review of DPR of KESCO DATED 23rd FEB 2005
36
▪ Billing for different categories of consumers
▪ On the spot billing
▪ Making corrections in the bill
▪ Interactive revenue collection mechanism
▪ Verification of bill with out-of-norm consumption pattern
▪ Sample check to detect under / over billing
▪ Monthly payment on normative basis, with billing on actual, once in
three months for rural area
▪ Identification of meter reader
▪ Generation of MIS report indicating the deviation in energy
consumption pattern for different categories of consumers
▪ Generation of reports where the bills are not paid by the consumers
All entries should be done in the Computer System by authorized persons.
He should have security code which may indicate the name of the person
who has made corrections or changes in the energy bill of the consumers(s).
In case of HT consumers, scrutiny/ check may be carried out by senior
officers in the sub division/ division and in case of LT consumers, regular
sample check may be done.
The responsible officer of the Circle may ensure that HT bills are issued
directly to the respective consumers and the revenue is realized by due date.
As soon as bills are prepared and distributed, list of consumers who are in
arrears may be printed through computer billing system for taking action of
disconnection.
Such list could be generated category-wise (residential, commercial,
industrial etc.), amount-wise (say up to Rs. 5,000/-, between Rs.5,000/- and
Study by ERDA on review of DPR of KESCO DATED 23rd FEB 2005
37
25,000/-) and period wise (arrears for period less than 3 months, 3 to 6
months and more than 6 months).
It is the responsibility of the concerned officer to promptly disconnect the
supply of defaulting consumers.
In order to identify the revenue loss in a circle, revenue balance sheet may
be prepared. This may be computed by taking into account the total energy
received in a circle and its average cost at the receiving points as well as
revenue realized from consumers for the same period.
The revenue realized may be worked out from the figures of energy
consumed by various consumers and tariff applicable in their case.
Study by ERDA on review of DPR of KESCO DATED 23rd FEB 2005
38
2.4 Consumer Metering, Billing and Collection
2.4.1 Metering
Average figure of losses in the sub transmission and distribution network in
India is much higher as compared to advance countries. Metering is one of
the most important elements contributing to higher commercial losses. There
are a number of other elements responsible for increase of commercial
losses. However, metering is one which can be tackled on priority and
achieve results with in a short time. This can be done by replacing old
meters by new quality / static meters.
The benefits due to replacement of meters depend upon many factors but it
is observed that on an average 22.5 units extra energy is recorded per month
per installation. This can be taken as a norm for assessing the cost-benefits
involved.
The utility has to identify pockets where the losses are more and
immediately replace all the meters in that area.
This necessitates restructuring and improvement of distribution system. This
can result in reduced figure of distribution system aggregate losses. The pre
requirement for restructuring transmission and distribution system is
installation of good quality of energy meters, at all relevant locations in the
power system network for accurate loading of the quantum of energy
handled by system. Being the major party in the power sector, it is
considered as the foremost duty of the power utility to analyze the metering
system and monitoring methods employed in their distribution system.
Study by ERDA on review of DPR of KESCO DATED 23rd FEB 2005
39
It has been proved by field studies that faulty status of the meters, age of the
meters, improper connections of CT units, inadequate metering etc. add
directly to the losses in the system. In a particular feeder under survey, when
quality meters replace the old meters, the energy billing can be increased.
Hence, in order to have well-defined accounting procedure, the old meters
have to be replaced with static meters or quality meters.
2.4.2 Billing
Billing is the most important aspect in a system. Employing proper metering
system, providing intelligent methodologies and supervising the same will
bring efficient revenue realization to utility.
On examination of the billing data from a utility shows that approximately
50 % of billing done is based on NA / NR / DF / ADF / RDF / CDF where,
NA Consumer Not Available
NR Not Readable,
IDF Instrument Defective,
RDF Reading Defective,
ADF Appeared Defective,
CDF Ceiling Defective
In light of this, the replacement of meters has to be stepped up to have
quicker results with lesser investment. The commercial and industrial
connections should be given priority.
The consumer metering system should be tamper proof. Appropriate
accuracy class meters should be deployed for different categories of
consumers.
Study by ERDA on review of DPR of KESCO DATED 23rd FEB 2005
40
2.4.3 Industrial Consumers:
In many cases the power factor of the LT industrial consumer is as low as
0.5-0.6. This burdens the distribution system with increased losses and hence
poor quality of power. To compensate this, the utility should collect the
energy charges based on kVA for industrial connections and also billing
should be done for the reactive energy consumed. Therefore, it becomes
necessary to introduce LT static meters for industrial connections.
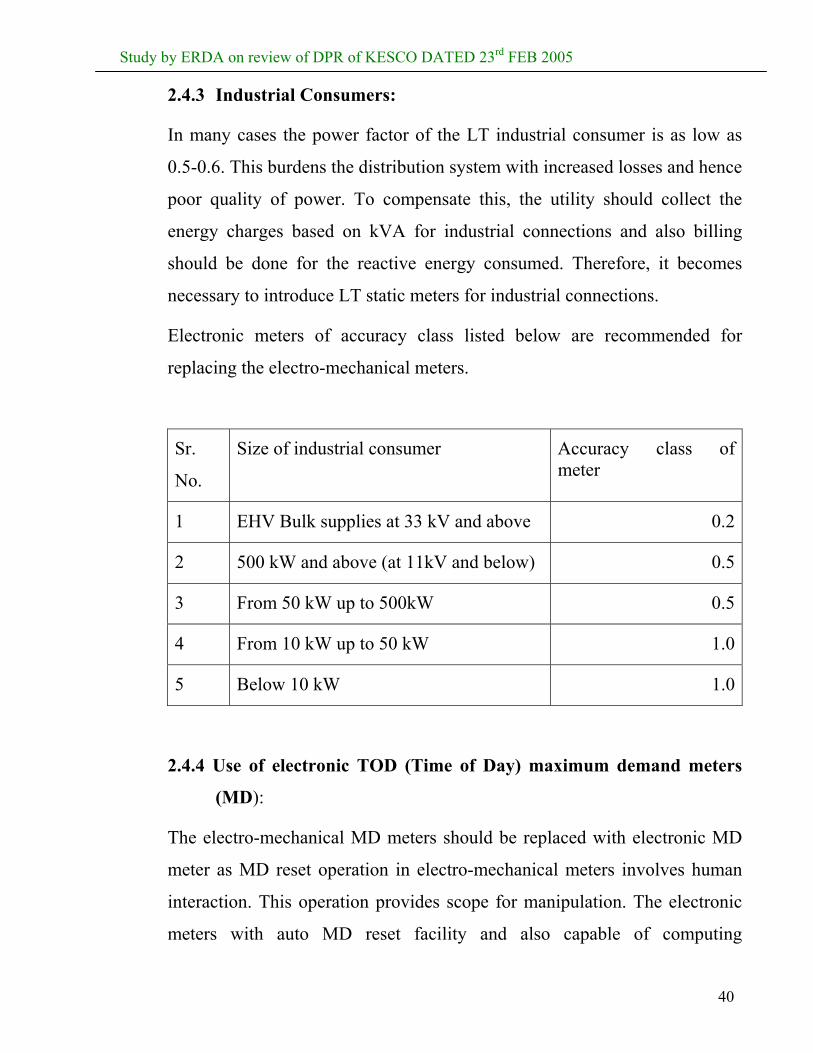
Electronic meters of accuracy class listed below are recommended for
replacing the electro-mechanical meters.
Sr.
No.
Size of industrial consumer Accuracy class of meter
1 EHV Bulk supplies at 33 kV and above 0.2
2 500 kW and above (at 11kV and below) 0.5
3 From 50 kW up to 500kW 0.5
4 From 10 kW up to 50 kW 1.0
5 Below 10 kW 1.0
2.4.4 Use of electronic TOD (Time of Day) maximum demand meters
(MD):
The electro-mechanical MD meters should be replaced with electronic MD
meter as MD reset operation in electro-mechanical meters involves human
interaction. This operation provides scope for manipulation. The electronic
meters with auto MD reset facility and also capable of computing
Study by ERDA on review of DPR of KESCO DATED 23rd FEB 2005
41
cumulative maximum demand provides solution for prevention of such
manipulations. Further, these meters are having memory facilities to give
following data, which can be retrieved through Meter Reading Instrument
(MRI) in each month.
• Hourly load survey data. (kWH, kVA, Voltage, Power Factor)
• Billing data (kVA MD, kWH & Power Factor)
• Tamper Data (CT missing, PT missing, etc)
The analysis of data is useful to expedite billing and reading activity, which
will be carried out without human intervention. Detection of theft and mal-
practices is easier. TOD metering features would also help in introduction of
suitable tariffs, which would enable demand side management to reduce
peak demand on system.
• Programming of CT/PT Ratios:
Manual billing process uses the CT and PT multiplication factors (Ratios)
stated on the paper label affixed to the metering cubicle. This provides scope
for manipulation. The actual ratio should be ascertained periodically.
Preferably, single ratio CTs and PTs for metering purpose may be used.
• Automatic Remote Metering System:
Automatic remote metering system is recommended to overcome the
problem of pilferage of energy by large consumers. This could be adopted in
areas with large number of high value industrial consumers.
Study by ERDA on review of DPR of KESCO DATED 23rd FEB 2005
42
• Replacement of Meters for small (up to 20 kVA, 3 phase consumers)
and Medium Consumers (20 kVA to 100 kVA)
The small and medium consumers (Industrial) category cover sanctioned
loads up to 100 kVA. The three phase LT consumers having load up to 20
kVA may be provided with static meters with tamper proof features.
Existing electromechanical meters should be replaced with electronic LT
TOD meters having MD, PF recording facility for consumers with load
greater than 20 kVA. Special cubicles may be designed to house the CTs
(encapsulated) of single ratio, MCBs and the meter, so that tampering
becomes difficult to the consumers.
2.4.5 Domestic - light & fan and Commercial Consumers
The meters of domestic light & fan are likely to be tampered as the present
installations provide easy access to incoming power cables, which leads to
tampering. In addition to meter seals, a metallic enclosure with a viewing
window and locking facility for the meter installation is recommended. The
meters could be located so that it becomes easily accessible without having
to go into the living area of premises.
This would facilitate regular reading of the meter regardless of whether the
premises are occupied at the time of the meter reader’s visit, by avoiding the
need for the meter reader to enter into the premises.
2.4.6 Meter Testing Facility:
It is necessary to ensure that the prime means of billing for the utility,
namely, the energy meters are checked regularly for accuracy. The meter
testing facilities need to be modernized and augmented as per anticipated
Study by ERDA on review of DPR of KESCO DATED 23rd FEB 2005
43
testing load. Portable site meter testing kits are available which should be
used to carry out surprise and spot checks.
It is recommended that computerized meter-testing database is created. This
would enable analysis of performance of meters and weeding out/ scrapping
of old meters.
The computer software to be used for meter records should have the
following minimum objectives.
• Tracking meter performance at individual and supplier level
• Provide data to evolve a policy for replacement of old meters.
Record for each meter may have the following information about the meter:
1. Make
2. Model/ type
3. Serial Number
4. Purchase Order Number
5. Latest Certificate date
6. Dial display details of kWH / kVAH/ Max. demand
7. Connection number
8. Date of installation/ re-installation
9. Dates of Repair
10. New or repaired
11. Malfunction or defective operation reported
Study by ERDA on review of DPR of KESCO DATED 23rd FEB 2005
44
2.4.7 Improved Metering:
(i) Installation of tamper-proof meter boxes and use of tamper-proof
numbered seals
(ii) Providing cut outs/ MCBs after the meter as per sanctioned load and
use of multi-core P.V.C. cables.
(iii) Installations of tamper proof electronic energy meters.
(iv) Providing adequate meter testing facilities. A time bound programme
should be chalked out for checking the meters and replacement of
defective meters with tested meters.
(v) Pilot studies for introduction of modern technologies such as pre-paid
meters, remote metering, automatic billing etc. should be undertaken to
establish the efficacy and suitability for adoption on a wider scale
covering all categories of consumers.
2.4.8 Periodic Test Schedule for Meters
Meters should be tested according to the following test schedule:
• Single Phase LT meters: Once in 5 years after installation at
consumer’s premises.
• Poly-phase LT meters: Once in 2 years after installation at
consumer’s premises.
• LT three-phase meters (CT operated) 20 kVA to 100 kVA:
Once in a year to be checked since these are
installed for high value consumers.
Study by ERDA on review of DPR of KESCO DATED 23rd FEB 2005
45
• HT meters:
For EHV level consumer (above 10 MVA)-Once in a quarter year.
For Loads (contract demand 5-10 MVA)-Once in a six months
Remaining HT consumers-Once in a year.
The testing schedule for HT consumers should cover the entire metering
system including CTs, PTs and pilot wire. Detailed ratio testing of CTs and
PTs is to be done. Testing through mobile cubicles through secondary
injections kits and phantom loading may also be carried out.
Study by ERDA on review of DPR of KESCO DATED 23rd FEB 2005
46
2.5 System Metering The metering plan for an effective energy accounting should cover the input
points of the circle and identify receiving and transfer points at different
voltage levels to ultimately enable measurement of energy input to a 11/6.6
kV feeder and there after to the ultimate consumers. The meters in the sub-
stations and 11/6.6 kV feeders should be modern electronic trivector meters
of 0.5 class accuracy with load survey capability, data logging features,
down loading facilities through Meter Reading Instruments and provision for
export/ import recording as per requirements of specific locations. Such
meters would eliminate scope for manipulation. Metering at these voltage
levels involves CTs and PTs and actual accuracies including ratios are to be
checked periodically.
Till such time, 100% meters are provided to the un-metered class of
consumers, meters may be provided on LV side of selected distribution
transformers feeding say, predominantly agriculture consumers or
consumers without meters and theft prone areas. These meters should also
be 0.5-class accuracy with load survey capability, data logging features and
downloading facilities. This would enable correct estimation of utilization
pattern (average consumption/ consumer or per kW) of consumers on that
distribution transformer. However, care should be taken to select the
transformers for metering in such a way that it capture and address the
consumer metering deficiencies.
Study by ERDA on review of DPR of KESCO DATED 23rd FEB 2005
47
Installation of meters on DTC centers will help in
(a) Identifying high energy loss pockets in the feeder
(b) Accounting energy in the feeder
(c) In the estimation of the energy catered among agriculture consumers.
The practice presently followed is to compile the energy sent out and
energy-billed figures based on the feeder panel installed meters. However, it
is suggested to follow this practice to downstream also to have the proper
energy accounting, location wise.
Study by ERDA on review of DPR of KESCO DATED 23rd FEB 2005
48
2.6 Consumer Indexing
It is necessary for the utility to know about the consumers who were located
in the field in relation to distribution feeders and sub-stations emanating
from the divisions: with reference to existing consumers in computer
database.
This is done by consumer indexing. By this utility can know about
1) Consumers who are existing but not present in the ledgers of the utility
2) Duplicate consumers where book number, service connection number
and division codes are the same.
3) The illegal connections are always a matter of concern to electric utilities.
Certain observations on the same can be recorded. Abundance of illegal
connections brings direct revenue loss to utility.
4) By actual site survey (i.e. consumer indexing) the utility can find the
following types of consumers. 1) Metered consumer, 2) Unmetered
consumption of rural domestic consumers and 3) Unmetered
consumption of agriculture consumers. By site survey the connected load
of unmetered consumers can be found for each and every consumer.
Hence norms of consumption per kW connected load can be found out
and hence assessment of unmetered consumers can be done more
accurately.
Study by ERDA on review of DPR of KESCO DATED 23rd FEB 2005
49
2.7 Distribution Transformer
2.7.1 Overloaded/ Under loaded distribution transformer:
One of the main objectives under APDRP scheme is to ensure quality power
to the consumers by targeting reduction in outages and losses in distribution
system. A review on distribution transformers is found essential because
loading on transformer is to be studied against growing demand of
connected consumers. In the case of overloading of DTC, it is necessary to
propose new distribution transformers or the same may be shifted near to the
load center, so that quality of power supply can be improved.
The distribution transformers to be installed in the circle should preferably
have standard rating of 25,50,63,100,250,315,400,500 and 630kVA. The
higher capacity (i.e. larger than 250 kVA) shall be used for concentrated
loads or areas with high load density and lower (less than 100 kVA) may be
used for rural areas. In high-rise buildings having concentrated loads, higher
capacity distribution transformers such as 1000 kVA may be used. 33/0.415
kV distribution transformers of appropriate rating-630 kVA, 1000 kVA,
1600 kVA, 2000 kVA, may also be used based on techno-economic
considerations. Lower ratings could be used for rural areas/far flung urban
areas. Standardization of ratings would help in achieving reduction in
inventory for purpose of procurement and maintenance and reduction in
price on account of bulk purchase.
The distribution transformers in urban areas should operate at an initial
capacity factor of about 65%-75% of their rated capacity and would have to
be augmented when the maximum demand on the transformer is near its
Study by ERDA on review of DPR of KESCO DATED 23rd FEB 2005
50
rating. In case of rural areas, a higher loading based on the assessment of
load growth could be considered for adoption.
In addition some new transformers would be required and some would have
to be augmented. Attempts should be made to locate the distribution
transformer as near to the load center as possible. It may not be possible to
determine the actual location where these are to be installed. However, for
the purpose of the scheme, expected load growth indications would have to
be considered for determining number and location of the distribution
transformers.
2.7.2 Providing distribution boxes on distribution transformers:
It is proposed to provide distribution boxes on transformers from the point of
view of protection to distribution transformers and also reduction in losses
because in absence of distribution box, the cables are directly connected to
the transformer and this sometimes leads to loose connections. These loose
connections add to additional losses in the system.
Study by ERDA on review of DPR of KESCO DATED 23rd FEB 2005
51
2.8 Power Transformer
2.8.1 Overloading / New Power transformer:
In case the load on a sub station is found to exceed the rated capacity of the
transformer, it becomes necessary to upgrade the power transformer or add a
new transformer. In many cases, it is not technically possible to bifurcate the
feeder from the same sub station. It becomes necessary to install new power
transformers at the existing substation. The projected load growth of a
substation should be available for future planning.
Study by ERDA on review of DPR of KESCO DATED 23rd FEB 2005
52
2.9 Capacitors 2.9.1 Requirement of capacitors
In ideal system the power factor is maintained at 0.9 to 0.95 by providing
required compensation, which will improve the quality of power, will reduce
losses and improve the voltage regulation.
It is seen that the power factor or the MVA readings are not the meter
readings but assessed readings by assuming one of the factor i.e. MVA or pf.
2.9.2 Installation of capacitors
The capacitor bank shall be complete with neutral CT/ RVT and series
reactor as required. Circuit breaker, offload isolators, instrument
transformer, control and relay panels, connecting material and any other
material required for capacitor bank may be included in the scope of supply
of capacitor bank supplier or procured separately by the purchaser.
2.9.3 LT capacitor
Shunt capacitor are the simplest and cheapest way of managing the reactive
power. Agricultural pump sets and LT motor loads operate at very low
power factors (0.6 to 0.7) causing reactive power mis-management and
voltage profile problems in the system and thereby increasing system losses.
It has been realized that the installation of LT capacitors close to the
consumer load would (1) reduce load current in the LT feeders. (2) reduce
the overloading of distribution transformers, 11kV lines and back up system.
However, LT consumers do not ensure the working of capacitors even if
these are provided at the time of release of connections, as they are not
benefited due to flat rate tariff. In addition, the consumers do not have
Study by ERDA on review of DPR of KESCO DATED 23rd FEB 2005
53
requisite knowledge and skill to decide the level of compensation and check
the healthiness of the capacitors. This problem can be taken care of by
providing LT capacitors on distribution transformers. However, the
changing load demand characteristic poses problems in deciding on the level
of compensation. The experience of the power utilities with switched
capacitors has been satisfactory. To overcome this problem, it would be
worthwhile to provide minimum level of fixed compensation at the LT level
to meet the average demand conditions and prescribing for higher nominal
voltage (+10%) to ensure safe operation under possible adverse conditions.
The balance requirement could be met by placing capacitors on 11kV
feeders wherever the site conditions permit. It is, therefore, recommended to
have 440V, 3 phase delta connected 50 cycles, outdoor type LT fixed
capacitor unit intended for power factor improvement to be installed on the
LT side of distribution transformers
LT fixed capacitor
Capacitor units shall comply with ISS: 2834/1986 (with latest version/
amendments) and ISS 13340/1993. The material shall be ISI marked.
Reference for recommended arrangement for connections/ protection for
fixed type capacitors to be installed on the LT side of distribution
transformers can be taken from CEA guidelines
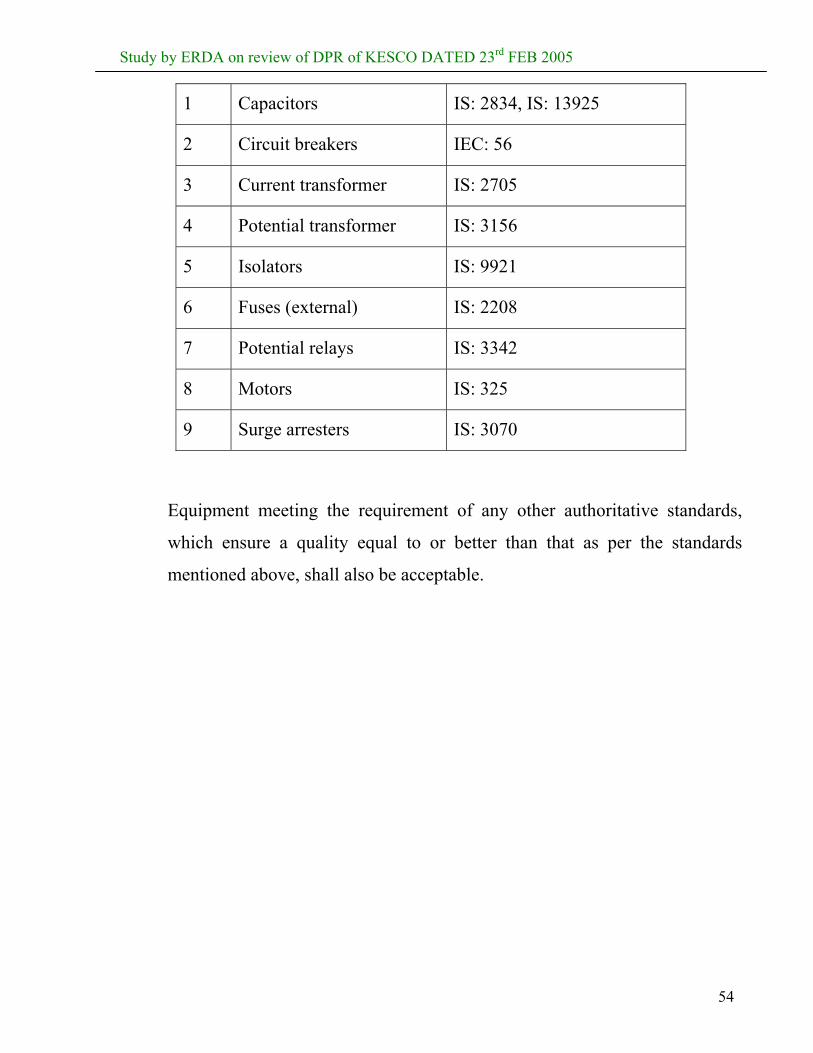
2.9.4 Pedestal mounted HT capacitor
Standards
The shunt capacitor banks and associated equipments shall conform to the
latest edition of the following standards (as amended up to date).
Study by ERDA on review of DPR of KESCO DATED 23rd FEB 2005
54
1 Capacitors IS: 2834, IS: 13925
2 Circuit breakers IEC: 56
3 Current transformer IS: 2705
4 Potential transformer IS: 3156
5 Isolators IS: 9921
6 Fuses (external) IS: 2208
7 Potential relays IS: 3342
8 Motors IS: 325
9 Surge arresters IS: 3070
Equipment meeting the requirement of any other authoritative standards,
which ensure a quality equal to or better than that as per the standards
mentioned above, shall also be acceptable.
Study by ERDA on review of DPR of KESCO DATED 23rd FEB 2005
55
2.10 Renovation, Strengthening and New Substation (Feeder Upgradation)
With the substantial increase in load demand expected in the plan period, the
system would need strengthening and augmentation to ensure delivery of
power to the consumers at proper voltage and for reduction of losses to a
reasonable level. For the development of the system, the future load
demands are worked out and imposed on the existing system to assess the
inadequacy of the system for meeting the demand in the horizon year. This
system augmentation/ strengthening is then worked out to cover the
inadequacy of the existing system to meet the proposed demand.
Sub – Transmission
The sub – transmission and distribution system would have to be expanded
to meet the growth in demand. The following options for the expansion of
sub – transmission system would have to be considered.
Augmentation of the transformation capacity at the existing 33/11kV
substation, rearranging/ reconfiguring the 33kV feeders by using higher size
conductors and or increasing the number of feeders.
Establishing new 33/11kV Substation nearer to the load centers and
redistributing the loads between existing and new Substations and feeder
strengthening.
Study by ERDA on review of DPR of KESCO DATED 23rd FEB 2005
56
Augmenting the transformer capacitors at some of the existing substations
and establishing new substations so as to have an even distribution of load
on the substations and corresponding strengthening and addition of feeders.
The locations for augmentation/ new substations have to be worked out on
the basis of assessment of the area wise power demand potential. In theory
the area supplied by each individual power Substation varies as a function of
distribution system voltage and load density. Once the radius of operation of
the Substation has been determined from these two factors, new Substation
have to be planned to cater to the loads not covered by the existing
Substations. The proposed locations of the new primary Substation have to
be chosen considering the proximity to the load center and availability of
suitable and adequate site. In the case of augmentation of existing
Substations, the availability of land and feasibility of adding new
transformer/ additional lines have to be kept in view.
Planning for site of substation and feeders in rural area should be based on
the load survey, and load centers in the village. The geographical maps of
village/ taluka showing the location of well, village streets, clusters, existing
diesel based industry/ cold storage etc. would have to be plotted ultimately
for use in optimal planning of network for the rural area.
The various options for the sub – transmission system are evaluated on
techno-economic considerations to decide on the final alternative. The load
flow studies would give the losses for the various alternatives and total cost
of each alternative would then be worked out based on capital cost of each
alternative and the cost of losses.
Evaluation of various alternatives
Study by ERDA on review of DPR of KESCO DATED 23rd FEB 2005
57
The study of each alternative should be analyzed under normal condition as
well as outage condition. It should be ensured that the network does not
experience overloading and the voltage variation in all the alternatives is
within the permissible limits.
To evolve the least cost alternative, subject to their meeting the technical
requirements, the total owning cost of various alternatives should be
estimated.
After identifying the scope of work and estimation of losses under various
alternatives for sub-transmission system, the least cost optimal solution may
be worked out considering the capital cost of proposed works and net
present worth of peak and energy losses over the expected life of the
equipment. The cost benefit ratio can then be worked out for each of the
proposed work.
Distribution system
Once the sub-transmission system has been finalized, the up gradation
requirements of distribution system have to be identified. The peak demand
at the 66 or 33/11 kV sub-station would have to be desegregated to work out
the peak demand in each feeder and the allocation of demand on the
distribution transformers would be made on the basis of actual load
connected to the distribution transformer.
The voltage regulation and the power losses along each feeder section upto
distribution transformer would have to be worked out. Based on the results
of studies (using the software), the feeder section requiring reconductoring/
addition of new feeder and its conductor size may be decided. It may be
ensured that the voltage is within the limit at the each node/ distribution
transformer.
Study by ERDA on review of DPR of KESCO DATED 23rd FEB 2005
58
In addition, some new transformer would be required and some would have
to be augmented. Attempts should be made to locate the distribution
transformer as near to the load center as possible. It may not be possible to
determine the actual location where these are to be installed. However, for
the purpose of the scheme expected load growth indications would have to
be considered for determining number and location of the distribution
transformers.
The requirement of LT line may be worked out based on detailed study of
LT network emanating from various distribution transformers. However, in
the beginning the requirement of LT lines may be worked out on the basis of
extrapolation of results from studies of typical distribution transformer.
2.10.1 Creation of new substation
Planning criteria for new sub-station should be on the basis of: -
a) Loading of existing substation
b) Accessibility to take feeder outlets
c) Load growth expected in the area
d) Availability of load
Following important points are to be considered for creation of new sub-
station
a) Existing system status of the HV substation
b) Single line diagram of the proposed sub-station
c) HV system power loss, voltage regulation
d) Existing and modified status of the 11/6.6kV feeders
e) Calculation of DF, LF and LLF
f) Loss status
g) Benefit due to the scheme
Study by ERDA on review of DPR of KESCO DATED 23rd FEB 2005
59
h) Estimates
i) 11/6.6kV feeder map with existing position
j) 11/6.6kV feeder map with proposed diagram
Sub-station layout
Before deciding the ratings of the equipment in a sub-station, it is necessary
to prepare a schematic/ lay out of the sub-station. There are a number of
arrangements dependent upon the system voltage, position of the sub-station
in the system, flexibility, reliability of supply and cost. The factors to be
considered while deciding the layout are:-
a) It should be possible to carry out equipment maintenance without
interrupting the entire supply
b) As far as possible there should be alternate arrangements in the
event of outage of any one important item of the equipment
c) The layout should be economical and should not hinder future
expansion
Single bus bar, single bus bar with bus sectionalizer, double bus bar
arrangement are being adopted depending upon the situations. A layout,
which is most economical and satisfies technical requirements as per actual
site conditions may be adopted. Generally, 33/11kV sub-station with single
bus bar and a sectionalizer in between on the 33kV as well as 11kV sides is
being adopted.
To improve the operational flexibility, minimize restoration time of power
supply and to prevent overloading of lines and transformers in real time
mode, modern features such as distribution automation may be incorporated.
The overall planned system subject to meeting the technical requirement for
supplying quality and reliable power supply to the consumers should be of
Study by ERDA on review of DPR of KESCO DATED 23rd FEB 2005
60
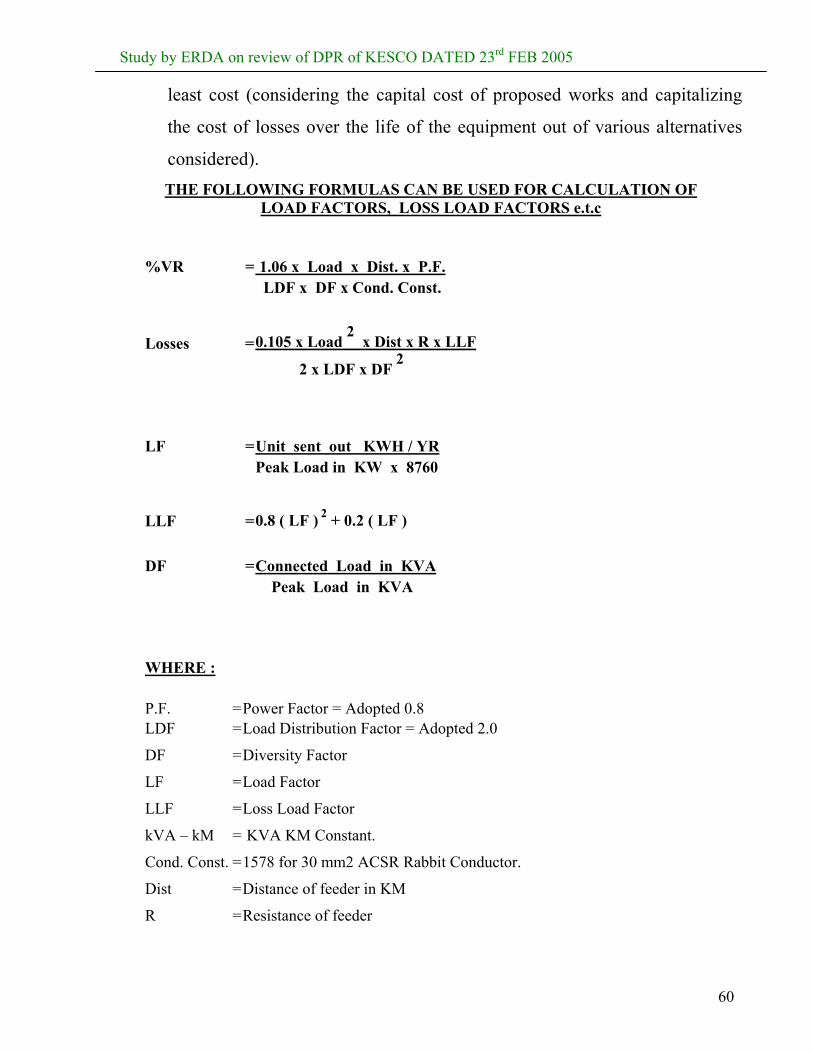
least cost (considering the capital cost of proposed works and capitalizing
the cost of losses over the life of the equipment out of various alternatives
considered). THE FOLLOWING FORMULAS CAN BE USED FOR CALCULATION OF
LOAD FACTORS, LOSS LOAD FACTORS e.t.c
%VR = 1.06 x Load x Dist. x P.F. LDF x DF x Cond. Const.
Losses = 0.105 x Load 2 x Dist x R x LLF
2 x LDF x DF
2
LF = Unit sent out KWH / YR Peak Load in KW x 8760
LLF = 0.8 ( LF ) 2 + 0.2 ( LF ) DF = Connected Load in KVA Peak Load in KVA WHERE : P.F. = Power Factor = Adopted 0.8 LDF = Load Distribution Factor = Adopted 2.0
DF = Diversity Factor
LF = Load Factor
LLF = Loss Load Factor
kVA – kM = KVA KM Constant.
Cond. Const. = 1578 for 30 mm2 ACSR Rabbit Conductor.
Dist = Distance of feeder in KM
R = Resistance of feeder
Study by ERDA on review of DPR of KESCO DATED 23rd FEB 2005
61
2.11 Guidelines for System Development
A massive programme of upgradation of Sub-Transmission and Distribution
(ST&D) System and reduction of Transmission and Distribution (T&D)
losses has been launched by the Govt. of India under the Accelerated Power
Development & Reforms Programme (APDRP). For achieving the
improvements systematically, a Committee of Experts under the
Chairmanship of Member (PS/ G&O) was constituted by the Govt. to
prepare guidelines covering various aspects of ST&D system development.
The guideline cover the following:
• Project Management
• Performance Evaluation
• Operation & Maintenance of sub-transmission and distribution
equipment
• Residual life assessment and R&M of the sub-transmission and
distribution equipment
• An overview of present situation
• Energy accounting-need and objective
• Organization structure of profit and energy accounting center
• Metering system
• Energy accounting Procedures
• Energy Audit
Study by ERDA on review of DPR of KESCO DATED 23rd FEB 2005
62
• Energy Billing and Revenue collection
• Reporting and Reviewing System
• Benefits and Outcomes
• Task for formulation of short and long term plan
• Planning Criteria
Previous sections outline the methodologies to be adopted in the
implementations of these guidelines. However, reference can be made to the
report made by CEA on this subject (Ref. “Formulation of Project Reports,
CEA, Volume 1, Nov. 2001).
Study by ERDA on review of DPR of KESCO DATED 23rd FEB 2005
63
2.12 System Studies The objective of transmission planing shall be to install sufficient capacity to
evacuate power from generating stations to Grid substations (having regard
to load forecast) while maintaining voltage within the required limits,
containing transmission losses at levels consistent with its Load Forecast and
providing for the economic exchange of power with contiguous states. For
this purpose, utility has to carry out power system studies covering load
flow, short circuit and transient stability studies.
Successful operation of a power system depends largely on the engineer’s
ability to provide reliable and uninterrupted service to load. The reliability of
the power supply implies much more than merely being available. In
practical terms, this means that both voltage and frequency must be held
within close tolerance so that the consumer equipment may operate
satisfactorily. For example, a drop in voltage of 10-15% or a reduction of the
system frequency of only a few hertz may lead to stalling of the motor loads
on the system.
As electric utilities grow in size, and the number of interconnections
increase, planning for future expansion has become increasingly complex.
The increasing cost of additions and modifications has made it imperative
that utilities consider a range of design options, and perform detailed studies
of the effect on the system of each option, based on a number of assumption:
like, normal and abnormal operating conditions, peak and off-peak loadings,
and present and future years of operation. A large volume of network data
must also be collected and accurately handled. To assist the engineer in this
power-system planning, digital computers and highly sophisticated computer
Study by ERDA on review of DPR of KESCO DATED 23rd FEB 2005
64
programs are used. Future transmission system will be far more complex
than those of today. This means that the power system planner’s task will be
more complex. If the systems being planned are to be optimal with respect to
construction cost, performance, and operating efficiency, better planning
tools are required. In general, the major power system planning tools are:
Load Flow analysis, short circuit analysis, Stability analysis and system
protection and relay co-ordination.
(1) Load Flow Studies:
The main objective of load flow analysis is to identify the potential
problems, in terms of unacceptable voltage conditions, overloading of
facilities, decreasing reliability, or any failure of the transmission system to
meet performance criteria. After this analysis stage, the planner develops the
alternative plans or scenarios that not only will prevent the unforeseen
problems but also will meet the long term objectives of system reliability.
This is done by detailed load flow studies.
(2) Short circuit Study:
After determining the best configuration from load flow study, the power
system can be tested for system behavior under fault conditions. The main
objective of short circuit study can be expressed as to determine the current
interrupting capacity of the circuit breaker so that the faulted equipment can
be disconnected successfully. To establish the relay requirement and settings
to detect the fault and cause the circuit breaker to operate when the current
flowing through it exceeds the maximum allowable current, to calculate
voltage during faulted conditions that affect insulation co-ordination and
lighting arrester applications, and to design the grounding systems.
Study by ERDA on review of DPR of KESCO DATED 23rd FEB 2005
65
(3) Stability Study:
Stability studies are performed in order to be sure that the system will
remain stable following the clearance of a severe fault or disturbance on
transmission line. Stability analysis is defined as the transient behavior of
the power system following a disturbance. The transient stability is defined
as the ability of the system to maintain synchronous operation following a
disturbance, usually a fault condition. These studies are necessary in order to
ensure that the wide variety of protective relays function correctly with
proper discrimination to provide required reliable, sensitive isolation of
faulty power system equipment.
Study by ERDA on review of DPR of KESCO DATED 23rd FEB 2005
66
2.13 Optimum Utilization of Resources
The power from transmission network is delivered to sub-transmission
network after stepping down the voltage to 33kV through 220/33kV Grid
substations. The power is carried at 33 kV by overhead line or cable.
33/11kV transformers step down the power to 11 kV for distribution. The
power is delivered from primary sub station through primary feeders mainly
at 11 kV to various distribution transformers. Distribution transformers
further step down the power to utilization voltage of 400 V. It carries power
from distribution sub station at 400 V to various consumers through service
lines and cable.
Though in time delivery of equipment is important from technical &
commercial considerations the timely installation of the equipment to derive
benefits from it is equally important. Further more, decay / damage of the
equipment / system components can set in due to long storage of equipment
at site. Especially energy meters should be placed in their normal packing
and transported over a distance of at least 40 to 50 kM, in any transport
vehicle.
Thus, the augmentation of power transformer / sub station / feeder can take
place depending on the future load growth. By augmentation of power
transformer & new power transformers possibility of overloading can be
reduced.
In power system network (distribution), at some place distribution
transformers are overloaded and at some place it is under loaded. In this

Study by ERDA on review of DPR of KESCO DATED 23rd FEB 2005
67
situation by changing the location of transformers can reduce this under
loading and overloading conditions.
Study by ERDA on review of DPR of KESCO DATED 23rd FEB 2005
68
2.14 Procedural Clearance The strategy for improvement of the system in each circle should be based
upon a detailed study to identify the factors causing high-energy losses. For
this, the utility should conduct the Energy Accounting / Energy Audit
studies so as to
• Assess the overall energy loss
• Identify system elements causing excessive losses
• Establish cause of losses due to technical or non technical factors
The scheme should cover:
• The analysis of existing system
• Measure for reduction of T & D losses
• Study of possible alternative schemes for strengthening and
improvement of the scheme to meet growing demands and evolving
optimum system for meeting the requirement in a cost effective
manner.
The power utility shall formulate the scheme for each circles either
utilizing in house expertise or through consultant.
The formulation of a project report for up gradation of system for the
identified circle should be taken up in two phases.
• Short Term Plan
• Long Term Plan
Study by ERDA on review of DPR of KESCO DATED 23rd FEB 2005
69
Short Term Plan
In the prevailing situation of mounting energy losses, priority attention needs
to be given to achieve the objective of loss reduction especially for reduction
of commercial loss as well as technical loss in the short-term plan.
The short-term plan shall cover the measures required for immediate
improvement and reduction of losses and shall be placed upon the
information / data readily available with the utilities. The work identified as
short term should be completed within 1 to 2 years.
Long Term Plan:
The long term plan will cover all the measures for improvement of quality
and reliability of power supply and reduction of T & D losses in the circle by
upgradation, strengthening and improvement of the sub transmission &
distribution system in a circle to meet the load demand for next 5 years. The
plan will be prepared by scientific planning of the system on the basis of
detailed system studies.
Study by ERDA on review of DPR of KESCO DATED 23rd FEB 2005
70
2.15 Cost Benefits When one speaks of network optimization, it refers to the minimization of
overall network cost. Therefore, the method of costing, alternative network
scheme is of great importance in optimization. The costing of network
scheme is a complex subject and a number of recognized methods are
available for this purpose. The method adopted should incorporate
recognized financial procedures. Usually the cost of establishing various
items, which make up an electric distribution system, can be broken into two
parts: capital cost and annual cost. The annual cost will cover such charges
as interest, maintenance cost and cost of losses.
Study by ERDA on review of DPR of KESCO DATED 23rd FEB 2005
71
2.16 Documents to be Provided with DPR
To enable The Commission to examine the plans/ proposals, the following
supporting documents should be submitted along with the DPR.
a) Clearances and approval (if required)
b) Acquisition of Land
c) Approval of financing
d) Date wise list of schemes, which were approved by planning
commission in previous plans but could not be taken up so far.
Fresh endorsement with justification is required is to be submitted
to the commission on any of the schemes proposed to be taken up
now.
e) Physical progress in substation, distribution line, others if any.
f) Target date of completion.
g) Original cost with date and revised cost with date
Year wise expenses schedules
Fund requirements in two years (current & next)
Annual plan provision
h) Means of finance including loan sanctioned and equity.
i) Source of own/ balance funds.
j) Govt. guarantee for the loan.
Study by ERDA on review of DPR of KESCO DATED 23rd FEB 2005
72
k) Financial progress (%) in substation, distribution line, and
expenditure proposed.
l) Cost benefits analysis carried out in the schemes.
m) Reports of system planning studies, load flow analysis if required
in accordance to commissions guideline for capital expenditure and
Load Forecast And Resources Plan Under Transmission And
Distribution Planning.
n) Licensee to identify the works and submit proposals by November
of preceding year.
o) Licensee must standardize the formats and have the budgetary cost
data bank, update periodically.
p) The expected loss reduction and improvement in voltage condition
should be worked out. The study should highlight following :
a. Justification for taking up new works.
b. Area of poor voltage/ system reliability where immediate
action for strengthening the system is required.
c. Proposals to mitigate the condition in item (ii)
d. Any other remarks on the system inadequacy and proposals
for strengthening the same.
e. The single line diagrams, bar chart for construction for 2
years duration.
f. Lay out plan, modified plans, existing plans, map of areas
wherever required with the DPR.
Study by ERDA on review of DPR of KESCO DATED 23rd FEB 2005
73
2.17 Conclusion Methodology for over all assessment of the status of the ST&D is discussed.
Various components of the system that contribute to the losses are identified
and the need to augment/ change those equipment and the process of doing
those are explained. Short term and long term planning objectives are
outlined and the guide lines for making proposals for system improvement
are given. Importance of analyzing these schemes to achieve optimal
performance at least cost is stressed. It is expected that the Commission
would use the material presented here for evaluation of schemes submitted
under the APDRP for the improvement of distribution systems in UP.