Embed Size (px)
Citation preview
CHAPTERReview of Economic Developments08
The Economic Survey 2015-16 had predicted the Indian economy to register the GDP growth rate in the range of 7 to 7.75 per cent in the year 2016-17. The economy was indeed treading along that path and clocked 7.2 per cent in the first half of the current financial year, as per the estimates released by the Central Statistics Office (CSO). However, consequent upon the radical measures initiated in November 2016 in the form of demonetisation of Rs. 1000 and Rs. 500 currency notes, the Indian economy is likely to experience a slowdown in the growth rate that could be lower than the first advance estimates of CSO. The first advance estimates released in early January 2017 were arrived at mainly based on data prior to demonetisation and largely reflect the economic situation prevailing in the first seven to eight months of the financial year. Even the likely reduction in the rate of real GDP growth of 1/4 percentage points to 1/2 percentage points relative to the baseline of about 7 per cent still makes India's growth noteworthy given the weak and unsettled global economy which posted a growth rate of a little over 3 per cent in 2016. That India managed to achieve this high growth in the aftermath of demonetisation and amidst the global slowdown, along with a macro-economic environment of relatively lower inflation (unlike a generally higher inflation in the previous episodes of high growth), moderate current account deficit coupled with broadly stable rupee-dollar exchange rate and the economy treading decisively on the fiscal consolidation path, makes it quite creditable. Most external debt indicators also point towards an improvement as at end September 2016.
However, challenges abound. The investment to GDP ratio has not only been lower than the desirable levels but has been consistently declining over the last few years. This trend needs to be reversed at the earliest in order to realise higher and lasting economic growth. Similarly, the savings rate will have to be raised, so that investment can be financed without resorting to high dose of external financing. After remaining fairly stable for much of the last two years, international prices of crude oil have started to trend up. This along with rise in the prices of other commodities like coal, etc. could exert inflationary pressure and have the potential to adversely impact the trade and fiscal balances. The outlook for the next financial year suggests that growth is set to recover, as the currency in circulation returns to normal levels and taking into account the significant reform measures initiated by the government.

140 Economic Survey 2016-17
I. IntroductIon
8.1 AsperthefirstAdvanceEstimates(AE)releasedbytheCSO,theIndianeconomyisestimatedtoregisteraGDPgrowthrateof7.1percentin2016-17.(Thereisalikelihoodof thisgrowthbeingreviseddownwards inthesubsequent revisionscarriedoutby theCSO). The growth in the second half of2016-17worksoutto7.0percentasagainst7.2percentinthefirsthalf (Figure1).Thefirst AE released by CSO in early January2017were arrived at based on datamainlyup to October and in some cases up toNovember2016andhencelargelymirrortheeconomicsituationduringthefirstseventoeightmonthsof thefinancialyear.
8.2 AsperthefirstAE,thegrowthrateofgross value added (GVA) at constant basicpricesfor2016-17isplacedat7.0percent,asagainst7.2percentin2015-16.Thegrowthinthesecondhalf of 2016-17isestimatedat6.7percentasagainst7.2percentinthefirsthalf (Figure 1). The sector-wise details arepresentedintheTable1.
8.3 At the sectoral level, growth ofagriculture & allied sectors improvedsignificantly in 2016-17, following thenormal monsoon in the current yearwhich was preceded by sub-par monsoonrainfall in 2014-15 and 2015-16. Highergrowth in agriculture sector in 2016-17 isnot surprising; rabi sowing so far and thefirst advance estimates of the kharif cropproductionfor theyearattest to this.Afterachieving a real growth of 7.4 per cent intermsof valueaddedin2015-16,thegrowthin industrial sector, comprising mining &quarrying, manufacturing, electricity, gas& water supply, and construction sectorsmoderatedin2016-17.Thisisintandemwiththe moderation in manufacturing, mostlyonaccountof asteepcontractionincapitalgoods,andconsumernon-durablesegments
Figure 1. Growth in GDP and GVA at constant prices (per cent)
Source: CSO
Table 1. Growth Rate of GVA at Basic Prices for Different Sectors (per cent)
Sector 2012-13a 2013-14a 2014-15b 2015-16c 2016-17d 2016-17H1 H2
Agriculture, forestry & fishing 1.5 4.2 -0.2 1.2 4.1 2.5 5.2Industry 3.6 5.0 5.9 7.4 5.2 5.6 4.9Mining&quarrying -0.5 3.0 10.8 7.4 -1.8 -0.9 -2.6Manufacturing 6.0 5.6 5.5 9.3 7.4 8.1 6.7Electricity,gas,watersupply,etc 2.8 4.7 8.0 6.6 6.5 6.4 6.6Construction 0.6 4.6 4.4 3.9 2.9 2.5 3.4Services 8.1 7.8 10.3 8.9 8.8 9.2 8.4Trade,hotel,transport,storage 9.7 7.8 9.8 9.0 6.0 7.6 4.5Financial,realestate&professionalservices
9.5 10.1 10.6 10.3 9.0 8.8 9.2
Publicadministration,defence,etc. 4.1 4.5 10.7 6.6 12.8 12.4 13.2GVA at basic prices 5.4 6.3 7.1 7.2 7.0 7.2 6.7Source: CSO Note: a=second revised estimate; b=first revised estimate c=provisional estimate; d= first advance estimate
4.5
5.0
5.5
6.0
6.5
7.0
7.5
8.0
8.5
H1 H2 H1 H2 H1 H2 H1 H2 H1 H2
2012-13 2013-14 2014-15 2015-16 2016-17
Growth in GVA Growth in GDP

141Review of Economic Developments
of Index of Industrial Production (IIP).The contraction in mining and quarryinglargely reflectsslowdown in theproductionof crudeoil andnatural gas.However, theperformance of industrial sector in termsof valueaddedcontinued tobeatvariancewithitsachievementsbasedonIIP.Asinthepreviousyears,theservicesectorcontinuedtobethedominantcontributortotheoverallgrowthof theeconomy,ledbyasignificantpick-up in public administration, defence&other services, thatwereboostedby thepayouts of the Seventh Pay Commission.Consequently, the growth in services in2016-17 is estimated to be close towhat itwasin2015-16(Table1).
8.4 Fixed investment (gross fixed capitalformation(GFCF))toGDPratio(atcurrentprices) is estimated to be 26.6 per cent in2016-17,vis-à-vis29.3percent in2015-16.Thegrowthinfixedinvestmentatconstantprices declined from 3.9 per cent in 2015-16 to (-) 0.2 per cent in 2016-17. Fixedinvestment rate has been declining since2011-12(Figure2)andthistrendhastobereversed for medium to long term growthprospects.Beingawareof theneedtoboostinvestmentandgrowth,Government,inco-ordinationwith theReserveBankof Indiaandotherstakeholders,hastakenanumberof steps to improve the ease of doing
business and to improve the balance sheetpositionsof banksandfirms.
8.5 It is the 23.8 per cent growth ingovernmentfinal consumption expenditurethat is themajordriverof GDPgrowth inthecurrentyearfromthedemandside(Table2).Privateconsumptionisalsoprojectedtogrow at a reasonable pace during the year.With plummeting imports of gold, silverand other bullion, acquisition of valuablesbyhouseholdsisexpectedtocontractinthecurrentyear.Steepercontractioninimports,comparedtoexports,duringthefirsthalf of2016-17ledtoasharpdeclineintradedeficit.Despiteslowingservicesexports,thedeclineinmerchandisetradedeficithelpedimprovethe position of net exports of goods andnon-factorservicesinthenationalaccounts.
Source: CSO
Figure 2. GFCF as percentage of GDP
Table 2. Growth Rate of GDP at constant Prices and its components (per cent)
Component 2012-13a 2013-14a 2014-15b 2015-16c 2016-17d 2016-17H1 H2
Governmentfinalconsumption 0.5 0.4 12.8 2.2 23.8 16.9 32.4Privatefinalconsumption 5.3 6.8 6.2 7.4 6.5 7.1 6.0Grossfixedcapitalformation 4.9 3.4 4.9 3.9 -0.2 -4.4 4.2Changeinstocks -3.8 -18.6 20.3 5.5 5.2 5.9 4.6Valuables 2.6 -42.2 15.4 0.3 -33.5 -47.9 -19.3Exportsof goodsandservices 6.7 7.8 1.7 -5.2 2.2 1.7 2.6Importsof goodsandservices 6.0 -8.2 0.8 -2.8 -3.8 -7.5 -0.1GDP 5.6 6.6 7.2 7.6 7.1 7.2 7.0Source: CSONote: a=second revised estimate; b=first revised estimate c=provisional estimate; d= first advance estimate
25.0
27.0
29.0
31.0
33.0
35.0
37.0
H1 H2 H1 H2 H1 H2 H1 H2 H1 H2 H1 H2
2011-12 2012-13 2013-14 2014-15 2015-16 2016-17

142 Economic Survey 2016-17
II. FIscal developments
8.6Budget2016-17reaffirmedGovernment’scommitment to continue with fiscalconsolidation and projected fiscal deficitat3.5percentof GDPfortheyear,downfrom3.9percentin2015-16.Consolidationwas sought to be achieved through a 11.9per cent increase in the gross tax revenue(over 2015-16 PA) and significant stridesin non-tax revenue and non-debt capitalreceipts, despite upside compulsions onthe expenditure side necessitated primarilyby higher pay-outs on account of theimplementationof therecommendationsoftheSeventhPayCommission.
8.7 Thebuoyancyof non-debtreceiptsofthe Union Government, consisting of nettax revenue,non-tax revenueandnon-debtcapitalreceiptsduringApril-November2016supported fiscal rectitude (Table 3). Thegrowthinnon-debtreceiptsat25.8percentduringApril-November2016surpassedthebudgeted growth rate of 16.4 per cent forthefullyear(over2015-16PA).
8.8 On the whole, tax collections,especially union excise duties and servicetax, have been buoyant in the current yeartillNovember2016 (Figure3).Despite thepossibleshort-termspill-overeffectsof thecancellationof thelegaltendercharacterof
Table 3. Non-debt receipts of the Union Government
April-November (as per cent of BE)
Growth in April-November (per cent)
2015-16 2016-17 2015-16 2016-17Grosstaxrevenue 53.0 57.2 20.8 21.5Tax(nettoCentre) 50.5 58.9 12.5 33.6Nontaxrevenue 78.1 54.2 34.9 1.0Non-debtcapitalreceipts 25.8 48.5 180.3 57.1Totalnon-debtreceipts 53.9 57.4 20.0 25.8
Source: CGA Note: BE-Budget Estimates
Figure 3. Growth in Central taxes (per cent)
Source: CGA Note: PA: Provisional Actuals
11.9 8.7
23.4
9.3 10.7 9.3
21.5
9.0
20.9
6.8
46.0
27.1
Gross TaxRevenue
CorporationTax
PersonalIncome Tax
Custom Excise Duty Service Tax
Growth in 2016-17 (BE) over 2015-16 (PA)
Growth in April-November 2016 (per cent)

143Review of Economic Developments
Figure 4. Transfer to States and Union territories during April-November
Source: CGA
highvaluenotes,indirecttaxesgrewby36.4per cent during the month of November2016. The tax measures on additionalresourcemobilizationhaveprimarilyhelpedthisbuoyancythusfar.
8.9 Anaverageof about34.5percentofthegrosstaxcollectionswasrealizedduringthefourthquarterduringthefive-yearperiod,2011-12 to2015-16.This indicates that theachievementof thebudgetestimatesof taxcollections in the current year will dependsignificantly on the dynamics of economicactivity and tax collections during the lastquarter. In the last quater of the currentyear, the pace of economic activity can beaffectedby thedemonetisationof thehighdominationcurrencyandtheresponsetothegradualre-monetization.
8.10 Therealizationof thegrosstaxrevenueduringApril-November2016asratioof thebudget estimates for 2016-17 was muchhigher than the corresponding figure inthe previous year (Table 3). Devolution toStates and Union Territories during April-November2016alsokeptpacewiththetax
collections (Figure 4). The net resourcestransferred, including tax devolution, non-plan grants and Central assistance duringApril-November2016was58percentof thebudgetestimatesforthefullyearandanotchbelow the corresponding accomplishmentsinthepreviousyear.
8.11 The growth in revenue expenditureduringApril-November 2016,which primafacie seems very high (Table 4), may beviewed against the background of a fewdevelopments.Firstly,thesalarycomponentof therevenueexpenditureincreasedby23.2per cent, close to the sameas itsbudgetedgrowth,owingtomeetingthecommitmentsunder the Seventh Pay Commission.Secondly,incontrastto5.9percentdeclineinmajorsubsidiesbudgetedforthecurrentyear, it increased by 5.0 per cent duringApril-November 2016, despite a decline infertilizer and petroleum subsidy bills. Thiswasbecauseof a21.6percentsurgeinfoodsubsidy,largelybecauseitisfront-loadedthisyearandislikelytotaperoff,toagreatextent,astheyearprogresses.Thethirdreasonfor
57 61
68 72
59 54 52
72 78
58
State's share of taxes& duties
Non plan grants &loans
Central Assistance Recovery of loans &advances
Net resourcestransferred
as % of BE 2015-16 as % of BE 2016-17

144 Economic Survey 2016-17
Table 4. Major expenditure categories of the Union Government
April-Nov as per cent of BE April-November Growth (per cent)
2015-16 2016-17 2015-16 2016-17TotalExpenditure 64.3 65.0 6.3 12.6Revenueexpenditure 64.0 66.1 3.2 16.4Interestpayments 55.4 54.1 8.6 5.6Majorsubsidies 82.9 85.3 -3.6 5.0Pensions 68.3 65.7 (-)1.4 34.1Salaries 43.6 42.4 NA 23.2Grantsforcreationof capitalassets 73.2 67.7 -0.8 39.5Capitalexpenditure 65.8 57.6 30.8 -10.4Adjustedrevenueexpenditure(*) 63.3 65.9 3.6 14.3Adjustedcapitalexpenditure(*) 68.1 61.7 18.1 6.4Source: CGANote: (*)=Adjusted revenue and capital expenditures are arrived at by deducting ‘grants for creation of capital assets’ from revenue expenditure and adding it to capital expenditure
the strong growth in revenue expenditureisanincreaseof 39.5percentinthegrantsforcreationof capitalassets(GCCA)duringApril-November2016.AllgrantsgiventotheStateGovernmentsandUnionTerritoriesaretreatedasrevenueexpenditure,butapartofthesegrantsareusedforcreationof capitalassets.TheinvestmentpushthattheCentralGovernment expenditure provides to theeconomycanbeapproximatedbysubtractingthese grants from revenue expenditure andadding it to the capital expenditure. Thisadjustment reduces the gap between thegrowth in capital and revenueexpenditures(Table4).
8.12 The total outstanding liabilities ofthe Central Government are composedof internal debt, other internal liabilitieslike provident funds, small savings, etc.and external debt. The growth in thetotal outstanding liabilities of the UnionGovernmentremainedcloselysimilarduring2014-15 and 2015-16, at 10.1 per cent and10.4percentrespectively.Yet,therewasanincreaseintheratioof internaldebtof theCentral Government to GDP in 2015-16(Figure5).Thiswasnotduetoanyadverse
change in the trajectory of debt addition,but to the nominalGDP growth decliningin the year—despite an accelerationof therealGDP growth—on account of a sharpdecline in inflation. The growth in totaloutstandingliabilitieswasbudgetedtocomedownsharplyto7.9percentin2016-17from10.4percentinthepreviousyear.
Figure 5. Outstanding liabilities of the Union Government as per cent of GDP (per cent)
Source: CGA Note: RE- Revised estimates
0
10
20
30
40
50
60
2012-13 2013-14 2014-15 2015-16 (RE) 2016-17 (BE)
37.8 37.6 37.9 39.2 38.5
11.3 11.0 10.5 10.1 9.4
1.8 1.6 1.6 1.5 1.5
Internal debt Other Internal liabilities External debt
III. prIces
8.13 Theheadlineinflationasmeasuredbythe Consumer Price Index (CPI) remainedundercontrolforthethirdsuccessivefinancial

145Review of Economic Developments
year.The averageCPI inflationdeclined to4.9percentin2015-16from5.9percentin2014-15. It was 4.8 per cent during April-December 2016. Inflation hardened duringthefirstfewmonthsof 2016-17,mainlyduetoupwardpressureonthepricesof pulsesandvegetables.Itdippedtotwo-yearlowof3.4 per cent inDecember 2016 as a resultof lowerprices(Figure6),especiallyof fooditems.
8.14 The average inflation based on thewholesalepriceindex(WPI)declinedto(-)2.5
percentin2015-16from2.0percentin2014-15.Thedownwardtrend,howeverreversedduring the currentfinancial yearpartlyduetoimpactof riseinglobalcommoditypricesand partly owing to adverse base effect.The global commodity and energy priceshave increased by 18 per cent and 23 percent respectively in thefirst elevenmonthsof 2016asperIMFpriceindices.TheWPIinflationstoodat3.4percentinDecember2016(Figure7)andtheaverageinflationwas2.9percentduringApril-December2016.
Figure 6. Base Effect and Price Effect in CPI (percentage points)
Source: Calculated using CPI data, CSO
-1.5
-1.0
-0.5
0.0
0.5
1.0
1.5
Dec
-15
Jan-
16
Feb-
16
Mar
-16
Apr-1
6
May
-16
Jun-
16
Jul-1
6
Aug-
16
Sep-
16
Oct
-16
Nov
-16
Dec
-16
Jan-
17
Feb-
17
Mar
-17
Apr-1
7
May
-17
Jun-
17
Jul-1
7
Aug-
17
Sep-
17
Oct
-17
Nov
-17
Dec
-17
Price effectBase effectMonthly change in inflation
Figure 7. Inflation based on WPI and CPI-Combined (per cent)
Source: CSO& DIPP
-6.0
-4.0
-2.0
0.0
2.0
4.0
6.0
8.0
10.0
Apr-1
4
Jun-
14
Aug-
14
Oct
-14
Dec
-14
Feb-
15
Apr-1
5
Jun-
15
Aug-
15
Oct
-15
Dec
-15
Feb-
16
Apr-1
6
Jun-
16
Aug-
16
Oct
-16
Dec
-16
WPI headline CPI headline CPI food (CFPI) CPI (excl. food & fuel group)
146 Economic Survey 2016-17
Food inflation
8.15 The inflation in India is repeatedlybeingdrivenbynarrowgroupof fooditems.Pulsescontinuedtobethemajorcontiributorof foodinflation(Figure8b).Thepricesofpulses, inparticular tur andurad, remainedpersistently high from mid 2015 to mid2016 due to shortfall in domestic andglobalsupply.SinceJuly2016,pulsespricesexceptgramdalpriceshavebeendecliningowing to near normal monsoon, increasein theRabipulses sowing andbufferbuildup by the Government. Sugar prices alsofirmeduponaccountof lowerproductionandhardeningof price in the internationalmarket.Vegetableprices,whichflaredduringtheleansummerseason,havealsodeclinedsharplyassupplypickedupduringthepostmonsoonandwinterseason.TheCPIfoodinflation(CFPI)has,asaresult,dippedtoatwo-year lowof 1.4 per cent inDecember2016. The inflation for pulses & productsdippedtonegative1.6percentinDecember2016,andthevegetables inflationremainednegativesinceSeptember2016.
Core inflation remains sticky
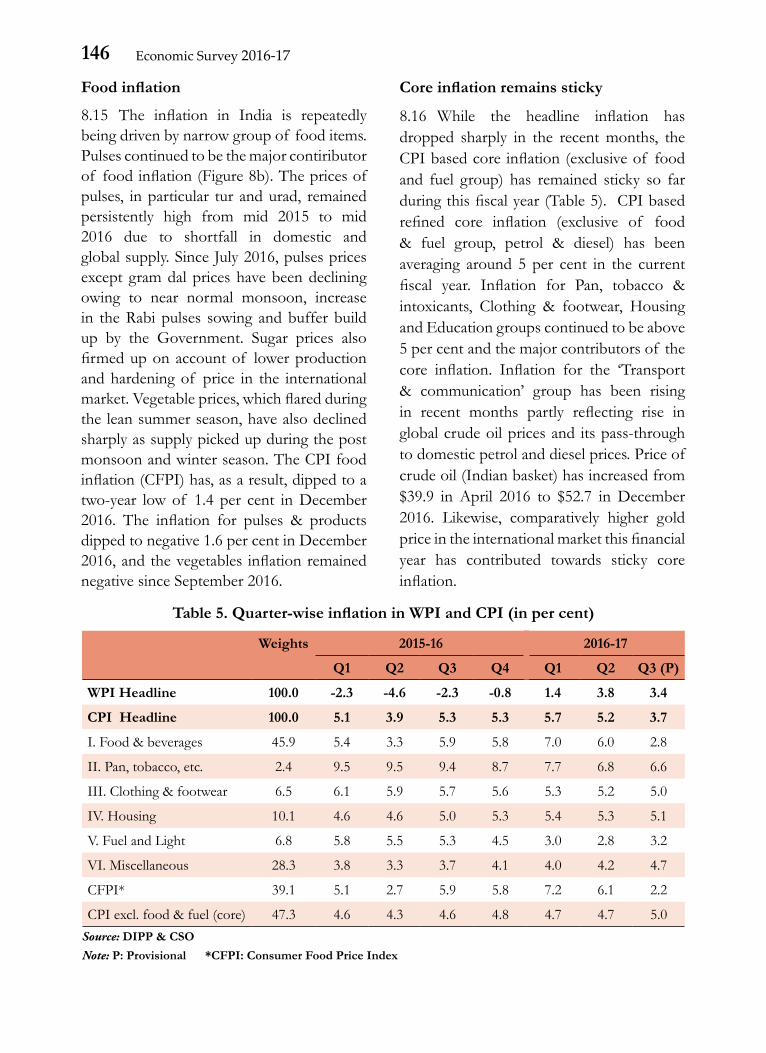
8.16 While the headline inflation hasdropped sharply in the recentmonths, theCPIbasedcoreinflation(exclusiveof foodand fuel group) has remained sticky so farduringthisfiscalyear(Table5).CPIbasedrefined core inflation (exclusive of food& fuel group, petrol & diesel) has beenaveraging around 5 per cent in the currentfiscal year. Inflation for Pan, tobacco &intoxicants, Clothing & footwear, HousingandEducationgroupscontinuedtobeabove5percentandthemajorcontributorsof thecore inflation. Inflation for the ‘Transport& communication’ group has been risingin recent months partly reflecting rise inglobalcrudeoilpricesand itspass-throughtodomesticpetrolanddieselprices.Priceofcrudeoil(Indianbasket)hasincreasedfrom$39.9 in April 2016 to $52.7 inDecember2016. Likewise, comparatively higher goldpriceintheinternationalmarketthisfinancialyear has contributed towards sticky coreinflation.
Table 5. Quarter-wise inflation in WPI and CPI (in per cent)
Weights 2015-16 2016-17
Q1 Q2 Q3 Q4 Q1 Q2 Q3 (P)
WPI Headline 100.0 -2.3 -4.6 -2.3 -0.8 1.4 3.8 3.4
CPI Headline 100.0 5.1 3.9 5.3 5.3 5.7 5.2 3.7
I.Food&beverages 45.9 5.4 3.3 5.9 5.8 7.0 6.0 2.8
II.Pan,tobacco,etc. 2.4 9.5 9.5 9.4 8.7 7.7 6.8 6.6
III.Clothing&footwear 6.5 6.1 5.9 5.7 5.6 5.3 5.2 5.0
IV.Housing 10.1 4.6 4.6 5.0 5.3 5.4 5.3 5.1
V.FuelandLight 6.8 5.8 5.5 5.3 4.5 3.0 2.8 3.2
VI.Miscellaneous 28.3 3.8 3.3 3.7 4.1 4.0 4.2 4.7
CFPI* 39.1 5.1 2.7 5.9 5.8 7.2 6.1 2.2
CPIexcl.food&fuel(core) 47.3 4.6 4.3 4.6 4.8 4.7 4.7 5.0Source: DIPP & CSONote: P: Provisional *CFPI: Consumer Food Price Index

147Review of Economic Developments
Figure 8. Drivers of CPI-Headline, Food and Core inflation (Contribution in percentage points)
Source: Calculated using CPI data, CSO
2.4
0.2 0.4
0.5
0.4
1.0
2.5
0.2 0.3
0.5
0.2
1.1
A: CPI Headline
Food & beverages Pan, tobacco & intoxicants
Clothing & footwear Housing
Fuel & light Miscellaneous
2016-17 (Apr-Dec)
2015-16
0.5 0.6
0.9
0.3 0.4
1.8
-0.2 0.6
0.9
0.7
0.7
0.3 0.4
1.1
0.5
0.5
B: CPI Food Cereals &productsEgg, meat &fishMilk &products
Oils &fats
Fruits &vegetablesPulses &productsSugar &confectionerySpices
2016-17 (Apr-Dec)
2015-16
1.0
0.5
0.8 0.7
0.1
0.6
0.9 1.1
0.4
0.8 0.6
0.4
0.5
1.0
C: CPI Core
Housing
Pan, tobacco &intoxicantsClothing &footwearHealth
Transport &communicationEducation
Others
2016-17 (Apr-Dec)
2015-16
Inflation outlook
8.17 In view of the deceleration in thewholesale and retail prices of key fooditemsduringthesecondhalf of thecurrentfinancial year so far, the average inflationbasedonCPI isprojectedtoremainbelow5 per cent. For the next financial year, therecentuptickinglobalcommodityprices,inparticular crude oil prices, pose an upsiderisk. The food inflation is likely to remainsubduedinthe lightof higherRabisowingacreage,projectedincreaseintheproductionof pulses and key agri-products globallyand astute food management and pricemonitoringbytheGovernment.
Iv. monetary management and FInancIal IntermedIatIon
8.18 TheGovernmentamendedtheReserveBankof IndiaAct,1934duringthecurrentfinancialyear.TheamendedActprovidesforinflationtargettobesetbytheGovernment,
inconsultationwiththeReserveBank,onceineveryfiveyearsandfurtherprovidesfora statutorybasis for the constitutionof anempowered Monetary Policy Committee(MPC).Asper the revisedmonetarypolicyframework, the Government has fixed theinflationtargetof 4percentwithtolerancelevel of +/- 2 per cent for the periodbeginningfrom5thAugust,2016toMarch31,2021.TheGovernmenthasalsonotifiedtheconstitutionof theMPCon29thSeptember2016.SofartheMPChasalreadyheldtwomeetings.TheMPC,initslatestmeetingheldon December 7, 2016, while maintainingaccommodativepolicystancedidnotchangethepolicyrate.Thepolicyratewasreducedby25basispointsto6.25percentinitsfirstmeeting held on October 4, 2016. Hencethe reverse repo rate under the LiquidityAdjustment Facility (LAF) remains 5.75percent,andtheMarginalStandingFacility(MSF)rateis6.75percent.

148 Economic Survey 2016-17
Figure 9. Liquidity Condition (Rs. thousand crore)
8.19 TheReserveBankof India(RBI)alsorefined its monetary policy framework inApril 2016, with the objective of meetingshort-term liquidity needs through regularfacilities;frictionalandseasonalmismatchesthrough fine-tuning operations and moredurable liquidity bymodulating net foreignassetsandnetdomesticassetsinitsbalancesheet.TheMPCsofarhasgonebythescript.
Liquidity situation
8.20 TheRBIhasbeenmanaging liquidityfollowingitsliquiditymanagementframework(Figure9).Inordertobringexanteliquidityconditionsclosetoneutralityithaspumpeddurable liquidity through open marketoperations (OMOs). Post the withdrawalof specified bank notes (SBNs), RBI hasconducted exceptional operations to mopthe large surplus liquidity through variablereversereporate.TocomplementtheRBI’sefforts, theGovernment also increased thelimitonsecuritiesundermarketstabilisationschemefromRs.30,000croretoRs.6lakhcrore. Liquidity conditions were generallytightduringQ1of 2016-17.Theconditioneasedsignificantlyinthesubsequentmonthsbarringoneortwoexceptionalepisodes.The
Source: RBI
weighted average callmoney rate (WACR),on an average has been hovering aroundpolicy ratewithout crossing the upper andlowerboundsof thecorridor.
Yield on Government bills/ securities
8.21 Therewasasharpfall inthe91dayst-bill rate in April 2016 owing to 25 bpscut in repo rate. Ten years governmentsecurity (G-sec) yield however continuedto tread high in spite of the rate cut andin fact increased marginally after the ratecut (Figure 10). However, yield on G-secstarted softening since June 2016. As of30th December 2016, 10-year G-sec yieldstoodat6.63percent.
8.22 The transmission of the rate cuts,however, remained far from perfect. Baseratecamedownmarginallyfrom9.30/9.70inApril2016to9.30/9.65asof 30thDecember2016. Term deposit rates for greater thanone-year maturity period declined from7.00/7.50to6.50/7.00inthisperiod.
Banking sector
8.23 The performance of the bankingsector, public sector banks (PSBs) in
60
70
(600) (500) (400) (300) (200) (100)
- 100 200 300 400
01-A
pr-1
6
12-M
ay-1
6
22-Ju
n-16
02-A
ug-1
6
12-S
ep-1
6
23-O
ct-16
03-D
ec-1
6
13-Ja
n-17
LAF Avg LAF

149Review of Economic Developments
Source: RBI
Figure 10. Movement of Key Rates (per cent)
5.86.06.26.46.66.87.07.27.47.6
Dec
. 30,
2016
Dec
. 16,
2016
Dec
. 2, 2
016
Nov
. 18,
2016
Nov
. 4, 2
016
Oct.
21, 2
016
Oct.
7, 20
16
Sep.
23, 2
016
Sep.
9, 20
16
Aug.
26, 2
016
Aug.
12, 2
016
Jul. 2
9, 20
16
Jul. 1
5, 20
16
Jul. 1
, 201
6
Jun.
17, 2
016
Jun.
3, 20
16
May
20, 2
016
May
6, 20
16
Apr.
22, 2
016
Apr.
8, 20
16
Policy Repo Rate Call Money Rate (Weighted Average)91-Day Treasury Bill (Primary) Yield 10-Year Government Securities Yield
particular, continued to be subdued in thecurrent financial year. The asset qualityof banks deteriorated further. The grossnon-performing assets (GNPA) to totaladvances ratio of scheduled commercialbanks(SCBs)increasedto9.1percentfrom7.8percentbetweenMarchandSeptember2016.Profitafter tax (PAT)contractedonyear-on-yearbasisinthefirsthalf of 2016-17duetohighergrowthinriskprovisions,loan write-off and decline in net interestincome.
Credit growth 8.24 Non- food credit (NFC) outstandinggrewat sub10percent forall themonthsexcept for September 2016 (Figure 11).Creditgrowthto industrialsectorremainedpersistently below 1 per cent during thecurrent fiscal, with contraction in August,October and November. However, bankcredit lending to agriculture and alliedactivities (A&A) and personal loans(PL) segments continue to be the majorcontributortooverallNFCgrowth.
Figure 11. Growth of NFC and its components (per cent)
Source: RBI
-5-2147
1013161922
Apr-1
4
Jun-
14
Aug-
14
Oct-
14
Dec
-14
Feb-
15
Apr-1
5
Jun-
15
Aug-
15
Oct-
15
Dec
-15
Feb-
16
Apr-1
6
Jun-
16
Aug-
16
Oct-
16
NFC A & A Industry Services PL

150 Economic Survey 2016-17
Figure 12. Indian Benchmark Indices: Sensex & Nifty (Daily Movements from 1st January 2016 to 31st December 2016)
Source: Nifty, Sensex
Measures to strengthen corporate bond market
8.25 TheRBItookanumberof measuresto strengthen the corporate bondmarket in India. It accepted many of therecommendations of theKhanCommitteeto boost investor participation and marketliquidityinthecorporatebondmarket.Thenew measures as announced by the RBIinclude:(a)Commercialbanksarepermittedtoissuerupee-denominatedbondsoverseas(masalabonds)fortheircapitalrequirementsand for financing infrastructure andaffordable housing; (b) brokers registeredwith the Securities and Exchange Boardof India (SEBI) and authorized as marketmakersincorporatebondmarketpermittedtoundertake repo/ reverse repo contractsincorporatedebtsecurities.Thismovewillmake corporate bonds fungible and thusboostturnoverinthesecondarymarket;(c)banks allowed to increase the partial creditenhancement they provide for corporatebonds to 50 per cent from 20 per cent.Thismovewillhelp lower-ratedcorporatesto access the bond market; (d) permittingprimarydealerstoactasmarketmakersfor
government bonds, to give further boostto government securities by making themmoreaccessibletoretailinvestors;and(e)toease access to the foreignexchangemarketforhedginginoverthecounter(OTC)andexchange-traded currency derivatives, theRBIhasallowedentitiesexposedtoexchangerate risk to undertake hedge transactionswithsimplifiedprocedures,uptoa limitofUS$30millionatanygiventime.
Indian markets performance
8.26 Indian markets recorded modestgrowthof 1.95–3percent(Sensexwasupby1.95per centwhileNiftywashigherby3.0 per cent) for the calendar year 2016 ascomparedtolossesregisteredin2015.
8.27 Theupwardmomentum,visibleintheIndian markets peaked around September2016, lost steam thereafter (Figure 12),particularly in the wake of foreign capitaloutflowfromemergingmarkets.Globalanddomesticfactorshadasizableimpactontheperformanceof theIndianmarkets.Someofthecloselywatcheddevelopmentswere theBrexit, theUSPresidentialelectionsaswellaspolicyannouncementsbytheUSFederal
6500
7000
7500
8000
8500
9000
9500
2000021000220002300024000250002600027000280002900030000
01-Ja
n-16
22-Ja
n-16
12-F
eb-1
6
04-M
ar-1
6
25-M
ar-1
6
15-A
pr-1
6
06-M
ay-1
6
27-M
ay-1
6
17-Ju
n-16
08-Ju
l-16
29-Ju
l-16
19-A
ug-1
6
09-S
ep-1
6
30-S
ep-1
6
21-O
ct-16
11-N
ov-1
6
02-D
ec-1
6
23-D
ec-1
6
BSE Nifty (RHS)

151Review of Economic Developments
Reserve and the RBI. In addition, otherfactorswhichweighedonmarketsentimentincluded the policy decisions taken by theOPEC regarding oil production and theappointment of the new governor of theRBI.
Foreign Portfolio Investments
8.28 Forthefirst timesincethemeltdownof 2008,NetForeignPortfolioInvestments(FPI) have turned negative (implying thattherewasanoutflowfromtheIndianmarketsto the tune of Rs. 23079 crore) (Table 6).The FPI outflow was not a phenomenonassociatedwithIndianmarketsaloneasFPIspulledoutof mostEMEsinabigwayduetohigherreturnsinadvancedeconomies.
v. IndIa’s merchandIse trade Exports
8.29 Inlinewithsubduedglobalgrowthandtrade,India’sexportsdeclinedby1.3percentand 15.5 per cent in 2014-15 and 2015-16respectively. The trend of negative growthwas reversed somewhat during 2016-17(April-December), with exports registeringa growth of 0.7 per cent to US$ 198.8billion from US$ 197.3 billion in 2015-16(April-December). During 2016-17 (April-December) Petroleum, oil and lubricants(POL)exportsconstituting11.1percentoftotalexportsdeclinedby9.8percenttoUS$22.0 billion over corresponding previousperiod, while non POL exports grew by
Table 7. Export Performance of some important sectors 2015-16 2016 (apr-nov) (p)PositiveGrowth Chemicalsandrelated*products{0.6} Oresandminerals{35.3}
Marineproducts{20.6}GemsandJewellery{11.6}Electronicgoods{3.0}Engineeringgoods{0.9}
NegativeGrowth Textiles{-3.2}GemsandJewellery{-4.8}Electronicgoods{-5.3}Leather{-10.3}Marineproducts{-13.5}Oresandminerals{-16.4}Engineeringgoods{-17.0}Agricultureandalliedproducts{-17.6}Petroleumproducts{-46.2}
Chemicalsandrelatedproducts*{-0.5}Agricultureandalliedproducts{-3.0}Leather{-4.8}Textiles{-5.2}Petroleumproducts{-9.8}
Source: Department of CommerceNote: Figures in bracket { } indicates growth rate y-o-y. *: including plastic & plastic products.P: Provisional as per quick estimates
Table 6. Net FPI/FII Investment in India in 2010-2016 (in Rs. Crore)
Segments 2010 2011 2012 2013 2014 2015 2016
Equity 133266 -2714.3 128360 113136 97054 17808 20568
Debt 46408 42067 34988 -50849 159156 45857 -43647
Total 179674 39352.9 163348 62286 256213 63663 -23079
Source: NSDL

152 Economic Survey 2016-17
2.2 per cent toUS $ 176.8 billion.A largenumber of export sectors have moved topositivegrowthterritoryinApril-November2016-17ascomparedto2015-16(Table7).
8.30 Region-wise, India’s exports toEurope, Africa, America, Asia and CISand Baltics declined in 2015-16. However,India’sexportstoEurope,AmericaandAsiaincreasedby2.6per cent, 2.4per cent and1.1per cent respectively in2016-17 (April-November),whileexportstoAfricadeclinedby13.5percent.USAfollowedbyUAEandHongKongwerethetopexportdestinations.
Imports
8.31 Value of imports declined fromUS$448 billion in 2014-15 to US$ 381 billionin 2015-16, mainly on account of declinein crude oil prices resulting in lower levelsof POL imports. During 2016-17 (April-December) imports declined by 7.4 percent toUS$ 275.4 billion compared to thecorrespondingperiodof previousyear.POLimportsdeclinedby10.8percent.Goldandsilverimportsdeclinedby35.9percentandnon-POLandnon-gold&silverimportsby2.0percent.Positivegrowthwasregisteredinpearlsandsemi-preciousstones(19.0percent)andFoodandalliedproducts(1.3percent).Importsof capitalgoodsdeclinedby8.8percent.
8.32 India’s imports from Europe, Africa,America, Asia and CIS & Baltics regionsdeclined in 2015-16. However, in 2016-17(April-November), imports from CIS &Baltics region increased by 10.3 per centwhile other four regionswitnessed decline.Topthreeimportdestinationsof IndiawereChinafollowedbyUAEandUSAin2016-17(April-November).
Trade deficit
8.33 In 2015-16, India’s trade deficitdeclined by 13.8 per cent (vis-à-vis 2014-
15) to US$ 118.7 billion. Furthermore, itdeclinedby23.5percenttoUS$76.5billionin 2016-17 (April-December) as comparedto US$ 100.1 billion in the correspondingperiodof previousyear.
vI. Balance oF payments
Current account
8.34 DespitemoderationinIndia’sexports,India’s external sector position has beencomfortable,withthecurrentaccountdeficit(CAD) progressively contracting fromUS$ 88.2 billion (4.8 per cent of GDP) in2012-13 to US$ 22.2 billion (1.1 per centof GDP) in 2015-16. The CAD furthernarrowedin2016-17(H1)to0.3percentofGDP. In 2016-17 (H1), sharp contractionin trade deficit outweighed the decline innet invisibleearnings.Thedownwardspiralin international crude oil prices resultedin a decline in oil import bill by around18 per cent which together with a sharpdecline in gold imports led to a reductionin India’s overall imports (on BoP basis).Net services receipts declined by 10 percent in H1 of 2016-17 despite increase inservicesreceipts(4.0percent)asgrowthinservicespaymentswashigher(16percent).However, growth of receipts of softwarewasmarginalandfinancial servicesreceiptsdeclined. Subdued income conditions insource countries, particularly in the gulfregionduetodownwardspiral inoilpricescontinued to weigh down on remittancesby Indians employed overseas as privatetransfersmoderated to US$ 28.2 billion inH1of 2016-17fromUS$32.7billioninH1of 2015-16.
Capital/finance account
8.35 Despite higher net repayments onoverseas borrowings and fall in bankingcapital (net) with building up of foreigncurrencyassetsbybanks&decline inNRIdeposits (net), robust inflow of foreign

153Review of Economic Developments
Table 8. Summary of Balance of Payments (US $ billion)
2013-14 2014-15 2015-16 2015-16 2016-17 (April-March) H1 H1Tradebalance -147.6 -144.9 -130.1 -71.3 -49.5Netservices 73.1 76.5 69.7 35.6 32.0Invisibles(net) 115.2 118.1 107.9 56.7 45.7CurrentAccountBalance -32.4 -26.9 -22.2 -14.7 -3.7TotalCapital/FinanceA/C(Net) 47.9 88.3 40.1 25.3 19.2ReserveMovement(-increase)and(+decrease) -15.5 -61.4 -17.9 -10.6 -15.5Tradebalance/GDP(percent) -7.9 -7.1 -6.3 -7.1 -4.6InvisibleBalance/GDP(percent) 6.2 5.8 5.2 5.7 4.3CurrentAccountBalance/GDP(percent) -1.7 -1.3 -1.1 -1.5 -0.3NetCapitalFlows/GDP(percent) 2.6 4.3 1.9 2.5 1.8
Source: RBI
direct investment (FDI) and net positiveinflowof foreignportfolioinvestment(FPI)weresufficienttofinanceCADleadingtoanaccretioninforeignexchangereservesinH1of 2016-17.ThenetFDIflowsof US$21.3billionrecordedagrowthof about29percentover thecorrespondingperiodof last year.Therewasnetinflowof portfolioinvestmentamountingtoUS$8.2billioninH1of 2016-17as againstoutflowof US$3.5billion inH1 of 2015-16. Banking capital recordednetoutflowof US$6.8billion,primarilyonaccount of acquisition of foreign currencyassets by banks, while net repayment ofexternalcommercialborrowingsresulted inanoutflowof US$4.6billioninH1of 2016-17.Withnetcapitalflowsremaininghigherthan the CAD, there was net accretion toIndia’s foreign exchange reserves (on BoPBasis)(Table8andAppendixA1).
Foreign exchange reserves
8.36 In H1 of 2016-17, India’s foreignexchange reserves increased by US$ 15.5billiononBoPbasis(i.e.,excludingvaluationeffects),whileinnominalterms(i.e.,includingvaluationeffect)theincreasewastothetuneof US$11.8billion.Thelossduetovaluationchangesof US$3.7billionmainlyreflectstheappreciationof theUSdollaragainstmajor
currencies.
Exchange rate
8.37 Inflowsonaccountof FIIs,particularlyinto the equity segment, and positivesentimentsgeneratedbyanarrowerCADinH1of 2016-17helpedtherupeetomoveinanarrowrange.Thesubsequentdepreciationof the rupee could be attributed largely tothestrengtheningof theUSdollargloballyfollowingtheUSpresidentialelectionresultsand tightening of monetary policy by theFederal Reserve. Nevertheless, in 2016-17sofar,therupeehasperformedbetterthanmostof other emergingmarket economies(EMEs).During2016-17(April-December),ony-o-ybasis,therupeedepreciatedby3.4per cent againstUS dollar as compared tothedepreciationof Mexicanpeso(14.4percent), South African Rand (8.6 per cent)and Chinese renminbi (6.3 per cent). Therupee depreciated in terms of nominaleffective exchange rate (NEER) against abasketof 6and36currenciesduringApril-December 2016.However, the 6-currrencyand 36-currencyREER (Trade-based; Baseyear: 2004-05=100) appreciated by 6.1 percentand5.6percent,respectivelyasatend-December2016overend-March2016.

154 Economic Survey 2016-17
vII. external deBt
8.38 At end-September 2016, India’sexternal debt stock stood at US$ 484.3billion,recordingadeclineof US$0.8billionoverthelevelatend-March2016,mainlydueto a reduction in commercial borrowingsandshort termexternaldebt.However,onasequentialbasis,totalexternaldebtatend-September2016increasedbyUS$4.8billionfromtheend-June2016level.
8.39 Thesharesof Government(Sovereign)and non-Government debt in the totalexternaldebtwere20.1percentand79.9percentrespectively,atend-September2016.USdollardenominateddebtaccountedfor55.6percentof India’stotalexternaldebtatend-September 2016, followed by Indian rupee(30.1percent),SDR(5.8percent),JapaneseYen (4.8 per cent) Pound Sterling (0.7 percent),Euro(2.4percent)andothers(0.6percent).
8.40 The maturity pattern of India’sexternaldebt indicatesdominanceof long-term borrowings. At end-September 2016,long-termexternaldebtaccounted for83.2per cent of India’s total external debt.On
a residual maturity basis, short-term debtconstituted 42.0 per cent of total externaldebt at end-September 2016 and 54.7 percentof totalforeignexchangereserves.Theratioof concessional debt to total externaldebt was 9.4 per cent at end-September2016, same as at end-June 2016 and amarginal increase from the 9.0 per cent atend-March 2016.Most of the key externaldebt indicators showed an improvement inSeptember 2016 (Table 9) vis-à-vis March2016.Theshareof short-termdebtintotalexternal debt declined to 16.8 per cent atend-September 2016 and foreign exchangereservesprovidedacoverof 76.8percenttothetotalexternaldebtstock.Otherindicatorsalsogenerallyshowedanimprovement.
8.41 Cross-countrycomparisonof externaldebt based on the World Bank’s annualpublication titled ‘International DebtStatistics2017’,whichcontainstheexternaldebt data for the year 2015, indicatesthat India continues to be among theless vulnerable countries. India’s key debtindicatorscomparewellwithotherindebteddevelopingcountries.
Table 9. India’s Key External Debt Indicators (per cent)
Year External Debt (US$
billion)
External Debt to
GDP
Debt Service Ratio
Concessional Debt to Total
Debt
Foreign Exchange Reserves to Total
Debt
Short-Term External Debt# to Foreign
Exchange Reserves
Short- Term
External Debt to
Total Debt
2007-08 224.4 18.0 4.8 19.7 138.0 14.8 20.42013-14 446.2 23.9 5.9 10.4 68.2 30.1 20.52014-15 474.7 23.2 7.6 8.8 72.0 25.0 18.02015-16(PR) 485.0 23.4 8.8 9.0 74.3 23.1 17.2End-Sept2016(QE)
484.3 * * 9.4 76.8 21.8 16.8
Source: India's External debt as at end-September 2016, Ministry of Finance
Notes: PR: Partially Revised; QE: Quick Estimates. # Short Term External Debt is based on Original Maturity. *: Not worked out for part of the year

155Review of Economic Developments
vIII. outlook For the economy For the year 2017-188.42 CSO in its first AE estimated theeconomy to grow by 7.1 per cent in thecurrent year. However, it has stated thatthese numbers have been projected takingintoaccounttheinformationforfirstsevento eightmonths. It is therefore unlikely tohave captured the impactof withdrawalofthehighdenominationcurrency.AlthoughitisdifficulttopreciselypinpointtheimpactonGDP,inalllikelihood,thegrowthnumbersofGDP,GVA,etc.couldbereviseddownwardsinthesubsequentrevisionstobecarriedoutby the CSO. Inflation could also be lowerthanwhatcomesoutfromtheimplicitGDPdeflator underlying the CSO’s first AE for2016-17.
8.43 For 2017-18, it is expected that thegrowthwould return tonormalas thenewcurrency notes in required quantities comebackintocirculationandasfollowupactionsto demonetisation are taken. Helping tomaintainthemomentumof suchgrowthwillbefactorslikepossiblenormalmonsoon,anincrease in the level of exports followingtheprojectedincreaseinglobalgrowthandaboveallvariousreformmeasurestakenbytheGovernmenttostrengthentheeconomy.Some possible challenges to growth exist.For example, the prices of crude oil havestarted rising and are projected to increasefurther in the next year. Estimates suggestthatoilpricescouldrisebyasmuchasone-sixth over the 2016-17 level, which couldhavesomedampeningimpactonthegrowth.Fixed investment rate in the economy hasconsistently declined in the past few years,moresotheprivateinvestment.Raisingthegrowthrateof theeconomywill toagreatextent depend on quickly reversing thisdownwardtrendintheinvestment.Thelastfewyearshavealsowitnessedaslowdowninglobaltradeandinvestmentflows.Although,
Indiahasnotbeenparticularlyaffectedbythisslowdown,lowergrowthinforeignportfolioinvestment cannot be ruled out, partly onaccountof thefact that the interest rates intheUnitedStateshavebeguntoincrease.
8.44 Onbalance,thereisastronglikelihoodthatIndianeconomymayrecoverbacktoagrowth of 6¾ per cent to 7½ per cent in2017-18.
Ix. agrIculture and Food management
8.45 As per the first advance estimates oftheCSO,growthratefortheagricultureandalliedsectors isestimated tobe4.1percentfor2016-17.DetailsmaybeseenatTable1.
Production
8.46 As per the First Advance Estimates(AE)releasedbyMinistryof AgricultureandFarmers Welfare on 22nd September 2016,production of Kharif food-grains during2016-17isestimatedat135.0milliontonnescomparedto124.1milliontonnesin2015-16(Table10).
Table 10. Production of Major Kharif Crops (in Million Tonnes)
Crops 2015-16(First AE)
2016-17(First AE)
TotalKharif food-grains 124.1 135.0Rice 90.6 93.9TotalCoarseCereals
27.9 32.5
TotalPulses 5.6 8.7TotalOilseeds 19.9 23.4Sugarcane 341.4 305.2Cotton@ 33.5 32.1
Source: Directorate of Economics & Statistics, Department of Agriculture, Cooperation & Farmers Welfare. Note: @Production in million bales of 170 kgs each.
Acreage under kharif and rabi crops
8.47 During 2016-17, area sown upto 14th
October,2016underallkharif crops taken

156 Economic Survey 2016-17
together was 1075.7 lakh hectares whichwas3.5percenthighercomparedto1039.7lakh hectares in the corresponding periodof 2015-16(AppendixA2).ArharregisteredthemaximumpercentageincreaseinacreageduringtheKharif season2016-17comparedtothepreviousyear.
8.48 Therabicrops’sowingis inprogress.The area coverage under rabi crops (totalarea)ason13thJanuary2017for2016-17at616.21 lakh hectares is 5.9 per cent higherthanthatinthecorrespondingweekof lastyear (Figure 13). The area coverage underwheatason13thJanuary2017is7.1percenthigherthanthat inthecorrespondingweekof lastyear.Theareacoverageundergramason13thJanuary2017is10.6percenthigherthanthatinthecorrespondingweekof lastyear(Figure13inChapter1).
Monsoon rainfall and its distribution
8.49 During the South West MonsoonSeason (June-September) of 2016 thecountry as a whole received rainfall whichwas 97per cent of its longperiod average(LPA). The actual rainfall received duringthisperiodwas862.0mmasagainsttheLPAat887.5mm.Region-wisedetailsaregiveninTable11.Outof thetotal36meteorologicalsubdivisions,4 subdivisions receivedexcessrainfall, 23 subdivisions received normalrainfall and the remaining 9 subdivisionsreceiveddeficientrainfall.
Table 11. Long Period Average (LPA) vs. Actual South West Monsoon Season Rainfall
(JunetoSeptember)in2016
Region LPA (mm)
Rainfall (mm)
(Actual)
Rainfall (% of LPA)
AllIndia 887.5 862.0 97NorthwestIndia 615.1 584.2 95CentralIndia 975.3 1034.1 106NortheastIndia 1437.8 1281.5 89SouthPeninsula 715.6 661.5 92Source: India Meteorological Department.
Irrigated area under principal crops
8.50 Irrigation isoneof thecritical inputstoimproveproductivityinagriculture.Wideregionalandcrop-wisevariationscanbeseenincoverageof irrigatedarea(Figure14).
Price policy of agricultural produce
8.51 The price policy of Government formajor agricultural commodities seeks toensure remunerative prices to the farmersto encourage higher investment andproduction, and to safeguard the interestof consumers bymaking available suppliesat reasonable prices. On account of thevolatility of prices of pulses, a Committeeon ‘Incentivising Pulses ProductionThrough Minimum Support Price (MSP)and Related Policies’ was set up under theChairmanshipof Dr.ArvindSubramanian,Chief EconomicAdviser,whichsubmitteditsreporton16thSeptember,2016.Themain
Figure 13. Sowing of Rabi Crops (Million Hectares)
Source: Directorate of Economics & Statistics.
4
14
24
34
44
54
64
30thOct
4thNov
11thNov
18thNov
27thNov
4thDec
11thDec
18thDec
30thDec
8thJan
15thJan
2014-15 2015-16 2016-17 Avg 5 yrs
Figure 14. State-wise per cent coverage of irrigated area under principal crops during
2013-2014
Source: Directorate of Economics & Statistics.
0102030405060708090
100
Rice Wheat Total Pulses

157Review of Economic Developments
recommendationsaregiveninAnnexureA3and the report is available at http://mof.gov.in/reports/Pulses_report_16th_sep_2016.pdf.Toincreaseproductivityof pulses,anewextraearlymaturing,highyieldingvarietyof Arhar(Pusa Arhar-16) has been developed to bemadeavailableforfarmersinthenextKharifseason.
8.52 TheMinimumSupportPrices(MSPs)of majorcropsduringthelasttwoyearsarepresented in Annexure A4. During 2016-17, MSPs were raised substantially mainlyforpulsestoincentivizefarmerstocultivatepulses(Figure15).
Food-grain stocks and procurement in central pool
8.53 The food-grainmanagement involvesprocurementof riceandwheatandfollowingthenorms forbuffer stocks.The stocksoffood-grains(RiceandWheat)was43.5milliontonnesason1stDecember,2016comparedto 50.5million tonnes as on 1st December,2015 vis-à-vis the buffer stock norm of30.77milliontonnesason1stOctober2015(Figure16.A&B).Procurementof rice ason6thJanuary2017was23.2milliontonnesduring Kharif Marketing Season 2016-17whereas procurement of wheat was 22.9milliontonnesduringRabiMarketingSeason2016-17. As part of the price policy toprotectconsumers, theCentralIssuePrices
of riceandwheathaveremainedunchangedsince1stJuly2002.
Agriculture credit
8.54 Creditisanimportantinputtoimproveagricultural output and productivity. Toimprove agricultural credit flow, the credit
Source: Commission for Agricultural Costs and Prices (CACP).
Figure 15. Per cent Change in MSP (2016-17 over 2015-16) of select crops
02468
1012141618
Source: Food Corporation of India.
Figure 16 A. Wheat Stocks and Buffer Norms (in Million Tonnes)
5
10
15
20
25
30
35
40
45
Jan Feb Mar Apr May Jun Jul Aug Sep Oct Nov Dec2014 2015 2016 Buffer Norm
Figure 16 B. Rice Stocks and Buffer Norms (in Million Tonnes)
5
10
15
20
25
30
35
Jan Feb Mar Apr May Jun Jul Aug Sep Oct Nov Dec
2014 2015 2016 Buffer Norm
Figure 17. Agriculture Credit (Rs. lakh crore)
Source: NABARD. Note: *The target for 2016-17 refers to the full year while achievement is for the first half.
6.1 7.3 8.5 8.8 7.6
5.8 7.0
8.0 8.5
9.0
2012-13 2013-14 2014-15 2015-16 2016-17*
Achievement Target
Source: Food Corporation of India.

158 Economic Survey 2016-17
target for 2016-17 has been fixed at Rs. 9lakhcroreagainstRs.8.5lakhcrorefor2015-16 (Figure 17). As against the target, theachievement for 2016-17 (upto September2016),was84percentof the target,higherthanthecorrespondingfigureof 59percentuptoSeptember2015.
x. IndustrIal, corporate and InFrastructure sectors
8.55 As per the first advance estimatesof the CSO, growth rate of the industrialsector comprising mining & quarrying,manufacturing, electricity and constructionis projected to decline from 7.4 per centin 2015-16 to 5.2 per cent in 2016-17(See Table. 1 & para 8.3). During April-November2016-17,amodestgrowthof 0.4percenthasbeenobservedintheIndexofIndustrialProduction(IIP)whichisavolumeindexwithbase year of 2004-05.Thiswasthe composite effect of a strong growthin electricity generation and moderationin mining and manufacturing (Table 12).In terms of use-based classification, basicgoods, intermediate goods and consumerdurable goods attained moderate growth.Conversely, the production of capitalgoods declined steeply and consumernon-durable goods sectors suffered a modestcontractionduringApril-November2016-17 (Table12).
8.56 Theeightcoreinfrastructuresupportiveindustries, viz. coal, crude oil, natural gas,refinery products, fertilizers, steel, cementand electricity that have a total weight ofnearly 38 per cent in the IIP registered acumulative growth of 4.9 per cent duringApril-November, 2016-17 as compared to2.5percentduringApril-November,2015-16. The production of refinery products,fertilizers, steel, electricity and cementincreasedsubstantially,whiletheproductionof crudeoilandnaturalgasfellduringApril-
November,2016-17.Coalproductionattainedlowergrowthduringthesameperiod.
Table 12. IIP-based Growth Rates of Broad Sectors/Use-based Classification (per cent)
2014-15
2015-16
April-Nov.
2015-16
April-Nov.
2016-17Generalindex 2.8 2.4 3.8 0.4
Mining 1.5 2.2 2.1 0.3Manufacturing 2.3 2.0 3.9 -0.3Electricity 8.4 5.7 4.6 5.0Basicgoods 7.0 3.6 3.9 4.1CapitalGoods 6.4 -2.9 4.7 -18.9Intermediategoods
1.7 2.5 2.0 3.4
Consumergoods -3.4 3.0 4.1 1.8Durables -12.6 11.3 11.8 6.9Non-durables 2.8 -1.8 -0.5 -1.8Source: CSO
8.57 Most indicators of infrastructure-related activities showed expansion duringH12016-17.Thermalpowerwithagrowthof 6.9 per cent boosted overall powergeneration while hydro and nuclear powergeneration contracted marginally duringApril-September2016(Figure18).
8.58 The performance of corporate sector(Reserve Bank of India, January 2017)highlightedthatthegrowthinsaleswas1.9percent inQ2of 2016-17ascompared tonearstagnantgrowthof 0.1percentinQ1of 2016-17.Thegrowthof operatingprofitsdeceleratedto5.5percentinQ2of 2016-17from9.6percentinthepreviousquarter.TheY-o-Ygrowthininterestexpensesremainedflat inQ2of 2016-17, as compared to 5.8percentinthepreviousquarter.Growthinnetprofitsregisteredaremarkablegrowthof16.0percentinQ2of 2016-17,ascomparedto11.2percentinQ1of 2016-17.
8.59 The Government has liberalized andsimplified the foreign direct investment(FDI) policy in sectors like defence,railway infrastructure, construction and

159Review of Economic Developments
pharmaceuticals, etc. During April-September 2016-17, FDI equity inflowswereUS$21.7billionascompared to totalFDI inflows of US$ 16.6 billion duringApril-September 2015-16 showing 30.7per cent surge. Sectors like services sector,construction development, computersoftware&hardwareandtelecommunicationshaveattractedhighestFDIequityinflows.
8.60 Manynewinitiativeshavebeentakenupby theGovernment to facilitate investmentand ease of doing business in the country.Noteworthy among them are initiativessuch as Make-in-India, Invest India, StartUp India and e-biz Mission Mode Projectunder the National e-Governance Plan.Measurestofacilitateeaseof doingbusinessinclude online application for IndustrialLicense and Industrial EntrepreneurMemorandum through the eBiz website24x7 for entrepreneurs; simplification ofapplication forms for Industrial LicenceandIndustrialEntrepreneurMemorandum;limitingdocumentsrequiredforexportandimport to three by Directorate General ofForeignTrade; and settingupof InvestorFacilitationCellunderInvestIndiatoguide,assist and handhold investors during theentirelife-cycleof thebusiness.
xI. servIces sector
8.61As per the first advance estimates oftheCSO,growthrateof theservicessectorisprojectedtogrowat8.8percentin2016-17,almostthesameasin2015-16(SeeTable1 & para 8.3). As perWTO data, India’scommercialservicesexportsincreasedfromUS$51.9billionin2005toUS$155.3billionin 2015. The share of India’s commercialservicestoglobalservicesexportsincreasedto3.3percentin2015from3.1percentin2014despitenegativegrowthof 0.2percentin2015ascomparedto5.0percentgrowthin2014.Thiswasduetotherelativelygreaterfallinworldservicesexportsby6.1percentin2015.AsperRBI’sBoPdata,India’sservicesexportsdeclinedby2.4percentin2015-16asaresultof slowdowninglobaloutputandtrade.However, inH1of 2016-17,servicesexportsincreasedby4.0percentcomparedto0.3percentgrowthinthesameperiodofpreviousyear.Growthof netservices,whichhasbeenamajorsourceof financingIndia’stradedeficit in recentyears,was (-)9.0percentin2015-16and(-)10.0percentinH1of 2016-17due to relatively higher growthinimportsof services.Growthof softwareexportswhich accounted for 48.1 per centshareinservicesexportswas1.4percentin2015-16and0.1percentinH1of 2016-17.
Figure 18. Growth in infrastructure-related activities during H1 2016-17 (in per cent)
Source: MoSPI-6
-4
-2
0
2
4
6
8
10
12
Powergeneration
Highwayconstruction/
widening
Rail freighttraffic
Railwayearnings
Cargo atmajor ports
Export cargo Import cargo

160 Economic Survey 2016-17
8.62 India’s tourism sector witnessed agrowthof 4.5percent intermsof foreigntourist arrivals (FTAs) with 8.2 millionarrivals in 2015, and a growth of 4.1 percent in foreign exchange earnings (FEEs)of US$21.1billion.In2016(Jan. toDec.),FTAswere8.9millionwithgrowthof 10.7percentandFEE(US$terms)wereatUS$23.1billionwithagrowthof 9.8percent.
8.63 TheNikkei/Markit Services PMI forIndia was at a high of 57.5 in January of2013.Itfellto46.7inNovember2016from54.5inOctober2016.However,itincreasedmarginally to 46.8 inDecember 2016. TheBalticdryindex(BDI)anindicatorof both
merchandise trade and shipping services,whichshowedsomeimprovementupto18November2016declinedsomewhat to910on13January2017(Figure19).
xII. socIal InFrastructure, em-ployment and human development
Trends in social sector expenditure8.64 AspertheReserveBankof Indiadata,expenditureonsocialservicesbyCentreandStates,asaproportionof GDPwas7.0percent during 2016-17 (BE), with educationandhealthsectorsaccountingfor2.9percentand1.4percentrespectively(Table13).Theyear2014-15inrespectof whichlatestactualfigures are available showed a significant
Figure 19. Baltic Dry Index
Source: http://in.investing.com/indices/baltic-dry-historical-data
Table 13. Trends in social sector expenditure
Items 2009-10 2013-14 2014-15 2015-16 RE
2016-17BE
As percentage to GDPTotalExpenditure 28.6 26.6 25.1 28.2 28.4ExpenditureonSocialServices 6.9 6.6 5.7 6.9 7.0of which:Education 3.0 3.1 2.6 2.9 2.9Health 1.4 1.2 1.1 1.3 1.4Others 2.5 2.3 2.0 2.7 2.7
Source: Reserve Bank of India.
0
2000
4000
6000
8000
10000
12000
14000
01-Jan-08
12-May-08
21-Sep-08
31-Jan-09
12-Jun-09
22-Oct-09
03-Mar-10
13-Jul-10
22-Nov-10
03-Apr-11
13-Aug-11
23-Dec-11
03-May-12
12-Sep-12
22-Jan-13
03-Jun-13
13-Oct-13
22-Feb-14
04-Jul-14
13-Nov-14
25-Mar-15
04-Aug-15
14-Dec-15
24-Apr-16
03-Sep-16
13-Jan-17
663 on 8 Dec 2008
290 on 11 Feb 2016
910 on 13 January 2016
1 11793 on 20 May 2008

161Review of Economic Developments
declinefromtheRElevel followinga largedecrease in actual social sector expenditureof thestatesfromtherevisedestimates.
Employment scenario
8.65 The results of the quarterly quickemployment surveys in select labour-intensiveandexport-orientedsectorsbytheLabour Bureau for the period December,2015overDecember,2014(Figure20)showthat the overall employment increased by135thousand.Thesectors thatcontributedto this increase include: IT/BPOs sector,textiles including apparels and metals.Employment, however, declined in gems& jewellery sector, handloom/powerloomsector, leather, automobiles sectors andtransportsectorduringthesameperiod.
8.66 AbroadercoverageonlabouremployedandrelatedstatisticsisprovidedbytheAnnualEmployment and Unemployment Surveys
(EUS)alsoconductedbytheLabourBureau,Ministry of Labour and Employment.The results of the latestEUS, 2015-16 aresummarisedinTable14.TheLabourForceParticipation Rate (LFPR) at the all Indialevelbasedonusualprincipalstatusapproachwasestimatedat50.3percent.TheAllIndiaLFPRof femalesismuchlowerthanthatformales.TherearewideinterstatevariationsinthefemaleLFPRaswell.TheNorthEasternandSouthernStates,ingeneral,displayhighfemaleLFPR as compared to low levels inNorthernStates.AsperEUS,2015-16, theunemployment rate for femaleswas higherthan that of males across rural and urbanareas (Table.14).Therearewide inter-statevariationsinURascanbeseeninFigure21.
8.67 As per EUS Surveys, employmentgrowthhasbeensluggish.Further,Statesthatshowlowunemploymentratesalsogenerallyrank high in the share of manufacturing.While States compete to seek investmentofferingincentives,linkingincentivestothenumber of jobs created, sustained effortsneed tobeconsideredasa tool to increaseemployment.
8.68 The employment by sectors and bycategories are shown in Figure 22 (A&B).There is a clear shift in employment tosecondary and tertiary sectors from theprimarysector.Thegrowth inemploymentby category reflects increase inboth casuallabour and contract workers (Figure 22.B).This has adverse implications on the
Table 14. LFPR, WPR and UR based on Usual Principal Status (UPS), 2015-16
ParameterRural Urban Total
M F P M F P M F PLFPR 77.3 26.7 53.0 69.1 16.2 43.5 75.0 23.7 50.3WPR 74.1 24.6 50.4 66.8 14.3 41.4 72.1 21.7 47.8UR 4.2 7.8 5.1 3.3 12.1 4.9 4.0 8.7 5.0Source: Report on 5th Annual EUS, 2015-16 (Labour Bureau).Note: LFPR- Labour Force Participation Rate, WPR- Worker Population Ratio, UR- Unemployment Rate, M- Male; F-Female; P-Persons.
Figure 20. Estimated change in Employment in Eight Selected Sectors (in 000)(December2015overDecember2014)
Source: Labour Bureau.
72
-8
37
-8 -19 -4
76
-11
135
-25
0
25
50
75
100
125
150
Text
iles
Leat
her
Met
als
Aut
omob
iles
Gem
s & Je
wel
lery
Tran
spor
t
IT/B
PO
Han
dloo
m
Tota
l

162 Economic Survey 2016-17
Figure 21. Unemployment Rate based on UPS approach for persons of age 15 years and above in States, 2015-16 (per cent)
Source: Report on 5th Annual EUS, 2015-16 (Labour Bureau).
Figure 22 A & B. All India distribution of employed persons based on UPS approach by sectors of employment and by category of employment (per cent)
Source: Report on 5th Annual EUS, 2015-16 (Labour Bureau).
level of wages, stability of employment,social security of employees owing to the‘temporary’ nature of employment. It alsoindicatespreferencebyemployersawayfromregular/formal employment to circumventlabourlaws.
8.69 Themultiplicityof labourlawsandthedifficulty in their compliance have been animpediment to the industrial developmentand employment generation. At present,thereare39Centrallabourlawswhichhavebeenbroadly proposed to be grouped intofour or five Labour Codes on functionalbasis with the enactment of special laws
for small manufacturing units. In a majorinitiative for bringing compliance in thesystem, catalysing theneedof job creationandtoensureeaseof doingbusinesswhileensuringsafety,healthandsocialsecurityofeveryworker,theGovernmenthasputforthasetof labourreformmeasures.
Education sector
8.70 An important concern that is oftenraised in the context of school educationis low learning outcomes. This has beenpointed out in several studies includingASER, 2014. While there have been
0
5
10
15
20
25G
ujar
atK
arna
taka
Chha
ttisg
arh
Mah
aras
htra
Telan
gana
Mizo
ram
Delh
iA
ndhr
a Pra
desh
Tam
il N
adu
Mad
hya P
rade
shH
arya
naM
egha
laya
Wes
t Ben
gal
Odi
sha
Man
ipur
Biha
rPu
njab
Ass
amU
ttara
khan
dRa
jasth
anJa
mm
u &
Kas
hmir
Utta
r Pra
desh
Jhar
khan
dN
agala
ndA
runa
chal
Prad
esh
Goa
Him
acha
l Pra
desh
Ker
alaSi
kkim
Trip
ura
52.9
19.3
27.8
46.1
21.8
32
Primary Sector Secondary Sector Tertiary Sector
2011-12 (2nd Round) 2015-16 (5th Round)
0 10 20 30 40 50 60
Self employed
Wages/salaried
Contract Workers
Casual Labourers
2011-12 (2nd Round)
2015-16 (5th Round)
52.9
19.3
27.8
46.1
21.8
32
Primary Sector Secondary Sector Tertiary Sector
2011-12 (2nd Round) 2015-16 (5th Round)
0 10 20 30 40 50 60
Self employed
Wages/salaried
Contract Workers
Casual Labourers
2011-12 (2nd Round)
2015-16 (5th Round)

163Review of Economic Developments
improvements in access and retention, thelearningoutcomesforamajorityof childrenisstillacauseof seriousconcern.Someofthe underlying causes contributing to lowquality of education in the primary sectorareteacherabsenteeismandtheshortageofprofessionallyqualifiedteachers.
8.71 Though the share of teachercomponent in total Sarva ShikshaAbhiyan(SSA) budget has been increasing over theyears from 35 per cent in 2011-12 to 59per cent in 2014-15, teacher absenteeismandtheshortageof professionallyqualifiedteachers remain an issue to be addressed.The components of SSA Budget 2014-15aregiveninFigure23.
8.72 An option to address teacherabsenteeismthatcanbeexploredisbiometricattendanceof allteachersinprimaryschoolsfor each scheduled class/lecture/session/distinctfromthepresentsystem,whereitismorning and evening to ostensibly recordarrivalanddepartureswith littlecontrolonthe activities during the working hours. Apilot project in one district of every Statemay be commenced for six months to beexpanded to all districts in three years.Apart from thebiometric attendancebeingregularly monitored by local communitiesandparents, it shouldalsobeput inpublicdomain.Thisshouldbebackedbyadequateteaching aids, recorded lectures, etc. tofill in for absentee teachers. The scopeof implementation should leave room forflexibilityatthelocallevelsothesamedonotendupas topdriven ‘ModelSchools’.Thepilot of biometric attendance of teachersshould be accompaniedwith an evaluationof learningoutcomes.
Health for all
8.73 India’s health policy aims at anintegrated approach which will provideaccessible, affordable and equitable
Figure 23. Per cent share of components in SSA Budget during 2014-15
Source: SSA Portal, ASER portal.
quality health care to themarginalized andvulnerablesections.Theaimof goodhealthand well-being for all as envisaged in theSustainable Development Goal (SDG) 3,“Ensure healthy lives and promote well being for all at all ages” should be synchronizedwithIndia’sdomestictargetstoreapthebenefitsof the'demographicdividend'.
8.74 Despite the challenges faced by thegovernment in providing affordable healthservices to thepopulation, therehavebeensome notable achievements in the healthsector. Life expectancy has doubled andinfantmortalityandcrudedeathrateshavereduced sharply. India’s total fertility rate(TFR)hasbeensteadilydecliningandwas2.3(rural2.5&urban1.8)during2014.InfantMortalityRate(IMR)hasdeclinedto37per1000 live births in 2015 from 44 in 2011.The challenge lies in addressing the hugegapbetweenIMRinrural(41per1000livebirths) and urban (25 per 1000 live births)areas.
8.75 TheMaternalMortalityRatio (MMR)declined from 301 maternal deaths per100,000 live births during 2001-03 to 167maternaldeathsper100,000livebirthsduring2011-13.TherearewideregionaldisparitiesinMMR(Figure24),withStateslikeAssam,
59% 18%
12%
0% 7%
3% 1% Teachers
Schools
Children
Quality
Management
School Grants
Micelleneous

164 Economic Survey 2016-17
Uttar Pradesh, Rajasthan, Odisha, MadhyaPradesh and Bihar recording MMR wellabovetheallIndiaMMRof 167.Therefore,inadditiontoreducingtheallIndiaMMRinlinewithSDG3targets,byimprovinghealthand nutritional status of women, there isneed to focus on StateswithMMRhigherthanthenationalaverage.
8.76 Thehigh levels of anaemia prevalentamongwomenintheagegroup15-49havea
Figure 24. Maternal Mortality Ratio by States, 2011-13 (per 100000 live births)
Source: MMR Bulletin, 2011-13, Ministry of Health and Family Welfare.
Source: National Family Health Survey (NFHS-4) 2015-16 -State Fact Sheet.Note: Anaemia in women excludes pregnant women.
Figure 25. Percentage of men and women with anaemia across States
directcorrelationwithhighlevelsof MMR.InHaryanaandWestBengalmorethan60percentof womensufferfromanaemia(Figure25). Under the National Health Mission,Government of India has programmes toaddresstheissueof anaemiathroughhealthandnutrition education to promote dietarydiversification, inclusionof ironfoliaterichfoodaswellasfooditemsthatpromoteironabsorption.
300 285 244
222 221 208
141 133 127 126 113 112 92 79 68 61
050
100150200250300350
India
0.010.020.030.040.050.060.070.0
Anaemia in Women Anaemia in Men

165Review of Economic Developments
Box 1. Experimental Health Outcome IndexAnexperimentalHealthOutcomeIndex(HOI)hasbeencomputedusingLifeExpectancyatage1year(LE1),IMRandMMRasindicators.LE1figuresarefromtheperiod2010-14.IMRandMMRfiguresformajorityof theStatesarefor2011-13.TheHealthOutcomeIndicescomputedbystandardisingtheaboveindicatorsforthe18Statesareplottedbelow.
Figure B1. Health Outcome Index
Source: Calculated by using Sample Registration System data, O/o RGI & Census of India.
Note: Standardised LE1 = (Actual value-Minimum value)/ (Maximum value-Minimum value). Standardised IMR=(Maximumvalue-Actualvalue)/(Maximumvalue-Minimumvalue).StandardisedMMR=(Maximumvalue-Actualvalue)/(Maximumvalue-Minimumvalue).HereAndhraPradeshincludesTelangana.
Asperthedata,AssamhasthelowesthealthoutcomeindexwhereasKeralahasthehighest.Outof theeighteenStates,nineStateshaverecordedahealthoutcomeindexhigherthantheAllIndiaindex(0.6).AssamwhichhasthelowesthealthoutcomeindexhasreportedthehighestMMRascanbeseeninFigure24.
Inclusive Policies of the Government
8.77 It is the vision of the Governmentto have an inclusive society in which equalopportunitiesareprovidedforthegrowthanddevelopmentof allsectionsof thepopulationincluding the marginalised, vulnerable andweaker sections to leadproductive, safeanddignifiedlives.Accordingly,programmeshavebeen initiated by the government towardsattainingtheobjectiveof inclusivesocietylikethe Accessible India Campaign (Box2)
8.78 The government has variousschemes meant for the economic andsocial empowerment of people belongingto the minority communities. For socialempowerment, the ‘Nai roshni’ schemeforleadershipdevelopmentof minoritywomen,‘PadhoPardesh’,aschemeof interestsubsidy
on educational loans for overseas studiesfor the students belonging to theminoritycommunities, etc. are being implemented.For skill development and economicempowerment of minorities, schemeslike 'Seekho Aur Kamao' (Learn & Earn),Upgrading Skill and Training in TraditionalArts/CraftsforDevelopment(USTTAD)and‘NaiManzil’-aschemetoprovideeducationandskilltrainingtotheyouthfromminoritycommunitiesareinoperation.
xIII. clImate change
Developments in international climate change negotiations:
8.79 On12thDecember,2015,196PartiestotheUnitedNationsFrameworkConventiononClimateChange(UNFCCC)adoptedthehistoric Paris Agreement, which brings all
0.00.10.20.30.40.50.60.70.80.91.0
All India

166 Economic Survey 2016-17
Box 2. Accessible India Campaign (Sugamya Bharat Abhiyan)As a society it is imperative to promote, protect and ensure the full and equal enjoyment of all human rightsandfundamentalfreedomsbyallpersonswithdisabilities,andtopromoterespectfortheirinherentdignity(UNConventiononrightsof PersonswithDisabilities).AccordingtoCensus2011,thenumberof personswithdisabilitiesinIndiaconstituted2.2percentof thepopulation.TheDepartmentof Empowermentof PersonswithDisabilities(DEPwD) launched ‘Accessible India Campaign (Sugamya Bharat Abhiyan)’ as a nation-wideCampaign for achievinguniversalaccessibilityforPersonswithDisabilities(PwDs)withafocusonthreeverticals:BuiltEnvironment,PublicTransportationandInformation&CommunicationTechnologies.
The‘InclusivenessandAccessibilityIndex’launchedbytheGovernmentaspartof theSugamyaBharatAbhiyanhelpstheindustriesandcorporatestoparticipateintheAccessibleIndiaCampaign(AIC)byvoluntarilyevaluatingtheirreadinessformakingtheworkplaceaccessibleforPwDs.TheIndexisafirst-of-its-kindinitiativeinthecountryandwillbeanidealinstrumentfortheintegration,assimilationandinclusionof PwDsintothemainstream.TheIndexenablestheorganisationstointrospectovertheirinclusivepoliciesandorganisationalcultureinaidof PwDs,employmentof suchworkforceandadaptationstomeettheneedsof PwDs.
Further, the“Rights of Persons with Disabilities Bill – 2016”passedbytheParliamentaimsatsecuringandenhancingtherightsandentitlementsof PwDs.Thebillhasproposedtoincreasethereservationinvacanciesingovernmentestablishmentsfrom3percent to4percentfor thosewithbenchmarkdisabilityandhighsupportneeds.Furtherdetailsof thebillareavailableathttp://pib.nic.in/newsite/PrintRelease.aspx?relid=155592.
nations into a commoncause toundertakeambitiouseffortstocombatclimatechangeandunleashactionsandinvestmenttowardsalowcarbon,resilientandsustainablefuture.TheParisAgreement sets the path for thepost-2020 actions based on the NationallyDetermined Contributions (NDCs) of theParties. The Paris Agreement entered intoforceon4thNovember2016.
8.80 The 22nd Session of the Conferenceof Parties(COP22)toUNFCCCwasheldfrom 7-19 November 2016 in Marrakech,Morocco.Themainthrustof COP22wason developing rules and action frameworkfor operationalizing the Paris Agreementandadvanceworkonpre-2020Actions.AtCOP22,Partiesagreedtoadeadlineof 2018for the rule book. Detailing exercise willincludeaccountingof theNDCs,adaptationcommunication, building a transparencyframework,globalstocktakeeveryfiveyears,etc.
8.81 ThekeydecisionadoptedatCOP22was “Marrakech Action Proclamation forourClimateandSustainableDevelopment”whichcapturedthesenseof urgencytotakeaction on climate change. The Marrakech
Action Proclamation also emphasized theneed to strengthen and support efforts toeradicate poverty, ensure food security andenhance resilience of agriculture. The pre2020actionincludingmobilizationof USD100billionperyearwasakeyelementof theProclamation.
India’s green actions
8.82 India ratified theParisAgreementon2nd October 2016. India’s comprehensiveNDC target is to lower the emissionsintensity of GDPby 33 to 35 per cent by2030from2005levels,toincreasetheshareof non-fossil fuelsbasedpower generationcapacity to40per centof installed electricpower capacity by 2030, and to create anadditional(cumulative)carbonsinkof 2.5–3GtCO2e through additional forest and treecoverby2030.
8.83 Currently, India’s renewable energysector is undergoing transformation witha target of 175 GW of renewable energycapacitytobereachedby2022.Inordertoachieve the target, themajorprogrammes/schemes on implementation of Solar Park,Solar Defence Scheme, Solar scheme for

167Review of Economic Developments
Central Public Sector Undertakings, Solarphotovoltaic (SPV) power plants on CanalBank and Canal Tops, Solar Pump, SolarRooftop, etc. havebeen launched in recentyears.A capacity additionof 14.30GWofrenewableenergyhasbeenreportedduringthe last two and half years under GridConnectedRenewablePower,whichinclude5.8GW fromSolarPower, 7.04GW fromWind Power, 0.53 GW from Small HydroPowerand0.93GWfromBio-power.Asaresultof variousactionsintherightdirection,India attained 4th position in global windpower installed capacity after China, USAandGermany.Ason31stOctober2016,Indiaachieved 46.3 GW grid-interactive powercapacity; 7.5GWof grid-connectedpowergenerationcapacityinrenewableenergy;andsmall hydro power capacity of 4.3GW. Inaddition,92305SolarPumpswere installedandRs.38,000croreworthof GreenEnergyCorridorisbeingsetuptoensureevacuationof renewableenergy.
8.84 In January 2016, Government hasamended the National Tariff Policy forelectricity.TheTariff Policyamendmenthasa focus on the environmental aspect withprovisions such as 1) Renewable PurchaseObligationinwhich8percentof electricityconsumption excluding hydro power shallcomefromsolarenergybyMarch2022;2)RenewableGenerationObligation inwhichnew coal/lignite based thermal plants afterspecified date to also establish/procure/purchaserenewablecapacity;3)bundlingofrenewable power with power from plantswhose Power Purchase Agreements haveexpiredorcompletedtheirusefullife;4)nointer-state transmission charges for solarand wind power; 5) procurement of 100per cent power produced from waste-to-energyplants;6)ancillaryservicestosupportgrid operation for expansion of renewableenergy,etc.
8.85 With India’s initiative, InternationalSolarAlliance(ISA)waslaunched,whichisenvisagedasacoalitionof solarresource-richcountriestoaddresstheirspecialenergyneedsand will provide a platform to collaborateon addressing the identified gaps througha common, agreed approach. 24 countrieshave signed the Framework Agreementof ISA after it was opened for signatureonNovember15,2016.ISA isexpectedtobecome inter-governmental treaty-basedorganization that will be registered underArticle 102 of the UN charter after 15countries ratify theAgreement. With legalframework in place, ISA will be a majorinternationalbodyheadquarteredinIndia.
8.86 Governmentof Indiahas establishedtheNational Adaptation Fund for ClimateChangetoassistStatesandUnionTerritoriesto undertake projects and actions foradaptationtoclimatechange.Rs.182.3crorehasbeenreleasedfor18projectsforsectorsincludingagricultureandanimalhusbandry,water resources, coastal areas, biodiversityandecosystemservices.
8.87 Indiaisalsooneof thefewcountriesin theworld to impose a taxon coal.Thiscoal cess which has been renamed as“Clean Environment Cess” in the UnionBudget 2016-17 funds the National CleanEnvironment Fund (NCEF). The CleanEnvironment Cess has been doubled inthe2016-17budgetfromRs.200pertonnetoRs.400per tonne.Theproceedsof theNCEF are being used to finance projectsunderGreenEnergyCorridorforboostingupthetransmissionsector,NamamiGange,Green India Mission, Jawaharlal NehruNationalSolarMission, installationof SPVlights and small capacity lights, installationof SPVwaterpumpingsystems,SPVPowerPlants and Grid Connected Rooftop SPVPowerPlants.

168 Economic Survey 2016-17
appendIx
A1. Summary of Balance of Payments (US $ billion) 2012-13 2013-14 2014-15 2015-16 2015-16 2016-17
(April-March) H1 H1Exports,f.o.b 306.6 318.6 316.5 266.4 135.6 134.0Imports,c.i.f 502.2 466.2 461.5 396.4 206.9 183.5Tradebalance -195.7 -147.6 -144.9 -130.1 -71.3 -49.5Servicesexports 145.7 151.8 158.1 154.3 77.0 80.1Servicesimports 80.8 78.7 81.6 84.6 41.4 48.0Netservices 64.9 73.1 76.5 69.7 35.6 32.0Income(net) -21.5 -23.0 -24.1 -24.4 -11.3 -14.1Pvt.transfers(net) 64.3 65.5 66.3 63.1 32.7 28.2Officialtransfers(net) -0.3 -0.2 -0.6 -0.5 -0.3 -0.4Invisibles(net) 107.5 115.2 118.1 107.9 56.7 45.7CurrentAccountBalance -88.2 -32.4 -26.9 -22.2 -14.7 -3.7CapitalAccount ExternalAssistance(net) 1.0 1.0 1.7 1.5 0.2 0.5CommercialBorrowings(net) 8.5 11.8 1.6 -4.5 -1.3 -4.6ForeignInvestment(net) 46.7 26.4 73.5 31.9 13.0 29.4FDI(net) 19.8 21.6 31.3 36.0 16.5 21.3Inflows 39.8 43.6 51.8 59.9 26.8 38.3Outflows 20.0 22.0 20.5 23.9 10.3 17.0Portfolio(net) 26.9 4.8 42.2 -4.1 -3.5 8.2FII(net) 27.6 5.0 40.9 -4.0 -3.8 7.9Non-ResidentDeposits(net) 14.8 38.9 14.1 16.1 10.1 3.5RupeeDebtService -0.1 -0.1 -0.1 -0.1 -0.1 -0.1Othercapitalflows(net) 21.0 -30.1 -2.5 -4.8 3.3 -9.5Short-TermCredits(net) 21.7 -5.0 -0.1 -1.6 -2.5 -0.5BankingCapital(net) 16.6 25.4 11.6 10.6 18.3 -6.8Errors&Omissions 2.7 -1.0 -1.0 -1.1 -1.5 -0.6Others(net) -19.9 -49.7 -13.0 -12.7 -11.0 -1.6TotalCapital/FinanceA/C(Net)
92.0 47.9 88.3 40.1 25.3 19.2
ReserveMovement(-increase)and(+decrease)
-3.8 -15.5 -61.4 -17.9 -10.6 -15.5
Tradebalance/GDP(percent) -10.7 -7.9 -7.1 -6.3 -7.1 -4.6InvisibleBalance/GDP(percent)
5.9 6.2 5.8 5.2 5.7 4.3
CurrentAccountBalance/GDP(percent)
-4.8 -1.7 -1.3 -1.1 -1.5 -0.3
NetCapitalFlows/GDP(percent)
5.0 2.6 4.3 1.9 2.5 1.8
Source: RBI

169Review of Economic Developments
A2. Area coverage under select Kharif crops as on 14th October 2016S.No Crops Area Sown
(in lakh hectares)% change over
last year
2016-17 2015-16 2015-16
1. Rice 391.24 381.09 2.66
2. Pulses 146.24 113.21 29.18
a. Arhar 52.81 37.66 40.24
b. Uradbean 35.68 28.51 25.15
c. Moongbean 34.11 25.63 33.08
3. Coarsecereals 190.50 185.83 2.52
a. Jowar 19.59 19.88 -1.48
b. Bajra 70.43 70.50 -0.10
c. Ragi 10.40 11.69 -11.01
d. Kharif Maize 84.43 77.91 8.37
4. Oilseeds 190.31 185.19 2.77
a. Groundnut 47.07 36.79 27.95
b. Soyabean 114.78 116.29 -1.29
c. Sunflower 1.69 1.50 12.41
5. Sugarcane 46.13 49.61 -7.01
6. Jute&Mesta 7.59 7.73 -1.86
7. Cotton 103.69 117.09 -11.44
Total 1075.71 1039.74 3.46
Source: Directorate of Economics & Statistics, Department of Agriculture, Cooperation & Farmers Welfare.

170 Economic Survey 2016-17
A3. Incentivizing Pulses Production: Summary of RecommendationsPolicy Timing
1. MSP and Procurement
a. Government procurement machinery should be on high gear toensuretheprocurementof 29Kharif pulsesatthisseason’sannouncedMSP
Immediate
b. To ensure effective procurement, a High Level CommitteecomprisingMinisters of Finance,Agriculture, andConsumerAffairsandPrincipalSecretarytoPMshouldbeconstituted.Thereshouldbeweeklyreportingbyprocurementagenciesonthegroundwithphysicalverificationof procurement
Immediate
c.Buildup2million tonsof pulses stockwith targets for individualpulses,especiallytur(3.5lakhtonnes)andurad(2lakhtonnes).Theseshouldbebuiltupgraduallybutopportunistically,buyingwhenpricesarelow.
Immediate
d. MSP to be increased to Rs. 70/kg in 2018 when short durationKharif turisreadyforcommercialization.EffortstobemadetogiveproductionsubsidiestofarmersforgrowingpulsesinirrigatedareasofaboutRs.10-15perkgtobegivenviaDBT.
Kharif 2018 but planning tobeginsoon
e.InstructCACPtocomprehensivelyreviewitsMSP-settingframeworktoincorporateriskandsocialexternalitiesalongthelinesdoneinthisreport
Immediate
2. Other Price Management Policies
a.Eliminate export ban on pulses and stock limits; at the very leastlimitsonwholesalers shouldbeeliminated.Thegreater the limitsonprocurementbythegovernment,thegreatertheurgencytotaketheseactionstoensurethatmarketpricesstabilizeabovetheMSP.Theworstcasescenarioforfarmersisweakprocurementandstocklimitswhichforcefarmerstosellmostof theiroutputatmarketpricesthatarewellbelowMSP.Moregenerally,theuseof tradepolicytocontroldomesticprices,whichinducespolicyvolatility,shouldbeavoided.
Immediate
b.EncouragestatestodelistpulsesfromtheirAPMCs Immediate
c. Review Essential Commodities Act, 1955 and futures trading ofagricultural commodities with a view to preserving objectives butfindingmoreeffectiveandlesscostlyinstrumentsforachievingthem
Asappropriate
3. Institutions for procurement-stocking-disposal
a. Create a new institution as a Public Private Partnership (PPP) tocompetewith and complement existing institutions to procure stockanddisposepulses.
Preparationtostartimmediatelywithaimof implementationbyrabi 2016. Cabinet note to bereadywithin4weeks.
b.Announceclearrulesfordisposalof stocks.
4. Minimizing Adverse Impacts
a. Encourage development of GM technologies. Grant expeditiousapprovaltoindigenouslydevelopednewvarietiesof pulses
Asappropriate

171Review of Economic Developments
A4. Minimum Support Prices (Crop Year) of Major Crops (Rs./Quintal)Commodity 2015-16 2016-17Kharif CropsPaddy(Common) 1410 1470Paddy(Grade‘A’) 1450 1510Jowar(Hybrid) 1570 1625Jowar(Maldandi) 1590 1650Bajra 1275 1330Ragi 1650 1725Maize 1325 1365Tur(Arhar) 4625^ 5050*Moong 4850^ 5225*Urad 4625^ 5000*Groundnut 4030 4220$SunflowerSeed 3800 3950$Soyabean(Yellow) 2600 2775$Sesamum 4700 5000#Nigerseed 3650 3825$Cotton(MediumStaple) 3800 3860Cotton(LongStaple) 4100 4160RabiCropsWheat 1525 1625Barley 1225 1325Gram 3425^^ 4000**Lentil(Masur) 3325^^ 3950##Rapeseed/Mustard 3350 3700**
Source: Commission for Agricultural Costs and Prices (CACP).Notes:Figuresinbracketsindicatepercentageincrease.^:IncludedBonusRs.200perquintal,*:IncludingBonusRs.425perquintal,$:IncludingBonusRs.100perquintal,#:IncludingBonusRs.200perquintal,^^:AdditionalbonusRs.75perquintal,**:Includingbonusof Rs.200perquintal,##:Includingbonusof Rs.100perquintal.