Embed Size (px)
Citation preview
JOINT LEGISLATIVE AUDIT AND REVIEW COMMISSIONOF THE VIRGINIA GENERAL ASSEMBLY
Review of Elementary andSecondary School Funding:
Interim Status Report
House Document No. 39
Members of theJoint Legislative Audit and Review Commission
ChairmanDelegate Vincent F. Callahan, Jr.
Vice-ChairmanSenator Kevin G. Miller
Senator Charles J. ColganDelegate M. Kirkland CoxDelegate V. Earl Dickinson
Senator J. Randy ForbesDelegate Frank D. Hargrove, Sr.
Delegate Dwight C. JonesSenator Thomas K. Norment, Jr.
Delegate Harry J. ParrishDelegate Lacey E. Putney
Delegate John A. Rollison IIIDelegate John H. Rust, Jr.Senator Walter A. Stosch
Mr. Walter J. Kucharski, Auditor of Public Accounts
DirectorPhilip A. Leone
COPYRIGHT 2000, COMMONWEALTH OF VIRGINIA
Preface
Philip A. LeoneDirector
January 22, 2001
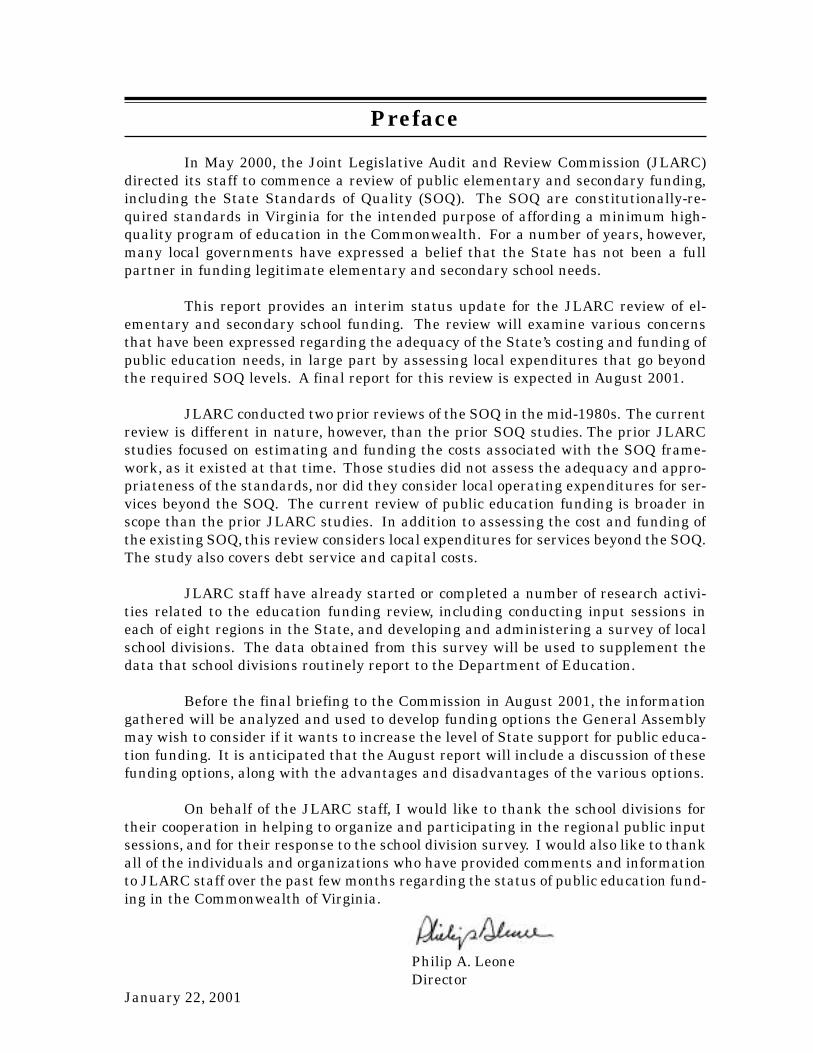
In May 2000, the Joint Legislative Audit and Review Commission (JLARC)directed its staff to commence a review of public elementary and secondary funding,including the State Standards of Quality (SOQ). The SOQ are constitutionally-re-quired standards in Virginia for the intended purpose of affording a minimum high-quality program of education in the Commonwealth. For a number of years, however,many local governments have expressed a belief that the State has not been a fullpartner in funding legitimate elementary and secondary school needs.
This report provides an interim status update for the JLARC review of el-ementary and secondary school funding. The review will examine various concernsthat have been expressed regarding the adequacy of the State’s costing and funding ofpublic education needs, in large part by assessing local expenditures that go beyondthe required SOQ levels. A final report for this review is expected in August 2001.
JLARC conducted two prior reviews of the SOQ in the mid-1980s. The currentreview is different in nature, however, than the prior SOQ studies. The prior JLARCstudies focused on estimating and funding the costs associated with the SOQ frame-work, as it existed at that time. Those studies did not assess the adequacy and appro-priateness of the standards, nor did they consider local operating expenditures for ser-vices beyond the SOQ. The current review of public education funding is broader inscope than the prior JLARC studies. In addition to assessing the cost and funding ofthe existing SOQ, this review considers local expenditures for services beyond the SOQ.The study also covers debt service and capital costs.
JLARC staff have already started or completed a number of research activi-ties related to the education funding review, including conducting input sessions ineach of eight regions in the State, and developing and administering a survey of localschool divisions. The data obtained from this survey will be used to supplement thedata that school divisions routinely report to the Department of Education.
Before the final briefing to the Commission in August 2001, the informationgathered will be analyzed and used to develop funding options the General Assemblymay wish to consider if it wants to increase the level of State support for public educa-tion funding. It is anticipated that the August report will include a discussion of thesefunding options, along with the advantages and disadvantages of the various options.
On behalf of the JLARC staff, I would like to thank the school divisions fortheir cooperation in helping to organize and participating in the regional public inputsessions, and for their response to the school division survey. I would also like to thankall of the individuals and organizations who have provided comments and informationto JLARC staff over the past few months regarding the status of public education fund-ing in the Commonwealth of Virginia.
Table of Contents
Page
BACKGROUND........................................................................................................... 1
STUDY ISSUES ........................................................................................................... 6
RESEARCH ACTIVITIES ....................................................................................... 10
APPENDIXES:Project Schedule ........................................................................................... A-1
JLARC Survey of Virginia School Divisions .......................................... B-1
Page 1 Review of Elementary and Secondary School Funding: Interim Status Report
Review of Elementary and SecondarySchool Funding: Interim Status Report
In May 2000, the Joint Legislative Audit and Review Commission (JLARC)directed staff to commence a review of funding for elementary and secondary educa-tion in Virginia’s public schools. Under Virginia’s Constitution, the General Assemblyhas responsibility for providing a system of free public elementary and secondary schools,seeking to ensure that an educational program of high quality is established and main-tained, and determining the manner in which funds are to be provided to meet stateStandards of Quality (SOQ), including apportioning the costs between the State andlocal governments. The General Assembly, therefore, has a clear reason for continualconcern as to the adequacy and appropriateness of public elementary and secondaryeducation funding.
The planned JLARC review will address the cost and funding of the State’sexisting standards. However, the focus of the review will be on local expenditures forservices that go beyond the SOQ. The study will examine the amounts that are spentabove current SOQ cost levels within several cost categories, and will examine thepurposes of those expenditures. While the greatest emphasis of the analytical workwill be on elementary and secondary school operating costs, debt service and capitalcosts will be included in the review, as well as an assessment of certain issues appli-cable to determining local shares of the funding responsibility (for example, local abil-ity to pay).
JLARC staff will brief the study findings in August 2001. The final report isexpected to include funding options that the General Assembly may wish to consider ifit wishes to increase the level of State support for public education funding. The reportwill also assess some of the advantages and disadvantages of these funding options.
The current report is an interim status report. It has three parts. First, itprovides some background information to explain the context for the review. Second,study issues are described. This part of the interim report states the broad conceptualissues, as well as the major categories of concern that were raised by school divisionand local government officials and other participants at eight regional input sessionsconducted by JLARC staff. Finally, a JLARC staff survey of school divisions, and otherresearch activities for the review that will be pursued during 2001, are discussed. SinceJLARC staff are currently engaged in the data collection process for the study, theinterim report does not include substantive findings.
BACKGROUND
Virginia’s Standards of Quality provide an important foundation for the State’srole in funding elementary and secondary education. The SOQ are minimum require-ments for school divisions in Virginia to provide a program of high quality for public
Page 2 Review of Elementary and Secondary School Funding: Interim Status Report
elementary and secondary education. Under the State constitution, the State Board ofEducation (BOE) prescribes these standards, subject to revision by the General As-sembly.
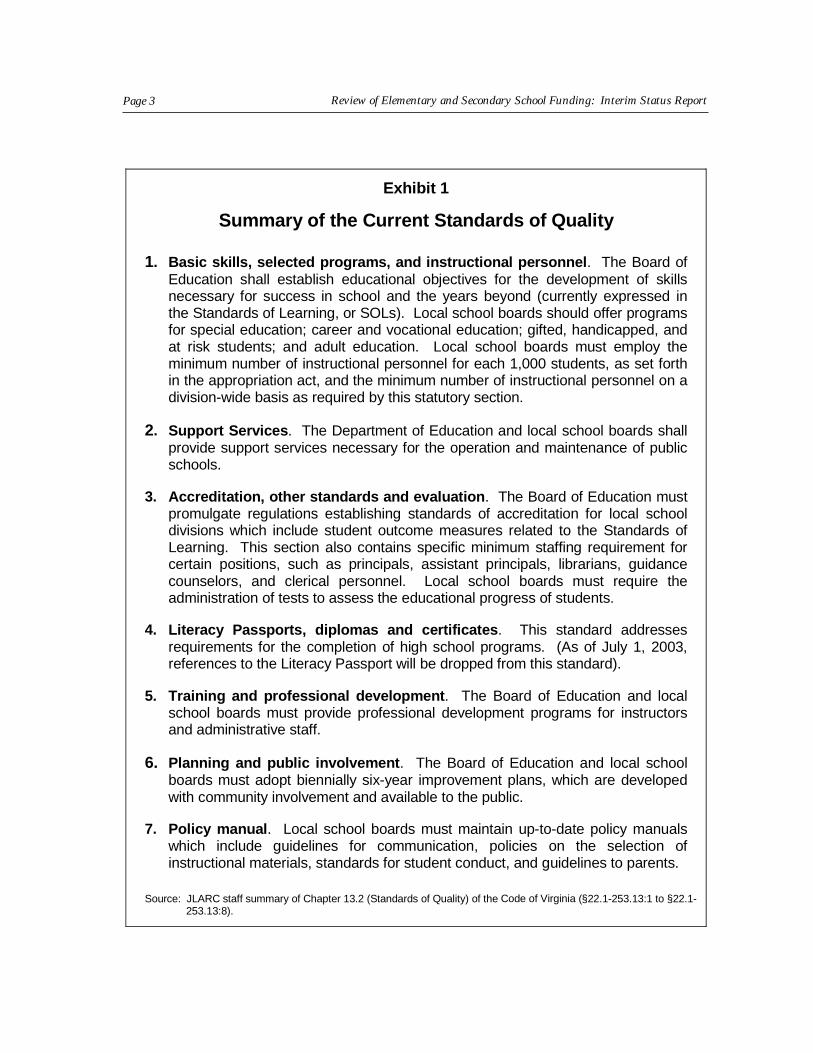
The current SOQ cover seven major areas. These areas are summarized inExhibit 1. A complete listing of all actual requirements which must be implemented inorder to fully comply with the SOQ needs to take into account: the Code of Virginia,the Bylaws and Regulations of the Board of Education, the Standards for AccreditingSchools adopted by the Board of Education, and the Appropriation Act.
The present SOQ provide a statutory basis for both the Standards of Learning(SOL) and the Standards of Accreditation (SOA). Standard 1 of the SOQ states:
The Board of Education shall establish educational objectives to imple-ment the development of the skills that are necessary for success inschool and for preparation for life in the years beyond. The currenteducational objectives [are] known as the Standards of Learning (Codeof Virginia, Title 22.1-253.13:1).
Standard 3 of the SOQ states: “The Board of Education shall promulgate regulationsestablishing standards for accreditation….“
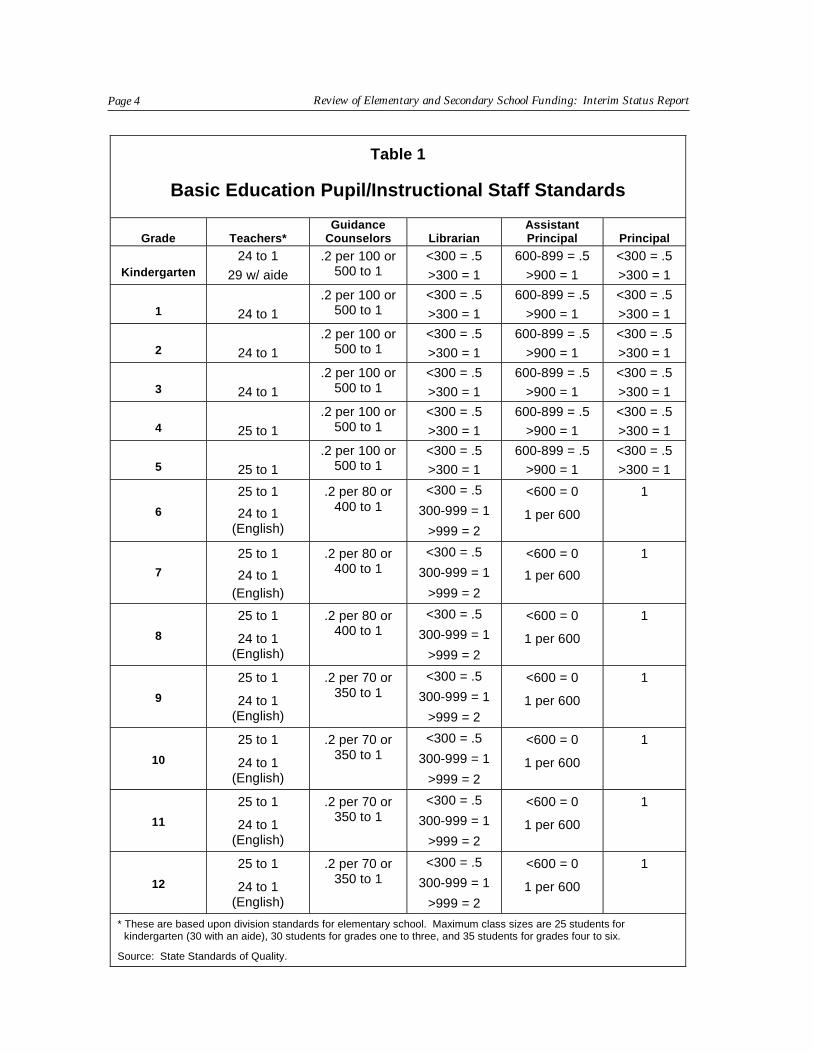
The SOQ include various quantified and non-quantified standards. Table 1provides an example of an area in which there are a number of quantified standards —instructional staff-to-pupil ratios at the classroom, school, and division level for basiceducation programs. In some areas, such as support services, the standards generallyare not quantified.
The General Assembly has responsibility for determining how the SOQ are tobe funded. While the State provides some funding to localities for elementary andsecondary education that is not pursuant to the SOQ, the bulk of State funding isprovided for SOQ purposes – that is, to help localities meet the costs of the standards.
In the mid-1980s, JLARC staff reviewed SOQ costs and funding. The findingsfrom these reviews were documented in two JLARC reports titled Funding the Stan-dards of Quality Part I: Assessing SOQ Costs and Funding the Standards of QualityPart II: SOQ Costs and Distribution. The reviews did not assess the adequacy andappropriateness of the standards, and did not cover capital and debt service costs. Thereviews did produce a number of changes to the SOQ cost methodology, and contrib-uted to the use of a local ability-to-pay factor in funding more of the SOQ cost accounts.The second report also identified some alternative measures of local ability to pay, butthese were not implemented.
The SOQ provide a minimum foundation program for Virginia’s school divi-sions, but do not eliminate differences in spending levels for elementary and secondary
Page 3 Review of Elementary and Secondary School Funding: Interim Status Report
Exhibit 1
Summary of the Current Standards of Quality
1. Basic skills, selected programs, and instructional personnel. The Board ofEducation shall establish educational objectives for the development of skillsnecessary for success in school and the years beyond (currently expressed inthe Standards of Learning, or SOLs). Local school boards should offer programsfor special education; career and vocational education; gifted, handicapped, andat risk students; and adult education. Local school boards must employ theminimum number of instructional personnel for each 1,000 students, as set forthin the appropriation act, and the minimum number of instructional personnel on adivision-wide basis as required by this statutory section.
2. Support Services. The Department of Education and local school boards shallprovide support services necessary for the operation and maintenance of publicschools.
3. Accreditation, other standards and evaluation. The Board of Education mustpromulgate regulations establishing standards of accreditation for local schooldivisions which include student outcome measures related to the Standards ofLearning. This section also contains specific minimum staffing requirement forcertain positions, such as principals, assistant principals, librarians, guidancecounselors, and clerical personnel. Local school boards must require theadministration of tests to assess the educational progress of students.
4. Literacy Passports, diplomas and certificates. This standard addressesrequirements for the completion of high school programs. (As of July 1, 2003,references to the Literacy Passport will be dropped from this standard).
5. Training and professional development. The Board of Education and localschool boards must provide professional development programs for instructorsand administrative staff.
6. Planning and public involvement. The Board of Education and local schoolboards must adopt biennially six-year improvement plans, which are developedwith community involvement and available to the public.
7. Policy manual. Local school boards must maintain up-to-date policy manualswhich include guidelines for communication, policies on the selection ofinstructional materials, standards for student conduct, and guidelines to parents.
Source: JLARC staff summary of Chapter 13.2 (Standards of Quality) of the Code of Virginia (§22.1-253.13:1 to §22.1-253.13:8).
Page 4 Review of Elementary and Secondary School Funding: Interim Status Report
Table 1
Basic Education Pupil/Instructional Staff Standards
Grade Teachers*Guidance
Counselors LibrarianAssistantPrincipal Principal
Kindergarten24 to 1
29 w/ aide
.2 per 100 or500 to 1
<300 = .5
>300 = 1
600-899 = .5
>900 = 1
<300 = .5
>300 = 1
1 24 to 1
.2 per 100 or500 to 1
<300 = .5
>300 = 1
600-899 = .5
>900 = 1
<300 = .5
>300 = 1
2 24 to 1
.2 per 100 or500 to 1
<300 = .5
>300 = 1
600-899 = .5
>900 = 1
<300 = .5
>300 = 1
3 24 to 1
.2 per 100 or500 to 1
<300 = .5
>300 = 1
600-899 = .5
>900 = 1
<300 = .5
>300 = 1
4 25 to 1
.2 per 100 or500 to 1
<300 = .5
>300 = 1
600-899 = .5
>900 = 1
<300 = .5
>300 = 1
5 25 to 1
.2 per 100 or500 to 1
<300 = .5
>300 = 1
600-899 = .5
>900 = 1
<300 = .5
>300 = 1
6
25 to 1
24 to 1(English)
.2 per 80 or400 to 1
<300 = .5
300-999 = 1
>999 = 2
<600 = 0
1 per 600
1
7
25 to 1
24 to 1(English)
.2 per 80 or400 to 1
<300 = .5
300-999 = 1
>999 = 2
<600 = 0
1 per 600
1
8
25 to 1
24 to 1(English)
.2 per 80 or400 to 1
<300 = .5
300-999 = 1
>999 = 2
<600 = 0
1 per 600
1
9
25 to 1
24 to 1(English)
.2 per 70 or350 to 1
<300 = .5
300-999 = 1
>999 = 2
<600 = 0
1 per 600
1
10
25 to 1
24 to 1(English)
.2 per 70 or350 to 1
<300 = .5
300-999 = 1
>999 = 2
<600 = 0
1 per 600
1
11
25 to 1
24 to 1(English)
.2 per 70 or350 to 1
<300 = .5
300-999 = 1
>999 = 2
<600 = 0
1 per 600
1
12
25 to 1
24 to 1(English)
.2 per 70 or350 to 1
<300 = .5
300-999 = 1
>999 = 2
<600 = 0
1 per 600
1
* These are based upon division standards for elementary school. Maximum class sizes are 25 students forkindergarten (30 with an aide), 30 students for grades one to three, and 35 students for grades four to six.
Source: State Standards of Quality.
Page 5 Review of Elementary and Secondary School Funding: Interim Status Report
education between localities. Local governments are free to spend as much or as littleabove the required foundation as they are willing and able to pay.
In the 1990s, the State’s approach to education funding was challenged ondisparity grounds. It was noted that expenditures for public education varied acrossthe school divisions. The State Supreme Court upheld the constitutionality of theState’s SOQ funding system in 1994, noting that the General Assembly had carried outits constitutional requirements, and that “nowhere does the Constitution require equal,or substantially equal, funding or programs among and within” the school divisions.
However, concerns have persisted about the adequacy of either the State’sstandards or the costs that are calculated to meet the standards. In part, concernsstem from the fact that many local governments make expenditures that go beyond theSOQ. Some local governments have expressed a view that the State has not been a fullpartner in funding legitimate elementary and secondary needs. These concerns arepart of the context for the JLARC review.
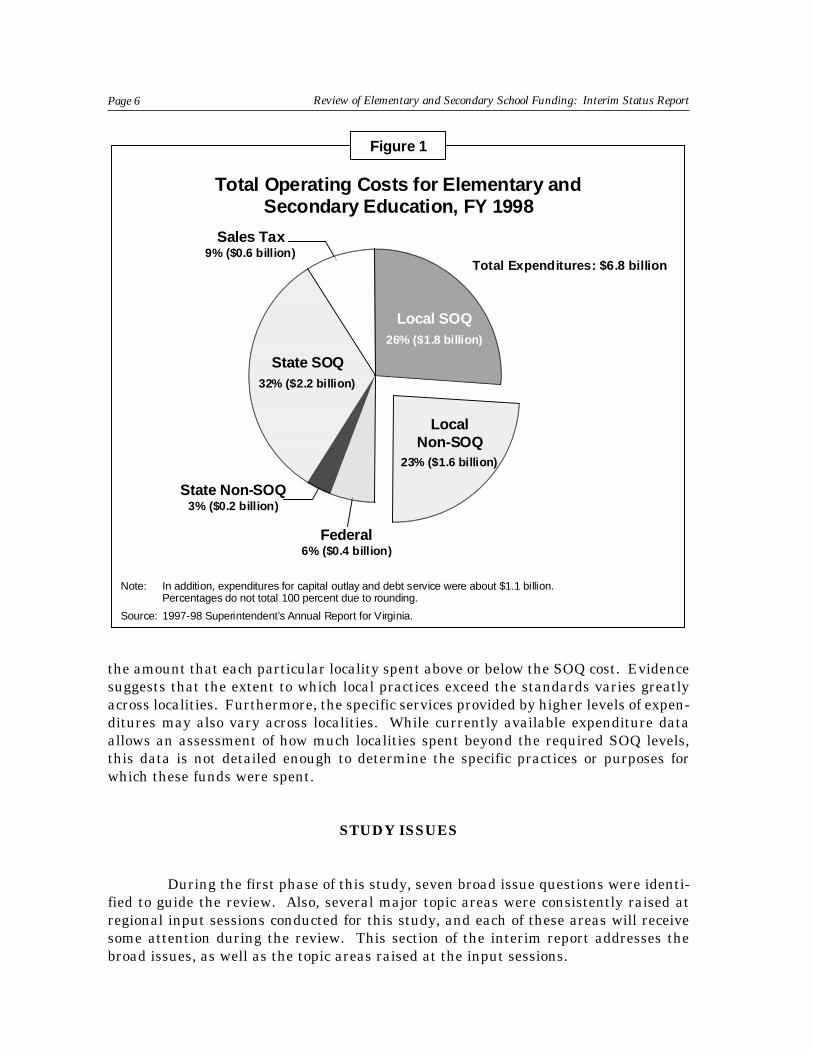
Education expenditure data from Fiscal Year (FY) 1998 reveals that in aggre-gate, localities did in fact spend significantly more than was required of them by theSOQ. In FY 1998, approximately $6.8 billion in total was spent for public elementaryand secondary school operating costs (see Figure 1). Of that total, approximately $4.6billion was attributed to the State and local shares of funding required by the SOQ($2.8 billion and $1.8 billion, respectively). The State provided an additional $237million for educational programs through various categorical and incentive based pro-grams, and the federal government provided Virginia schools approximately $400 mil-lion to support operations in FY 1998. The remaining $1.6 billion (almost one-quarterof operating costs) represents local operating expenditures that were beyond the re-quired local SOQ funding.
In addition to the operational costs of primary and secondary public educa-tion, the localities reported spending approximately $1.1 billion for capital outlay anddebt service in FY 1998. In that fiscal year, the State provided up to about $9 millionin direct aid (from the maintenance supplement account) for these two categories. TheState also provided loan assistance through the State Literary Fund and the VirginiaPublic School Authority. When total costs (operational costs plus capital outlay anddebt service) are considered, the proportion of the cost that is “local non-SOQ” is esti-mated to be 34 percent.
It should be noted that these data are for FY 1998. The school divisions andthe Department of Education are currently in the process of collecting expendituredata for FY 2000, and FY 2000 data will be used in the final report for this study.Further, since FY 1998, the State has enhanced its non-SOQ funding. For example,after FY 1998, the State began to fund a school construction grant program and pro-vided some Lottery Funds for capital purposes.
While the FY 1998 data indicates the extent in aggregate to which the expen-ditures of localities exceeded their required local shares for the SOQ, it does not reveal
Page 6 Review of Elementary and Secondary School Funding: Interim Status Report
the amount that each particular locality spent above or below the SOQ cost. Evidencesuggests that the extent to which local practices exceed the standards varies greatlyacross localities. Furthermore, the specific services provided by higher levels of expen-ditures may also vary across localities. While currently available expenditure dataallows an assessment of how much localities spent beyond the required SOQ levels,this data is not detailed enough to determine the specific practices or purposes forwhich these funds were spent.
STUDY ISSUES
During the first phase of this study, seven broad issue questions were identi-fied to guide the review. Also, several major topic areas were consistently raised atregional input sessions conducted for this study, and each of these areas will receivesome attention during the review. This section of the interim report addresses thebroad issues, as well as the topic areas raised at the input sessions.
Total Operating Costs for Elementary andSecondary Education, FY 1998
State Non-SOQ3% ($0.2 billion)
Federal6% ($0.4 billion)
Note: In addition, expenditures for capital outlay and debt service were about $1.1 billion.Percentages do not total 100 percent due to rounding.
Source: 1997-98 Superintendent’s Annual Report for Virginia.
Total Expenditures: $6.8 billion
Figure 1
LocalNon-SOQ
23% ($1.6 billion)
Sales Tax9% ($0.6 billion)
State SOQ32% ($2.2 billion)
Local SOQ26% ($1.8 billion)
Page 7 Review of Elementary and Secondary School Funding: Interim Status Report
Issue Questions for the Review
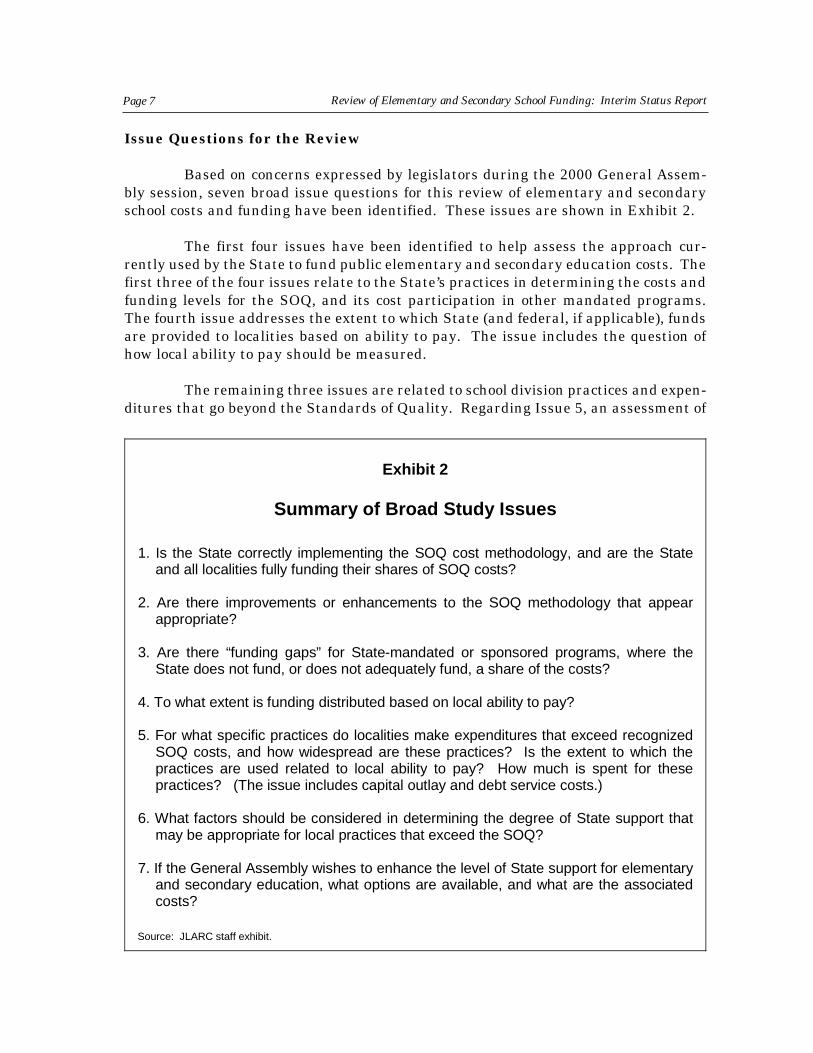
Based on concerns expressed by legislators during the 2000 General Assem-bly session, seven broad issue questions for this review of elementary and secondaryschool costs and funding have been identified. These issues are shown in Exhibit 2.
The first four issues have been identified to help assess the approach cur-rently used by the State to fund public elementary and secondary education costs. Thefirst three of the four issues relate to the State’s practices in determining the costs andfunding levels for the SOQ, and its cost participation in other mandated programs.The fourth issue addresses the extent to which State (and federal, if applicable), fundsare provided to localities based on ability to pay. The issue includes the question ofhow local ability to pay should be measured.
The remaining three issues are related to school division practices and expen-ditures that go beyond the Standards of Quality. Regarding Issue 5, an assessment of
Exhibit 2
Summary of Broad Study Issues
1. Is the State correctly implementing the SOQ cost methodology, and are the Stateand all localities fully funding their shares of SOQ costs?
2. Are there improvements or enhancements to the SOQ methodology that appearappropriate?
3. Are there “funding gaps” for State-mandated or sponsored programs, where theState does not fund, or does not adequately fund, a share of the costs?
4. To what extent is funding distributed based on local ability to pay?
5. For what specific practices do localities make expenditures that exceed recognizedSOQ costs, and how widespread are these practices? Is the extent to which thepractices are used related to local ability to pay? How much is spent for thesepractices? (The issue includes capital outlay and debt service costs.)
6. What factors should be considered in determining the degree of State support thatmay be appropriate for local practices that exceed the SOQ?
7. If the General Assembly wishes to enhance the level of State support for elementaryand secondary education, what options are available, and what are the associatedcosts?
Source: JLARC staff exhibit.
Page 8 Review of Elementary and Secondary School Funding: Interim Status Report
the specific practices employed by localities that go beyond the SOQ is a major focus ofthis review. Once the purposes for and extent of these expenditures have been identi-fied by each locality, the data will need to be examined to assess the extent to whichspecific practices are typical or prevailing either statewide or among similar localities.
In addition, to address Issue 6, the study will examine the factors that mightbe relevant to determining the degree of State support that may be appropriate forlocal practices that currently exceed the SOQ. Regarding Issue 7, enhancements toState support could potentially be made by raising the SOQ, with accompanying fund-ing, or by increasing non-SOQ funds. Options and associated costs will be developedfor General Assembly consideration. Potential advantages and disadvantages of dif-ferent approaches or options will be presented.
Topics of Concern Raised at Regional Input Sessions
In addition to the broad issue questions identified for the review, six majortopical areas of concern were consistently raised this summer at regional input ses-sions for the study conducted by JLARC staff. These sessions were held during Julyand August of 2000 in each of the eight superintendent’s regions in order to obtain localperspectives and to further define the study issues. The meetings took place in Marion,Roanoke, Charlottesville, Woodbridge, Virginia Beach, Henrico, Tappahannock, andSouth Hill. Participants in the regional input session process included school divisionsuperintendents, school division finance officers, local government officials, and oth-ers. The six major topical areas of concern that were raised at these sessions were:staffing, teacher salaries, special education costs, technology, debt service and capitalcosts, and local ability to pay.
The following descriptions of the topic discussions reflect the general consen-sus of the local participants at the input sessions. All of the points made were notexpressed by all participants. It is also important to note that this discussion reflectsparticipant views, not results or findings from this study.
Staffing. Regional input session participants strongly emphasized their be-lief that the staffing ratios upon which SOQ funding is based are not adequate. Par-ticipants stated that the pupil-teacher ratios upon which SOQ funding is based are notadequate, based on research that has shown student achievement gains with smallerclass sizes and in smaller schools. Participants also indicated that SOQ funding doesnot accurately reflect the use of resource teachers in elementary schools, such as art,music, and physical education teachers. At the secondary level, participants arguedthat SOQ funding does not adequately address the need for additional course offerings.Additional course offerings often translate into more teachers. Finally, participantsfelt that the SOQ does not accurately reflect the need for positions such as assistantprincipals, guidance counselors, reading specialists, safety officers, instructional aides,and school nurses.
Page 9 Review of Elementary and Secondary School Funding: Interim Status Report
Adequacy of Teacher Salaries. There was great concern that Virginia, alongwith the rest of the nation, appears to be facing a teacher shortage. This shortage maybe most prevalent in the areas of math, science, and special education. According tosession participants, the salary levels recognized in the SOQ are a major reason for theloss of both new and experienced teachers to other states, particularly North Carolinaand Maryland. Session participants also indicated that there is intense competitionamong the localities within Virginia to recruit and retain teachers, and that salary hasbecome the major factor that prospective teachers focus upon when making their em-ployment decisions. Participants made a variety of suggestions regarding teacher sal-ary. Some participants suggested that SOQ funding should be based on the nationalaverage teacher salary, while others suggested that the State should set either a re-quired minimum salary, or a statewide defined salary scale which localities could thenchoose to supplement. Finally, some participants suggested that the State providemore significant funding for scholarship or loan forgiveness programs for teachers thatstay in Virginia.
Special Education Funding. Session participants indicated a belief thatSOQ special education staffing ratios have not kept pace with new federal require-ments and decisions from the courts. According to participants, these new require-ments have forced school divisions to provide more intensive special education servicesthan are prescribed in the standards, thus increasing local expenditures, while Statefunding has remained more constant on a per-pupil basis. Participants emphasizedthat a few students with severe disabilities can increase local costs tremendously.However, the cost impact that such students have on a particular locality may not beadequately reflected in the State’s calculation of prevailing special education costs state-wide.
Adequacy of Technology Funding. Technology funding was another con-cern that was consistently voiced across the regions at the input sessions. Althoughsession participants were generally appreciative of the State funding that has beenprovided to school divisions for hardware and software purchases, two basic concernsremained. Participants expressed the view that State technology funding has not beenadequate or consistent enough to meet school divisions’ needs. In addition, partici-pants asserted that the State has not provided funding for technology personnel tooperate and maintain the equipment. Session participants indicated their belief thattechnology in the schools provides a significant educational tool, and indicated a desireto build technology funding into the SOQ funding calculation, including both equip-ment (hardware/software) and technology personnel costs.
Capital and Debt Service Costs. Concerns were raised at the input ses-sions about the increased strain on school facilities that is due to factors such as stu-dent population growth, class size reduction, and the pressure to offer additional courses.Participants at the input sessions indicated that the strain on facilities has resulted inthe increased use of trailers and portable classrooms. In addition to new constructionand renovation needs, participants indicated that facility maintenance is a significantunmet need, especially for localities with aging school buildings. The participants at
Page 10 Review of Elementary and Secondary School Funding: Interim Status Report
the regional input sessions were generally appreciative of the recent State funding forcapital and debt service costs. However, participants noted that the State funding wasa very small percentage of their total capital needs and debt service costs.
Local Ability to Pay, Particularly the Composite Index. Although theissue of local ability to pay was raised in all of the sessions, the level of satisfactionwith the composite index varied across the State and even within regions. Some ses-sion participants indicated satisfaction with the existing composite index. However,there were also significant criticisms of the ability-to-pay measure. For example, theuse of income in the index was criticized, because localities are not able to tax income.Some participants indicated that a measure used to determine local versus State sharesshould also reflect local tax effort, not just tax capacity.
Other Concerns. Participants at the regional input sessions also raised avariety of other concerns. Although these concerns were not reflected statewide, con-cern was expressed regarding alternative education costs, gifted education costs, costsrelated to the Standards of Learning such as remedial summer school, pupil transpor-tation costs including a shortage of bus drivers, staff development funding, utility coststhat are higher than the statewide prevailing average, and pre-school funding for at-risk four-year olds in Virginia.
RESEARCH ACTIVITIES
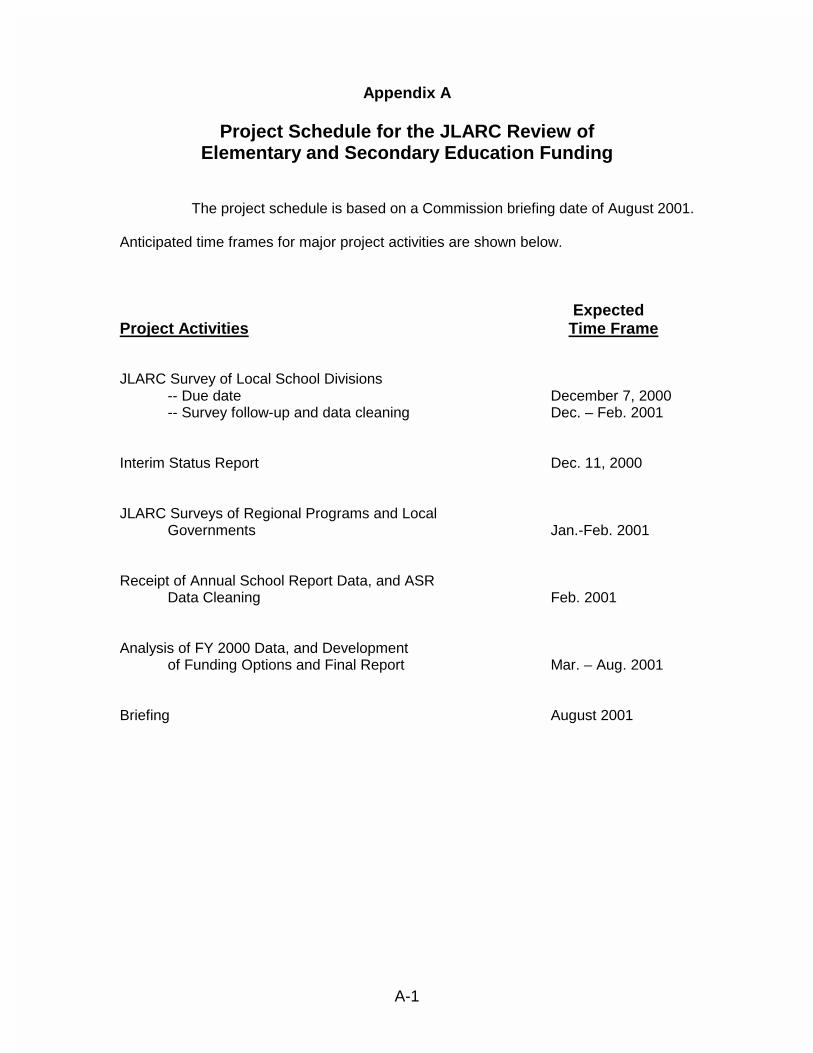
To fully assess the various issues identified for this study, JLARC staff willundertake several research activities in addition to the regional input sessions. Theseactivities include data collection tasks, and an assessment of the study issues and thedevelopment of funding options. The project schedule for completing these researchactivities is provided in Appendix A.
Overview of Key Data Collection Activities Including School Division Survey
There are four major sources of data which JLARC staff will use in assessingexpenditures for elementary and secondary education. One of these sources, the An-nual School Report, contains data that are collected from the school divisions by theDepartment of Education. The other three major sources of data will be collected byJLARC staff.
Annual School Report Data Collected by DOE. There are several sourcesof currently available public education data. One of these sources is the Annual SchoolReport (the ASR). Through the ASR, the school divisions provide certain financial andstatistical data. For example, the ASR contains data on expenditures from the schooldivision budgets broken down into a number of cost categories, and the number ofelementary and secondary FTE teachers. In addition, for 1999-2000, school divisionswere asked to complete a supplemental schedule on technology expenditures and per-
Page 11 Review of Elementary and Secondary School Funding: Interim Status Report
sonnel. The ASR data are collected by the Department of Education. It is anticipatedthat DOE will provide the 1999–2000 ASR data to JLARC staff in January 2001.
JLARC Staff Survey of School Divisions. While the Annual School Reportprovides a substantial amount of financial and statistical data, additional informationis required to address the study issue of local expenditures beyond the SOQ. To collectthe additional data that is needed, JLARC staff prepared an electronic survey of Vir-ginia school divisions. A copy of the survey instrument is provided in Appendix B.
The JLARC staff survey of local school divisions was released to the schooldivisions by e-mail on Monday, October 23, 2000. It has been posted on the JLARCwebsite. Prior to its release, the survey was provided to a number of school divisionsuperintendents and finance officers to obtain their comments, as a pre-test of theinstrument.
The survey consists of 15 sections, most of which pertain to the 1999 – 2000school year, because that is the most recent year for which ASR data will be availablewithin the timeframe of the review. School divisions were asked to provide their re-sponses to the survey by December 7, 2000, so that the data are returned before schoolsbegin closing for the holiday season. The questions on the JLARC staff survey collectdata from the school divisions that are not available from other sources, at least not atthe same level of detail or for the particular year in question.
Twelve of the fifteen sections of the survey (sections 1 – 11, and section 13)directly address the concerns raised at the regional input sessions, and serve to gatherdata that could not be obtained from other sources. In addition, three of the sections (5– 7) address related issues of school health personnel, medically fragile students, andstudents who receive special education. The remaining three sections of the survey(sections 12, 14, and 15) address miscellaneous issues and provide room for schooldivisions to submit additional comments.
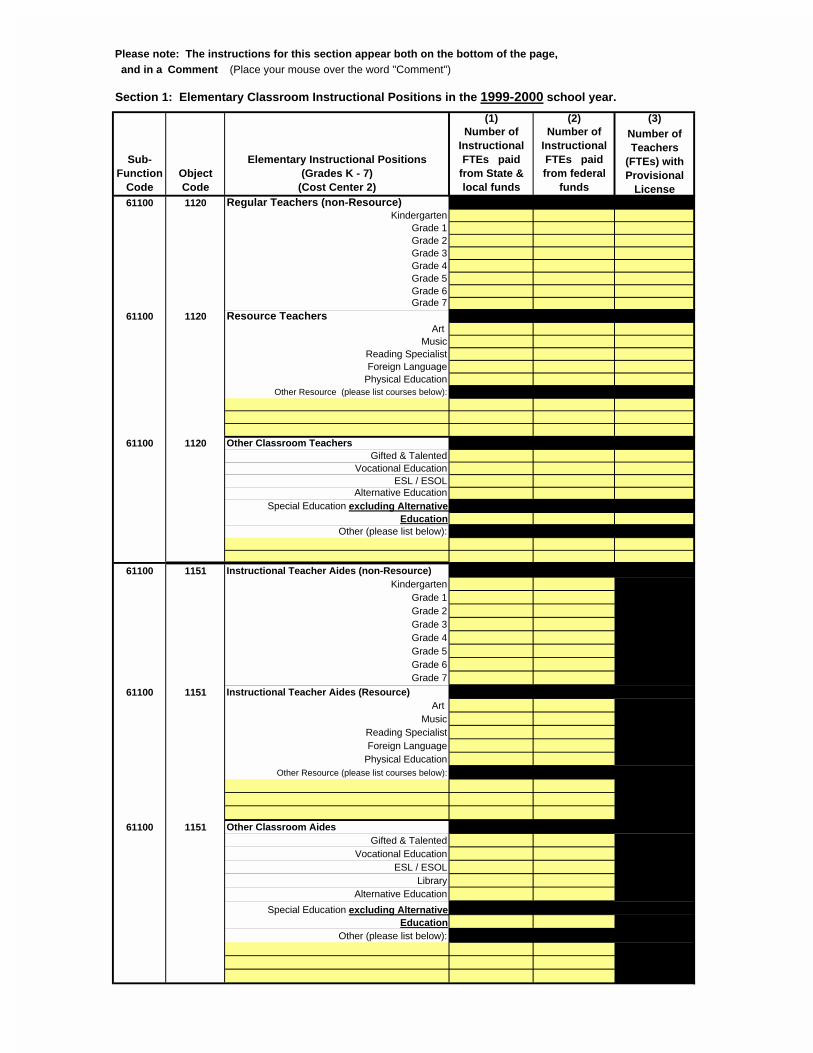
Specifically, sections 1 and 2 request elementary and secondary classroominstructional Full-time Equivalent (FTE) positions, respectively, broken down into somedetail. For example, at the elementary level, distinctions are made between “regular”teachers (to be reported by grade) and “resource” teachers (for example, art teachers,music teachers, and other subject matter specialists). These sections also request thatthe information provided on instructional FTE positions be broken out by State andlocally-funded FTE positions versus those positions that are federally funded. Infor-mation is also requested on the number of FTEs that have a provisional license. Themain purpose of this section is to help compare locality FTE-offered positions againstpositions recognized by the SOQ.
Section 3 requests data on the total number of alternative education place-ments and the associated FTE positions. For the purposes of this section, locally-provided alternative education includes: (1) arrangements for students who exhibitdangerous and/or disruptive behavior and thus no longer have access to the traditionalprogram, and (2) arrangements for students who experience academic difficulty in regu-
Page 12 Review of Elementary and Secondary School Funding: Interim Status Report
lar education (the latter excludes special and vocational education). The main issueaddressed in this section is instructional staffing, and the main purpose is to examinethe range in school division pupil-teacher ratios for each type of alternative education.The SOQ require that “educational alternatives” be provided, but do not provide anyquantified ratios for these positions. Divisions indicate that class sizes are lower thanfor regular classroom instruction.
Section 4 requests data on school resource officer FTEs and funding. For thepurposes of this section, school resource officers (SROs) are those personnel who haveas their only duty the promotion of safety and prevention of crime and truancy in theschools. Specifically, this section makes distinctions between: costs that are funded bythe school division budget; costs that are funded by the local government, but as partof a non-school budget; and costs that are funded by the State or federal government.The main purpose of this section is to gather data on instructional staffing and theassociated costs for SROs in response to reports from school divisions indicating thatcosts for these positions may not be captured in SOQ funding through the AnnualSchool Report. For example, some localities may pay for the positions outside of theschool budget.
Section 5 requests data on the use of consulting physicians, and the number ofschool health FTE positions and their salary. Specifically, this section requests infor-mation about physical and occupational therapists, speech-language pathologists,nurses, and other personnel. This section also asks school divisions to indicate whetherthese personnel are employed by the division or provided by the local government. Themain purpose of this section is to consider whether the various types of health person-nel that are used by divisions are recognized by the ASR and in the SOQ cost calcula-tions, and to compare locally-offered positions against those recognized by the SOQ.
Section 6 requests data on expenditures for assistive technology, as well asthe number of medically fragile (MF) students. Specifically, this section requests in-formation on the number of MF students who have an identified disability under fed-eral law, the number of MF students who require their own nurse, and those expendi-tures that are associated with medically fragile students. The main purpose of thissection is to gather data on those additional expenditures associated with medicallyfragile students, which may result in part from federal law, and that may not be recog-nized by the SOQ.
Section 7 requests data on expenditures for legal services, assistive technol-ogy, and contracted services for special education, as well as the number of FTE posi-tions that provide instruction to students who receive special education. The mainissue addressed in this section is special education instructional staffing and specialeducation-related expenditures. The main purpose of this section is to help comparelocality FTE-offered positions against positions recognized by the SOQ. School divi-sions indicate that there are costs associated with federal and state regulations thatmay not be recognized by the SOQ.
Page 13 Review of Elementary and Secondary School Funding: Interim Status Report
Section 8 asks whether various types of fringe benefits were extended to schooldivision personnel in the 1999 - 2000 school year. The main purpose of this section isto help examine the differences in local expenditure levels that may be due to differ-ences in fringe benefit practices.
Section 9 requests the average percent salary increase adopted for severalrecent school years, including the current school year. It also requests the effectivedate of pay increases. The main purpose of this section is to compare pay raise levelsadopted by school divisions with the percentage increases provided in the Appropria-tion Act. It is unclear whether the percentage increases offered by the State have keptpace with local pay raise practices. The issue will consider matters such as the timingof the pay increases as well.
Section 10 seeks data on the extent to which expenditures have been for vari-ous salary enhancements, such as signing bonuses, educational loan repayments onbehalf of teachers, performance-based incentive payments, “leadership compensation”,and “other enhancements”, such as compensation that is provided for school-relatedwork or activities that are performed outside of the regular work day. The main pur-pose of this section is to examine the magnitude of salary enhancements, including thepotential use of incentives to recruit and retain personnel.
Section 11 asks various questions about matters such as the number of recentvacancies, applicants for positions, areas of hiring difficulty, new and senior teachers,and substitute teacher and bus driver hiring situations. The main issue addressed inthis section is potential staffing shortages. The main purpose is to develop some indi-cators of the extent to which school divisions are experiencing difficulties in recruitingand retaining personnel.
Section 12 addresses miscellaneous areas of interest that could not be groupedwith the larger series of questions. The main issues addressed in this section includecapital outlay (number of trailers and new facilities in the 1999 – 2000 school year), theuse of pooled purchases to acquire support materials, bus replacement schedules, theuse of the middle school designation and the grades included, and repayment periodsfor loans. The main purpose of this section is to facilitate analyses of some specialfactors that may impact the costs reported on the Annual School Report or on otherdata sources.
Section 13 requests data on the scheduling of classes (use of block periods, thenumber of periods used), the number and type of secondary school class offerings in thedivision, and the five largest class sizes in the school division, broken out into somespecific categories. The main issue addressed in this section is instructional staffing,and the main purpose is to help assess SOQ class size standards, the upper bounds ofschool division class size practices, and the adequacy of State calculations in determin-ing SOQ-required positions.
Page 14 Review of Elementary and Secondary School Funding: Interim Status Report
Section 14 requests that school divisions identify areas in the ASR for whichthe directions may be unclear or for which data may be reported inconsistently. Themain purpose of this section is to alert JLARC staff to those possible ASR expenditureor statistical data components for which the data reported across school divisions maynot capture the same types of items due to definitional issues.
Finally, section 15 provides space for any comments that the school divisionmight have about the issues raised in the survey, or for additional information associ-ated with the questions asked in other sections of the survey. The main purpose of thissection is to provide school divisions an opportunity for open-ended responses to issuesraised by the survey.
JLARC Staff Survey of Regional Education Center or Programs, andLocal Governments. In addition to surveying local school divisions, JLARC staffplan to survey regional education programs, and local government budget offices. Re-gional education programs, which include special, alternative, and vocational educa-tion, as well as Governor’s schools, will receive a brief survey to collect data that is notavailable from the ASR. With regard to local governments, the input sessions for thisstudy revealed that some school-related costs — for example, school resource officers— may not be found in the school divisions’ budgets, but rather may be found in localgovernment budgets. A survey of local government budget offices will help ensure thatall local education costs are reflected in the JLARC study. This relatively short surveywill be administered to local governments in the December 2000 to end of January2001 timeframe.
Assessment of Study Issues and Development of Options
There will be four major components to the assessment of issues for this re-view. These components include: a review of current State education funding levels,both for the SOQ and for non-SOQ purposes; an assessment of locality expendituresthat go beyond the SOQ; an assessment of local share of funding issues, includingability to pay and local effort; and development of funding options and associated costsfor elementary and secondary education.
Review of Current State Funding Levels for SOQ and Non-SOQ Pur-poses. It is not possible to determine how much localities expend that goes beyond theSOQ without examining the magnitude of SOQ costs (by cost category) which are rec-ognized through State cost calculations and funding, and the required local shares forthe SOQ. To gain a full understanding of the current sharing of elementary and sec-ondary costs by the State and the localities, State funding for non-SOQ purposes alsoneeds to be considered in the analysis.
DOE staff have provided JLARC staff with the current funding model used byDOE to calculate SOQ costs. Access to the model will be helpful in achieving the studyobjectives. The SOQ funding model is largely executed in a database environment.Prior to 2000, the SOQ model ran on a DOS-based version of Oracle, a commonly used
Page 15 Review of Elementary and Secondary School Funding: Interim Status Report
database software package. However, during the summer of 2000, DOE upgraded theSOQ model to run in a Windows-based Oracle environment. In addition to the data-base portion of the SOQ model, DOE makes a number of SOQ cost calculations inoutside Excel spreadsheets.
JLARC staff are in the process of developing the capability to execute themodel and related spreadsheets, and therefore calculate SOQ costs, independently ofDOE. JLARC staff will review the assumptions and calculations of the SOQ model.JLARC staff will continue to carry out this review in the coming months to determinewhether significant modifications that could affect costs have been made to the SOQmethodology since the JLARC SOQ I and SOQ II reports. (After the release of thereports, legislative sessions ratified the JLARC cost methodology through its use inthe State budget process.) For example, cost components may have been dropped,added, or aggregated, which could affect SOQ cost calculations.
JLARC staff will also determine whether there are any technical / method-ological improvements or enhancements to the SOQ cost calculations that appear ap-propriate. For instance, if some school divisions experience costs that are higher thanthe prevailing costs for items that are beyond their control, an enhancement to theSOQ methodology to account for these higher costs may be justified.
JLARC staff will also review whether there are any funding gaps for State-mandated or sponsored programs where the State does not adequately fund a share ofthe costs. Funding gaps may have arisen if new requirements have been placed onlocal school divisions by the State or Federal government since the existing SOQ fund-ing methodology was developed. The assessment of potential funding gaps will includeboth SOQ and non-SOQ funds, since some State funds may have been provided outsidethe SOQ to support new requirements. In addition, JLARC staff will review how theState has implemented funding for various non-SOQ programs that receive State fund-ing. For example, some materials provided to JLARC staff during this first phase ofthe study indicate that some school divisions may not be able to access State preschoolfunds for the Virginia Preschool Initiative, which was initiated in 1994.
Assessment of Locality Expenditures Beyond the SOQ. As previouslyindicated, in FY 1998, localities spent an additional $1.6 billion beyond what was re-quired of them by the SOQ for elementary and secondary education costs. This amountwas $2.7 billion in FY 1998, if capital costs and debt service are included in the calcu-lation. The regional input sessions indicated that there are several cost categories thatmany school divisions may fund at levels beyond what is required by the SOQ. How-ever, by using the data collected for this study, it should be possible to better isolatethose expenditures by purpose, and examine patterns that relate to those expendi-tures. The extent to which localities exceed the required SOQ funding amount appearsto vary significantly.
In the coming months, JLARC staff will analyze the data to identify for whichspecific practices localities make substantial expenditures beyond the SOQ. In somecases, these may be practices that are funded in the SOQ, but not to the extent that
Page 16 Review of Elementary and Secondary School Funding: Interim Status Report
many localities fund them. For example, many localities have stated that they providelower pupil-teacher ratios than are required by the SOQ. In other cases, these may bepractices that are not included in the SOQ cost methodology at all.
Along with identifying specific practices, JLARC staff will determine how wide-spread these additional practices are. Some practices may prevail statewide, whereasothers may only prevail in a cluster of related localities. Since it appears that theextent to which local practices exceed the standards varies greatly across localities,JLARC staff will review whether spending on these additional practices is related tolocal ability to pay.
The JLARC staff assessment of local costs that exceed the SOQ will be largelybased on data from the 1999-2000 Annual School Report and data obtained throughthe JLARC surveys to local school divisions, regional centers, and local budget offices.JLARC staff will also make use of the results of several other surveys that have beenadministered to local school divisions within the past year or two.
The review of local practices exceeding the SOQ will result in an assessmentof which practices should be considered for additional State financial support. To makethis assessment, staff will need to understand why localities support educational prac-tices beyond the SOQ.
There may be a variety of reasons for why localities support additional prac-tices which exceed the SOQ. Some localities may make expenditures beyond the SOQcalculated costs due to circumstances beyond their control. For example, in the previ-ous SOQ reviews JLARC staff found that differences in per pupil transportation costswere often due to factors outside a locality’s control — the area of the locality (in squaremiles) and the number of pupils transported. JLARC staff recommended that the SOQcalculation for transportation costs be modified to include tiered pupil transportationprevailing costs based upon locality specific utilization. In the current review, JLARCstaff intend to analyze local expenditures exceeding the SOQ prevailing costs to deter-mine if there are other expenditure categories that are affected by specific circum-stances beyond local control. Several localities have suggested that special educationcosts may fall into this category of expenditures.
Some local expenditures made beyond the SOQ-calculated costs may be due tolocal aspiration. However, their related benefits may warrant State support. To deter-mine whether additional local practices warrant consideration for State support, JLARCstaff will examine whether there is evidence that these local practices do, indeed, leadto measurable benefits. This may be done through reviewing Virginia-specific researchand data, such as analyzing whether particular practices (for example, lower pupil-teacher ratios) appear to be associated with higher test scores. Also, JLARC staff willreview relevant research or analyses that have been conducted in other states or at thenational level. School division personnel may also be asked about the availability ofevidence, or for their observations, regarding the efficacy of certain practices.
Page 17 Review of Elementary and Secondary School Funding: Interim Status Report
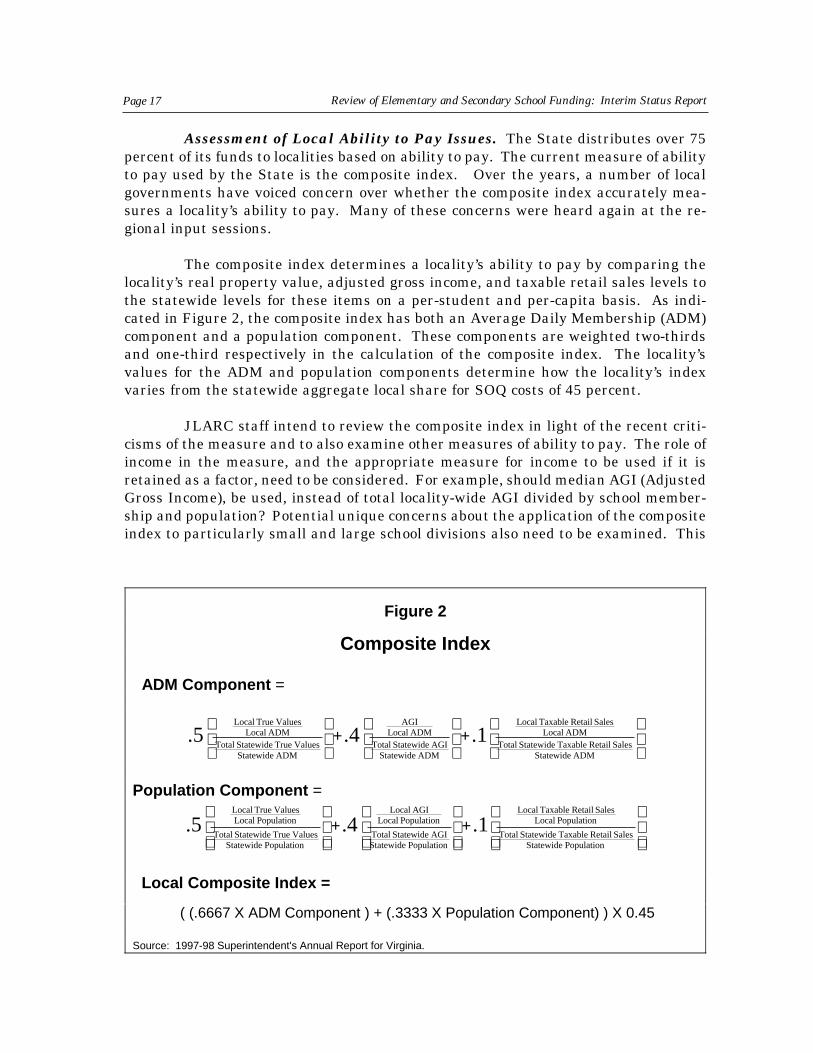
Assessment of Local Ability to Pay Issues. The State distributes over 75percent of its funds to localities based on ability to pay. The current measure of abilityto pay used by the State is the composite index. Over the years, a number of localgovernments have voiced concern over whether the composite index accurately mea-sures a locality’s ability to pay. Many of these concerns were heard again at the re-gional input sessions.
The composite index determines a locality’s ability to pay by comparing thelocality’s real property value, adjusted gross income, and taxable retail sales levels tothe statewide levels for these items on a per-student and per-capita basis. As indi-cated in Figure 2, the composite index has both an Average Daily Membership (ADM)component and a population component. These components are weighted two-thirdsand one-third respectively in the calculation of the composite index. The locality’svalues for the ADM and population components determine how the locality’s indexvaries from the statewide aggregate local share for SOQ costs of 45 percent.
JLARC staff intend to review the composite index in light of the recent criti-cisms of the measure and to also examine other measures of ability to pay. The role ofincome in the measure, and the appropriate measure for income to be used if it isretained as a factor, need to be considered. For example, should median AGI (AdjustedGross Income), be used, instead of total locality-wide AGI divided by school member-ship and population? Potential unique concerns about the application of the compositeindex to particularly small and large school divisions also need to be examined. This
Figure 2
Composite Index
ADM Component =
+
+
ADM StatewideSales Retail Taxable Statewide Total
ADM LocalSales Retail Taxable Local
ADM StatewideAGI Statewide Total
ADM LocalAGI
ADM StatewideValues True Statewide Total
ADM LocalValues True Local
.14.5.
Population Component =
+
+
Population StatewideSales Retail Taxable Statewide Total
Population LocalSales Retail Taxable Local
Population StatewideAGI Statewide Total
Population LocalAGI Local
Population StatewideValues True Statewide Total
Population LocalValues True Local
.1.45.
Local Composite Index =
( (.6667 X ADM Component ) + (.3333 X Population Component) ) X 0.45
Source: 1997-98 Superintendent's Annual Report for Virginia.
Page 18 Review of Elementary and Secondary School Funding: Interim Status Report
analysis will lead to an assessment of whether any modifications to the existing com-posite index are possible and appropriate, and whether any other measures of abilityto pay should be considered. As part of this assessment, staff will model the impact onlocal school divisions of any modifications to the composite index or new ability to paymeasures.
Development of Funding Options and Associated Costs for Elementaryand Secondary Education. The final component of the JLARC review of elementaryand secondary school funding will be the development of funding options for the Gen-eral Assembly’s consideration. After JLARC staff have identified potential enhance-ment to the existing SOQ cost methodology, and otherwise examined the expendituresmade for local practices beyond those required by the standards, staff will complete theanalysis with a discussion of possible options and associated costs for enhancing theState’s level of support for elementary and secondary education.
There will probably be numerous areas and a variety of ways available inwhich to adjust State educational funding. JLARC staff will seek to have the capacityto calculate these various funding options individually. However, the primary objec-tive will be to present a manageable set of initial funding options to the General As-sembly. Rather than an “a la carte” approach, a set of potential funding packageswould be created that seek to logically combine several of the potential adjustments.
To develop funding options, priority levels for the options will be determinedbased on a consistent framework. The prioritization framework will be based on thestrength of the evidence that exists for the necessity of the modification, the measuredor perceived benefit attributable to the practice, and the prevailing nature of the prac-tice. The framework is expected to result in tiered categories that reflect priority lev-els based on the criteria applied in the review.
Although it is too early in the study process to specify the option categories,there will probably be something comparable to a “high priority” category and two orthree tiers of lower priority options. The high priority category, or first tier of options,would likely include any SOQ costs that are not currently captured by the State’s fund-ing model, as well as technical modifications to the SOQ cost calculations to recognizeexpenditures above prevailing levels for reasons that are clearly beyond local control.The funding modifications in the high priority category will likely result in formalrecommendations in the final report.
The second and third tiers of options would include practices that are found toor thought to have educational benefit. Options in the second tier would probablyinclude practices for which a meaningful positive impact on student performance orlearning can be substantiated with data analysis or other research methods. For ex-ample, if a meaningful positive influence on student achievement can be isolated for aparticular practice (such as a lower pupil-teacher ratio), then such a practice wouldprobably be placed in the second tier. A third tier of options would likely includepractices that have a theoretical educational benefit or make sense intuitively, but the
Page 19 Review of Elementary and Secondary School Funding: Interim Status Report
benefit has not been strongly established by empirical results to this point. In additionto assessing the necessity of a modification and the educational benefit associated withthe practice, the extent to which a practice is prevailing across localities could affect itsprioritization.
The categories of options may not be as clear cut as the above discussion im-plies. If this is the case, the review may result in just two priority levels (“should do”versus “could do”), with multiple funding options in each level. At a minimum, therewill be an effort to rate potential enhancements through the application of designatedcriteria and to discuss the advantages and disadvantages of each of the funding op-tions.
The final report will also present the costs associated with each of the priori-tized items. Costs will be presented in terms of aggregate State and local costs, and atthe school division level. JLARC staff expect to present the options in a format thatclosely resembles the presentation of funding options in prior JLARC SOQ reports.Costs for the options will be calculated for all relevant school divisions that can benefitfrom a particular practice, whether or not the school divisions currently have suchpractices in place.

Page 20 Review of Elementary and Secondary School Funding: Interim Status Report
A-1
Appendix A
Project Schedule for the JLARC Review of Elementary and Secondary Education Funding
The project schedule is based on a Commission briefing date of August 2001.
Anticipated time frames for major project activities are shown below.
Expected Project Activities Time Frame
JLARC Survey of Local School Divisions
-- Due date December 7, 2000 -- Survey follow-up and data cleaning Dec. – Feb. 2001
Interim Status Report Dec. 11, 2000 JLARC Surveys of Regional Programs and Local
Governments Jan.-Feb. 2001
Receipt of Annual School Report Data, and ASR
Data Cleaning Feb. 2001 Analysis of FY 2000 Data, and Development
of Funding Options and Final Report Mar. – Aug. 2001 Briefing August 2001
Comment
Appendix B
The following survey has been developed to supplement the information you report to the Department of Education through the Annual School Report and various other data collection efforts. We believe that this additional information will enable us to address the issues that were identified through the public input sessions. Without this information, JLARC staff will not be able to isolate the cost implications of the specific practices undertaken that exceed the Standards of Quality, and we will have a less complete understanding of the factors that are impacting school division expenditures.
As you can see, the survey is presented in an electronic format, and we ask that you provide the requested data on this template, and e-mail it back to Ashley Colvin at [email protected]. We are requesting that you complete the survey and mail it back to us by no later than December 7, 2000. Please direct questions regarding the survey to Ashley Colvin at (804) 819-4592.
Thank you very much for your assistance in completing this survey. The information that you are providing will be an essential contribution to making this study a thorough and accurate review.
Some questions contain "comments" that provide definitions or other clarification. The comment"pops-up" when your mouse is placed over the comment ( which is indicated by a red triangle )
The survey consists of 15 sections. Sections 1 through 8 seek data from the 1999-2000 school year, sections 9 through 12 seek data from more than one school year, and section 13 seeks data from the 2000-2001 school year. Section 14 asks for your opinion on any areas on the Annual School Report that are unclear, and section 15 provides space for your comments on the issues raised in this survey. To ensure that each section is completed, on each sheet please scroll downward until you see End of Section . The instructions for each question are printed in each section, and also in a separate Microsoft Word 97 document that has been sent along with this survey. Both this survey and the separate instruction document are available for downloading at http://jlarc.state.va.us/edsurvey.htm
JLARC Survey of Virginia School Divisions
The Joint Legislative Audit and Review Commission (JLARC), the oversight commission of the Virginia General Assembly, has requested that its staff conduct a study of elementary and secondary school education funding. A central focus of this study is the expenditures that are made by localities that go beyond the Standards of Quality (the SOQ).
B-1
Please provide the following information
Name of Division:
Ashley ColvinJoint Legislative Audit and Review CommissionSuite 1100, General Assembly BuildingRichmond, Virginia 23219
I hereby certify that this is a true and correct report.
Signature of Division Superintendent Signature of Clerk of the Board
Typed Name Typed Name
Date Date
When the survey is complete, please have the Superintendent and the Clerk of the Board, or his or her designee, sign this form and mail a hard copy (of just this sheet) to:
Name, Phone Number, and Email Address of Contact for Follow-up Questions:
B-2
Please note: The instructions for this section appear both on the bottom of the page, and in a Comment (Place your mouse over the word "Comment")
Section 1: Elementary Classroom Instructional Positions in the 1999-2000 school year.
(1) (2) (3)
Sub-Function
CodeObject Code
Elementary Instructional Positions (Grades K - 7)
(Cost Center 2)
Number of Instructional FTEs paid
from State & local funds
Number of Instructional FTEs paid from federal
funds
Number of Teachers
(FTEs) with Provisional
License 61100 1120 Regular Teachers (non-Resource)
KindergartenGrade 1Grade 2Grade 3Grade 4Grade 5Grade 6Grade 7
61100 1120 Resource TeachersArt
MusicReading SpecialistForeign Language
Physical EducationOther Resource (please list courses below):
61100 1120 Other Classroom TeachersGifted & Talented
Vocational EducationESL / ESOL
Alternative Education
Other (please list below):
61100 1151 Instructional Teacher Aides (non-Resource)Kindergarten
Grade 1Grade 2Grade 3Grade 4Grade 5Grade 6Grade 7
61100 1151 Instructional Teacher Aides (Resource)Art
MusicReading SpecialistForeign Language
Physical EducationOther Resource (please list courses below):
61100 1151 Other Classroom AidesGifted & Talented
Vocational EducationESL / ESOL
LibraryAlternative Education
Other (please list below):
Special Education excluding Alternative Education
Special Education excluding Alternative Education
End of Section
Instructions: As in the Annual School Report (ASR), “Elementary” is defined as Grades K-7. Full-time Equivalencies (FTEs) should be reported to two decimal points. When reporting the total number of instructional positions in FTEs, please report the total number of FTE instructional positions that are funded by State and local funds in column (1), and the total number of federally-funded FTE instructional positions in column (2). Please ensure that the total FTEs reported on this page (the sum of columns 1 and 2) equals the FTEs reported in the ASR. If instructional positions have responsibilities that span multiple categories listed below, they should be prorated between the relevant categories.
For Special Education include all teachers whose primary responsibility is to teach students with disabilities -- but exclude teachers who provide alternative education (which should be reported on the line for alternative education).
Please ensure that every cell is filled-in (if the question is not applicable, please enter a zero). For the "other" categories, if additional space is needed please attach a supplemental spreadsheet with all data elements provided. NOTE: Instructional Teacher Aides includes Instructional Assistants.
Please note: The instructions for this section appear both on the bottom of the page, and in a Comment (Place your mouse over the word "Comment")
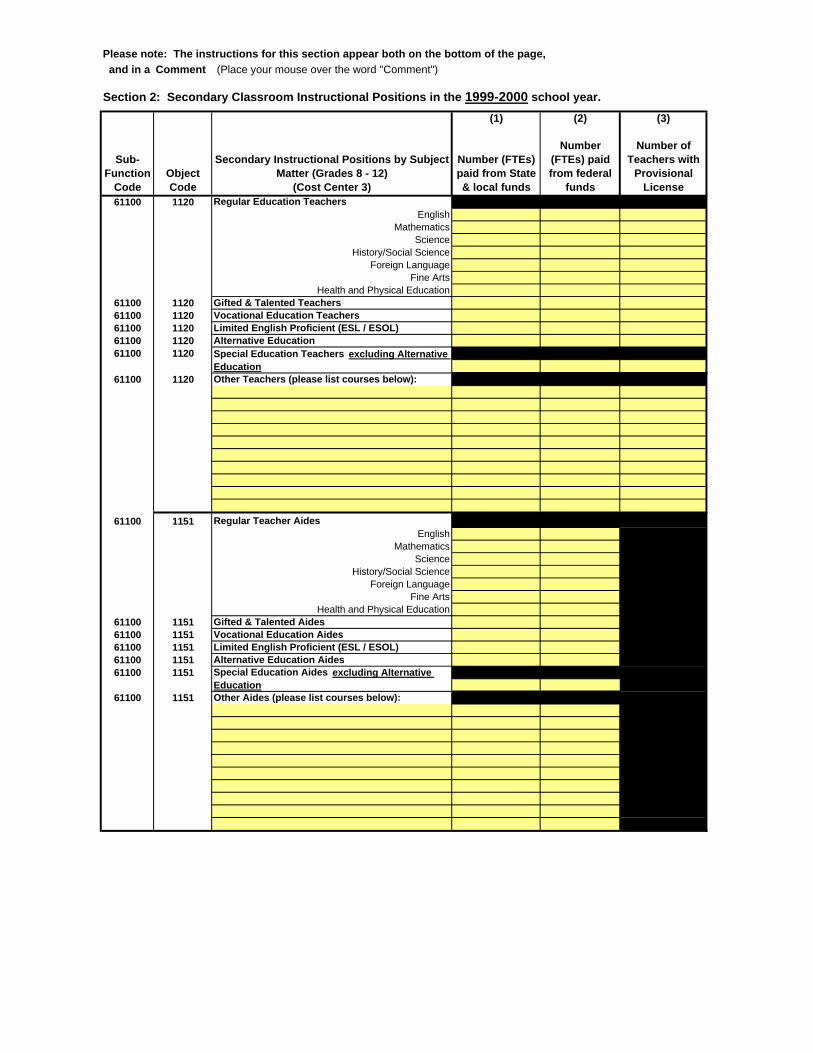
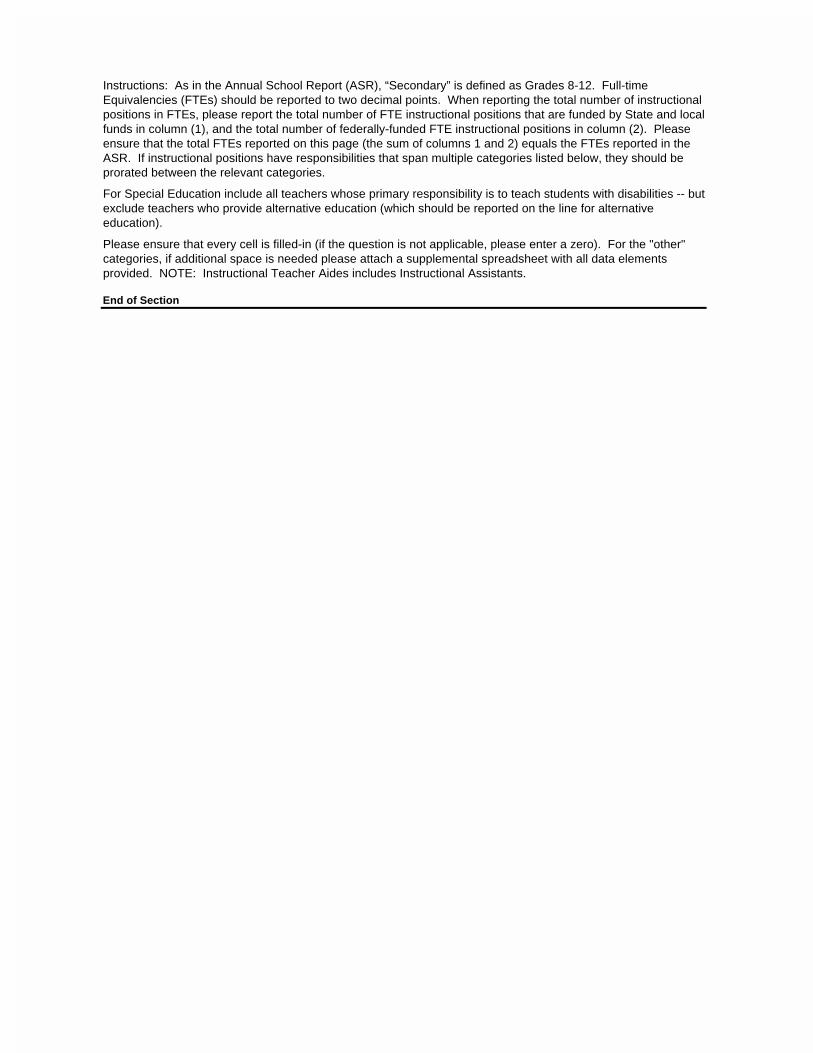
Section 2: Secondary Classroom Instructional Positions in the 1999-2000 school year.
(1) (2) (3)
Sub-Function
CodeObject Code
Secondary Instructional Positions by Subject Matter (Grades 8 - 12)
(Cost Center 3)
Number (FTEs) paid from State & local funds
Number (FTEs) paid from federal
funds
Number of Teachers with
Provisional License
61100 1120 Regular Education TeachersEnglish
MathematicsScience
History/Social ScienceForeign Language
Fine ArtsHealth and Physical Education
61100 1120 Gifted & Talented Teachers61100 1120 Vocational Education Teachers61100 1120 Limited English Proficient (ESL / ESOL)61100 1120 Alternative Education61100 1120
61100 1120 Other Teachers (please list courses below):
61100 1151 Regular Teacher AidesEnglish
MathematicsScience
History/Social ScienceForeign Language
Fine ArtsHealth and Physical Education
61100 1151 Gifted & Talented Aides61100 1151 Vocational Education Aides61100 1151 Limited English Proficient (ESL / ESOL)61100 1151 Alternative Education Aides61100 1151
61100 1151 Other Aides (please list courses below):
Special Education Teachers excluding Alternative Education
Special Education Aides excluding Alternative Education
End of Section
Instructions: As in the Annual School Report (ASR), “Secondary” is defined as Grades 8-12. Full-time Equivalencies (FTEs) should be reported to two decimal points. When reporting the total number of instructional positions in FTEs, please report the total number of FTE instructional positions that are funded by State and local funds in column (1), and the total number of federally-funded FTE instructional positions in column (2). Please ensure that the total FTEs reported on this page (the sum of columns 1 and 2) equals the FTEs reported in the ASR. If instructional positions have responsibilities that span multiple categories listed below, they should be prorated between the relevant categories.
For Special Education include all teachers whose primary responsibility is to teach students with disabilities -- but exclude teachers who provide alternative education (which should be reported on the line for alternative education).
Please ensure that every cell is filled-in (if the question is not applicable, please enter a zero). For the "other" categories, if additional space is needed please attach a supplemental spreadsheet with all data elements provided. NOTE: Instructional Teacher Aides includes Instructional Assistants.
This question distinguishes between two kinds of local alternative education programs:
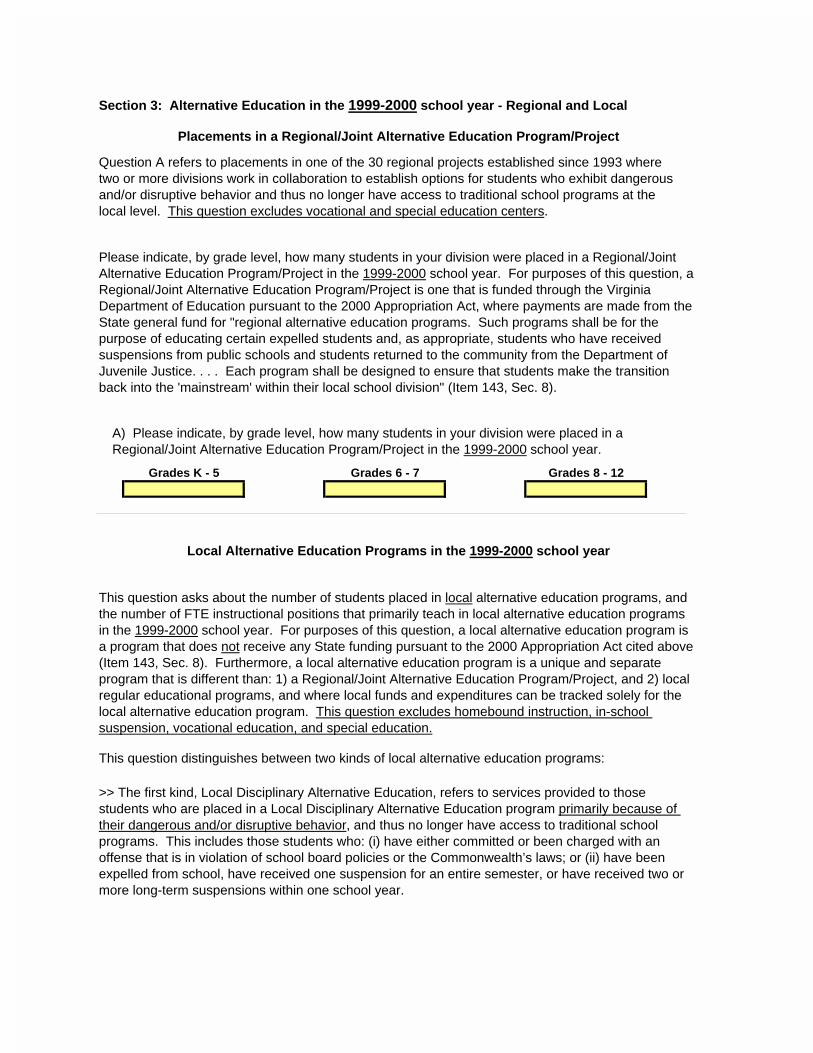
Section 3: Alternative Education in the 1999-2000 school year - Regional and Local
Grades K - 5 Grades 6 - 7 Grades 8 - 12
Placements in a Regional/Joint Alternative Education Program/Project
A) Please indicate, by grade level, how many students in your division were placed in a Regional/Joint Alternative Education Program/Project in the 1999-2000 school year.
Question A refers to placements in one of the 30 regional projects established since 1993 where two or more divisions work in collaboration to establish options for students who exhibit dangerous and/or disruptive behavior and thus no longer have access to traditional school programs at the local level. This question excludes vocational and special education centers.
Please indicate, by grade level, how many students in your division were placed in a Regional/Joint Alternative Education Program/Project in the 1999-2000 school year. For purposes of this question, a Regional/Joint Alternative Education Program/Project is one that is funded through the Virginia Department of Education pursuant to the 2000 Appropriation Act, where payments are made from the State general fund for "regional alternative education programs. Such programs shall be for the purpose of educating certain expelled students and, as appropriate, students who have received suspensions from public schools and students returned to the community from the Department of Juvenile Justice. . . . Each program shall be designed to ensure that students make the transition back into the 'mainstream' within their local school division" (Item 143, Sec. 8).
Local Alternative Education Programs in the 1999-2000 school year
This question asks about the number of students placed in local alternative education programs, and the number of FTE instructional positions that primarily teach in local alternative education programs in the 1999-2000 school year. For purposes of this question, a local alternative education program is a program that does not receive any State funding pursuant to the 2000 Appropriation Act cited above (Item 143, Sec. 8). Furthermore, a local alternative education program is a unique and separate program that is different than: 1) a Regional/Joint Alternative Education Program/Project, and 2) local regular educational programs, and where local funds and expenditures can be tracked solely for the local alternative education program. This question excludes homebound instruction, in-school suspension, vocational education, and special education.
>> The first kind, Local Disciplinary Alternative Education, refers to services provided to those students who are placed in a Local Disciplinary Alternative Education program primarily because of their dangerous and/or disruptive behavior, and thus no longer have access to traditional school programs. This includes those students who: (i) have either committed or been charged with an offense that is in violation of school board policies or the Commonwealth’s laws; or (ii) have been expelled from school, have received one suspension for an entire semester, or have received two or more long-term suspensions within one school year.
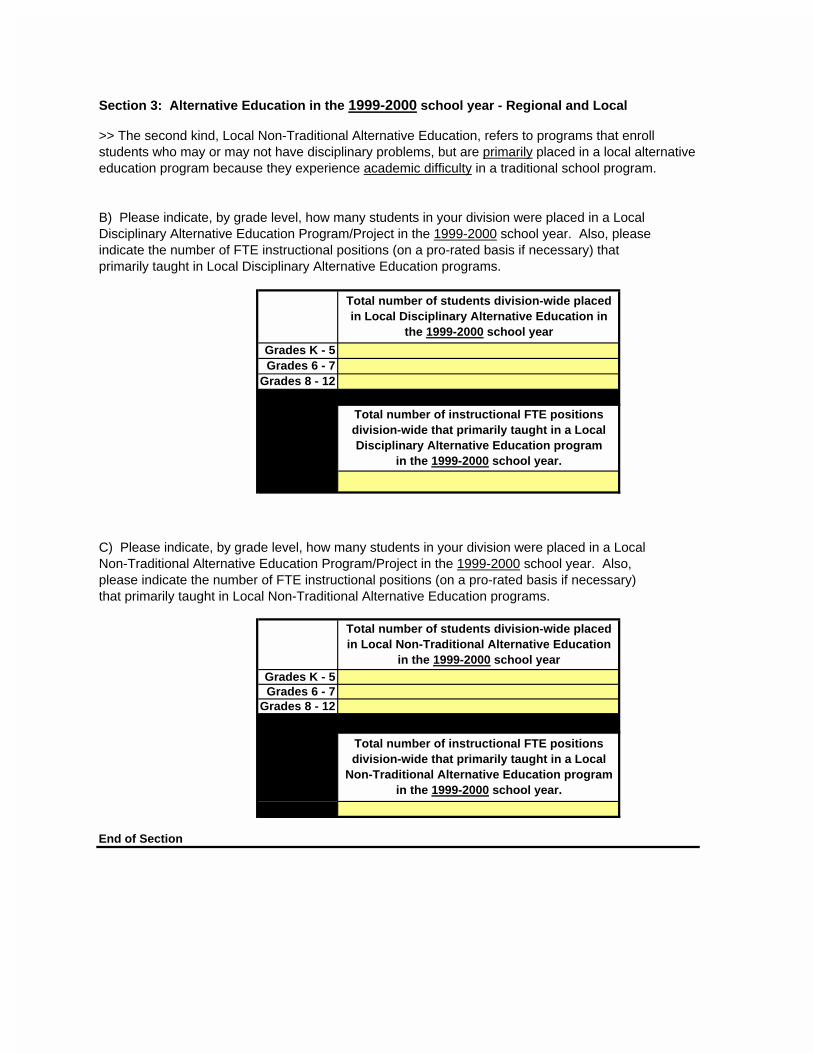
Section 3: Alternative Education in the 1999-2000 school year - Regional and Local
End of Section
>> The second kind, Local Non-Traditional Alternative Education, refers to programs that enroll students who may or may not have disciplinary problems, but are primarily placed in a local alternative education program because they experience academic difficulty in a traditional school program.
Total number of students division-wide placed in Local Non-Traditional Alternative Education
in the 1999-2000 school year
Grades K - 5
B) Please indicate, by grade level, how many students in your division were placed in a Local Disciplinary Alternative Education Program/Project in the 1999-2000 school year. Also, please indicate the number of FTE instructional positions (on a pro-rated basis if necessary) that primarily taught in Local Disciplinary Alternative Education programs.
Total number of students division-wide placed in Local Disciplinary Alternative Education in
the 1999-2000 school year
Grades K - 5
Total number of instructional FTE positions division-wide that primarily taught in a Local Disciplinary Alternative Education program
in the 1999-2000 school year.
C) Please indicate, by grade level, how many students in your division were placed in a Local Non-Traditional Alternative Education Program/Project in the 1999-2000 school year. Also, please indicate the number of FTE instructional positions (on a pro-rated basis if necessary) that primarily taught in Local Non-Traditional Alternative Education programs.
Grades 8 - 12Grades 6 - 7
Grades 6 - 7Grades 8 - 12
Total number of instructional FTE positions division-wide that primarily taught in a Local
Non-Traditional Alternative Education program in the 1999-2000 school year.
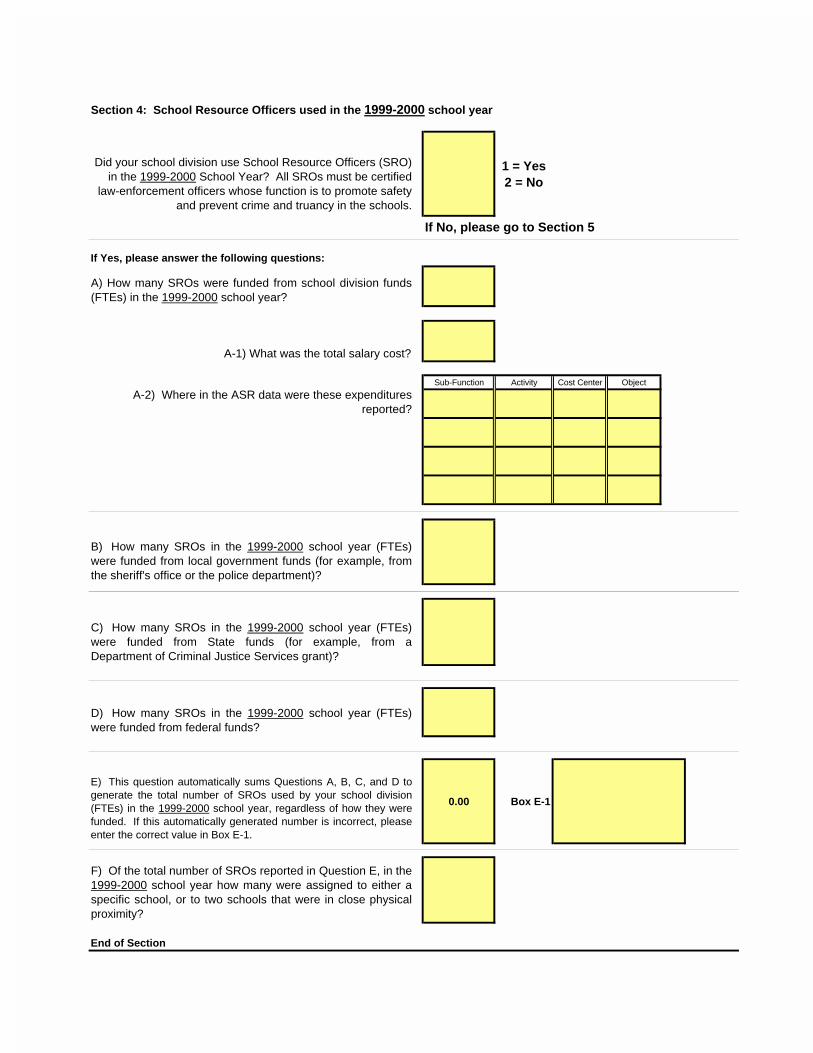
Did your school division use School Resource Officers (SRO) in the 1999-2000 School Year? All SROs must be certified
law-enforcement officers whose function is to promote safety and prevent crime and truancy in the schools.
1 = Yes 2 = No
If Yes, please answer the following questions:
A) How many SROs were funded from school division funds(FTEs) in the 1999-2000 school year?
A-1) What was the total salary cost?
Sub-Function Activity Cost Center Object
A-2) Where in the ASR data were these expenditures reported?
B) How many SROs in the 1999-2000 school year (FTEs)were funded from local government funds (for example, fromthe sheriff's office or the police department)?
C) How many SROs in the 1999-2000 school year (FTEs)were funded from State funds (for example, from aDepartment of Criminal Justice Services grant)?
D) How many SROs in the 1999-2000 school year (FTEs)were funded from federal funds?
E) This question automatically sums Questions A, B, C, and D togenerate the total number of SROs used by your school division(FTEs) in the 1999-2000 school year, regardless of how they werefunded. If this automatically generated number is incorrect, pleaseenter the correct value in Box E-1.
0.00 Box E-1
F) Of the total number of SROs reported in Question E, in the1999-2000 school year how many were assigned to either aspecific school, or to two schools that were in close physicalproximity?
End of Section
If No, please go to Section 5
Section 4: School Resource Officers used in the 1999-2000 school year
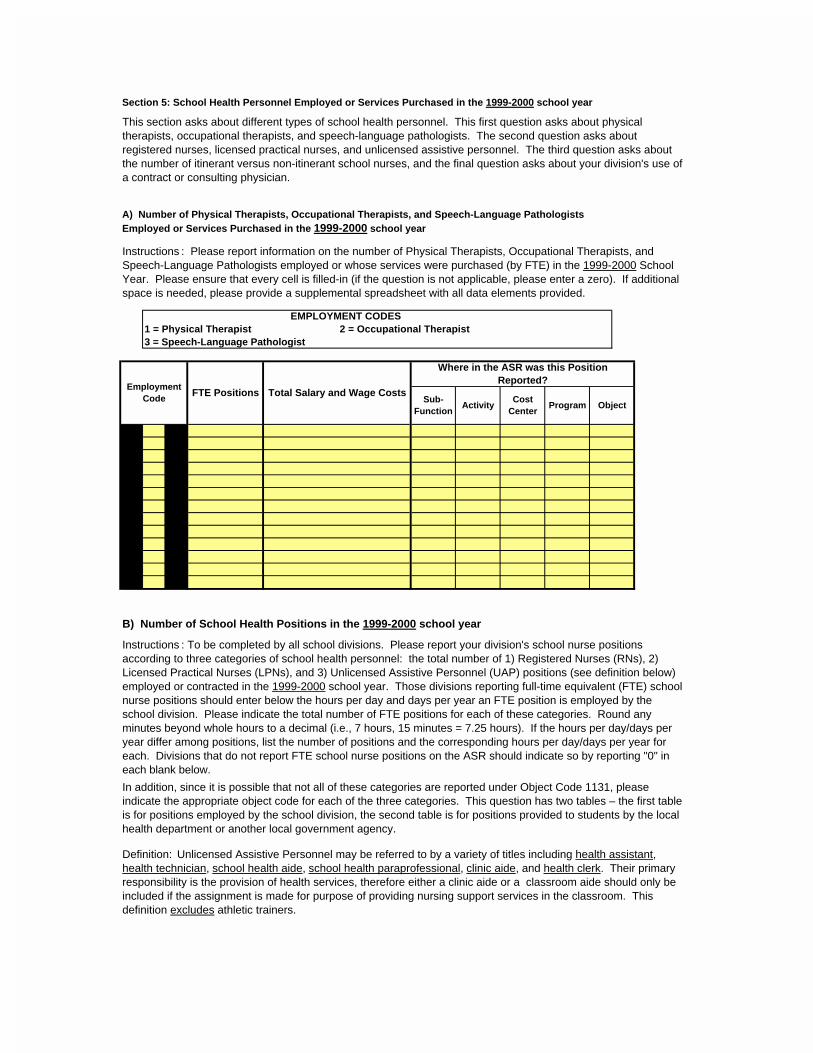
B) Number of School Health Positions in the 1999-2000 school year
In addition, since it is possible that not all of these categories are reported under Object Code 1131, please indicate the appropriate object code for each of the three categories. This question has two tables – the first table is for positions employed by the school division, the second table is for positions provided to students by the local health department or another local government agency.
Definition: Unlicensed Assistive Personnel may be referred to by a variety of titles including health assistant, health technician, school health aide, school health paraprofessional, clinic aide, and health clerk. Their primary responsibility is the provision of health services, therefore either a clinic aide or a classroom aide should only be included if the assignment is made for purpose of providing nursing support services in the classroom. This definition excludes athletic trainers.
Instructions : Please report information on the number of Physical Therapists, Occupational Therapists, and Speech-Language Pathologists employed or whose services were purchased (by FTE) in the 1999-2000 School Year. Please ensure that every cell is filled-in (if the question is not applicable, please enter a zero). If additional space is needed, please provide a supplemental spreadsheet with all data elements provided.
This section asks about different types of school health personnel. This first question asks about physical therapists, occupational therapists, and speech-language pathologists. The second question asks about registered nurses, licensed practical nurses, and unlicensed assistive personnel. The third question asks about the number of itinerant versus non-itinerant school nurses, and the final question asks about your division's use of a contract or consulting physician.
Instructions : To be completed by all school divisions. Please report your division's school nurse positions according to three categories of school health personnel: the total number of 1) Registered Nurses (RNs), 2) Licensed Practical Nurses (LPNs), and 3) Unlicensed Assistive Personnel (UAP) positions (see definition below) employed or contracted in the 1999-2000 school year. Those divisions reporting full-time equivalent (FTE) school nurse positions should enter below the hours per day and days per year an FTE position is employed by the school division. Please indicate the total number of FTE positions for each of these categories. Round any minutes beyond whole hours to a decimal (i.e., 7 hours, 15 minutes = 7.25 hours). If the hours per day/days per year differ among positions, list the number of positions and the corresponding hours per day/days per year for each. Divisions that do not report FTE school nurse positions on the ASR should indicate so by reporting "0" in each blank below.
Sub-Function
A) Number of Physical Therapists, Occupational Therapists, and Speech-Language Pathologists Employed or Services Purchased in the 1999-2000 school year
EMPLOYMENT CODES 1 = Physical Therapist 2 = Occupational Therapist 3 = Speech-Language Pathologist
Employment Code
FTE Positions Total Salary and Wage Costs
Where in the ASR was this Position Reported?
Program ObjectActivityCost
Center
Section 5: School Health Personnel Employed or Services Purchased in the 1999-2000 school year
Section 5: School Health Personnel Employed or Services Purchased in the 1999-2000 school year
Under what Object Code
was this reported on the
ASR?
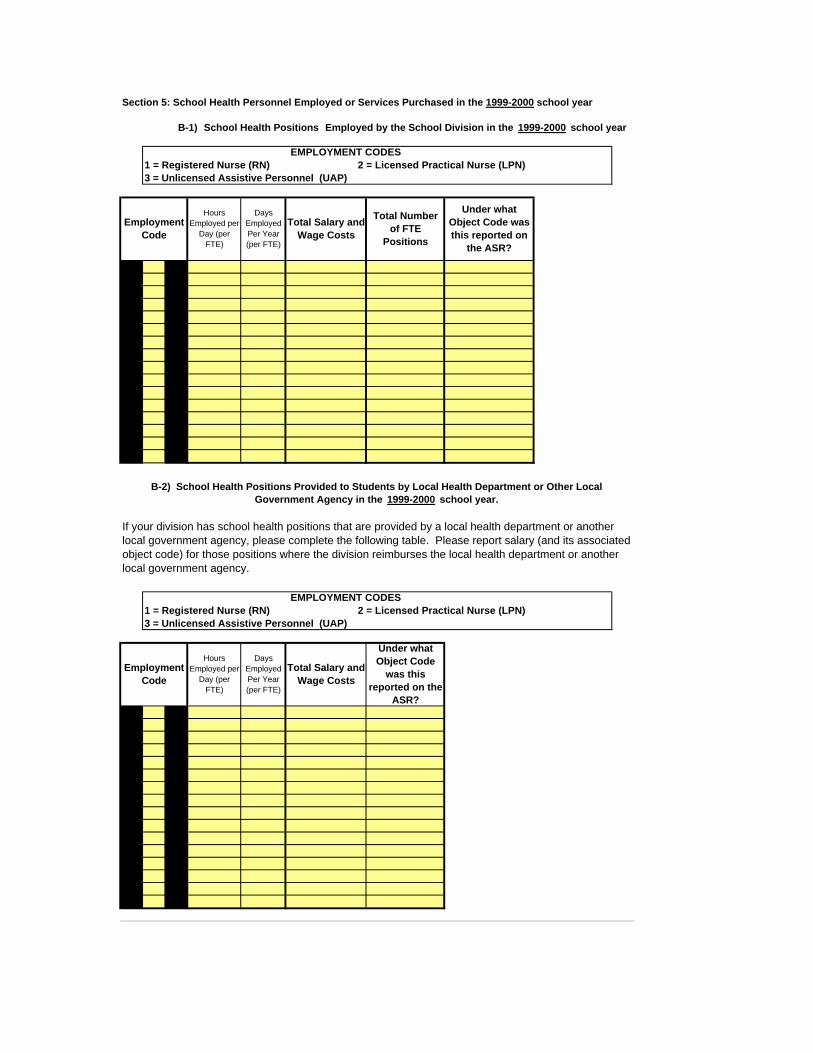
If your division has school health positions that are provided by a local health department or another local government agency, please complete the following table. Please report salary (and its associated object code) for those positions where the division reimburses the local health department or another local government agency.
B-1) School Health Positions Employed by the School Division in the 1999-2000 school year
B-2) School Health Positions Provided to Students by Local Health Department or Other Local Government Agency in the 1999-2000 school year.
EMPLOYMENT CODES 1 = Registered Nurse (RN) 2 = Licensed Practical Nurse (LPN) 3 = Unlicensed Assistive Personnel (UAP)
Employment Code
Hours Employed per
Day (per FTE)
Days Employed Per Year (per FTE)
Total Salary and Wage Costs
EMPLOYMENT CODES 1 = Registered Nurse (RN) 2 = Licensed Practical Nurse (LPN) 3 = Unlicensed Assistive Personnel (UAP)
Employment Code
Hours Employed per
Day (per FTE)
Days Employed Per Year (per FTE)
Total Salary and Wage Costs
Under what Object Code was this reported on
the ASR?
Total Number of FTE
Positions
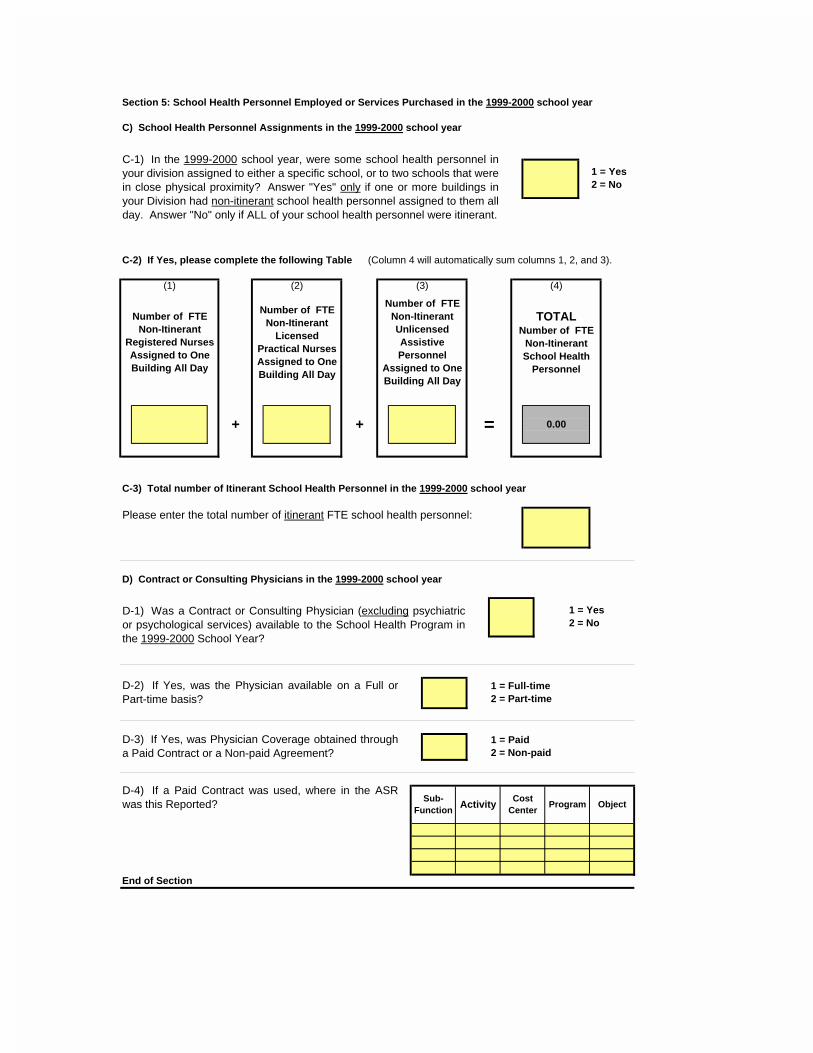
Section 5: School Health Personnel Employed or Services Purchased in the 1999-2000 school year
C) School Health Personnel Assignments in the 1999-2000 school year
C-2) If Yes, please complete the following Table (Column 4 will automatically sum columns 1, 2, and 3).
C-3) Total number of Itinerant School Health Personnel in the 1999-2000 school year
Please enter the total number of itinerant FTE school health personnel:
D) Contract or Consulting Physicians in the 1999-2000 school year
End of Section
1 = Yes 2 = No
1 = Yes 2 = No
1 = Full-time 2 = Part-time
1 = Paid 2 = Non-paid
0.00
C-1) In the 1999-2000 school year, were some school health personnel inyour division assigned to either a specific school, or to two schools that werein close physical proximity? Answer "Yes" only if one or more buildings inyour Division had non-itinerant school health personnel assigned to them allday. Answer "No" only if ALL of your school health personnel were itinerant.
TOTAL Number of FTE
Non-Itinerant School Health
Personnel
Number of FTE Non-Itinerant Unlicensed Assistive Personnel
Assigned to One Building All Day
Number of FTE Non-Itinerant
Licensed Practical Nurses Assigned to One Building All Day
(1) (2) (3) (4)
Number of FTE Non-Itinerant
Registered Nurses Assigned to One Building All Day
Sub-Function
Activity Program ObjectD-4) If a Paid Contract was used, where in the ASRwas this Reported?
=
Cost Center
D-2) If Yes, was the Physician available on a Full orPart-time basis?
D-3) If Yes, was Physician Coverage obtained througha Paid Contract or a Non-paid Agreement?
D-1) Was a Contract or Consulting Physician (excluding psychiatricor psychological services) available to the School Health Program inthe 1999-2000 School Year?
+ +

If No, please go to Section 7.
B) Number of Medically Fragile Students in the 1999-2000 school year
=+
(1) (4)(3)
Number of Medically Fragile
Students who have a
504 plan
Number of Medically Fragile Students Without
an Identified Disability
TOTAL Number of
Medically Fragile Students
Number of Medically Fragile
Students who have a special education IEP
+
Section 6: Medically Fragile Students in the 1999-2000 school year
(2)
0
Definition : Medically Fragile (MF) students are those students with a chronic condition and/or who require technology or ongoing support to prevent adverse physical consequences. MF students may be technology-dependent, have complex or special health care needs, or have other health impairments. Examples of medically fragile students include, but are not limited to:
A) Did your school division have any Medically Fragilestudents in the 1999-2000 school year?
1 = Yes 2 = No
Instructions : This question asks for your division's total number of Medically Fragile (MF) students in the 1999-2000 School Year. This includes MF students who are placed in regular or special education classroom settings, or who are receiving homebound instruction (as a result of either an Individualized Education Plan (IEP) under the Individuals with Disabilities Education Act (IDEA), or a 504 plan under Section 504 of the Rehabilitation Act of 1973). Only those MF students who are placed in classroom settings or in homebound instruction should be included. In other words, do not include those MF students who are placed in 1) a Licensed Nursing Home, 2) a Long-stay Acute Care Hospital, or 3) an Intermediate Care Facility – Mental Retardation (ICFMR).
>> Students diagnosed with asthma and receiving medication (nebulizers, etc). >> Students with heart, lung, kidney, or liver transplants.>> Students diagnosed with cancer.>> Students receiving treatments (catheterizations, tracheotomy care, tube feeding, etc).>> Students diagnosed with diabetes who receive blood sugar checks during the school day and may or may not receive insulin or glucagon.
Please answer this question by identifying Medically Fragile students by whether or not they have: (in column 1) an IEP, (in column 2) a 504 Plan, or (in column 3) no identified disability. Column 4 will automatically sum columns 1, 2, and 3.
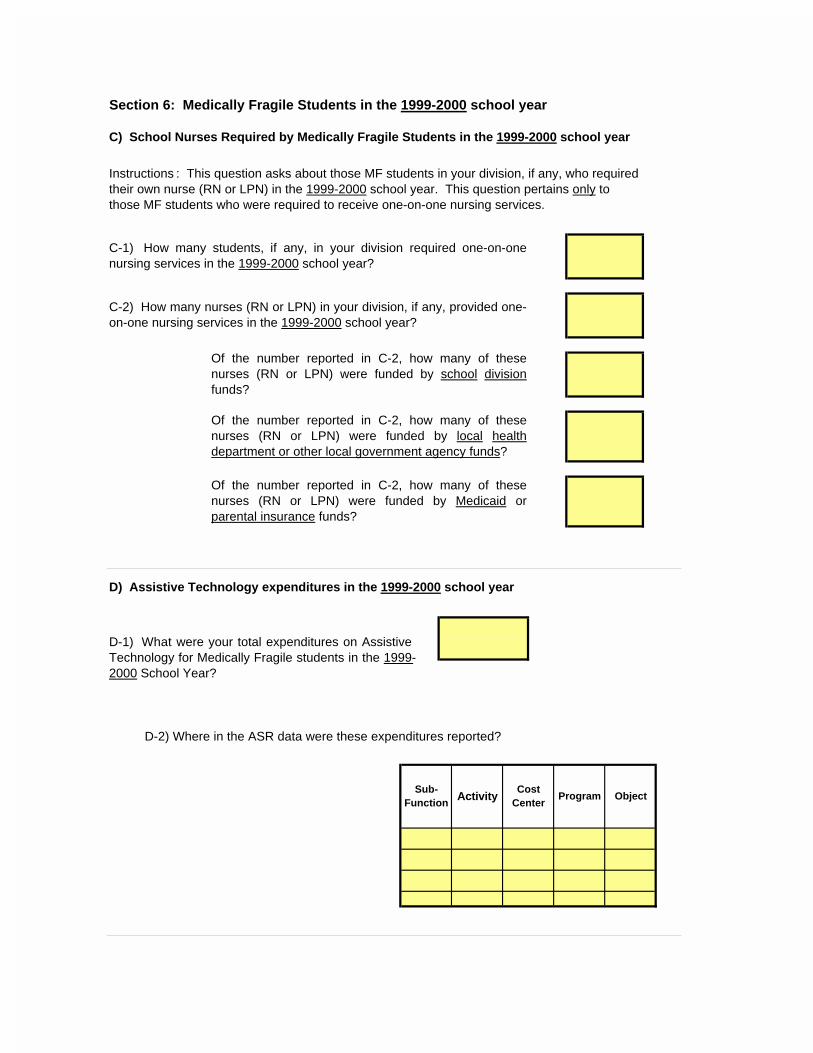
Section 6: Medically Fragile Students in the 1999-2000 school year
C) School Nurses Required by Medically Fragile Students in the 1999-2000 school year
D) Assistive Technology expenditures in the 1999-2000 school year
Program ObjectSub-
Function
Of the number reported in C-2, how many of thesenurses (RN or LPN) were funded by Medicaid orparental insurance funds?
Activity
D-1) What were your total expenditures on AssistiveTechnology for Medically Fragile students in the 1999-2000 School Year?
D-2) Where in the ASR data were these expenditures reported?
Cost Center
Instructions : This question asks about those MF students in your division, if any, who required their own nurse (RN or LPN) in the 1999-2000 school year. This question pertains only to those MF students who were required to receive one-on-one nursing services.
Of the number reported in C-2, how many of thesenurses (RN or LPN) were funded by local healthdepartment or other local government agency funds?
Of the number reported in C-2, how many of thesenurses (RN or LPN) were funded by school divisionfunds?
C-1) How many students, if any, in your division required one-on-onenursing services in the 1999-2000 school year?
C-2) How many nurses (RN or LPN) in your division, if any, provided one-on-one nursing services in the 1999-2000 school year?
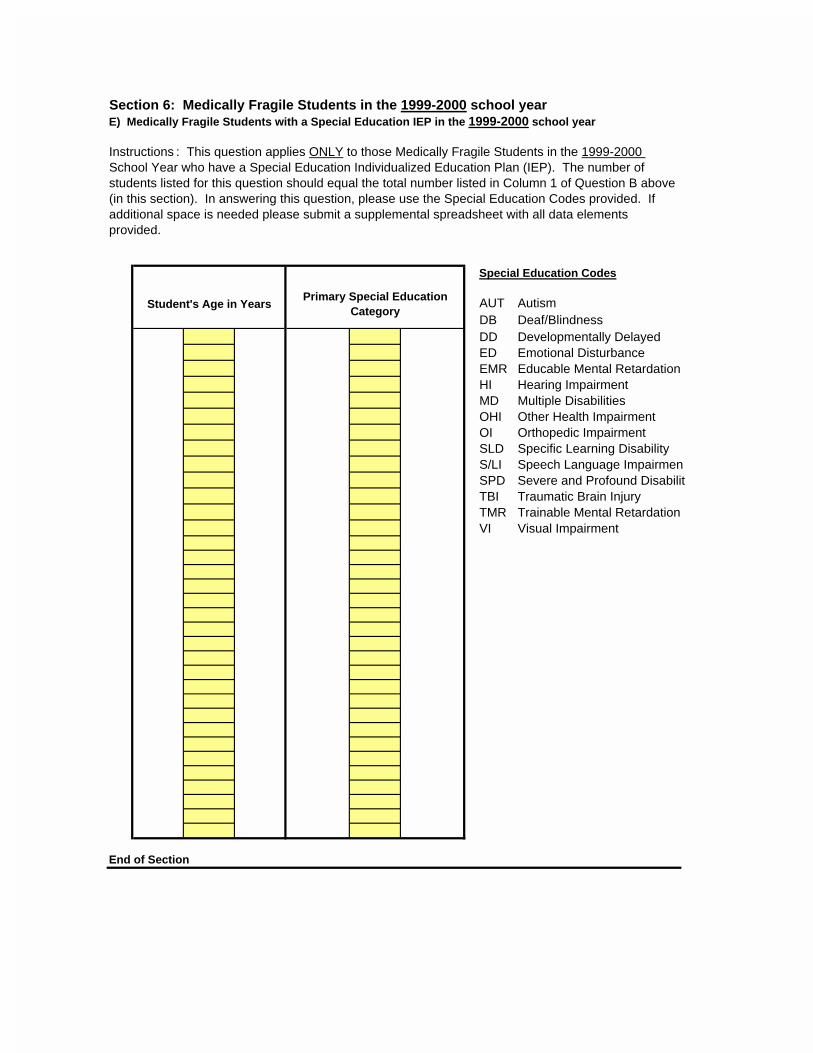
Section 6: Medically Fragile Students in the 1999-2000 school yearE) Medically Fragile Students with a Special Education IEP in the 1999-2000 school year
Special Education Codes
AUT AutismDB Deaf/BlindnessDD Developmentally DelayedED Emotional DisturbanceEMR Educable Mental RetardationHI Hearing ImpairmentMD Multiple DisabilitiesOHI Other Health ImpairmentOI Orthopedic ImpairmentSLD Specific Learning DisabilityS/LI Speech Language ImpairmenSPD Severe and Profound DisabilitTBI Traumatic Brain InjuryTMR Trainable Mental RetardationVI Visual Impairment
End of Section
Primary Special Education Category
Student's Age in Years
Instructions : This question applies ONLY to those Medically Fragile Students in the 1999-2000 School Year who have a Special Education Individualized Education Plan (IEP). The number of students listed for this question should equal the total number listed in Column 1 of Question B above (in this section). In answering this question, please use the Special Education Codes provided. If additional space is needed please submit a supplemental spreadsheet with all data elements provided.
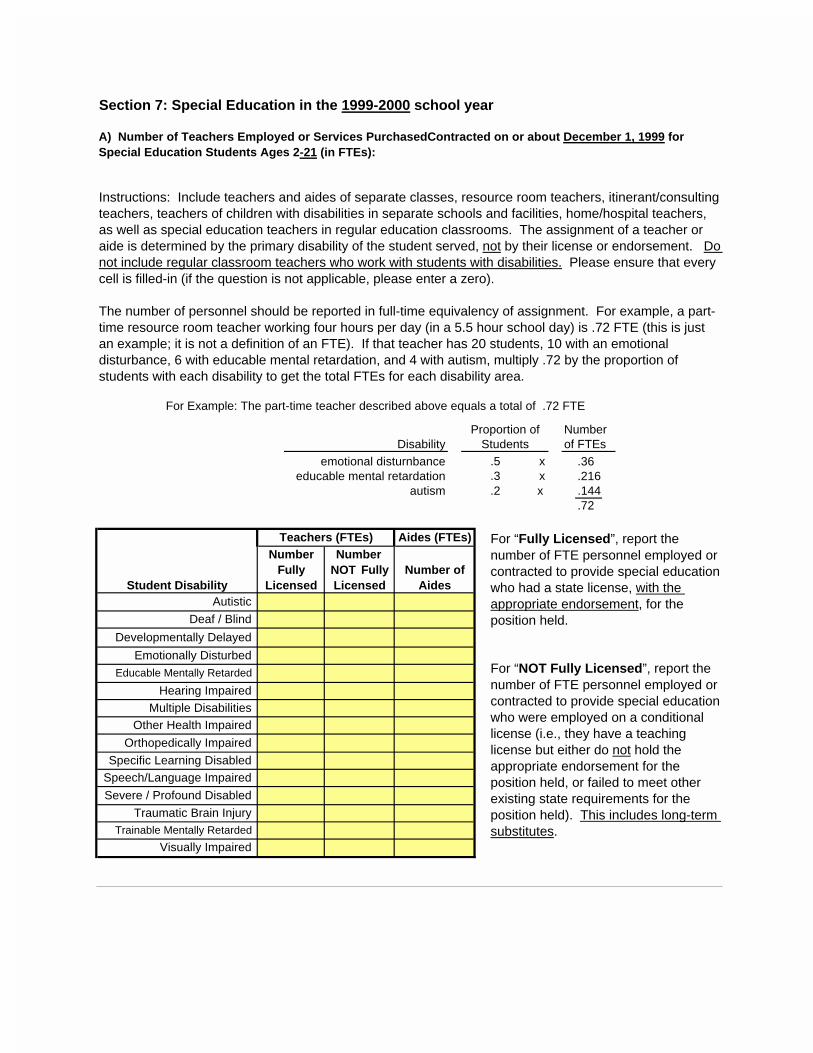
Numberof FTEs
.5 x
.3 x
.2 x
Speech/Language Impaired
Severe / Profound Disabled
Traumatic Brain Injury Trainable Mentally Retarded
Visually Impaired
For “NOT Fully Licensed”, report the number of FTE personnel employed or contracted to provide special education who were employed on a conditional license (i.e., they have a teaching license but either do not hold the appropriate endorsement for the position held, or failed to meet other existing state requirements for the position held). This includes long-term substitutes.
Emotionally Disturbed Educable Mentally Retarded
Hearing Impaired
Developmentally Delayed
Other Health Impaired
Orthopedically Impaired
Specific Learning Disabled
Multiple Disabilities
Student DisabilityAutistic
Deaf / Blind
Teachers (FTEs)Number
NOT Fully Licensed
Instructions: Include teachers and aides of separate classes, resource room teachers, itinerant/consulting teachers, teachers of children with disabilities in separate schools and facilities, home/hospital teachers, as well as special education teachers in regular education classrooms. The assignment of a teacher or aide is determined by the primary disability of the student served, not by their license or endorsement. Do not include regular classroom teachers who work with students with disabilities. Please ensure that every cell is filled-in (if the question is not applicable, please enter a zero).
The number of personnel should be reported in full-time equivalency of assignment. For example, a part-time resource room teacher working four hours per day (in a 5.5 hour school day) is .72 FTE (this is just an example; it is not a definition of an FTE). If that teacher has 20 students, 10 with an emotional disturbance, 6 with educable mental retardation, and 4 with autism, multiply .72 by the proportion of students with each disability to get the total FTEs for each disability area.
For “Fully Licensed”, report the number of FTE personnel employed or contracted to provide special education who had a state license, with the appropriate endorsement, for the position held.
For Example: The part-time teacher described above equals a total of .72 FTE
emotional disturnbance
.72
Proportion of Students
.36Disability
educable mental retardationautism
.216
.144
Number Fully
Licensed
Section 7: Special Education in the 1999-2000 school year
Aides (FTEs)
Number of Aides
A) Number of Teachers Employed or Services PurchasedContracted on or about December 1, 1999 for Special Education Students Ages 2-21 (in FTEs):
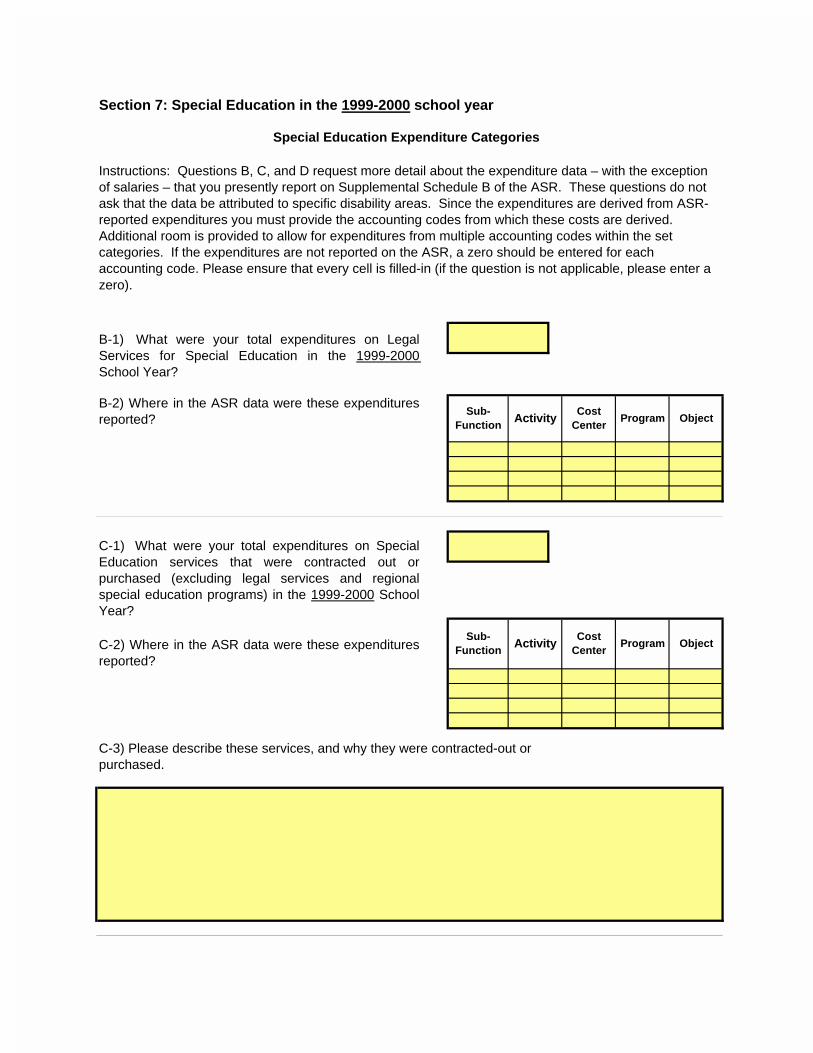
Section 7: Special Education in the 1999-2000 school year
Instructions: Questions B, C, and D request more detail about the expenditure data – with the exception of salaries – that you presently report on Supplemental Schedule B of the ASR. These questions do not ask that the data be attributed to specific disability areas. Since the expenditures are derived from ASR-reported expenditures you must provide the accounting codes from which these costs are derived. Additional room is provided to allow for expenditures from multiple accounting codes within the set categories. If the expenditures are not reported on the ASR, a zero should be entered for each accounting code. Please ensure that every cell is filled-in (if the question is not applicable, please enter a zero).
C-2) Where in the ASR data were these expendituresreported?
C-1) What were your total expenditures on SpecialEducation services that were contracted out orpurchased (excluding legal services and regionalspecial education programs) in the 1999-2000 SchoolYear?
ObjectProgramActivitySub-
FunctionCost
Center
Program
B-1) What were your total expenditures on LegalServices for Special Education in the 1999-2000 School Year?
Object
Special Education Expenditure Categories
Cost Center
B-2) Where in the ASR data were these expendituresreported?
Sub-Function
Activity
C-3) Please describe these services, and why they were contracted-out or purchased.
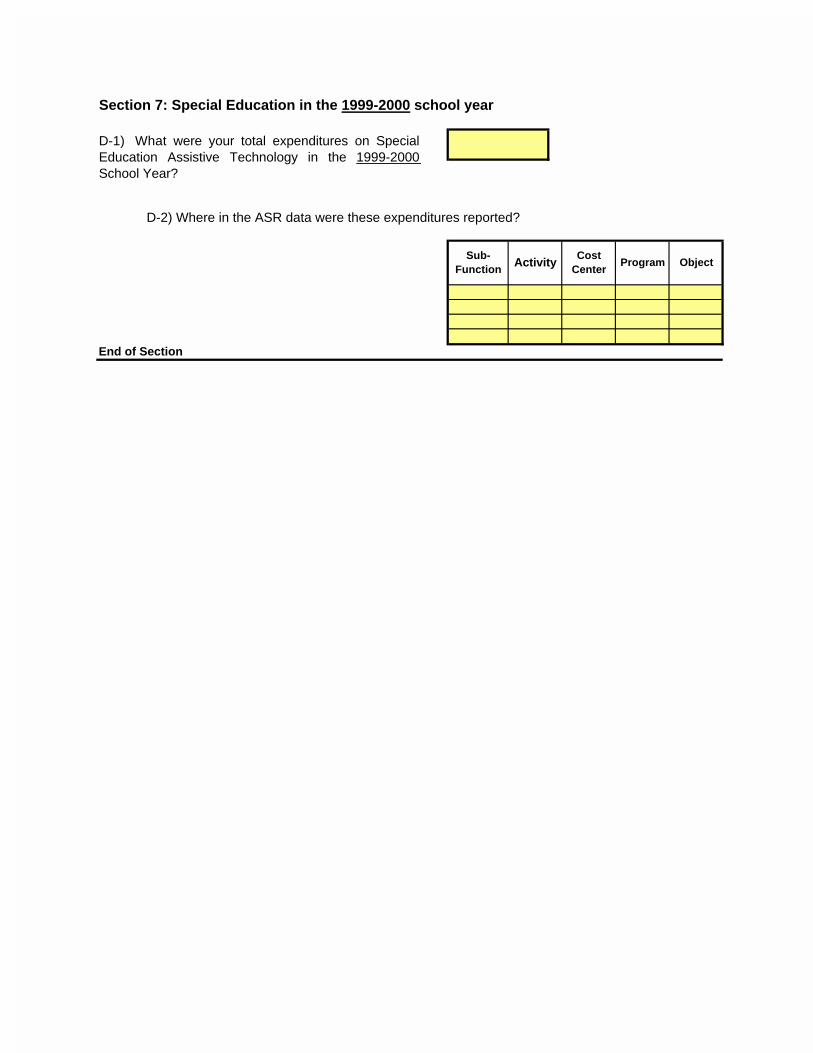
Section 7: Special Education in the 1999-2000 school year
End of Section
Sub-Function
ActivityCost
CenterProgram Object
D-2) Where in the ASR data were these expenditures reported?
D-1) What were your total expenditures on SpecialEducation Assistive Technology in the 1999-2000 School Year?

Professional Non-ProfessionalPositions Positions
Health Insurance:
1 = Yes 2 = No
1 = Yes 2 = No
Plan Structure
1 = Yes 2 = No
1 = Yes 2 = No
1 = Yes 2 = No
1 = Yes 2 = No
1 = Yes 2 = No
1 = Yes 2 = No
1 = Yes 2 = No
1 = Yes 2 = No
1 = Yes 2 = No
1 = Yes 2 = No
1 = Yes 2 = No
Instructions: Please provide the following information for the 1999-2000 school year for both full-time and part-time employees. If your division offered combined plans, such as combined health and dental insurance, please respond as though these plans were offered separately.
Part-time EmployeesFull-time Employees
Section 8: Fringe Benefits in the 1999-2000 school year
A-2) If yes, what percent of the premium did youcover?
A-3) Did you offer employee plus one coverage?A-4) If yes, what percent of the premium did youcover?
A-5) Did you offer family coverage?
B-3) Did you offer retiree plus one coverage?
B-6) If yes, what percent of the premium did youcover?
A) Did you offer health insurance for currentemployees? (If No, go to question B.)
B) Did you offer health insurance for retiredemployees? (If No, go to question C.)
A-1) Did you offer employee coverage?
B-4) If yes, what percent of the premium did youcover?
B-5) Did you offer family coverage?
B-1) Did you offer retiree coverage?B-2) If yes, what percent of the premium did youcover?
A-6) If yes, what percent of the premium did youcover?
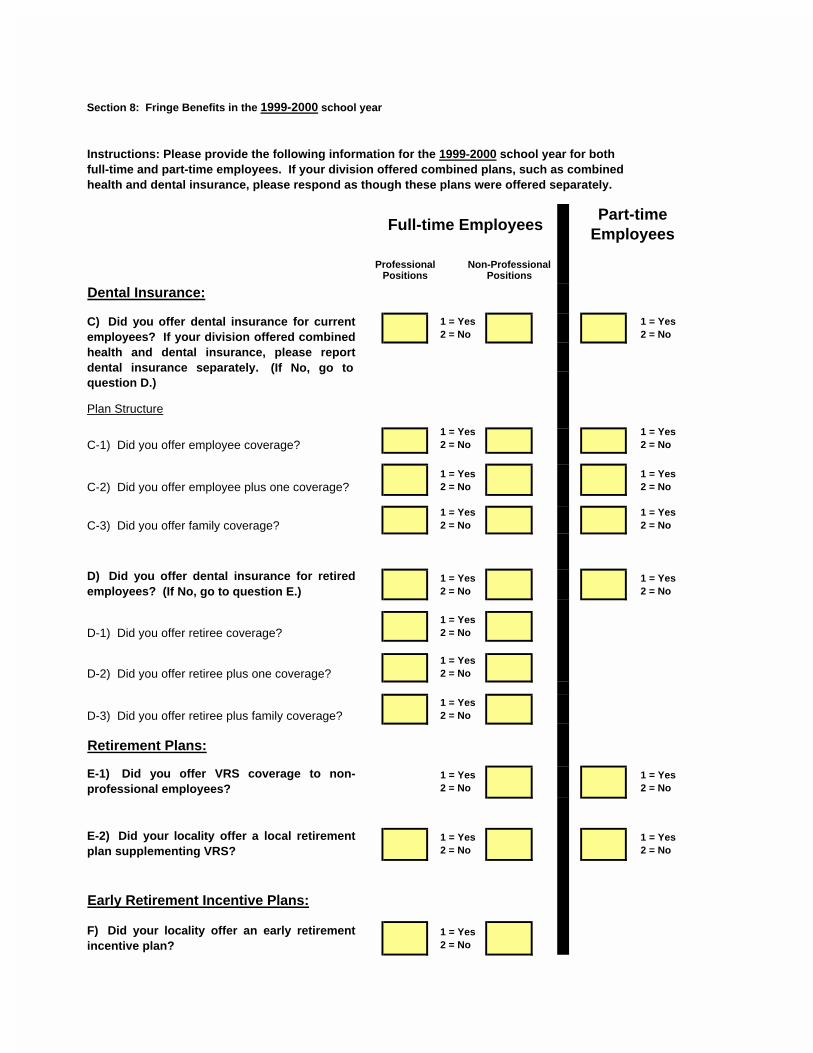
Professional Non-ProfessionalPositions Positions
Instructions: Please provide the following information for the 1999-2000 school year for both full-time and part-time employees. If your division offered combined plans, such as combined health and dental insurance, please respond as though these plans were offered separately.
Part-time EmployeesFull-time Employees
Section 8: Fringe Benefits in the 1999-2000 school year
Dental Insurance:
1 = Yes 2 = No
1 = Yes 2 = No
1 = Yes 2 = No
1 = Yes 2 = No
1 = Yes 2 = No
1 = Yes 2 = No
1 = Yes 2 = No
1 = Yes 2 = No
1 = Yes 2 = No
1 = Yes 2 = No
1 = Yes 2 = No
1 = Yes 2 = No
1 = Yes 2 = No
Retirement Plans:
1 = Yes 2 = No
1 = Yes 2 = No
1 = Yes 2 = No
1 = Yes 2 = No
Early Retirement Incentive Plans:
1 = Yes 2 = No
F) Did your locality offer an early retirementincentive plan?
E-1) Did you offer VRS coverage to non-professional employees?
D-3) Did you offer retiree plus family coverage?
E-2) Did your locality offer a local retirementplan supplementing VRS?
D-1) Did you offer retiree coverage?
Plan Structure
C-1) Did you offer employee coverage?
C-2) Did you offer employee plus one coverage?
C) Did you offer dental insurance for currentemployees? If your division offered combinedhealth and dental insurance, please reportdental insurance separately. (If No, go toquestion D.)
C-3) Did you offer family coverage?
D) Did you offer dental insurance for retiredemployees? (If No, go to question E.)
D-2) Did you offer retiree plus one coverage?
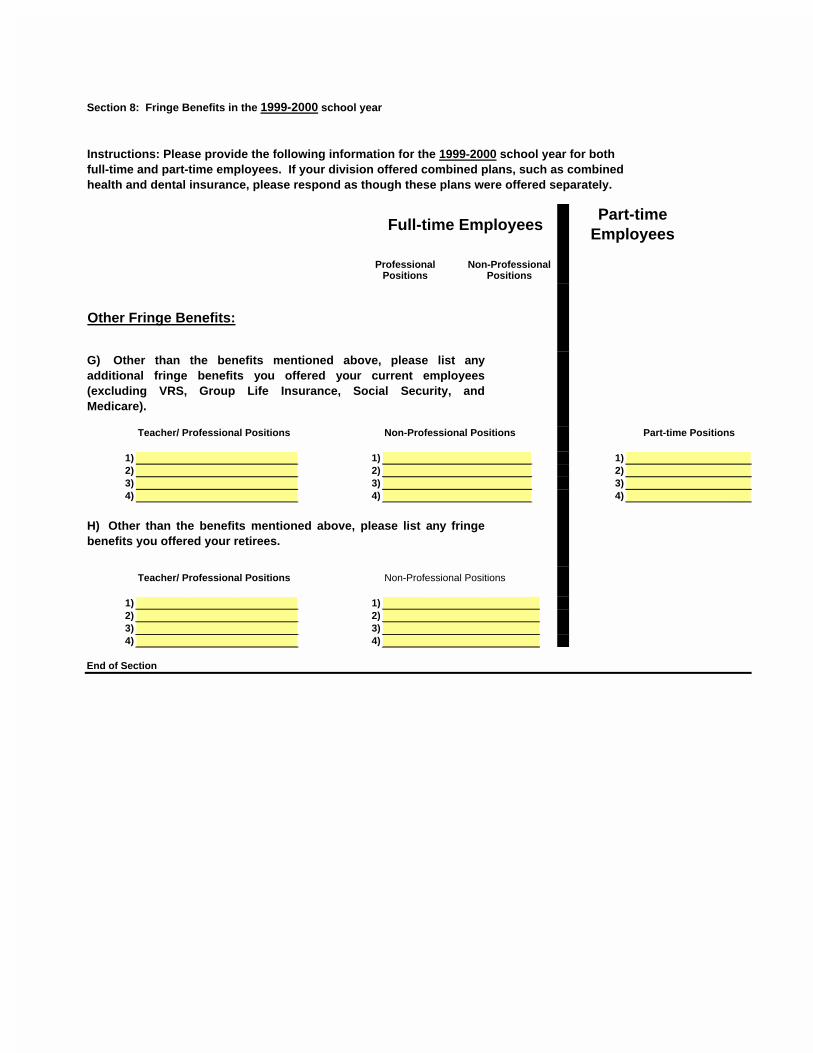
Professional Non-ProfessionalPositions Positions
Instructions: Please provide the following information for the 1999-2000 school year for both full-time and part-time employees. If your division offered combined plans, such as combined health and dental insurance, please respond as though these plans were offered separately.
Part-time EmployeesFull-time Employees
Section 8: Fringe Benefits in the 1999-2000 school year
Other Fringe Benefits:
Teacher/ Professional Positions Non-Professional Positions Part-time Positions
1) 1) 1)2) 2) 2)3) 3) 3)4) 4) 4)
Teacher/ Professional Positions Non-Professional Positions
1) 1)2) 2)3) 3)4) 4)
End of Section
H) Other than the benefits mentioned above, please list any fringebenefits you offered your retirees.
G) Other than the benefits mentioned above, please list anyadditional fringe benefits you offered your current employees(excluding VRS, Group Life Insurance, Social Security, andMedicare).
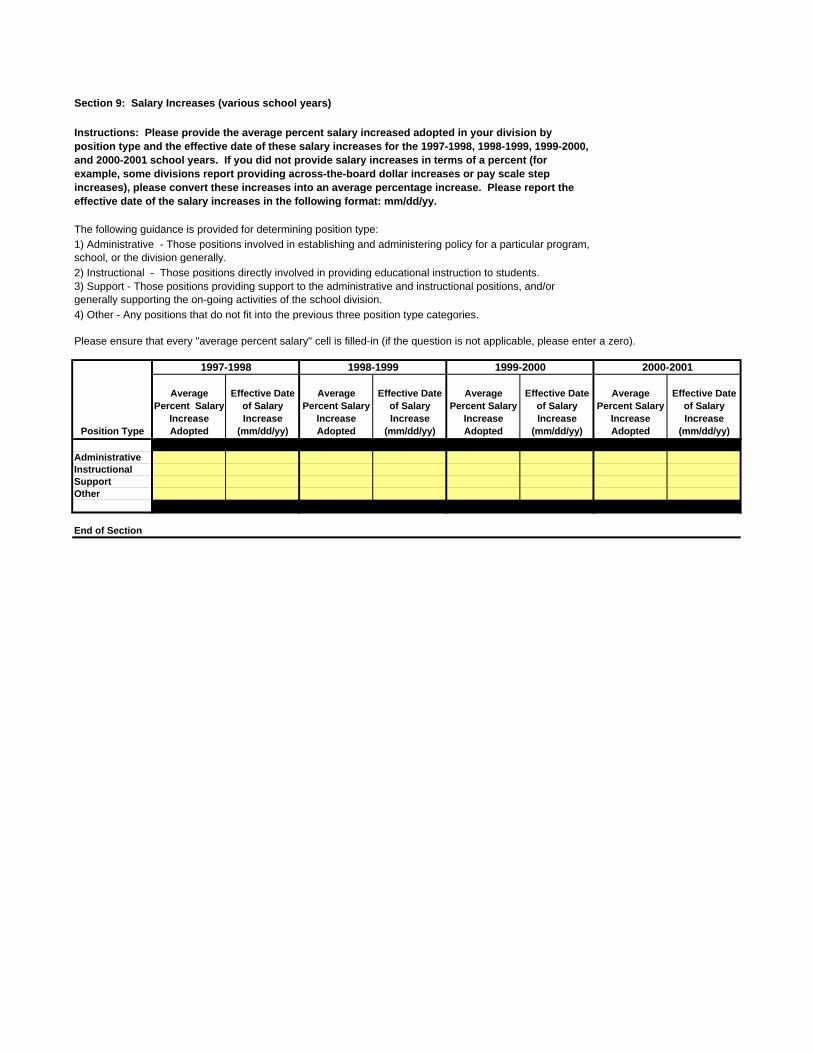
Section 9: Salary Increases (various school years)
The following guidance is provided for determining position type:
2) Instructional - Those positions directly involved in providing educational instruction to students.
4) Other - Any positions that do not fit into the previous three position type categories.
Please ensure that every "average percent salary" cell is filled-in (if the question is not applicable, please enter a zero).
Position Type
Average Percent Salary
Increase Adopted
Effective Date of Salary Increase
(mm/dd/yy)
Average Percent Salary
Increase Adopted
Effective Date of Salary Increase
(mm/dd/yy)
Average Percent Salary
Increase Adopted
Effective Date of Salary Increase
(mm/dd/yy)
Average Percent Salary
Increase Adopted
Effective Date of Salary Increase
(mm/dd/yy)
AdministrativeInstructionalSupportOther
End of Section
Instructions: Please provide the average percent salary increased adopted in your division by position type and the effective date of these salary increases for the 1997-1998, 1998-1999, 1999-2000, and 2000-2001 school years. If you did not provide salary increases in terms of a percent (for example, some divisions report providing across-the-board dollar increases or pay scale step increases), please convert these increases into an average percentage increase. Please report the effective date of the salary increases in the following format: mm/dd/yy.
3) Support - Those positions providing support to the administrative and instructional positions, and/or generally supporting the on-going activities of the school division.
1) Administrative - Those positions involved in establishing and administering policy for a particular program, school, or the division generally.
2000-20011997-1998 1998-1999 1999-2000
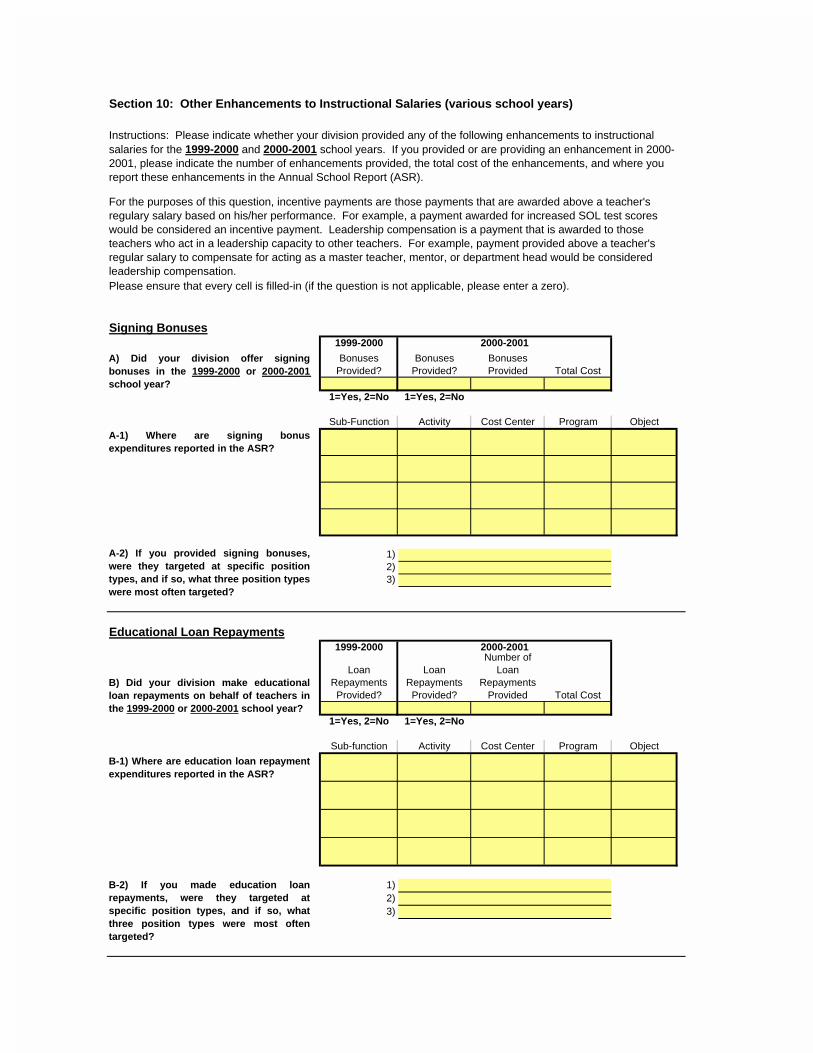
Section 10: Other Enhancements to Instructional Salaries (various school years)
Signing Bonuses1999-2000 2000-2001
Bonuses Provided?
Bonuses Provided?
Bonuses Provided Total Cost
1=Yes, 2=No 1=Yes, 2=No
Sub-Function Activity Cost Center Program Object
1)2)3)
Educational Loan Repayments1999-2000 2000-2001
Loan Repayments Provided?
Loan Repayments Provided?
Number of Loan
Repayments Provided Total Cost
1=Yes, 2=No 1=Yes, 2=No
Sub-function Activity Cost Center Program Object
1)2)3)
A-2) If you provided signing bonuses,were they targeted at specific positiontypes, and if so, what three position typeswere most often targeted?
B-2) If you made education loanrepayments, were they targeted atspecific position types, and if so, whatthree position types were most oftentargeted?
A) Did your division offer signingbonuses in the 1999-2000 or 2000-2001 school year?
A-1) Where are signing bonusexpenditures reported in the ASR?
B) Did your division make educationalloan repayments on behalf of teachers inthe 1999-2000 or 2000-2001 school year?
B-1) Where are education loan repaymentexpenditures reported in the ASR?
Please ensure that every cell is filled-in (if the question is not applicable, please enter a zero).
Instructions: Please indicate whether your division provided any of the following enhancements to instructional salaries for the 1999-2000 and 2000-2001 school years. If you provided or are providing an enhancement in 2000-2001, please indicate the number of enhancements provided, the total cost of the enhancements, and where you report these enhancements in the Annual School Report (ASR).
For the purposes of this question, incentive payments are those payments that are awarded above a teacher's regulary salary based on his/her performance. For example, a payment awarded for increased SOL test scores would be considered an incentive payment. Leadership compensation is a payment that is awarded to those teachers who act in a leadership capacity to other teachers. For example, payment provided above a teacher's regular salary to compensate for acting as a master teacher, mentor, or department head would be considered leadership compensation.
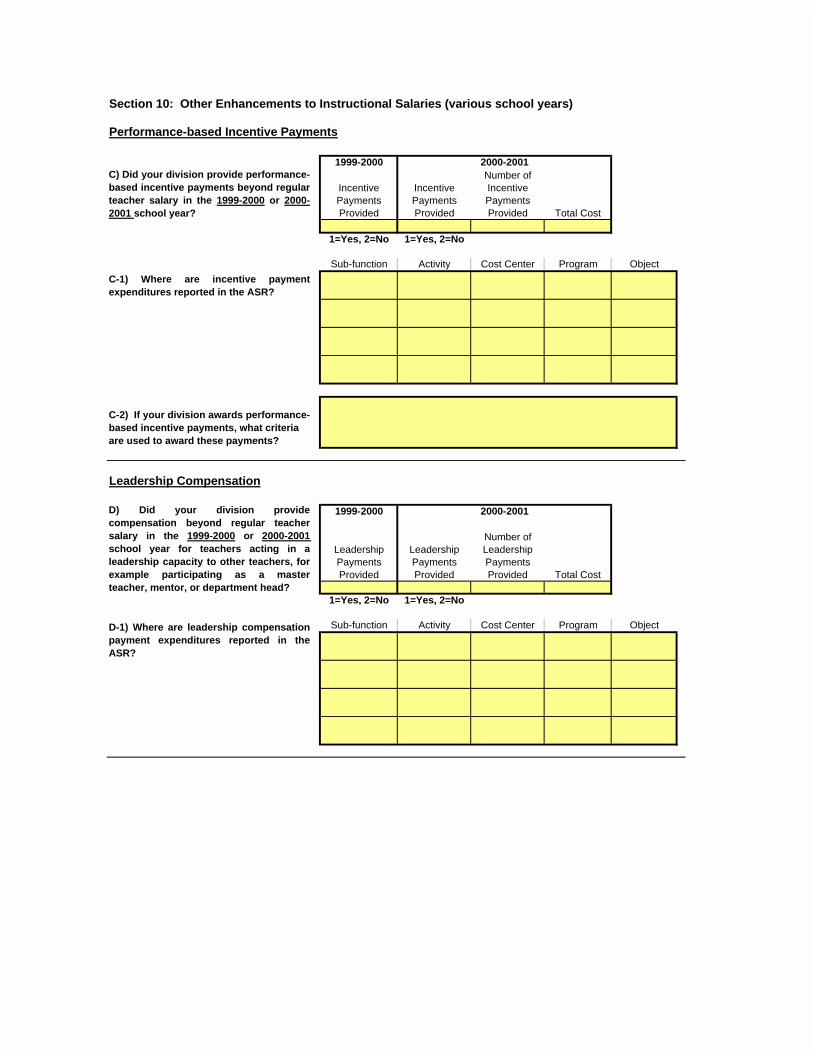
Section 10: Other Enhancements to Instructional Salaries (various school years)
1999-2000 2000-2001
Incentive Payments Provided
Incentive Payments Provided
Number of Incentive Payments Provided Total Cost
1=Yes, 2=No 1=Yes, 2=No
Sub-function Activity Cost Center Program Object
Leadership Compensation
1999-2000 2000-2001
Leadership Payments Provided
Leadership Payments Provided
Number of Leadership Payments Provided Total Cost
1=Yes, 2=No 1=Yes, 2=No
Sub-function Activity Cost Center Program Object
Performance-based Incentive Payments
D-1) Where are leadership compensationpayment expenditures reported in theASR?
C-2) If your division awards performance-based incentive payments, what criteria are used to award these payments?
C) Did your division provide performance-based incentive payments beyond regularteacher salary in the 1999-2000 or 2000-2001 school year?
C-1) Where are incentive paymentexpenditures reported in the ASR?
D) Did your division providecompensation beyond regular teachersalary in the 1999-2000 or 2000-2001 school year for teachers acting in aleadership capacity to other teachers, forexample participating as a masterteacher, mentor, or department head?
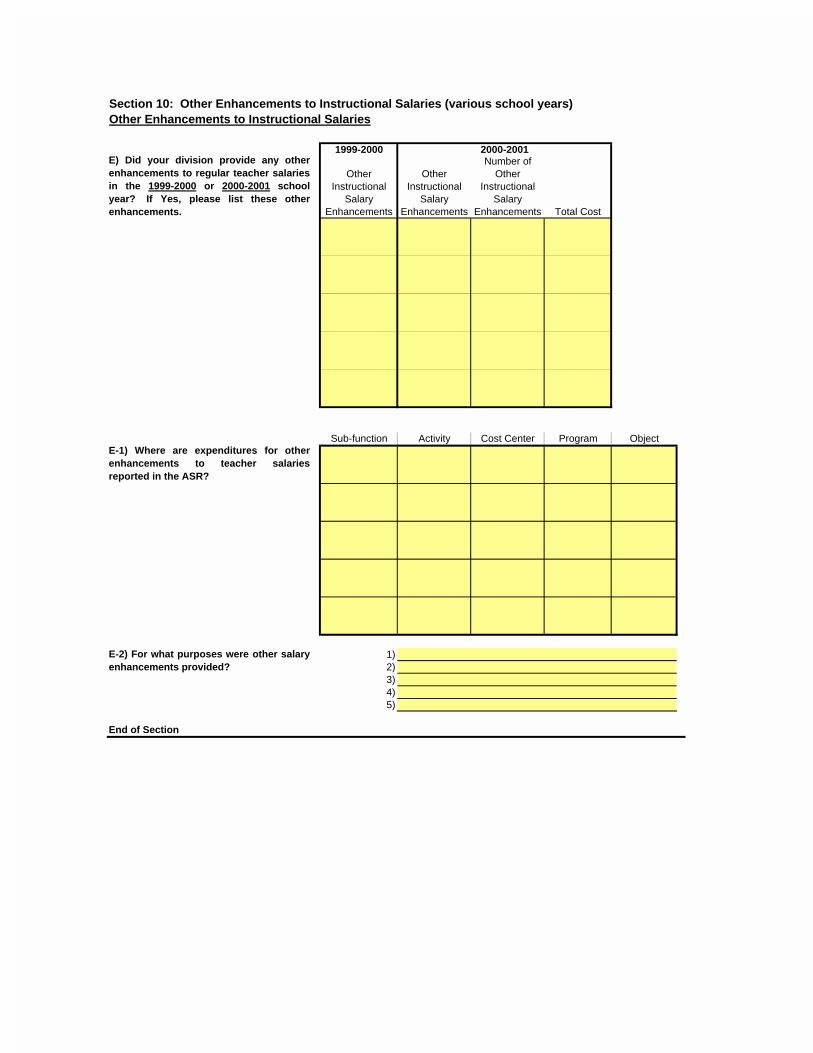
Section 10: Other Enhancements to Instructional Salaries (various school years)Other Enhancements to Instructional Salaries
1999-2000 2000-2001
Other Instructional
Salary Enhancements
Other Instructional
Salary Enhancements
Number of Other
Instructional Salary
Enhancements Total Cost
Sub-function Activity Cost Center Program Object
1)2)3)4)5)
End of Section
E-2) For what purposes were other salaryenhancements provided?
E) Did your division provide any otherenhancements to regular teacher salariesin the 1999-2000 or 2000-2001 schoolyear? If Yes, please list these otherenhancements.
E-1) Where are expenditures for otherenhancements to teacher salariesreported in the ASR?
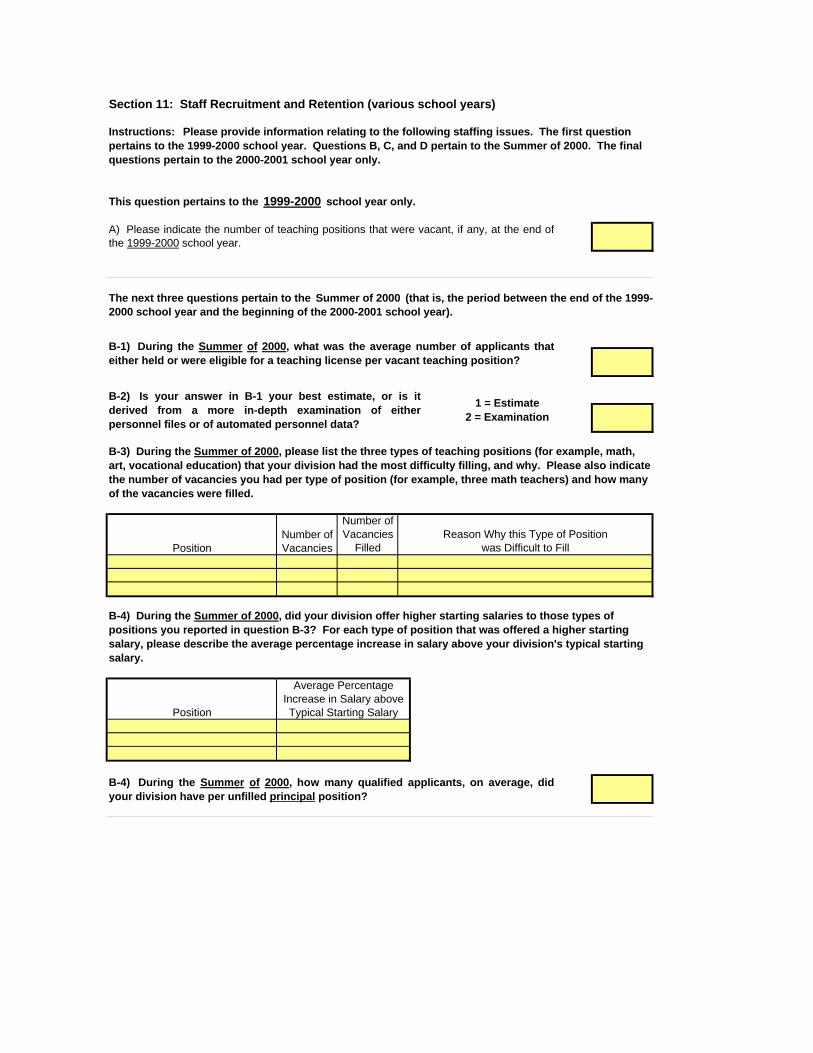
This question pertains to the 1999-2000 school year only.
Average Percentage Increase in Salary above Typical Starting SalaryPosition
B-4) During the Summer of 2000, did your division offer higher starting salaries to those types of positions you reported in question B-3? For each type of position that was offered a higher starting salary, please describe the average percentage increase in salary above your division's typical starting salary.
Number of Vacancies
FilledReason Why this Type of Position
was Difficult to Fill
Section 11: Staff Recruitment and Retention (various school years)
A) Please indicate the number of teaching positions that were vacant, if any, at the end ofthe 1999-2000 school year.
Instructions: Please provide information relating to the following staffing issues. The first question pertains to the 1999-2000 school year. Questions B, C, and D pertain to the Summer of 2000. The final questions pertain to the 2000-2001 school year only.
The next three questions pertain to the Summer of 2000 (that is, the period between the end of the 1999-2000 school year and the beginning of the 2000-2001 school year).
B-1) During the Summer of 2000, what was the average number of applicants thateither held or were eligible for a teaching license per vacant teaching position?
B-2) Is your answer in B-1 your best estimate, or is itderived from a more in-depth examination of eitherpersonnel files or of automated personnel data?
1 = Estimate 2 = Examination
Position
B-3) During the Summer of 2000, please list the three types of teaching positions (for example, math, art, vocational education) that your division had the most difficulty filling, and why. Please also indicate the number of vacancies you had per type of position (for example, three math teachers) and how many of the vacancies were filled.
Number of Vacancies
B-4) During the Summer of 2000, how many qualified applicants, on average, didyour division have per unfilled principal position?
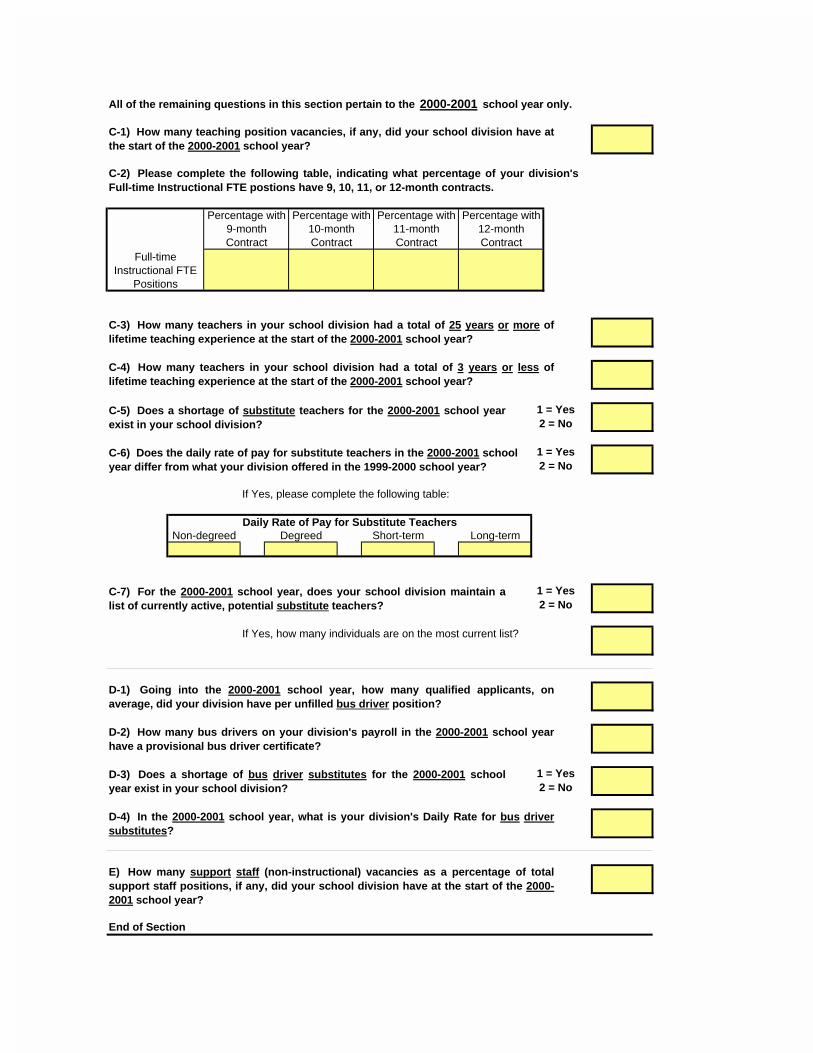
All of the remaining questions in this section pertain to the 2000-2001 school year only.
If Yes, please complete the following table:
If Yes, how many individuals are on the most current list?
End of Section
C-2) Please complete the following table, indicating what percentage of your division'sFull-time Instructional FTE postions have 9, 10, 11, or 12-month contracts.
Full-time Instructional FTE
Positions
Percentage with 9-month Contract
Percentage with 10-month Contract
Percentage with 11-month Contract
Percentage with 12-month Contract
D-1) Going into the 2000-2001 school year, how many qualified applicants, onaverage, did your division have per unfilled bus driver position?
1 = Yes 2 = No
C-7) For the 2000-2001 school year, does your school division maintain alist of currently active, potential substitute teachers?
1 = Yes 2 = No
Daily Rate of Pay for Substitute TeachersLong-term
E) How many support staff (non-instructional) vacancies as a percentage of totalsupport staff positions, if any, did your school division have at the start of the 2000-2001 school year?
C-6) Does the daily rate of pay for substitute teachers in the 2000-2001 schoolyear differ from what your division offered in the 1999-2000 school year?
Non-degreed
D-2) How many bus drivers on your division's payroll in the 2000-2001 school yearhave a provisional bus driver certificate?
D-3) Does a shortage of bus driver substitutes for the 2000-2001 schoolyear exist in your school division?
1 = Yes 2 = No
D-4) In the 2000-2001 school year, what is your division's Daily Rate for bus driversubstitutes?
C-3) How many teachers in your school division had a total of 25 years or more oflifetime teaching experience at the start of the 2000-2001 school year?
C-1) How many teaching position vacancies, if any, did your school division have atthe start of the 2000-2001 school year?
1 = Yes 2 = No
Short-termDegreed
C-5) Does a shortage of substitute teachers for the 2000-2001 school yearexist in your school division?
C-4) How many teachers in your school division had a total of 3 years or less oflifetime teaching experience at the start of the 2000-2001 school year?
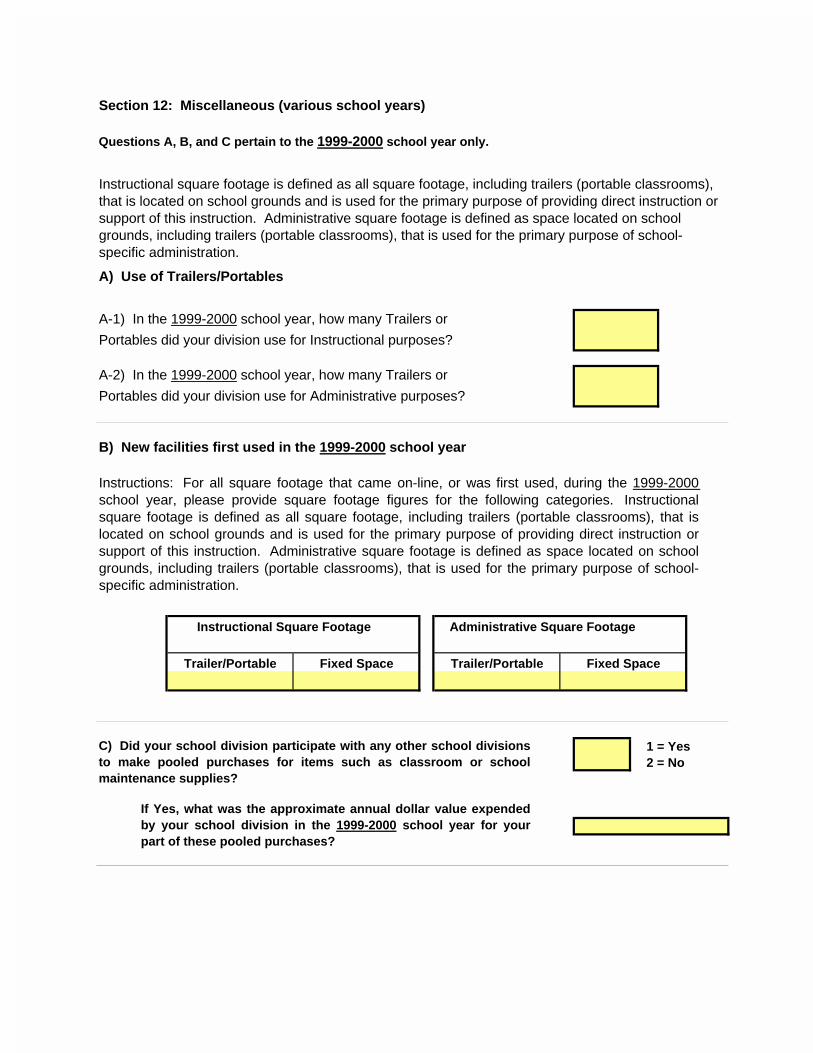
Questions A, B, and C pertain to the 1999-2000 school year only.
A) Use of Trailers/Portables
Instructional Square Footage Administrative Square Footage
Instructional square footage is defined as all square footage, including trailers (portable classrooms), that is located on school grounds and is used for the primary purpose of providing direct instruction or support of this instruction. Administrative square footage is defined as space located on school grounds, including trailers (portable classrooms), that is used for the primary purpose of school-specific administration.
If Yes, what was the approximate annual dollar value expendedby your school division in the 1999-2000 school year for yourpart of these pooled purchases?
Instructions: For all square footage that came on-line, or was first used, during the 1999-2000 school year, please provide square footage figures for the following categories. Instructionalsquare footage is defined as all square footage, including trailers (portable classrooms), that islocated on school grounds and is used for the primary purpose of providing direct instruction orsupport of this instruction. Administrative square footage is defined as space located on schoolgrounds, including trailers (portable classrooms), that is used for the primary purpose of school-specific administration.
C) Did your school division participate with any other school divisionsto make pooled purchases for items such as classroom or schoolmaintenance supplies?
1 = Yes 2 = No
Trailer/Portable Fixed Space Trailer/Portable Fixed Space
Section 12: Miscellaneous (various school years)
B) New facilities first used in the 1999-2000 school year
A-2) In the 1999-2000 school year, how many Trailers or
Portables did your division use for Administrative purposes?
A-1) In the 1999-2000 school year, how many Trailers or
Portables did your division use for Instructional purposes?
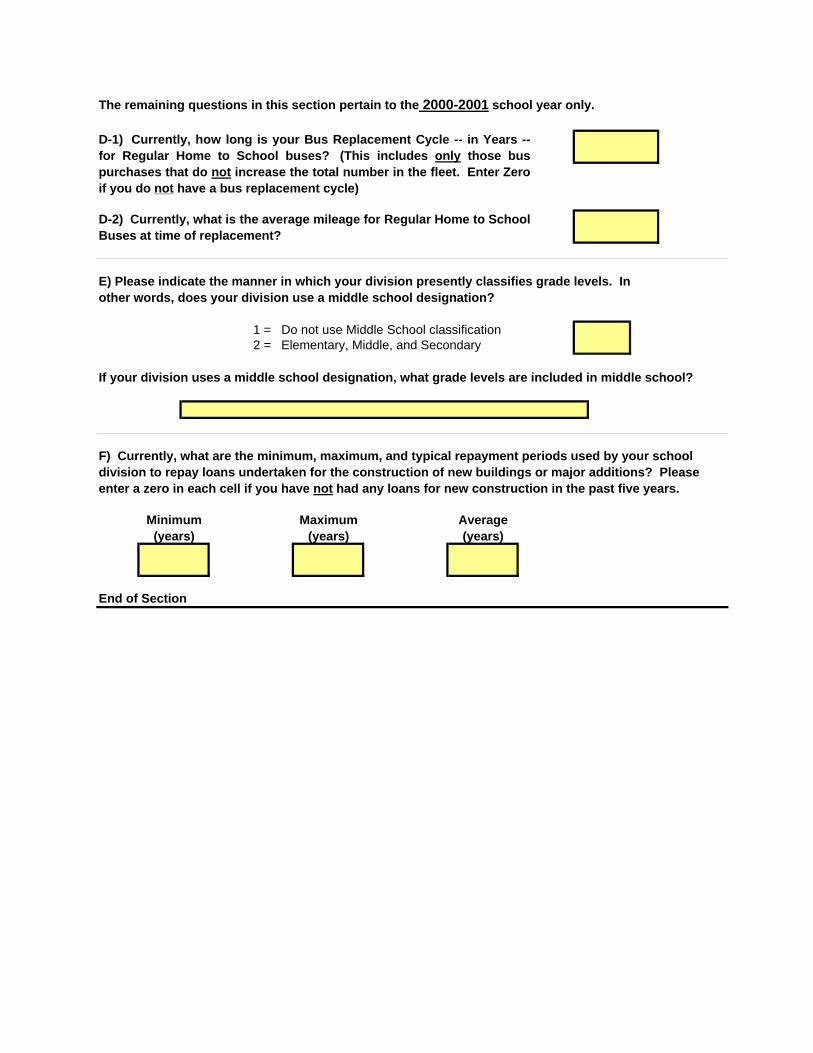
The remaining questions in this section pertain to the 2000-2001 school year only.
1 = Do not use Middle School classification2 = Elementary, Middle, and Secondary
If your division uses a middle school designation, what grade levels are included in middle school?
End of Section
E) Please indicate the manner in which your division presently classifies grade levels. In other words, does your division use a middle school designation?
F) Currently, what are the minimum, maximum, and typical repayment periods used by your school division to repay loans undertaken for the construction of new buildings or major additions? Please enter a zero in each cell if you have not had any loans for new construction in the past five years.
D-2) Currently, what is the average mileage for Regular Home to SchoolBuses at time of replacement?
D-1) Currently, how long is your Bus Replacement Cycle -- in Years --for Regular Home to School buses? (This includes only those buspurchases that do not increase the total number in the fleet. Enter Zeroif you do not have a bus replacement cycle)
Minimum (years)
Maximum (years)
Average (years)
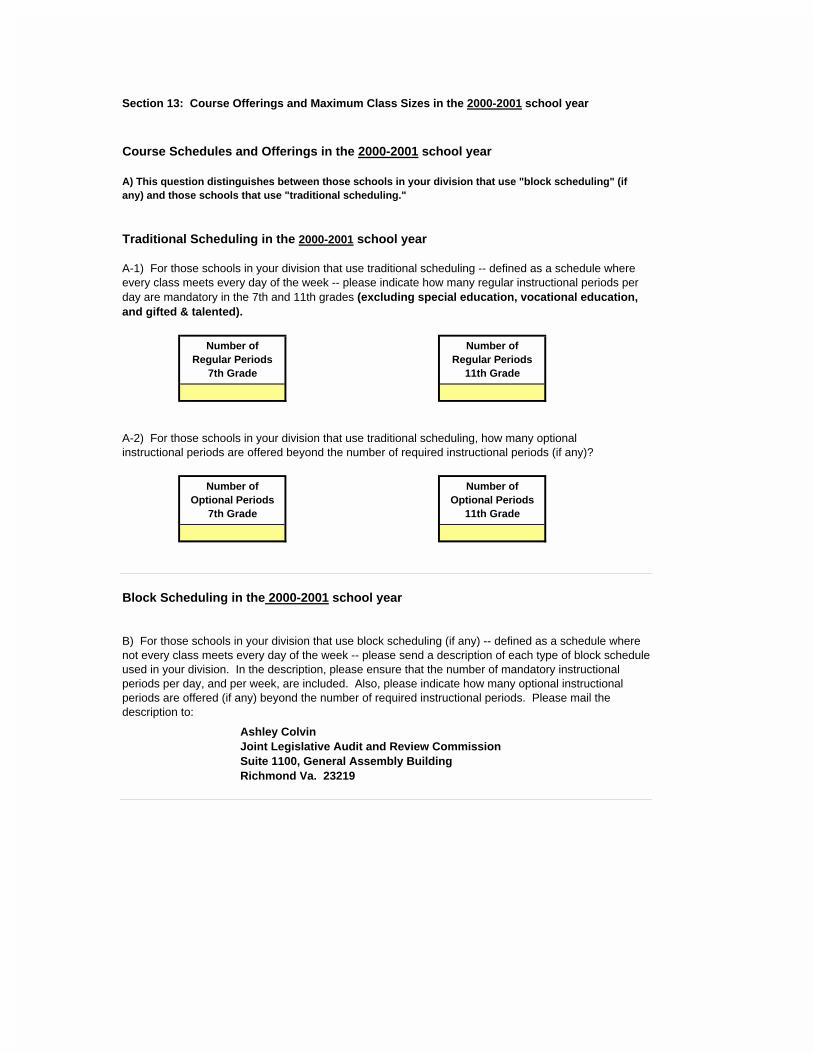
Section 13: Course Offerings and Maximum Class Sizes in the 2000-2001 school year
Course Schedules and Offerings in the 2000-2001 school year
Traditional Scheduling in the 2000-2001 school year
Block Scheduling in the 2000-2001 school year
B) For those schools in your division that use block scheduling (if any) -- defined as a schedule where not every class meets every day of the week -- please send a description of each type of block schedule used in your division. In the description, please ensure that the number of mandatory instructional periods per day, and per week, are included. Also, please indicate how many optional instructional periods are offered (if any) beyond the number of required instructional periods. Please mail the description to:
A-1) For those schools in your division that use traditional scheduling -- defined as a schedule where every class meets every day of the week -- please indicate how many regular instructional periods per day are mandatory in the 7th and 11th grades (excluding special education, vocational education, and gifted & talented).
Number of Optional Periods
11th Grade
A) This question distinguishes between those schools in your division that use "block scheduling" (if any) and those schools that use "traditional scheduling."
Number of Regular Periods
11th Grade
Number of Regular Periods
7th Grade
A-2) For those schools in your division that use traditional scheduling, how many optional instructional periods are offered beyond the number of required instructional periods (if any)?
Ashley Colvin Joint Legislative Audit and Review Commission Suite 1100, General Assembly Building Richmond Va. 23219
Number of Optional Periods
7th Grade
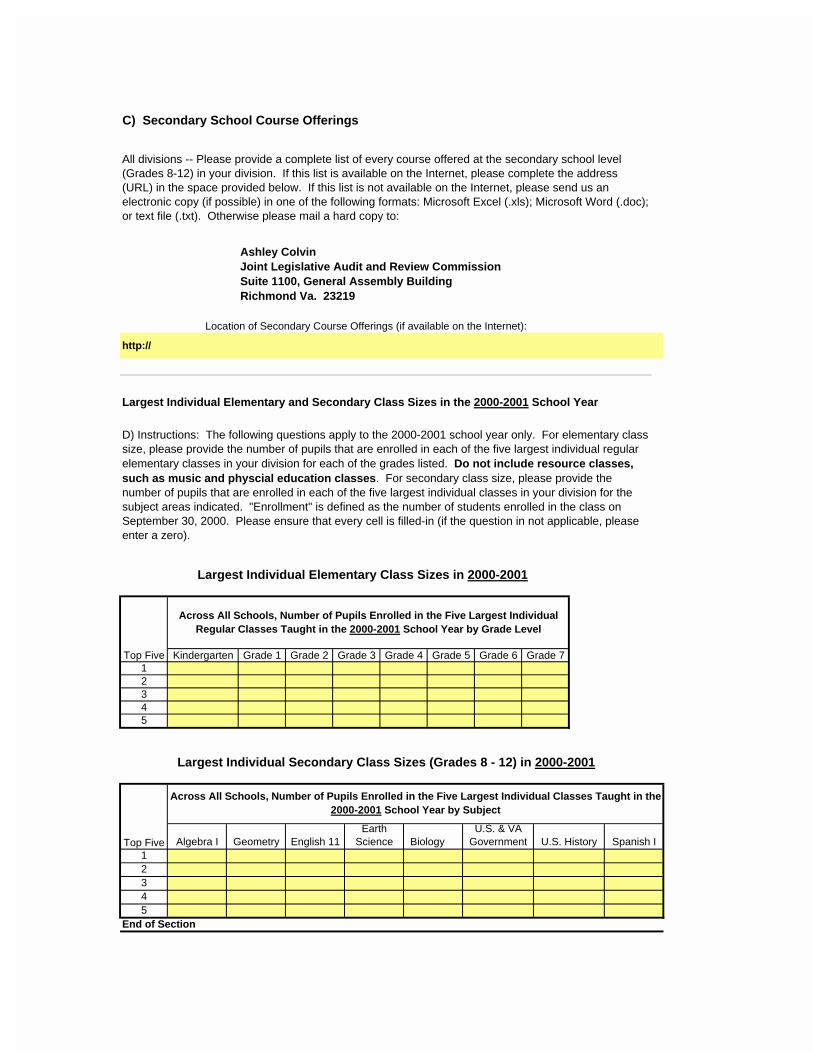
C) Secondary School Course Offerings
End of Section
All divisions -- Please provide a complete list of every course offered at the secondary school level (Grades 8-12) in your division. If this list is available on the Internet, please complete the address (URL) in the space provided below. If this list is not available on the Internet, please send us an electronic copy (if possible) in one of the following formats: Microsoft Excel (.xls); Microsoft Word (.doc); or text file (.txt). Otherwise please mail a hard copy to:
http://
5
Across All Schools, Number of Pupils Enrolled in the Five Largest Individual Classes Taught in the 2000-2001 School Year by Subject
Across All Schools, Number of Pupils Enrolled in the Five Largest Individual Regular Classes Taught in the 2000-2001 School Year by Grade Level
Ashley Colvin Joint Legislative Audit and Review Commission Suite 1100, General Assembly Building Richmond Va. 23219
Location of Secondary Course Offerings (if available on the Internet):
D) Instructions: The following questions apply to the 2000-2001 school year only. For elementary class size, please provide the number of pupils that are enrolled in each of the five largest individual regular elementary classes in your division for each of the grades listed. Do not include resource classes, such as music and physcial education classes. For secondary class size, please provide the number of pupils that are enrolled in each of the five largest individual classes in your division for the subject areas indicated. "Enrollment" is defined as the number of students enrolled in the class on September 30, 2000. Please ensure that every cell is filled-in (if the question in not applicable, please enter a zero).
Largest Individual Secondary Class Sizes (Grades 8 - 12) in 2000-2001
4
Algebra I Spanish IBiologyU.S. & VA
Government U.S. HistoryEarth
ScienceGeometry English 11
54
Top Five
321
32
Grade 5 Grade 6 Grade 71
Largest Individual Elementary Class Sizes in 2000-2001
Top Five Kindergarten Grade 1 Grade 2 Grade 3 Grade 4
Largest Individual Elementary and Secondary Class Sizes in the 2000-2001 School Year
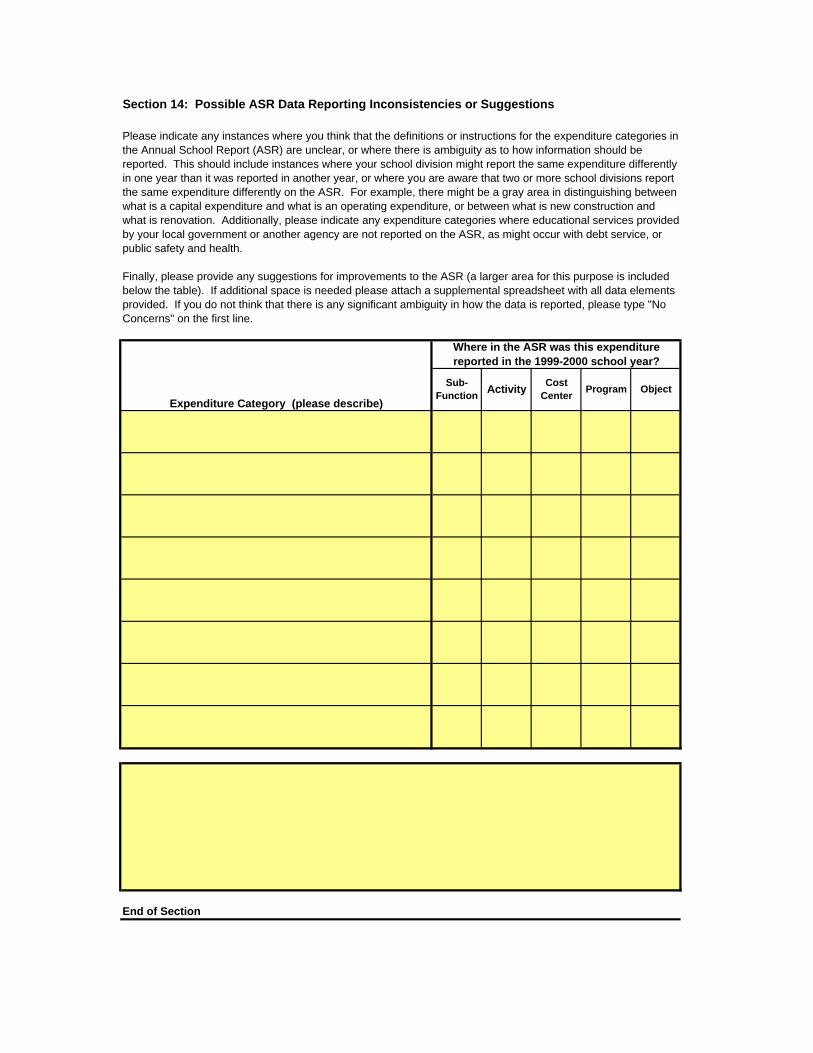
End of Section
Please indicate any instances where you think that the definitions or instructions for the expenditure categories in the Annual School Report (ASR) are unclear, or where there is ambiguity as to how information should be reported. This should include instances where your school division might report the same expenditure differently in one year than it was reported in another year, or where you are aware that two or more school divisions report the same expenditure differently on the ASR. For example, there might be a gray area in distinguishing between what is a capital expenditure and what is an operating expenditure, or between what is new construction and what is renovation. Additionally, please indicate any expenditure categories where educational services provided by your local government or another agency are not reported on the ASR, as might occur with debt service, or public safety and health.
Section 14: Possible ASR Data Reporting Inconsistencies or Suggestions
Expenditure Category (please describe)
Where in the ASR was this expenditure reported in the 1999-2000 school year?
Sub-Function
ActivityCost
CenterProgram Object
Finally, please provide any suggestions for improvements to the ASR (a larger area for this purpose is included below the table). If additional space is needed please attach a supplemental spreadsheet with all data elements provided. If you do not think that there is any significant ambiguity in how the data is reported, please type "No Concerns" on the first line.

Please e-mail your survey by December 7, 2000 to:
Section 15: Additional Comments
The following space is provided for any comments you may have about the issues raised in the survey (please attach additional sheets if necessary.)
Thank you for your time and cooperation.
������������������������
������������������������ ��
�������������� ����������������������������������������������������
�������������������������������
������������������ ��������������
������������
�������������������
������������ �������������������
�������������
��������������
����������������
�����������������
�������������
�� ��������� � � ���������������������������������������������������������������������������
�����������
������ �������������� ������ ���� ����������� �������
���������
JLARC Staff
������� �����������������������
���������� ��
��������������
���������������
��������
�����������
����������������
���������������
���������������������� ��!�"#�$�#%�����&�$�����'��!���"#'(���
���� �������������������������������
���� ���������������������������
��������� ����
���������������
Recent JLARC Reports
Improvement of Hazardous Roadway Sites in Virginia, October 1997Review of DOC Nonsecurity Staffing and the Inmate Programming Schedule, December 1997VRS Oversight Report No. 9: Semi-Annual VRS Investment Report, December 1997Technical Report: Gender Pay Equity in the Virginia State Workforce, December 1997The Secretarial System in Virginia State Government, December 1997Overview: Review of Information Technology in Virginia State Government, December 1997Review of the Comprehensive Services Act, January 1998Review of the Highway Location Process in Virginia, January 1998Overview: Year 2000 Compliance of State Agency Systems, January 1998Structure of Virginia’s Natural Resources Secretariat, January 1998Special Report: Status of Automation Initiatives of the Department of Social Services, February 1998Review of the Virginia Fair Housing Office, February 1998Review of the Department of Conservation and Recreation, February 1998VRS Oversight Report No. 10: Semi-Annual VRS Investment Report, July 1998State Oversight of Commercial Driver-Training Schools in Virginia, September 1998The Feasibility of Converting Camp Pendleton to a State Park, November 1998Review of the Use of Consultants by the Virginia Department of Transportation, November 1998Review of the State Board of Elections, December 1998VRS Oversight Report No. 11: Semi-Annual VRS Investment Report, December 1998Review of the Virginia Department for the Aging, January 1999Review of Regional Criminal Justice Training Academies, January 1999Interim Report: Review of the Health Regulatory Boards, January 1999Interim Report: Review of the Functional Area of Health and Human Resources, January 1999Virginia’s Welfare Reform Initiative: Implementation and Participant Outcomes, January 1999Legislator’s Guide to the Virginia Retirement System, 2nd Edition, May 1999VRS Oversight Report No. 12: Semi-Annual VRS Investment Report, July 1999Preliminary Inquiry, DEQ and VDH Activities to Identify Water Toxic Problems and Inform the Public, July 1999Final Report: Review of the Health Regulatory Boards, August 19991999 Report to the General Assembly, September 1999Competitive Procurement of State Printing Contracts, September 1999Review of Undergraduate Student Financial Aid in Virginia’s Public Institutions, October 1999Review of Air Medevac Services in Virginia, October 1999Alternatives to Stabilize Regional Criminal Justice Training Academy Membership, November 1999Review of the Statewide Human Services Information and Referral Program in Virginia, November 1999The Impact of Digital TV on Public Broadcasting in Virginia, November 1999Review of the Impact of State-Owned Ports on Local Governments, December 1999Review of the Use of Grievance Hearing Officers, December 1999Review of the Performance and Management of the Virginia Department of Health, January 2000Virginia’s Medicaid Reimbursement to Nursing Facilities, January 2000Interim Report: Review of the Virginia Housing Development Authority, January 2000Interim Report: Child Support Enforcement, January 2000Interim Special Report: Revolutionary War Veteran Gravesites in Virginia, February 2000VRS Oversight Report No. 14: Semi-Annual VRS Investment Report, July 2000Final Report: Review of the Virginia Housing Development Authority, August 2000Technical Status Report: An Overview of Expenditure Forecasting in Four Major State Programs, August 2000Virginia’s Welfare Reform Initiative: Follow-Up of Participant Outcomes, October 2000Final Report: Child Support Enforcement, November 2000Technical Report: The Cost of Raising Children, November 2000Review of the Medicaid Inpatient Hospital Reimbursement System, December 2000Special Inquiry: A Review of Child Support Enforcement and the Judicial Process, December 2000Review of the Virginia Distribution Center, January 2001Review of Construction Costs and Time Schedules for Virginia Highway Projects, January 2001Review of RMA and Powhite Parkway Extension Toll Facility Operations, January 2001Review of VDOT’s Administration of the Interstate Asset Management Contract, January 2001Review of Elementary and Secondary School Funding: Interim Status Report, January 2001
JLARC Home Page: http://jlarc.state.va.us

JLARCSuite 1100
General Assembly BuildingCapitol Square
Richmond, Virginia 23219(804) 786-1258 Fax: 371-0101
http://jlarc.state.va.us