Embed Size (px)
Citation preview

CONFIDENTIAL REPORT
Prepared for:Energy Networks Association
Review of Engineering Recommendation G5/4-1Stage 3 Connections and Higher Order Harmonics
Author : Andrew Bower
Repor t No : 79410
Apri l 2013

CONFIDENTIAL - This document may not be disclosed to any person other than the addressee or any duly authorised person within the addressee's company or organisation and may only be disclosed so far as is strictly necessary for the proper purposes of the addressee which may be limited by contract. Any person to whom the document or any part of it is disclosed must comply with this notice. A failure to comply with it may result in loss or damage to EATL or to others with whom it may have contracted and the addressee will be held fully liable therefor.
Care has been taken in the preparation of this Report, but all advice, analysis, calculations, information, forecasts and recommendations are supplied for the assistance of the relevant client and are not to be relied on as authoritative or as in substitution for the exercise of judgement by that client or any other reader. EA Technology Ltd. nor any of its personnel engaged in the preparation of this Report shall have any liability whatsoever for any direct or consequential loss arising from use of this Report or its contents and give no warranty or representation (express or implied) as to the quality or fitness for the purpose of any process, material, product or system referred to in the report.
All rights reserved. No part of this publication may be reproduced or transmitted in any form or by any means electronic, mechanical, photocopied, recorded or otherwise, or stored in any retrieval system of any nature without the written permission of the copyright holder.
© EA Technology Ltd April 2013
EA Technology Limited, Capenhurst Technology Park, Capenhurst, Chester, CH1 6ES; Tel: 0151 339 4181 Fax: 0151 347 2404http://www.eatechnology.com
Registered in England number 2566313
Project No: 79410
Review of Engineering Recommendation G5/4-1Stage 3 Connections and Higher Order Harmonics
EA Technology Review of Engineering Recommendation G5/4-1Stage 3 Connections and Higher Order Harmonics
Project No. 79410
Review of Engineering Recommendation G5/4-1
Stage 3 Connections and Higher Order Harmonics
by
Andrew Bower
SummaryThis report summarises the work which has been carried out under two work packages to consider how the requirements of ER G5/4-1 for stage 3 connections compares with other international standards and other national or company specific policies and procedures, and also to identify whether there are any existing planning limits in use for higher order harmonics above the 50th order.
The report presents the results of literature searches carried out in support of reviewing these topic areas giving a summary of over 40 standards, presentations or learned papers.
Work Package 1 considers the existing requirements in ENA Engineering Recommendation G5/4-1 for connections of non-linear load at 33kV and above, comparisons are made with the approaches of internationally recognised standards and other national or company specific approaches to the management of these connections. The issues highlighted in a number of papers concerning the practical and equitable allocation of emissions to customers seeking a connection are considered. Developments in the modelling of harmonic distortion are examined alongside the suggested requirements in IEC 61000-3-6.
Work Package 2 considers the existing position for harmonics in excess of the 50th order, examining the potential need to develop limits for emissions and how this will then inevitably lead to a need for the development of compatibility and immunity limits for networks and equipment. The difficulty posed in making measurements of the existing levels of harmonics at these higher frequencies by the inherent frequency response limitations of traditional voltage and current transformers is considered and an initial measurement regime is proposed.
From the results of the literature search conclusions are drawn and recommendations made for proposed next steps in the development of these topics.

EA Technology Review of Engineering Recommendation G5/4-1Stage 3 Connections and Higher Order Harmonics
Project No. 79410
ContentsPage
1 Introduction 11.1 Work Package 1 11.2 Work Package 2 11.3 Report Structure 2
2 Literature Search 32.1 Background Emissions Assessment 32.2 Other Standards 3
2.2.1 IEC TR 61000-3-6 32.2.2 A review of the new Australian Harmonics Standard AS/NZS 61000-3-6 72.2.3 IEEE 519 – Recommended Practices and Requirements for Harmonic Control in Electrical Power Systems 82.2.4 Interpreting IEEE 519 and Meeting its Harmonic Limits in VFD Applications
112.2.5 Comparison of IEEE 519 and IEC TR 61000-3-6 13
2.3 Existing Policies & Procedures 142.3.1 Hydro-Qu�bec Trans�nergie– Emission Limits for Customer Facilities Connected to the Hydro-Qu�bec Transmission System 142.3.2 PACIFICORP – Pacific Power Utah Power, Engineering Handbook 1C.4.1 Harmonic Distortion 152.3.3 Technical Requirements for Connecting to the Alberta Interconnected Electric System (IES) Transmission System 162.3.4 ATCO Electric Alberta – System Standard for the Installation of New Loads
172.3.5 Alpine Energy Limited – Rural Network Harmonic Standard 192.3.6 Abu Dhabi Distribution Company – Limits for Harmonics in the Electricity System19
2.4 Setting Planning Levels 202.4.1 Harmonic Planning Levels for Australian Distribution Systems 20
2.5 Harmonic Impedance 222.5.1 Impact of Reactive Power Compensation Equipment on the Harmonic Impedance of High Voltage Networks 222.5.2 Guide for Assessing Network Harmonic Impedance 23
2.6 Modelling Requirements 242.6.1 Power System Modelling and Harmonic Analysis 242.6.2 Grid Modelling for purposes of wind farm harmonic voltages evaluation 242.6.3 A Study Case on Harmonic Distortion Created by Wind Turbines 252.6.4 Impact of the Modelling of Transmission Network Components on the Emission Limits for Distorting Loads in HV System 252.6.5 Penetration of Harmonics from the Baltic Cable HVDC station into the Feeding AC Station – Cigre 1996 36-302 262.6.6 Modeling Distribution Networks for Simulation of Harmonics on the HV Systems 27
2.7 Emissions Allocation 282.7.1 Recommended Methods of Determining Power Quality Emission Limits for Installations Connected to EHV, HV, MV and LV Power Systems 282.7.2 Application of IEC 61000-3-6 29

EA Technology Review of Engineering Recommendation G5/4-1Stage 3 Connections and Higher Order Harmonics
Project No. 79410
2.7.3 The Impact of Rural MV & HV Underground Network Extensions on Harmonic Voltage Distortion 372.7.4 Voltage Droop Method 38
2.8 Academic Research Work 382.8.1 Harmonic Management in MV systems 38
2.9 Measurement 392.9.1 Method to Determine Contribution of the Customer and the Power System to the Harmonic Disturbance 392.9.2 Conditions for the Assessment of the Harmonic Compliance of an Installation 40
2.10 Higher Order Harmonics 412.10.1 Closing the Spectral Gaps 412.10.2 IEC 61000-4-7 432.10.3 CISPR 16 442.10.4 IEC 61000-4-30 442.10.5 Measurement – limitations 452.10.6 Harmonic Measurements Using Capacitor Voltage Transformers 45
3 WP 1 – Comparison of Methodologies 473.1 First Come First Served v Equal Rights 47
3.1.1 First come first served 473.1.2 Equal Rights 473.1.3 Potential Compromise 48
3.2 Measurement Requirements 493.2.1 Background Measurements 493.2.2 Measurements to check compliance 49
3.3 Modelling Requirements 503.3.1 Influence Coefficients 503.3.2 Extent of Modelling 50
3.4 Point of common coupling 50
4 WP 2 – Higher Order Limits 524.1 General 524.2 Measurement 52
4.2.1 Standards for Measurement 524.2.2 Standards for Installation 534.2.3 Limitations of transducers 53
5 Conclusions 545.1 Work Package 1 54
5.1.1 Background measurements 545.1.2 Point of common coupling 545.1.3 Modelling 555.1.4 Expansion of harmonic producing equipment 55
5.2 Work Package 2 565.2.1 Standards Gap 565.2.2 Measurement Issues 565.2.3 Potential Way Forward 565.2.4 Standards Development 565.2.5 Measurements 57
6 Recommendations 586.1 Work Package 1 58
6.1.1 Background Monitoring 58

EA Technology Review of Engineering Recommendation G5/4-1Stage 3 Connections and Higher Order Harmonics
Project No. 79410
6.1.2 Modelling 586.1.3 Encourage assessment within installation 586.1.4 Stage 3 shift to 132kV PCC 586.1.5 Standards Development 58
6.2 Work Package 2 596.2.1 Measurement Campaign 596.2.2 Standards Development 59
7 References 60
EA Technology Review of Engineering Recommendation G5/4-1Stage 3 Connections and Higher Order Harmonics
Project No. 79410
1 of 62
1 IntroductionThe Energy Networks Association have engaged EA Technology to undertake a focussed review of Engineering Recommendation G5/4-1 in particular examining issues relating to stage 3 connection assessments and the potential requirements for harmonic emission limits to be extended to harmonics beyond the 50th order.
Two distinct work packages have been identified Work Package 1 – Defining the extent of Harmonic Measurements required to ensure
the optimum technical/economic solution can be derived for DNOs and TSOs Work Package 2 – The necessity of evaluating harmonic levels above 50th harmonic
order
1.1 Work Package 1
This work package is required to consider the optimum approach to modelling networks for the purpose of carrying out stage 3 connection assessments. It is intended to resolve an agreed interpretation of the various and potentially conflicting standards which are available and could be used to inform the ER G5/4 stage 3 connection process and to consider what may be an appropriate level of modelling and monitoring. The aim of the work package is to remove uncertainty around the requirements for harmonic assessments and to arrive at an agreed coordinated approach to these measurements based on a technical assessment of the latest knowledge.
There are two overlapping sets of questions regarding the extent of modelling, those of the TSO and those of the DNOs.
For the TSO there is the question of whether it is appropriate to restrict the assessment of harmonic emission limits for new EHV connections to only EHV and 132kV nodes, where regular monitoring is already routinely carried out and to exclude lower voltage levels from measurements made to support these EHV connection assessments. It is acknowledged that the validity of this approach will be affected by any conclusions drawn regarding the influence coefficient between voltage levels.
For the DNO the questions are similar in that they seek to understand the extent to which the overall number of busbars which must be monitored can be limited and whether the range of voltage levels included within the measurements can also be restricted and if so, how to determine where the boundaries will be set.
1.2 Work Package 2
This work package reflects concerns that as the number of non-linear loads increases and as generation connected via power electronic converter technologies proliferates there may be potential for significant harmonics above the 50th order. At present there are no nationally or internationally recognised limits for harmonic emissions above this level on HV and EHV systems as IEC 61000-2-12 provides only indicative limits for LV and MV networks./
This work package aims to understand whether there are any planning levels at HV and EHV in use for these higher order harmonics in use and if so what are the levels, how to safeguard the power system and maintain immunity of existing equipment, to consider the
EA Technology Review of Engineering Recommendation G5/4-1Stage 3 Connections and Higher Order Harmonics
Project No. 79410
2 of 62
development of limits for +50th order harmonics and to consider how these might be measured with sufficient accuracy.
1.3 Report Structure
The report contains a summary of the various topic areas which have been explored as part of the literature searches. Under each section is a summary of the document reviewed and a brief commentary on the implications for this piece of work.
Each work package is then addressed as a separate section examining the implications of the literature search and considering the potential options which may be considered for further development.
Finally the conclusions and recommendations are presented in a single section but separated by work package.

EA Technology Review of Engineering Recommendation G5/4-1Stage 3 Connections and Higher Order Harmonics
Project No. 79410
3 of 62
2 Literature SearchA literature search has been carried out to examine the various issues highlighted in section 1 above. There have, as might be expected, been numerous papers addressing or touching on the issues under consideration. It would clearly be impractical to read and comment on every such paper and as such a selection of papers covering a range of pertinent aspects have been selected for further examination and discussion within this report.
Fundamental to the issue of assessing potential connections is consideration of what the aim of the assessment is and what are the limitations, legal or regulatory on how this may be achieved?
One of the key challenges is to strike an appropriate balance between the rigour and precision of the harmonic assessment and the time and cost of delivering this precision. It must also be considered whether a high level of precision is appropriate considering the many uncertainties which will necessarily have to be accounted for.
2.1 Background Emissions Assessment
The key aspect in determining the acceptability of a proposed connection of non-linear equipment is to predict the cumulative effect of this new distorting equipment in combination with the effects of the pre-existing distorting equipment with a view to ensuring that the resultant conditions remain within both the overall and individual harmonic voltage distortion limits.
Key to this is a representative assessment of the pre-existing harmonic distortion levels. It is normal practice to make measurements for a period of at least one week in order to capturethe range of variations in harmonic emissions which might be experienced between the weekdays and weekends. Engineering Recommendation G5/4-1 [1] section 5.15 requires that the measurements be made over at least 7 days when the fault levels at the point of common coupling are representative of the post-connection conditions. Where this condition cannot be met then the measured values should be scaled to allow for the effect of changes in the fault level at the point of common coupling. Further details are provided in section 6 of Engineering Technical Report 122 [2] regarding the duration of measurements which are required to capture the cyclic variation in harmonic distortion and the types of measurements and which values should be used for the assessment to demonstrate compliance.
Based on IEC 61000-4-30 [3] measurements should made to include the 3 second and 10 minute aggregation, which can then be selected as appropriate for the assessment. The 95% value from the cumulative probability function should be used in the assessment process. The decision to select 3 second or 10 minute values is determined by whether the emissions of the equipment to be connected will be relatively steady or characterised by short duration peak outputs.
2.2 Other Standards
2.2.1 IEC TR 61000-3-6
This technical report [4] provides guidance on the principles which can be used to determine the requirements for the connection of distorting equipment to the MV HV and EHV public

EA Technology Review of Engineering Recommendation G5/4-1Stage 3 Connections and Higher Order Harmonics
Project No. 79410
4 of 62
transmission and distribution networks. The report addresses the allocation of capacity within the power system to absorb distortion, it does not address potential methods of mitigation nor does it consider how the capacity of the network to accept additional distorting connections may be increased.
IEC TR 61000-3-6 acknowledges that the boundaries between different descriptions of voltage levels may vary between countries. For the avoidance of confusion the boundaries used within 61000-3-6 are defined as:
low voltage (LV) refers to Un ≤1 kV; medium voltage (MV) refers to 1 kV < Un ≤35 kV; high voltage (HV) refers to 35 kV < Un ≤230 kV; extra high voltage (EHV) refers to 230 kV < Un.
Despite the definition of these descriptions for voltage levels it is also noted that the actual voltage is less important than the function of that system. Accordingly some HV systems may be assigned planning levels between those nominally suggested for MV and HV systems if the purpose of that system renders that appropriate.
2.2.1.1 Compatibility LevelsThe compatibility levels are the reference values to ensure the coordination of emissions from and immunity of equipment connected to the public distribution network, the compatibility levels are generally based on the 95% probability levels for entire systems rather than at a specific location. The compatibility levels for LV and MV systems are described in IEC 61000-2-2 and IEC 61000-2-12 respectively and it must be remembered that these levels relate to steady state harmonic conditions; for short term effects as characterised by 3 second average measurements the compatibility levels may be found by multiplication of the steady state level by a factor related to the harmonic order as shown in equation 1
Equation 1 – harmonic limit multiplier for short duration harmonics
There are no compatibility levels defined in IEC standards for HV and EHV systems.
2.2.1.2 Planning LevelsWhereas compatibility levels are defined within the IEC standards as described above planning levels may be determined on an individual basis by the network operator, the values which are reproduced within the document are indicative values only. Planning levels must be less than or equal to the compatibility level and should be selected to facilitate coordination of harmonic distortion between different voltage levels. It is noted within the document that care must be exercised when specifying very low values for individual harmonics particularly for higher order harmonics where difficulties may be experienced in accurately measuring these harmonics at HV and EHV levels. Planning levels will typically be developed for steady state 10 minute average conditions and similar to the compatibility levels the individual harmonic planning levels may be increased in the case of short term bursts of harmonic distortion as characterised by 3 second average measurements by the use of the same factor described in equation 1 above. The relationship between emission, compatibility and immunity limits are illustrated in Figure 1 below.
The planning levels are used to inform the allocation of emission limits for individual customers at MV levels and above.

EA Technology Review of Engineering Recommendation G5/4-1Stage 3 Connections and Higher Order Harmonics
Project No. 79410
5 of 62
Figure 1 – Network Planning, Compatibility and Immunity levels
2.2.1.3 Stage 1 – simplified evaluation of disturbance emissionUnder stage 1 assessment the connection of customers taking a small demand or customers with only small amounts of distorting equipment may be accepted without the need to carry out detailed evaluation of the emissions from the installation or the network response. Two possible criteria for acceptance are offered; agreed power as a criterion and weighted distorting power as a criterion.
Agreed power – where the agreed power of the customer is less than or equal to 0.2% of the short circuit power at the point of evaluation then such a distorting installation may be connected without further examination.
Weighted distortion power – using weighting factors related to the types of distorting equipment within the installation a weighted sum of distorting power can be assessed. If the weighted distorting power of the installation is less than or equal to 0.2% of the short circuit power at the point of evaluation then the connection may be accepted under stage 1.
Where neither of these criteria can be met a stage 2 assessment must be made.
2.2.1.4 Stage 2 – emission limits relative to actual system characteristicsConsidering the actual capacity of the system to accommodate distorting loads taking account of the phase differences of harmonic currents, the system impedance and future load then installations with higher emissions than would be permissible under stage 1 may be connected. Two potential approaches to the apportionment of emission limits are presented.
The first simplified approach sets emission limits for individual harmonics based on their percentage of fundamental current. An example of such limits is given in the text and it applies to customers where:
the customer has an agreed power ≤1MVA; the result of agreed power / short circuit power is <1%, the customer does not use power factor correction capacitors or filters; and the pre-existing harmonic levels allow it.

EA Technology Review of Engineering Recommendation G5/4-1Stage 3 Connections and Higher Order Harmonics
Project No. 79410
6 of 62
The second approach takes account of setting planning levels for a network segment based on its contribution to the global network harmonic distortion. Individual customers will each be allowed only a proportion of the total permissible emissions; the report suggests that a reasonable approach is to take the ratio between the customers agreed power consumption and the total supply capability of the network. In cases where the existing harmonic levels are higher than they should be for the demand connected, the report suggests lowering the emissions limit for new installations, reconsidering planning levels or raising the absorption capacity of the network.
It is acknowledged in the report that for customers with a low agreed power the equation used to apportion voltage harmonic emissions may lead to impractically low limitations, in such cases the report advocates setting a minimum limit of 0.1% for the relevant harmonic order(s).
2.2.1.5 Stage 3 – acceptance of higher emission levels on a conditional basisStage 3 assessment under IEC 61000-3-6 does not have any defined limits; rather it describes some circumstances where the network operator may accept a distorting installation to emit disturbances beyond the basic limits allowed in stage 2, e.g. the installation might produce harmonics with a cancellation effect; distorting parts of the installation might not operate simultaneously; the actual system impedance might be less than hypothesized; the exceedance of stage 2 limits only occur occasionally. The report recommends that “A careful study of the connection should always be carried out, taking account of pre-existing distortion and of the expected contribution from the considered installation for different possible operating conditions.” The allocation of higher emission limits may be conditional and subject to limitations imposed by the network operator. It is suggested that such conditional limits may be temporary in nature for as long as the spare capacity exists suggesting that the customer may have to install mitigation at some later unspecified date when another customer seeks a new or enlarged connection.
2.2.1.6 Annex A: Envelope of the maximum expected impedanceThis annex which is drawn from ENA ETR 112 outlines a means whereby an initial assessment can be made of what is the worst level of emissions which might be expected from a given installation. Using current harmonic emission data for the proposed connection and worst case harmonic impedance data a conservative assessment of the potential emissions may be made. If when using these harmonic impedance values to assess potential harmonic voltage emissions the results suggest that an installation will remain within the voltage emission limits at the point of common coupling then the connection may be made with minimum risk. If however the results suggest that the installation will exceedthe permissible emission limits then before mitigating measures are considered a more refined assessment should be performed.
The annex provides details of how the worst case impedance values may be determined at LV, 11kV and 33kV, the graph of 11kV impedance is drawn as far as the 20th order and general guidance is give at 33kV as far as the 16th harmonic beyond which specific measurements may be required. It should be remembered that ETR 112 from which this material is drawn dates from 1988 and predates the introduction of limits within ER G5/3 above the 25th.
2.2.1.7 Annex B: Guidance for Allocating Planning Levels and Emission Levels at MV
This annex, which echoes work carried out in Australia described in sections 2.4.1 & 2.7.2.2 below, provides guidance on how a DNO might determine the planning levels to be applied

EA Technology Review of Engineering Recommendation G5/4-1Stage 3 Connections and Higher Order Harmonics
Project No. 79410
7 of 62
within an MV system which itself has series MV voltage levels e.g. 33kV and 11kV and how to allocate emissions to customer in MV networks with long feeders.
2.2.1.8 Annex C: Example of calculation of global MV + LV contributionThis annex illustrates the calculation of the acceptable global contribution of the MV + LV systems and also demonstrates that care must be taken in the case of resonant conditions when the transfer coefficient between HV and MV systems exceeds unity.
2.2.1.9 Annex D: Method for sharing planning levels and allocating emission levels in meshed EHV_HV systems
This annex builds on the method described in section 8.2 of IEC 61000-3-6 for the apportionment of planning levels, first examining a general method for the sharing of planning levels and then examining the application of this method taking account of resonance effects. The application of influence coefficients to assist in the identification of areas where harmonic distortion may be higher and the apportionment of emissions limits is described in this section.
2.2.2 A review of the new Australian Harmonics Standard AS/NZS 61000-3-6
This paper [5] was published at the time that Australia moved from its previous standard AS2279.2 Disturbances in Mains Supply Networks Part2: Limitation of Harmonics caused by Industrial Equipment to an Australian implementation of IEC TR 61000-3-6 which was given the status of a standard rather than a technical report. .
The previous standard, AS 2279.2, adopted a three stage approach viz: Stage 1 – conservative but simple assessment based on the ratio of converter rating
to fault level at the point of common coupling. Stage 2 – allowed higher converter ratings if the existing or background harmonic
levels had been measuredo Background harmonics less than 25% of the standard levels permitted
converter ratings are based on the type of converter and fault levelo Background harmonics between 25% and 75% of the standard levels then
converter ratings allowed are half that permitted for levels below 25% Stage 3 – for higher background levels a full harmonic investigation was required.
Whilst, when it was first produced, AS 2279.2 proved to be an adequate means of managing the issue of harmonic disturbances as the nature and number of such distorting loads increased over time several deficiencies were exposed.
No account was taken of the variation of harmonics with time was taken Stage 2 assessment gave the largest harmonic distortion allowance to the first
converter to be connected to a particular part of the network. Any subsequent converters of the same rating were allowed a lower emissions limit.
Larger converters were not handled in stage 1 or 2, industry rules which evolved to handle this (presumably avoiding stage 3 connections) proved to be inadequate in some cases
There were issues caused by the division of the background emissions for stage 2 and 3 assessments where connections were required close to the break points.
The harmonic emissions of ac drives can be quite different to those experienced from dc drives on which the development of Stage 2 was based.
The paper reviews the changes which faced the electricity companies and their customers as the change was implemented and how this new standard would address the problems identified above. A worked example demonstrates the differences between the two
EA Technology Review of Engineering Recommendation G5/4-1Stage 3 Connections and Higher Order Harmonics
Project No. 79410
8 of 62
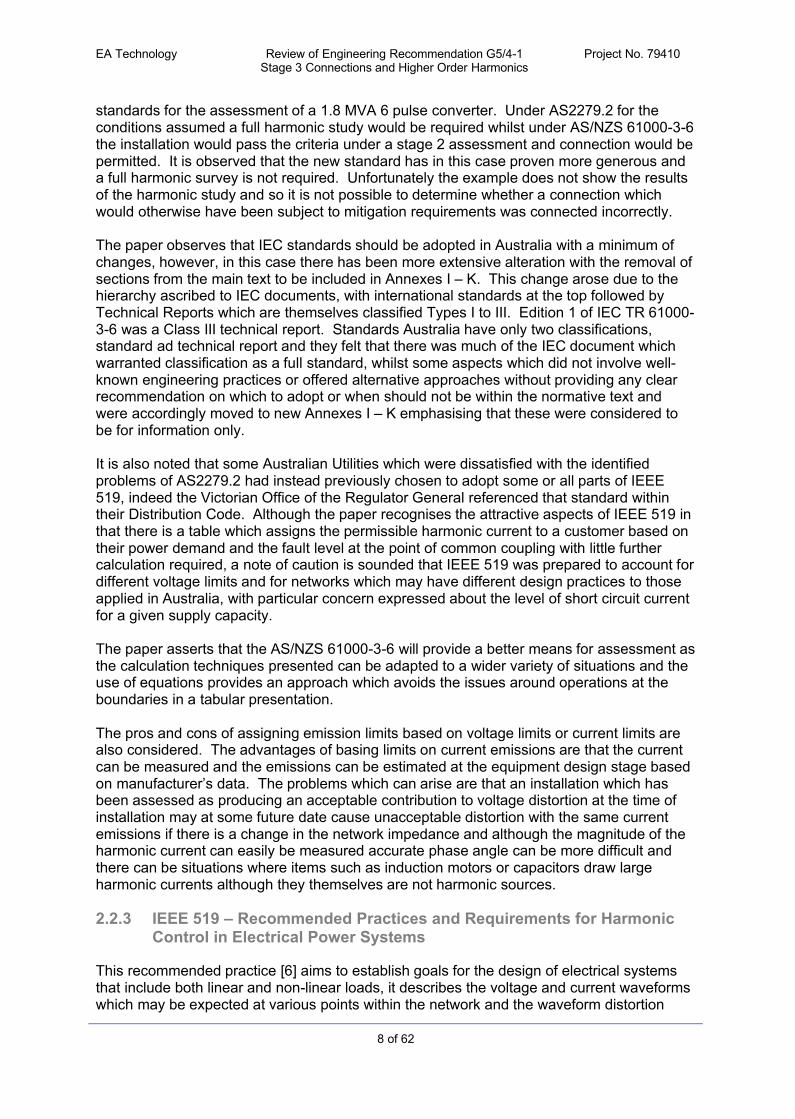
standards for the assessment of a 1.8 MVA 6 pulse converter. Under AS2279.2 for the conditions assumed a full harmonic study would be required whilst under AS/NZS 61000-3-6 the installation would pass the criteria under a stage 2 assessment and connection would be permitted. It is observed that the new standard has in this case proven more generous and a full harmonic survey is not required. Unfortunately the example does not show the results of the harmonic study and so it is not possible to determine whether a connection which would otherwise have been subject to mitigation requirements was connected incorrectly.
The paper observes that IEC standards should be adopted in Australia with a minimum of changes, however, in this case there has been more extensive alteration with the removal of sections from the main text to be included in Annexes I – K. This change arose due to the hierarchy ascribed to IEC documents, with international standards at the top followed by Technical Reports which are themselves classified Types I to III. Edition 1 of IEC TR 61000-3-6 was a Class III technical report. Standards Australia have only two classifications, standard ad technical report and they felt that there was much of the IEC document which warranted classification as a full standard, whilst some aspects which did not involve well-known engineering practices or offered alternative approaches without providing any clear recommendation on which to adopt or when should not be within the normative text and were accordingly moved to new Annexes I – K emphasising that these were considered to be for information only.
It is also noted that some Australian Utilities which were dissatisfied with the identified problems of AS2279.2 had instead previously chosen to adopt some or all parts of IEEE 519, indeed the Victorian Office of the Regulator General referenced that standard within their Distribution Code. Although the paper recognises the attractive aspects of IEEE 519 in that there is a table which assigns the permissible harmonic current to a customer based ontheir power demand and the fault level at the point of common coupling with little further calculation required, a note of caution is sounded that IEEE 519 was prepared to account for different voltage limits and for networks which may have different design practices to those applied in Australia, with particular concern expressed about the level of short circuit current for a given supply capacity.
The paper asserts that the AS/NZS 61000-3-6 will provide a better means for assessment as the calculation techniques presented can be adapted to a wider variety of situations and the use of equations provides an approach which avoids the issues around operations at the boundaries in a tabular presentation.
The pros and cons of assigning emission limits based on voltage limits or current limits are also considered. The advantages of basing limits on current emissions are that the current can be measured and the emissions can be estimated at the equipment design stage based on manufacturer’s data. The problems which can arise are that an installation which has been assessed as producing an acceptable contribution to voltage distortion at the time of installation may at some future date cause unacceptable distortion with the same current emissions if there is a change in the network impedance and although the magnitude of the harmonic current can easily be measured accurate phase angle can be more difficult and there can be situations where items such as induction motors or capacitors draw large harmonic currents although they themselves are not harmonic sources.
2.2.3 IEEE 519 – Recommended Practices and Requirements for Harmonic Control in Electrical Power Systems
This recommended practice [6] aims to establish goals for the design of electrical systems that include both linear and non-linear loads, it describes the voltage and current waveforms which may be expected at various points within the network and the waveform distortion

EA Technology Review of Engineering Recommendation G5/4-1Stage 3 Connections and Higher Order Harmonics
Project No. 79410
9 of 62
goals for the system designer. Compliance with these design goals should minimise the interference between electrical equipment connected to the distribution system.
The recommendations address emission limits for steady state conditions, it is acknowledged that transient conditions exceeding these limits may be encountered.
The principal effects of particular network elements on the frequency response of the power system are described in Section 5 of IEEE 519. This section also considers the effect of current injection into a transmission system and the many complex current paths that exist and the ways that the frequency response of the system can be significantly altered by the switching of capacitor banks on the transmission system.
Analysis methods are described in section 8 of IEEE 519, this section describes the situations where a full three phase model may be required rather than a single phase positive sequence representation of the network. In particular this is considered to be necessary where telephone interference is a cause for concern where the influence of residual (zero sequence) harmonics is important. To accurately determine the residual harmonic currents the system or harmonic unbalance must be represented. In addition where there are single phase or unbalanced harmonic sources or single phase capacitor banks then a three phase system model is required.
For low frequencies and shorter lines found in distribution networks a simple series impedance is usually considered to be sufficient, whereas at higher frequencies (>25th order) the capacitance of these lines or cables should also be included. At transmission voltage levels it is necessary to take account of the distribution of capacitance and the effects of conductor transposition to accurately represent the frequency response characteristics of the line.
Section 9 of the recommended practice covers the measurements which are necessary for the assessment and management of emissions and distortion at the customer’s connection point and elsewhere in the network. This section describes some of the reasons for making measurement and considers the accuracy requirements of the measuring device and the potential errors introduced by available transducers.
IEEE 519 Section 10 addresses the current distortion limits which are typically applied at the point of common coupling for individual customers. The harmonic limits which are established are only permissible if the transformers are suitably rated in accordance with the requirements of IEEE C57.12.00-1987 or if the effects have been assessed inline with the methodology contained in IEEE C57.110-1986.
The current emission limits for the three voltage ranges included within IEEE 519 are reproduced in Table 1 below.

EA Technology Review of Engineering Recommendation G5/4-1Stage 3 Connections and Higher Order Harmonics
Project No. 79410
10 of 62
Table 1 – Reproduction of IEEE 519 Tables 10.3, 10.4 & 10.5
ISC/IL h<11 11≤h<17 17≤h<23 23≤h<35 35≤h TDDVrms ≤ 69kV
<20* 4.0 2.0 1.5 0.6 0.3 5.020-50 7.0 3.5 2.5 1.0 0.5 8.0
50-100 10.0 4.5 4.0 1.5 0.7 12.0100-1000 12.0 5.5 5.0 2.0 1.0 15.0
>1000 15.0 7.0 6.0 2.5 1.4 20.069kV < Vrms ≤ 161kV
<20* 2.0 1.0 0.75 0.3 0.15 2.520-50 3.5 1.75 1.25 0.5 0.25 4.0
50-100 5.0 2.25 2.0 0.75 0.35 6.0100-1000 6.0 2.75 2.5 1.0 0.5 7.5
>1000 7.5 3.5 3.0 1.25 0.7 10.0Vrms > 161kV
<50 2.0 1.0 0.75 0.3 0.15 2.5≥50 3.5 1.75 1.25 0.5 0.25 4.0
Even harmonics are limited to 25% of the odd harmonic limits above
Current distortions that result in a dc offset, e.g. half wave converters, are not allowed.
*All power generation equipment is limited to these values of current distortion regardless of the actual short circuit ratio, ISC/IL.
WhereISC = maximum short circuit current at PCCIL= maximum demand load current (fundamental frequency component) at PCC
Figure 2 – IEEE 519 Fig 10.2 Probability distribution of Current THD
EA Technology Review of Engineering Recommendation G5/4-1Stage 3 Connections and Higher Order Harmonics
Project No. 79410
11 of 62
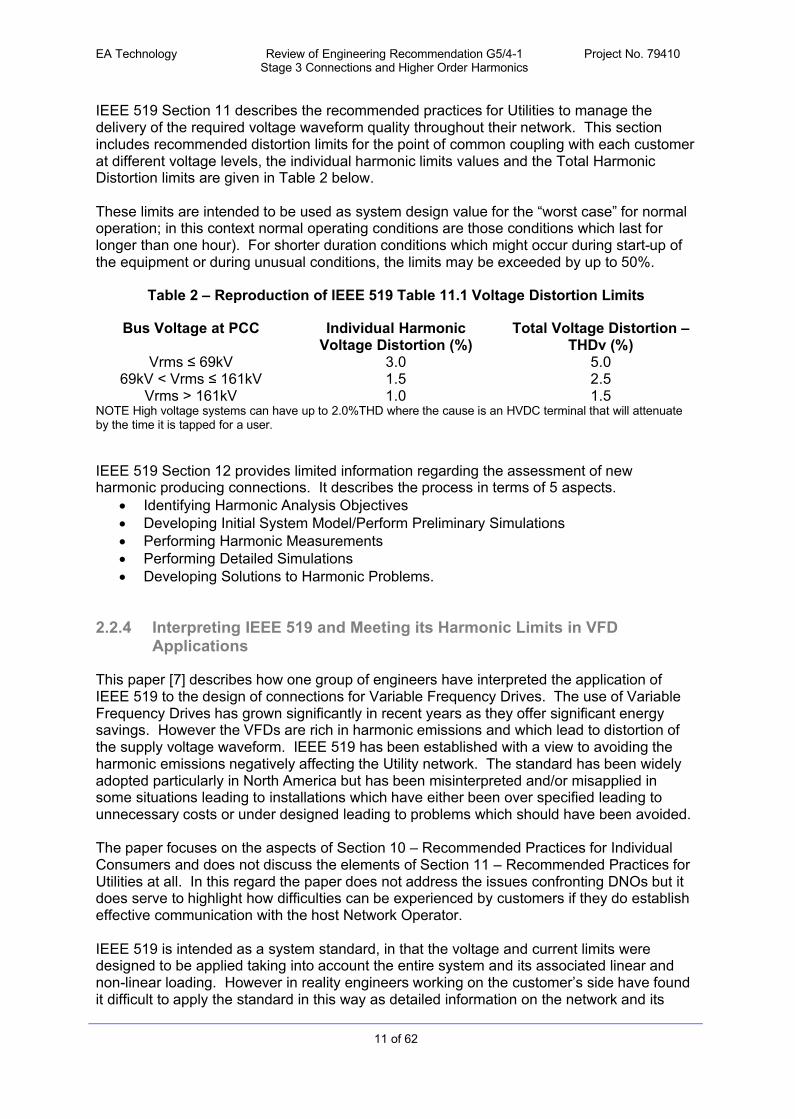
IEEE 519 Section 11 describes the recommended practices for Utilities to manage the delivery of the required voltage waveform quality throughout their network. This section includes recommended distortion limits for the point of common coupling with each customer at different voltage levels, the individual harmonic limits values and the Total Harmonic Distortion limits are given in Table 2 below.
These limits are intended to be used as system design value for the “worst case” for normal operation; in this context normal operating conditions are those conditions which last for longer than one hour). For shorter duration conditions which might occur during start-up of the equipment or during unusual conditions, the limits may be exceeded by up to 50%.
Table 2 – Reproduction of IEEE 519 Table 11.1 Voltage Distortion Limits
Bus Voltage at PCC Individual Harmonic Voltage Distortion (%)
Total Voltage Distortion –THDv (%)
Vrms ≤ 69kV 3.0 5.069kV < Vrms ≤ 161kV 1.5 2.5
Vrms > 161kV 1.0 1.5NOTE High voltage systems can have up to 2.0%THD where the cause is an HVDC terminal that will attenuate by the time it is tapped for a user.
IEEE 519 Section 12 provides limited information regarding the assessment of new harmonic producing connections. It describes the process in terms of 5 aspects.
Identifying Harmonic Analysis Objectives Developing Initial System Model/Perform Preliminary Simulations Performing Harmonic Measurements Performing Detailed Simulations Developing Solutions to Harmonic Problems.
2.2.4 Interpreting IEEE 519 and Meeting its Harmonic Limits in VFD Applications
This paper [7] describes how one group of engineers have interpreted the application of IEEE 519 to the design of connections for Variable Frequency Drives. The use of Variable Frequency Drives has grown significantly in recent years as they offer significant energy savings. However the VFDs are rich in harmonic emissions and which lead to distortion of the supply voltage waveform. IEEE 519 has been established with a view to avoiding the harmonic emissions negatively affecting the Utility network. The standard has been widely adopted particularly in North America but has been misinterpreted and/or misapplied in some situations leading to installations which have either been over specified leading to unnecessary costs or under designed leading to problems which should have been avoided.
The paper focuses on the aspects of Section 10 – Recommended Practices for Individual Consumers and does not discuss the elements of Section 11 – Recommended Practices for Utilities at all. In this regard the paper does not address the issues confronting DNOs but it does serve to highlight how difficulties can be experienced by customers if they do establish effective communication with the host Network Operator.
IEEE 519 is intended as a system standard, in that the voltage and current limits were designed to be applied taking into account the entire system and its associated linear and non-linear loading. However in reality engineers working on the customer’s side have found it difficult to apply the standard in this way as detailed information on the network and its

EA Technology Review of Engineering Recommendation G5/4-1Stage 3 Connections and Higher Order Harmonics
Project No. 79410
12 of 62
loading is not generally available to them at the design stage. Additional complications arise because the standard applies the maximum load current as the basis for determining the permissible emissions limits and at the design stage this may not be known with sufficient accuracy.
These issues often lead to designers taking a conservative approach and ensuring that the emission limits are met at each individual item of non-linear equipment. Although this will likely be effective in ensuring that the overall installation does not cause unacceptable levels of harmonic distortion it may well lead to costly and unnecessary mitigation measures being specified.
The current emission limits are determined from the ratio of the Short Circuit current at the point of common coupling and the customer’s maximum load current. A lower ratio implies either a weak system with a high impedance, large customer or perhaps even both. The lower the ratio the lower the permissible individual current emissions and total demand distortion. Since the intention of the standard, in common with all electromagnetic compatibility standards, is to ensure that the distortion caused by one customer does not lead to unacceptable disturbances for another customer the limits were therefore intended to be applied at the point on the network where the distortion could affect another customer; this is referred to as the point of common coupling. A critical aspect of the assessment is the determination of where the point of common coupling is considered to be. The definition included within section 10 was quite difficult to apply in practice and so a further definition has been provided by the IEEE 519 working group.
The initial part of the revised definition of the point of common coupling will likely appear familiar to UK network and system operators, ‘The point of common coupling with the consumer/utility interface is the closest point on the utility side of the customer’s service where another utility customer is or could be supplied.’ The definition goes on to say, ‘The ownership of any apparatus such as a transformer that the utility might provide in the customer’s system is immaterial to the definition of the point of common coupling.’ The implication of this second point is that for a situation where a customer is the only customer from a DNO owned transformer then the Point of Common Coupling is on the primary side of the transformer. Whilst in many cases this may in practical terms be the reality the result is that the ratio of short circuit current to maximum demand current is increased allowing higher levels of current emissions which will lead to higher levels of voltage distortion at the secondary side of the transformer. This may not affect other customers which is the Utilities primary concern but may lead to the customer causing themselves unacceptable levels of distortion on their own installation. The paper suggests that whilst applying the limits at the primary of the transformer may be permissible under the standard, good engineering practice should discourage this approach and encourage the consideration of the secondary side distortion.
The issue of what maximum load should be considered is difficult to determine at the design stage the standard recommends that the average current of the maximum demand in the preceding 12 months should be used. Clearly such a value will not be available at the design stage and as the eventual Maximum Demand will be affected by the final operating mode of the installation it is difficult if not impossible to determine with any accuracy what this value should be. The most practical approach is suggested to be using the maximum rated current of the non-linear load whilst selecting any necessary mitigation to be of a type whose performance is not degraded too greatly at lighter loads. Whilst the percentage distortion may increase at lighter loads the individual ampere emissions at each harmonic frequency will generally be highest at maximum load and it is the ampere value which gives rise to the voltage distortion rather than the level of current distortion.

EA Technology Review of Engineering Recommendation G5/4-1Stage 3 Connections and Higher Order Harmonics
Project No. 79410
13 of 62
The paper concludes that the application of limits in IEEE 519 to variable frequency drives is a useful but often challenging exercise. Most VFD suppliers and filter manufacturers can assist by running a power system harmonic analysis for a specific application. This analysis may be carried out to compare the performance and cost of various harmonic mitigation methods. Overall the paper asserts that it is important that the interactions of the various elements of the power system must be understood.
2.2.5 Comparison of IEEE 519 and IEC TR 61000-3-6
This paper and presentation [8, 9] from Professor Mark Halpin at the University of Auburn who is the Chairman of the IEEE Task Force responsible for the update of IEEE 519 provides a summary comparison of the approach and requirements of IEEE 519 and IEC 61000-3-6 for the management of harmonic emissions. The paper examines the similarities and differences between the two documents and considers how each contributes to their aim of managing harmonic voltage distortion.
The principal difference between the two approaches is that IEEE 519 seeks to control the voltage distortion by the placing direct current limits upon the customer. The magnitude of the permissible harmonic current in IEEE 519 is defined according to the voltage level and varies and with the ratio of short circuit current and the maximum demand at the point of common coupling. Whereas in IEC 61000-3-6 the current limits are not specifically defined, rather the proportion of voltage distortion permitted by an individual customer is defined for each harmonic based on the available capacity to absorb distortion at the connection point in the network and appropriate current emission limits for each harmonic order determined to ensure that permissible distortion is not exceeded. Voltage distortion limits in IEEE 519 are quite different to those applied in IEC 61000-3-6. Whereas the permissible voltage distortion for individual harmonics in IEC 61000-3-6 decreases as harmonic order increases in IEEE 519 a constant value of voltage distortion for each harmonic is permitted together with a maximum value of THD.
IEEE 519 limits the consideration of any time variation of harmonic emissions to permitting current harmonic limits to be exceeded by up to 50% for short periods of time, whilst IEC 61000-3-6 addresses the issue by considering the percentage of time where limits will not be exceeded, with the 95th percentile value selected for the short time 10 minute average and the 99th percentile selected for the very short time 3 second average. The permissible current emissions for the very short time emissions may be increased by a multiplying factor specific to each harmonic order.
IEEE 519 does not have any limits for interharmonics. IEC 61000-3-6 addresses the issue of interharmonic voltage limits by recommending a frequency independent limit of 0.2% which should ensure that distortion is low enough not to cause problems with signalling and communications equipment.
The underlying principle of IEEE 519 is that of shared responsibility between the customer and the utility to ensure that the voltage harmonic distortion is kept below the permitted levels. All customers are permitted a share of the system’s ability to absorb harmonic emissions, if with all customers emissions within their permitted limits there are problems experienced with the levels of voltage distortion then the utility is required to take remedial action to restore the voltage quality to the expected conditions. The paper observes that practical experience is suggesting that Utility companies using the IEEE harmonic limits standards are seeing an increasing number of cases where they are required to make system improvements to maintain the voltage quality. This is leading to pressure on the standards making bodies to decrease the permissible harmonic customer emission limits.

EA Technology Review of Engineering Recommendation G5/4-1Stage 3 Connections and Higher Order Harmonics
Project No. 79410
14 of 62
The IEC 61000-3-6 approach is to assign current limits to customers which are more directly linked to the voltage quality targets and are designed to ensure that when all customers are operating with in their limits then system level voltage quality problems will not exist. The paper observes that utility companies utilising the IEC 61000-3-6 methodology are finding an increased need to design their systems differently. This is leading to pressure on standards making bodies to raise the compatibility levels.
2.3 Existing Policies & Procedures
A search of the internet has uncovered a number of DNO policies and examples of guidance from manufacturers on how to achieve compliance with the requirements of specific standards.
2.3.1 Hydro-Qu�bec Trans�nergie– Emission Limits for Customer Facilities Connected to the Hydro-Qu�bec Transmission System
This document [10] describes the emission limits and the associated assessment methods for electrical disturbances, including harmonics, unbalance, rapid voltage changes and flicker caused by equipment in customer facilities connected to the Hydro-Qu�bec transmission system. The emission limits are applicable to connections between 44kV and315kV which:
connect new customer facilities to the power system or return to service facilities which the customer has decommissioned or shut-down
add disturbance producing equipment or change equipment characteristics at existing facilities.
The statistical classification of measurement data for assessment against the emission limits is made on a daily basis, although the measurements may be made over several days or weeks in order to cover expected operating conditions. A 95% or 99% daily value may be selected.
There are two levels of assessment applied to such new or revised connections, simplified and detailed assessment.
Under the simplified assessment criteria, customers are not required to produce a detailed assessment of their harmonic emissions propagated to the transmission if the total power of their harmonic producing equipment is below a threshold set in Table 1 of the document AND that value is less than 0.25% of the short-circuit power at the interface point under common operating conditions. To qualify for a simplified assessment the customer is required to confirm in writing the total power of their harmonic producing equipment to demonstrate that the facility meets the criteria.
If a customer’s facility is unable meet the criteria describe above for a simplified assessment they are required to provide a detailed study of the harmonic emissions from the facility using a prescribed method and to demonstrate that the facility is designed to comply with the limits for harmonic current emissions and limits for telephone interference. Both of these limits are subject to evaluation under common operating conditions for all affected customers whilst for those customers for whom the ratio of short circuit power to reference power (peak demand) is less than 30 it is also necessary for the customer to submit an assessment of emission levels to ensure that they do not exceed twice the limits allowable under common operating conditions.

EA Technology Review of Engineering Recommendation G5/4-1Stage 3 Connections and Higher Order Harmonics
Project No. 79410
15 of 62
The assessment of harmonic emission levels are made using the harmonic emission loci provided by Hydro-Qu�bec. Common Operating Conditions, these are determined to include system conditions which may be expected to be present for greater than 5% of the time over a year. Occasional Operating Conditions are determined to include outage conditions which may be expected to occur for between 1% and 5% of the time in a year.
Measurement of harmonic emission levels are made using 10 minute aggregation intervals as specified in IEC 61000-4-7, the measured emission levels must have a 95% daily value below the allowable emission limits and a 99% daily value not exceeding 1.5 times the allowable emission limits.
2.3.2 PACIFICORP – Pacific Power Utah Power, Engineering Handbook1C.4.1 Harmonic Distortion
This document [11] was produced and made available for customers considering the installation of equipment which could produce harmonic distortion on the PACIFICORP network. IEEE 519 Recommended Practices and Requirements for Harmonic Control in Power Systems, and IEEE C57.110 Recommended Practice for Establishing Transformer Capability When Supplying Non-sinusoidal Load Currents are both referenced as underpinning the principles of this document.
Voltage Notching LimitsThe first limits tabulated in this document are those restricting the amount of notching permissible due to commutation between solid state switching devices, the limits replicatethose within IEEE 519.
Table 3 IEEE 519 Voltage Notching Limits
Special Applications*
GeneralSystem
Dedicated System**
Notch Depth 10% 20% 50%THD (Voltage) 3% 5% 10%Notch Area (AN)*** 16400 22800 36500* Special application includes hospitals and airports.** A dedicated system is exclusively dedicated to the converter load*** In volt-microseconds at rated voltage and current.
Current Distortion limits are set based on the voltage level and the ratio of Short Circuit current, ISC to full load current IL as shown in the table below, again these limits replicate those within IEEE 519. The full load current IL is determined from the average for the preceding 12 months of the kW monthly peak demands. The short circuit current is determined from recent PacifiCorp fault studies for a three phase fault at the customer’spoint of common coupling.
Table 4 below is applicable to general harmonic distortion and for 6 pulse drives, where higher pulse number drives are employed the limits for the characteristic harmonics may be increased by a factor of √(q/6) where q is the pulse number. This increase for characteristic harmonic current emission limits is however only permissible if the current emissions for every non-characteristic and even harmonic are less than 25% of the limits in the table.

EA Technology Review of Engineering Recommendation G5/4-1Stage 3 Connections and Higher Order Harmonics
Project No. 79410
16 of 62
Table 4 IEEE 519 Current Emission Limits
ISC/IL h<11 11≤h<17 17≤h<23 23≤h<35 35≤h TDDVrms ≤ 69kV
<20* 4.0 2.0 1.5 0.6 0.3 5.020-50 7.0 3.5 2.5 1.0 0.5 8.0
50-100 10.0 4.5 4.0 1.5 0.7 12.0100-1000 12.0 5.5 5.0 2.0 1.0 15.0
>1000 15.0 7.0 6.0 2.5 1.4 20.069kV < Vrms ≤ 161kV
<20* 2.0 1.0 0.75 0.3 0.15 2.520-50 3.5 1.75 1.25 0.5 0.25 4.0
50-100 5.0 2.25 2.0 0.75 0.35 6.0100-1000 6.0 2.75 2.5 1.0 0.5 7.5
>1000 7.5 3.5 3.0 1.25 0.7 10.0Vrms > 161kV
<50 2.0 1.0 0.75 0.3 0.15 2.5≥50 3.5 1.75 1.25 0.5 0.25 4.0
* All power generation equipment is limited to these values of current distortion regardless of the actual short circuit ratio, ISC/IL.
Current distortions that result in a d.c. offset, e.g., half wave converters, are not allowed.
PacifiCorp apply the following voltage distortion limits to their networks for normal operation. During start-up conditions or unusual non-repetitive conditions these limits may be exceeded by no more than 50%.
Table 5 IEEE 519 Voltage Harmonic Distortion Limits
Bus Voltage at PCC Individual Harmonic Voltage Distortion (%)
Total Voltage Distortion –THDv (%)
Vrms ≤ 69kV 3.0 5.069kV < Vrms ≤ 161kV 1.5 2.5
Vrms > 161kV 1.0 1.5
2.3.3 Technical Requirements for Connecting to the Alberta Interconnected Electric System (IES) Transmission System
2.3.3.1 Part 1: Technical Requirements for Connecting GeneratorsThis document [12] sets out the general technical requirements for to connect a generation station to Alberta’s Interconnected Electric System and Transmission System either directly or indirectly through interconnected onsite or distribution facilities.
The issue of Harmonics is addressed in only two places, section 3 which describes the network conditions which may be expected at the point of connection and section 4 which describes what conditions the generator must meet to be eligible to connect.
The network conditions to be expected for harmonics are to be as specified in IEEE 519. Upon request the Transmission Administrator will provide the generator with details of the harmonic impedance envelope specific to the point of connection.
The obligations of the generator with regard to harmonics require them to mitigate harmonic currents which result from non-compliance with IEEE 519.

EA Technology Review of Engineering Recommendation G5/4-1Stage 3 Connections and Higher Order Harmonics
Project No. 79410
17 of 62
2.3.3.2 Part 2: Technical Requirements for Connecting LoadsThis document [13] sets out the general technical requirements to directly connect a load to Alberta’s Interconnected Electric System and Transmission System.
The issue of Harmonics is addressed in only two places section 3 which describes the network conditions which may be expected at the point of connection and section 4 which describes what conditions the generator must meet to be eligible to connect.
The network conditions for harmonics are to be expected to be as specified in IEEE 519. Upon request the Transmission Administrator will provide the load customer with details of the harmonic impedance envelope specific to the point of connection.
The obligations of a load customer with regard to harmonics require them to mitigate harmonic currents which result from non-compliance with IEEE 519.
2.3.4 ATCO Electric Alberta – System Standard for the Installation of New Loads
This document [14] describes the process by which connections of new load to the Alberta distribution system is managed to ensure the successful installation and connection of these new loads without causing undue disruption to existing customers. The preface points the reader towards the Technical Requirements documents described above for connections above 25kV. Anything above 25kV is considered Transmission within Alberta.
There is a lot more detail about the requirements for considering harmonic loads for connection to the Alberta Distribution system compared to that available for the transmission systems as described in section 2.3.3. Whereas the transmission system requirements are covered by IEEE 519, the distribution system appears to employ some sort of hybrid approach with permissible voltage distortion values being governed by the Canadian version of 61000-3-6 whilst limits are placed on the current emissions in line with the requirements of .IEEE 519.
In making an assessment of a new connection application the customers are divided into two categories, Category A and Category B. To be classed as a Category A customer the new load connection must meet all of the following criteria.
The sum of the weighted harmonic loading, SDwi divided by the system short-circuitlevel, Ssc(3 phase fault MVA), at the point of common coupling must be less than 0.1% as per CAN/CSA C6100-3-6:04 Section 7.1.1
The sum of the weighted harmonic; loading divided by the total plant load must be less than 10%. In general all loads that exceed 10% will be reviewed
The consumer capacitor banks must satisfy the following condition:o |hresonance - h| > 0.35 for h = 5, 7, 11, 13, 17 [Characteristic harmonics]o |hresonance - h|>0.1 for h – 2, 4, 6, 8, 10 [Even harmonics]o |hresonance - h|>0.15 for h = 3, 9, 15, 21, 27 [Triplen harmonics]
Frequencies are in per unit (base Frequency is 60Hz) See Note 2Note 1 Weighting of the various harmonic loads will be completed using table A.2in the Appendix. This table is reproduced from CAN/CSA C61000-3-6:04 Section 7 if the characteristics of the harmonics producing load are unknown, weighting of 2.5 should be assumed.Note 2 Any shunt capacitor within a harmonic environment should be detuned using a series reactor.
For a category A customer ATCO will not carry out any harmonic analysis of the customer’s facilities, although other forms of analysis may be required to address voltage dips during motor starting or flicker.

EA Technology Review of Engineering Recommendation G5/4-1Stage 3 Connections and Higher Order Harmonics
Project No. 79410
18 of 62
Any proposed connection not meeting these criteria is classed as Category B. Such connections are subject to the same assessments for voltage dips and flicker as category A customers with the additional harmonic assessments required for Category B non-linear loads. The Category B procedure outlines how ATCO will work with the customer to determine the requirements for the connection, key to this is an expectation that communication between the customer and ATCO will begin before the customer begins specifying the non-linear loads. ATCO undertake to provide the short-circuit levels at the point of common coupling, the maximum level of voltage unbalance (defined as per IEEE 1159) and system information requested by the consumer.
ATCO will undertake measurements to determine the compliance of an installation before and after the customer has commissioned their new/additional load. Compliance is deemed to have been achieved if the cumulative probability is less than the planning level given in Section 6 of the document and reproduced in table 6 below.
Table 6 – Planning Levels for Individual Voltage Harmonics CAN/CSA 61000-3-6:04
Harmonic Order
% Fundamental Level at 95% Probability
IVHn(3s)
% Fundamental Level at 99.99% Probability
IVHn(3s)
% Fundamental Level at 99.99% Probability
IVHn(10min)2 1.6 2.4 1.64 1.0 1.5 1.06 0.5 0.75 0.58 0.5 0.75 0.5
10 0.5 0.75 0.512 0.5 0.75 0.5
>12 (even) 0.5 0.75 0.53 4 6 45 5 7.5 57 4 6 49 1.2 1.8 1.2
11 3 4.5 313 2.5 3.75 2.515 0.3 0.45 0.317 1.6 2.4 1.619 1.2 1.8 1.221 0.2 0.3 0.223 1.2 1.8 1.225 1.2 1.8 1.227 0.7 1.05 0.729 0.63 0.95 0.6331 0.6 0.9 0.633 0.59 0.87 0.5935 0.56 0.84 0.5637 0.54 0.81 0.5439 0.52 0.78 0.5241 0.50 0.76 0.5043 0.49 0.74 0.4945 0.48 0.72 0.4847 0.46 0.70 0.4649 0.45 0.68 0.45
The limits specified in this table are referenced to CAN/CSA 61000-3-6 which is the Canadian implementation of IEC TR 61000-3-6 with Canadian specific amendments.

EA Technology Review of Engineering Recommendation G5/4-1Stage 3 Connections and Higher Order Harmonics
Project No. 79410
19 of 62
In addition to the limits for individual harmonic voltage distortion laid out in table 6 above there are also requirements to limit the levels of current harmonic emissions in line with the requirements of IEEE 519. However clearly in order to maintain the specified voltage distortion limits the levels of current harmonic emissions must reduce as the short circuit level decreases with increasing distance from the source substation.
Section 7 describes who is responsible for mitigation of issues caused by harmonic emissions.
Telephone interference – mitigation is the responsibility of the customer Current/Voltage Distortion
o If the system impedance envelope is still within the tolerances of that defined at connection then the customer will be expected to take mitigating measures
o If the distortion limits are breached as a result of changes made by ATCO to the network then ATCO will assume responsibility for mitigation.
2.3.5 Alpine Energy Limited – Rural Network Harmonic Standard
This procedure [15] from New Zealand came into force in April 2011, references IEEE 519 as the Industry Standard, the tables for current emissions and voltage harmonic distortion replicates those of IEEE 519.
There are some specific additional requirements for connection and operation of loads over and above compliance with the current emission limits defined in Table 1 of the documentand these are reproduced below.
2.3.6 Abu Dhabi Distribution Company – Limits for Harmonics in the Electricity System
This document [16] published in 2005 describes the obligations on Distribution Companies, Customers and other Users of the Distribution System in regard to the management of harmonics on the Electricity Supply System.
The document was prepared after a review of international practices and makes particular reference to UK and European standards. The tables which set out the limits for voltage distortion and current emissions are identical to those in ENA ER G5/4.

EA Technology Review of Engineering Recommendation G5/4-1Stage 3 Connections and Higher Order Harmonics
Project No. 79410
20 of 62
There is in general less detailed information in this document than exists in ER G5/4-1, where further information is required the reader is referred to ER G5/4 and ETR122.
One particular aspect where the practice deviates from that described in G5/4 is the flow diagram describing the connection assessment process. In the Abu Dhabi Distribution Company Document the potential for existing background levels to exceed planning levels is explicitly catered for and the requirement for the Distribution Company to undertake mitigation measures to restore the levels to below 75% of the planning levels thereby allowing new customers to be connected. These mitigation measures may include identifying existing sources of high harmonic emission and requesting that these emissions be reduced. Where no individual customer can be identified as a significant contributor to the high background levels the Distribution Company is required to undertake other mitigation measures including splitting areas of the network into smaller isolated zones orinstalling filters at distribution or primary substations. Splitting the network would seem likely to make the harmonic conditions worse in at least part of the network, it is however one of the methods listed in the Recommendation.
2.4 Setting Planning Levels
2.4.1 Harmonic Planning Levels for Australian Distribution Systems
This paper [17] describes a modelling technique for determining the harmonic voltage distortion across a distribution system applicable when there is an equitable distribution of harmonic emission. Taking harmonic voltage distortion levels at 132kV and 415V based on IEC compatibility and planning levels the levels of distortion present at intermediate voltages are determined. Using the modelling methodology described in the paper studies were carried out on six systems considered to be typical of Australian practice. These studies sought to examine the effect of voltage level and system parameters for harmonics in the range 2-40. Based on the results of these studies harmonic planning levels are recommended for application to Australian distribution systems.
The paper raises the concern that the indicative planning levels given in IEC 61000-3-6 are identical for all medium voltage levels. Where there is more than one MV level in series in the network to have identical planning levels may be inappropriate as if the two systems have the same distortion levels there must be no voltage drop and hence no harmonic current between the two levels. To resolve this potential issue the Integral Power Quality Centre 1was asked by Standards Australia to determine appropriate planning levels for typical Australian distribution systems. The paper describes the methodology employed.
A generic system from 132kV to 415V was selected including 132/33kV, 33/11kV and 11/0.415kV transformation stages. The network parameters were based on values obtained from several utilities to ensure that the system represented a wide range of network conditions. Key parameters which influenced the development of the model were fault levels, substation loadings, numbers and lengths of lines and cables, load values and the distribution of those loads.
The LV load was set to have a constant harmonic distortion level which assumes that the LV load is predominantly domestic and can be characterised based on the emissions permitted for the various different classes of equipment in AS/NZS 61000-3-2 and an assumed penetration of such devices within each domestic property. From the analysis undertaken to
1 Now known as the Endeavour Energy Power Quality & Reliability Centre located at the University of Wollongong http://www.elec.uow.edu.au/eepqrc/home

EA Technology Review of Engineering Recommendation G5/4-1Stage 3 Connections and Higher Order Harmonics
Project No. 79410
21 of 62
establish the base LV load for the model it was observed that although air conditioning equipment had an individually higher contribution to harmonic emissions the prevalence of items such as personal computers and televisions meant that on an average per household basis the contributions form PCs and TVs to harmonic emissions was expected to be greater. Having defined an average household consumption using the second summation law the average emissions were determined. These average emissions were then summated again using the second summation law to determine the ‘typical’ current emissions for an LV system fed from an individual 11kV/415V transformer.
Table 7 – Recommended Australian Planning Levels (% of nominal)
Voltage LevelHarmonic
order132kV 66kV 33kV 22kV 11kV 415V
2 1.1 1.3 1.3 1.7 1.7 1.83 2.0 2.6 2.8 4.3 4.3 4.54 0.6 0.7 0.73 0.96 0.96 1.05 2.0 2.8 3.1 5.1 5.1 5.56 0.3 0.35 0.36 0.48 0.48 0.507 2.0 2.6 2.7 4.2 4.2 4.58 0.27 0.31 0.32 0.43 0.43 0.459 0.81 0.92 0.95 1.27 1.27 1.35
10 0.27 0.31 0.32 0.42 0.42 0.4511 1.5 1.8 1.9 3.0 3.0 3.312 0.12 0.13 0.14 0.19 0.19 0.2013 1.5 1.7 1.8 2.5 2.5 2.814 0.12 0.13 0.14 0.19 0.19 0.2015 0.18 0.20 0.20 0.28 0.28 0.3016 0.12 0.13 0.14 0.18 0.18 0.2017 1.0 1.1 1.2 1.6 1.6 1.818 0.12 0.13 0.13 0.18 0.18 0.2019 0.81 0.88 0.90 1.23 1.23 1.3520 0.12 0.13 0.13 0.18 0.18 0.2021 0.12 0.13 0.13 0.18 0.18 0.2022 0.12 0.13 0.13 0.18 0.18 0.2023 0.7 0.77 0.79 1.18 1.18 1.3524 0.12 0.13 0.13 0.18 0.18 0.2025 0.51 0.54 0.55 0.76 0.76 0.8526 0.12 0.13 0.13 0.18 0.18 0.2027 0.12 0.13 0.13 0.18 0.18 0.2028 0.12 0.13 0.13 0.18 0.18 0.2029 0.46 0.47 0.48 0.67 0.67 0.7630 0.12 0.12 0.13 0.17 0.17 0.2031 0.44 0.45 0.45 0.63 0.63 0.7332 0.12 0.12 0.12 0.17 0.17 0.2033 0.12 0.12 0.12 0.17 0.17 0.2034 0.12 0.12 0.12 0.17 0.17 0.2035 0.4 0.4 0.4 0.57 0.57 0.6736 0.12 0.12 0.12 0.17 0.17 0.2037 0.38 0.38 0.38 0.54 0.54 0.6438 0.12 0.12 0.12 0.17 0.17 0.2039 0.12 0.12 0.12 0.17 0.17 0.2040 0.12 0.12 0.12 0.17 0.17 0.20
THD 3.0 4.1 4.4 6.6 6.6 7.3
EA Technology Review of Engineering Recommendation G5/4-1Stage 3 Connections and Higher Order Harmonics
Project No. 79410
22 of 62
According to 61000-3-6 the preferred harmonic allocation is a value of harmonic current which increases as the load maximum demand increases SMV. As a result of the second summation law can be simplified if the allocation of emissions follows the following equation where α is the Second Summation Law exponent and kMVh is the allocation constant.
IMVh = kMVhSMV1/α
In order to determine the MV planning levels the value of kMVh is varied until the harmonic voltages at the ends of the 415V distributor reach the LV planning levels. The value of SMV to be used for these calculations is the designed maximum demand taking account of all planned load growth.
The aim of the study was to find a voltage profile which could be applied to all of the test systems without limiting the harmonic absorption capability of the network to too great an extent.
The planning levels recommended as a result of the studies undertaken are listed in Table 7 above.
2.5 Harmonic Impedance
The harmonic impedance of the network in combination with the harmonic current emissions of the connected loads determines the harmonic voltage at the point of connection. The assessment of the harmonic impedance of a network is crucial to the accuracy of any prediction of the likely harmonic distortion for a new distorting load. A number of papers have been identified which describe attempts to directly measure the harmonic impedance of the network, these are summarised below.
2.5.1 Impact of Reactive Power Compensation Equipment on the Harmonic Impedance of High Voltage Networks
This 2003 paper [18] describes the assessment and design of reactive power compensation capacitor banks for connection into the TenneT 2380kVand 220kV networks. The deregulation of the European Energy market required that generation and network operating companies become separate in both economic or financial terms and technical issues. In order to meet these requirements the Dutch companies installed large numbers of reactive power compensating devices, typically these take the form of mechanically switched capacitor banks (MSCs).
Background harmonic measurements were made at different Dutch 380kV substations to determine the base case conditions before the installation of reactive power compensation equipment or the connection of HVDC links. To make the voltage distortion measurements a 380kV RCR type voltage divider was used installed in the coupling section of the substation. Before undertaking the measurements the frequency response of the divider was checked at KEMA’s high voltage laboratory. For GIS substations the capacitive voltage indicator was used with a termination capacitor attached to the indicator plug to create a capacitor divider. The results of these measurements indicated that some of the background levels were already approaching the planning levels for the 380kV network giving rise to
2 TenneT operates transmission systems in Netherlands & Germany http://www.tennet.org/
EA Technology Review of Engineering Recommendation G5/4-1Stage 3 Connections and Higher Order Harmonics
Project No. 79410
23 of 62
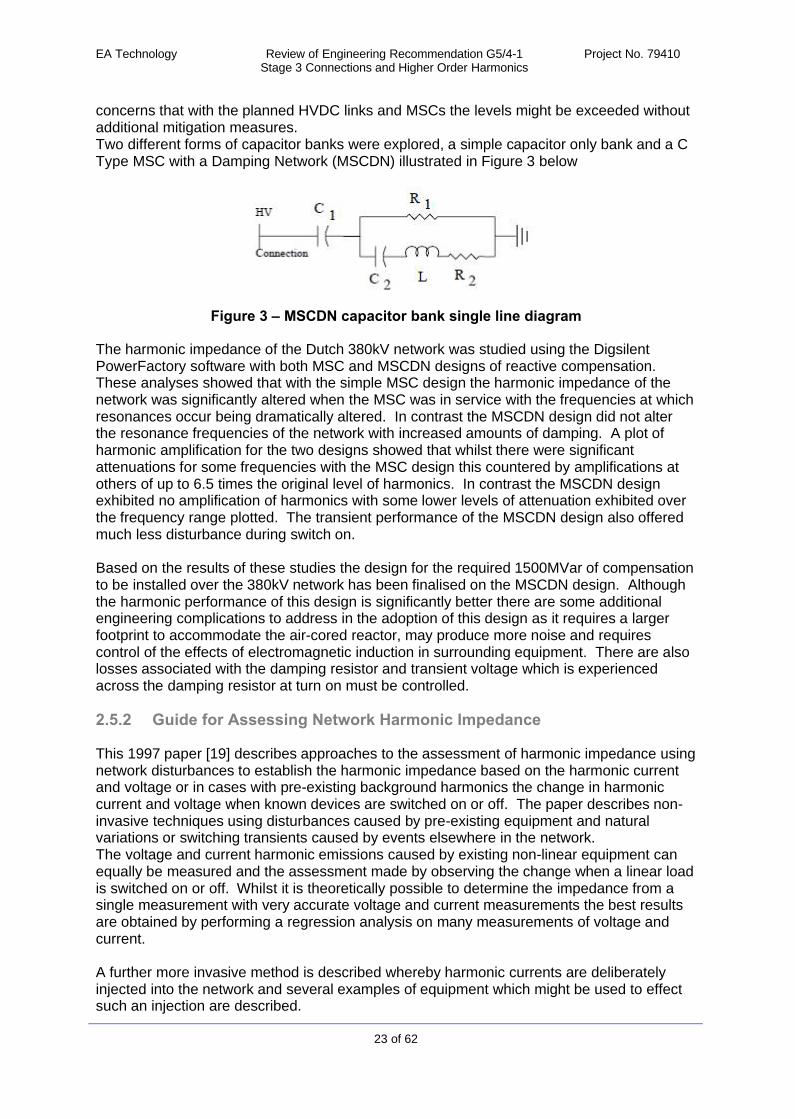
concerns that with the planned HVDC links and MSCs the levels might be exceeded without additional mitigation measures.Two different forms of capacitor banks were explored, a simple capacitor only bank and a C Type MSC with a Damping Network (MSCDN) illustrated in Figure 3 below
Figure 3 – MSCDN capacitor bank single line diagram
The harmonic impedance of the Dutch 380kV network was studied using the Digsilent PowerFactory software with both MSC and MSCDN designs of reactive compensation. These analyses showed that with the simple MSC design the harmonic impedance of the network was significantly altered when the MSC was in service with the frequencies at which resonances occur being dramatically altered. In contrast the MSCDN design did not alter the resonance frequencies of the network with increased amounts of damping. A plot of harmonic amplification for the two designs showed that whilst there were significant attenuations for some frequencies with the MSC design this countered by amplifications at others of up to 6.5 times the original level of harmonics. In contrast the MSCDN design exhibited no amplification of harmonics with some lower levels of attenuation exhibited over the frequency range plotted. The transient performance of the MSCDN design also offered much less disturbance during switch on.
Based on the results of these studies the design for the required 1500MVar of compensation to be installed over the 380kV network has been finalised on the MSCDN design. Although the harmonic performance of this design is significantly better there are some additional engineering complications to address in the adoption of this design as it requires a larger footprint to accommodate the air-cored reactor, may produce more noise and requires control of the effects of electromagnetic induction in surrounding equipment. There are also losses associated with the damping resistor and transient voltage which is experienced across the damping resistor at turn on must be controlled.
2.5.2 Guide for Assessing Network Harmonic Impedance
This 1997 paper [19] describes approaches to the assessment of harmonic impedance using network disturbances to establish the harmonic impedance based on the harmonic current and voltage or in cases with pre-existing background harmonics the change in harmonic current and voltage when known devices are switched on or off. The paper describes non-invasive techniques using disturbances caused by pre-existing equipment and natural variations or switching transients caused by events elsewhere in the network.The voltage and current harmonic emissions caused by existing non-linear equipment can equally be measured and the assessment made by observing the change when a linear load is switched on or off. Whilst it is theoretically possible to determine the impedance from a single measurement with very accurate voltage and current measurements the best results are obtained by performing a regression analysis on many measurements of voltage and current.
A further more invasive method is described whereby harmonic currents are deliberately injected into the network and several examples of equipment which might be used to effect such an injection are described.
EA Technology Review of Engineering Recommendation G5/4-1Stage 3 Connections and Higher Order Harmonics
Project No. 79410
24 of 62
The paper also discusses the pros & cons of various calculation methods and the simplifications which may be made without undue risk of the answers being overly optimistic. When a more detailed study is required one of the key difficulties in carrying out such a study on a computer based system is the collection of accurate data concerning the variation in impedance with harmonic order of the various network elements and loads. The accuracy of any model cannot be expected to be better than the data on which it is based. To achieve the most accurate results a full knowledge of the variation of the circuit elements is required and this is not always available. It is suggested that the 20th harmonic order may be the limit for reliable calculation results in HV or EHV systems.
It is concluded that calculation and measurement should not be regarded as competing but rather complementary and particularly in cases where more detailed studies are required,then measurements should be employed to provide data and to assist in the validation of the model.
2.6 Modelling Requirements
2.6.1 Power System Modelling and Harmonic Analysis
This lecture note [20] from Dr. R. Sreerama Kumar describes how frequency dependency of the various system components of the power system can be modelled. The application notes describe how where the harmonic power flow study produces separate line and bus sequence components potential maloperation of negative sequence protection can be predicted due to anticipated levels of negative sequence harmonic components from 5th
harmonics for example.
2.6.2 Grid Modelling for purposes of wind farm harmonic voltages evaluation
This case study [21] from Leonardo Energy examines the evaluation of grid harmonic impedance and the combination of this evaluation with the turbine data to establish the voltage harmonic distortion which is expected at the wind farm connection point. The evaluation of the grid harmonic impedance considers the effect of switching out of service capacitor banks in both the transmission and distribution systems, variations in the short circuit infeed.
The results of the studies suggest that the grid harmonic impedance was not significantly altered as a result of switching out the 600kVAr capacitor bank in the transmission system, increasing the short circuit power, switching off part of the system generation or light load conditions. However much stronger influences on the grid harmonic impedance characteristics were seen when switching off a capacitor bank in the next distribution substation, altering the line data for 110kV lines based on a different model and supplying the analysed connection point from a different substation.
From these observations the paper concludes that for harmonic analysis it is insufficient to use a simple network equivalent considering the harmonic impedance and that different network configurations must be taken into account. The greatest variation seen in the assessed levels of THD was almost a 50% reduction over what was considered the base case analysis. Furthermore the modelling of the network elements also has a significant effect upon the harmonic impedance of the network, significant changes in impedance from the base case assessment were seen when the 110kV tower lines were modelled taking account of the line topology rather than a simple impedance model.

EA Technology Review of Engineering Recommendation G5/4-1Stage 3 Connections and Higher Order Harmonics
Project No. 79410
25 of 62
2.6.3 A Study Case on Harmonic Distortion Created by Wind Turbines
This paper [22] from the National Technical University of Athens also considers the modelling of the effects of inverter connected wind turbines on the harmonic distortion levels on networks which may experience harmonic resonance conditions. The paper considers the case of a proposed connection of 20 x 500kW wind turbines into the MV network on the Greek island of Kefalonia. The MV network is connected to the 150kV network by successive sections of overhead line and submarine cable of significant lengths. The capacitance of the submarine cables gives rise to the concerns over potential resonant conditions requiring investigation of potential harmonic distortion issues.
The modelling methodology employed is based on the requirements of IEC 61000-3-6. Cigre Guides and IEEE task force recommendations. In determining the methodology consideration was given to a balance between the required modelling complexity and the ease of implementation especially taking account of the lack of reliable data for actual systems. The fundamental assumptions employed in the modelling approach are:
Harmonic sources are the power electronics converters at the wind turbines. These harmonic sources are modelled as discrete current injections for each harmonic frequency with defined magnitudes for each frequency.
A direct harmonic solution is obtained in line with the method described in Power System Harmonics by Jos Arillaga & Neville Watson
The network is represented by a sequence component model which is required in order to both accurately represent the propagation of zero sequence harmonic orders and capture the effects of asymmetry in the harmonic sources.
Three potential load models are identified and it is stressed that correct selection of the load model is important for the correct assessment of possible resonant conditions. It is stated that no generally applicable harmonic model exists and case specific measurements and evaluations will be required for detailed studies. All three of the models whilst varying the values or R1 and X1 with increasing harmonic order are passive components which do not provide any representation of harmonic sources within the general load. As a consequence this assessment method will only provide information about the level of distortion which will be created by the harmonic output of the wind turbine. Using the summation law however these values can be added to typical background measurements to provide a prediction.
The paper does acknowledge some limitations of the modelling approach with regard to load representation as well as crude approximations of the MV network and its capacitance which is reduced to an aggregate capacitance connected to the MV busbars. A more detailed and reliable assessment of the harmonic distortion could be achieved with a more detailed representation of the MV network. However despite this acknowledgement the view is expressed that in reality any assessment made of such a proposed connection would be unlikely to have been carried out to the detail which has been described never mind the enhanced level possible with more detailed MV representation.
In the case examined in this paper the characteristic harmonic outputs of the wind turbines occurred near a parallel resonance in the distribution system resulting in a level of voltage harmonic distortion at the margins of acceptability without additional mitigation.
2.6.4 Impact of the Modelling of Transmission Network Components on the Emission Limits for Distorting Loads in HV System
This paper [23] describes the development and use of a tool employing Matlab and PowerFactory which is used to calculate emission limits in accordance with appendix E of
EA Technology Review of Engineering Recommendation G5/4-1Stage 3 Connections and Higher Order Harmonics
Project No. 79410
26 of 62
IEC 61000-3-6. The results of using the tool for two connection points is described, one a strong connection point and the other weak.
The software package developed to allocate the voltage and current emission limits for distorting load includes the use of PowerFactory scripts written using the Digsilent Programming Language (DPL) and Matlab scripts. The PowerFactory scripts run frequency sweep studies on the networks, the output of these studies are used as the input to the Matlab program. The Matlab script calculates voltage emission limits based on the harmonic impedance data generated from PowerFactory, nominal voltage of all buses, apparent (complex) power of all loads, the planning levels for harmonic voltages and existing background harmonics, both expressed as a percentage of the nominal voltage
As part of the development the effect of differing forms of transmission line model are explored. It is demonstrated that there is a significant effect on the harmonic impedance between calculations using lumped pi transmission line model and those employing distributed parameters.
Similarly, discernible differences are experienced between models which take account of the skin effect on transmission lines and those which don’t. The differences in impedance are insignificant up to the 9th harmonic whilst beyond that frequency the differences become more significant as the harmonic order increases. The skin effect is most dramatic at resonance frequencies. Under these conditions the magnitude of the busbar self impedance can be reduced by up to 50% when the effect of the transmission line skin effect has been modelled.
Considering the effects described above in order to accurately represent network conditions and to assist in the design of any necessary mitigation measures it is important to employ transmission line models which employ distributed parameters and take account of the conductor skin effect.
2.6.5 Penetration of Harmonics from the Baltic Cable HVDC station into the Feeding AC Station – Cigre 1996 36-302
This paper [24] examines the calculation of harmonic conditions for the HVDC link on the 400kV and 130kV voltage levels at the connecting substation. The link has been in operation since 1994 and measurements were carried out for a week prior to and subsequent to the connection of the HVDC link. The measured harmonic impedancesvalues were compared against those calculated from a multiconductor model. The model takes account of:
the type, position, sag, temperature and skin effect of the conductors on the tower lines,
transposition points of phase conductors, earthing ‘sky-wires’ and the distributed earthing of any counterpoises
coupled power lines at parallelisms measured earth conductivities frequency dependency of transformers and loads (using CIGRE method) magnetising impedance of transformers type of 50Hz power cables and their sheath earthing
The load models used are derived based on the 1981 Cigre paper ‘Harmonics, Characteristic Parameters, Methods of Study, Estimates of Existing Values in the Network’. It is observed that these models are valid at medium voltage level, however, based on measurements at a HV/MV substation within the model area it is concluded that the models

EA Technology Review of Engineering Recommendation G5/4-1Stage 3 Connections and Higher Order Harmonics
Project No. 79410
27 of 62
are not completely accurate and should be improved although no real proposal about what is required to provide the necessary improvement is suggested. The more of the MV network which was modelled the better the agreement was achieved with the measured values. This perhaps suggests that the problem is that applying these MV models to the HV and EHV networks introduces inaccuracies because they do not take account of the effects of the MV network in the model.
2.6.6 Modeling Distribution Networks for Simulation of Harmonics on the HV Systems
This paper [25] describes the modeling of 5th harmonics in primary substations which was developed as part of a French research program into the impact of harmonics on the French transmission and distribution system. The models cover the full harmonic range, although the paper concentrates on the 5th harmonic which is dominant in France.
The models were developed to enable the representation of primary HV/MV substations on HV networks for the simulation of extended networks. Three types of HV/MV substation are described rural, urban and mixed. The equivalent models for these substations describe the substation impedance and the upstream harmonic current emissions in terms of amplitude and phase angle.
Development of the composite model involves the successive modeling of the loads the feeders these are connected to and finally the HV/MV substation supplying them.
Customers are modeled representing residential, commercial and service and industrial sectors and the model is used at each point of connection of loads to the network along a main distribution line.
The feeder models are classified according to their construction rather than the type of load connected to it. Three standard categories are described:
Overhead feeders – principally supplying low customer density rural areas Mixed feeders – supplying mainly rural areas of above average customer density or
small towns, mixed feeders have been omitted from the study fort he purposes of simplification
Underground feeders – mainly supplying urban areas
HV/MV substations are made from a set of MV feeders supplied by one or more transformers together with a facility for compensating reactive energy. Three categories of substation are proposed.
Urban – supplying urban or highly industrialised areas, at least 90% underground feeders
Mixed – supplying both built up areas and rural areas, between 15% and 0% underground feeders
Rural – supplying only rural or semi-rural areas less than 15% underground feeders.
The modelling begins with the loads and applies these load models to the MV feeders; the aim is to create a Norton equivalent representation of the feeder. The feeder models are then applied to the HV/MV substation model according to the classification again with the aim of producing a Norton equivalent.
The outputs of the models were compared against measured values of the same class taking account of the need to vary the model to reflect the variation in load current throughout the day. To make the comparison between the model outputs and the observed network conditions the measured values were adjusted taking account of the load factor and

EA Technology Review of Engineering Recommendation G5/4-1Stage 3 Connections and Higher Order Harmonics
Project No. 79410
28 of 62
the time of the measurements compared to the conditions in the model. The equivalent value of harmonic current is determined by multiplying the measured value by the ratio of the fundamental current in the model to the measured fundamental current and by a factor dependent upon the type of load and the time of day the model represents. The model in this case was intended to represent conditions at 8pm under average load. The time factor is a value of 1.2 or 2, the paper makes the assumptions that mainly domestic loads (rural substations) should use the value of 2 whilst domestic/commercial and service sector loads (urban substations) should use a value of 1.2.
These comparisons show that taking account of the differences between the average models and the actual feeders the results show a reasonable degree of agreement. However, this does perhaps also highlight a key issue with any modelling activity, clearly the accuracy of the results achieved are dependent upon the source data on which the model is based.
The paper concludes that the models which are average French models should not be used for small scale networks, particularly if it is possible to use measurements made directly on the network.
The models include the capacitive aspect of the downstream networks and represent the harmonic emissions in terms of both magnitude and phase angle. Where it is necessary to represent large sections of networks and not all of the data is available then the models described in this paper provide a good basis for a model of the wider network.
2.7 Emissions Allocation
2.7.1 Recommended Methods of Determining Power Quality Emission Limits for Installations Connected to EHV, HV, MV and LV Power Systems
This paper [26] provides an overview of the work carried out by CIGRE/CIRED C4.103 which ultimately provided the basis for the revision of IEC TR 61000-3-6 published in 2008. The paper actually examines issues associated with the determination of permissible limits for Harmonics Flicker and Unbalance although this summary concentrates on the aspects related to harmonics.
The working group consisted of 32 experts from 19 countries tasked with preparing four reports for the IEC updating, simplifying and supplementing international recommendations describing how to set and apply emission limits for the connection of disturbing installations. The aim of these reports was to provide methods to address the allocation of the capacity of the power system to absorb disturbances and to ensure that the allocation is coordinated between voltage levels so as to remain within the compatibility levels at the different utilisation points across the system.
The objective of the approach is, in common with other approaches, intended to ensure that the total harmonic distortion caused by all distorting installations will not exceed the planning levels thereby remaining within the compatibility levels whilst allowing for some future growth of load.
Three distinct steps are described to assign individual customer emission limits. Adoption of a general summation law Allocation of global contributions at a given voltage level to ensure coordination
between different elements of a system

EA Technology Review of Engineering Recommendation G5/4-1Stage 3 Connections and Higher Order Harmonics
Project No. 79410
29 of 62
Assignment of emission limits to installations based on a share of global contributions
For the summation of disturbances the values for exponents remained as in the previous version of IEC 61000-3-6 and are reproduced in Table 8 below.
Table 8 Summation Law Exponents
Harmonic Orderh<5 5≤h≤10 h>10
1 1.4 2
The principles behind the sharing of global contributions between voltage levels are illustrated in figure 4 below. The level of disturbance which is experienced at the MV busbar is the sum (using the summation law) of the disturbances due to the emissions from all of the installations and equipment connected at LV, MV and the upstream HV system.
Figure 4 – Determination of global contribution
The assignment of individual limits takes account of the global contribution applicable to that part of the network and the proportion of the system capacity represented by the individual load being considered. The basis for this criterion is justified based on the assumption that the agreed power of an installation is linked to the customer’s share in the investment costs of the local network.
2.7.2 Application of IEC 61000-3-6
There are a number of papers examining the application of 61000-3-6 in Australia where it has been implemented with the status of an Australian Standard rather than a Technical Report as published by the IEC.
In addition there are papers which examine the differences between the application at Medium Voltage and Transmission voltage levels.
2.7.2.1 Harmonic Allocation Constant for Implementation of AS/NZ 61000-3-6

EA Technology Review of Engineering Recommendation G5/4-1Stage 3 Connections and Higher Order Harmonics
Project No. 79410
30 of 62
This paper [27] addresses the difficulties which were experienced with the application of the standard in 2001 to provide equal emission rights to all customers based on their maximum demand. If current emissions are allocated based on the proportion of network demand capacity then difficulties can arise when the customers are spread out along a feeder where the fault level varies significantly over its length. The paper proposes an alternative approach to the allocation of emission rights taking account of the fault level variation, this method requires the use of an allocation constant to be applied to all customers connected to the same zone substation. The paper describes a methodology for calculating the harmonic allocation constant when the load data is incomplete and provides details of some assumptions which help to optimise the calculations. A version of this method now appears to be present with some modifications as Appendix B of the most recent revision of IEC 61000-3-6.
2.7.2.2 Allocating Harmonic Emission to Medium Voltage Customers in Long Feeder Systems
The allocation of emissions in long MV feeders according to IEC 61000-3-6 and AS/NZS 61000-3-6 is examine in this paper [28]. For a long feeder there can be a significant variation in the fault level between the source and the most remote point on the feeder. This can have significant effects upon the levels of emissions considered permissible and the effective use of the network capacity depending upon the allocation strategy adopted. For a feeder 5 or more km in length the paper suggests that fault level may reduce by a factor of 5:1 between the source and the remote end.
If each customer of equal maximum demand is given an equal share of the harmonic voltage absorption capacity then the permissible current emissions are determined from the allocated voltage emissions divided by the harmonic impedance at the point of common coupling. Under this approach those customers located further away from the source will be permitted proportionally lower current emissions.
If on the other hand customers are allocated an equal share of the local network current emission absorption capacity then equally sized demands close to the source will have the same current emission restrictions as those at the remote end of the network which will restrict the utilisation of the harmonic absorption capacity.
AS/NZS 61000-3-6 recommends an intermediate option between these two extremes allocation of an equal share of the harmonic volt-amperes which is equivalent to varying the harmonic current emissions with the inverse square root of the harmonic impedance at the point of common coupling. The example given in the standard involves all feeders being equally loaded and this leads to a significant reduction in the data which is required. More realistic examples of network loading require impractical levels of data about the network and the connected loads to provide an exact solution.
This paper proposes a new method which is intended to provide a more accurate assessment for a wide range of system types. Rather than representing the network load as a series of lumped loads the approach proposed in this paper represents the load as a uniform continuous load along the feeder which provides a system capable of exact solution with a much reduced data requirement.
2.7.2.3 Allocation of Harmonic Currents to Customers in Meshed HV NetworksThis paper [29] describes a simplified method of allocating harmonic currents to customers in a meshed network which aims to deliver an allocation of emissions which will not exceed

EA Technology Review of Engineering Recommendation G5/4-1Stage 3 Connections and Higher Order Harmonics
Project No. 79410
31 of 62
the harmonic voltage limits when all of the loads emit their prescribed allocation, which can occur when AS/NZ 61000-3-6 1996 is applied to such networks and also without some of the complexities exhibited in that version of the standard.
The paper examines the application of AS/NZS 61000-3-6 to the transmission network. To demonstrate this application and to determine some of the more subtle aspects of harmonic allocations a relatively simple 3 node network is used. It is acknowledged in the paper that the state of the network has the potential to affect harmonic allocations considerably and that whilst the ideal would be to cover all possible switching combinations, generator operating range and all load conditions such an aim is impractical. Instead it is suggested that the harmonic allocation must be based upon the worst case conditions although determining this is not a trivial exercise for the purposes of the study it is assumed that open points and outage conditions will not affect the allocation.
Applying the requirements of AS/NZS 61000-3-6 rigorously to the 3 node network to determine the allocation of emissions yields results which when all of the loads are emitting their maximum permitted harmonic currents leads to harmonic voltages which exceed the planning levels against which the emissions allocations were assessed.
The paper asserts that although the standard is partially successful in delivering a measure of equality in the allocation of emissions this is not sufficient to compensate for the fact that the procedure does not always prevent the planning limits from being exceeded even if all customers are compliant with their emissions allocations.
To resolve this problem a new alternative method of allocation is proposed. The method is described as the Constrained Bus Voltage approach. However rather than allocating voltage limits the method addresses the harmonic current emissions directly.
Harmonic currents are limited by the equation 2 below:
Equation 2 – Constrained Bus Voltage Approach: Current Allocation
The term kh is frequency dependent but does not vary between busbars. The maximum value of kh for each harmonic is determined by applying the rule that no busbar harmonic voltages shall exceed the planning limit when all loads take their full harmonic current allocation (95% value). In this way the busbar voltages are constrained and the method overcomes the potential for exceedance of planning levels.
The calculation results demonstrate that when all loads are operating at their maximum emissions in a stochastic sense (95th percentile) none of the busbars exceed the planning levels. Relative to the results obtained for the rigorous application of AS/NZS 61000-3-6 one of the nodes has seen a reduction in permitted emissions, this reduction being at the lower order harmonics. It is not surprising that there must have been a reduction in emissions somewhere as the voltage distortion levels have been reduced. Overall the results suggest that the revised method has the scope to ensure that the harmonic absorption capacity of the network is more fully utilised throughout the frequency range.
The paper concludes that the constrained bus voltage method offers a better method for allocation of emissions; further work was required to establish how much of the network must be included within the model to ensure reliable results and what are the effects of including or excluding line and power factor capacitance from the model.

EA Technology Review of Engineering Recommendation G5/4-1Stage 3 Connections and Higher Order Harmonics
Project No. 79410
32 of 62
2.7.2.4 Experience in the Application of IEC TR 61000-3-6 to Harmonic Allocation in Transmission Systems
This paper [30] from Cigre 2006 describes the Australian experience of applying the first edition of IEC TR 61000-3-6, as amended to become AS/NZS 61000-3-6, to the transmission networks in Australia. As an Australian Standard the transmission utilities and customers are bound to abide by the harmonic allocations set by the standard.
IEC TR 61000-3-6 provides a procedure for the calculation of the harmonic voltage emission limits at the point of connection; however there can be occasions where the incidence of the highest levels of voltage emissions are actually remote from the point of connection. This can be addressed by considering the interactions between each source of harmonic current emissions and all other busbars in one single step. This has lead to the development of the ‘harmonic allocation constant’ described above in section 2.7.2.1. This constant applies to the whole transmission system and provides a measure of the network’s ability to absorb harmonics without breaching defined planning limits.
It is implied in the standard that this assessment should be carried out for a single ‘normal’ operating condition. In practice substantial variations in the harmonic response of transmission networks have been identified as changes are made in the numbers of generators connected and network topology. The paper describes a proposed approach which aims to account for these variations by taking data from multiple network scenarios.
In developing this approach two transmission networks were considered, however as the results were similar for both, only one is considered in detail in the paper. The longest lines are in the region of 200km long and they can exhibit substantial levels of shunt capacitance with the result that harmonic current injected at one extremity of the network can give rise tosignificant harmonic voltages at other extremities. It was therefore necessary to study the transmission network as a single entity.
The transmission system has both 220kV and 110kV voltage levels both with generation and individual loads connected to them. In terms of their functionality there is no distinction between the two voltage levels which presents its own issues when determining the appropriate harmonic contributions.
The model was developed in line with the principles identified in the paper [25] reviewed in section 2.6.6 above and also with elements identified in Power System Harmonics by Jos Arillaga and Neville Watson. As the full range of harmonics from 2nd to 40th are of interest in the assessment and there a several long lines within the network to be studied it was necessary to employ detailed modelling of the transmission lines including distributed parameters for both series impedances and shunt admittances and the skin effect on the series resistance.
Due to these features and the need to model the effect of various different generator connection scenarios it was not possible to carry out any extensive simplification of the transmission network. The loads and generators connected at MV buses which were not require to be switched on and off to test the various network arrangements were modelled referenced to their associated HV buses. (It was observed in 2.6.5 above that this approach can affect the results as the MV load models need to be connected to MV system models to deliver accurate results although 2.6.6 describes the development of a primary substation model which addresses this concern.)
The analysis highlighted some resonance conditions where small changes in emissions at one busbar gave rise to much more significant variations at very remote sites. This highlighted the need for network damping, rather than altering the loads already modelled
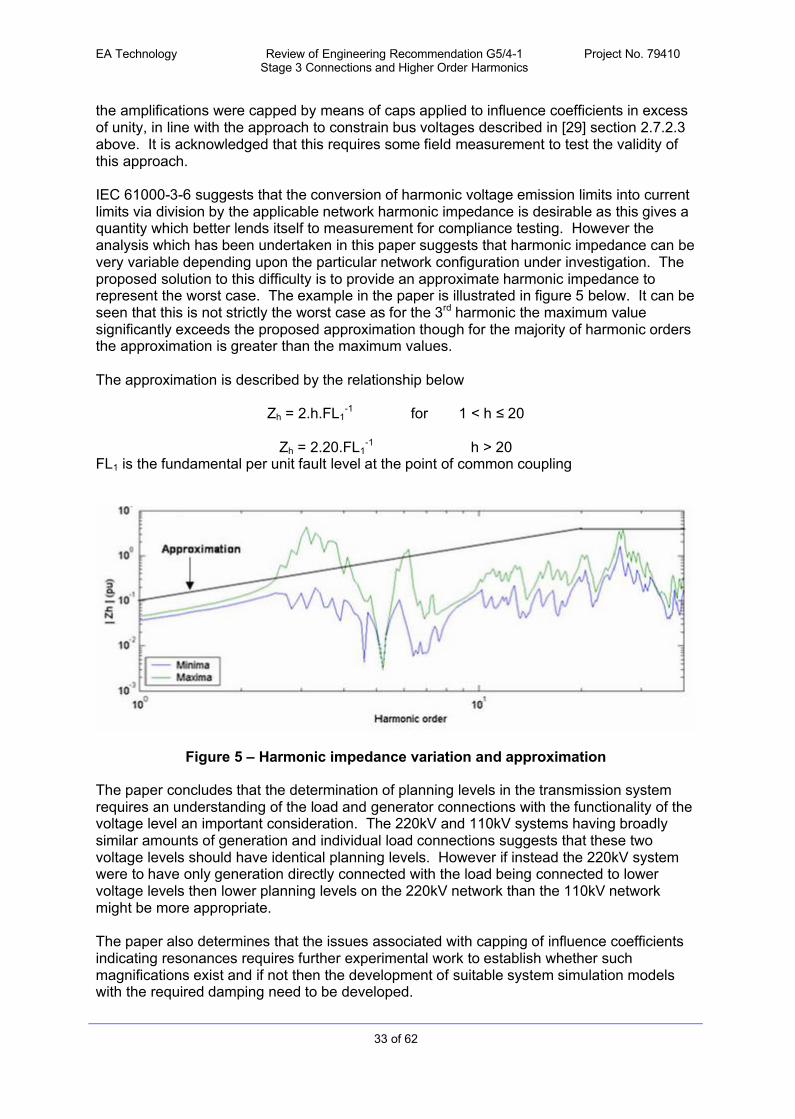
EA Technology Review of Engineering Recommendation G5/4-1Stage 3 Connections and Higher Order Harmonics
Project No. 79410
33 of 62
the amplifications were capped by means of caps applied to influence coefficients in excess of unity, in line with the approach to constrain bus voltages described in [29] section 2.7.2.3 above. It is acknowledged that this requires some field measurement to test the validity of this approach.
IEC 61000-3-6 suggests that the conversion of harmonic voltage emission limits into current limits via division by the applicable network harmonic impedance is desirable as this gives a quantity which better lends itself to measurement for compliance testing. However the analysis which has been undertaken in this paper suggests that harmonic impedance can be very variable depending upon the particular network configuration under investigation. The proposed solution to this difficulty is to provide an approximate harmonic impedance to represent the worst case. The example in the paper is illustrated in figure 5 below. It can be seen that this is not strictly the worst case as for the 3rd harmonic the maximum value significantly exceeds the proposed approximation though for the majority of harmonic orders the approximation is greater than the maximum values.
The approximation is described by the relationship below
Zh = 2.h.FL1-1 for 1 < h ≤ 20
Zh = 2.20.FL1-1 h > 20
FL1 is the fundamental per unit fault level at the point of common coupling
Figure 5 – Harmonic impedance variation and approximation
The paper concludes that the determination of planning levels in the transmission system requires an understanding of the load and generator connections with the functionality of the voltage level an important consideration. The 220kV and 110kV systems having broadly similar amounts of generation and individual load connections suggests that these two voltage levels should have identical planning levels. However if instead the 220kV system were to have only generation directly connected with the load being connected to lower voltage levels then lower planning levels on the 220kV network than the 110kV network might be more appropriate.
The paper also determines that the issues associated with capping of influence coefficients indicating resonances requires further experimental work to establish whether suchmagnifications exist and if not then the development of suitable system simulation models with the required damping need to be developed.

EA Technology Review of Engineering Recommendation G5/4-1Stage 3 Connections and Higher Order Harmonics
Project No. 79410
34 of 62
A worst case harmonic impedance variation for transmission systems is proposed. It is observed that although analytical techniques have been developed which apply IEC 61000-3-6 to transmission network which are typical of those found in Australia a wider variety of transmission systems should be studied to find techniques which are more generally applicable to aid the development of international standards.
2.7.2.5 Harmonic Allocation to Aggregated Regions within a Transmission Network
This paper [31] builds on the work of the paper described above and describes a modification to the allocation method set out in IEC/AS 61000-3-6, which overcomes the potential for harmonic voltages to exceed planning levels when all of the connected loads inject their calculated currents and also reduces the need to possess detailed knowledge of the characteristics of each connected load on the network.
Rather than individual busbars being allocated emission limits, emissions levels are allocated to areas comprising busbars which are electrically close to one another. This approach is intended to reduce the effects of uncertainty about the characteristics and magnitude of load at a particular busbar which in the Australian transmission system has been found to typically vary between 0% and 30% of the system fault level. When used as a planning approach the uncertainty about future loads at specific busbars means that this level of detail is very unlikely to be available.
The paper asserts that there are specific characteristics of the transmission networks in Australia compared to distribution networks which make area based allocation suitable for consideration
The loading level which may be connected at a particular busbar at some future time is rarely known with particular precision. Combining electrically close busbars into an area to which emission levels will be allocated means that less knowledge is required for any one individual busbar and this combination makes an overall realistic allocation of harmonics easier to achieve.
It may often be the case that an individual load will not actually require the entire allocation of emissions to which it would be entitled by virtue of its magnitude compared to system capacity. Being able to transfer that ‘spare’ allocation to another distorting load would enable more efficient utilisation of the harmonic absorption capacity of the network. There may not be such a load at the exact same busbar but within a slightly wider electrical region such a transfer may be more practically achieved.
The precision of any harmonic allocation is likely to be related to the precision of the data available to assess that allocation. As the parameters of the transmission network can vary significantly as the operating conditions change the implication might be that the allocations if tied to accurate assessments of load level might also have to change with the network or perhaps such a rigid specification of emissions allocation at a specific location is in fact not appropriate on the transmission system.
In the case of very large loads where number of separate supplies from different busbars might be required the allocation for that load should not be different for each supply. By combining a number of electrically close busbars into a single area the implied need for such a distinction between elements of the load can be removed.
The paper asserts that the future loading of individual busbars cannot be assessed with any reasonable degree of accuracy whilst the likely future loading on the entire network can be predicted with a greater degree of accuracy (or at least the sum of the uncertainties balance out more). Clearly allocating emissions limits on the total loading of the entire system would

EA Technology Review of Engineering Recommendation G5/4-1Stage 3 Connections and Higher Order Harmonics
Project No. 79410
35 of 62
be impossible. The adoption of areas is suggested as some sort of middle ground between the two extremes.
A methodology is proposed which offers a way to overcome the issues where an existing busbar is either unloaded or only very lightly loaded to avoid the allocation of emissions on other busbars preventing any future distorting load from being connected to the unloaded busbar. This involves assigning a level of future loading to that busbar; the suggested method takes the 90th percentile load relative to the fault level as the estimated future load. Based on the distribution of loadings in the Australian Transmission system where the highest loaded site reaches a load of 34% of the site fault level the 90th percentile loading is 5.3% of site fault level.
However it is demonstrated that this approach can lead to some seemingly anomalous allocations where existing more heavily loaded sites receive lower allocations than presently unloaded sites with a high fault level receive to take account of some potential future loading of as yet indeterminate magnitude. It is suggested that the division of the network into areas will permit a better compromise between the emissions allocations in such situations.
The paper proposes a methodology for determining the number of areas required for allocation of emissions across the network and for assigning which individual busbars should belong to which area. In performing the allocation of emissions to an area all transmission lines and series elements within the area are discarded and all passive shunt elements within the area combined into a single equivalent element. At the time of the paper investigations had been limited to purely inductive network representations in case complications should arise from considering shunt capacitances.
The paper concludes that area based allocation of emissions provides a feasible method of overcoming the problems which occur from not having accurate knowledge of the load locations and magnitudes and also provides harmonic emission levels which are not unduly constrained by making allowances for unlikely levels of future load at every busbar. This approach allows the absorption capacity of the whole network to be more fully utilised than would otherwise be the case following a strict implementation of IEC 61000-3-6.
The paper identifies further work which would be necessary to refine the procedure: Identify the most appropriate way of assigning load to an area Investigate using area based allocation to overcome other uncertainties such as
generation commitment Examine the effects of uncertainty in inter area equipment parameters Formalise a procedure for handling multiple harmonics Investigate the feasibility of using area based allocation with more detailed network
modelling including shunt capacitances from transmission lines and power factor correction.
2.7.2.6 Harmonic Allocation Using IEC TR 61000-3-6 at the Distribution Transmission Interface
This paper [32] describes the approaches taken to allocation of harmonic emission limits in a radial distribution system and the approaches to allocation of harmonic emission limits in a meshed transmission system.
The paper reiterates the particular problem of transmission systems that there are many different network arrangements which should be considered and there may be significant variations between the conditions which exist under these arrangements. It is suggested that it is inevitable that certain simplifying assumption will have to be made. These

EA Technology Review of Engineering Recommendation G5/4-1Stage 3 Connections and Higher Order Harmonics
Project No. 79410
36 of 62
assumptions will give rise to greater uncertainty and so a greater safety margin may be required for transmission emission limit allocation compared to allocation within the distribution system. From this it would appear that transmission system absorption capacity may not be expected to be as fully utilised as in the distribution network.
The paper demonstrates that if the typical approaches to allocation of emission limits are applied to a single load of 300MVA connected as a distribution load with a connection point at the MV busbar and as transmission load with a connection point on the HV busbar there is a significant discrepancy between the permitted relative harmonic currents.
The discrepancy arises due to the different modelling approaches used for transmission and distribution systems. Distribution systems tend to have reasonably well defined characteristics at harmonic frequencies and it is therefore possible to allocate emission limits with only a relatively small safety margin. Conversely, transmission system harmonic characteristics are less certain and as a result larger safety margins are required.
Three approaches in order of complexity to modifying the allocation process to remove this discrepancy are proposed:
Capped harmonic allocation Hybrid harmonic allocation Adjusted Planning levels.
Under the capped harmonic allocation approach for every harmonic allocation within a distribution system it would be necessary to consider the equivalent allowable transmission system absorption and apply this as a cap to the distribution allocation. A simple test is required to guide whether or not capping needs to be applied. However development of such a test is likely to require experience of the results for several cases where the allocation discrepancy was a cause for concern before a reliable test could be developed. For this reason the idea of a capped allocation was not developed further.
The hybrid harmonic allocation seeks to identify a rule of thumb to identify when problems might be expected to occur and introduce a modification to the allocation procedure for this case. The proposed approach considers only large loads connected one level down from the transmission system. A critical level of load is defined at which the hybrid allocation approach will be implemented, a value of 5% of the maximum load which is or would be connected directly to the transmission system. The portion of the load up to the critical level is given an allocation in line with a distribution approach, the remainder of the load above the critical level is given an allocation using the transmission approach, and the two allocations are combined together using the summation law. The two part approach avoids the discontinuity in the emissions allocation at the critical load threshold similar to the discrepancy which appeared when the same magnitude offload was considered on either side of the transmission distribution boundary.
The distribution of harmonic allocation between the different voltage levels is dependent upon the variation in planning levels which have been allocated between the EHV system down to MV and LV systems. If the planning levels were to be raised at EHV with the levels at MV remaining unchanged this would increase the available emission allocation at EHV but result in a reduction in emission allocation at MV level. The figures examined in the paper suggest that raising the planning levels may reduce the MV allocation by more than the increase at EHV leading to an overall reduction in the harmonic absorption of the network.
The paper concludes that the most promising solution is the hybrid emission allocation, whilst adjustment of the planning levels should only be considered if the problem of a
EA Technology Review of Engineering Recommendation G5/4-1Stage 3 Connections and Higher Order Harmonics
Project No. 79410
37 of 62
discrepancy between allocations is found to be widespread with the existing values of planning levels.
2.7.3 The Impact of Rural MV & HV Underground Network Extensions on Harmonic Voltage Distortion
This paper [33] examines the effect that network reinforcement, new connections and overhead line replacement can have on the harmonic voltage distortion levels. Using a simplified network model the effects of adding an additional unloaded cable to the network is examined and the effects on harmonic impedance with increased length of this cable is plotted for the 5th, 7th and 11th harmonics. The effect of these additional lengths of cable on the network harmonic impedance is expressed as a gain factor for each harmonic compared against the base case impedance prior to connection. The results of this calculation for the test network showed that the effects change with length and are different for each harmonic. In the example network the peak gain is 5 p.u. for the 5th harmonic with the addition of 160km of underground cable whereas for the 11th harmonic the peak gain is 1.8 p.u. with the addition of 11.5km of underground cable.
In a similar manner it is demonstrated that switching of capacitor banks can have significant effects on the levels of harmonic voltage distortion with the effects of a 60MVAr capacitor being equivalent to 80km of 132kV cable.
The management of harmonic voltage distortion focuses on the regulation of harmonic current emissions from load components either by product emission standards in the case of LV equipment rated up to 16A per phase and staged assessment procedures for larger individual items of equipment or groups of equipment. These assessments will take account of the existing voltage harmonic distortion levels and then determine whether the capacity of the network is sufficient to accommodate the proposed levels of emissions.
Whereas the fundamental network impedance is governed by the upstream network components and remains largely under the control of the network operator, the harmonic impedance of a network can be affected by changes in downstream components, such as capacitors, underground cable and resistive demand. In order to manage harmonic impedance both source and downstream elements of the network need to be controlled. The paper observes that exercising control over downstream components will become increasingly complex with the diversification in network ownership.
By examining the conditions surrounding the expansion of supplies for Southern Regional Railways some serious shortcomings in the ‘Worst Case Impedance’ approach detailed in Appendix 1 of IEC 61000-3-6 are identified. It is stated that this approach, although not generally used in the UK, is inappropriate for rural underground networks where the high shunt capacitance provided by the cables combined with the relatively high series inductance of lower fault level networks and a high shunt resistance resulting from sparse rural demand produce resonant conditions with a lower frequency and higher Q factor than urban underground networks.
The paper concludes that in order to control harmonic voltage distortion there is a need to control both harmonic impedance and harmonic current injection. To control the harmonic impedance the system designer must consider both upstream and downstream components. Projects which will increase the underground cable network or which will add capacitors for reactive compensation are likely to need harmonic filters. The paper recommends that standards bodies need to consider how to share rural underground network capacity before such networks become commonplace.

EA Technology Review of Engineering Recommendation G5/4-1Stage 3 Connections and Higher Order Harmonics
Project No. 79410
38 of 62
2.7.4 Voltage Droop Method
The strict application of IEC 61000-3-6 has been demonstrated to have some onerous data requirements in particular regarding the nature of the loads already connected to the network as well as the load seeking connection. In practice this level of detail is rarely available for either the existing or proposed load. In order to overcome this limitation an alternative approach which retains the main principles of IEC 61000-3-6 but which has significantly less onerous data requirements has been developed. The application of this method is examined and its effectiveness described in several papers [34. 35, 36] outlined below.
The voltage droop method essentially seeks to take account of the effect of the impedance of the network in determining the permissible levels of harmonic current emissions from a particular site. At first glance this seems to be the same as the existing allowances permitted under ER G5/4 to adjust the permissible current emissions up or down if the fault level at the point of connection is greater or less than the nominal 10MVA assumed for LV networks. However, there is a subtle difference between ER G5/4-1 and the voltage droop method which is: whereas G5/4 makes a linear reduction adjustment on the proportion of fault level against the reference levels used to derive the current emission limits and does not consider the magnitude of the load itself; the voltage droop method takes account of the size of the load in determining the adjustment in permissible current emissions.
The data requirements for the application of the voltage droop method are less onerous than for a strict application of IEC 61000-3-6 and the results obtained in the papers appear to err on the safe side in terms of the levels of distortion. However the technique as described in the papers and the results obtained are predicated on some specific assumptions about the nature of loads supplied from the MV and LV networks. In particular the assumption that any power factor correction capacitors installed are detuned by the inclusion of a series reactor. It is not clear whether that is a valid assumption to make for UK networks.
The papers only address the allocation of emission limits for MV and LV networks so it would appear that the approach cannot be applied to higher voltage levels where the simplifications of network data which is one of its main attractions would likely create larger errors in the resulting allocations.
2.8 Academic Research Work
2.8.1 Harmonic Management in MV systems
This PhD thesis [37] submitted to the University of Wollongong by Duane Robinson examines the experiences of changes in levels of harmonic distortion considering the results of a number of studies around the world. The result of his research into the various harmonic monitoring campaigns carried out around the world suggests that the trend was one of gradual harmonic growth with predictions in some literature that existing planning levels may be exceeded within a decade. We are now a decade on from the publication of this thesis and perhaps in some locations that prediction was correct. From this work and predictions it was suggested that there was a demonstrable need for a commitment to monitoring of harmonic levels within distribution systems to allow both DNOs and customers to plan for harmonic growth.
The thesis asserts that because of these rising levels of harmonic distortion DNOs should consider employing preventative measures to maintain distortion levels within acceptable

EA Technology Review of Engineering Recommendation G5/4-1Stage 3 Connections and Higher Order Harmonics
Project No. 79410
39 of 62
limits and that these measures should be considered as part of the network planning function. To assist in this planning it is suggested that DNOs will need to develop capabilities to estimate typical distortion levels for MV networks. To assist with this aim a methodology for assessing likely levels of distortion taking account of the diversity of loads is presented.
Some of the papers from Australia addressed previously have been borne out of the work undertaken for this PhD Thesis
2.9 Measurement
2.9.1 Method to Determine Contribution of the Customer and the Power System to the Harmonic Disturbance
This paper [38] describes calculation methodologies developed to help establish the contribution that an individual customer is making to the overall voltage harmonic distortion at the point of connection. As the electricity market has developed in France and following the introduction of the Emerald Power Quality contract, at the time the paper was written there was an expectation that mandatory rules would be issued in the near future governing the connection of distorting load and defining the obligations of both parties. In order to be able to establish whether the customer has met their obligations or not it is necessary to establish the source and magnitude of disturbances or distortion. To do this it is necessary to be able to distinguish with appropriate precision the harmonic current being emitted from the downstream installation from the current measured at the point of connection.
The current being measured at the point of connection is the vector sum of the current being emitted by the installation into the network and the current from the network towards the customer. In general it may be expected that the emissions from the customer are the dominant factor, but in the case of resonant conditions the harmonic current from the network to the customer may be more significant.
Three approaches to the calculation are suggested which allow the varying proportion of source and load harmonic current to be determined. All three methods are based on solving the equations below which represent the conditions present at the point of connection illustrated in figure 6 below.
h(i))IcJc(Zh(i)Vh(i))IsJs(Zh(i)V
The first method employs naturally occurring changes in customer load and network harmonic conditions to measure the pre and post disturbance values of Vh and Ih to enable the harmonic impedances to be established
The second approach involves regression analysis to resolve the equations substituting variables Vs for ZsJs and Vc for ZcJc
The third method is an iterative approach which first establishes a value for one unknown parameter from a set of measurements and then uses this first estimate to determine the other unknown parameter, the seed for this method is derived from the measurements of disturbances employed in the first method.
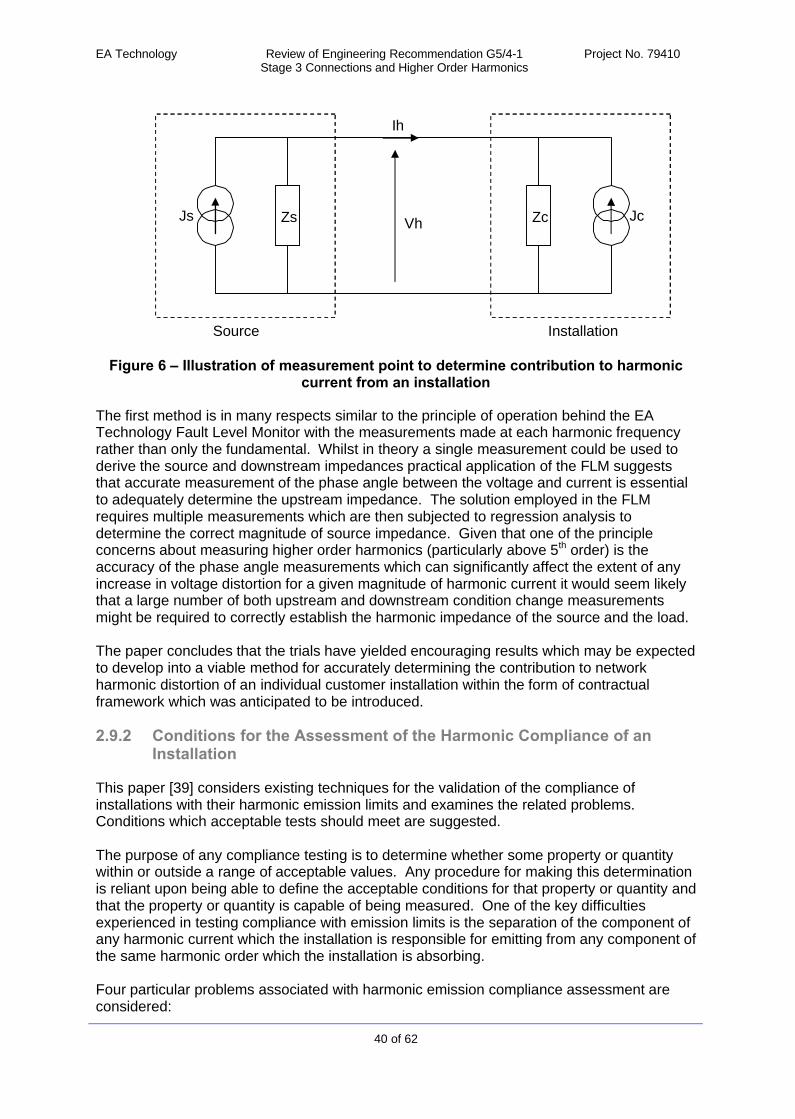
EA Technology Review of Engineering Recommendation G5/4-1Stage 3 Connections and Higher Order Harmonics
Project No. 79410
40 of 62
Figure 6 – Illustration of measurement point to determine contribution to harmonic current from an installation
The first method is in many respects similar to the principle of operation behind the EA Technology Fault Level Monitor with the measurements made at each harmonic frequency rather than only the fundamental. Whilst in theory a single measurement could be used to derive the source and downstream impedances practical application of the FLM suggests that accurate measurement of the phase angle between the voltage and current is essential to adequately determine the upstream impedance. The solution employed in the FLM requires multiple measurements which are then subjected to regression analysis to determine the correct magnitude of source impedance. Given that one of the principle concerns about measuring higher order harmonics (particularly above 5th order) is the accuracy of the phase angle measurements which can significantly affect the extent of any increase in voltage distortion for a given magnitude of harmonic current it would seem likely that a large number of both upstream and downstream condition change measurementsmight be required to correctly establish the harmonic impedance of the source and the load.
The paper concludes that the trials have yielded encouraging results which may be expected to develop into a viable method for accurately determining the contribution to network harmonic distortion of an individual customer installation within the form of contractual framework which was anticipated to be introduced.
2.9.2 Conditions for the Assessment of the Harmonic Compliance of an Installation
This paper [39] considers existing techniques for the validation of the compliance of installations with their harmonic emission limits and examines the related problems. Conditions which acceptable tests should meet are suggested.
The purpose of any compliance testing is to determine whether some property or quantity within or outside a range of acceptable values. Any procedure for making this determination is reliant upon being able to define the acceptable conditions for that property or quantity and that the property or quantity is capable of being measured. One of the key difficultiesexperienced in testing compliance with emission limits is the separation of the component of any harmonic current which the installation is responsible for emitting from any component of the same harmonic order which the installation is absorbing.
Four particular problems associated with harmonic emission compliance assessment are considered:
ZsJs JcZc
Ih
Vh
Source Installation

EA Technology Review of Engineering Recommendation G5/4-1Stage 3 Connections and Higher Order Harmonics
Project No. 79410
41 of 62
Identification of background voltage Determination of the dominant harmonic source Separation of the customer and supply contributions to harmonic distortion at the
point of common coupling Network harmonic impedance assessment
In examining the previous work which has been undertake to develop possible tests most if not all are identified as having some weakness or flaw which has subsequently been exposed.
Before compliance tests can be identified it is necessary to understand what would make test acceptable. Four criteria which should be met by a satisfactory compliance test are proposed:
Any compliance test adopted ought to relate in some way to the allocated quantity An acceptable compliance test requires some independence between the network
and customer side of the point of common coupling The design of the compliance test ought not to preclude corrective action from being
taken when an installation is found to fail to comply with its allocation The compliance test should not promote behaviour likely to cause damage to either
the network or the customer installation.
Whilst the criteria for a successful compliance test are defined the paper does not offer any guidance or insight in to how a test which meets these requirements may actually be realised.
2.10 Higher Order Harmonics
The standards making bodies draw distinct bands for the management of conducted disturbances, between 2-9kHz and 9-150kHz. Responsibility for these areas falls between different international committees. At present standards typically address the harmonic current emissions of equipment at frequencies up to 50 times the fundamental frequency.
2.10.1 Closing the Spectral Gaps
A presentation [40] given by John Woodgate of JM Woodgate Associates who is a member of the BSI EMC committee GEL 210_12 considers the gaps in the existing suite of standards addressing the issue of higher frequency disturbances.
Although there are generic standards in place for immunity in the frequency range 2kHz –9kHz, these are not always carried through to individual product standards. These standards are
IEC 61000-4-6: Immunity to conducted disturbances due to Radio Frequency fields 9kHz to 80MHz
IEC 61000-4-13: Immunity to Harmonics & Interharmonics IEC 61000-4-16: Immunity to common-mode disturbances 0Hz to 150kHz.
There are currently no published compatibility levels for disturbances beyond the 50th order.Similarly there are no existing planning standards for the frequency range above the 50th
order.
Measurement methods for harmonics and interharmonics are described by IEC 61000-4-7. There is an informative annex which describes the measurement of harmonic and

EA Technology Review of Engineering Recommendation G5/4-1Stage 3 Connections and Higher Order Harmonics
Project No. 79410
42 of 62
interharmonic disturbances in the frequency range 2kHz – 9kHz. Further detail regarding this document is given in section 2.11.2 below.There are some emissions standards in use within this frequency range and there are plansfor the development of more generic standards although there has been little progress to date. The product specific emissions standards currently in use are:
CISPR 11 considers conducted emission and radiated magnetic field emission limits in the range 9kHz – 150kHz for induction cooking appliances only.
CISPR 15 considers conducted emission and radiated magnetic field emission limits in the range 9kHz – 150kHz for self ballasted lamps only.
The generic emissions standards which have been proposed are: IEC 61000-3-9: Limits for interharmonic current emissions (equipment with input
power ≤16A per phase and prone to produce interharmonics by design). There has been no progress on this project and it is listed on the IEC websites as a possible work item, there is no work currently scheduled.
IEC TR 61000-3-10 Emission limits in the frequency range 2kHz – 9kHz. There has been no progress on this project either; it is also listed as a possible work item with no work currently scheduled.
IEC SC77A 3has been asked by TC134 for assistance with the development of standards for emissions and immunity relating to smart meters. SC77A reported to the IEC Advisory Committee on Electromagnetic Compatibility (ACEC) which has resulted in other Technical Committees also recognising the need for new and revised standards addressing the frequency ranges 2kHz – 9kHZ and 9kHZ – 150kHz. SC77A secretariat is currently asking its working groups to review the immunity standards urgently and to work on the preparation of emission standards particularly in the range 2kHz – 9kHz. The range 9kHz – 150kHz falls under the purview of SC77B5.
2.10.1.1 Emissions, Immunity & CompatibilityEmissions & Immunity levels must be complementary, for low frequency conducted emissions this is expressed in terms of compatibility levels which are defined in IEC 61000-2-2, IEC 610000-2-4 and IEC 61000-2-12. The actual limits for emissions are dealt with by SC77A WG1, immunity levels are set by WG6 and compatibility levels by WG8. It is therefore essential that these three working groups cooperate effectively to ensure that the levels are established with sufficient margins between them to provide the desired electromagnetic compatibility.
This cooperation is enshrined within the terms of reference for each of the working groups WG1 liaises with WG6 with regard to the test procedures to measure emissions and
determine immunity. WG1 liaises with WG8 and other international bodies to establish the typical voltages
seen on networks and the maximum acceptable (compatibility) voltage levels. WG6 uses information received from WG1 on the typical and maximum acceptable
levels to aid determination of the immunity levels.
3 SC77A is the sub committee of Technical Committee 77 Electromagnetic Compatibility which is responsible for the management and development of standards addressing electromagnetic compatibility low frequency phenomena ≤9kHz4 IEC TC13 is responsible for the development and management of standards relating to electrical energy measurement tariff and load control5 SC77B is the sub committee of Technical Committee 77 Electromagnetic Compatibility which is responsible for the management and development of standards addressing electromagnetic compatibility high frequency phenomena >9kHz

EA Technology Review of Engineering Recommendation G5/4-1Stage 3 Connections and Higher Order Harmonics
Project No. 79410
43 of 62
WG8 liaises with other working groups of TC77 other Technical Committees and other international bodies.
However for these liaisons to be effective and the data to be exchanged between working groups the data must be submitted in the first place. The problem which faces these working groups in determining permissible emission limits is the lack of data about the existing immunity of the many millions of devices which are already connected to the public electricity networks. As no existing product standards require immunity tests to be carried out in the frequency range 2Hz – 9kHz there is no readily available data to provide this guidance. This presents a very real risk that any emission limits which are set may be unnecessarily restrictive and similarly that any initial guidance on compatibility levels may also err on the side of caution. This could then potentially result in the development of immunity standards which would effectively clamp the levels. As the levels of these higher order harmonics in the networks are not currently measured then there is a potential risk that any guidance which might be issued on compatibility levels may set a level which is below the levels which already exist which the DNOs and TSOs would be responsible for addressing.
In order to assist the production of practical and realistic levels for the new compatibility and immunity levels there would be a benefit in carrying out a survey of existing conditions at a range of sites across differing voltage levels and types of network. If possible a coordinated approach via Eurelectric across the EU would provide a much greater range of data to inform this process.
2.10.2 IEC 61000-4-7
The measurement method for harmonics and interharmonics is described in IEC 61000-4-7[41]. It should be remembered that IEC 61000-4-7 was originally created to describe how measurements should be made of emissions from equipment when testing to demonstrate compliance with IEC 61000-3-2 (and its predecessor standard IEC 60555-2). Consequently there are aspects of the standard which describe in detail the arrangements for carrying out the emissions tests for an individual piece of equipment in an EMC test laboratory.
This standard describes how to measure and group the spectral components up to 9kHz which are superimposed upon the fundamental of the power system. The standard draws a distinction between the harmonic interharmonics and other component above the harmonic range and up to 9kHz
Informative annex B describes the requirements of a method for measurement in the frequency range 2kHz – 9kHz (40th to 180th harmonic).
There two classes of accuracy specified for instruments complying with the requirements of this standard class I and class II. The required maximum errors in the measurements aregiven in Table 9 below.

EA Technology Review of Engineering Recommendation G5/4-1Stage 3 Connections and Higher Order Harmonics
Project No. 79410
44 of 62
Table 9 – Accuracy requirements for current voltage and power measurements
2.10.3 CISPR 16
CISPR 16-2-1 [42] provides details of how to undertake measurements of conducted disturbances in the range 9kHz – 30MHz. As the standard covers such a wide range of frequencies there are inevitably a number of considerations about the arrangement of connections and measurement cables which have the potential to influence the measurement results particularly at the higher frequencies.
The actual measurements made in line with CISPR 16 are made using a spectrum analyser;the standard instead focuses on the requirements for the physical arrangements of the equipment under test and the measurement connections. Due to the higher frequencies included at the top end of the standard’s frequency range in order to help avoid any stray signals being induced in the test measurements the connections are ‘preferred to meander’. This is a different arrangement to that which would be most likely to be installed in either a permanent monitoring installation where the connections would routed in a wiring loom or a temporary installation where good practice would suggest that the test connections should be bunched together and installed in such a way as to avoid introducing any electrical or other physical hazards to personnel working in the vicinity of the temporary installation
2.10.4 IEC 61000-4-30
This standard defines the measurement and interpretation of results for power quality parameters in 50/60Hz ac power supply systems. Measurement methods are described for each parameter.

EA Technology Review of Engineering Recommendation G5/4-1Stage 3 Connections and Higher Order Harmonics
Project No. 79410
45 of 62
This standard is currently under revision; one of the proposed additions to the revision is informative annex C which addresses the measurement of conducted emissions in the range 2kHz – 150kHz. This annex is being introduced in recognition of the increasing levels of concern about devices which emit voltages or current in these frequency ranges. Theseemissions may be ‘unintended’ in the case of switching noise from a power electronic device or intended in the case of power line communication equipment. For measurement of emissions during type testing of a product to ensure compliance with any emission limits then the methods described in 61000-4-7 and CISPR 16 are appropriate since the duration of any testing will be shorter and the consequent amount of data produced is a manageable quantity. However in the case of longer term or permanent measurements being made at a customer connection point or within a distribution network the complexity and expense of implementation and the volume of data which will be generated maybe overwhelming. In order to address this concern the informative annex proposes a practical measurement method which may be considered more appropriate for longer term measurements. In this case the methodology records the maximum, minimum and average rms voltage conditions in 2kHZ wide frequency segments between 2kHZ and 150kHz for 10/12 cycle intervals.
The revision of IEC 61000-4-30 is scheduled for completion in 2014, so in the short term in order to make measurements of higher order harmonics with any hope of comparability between results we will be restricted to instruments measuring in the range 2kHz – 9kHz which implement the informative annex B of 61000-4-7 fully, or selecting a single brand of instrument so that at least all measurements are carried out in the same manner.
2.10.5 Measurement – limitations
The effect of transducers upon the measurements of Power Quality parameters is acknowledged in IEC 61000-4-30 with some discussion of the issues in Annex A. The measurement methods which are applied describe the measurement of the voltage or current waveform presented to the instrument; it is the responsibility of the user to consider the effect that the transducer may have upon the accuracy of the reproduced signal.
ACE Report 73 [43] contains within Appendix K an assessment of the typical capability of the CTs and VTs found on the UK transmission and distribution networks.
Table 10 Indicative Frequency Response of existing VTs and CTs
Voltage Range Device Capability≤66kV Electromagnetic VTs Up to 1500Hz (30th harmonic)≥132kV Capacitor Voltage transformers Unsuitable tuned at 50Hz≥132kV Capacitor Voltage Divider Suitable provided load
impedance >10 times 50Hz impedance of bottom arm
<132KV Wound ring core CT 1500Hz (30th harmonic)275kV and 400kV Large ring core Ct Up to 10kHz (200th harmonic)
2.10.6 Harmonic Measurements Using Capacitor Voltage Transformers
A paper published in the IEEE transactions on Power Delivery Volume 20, January 2005 [44] describes a method for the measurement of harmonics in EHV systems based on the measurement of currents in a Capacitor Voltage Transformer (CVT) and the values of the capacitor elements of the CVT.
EA Technology Review of Engineering Recommendation G5/4-1Stage 3 Connections and Higher Order Harmonics
Project No. 79410
46 of 62
Capacitive and Resistive dividers have both a significant capital cost and space impact within a substation especially when they cannot be used to supply protection relays or meters and are typically applied to the specific task of measuring harmonics. CVTs do not have a uniform flat frequency response making them unsuitable alone for the measurement of harmonics. Techniques have been developed to compensate for the frequency response of the CVT removing the errors in measurement. However, this approach requires that the offline tests be carried out on the CVT to determine its frequency response to allow the correct compensation, this is further complicated by the fact that CVT errors vary with the burden applied.
The paper describes a method whereby conventional CVTs can be used to make harmonic measurements without the need to carry out any offline testing of the CVT to determine its frequency response. Knowing the values of the capacitor elements and measuring the currents flowing in the elements the primary voltage can be calculated. By measuring the current at each harmonic frequency the corresponding harmonic voltage can be determined.
The methodology was modelled using an Electromagnetic Transient Program, laboratory tests were carried out with known sources of harmonic distortion and comparisons made with measurements from CVTs where the frequency response characteristics had been measured and compensated to establish the validity of the proposed methodology.
The paper concludes that the simulations and field measurements have demonstrated that with the relatively simple modification of making current measurements on the capacitor elements, a standard CVT can be used to make harmonic measurements without the need for offline testing or any knowledge of the burden applied to the CVT.
One key benefit of this approach was identified in the measurement of low level harmonic voltages such as typically experienced for higher order harmonics. As the reactance of the path on which the measurements of current are made actually decreases with increasing frequency the ability of the technique to measure the harmonic voltage is unaffected by the low magnitude of the source harmonic voltage compared to direct voltage measurement techniques such as wound VTs, and resistive or capacitive dividers.

EA Technology Review of Engineering Recommendation G5/4-1Stage 3 Connections and Higher Order Harmonics
Project No. 79410
47 of 62
3 WP 1 – Comparison of Methodologies
3.1 First Come First Served v Equal Rights
The existing overall methodology of G5/4 is in truth a hybrid of these two approaches. At lower voltages where to an extent the harmonic emissions of individual customers are not directly controlled but rather the emissions are limited by the application of EMC standards which define and govern emissions based on the type and capacity of device, the approach is more readily characterised as equal rights. No specific limitations are placed on a domestic customer regarding the level of emissions.
As we move up the voltage levels and size of equipment seeking connection the complexity of connection assessment increases and the approach in G5/4-1 gradually shifts from one of equal rights towards first come first served. There are good and reasonable arguments in favour of each approach, which we will briefly examine below.
3.1.1 First come first served
Network owners and operators have a number of obligations in the operation and development of the networks. For this discussion there are two particularly pertinent requirements which must be considered and can be paraphrased as:
To provide the least cost technically acceptable connection. To plan and operate an economic and efficient network.
These requirements are complementary and seek to ensure that the network is run effectively to benefit all of the connected customers. However when considering an individual connection a tension can arise between the twin aims of providing the lowest cost connection and ensuring the economic development of the network for the future.
The idea that the first comer gets virtually unlimited access to the available network headroom for absorbing disturbances and distortion could be considered to be a literal interpretation of the requirement to offer the least cost technically acceptable connection. It certainly offers the least cost connection to that customer, but any subsequent customerswill potentially then be subject to progressively more restrictive connection conditions.
If the first comer is offered a relatively less restrictive connection thereby reducing or removing the headroom to absorb further disturbance or distortion at the point of common coupling whilst still apparently leaving capacity for additional network connectionsconsidering the current carrying capacity of the network elements could that be interpreted as failing to operate and develop an economic and efficient network?
3.1.2 Equal Rights
If the first comer has their emissions limited in proportion to their share of the network capacity this instinctively feels more fair and equitable to the second and subsequent customers seeking connections below the same primary node. However in this case the first customer may now be required to invest potentially significant sums of money to limit the level of their emissions in case a further application for connection might be received at some time in the future. If there is little chance of such a subsequent connection enquiry materialising then the first comer might consider that they have unnecessarily been required to pay for and install mitigation equipment.
EA Technology Review of Engineering Recommendation G5/4-1Stage 3 Connections and Higher Order Harmonics
Project No. 79410
48 of 62
The notion of equal rights has also been shown to be easier said than done in some circumstances, raising the question of which parameter is shared equally, should it be current emissions, voltage emissions or a hybrid of the two? The papers discussed under section 2.6 have highlighted difficulties in the rigorous application of IEC TR 61000-3-6 and proposed some alternative approaches to either improve on identified problems or to simplify the assessment procedures. However the simplifications offered have tended to rely on certain assumptions which may or may not be applicable to all UK distribution networks.
As the UK has not operated an equal rights allocation of emissions up to now there will be instances where, although there remains headroom within the network to connect further disturbing or distorting equipment, this headroom may not be in proportion to the available connection capacity. Any move towards an equal allocation of emissions rights will necessarily have to take due account of this situation. This tends to suggest that under such an approach future connections should be considered in terms proportional allocation of the remaining headroom.
3.1.3 Potential Compromise
Perhaps the best way forward is not to stick rigidly to either approach, where a number of applications are being received, or are expected to be received, in a relatively short space of time then it would seem unjust that the customer submitting their application first gets the cheapest connection with each subsequent application becoming progressively more expensive as increasing levels of mitigation are required. Such a queued approach to assessment could also lead to issues when an applicant withdraws or wishes to amend their application. This change in the queue can lead to the need to reassess other connection applications. In such a case the equal sharing of the remaining available capacity between all of the applicants would be more equitable and potentially much easier to manage as the applications progress from initial enquiry to firm acceptance of a connection offer. During this period there will quite likely be some applications which do not progress, potentially freeing up additional absorption capacity, there may also be additional applications which need to be assessed; if the available absorption capacity is being equitably shared according to share of network capacity rather than allocated on a chronological order of application,then any variation in emissions up or down which might be necessary as the assessment is carried out prior to firm connection offer, should be much easier to achieve.
However where a single application is received, and if it is the case that for whatever reason another application may not be received imminently or within duration of a planning window (the length of this to be determined in further discussions), then it may be a reasonable compromise to consider the most favourable approach to ‘equal’ allocation of emissions for that customer, accepting that this may proportionally reduce available headroom for potential future connections. Whilst the idea that there can be a more favourable approach to an equal allocation seems contradictory, the potential for such a condition arises when you consider the customer location relative to the existing network and the parameter used to assess the equality of emissions.
The most suitable approach to the allocation of emissions whether based on shares of harmonic voltage emissions, harmonic current emissions or harmonic volt-amperes must be considered taking account of the distribution of the applicants over the network and their relative magnitudes. The papers described in section 2.6 describe the advantages and disadvantages of the various approaches to division of the rights allocation. There does not appear to be a single emissions allocation method which could necessarily be considered the correct one in all cases. The following issues should be considered in the formulation of any guidance.

EA Technology Review of Engineering Recommendation G5/4-1Stage 3 Connections and Higher Order Harmonics
Project No. 79410
49 of 62
The number of near coincident applications for connection or the likelihood of such applications.
o It may be the case that where a particular area has been designated as suitable for the development of, for example, windfarms and therefore there may be a presumption in favour of planning permission being granted that it would be more appropriate to consider an equitable allocation of emissions based on the available network capacity
How spread out would the anticipated connections be? To what extent will any connection be considered sole use for the connected
customer?
3.2 Measurement Requirements
3.2.1 Background Measurements
One of the chief concerns for GB DNOs with the assessment of proposed connections which fall under Stage 3 is the timescale required by Ofgem for provision of a connection proposal. This does not allow sufficient time to establish where measurements might be required and to carry them out before at least an indicative cost has to be provided.
The requirements for measurements in ER G5/4-1 and ETR 122 state that measurements should be taken over a period of at least 7 days in order to capture a full weekly cycle of network loading conditions. In addition ETR 122 advises that the measurements should be made at a time when the fault level at the point of common coupling is representative of the conditions which will be present post connection. Where this is not possible the values obtained may be scaled. It is acknowledged in ETR 122 that the network conditions may vary throughout the year and it will not be possible to undertake measurements at differenttimes of the year within the timescales required of the connection assessment process. However it also says that the DNO should be aware of the possibility that such variations may occur as a result of changing load patterns and circuit configurations. It does not say that measurements should have been made previously just that DNOs should be aware of the possibility. Whilst it is one thing to be aware that such changes may occur it is quite another to actually know what the effect actually is especially if the network configuration changes might introduce conditions giving rise to a resonance condition.
3.2.2 Measurements to check compliance
The issue of measurements to check compliance is dependent upon an acceptance test being defined which meets the four criteria outline in the paper [39] reviewed in section 2.9.2. The conclusion of that paper did not identify any existing measurement technique for the measurement of harmonic current which would be able to meet the four criteria or is able to satisfactorily separate the components of emissions and absorption.
Until such a definitive methodology is developed any compliance testing would seem to be a matter for negotiation between the network operator and the customer, or their technical representative, as to what criteria will be judged to represent success and how and under what conditions will that criteria be measured.
EA Technology Review of Engineering Recommendation G5/4-1Stage 3 Connections and Higher Order Harmonics
Project No. 79410
50 of 62
3.3 Modelling Requirements
3.3.1 Influence Coefficients
The Influence Coefficient Khj-m is the harmonic voltage of order h at node m which is produced when a 1pu harmonic voltage of order h is injected at node j. The influence coefficients are related to the elements of the node impedance matrix of the system for the harmonic order of interest. An influence coefficient greater than 1 indicates a resonant condition and an amplification of the effects of the current emissions. To calculate the values of the influence coefficients for all of the nodes of interest will typically require a harmonic analysis computer program. More remote parts of the network upstream and downstream of the area of interest may be represented by their equivalent source impedances. For an accurate assessment of the influence coefficients Annex D2 of IEC 61000-3-6 suggests that the system should be modelled for at least 2-3 nodes away from the nodes of interest.
3.3.2 Extent of Modelling
The majority of papers reviewed concerning the requirements for modelling of the transmission system concur that the longer feeders involved necessitate the use of detailed models incorporating distributed parameters for the series impedances and the shunt admittances. In addition for these models the skin effect of the conductors on the series resistance is also shown to have a significant effect on the assessment of the harmonic impedance. The need to undertake a number of different studies to ensure that as far aspracticable the full range of operating conditions has been assessed particularly at transmission level together with these factors tend to militate against simplification of the transmission system modelling.
The typical MV load models have been shown to introduce errors when employed without a model of the network between the HV system and the MV loads. However the paper [25] reviewed in section 2.6.6 provided encouraging results which suggest that an equivalent MV load model can be developed which allows this area to be simplified without undue effects upon the results. There are caveats in that paper as to the applicability of the average models to small scale network studies. It would seem that average models developed following the principles outlined in that paper would provide useful models of the MV network 2-3 nodes distant from the point of connection being assessed but assessment of a connection in the 132kV and 66kV or 33kV networks should seek to employ more accurate models in the more immediate vicinity based on actual network measurements.
3.4 Point of common coupling
In ER G5/4 the point of common coupling is defined as the point in the public supply system, electrically nearest to a Customer’s installation, at which other Customers’ loads are, or may be, connected. Whilst for some larger connections the point of common coupling is at 33kV the reality is that in the vast majority of cases the actual non-linear load will be connected at a lower voltage level than this.
In IEEE 519 the point of common coupling may be considered to move for the purposes of assessing compliance with current emissions as described here. ‘The point of common coupling with the consumer/utility interface is the closest point on the utility side of the customer’s service where another utility customer is or could be supplied.’ The definition

EA Technology Review of Engineering Recommendation G5/4-1Stage 3 Connections and Higher Order Harmonics
Project No. 79410
51 of 62
goes on to say, ‘The ownership of any apparatus such as a transformer that the utility might provide in the customer’s system is immaterial to the definition of the point of common coupling.’ This allows the point of common coupling to be considered on the HV terminals of the transformer rather than at the low voltage terminals as might otherwise have been the case based on the location of metering as described in Section 10 of the standard itself. In the case of IEEE 519 this latitude offers the benefit to the customer that by considering the point of common coupling to be at a point with a higher short circuit current level and as a consequence of the transformer ratio a lower load current then higher emissions are permitted due to the increased Isc/IL ratio. It should be noted that whilst this approach may allow an installation to demonstrate compliance with the standard it will not address control of the emissions and the consequent voltage distortion levels within the customer’s installation.
However, if when carrying out an assessment of a connection whose point of common coupling is or will be at 33kV the customer is already aiming for or could be encouraged to aim for compliance with stage 2 limits at the lower voltage busbar to which the load is actually connected then the connection assessment could potentially be significantly simplified. Whilst this may not be a trivial request it should be remembered that controlling the voltage distortion levels within their installation may have some significant benefits in terms of the Electromagnetic Compatibility performance of their installation, avoiding maloperations and premature failures of control equipment which may otherwise be adversely affected by elevated harmonic distortion levels. It has tended to be the Author’s experience that well informed customers do tend to attempt to apply G5/4-1 limits within their installations even when there is no requirement to do so from a contractual or PCC point of view. This approach is already sanctioned at the end of section 8.4.3 of ETR 122 where it is mentioned in the context of a 33kV connection with a small amount of non-linear equipment. Extending this approach to connections with larger levels of non-linear equipment mayrequire the development of rules governing the connection and the management of any mitigating devices. For example to avoid the concerns expressed regarding the potential effects of filtering on the background harmonic levels it might be a requirement that mitigation is directly associated with individual items of plant or groups of items which only ever operate together. This directly associated mitigation would only be connected when the item of plant was in operation.
EA Technology Review of Engineering Recommendation G5/4-1Stage 3 Connections and Higher Order Harmonics
Project No. 79410
52 of 62
4 WP 2 – Higher Order Limits
4.1 General
There is a circular conundrum being experienced in the standards making bodies looking at the issue of higher order harmonic limits; any limits which are to be created must necessarily not impinge upon the immunity of existing equipment, however the immunity of existing equipment is not necessarily known as it was not tested since there are no emission limits or compatibility limits against which to assess immunity. The approach is therefore likely to be to set levels at a low level where it is not expected that significant immunity issues will be experienced. The danger, such as it is, with this approach is that in seeking to avoid potential problems with existing equipment of unknown immunity the limits are potentially set unnecessarily low with the potential for an increase in costs for manufacturers and perhaps even system operators in meeting and maintaining these emission and compatibility levels.
4.2 Measurement
A further difficulty arises in the actual measurement of the higher order harmonics. Direct connection at Low Voltage for voltage distortion measurement is a practical proposition and the frequency response of the measurement device can more readily be determined, although there may still be scope for higher frequency measurements to be affected by the installation of test leads and new approaches and standards for installation may be required to ensure comparability at the highest frequencies.
Measurement of the current emissions giving rise to the voltage distortion will be potentially more problematical at these higher frequencies particularly when considering higher power devices where the measurement of the current is necessarily achieved using transducers which may themselves attenuate the signals at higher frequencies. The measurement inaccuracies are not limited to just the magnitude of the harmonic but also its phase angle, which is critical to any assessment of the cumulative effect of harmonics on the waveform.
The most recent amendment to Engineering Recommendation G5/4-1 saw the introduction of the concept of Partial Weighted Harmonic Distortion (PWHD) for harmonics above the 25th
order precisely because of the difficulty in measuring accurately both the magnitude and the phase angle of these higher order harmonics. The concept of PWHD was introduced in IEC 61000-3-12 [45] which sets emission limits for LV apparatus with a rated current between 16A and 75A per phase.
4.2.1 Standards for Measurement
The applicable standards for measurement of harmonics beyond the current range are IEC 61000-4-7 and CISPR 16-2-1. The requirements for the measurements in IEC 61000-4-7 are at the present time only an informative annex.
IEC 61000-4-30 which specifies the measurement methods for PQ parameters does not currently have any provisions for harmonic orders beyond the 50th although an informative annex is planned for the next edition scheduled for publication in 2014. This informative annex is intended to cover measurements in the range 2kHz – 150kHz. As such it will bridge the requirements contained in 61000-4-7 and CISPR 16-2-1. It should be remembered that IEC 61000-4-30 although titled as a power quality measurement standard is predominantly concerned with the techniques used to make measurements of voltage parameters. The measurement of current parameters considered within 61000-4-30 being

EA Technology Review of Engineering Recommendation G5/4-1Stage 3 Connections and Higher Order Harmonics
Project No. 79410
53 of 62
informative annexes to aid the interpretation of the results of voltage measurement and the proposed measurements for higher order harmonics will focus on the voltage distortion.
4.2.2 Standards for Installation
There are no specific requirements in either IEC 61000-4-7 or IEC 61000-4-30 regarding the means of installation. It is typically good practice when installing a monitor to arrange any temporary wiring in a neat loom bunched together to make it relatively easy to fix the wiring at points within the panel so as not to impede anyone requiring access during the monitoring period. Similarly fixed monitoring will tend to have its wiring grouped together in the wiringloom of the panel.
CISPR 16-2-1 which describes the test arrangements for emissions testing in the frequency range 9kHz – 30MHz of a single item of equipment in an EMC test laboratory does prescribe the requirements for installation. In order to reduce as far as possible any common mode induced interference the test leads are described as meandering. This is a marked difference from typical practice for the installation of monitoring on the distribution network.
4.2.3 Limitations of transducers
From the results of studies carried out for ACE Report 73 it appears that the response of many existing wound type VTs and CTs on the distribution system may begin to attenuate beyond the 30th harmonic.
Capacitor VT measurements have been discussed in section 2.10.6. The results described in the paper demonstrate that it is possible to obtain good quality measurements from Capacitor Voltage Transformers with a relatively simple modification.
Whilst it has been demonstrated that the techniques exist to be able to make measurements of higher order distortion using such equipment it must be remembered that the majority of voltage transformers within the distribution networks are of the wound electromagnetic type.
In the short term this suggests that any measurements to determine the extent of any existing higher order harmonic voltage distortion need to be made at LV where direct connection is possible or at EHV substations equipped with CVTs which either have been or can be modified to include the harmonic current sensors.
EA Technology Review of Engineering Recommendation G5/4-1Stage 3 Connections and Higher Order Harmonics
Project No. 79410
54 of 62
5 Conclusions
5.1 Work Package 1
5.1.1 Background measurements
The current approach of making measurements at a potential connection site when the connection enquiry is received causes delays and difficulties in the connection process. As the results of these measurements are often not going to be available in a timescale which fits in with the requirements of the guaranteed standards for a response to a connection enquiry the initial indicative offer necessarily comes with a number of caveats. If and when the conditions which drive these caveats are realised the revised offer can be significantly different leading to the potential for unnecessary conflict.
The options regarding background measurements are: Do nothing, in which case it will be necessary to either continue with the existing
approach of making offers with a number of potentially significant caveats attached or to seek a general extension from Ofgem to the guaranteed response times for these more complicated and involved assessments.
Begin a program of installing fixed monitoring equipment or at least fixed monitoring points to allow a program of periodic measurements at major substations 132/33kV(or 132/11kV in major cities) and above. This will of course have both an initial capital cost and a relatively small ongoing revenue cost. The benefits will be a ready bank of background measurements which will indicate which 33kV networks are likely to experience problems with the connection of a significant source of harmonic current emissions. The measurements will be capable of offering a wider range of data including differing times of year and network configurations, all the better to assess the potential impacts at an early stage.
An increase in the number of fixed monitoring installations would as mentioned above provide a ready bank of measurements to inform the assessment process. It would also provide additional information regarding the general trend of voltage distortion on the distribution network over time. This potential benefit overlaps with the increasing desire from the Council of European Energy Regulators, CEER, for the availability of a range of power quality parameters regarding public electricity supply networks. Before a programme of installation of such fixed monitoring equipment could be considered it would be necessary to understand how it would be funded, what the required outputs would be and how these would be used to provide meaningful information to customers.
5.1.2 Point of common coupling
The original requirement for a Stage 3 connection as described in ACE Report 73 suggests that this was intended for connections at 132kV or above (although G5/3 did not contain limits for the 275KV and 400kV systems). It may be beneficial for many connection requests to consider whether for assessment purposes the point of common coupling should be moved to the low voltage side of any customer owned transformer. Whilst this may in some cases present some emission control challenges at the lower voltage levels for the customer which they might otherwise have avoided, it will have the advantage that if these are addressed during the connection process they will better manage the Electromagnetic Compatibility conditions within their network and may avoid malfunctions and premature failures which they may otherwise have experienced and then had to engage with the DNO and other service providers to resolve.
EA Technology Review of Engineering Recommendation G5/4-1Stage 3 Connections and Higher Order Harmonics
Project No. 79410
55 of 62
5.1.3 Modelling
The scope for simplifying the modelling appears to be limited to at least 2-3 nodes away from the area of interest. Whilst the use of influence coefficients as described in IEC 61000-3-6 can highlight the potential for resonances which will require treatment to avoid unduly harsh emission limits they are not a substitute for modelling, they still require the establishment and maintenance of a model which extends beyond the immediate area of interest and in order to provide the required accuracy the components of the model particularly in the case of longer lines found in transmission and sub-transmission networks must be represented in terms of distributed parameters for lines and cables rather than simply lumped impedances.
Modelling of downstream loads in the MV system as lumped equivalents at the edge of the transmission system also adversely affects the accuracy of the answers. The typical MV models are intended for use at the end of the MV system and removal of the MV network affects the usefulness of the answers obtained.
The models whose development was outlined in the French paper [25] referenced in section 2.6.6 were described as being best suited to modelling a wider area network and as such might be applied to the network beyond the 2-3 node limit described in IEC TR 61000-3-6 as being required as the minimum for modelling. For the elements of the network within that 2-3 node limit it is suggested that more detailed modelling based on actual network measurements should be employed.
5.1.4 Expansion of harmonic producing equipment
The amount of non-linear harmonic producing equipment is set to continue expanding both as a result of the increased penetration of the ‘traditional’ forms of this equipment and as a result of technology substitution.
The banning of incandescent lamps will see their replacement in many cases with Compact Fluorescent Lamps or LED lamps or low voltage halogen lamps. All of these alternative lamps often, if not always, employ a switched mode power supply to provide the dc supply to the lamp. These produce similar current emissions profiles to Personal Computers replacing the former linear load of the incandescent lamp. There is an additional effect from this technology substitution which is the loss of the damping effect of the resistive load provided by the incandescent lamps and other linear loads which may be displaced by power electronic controlled versions.
As some of these technologies mature and they begin to become truly credible replacements for the older technologies their demand is actually increasing although still lower than that of the Incandescent lamps they are displacing. However whereas when the demand was low the harmonic emissions were ‘unlimited’ as the devices increase in electrical demand they reach the thresholds where limits on emissions are applied, the cost of meeting the limits is obviously unwelcome to the manufacturers and they lobby hard within the standards making bodies to revise or remove these emission limits often suggesting that as we are not generally experiencing problems the limits could be raised. The fact that we are not experiencing widespread problems really can only be assumed to demonstrate that the EMC regulations and the associated standards are working. Any alteration to the limits should only be countenanced after a rigorous understanding of any adverse effects, in terms of reduction in operating life which might be experienced by the network components, has been gained from a focussed program of work to quantify and understand what the effect of higher harmonic missions might be on the insulation of cables, heating losses in cable cores and transformers.

EA Technology Review of Engineering Recommendation G5/4-1Stage 3 Connections and Higher Order Harmonics
Project No. 79410
56 of 62
To avoid the inappropriate raising of limits it is essential that effective engagement is maintained on the IEC working groups responsible for the maintenance and development of the basic EMC publications.
5.2 Work Package 2
5.2.1 Standards Gap
The current lack of standards in this area makes determination of appropriate limits impractical, whilst it would be possible to look to devices a set of arbitrary planning limits, there would be little in the way of evidence to suggest that these were justified or even achievable.
5.2.2 Measurement Issues
Although IEC 61000-4-7 does contain details of how to make measurements of the harmonic and interharmonic spectral energy in the range 2kHz – 9kHz it currently takes the form of an informative annex. Whilst it remains informative there is relatively little incentive for any manufacturer to implement this element fully especially since there are few emissions standards and as yet there is no requirement in IEC 61000-4-30 to include measurements in this range, although as has been mentioned already this due to change with the next edition.
It is currently suggested that the propagation of higher order harmonics may be limited by the impedance characteristics of the network itself, the series reactance tending to impede the propagation and the shunt capacitance tending to absorb the higher frequency currents within a relatively short distance of the source. Measurements may therefore have to be made at or very close to the connection of the types of device suspected of causing these types of emissions. In addition it may be worthwhile purchasing examples of the types of equipment and subjecting them to the types of tests which an emissions standard would call for if it existed.
5.2.3 Potential Way Forward
The void which currently exists presents an opportunity for the development of evidence based limits for compatibility levels based on the 95th percentile values on existing networks. This could either be a UK centric set of measurements or if the Eurelectric PQ network of experts could be engaged a Europe wide range of measurements to inform the development of interim limits based on current network conditions
Measurements made at or close to suspect devices as well as at the associated supplying busbar could be undertaken to determine the levels of emissions and the extent to which they d actually propagate through the network. Care must be taken with the selection of the measuring device, since few manufacturers (if any) currently implement the requirements of the informative Annex B in IEC 61000-4-7 for the measurement of distorting signals in the frequency range 2kHz – 9kHz it would be beneficial if measurements could be made using the same device to ensure consistency between measurement sites.
5.2.4 Standards Development
In order to ensure that the electricity industry has suitable input to the development of standards for emissions, immunity and compatibility levels in these higher frequency ranges

EA Technology Review of Engineering Recommendation G5/4-1Stage 3 Connections and Higher Order Harmonics
Project No. 79410
57 of 62
it will be essential to ensure that effective engagement is maintained with the IEC working groups responsible for the development of these documents. Whilst involvement with the British Standards Committee will provide visibility of developments, the proposals will have assumed a certain level of momentum by the time the drafts are made available to the National Committees. This is much more easily influenced at the beginning within the relevant working groups rather than once a draft has been circulated to the national standards committees for comment.
5.2.5 Measurements
The potential frequency response limitations of wound VTs and CTs on the MV and HV distribution suggests that any initial measurements of higher order harmonics should be made on LV networks where these limitations do not exist. As there is concern that the high frequency switching of the inverters associated with embedded generation may be one source of such disturbances measurements should be made at the connection points of a number of these devices. The CTs used to make the current measurements must be selected to have a sufficiently high frequency response. In order to test the idea that the effect of these higher frequency signals may be limited by the combined effects of the shunt and series impedances of the distribution network further measurements should be made along the feeder to establish the extent of their propagation into the network.
Capacitor Voltage Transformers on the transmission network equipped with the necessary current transducer modification could provide an additional source of measurements to demonstrate whether there is a cause for concern at the transmission level. These locations would have the added advantage discussed in section 2,10,6 that this method of measurement is particularly effective at measuring low levels of higher frequency signals.

EA Technology Review of Engineering Recommendation G5/4-1Stage 3 Connections and Higher Order Harmonics
Project No. 79410
58 of 62
6 Recommendations
6.1 Work Package 1
6.1.1 Background Monitoring
Consideration should be given to identifying the costs and benefits of a programme to increase the numbers of fixed monitoring installations at major substations (e.g.132/33kV sites) and above (or 132/11kV in major city centres). Such a programme would provide more background information ahead of connection requests allowing more accurate initial cost estimates to be made and early informed discussion of any likely harmonic mitigation requirements. In addition such measurements would be useful to the ENA long term harmonic measurement working group and could satisfy the growing calls for Power Quality information from CEER.
6.1.2 Modelling
Further work should be considered to undertake modelling of a selection of real network scenarios. This work should take account of the requirements identified in IEC TR 61000-3-6 to model at least 2-3 nodes away from the point of connection and should explore the effects of employing different techniques to represent the more remote network elements and the effects of varying the complexity of the model for the network within the 2-3 node limit.
6.1.3 Encourage assessment within installation
For some connections, although the connection and metering point may be at 33kV or above, it may be possible to determine acceptability based on consideration of the compliance of the connection with regards to permissible levels of harmonic distortion were to be made at lower voltage levels within the installation, as described in section 8.3.4 of ETR 122. Such an approach may reduce the number of Stage 3 assessments required and might also help to minimise any adverse effects which the customer might otherwise experience within their network due to the potentially higher levels of distortion they could otherwise subject themselves to. For connections with high levels of non-linear load it may be necessary to implement restrictions which ensure that any mitigation required to control harmonic distortion levels should only be operated alongside the equipment for which it is intended to provide mitigation.
6.1.4 Stage 3 shift to 132kV PCC
Based on the background measurements, the harmonic analysis and the subsequent post connection measurements the extent of the problem at 33kV and below of stage 3 connections should be established and dependent upon the results consideration given to whether it is viable to return Stage 3 connections to 132kV and above as was previously the case.
6.1.5 Standards Development
To avoid inappropriate increases in emissions from the typical household equipment which will inevitably have some effect on the distortion levels within the network it is essential that the UK electricity industry pro-actively participate in the relevant EMC working groups at IEC level as well as through the BSI.

EA Technology Review of Engineering Recommendation G5/4-1Stage 3 Connections and Higher Order Harmonics
Project No. 79410
59 of 62
6.2 Work Package 2
6.2.1 Measurement Campaign
In order to inform the development of realistic limits for emissions and compatibility levels the development of a measurement campaign to establish the range of real network conditions should be considered. This campaign should, if possible, involve the wider DNO community in Europe via Eurelectric’s Standardisation Network of Experts.
To avoid issues resulting from the frequency response of wound VTs prevalent in MV and HV distribution networks, any initial measurement campaign should be made on the LV and EHV networks, in particular at the points of connection of inverter connected embedded generation as these are suspected of being potential sources of higher order harmonic emissions.
To aid understanding of the extent of any attenuation of these emissions which may be experienced due to the impedance of the network at these higher frequencies additional measurements should be made along the associated LV feeders. Such measurements will clearly be a less practical proposition in the transmission network
6.2.2 Standards Development
To avoid the development of inappropriate emissions and compatibility levels from the equipment which will produce harmonics in the higher frequency ranges it is essential that the UK electricity industry pro-actively participate in the relevant EMC working groups at IEC level as well as through the BSI.

EA Technology Review of Engineering Recommendation G5/4-1Stage 3 Connections and Higher Order Harmonics
Project No. 79410
60 of 62
7 References1. Energy Networks Association Engineering Recommendation G5/4-1: 2005, Planning
Levels for Harmonic Voltage Distortion and the Connection of Non-Linear Equipment to Transmission Systems and Distribution Networks in the United Kingdom
2. Energy Networks Association Engineering Technical Report 122: 2002, Guide to the Application of Engineering Recommendation G5/4 in the Assessment of Harmonic Voltage Distortion and Connections of Non-Linear Equipment to the Electricity Supply System in the UK.
3. IEC 61000-4-30: 2009 Electromagnetic Compatibility (EMC) Part 4-30: Testing and Measurement Techniques – Power Quality Measurement Methods
4. IEC TR 61000-3-6 Ed 2: 2007 Electromagnetic Compatibility (EMC) – Part 3-6: Assessment of Harmonic Emission Limits for the Connection of Distorting Installations to MV, HV and EHV power systems.
5. A Review of the new Australian Harmonics Standards AS/NZS 61000-3-6 V J Gosbell University of Wollongong, P Muttik Alsthom, D K Geddey Transgrid
6. IEEE 519: 1992 Recommended Practices and Requirements for Harmonic Control in Electrical Power Systems
7. Interpreting IEEE 519 and meeting its harmonic limits in VFD applications. Paper no PCIC 20003-15. A Hoevenaars Mirus International Inc, K Le Doux Toshiba International Corp , M Colosino Crescent Power Systems Inc
8. Comparison of IEEE and IEC Harmonic Standards, IEEE 2005, S M Halpin
9. IEEE and IEC Harmonic Limits – Seminari Sulla Qualita’E Sulla Sicurezza Elettrica, Mark Halpin, Auburn University -21 May 2007
10. Hydro Qu�bec TransEnergie – Emission Limits for Customer Facilities Connected to the Hydro Qu�bec Transmission System
11. PACIFICORP – Pacific Power, Utah Power, Engineering Handbook 1C.4.1 Harmonic Distortion
12. Technical Requirements for Connecting to te Alberta Interconnected Electric System (IES) Transmission System Part 1 Technical Requirements for Connecting Generators
13. Technical Requirements for Connecting to the Alberta Interconnected Electric System (IES) Transmission System Part 1 Technical Requirements for Connecting Loads
14. ATCO Electric Alberta – System Standard for the Installation of New Loads: June 2005
15. Alpine Energy Limited – Rural Network Harmonic Standard, AEL.DS 07 April 2011
16. Abu Dhabi Distribution Company – Engineering Recommendation No1 of the Electricity Distribution Code – Limits for Harmonics in the Electricity System Version 1.0 November 2005
EA Technology Review of Engineering Recommendation G5/4-1Stage 3 Connections and Higher Order Harmonics
Project No. 79410
61 of 62
17. Harmonic Planning Levels for Australian Distribution Systems, VJ Gosbell V W Smith D Robinson Integral Energy Power Quality Centre University of Wollongong, W Miller Standards Australia
18. Impact of Reactive Power Compensation Equipment on the Harmonic Impedance, IEEE Power Tech Conference 2003, J H R Enslin J Knijp CPJ Jansen KEMA, J H Schuld Tennet
19. Guide for Assessing Network Harmonic Impedance, A Robert Electrabel, T Deflandre Joint CIGRE/CIRED working group CC02
20. Power System Modelling and Harmonic Analysis, Dr R Sreerama Kumar
21. Grid Modelling for Purposes of Wind Farm Harmonic Voltages Evaluation, Leonardo Energy Case Study, Bartosz Kedra Institute of Power Engineering
22. A Study Case on Harmonic Distortion Created by Wind Turbines, CIRED June 2005, S Papathanassiou M Papadopoulos National Technical University of Athens
23. Impact of the Modelling of Transmission Network Components on the Emission Limits for Distorting Load in HV System
24. Penetration of Harmonics from the Baltic Cable HVDC station into the Feeding AC Station – CIGRE 1996-36-302 F Jonas STRI, L Juhlin ABB Power Systems, A Nyman Baltic Cable
25. Modelling of Distribution Networks for Simulation of Harmonics on the HV systemsCIGRE 1996 36-305. T Deflandre, P Rioual, J Matinon, J L Javerzac, Electricit� de France
26. Recommended Methods of Determining Power Quality Emissions Limits for Installations Connected to EHV, HV, MV and LV Power Systems, Cired May 2007 Paper 0893, G Beaulieu Hydro Quebec Canada, R Koch Eskom South Africa, M Halpin Auburn University USA, L Berthet EDF France – Paper presented on behalf of CIGRE/CIRED JWG C4.103
27. Harmonic Allocation Constant for Implementation of AS/NZ 61000-3-6, D A Robinson V J Gosbell B S P Perera Integral Energy Power Quality Centre University of Wollongong
28. Allocating Harmonic Emission to Medium Voltage Customers in Long Feeder Systems, V J Gosbell D Robinson, Integral Energy Power Quality Centre, University of Wollongong
29. Allocation of Harmonic Currents to Customers in Meshed HV Networks, T J Browne V J Gosbell S Perera Integral Energy Power Quality Centre University of Wollongong
30. Experience in the Application of IEC TR 61000-3-6 to Harmonic Allocation in Transmission Systems CIGRE C4-401 2006, T J Browne V J Gosbell S Perera D A Robinson University of Wollongong, L M Falla Transend Networks Australia, PJ Windle Powerlink Queensland, A C D Perera Transend Networks Australia
31. Harmonic Allocation to Aggregated Regions within a Transmission Network, T J Browne V J Gosbell S Perera Integral Energy Power Quality Centre University of Wollongong

EA Technology Review of Engineering Recommendation G5/4-1Stage 3 Connections and Higher Order Harmonics
Project No. 79410
62 of 62
32. Harmonic Allocation Using IEC TR 61000-3-6 at the Distribution Transmission InterfaceV Gosbell University of Wollongong, T Browne Arizona State University, S Perera University of Wollongong
33. The Impact of Rural MV & HV Underground Network Extensions on Harmonic Voltage Distortion, Cired June 2005 D Ellis EDF Energy – United Kingdom
34. Introducing Power System Voltage Droop as a New Concept for Harmonic Current Allocation IEEE Paper, R A Barr Electric Power Consulting Pty Ltd, V J Gosbell University of Wollongong
35. A New Approach to Harmonic Allocation for MV Installations, IEEE Paper, V J Gosbell University of Wollongong, R A Barr Electric Power Consulting Pty Ltd
36. Harmonic Allocation Following IEC Guidelines Using the Voltage Droop Concept, IEEE paper, V J Gosbell University of Wollongong, R A Barr Electric Power Consulting Pty Ltd
37. Harmonic Management in MV Distribution Systems, University of Wollongong Theses Collection 2003, Thesis submitted in fulfilment of the requirements for the award of the degree Doctor of Philosophy from the University of Wollongong by Duane Robinson BE(ELEC)
38. Method to Determine Contribution of the Customer and the Power System to the Harmonic Disturbance, CIRED May 2003, O Gonbeau L Berthet Electricit� de France, J L Javerzac R�seau de Transport Electrique, D Boudou Electricit� de France.
39. Conditions for the Assessment of the Harmonic Compliance of an Installation IEEE Paper, T J Browne Arizona State University, V J Gosbell S Perera University of Wollongong
40. Closing the Spectral Gaps, JM Woodgate, JM Woodgate & Associates
41. IEC 61000-4-7 Electromagnetic Compatibility (EMC) Part 4-7: Testing and Measurement Techniques – General guide on harmonics and interharmonics measurements and instrumentation for power supply systems and equipment connected thereto
42. CISPR 16-2-1 Specification for radio disturbance and immunity measuring apparatusand methods Part 2-1 Methods of measurement of disturbances and immunity –Conducted disturbance measurements.
43. Energy Networks Association ACE Report 73 1979: Report on Limits for Harmonics in the UK Electricity Supply Industry
44. Harmonic Voltage Measurements Using CVTs, Foroozan Ghassemi, Philip Gale, Tom Cumming, Colin Coutts. IEEE Transactions on Power Delivery Volume 20 No 1 January 2005