Embed Size (px)
Citation preview
PNNL-15305
Review of Geophysical Techniques to Define the Spatial Distribution of Subsurface Properties or Contaminants C. J. Murray G. V. Last M. J. Truex August 2005 Prepared for the U.S. Department of Energy under Contract DE-AC05-76RL01830
DISCLAIMER This report was prepared as an account of work sponsored by an agency of the United States Government. Neither the United States Government nor any agency thereof, nor Battelle Memorial Institute, nor any of their employees, makes any warranty, express or implied, or assumes any legal liability or responsibility for the accuracy, completeness, or usefulness of any information, apparatus, product, or process disclosed, or represents that its use would not infringe privately owned rights. Reference herein to any specific commercial product, process, or service by trade name, trademark, manufacturer, or otherwise does not necessarily constitute or imply its endorsement, recommendation, or favoring by the United States Government or any agency thereof, or Battelle Memorial Institute. The views and opinions of authors expressed herein do not necessarily state or reflect those of the United States Government or any agency thereof.
PACIFIC NORTHWEST NATIONAL LABORATORY operated by BATTELLE
for the UNITED STATES DEPARTMENT OF ENERGY
under Contract DE-AC05-76RL01830
Printed in the United States of America
Available to DOE and DOE contractors from the Office of Scientific and Technical Information,
P.O. Box 62, Oak Ridge, TN 37831-0062; ph: (865) 576-8401 fax: (865) 576-5728
email: [email protected]
Available to the public from the National Technical Information Service, U.S. Department of Commerce, 5285 Port Royal Rd., Springfield, VA 22161
ph: (800) 553-6847 fax: (703) 605-6900
email: [email protected] online ordering: http://www.ntis.gov/ordering.htm
This document was printed on recycled paper. (8/00)
PNNL-15305
Review of Geophysical Techniques to Define the Spatial Distribution of Subsurface Properties or Contaminants C. J. Murray G. V. Last M. J. Truex August 2005 Prepared for Fluor Hanford, Inc. under Contract DE-AC05-76RL01830 with the U.S. Department of Energy Pacific Northwest National Laboratory Richland, Washington
iii
Summary
The purpose of this report is to summarize the state-of-the-art, minimally intrusive geophysical techniques that can be used to elucidate subsurface geology, structure, moisture, and chemical compo-sition. The term “minimally intrusive” is used here to mean technologies that can be installed in the shallow (<0.3048 meter [1 foot]) surface, can use pre-existing monitoring wells, or can use inexpensive subsurface access.
A significant amount of characterization will be needed at Hanford in the future to support remedia-tion decisions and implementation of remedies. Due to the large volume of contaminated soil in the subsurface, geophysical characterization techniques may be desirable because they can provide data that directly estimates the spatial distribution of subsurface properties or contaminants. In contrast, many currently used techniques rely on discrete samples, and spatial distributions must be interpolated between the sample locations. In addition, the use of geophysical techniques will minimize the amount of intrusive characterization (e.g., boreholes) and the resulting waste management costs that will be needed in the future.
The choice of geophysical technology is site specific, and it may be useful to consider combinations of technologies and combined data analysis techniques as a means to enhance the characterization effort. Our analyses of the geophysical techniques, provides the following information for consideration:
• For characterizing contamination, there are technologies that may be useful for metals, other organics, and nonaqueous phase liquid (NAPL) contamination.
• Dissolved- and vapor-phase contamination are not readily characterized by geophysical techniques.
• Subsurface properties including stratigraphy, moisture, hydraulic conductivity, and porosity can be characterized with geophysical techniques. However, geophysical techniques are not as suitable for characterizing grain size, geochemistry, and flow patterns.
• In conjunction with the geophysical technologies for characterizing contaminant distribution and subsurface properties, widely available magnetometer and electromagnetic metal detectors are useful to identify cultural features that can affect the performance of geophysical technologies.

v
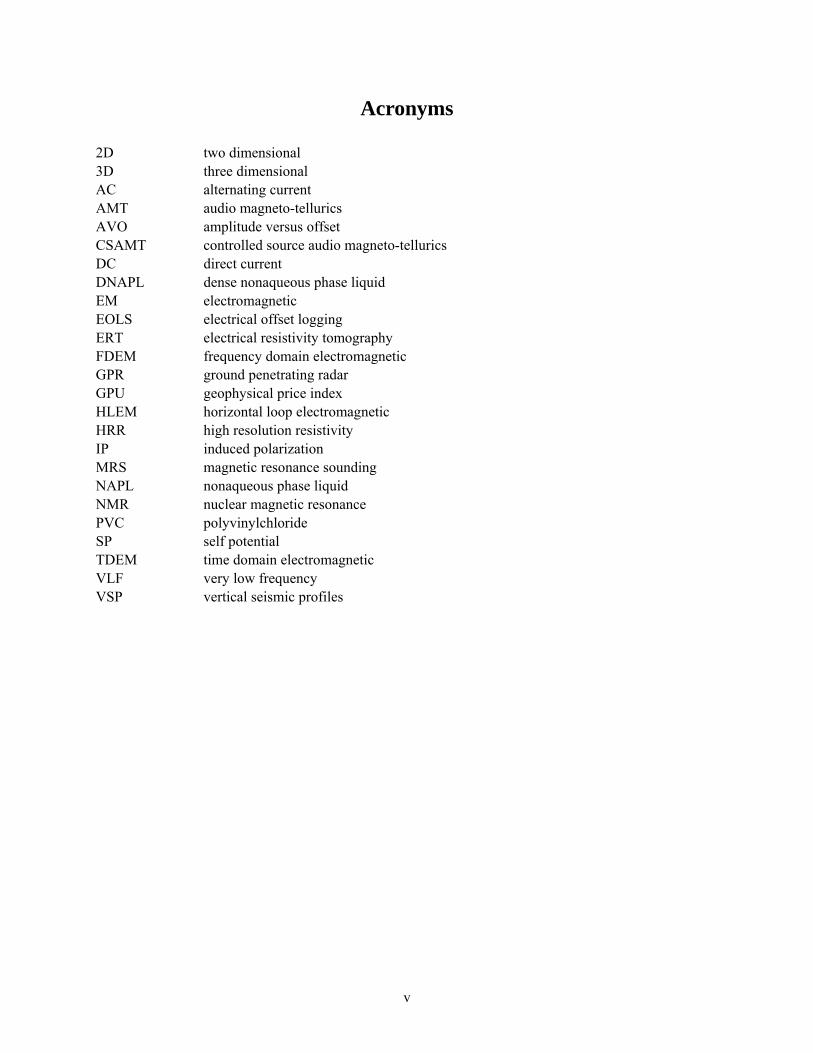
Acronyms
2D two dimensional 3D three dimensional AC alternating current AMT audio magneto-tellurics AVO amplitude versus offset CSAMT controlled source audio magneto-tellurics DC direct current DNAPL dense nonaqueous phase liquid EM electromagnetic EOLS electrical offset logging ERT electrical resistivity tomography FDEM frequency domain electromagnetic GPR ground penetrating radar GPU geophysical price index HLEM horizontal loop electromagnetic HRR high resolution resistivity IP induced polarization MRS magnetic resonance sounding NAPL nonaqueous phase liquid NMR nuclear magnetic resonance PVC polyvinylchloride SP self potential TDEM time domain electromagnetic VLF very low frequency VSP vertical seismic profiles

vii
Contents
Summary ............................................................................................................................................ iii
Acronyms........................................................................................................................................... v
1.0 Introduction .............................................................................................................................. 1 2.0 Characterization Applications .................................................................................................. 1 3.0 Technology Review ................................................................................................................. 2
3.1 Technologies for Characterizing Contaminant Distribution .......................................... 5 3.2 Technologies for Characterizing Subsurface Properties ................................................ 12 3.3 Supporting Technologies................................................................................................ 23
4.0 Conclusions .............................................................................................................................. 23 5.0 References ................................................................................................................................ 24 Appendix A – Brief Descriptions of Geophysical Techniques
Figure
1 Illustrating the Relative Cost of Several Geophysical Techniques .......................................... 5
Tables
1 Listing of Geophysical Technologies Identified ...................................................................... 3
2 Technologies from Table 1 not Considered Further in the Report........................................... 4
3 Characteristics of Contaminant Distribution Characterization Technologies .......................... 6
4 Functionality of Contaminant Distribution Characterization Technologies ............................ 8
5 Summary of Evaluation for Contaminant Distribution Characterization Technologies .......... 12
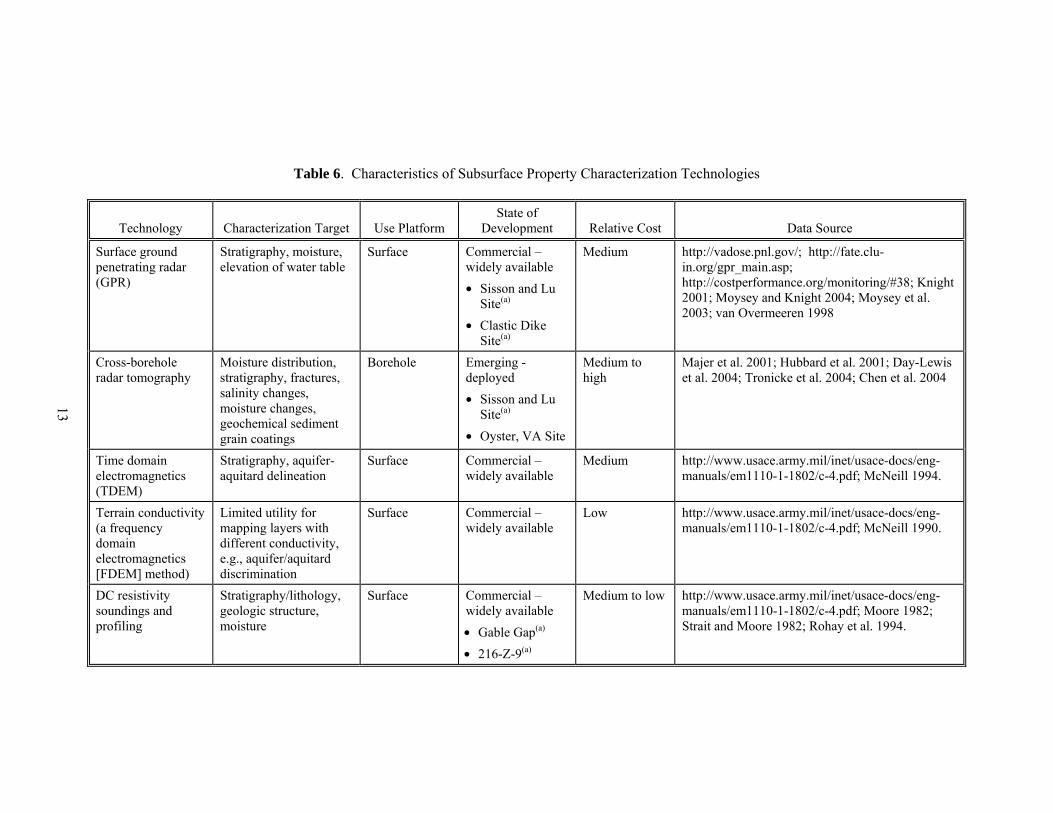
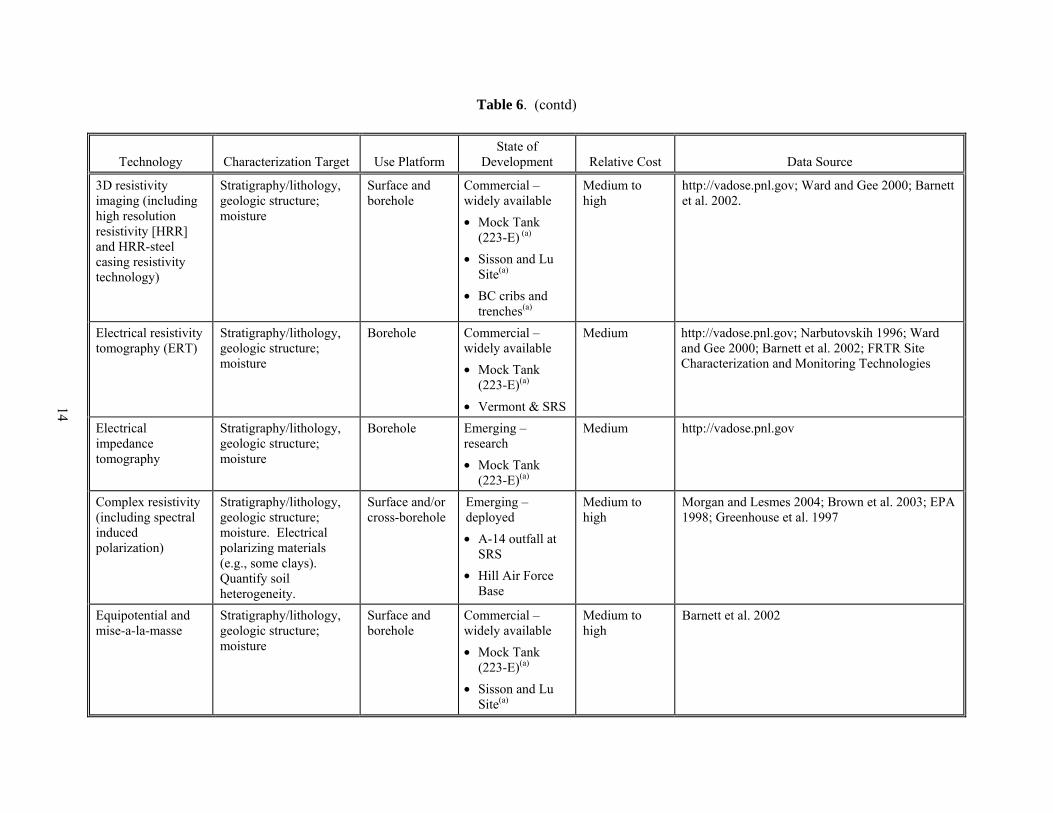
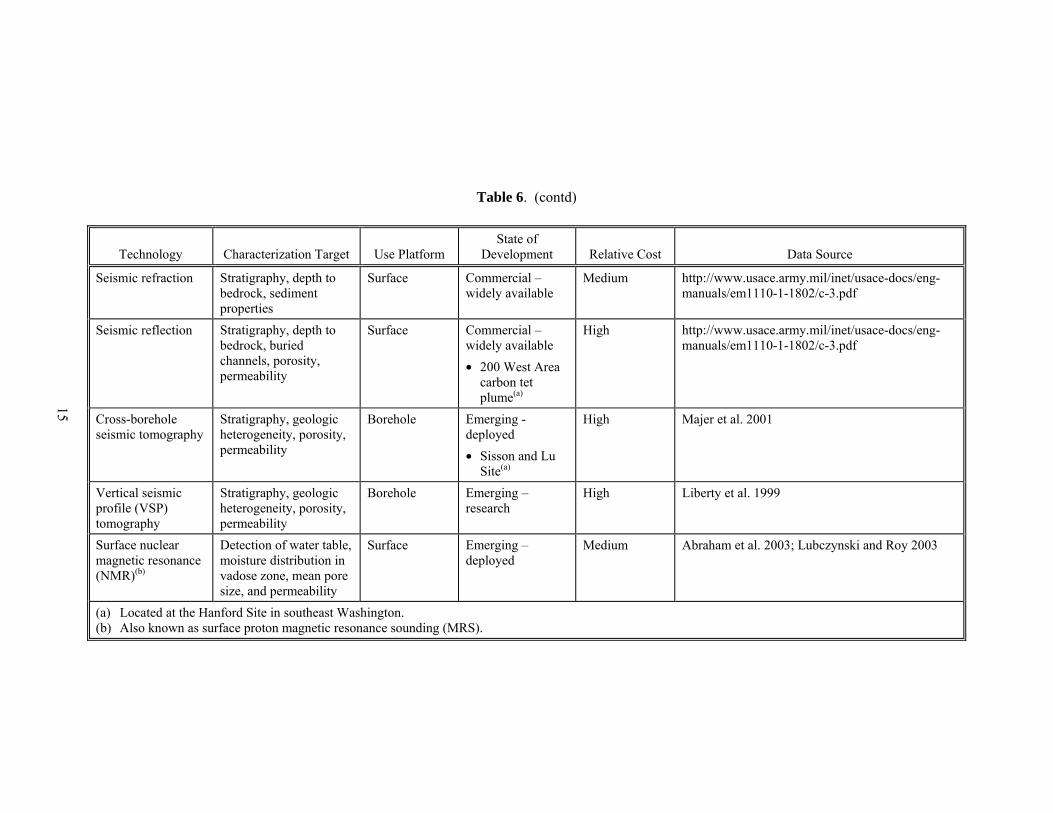
6 Characteristics of Subsurface Property Characterization Technologies .................................. 13
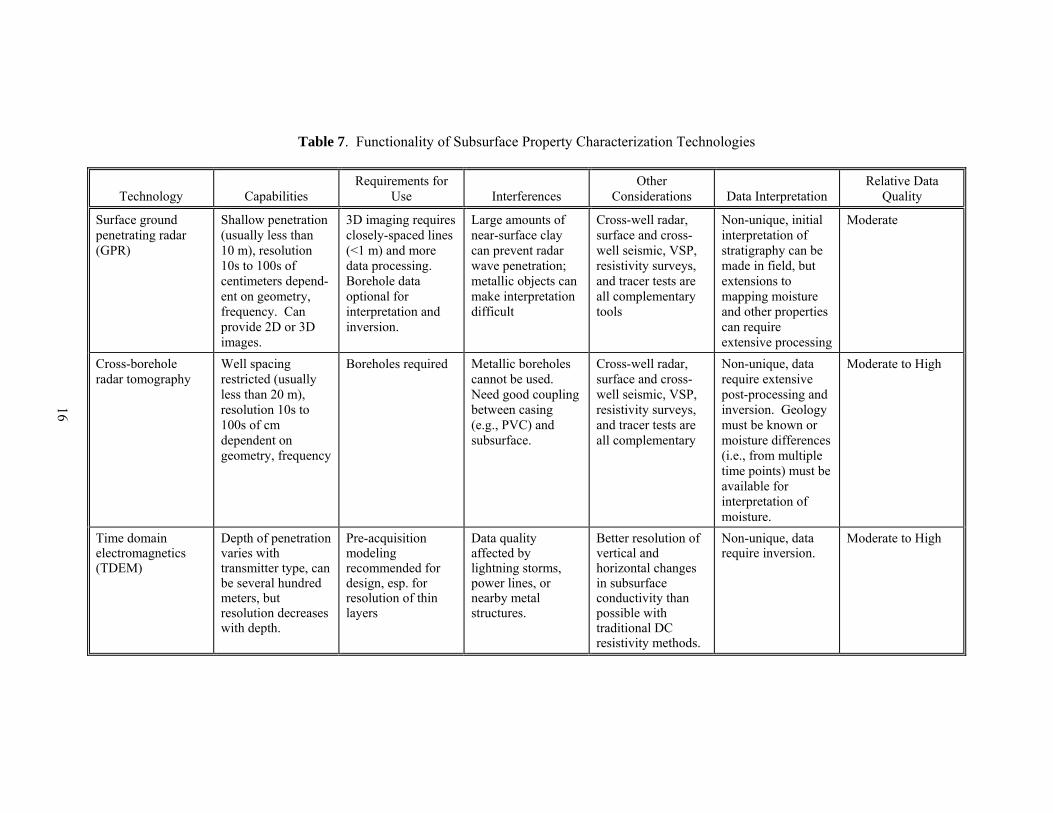
7 Functionality of Subsurface Property Characterization Technologies..................................... 16
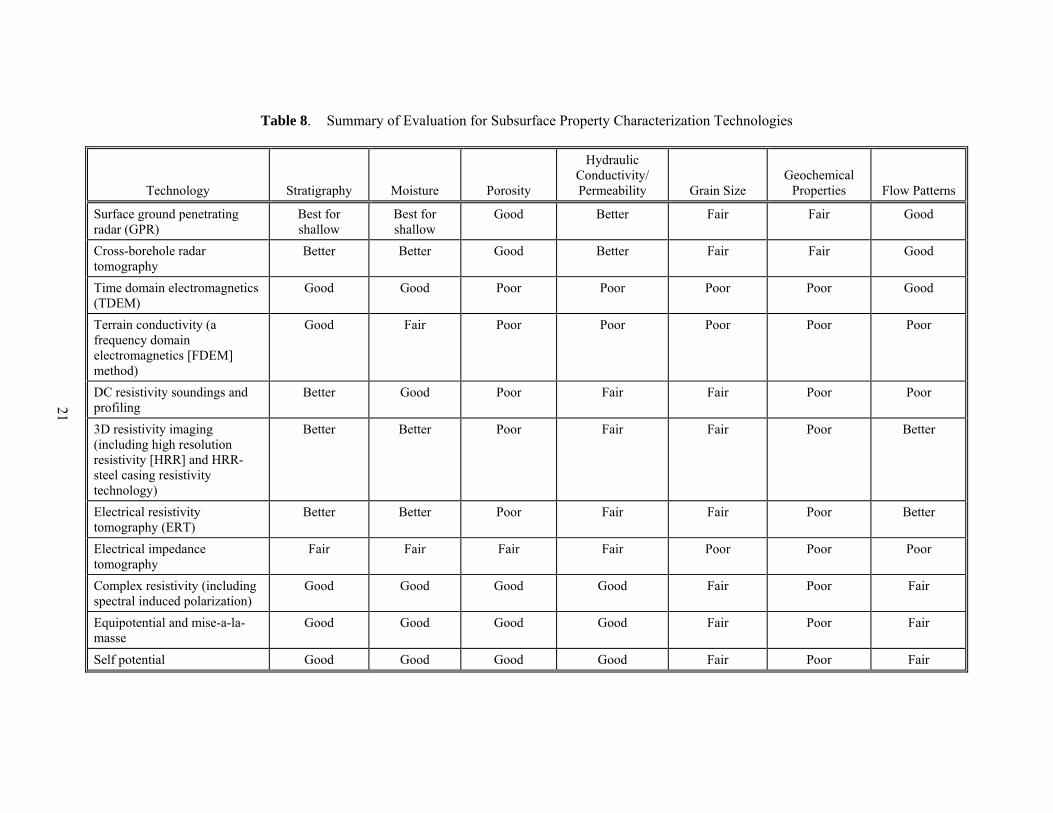
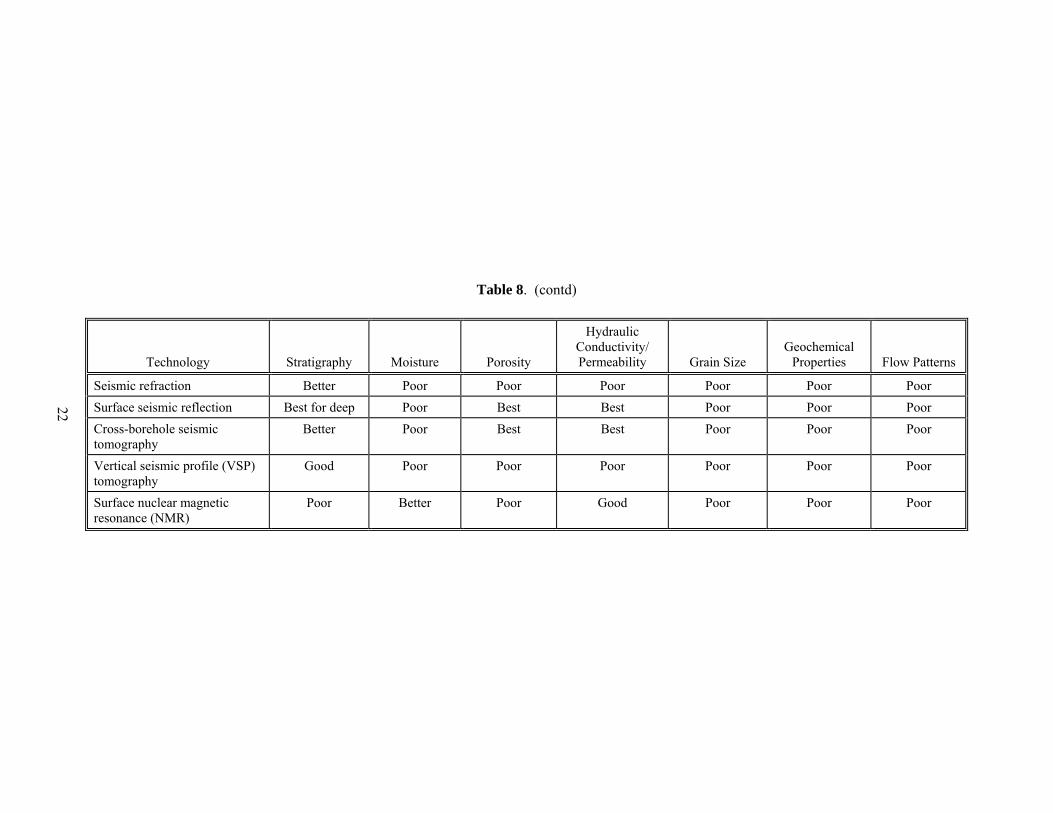
8 Summary of Evaluation for Subsurface Property Characterization Technologies................... 21
9 Characteristics of Supporting Technologies ............................................................................ 23
1
1.0 Introduction
A significant amount of characterization will be needed at Hanford in the future to support remedia-tion decisions and implementation of remedies. Due to the large volume of contaminated soil in the subsurface, geophysical characterization techniques may be desirable because they can provide data that directly estimates the spatial distribution of subsurface properties or contaminants. In contrast, many currently used techniques rely on discrete samples, and spatial distributions must be interpolated between the sample locations. In addition, the use of geophysical techniques will minimize the amount of intrusive characterization (e.g., boreholes) and the resulting waste management costs that will be needed in the future.
The purpose of this report is to summarize the state-of-the-art, minimally intrusive geophysical techniques that can be used to elucidate subsurface geology, structure, moisture, and chemical compo-sition. The term “minimally intrusive” is used here to mean technologies that can be installed in the shallow (<0.3048 meter [1 foot]) surface, can use pre-existing monitoring wells, or can use inexpensive subsurface access.
The technology review focused on geophysical characterization techniques that provide two- or three-dimensional information about the spatial distribution of subsurface properties and/or contaminants. As such, two-dimensional surface contamination survey methods or one-dimensional borehole geophysical techniques, such as neutron probes, were not included unless part of a tomographic array. The review also did not target technologies specifically for determining burial ground contents, although some of the technologies are applicable for that use.
2.0 Characterization Applications
Geophysical techniques encompass a wide range of different capabilities in terms of the type of information that can be obtained. Available information was reviewed to identify and describe geo-physical characterization techniques that can be applied to (1) determining fate and transport properties and (2) determining contaminant distribution for near surface, vadose zone, and groundwater applications. Specific categories of application considered in this review are listed below:
• Fate and Transport Properties − Stratigraphy − Moisture − Porosity − Hydraulic conductivity/permeability − Grain size − Geochemical properties (pH, iron content, organic carbon) − Flow patterns
2
• Contaminant Distribution − Radionuclides (based on chemical properties) − Chemicals
Metals Other inorganics Organics/modified organics
• Nonaqueous phase liguid (NAPL) • Dissolved • Vapor
3.0 Technology Review
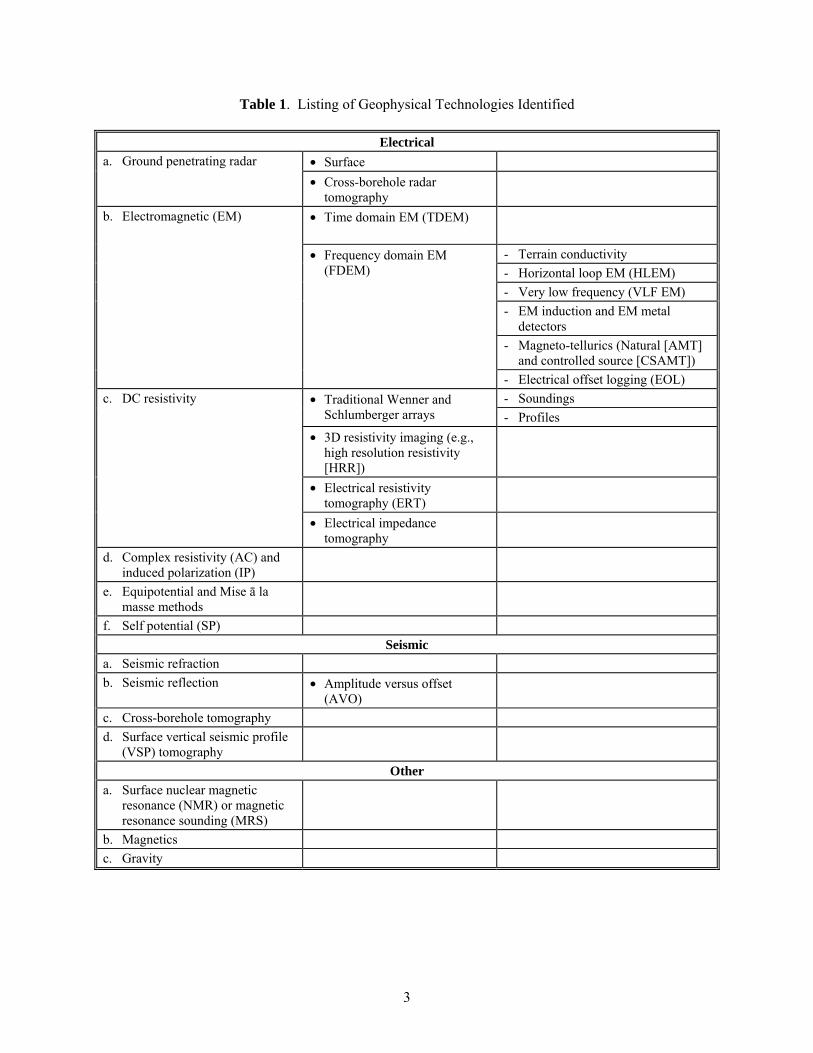
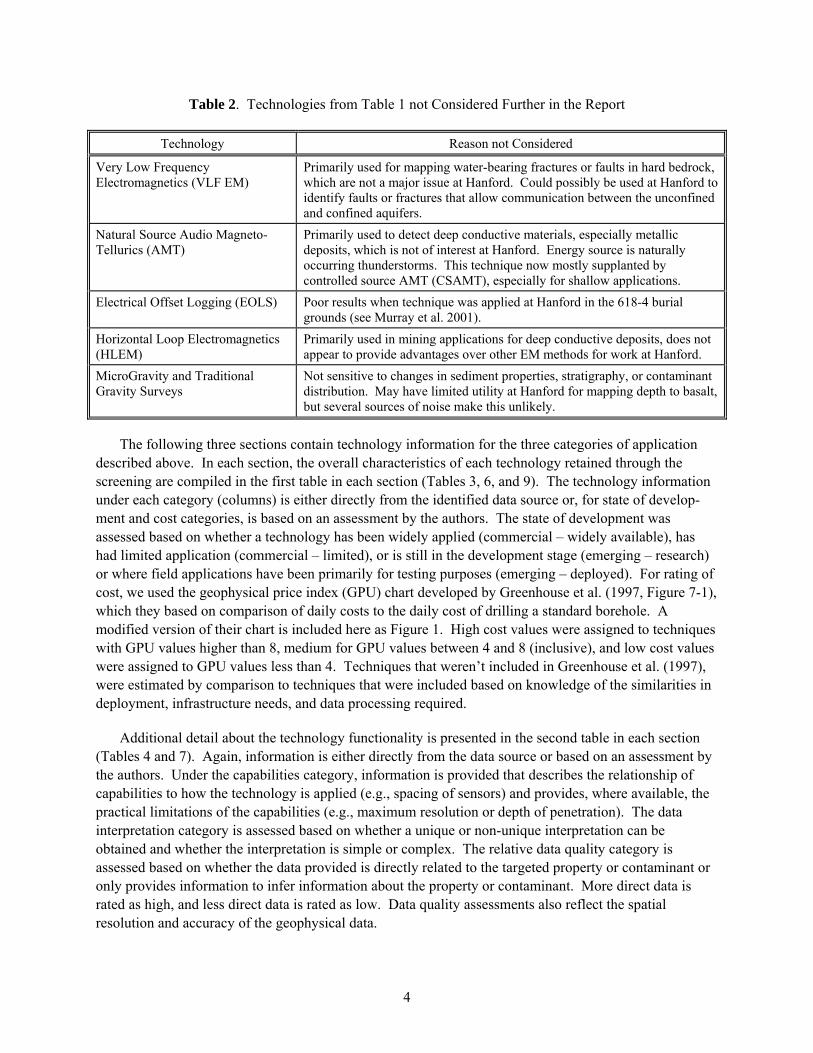
A number of geophysical characterization techniques were identified (Table 1) based on a review of literature and vendor sources. Appendix A contains brief description of these techniques. The technol-ogies in Table 1 were screened to determine which were most appropriate for more detailed review. The criterion used to screen technologies was based primarily on consideration of the type of information provided. For instance, technologies that identify buried objects, while potentially useful for application at burial grounds, were eliminated because this report is focused on determining subsurface properties and contaminant distribution. Table 2 contains a listing of technologies that were not considered further in this report, but may be of use for other types of application at Hanford.
Technology information is organized into three basic categories of application to
1. characterize contaminant distribution 2. characterize subsurface property distribution 3. provide information to support the first two activities (e.g., identification of cultural features)
Some technologies can be used for multiple applications and are described under more than one of the above categories. Within each category, technologies are also distinguished based on the platform for deployment (e.g., surface survey, subsurface sensors). Additionally, recommended technologies are highlighted within each category. Technologies are identified and reviewed in this report based on their functionality, not necessarily based on a specific instrument or vendor.
The geophysical techniques evaluated here can be used to characterize the distribution of chemical contaminants and/or the distribution of subsurface properties. No techniques were identified that provide minimally invasive (i.e., non-borehole) measurements of radioactivity in the deep subsurface (e.g., greater than about 1 to 2 meters [3.28 to 6.56 feet]). However, in many cases, the same techniques that can detect metals can also detect metallic radionuclides. There are also links between radionuclide and moisture/ chemical plumes, and the distribution of subsurface properties usually impacts the spatial distribution of radionuclides, so it would be possible to use multi-variate geostatistical methods (e.g., Goovaerts 1997) to estimate radionuclide concentrations between boreholes based on a combination of borehole measure-ments and subsurface geophysical data.
3
Table 1. Listing of Geophysical Technologies Identified
Electrical • Surface a. Ground penetrating radar • Cross-borehole radar
tomography
• Time domain EM (TDEM)
- Terrain conductivity - Horizontal loop EM (HLEM) - Very low frequency (VLF EM) - EM induction and EM metal
detectors - Magneto-tellurics (Natural [AMT]
and controlled source [CSAMT])
b. Electromagnetic (EM)
• Frequency domain EM (FDEM)
- Electrical offset logging (EOL) - Soundings • Traditional Wenner and
Schlumberger arrays - Profiles • 3D resistivity imaging (e.g.,
high resolution resistivity [HRR])
• Electrical resistivity tomography (ERT)
c. DC resistivity
• Electrical impedance tomography
d. Complex resistivity (AC) and induced polarization (IP)
e. Equipotential and Mise ā la masse methods
f. Self potential (SP) Seismic
a. Seismic refraction b. Seismic reflection • Amplitude versus offset
(AVO)
c. Cross-borehole tomography d. Surface vertical seismic profile
(VSP) tomography
Other a. Surface nuclear magnetic
resonance (NMR) or magnetic resonance sounding (MRS)
b. Magnetics c. Gravity
4
Table 2. Technologies from Table 1 not Considered Further in the Report
Technology Reason not Considered
Very Low Frequency Electromagnetics (VLF EM)
Primarily used for mapping water-bearing fractures or faults in hard bedrock, which are not a major issue at Hanford. Could possibly be used at Hanford to identify faults or fractures that allow communication between the unconfined and confined aquifers.
Natural Source Audio Magneto-Tellurics (AMT)
Primarily used to detect deep conductive materials, especially metallic deposits, which is not of interest at Hanford. Energy source is naturally occurring thunderstorms. This technique now mostly supplanted by controlled source AMT (CSAMT), especially for shallow applications.
Electrical Offset Logging (EOLS) Poor results when technique was applied at Hanford in the 618-4 burial grounds (see Murray et al. 2001).
Horizontal Loop Electromagnetics (HLEM)
Primarily used in mining applications for deep conductive deposits, does not appear to provide advantages over other EM methods for work at Hanford.
MicroGravity and Traditional Gravity Surveys
Not sensitive to changes in sediment properties, stratigraphy, or contaminant distribution. May have limited utility at Hanford for mapping depth to basalt, but several sources of noise make this unlikely.
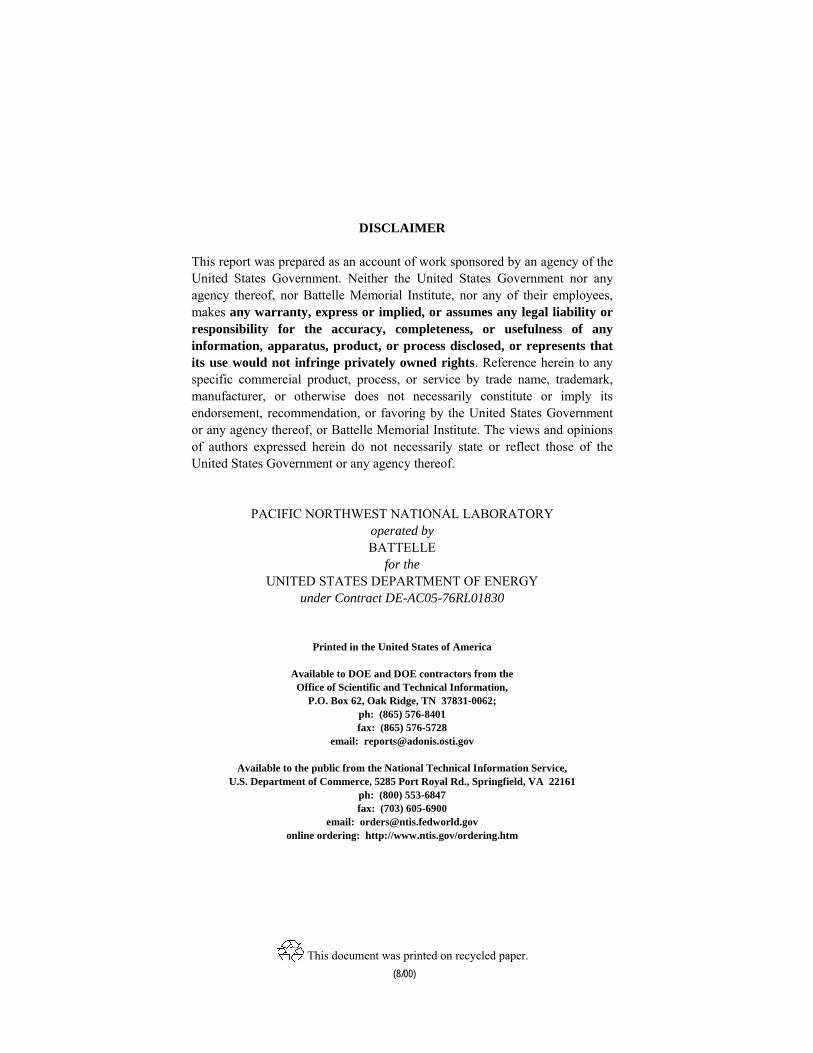
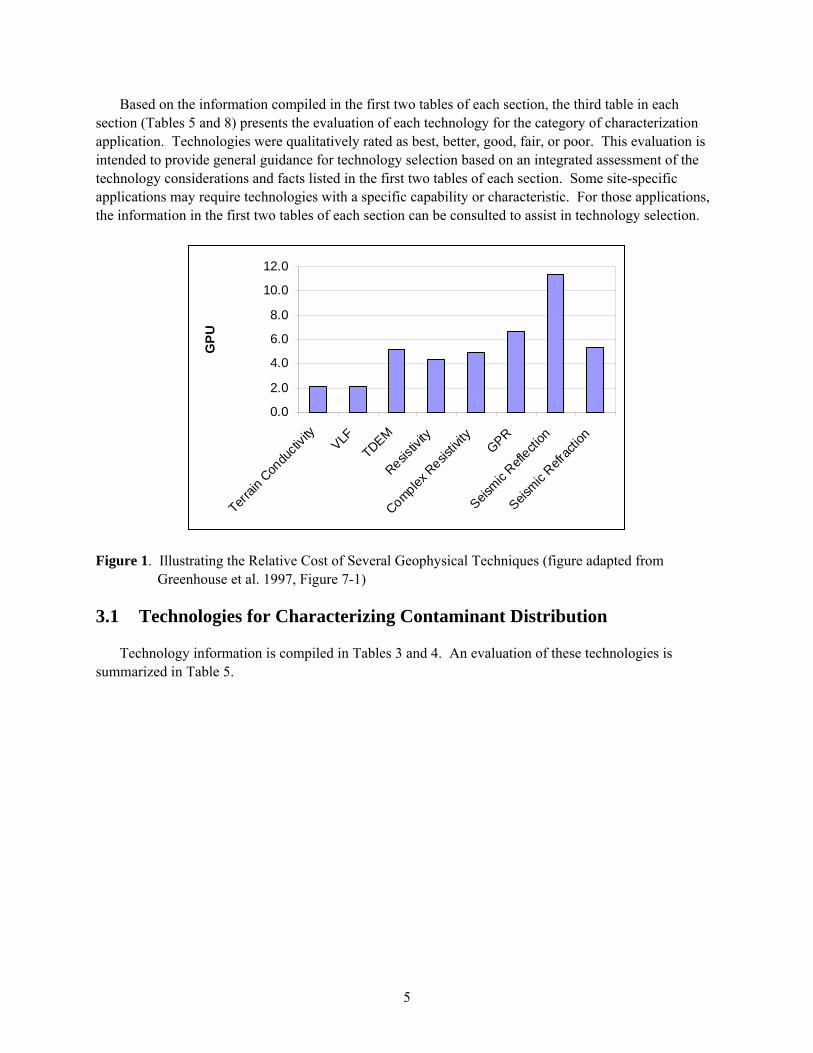
The following three sections contain technology information for the three categories of application described above. In each section, the overall characteristics of each technology retained through the screening are compiled in the first table in each section (Tables 3, 6, and 9). The technology information under each category (columns) is either directly from the identified data source or, for state of develop-ment and cost categories, is based on an assessment by the authors. The state of development was assessed based on whether a technology has been widely applied (commercial – widely available), has had limited application (commercial – limited), or is still in the development stage (emerging – research) or where field applications have been primarily for testing purposes (emerging – deployed). For rating of cost, we used the geophysical price index (GPU) chart developed by Greenhouse et al. (1997, Figure 7-1), which they based on comparison of daily costs to the daily cost of drilling a standard borehole. A modified version of their chart is included here as Figure 1. High cost values were assigned to techniques with GPU values higher than 8, medium for GPU values between 4 and 8 (inclusive), and low cost values were assigned to GPU values less than 4. Techniques that weren’t included in Greenhouse et al. (1997), were estimated by comparison to techniques that were included based on knowledge of the similarities in deployment, infrastructure needs, and data processing required.
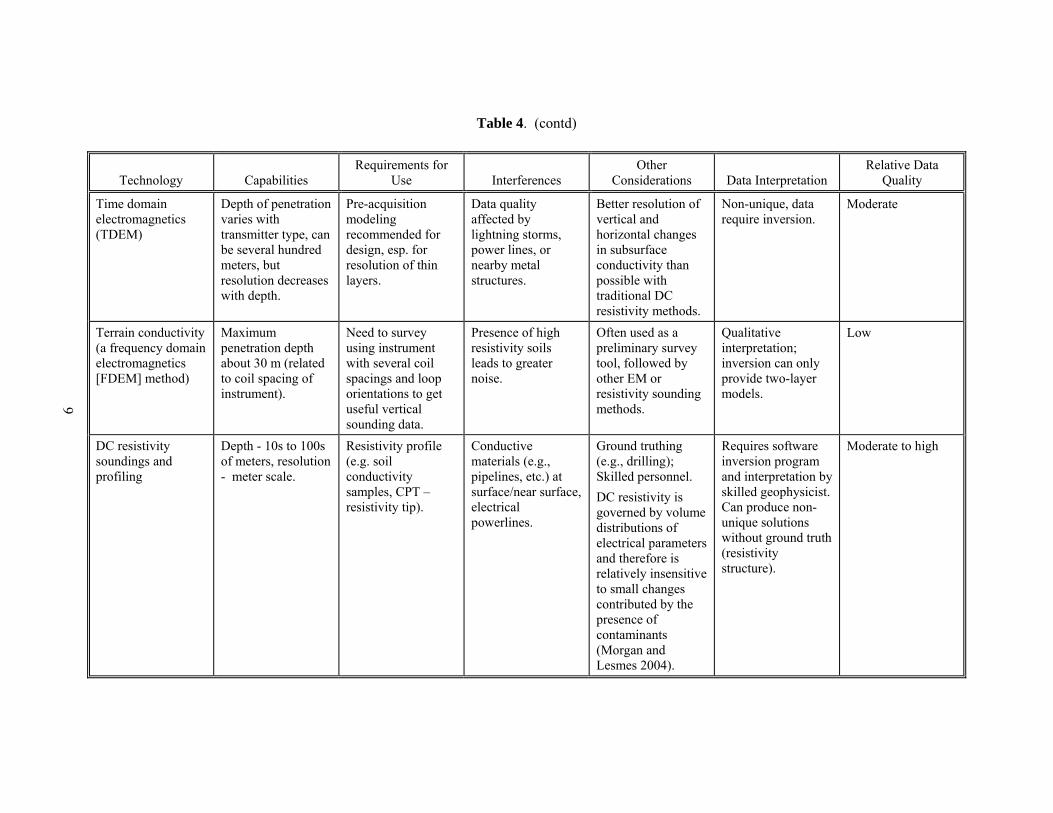
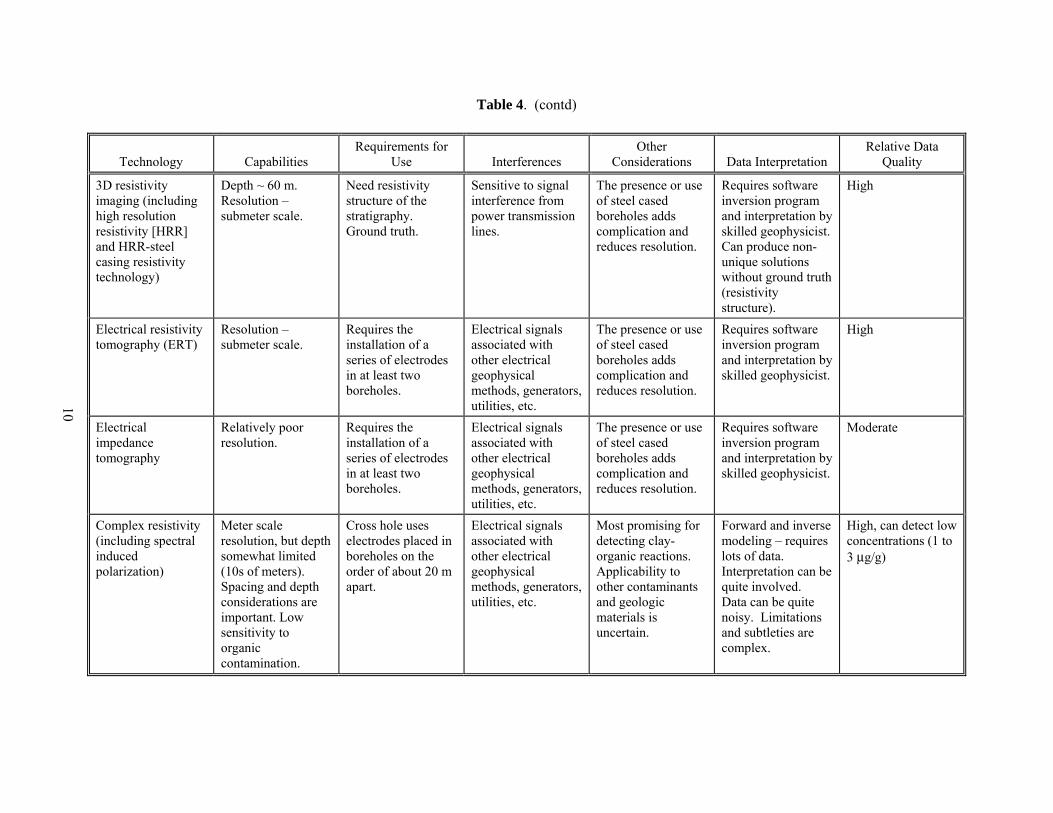
Additional detail about the technology functionality is presented in the second table in each section (Tables 4 and 7). Again, information is either directly from the data source or based on an assessment by the authors. Under the capabilities category, information is provided that describes the relationship of capabilities to how the technology is applied (e.g., spacing of sensors) and provides, where available, the practical limitations of the capabilities (e.g., maximum resolution or depth of penetration). The data interpretation category is assessed based on whether a unique or non-unique interpretation can be obtained and whether the interpretation is simple or complex. The relative data quality category is assessed based on whether the data provided is directly related to the targeted property or contaminant or only provides information to infer information about the property or contaminant. More direct data is rated as high, and less direct data is rated as low. Data quality assessments also reflect the spatial resolution and accuracy of the geophysical data.
5
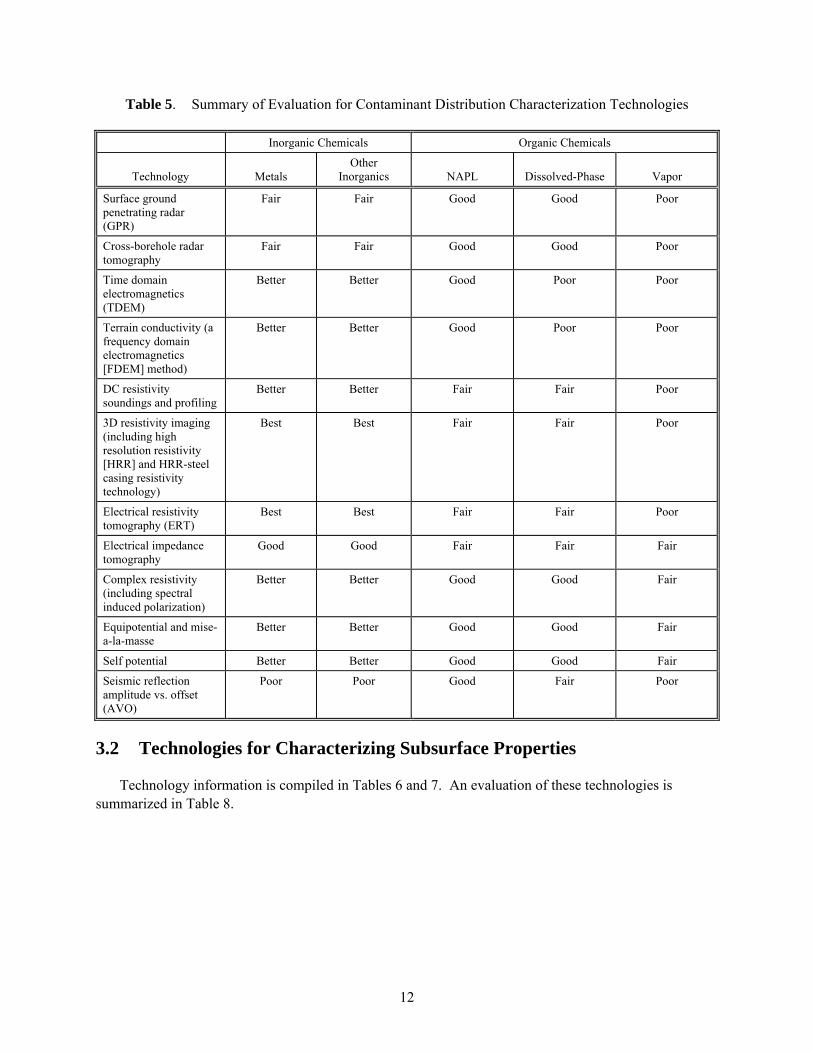
Based on the information compiled in the first two tables of each section, the third table in each section (Tables 5 and 8) presents the evaluation of each technology for the category of characterization application. Technologies were qualitatively rated as best, better, good, fair, or poor. This evaluation is intended to provide general guidance for technology selection based on an integrated assessment of the technology considerations and facts listed in the first two tables of each section. Some site-specific applications may require technologies with a specific capability or characteristic. For those applications, the information in the first two tables of each section can be consulted to assist in technology selection.
0.0
2.0
4.0
6.0
8.0
10.0
12.0
Terrain
Con
ducti
vity
VLFTDEM
Resistiv
ity
Complex R
esistiv
ityGPR
Seismic
Reflecti
on
Seismic
Refrac
tion
GPU
Figure 1. Illustrating the Relative Cost of Several Geophysical Techniques (figure adapted from Greenhouse et al. 1997, Figure 7-1)
3.1 Technologies for Characterizing Contaminant Distribution
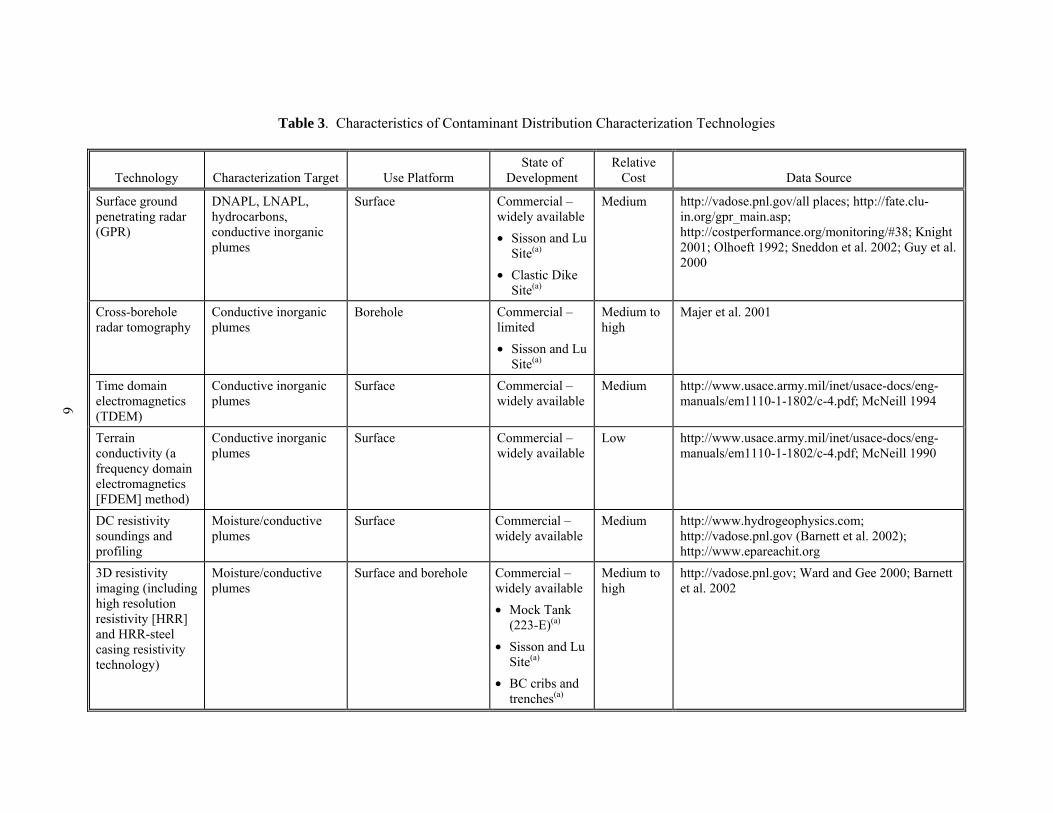
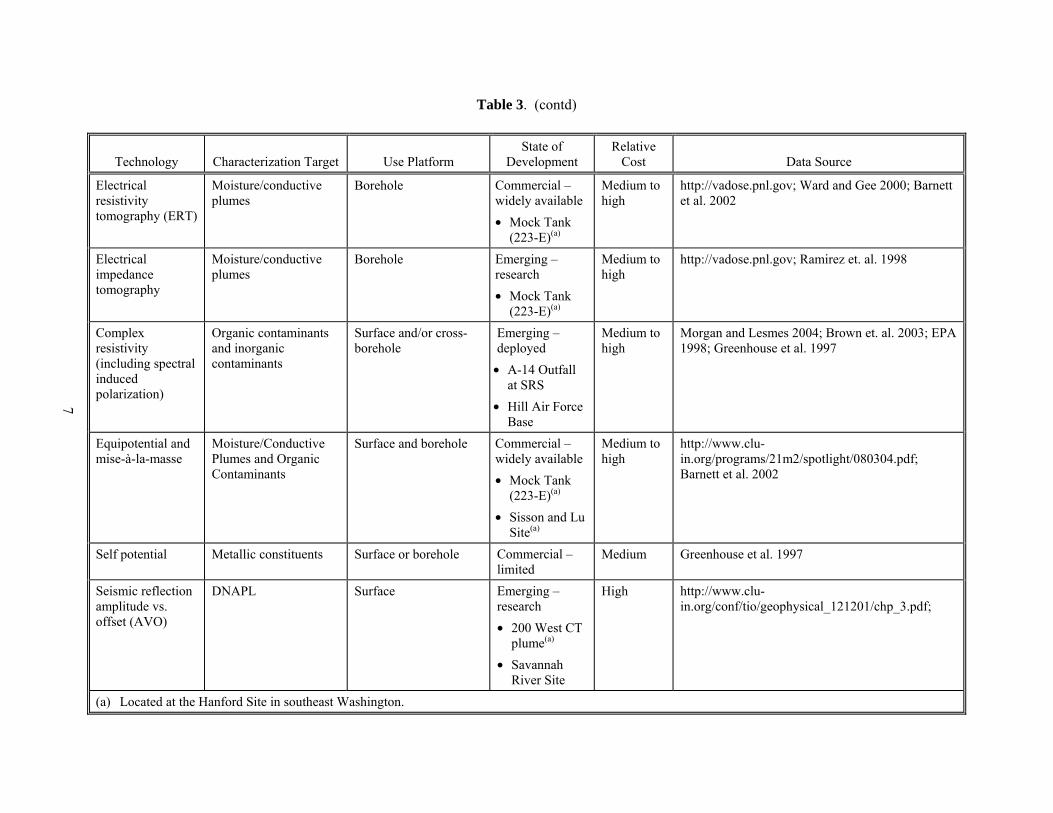
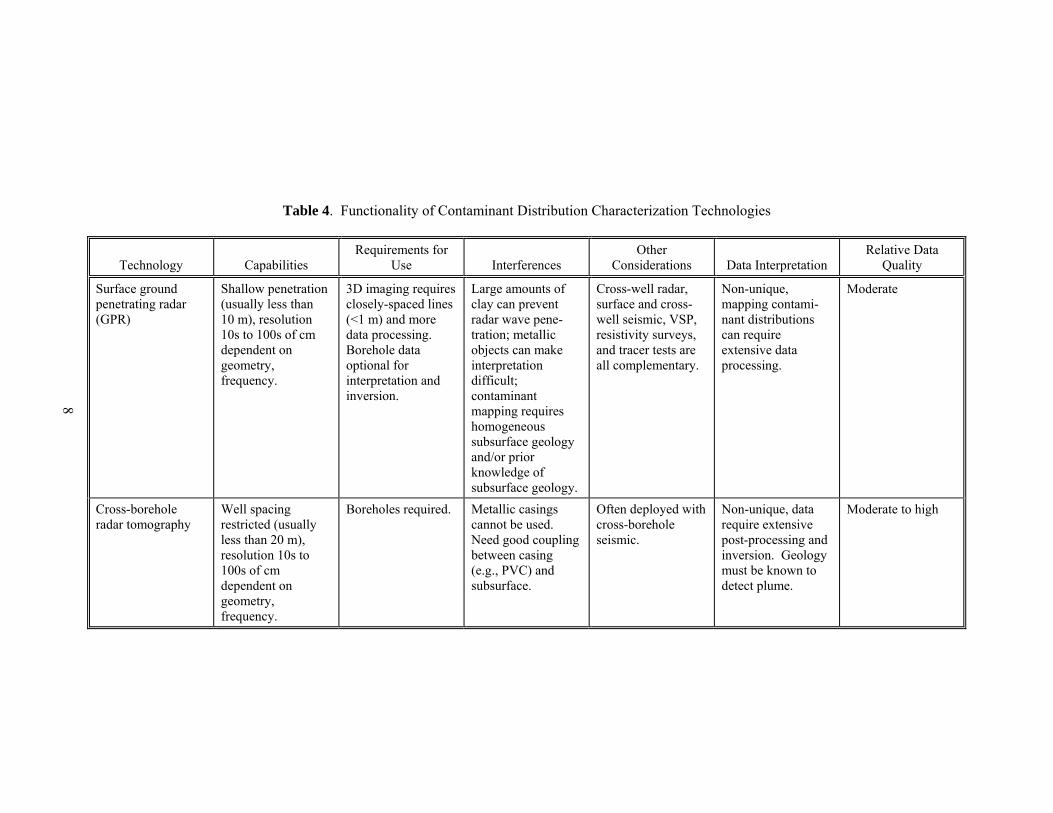
Technology information is compiled in Tables 3 and 4. An evaluation of these technologies is summarized in Table 5.
6
Table 3. Characteristics of Contaminant Distribution Characterization Technologies
Technology Characterization Target Use Platform State of
Development Relative
Cost Data Source
Surface ground penetrating radar (GPR)
DNAPL, LNAPL, hydrocarbons, conductive inorganic plumes
Surface Commercial – widely available • Sisson and Lu
Site(a) • Clastic Dike
Site(a)
Medium http://vadose.pnl.gov/all places; http://fate.clu-in.org/gpr_main.asp; http://costperformance.org/monitoring/#38; Knight 2001; Olhoeft 1992; Sneddon et al. 2002; Guy et al. 2000
Cross-borehole radar tomography
Conductive inorganic plumes
Borehole Commercial – limited • Sisson and Lu
Site(a)
Medium to high
Majer et al. 2001
Time domain electromagnetics (TDEM)
Conductive inorganic plumes
Surface Commercial – widely available
Medium http://www.usace.army.mil/inet/usace-docs/eng-manuals/em1110-1-1802/c-4.pdf; McNeill 1994
Terrain conductivity (a frequency domain electromagnetics [FDEM] method)
Conductive inorganic plumes
Surface Commercial – widely available
Low http://www.usace.army.mil/inet/usace-docs/eng-manuals/em1110-1-1802/c-4.pdf; McNeill 1990
DC resistivity soundings and profiling
Moisture/conductive plumes
Surface Commercial – widely available
Medium http://www.hydrogeophysics.com; http://vadose.pnl.gov (Barnett et al. 2002); http://www.epareachit.org
3D resistivity imaging (including high resolution resistivity [HRR] and HRR-steel casing resistivity technology)
Moisture/conductive plumes
Surface and borehole Commercial – widely available • Mock Tank
(223-E)(a) • Sisson and Lu
Site(a) • BC cribs and
trenches(a)
Medium to high
http://vadose.pnl.gov; Ward and Gee 2000; Barnett et al. 2002
7
Table 3. (contd)
Technology Characterization Target Use Platform State of
Development Relative
Cost Data Source
Electrical resistivity tomography (ERT)
Moisture/conductive plumes
Borehole Commercial – widely available • Mock Tank
(223-E)(a)
Medium to high
http://vadose.pnl.gov; Ward and Gee 2000; Barnett et al. 2002
Electrical impedance tomography
Moisture/conductive plumes
Borehole Emerging – research • Mock Tank
(223-E)(a)
Medium to high
http://vadose.pnl.gov; Ramirez et. al. 1998
Complex resistivity (including spectral induced polarization)
Organic contaminants and inorganic contaminants
Surface and/or cross-borehole
Emerging – deployed
• A-14 Outfall at SRS
• Hill Air Force Base
Medium to high
Morgan and Lesmes 2004; Brown et. al. 2003; EPA 1998; Greenhouse et al. 1997
Equipotential and mise-à-la-masse
Moisture/Conductive Plumes and Organic Contaminants
Surface and borehole Commercial – widely available • Mock Tank
(223-E)(a) • Sisson and Lu
Site(a)
Medium to high
http://www.clu-in.org/programs/21m2/spotlight/080304.pdf; Barnett et al. 2002
Self potential Metallic constituents Surface or borehole Commercial – limited
Medium Greenhouse et al. 1997
Seismic reflection amplitude vs. offset (AVO)
DNAPL Surface Emerging – research • 200 West CT
plume(a) • Savannah
River Site
High http://www.clu-in.org/conf/tio/geophysical_121201/chp_3.pdf;
(a) Located at the Hanford Site in southeast Washington.
8
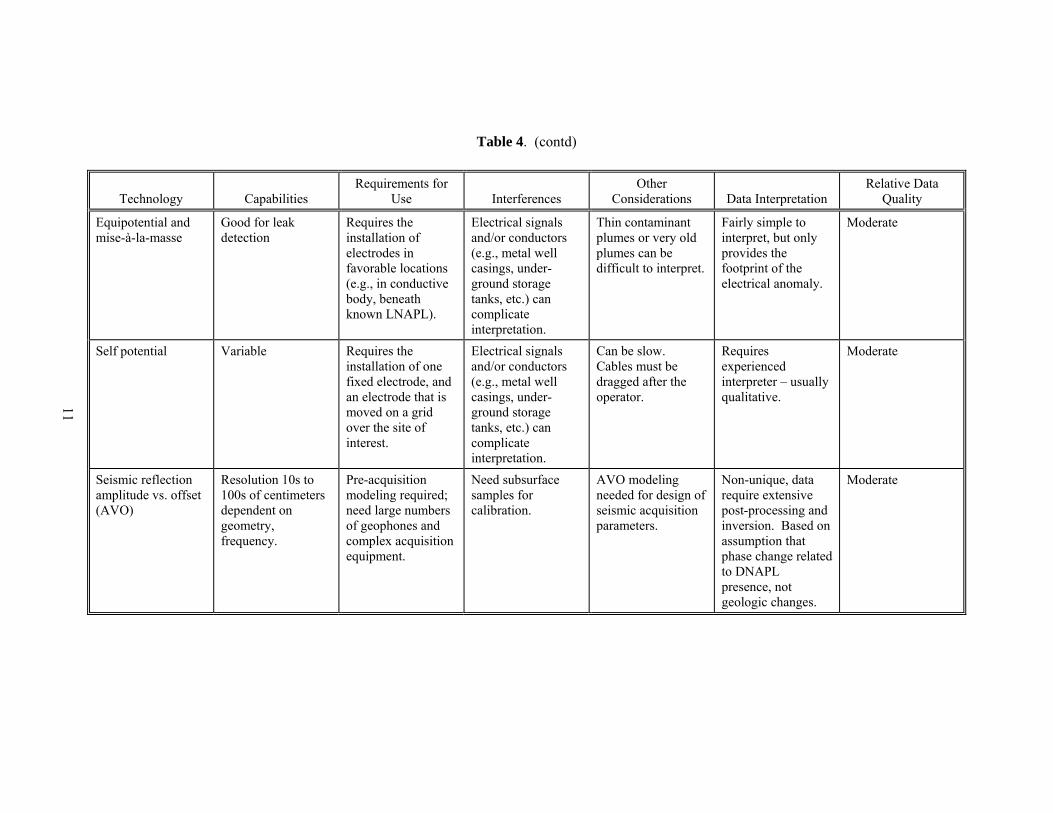
Table 4. Functionality of Contaminant Distribution Characterization Technologies
Technology Capabilities Requirements for
Use Interferences Other
Considerations Data Interpretation Relative Data
Quality
Surface ground penetrating radar (GPR)
Shallow penetration (usually less than 10 m), resolution 10s to 100s of cm dependent on geometry, frequency.
3D imaging requires closely-spaced lines (<1 m) and more data processing. Borehole data optional for interpretation and inversion.
Large amounts of clay can prevent radar wave pene-tration; metallic objects can make interpretation difficult; contaminant mapping requires homogeneous subsurface geology and/or prior knowledge of subsurface geology.
Cross-well radar, surface and cross-well seismic, VSP, resistivity surveys, and tracer tests are all complementary.
Non-unique, mapping contami-nant distributions can require extensive data processing.
Moderate
Cross-borehole radar tomography
Well spacing restricted (usually less than 20 m), resolution 10s to 100s of cm dependent on geometry, frequency.
Boreholes required. Metallic casings cannot be used. Need good coupling between casing (e.g., PVC) and subsurface.
Often deployed with cross-borehole seismic.
Non-unique, data require extensive post-processing and inversion. Geology must be known to detect plume.
Moderate to high
9
Table 4. (contd)
Technology Capabilities Requirements for
Use Interferences Other
Considerations Data Interpretation Relative Data
Quality
Time domain electromagnetics (TDEM)
Depth of penetration varies with transmitter type, can be several hundred meters, but resolution decreases with depth.
Pre-acquisition modeling recommended for design, esp. for resolution of thin layers.
Data quality affected by lightning storms, power lines, or nearby metal structures.
Better resolution of vertical and horizontal changes in subsurface conductivity than possible with traditional DC resistivity methods.
Non-unique, data require inversion.
Moderate
Terrain conductivity (a frequency domain electromagnetics [FDEM] method)
Maximum penetration depth about 30 m (related to coil spacing of instrument).
Need to survey using instrument with several coil spacings and loop orientations to get useful vertical sounding data.
Presence of high resistivity soils leads to greater noise.
Often used as a preliminary survey tool, followed by other EM or resistivity sounding methods.
Qualitative interpretation; inversion can only provide two-layer models.
Low
DC resistivity soundings and profiling
Depth - 10s to 100s of meters, resolution - meter scale.
Resistivity profile (e.g. soil conductivity samples, CPT – resistivity tip).
Conductive materials (e.g., pipelines, etc.) at surface/near surface, electrical powerlines.
Ground truthing (e.g., drilling); Skilled personnel. DC resistivity is governed by volume distributions of electrical parameters and therefore is relatively insensitive to small changes contributed by the presence of contaminants (Morgan and Lesmes 2004).
Requires software inversion program and interpretation by skilled geophysicist. Can produce non-unique solutions without ground truth (resistivity structure).
Moderate to high
10
Table 4. (contd)
Technology Capabilities Requirements for
Use Interferences Other
Considerations Data Interpretation Relative Data
Quality
3D resistivity imaging (including high resolution resistivity [HRR] and HRR-steel casing resistivity technology)
Depth ~ 60 m. Resolution – submeter scale.
Need resistivity structure of the stratigraphy. Ground truth.
Sensitive to signal interference from power transmission lines.
The presence or use of steel cased boreholes adds complication and reduces resolution.
Requires software inversion program and interpretation by skilled geophysicist. Can produce non-unique solutions without ground truth (resistivity structure).
High
Electrical resistivity tomography (ERT)
Resolution – submeter scale.
Requires the installation of a series of electrodes in at least two boreholes.
Electrical signals associated with other electrical geophysical methods, generators, utilities, etc.
The presence or use of steel cased boreholes adds complication and reduces resolution.
Requires software inversion program and interpretation by skilled geophysicist.
High
Electrical impedance tomography
Relatively poor resolution.
Requires the installation of a series of electrodes in at least two boreholes.
Electrical signals associated with other electrical geophysical methods, generators, utilities, etc.
The presence or use of steel cased boreholes adds complication and reduces resolution.
Requires software inversion program and interpretation by skilled geophysicist.
Moderate
Complex resistivity (including spectral induced polarization)
Meter scale resolution, but depth somewhat limited (10s of meters). Spacing and depth considerations are important. Low sensitivity to organic contamination.
Cross hole uses electrodes placed in boreholes on the order of about 20 m apart.
Electrical signals associated with other electrical geophysical methods, generators, utilities, etc.
Most promising for detecting clay-organic reactions. Applicability to other contaminants and geologic materials is uncertain.
Forward and inverse modeling – requires lots of data. Interpretation can be quite involved. Data can be quite noisy. Limitations and subtleties are complex.
High, can detect low concentrations (1 to 3 μg/g)
11
Table 4. (contd)
Technology Capabilities Requirements for
Use Interferences Other
Considerations Data Interpretation Relative Data
Quality
Equipotential and mise-à-la-masse
Good for leak detection
Requires the installation of electrodes in favorable locations (e.g., in conductive body, beneath known LNAPL).
Electrical signals and/or conductors (e.g., metal well casings, under-ground storage tanks, etc.) can complicate interpretation.
Thin contaminant plumes or very old plumes can be difficult to interpret.
Fairly simple to interpret, but only provides the footprint of the electrical anomaly.
Moderate
Self potential Variable Requires the installation of one fixed electrode, and an electrode that is moved on a grid over the site of interest.
Electrical signals and/or conductors (e.g., metal well casings, under-ground storage tanks, etc.) can complicate interpretation.
Can be slow. Cables must be dragged after the operator.
Requires experienced interpreter – usually qualitative.
Moderate
Seismic reflection amplitude vs. offset (AVO)
Resolution 10s to 100s of centimeters dependent on geometry, frequency.
Pre-acquisition modeling required; need large numbers of geophones and complex acquisition equipment.
Need subsurface samples for calibration.
AVO modeling needed for design of seismic acquisition parameters.
Non-unique, data require extensive post-processing and inversion. Based on assumption that phase change related to DNAPL presence, not geologic changes.
Moderate
12
Table 5. Summary of Evaluation for Contaminant Distribution Characterization Technologies
Inorganic Chemicals Organic Chemicals
Technology Metals Other
Inorganics NAPL Dissolved-Phase Vapor
Surface ground penetrating radar (GPR)
Fair Fair Good Good Poor
Cross-borehole radar tomography
Fair Fair Good Good Poor
Time domain electromagnetics (TDEM)
Better Better Good Poor Poor
Terrain conductivity (a frequency domain electromagnetics [FDEM] method)
Better Better Good Poor Poor
DC resistivity soundings and profiling
Better Better Fair Fair Poor
3D resistivity imaging (including high resolution resistivity [HRR] and HRR-steel casing resistivity technology)
Best Best Fair Fair Poor
Electrical resistivity tomography (ERT)
Best Best Fair Fair Poor
Electrical impedance tomography
Good Good Fair Fair Fair
Complex resistivity (including spectral induced polarization)
Better Better Good Good Fair
Equipotential and mise-a-la-masse
Better Better Good Good Fair
Self potential Better Better Good Good Fair
Seismic reflection amplitude vs. offset (AVO)
Poor Poor Good Fair Poor
3.2 Technologies for Characterizing Subsurface Properties
Technology information is compiled in Tables 6 and 7. An evaluation of these technologies is summarized in Table 8.
13
Table 6. Characteristics of Subsurface Property Characterization Technologies
Technology Characterization Target Use Platform State of
Development Relative Cost Data Source
Surface ground penetrating radar (GPR)
Stratigraphy, moisture, elevation of water table
Surface Commercial – widely available • Sisson and Lu
Site(a) • Clastic Dike
Site(a)
Medium http://vadose.pnl.gov/; http://fate.clu-in.org/gpr_main.asp; http://costperformance.org/monitoring/#38; Knight 2001; Moysey and Knight 2004; Moysey et al. 2003; van Overmeeren 1998
Cross-borehole radar tomography
Moisture distribution, stratigraphy, fractures, salinity changes, moisture changes, geochemical sediment grain coatings
Borehole Emerging - deployed • Sisson and Lu
Site(a) • Oyster, VA Site
Medium to high
Majer et al. 2001; Hubbard et al. 2001; Day-Lewis et al. 2004; Tronicke et al. 2004; Chen et al. 2004
Time domain electromagnetics (TDEM)
Stratigraphy, aquifer-aquitard delineation
Surface Commercial – widely available
Medium http://www.usace.army.mil/inet/usace-docs/eng-manuals/em1110-1-1802/c-4.pdf; McNeill 1994.
Terrain conductivity (a frequency domain electromagnetics [FDEM] method)
Limited utility for mapping layers with different conductivity, e.g., aquifer/aquitard discrimination
Surface Commercial – widely available
Low http://www.usace.army.mil/inet/usace-docs/eng-manuals/em1110-1-1802/c-4.pdf; McNeill 1990.
DC resistivity soundings and profiling
Stratigraphy/lithology, geologic structure, moisture
Surface Commercial – widely available • Gable Gap(a) • 216-Z-9(a)
Medium to low http://www.usace.army.mil/inet/usace-docs/eng-manuals/em1110-1-1802/c-4.pdf; Moore 1982; Strait and Moore 1982; Rohay et al. 1994.
14
Table 6. (contd)
Technology Characterization Target Use Platform State of
Development Relative Cost Data Source
3D resistivity imaging (including high resolution resistivity [HRR] and HRR-steel casing resistivity technology)
Stratigraphy/lithology, geologic structure; moisture
Surface and borehole
Commercial – widely available • Mock Tank
(223-E) (a) • Sisson and Lu
Site(a) • BC cribs and
trenches(a)
Medium to high
http://vadose.pnl.gov; Ward and Gee 2000; Barnett et al. 2002.
Electrical resistivity tomography (ERT)
Stratigraphy/lithology, geologic structure; moisture
Borehole Commercial – widely available • Mock Tank
(223-E)(a) • Vermont & SRS
Medium http://vadose.pnl.gov; Narbutovskih 1996; Ward and Gee 2000; Barnett et al. 2002; FRTR Site Characterization and Monitoring Technologies
Electrical impedance tomography
Stratigraphy/lithology, geologic structure; moisture
Borehole Emerging – research • Mock Tank
(223-E)(a)
Medium http://vadose.pnl.gov
Complex resistivity (including spectral induced polarization)
Stratigraphy/lithology, geologic structure; moisture. Electrical polarizing materials (e.g., some clays). Quantify soil heterogeneity.
Surface and/or cross-borehole
Emerging – deployed • A-14 outfall at
SRS • Hill Air Force
Base
Medium to high
Morgan and Lesmes 2004; Brown et al. 2003; EPA 1998; Greenhouse et al. 1997
Equipotential and mise-a-la-masse
Stratigraphy/lithology, geologic structure; moisture
Surface and borehole
Commercial – widely available • Mock Tank
(223-E)(a) • Sisson and Lu
Site(a)
Medium to high
Barnett et al. 2002
15
Table 6. (contd)
Technology Characterization Target Use Platform State of
Development Relative Cost Data Source
Seismic refraction Stratigraphy, depth to bedrock, sediment properties
Surface Commercial – widely available
Medium http://www.usace.army.mil/inet/usace-docs/eng-manuals/em1110-1-1802/c-3.pdf
Seismic reflection Stratigraphy, depth to bedrock, buried channels, porosity, permeability
Surface Commercial – widely available • 200 West Area
carbon tet plume(a)
High http://www.usace.army.mil/inet/usace-docs/eng-manuals/em1110-1-1802/c-3.pdf
Cross-borehole seismic tomography
Stratigraphy, geologic heterogeneity, porosity, permeability
Borehole Emerging - deployed • Sisson and Lu
Site(a)
High Majer et al. 2001
Vertical seismic profile (VSP) tomography
Stratigraphy, geologic heterogeneity, porosity, permeability
Borehole Emerging – research
High Liberty et al. 1999
Surface nuclear magnetic resonance (NMR)(b)
Detection of water table, moisture distribution in vadose zone, mean pore size, and permeability
Surface Emerging – deployed
Medium Abraham et al. 2003; Lubczynski and Roy 2003
(a) Located at the Hanford Site in southeast Washington. (b) Also known as surface proton magnetic resonance sounding (MRS).
16
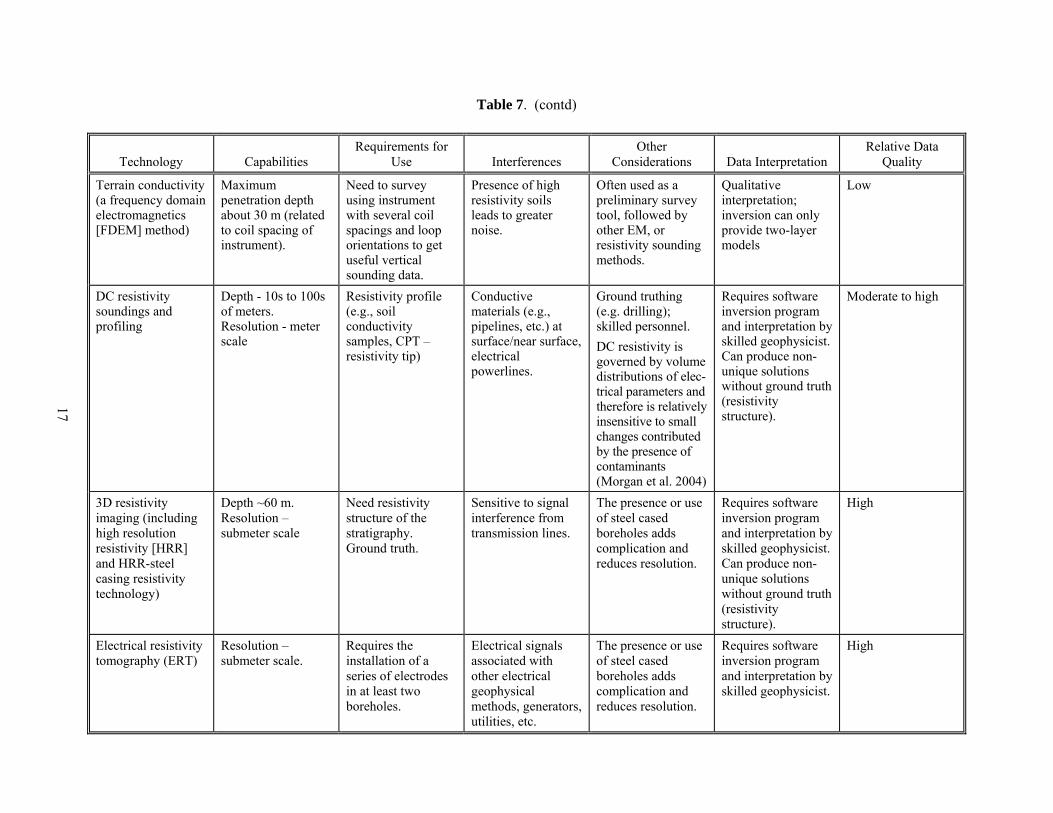
Table 7. Functionality of Subsurface Property Characterization Technologies
Technology Capabilities Requirements for
Use Interferences Other
Considerations Data Interpretation Relative Data
Quality
Surface ground penetrating radar (GPR)
Shallow penetration (usually less than 10 m), resolution 10s to 100s of centimeters depend-ent on geometry, frequency. Can provide 2D or 3D images.
3D imaging requires closely-spaced lines (<1 m) and more data processing. Borehole data optional for interpretation and inversion.
Large amounts of near-surface clay can prevent radar wave penetration; metallic objects can make interpretation difficult
Cross-well radar, surface and cross-well seismic, VSP, resistivity surveys, and tracer tests are all complementary tools
Non-unique, initial interpretation of stratigraphy can be made in field, but extensions to mapping moisture and other properties can require extensive processing
Moderate
Cross-borehole radar tomography
Well spacing restricted (usually less than 20 m), resolution 10s to 100s of cm dependent on geometry, frequency
Boreholes required Metallic boreholes cannot be used. Need good coupling between casing (e.g., PVC) and subsurface.
Cross-well radar, surface and cross-well seismic, VSP, resistivity surveys, and tracer tests are all complementary
Non-unique, data require extensive post-processing and inversion. Geology must be known or moisture differences (i.e., from multiple time points) must be available for interpretation of moisture.
Moderate to High
Time domain electromagnetics (TDEM)
Depth of penetration varies with transmitter type, can be several hundred meters, but resolution decreases with depth.
Pre-acquisition modeling recommended for design, esp. for resolution of thin layers
Data quality affected by lightning storms, power lines, or nearby metal structures.
Better resolution of vertical and horizontal changes in subsurface conductivity than possible with traditional DC resistivity methods.
Non-unique, data require inversion.
Moderate to High
17
Table 7. (contd)
Technology Capabilities Requirements for
Use Interferences Other
Considerations Data Interpretation Relative Data
Quality
Terrain conductivity (a frequency domain electromagnetics [FDEM] method)
Maximum penetration depth about 30 m (related to coil spacing of instrument).
Need to survey using instrument with several coil spacings and loop orientations to get useful vertical sounding data.
Presence of high resistivity soils leads to greater noise.
Often used as a preliminary survey tool, followed by other EM, or resistivity sounding methods.
Qualitative interpretation; inversion can only provide two-layer models
Low
DC resistivity soundings and profiling
Depth - 10s to 100s of meters. Resolution - meter scale
Resistivity profile (e.g., soil conductivity samples, CPT – resistivity tip)
Conductive materials (e.g., pipelines, etc.) at surface/near surface, electrical powerlines.
Ground truthing (e.g. drilling); skilled personnel. DC resistivity is governed by volume distributions of elec-trical parameters and therefore is relatively insensitive to small changes contributed by the presence of contaminants (Morgan et al. 2004)
Requires software inversion program and interpretation by skilled geophysicist. Can produce non-unique solutions without ground truth (resistivity structure).
Moderate to high
3D resistivity imaging (including high resolution resistivity [HRR] and HRR-steel casing resistivity technology)
Depth ~60 m. Resolution – submeter scale
Need resistivity structure of the stratigraphy. Ground truth.
Sensitive to signal interference from transmission lines.
The presence or use of steel cased boreholes adds complication and reduces resolution.
Requires software inversion program and interpretation by skilled geophysicist. Can produce non-unique solutions without ground truth (resistivity structure).
High
Electrical resistivity tomography (ERT)
Resolution – submeter scale.
Requires the installation of a series of electrodes in at least two boreholes.
Electrical signals associated with other electrical geophysical methods, generators, utilities, etc.
The presence or use of steel cased boreholes adds complication and reduces resolution.
Requires software inversion program and interpretation by skilled geophysicist.
High
18
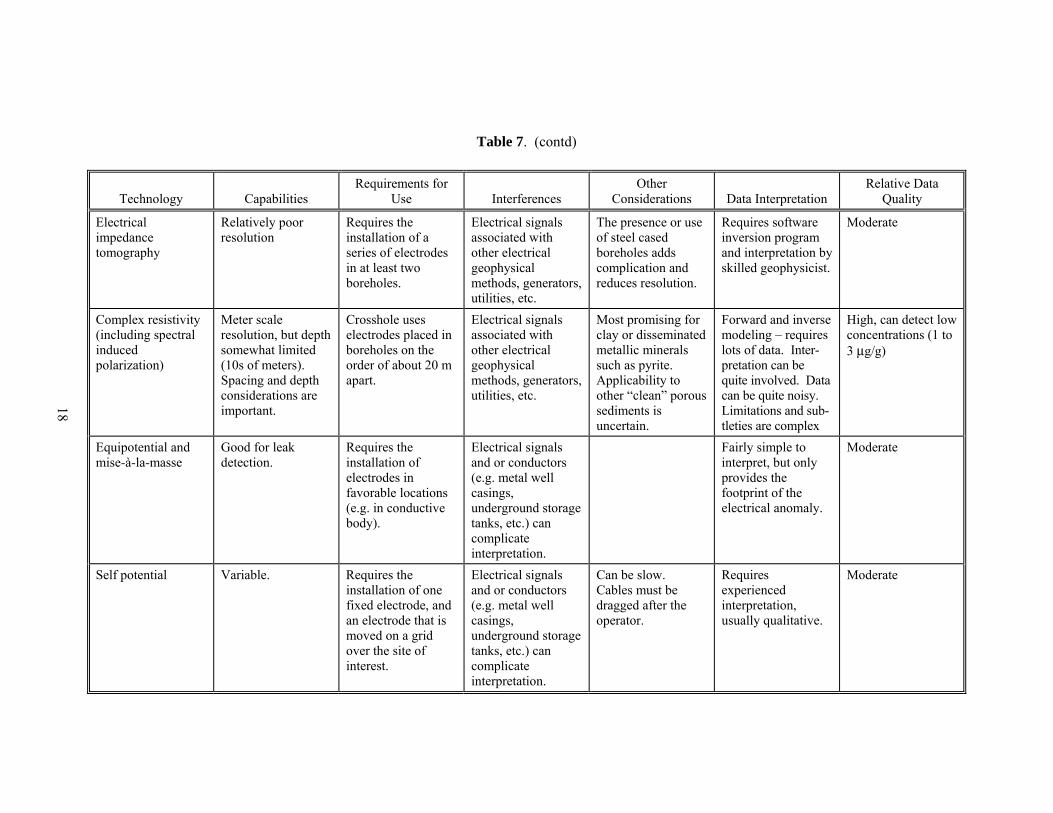
Table 7. (contd)
Technology Capabilities Requirements for
Use Interferences Other
Considerations Data Interpretation Relative Data
Quality
Electrical impedance tomography
Relatively poor resolution
Requires the installation of a series of electrodes in at least two boreholes.
Electrical signals associated with other electrical geophysical methods, generators, utilities, etc.
The presence or use of steel cased boreholes adds complication and reduces resolution.
Requires software inversion program and interpretation by skilled geophysicist.
Moderate
Complex resistivity (including spectral induced polarization)
Meter scale resolution, but depth somewhat limited (10s of meters). Spacing and depth considerations are important.
Crosshole uses electrodes placed in boreholes on the order of about 20 m apart.
Electrical signals associated with other electrical geophysical methods, generators, utilities, etc.
Most promising for clay or disseminated metallic minerals such as pyrite. Applicability to other “clean” porous sediments is uncertain.
Forward and inverse modeling – requires lots of data. Inter-pretation can be quite involved. Data can be quite noisy. Limitations and sub-tleties are complex
High, can detect low concentrations (1 to 3 μg/g)
Equipotential and mise-à-la-masse
Good for leak detection.
Requires the installation of electrodes in favorable locations (e.g. in conductive body).
Electrical signals and or conductors (e.g. metal well casings, underground storage tanks, etc.) can complicate interpretation.
Fairly simple to interpret, but only provides the footprint of the electrical anomaly.
Moderate
Self potential Variable. Requires the installation of one fixed electrode, and an electrode that is moved on a grid over the site of interest.
Electrical signals and or conductors (e.g. metal well casings, underground storage tanks, etc.) can complicate interpretation.
Can be slow. Cables must be dragged after the operator.
Requires experienced interpretation, usually qualitative.
Moderate
19
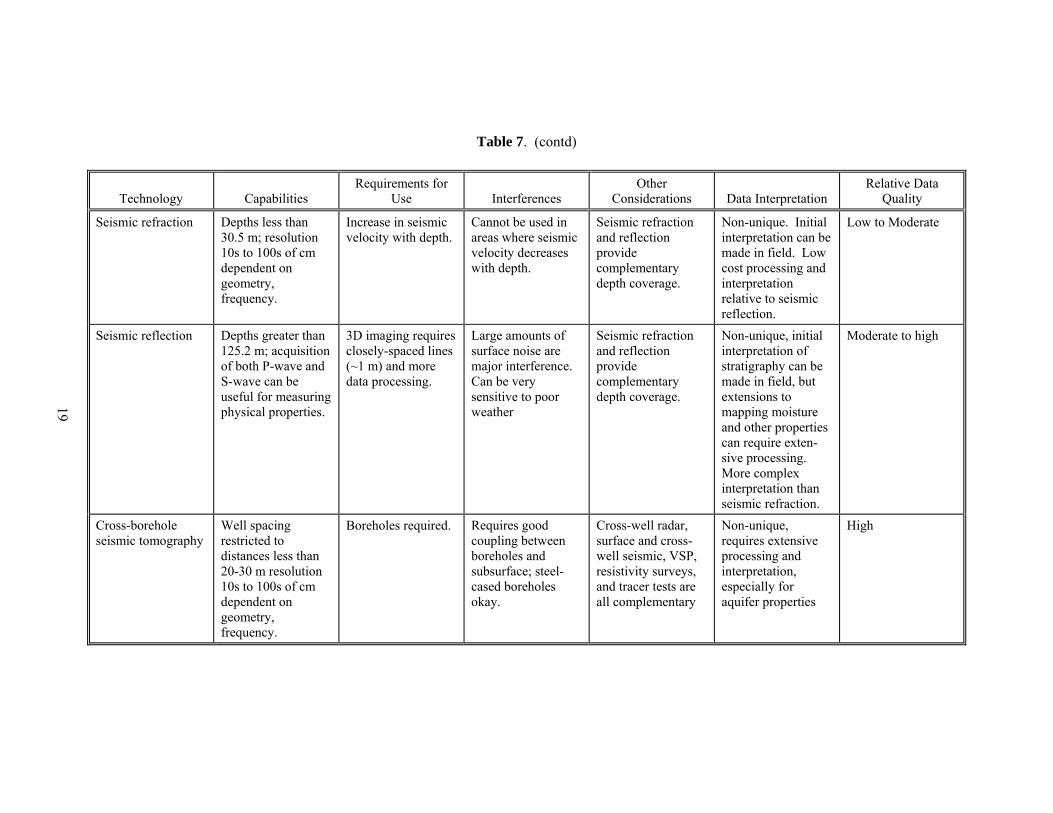
Table 7. (contd)
Technology Capabilities Requirements for
Use Interferences Other
Considerations Data Interpretation Relative Data
Quality
Seismic refraction Depths less than 30.5 m; resolution 10s to 100s of cm dependent on geometry, frequency.
Increase in seismic velocity with depth.
Cannot be used in areas where seismic velocity decreases with depth.
Seismic refraction and reflection provide complementary depth coverage.
Non-unique. Initial interpretation can be made in field. Low cost processing and interpretation relative to seismic reflection.
Low to Moderate
Seismic reflection Depths greater than 125.2 m; acquisition of both P-wave and S-wave can be useful for measuring physical properties.
3D imaging requires closely-spaced lines (~1 m) and more data processing.
Large amounts of surface noise are major interference. Can be very sensitive to poor weather
Seismic refraction and reflection provide complementary depth coverage.
Non-unique, initial interpretation of stratigraphy can be made in field, but extensions to mapping moisture and other properties can require exten-sive processing. More complex interpretation than seismic refraction.
Moderate to high
Cross-borehole seismic tomography
Well spacing restricted to distances less than 20-30 m resolution 10s to 100s of cm dependent on geometry, frequency.
Boreholes required. Requires good coupling between boreholes and subsurface; steel-cased boreholes okay.
Cross-well radar, surface and cross-well seismic, VSP, resistivity surveys, and tracer tests are all complementary
Non-unique, requires extensive processing and interpretation, especially for aquifer properties
High
20
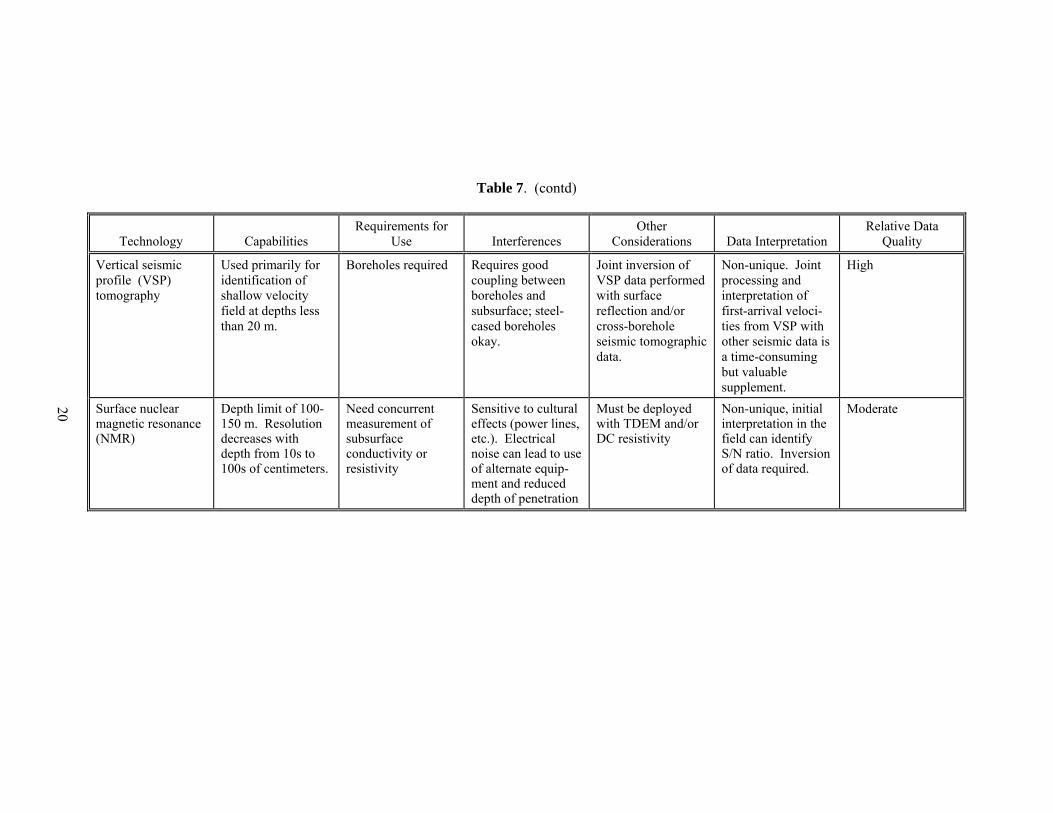
Table 7. (contd)
Technology Capabilities Requirements for
Use Interferences Other
Considerations Data Interpretation Relative Data
Quality
Vertical seismic profile (VSP) tomography
Used primarily for identification of shallow velocity field at depths less than 20 m.
Boreholes required Requires good coupling between boreholes and subsurface; steel-cased boreholes okay.
Joint inversion of VSP data performed with surface reflection and/or cross-borehole seismic tomographic data.
Non-unique. Joint processing and interpretation of first-arrival veloci-ties from VSP with other seismic data is a time-consuming but valuable supplement.
High
Surface nuclear magnetic resonance (NMR)
Depth limit of 100-150 m. Resolution decreases with depth from 10s to 100s of centimeters.
Need concurrent measurement of subsurface conductivity or resistivity
Sensitive to cultural effects (power lines, etc.). Electrical noise can lead to use of alternate equip-ment and reduced depth of penetration
Must be deployed with TDEM and/or DC resistivity
Non-unique, initial interpretation in the field can identify S/N ratio. Inversion of data required.
Moderate
21
Table 8. Summary of Evaluation for Subsurface Property Characterization Technologies
Technology Stratigraphy Moisture Porosity
Hydraulic Conductivity/ Permeability Grain Size
Geochemical Properties Flow Patterns
Surface ground penetrating radar (GPR)
Best for shallow
Best for shallow
Good Better Fair Fair Good
Cross-borehole radar tomography
Better Better Good Better Fair Fair Good
Time domain electromagnetics (TDEM)
Good Good Poor Poor Poor Poor Good
Terrain conductivity (a frequency domain electromagnetics [FDEM] method)
Good Fair Poor Poor Poor Poor Poor
DC resistivity soundings and profiling
Better Good Poor Fair Fair Poor Poor
3D resistivity imaging (including high resolution resistivity [HRR] and HRR-steel casing resistivity technology)
Better Better Poor Fair Fair Poor Better
Electrical resistivity tomography (ERT)
Better Better Poor Fair Fair Poor Better
Electrical impedance tomography
Fair Fair Fair Fair Poor Poor Poor
Complex resistivity (including spectral induced polarization)
Good Good Good Good Fair Poor Fair
Equipotential and mise-a-la-masse
Good Good Good Good Fair Poor Fair
Self potential Good Good Good Good Fair Poor Fair
22
Table 8. (contd)
Technology Stratigraphy Moisture Porosity
Hydraulic Conductivity/ Permeability Grain Size
Geochemical Properties Flow Patterns
Seismic refraction Better Poor Poor Poor Poor Poor Poor Surface seismic reflection Best for deep Poor Best Best Poor Poor Poor Cross-borehole seismic tomography
Better Poor Best Best Poor Poor Poor
Vertical seismic profile (VSP) tomography
Good Poor Poor Poor Poor Poor Poor
Surface nuclear magnetic resonance (NMR)
Poor Better Poor Good Poor Poor Poor
23
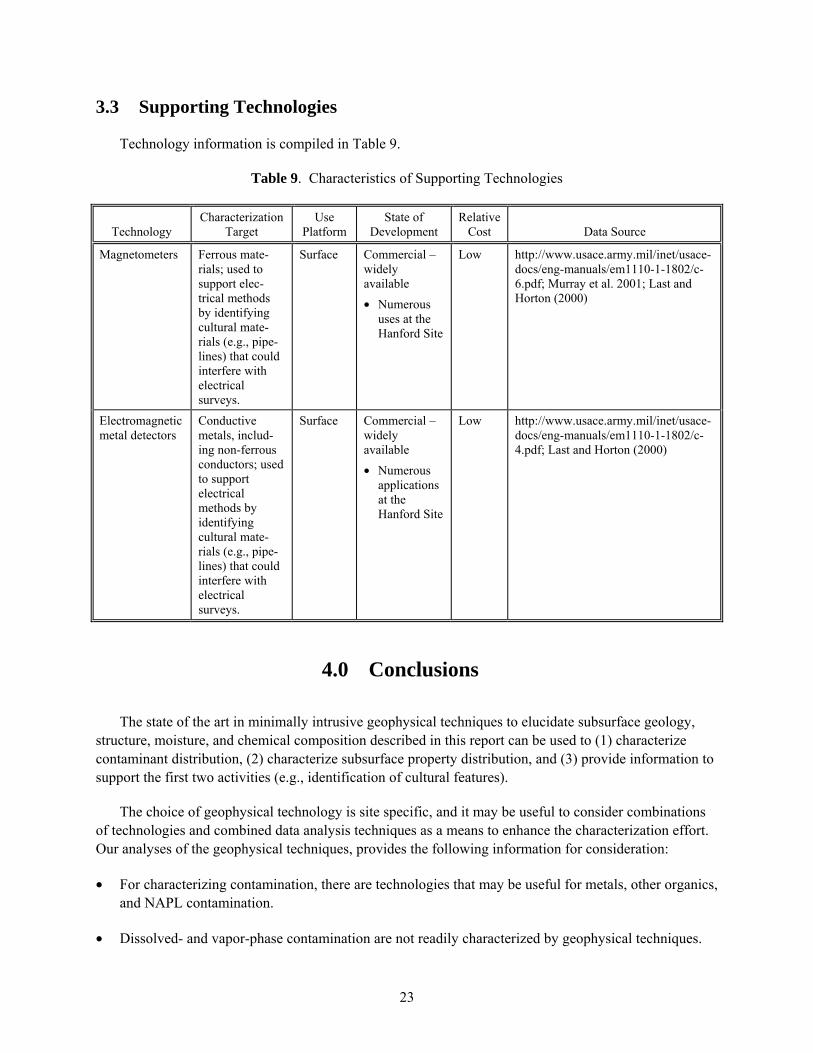
3.3 Supporting Technologies
Technology information is compiled in Table 9.
Table 9. Characteristics of Supporting Technologies
Technology Characterization
Target Use
Platform State of
Development Relative
Cost Data Source
Magnetometers Ferrous mate-rials; used to support elec-trical methods by identifying cultural mate-rials (e.g., pipe-lines) that could interfere with electrical surveys.
Surface Commercial – widely available • Numerous
uses at the Hanford Site
Low http://www.usace.army.mil/inet/usace-docs/eng-manuals/em1110-1-1802/c-6.pdf; Murray et al. 2001; Last and Horton (2000)
Electromagnetic metal detectors
Conductive metals, includ-ing non-ferrous conductors; used to support electrical methods by identifying cultural mate-rials (e.g., pipe-lines) that could interfere with electrical surveys.
Surface Commercial – widely available • Numerous
applications at the Hanford Site
Low http://www.usace.army.mil/inet/usace-docs/eng-manuals/em1110-1-1802/c-4.pdf; Last and Horton (2000)
4.0 Conclusions
The state of the art in minimally intrusive geophysical techniques to elucidate subsurface geology, structure, moisture, and chemical composition described in this report can be used to (1) characterize contaminant distribution, (2) characterize subsurface property distribution, and (3) provide information to support the first two activities (e.g., identification of cultural features).
The choice of geophysical technology is site specific, and it may be useful to consider combinations of technologies and combined data analysis techniques as a means to enhance the characterization effort. Our analyses of the geophysical techniques, provides the following information for consideration:
• For characterizing contamination, there are technologies that may be useful for metals, other organics, and NAPL contamination.
• Dissolved- and vapor-phase contamination are not readily characterized by geophysical techniques.
24
• Subsurface properties including stratigraphy, moisture, hydraulic conductivity, and porosity can be characterized with geophysical techniques. However, geophysical techniques are not as suitable for characterizing grain size, geochemistry, and flow patterns.
• In conjunction with the geophysical technologies for characterizing contaminant distribution and subsurface properties, widely available magnetometer and electromagnetic metal detectors are useful to identify cultural features that can affect the performance of geophysical technologies.
5.0 References
Abraham JD, A Legchenko, A Mazzella, EA White, JW Lane Jr., and JB Fleming. 2003. “TDEM and NUMISPlus Soundings at the Ash Meadows National Wildlife Refuge - A Case Study.” In 2nd Inter-national Workshop on the Magnetic Resonance Sounding Method Applied to Non-Invasive Groundwater Investigations, November 19 to 20, 2003, Orléans, France, Proceedings: Orléans, France, Bureau de Recherches Géologiques et Minières (BRGM). Available URL: http://water.usgs.gov/ogw/bgas/publications/2003_MRS_Abraham/
Barnett DB, GW Gee, and MD Sweeney. 2002. Results of Tank-Leak Detection Demonstration Using Geophysical Techniques at the Hanford Mock Tank Site – Fiscal Year 2001. PNNL-13813, Pacific Northwest National Laboratory, Richland, Washington.
Brown SR, D Lesmes, J Fourkas, and JR Sorenson. 2003. Complex Resistivity for Monitoring DNAPL Contamination. EMSP Project No. 70012, Environmental Management Science Program, U.S. Depart-ment of Energy, Washington, D.C., see http://emsp.em.doe.gov/
Chen J, S Hubbard, Y Rubin, C Murray, E Roden, and E Majer. 2004. “Geochemical Characterization Using Geophysical Data and Markov Chain Monte Carlo Methods: A Case Study at the South Oyster Bacterial Transport Site in Virginia.” Water Resour. Res. 40(12):W12412, DOI: 10.1029/2003WR002883.
Day-Lewis FD, JW Lane Jr., and SM Gorelick. 2004. “Combined Interpretation of Radar, Hydraulic, and Tracer Data from a Fractured-Rock Aquifer Near Mirror Lake, New Hampshire, USA.” Hydrogeology, DOI: 10.1007/s10040-004-0372-y.
EPA. 1998. Geophysical Techniques to Locate DNAPLs: Profiles of Federally Funded Projects. EPA 542-R-98-020, U.S. Environmental Protection Agency, Washington, D.C.
Goovaerts P. 1997. Geostatistics for Natural Resources Evaluation. Oxford University Press, New York.
Greenhouse J, P Gudjurgis, and D Slaine. 1997. An Introduction to Near-Surface and Environmental Geophysical Methods and Applications. Reference notes for a 1997 SAGEEP Short Course, Environmental and Engineering Geophysical Society, Denver, Colorado.
25
Guy ED, JJ Daniels, J Holt, SJ Radzevicius, and MA Vendl. 2000. “Electromagnetic Induction and GPR Measurements for Creosote Contaminant Investigation. Journal Environmental and Engineering Geophysics 5(2):11-19.
Hubbard SS, J Chen, J Peterson, EL Majer, KH Williams, DJ Swift, B Mailloux, and Y Rubin. 2001. “Hydrogeological Characterization of the South Oyster Bacterial Transport Site Using Geophysical Data.” Water Resour. Res. 37:2431–2456.
Knight RJ. 2001. “Ground Penetrating Radar for Environmental Applications.” Annu. Rev. Earth Planet. Sci. 34:229–255.
Last GV and DG Horton. 2000. Review of Geophysical Characterization Methods Used at the Hanford Site. PNNL-13149, Pacific Northwest National Laboratory, Richland, Washington.
Liberty LM, WP Clement, and MD Knoll. 1999. “Surface and Borehole Seismic Characterization of the Boise Hydrogeophysical Research Site.” In Proceedings of SAGEEP99, The Symposium on the Application of Geophysics to Engineering and Environmental Problems, March 14-18, 1999, Oakland, California, pp. 723-732.
Lubczynski M and J Roy. 2003. “Hydrogeological Interpretation and Potential of the New Magnetic Resonance Sounding (MRS) Method.” Journal of Hydrology 283(1):19-40.
Majer EL, KH Williams, JE Peterson, and GW Gee. 2001. High Resolution Imaging of Vadose Zone Transport using Crosswell Methods. PNNL-13792, Pacific Northwest National Laboratory, Richland, Washington.
McNeill JD. 1990. “Use of Electromagnetic Methods for Groundwater Studies.” In Geotechnical and Environmental Geophysics, Vol 1, Society of Exploration Geophysicists, Tulsa, Oklahoma, pp. 191-218.
McNeill JD. 1994. Principles and Applications of Time Domain Electromagnetic Techniques for Resistivity Sounding. Geonics Ltd. Technical Note TN-27, 15 p (available on request from Geonics Ltd, Mississauga, Ontario, Canada, see http://www.geonics.com/contact.html).
Moore BA. 1982. Geophysical Investigation of the Gable Mtn. Pond – West Lake Area, Hanford Site, Southcentral Washington. RHO-SA-239, Rockwell Hanford Operations, Richland, Washington.
Morgan FD, and D Lesmes. 2004. Induced Polarization with Electromagnetic Coupling: 3D Spectral Imaging Theory. EMSP Project No. 73836, U.S. Department of Energy, Environmental Management Science Program, Washington, D.C. Available online at http://emsp.em.doe.gov/
Moysey S and RJ Knight. 2004. “Modeling the Field-Scale Relationship Between Dielectric Constant and Water Content in Heterogeneous Systems.” Water Resources Research, 14, DOI 10.1029/2003WRR002589.
Moysey S, J Caers, RJ Knight, and RM Allen-King. 2003. “Stochastic Estimation of Facies Using Ground Penetrating Radar Data.” Stochastic Environmental Research and Risk Assessment 17:306-318.
26
Murray CJ, GV Last, and Y Chien. 2001. Enhanced Site Characterization of the 618-4 Burial Ground. PNNL-13656, Pacific Northwest National Laboratory, Richland, Washington.
Narbutovskih SM, TD Halter, MD Sweeney, W Daily, and AL Ramirez. 1996. Electrical Resistivity Tomography at the DOE Hanford Site. WHC-SA-3055-VA, Westinghouse Hanford Company, Richland, Washington.
Olhoeft GR. 1992. “Geophysical Detection of Hydrocarbon and Organic Chemical Contamination.” In Proceedings on Application of Geophysics to Engineering, and Environmental Problems, RS Bell (ed.). Environment and Engineering Geophysical Society, Oakbrook, Illinois, p. 587-595. Available online at http://www.g-p-r.com/sageep92.pdf.
Ramirez A, W Daily, A Binley, and D LaBrecque. 1998. Laboratory Scale Tests of Electrical Impedance Tomography. UCRL-JC-132657, Lawrence Livermore National Laboratory, Livermore, California.
Rohay VL, KJ Swett, VM Johnson, GV Last, DC Lanigan, and LA Doremus. 1994. FY03 Site Characterization Status Report and Data Package for the Carbon Tetrachloride Site. WHC-SD-EN-TI-202, Rev. 0, Westinghouse Hanford Company, Richland, Washington.
Sneddon KW, MH Powers, RH Johnson, and EP Poeter. 2002. Modeling GPR Data to Interpret Porosity and DNAPL Saturations for Calibration of a 3-D Multiphase Flow Simulation. U.S. Geological Survey Open-File Report 02-451, U.S. Geological Survey, Washington, D.C.
Strait SR and BA Moore. 1982. Geohydrology of the Rattlesnake Ridge Interbed in the Gable Mountain Pond Area. RHO-ST-38, Rockwell Hanford Operations, Richland, Washington.
Tronicke J, K Holliger, W Barrash, and MD Knoll. 2004. “Multivariate Analysis of Crosshole Georadar Velocity and Attenuation Tomograms for Aquifer Zonation.” Water Resources Research 40(1):W01519, DOI 10.1029/2003WR002031.
van Overmeeren RA. 1998. “Radar Facies of Unconsolidated Sediments in the Netherlands: A Radar Statigraphy Interpretation Method for Hydrogeology.” J. App. Geophysics 40:1–18.
Ward AL and GW Gee. 2000. Vadose Zone Transport Field Study: Detailed Test Plan for Simulated Leak Tests. PNNL-13263, Pacific Northwest National Laboratory, Richland, Washington.
Appendix A
Brief Descriptions of Geophysical Techniques
A.1
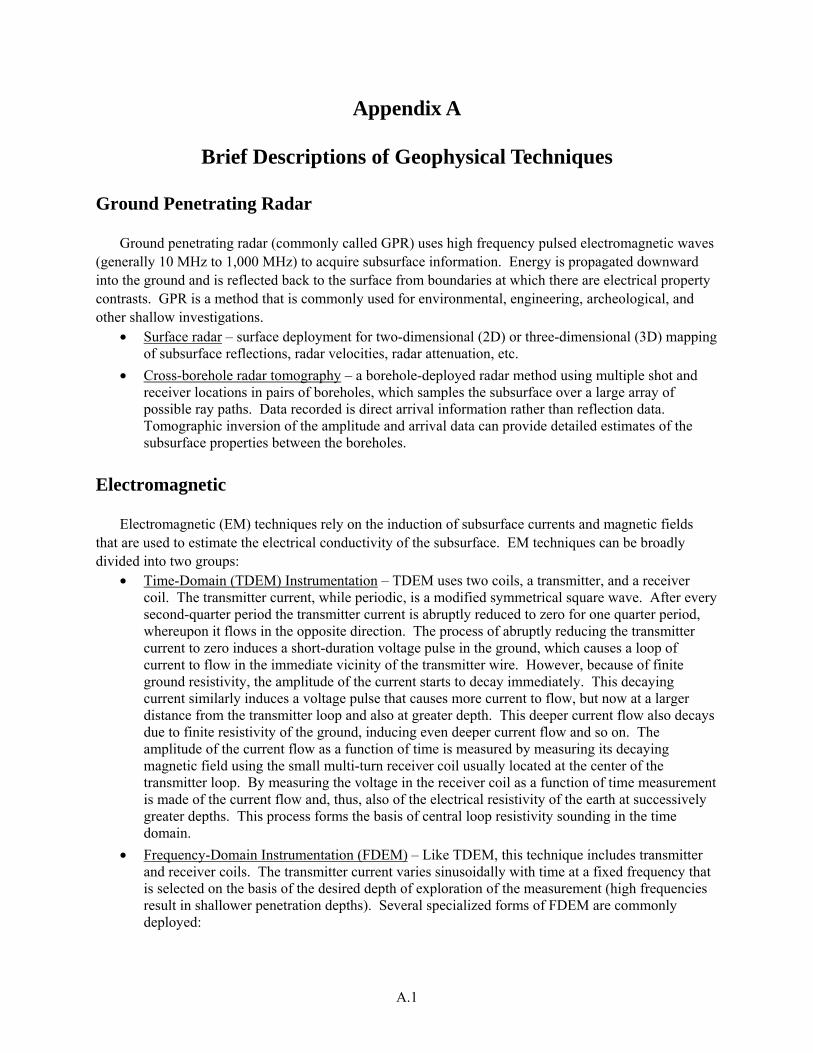
Appendix A
Brief Descriptions of Geophysical Techniques
Ground Penetrating Radar Ground penetrating radar (commonly called GPR) uses high frequency pulsed electromagnetic waves (generally 10 MHz to 1,000 MHz) to acquire subsurface information. Energy is propagated downward into the ground and is reflected back to the surface from boundaries at which there are electrical property contrasts. GPR is a method that is commonly used for environmental, engineering, archeological, and other shallow investigations.
• Surface radar – surface deployment for two-dimensional (2D) or three-dimensional (3D) mapping of subsurface reflections, radar velocities, radar attenuation, etc.
• Cross-borehole radar tomography – a borehole-deployed radar method using multiple shot and receiver locations in pairs of boreholes, which samples the subsurface over a large array of possible ray paths. Data recorded is direct arrival information rather than reflection data. Tomographic inversion of the amplitude and arrival data can provide detailed estimates of the subsurface properties between the boreholes.
Electromagnetic Electromagnetic (EM) techniques rely on the induction of subsurface currents and magnetic fields that are used to estimate the electrical conductivity of the subsurface. EM techniques can be broadly divided into two groups:
• Time-Domain (TDEM) Instrumentation – TDEM uses two coils, a transmitter, and a receiver coil. The transmitter current, while periodic, is a modified symmetrical square wave. After every second-quarter period the transmitter current is abruptly reduced to zero for one quarter period, whereupon it flows in the opposite direction. The process of abruptly reducing the transmitter current to zero induces a short-duration voltage pulse in the ground, which causes a loop of current to flow in the immediate vicinity of the transmitter wire. However, because of finite ground resistivity, the amplitude of the current starts to decay immediately. This decaying current similarly induces a voltage pulse that causes more current to flow, but now at a larger distance from the transmitter loop and also at greater depth. This deeper current flow also decays due to finite resistivity of the ground, inducing even deeper current flow and so on. The amplitude of the current flow as a function of time is measured by measuring its decaying magnetic field using the small multi-turn receiver coil usually located at the center of the transmitter loop. By measuring the voltage in the receiver coil as a function of time measurement is made of the current flow and, thus, also of the electrical resistivity of the earth at successively greater depths. This process forms the basis of central loop resistivity sounding in the time domain.
• Frequency-Domain Instrumentation (FDEM) – Like TDEM, this technique includes transmitter and receiver coils. The transmitter current varies sinusoidally with time at a fixed frequency that is selected on the basis of the desired depth of exploration of the measurement (high frequencies result in shallower penetration depths). Several specialized forms of FDEM are commonly deployed:
A.2
o EM Induction – These are EM instruments that induce subsurface currents and magnetic fields using either 2 or 3 rigidly connected coils, usually closely spaced. Primarily used for electromagnetic metal detectors, where the inclusion of a third coil can help distinguish between deep and shallow metallic objects. EM metal detectors have an advantage over magnetometers because they are sensitive to all metals, not just ferrous metals.
o Very Low Frequency EM (VLF EM) – Is an inductive technique which relies on very low frequency horizontal EM signals from remote military transmitters as an electrical source. Localized conductors, such as water-filled fractures, cause angular disturbances in this signal which are measured with the VLF-EM instrument.
o Magneto-Tellurics - Natural or audio magneto-tellurics (AMT) determines the subsurface electrical resistivity distribution by measuring time-dependent variations of the earth’s subsurface electromagnetic fields resulting from natural variation in the earth’s electrical field (i.e., distant lightning), while controlled source AMT (CSAMT) measures the subsurface electric and magnetic fields resulting from input of high frequency, non-polarized, artificially transmitted electromagnetic waves.
o Terrain Conductivity – Terrain conductivity EM systems allow a rapid determination of the average conductivity of the ground because they do not require electrical contact with the ground as is required with DC resistivity techniques. However, the technique provides limited vertical resolution of differences in conductivity and usually is supplemented with a limited number of DC resistivity or TDEM soundings.
o Horizontal Loop EM – HLEM uses two coils with large separation distances and is primarily used in mining applications for identification of deep conductive metal deposits. The technique provides greater depth penetration, but with low resolution and can only detect relatively large differences in conductivity.
o Electromagnetic Offset Logging (EOLS) – EOLS is an EM method intended to allow 3D mapping of subsurface electrical conductivity. The method uses a source loop placed at a number of stations on the surface. For each surface station, the resulting electromagnetic field is surveyed using a large number of measurements in a nearby borehole, which must be cased with PVC and not steel.
Seismic Seismic methods measure the transmission of mechanical vibrations (sound waves) through the subsurface and relate those to subsurface properties based on models for the transmission, reflection, and possibly refraction of the sound waves. The techniques use many different types of sources of acoustic energy, ranging from hitting a steel plate with a sledgehammer to very sophisticated explosives, electromechanical sparkers, and truck mounted vibrators. The sound waves are usually recorded in a series of geophones that may be emplaced at the surface or deployed in boreholes. The complexity and cost of efforts to record and process seismic data can vary enormously.
• Seismic Refraction – The simplest technique, seismic refraction uses surface deployed sources and geophones to record the first arrivals of seismic waves that have been refracted at a subsurface boundary. The technique can be used to map the depth to a subsurface reflector and the velocity within the subsurface layers above and below that reflector.
• Seismic Reflection – Surface reflection methods also use surface deployed sources and arrays of geophones; they record the seismic energy reflected from subsurface boundaries. The amount of energy reflected at a boundary depends on the densities and seismic velocities of the materials
A.3
above and below the boundary. Advanced recording and processing techniques can be used to generate 3D images of stratigraphy as well as both sediment and fluid properties.
• Surface Vertical Seismic Profiles (VSP) and Tomography – Surface VSP involves the use of a surface seismic source and a string of geophones deployed in a nearby borehole. Primary use of the method is to provide better estimates of vertical variations in seismic velocity with depth. Recent studies suggest integrated use of surface VSP data with surface reflection seismic and cross-borehole tomography.
• Cross-Borehole Tomography – Cross-borehole seismic tomography is similar to cross-borehole radar. The method uses multiple source and receiver locations in pairs of boreholes, which samples the subsurface over a large array of possible ray paths. Data recorded is direct arrival information rather than reflection data. Tomographic inversion of the amplitude and arrival data can provide detailed estimates of the subsurface properties between the boreholes.
Direct Current Resistivity Direct current (DC) resistivity techniques measure the electrical properties of the earth by driving a DC signal into the ground and measuring the resulting potentials (voltage) created in the earth. From these data, the electrical properties of the earth (the geoelectrical section) can be derived, and in turn, from those electrical properties, we can infer geologic properties. There are a wide range of techniques dependent on the electrode configuration and the modeling/data reduction software. These techniques can be broadly divided into two groups: (1) those using electrodes placed only at the surface and (2) those using electrodes emplaced in the subsurface via boreholes.
• Surface Based Resistivity o Traditional DC Resistivity – Traditional DC resistivity techniques use surface based
(horizontal) arrays of electrodes to apply the current to the ground and to measure the earth voltage. The most commonly used electrode arrangements include the Wenner, Schlumberger and dipole-dipole arrays. These techniques can be used for both vertical electrical soundings (VES) to determine the depth to geoelectrical horizons, or for electrical profiling to map lateral changes and identify near-vertical features.
o 3D Electrical Resistivity – Three dimensional electrical resistivity imaging (e.g. high-resolution resistivity) is similar to electrical profiling, but uses more advanced modeling/reduction software to process the resistivity data to produce 3D or pseudo-3D images.
• Borehole Based Resistivity o Electrical Resistivity Tomography – Electrical resistivity tomography (ERT) uses
multiple electrically isolated electrodes place in vertical arrays in a cross-borehole geometry, to produce relatively high-quality, high-resolution images.
o Electrical Impedance Tomography - Electrical impedance tomography is similar to ERT but uses the magnitude and phase of the measured electrical impedance (which under D.C. conditions corresponds to resistance).
Complex Resistivity (AC) and Induced Polarization The terms “complex resistivity” and “induced polarization” are used interchangeably. Complex resistivity is essentially a resistivity survey which uses alternating current (AC). The magnitude and phase of the voltage to current ratio is measured using standard resistivity electrode arrays over a range of frequencies. Induced polarization is a low frequency form of complex resistivity. Complex resistivity response is a plot of the complex apparent resistivity as a function of frequency. Variations in the
A.4
response arise from pore-scale phenomena. Forward and inverse modeling can be performed and interpretation of the full range complex resistivity data can be quite involved. Equipotential and Mise A La Masse Equipotential or mise a la masse techniques measure the electrical potentials between electrodes (and/or a conductive body in contact with that electrode). When good or poor conductors are imbedded in a homogeneous medium between the electrodes, a distortion of the electrical field occurs. The shape of the equipotential lines typically mimic to some degree, the footprint of the conductive body. Self Potential Various electrical potentials occur around dissimilar materials in native ground or within the subsurface altered by human actions. Self potential techniques, measure the electrical potentials between a base electrode and a roving electrode placed in a grid or along a profile line. Interpretation can range from simple qualitative plots of the self-potentials, to complex computer modeling to resolve subtle interactions between temperature, electrochemical reactions and earth geometry. Other There are several remaining methods that do not fit into the geophysical categories described above.
• Surface Nuclear Magnetic Resonance (NMR) – Surface NMR, or surface proton magnetic resonance sounding (MRS), measurements are relatively new methods that can be used to indirectly estimate the water content of saturated and unsaturated zones in the earth's subsurface. MRS is used to estimate aquifer properties including quantity of water contained in the aquifer, porosity, and hydraulic permeability.
• Magnetic Methods – Many rocks and minerals are weakly magnetic or are magnetized by induction in the earth’s field, and cause spatial variations or “anomalies” in the earth’s magnetic field. Manmade objects containing iron or steel, e.g., steel drums, are often highly magnetized and locally can cause large anomalies. Magnetic methods are generally used to map the location and size of ferrous objects.
• Gravity – The intensity of the force of gravity due to a buried mass difference (concentration or void) is superimposed on the larger force of gravity due to the total mass of the earth. By very precise measurement of gravity and by careful correction for variations in the larger component due to the whole earth, a gravity survey can sometimes detect natural or manmade voids, variations in the depth to bedrock, and geologic structures of engineering interest. Precise and small-scale studies used for environmental and engineering processes are often referred to as microgravity studies.
PNNL-15305
Distr.1
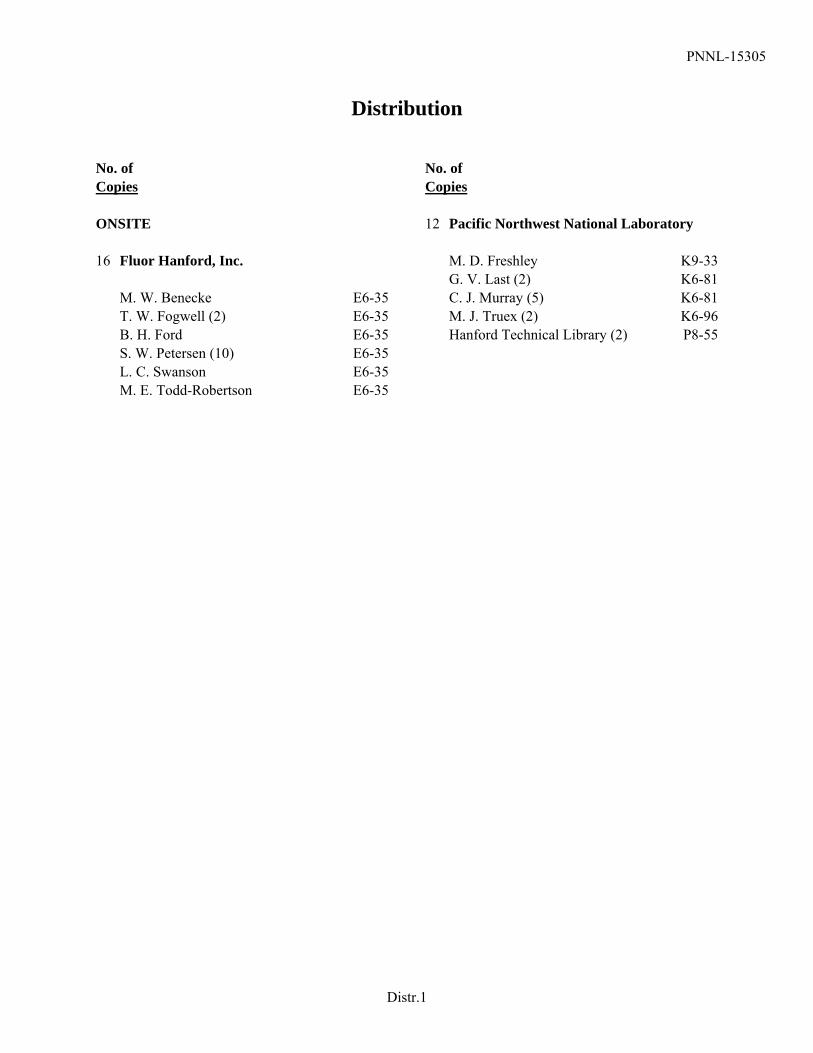
Distribution No. of Copies ONSITE 16 Fluor Hanford, Inc. M. W. Benecke E6-35 T. W. Fogwell (2) E6-35 B. H. Ford E6-35 S. W. Petersen (10) E6-35 L. C. Swanson E6-35 M. E. Todd-Robertson E6-35
No. of Copies 12 Pacific Northwest National Laboratory M. D. Freshley K9-33 G. V. Last (2) K6-81 C. J. Murray (5) K6-81 M. J. Truex (2) K6-96 Hanford Technical Library (2) P8-55