Embed Size (px)
Citation preview
Review of Postal Automation Strategy: ATechnical and Decision Analysis
June 1984
NTIS order #PB85-127843
—--——
Recommended Citation:
Review of Postal Automation Strategy: A Technical and Decision Analysis--A Technical Memorandum (Washington, DC.: U.S. Congress, Office ofTechnology Assessment, OTA-TM-CIT-22, June 1984).
Library of Congress Catalog Card Number 84-601072

—
OTA POSTAL AUTOMATION STAFF
John Andelin, Assistant DirectorOTA Science, Information, and Natural Resources Division
Frederick W. Weingarten, Communications and Information TechnologiesProgram Manager
Project Staff
Fred B. Wood, Project Director
Jean E. Smith, Analyst
Administrative Staff
Liz Emanuel Shirley Gayheart Jennifer Nelson Renee Lloyd
Contractors
Friendship Engineering CompanyWilliam P. Gingras, Principal Investigator
Decision Science Consortium, Inc.Jacob W. Ulvila, Principal Investigator

* .*
OTA POSTAL AUTOMATION WORKSHOP PARTICIPANTS
March 5, 1984
Robert BuzardElectroCom Automation Inc.
Larry S. DavisUniversity of Maryland
Harry A. DornELSAG Inc. (U. S.)
William FergusonPostal Rate Commission
William GingrasFriendship Engineering Company
Dana GrubbNational Bureau of Standards
Jacob RabinowNational Bureau of Standards
Louis RubinfieldSDC-Burroughs
Israel SheinbergRecognition Equipment, Inc.
Richard A. StotlerSDC-Burroughs
Robert TracyPitney Bowes
Jacob W. UlvilaDecision Science Consortium, Inc.
Art Hamburgen u. s.IBM (Rochester)
M. Wayne HollandShell Oil Company
u. s.Charles W. HulburtSRI International
Lloyd KrauseConsultant
Jerry W. LoftusBell & Howell
Jeryl MumpowerNational Science Foundation
Robert P. OttenThe Reader's Digest
James E. PehtaList Processing Company
Matthias PrasserAEG Telefunken
General Accounting OfficeWillis ElmoreRobert E. PriceRobert Hadley
Postal ServiceJames V. JellisonLynn A. KiddHarold GlassRobert KrauseRay MorganBill ChappNick Barranca
.
CONTENTS
Page
Foreword •••.••.••.•••.••.•.•..••..•......•.•..••.•.••.•.•••.....•.......... 1
Overview ................................................................... 2
Su m mary .•••••.••.•••.•.••••••.••.•...•••••••••••••••••.••••...•........... 6 Sum mary of Technical Analysis •.•••••••.•••••••.•••••.••••............... 6 Sum mary of Decision Analysis ••••••••••••••••••••• = • = ••• = • • • • • • • • • • • • • • •• 8
Technical Analysis ....•...•.••••.••••••••.••••••.••••••••.•.•.....•••....... Alternatives to Optical Character Recognition •••••••.•.•.•..•..•••...•... Alternatives to a 9-Digit Zip Code .••.•••.••••••••••••.•.•...••....•..... Performance of Single-line Optical Character Readers (OCRs) .............. . Performance of Bar Code Sorters •••••.•••••••••••••••••••••.•••........• Performance of Multi-line OCRs .••..•••••••••••••••••••••••..••......... Feasibili ty of Local and National Directories ••••••••••••••••••••.••....... Feasibility of Single-line to Multi-line Conversion •••••••.•••.•••••.•....•.. Technical qpportunities for Improved Performance ••••••.•.•..•••••...•...•
Decision Analysis .••••.••.•••••..••....•......•••••••••••••.•••••..••.••••.• Introduction Description of Decision Options .•.••••.••••.••.••.•.•...••.••••••.•.•.•• Discussion of Key Assumptions ..•.•.••••••••••••..••.•••••...••.•.••••.. Discussi on of Key Uncertainties ••.••.•••.••.•..•••••.••.••.••••••..••... Results of Decision Analysis .••.•••...•••.•••.••••..•.•.••.•..••........
13 13 15 16 18 18 22 25 27
33 33 34 36 41 51
Appendix A: Modeling Methodology ..•.•...•.••...•••••..•.••.....•.......•... 59
Appendix 8: Detailed Cash Flow Models and Results 67
Selected References 98

Table No.
LIST OF FIGURES
Page
1.2.3.4.5.6.7.8.9.10.
11.
12.
13.
14.
15.
16.
17.
Illustrative Optical Character Reader (OCR) Performance Data . * . * .**.**.*, 16aProductivity of Single- and Multi-Line Optical Character Readers , . . . . . . . .0 . 2 laSummary of USPS Equipment Upgrades ● ***O*********.****************.**. 3 laDecision Options . . * . . . . . . * * 0 * * * * . * * * * * * * * * . * * * * e * * * * * * * * * * 0 * * * * * * * * 0 * * 34aUncertainties Included in Analysis of Decision Options ● * * * * * 0 * 0 * * . *.*.....* 41aComparison of Code Usages ..*. .*. =**. *.*. *.. **** . * * * e * * * * * * * * *.***..** 42aGrowth in ZIP+4 Usage Rate . * . . . . . * . . . . . . . * . * . * * * . . . . * . . . * . * . . ***..*..* 43aEstimates of 1989 Clerk/Carrier Savings ... .*. .. ***********O.***********. 44aUsage Savings Factors . . . . . . . . . . . . . . . . . . . . . . . . . . . . . . . . . . . . . . . . . . . . . . . . . 46aEstimated Percentage Rates of Return for Decision Options
Under Various Conditions . ..*.*.**.*..*.****.*.*******.****.***.**. 52aEstimated Net Present Values (in billions of dollars) for
Decision Options Under Various Conditions . ****...*..*..************ 53aComparison of Net Present Values (in percentages and
billions of dollars) of Options D, G, and H with Option A . . . . . . . . . . . . . . .54aEighty Percent Intervals on Net Present Value (Overall and
Conditional) *0** **** **0* ***. .**. *.** ***. ..*. ..*. *.. ******0*****.* 54bCumulative Probability Distributions of Net Present Value
(Smoothed) 0*** ***. .*** **** **. *..0 .0. .**O*O* e*** *.. .e. *****.*0.* 56aSensitivity of net Present Value to Multi-Line OCR
Purchase Cost.
0*** **** 0*. **** .*. ... .0. **** .*. .**. . * * * e * . ******..* 56bComparative Net Cash Flows, Selected Options and Conditions,
1985-1998 (in billions of dollars) . . . * . * . . . . . . . ** . . . ****** .* . . ** . . . ** . 57aComparative Net Cash Flows, Selected Options, Conditions,
and Years (in $ billions) .*. *.. *.*. .*. ..*. **** **. *e*. *e. **e* e* **e.** 57b
A-1. Probabilistic Cash Flow Model ● ***. m*** .*** 0 **0****..*.*......*********** 60A-2. Simplified Representation of Continuous Probability
Distribution ... ... .*. *.. ..o.O. **. **** . . . . . . . . . . . . . . . . . . . . . . . . . . . . . 61A-3 through A-7. Simplified Schematic Model for Options A
through E ... .**. .* .**....*....*.*.**..*.*.***.*.*****.*****.*****.* 62-66
B-1 through B-4. Cash Flow Results for Options A through D . . . . . . . . . . . . . . ....68-71
LIST OF TABLES
B-1 through B-19. Detailed Cash Flow Results ... ... ... ..o. ... ... ... ..abo e . . . 72-97
Foreword
This OTA Technical Memorandum on postal automation responds to an October 5,1983, letter of request from Congressman William D. Ford, Chairman of the HouseCommittee on Post Office and Civil Service, Congressman Robert Garcia, Chairman ofthe Subcommittee on Postal Operations and Services, and Congressman Mickey Leland,Chairman of the Subcommittee on Postal Personnel and Modernization.
The Committee asked OTA to review the United States Postal Service (USPS)decision to utilize single-line optical character readers (OCRs) instead of multi-lineOCRs, and to conduct a comparative technical and economic analysis of the twotechnologies in the context of the overall postal automation program. OTA did notassess the impacts of postal automation in other areas such as labor force requirements,mail processing organization, and privacy and security of the mail.
The Senate Committee on Governmental Affairs, Subcommittee on Civil Service,Post Office, and General Services, has also expressed an interest in this subject.
[n preparing this memorandum, OTA has drawn on information and analyses from avariety of sources, including the October 1982 OTA report on Implications of ElectronicMail and Message Systems for the U.S. Postal Service. USPS has provided extensivematerials on prior USPS automation studies as well as current operational data. TheGeneral Accounting Office has provided useful perspectives and analyses based on priorwork and on a directly related study conducted in parallel with OTA’s. On March 5, 1984,OTA held a postal - automation ‘workshop attended by mailers, manufacturers, andresearchers who, along with USPS and GAO, participated in a vigorous discussion of keyissues. Finally, OTA has benefited greatly from the excellent work of two OTAcontractors -- Friendship Engineering Company for technical analysis and DecisionScience Consortium, Inc. for decision and economic analysis.
OTA appreciates the participation of those who helped bring this study to fruition.The memorandum is, however, solely the responsibility of OTA, not of those who so ablyadvised and assisted in its preparation. Also, the purpose of this memorandum is toprovide analysis and evaluation of options available to Congress and USPS, not to makerecommendations as to which option(s) should be implemented.

Overview
The United States Postal Service (USPS) is in the midst of implementing a majorpostal automation program. This program includes acquisition of a large number ofoptical character readers (OCRs) and bar code sorters (BCSs) along with adoption Of theextended 9-digit ZIP code (known as ZIP + 4).
This postal automation program is intended primarily to reduce the amount of laborrequired to process mail, and secondarily to improve the quality of mail service. Sincelabor accounts for about 85 percent of total postal costs, reductions in the laborcomponent of mail processing offer the greatest potential to cut current postal costs andrestrain future cost increases.
USPS has already developed a national ZIP+4 directory, and since October 1, 1983,has been encouraging business mailers to use ZIP+4. Mailers receive a discount of 0.5cent per piece of ZIP+4 presort first class mail when OCR-readable (can be read byoptical character readers) and mailed in batches of 500 or more letters. For ZIP+4non-presort first class mail, mailers receive a discount of 0.9 cent per piece, whenOCR-readable and mailed in batches of at least 250 letters. Use of ZIP+4 is voluntary.At present, very few mailers (59 as of late May 1984) have converted to ZIP+4.
Use of ZIP+4 allows USPS to sort letters down to the city block, building, or postoffice box, whereas the 5-digit zip code permits sorting only to the level of a smallerpost office zone or a geographical area within a larger post office zone. The opticalcharacter readers are intended to read the ZIP+4 code, translate it into a bar code, andapply the bar code (with an ink jet printer) to the lower right-hand corner of theenvelope. From then on, the letter can be sorted automatically by barcode sorters downto the level of carrier routes. All intermediate manual sorting is eliminated.
To carry out the automated sorting, USPS has already bought 252 OCRs and248 BCSs (Phase I of the automation procurement) at a combined cost (including ancillaryequipment and installation expense) of $234 million. USPS expects this equipment to befully installed and operational by the end of 1984. And USPS has received bids onprocurement of an additional 403 OCRs and soon will be soliciting bids on an additional452 BCSs (Phase II of the automation procurement). USPS has allocated $450.2 millionfor this procurement, of which $363 million is for capital expenditure.
The central issue addressed by this OTA technical memorandum is whether thecurrent USPS automation strategy is technically and economically sound, and whetherUSPS should proceed to actual procurement of this equipment as planned or revise itsstrategy in whole or in part.
OTA concluded that the current postal automation strategy, while technicallyfeasible, is not likely to achieve the greatest projected economic return to USPS whenthe uncertainty in ZIP+4 usage is taken into account.
USPS has based their “strategy on achieving 90 percent ZIP+4 usage (among largebusiness mailers) within 5 years, and 27 percent after 1 year. Current estimates indicatethat first year (1984) ZIP+4 usage will fall far short of original USPS projections. Based
2
●
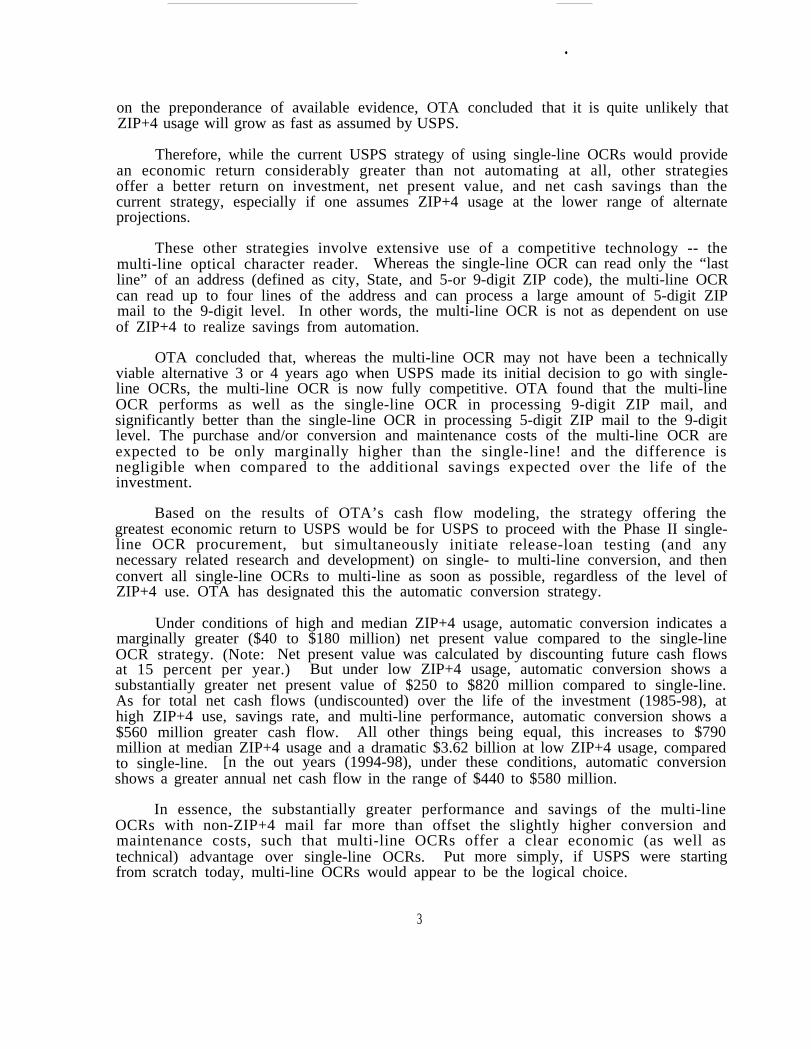
on the preponderance of available evidence, OTA concluded that it is quite unlikely thatZIP+4 usage will grow as fast as assumed by USPS.
Therefore, while the current USPS strategy of using single-line OCRs would providean economic return considerably greater than not automating at all, other strategiesoffer a better return on investment, net present value, and net cash savings than thecurrent strategy, especially if one assumes ZIP+4 usage at the lower range of alternateprojections.
These other strategies involve extensive use of a competitive technology -- themulti-line optical character reader. Whereas the single-line OCR can read only the “lastline” of an address (defined as city, State, and 5-or 9-digit ZIP code), the multi-line OCRcan read up to four lines of the address and can process a large amount of 5-digit ZIPmail to the 9-digit level. In other words, the multi-line OCR is not as dependent on useof ZIP+4 to realize savings from automation.
OTA concluded that, whereas the multi-line OCR may not have been a technicallyviable alternative 3 or 4 years ago when USPS made its initial decision to go with single-line OCRs, the multi-line OCR is now fully competitive. OTA found that the multi-lineOCR performs as well as the single-line OCR in processing 9-digit ZIP mail, andsignificantly better than the single-line OCR in processing 5-digit ZIP mail to the 9-digitlevel. The purchase and/or conversion and maintenance costs of the multi-line OCR areexpected to be only marginally higher than the single-line! and the difference isnegligible when compared to the additional savings expected over the life of theinvestment.
Based on the results of OTA’s cash flow modeling, the strategy offering thegreatest economic return to USPS would be for USPS to proceed with the Phase II single-line OCR procurement, but simultaneously initiate release-loan testing (and anynecessary related research and development) on single- to multi-line conversion, and thenconvert all single-line OCRs to multi-line as soon as possible, regardless of the level ofZIP+4 use. OTA has designated this the automatic conversion strategy.
Under conditions of high and median ZIP+4 usage, automatic conversion indicates amarginally greater ($40 to $180 million) net present value compared to the single-lineOCR strategy. (Note: Net present value was calculated by discounting future cash flowsat 15 percent per year.) But under low ZIP+4 usage, automatic conversion shows asubstantially greater net present value of $250 to $820 million compared to single-line.As for total net cash flows (undiscounted) over the life of the investment (1985-98), athigh ZIP+4 use, savings rate, and multi-line performance, automatic conversion shows a$560 million greater cash flow. All other things being equal, this increases to $790million at median ZIP+4 usage and a dramatic $3.62 billion at low ZIP+4 usage, comparedto single-line. [n the out years (1994-98), under these conditions, automatic conversionshows a greater annual net cash flow in the range of $440 to $580 million.
In essence, the substantially greater performance and savings of the multi-lineOCRs with non-ZIP+4 mail far more than offset the slightly higher conversion andmaintenance costs, such that multi-line OCRs offer a clear economic (as well astechnical) advantage over single-line OCRs. Put more simply, if USPS were startingfrom scratch today, multi-line OCRs would appear to be the logical choice.
3

The automatic conversion strategy assumes that conversion of single-line OCRs tomulti-line capability is technically feasible and legally viable and could be accomplishedwith no degradation in performance. Questions have been raised as to whether thesingle-line OCR vendors would have the ability to do the conversions and/or whetherother vendors -- perhaps more experienced with multi-line OCRs -- would be able to dothe conversions without having access to proprietary information. A possible solutionwould be to reissue the Phase II request for proposals (RFP) with additional criteria onsingle- to multi-line convertibility and/or with a procurement split between single- andmulti-line OCRs.
A split procurement would be intended to provide a stronger push to furtherimprove multi-line OCR performance and perhaps provide a greater incentive forcompetition in the development of both multi-line OCRs and single- to multi-lineconversion kits. OTA found that, overall, a 90-10 split procurement shows the secondhighest projected economic return, only marginally less than automatic conversion buthigher than hedge conversion.
Under the 90-10 split procurement option, USPS would cancel the current Phase 11procurement, immediately reissue an RFP for 90 percent of the single-line OCRs (363instead of 403), and simultaneously initiate release-loan testing of the multi-line OCR.A new RFP for procurement of the other 10 percent of Phase 11 OCRs, but using multi-line technology (40 multi-line OCRs), would be issued as soon as possible, probably inabout 2 years. The single-line OCRs (252 from Phase I and 363 from Phase II) would beconverted to multi-line as soon as a conversion kit has been successfully developed andtested.
The 90-10 option would result in a delay of about 2 to 3 months in procurement ofthe 90 percent Phase 11 single-line OCRs (the time required to reissue the RFP andreceive and evaluate new bids). Procurement of the other 10 percent would be delayedabout 2 to 3 years (the time required to complete release-loan testing of, issue an RFPon, and receive and evaluate bids for multi-line OCRs). OTA found that the cost of thisdelay for 10 percent of the Phase II procurement is very small, and would be negligible ifthe split procurement resulted in significantly higher multi-line OCR performance thanwould otherwise be the case.
In sum, the 90-10 split procurement option is intended to reduce the uncertaintyassociated with automatic conversion by providing a greater incentive to companies tofurther improve multi-line OCR performance and to develop the best possible conversionkits.
OTA is not recommending one option over another, but simply pointing out thetrade-offs involved. The automatic conversion shows the highest projected economicreturn, followed in order by the 90-10 split procurement, hedge conversion, and 50-50split procurement. All of these options depend on conversion kits that provide highmulti-line performance.
The principal question is how to stimulate development of the best possibleconversion kit. OTA believes that some outside competition would help achieve thisobjective, and that it will be necessary to provide incentives to attract the bestcompanies. One incentive is to keep open the decision on which company will do the

conversions pending the results of several competitive development and testing efforts.This means that the best performing company would have a good chance for theconversion contract (estimated at about $130 million). A second incentive is theopportunity for participating companies to use the R&D results on the world market,even if USPS does not buy any multi-line OCRs. A third incentive would be the prospectof competing for the 10 percent of the Phase II procurement reserved for multi-lineOCRs (estimated at $34 million) under a split procurement option.
Thus, a 90-10 split procurement option could involve several elements: reissuingthe Phase II RFP for 363 (rather than 403) single-line OCRs; initiating competitiverelease-loan testing on multi-line OCRs; and awarding several development contracts forconversion kits, either all on a competitive basis or at least one on an open competitivebasis even if the others are awarded sole source to Phase I and Phase II single-line OCRcompanies.
In addition to revising current automation strategy to give greater emphasis tomulti-line OCRs, USPS may also wish to strengthen its commitment to research anddevelopment, which is still well below industry averages, and aggressively pursue furtheropportunities for improved performance of postal automation.

—
Summary
Summary of Technical Analysis
Alternatives to optical character recognition technology. As a starting point, OTAexamined possible alternatives to optical character recognition for postal automationtechnology. Optical character recognition technology reads printed alphanumericcharacters (letters and numbers) and recodes these characters into machine-readableforms such as a bar code.
OTA identified several electronic, magnetic, and mechanical alternatives to opticalcharacter recognition. However, OTA concluded that, at least for the U.S. mail, it is asyet difficult to improve on the information-carrying ability, readability, and costeffectiveness of printed characters on paper. As long as this is the case, then opticalcharacter recognition technology is the technology of choice.
Electronic mail is likely to be the strongest competitor of postal automation. Butthere most likely will be a significant residual volume of paper mail at least through theyear 2000. Thus there is a window of opportunity for further USPS use of paper-basedautomation technology.
Alternatives to a 9-digit ZIP code. OTA found that there are alternative codes.However, OTA concluded that at this juncture there is no realistic alternative. The 5-digit ZIP is almost universally accepted and used (98 percent usage); the 9-digit ZIPdirectory is now completed; and ZIP+4 codes are being distributed to large businessmailers.
If ZIP+4 becomes widely used, USPS could consider adding a tenth digit (for errorchecking purposes) at some future time. (Note: The USPS bar code already includes acorrection character. ) Only if ZIP+4 does not become widely used could alternativecodes realistically be considered.
Performance of single-line optical character readers (OCRs). OTA reviewedavailable data on performance of the single-line OCRs now being installed by USPS.Single-line OCRs read only the last line of an address -- usually containing the city,State, and 5- or 9-digit ZIP code. OTA concluded that, despite initial start-up problems,the already installed OCRs now essentially meet USPS performance specifications.
Performance of multi-line OCRs. Over the last few years, multi-line OCRtechnology has emerged from the laboratory and prototype stage to operational units.Multi-line machines read up to four lines of the address.
OTA concluded that, as of May 1984, the preponderance of evidence indicates thatmulti-line OCR performance is essentially equivalent to single-line for reading 9-digitZIP mail, and that multi-line performance is substantially better for reading 5-digit ZIP
6

. .
mail to the 9-digit level. * OTA identified one U.S. firm (Recognition Equipment, Inc.)and two foreign firms (Telefunken of Germany, ELSAG of Italy) that have proven multi-line OCRs.
OTA also concluded that USPS has probably underestimated the ultimateoperational performance level of multi-line OCRs by 5 to 15 percent. USPS estimatedthat multi-line OCRs would process 60 percent of 5-digit mail to the 9-digit level. OTAbelieves that 65 percent is more likely and 75 percent possible.
Feasibility of local and national directories. In order to read, code, and sort S-digitZIP mail to the 9-digit level, multi-line OCRs require a computerized address directoryagainst which the address information can be compared to ascertain the correct 9-digitZIP code. They then apply the corresponding barcode, and finally sort the letter.
Until recently, the absence of a local or national directory was a limiting factor foruse of multi-line OCRs. However, in the 1981-83 period, USPS completed a nationalZIP+4 directory and local ZIP+4 directories for major metropolitan areas. USPS and OTAagree that the conversion of existing local ZIP+4 directories to a multi-line OCR formatis technically feasible.
Whereas local directories clearly would be necessary for multi-line OCR operation,OTA was not able to determine whether national directories would offer any significantadvantage, particularly when compared to the technical difficulties and likely additionalcost.
Feasibility of single-line to multi-line conversion. OTA reviewed the technicalfeasibility and cost of converting single-line OCRs to multi-line. OTA concluded thatconversion would be technically feasible and the USPS estimate of conversion cost --$200,000 per machine -- is as good as can be developed from available information.
The actual cost of single- to multi-line OCR upgrade can only be determined bydetailed engineering analysis and competitive procurement process. It impossible thatthe conversion could be accomplished by an OCR manufacturer other than the originalsource, although this might require a high degree of technical cooperation between thetwo vendors.
Technical opportunities for improved performance. OTA identified several areaswhere technical performance of postal automation might be improved in the future.These include bar-coded reply envelopes, mailer printing of bar codes, improvements inperformance of optical character readers, standards for address format, and increasedresearch and development on postal automation.
* The full address with 5-digit ZIP is read and compared against a computerizedaddress directory that includes 9-digit ZIP codes. If a match is made between theaddress on the envelope and an address in the directory, the appropriate 9-digitcode is applied.
7

●✎
The USPS record on postal automation R&D is mixed. USPS continues tounderspend on R&D compared to the U.S. industry average, and postal R&D organizationand management appear to have lacked stability, clear direction and, at times, top levelcommitment. Despite 20 years of USPS investment in optical character recognitionR&D, when USPS solicited manufacturers in 1980 for single-line OCRs, all U.S.manufacturers previously receiving USPS support for single-line OCR R&D hadwithdrawn from the market, in part due to several years of USPS indecision on anautomation strategy.
On the other hand, USPS has established a good track record in narrowly focused R&D on improvements to upgrade existing equipment, such as the multi-position lettersorting machine. Also, despite some variability in funding and commitment, USPS hasprovided enough support over the last 14 years to Recognition Equipment, Inc. (REI) suchthat REI has developed one of the leading multi-line OCRs on the world market.
Summary of Decision Analysis
USPS faces a decision point as to whether to continue its commitment to ZIP+4 andsingle-line OCR technology or to modify that commitment in some way.
OTA employed decision analysis techniques to: identify the range of optionsavailable to USPS; develop a probabilistic cash flow model of each option; assignprobability distributions for key variables such as ZIP+4 usage and multi-line OCRperformance; and calculate the rate of return (ROI), net present value (NPV), total netcash flow, and annual net cash flow for each option; and conduct sensitivity tests of theresults to changes in key variables.
Description of decision options.
o Option A: Phase II single-line OCR is the current USPS strategy to proceedto procurement of the 403 additional single-line OCRs advertised for Phase 11of the postal automation program, and on which bids have already beenreceived. Under option A, there would be no further USPS expenditure onmulti-line OCR research, development, and testing.
o Option B: Multi-line OCR with ZIP+4 is a decision to cancel the currentPhase 11 single-line OCR procurement, initiate release-loan testing ofmulti-line OCRs, and as soon as possible reissue the Phase [1 request forproposals but for multi-line rather than single-line OCRs, meanwhileretaining the ZIP+4 code. Single-line OCRs already purchased would beconverted to multi-line capability.
* OTA did not analyze the option of procuring 403 additional Phase I single-lineOCRs instead of Phase II OCRs. This option was judged to be not significantlydifferent from option A.
** The release-loan testing manufacturers actually test prototype equipment on USPSpremises with real mail.
8

o Option C: Multi-line OCR without ZIP+4 is the same as option B except thatthe ZIP+4 code would be terminated. The 5-digit ZIP code would be retained.
o Option D: Automatic conversion is to proceed with the Phase 11 single-lineOCR procurement, but simultaneously initiate release-loan testing (and anynecessary related R&D) on single-line to multi-line conversion and thenconvert all single-line OCRs as soon as possible, regardless of the level ofZIP+4 use.
o Option E: Hedge conversion is similar to option D except that the single- tomulti-line conversion would take place only if ZIP+4 use is low at a specifiedfuture time (defined here as year-end 1987). Both options D and E include thesame initial decision to purchase Phase II single-line OCRs, and to initiaterelease-loan testing of and any necessary research on conversion. Thedifference is that under option D, the conversion would be made regardless ofthe level of ZIP+4 use, while under option E, conversion would take place onlyif use is low.
o Option F: Cancel Phase II and ZIP+4 is to cancel the Phase II single-line OCRprocurement, terminate ZIP+4, and use the single-line OCRs alreadypurchased to process 5-digit ZIP mail.
o Option G: 50-50 Split procurement is a hybrid option that would cancel thePhase II procurement, immediately reissue an RFP for one-half the number ofsingle-line OCRs (202 instead of 403), and simultaneously initiate release-loantesting of the multi-line OCR and single- to multi-line conversion. A newRFP for procurement of the other half of the OCRs but using multi-linetechnology (201 multi-line OCRs) would be issued as soon as possible,probably in about 2 years, at which time the then existing single-line OCRs(252 from Phase I and 202 from Phase II) would be converted to multi-line.
o Option H: 90-10 Split Procurement is similar to option G except that thePhase 11 RFP would be reissued for 90 percent of the single-line OCRs (363),rather than 50 percent, and release-loan testing would be initiated on multi-line OCRs leading to a new RFP for procurement of the other 10 percent ofthe OCRs (40) using multi-line technology.
Key assumptions. Where possible and justifiable, OTA used the same assumptionsas did USPS. For example, OTA and USPS used the same time horizon (14 years, 1985-98), labor cost escalation rate (7.42 percent annually), baseline cost and savingsprojections (for single-line OCRs, as presented in January 1984 to the Board ofGovernors), discount rate (15 percent per year), and single-line OCR performance andcost. OTA assumptions about multi-line OCR cost ($850,000 per machine), single- tomulti-line conversion cost ($200! 000 per machine), and the time required to release-loantest and procure multi-line OCRs and conversion kits (3 years) were generally consistentwith USPS and GAO estimates.

● ✎
The major differences between USPS and OTA were assumptions about theincentive rates for ZIP+4 usage (OTA and GAO treated these as a cost, since incentivesappear to be required to get large mailers to use ZIP+4), multi-line OCR performancerates (OTA and GAO concluded that performance would likely be somewhat better thanUSPS estimated), ZIP+4 usage, and clerk/carrier savings rate.
For the latter three variables, OTA developed low, median, and high estimates.For low, median, and high estimates of multi-line OCR performance. OTA concluded thatproduction model multi-line OCRs would read 60, 65. and 75 percent of 5-digit mail tothe 9-digit level, respectively.
For ZIP+4 usage, USPS projects that usage would reach 90 percent of themachinable metered first class mail base within 5 years. This is considerably moreoptimistic than actual experience with either the U.S. 5-digit ZIP code or the Canadian6-digit postal code. The 5-digit ZIP took 12 years to reach 90 percent usage; after 5years, the 5-digit usage level was about 51 percent. Thus, the USPS projection showsZIP+4 reaching 90 percent about two and one-half times as fast as the 5-digit ZIP (in 5years rather than 12). At present, the projected actual volume of ZIP+4 mail for 1984 isabout 20 percent of the original USPS projection.
After reviewing all available evidence, OTA concluded that the USPS ZIP+4projection should be considered optimistic (high), that an appropriate median estimatewould be the 5-digit ZIP growth pattern, and that an appropriate pessimistic (low)estimate would be a growth pattern peaking out at about 40 percent ZIP+4 usage. At thepresent time, the first year ZIP+4 usage could turn out to be even more pessimistic. Theestimated 2.73 billion pieces of ZIP+4 first class mail at year end 1984 represents about5.4 percent of the target mail base as compared to about 7 percent under the lowscenario, 13 percent under the median, and 28 percent under the optimistic scenario.(GAO made no estimate of ZIP+4 usage but did find that businesses are still concernedabout the cost of converting and whether the USPS presort discount will be modifiedbecause of ZIP+4.)
For clerk/carrier labor savings, OTA concluded that the USPS baseline estimatewas probably somewhat optimistic, since the quality and mix of the OCR processed mailmay be less than anticipated, and labor costs (e.g., for maintenance) may be more thanexpected. OTA assumed high, median, and low labor savings rates of 100 percent, 90percent, and 80 percent of the USPS estimate.
Results of decision analysis. With respect to internal rates of return (ROIs), everyoption except option F (cancel), under all conditions modeled, shows an ROI above the 15percent threshold established by USPS. OTA assumed, therefore, that under anyscenario, the Phase I single-line OCRs already purchased would be kept in service. AllROIs, net present values, and cash flows were calculated net of cash flows associatedwith the Phase I single-line OCRs. Use of ROIs for decision making has a seriouslimitation. When more than one option clears the hurdle rate (that is, has more than theminimum required ROI, in this case 15 percent), the ROI itself gives no indication of thecash flow differences of the various options as a basis for comparing the options. Analternative to ROI frequently used in capital investment decision making is net presentvalue (NPV). NPV discounts the cash flows of each option at the hurdle or threshold rate,in this study 15 percent.
10

—— ——
Under conditions of high savings and high multi-line performance, option D(automatic conversion) has about a 5 percent and 11 percent higher NPV with high andmedian ZIP+ 4 usage, respectively, than option A (single-line OCR). At low ZIP+4 usage,all other things being equal, the option D advantage increases to a substantial 134percent or about $820 million in NPV. At a low savings rate (along with low ZIP+4 usageand high multi-line performance), the relative advantage of option D over A increasesfurther to about 310 percent although the absolute advantage decreases to about $650million in NPV. Even at low multi-line performance, option D has 53 to 119 percentrelative advantage in NPV and a $320 to $250 million absolute advantage in NPV, at ahigh and low savings rate, respectively. Option E (hedge conversion) has the same NPVas option A at high or median ZIP+4 usage and the same NPV as option D at low ZIP+4usage.
Option H (90-10 split procurement) also has a higher NPV than option A underalmost all conditions. Option G (50-50 split procurement) has a significant althoughsomewhat smaller advantage over option A at low ZIP+4 usage. Option G has a 34 to 271percent relative advantage in NPV and a $170 to $710 million absolute advantage in NPVat low ZIP+4 usage, depending on the multi-line OCR performance rate and savings rate.
The ranking of the options by NPV is summarized below:
Overall NPV Rank Low ZIP+4 Use NPV Rank
Option D 1 highest Option D 1 highestH 2 E 2 (tie)E 3 H 3G 4 c 4A 5 G 5B 6 B 6c 7 lowest A 7 lowest
OTA found that the NPV results are not very sensitive to the purchase price of themulti-line OCR or the number of multi-line OCR units. An increase in the purchaseprice from $850,000 to $970,000 or an increase in the number of units from 403 to 444 (asestimated by GAO to be required if the entire Phase [1 procurement was switched fromsingle- to multi-line OCRs) would reduce NPV by about $20 to $30 million.
Net present value appears to be the best basis for comparative quantitativeevaluation of the decision options. However, the actual undiscounted net cash flows overthe 13 year payback period (1985-1998) can provide another dimension to theevaluation. Option A (single-line) is estimated to show positive cash flows of $8.8, $8.24,and $3.57 billion at high, medium, and low ZIP+4 usage. At high ZIP+4 usage, option B(multi-line with ZIP+4) is somewhat lower at $8.14 billion, options D (automaticconversion) and H (90-10 split procurement) somewhat higher at $9.36 billion and $9.24billion respectively, and option G (50-50 split procurement) about the same at $8.75billion. The comparisons between options change relatively little at median ZIP+4 usage.
However, at low ZIP+4 usage there is a substantial difference in net cash flows.Option A(single-line) shows a net cash flow of $3.57 billion. But, depending on themulti-line OCR performance rate, options D (automatic conversion) and H (90-10 split
11

. .,
procurement) show a net cash flow of $5 to $7.2 billion, or about $1.4 to $3.6 billiongreater than option A. Option G (50-50 split procurement) shows about $1.1 to $3.3billion greater cash flow than option A, and option B (multi-line with ZIP+4) shows about$0.8 to $3.0 billion greater cash flow than option A.
A comparison of yearly cash flows gives similar results. By 1994, all equipmentwill presumably have been installed (or converted) and up and running at optimalperformance. Options B, D, G. and H will by that time look exactly the same -- ailmulti-line OCRs. The single-line OCRs procured under options D, G, and H will havebeen converted to multi-line capability. Option A will continue to be solely single-lineOCRs.
With high ZIP+4 usage, option A shows an annual net cash flow of about $870million to $1.2 billion from 1994 to 1998. Options B, D, G, and H show almost identicalannual cash flows, only slightly higher by about $70 to $100 million per year. However,at low ZIP+4 usage, the differences again become substantial. With high multi-lineperformance, options B, D, G, and H show between $440 and $580 million per yearadditional net cash flow compared to option A, from 1984 to 1998. With median multi-line performance, the advantage of options B, D, G, and H over A ranges from $370 to$490 million per year. And even at low multi-line performance, the advantage overoption A, while reduced, is still significant at $180 to $240 million per year.
12

.,
Technical Analysis
Alternatives to Optical Character Recognition
As a starting point, OTA examined possible alternatives to optical character
recognition technology for postal automation.
OTA concluded that the strongest competition to postal automation is likely to
come from electronic mail. If a significant portion of the paper-based mainstream were
to divert to either Generation II (electronic input-hardcopy output) or Generation [11
(electronic input and output)
recognition technology would
electronic mail and message
assumptions about growth of
electronic mail, then the need for optical character
be reduced. However, in a previous (1982) study of
systems, OTA found that, even under very optimistic
electronic mail, there most likely will be a significant
residual volume of paper mail at least through the year 2000.
Therefore, while electronic mail is a strong competitor of postal automation, the
major effects of electronic competition are likely to be delayed for at least 10 to 15
years. From this vantage point, there is a window of
paper-based automation technology.
Some leaders in the optical character recognition
“the current information revolution promises to replace
opportunity for further use of
industry already recognize that
the traditional media on which
information has been carried (paper) with electronic media.... Thus, OCR provides a
bridge between the Paper Age and. the [formation Age. It is a transitional system which
aids users who have one foot in each era. But as the (electronic) Information Age
matures, the role of OCR promises to diminish.... The irony is that OCR will be faced
with increased opportunities before the electronic axe falls” (Schantz, 1983, p.?).
13
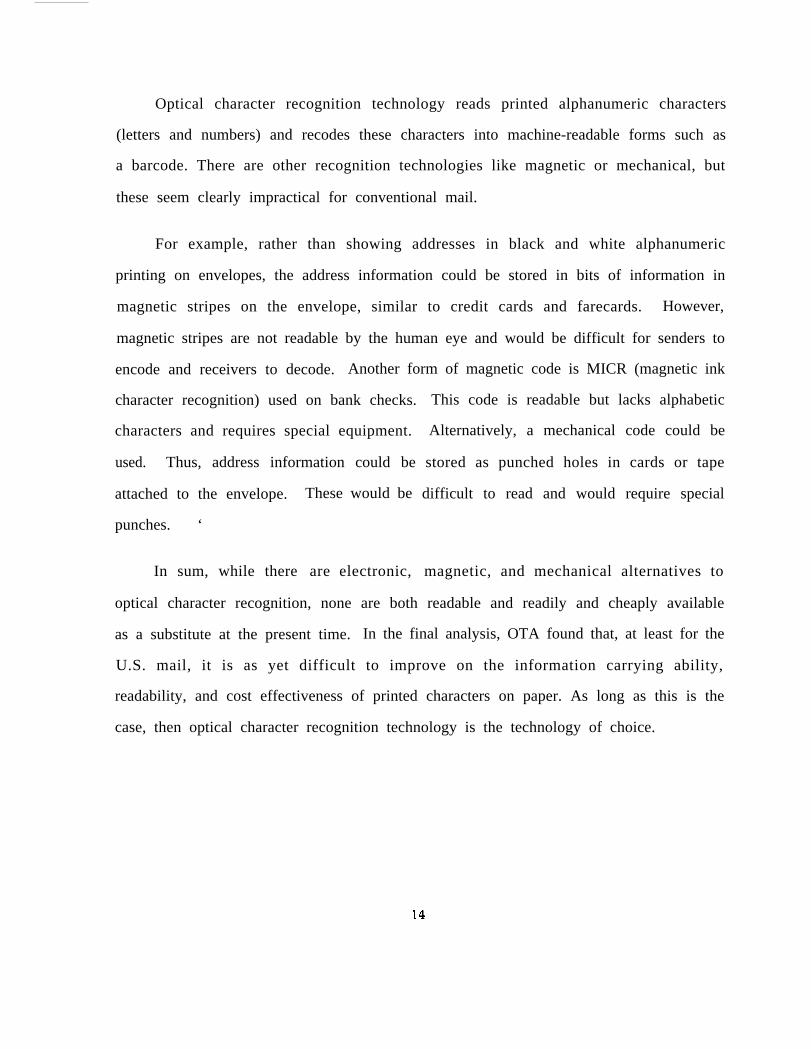
Optical character recognition technology reads printed alphanumeric characters
(letters and numbers) and recodes these characters into machine-readable forms such as
a barcode. There are other recognition technologies like magnetic or mechanical, but
these seem clearly impractical for conventional mail.
For example, rather than showing addresses in black and white alphanumeric
printing on envelopes, the address information could be stored in bits of information in
magnetic stripes on the envelope, similar to credit cards and farecards. However,
magnetic stripes are not readable by the human eye and would be difficult for senders to
encode and receivers to decode. Another form of magnetic code is MICR (magnetic ink
character recognition) used on bank checks.
characters and requires special equipment.
used. Thus, address information could be
attached to the envelope.
punches. ‘
In sum, while there
These would be
are electronic,
This code is readable but lacks alphabetic
Alternatively, a mechanical code could be
stored as punched holes in cards or tape
difficult to read and would require special
magnetic, and mechanical alternatives to
optical character recognition, none are both readable and readily and cheaply available
as a substitute at the present time. In the final analysis, OTA found that, at least for the
U.S. mail, it is as yet difficult to improve on the information carrying ability,
readability, and cost effectiveness of printed characters on paper. As long as this is the
case, then optical character recognition technology is the technology of choice.
.
Alternatives to a 9-Digit ZIP Code
—
OTA also examined whether there are viable alternatives to the 9-digit ZIP or
ZIP+4 code.
OTA concluded that there are alternative codes. and, indeed, some are used today
by other countries. For example, both Canada and Britain use alphanumeric zip codes,
that is, a combination of letters and numbers. Other code schemes have been suggested,
for example, using individual telephone numbers as zip codes. Telephone numbers would
permit sorting down to the level of each individual street address.
In 1976, USPS considered a wide range of alternative ZIP schemes, including
scrapping the 5-digit ZIP, using an alphanumeric code, and adding a check digit (e.g., a
tenth digit to the 9-digit code). USPS ruled out any change in the basic 5-digit ZIP, since
almost all mail (about 94 percent as of 1976) used a ZIP code. A change in the 5-digit
code was judged by USPS to be unfair and excessively burdensome to mailers. This left
the alternative of adding 3, 4 or 5 digits to the existing 5-digit codes. USPS elected to
add 4 digits. Three was ruled out since this would have required an alpha or
alphanumeric add-on. Five was likewise ruled out, since the additional digit, while
helping to detect code errors and preventing letters from sorting to the wrong
destination, would have increased mailing list information and maintenance cost. (The
USPS barcode does contain a correction character.)
At the March 5 OTA workshop, several participants expressed the view that the
current 9-digit ZIP was not the best code, but that it was too late to make any major
changes. The 5-digit ZIP is almost universally accepted and used (98 percent usage) and
the 9-digit ZIP directory is now completed. ZIP+4 codes are being distributed to and
beginning to be used by large business mailers.
15

——-——.
At this juncture, OTA concluded that there is no realistic alternative. If the ZIP+4
becomes widely used, USPS could consider adding a tenth digit (for error checking
purposes) at some future time. If ZIP+4 does not become widely used, alternative codes
could be considered.
.
Performance of Single-line Optical Character Readers (OCRs)
OTA reviewed available data on performance of the single-line OCRs now being
installed by USPS. Single-line OCRs read only the last line of an address -- usually
containing the city, State, and 5-or 9-digit ZIP code.
[n the 1976-80 period, when the basic USPS automation program was developed, the
single-line optical character reader was, in the opinion of USPS, the only proven
equipment. Even so, in 1980 when USPS issued specifications for single-line OCRs, no
U.S. manufacturer had OCRs meeting USPS specifications. As a result, and to meet
USPS domestic content requirements, four foreign companies teamed with U.S.
manufacturers who were licensed to produce single-line OCRs.
Two U.S. OCR manufacturers (under foreign license) were selected -- Burroughs
(under license to NEC) and Pitney Bowes (under license to
code sorter (BCS) manufacturer, Bell and Howell.
Both OCR manufacturers experienced start-up
performance specifications. However, based on review of
ELSAG) -- along with one bar
problems in meeting USPS
current performance data and
on-site inspection, OTA concluded
USPS performance specifications.
figure 1.
that the already installed OCRs now
[illustrative OCR performance data
essentially meet
are presented in
16

——
Figure 1
Illustrative Optical Character Reader (OCR) Performance Data
Burroughs/NEC
Actual Test Results
Meter Belt MailManaged Mail
Performance Specs
Meter Belt MailManaged Mail
Actual Test Results
Meter Belt MailManaged Mail
Performance Specs
Meter Belt MailManaged Mail
Accept Throughput ErrorRate Rate Rate
80.0% 28,500 pieces/hour 1.50%60.0% 31,300 pieces/hour 2.40%
62.1% 28,908 pieces/hour53.4% 30,083 pieces/hour
Pitney Bowes/ELSAG
Accept ThroughputRate Rate
72.0% 28,500 pieces/hour62.0% 30,500 pieces/hour
67.1% 26,224 pieces/hour57.8% 26,730 pieces/hour
2.37%2.00%
ErrorRate
1.10%1.10%
1.50%1.50%
Definitions:
Accept Rate Percent of letters read by the OCR as a portion ofthe total fed into the OCR.
Throughput Total mail pieces fed through the OCR per hour.
Error Rate Percent of letters sent to the wrong pocket.
Meter Belt Mail - High quality, generally OCR readable mail- fromlarge mailers.
Managed Mail - Mail from other Post Offices containing widelyvariable levels of OCR readable mail.
Source: United States Postal Service: August 1983 2-week tests.
16a
—-— —-——.—.—— —
The 252 OCRs already purchased by USPS averaged $645,000 per unit in capital
cost, although the Burroughs price was apparently significantly lower (approximately
$300,000 per unit) than the Pitney Bowes price.
These
recognition
acceptance
USPS), and
significant
prices include all OCR equipment (e.g., mail transport, optical character
unit, computer directory, ink jet printer, sorting stackers) plus installation,
(equipment must perform to USPS specifications prior to acceptance by
2 years worth of spare parts. There is no obvious explanation for the
price difference between Burroughs and Pitney Bowes, since both
manufacturers bid on the same number of units meeting the same technical performance
specifications. USPS apparently split the procurement between two vendors in order to
encourage future competition for subsequent procurements, but at an additional cost of
about $37.8 million (126 units
Pitney Bowes and Burroughs).
In the so-called Phase II
OCRs. Competitive bids have
times the estimated $300,000 price differential between
procurement, USPS intends to purchase an additional 403
been solicited from four qualified U.S. manufacturers (all
under license to foreign companies):
U.S. Manufacturers Foreign Licenser
Burroughs NEC (Japan)Pitney Bow-es ELSAG (Italy)Recognition Equipment Inc. Toshiba (Japan)ElectroCom Telefunken (Germany)
USPS has budgeted for a capital cost of $660,000 per unit for
been received by USPS, but a selection decision and contract
before late June 1984..
the 403 OCRs. Bids have
award(s) will not be made

Performance of Bar Code Sorters (BCSs)
Performance of the BCSs has not been in dispute. USPS has already procured 248
units from Bell and Howell at a capital cost of approximately $129,000 each. The BCSs
sort 24,000 to 28,000 letters per hour depending on the type of sort, with an accept rate
of 96 percent. USPS plans to procure an additional 452 BCSs as part of the Phase II
procurement, and has budgeted approximately
agreements with five BCS manufacturers to
summer of 1984. The manufacturers are:
$154,000 per unit. USPS has signed
conduct release-loan tests during the
Bell and Howell (U. S.)Hotchkiss-Brandt Sogeme (France)
USPS will require that at
manufacture. Therefore, any
Leigh Instruments (Canada)National Presort (U. S.)Telefunken (Germany)
[east 75 percent of the machine cost be of domestic
foreign manufacturer whose equipment tests satisfactorily
will have to license a U.S. company to produce all or most of the machines in order to
qualify for the competitive procurement.
Performance of Multi-Line OCRs
Over the last few years, multi-line OCR technology has emerged from the
laboratory and prototype stage to operational units. OTA examined available research
and data on multi-line OCR performance. The major difference between single- and
multi-line OCRs is that the multi-line machines read up to four lines of the address while
the single-line machines read only the bottom line (with city, state, and ZIP).
18
At present, USPS has no definite plans for use
has largely funded the development of a multi-line
(REI), a U.S. company based in Dallas, Texas. REI
.—
of multi-line OCRs. However, USPS
OCR by Recognition Equipment Inc.
has a proven track record in optical
character recognition technology and is a leading U.S. corporation in high performance
OCRs.
There are a total of five prototype REI multi-line OCRs operating
installations (two in Chicago; one each in New York, Philadelphia, and Dallas)
OCRs are known as RCS/OCR for Read Code Sort/Optical Character Readers.
at pos ta l
The REI
The computer software of the RCS/OCR is programed so that the address search is
“bottom up.” That is, the bottom line containing city, State, and ZIP code (5- or 9-digit)
is read first, followed by
followed by the third (and,
building, etc. The address
the second line containing the street number and name,
if necessary, fourth) line containing company name, office
information on the envelope is compared with information
maintained in a computerized ZIP+4 address directory. Once a match between the
address information on the envelope and in the directory is obtained, a bar code is
applied to the envelope, which from then on is sorted automatically down to the carrier
level. The multi-line provides additional redundancy since, for example, the street
number and name as well as city and State can be cross-checked against the ZIP code.
A direct comparison between single- and multi-line machine performance is
difficult, since the USPS has not subjected both machines to equivalent acceptance
testing on a comparable mail base. REI had proposed comparative testing, but this
suggestion was declined by USPS on the grounds that it would be unfair to other potential
multi-line OCR manufacturers and would violate the ongoing competitive procurement
process for single-line OCRs. USPS also asserts that the REI multi-line OCR did not
19

.
meet USPS performance specifications in 1980, when USPS initially decided to use
single-line OCRs, and that test results on the prototype multi-line OCRs were not
available until April 1983, after USPS had decided to purchase single-line OCRs.
OTA did not itself investigate and has reached no conclusions on the OCR
procurement history. However, OTA did conclude that, as of May 1984, the
preponderance of evidence indicates that multi-line OCR performance is essentially
equivalent to that of single-line OCR performance for processing 9-digit ZIP mail, and
that multi-line performance is substantially better for processing 5-digit ZIP mail to the
9-digit level.
For 9-digit ZIP (ZIP+4) mail, USPS performance data indicate that the Burroughs
and Pitney Bowes single-line OCRs and the REI multi-line OCRs all correctly read, code,
and sort 98 to 99 percent of OCR-readable ZIP+4
analysis, USPS assumes 100 percent correct reading of
mail. For purposes of mail flow
ZIP+4 mail.
For 5-digit ZIP mail, both single-line and multi-line OCRs correctly read, code, and
sort 98 to 99 percent correctly to 5 digits. However, only the multi-line OCR can read,
code, and sort 5-digit ZIP mail to 9 digits.
USPS has estimated that the multi-line OCR can read, code, and sort 60 percent of
5-digit ZIP mail to 9 digits. USPS believes that this 60 percent estimate may be high,
since USPS assumed that the total local metropolitan area would be included in the OCR
computer directory. If the local directory has less than total coverage, the
read-code-sort rate would be reduced. Also, USPS notes that adequate test data are not
available on how the multi-line OCR performs two-stage encoding (e.g., placing a 5-digit
bar code on a non-local letter at an originating post office and subsequently placing the
20
4-digit add-on bar code -- or the entire 9-digit bar code -- on the letter at the
destination post office).
In contrast, OTA has concluded that the 60 percent USPS estimate may be low for
the following reasons. First, full coverage computerized local address directories appear
to be technically and economically feasible. USPS already has partial local directories in “
several metropolitan areas. Second, there is no evidence that two-stage encoding will
pose a significant problem for multi-line OCRs. Reasserts that two-stage encoding can
be accomplished with no significant degradation in performance. Third, it is reasonable
to expect that production model multi-line OCRs would have improved performance
compared to the prototype RSC/OCRs. USPS has found that single-line OCR
performance improved 5 to 10 percent between prototype and production.
With respect to overall
multi-line OCRs are roughly
shown in figure 2.
productivity, USPS has concluded that the single-line and
equal. Average data from USPS performance reports are
In addition to REI, OTA has identified two other companies that manufacture
multi-line OCRs: Telefunken (Germany) and ELSAG (Italy). Japanese firms may have
the capability and interest, judging from their activity in the single-line OCR market.
Other than REI, no U.S. companies are known to currently have multi-line OCR
capability. At one t ime, Control Data Corporation, IBM Corporation, and
Ford-Aerospace (Philco-Ford) all had single-line OCR products, and might have been able
to develop multi-line OCRs, but left the business in the mid-1970’s. Burroughs, Pitney
Bowes, and ElectroCom have acquired single-line OCR capability under licenses to
foreign manufacturers (NEC, ELSAG, and Telefunken, respectively).

Figure 2
Productivity of Single- and Multi-LineOptical Character Readers
Burroughs Single-line OCR 52.8 22,324 8,527
Pitney Bowes Single-line OCR 51.8 19,305 9,127
REI Multi-line OCR 51.3 22.095 10.397
Definitions:
Gross Accept Rate - Pieces of mail accepted by the machine per hourdivided by pieces of mail fed to the machine perhour.
Throughput Pieces of mail fed through the machine per hour.
Productivity Throughput divided by workhours to arrive atpieces of mail processed per work hour.
Source: United States Postal Service
21a
——.—
While it is difficult to extrapolate from foreign experience to U.S. postal needs,
due in part to major differences in the mail make-up and use of postal codes, multi-line
OCRs appear to be performing well in other countries. ELSAG has 20 two-line OCRs
operating in French post offices with an apparently very low error rate (0.1 to 0.5
percent). Telefunken has two- or three-line OCRs operating in Norway, the Netherlands,
and Britain. The British Post Office reports that its one Telefunken three-line OCR is
undergoing a field trial to be completed by December 1984, and is handling United
Kingdom mail at rates between 28,000 and 30,000 letters per hour. Productivity and
error rates are not known.
Feasibility of Local and National Directories
[n order to read, code, and sort 5-digit ZIP mail to the 9-digit level, multi-line
OCRs require a computerized address directory against which the address information
can be compared to ascertain the correct 9-digit ZIP code, then apply the corresponding
bar code, and finally sort the letter.
OTA has reviewed the current state-of-the-art in computerized directories to
determine if such directories for postal purposes are technically and economically
feasible.
Accordingly to USPS, about 40 percent of
a multi-line OCR is to process local mail to
mail is local and 60 percent non-local. [f
the 9-digit level at the originating post
office, a local directory is needed.
non-local) to the 9-digit level at
needed.
If a multi-line OCR is to process all mail (local and
the originating post office, a national directory is
22

—— —
.
Until recently, the absence of a local or national directory was a limiting factor for
use of multi-line OCRs. However, in the 1981-83 period, USPS completed a national
ZIP+4 directory and local ZIP+4 directories for major metropolitan areas. The national
directory is stored on a computer in San Francisco and is essentially the sum of all local
directories.
In the four cities where multi-line OCRs are already operating (Chicago, New York,
Philadelphia, Dallas), the local directories have been partially converted to a format
usable by the multi-line OCRs. For example, the Philadelphia multi-line OCR uses a
converted local ZIP+4 directory containing about 185,000 local ZIP+4 codes covering
more than one-half of the addresses in the Philadelphia metropolitan area.
USPS and OTA agree that the conversion of existing local ZIP+4 directories to a
multi-line OCR format is technically feasible. This would be simply an extension of the
partial conversions already accomplished in the four cities noted above.
Whereas local directories clearly would be necessary for multi-line OCR operation,
OTA was not able to determine whether national directories would offer any significant
advantage. With local directories only, non-local mail would have to be processed by
multi-line OCRs twice, once at the
second time at the destination post
would, in theory, eliminate the need
OCR processing, the ZIP+4 bar coded
originating post office to the 5-digit level and a
office to the 9-digit level. A national directory
for two-stage OCR processing. After the initial
mail could bypass subsequent OCR processing and
be handled entirely by the less expensive bar code sorters.
USPS argues that this would not result in a reduction in the number of OCRs, since
these machines would still be needed for processing outgoing mail at the destination post
23

off ice. In addition, USPS points out that when taken together, local directories in all
major metropolitan areas would amount to a de facto national directory. Local mail
(about 40 percent of the total) would be processed using a local directory in the
originating post office, and non-local mail (the other 60 percent) would be processed
using local directories in the various destination post offices.
Nonetheless, OTA estimated the technical and cost requirements of a national
directory, even though the need for such a directory has not been firmly established.
The memory size of a national directory has been grossly estimated at 20 gigabits
or 20 billion bits. A directory of this size would contain all 20 million ZIP+4 codes plus
address information including street number and address, city, State, and, where
necessary, building floor and suite numbers. The size could be reduced to include only
the most frequently used ZIP+4 codes and related address information. For example, if
15 percent of ZIP+4 codes account for 75 percent of ZIP+4 code use, then a memory size
of 3 billion bits might suffice.
Currently available magnetic disc memory technology can provide a 3 billion bit
capacity at a cost of about $30,000. But the average access time appears to be too
long. Optical disc and magnetic bubble memories have similar limitations. Large
random access memories (RAMs) have fast access times (microseconds as compared to
milliseconds) and may be the best approach. A 3 billion bit directory using 256K RAMs
might cost on the order of $300,000 in 3 years (1987 dollars). If five OCRs shared each
directory, then the cost per OCR would be about $60,000.
[n sum, a national directory would be technically feasible with memory technology
now coming on the market. A full national directory of 20 billion bits of information
.
would be very expensive (about $4 million each in 1987), even if shared among five OCRs
($800,000 per OCR). If the memory size is reduced to 3 billion bits, the cost would be
about $300,000 per memory, or $60,000 per OCR if used on a shared basis (as above).
In contrast, a local directory would require much smaller memory size (e.g., about
72 million bits for the Philadelphia metropolitan area). OTA estimated that the cost of a
typical local directory would be about $20,000 (roughly $300,000 times 72 million/3
billion times a multiplier of 3x). At this low cost, sharing a directory among several
OCRs may not be necessary. But if shared among five OCRs, the cost per OCR would be
further reduced to about $4,000. In all likelihood, the capital cost of local directories
would be small compared to either the total
directory data conversion and maintenance.
cost of multi-line OCRs or to the cost of
Feasibility of Single-line to Multi-line Conversion
OTA reviewed the technical feasibility and cost of converting single-line OCRs to
multi-line. OTA concluded that conversion would be technically feasible and that the
USPS estimate of conversion cost -- $200,000 per machine -- is as good as can be
developed from available information.
Conversion is relatively simple because a large part of the single-line OCR could be
retained almost as is, as discussed below.
Letter sorter -- no change.
Letter transport -- no change. The current mechanical transport is designed to
move faced and bottom justified letters at a constant speed past an OCR window. This
function is common to single- and multi-line OCRs and would not change.
25

. . . . .—
. .
“Prelook” window -- probably no change. The prelook is used to find the address
location, and probably could be used as
Lenses and scanners -- probably
are adequate. Otherwise, the OCR
“prelook") would need to be replaced.
is.
no change if the scan height and pixel resolution
hardware from the lens system back (including
OCR electronics -- probably some change needed to upgrade the image registers,
recognition logic, etc. Since the multi-line OCR must process much more address
information than the single-line OCR, the basic scanning and clocking rates may have to
be increased. If the single-line OCR already
at sufficient speed and resolution, then little
needed -- only a change in computer software
captures three or four lines of the address
or no change in OCR electronics would be
and directory.
Computer software -- change needed to upgrade the software so that multiple
address lines could be
formatted and queued
processed in a “bottom-up” fashion, and the resulting data properly
into the directory.
Computerized directory -- change needed to expand the directory from city, State,
and ZIP+4 to include street number and name and, as appropriate, building floor and
suite.
Ink jet printer and verifier -- probably no change needed with a local directory. [f
a national directory is used, the access and processing time may lengthen to the point
where the ink jet printer and verifier (sprays the bar code on the bottom right-hand edge
of each envelope) would need to be moved farther downstream in the transport path.
26

The actual cost of single- to multi-line OCR upgrade can only be determined by
detailed engineering analysis and a competitive procurement process. It is possible that
the conversion could be accomplished by an OCR manufacturer other than the original
source, although this would require a high degree of technical cooperation between the
two OCR vendors.
Technical Opportunities for Improved Performance
OTA identified several areas where technical performance of postal automation
might be improved in the future. These include bar-coded reply envelopes, mailer
printing of bar codes, character recognition upgrades, address format standards, and
increased postal research and development.
Bar-coded reply envelopes. Mailers-- and especially large business mailers --
already frequently provide reply envelopes to customers, presumably to facilitate .
payment of bills such as those mailed out monthly by utility, telephone, and gas
companies. Preprinting of the bar code along with the return address on the reply
envelope would appear to be cost-effective, and could permit processing of business reply
mail by the less expensive BCSs rather than OCRs.
Some business mailers are already preprinting bar codes. But in order for this to be
successful, the bar codes must be readable by the Bell and Howell barcode sorters. That
is, the color spectrum of the ink and location of the bar code on the envelope must match
the capability and location of the photo-detector in the BCS. Also, in order to achieve
savings by bypassing some or all OCR processing, the bar-coded reply envelopes would
need a unique facing indicia mark (FIM) so that these envelopes could be detected
(perhaps by the facer/canceler) early in the mainstream and diverted to BCSs.
27
-— —. —
●
Mailer printing of outgoing bar codes.’ Most major business mailers already use
computers to store, update, and print out addresses on outgoing mail. Addresses are
printed directly on the envelopes, on mailing labels, or on letters that show through
window envelopes. Almost all business mailers have already entered the 5-digit ZIP
codes into their address data bases. USPS would, of course, like them
addresses from 5-digit to 9-digit ZIP codes.
At present, few mailers have actually converted their address files.
of concern over the cost of conversion. Some participants at the March 5
to convert the
partly because
OTA workshop
pointed out that, if and when mailers convert, consideration should be given to building in
a capability to print outgoing bar codes in addition to or as a substitute for the ZIP+4
numeric codes. In principal, outgoing bar-coded mail could, with proper FIMs on the
envelopes, bypass
In practice,
speed non-impact
the OCRs completely and go directly to
the technical and economic feasibility
printers (such as laser printers) could
BCSs.
is unclear. For example, high
be programed to print the bar
code immediately under the last address line on an envelope or label. However, if the
barcode location is too far up from the bottom of the envelope, then the Bell and Howell
bar code sorters used by USPS would not be able to read the bar code unless a second
scanning channel was added.
could also be used, but this
processing changes on the part
Ink jet printers or special photo offset printing devices
would involve significant equipment procurement and
of mailers. And proper location of the bar code could be
difficult when labels or window envelopes are
or barcode labels might be needed. Bell and
and/or inserting machines could be easily used
used. Special bar code window envelopes
Howell indicated to OTA that addressing
to print bar codes on outside envelopes of
outgoing mail, and that 30 to 35 billion pieces of mail annually could be processed
way. A clear understanding of the potential and pitfalls must await further study.
28
in this
Character recognition upgrades. The percentage of OCR-readable mail actually
read by the single-line OCRs used by USPS, although meeting USPS performance
specifications, is still far less than 100 percent. USPS has assumed an average read rate
of 70 percent. One way to improve performance is to upgrade the character recognition
technology.
Current character recognition technology uses mask matching, whereby character
patterns are stored in electronic memory and matched against the actual characters in
the address. But because there are so many different sizes, shapes, and forms of
alphanumeric characters in U.S. mail addresses, not all characters are stored in
electronic memory. If the computer cannot make a match within 100 milliseconds, the
address is not read.
The overall read rate could be improved by, first, studying the rejected addresses
and determining what types of characters are not being read. Then, OCR manufacturers
could
some
be solicited to develop improved character recognition technology that would read
or all of the characters rejected most frequently.
Address format standards. Some OCR rejects are due to problems with the
location and format of addresses on envelopes. To receive a ZIP+4 discount, mailers
must meet several mandatory requirements. These include: a barcode clear zone (at
the bottom right-hand portion of the envelope) in which no printing or markings
whatsoever are permitted; an OCR read area in which the city, State, and ZIP+4 code
line must be visible and unobstructed (no extraneous printing or markings); machine-
printed address with uniform character single and line spacing; and a reasonable degree
of color contrast between the address and mail piece.
2 9

——. . . . .
However, there are several voluntary guidelines with respect to margins; State
abbreviations; character fonts; character pitch, height, and height to width ratio;
character and line skew; upper case characters; and line and character spacing. Also,
while black ink on white paper is preferred, other color combinations are permitted
(except for brilliant colors and reverse printing and any others that do not meet minimum
reflectance standards).
The overall read rate could
determining the cause(s). The most
be improved by studying the rejected address and
common causal factors could be mitigated by:
1. better enforcement of mandatory format requirements;
2. improved compliance with voluntary format requirements, possibly throughincentives, and if necessary, by making some voluntary requirementsmandatory; and/or
3* technical upgrades as discussed previously, so thatvariety of address characters and formats.
Postal research and development. The USPS record on
mixed. On the negative side, USPS continues to underspend
the OCRs can read a wider
postal automation R&D is
on R&D, despite repeated
recommendations from congressional oversight committees and the Commission on
Postal Service to raise postal R&D closer to private sector levels. Postal R&D was about
$24 million in 1983, or about
compares to a U.S. industry
organization and management
times, top-level commitment.
one-tenth of one percent (0.1 percent) of revenue. This
average of perhaps 3 percent. Second, postal R&D
appear to have lacked stability, clear direction, and, at
Third, despite 20 years of USPS investment in optical
character recognition R&D, when USPS solicited manufacturers in 1980 for single-line
OCRs, no U.S. manufacturer was judged to be qualified. All U.S. manufacturers
previously receiving USPS support for single-line OCR R&D had withdrawn from the
market by 1980, in part due to USPS indecision on an automation strategy.
30

For example,
Philco Corporation
USPS awarded development contracts for first
in 1960-65, and for second generation OCRs to
generation OCRs to
IBM and Philco-Ford
in 1968 and 1969, respectively. Both companies developed successful OCR designs and
were subsequently awarded prototype contracts. The Philco-Ford second generation
OCRs were installed in Boston in November 1971 and successfully tested in early 1972;
and IBM OCRs were installed in New York in June 1972 and tested in late 1972. By the
time USPS had settled on a postal automation strategy and solicited manufacturers to
provide OCRs on a
line OCR business
Philco-Ford second
the IBM OCR units
release-loan basis in 1979-80, the only companies left in the single-
were foreign manufacturers. This was despite the fact that the
generation OCR units in Boston remained operational until 1982, and
in New York are still in service.
Thus, it is at least arguable that USPS could have reasonably opted for wide
deployment of single-line OCRs in the early 1970’s, perhaps using a 5-digit bar code (5-
digit ZIP code use had reached 84 percent by 1972). Had USPS opted for this strategy,
some U.S. manufacturers of single-line OCRs might well have stayed in the business.
And it would be reasonable to expect that OCR technology would be further advanced
than it is today.
On the positive side, USPS has established a good track record in narrowly focused
R&D on improvements to upgrade existing equipment. For example, the multi-position
letter-sorting machine (MPLSM), in wide use since the late 1960’s, has been upgraded
several times, most recently by a not yet fully implemented electronic ZIP retrofit
(known as EZR) that allows four-digit keying of ZIP+4 codes. Facer cancellers, single
position letter sorting machines, and flat sorting machines also have been, or will be,
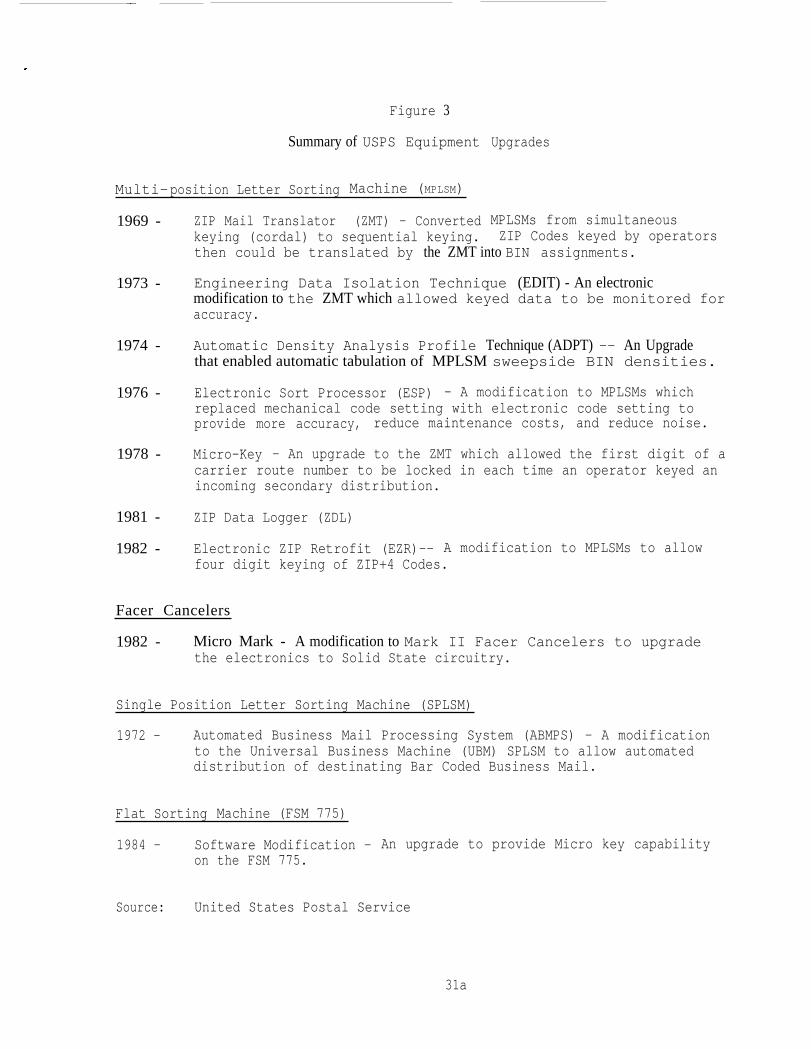
upgraded. USPS equipment upgrades are highlighted in figure 3.
31
—
.
Figure 3
Summary of USPS Equipment
Multi-position Letter Sorting Machine (MPLSM)
1969 -
1973 -
1974 -
1976 -
1978 -
1981 -
1982 -
ZIP Mail Translator (ZMT) - Convertedkeying (cordal) to sequential keying.
Upgrades
MPLSMs from simultaneousZIP Codes keyed by operators
then could be translated by the ZMT into BIN assignments.
Engineering Data Isolation Technique (EDIT) - An electronicmodification to the ZMT which allowed keyed data to be monitored foraccuracy.
Automatic Density Analysis Profile Technique (ADPT) -- An Upgradethat enabled automatic tabulation of MPLSM sweepside BIN densities.
Electronic Sort Processor (ESP) - A modification to MPLSMs whichreplaced mechanical code setting with electronic code setting toprovide more accuracy, reduce maintenance costs, and reduce noise.
Micro-Key - An upgrade to the ZMT which allowed the first digit of acarrier route number to be locked in each time an operator keyed anincoming secondary distribution.
ZIP Data Logger (ZDL)
Electronic ZIP Retrofit (EZR)-- A modification to MPLSMs to allowfour digit keying of ZIP+4 Codes.
Facer Cancelers
1982 - Micro Mark - A modification to Mark II Facer Cancelers to upgradethe electronics to Solid State circuitry.
Single Position Letter Sorting Machine (SPLSM)
1972 - Automated Business Mail Processing System (ABMPS) - A modificationto the Universal Business Machine (UBM) SPLSM to allow automateddistribution of destinating Bar Coded Business Mail.
Flat Sorting Machine (FSM 775)
1984 - Software Modification - An upgrade to provide Micro key capabilityon the FSM 775.
Source: United States Postal Service
31a

Also on the positive side, despite some variability in funding and commitment,
USPS has provided enough support over the last 14 years to Recognition Equipment,Inc.
(of Dallas, Texas) such that REI has developed one of the leading multi-line OCRs on the
world market. Ironically, at various times from the late 1960’s to the late 1970’s, USPS
appeared to actually favor the multi-line over the single-line OCR. [n the late 1970’s,
USPS procured one multi-line OCR from REI, and as insurance solicited every known
OCR manufacturer in the world to provide a single-line OCR on a release-loan basis.
As it turned out, the REI multi-line OCR did not satisfy USPS performance
requirements, but the single-line OCRs of five foreign manufacturers did (ELSAG, NEC,
Telefunken, Toshiba, and ITT Belgium). USPS decided to deploy single-line OCRs and
awarded production contracts to Pitney Bowes (under license to ELSAG) and Burroughs
(under license to NEC) in early 1981. According to USPS, for insurance purposes an
additional contract was awarded to REI for five multi-line OCRs. These were installed
and tested between June 1982 and April 1983. As discussed earlier, USPS test data
indicate that the multi-line OCR performance is now fully competitive with single-line
OCR performance.
Finally, USPS may wish to consider: (1) new approaches to R&D and procurement
(including the release-loan testing process) with a view towards speeding up the time
delay from R&D to installation of new equipment; and (2) new ways to organize mail
processing in order to achieve faster and more reliable delivery.
32

—
Decision Analysis
Introduction
USPS is approaching a critical decision point on postal automation strategy. At
present, the USPS commitment is to the 9-digit ZIP and single-line OCR. USPS has
developed 9-digit ZIP codes (ZIP+4) for the entire United States and prepared a national
ZIP+4 directory, although as yet very few mailers are using ZIP+4. Also, USPS has
procured and is installing Phase I automation equipment (including 252 single-line OCRs
and 248 BSCs) and has received bids on an additional 403 single-line OCRs as part of a
Phase II procurement. A selection decision is pending.
However, multi-line OCR technology has advanced to the point where it is fully
competitive with single-line OCRs
ZIP+4 mail. In
advantage over
addition, multi-line
single-line OCRs in
Thus USPS faces a decision
with respect to technical performance in processing
technology offers a significant technical performance
processing 5-digit ZIP mail to the 9-digit level.
point as to whether to continue its commitment to
ZIP+4 and single-line OCR technology or to modify that commitment in some way.
[n order to analyze the USPS decision, OTA has employed decision analysis
techniques to: identify the range of options available to USPS; develop a probabilistic
cash flow model of each option; assign probability distributions for key variables such as
ZIP+4 usage and multi-line OCR performance; calculate the rate of return (ROI), net
present value (NPV), total net cash flow, and annual net cash flow for each option; and
conduct sensitivity tests of the results to changes in key variables.
33

The options and assumptions used in the decision analysis along with the major
results are discussed below. Further details on the modeling methodology and the
complete cash flows for each option are included in the appendices.
Decryption of Decision Options
OTA identified eight major decision options. These are listed in figure 4 and
described below.
Option A: Phase II Single-Line OCR. Option A is the current USPS strategy to
proceed to procurement of the 403
the postal automation program, on
A, there would be no further
development, and testing.
additional single-line OCRs advertised for Phase 11 of
which bids have already been received. Under option
USPS expenditure on multi-line OCR research,
Option B: Multi-Line OCR with ZIP+4. Opt on B is a decision to cancel the current
Phase 11 single-line OCR procurement, initiate release-loan testing (where manufacturers
actually test prototype equipment on USPS premises using real mail) of multi-line OCRs,
and as soon as possible reissue the Phase 11 request for proposals but for multi-line rather
than single-line OCRs, meanwhile retaining the ZIP+4 code. Single-line OCRs already
purchased would be converted to multi-line capability.
that
line
Option C: Multi-Line OCR without ZIP+4. Option C is the same as option B except
the ZIP+4 code would be terminated. The 5 digit ZIP code would be retained.
Option D: Automatic Conversion. Option D is to proceed with the Phase II single-
OCR procurement, but simultaneously initiate release-loan testing (and any
necessary related R&D) on single-line to multi-line conversion, and then convert all
single-line OCRs as soon as possible, regardless of the level of ZIP+4 use.34

.Figure 4
Decision Options
A: Single-Line OCR, Phase II
B: Multi-Line OCR, with ZIP+4
c: Multi-Line OCR, No ZIP+4
D: Automatic Conversion: Purchase Single-Line, ContResearch and Testing on MuLine, and Convert Regardleof ZIP+4 Usage
E: Hedge Conversion: Purchase Single-Line, ContinueResearch and Testing onMulti-Line, Convert if ZIP+4Usage is Low.
inuelti-ss
F: Cancel Phase II, No ZIP+4
\
50-50 Split Procurement: Purchase ½ Single-Linenow, ½ Multi-Line Later.
90-10 Split Procurement: Purchase 90% Single-Linenow, 10% Multi-Line Later.
Source: Office of Technology Assessment
34a.
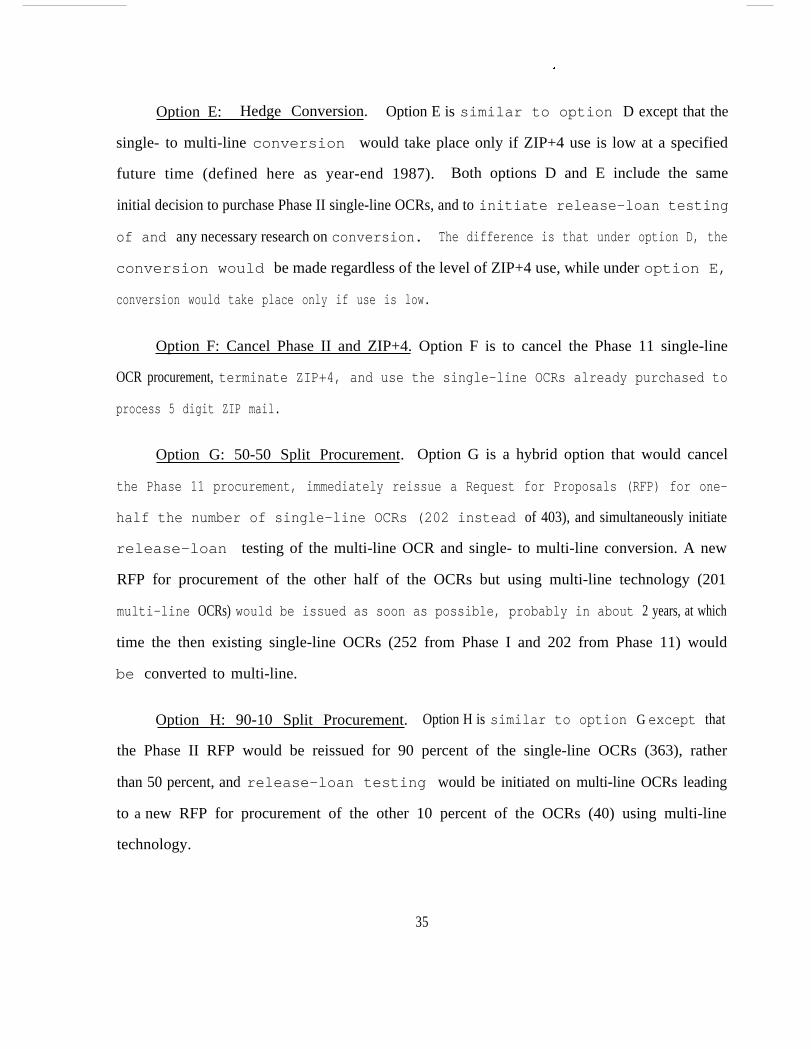
.
Option E: Hedge Conversion. Option E is similar to option D except that the
single- to multi-line conversion would take place only if ZIP+4 use is low at a specified
future time (defined here as year-end 1987). Both options D and E include the same
initial decision to purchase Phase II single-line OCRs, and to initiate release-loan testing
of and any necessary research on conversion. The difference is that under option D, the
conversion would be made regardless of the level of ZIP+4 use, while under option E,
conversion would take place only if use is low.
Option F: Cancel Phase II and ZIP+4. Option F is to cancel the Phase 11 single-line
OCR procurement, terminate ZIP+4, and use the single-line OCRs already purchased to
process 5 digit ZIP mail.
Option G: 50-50 Split Procurement. Option G is a hybrid option that would cancel
the Phase 11 procurement, immediately reissue a Request for Proposals (RFP) for one-
half the number of single-line OCRs (202 instead of 403), and simultaneously initiate
release-loan testing of the multi-line OCR and single- to multi-line conversion. A new
RFP for procurement of the other half of the OCRs but using multi-line technology (201
multi-line OCRs) would be issued as soon as possible, probably in about 2 years, at which
time the then existing single-line OCRs (252 from Phase I and 202 from Phase 11) would
be converted to multi-line.
Option H: 90-10 Split Procurement. Option H is similar to option G except that
the Phase II RFP would be reissued for 90 percent of the single-line OCRs (363), rather
than 50 percent, and release-loan testing would be initiated on multi-line OCRs leading
to a new RFP for procurement of the other 10 percent of the OCRs (40) using multi-line
technology.
35

.—
.“
Discussion of Key Assumptions
In developing and modeling the decision options, OTA made a variety of
assumptions. The starting point for the OTA analysis was the January 1984 cost, savings,
and cash flow projections for single-line OCR procurement (and related equipment
including bar code readers and extended ZIP retrofit kits) provided by USPS to the Postal
Board of Governors. - Using the USPS data as a base, key assumptions were adopted as is
or modified as necessary to fit the decision options analyzed by OTA. These key
assumptions are discussed below by option or groups of options.
AllOptions
o Time horizon. OTA assumed a 14-year time horizon, the same as was used byUSPS. Thus, cash flows and ROI/NPV precalculated for the 1985-1998 timeperiod.
o Labor cost escalation rate. OTA assumed a 7.42 percent annual escalation inclerk/carrier labor costs, as was used by USPS. This escalation rate is basedon a 10-year historical average.
o Baseline cost and savings projections. OTA used the USPS cost and savingsprojections for single-line OCRs and related equipment. These projectionswere adjusted for the various options depending on extent and timing ofsingle-line OCR deployment and uncertainties (where applicable) in ZIP+4 useand savings rate.
o Discount rate. OTA assumed a 15 percent discount rate (or required ROI), aswas used by USPS. Compared to the U.S. Government’s cost of capital(estimated to be 12.0 to 12.4 percent based on yields on U.S. Treasury bondsmaturing in 1998-2001), the USPS discount rate appears to be reasonable.
o Phase 11A procurement. USPS has identified a possible future procurement ofautomation equipment as Phase IIA. OTA has excluded this from all optionsand limited analysis to Phases I and II.
36
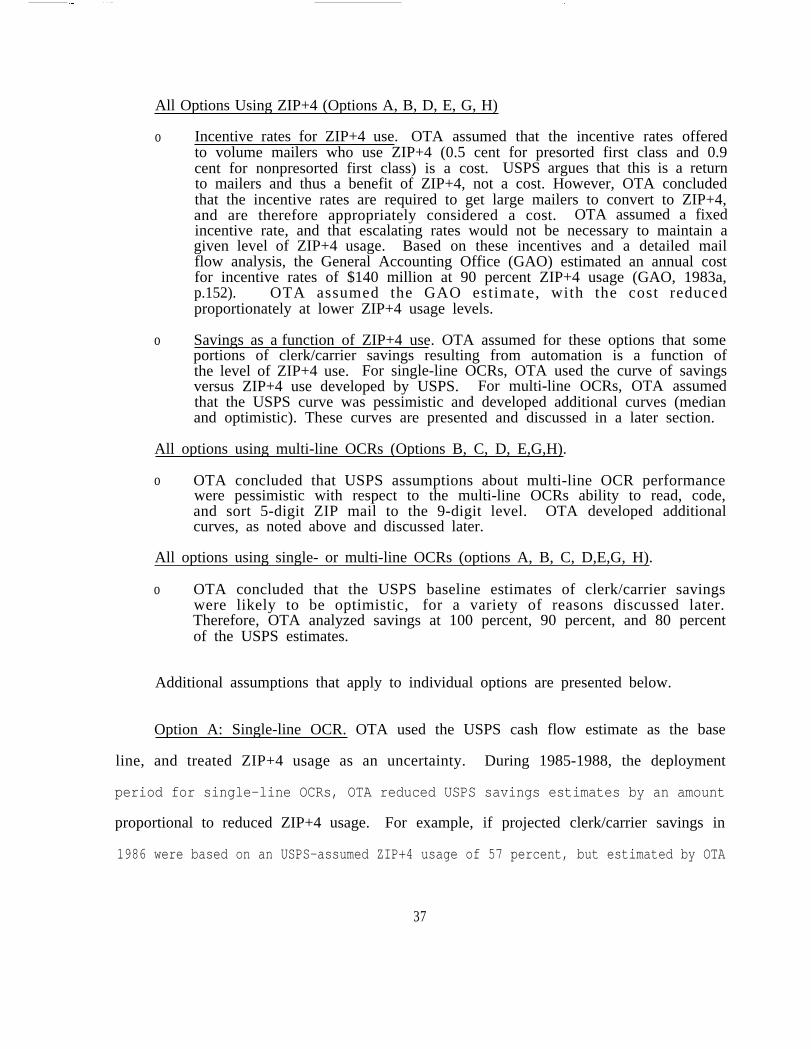
— . . . . .—— -——— —. .—
All Options Using ZIP+4 (Options A, B, D, E, G, H)
o Incentive rates for ZIP+4 use. OTA assumed that the incentive rates offeredto volume mailers who use ZIP+4 (0.5 cent for presorted first class and 0.9cent for nonpresorted first class) is a cost. USPS argues that this is a returnto mailers and thus a benefit of ZIP+4, not a cost. However, OTA concludedthat the incentive rates are required to get large mailers to convert to ZIP+4,and are therefore appropriately considered a cost. OTA assumed a fixedincentive rate, and that escalating rates would not be necessary to maintain agiven level of ZIP+4 usage. Based on these incentives and a detailed mailflow analysis, the General Accounting Office (GAO) estimated an annual costfor incentive rates of $140 million at 90 percent ZIP+4 usage (GAO, 1983a,p.152). OTA assumed the GAO estimate, with the cost reducedproportionately at lower ZIP+4 usage levels.
o Savings as a function of ZIP+4 use. OTA assumed for these options that someportions of clerk/carrier savings resulting from automation is a function ofthe level of ZIP+4 use. For single-line OCRs, OTA used the curve of savingsversus ZIP+4 use developed by USPS. For multi-line OCRs, OTA assumedthat the USPS curve was pessimistic and developed additional curves (medianand optimistic). These curves are presented and discussed in a later section.
All options using multi-line OCRs (Options B, C, D, E,G,H).
o OTA concluded that USPS assumptions about multi-line OCR performancewere pessimistic with respect to the multi-line OCRs ability to read, code,and sort 5-digit ZIP mail to the 9-digit level. OTA developed additionalcurves, as noted above and discussed later.
All options using single- or multi-line OCRs (options A, B, C, D,E,G, H).
o OTA concluded that the USPS baseline estimates of clerk/carrier savingswere likely to be optimistic, for a variety of reasons discussed later.Therefore, OTA analyzed savings at 100 percent, 90 percent, and 80 percentof the USPS estimates.
Additional assumptions that apply to individual options are presented below.
Option A: Single-line OCR. OTA used the USPS cash flow estimate as the base
line, and treated ZIP+4 usage as an uncertainty. During 1985-1988, the deployment
period for single-line OCRs, OTA reduced USPS savings estimates by an amount
proportional to reduced ZIP+4 usage. For example, if projected clerk/carrier savings in
1986 were based on an USPS-assumed ZIP+4 usage of 57 percent, but estimated by OTA
37
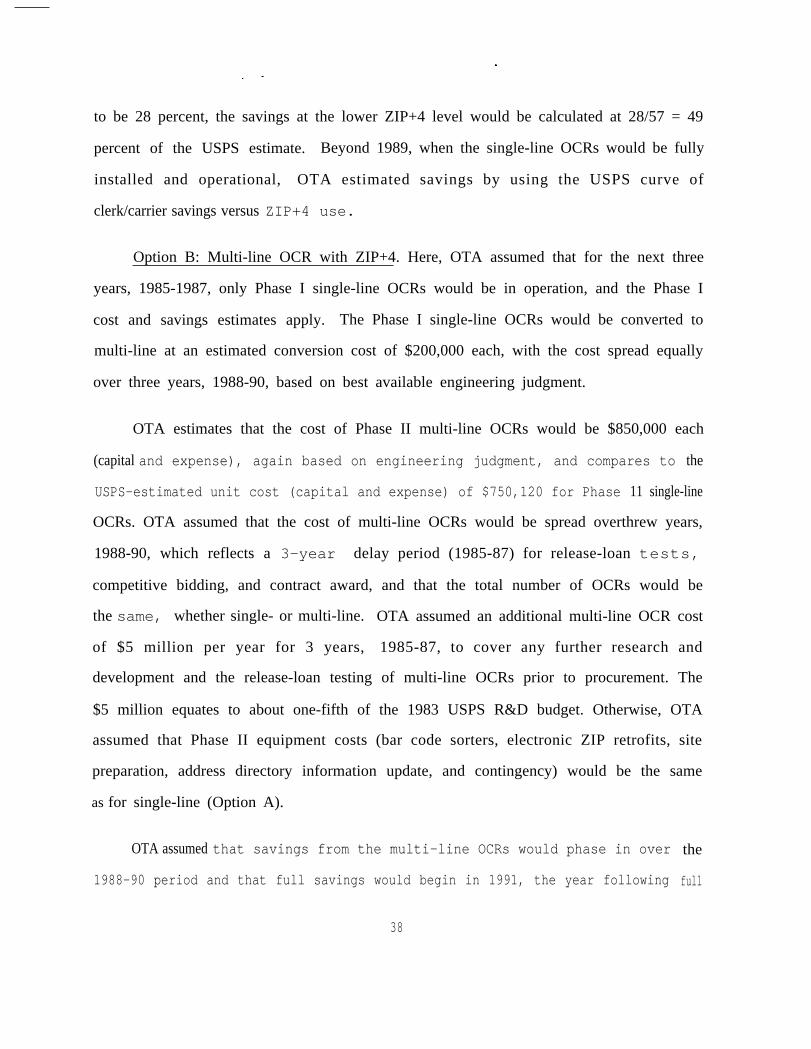
..-
to be 28 percent, the savings at the lower ZIP+4 level would be calculated at 28/57 = 49
percent of the USPS estimate. Beyond 1989, when the single-line OCRs would be fully
installed and operational, OTA estimated savings by using the USPS curve of
clerk/carrier savings versus ZIP+4 use.
Option B: Multi-line OCR with ZIP+4. Here, OTA assumed that for the next three
years, 1985-1987, only Phase I single-line OCRs would be in operation, and the Phase I
cost and savings estimates apply. The Phase I single-line OCRs would be converted to
multi-line at an estimated conversion cost of $200,000 each, with the cost spread equally
over three years, 1988-90, based on best available engineering judgment.
OTA estimates that the cost of Phase II multi-line OCRs would be $850,000 each
(capital and expense), again based on engineering judgment, and compares to the
USPS-estimated unit cost (capital and expense) of $750,120 for Phase 11 single-line
OCRs. OTA assumed that the cost of multi-line OCRs would be spread overthrew years,
1988-90, which reflects a 3-year delay period (1985-87) for release-loan tests,
competitive bidding, and contract award, and that the total number of OCRs would be
the same, whether single- or multi-line. OTA assumed an additional multi-line OCR cost
of $5 million per year for 3 years, 1985-87, to cover any further research and
development and the release-loan testing of multi-line OCRs prior to procurement. The
$5 million equates to about one-fifth of the 1983 USPS R&D budget. Otherwise, OTA
assumed that Phase II equipment costs (bar code sorters, electronic ZIP retrofits, site
preparation, address directory information update, and contingency) would be the same
as for single-line (Option A).
OTA assumed that savings from the multi-line OCRs would phase in over
1988-90 period and that full savings would begin in 1991, the year following
38
the
full
— .——. .— —
installation. Multi-line savings at a given level of ZIP+4 use are based on the curve of
savings versus ZIP+4 use presented later. The curve is treated as an uncertainty, with
pessimistic, median, and optimistic performance assumptions built in.
Option C: Multi-line OCR without ZIP+4. Option C is based on the same
assumptions as Option B, except that the cost of the ZIP+4 rate incentive is dropped
(since ZIP+4 would be terminated) and savings are estimated based on zero use of
ZIP+4. For 1985-87, OTA assumed that savings would be the same as for the Phase I
single-line OCRs with zero ZIP+4 use. For 1988-90, OTA assumed that one-third of the
full savings benefit of Phase I single-line OCR conversion to multi-line would be realized
in 1989, and two-thirds of the savings benefit in 1990. OTA assumed that Phase II
multi-line OCR savings would phase in over 1988-90, and that full savings of converted
Phase I OCRs and Phase II multi-line OCRs would begin in 1991.
Option D: Automatic Conversion. Here, OTA assumed that single-line OCRs would .
be purchased and installed on the same schedule as in Option A. Over the 1985-87
period, R&D and release-loan testing on single- to multi-line conversion would be
conducted at $5 million per year. All single-line OCRs (Phase I and Phase II) would be
converted to multi-line at a total cost of $31 million ($200,000 per conversion times 655
units) spread over 3 years, 1988-90. Clerk/carrier savings are assumed to be the same as
option A savings through 1990, and the same as option B from 1991 on.
Option E: Hedge Conversion. In option E, OTA assumed conversion of single-line
OCRs to multi-line only if ZIP+4 use is low at the end of 1987. If ZIP+4 use is at the high
or median level, conversion would not take place and option E would be the same as
option A except for a $5 million per year R&D and release-loan cost for 3 years, 1985-
87. If ZIP+4 use is low, then conversion would take place and option E would be the same
as option D.39

.
Option F: Cancel. Here, OTA assumed that the Phase 11 OCR procurement would
be cancelled, as would the ZIP+4 program and related rate incentives. The 252 single-
line OCRs purchased in Phase I would be used to process 5-digit ZIP mail. OTA assumed
that maintenance and spare parts costs would be the same, but that there would be no
address directory information update cost. Clerk carrier savings for option F were
assumed to be the same as with zero percent ZIP+4 use; that is, about 21 percent of the
savings achievable at 90 percent ZIP+4 use, per USPS estimates.
OTA used option F as the baseline against which incremental cash flows of other
options can be measured.
Option G: 50-50 Split Procurement. For option G, OTA assumed that the 252
Phase I single-line OCRs would be converted to multi-line in 1988-90 (as in options B, C,
D); the Phase 11 procurement would be split, with 202 additional single-line OCRs
purchased now, installed in 1985-87, and converted to multi-line in 1988-90 (same as
option D except at one-half the number of single-line OCR units); and 201 multi-line
OCRs would be purchased
option B except at
Thus, option
one-half
G is an
after release-loan testing and installed in 1988-90 (same as
the number of multi-line OCR units).
intermediate option between options B and D and would be
expected to roughly split the difference between the two.
Option H: 90-10 Split Procurement. Option H is based on the same assumptions as
option G except for the Phase 11 split: 363 (instead of 202) additional single-line OCRs
would be purchased now, installed in 1985-87, and converted to multi-line in 1988-90; and
40 (instead of 201) multi-line OCRs would be purchased after release-loan testing and
installed in 1988-90.
40

Discussion of Key Uncertainties
OTA gave explicit consideration to several uncertainties in the decision analysis.
These included uncertainty about ZIP+4 usage, multi-line OCR performance, single- and
multi-line savings rate, multi-line OCR cost, single- to multi-line conversion cost, multi-
line ZIP+4 use, national directory feasibility and cost, single/multi-line OCR
obsolescence, and multi-line OCR procurement delay.
The ZIP+4 usage, multi-line performance, and single/multi-line savings rate have
proven to be the most controversial uncertainties. These are discussed first, followed by
the less controversial uncertainties.
As shown in figure 5, the three most controversial uncertainties were included in
many of the decision options. ZIP+4 usage was treated as an uncertainty in analysis of
options A, B, D, E, and, by extension, G and H. Multi-line OCR performance was treated
as an uncertainty in analysis of options B, C, D, E, G, and H. The single/multi-line
savings rate was treated as an uncertainty in options A, B, C, D, E, G, and H.
ZIP+4 Usage. USPS has based its analysis on the assumption that 90 percent ZIP+4.
usage will be achieved by the end of 1988. The 90 percent is calculated as a
of total machinable, metered first class letter mail of about 51 billion pieces.
achieve 90 percent by 1988, USPS assumed the following interim usage rates:
percentage
In order to
41
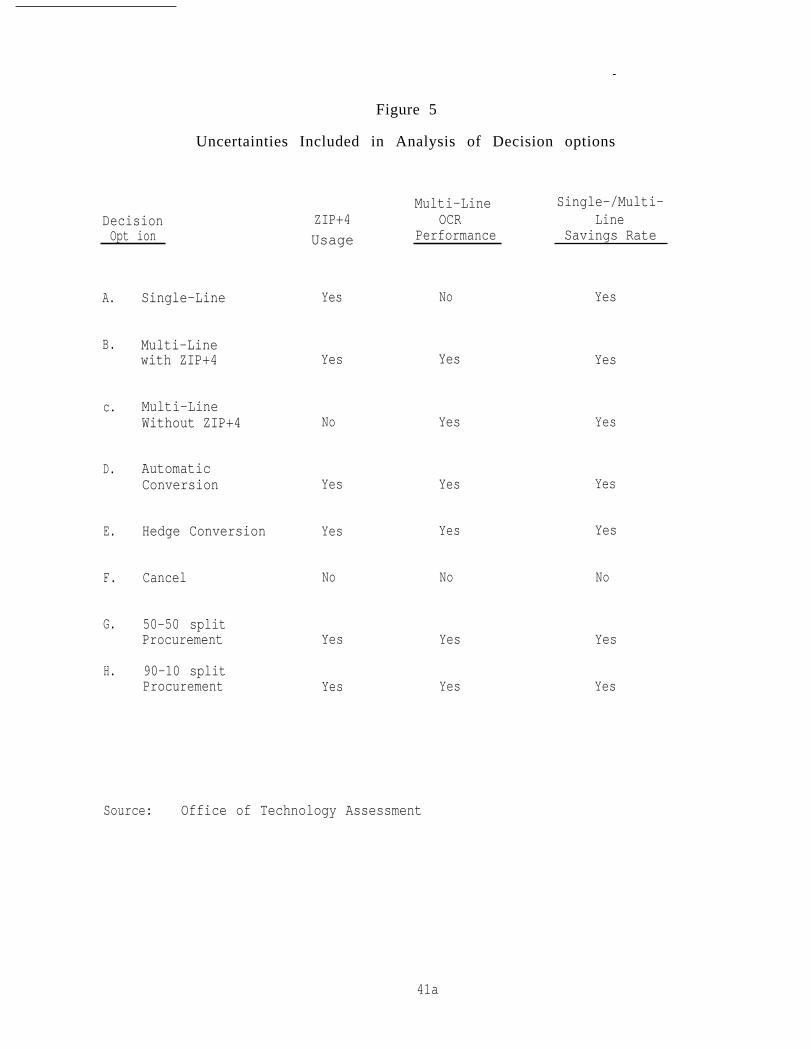
.
DecisionOpt ion
Figure 5
Uncertainties Included in Analysis of Decision options
A.
B.
c.
D.
E.
F.
G.
H.
Single-Line
Multi-Linewith ZIP+4
Multi-LineWithout ZIP+4
AutomaticConversion
Hedge Conversion
Cancel
50-50 splitProcurement
90-10 splitProcurement
Multi-Line Single-/Multi-ZIP+4 OCR LineUsage Performance Savings Rate
Yes No Yes
Yes
No
Yes
Yes
No
Yes
Yes
Yes
Yes
Yes
Yes
No
Yes
Yes
Yes
Yes
Yes
Yes
No
Yes
Yes
Source: Office of Technology Assessment
41a

— .—.———— .— ——..—————. —————
ZIP+4 PiecesYear Ending Usage Rate Of Mail
1984 27 percent 13.8 Billion1985 48 24.51986 66 33.71987 85 43.41988 90 45.9
As of late May 1984, 59 mailers had actually converted their mailing address files
to ZIP+4. Of these, 42 had qualified for ZIP+4 discounts and are expected to generate
401 million pieces on an annual basis. Sixteen of the other 17 are expected to
collectively generate 25 million pieces of non-qualifying ZIP+4 first class mail, and the
seventeenth, 200 million pieces of third-class mail. Another 258 mailers had given USPS
definite commitments to convert to ZIP+4 by December 1984. When fully converted,
these 258 mailers are expected to generate a total of 2.1 billion pieces of first class mail
annually.
Thus, at present, the projected actual volume of ZIP+4 mail (as a 1984 year-end
volume and percentage of total machinable, metered first class mail) is about 2.73 billion
pieces or about 19.8 percent of the original USPS projection. It impossible, of course,
that additional mailers will decide to convert before the end of 1984. It is also possible
that some of these already committed to convert will not actually do so.
As shown in figure 6, the original USPS projection of 90 percent ZIP+4 usage within
5 years is considerably more optimistic than actual
digit ZIP code or the Canadian 6-digit postal code.
reach 90 percent usage; after 5 years, the 5-digit
experience with either the U.S. 5-
The 5-digit ZIP took 12 years to
usage level was about 51 percent.
Thus, the USPS projection shows ZIP+4 reaching 90 percent about two and one-half times
as fast (in 5 years rather than 12).
42

Figure 6
100
90
80
40
30
20
Comparison of Code UsagesU.S. 5 Digit, Zip+4, and Canadian
SOURCE : United States Postal Service
42a.
.1 .It - .... ... ~
.-t::r
/ 7' I'
.'
~ .-"
..----.r ( //.r
./ f
'70 IY /-r I
I / J
/1 /
l .' i
/ I I
! I / ! / I ~
/' I
~( ~/ , I I
l ,i
I l
50
.t \1
~ . )
Uf
~
I I . . 66 68 70 72 74 76 7B SO S2 B4 S6 SB 90
Year o 5 D~it + canadian .~:. ?roJ. ZIP+4

USPS justifies its projection on the grounds that “the technology used by mailers
today is dramatically more sophisticated than that of the 1960’s, when the 5-digit ZIP
code was introduced. The widespread use of the 5-digit ZIP code, the proliferation of
office automation and automated mailings, and the ZIP+4 incentive all point to
successful and accelerated acceptance of ZIP+4." (USPS, Jellison, 1984c). In 1983, GAO
reviewed the one ZIP+4 market study cited by USPS (a 1982 survey conducted for USPS
by R.H. Bruskin Associates). GAO expressed reservations about the study methodology
(response rate too low, study universe not representative) and was unable to endorse the
study results (GAO, 1983b, pp. iv-v, 31-36).
After reviewing all available evidence, OTA concluded that the USPS ZIP+4
projection should be considered optimistic, that inappropriate median estimate would be
the 5-digit ZIP growth pattern, and that an appropriate pessimistic estimate would be a
growth pattern similar to that of the USPS Electronic Computer Originated Mail Service
(E-COM), where actual usage was about one-third of USPS projections. At the present
time, the first year ZIP+4 usage could turn out to be even more pessimistic. The
estimated 2.73 billion pieces of ZIP+4 first class mail at year end 1984 represents about
5.4 percent of the target mail base as compared to about 7 percent under the pessimistic
scenario, 13 percent under the median, and 28 percent under the optimistic scenario.
OTA’s ZIP+4 growth curves are shown in figure 7. OTA assumed that there is a 5
percent chance that actual ZIP+4 usage will equal or exceed the USPS projection (the
high growth curve), a 50-50 chance that actual usage will be above or below the median
growth curve (that is, it is equally likely that ZIP+4 usage will be above or below the 5-
digit ZIP growth curve), and a 5 percent chance that ZIP+4 usage will be equal to or less
than the low growth curve. At the present time, ZIP+4 growth is tracking a growth curve
lower than the low curve in figure 7.
43
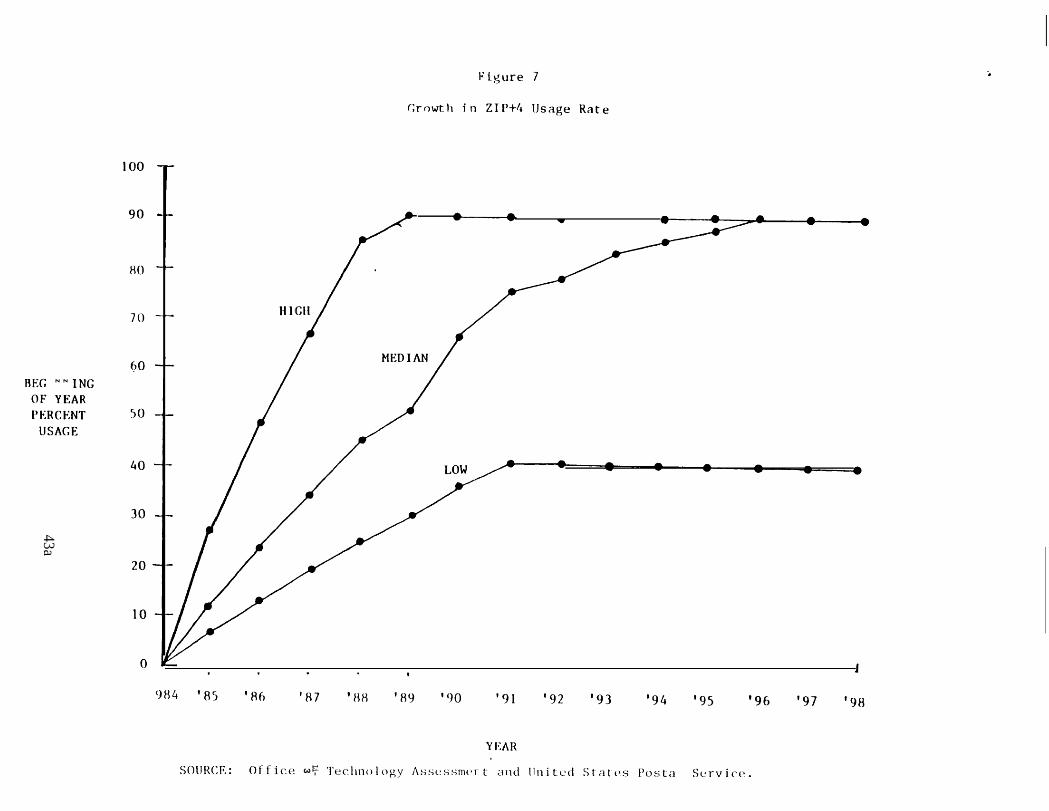
zz
u4u*kc43a
.....
L
Li-3
Figure 7
Crowth in ZIP+4 Usage Rate
100
90 . •
80
70
f?0 REG ING
OF YEAR rl-:RCENT 50
USAGE
40 LOW ~ • • • • • • •
30 / 20
10
o
984 '85 'Sf, '87 'RR '89 '90 , 91 '92 '93 '94 '95 '96 '97 '98
YEAR
SOURCE: Office Technology i\ssL'SSm('rt and lInitl'o Stales Posta Service.

As a final note, GAO recently surveyed six business associations whose members
mail large volumes of first class mail. Although not a representative sample, GAO found
that while there is some interest in ZIP+4, businesses are still concerned about the cost
of converting their address files (even with the current rate incentives) and whether the
USPS presort program (and discounts) will end as a result of ZIP+4. In order to promote
conversion, USPS is allowing "comingling" or mixing of up to 15 percent non-ZIP+4 mail
in a ZIP+4 presort first class mailing until February 1, 1985, and up to 10 percent until
October 1, 1985. As yet, however, there is little evidence that business mailers are
giving ZIP+4 conversion a high priority.
Multi-line OCR performance. A major advantage of multi-line OCRs is the ability
to read, code, and sort 5-digit ZIP mail to the 9-digit level. That is, unlike the single-
line OCR, the multi-line OCR can process a significant percentage of 5-digit ZIP mail as
if the ZIP+4 were being used but without actually requiring the ZIP+4 code to be on each
letter. The multi-line OCR does this by matching the multi-line address information on
the envelope with address and ZIP+4 information stored in a computerized address
directory. Even though there is no ZIP+4 code on the envelope, when a match is made,
the multi-line OCR prints the 9-digit barcode on the envelope.
At issue is not whether but how well the multi-line OCR can process 5-digit mail to
the 9-digit level. USPS has estimated that the multi-line OCR can process 60 percent of
5-digit mail accepted by the OCR to the 9-digit level extra based on acceptance tests of
the REI equipment. However, USPS notes that the 60 percent is "a projection that was
not fully tested.” Based on the 60 percent multi-line performance estimate (5-digit to 9-
digit level) and more complete data available on single- and multi-line OCR processing of
9-digit (ZIP+4) mail, USPS developed a set of curves shown in figure 8 as alternatives A,
44

.
. .
IIv
00
. .C4
0o7
“
dIZ
44a
100
')0
70
""""" (,0 N '-"
W
~ Cf.) ')0 :;:J
~ :;:J 0 r:.x..
Cf.) ~
:;:J t-l Po.
)0
20
10
o
figure 8
Estimatc~ of 989 Clerk/Carrier Savings
./ 1/ d/V
. u ~/ /1 ~. ~;r I / ~ / ~ ,r:f. '<9
/.V / / ~~ .iI /// ~t /
/ V I / '.,-L ~ / 7 I V 2~
/ 7 ~ . j
/ I / / 00 200 300 400 500 600 7 800 900 DOC
ANNUAL SAVINGS (MILLIONS OF DOLLARS)
SOURCE: United States Postal Service (curves for Alternatives A, B(low), C); and Office of Technology Assessment (curves for Alternatives B (Median) and B (high).
Alt. A Single-Line OCR With ZIP+4
Alt. B Multi-Line OCR With ZIP+4
Alt. C Multi-Line OCR Without ZIP+4
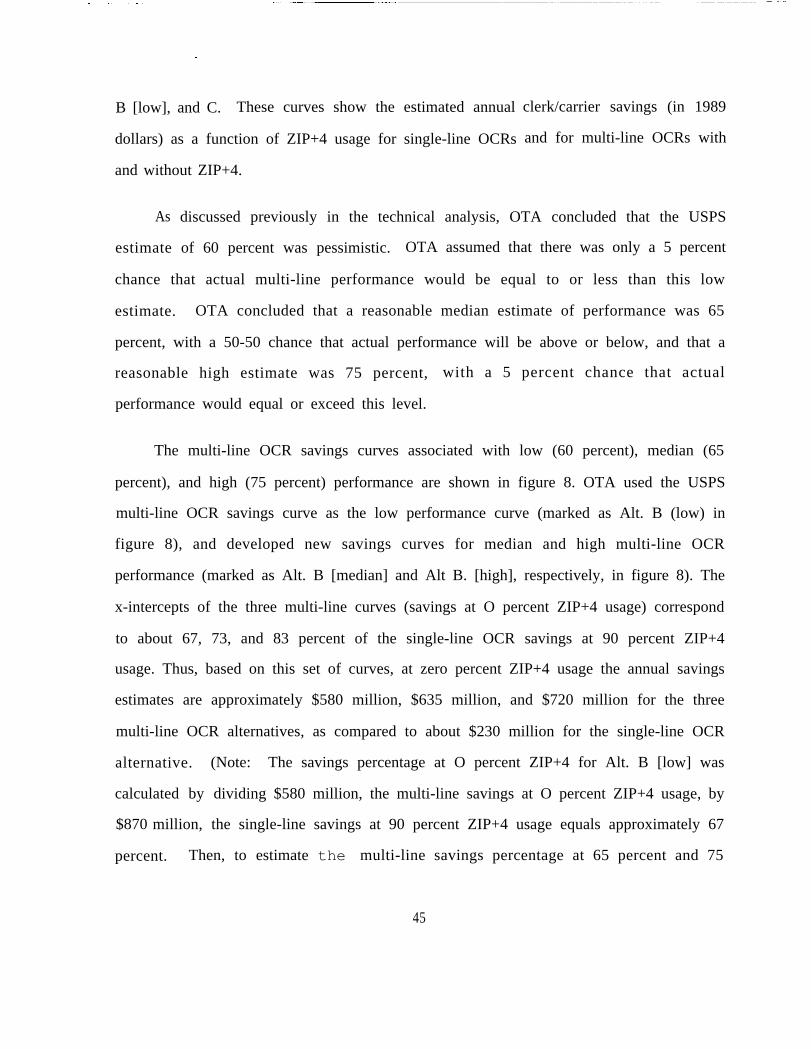
.
B [low], and C. These curves show the estimated annual
dollars) as a function of ZIP+4 usage for single-line OCRs
and without ZIP+4.
clerk/carrier savings (in 1989
and for multi-line OCRs with
As
estimate
discussed previously in the technical analysis, OTA concluded that the USPS
of 60 percent was pessimistic. OTA assumed that there was only a 5 percent
chance that actual multi-line performance would be equal to or less than this low
estimate. OTA concluded that a reasonable median estimate of performance was 65
percent, with a 50-50 chance that actual performance will be above or below, and that a
reasonable high estimate was 75 percent, with a 5 percent chance that actual
performance would equal or exceed this level.
The multi-line OCR savings curves associated with low (60 percent), median (65
percent), and high (75 percent) performance are shown in figure 8. OTA used the USPS
multi-line OCR savings curve as the low performance curve (marked as Alt. B (low) in
figure 8), and developed new savings curves for median and high multi-line OCR
performance (marked as Alt. B [median] and Alt B. [high], respectively, in figure 8). The
x-intercepts of the three multi-line curves (savings at O percent ZIP+4 usage) correspond
to about 67, 73, and 83 percent of the single-line OCR savings at 90 percent ZIP+4
usage. Thus, based on this set of curves, at zero percent ZIP+4 usage the annual savings
estimates are approximately $580 million, $635 million, and $720 million for the three
multi-line OCR alternatives, as compared to about $230 million for the single-line OCR
alternative.
calculated by
$870 million,
(Note: The savings percentage at O percent ZIP+4 for Alt. B [low] was
dividing $580 million, the multi-line savings at O percent ZIP+4 usage, by
the single-line savings at 90 percent ZIP+4 usage equals approximately 67
percent. Then, to estimate the multi-line savings percentage at 65 percent and 75
45

●✎☛
percent performance levels corresponding to Alt. B [median] and Alt. B [high],
respectively, simple ratios were calculated: 65 percent/60 percent X 0.67 equals
approximately 73 percent for Alt. B [median], and 75 percent/60 percent X 0.67 equals
approximately 83 percent for Alt. B [high].)
As is evident from figure 8, the USPS multi-line with ZIP+4 curve (Alt. B. [low]) has
an elbow in it, with no increase in the savings level occurring until ZIP+4 usage exceeds
about 20 to 25 percent. USPS defends this “elbow” on the grounds that up to about 20
percent ZIP+4 usage, the read redundancy in the address and the ZIP+4 code negates any
advantage from the multi-line OCR. [n other words, USPS believes that the higher
quality mail will be the first to use ZIP+4, and thus there will be no immediate benefit
from multi-line processing. OTA was unable to establish a satisfactory engineering
justification for this redundancy effect, and USPS was unable to provide a detailed
explanation. Therefore, while OTA included the elbow in the USPS-estimated curve used
as multi-line alternative B [low], OTA excluded the elbow for alternatives B [median] and
B [high]. For these multi-line alternatives, OTA assumed a linear relationship between
ZIP+4 usage and savings.
For modeling purposes, OTA converted the figure 8 curves into a set of normalized
linear equations using ZIP+4 usage as the independent variable and usage savings factor
as the dependent variable. A usage savings factor of 1.0 equates to 100 percent of the
savings projected for the single-line OCR alternative at 90 percent ZIP+4 usage. The set
of curves corresponding to the linear equations is shown in figure 9. The slope of the
single-line OCR curve was adjusted slightly to be consistent with the ZIP+4 sensitivity
analyses included in the 1984 USPS proposal to the Postal Board of Governors (savings
factors of 1.0, 0.866, and 0.72 at ZIP+4 usage rates of 0.9, 0.76, and 0.57 [corresponds to
90 percent, 76 percent, and 57 percent ZIP+4 usage]).
46

.
-.
Figure 9
Usage Savings Factors
0
.
.
I 1 I I I 1 I ! Ii
.1 .2. - . 3 .4 .5
ZIP+4 USAGE (U)
.6 .7 .8 .9 1.0
1.0875
Alto A = Single-Line OCRAlt. B= Multi-Line OCR with
(low) performance(median) performance(high) performance
SOURCE: Office of Technology Assessment
46a

* .*
Single/multi-line savings rate. In addition to uncertainty over ZIP+4 usage and
multi-line OCR performance, OTA included an uncertainty over the baseline level of
clerk/carrier savings estimated by USPS. USPS asserts that their estimates are
conservative, since the estimates “do not include additional savings from a reduction in
operator scheme training, increased employee flexibility, error reduction, or the
potential for encoding mail manually.” USPS also points out that the savings estimates
are based on machinable first-class mail only, and do not include savings from non-
machinable first class mail or from semi-automated processing of ZIP+4 coded flats and
parcels (for example, by using a wand reader or laser scanner).
On the other hand, the USPS savings estimates are vulnerable to lower than
anticipated volume and/or higher than expected costs. Some large mailers may develop
techniques for totally bypassing the OCRs, for example, by applying bar codes to
outgoing letters at the same time addresses are printed. This would be an extension of
presorting letters to the carrier route level, which is apparently already competing with
postal automation. [f a significant amount of machinable, easy to read (trayed and clean)
first class mail is presorted and bypasses the OCRs, the OCRs would be left with a higher
relative volume of lower quality mail with a lower OCR performance level to be
expected. The net result could be a considerable decrease in OCR productivity and
savings.
This downside potential is dramatized by comparing single-line OCR accept rates
(percentage of mail fed to an OCR that is accepted by the machine) for different types
of mail. USPS assumed, for example, an accept rate of 90 percent for presort first class
mail but only 50 percent for collection box mail and 75 percent for bulk business mail.
To the extent the OCR mail mix changes such that presort decreases relative to other
mail types, then the overall
all other things being equal.
As to the possibility
..
OCR accept, productivity, and savings rates would decline,
of higher than expected costs, the greatest vulnerability
appears to be in the labor area, not in equipment. Although it is too early to have hard
figures, it is possible that OCR maintenance labor costs will be higher than anticipated.
All factors considered, OTA concluded that the USPS baseline estimate of
clerk/carrier savings was probably somewhat optimistic. OTA assumed that there is a 5
percent chance that the actual savings rate will equal or exceed 100 percent of the USPS
baseline savings estimate, a 50-50 chance that the savings rate will be above or below 90
percent of the USPS baseline estimate, and a 5 percent chance that the actual rate will
be equal to or less than 80 percent of the USPS estimate.
Multi-line OCR Cost. OTA noted some uncertainty about the purchase and
maintenance costs of the multi-line OCR. Firm estimates are not possible in the absence
of a competitive bidding on and operational experience with a large number of multi-line
OCRs. USPS has estimated that multi-line OCRs would cost $200,000 more per unit to
buy than single-line OCRs, or about $950,000 compared to the $750,000 (per single-line
OCR unit (capital and expense) used in the USPS
Governors.
However, based on best available engineering
$100,000 purchase cost difference is more realistic.
proposal to the Postal Board of
judgment, OTA concluded that a
Also,
analysis on multi-line OCR purchase prices of $750,000,
found that the impact on ROI/NPV was negligible, as will be
OTA conducted a sensitivity
$850,000, and $950,000 and
discussed in a later section.
48

*
As for multi-line OCR maintenance cost, OTA concluded that the cost of updating
the multi-line OCR address directory would probably be greater than updating the single-
line OCR directory. USPS has very roughly estimated this additional maintenance cost
at one work year per local directory per year (equivalent
months). Since 209 local directory updates would be
projected to have OCRs), the additional yearly directory
to three persons working for 4
needed (the number of cities
maintenance cost is estimated
to be about $9.32 million (209 local directory updates times $44.6K per average work
year). This amount is negligible (on the average one percent or less) compared to the
total yearly multi-line savings, and therefore was excluded from further analyses.
Single- to multi-line conversion cost.
assumed a conversion cost of $200,000 per
judgment.
Multi-line ZIP+4 usage. USPS believes
In the absence of firm estimates, OTA
unit, based on best available engineering
that use of multi-line OCRs would likely
have a detrimental effect on mailer acceptance and use of ZIP+4. In other words, all
other things being equal, USPS believes that ZIP+4 usage would be less for a multi-line
OCR system than for a single-line OCR system.
While a few mailers have indicated that a USPS switch to multi-line OCRs would
reduce the likelihood of converting to ZIP+4, the cost of conversion, level and stability of
USPS ZIP+4 rate incentives, and relationship to USPS presort rate incentives appear to
be much more important to mailers than the type of OCR equipment used by USPS. [n
sum, the available evidence suggests that mailers base their decisions about ZIP+4 use
primarily on economic and financial factors and not on technological factors.
49
.
In addition, even the concerns stated by USPS would appear to be moot for options
including an initial purchase of some or all of the Phase II single-line OCRs and
subsequent conversion to multi-line capability. Since actual conversion would probably
not begin for about 3 years, by that time it should be clear to what extent USPS
projections of ZIP+4 usage with a single-line OCR system are being met.
National directory feasibility and cost. OTA originally included the cost of
charge against multi-line OCR options, on the
be necessary for effective use of multi-line
OTA concluded that national directories, while
computerized national directories as a
theory that national directories would
OCRs. However, upon further analysis,
technically feasible, were not necessary, since
and destination cities amounts to a de facto
national directory has not yet been developed,
As a result of these factors, the cost of national directories was removed from further
consideration. (The cost of local directories was, of course, reflected in the estimates of
multi-line OCR purchase ‘price and single- to multi-line conversion price.)
the use of local directories in the origin
national directory. In addition, since a
estimating costs would be very difficult.
Single/multi-line OCR obsolescence. OTA originally included as an uncertainty the
obsolescence date for Phase II single-line OCR equipment (i. e., a 5 percent chance of
becoming obsolete in 1994 or earlier). However, OTA concluded that the single-line
OCRs could be upgraded, if necessary, to use new technologies and/or perform new or
expanded functions. Therefore, the equipment obsolescence date was excluded as an
uncertainty. All equipment was assumed to remain operational through 1998.
Multi-line OCR procurement delay. OTA originally assumed a 2-year delay in OCR
procurement if USPS switched from single-to multi-line OCRs. Upon further analysis.
OTA concluded that a 3-year delay was more reasonable, based on best available
50

engineering judgment and USPS experience with single-line OCR release-loan testing,
assuming no change in USPS procurement-practices. USPS has likewise estimated a 3-
year delay as more realistic, given the need to issue a new solicitation for release-loan
testing of multi-line OCRs.
Results of Decision Analysis
Probabilistic cash flow models were developed for each option using the
assumptions and uncertainties discussed previously. The models were then used to
project estimated yearly cash flows, rate of return, and net present value for each
decision option. (See appendices A and B for a detailed presentation of the models and
cash flows for all options except options G and H, which were estimated by
interpolation. )
The purpose of the modeling is to provide both absolute and comparative financial
projections for each decision option. However, while the models generate numbers that
appear to be very specific, the user of the results must understand that all projections
are subject to some imprecision, especially in view of the large number of assumptions
and uncertainties. But as long as these assumptions and uncertainties are treated
consistently, the results should provide a valid basis for comparison among options.
Results of the decision analysis are presented below in the following order: rates
of return, net present values, supplemental sensitivity analysis, and overall cash flows.
Rates of return. The cash flow models were used to estimate internal rates of
return (ROIs) for each option under each condition of uncertainty. The ROIs were
estimated on an incremental basis over option F (cancel), since OTA assumed that under
51

.
any scenario, the Phase I single-line OCRs already purchased would be kept in service.
Thus option F is in effect the baseline option. In essence, all ROIs are net of cash flows
associated with Phase I single-line OCRs.
The estimated ROIs for all options under various conditions are shown in figure
10. Every option under all conditions modeled shows an ROI above the 15 percent
threshold established by USPS. The lowest ROI is 20.6 percent, for option A (single-line
OCR) under low ZIP+4 usage and a low savings rate. Only if ZIP+4 was even lower (e.g.,
peaked out at 20 percent usage instead of the 40 percent assumed in the low usage
scenario) and/or the savings rate was even lower (e.g., 70 percent of USPS estimates
instead of the 80 percent assumed in the low savings rate scenario) would the option A
ROI drop below 15 percent.
The highest ROI is 84.6 percent, for option D (automatic conversion) under high
ZIP+4 usage, multi-line performance rate, and savings rate. However, under these
conditions options A (single-line OCR), E (hedge conversion), and H (90-10 split.
procurement) have only a slightly lower estimated ROI. The greatest difference between
option D (automatic conversion) and option A (single-line OCR) occurs with low ZIP+4
usage and high multi-line OCR performance. Under these conditions, the option D ROI is
anywhere from 33 to 50 percent higher than the option A ROI.
The relative ROI ranking of the various options as a function of ZIP+4 usage is as
follows (excluding option F, cancel, which has a negative ROI):
52
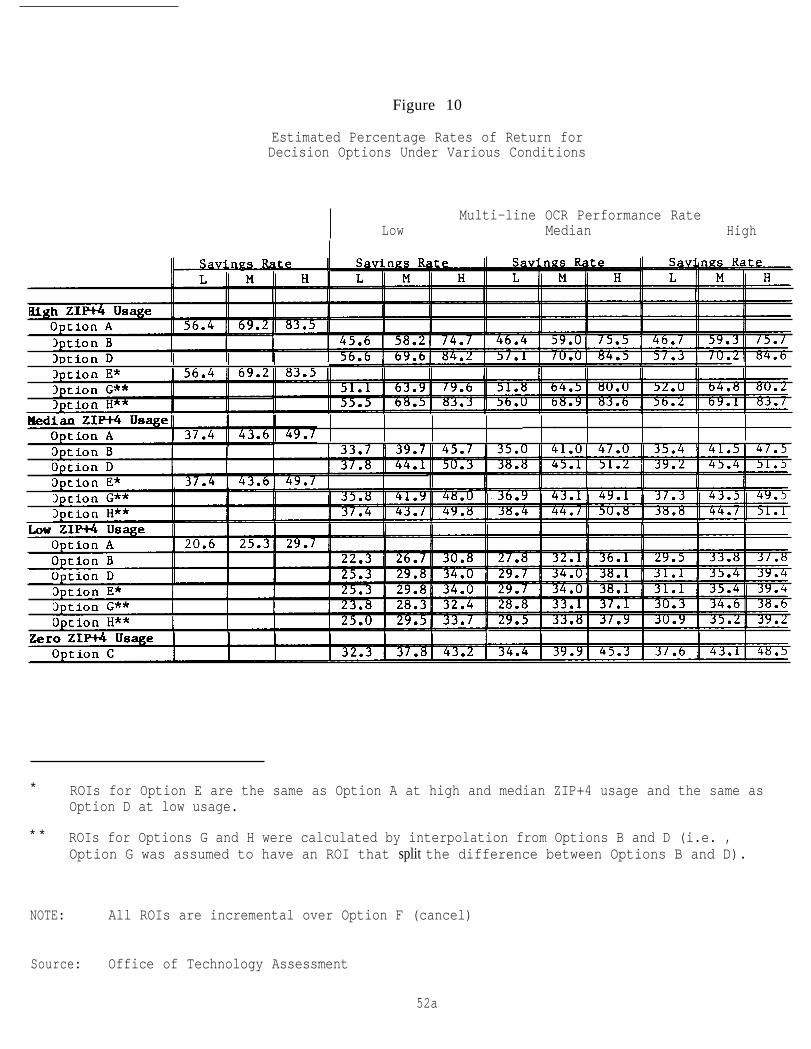
Figure 10
Estimated Percentage Rates of Return forDecision Options Under Various Conditions
Multi-line OCR Performance RateLow Median High
I I I
* ROIs for Option E are the same as Option A at high and median ZIP+4 usage and the same asOption D at low usage.
* * ROIs for Options G and H were calculated by interpolation from Options B and D (i.e. ,Option G was assumed to have an ROI that split the difference between Options B and D).
NOTE: All ROIs are incremental over Option F (cancel)
Source: Office of Technology Assessment
52a

Option DOption HOptions A and EOption GOption B
Highest ROI
Lowest ROI
Highest ROI
Low ZIP+4 Usage
Option COptions D and EOption HOption GOption BOption A Lowest ROI
Thus, at high or median ZIP+4 usage, options D and H have the highest ROIs. And
at low ZIP+4 usage, options C, D, E, and H have the highest ROIs.
more
ROI,
Net present values. Use of ROIs for decisionmaking has a serious limitation. When
than one option clears the hurdle rate (that is, has more than the minimum required
in this case 15 percent), the ROI itself gives no indication of the cash flow
differences of the various options as a basis for comparing the options. An alternative to
ROI frequently used in capital investment decisionmaking is net present value (NPV).
NPV discounts the cash flows of each option at the hurdle or threshold rate, in this study
15 percent.
Estimated NPVs for all options under all conditions (except option F, cancel, which
has a negligible NPV of $232,199) are shown in figure 11. The relative ranking of the
options based on NPV is the same as the ranking based on ROI, except for option C.
However, there is a significant difference in the absolute rankings when using NPV.
53

Figure 11
Estimated Net Present Values (in billions of dollars)for Decision Options Under Various Conditions
Multi-line OCR Performance RateLow Median High
I L I M I H I L I M I H I L I M H I L M I HI I I
High ZIP+4 UsageOption A 1.50 1.91 2.33Option B 1.07 1.42 1.77 1.12 1.48 1.84 1.14 1050 1.86Option D 1.51 1.93 2.35 1.57 1.99 2.42 1.59 2.01 2.44Option E* 1.50 1.91 2.33Option G** 1.29 1.68 2.06 1.35 1.74 2.13 1.36 1.76 2.15Option H** 1.47 1.88 2.29 1.53 1.94 2.36 1.55 1.96 2.38
Median ZIP+4 UsageOption A 1.05 1.38 1.71Option B 0.82 1.12 1.41 0.90 1.21 1.51 0.93 1.24 1.55Option D 1.09 1.43 1.77 1.17 1.52 1.87 1.19 1.55 1.90Option E* 1.05 1.38 1.71Option G** 0.96 1.28 1.59 1.04 1.37 1.69 1006 1.40 1.73Option H** 1.06 1.40 1.73 1.14 1.49 1.83 1.16 1.52 1.87
Low ZIP+4 UsageOption A 0.21 0.41 0.61Option B 0.30 0.50 0.70 0.59 0.83 1.07 0.70 0.95 1.20
1.03 1.30 0.86 1.15 1.43
Zero ZIP+4 UsageOption C 0.58 i 0.78 0.99 0.69 0.91 1.13 0.87 1.11 1.36
* NPVs for Option E are the same as Option A at high and median ZIP+4 use and the same asOption D at low usage.
* * NPVs for options G and H were calculated by interpolation from Options B and D (i.e. ,Option G was assumed to have a NPV that split the difference between Options B and D).
NOTE: All NPVs are incremental over Option F (cancel).
Source: Office of Technology Assessment
53a
Under conditions of high and medium ZIP+4 usage, high savings, and high multi-line
performance, option D (automatic conversion) has about a 5 percent and 11 percent
higher NPV, respectively, than option A (single-line OCR). At low ZIP+4 usage, another
things being equal, the option D advantage increases to a substantial 134 percent or
about $820 million in NPV. At a low savings rate (along with low ZIP+4 usage and high
multi-line performance), the relative advantage of option D over A increases further to
about 310 percent although the absolute advantage decreases to about $650 million in
NPV. Even at low multi-line performance, with low ZIP+4 usage option D has a 53 to 119
percent relative advantage in NPV and a $320 to 250 million absolute advantage in NPV,
at a high and low savings rate, respectively. Option H (90-10 split procurement) also has
a higher NPV than option A under almost all conditions. Option G (50-50 split
procurement) has a significant although somewhat smaller advantage over option A at
low ZIP+4 usage.
The net NPV advantage or disadvantage of options D, G, and H compared to option
A is shown in figure 12 for various conditions. Relative as well as absolute comparisons
are included for low ZIP+4 usage. The results clearly show that options D and H have a
marginally higher NPV at high and medium ZIP+4 usage under all conditions and a
substantially higher NPV at low ZIP+4 usage. On the other hand, option G has a
marginally lower NPV than option A at high ZIP+4 usage and median ZIP+4 usage with
low or median multi-line performance, a marginally higher NPV at median ZIP+4 usage
and high ZIP+4 performance, and a substantially higher NPV under all low ZIP+4
conditions.
Another way to present these results is shown in figure 13. Here, the 80 percent
credible values are shown for each option along with the overall net present value for
54

Figure 12
Comparison of Net Present Values (in percentages and billions of dollars)of Options D, G, and H with Option A
Multi-line OCR Performance RateLow Median High
Savings Rate Savings Rate Savings RateLow Med. High Low Med. High Low Med. High
High ZIP+4 UsageOption D ($) 0.01 0.02 0.02 0.07 0.08 0.09 0.09 0.10 0.11Option G ($) -0.21 -0.23 -0.27 -0.15 -0.17 -0.20 -0.13 -0.15 -0.18Option H ($) -0.03 -0.03 -0.04 0.03 0.03 0.03 0.05 0.05 0.05
Median ZIP+4 UsageOption D ($) 0.04 0.05 0.06 0.12 0.14 0.16 0.14 0.17 0.19Option G ($) -0.09 -0.10 -0.12 -0.01 -0.01 -0.01 0.01 0.02 0.03Option H ($) 0.01 0.02 0.02 0.09 0.11 0.12 0.11 0.14 0.16
Low ZIP+4 UsageOption D (%) 119 71 53 257 151 113 310 181 134
($) 0.25 0.29 0.32 0.54 0.62 0.69 0.65 0.74 0.82Option G (%) 81 46 34 209 127 92 271 156 116
($) 0.17 0.19 0.21 0.46 0.52 0.56 0.57 0.64 0.71Option H (%) 110 66 49 248 146 105 300 176 131
($) 0.23 0.27 0.30 0.52 0.60 0.67 0.63 0.72 0.80
Notes: Option D= Automatic conversion.Option G = 50-50 Split procurement.Option H = 9O-10 Split procurement.All dollar figures in billions and are net of Option A NPV from Figure 11.All NPVs are incremental over Option F (cancel).
Source: Office of Technology Assessment
54a
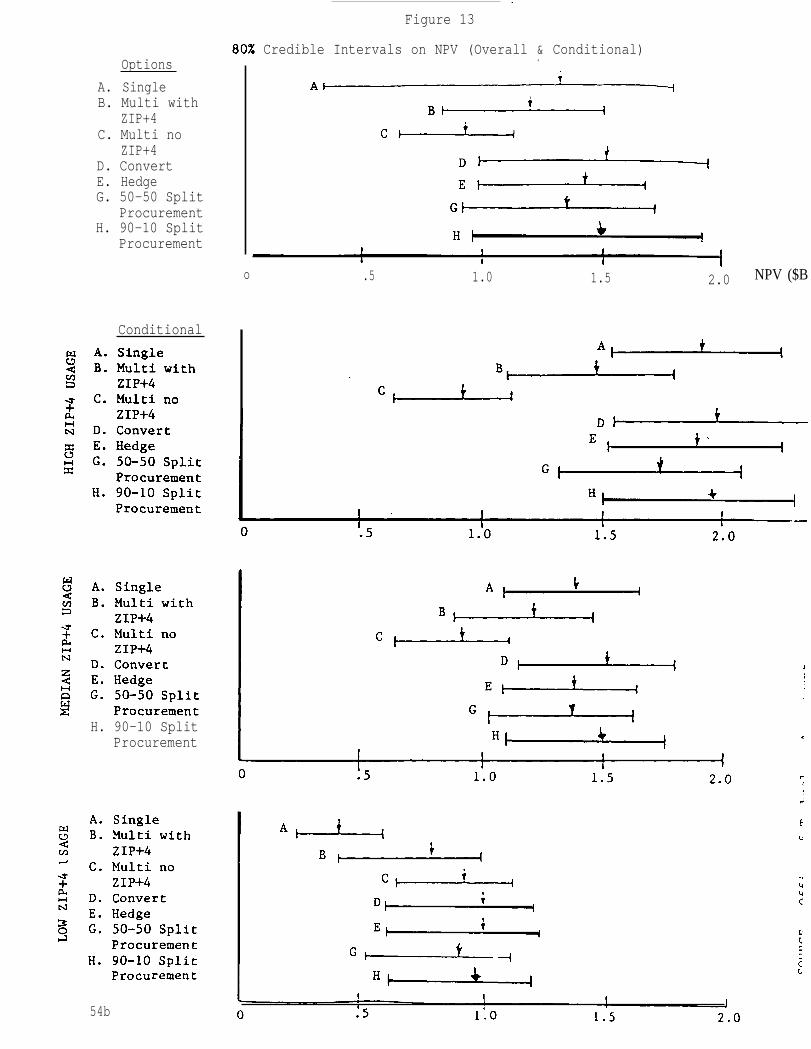
Options
A. SingleB. Multi with
ZIP+4C. Multi no
ZIP+4D. ConvertE. HedgeG. 50-50 Split
ProcurementH. 90-10 Split
Procurement
o
Conditional
H. 90-10 SplitProcurement
54b
. .
Figure 13
Credible Intervals on NPV (Overall & Conditional).
.5 1.0 1.5 2.0 NPV ($B
.
E
c.

——
.-
each option. The
NPV being above
smallest value.
ZIP+4 usage.
Figure 13
and the range
.
80 percent credible interval means that there is a 10 percent chance of
the largest value and a 10 percent chance of NPV being below the
The NPVs and credible intervals are shown overall and conditional on
shows, in effect, the ranking of the options by expected net present value
of uncertainty in NPV associated with each option, both overall and
conditional on ZIP+4 use. The ranking of the options by expected NPV is summarized
below:
Overall NPV Rank
Option DHEGABc
Low ZIP+4 Usage
Option DEHcGBA
1 highest234567 lowest
1 highest2 tie34567 lowest
Thus, option D (automatic conversion) ranks first in NPV both overall and with low
ZIP+4 usage. Option H (90-10 split procurement) ranks second in NPV overall and third
with low ZIP+4 usage. Option E
for first with low ZIP+4 usage.
OCR) rank almost identically in
relatively low (6th) in NPV, both
(hedge conversion) ranks third in NPV overall and ties
Options G (50-50 split procurement) and A (single-line
overall NPV. Option B (multi-line with ZIP+4) ranks
overall and with low ZIP+4 usage. Option C (multi-line
--

—— .— —— ——. -—
.
without ZIP+4) ranks the lowest in overall NPV, but somewhat higher (4th) in NPV with
low ZIP+4 usage. Option A (single-line) ranks the lowest in NPV with low ZIP+4 usage.
The dominance of option D (automatic conversion) can also be illustrated by
plotting the cumulative probability distributions of NPV for each option. As shown in
figure 14, for any value of NPV (incremental over option F (cancel]), the probability is
greatest for option D. For example, for an NPV of $1 billion, the probability is about 0.9
or 90 percent that option D will exceed that NPV (cumulative probability of about 0.1),
about 0.75 that option A will exceed, about 0.7 that option B will exceed, and only 0.5 (or
50 percent) that option C will exceed $1 billion.
Because option D dominants all other options under all conditions of uncertainty,
option D is stochastically dominant.
Supplemental sensitivity analysis. The basic models built in three uncertainties
(ZIP+4 usage, savings rate, multi-line performance rate). A supplemental analysis was
conducted to check the sensitivity of NPV results to changes in the purchase price of the
multi-line OCR or the number of multi-line OCR units.
The results, summarized in figure 15, showed that an increase in multi-line OCR
purchase price from $850,000 to $970,000 would have very little effect on NPV. The
effect would be to reduce NPV by about $0.02 and 0.03 billion. Likewise, an increase in
the number of multi-line OCR units from 403 to 439 (as estimated by GAO to be required
if the entire Phase 11 procurement was switched from single- to multi-line OCRs) would
cost about an additional $34.9 million (41 units x 850,000/unit), which is less than the
$40.3 million cost of a $120,000 price increase for 403 machines. Therefore, the effect
on NPV again would be very little.
56

. “
Figure 14
Cumulative Probability Distributionsof Net Present Value (Smoothed)
1.00
.50
.40
.30
.20
. 10
0
.—
Option G50-50 Split Option HProcurement Option A 90-10
0 7 .4 .6 .8 1.0 ‘2.0 2.5.2
Net Present Value (in $ billions)
n
Source: Office of Technology Assessment
56a

Figure 15
Sensitivity of Net Present Valueto Multi-line OCR Purchase Cost
NPV* with Different Multi-lineOCR Unit Costs
Multi-line Savings I ($ in billions)ZIP+4 Use Performance Rate Rate @ $750K @ $850K @ $970K
IHIGH High High 1.88 1.86 1.84
Median 1.52 1.50 I 1.48Low 1.16 1.14
Median High 1.86 1.84Median 1.50 1.48
1.121.811.46
Low 1.14 1.12 1.10Low High 1.79 1.77 1.75
Median 1.44 1.42 1.40Low 1.09 1.07 1.04
MEDIAN High High 1.57Median 1.26Low .95
Median High 1.53Median 1.23Low .92
Low High 1.43Median 1.14Low .84,
LOW High High 1.22Median ● 97Low .72
Median High 1009Median I .85Low .61
Low High .72Median .52Low .32
1.551.24.93
1.511.21.90
1.411.12
.82
1.20.95.70
1.521.21.90
1.491.18.88
1.391.09.80
1.18.93● 68
1.07 1.04.83 .80
.30 .27
* NPV for option B (multi-line OCR with ZIP+4) adjusted to reflectdifferent purchase costs.
Source: Office of Technology Assessment
56b

In sum, neither a modest
the total number of units would
.“
increase in price per unit for the multi-line OCRs or in
significantly change the NPVs.
Overall and selected year cash flows. Net present value
comparative quantitative evaluation of the decision options.
is the best basis for
However, the actual
undiscounted net
another dimension
cash flows over the 13 year payback period (1985-98) can provide
to the evaluation.
Comparative net cash flows for selected options and conditions are shown in figure
16. Option A (single-line) is estimated to show positive cash flows of $8.8. $8.24, and
$3.57 billion at high, medium, and low ZIP+4 usage. At high ZIP+4 usage, option B
(multi-line with ZIP+4)
conversion) and H (90-10
billion respectively, and
is somewhat lower at $8.14 billion, options D (automatic
split procurement) somewhat higher at $9.36 billion and 9.24
option G (50-50 split procurement) about the same at $8.75
billion. The comparisons between options change relatively little at median ZIP+4 usage.
However, at low ZIP+4 usage there is a substantial difference in net cash flows.
Option A (single-line) shows a net cash flow of $3.57 billion. But, depending on the
multi-line OCR performance rate, options D (automatic conversion) and H (90-10 split
procurement) show a net cash flow of $5 to 7.2 billion, or about $1.4 to 3.6 billion greater
than option A. Option G (50-50 split procurement) shows about $1.1 to 3.3 billion greater
cash flow than option A, and option B (multi-line with ZIP+4) shows about $0.8 to 3.0
billion greater cash flow than option A.
A comparison of yearly cash flows gives similar results. Yearly cash flows for
selected options and conditions are shown in figure 17, for the years 1994-98. By this
time, all equipment will presumably have been installed (or converted) and up and running
57
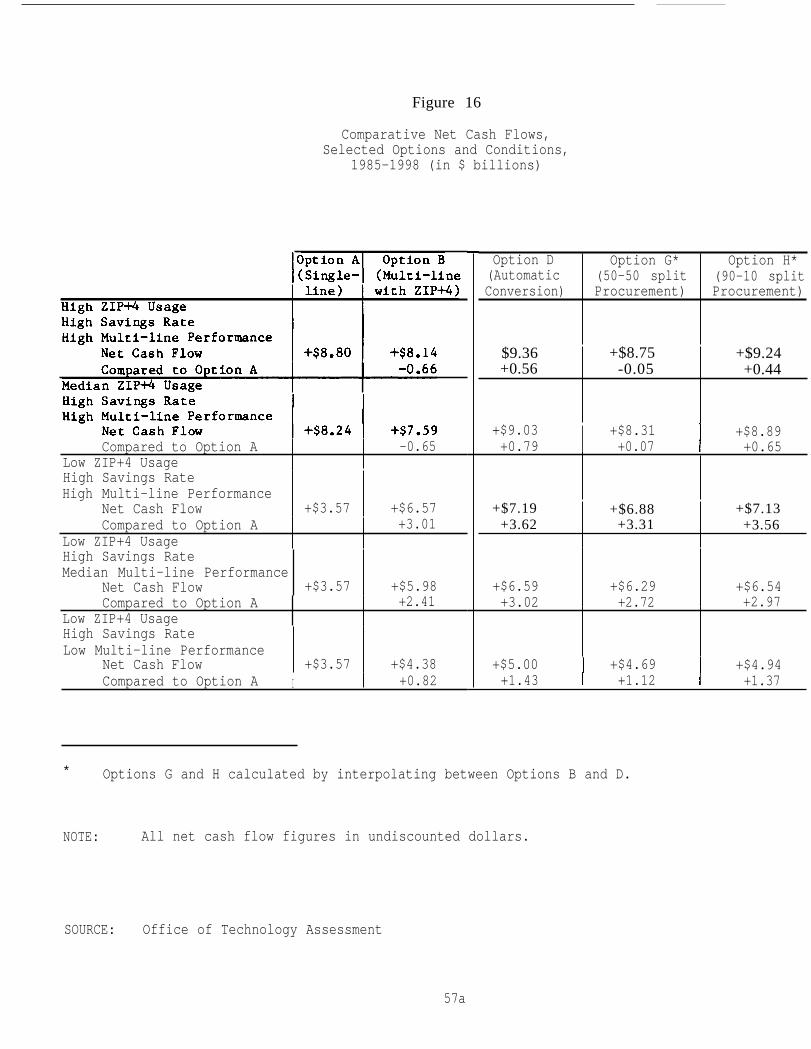
Figure 16
Comparative Net Cash Flows,Selected Options and Conditions,
1985-1998 (in $ billions)
Compared to Option A -0.65Low ZIP+4 UsageHigh Savings RateHigh Multi-line Performance
Net Cash Flow +$3.57 +$6.57Compared to Option A +3.01
Low ZIP+4 UsageHigh Savings RateMedian Multi-line Performance
Net Cash Flow +$3.57 +$5.98Compared to Option A +2.41
Low ZIP+4 UsageHigh Savings RateLow Multi-line Performance
Net Cash Flow +$3.57 +$4.38Compared to Option A I +0.82
Option D Option G* Option H*(Automatic (50-50 split (90-10 splitConversion) Procurement) Procurement)
$9.36 +$8.75 +$9.24+0.56 -0.05 +0.44
+$9.03 I +$8.31I
+$8.89+0.79 +0.07 +0.65
+$7.19 +$6.88 +$7.13+3.62 +3.31 +3.56
+$6.59 +$6.29 +$6.54+3.02 +2.72 +2.97
+$5.00I
+$4.69I
+$4.94+1.43 +1.12 +1.37
* Options G and H calculated by interpolating between Options B and D.
NOTE: All net cash flow figures in undiscounted dollars.
SOURCE: Office of Technology Assessment
57a

Figure 17
Comparative Net Cash Flows,Selected Options, Conditions, and Years
(in $ billions)
High ZIP+4 UsageHigh Savings RateHigh Multi-line Performance
Net Cash Flow 19941995199619971998
Low ZIP+4 UsageHigh Savings RateHigh Multi-line Performance
Net Cash Flow 19941995199619971998
Low ZIP+4 UsageHigh Savings RateMedian Multi-line Performance
Net Cash Flow 19941995199619971998
Low ZIP+4 UsageHigh Savings RateLow Multi-line Performance
Net Cash Flow 19941995199619971998
Option A(Single-line)
$0.870.941.021.111.20
0.430.460.500.540.59
0.430.460.500.540.59
0.430.460.500.540.59
Options B (Multi-line)D (Automatic Conversion)
G (50-50 Split Procurement)H (90-10 Split Procurement)
$0.941.021.111.201.30
0.870.931.011.091.17
0.800.860.931.001.08
0.610.660.710.770.83
Options B, G, D, H ICompared toOption A I
$0.070.080.090.090.10
0.440.470.510.550.58
I0.370.400.430.470.49
0.180.200.210.230.24
Source: Office of Technology Assessment
57b

at optimal performance. Options B, D, G, and H will by that time look exactly the same
-- all multi-line OCRs. The single-line OCRs procured under options D, G, and H will
have been converted to multi-line capability. Option A will continue to be solely single-
line OCRs.
With high ZIP+4 usage, option A shows an annual net cash flow of about $870
million to $1.2 billion from 1994 to 1998. Options B, D, G, and H show almost identical
annual cash flows, only slightly higher by about $70 to $100 million per year. However,
at low ZIP+4 usage, the differences again become substantial. With high multi-line
performance, options -B, D, G, and H show between $440 and 580 million per year
additional net cash flow compared to option A, from 1994 to 1998. With median multi-
line performance, the advantage of options B, D, G, and H ranges from $370 to 490
million per year. And even at low multi-line performance, the advantage over option A,
while reduced, is still significant at $180 to 240 million per year.
58
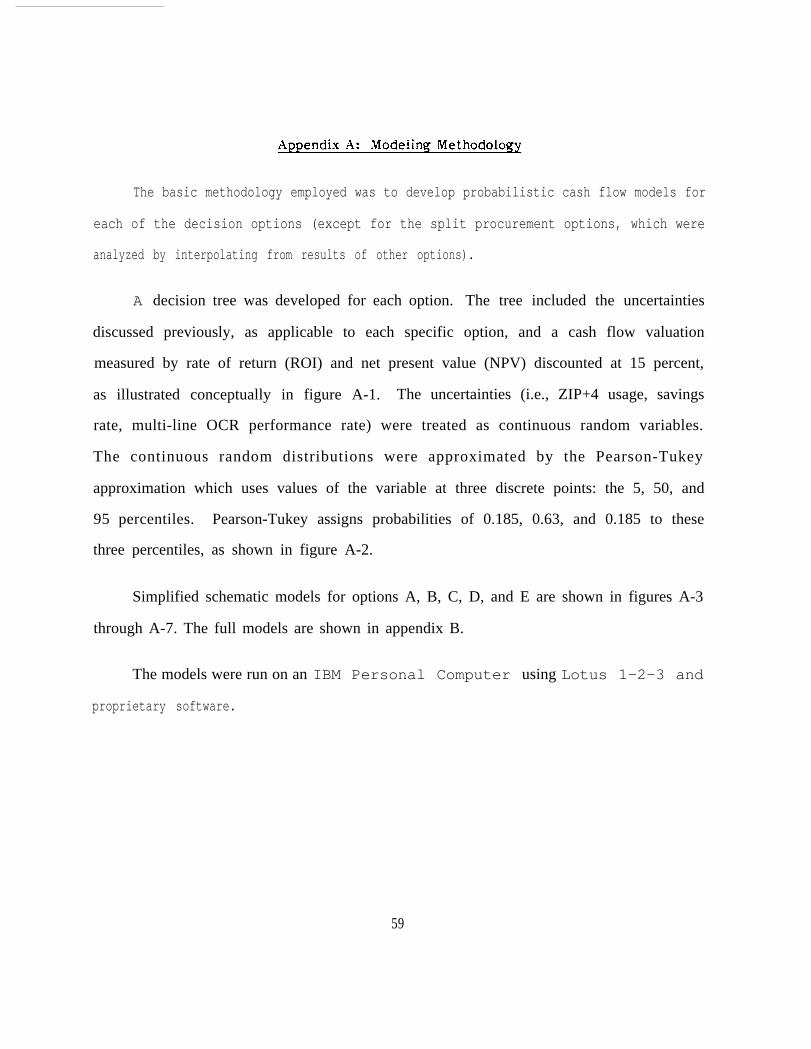
The basic methodology employed was to develop probabilistic cash flow models for
each of the decision options (except for the split procurement options, which were
analyzed by interpolating from results of other options).
A decision tree was developed for each option. The tree included the uncertainties
discussed previously, as applicable to each specific option, and a cash flow valuation
measured by rate of return (ROI) and net present value (NPV) discounted at 15 percent,
as illustrated conceptually in figure A-1. The uncertainties (i.e., ZIP+4 usage, savings
rate, multi-line OCR performance rate) were treated as continuous random variables.
The continuous random distributions were approximated by the Pearson-Tukey
approximation which uses values of the variable at three discrete points: the 5, 50, and
95 percentiles. Pearson-Tukey assigns probabilities of 0.185, 0.63, and 0.185 to these
three percentiles, as shown in figure A-2.
Simplified schematic models for options A, B, C, D, and E are shown in figures A-3
through A-7. The full models are shown in appendix B.
The models were run on an IBM Personal Computer using Lotus 1-2-3 and
proprietary software.
59

..—
Figure A-1
Probabilistic Cash Flow Model(Illustrated for Option A: Single-Line OCR)
UNCERTAINTIES
ZIP+4USAGE
CASH FLOW VALUATION
SAVINGS RATE
The uncertainties are continuous random variables. A simplifiedrepresentation of these distributions is used in the analysis (asexplained in figure A-2.
Source: Office of Technology Assessment

Continuous
Figure A-2
Simplified Representation of ContinuousProbability Distribution
Distribution
5%
F.05
F.95 VALUE
.63
Pearson-TukeyApproximation ofContinuous Distribution
F.05
F.50
F.95 VALUE
Model Represen-tation ofApproximation
‘.95
.185
.185
This representation is a Pearson-Tukey approximation. It was chosen becauseit provides an excellent approximation to a wide range of continuous probabilitydistributions, as explained in Keefer and Bodily (1983).
Source: Office of Technology Assessment61
,

—
Figure A-3.Simplified Schematic Model for
Option A: Single-Line OCR
ZIP+4 USAGE
High
.185Median
.185\ Low
(See figures 7, 8, 9)
SAVINGS RATE
High (100%)
.185 / ’Median (90%)
.185
\ LOW (80%)
SOURCE: Office of Technology Assessment
62
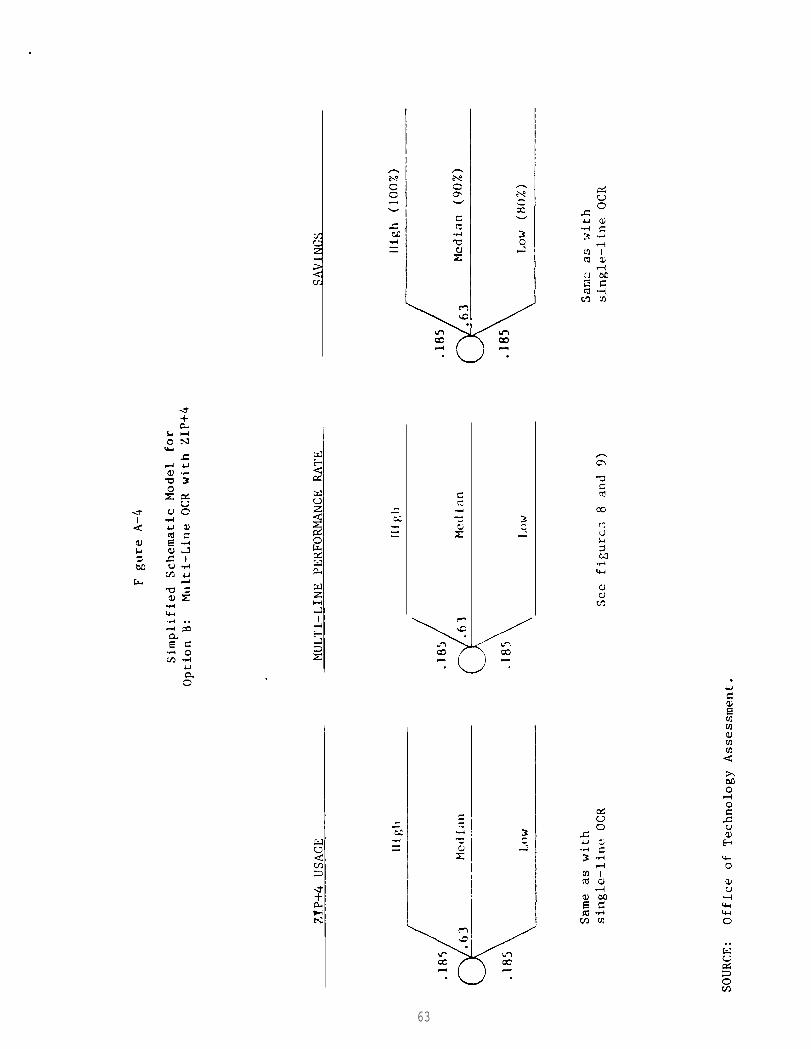
.
.
I
I
63

— —
.
Figure A-5
Simplified Schematic Modelfor Option C: Multi-Line OCR Without ZIP+4
MULTI-LINE PERFORMANCE RATE
\ Low
(See figures 8 and 9 atO% ZIP+4 usage)
SAVINGS RATE
High (100%)/
.185 /
Same as for all otheroptions
SOURCE: Office of Technology Assessment.
64
r
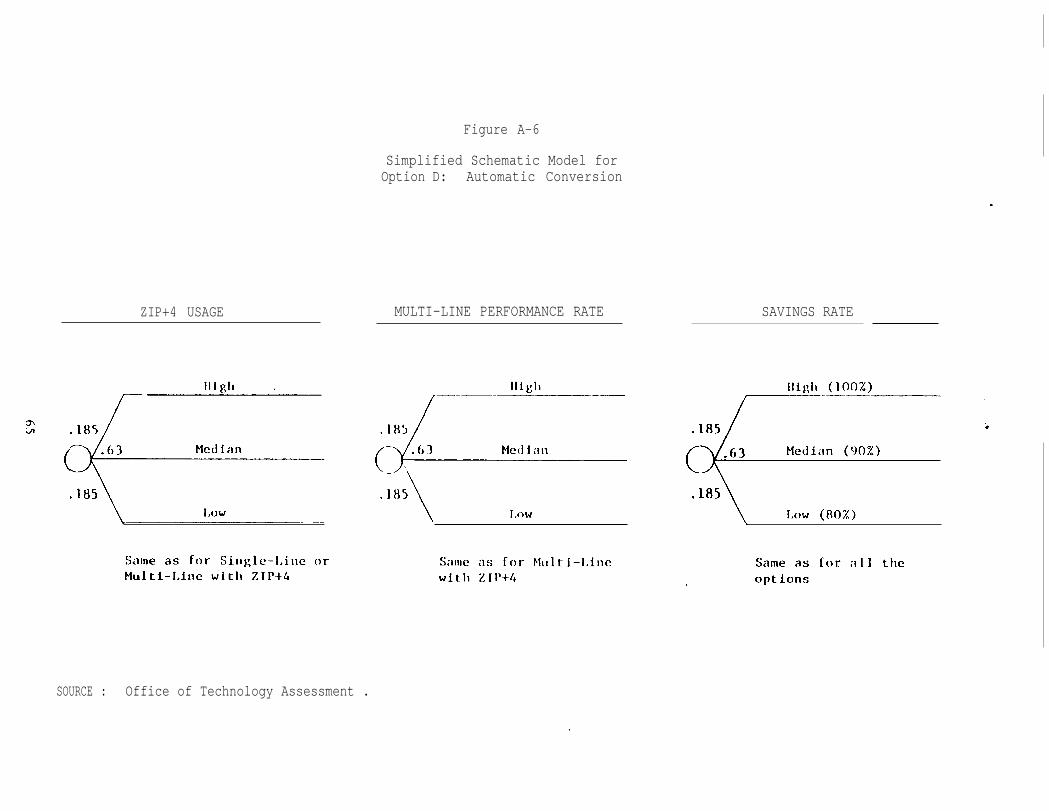
.
Figure A–6
Simplified Schematic Model forOption D: Automatic Conversion
ZIP+4 USAGE MULTI-LINE PERFORMANCE RATE SAVINGS RATE
SOURCE : Office of Technology Assessment .
.
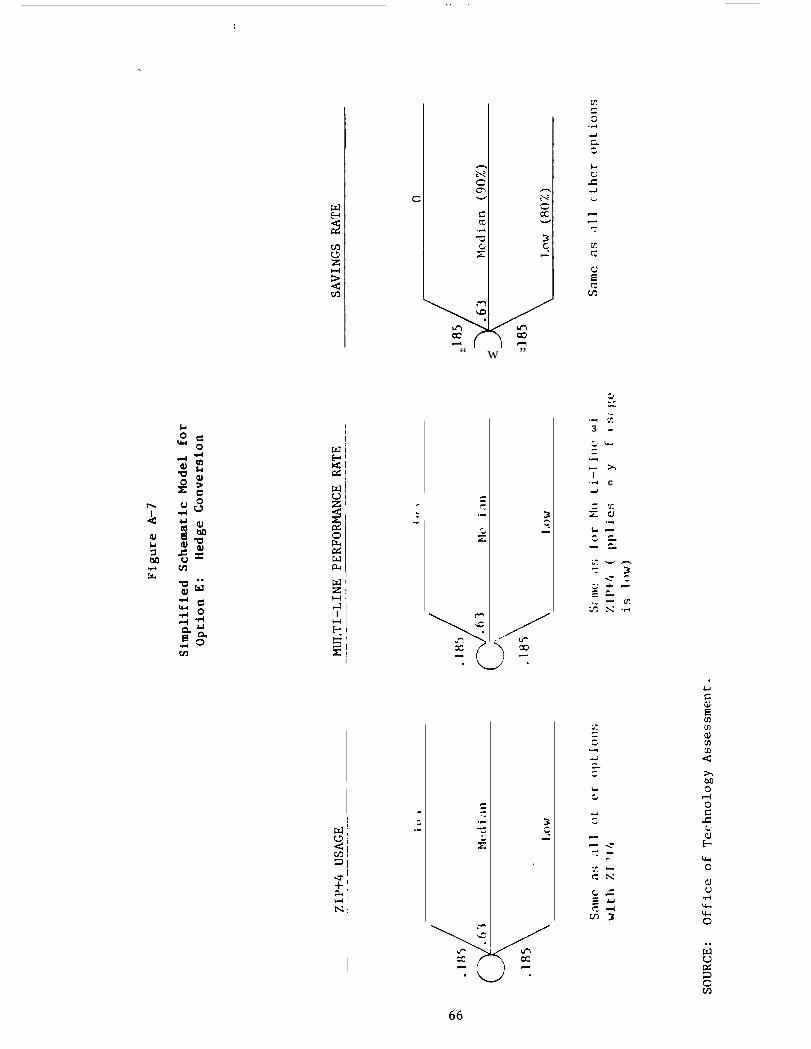
—————
;
I
.. .
“ w ”
,43
ii
7’c
.
...- .“
L
Unm
I
mI
han0
. ...-
/\.
Lr.0
I

——
Appendix B: Detailed Cash Flow Models and Results
The detailed cash flow model and results for options A, B, C, D, and F are
presented in this appendix. For each option, a complete probabilistic event tree is
shown, along with the incremental rate of return (ROI) and net present value (NPV) over
option F (cancel) for each condition of all options modeled. Also for each option,
detailed year-by-year cash flows are shown for each condition.
The detailed cash flows show two
total cash flows of the option modeled.
less cash flows for Option F (cancel).
All dollar figures are in thousands,
ROIs and NPVs. The first ROI and NPV are for
The second ROI and NPV are for total cash flows
and are carried to the nearest thousand dollars.
67

—...——— ——————— .... -—
.
Figure B-1
Cash Flow Model and Results forOption A: Single-Line OCR
INCREMENTAL
LABEL ROI (%) NPV (SB)
ZIP+4 USAGE SAVINGS RATE
111
112
113
121
83.5 2.33
● 169.2 1.91
56.4 1.50
49.7 1.71HIGH
185
.
.185
43.6 1.38
1.05
.185LOW
131 .61
132 25.3 .41
133 .21
SOURCE : Off ice of Technology Assessment
68
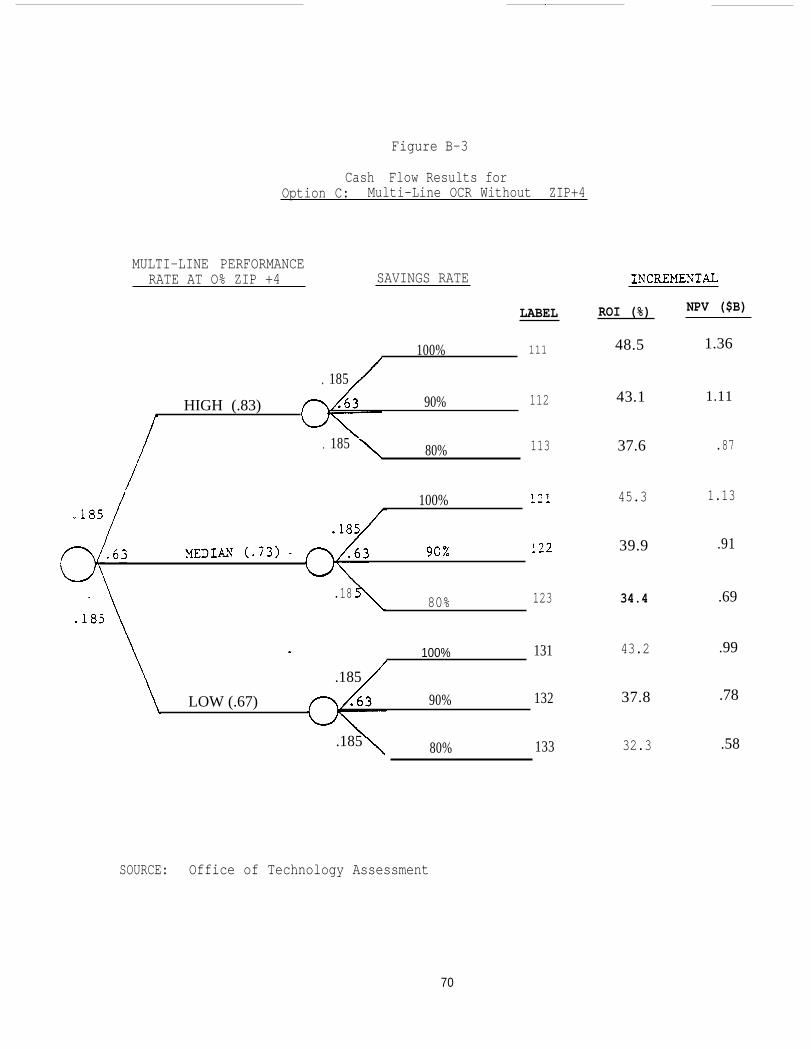
.-
Figure B-3
Cash Flow Results forOption C: Multi-Line OCR Without ZIP+4
MULTI-LINE PERFORMANCERATE AT O% ZIP +4 SAVINGS RATE
LABEL ROI (%) NPV ($B)
111 48.5 1.36100%
. 185
HIGH (.83) 90%
. 185 80%
43.1 1.11112
113 37.6 .87
45.3 1.13100%
.9139.9
.1880% 123 .69
.99
34.4
100% 131
.185
LOW (.67) 90% 132
.185
. 43.2
37.8 .78
80% 133 32.3 .58
SOURCE: Office of Technology Assessment
70
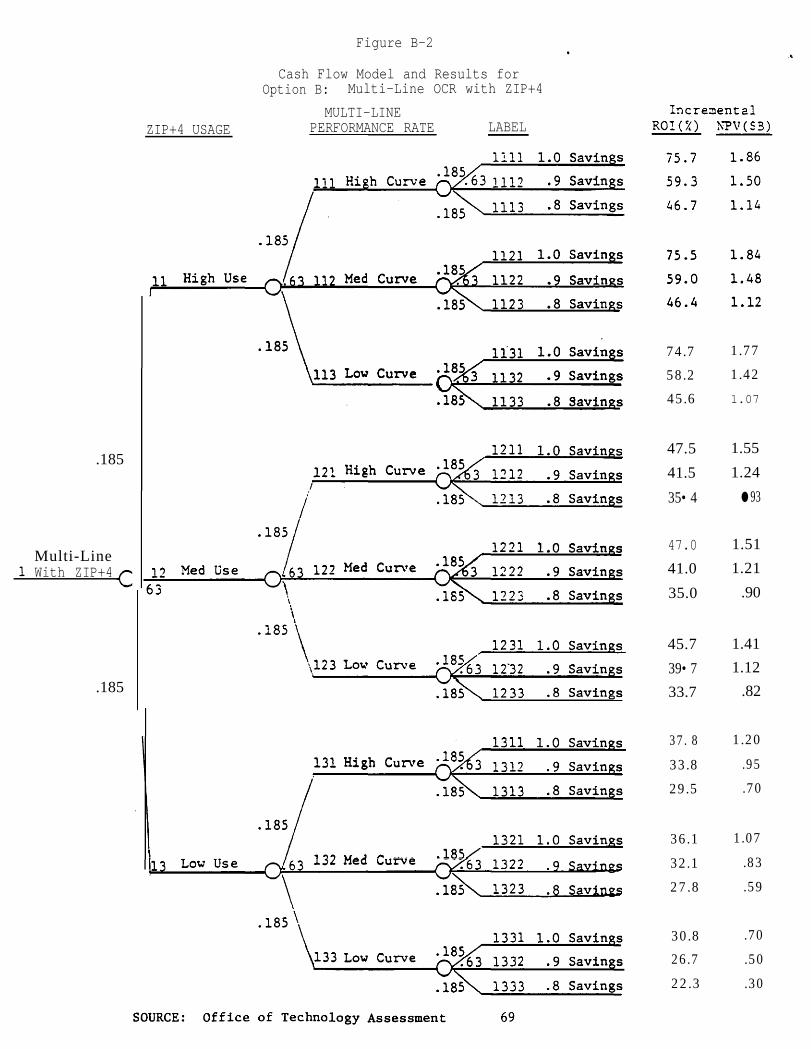
Figure B-2
.185
Multi-Line— With ZIP+4
.185
ZIP+4 USAGE
Cash Flow Model and Results forOption B: Multi-Line OCR with ZIP+4
MULTI-LINEPERFORMANCE RATE LABEL
74.7 1.77
58.2 1.42
45.6 1.07
47.5 1.55
41.5 1.24
35• 4 ● 93
47.0 1.51
41.0 1.21
35.0 .90
45.7 1.41
39• 7 1.12
33.7 .82
37. 8 1.20
33.8 .95
29.5 .70
36.1 1.07
32.1 .83
27.8 .59
30.8
26.7
22.3
.70
.50
.30
Incre:!lental RO!(I.) i\'"PV(S3)
1.0 Savin s 75.7 1.86
.9 Savin s 59.3 1.50
.8 Savings 46.7 1.14
1121 1.0 Savin s 75.5 1.84
11 High Use 1122 59.0 1.48
1123 .8 Savin s 46.4 1.12
1131 1.0 Savinss
113 Low Curve .1% 1132 .9 Savings
~ 1133 .8 Savings
1211 1.0 Savin s
121 High Curve I:! 12 .9 Savin s .'
'lsi 1213 .8 Savings
1221 1.0 Savin s
1 C 12 Med Use 122 Med Curve 1222 .9 Savin s 63 \ 1223 .8 Savin s
\ \ \ \
.185 \ 1231 1.0 Savings
\ 123 Lo,.,~ Curve 12"32 .9 Savin s
1233 .8 Savings
1311 1.0 Savings 131 High Curve .1% 1312 .9 Savings O·
.1~ 1313 .8 Savings
1321 1.0 Savings .. -"" .... 1 _ ~ Curve 1 Low Use j,"~ nea 1322
1323 .8 Savin~s
1331 1.0 Savin s 133 Low Curve 1332 .9 Savin s
1333 .8 Savings
SOURCE: Office of Technology Assessment 69

Figure B-4
Cash Flow Results foroption D: Automatic Conversion-
MULTI-LINEPERFORMANCE RATE
Inc rementa lZIP+4 USAGE LABEL SAVINGS RATE
84.5
70.0
57.1
2.42
1.99
1.57
84.2
69.6
56.6
2.35
1.93
1.51
.18551.5 1.90
45.4 1.55
39.2 1.19
/.185/
51.2
45.1
38.8
1.87
1.52
1.17.
i
1.7750.3
44.1
37.8
1.43.185 1.09
39.4 1 .43
35.4 1.15
31.1 .86
I
38.1
34.0
29.7
1.30
1 . 03
.75’. .
.9334.0
29.8
25.3
.70
.46
SOURCE: Office of Technology Assessment 71
11 High Use
...;,l....-.-..... c ..... on_v_e_r ...... t----1d 12 t.63 I
\
!-1ed Use
1~1 Hi~h Cu:ove
/ .lsi Med Curve
\ .183 \
113 Low Curve
121 High Curve
I I
/ ()f63 122 Mec Cun'c
\
.185 \ \
'-. 123 Lo~ Cun'e
131 High Curve
132 Med Curve Lo\o1 Use '.~~--------~
.185
Curve
.9 Savings
1113 .8 Savings
1121 1. a Savin s
1122 .9 Savin s
1123 .8 Savin s
1131 1.0 Savings
.9 Savings
.8 Savings
1211 1.0 Savings
1:212 .9 Savings
1213 .8 Savings
122J. 1.0 Savings .185
6," 0.;' 3 1 ':'.,., .9 Savings
.185'. 1223 .8 Savings
1231 1.0 Savin s
1232 .9 Savin s
1233 .8 Savings
1311 1. a Savin s
, -, i --'-- .9 Savin s
1313 .8 Savings
1321 1.0 Savings
1322 .9 Savings
1323 .8 Savings
1331 1.0 Savin s
1332 .9 Savings
1333 .8 Savings
RO! ( :0 ~"v ( S B )
84.6
70.2
57 • 3
2.44
2.01
1.59
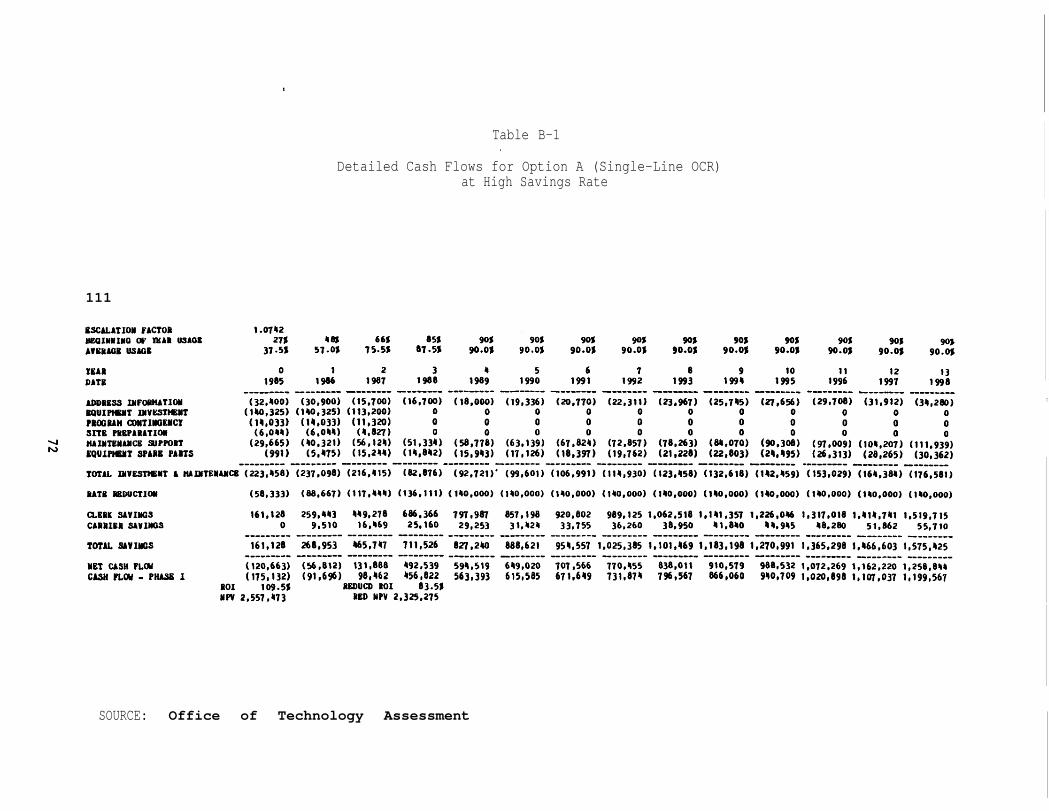
t
Table B-1. .
Detailed Cash Flows for Option A (Single-Line OCR) at High Savings Rate
111
I
SOURCE: Office of Technology Assessment
ISCALAtIO! Fieroa 1.01'2 HEGINIIIG 01' lEAl USAGE 21J U, 66, 85. go. gO' 90S 90' 90' 90, 90' 90J go, ,oJ AlalAGI USAGI 31·SJ 51.0' lS.S' 81.SJ go.OJ 90.0, 90.0' 90.0J 90.0J 90.0, 90.0' 90.0' 90.0, 90.0J
lEAl 0 2 1 , 5 6 7 8 9 10 11 12 13 PAta 1985 1986 1981 1988 1989 1990 1991 1992 1993 un 1995 1996 1991 1998 --------- --------- --------- --------- --------- --------- --------- --------- --------- --------- --------- --------- --------- ---------ADDIUS DlFOIJUTlON (32._00) (30,900) 05.700) U6.700) ( 18.000) (19.336) (20,770) (22.311) (23,967) (25,7'5) (21 ,656) (29.108) ()1.912) U'.280) &QUI,...t DVESTHBlt (140.325) (nO,325) (113.200) 0 0 0 0 ° 0 0 0 0 ° 0 'IOODM COIItllOEICr ( 14.0l}) ( 111.033) (11,320) 0 0 0 0 0 0 0 0 0 0 0 SItE PlEPI.ltION (6.0") (6,0") ('.821 ) ° 0 0 0 0 0 0 0 0 ° ° " ",lIItE.AllCE SUPPOIt (29,665) "0.]21) (56 .12') (51.33_) (58.178) (63,119) (67.824) (72,851) (78,26) (84,070) (90,]08) (97.009) (10 ... 207) (111.939) ....., EQUIPHllt SP'II 'Irrs (991) (5.'n) ( 15.2") (1'.8112) (15.'43) (11.126) <18.397) (19.762) (21,228) (22.803) (211,_95) (26.313) (28,265) C30,362)
--------- ----~---- --------- --------- --------- --------- --------- --------- --------- --------- --------- --------- --------- ---------tOUL D'ESntElt , "Allln.AIICI (223._58) (231.098) (216._15) (82.816) (92.72U' (99.601) (106.991) (In,930) ( 123,1158) (ll2.611) (n2.'59) ( 153,029) (1611,3'-) (176.581)
UTI IEDUCTIOII (58,333) (88.661) (111 .... ') (136,111) (1110,000) ( 1110,000) (1110,000) (1110,000) ( .. 0.000) (1'0,000) (1110,000) (1'0.000) (1110,000) (1110,000)
a.EIl SlYIIIQ3 161,128 259,110 "9,218 686.366 197 ,987 851,198 920,802 989.125 1,062,518 1,1111.357 1.226,0-' 1,311,018 1._1_.7" 1.519,115 CAlIIII SlUJIG3 0 9.510 16._69 25.160 29.253 31, _211 33.155 36,260 38.950 _1,8_0 ",9115 ",280 51,862 55,710
--------- --------- --------- --------- --.------ --------- --------- --------- --------- --------- --------- --------- --------- ---------tOTAL SlYlIICS 161,128 268,953 ~5.71J1 111.526 827,2~ 888,621 9511.557 1,025,385 1,101.'69 1.183.198 1.210,991 1,365.298 ',"'.603 1,575,425
--------- --------- --------- --------- --------- --------- --------- --------- --------- --------- --------- --------- --------- ---------nt CASH FLCJI ( 120,66]) (56,812) 131.888 1192.539 59',519 "9,020 101,566 110,1155 8)8,011 910,519 988,5)2 1,012.269 1,162,220 1,258,8" CASH FLW - PtwII 1 (115.132) (91.696) 98,"2 1156.822 563.391 615,585 611,611, 131.87' 196,561 866,060 "0.709 1,020,898 1,107,031 1,199.567
101 109.5J IEPUCP 101 8].5' IPV 2,557,'13 lED IPV 2,325.275

Table B-1 (continued)
—------- ---------,162,220 1,258,844,107,037 1,199,567
131
=x===sx=xc*=sz8======xm==xxg==*===:*================================== =========*================================a,=========a,=====.===*===========8==8======m===**=`==,===
SOURCE: Office of Technology Assessment
I

1
Table B-2
Detailed Cash Flows for Option A (Single-Line OCR)at Median Savings Rate
412,572
SOURCE: Office of Technology Assessment

Table B-3
Detailed Cash Flows for Option A (Single-Line OCR)at ‘Low Savings Rate
113
SEDUCED SAVINGS To 80%
AVERAGE USEAGE 37.5% 57.0$ 75.5% 87.5$ 90.0$ 90.0; 90.0% 90.0% 90.0% 90.0% 90.0% 90.0% 90.0% 90.0%
SOURCE: Office of Technology Assessment

Table B-4;
Detailed Cash Flows for Option B (Multi-Line with ZIP+4)at High Performance Rate and High Savings Rate
1111
(140,000) (140,000) (140,000) (140,000)
SOURCE: Office of Technology Assessment
I

Table B-4 (continued)
. . .
1995 19% 1997 1998
1311
SOURCE: Office of Technology Assessment
I

1112
1212
1312
1113
1213
1313
Table B-5
Detailed Cash Flows for Option B (Multi-Line OCR with ZIP+4)at High Performance Rate and Median or Low Savings Rate
8=8==8s*888=c8==s=8s8888=88=x8===8=====*=8===*======z================= *================8=========88==88888888=8=B8ss8888=8==x8888x88*c8c=xs= ==sx=xx===s
PRICE PER OCR
DATE
$850 NUMBER
1985 1986 1987
(131,525) (105,970) (66,809)
(151,173) (129,829) (97,288)33.8% RED NPV
655 i
1988 1989 1990 1991 1992 1993 1994 1995 19% 1997 1998- - - - - - - - -—------ —------- - - - - - - - - - - - - - - - - - - - - - - - - - - - - - - - - - - - - - -
(53,599) 14,436 144,947- - - - - - - - - —------- - - - - - - - -
631,176 688,397 749,864 815,892 886,8191,501,261
963,009 1,044,853 1,132,769
(132,571) (76,647) 49,971 622,361 679,959 742,711 810,433 884,692,237,034
963,009 1,044,853 1,132,769
(173,044) (145,310) (101,990) 597,271 646,205 698,770951,878
755,236 815,891 881,047 951,038 1,026,222
(151,201) (104,491) 937 524,022 573,524 627,519 685,925 749,954 817,742 888,806 965,143927,103
(183,634) (161,290) (128,609) 508,115 550,434 595,893 644,725 697,181 753,528 814,057 879,077699,882
●
SOURCE: Office of Technology Assessment
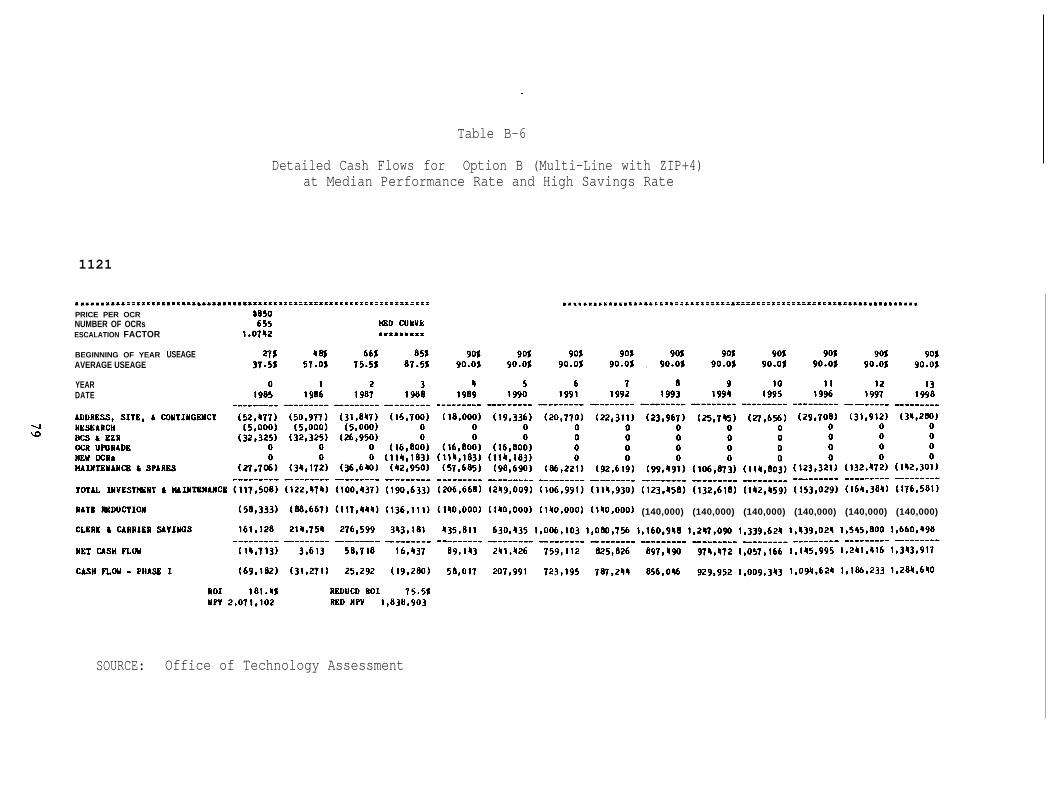
.
Table B-6
Detailed Cash Flows for Option B (Multi-Line with ZIP+4)at Median Performance Rate and High Savings Rate
1121
====x=====:==z=:=s=s=8===xx====:===z==x=xs========xxxxc===x=========== ========::=:=x:=xs:=x==s6xz::====az========x======x=a=8zsx==:z=ss=::== PRICE PER OCRNUMBER OF OCRsESCALATION FACTOR
BEGINNING OF YEARAVERAGE USEAGE
YEARDATE
USEAGE
(140,000) (140,000) (140,000) (140,000) (140,000) (140,000)
SOURCE: Office of Technology Assessment

1
Table B-6 (continued)
00 o
1221
•• = •• aa •• :.: •••••••••••••••••••••••••••••••••••••••••••• ==== •••••••• ==.a ••• a •••••• = •••• c •••••••••••••••••••••••••••••••••••••••••••••••••••••••••••• :_: ••••• : ••••••• ::::::
BIOI.IlMO Of 1111 USIAGK 12' 2~ 33' .... , 51' 611, 76' 18' 821 8" 87J 90J 90J 90J &VEIAGE USlAOI 11.5' 28.0' 38.5J "7.5J 57.5' 70.0, 77.0S 80.0S 83.0' 85.5' 88.5. 90.0' 90.0' 90.0,
D1TE 1985 1986 1987 1988 1989 1990 1991 1992 1993 19911 1995 1996 1997 1998 --------- --------- --------- --------- --------- --------- --------- --- ---
.IY'I'.a1 DCYESTHUT • '-.!I!!!!!!!!C! (111 i508) 1122.11711) (100._11) (190!6]]) (206!668) (2"'e009) (I06 e991) (11_,930) (123,_58) (132.618) (1"2.1159) (153.029) ( 1611.3811) (116.581) Ava ... . ""3:556) . (59:889) <13.889) (89 ....... ) (108.889) (119.118) (12 ......... ) (129.111) (133.000) (131.667) (1 .. 0.000) (1 .. 0.000) (1"0.000) IlTE IlDUCTIOli TOTll. SAYINGS
MET CASH 'LOt
C~ii fLOW - riiiSE 1
1321
D~lMMlNO ut' IKll USEAOE &VillGI USE1GE
DATI
101 MPV
(Zl.222) 15.193 105."93 1"'.0111 186.298 278."35 1190.338 961."30 .0113.8112 1.133,191 1.227.922 1.332.161 1."39.02" 1.5"5.800 1.660."98
--------- --------- --------- --------- --------- --------- ------.-- --------- --------- --------- --------- --------- --------- ---------(69.531)
( i2Ii,0(6)
61.U 1.1 ..... 339
6, 9.0J
1985
(60.536)
I AI:. ""--.n.\ ,~.~~v,
121 15.0,
1986
( 19.279)
Ic.,. .. nc\ \.,5.,,"'..1,
Rt:DUCD ROI lED I"
18S 21.0J
1981
(18.22 .. )
111':1 0.111\ ".~.~ ..... "
"1.0S 1.512.1111
211J 27.0J
1988
( 11.678)
(118,80_)
30J 33.0J
1989
132 ..... ,
QQ nnc "7~''''''''''
j6J 36.0'
1990
n".661
';'oA '7.11.11 "-,vI' ........
1991
"OJ "O.OS
1993
"OJ "O.OS
1995
IIOJ
"O.OJ
1998
TOTAL INVESTHEIT I MAINTEMANCE (111.508) (122,"7") (100,"37) (190.633) (206,668) (2"9.009) (106.991) (11_.930) (123.'58) (132.618) (1 .. 2 ... 59) (153.029) (16".38 .. ) (116.581) JATE .OUL"TION ( .... 000) (23.333) (32.667) (Jt2.000) (51.333) (59.111) (62.222) (62.222) (62.222) (62.222) (62.222) (62.222) (62.222) (62,222) TOTAL SAVINGS 38.671 56.5'" 76.935 105.896 159.797 266.18" 83".283 896.187 962.68_ 1.03".115 1.110,8116 1.193.211 1.281.811 1.316.922
lET CASH FLOW
ClSH FLOW - PHASE 1
(92.837) (89.293) (56.169) (126.737) (98.20") ("'.936) 665.069 719.03" 111.003 839.27" 906.165 978.019 1.055.205 1.138.118
(1"1.306) (12 ... 111) (89.595) (162."5 .. ) (129.330) (15.372) 629.153 680."53 735.559 19".755 858.3 .. 2 926.6"8 1.000.022 1.078.8~1
ROI "5.2' KEDUCD 101 36.1' In 1.298,732 lED M" 1.066.533
SOURCE: Office of Technology Assessment

Table B-7
Detailed Cash Flows for Option B (Multi-Line with ZIP+4)at Median Performance and Median or Low Savings Rate
.
===========================*====:g--.-.z==============:s====::=====:== =====================:================================================ ======================:=======---.-
PRICE PER OCR $850 NUMBER 655
● ✎ ✎ ✎ ✎ ✎ ✎ ✎ ✎ ✎ ✎ ✎ ✎ ✎ ✎ ✎ ✎ ✎ ✎ ✎ ✎ ✎ ✎ ✎ ✎ ✎ ✎ ✎ ✎ ✎ ✎ ✎ ✎ ✎ ✎ ✎ ✎ ✎ ✎ ✎ ✎ ✎ ✎ ✎ ✎ ✎ ✎ ✎ ✎ ✎ ✎ ✎ ✎ ✎ ✎ ✎ ✎ ✎ ✎ ✎ ✎ ✎ ✎ ✎ ✎ ✎ ✎ ✎ ✎ ✎ ✎ ✎ ✎ ✎ ✎ ✎ ✎ ✎ ✎ ✎ ✎ ✎ ✎ ✎ ✎ ✎ ✎ ✎ ✎ ✎ ✎ ✎ ✎ ✎ ✎ ✎ ✎ ✎ ✎ ✎ ✎ ✎ ✎ ✎ ✎ ✎ ✎ ✎ ✎ ✎ ✎ ✎ ✎ ✎ ✎ ✎ ✎ ✎ ✎ ✎ ✎ ✎ ✎ ✎ ✎ ✎ ✎ ✎ ✎ ✎ ✎ ✎ ✎ ✎ ✎ ✎✎✎✎✎● ......0. . . . . . . . . . . ....*.*.** . . . . . . . . . . . . . . . . . . . . . . . . . . . . . . ● .......*. . . . . . . . . . . ....***... . . . . . . . . . . . . . . . . . . . . ● . . . . . . . . . . . . . . . . . . . . . . . . . . . . . .
SOURCE : Office of Technology Assessment

Table B-8
I
I
I
1I
II
I
I
Detailed Cash Flows for Option B (Multi-Line with ZIP+4)at Low Performance Rate and High Savings Rate
=z==ss===s===s==8==2xs8=8=s=88x=====s=8s=====c88=88=a=8=8====:======x= =====================================================*====8s===:===zs= ======88==ZX:====ZZS:=:=SS=:Z:
SOURCE: Office of Technology AssessmentII
“1
I
1131
PIlCI fli oca .850 LOW CUln: .n.tlll or oca. 655 a •• a ••• a.
ESCALATIOI "croa 1.0'1'2
UEOIIIIlllO OF IIlI USIlG& 27' II_
66' 85' 90, 90J go, 90' 90J go, 90' 90' 90J 90,
Af£IAOI USEAOE 31·51 51.0J 15.51 81.5J 90.0J gO.OJ gO.oJ go.OJ 90.01 90.0' 90.0, 90.0' 90.0' 90.0'
1IA1 0 1 2 1 Jt 5 6 7 8 9 10 11 12 13 DATI 1985 1986 1981 1988 1989 1990 199' 1992 1991 199" 1995 1996 1991 1998
--------- --------- --------- --------- --------- -------- --------- --------- --------- --------- --------- --------- --------- ---------(XI ADDRESS. SIrE. • COIITlIlOEICJ (52.'17) (50.91U 01.'1IT) (16.100) ( 18.000) (19'.336) (20.170) (22.311) (23.961) (25.1115) (27 .656) (29.708) (31.912) U'.280) ~ .£SEIICH (5,000) (5.000) (5.000) ° 0 ° ° 0 ° 0 0 0 ° 0 BCS • IZI (]2.325) (32,325) (26,950) 0 0 0 0 0 0 0 0 0 0 0 OCI UfOl'DE 0 0 0 (16,800) ( 16.800) (16.800) ° 0 ° 0 ° 0 0 0 .. .." OC .. 0 0 0 on.183) (In,183) (1111,183) 0 0 0 0 0 0 0 0 MAlIInl'la • SPARES (27.106) U".112) (36.6JeO) ("2.950) (51,685) (98,690) (86.221) (92.619) (99.1191) ( 106.813) ( '111,IOl) ( 123.121) ( 132,1112) ('-2.]01)
--------- --------- --------- --------- --------- --------- --------- --------- --------- --------- --------- --------- --------- --------TOTAL DlYESTHEIT I HlIIITE.lICE (111,508) (122,'1') (100,1131> (190,633) (206,668) (2119.009) (106,991) ( 1111,910) (123,'58) (132,618) (1112,1159) ( 153,029) "",l811) (116,581) JATE EOUt.'TIOli (58,333) (88,661) ( 111,"") ( 136,111) ( 1110,000) (1110.000) (1110,000) ( 1110,000) (no,OOO) ( 1110,000) (1110,000) ( no,OOO) ( 1110,000) ( 1110,000)
CLEII • CAIIIEI SAVINas 161,128 2111.15' 276,599 3111.181 1135,811 610,1135 918.210 1,050.815 1,128,185 1,212,5111 1.302,511 1,199,158 1,502.915 1,6111.1196
--------- --------- --------- --------- --------- --------- --------- --------- --------- --------- --------- --------- --------- ---------lET CASH FLOW ( 111,113) 3.613 58,118 16.Hl 89,1113 2111,'26 131.239 195,885 865.3Z1 939,922 1,020,053 1, 106.129 1, 198.591 1,297,'15
CiSH FLOW - ruSE I (69. i82j ni ,2ii) 25,292 ( i9,280) S8,OH 207.991 695.322 757,;0; 82;,863 895 •• 0j 972,2;0 i ,05 •• 751 ......... _.IIi ....... 0, It. ""'_ 1,1'I.J,'1UG 1 ,".Jo,o,),
101 180." UDUCO 101 7Jt.7J In 2,0011.262 IIKD In 1,712,0611

Table B-8 (continued)
1231
=xx*s:========s===*=88=========8====================8================= =:=: =:=z:=:ss==::===s=...-.-===z:=====:===x=88z======x==xs=s==x=::::z=------ :==a=scxz===s:xsz=====x==:====.
NET CASH FLW
CASH FL(ll - PHASE
1331
=x8=8cmxsccx=zsc8*=88=2cacm8s*c=c==s8==========8m*===============a---- xc====xx=x=xs===c====x=========*============s============s============ =ss==ssss2==8s========1=======
SOURCE: Office of Technology Assessment ‘
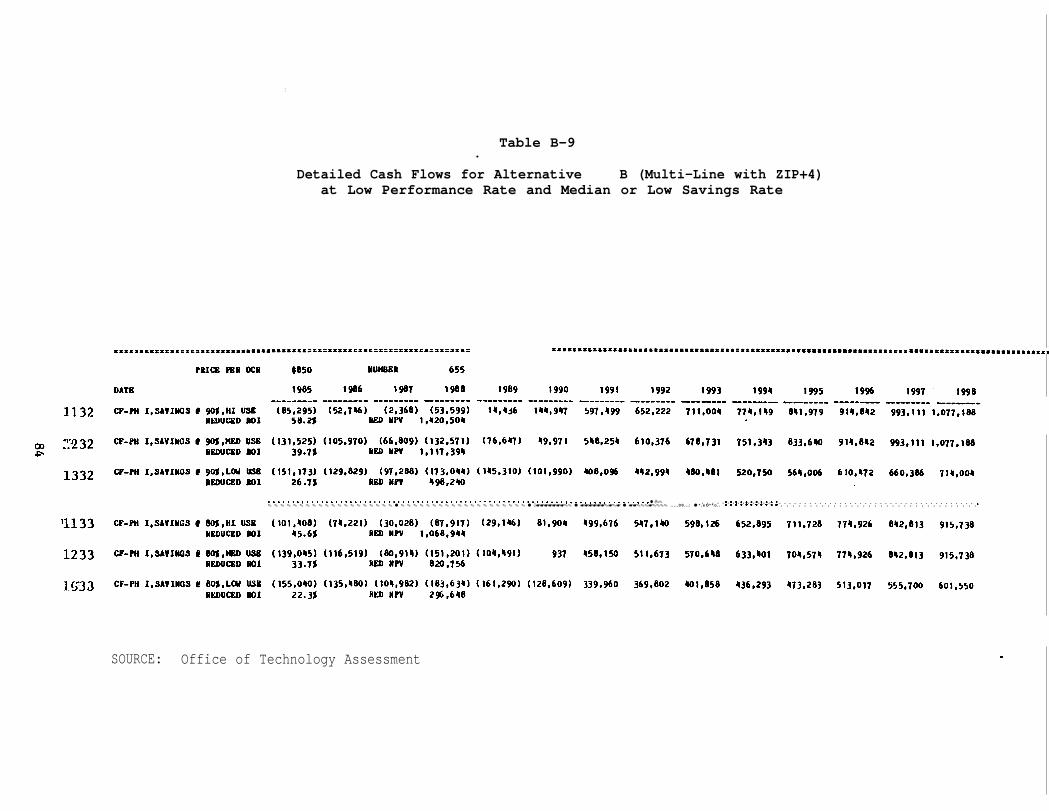
I
Table B-9.
Detailed Cash Flows for Alternative B (Multi-Line with ZIP+4)at Low Performance Rate and Median or Low Savings Rate
88xxz=x8*zs8===c===a8s8888*===88=z==================================== ============================================================x88=xz==s*===28=====8z===a=z*8x8::===xa~
. . . . . . . . . . . . . . . . . . . . . . . . . . . . . . . . . . . . . . . . . . . . . . . . . . . . . . . . . . . . . . . . . . . . . . . . . . . . . . . . ● ✌✎✎✎ ✎ ✎ ✎ ✎ ✎ ✎ ✎ ✎ ✎ ✎ ✎ ✎ ✎ ✎ ✎ ✎ ✎ ✎ ✎ ● ✎ ✎ ✎ ✎ ✎ ✎ ✎ ✎ ✎ ✎ ✎ ✎ ✎ ✎ ✎ ✎ ✎ ✎ ✎ ✎ ● ✝☛☛☛☛☛☛☛✎✎ ● ☛☛☛☛☛☛✎☛✎☛ ● ☛☛✎✎✎☛✎✎✎✎ .....00...: ● *.eO**o.. ..0.:.0.... . . . . . . . . . . . . . . . . . . . . . . . . . . . . . . . . . .. . . . . . . . . . . . . . . . . . . . . . . . . . . . . . . . . . . . . . . . . . . . . . . . . . . . . .
SOURCE: Office of Technology Assessment .

Table B-10. .
Detailed Cash Flows for Option C (Multi-Line OCR Without ZIP+4)at High Performance Rate
111
PRICE PER OCRNUMBER OF OCRs
.
,
ex> Ln
112
113
$850 CURVE FACTOR 655 0.8]
ESCALATION FICTOI 1.01112
lEU 0 1 2 3 DATI 1985 1986 1981 1988
--------- --------- --------- ---------ADDRESS. SITI. 1 COlITlIGINCY (52 .1117) (50.977) 01.8"1 ) (16,100) RESEARCII (5.000) (5.000) (5.000) 0 DCS • EZR (32.325) (]2.325) (26.950) 0 OCI UPGRADE 0 0 0 (16,800) NEW OCIia 0 0 0 (In,181) HABTBNINCE ,. SPIIES (21.706) (3".112) (36.6110) ("2.950)
-------- --------- --------- ---------'TOTAL lMVESTHEIT 1 HAlNTINllCE (111,508) (122.111") (100.11371 (190.633)
RATI REDUCTION
CLERI • CARBIER SAYINGS
NET CASH FLOi
CASH FL(II - P HAS£ 1
ROI NI'V
PRICE I'U OCR
DATE
CF-PH I,SAVINOS • go. REDUCED 801
0
82.175
---------05.33l>
(89,802)
61.5. 1.581.91;
(98.020) H.l'
0 0 0
12.056 10.066 15.010 -------- --------- ---------
(50.1118) 00.311) ( 115.623)
(85.302) (63.197) (151.3110)
REDUCD ROI u.s. .~D III" 1.J5S.11b
NUHBEP 655
1986 1981 1988
(92,508) (10,80") (158,8111) Il£.D Ii" 1,113.300
.. 5 6 7 8 9 10 11 12 13 1989 1990 1991 1992 1993 19911 1995 1996 1997 1998
--------- ----.--- --------- --------- --------- --------- -------- --------- -------- -----..;--(18.000) ( 19.336) (20.170) (22,310 (23.967) (25.1115) (27 ,656) (29.108) (31.912) U".280)
0 0 0 0 0 0 0 0 0 0 0 0 0 0 0 0 0 0 0 0
(16.600) 06.800) 0 0 0 0 0 0 0 0 on.181) (1111,183) 0 0 0 0 0 0 0 0
(51.685) (98.690) (86,221) (92,619) (99.1191) (106.873) 01'1.80) ( 123.321) ( 132.1112) (1112.301)
--------- -------- ------.- --------- --------- -------- ---_._- --------- --------- ---------(206.668) (2119.009) (106.991) (11",930) (123.'58) (132.618) (llt2.1159) (153,029) (16'.38') (116.580
0 0 0 0 0 ~ 0 0 0 0
190.058 .. 98 ..... 1 792.282 851,010 9111,219 982,oS" 1.0511,922 1.133.198 1.211.281 1.301.603
--------- --------- --------- --------- --------- --------- --------- --------- --------- ---------(16.610) 2"9."32 685,291 7]6.1110 190.761 8119.1136 912,11611 980,168 1,052.891 1.131.022
("1.736) 215.991 6A19.3711 697,558 1119,311 8011.916 86 ... 6111 928,191 991.7'" 1.011.7""
1989 1990 1991 1992 1993 1995 1996 1997 1998
--------- --------- --------- --------- --------- --------- ---------166.152 651.895 106,111 875.986
: : :' : : : : : : : : : : : : : : : : : , : : : : : : : : : : : : : : : : : :: :::::::::::::::::..::::::::::::::::::::::::::::::::::::::::::::::::::::: ;::::::::::::::::::::::::::::: CF-PH I.SAVINOS • 80J (106.231) (99.113) (71.810) (166,3112) 608.505 653.656 702.158 15'.258 810.2211
REDUCED HOI 37.6. RED NPV 870,823
z::===:::=:z==::::==s:==============z:======: ••• a:::=::=============== :=============:::========::::==:====:=c=:======= •• :za:=====ZE:=::C========a=========:==:===:==::::::
SOURCE: Office of Technology Assessment

Table B-n
1
122
1
123
Detailed Cash Flows for Option C (Multi-Line OCR Withou t ZIP+4)at Median Performance Rate
121
. . . . . . . . . . . . . . . . . . . . . . . . . . . . . . . . . . . . . . . . . . ..*.*..*. ...**..., . . . . . . . . . ● ✎ ✎ ✎ ✎ ✎ ✎ ✎ ✎ ☛ ✎ ✌ ✎ ☛ ✎ ✎ ✎ ✎ ✎ ✎ ✎ ✎ ✎ ✎ ✎ ✎ ✎ ✎ ✎ ✌ ✎ ✎ ✎ ✎ ☛ ☛ ● .0...... . . . . . . . . . .*..:*... ..*.*.,.. . . . . . . . . . ● . * * . * * * . 0 0 0 . . 0 . . . . . * * . * , . . . . . . . ......*,. . . . . . . . . . . . . . . . . . . . . . . . . . . . . . . . ...,*... . . . . . . . . . . . . . . . . . . . . . . . . . . . . . . . . . . . . . . . . . . . . . . .
a8s=s--.----===z=s==g==:====:====:=:8===-----.==========8========8====x====================--------========================================= =:====================----------.---- --..-- -------- - - . - - - - -
SOURCE: Office of Technology Assessment
PIICE PEl OCI '850 CUIYK .-aCTUI IIUHBII OF OCI. 655 0·13 BSClLlTI01 FlCTOI 1.01112
1111 0 1 ~ j .. 5 6 1 8 9 10 11 12 13 DATI 1985 1986 19111 1988 1989 1990 1991 1992 1993 199" 1995 1996 1991 1998 --------- --------- --------- --------- --------- --------- --------- --------- --------- --------- ------- --------- --------- ---------ADDIUS. 81TI. • COIITlIIODCJ (52."11) (50.911) (]1.8111) ( 16.100) ( 18.000) ( 19.336) (20.110) (22.311) (23.961) (25.1115) (21 .656) ( 29.108) (31.912) (]1I.280) lI£SEllCU (5.000) (5.000) (5.000) 0 0 0 0 0 0 0 0 0 0 0 BC8 • EZI (]2.325) (32.325) (26.950) 0 0 ° 0 0 0 0 0 0 0 0 OCI UI'QUDI 0 0 0 (16.800) ( 16.800) ( 16,800) 0 0 0 0 0 0 0 0 lEW oca. 0 0 0 (1111.183) (11".183) ( "",183) 0 0 0 0 0 0 0 0 KlllTElllICl • SPAllS (21 .1(6) 0",172) (]6,611O) ("2.950) (51,685) (98.690) (86,221) (92,619) (99.1191) (106.813) ( "",803) ( 123.321) (132."12) 0"2.301)
--------- --------- --------- --------- --------- --------- --------- --------- --------- -------.- --------- --------- --------- ---------roral. Dllt:5THKIIT • HUJlTElIllTa (111.508) ( 122."1") (100.1I]1) (190.633) (206.668) (2119.009) ( 106,990 (1n,930) (123.1158) 032.618) ( 1"2.1159) ( 153.029) (1611,38') (116,581)
IIltl .DUCTI(ll 0 0 0 0 0 0 0 0 0 0 0 0 0 0
CUll • ClIIlI1 SA V lias 82,175 12,056 10.066 15,010 190.058 1198.11'" 696,821 1118.531 fIO",012 863.13' 921 .823 996.668 1 .010.621 1.150.061 --------- --------- --------- --------- --------- --------- --------- --------- --------- --------- --------- --------- --------- ---------
00 .&T \A;,a .... w (35.333) (50 ... 18) (]0.311) ( 115.623) (16.610) 2119."32 589.835 633.601 680.6111 731.116 185.365 8113.639 906.231 913.1119 0\
CASH now - PIWSI (89.802) (85.302) (63.791) (151.3110) (111.136) 215.997 553.919 595.020 639.170 686.596 131.5"2 192.261 851.05" 91_.202.
101 611.0' IEDUCO 101 "5.U II" 1.359.013 lED II" 1.126.81~
6~5
DATI 1985 1986 1981 1988 1989 1990 1991 1992 1993 1995 1996 1991 1998 --------- --------- --------- --------- --------- --------- --------- --------- --------- --------- --------- --------- --------- ---------
CF-PH 1.SlVlIlOS' 90. (98.020) (92.508) (10.80") (158.8110 (66.1112) 166.152 11811.236 520.166 558.163 600.223 6"11.760 692.601 1113.992 199.196 IEDUCED 101 39.9' lED In 901.288
t , \ '. '. ' ••• t •• ~ :. ~ I. t. I. I. t.t.' .:. : • r .:. : . : ':' ~, : • I •• , •••• ::::1::::
CF-PH 1.5'III1Q5 • 80' (106.231) (99.713) (71.810) (166.3~2) (85.1118) 116.]08 11111.553 '115.313 "18.]56 513.850 551.977 IEDUCED 1101 3-.... lED lin 687 .701

e
.
I
Table
Detailed Cash Flows for Option Cat Low Performance
131
RATE REDUCTION o 0 0 0
B-12
(Multi-Line OCR Without ZIP+4)Rate
5 6 7 8 9 10 11 12 l a
0 0 0 0 0 a 0 0 0 0
:: ::::.*...........*. . . . . . . . . . . . . . . . . . . . . . . . . . . . . . . . . . . . . . . . . . . . . . . . . . . . . . . . . . . . . ......*..**...,..*.. ..*......*,...*.*... ,....,O.OOO,.O.OOOO.**...*.* . . . . . . . . . . .*,...,... . . . . . . . . . . . . . . . . . . . . . . . . . . . . . . . . . . . . . . . .*...*.**. ● *****.*** ● ***.*.*** . . . . . .. . . . . . . . . . . . . . . . . . . . . . . . . . . . . .
.SOURCE: Office of Technology Assessment
.

Table B-13
Detailed Cash Flows for Option D (Automatic Conversion)at High Performance Rate and High Savings Rate
1111
1.0742
o 1 2 3’1985 1986 1987 1988
71992
SOURCE: Office of Technology Assessment

Table B-13 (continued)
1211
1311
SOURCE: Office of Technology Assessment
BEGINNING OF YEAR USEAG! 12S 2lS 3lJ ,IIIIS SIS 611S 76S 78S 82S 811S eu 90S 90S 90S AVERAGE USUGE 17.5S 28.0S 38.5S "7.5S 57.5S 70.0S 77.0S 80.0S 83.0S 85.5S 88.5S 90.0S 90.0S 90.0S
DAT! 1985 1986 1987 1988 1989 1990 1991 1992 1993 19911 1995 1996 1997 1998
--------- -------- -------- --------- --------- -------- --------- --------- -------- -------- -------- --------- -------- --------TOTAL INVESTMENT l JU lNTENAJlCI (225,508) (230,11711) (186,687) (103,317) (119,352) (161,693) ( 106.991) ( 11".930) (123,1158) (132.618) (1112, .. ~~ (153,029) (1''',3811) (176.581) IIATE IIKDUCTlON tOTAL SAVINGS
II£T CASH FUN
CASH FUN - PHASE I
1311
(27 .222) (113.556) (59.889) (73.eIl9) (89.11 .... ) (108.ij89) (119,778) (12 ....... 11) (129.111) (133,000) (137.667) ('"0,000) (,110,000) ('"0,000) 75,193 132.117 237.500 386.257 591.99" 733,112 983.385 1,06".350 1,'51,916 1,2115.079 1.3117.377 1.1152.677 1.560.11'6 1.676.253
--------- --------- --------- --------- --------- --------- --------- --------- --------- --------- -------- --------- --------- ---------(177.537) (1111.912) (9.076) 209.05' 383.197
(232.006) (176.796) (112.502) 11),3311 352,071
ROI 62.0S REDUCD NOI 51.5S NPV 2,136.691 RED NPV 1.90".1193
1162,531 756,615 8211,975 899,3117 979,1160 1.067,252 1.159,6118 1.256,082 1.359.671
1129,095 720,699 786,3911 857,903 9311,9111 1,019,1129 1.108.277 1.200.899 1.300.39"
::=Z~::====E=:=::==:E:::==Z::=C==:ZE=======E&=======a==CC&=====:===c====:====:=:=======~===:=:=::::=====:============&a==========_====aa====a===s=========&:=========:~===
BEGINNING OF YEAR USEAGB 61 121 181 2"1 30S 36S 1101 II OS 1101 II OS II OS 1I0J "OS II OJ lVt:R1GK USUGI 9.01 15.01 21.0' 27 .01 31·01 38.0S 110.01 .. o.oJ "0.01 "o.oJ 1I0.0J "o.oJ 1I0.0J "O.OJ
DATE 1985 1986 1987 1988 1989 1990 1991 1992 1993 199" 1995 1996 1997 1998 --------- --------- -------- --------- --------- --------- --------- -----~---- ========= ========= ========= --=------ =====-==- =--====--=
TOTAL lNVt:STHENT • JUUfTt:NAHCE (225.508) (230."711) (186,687) (103.311) (119.352) (161.693) ( 106.991) (1111,930) (123,"58) (132,618) ( '''2.''59) ( 153.029) (16" ,38") (176,581) kAft: ICEIlUCTlON ( ,.. ,000) (23.333) (32,667) (1J2,OOO) (~I,H3) (59,111) (62,22~) (62.222) (62,222) (62,222) (62,222) (62,222) (62,222) (62,222) TOTAL SAVINGS 38,671 10,711 129,5116 219.557 11,...65" 11811.299 891,556 957.710 1.028,772 1.105.107 1,187,105 1.275.189 1,369.808 1."71.""7
--------- ------.. -- ------- .. --------- --------- -------- -------- --------- --------- -------- --------- --------- --------- ---------NET CASH FLo.. (200,837> (183.030) (89,808) 711,2110 2113,969 263."95 722,3"3 780 ,557 8"3.092 910,266 982,"2" 1,059,937 1. JlI3 ,201 ,,232,6 ....
CASH FLOW - PHASE I (255,]06) (217 ,91") ( 123,2311) 38.52] 212,8113 230.059 686 ."26 7111,976 801,6117 865,7'6 9311,602 1.008,566 1,088,019 1.173,366
ROI 116.6S REDUCD ROI 39.IIS NPV 1,666.239 RED"PV 1."3".0111

I
Table d-14
I
I
I
I
I
I
I
Detailed Cash Flows for-Option D (Automatic Conversion)at High Performance Rate and Median or Low Savings Rate
=*x==E=s===xss=sxx8sx8*s*88s888s8xzxssz=88xsz=c=szs=::==z:==z===xxxcs= =:=x:======sz=ss:=:s=2:=:==z.-.-...==s=axs=zs8sz====8===*===~~======== ==**===============~=*~=*===:=-------
SOURCE: Office of Technology Assessment
I
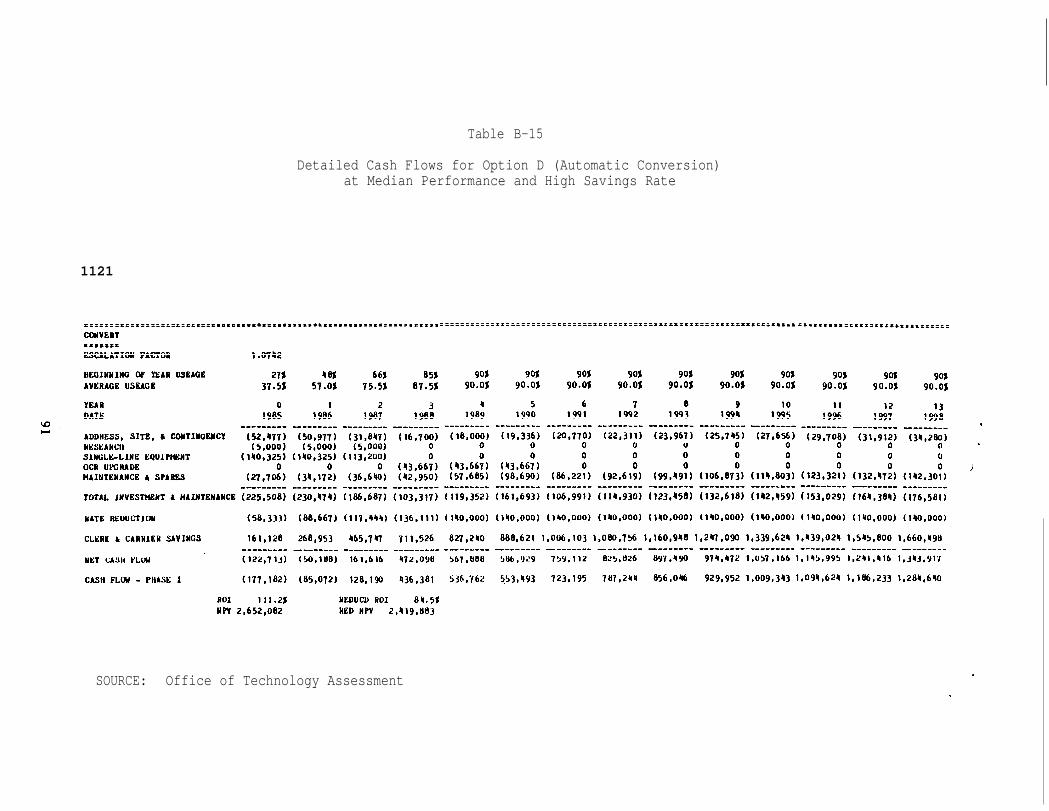
Table B-15
Detailed Cash Flows for Option D (Automatic Conversion)at Median Performance and High Savings Rate
1121
SOURCE: Office of Technology Assessment.
.
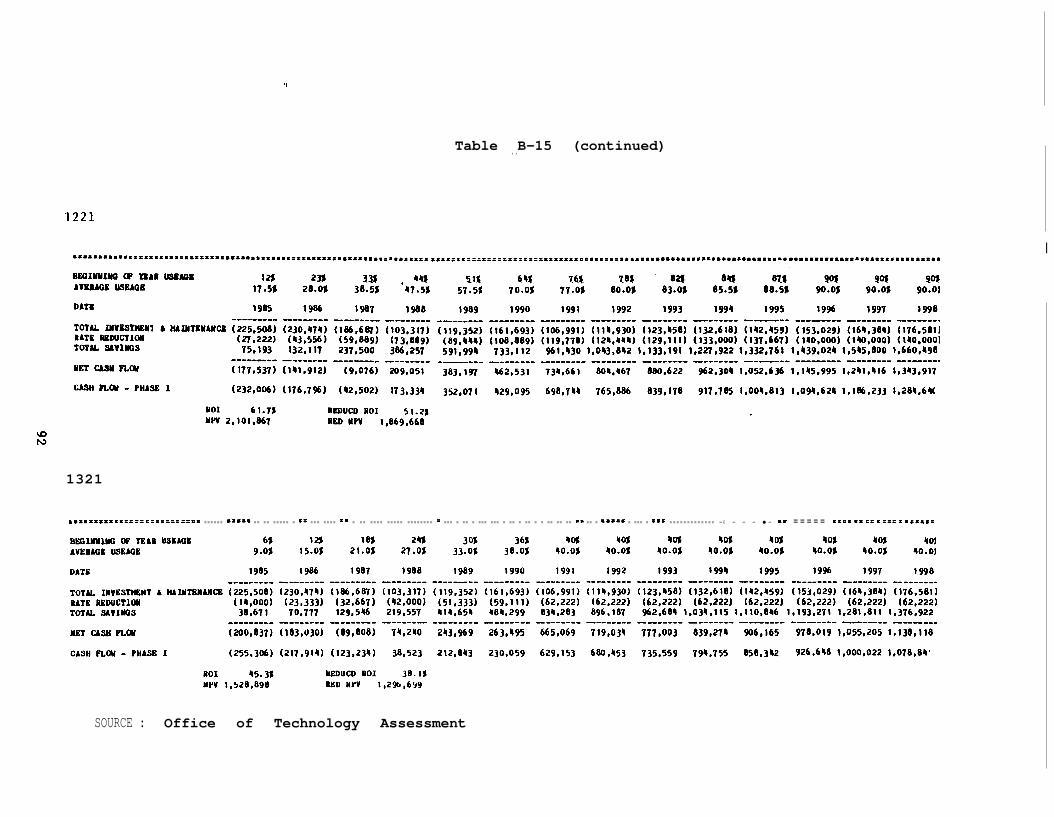
‘1
Table B-15 (continued). .
1221
I
1321
X=X8 ==s== =8== == s ::= ::= :=== = = = = = = ===== = = = = = = = = = = == = = = = = = = =* = = = = = = = = = = = = = = = = = = = = = === = == = === === = == = == = = == == == == == = ===== = === = === = = = = = = = = = = = = = =6 = = = ● = =s = = = = = ==6= == == = === = 8 ===s=
SOURCE : Office of Technology Assessment

Table B-16
Detailed Cash Flows for Option D (Automatic Conversion)at Median Performance and Median or Low Savings Rate
x:==::=:=====:::=::::::=:s=:=2s::=xs=xzz*x==:===z=:x=xc=s------------- --------------------------------.--- ---.--.--------.-------=:===:==========:=:===:======================== ==============:===-.----==:===------
DATE 1985 1986 1987 1988 1989 1990 1991 1992 1993 1994 1995 1996 1997 1998- - - - - - - - - —------- - - - - - - - - - - - - - - - - - - - - - - - - - - - - - - - - -
1122--------- —------- —------- -------- -------- --------- —-------
CF-PH I, SAVINGS @ 90%, HI USE (193,295) (111,967) 81,615 365,228 454,038- - - - - - - -
464,631 622,585 679,169 739,951 805,243 875,380 950,722 1,031,653 1,118,590REDUCED ROI 70.0% RED NPV 1,993,421
1222 CF-PH I, SAVINGS @ 90%, MED USE (239,525) (190,008) (66,252) 134,708 2 9 2 , 8 7 2 355,784 602,601 6 6 1 , 5 0 2 7 2 5 , 8 5 9 7 9 4 , 9 9 2 871,537 950,722 1,031,653 1,118,590REDUCED ROI 45.1% RED NPV 1,517,346
. . . . . . . . . . . . . . . . . . . . . . . . . . . . . . . . . . . . . . . . . . . . . . . . . . . . . . . . . . . . . . . . . . . . . . . . . . . . . . . . . . . . . . . . . . . . . . . . . . . . . . . . . . . . . . . . . . . . . . . . . . . . . . . . . . . . . . . ...... . . . . . . . . ● .,0.,.... ● .*....... . . . . . . . . . . . . . . . . . . . . ● . . . . . . . . . . . . . . . . . . . . . . . . . . . . . .,....,0.. ......0.,0 . . . . . . . . . . .**,.,.*., . . . . . . . . . . . . . . . . . . . . .
SOURCE: Office of Technology Assessment
8
.
)

.
‘1.
Table B-17
1
I
I
II
II
I
I
I
I
Detailed Cash Flows for Option D (Automatic Conversion)at Low Performance and High Savings Rate
1131
8=98s8*8*=88=8=8=m8D8s88===8==8888=mm=c==8x=B=*s88888888=======8==xcxx ===============================8======*=====*==========~=~===~*======= ● = = = = = = = = = = = = = = = = = e B = n = = = = c 8 a c
1.0742
SOURCE: Office of Technology AssessmentI
I

Table B-17 (continued)
1231
1331
========================:*=======:x==zsz====--------..-----.----.-z==:s-------.------...-.------..--======xz==:==zxs::::====x=:=:=========:: X======Z---------------------- ----------------------------- -.------
Assessment

Table B-18
I 1132
I 1232
I 1233
I 1333
Detailed Cash Flows for Alternative D (Automatic Conversion)at Low Performance Rate and Median or Low Savings Rate
SOURCE: Office of Technology Assessment

.
Table B-19
Cash Flows for Option F: Cancel
DATE
PHASE I ONLY CASH FLOW
1985 1986 1987 1988--------- — ------- — ------- ----- ”---
54,469 34,884 33,426 35,717
NPV 232,199
.
1989 1990 1991 1992 1993 1994 1995--------- — ------- --------- --------- — ------- — ------- ---------
31,126 33,436 35,916 38,581 41,444 44,519 47,823
1996 1997 1998----- .-.0 -- ------- ---------
51,371 55,183 59,277
SOURCE : Office of Technology Assessment
97
SELECTED REFERENCES
Michael T.Y. Lai and Ching Y. Suen, “Automatic Recognition of Characters byFourier Descriptors and Boundary Line Encodings,” Pattern Recognition,NOS. 1-6, pp. 383-392, 1981.
Recognition Equipment, Inc.
“Unsolicited Proposal for Build, [installation and Test of RCSOCR
vol. 14,
Systems" f submitted to United States Postal Service, undated (late 1982).
Letter from REI President William G. Moore, Jr. to Senior AssistantPostmaster General James V. Jellison, dated July 11, 1983.
Letter from William G. Moore, Jr., to Postmaster General William Bolger,dated August 24, 1983.
Letter from REI President William G. Moore, Jr., to Postmaster GeneralWilliam Bolger, dated September 9, 1983.
Herbert F. Schantz, “The Potential and Economics of Automated Data-Entry(Recognology) A High Technology in The Information Age,” RecognitionTechnologies Today, December 1983, pp. 5-7.
Ching Y. Suen, et. al., ‘f Automatic Recognition of Handprinted Characters -The S t a t e o f the Art,” Proceedings of the IEEE, vol. 68, No. 4,April 1980, pp. 469-487.
U.S. Congress, Committee on Government Operations, Subcommittee on GovernmentInformation, Justice, and Agriculture, Postal Service Electronic,Mail: The PriceStill Isn’t Right, House Report No. 98-552, 98th Congress, 1st Session,November 16, 1983.
U.S. Congress, Office of Technology Assessment, Implications of ElectronicMail and Message Systems for the U.S. Postal Service, October 1982.
U.S. General Accounting Office
Conversion to Automated Mail Processing Should Continue; Nine-Digit ZipCode Should be Adopted If Conditions Are Met, Report No. GAO/GGD-83-24,General Accounting Office, January 6, 1983 (GAO, 1983a).
“Background P a p e r o n Multi-Line Read Optical Character Reader,”September 1983.
Letter from General Government Division Director William J. Anderson toThe Honorable William D. Ford, Chairman, House Post Office and CivilService Committee, dated September 19, 1983.
98

.
Conversion to ‘Automated Mail Processing and Nine-Digit Zipcode: A Status-~ RePort ‘0 ” G~o/GGD-83-84’ ‘enerd A c c o u n t i n g O f f i c e ,September 28, 1983 (GAO, 1983 b).
Comparative Review of Single-Line Read and Multi-Line Read Optical. Character Readers Used in Mail Processing, May 1984 draft.
U.S. Postal Service
Letter from Senior Assistant Postmaster General James V. Jellison toREI President William G. Moore, Jr., dated July 26, 1983.
Letter and enclosures from Postmaster General William F. Bolger to TheHonorable William D. Ford, Chairman, House Post Office and Civil ServiceCommittee, dated July 27, 1983.
Letter from Postmaster General William F. Bolger to REI President‘William G. Moore, dated September 2, 1983.
Proposal to Board of Governors: Automated System Phase II, January 1984.
Letters and Attachments from Senior Assistant Postmaster GeneralJames V. Jellison to OTA Project Director Fred B. Wood, dated January 23,1984, and February 9, 1984.
Letter from Senior Assistant Postmaster General James V. Jellison to OTA‘Project Director Fred B. Wood, dated March 14, 1984 (1984c).
Letter from Lynn A. Kidd to Fred B. Wood, dated April 2, 1984.
Letters from Senior Government Relations Representative Kenneth F. Currierto OTA Project Director Fred B. Wood, dated April 2, 1984, and May 11,1984.
“Why a Four-Line OCR is Not the Way to Go,” undated.
.
99