Embed Size (px)
Citation preview
CONTRACTOR REPORT SAND98-I513
Unlimited Release
Review of Power Quality Applications of Energy Storage Systems
Shiva Swaminathan Rajat K. Sen Sentech, Inc. 4733 Bethesda Avenue Suite 608 Bethesda MD 20814
Prepared by Sandia National Laboratories Albuquerque, New Mexico 87185 and Livermore, California 94550
Sandia is a multiprogram laboratory operated by Sandia Corporation, a Lockheed Martin Company, for the United States Department of Energy under Contract DE-AC04-94AL85000.
Approved for public release; distribution is unlimited.
Printed July 1998
,~] Sandia National laboratories
Issued by Sandia National Laboratories, operated for the United States Department of Energy by Sandia Corporation.
NOTICE: This report was prepared as an account of work sponsored by an agency of the United States Government. Neither the United States Govern- ment nor any agency thereof, nor any of their employees, nor any of their contractors, subcontractors, or their employees, makes any warrant y, express or implied, or assumes any legal liability or responsibility for the accuracy, completeness, or usefulness of any information, apparatus, prod- uct, or process disclosed, or represents that its use would not infringe pri- vately owned rights. Reference herein to any specific commercial product, process, or service by trade name, trademark, manufacturer, or otherwise, does not necessarily constitute or imply its endorsement, recommendation, or favoring by the United States Government, any agency thereof, or any of their contractors or subcontractors. The views and opinions expressed herein do not necessarily state or reflect those of the United States Govern- ment, any agency thereof, or any of their contractors.
Printed in the United States of America. This report has been reproduced directly from the best available copy.
Available to DOE and DOE contractors from Office of Scientific and Technical Information P.O. Box 62 Oak Ridge, TN 37831
Prices available from (615) 576-8401, FTS 626-8401
Available to the public from National Technical Information Service U.S. Department of Commerce 5285 Port Royal Rd Springfield, VA 22161
NTIS price codes Printed copy: A03 Microfiche copy: AOI
SAND98-1513 Unlimited Release Printed May 1997
Distribution Category UC-1 350
Review of Power Quality Applications of Energy
Storage Systems*
Shiva Swaminathan Rajat K. Sen Sentech, Inc.
4733 Bethesda Avenue Suite 608
Bethesda, MD 20814
Abstract
Under the sponsorship of the U.S. Department of Energy (DOE) Office of Utility Technologies, the Energy Storage Systems Analysis and Development Department at Sandia National Laborato-
ries contracted Sentech, Inc., to assess the impact of power quality problems on the electricity supply system. This report contains the results of several studies that have identified the cost of
power quality events for electricity users and providers. The large annual cost of poor power
quality represents a national inefficiency and is reflected in the cost of goods sold, reducing U.S. competitiveness. The Energy Storage Systems (ESS) Program takes the position that mitigation merits the attention of not only the DOE but affected industries as well as businesses capable of assisting in developing solutions to these problems. This study represents the preliminary stages of an overall strategy by the ESS Program to understand the magnitude of these problems so as to begin the process of engaging industry partners in developing solutions.
● The work described in this report was performed for Sandia National Laboratories under
Contract No. AV-5396.
ACKNOWLEDGMENTS
Sandia National Laboratories would like to thank Dr. Christine E. Platt of the U.S. Department of Energy’s Office of Utility Technologies for the support and funding of this work. We would also like to acknowledge the National Power Laboratories, which conducted a study that provided data summaries for four types of power quality events and input from 130 user sites, and Duke Power, which conducted a study that provided detailed data from 198 indus- trial and commercial users, making it possible to derive approximations of the national impact of power quality events. Thanks are also due to Paul Butler of Sandia’s Energy Storage Analysis and Development Department for providing valuable technical review before the final study was published.
iv
REVIEW OF POWER QUALITY APPLICATIONS OF ENERGY STORAGE SYSTEMS CONTENTS
Contents
1.
2.
3.
4.
5.
Executive Summary . . . . . . . . . . . . . . . . . . . . . . . . . . . . . . . . . . . . . . . . . . . . . . . . . . . . . . . . . . . . . . . . . . . . . . . . . . . . . . . . . . . . . . . . . . . . . . . . . . . . . . . . . . . . . . . . . . . . . . . . . . . . .. .............. 1-1
Overview . . . . . . . . . . . . . . . . . . . . . . . . . . . . . . . . . . . . . . . . . . . . . . . . . . . . . . . . . . . . . . . . . . . . . . . . . . . . . . . . . . . . . . . . . . . . . . . . . . . . . . . . . . . . . . . . . . . . . . . . . . . . .................... .............. 2-1
Problem Description . . . . . . . . . . . . . . . . . . . . . . . . . . . . . . . . . . . . . . . . . . . . . . . . . . . . . . . . . . . . . . . . . . . . . . . . . . . . . . . . . . . . . . . . . . . . . . . . . . . . . . . . . . . . . . . . . . . . . . . . . . ................. - Scope of Power Quality Problems . . . . . . . . . . . . . . . . . . . . . . . . . . . . . . . . . . . . . . . . . . . . . . . . . . . . . . . . . . . . . . . . . . . . . . . . . . . . . . . . . . . . . . . . . . . . . . . . . . . . . . . . . . . . . . . ..t
The NPL Survey Results . . . . . . . . . . . . . . . . . . . . . . . . . . . . . . . . . . . . . . . . . . . . . . . . . . . . . . . . . . . . . . . . . . . ..".. """"" ""."" ."""" """J"."""""."""".."""""""""""""""""" 3-4 Cost of Poor Power Quality to Customers . . . . . . . . . . . . . . . . . . . . . . . . . . . . . . . . . . . . . . . . . . . . . . . . . . . . . . . . . . . . . . . . . . . . . . . . . . . . . . . . . . . . . . . . . . . . . . . . . . 3-5
Estimation of National Cost of Poor Power Quality . . . . . . . . . . . . . . . . . . . . . . . . . . . . . . . . . . . . . . . . . . . . . . . . . . . . . . . . . . . . . . . . . . . . . . . . . . . . . . . . . . . . 3-8
Technology Options . . . . . . . . . . . . . . . . . . . . . . . . . . . . . . . . . . . . . . . . . . . . . . . . . . . . . . . . . . . . . . . . . . . . . . . . . . . . . . . . . . . . . . . . . . . . . . . . . . . . . . . . . . . . . . . . . . . . . . . . . . ................. . 4-1
Matching the Power Quality Problem with the Technology Solutions . . . . . . . . . . . . . . . . . . . . . . . . . . . . . . . . . . . . . . . . . . . . . . . . . . . . . . . . 4-2 Cost-Benefit Analysis Example . . . . . . . . . . . . . . . . . . . . . . . . . . . . . . . . . . . . . . . . . . . . . . . . . . . . . . . . . . . . . . . . . . . . . . . . . . . . . . . . . . . . . . . . . . . . . . . . . . . . . . . . . . . . . . . . . . . 4-2
Conclusions . . . . . . . . . . . . . . . . . . . . . . . . . . . . . . . . . . . . . . . . . . . . . . . . . . . . . . . . . . . . . . . . . . . . . . . . . . . . . . . . . . . . . . . . . . . . . . . . . . . . . . . . . . . . . . . . . . . . . . . . . . . . .. .................... ........ 5-1
Appendix A. Graphical Illustration Of Power Quality Events . . . . . . . . . . . . . . . . . . . . . . . . . . . . . . . . . . . . . . . . . . . . . . . . . . . . . . . . . . . . . . . . . . . . . . . . . . A-1
3-1 3-2 3-3 4-1
4-2 4-3
1-1. 1-2. 1-3. 1-4. 3-1.
Figures
The CBEMA Curve. . . . . . . . . . . . . . . . . . . . . . . . . . . . . . . . . . . . . . . . . . . . . . . . . . . . . . . . . . . . . . . . . . . . . . . . . . . . . . . . . . . . . . . . . . . . . . . . . . . . . . . . . . . . . . . . . . . . . . . . . .................. 3-3
CBEMA Curve Analysis of the NPL Survey. . . . . . . . . . . . . . . . . . . . . . . . . . . . . . . . . . . . . . . . . . . . . . . . . . . . . . . . . . . . . . . . . . . . . . . . . . . . . . . . . . . . . . . . . . . . . . . . . . . . . 3-6 Difference in Commercial and Industrial Customer Interruption Cost . . . . . . . . . . . . . . . . . . . . . . . . . . . . . . . . . . . . . . . . . . . . . . . . . . . . . . . . . . . . . . . 3-8
Off-Line Configuration of Energy Storage Systems. . . . . . . . . . . . . . . . . . . . . . . . . . . . . . . . . . . . . . . . . . . . . . . . . . . . . . . . . . . . . . . . . . . . . . . . . . . . . . . . . . . . . . . ...4-l
Line-Interactive Configuration of Energy Storage Systems. . . . . . . . . . . . . . . . . . . . . . . . . . . . . . . . . . . . . . . . . . . . . . . . . . . . . . . . . . . . . . . . . . . . . . . . . . . . . . . 4-2
On-Line Configuration of Energy Storage Systems . . . . . . . . . . . . . . . . . . . . . . . . . . . . . . . . . . . . . . . . . . . . . . . . . . . . . . . . . . . . . . . . . . . . . . . . . . . . . . . . . . . . . . . . . . . 4-2
Tables
Mitigation Capabilities of Protection Devices . . . . . . . . . . . . . . . . . . . . . . . . . . . . . . . . . . . . . . . . . . . . . . . . . . . . . . . . . . . . . . . . . . . . . . . . . . . . . . . . . . . . . . . . . . . . . . . . . . . l-l
NPL Summary of Disturbances . . . . . . . . . . . . . . . . . . . . . . . . . . . . . . . . . . . . . . . . . . . . . . . . . . . . . . . . . . . . . . . . . . . . . . . . . . . . . . . . . . . . . . . . . . . . . . . . . . . . . . . . . . . . . . . . . . . . . . . . . 1-2
Duke Power Survey on Cost of Power Quality Events . . . . . . . . . . . . . . . . . . . . . . . . . . . . . . . . . . . . . . . . . . . . . . . . . . . . . . . . . . . . . . . . . . . . . . . . . . . . . . . . . . . . . . 1-2 National Cost Estimate for Large Industrial Customers . . . . . . . . . . . . . . . . . . . . . . . . . . . . . . . . . . . . . . . . . . . . . . . . . . . . . . . . . . . . . . . . . . . . . . . . . . . . . . . . . . . . 1-3
Cate~ories of Power Oualitv Variations. . . . . . . . . . . . . . . . . . . . . . . . . . . . . . . . . . . . . . . . . . . . . . . . . . . . . . . . . . . . . . . . . . . . . . . . . . . . . . . . . . . . . . . . . . . . . . . . . . . . . . . . . . . . 3-2 3-2. Sum~ary of Power Q~ality ‘Variation Categories and Causes* . . . . . . . . . . . . . . . . . . . . . . . . . . . . . . . . . . . . . . . . . . . . . . . . . . . . . . . . . . . . . . . . . . . . . . . . . . 3-3 3-3. Summary Overview of the CEA, NPL, and EPRI Power Quality Survey s . . . . . . . . . . . . . . . . . . . . . . . . . . . . . . . . . . . . . . . . . . . . . . . . . . . . . . . . . 3-4 3-4. Definition of Events in NPL Survey . . . . . . . . . . . . . . . . . . . . . . . . . . . . . . . . . . . . . . . . . . . . . . . . . . . . . . . . . . . . . . . . . . . . . . . . . . . . . . . . . . . . . . . . . . . . . . . . . . . . . . . . . . . . . . . . . . 3-5
3-5. Duration Summary Statistics for All NPL Data . . . . . . . . . . . . . . . . . . . . . . . . . . . . . . . . . . . . . . . . . . . . . . . . . . . . . . . . . . . . . . . . . . . . . . . . . . . . . . . . . . . . . . . . . . . . . . . . . 3-5
3-6. Events per Month Based upon All NPL Data and Individual Location Statistics . . . . . . . . . . . . . . . . . . . . . . . . . . . . . . . . . . . . . . . . . . . . . . 3-5 3-7. Components of Outage Costs by Scenario . . . . . . . . . . . . . . . . . . . . . . . . . . . . . . . . . . . . . . . . . . . . . . . . . . . . . . . . . . . . . . . . . . . . . . . . . . . . . . . . . . . . . . . . . . . . . . . . . . . . . . . . . 3-7
3-8. National Cost Estimate for Large Industrial Customers . . . . . . . . . . . . . . . . . . . . . . . . . . . . . . . . . . . . . . . . . . . . . . . . . . . . . . . . . . . . . . . . . . . . . . . . . . . . . . . . . . 3-1o
4-1. Individual Solutions to Single-Category Power Quality Events* . . . . . . . . . . . . . . . . . . . . . . . . . . . . . . . . . . . . . . . . . . . . . . . . . . . . . . . . . . . . . . . . . . . . . . 4-3 4-2. Power Quality Solutions and Their Ability to Protect against Events in Multiple Power Quality Categories . ..4-4
4-3. Competitiveness of Energy Storage Systems for Power Quality Applications . . . . . . . . . . . . . . . . . . . . . . . . . . . . . . . . . . . . . . . . . . . . . . . . . . 4-4
v
REVIEW OF POWER QUALITY APPLICATIONS OF
CONTENTS ENERGY STORAGE SYSTEMS
ASD
CBEMA
CEA
DOE
EPRI
ESS
IEEE
NPL
Pc
PG&E
RMS
UPS
Var
Acronyms and Abbreviations
adjustable speed drive
Computer Business Equipment Manufacturers Association
Canadian Electrical Association
U.S. Department of Energy
Electric Power Research Institute
Energy Storage Systems
Institute of Electrical and Electronics Engineers
National Power Laboratories
personal computer
Pacific Gas & Electric
root mean square
uninterruptible power supply
volt-ampere reactive
vi
REVIEW OF PO WER QUALITY APPLICA TIONS OF ENERGY STORAGE SYSTEMS EXECUTIVE SUMMARY
1. Executive Summary
In America, electricity has become ubiquitous. It is present virtually everywhere there is a need, it is available in seemingly limitless quantities, and it per- forms an uncountable variety of tasks. However, unnoticed by most users, the electricity supply often exhibits imperfections. The magnitude and preva- lence of these imperfections, together with the occa- sional total interruption or outage, constitute the ingredients of power quality.
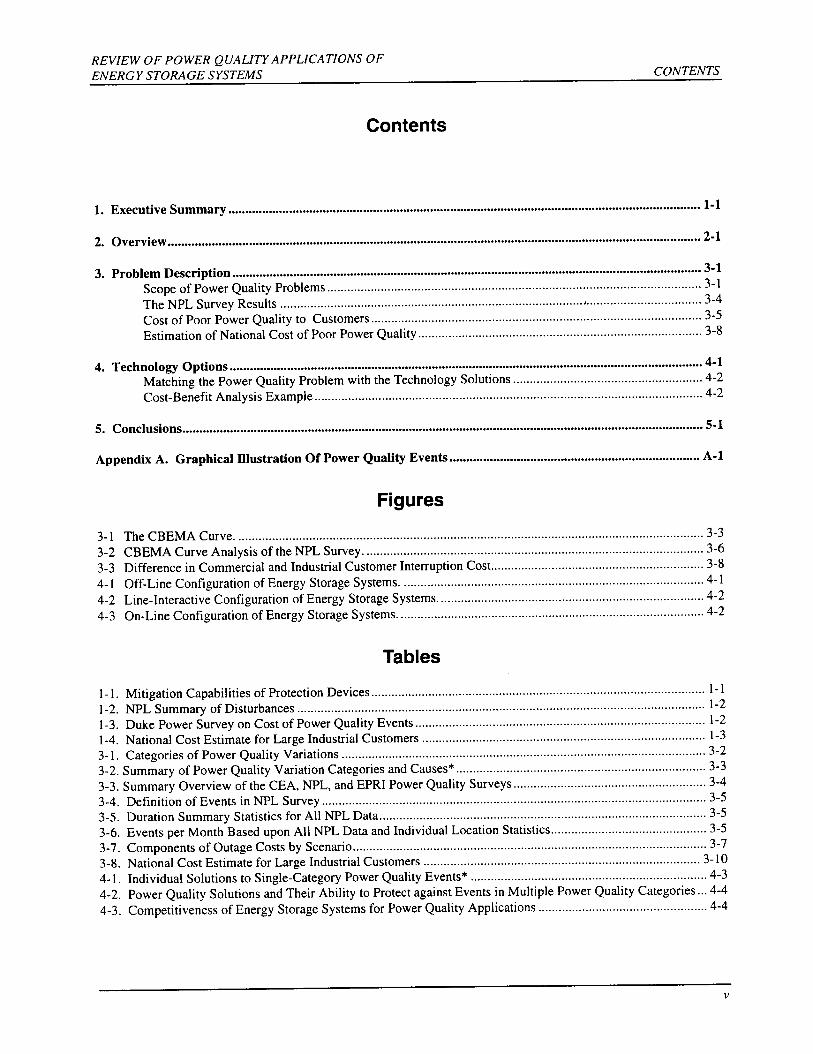
Increased automation in homes and factories has in- creased the impact of power quality deviations. Power quality has been defined as any problem mani- fested in voltage, current, or frequency deviations that results in failure or misoperation of utility or end-user equipment. Examples of power quality events and of devices capable of protecting against their effects are shown in Table I-1. Storage systems are seen to pro- vide by far the broadest range of power quality pro- tection.
While storage provides comprehensive protection, it may not be the economic choice for each of the power quality events listed in the table. However, because of their ability to detect and respond to the
energy deficiency in the supply source rapidly, energy storage systems are the preferred solution for voltage sags, undervoltages, and interruptions.
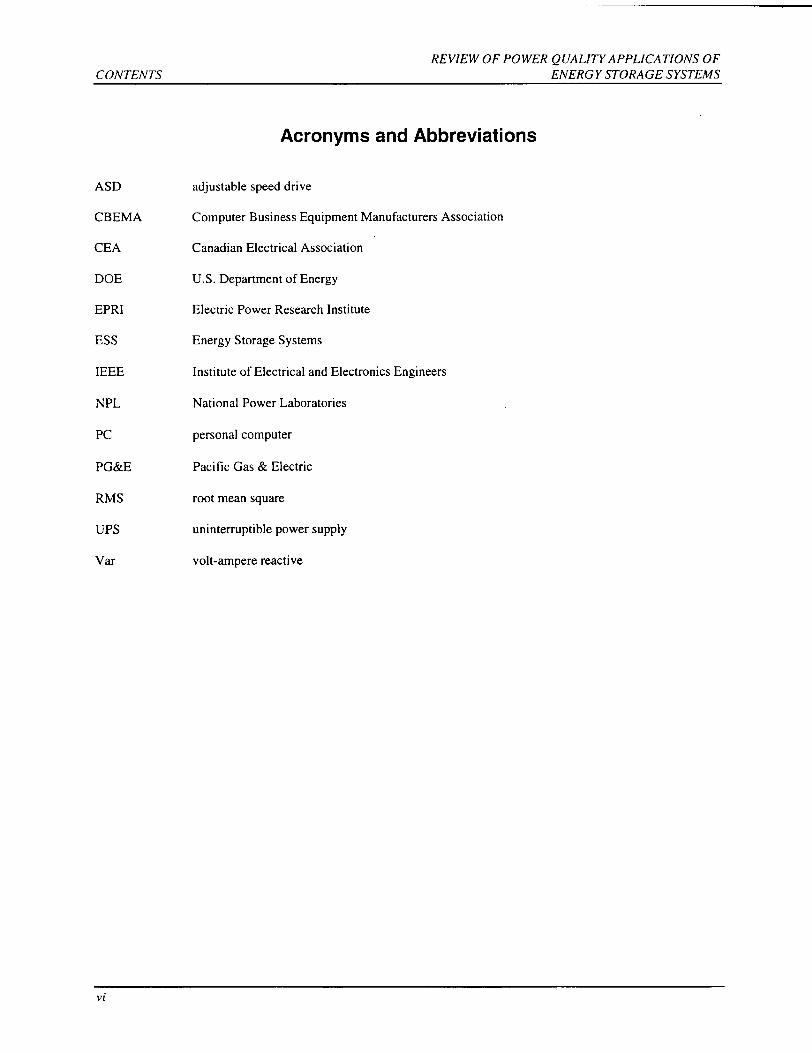
Data on the frequency of power quality disturbances are not widespread and are often proprietary. Three surveys conducted to determine the extent of power quality issues have been identified. While the de- tailed results of the surveys are not available in the public domain, data summaries have been published. The most useful summary for this study was pub- lished by the National Power Laboratories (NPL) and included data on 130 user sites consisting of 31 Yo industrial, 2490 small business, 1870 multistory buildings, 1770 residential, and 10% institutional. Table 1-2 summarizes NPL data for four types of power quality events. Because the data show great variance between the number of events in the best locations (zero) and the number in the worst locations (over 1,000 per month for three of the disturbances), it is likely that the median, rather than the average, is more representative of typical performance. Conse- quently, for this study, the more conservative median is used in subsequent analyses.
Table 1-1. Mitigation Capabilities of Protection Devices
Power Quality Event
Impulsive Oscillatory Sag/ Under-/Over- Harmonic Voltage Electrostatic Transient Transient Swell voltage Interruption Distortion Flicker Noise Discharge
x x
Surge arrestor x x
Filter x x
Isolation transformer x x
Constant voltage transformer
Dynamic voltage restorer
Backup generator
Humidity control x
Energy storage - Off-line x x x - Line-interactive x
x x x x x x x x x x
- On-1ine x x x x x x x x x
x
x
x
x
x
x
x
1-1
REVIEW OF PO WER QUALITY APPLICATIONS OF
EXECUTIVE SUMMARY ENERGY STORAGE SYSTEMS
Table 1-2. NPL Summary of Disturbances
Worst Best Locations Locations Median Average (events/month) (events/month) (events/month) (events/month)
Sags/UnderVoltages (low RMS) o 1,660 4.1 27.9
Swells/Overvoltages (high RMS) o 1,450 3.4 13.9
Transients o 1,166 15.7 63.5
Interruptions o 10 1.0 1.3
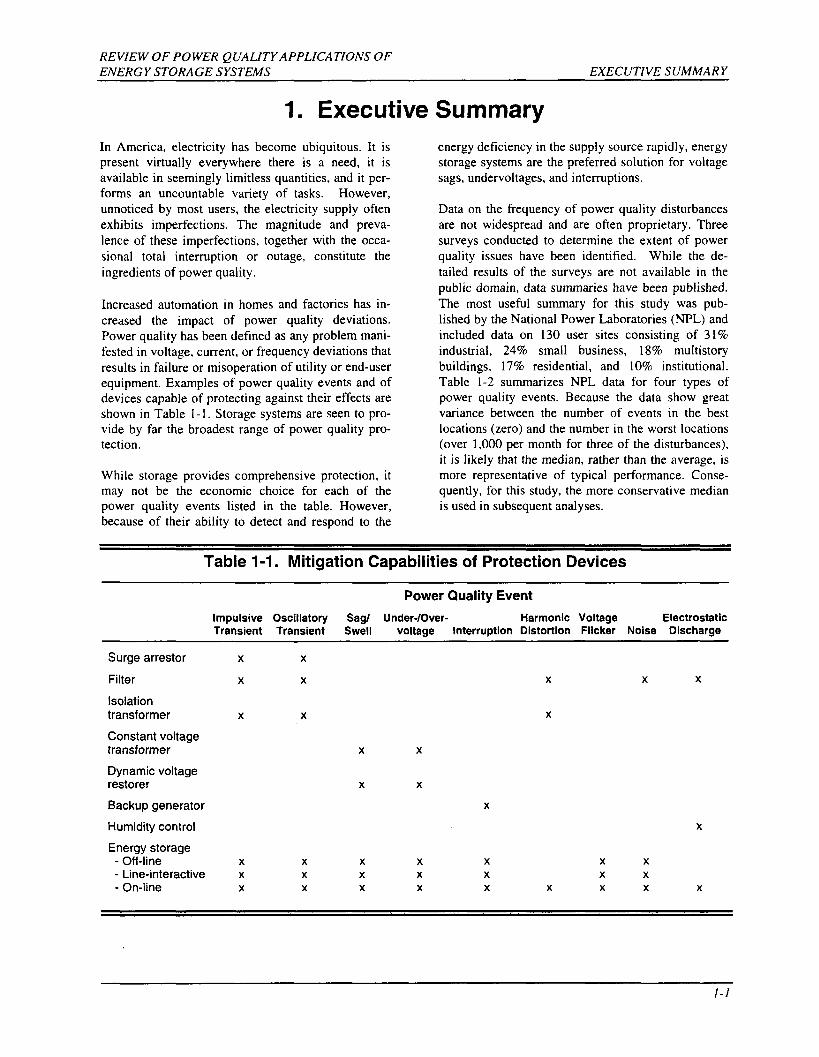
Information regarding the cost to electricity custom- ers of power imperfections is even less widely avail- able than data on the imperfections. However, a survey conducted by Duke Power has been published that contains information suitable for deriving ap- proximations of national impact. Duke surveyed 198 large industrial and commercial customers and col- lected information on the components of interruption costs under varying outage conditions. Analyzing the average interruption costs of the various outage conditions showed that the most costly occurrences resulted from electricity outages and voltage sags. The costs for these occurrences are summarized in Table 1-3, in which the greater impact of longer- duration events and the benefits of prior notice are clearly evident.
Few estimates of the national cost of power quality events have been attempted. An article in Spectrum, a publication of the Institute of Electrical and Electron- ics Engineers (IEEE), suggested a cost of $25 billion, and an Electric Power Research Institute (EPRI) re- port estimated a cost of $400 billion. The first value was based on 1.5–3% of sales of the U.S. manufactur- ing industry, and the second was based on estimates of idled employee-hours due to power quality prob- lems in the commercial sector.
The combination of NPL and Duke Power data pro- vides a third opportunity to estimate national impact,
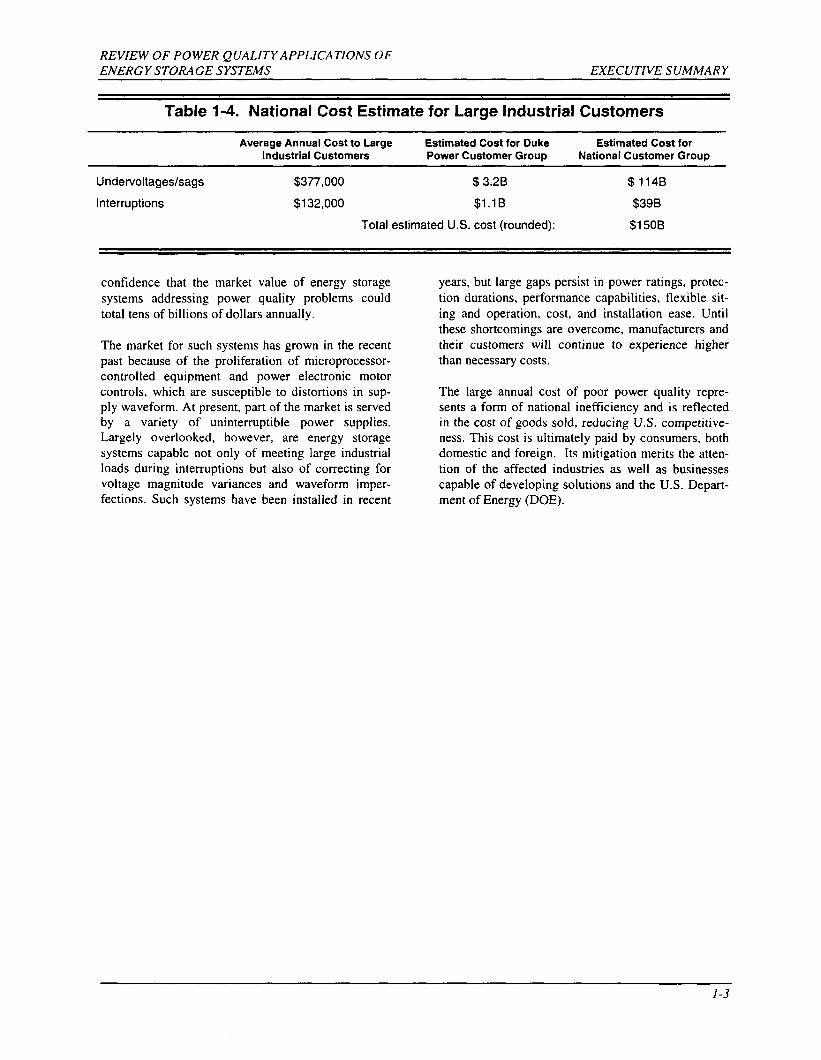
in particular to estimate the national cost of power quality events that energy storage systems could re- solve. Using the frequency of events from the NPL survey and extrapolating the Duke Power data to a national electricity level, a total cost (to large indus- trial customers) of U.S. power outages and voltage sags—and thus a potential power quality market for storage-can be developed. As shown in Table 1-4, the resulting estimate is approximately $150 billion annual cost.
The $150 billion value is developed using only un- dervoltage/sag and interruption data because these are the two categories of power quality problems in the Duke Power survey for which storage systems are a likely solution. Costs resulting from power quality problems in other categories are excluded. Thus the estimate is conservative in the sense that there may be cases where storage could provide cost-effective so- lutions for other power quality problems, possibly some not covered in the Duke survey.
It should be recognized that computing a national loss number with data from a single region can be a risky undertaking; opportunities to introduce error are rela- tively high. Nevertheless, it is noteworthy that the $150 billion estimate falls between the estimates of
$25 billion and $400 billion cited earlier. Whatever the actual number, one can postulate with increasing
Table 1-3. Duke Power Survey on Cost of Power Quality Events
Event
4-Hr Outage, l-Hr Outage, I-hr Outage Momentary Voltage No Notice No Notice with Notice Outage Sag
Average cost of event $74,835 $39,459 $22,973 $11,027 $7,694
1-2
REVIEW OF POWER QUALITY APPLICATIONS OF ENERGY STORAGE SYSTEMS EXECUTIVE SUMMARY
Table 1-4. National Cost Estimate for Large Industrial Customers
Average Annual Cost to Large Estimated Cost for Duke Estimated Cost for Industrial Customers Power Customer Group Nstional Customar Group
Undervoltageslsags $377,000 $ 3.2B $ 114B
interruptions $132,000 $l.l B $39B
Total estimated U.S. cost (rounded): $150B
confidence that the market value of energy storage systems addressing power quality problems could total tens of billions of dollars annually.
The market for such systems has grown in the recent past because of the proliferation of microprocessor- controlled equipment and power electronic motor controls, which are susceptible to distortions in sup- ply waveform. At present, part of the market is served by a variety of uninterruptible power supplies. Largely overlooked, however, are energy storage systems capable not only of meeting large industrial loads during interruptions but also of correcting for voltage magnitude variances and waveform imper- fections. Such systems have been installed in recent
years, but large gaps persist in power ratings, protec- tion durations, performance capabilities, flexible sit- ing and operation, cost, and installation ease. Until these shortcomings are overcome, manufacturers and their customers will continue to experience higher than necessary costs.
The large annual cost of poor power quality repre- sents a form of national inefficiency and is reflected in the cost of goods sold, reducing U.S. competitive- ness. This cost is ultimately paid by consumers, both domestic and foreign. Its mitigation merits the atten- tion of the affected industries as well as businesses capable of developing solutions and the U.S. Depart- ment of Energy (DOE).
1-3
REVIEW OF PO WER QUALITY APPLICATIONS OF EXECUTIVE SUMMARY ENERGY STORAGE SYSTEMS
Intentionally Left Blank
1-4
REVIEW OF PO WER QUALITY APPLICATIONS OF ENERGY STORAGE SYSTEMS OVERVIEW
2. Overview
The electric utility industry is expected by the public to provide a reliable and uninterrupted supply of electricity—a goal that the industry has achieved to a great extent. Although the reliability of the electricity supply system is high, there are occasional unsched- uled outages caused by a variety of unpredictable events. Industries such as telecommunications that cannot tolerate unscheduled outages have installed backup generation and/or energy storage systems in order to alleviate the problem.
In recent years, with increased automation and greater use of microprocessor-controlled processes, indus- tries have begun to realize that unscheduled outages are only one of many power quality problems. Very short perturbations (measured in milliseconds) in the supply waveform sometimes affect sensitive equip- ment, resulting in significant losses in productivity. The utility industry has begun to feel increased pres- sure from industrial customers not only to supply reliable and uninterrupted power, but also to ensure that the quality of the power supply is adequate for their equipment to operate smoothly. The deregula- tion pressures on the electric utility industry and the associated increases in customer choices only exacer- bate the utility industry’s need to provide the higher- quality power that their customers are demanding. EPRI has undertaken a major effort to analyze the nature and causes of the power quality problems.
A major thrust of the DOE’s Energy Storage Systems (ESS) Program at Sandia is to minimize or eliminate
power quality and reliability problems that cost U.S. companies productivity and revenues. To accomplish this, the ESS Program conducts its own analyses and exchanges analyses with industry partners and various industry organizations. It then develops suitable projects to address power quality and reliability problems using energy storage technologies/solutions. For example, a mid-voltage power quality system is being developed to solve power quality problems at the substation ( 15-kV) level. The PQ2000, a 2- MW/15-sec power quality system, has demonstrated its ability to address power quality problems by pro- tecting a lithograph plant in Somerville, Georgia, against short-duration power outages; it was designed to do the same at the utility level, and will soon do so at a Virginia utility. Power quality problems will also be mitigated with modular energy storage systems such as the 250-kW PM250 system and the Advanced Battery Energy Storage System (ABESS). These technologies are being advanced by the ESS Program and its partners and will offer benefits such as im- proved power plant operation and higher-reliability power for utility customers.
This study reviews the existing literature dealing with power quality issues and summarizes the nature, scope, and costs associated with poor power quality. It also discusses the technology options availabie to address power quality issues and identifies the role energy storage systems can play in mitigating these power quality problems.
2-1
REVIEW OF PO WER QUALITY APPLICATIONS OF OVERVIEW ENERGY STORAGE SYSTEMS
Intentionally Left Blank
2-2
REVIEW OF PO WER QUALITY APPLICATIONS OF ENERGY STORAGE SYSTEMS PROBLEM DESCRIPTION
3. Problem Description
The term power quality often means different things to different people. Electric utilities are primarily responsible for a reliable and uninterruptible supply of electricity, but this is just one facet of good power quality. The manufacturers of equipment define power quality as the characteristics of a power supply that are required to make end-user equipment work properly. These characteristics can be very different depending on the type of equipment and the manufac- turing process in question. Since end users are ulti- mately affected by poor power quality, the definition of power quality must accommodate their concerns. Thus, an EPRI Power Quality Workbook’ defines power quality as any problem manifested in voltage, current, or frequency deviations that results in failure or misoperation of utility or end-user equipment.
An ideal voltage supply is a pure sinusoidal wave- form with constant magnitude and frequency. Several types of distortions in the power supply can be the cause of power quality problems. These distortions result from a wide variety of events ranging from switching events within the end-user facility to faults hundreds of miles away on the utility transmission line. Perturbations that fall within the category of power quality events can be categorized as transient disturbances, fundamental frequency disturbances, and variations in steady state. Table 3-1 lists power- quality-related events and defines the characteristics of those events. Graphical descriptions of these per- turbations are provided in Appendix A.
The phenomena listed in Table 3-1 affect different equipment in different ways. Switching an air condi- tioner on may cause a sag in voltage, which might dim the lights momentarily. However, plugging in a coffee pot to the same receptacle as a PC might cause a voltage sag that could scramble data every time the heater of the coffee pot is turned on or off.2
Industrial equipment with microprocessor-based con- trols and power electronic devices that are sensitive to disturbances are affected most by poor power quality. Control systems can be affected by momentary volt- age sags or small transient voltages, resulting in nui- sance tripping of important processes. Furthermore, many of these sensitive loads are interconnected in
extensive networks and automated processes. This interconnected nature makes the whole system de- pendent on the most sensitive device when a distur- bance occurs. Examples of industries with such inter- connections include steel, plastic, glass, paper, and often chemical manufacturers.
A growing percentage of loads utilize power electron- ics in some type of power conversion process. Such systems generate harmonic currents that result in voltage distortion when they interact with the system impedance. Adjustable speed drives (ASDS), for ex- ample, can generate harmonics that can excite reso- nance with low-voltage capacitors and cause
equipment failure. In addition to ASDS, factory effi- ciency upgrades and demand-side management initia- tives often involve the application of equipment such as high-efficiency motors and electronic ballasts. These devices also have significant power quality compatibility issues. Changes in the load characteris- tics that result from the use of such equipment con- tribute further to the problems encountered by the end user.
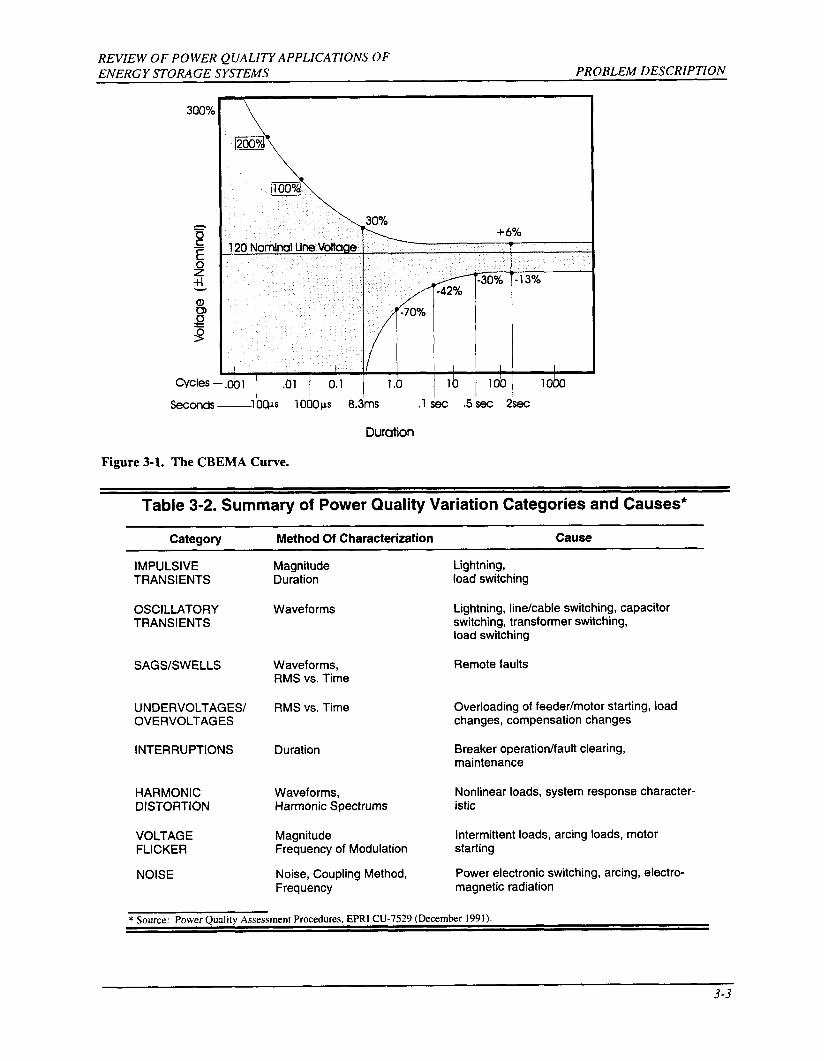
Because microprocessor-based controls and power electronic devices are most susceptible to distur- bances in voltage, the Computer Business Equipment Manufacturers Association (CBEMA)3 has defined the operational design range of voltage for computers. The CBEMA curve given in Figure 3-1 defines the tolerance of microprocessor-based equipment to volt- age deviations.
Microprocessor-based equipment is typically de- signed to withstand and operate normal] y during dis- turbances as long as the event is within the shaded portion of the curve. The curve depicts the ability of equipment to withstand large voltage swings (100- 200% under/over nominal voltage) for short durations (given in microseconds) and smaller voltage swings for longer durations.
Scope of Power Quality Problems
The types of power quality disturbances that may be present are highly dependent on location. If a facility is located at the end of a distribution feeder,
1 “Power Quality—Electric Power Research Insti- tute’s Power Quality Workbook,” TR- 105500, April 1996.
2 EPRI Journal, July/Aug 1991. 3 Presently known as the Information Technology
Industry Council.
3-1
REVIEW OF PO WER QUALITY APPLICATIONS OF PROBLEM DESCRIPTION ENERGY STORAGE SYSTEMS
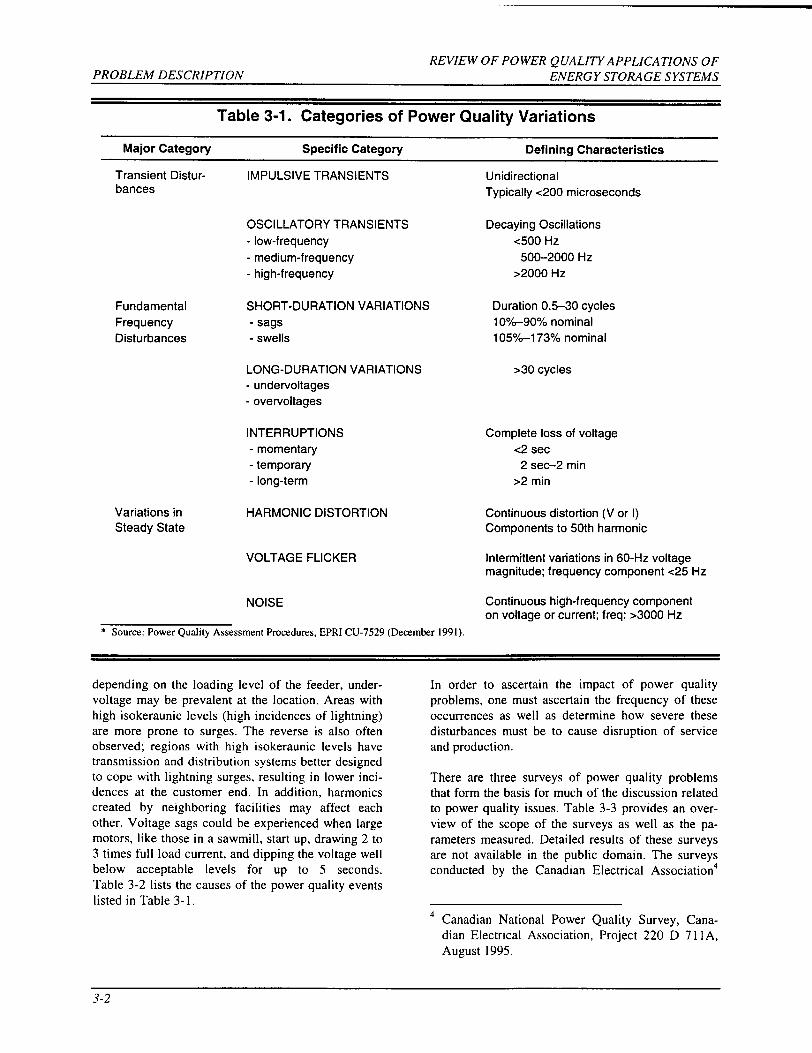
Table 3-1. Categories of Power Quality Variations
Major Category Specific Category Defining Characteristics
Fundamental
Frequency
Disturbances
Variations in Steady State
Transient Distur- IMPULSIVE TRANSIENTS bances
OSCILLATORY TRANSIENTS
- low-frequency
- medium-frequency
- high-frequency
SHORT-DURATION VARIATIONS
- sags - swells
LONG-DURATION VARIATIONS - undervoltages
- overvoitages
INTERRUPTIONS
- momentary
- temporary
- long-term
HARMONIC DISTORTION
VOLTAGE FLICKER
NOISE
* Source: Power Quality Assessment Procedures, EPR1 CU-7529 (December 1991).
Unidirectional Typically <200 microseconds
Decaying Oscillations <500 Hz
500-2000 tiz
>2000 Hz
Duration 0.5-30 cycles 1 oyo–goyo” nominal
10&%o–1 73~o rlonlilld
>30 cycles
Complete loss of voltage <2 sec
2 see-2 min >2 min
Continuous distortion (V or 1) Components to 50th harmonic
Intermittent variations in 60-Hz voltage magnitude; frequency component c25 Hz
Continuous high-frequency component on voltage or current; freq: >3000 Hz
depending on the loading level of the feeder, under- voltage may be prevalent at the location. Areas with high isokeraunic levels (high incidence of lightning) are more prone to surges. The reverse is also often observed; regions with high isokeraunic levels have transmission and distribution systems better designed to cope with lightning surges, resulting in lower inci- dence at the customer end. In addition, harmonics created by neighboring facilities may affect each other. Voltage sags could be experienced when large motors, like those in a sawmill, start up, drawing 2 to 3 times full load current, and dipping the voltage well below acceptable levels for up to 5 seconds. Table 3-2 lists the causes of the power quality events listed in Table 3-1.
In order to ascertain the impact of power quality problems, one must ascertain the frequency of these occurrences as well as determine how severe these disturbances must be to cause disruption of service and production.
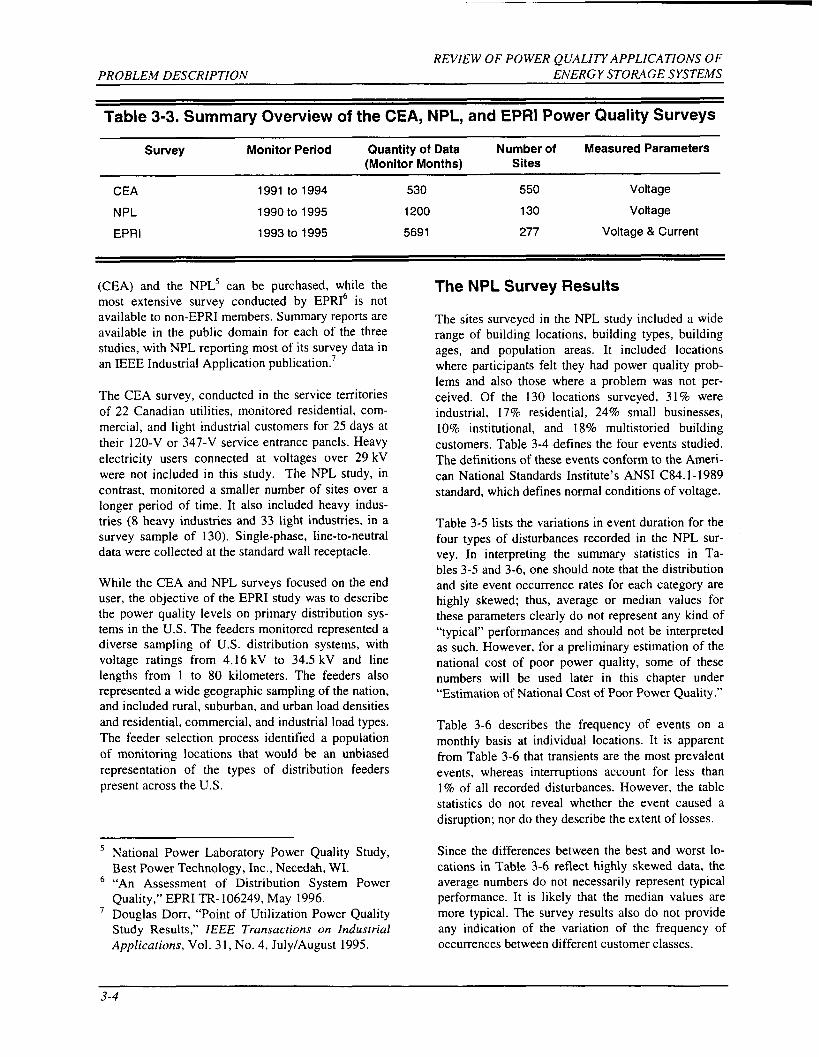
There are three surveys of power quality problems that form the basis for much of the discussion related to power quality issues. Table 3-3 provides an over- view of the scope of the surveys as well as the pa- rameters measured. Detailed results of these surveys are not available in the public domain. The surveys conducted by the Canadian Electrical Association
4 Canadian National Power Quality Survey, Cana- dian Electrical Association, Project 220 D 711A, August 1995.
3-2
REVIEW OF POWER QUALITY APPLICATIONS OF ENERGY STORAGE SYSTEMS PROBLEM DESCRIPTION
Figure 3-1.
300%
m
Cycles.
Seconds
m + 6’%0
120 Nominal Une WrlkX@
–.001 h 0.1
—1OC)AS 1 Ooops 8.3ms !1 4X .5 Sec 2’kec
Durotion
The CBEMA Curve.
Table 3-2. Summary of Power Quality Variation Categories and Causes*
Cateaorv Method Of Characterization Cause
IMPULSIVE TRANSIENTS
OSCILLATORY TRANSIENTS
SAGSLSWELLS
UNDERVOLTAGES/ OVERVOLTAGES
INTERRUPTIONS
HARMONIC DISTORTION
VOLTAGE FLICKER
NOISE
Magnitude Duration
Waveforms
Waveforms, RMS vs. Time
RMS vs. Time
Duration
Waveforms, Harmonic Spectrums
Magnitude Frequency of Modulation
Noise, Coupling Method, Frequency
Lightning, load switching
Lightning, line/cabie switching, capacitor switching, transformer switching, load switching
Remote faults
Overloading of feeder/motor starting, load changes, compensation changes
Breaker operation/fault clearing, maintenance
Nonlinear loads, system response character- istic
Intermittent loads, arcing loads, motor starting
Power electronic switching, arcing, electro- magnetic radiation
* Source: Power Qualit y Assessment Procedures, EPRI CU-7529 (December 1991).
3-3
REVIEW OF PO WER QUALITY APPLICATIONS OF
PROBLEM DESCRIPTION ENERGY STORAGE SYSTEMS
Table 3-3. Summary Overview of the CEA, NPL, and EPRI Power Quality Surveys
Survey Monitor Period Quantity of Data Number of Measured Parameters (Monitor Months) Sites
CEA 1991 to 1994 530 550 Voltage
NPL 1990 to 1995 1200 130 Voltage
EPRI 1993 to 1995 5691 277 Voltage & Current
(CEA) and the NPL5 can be purchased, while the most extensive survey conducted by EPRIC is not available to non-EPRI members. Summary reports are available in the public domain for each of the three studies, with NPL reporting most of its survey data in an IEEE Industrial Application publication.’
The CEA survey, conducted in the service territories of 22 Canadian utilities, monitored residential, com- mercial, and light industrial customers for 25 days at their 120-V or 347-V service entrance panels. Heavy
electricity users connected at voltages over 29 kV were not included in this study. The NPL study, in contrast, monitored a smaller number of sites over a longer period of time. It also included heavy indus- tries (8 heavy industries and 33 light industries, in a survey sample of 130). Single-phase, line-to-neutral data were collected at the standard wall receptacle.
While the CEA and NPL surveys focused on the end user, the objective of the EPRI study was to describe the power quality levels on primary distribution sys- tems in the U.S. The feeders monitored represented a diverse sampling of U.S. distribution systems, with voltage ratings from 4.16 kV to 34.5 kV and line lengths from 1 to 80 kilometers. The feeders also represented a wide geographic sampling of the nation, and included rural, suburban, and urban load densities and residential, commercial, and industrial load types. The feeder selection process identified a population of monitoring locations that would be an unbiased representation of the types of distribution feeders present across the U.S.
5 National Power Laboratory Power Quality Study, Best Power Technology, Inc., Necedah, WI.
c “An Assessment of Distribution System Power Quality,” EPRI TR- 106249, May 1996.
7 Douglas Dorr, “Point of Utilization Power Quality Study Results:’ IEEE Transactions on Industrial
Applications, Vol. 31, No. 4, July/August 1995.
The NPL Survey Results
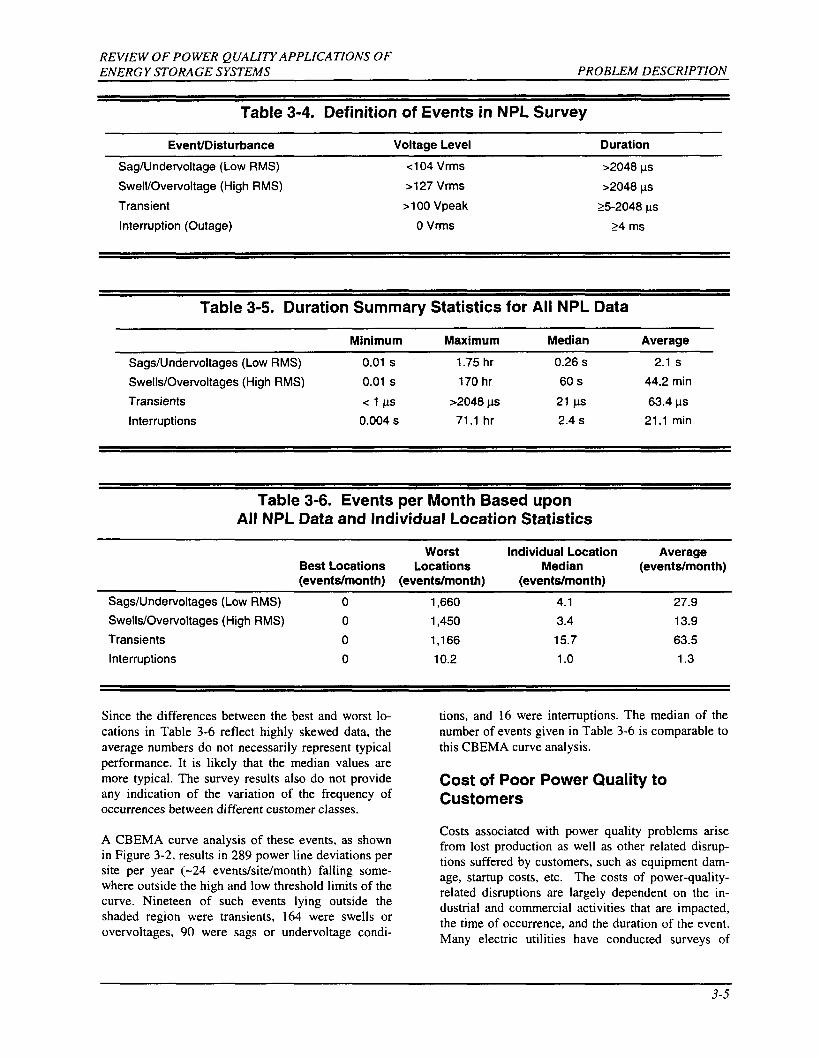
The sites surveyed in the NPL study included a wide range of building locations, building types, building ages, and population areas. It included locations where participants felt they had power quality prob- lems and also those where a problem was not per- ceived. Of the 130 locations surveyed, 31 % were industrial, 17% residential, 24% small businesses, 10% institutional, and 18% multistoried building customers. Table 3-4 defines the four events studied. The definitions of these events conform to the Ameri- can National Standards Institute’s ANSI C84. 1-1989 standard, which defines normal conditions of voltage.
Table 3-5 lists the variations in event duration for the four types of disturbances recorded in the NPL sur- vey. In interpreting the summary statistics in Ta- bles 3-5 and 3-6, one should note that the distribution and site event occurrence rates for each category are highly skewed; thus, average or median values for these parameters clearly do not represent any kind of “typical” performances and should not be interpreted as such. However, for a preliminary estimation of the national cost of poor power quality, some of these numbers will be used later in this chapter under “Estimation of National Cost of Poor Power Quality.”
Table 3-6 describes the frequency of events on a monthly basis at individual locations. It is apparent from Table 3-6 that transients are the most prevalent events, whereas interruptions account for less than 1% of all recorded disturbances. However, the table statistics do not reveal whether the event caused a disruption; nor do they describe the extent of losses.
Since the differences between the best and worst lo- cations in Table 3-6 reflect highly skewed data, the average numbers do not necessarily represent typical performance. It is likely that the median values are more typical. The survey results also do not provide any indication of the variation of the frequency of occurrences between different customer classes.
3-4
REVIEW OF PO WER QUALITY APPLICA TIONS OF ENERGY STORAGE SYSTEMS PROBLEM DESCRIPTION
Table 3-4. Definition of Events in NPL Survey
Event/Disturbance Voltage Level Duration
Sag/Undewoltage (Low RMS) c104 Vrms >2048 )lS
Swell/Ovewoltage (High RMS) >127 Vrms >2048 ~S
Transient >100 Vpeak >5.2048 PS
Interruption (Outage) O Vrms 24 ms
Table 3-5. Duration Summary Statistics for All NPL Data
Minimum Maximum Median Average
Sags/Undewoltages (Low RMS) 0.01 s 1.75 hr 0.26 S 2.1 s
Swells/Ovewoitages (High RMS) 0.01 s 170 hr 60 S 44.2 min
Transients <l@ >2048 w 21 ps 63.4 KS
Interruptions 0.004 s 71.1 hr 2.4 S 21.1 min
Table 3-6. Events per Month Based upon All NPL Data and Individual Location Statistics
Worst Individual Location Average Best Locations Locations Median (events/month) (events/month) (events/month) (events/month)
Sags/Undemoltages (Low RMS) o 1,660 4.1 27.9
Swells/Overvoltages (High RMS) o 1,450 3.4 13.9
Transients o 1,166 15.7 63.5
Interruptions o 10.2 1.0 1.3
Since the differences between the best and worst lo- cations in Table 3-6 reflect highly skewed data, the average numbers do not necessarily represent typical performance. It is likely that the median values are more typical. The survey results also do not provide any indication of the variation of the frequency of occurrences between different customer classes.
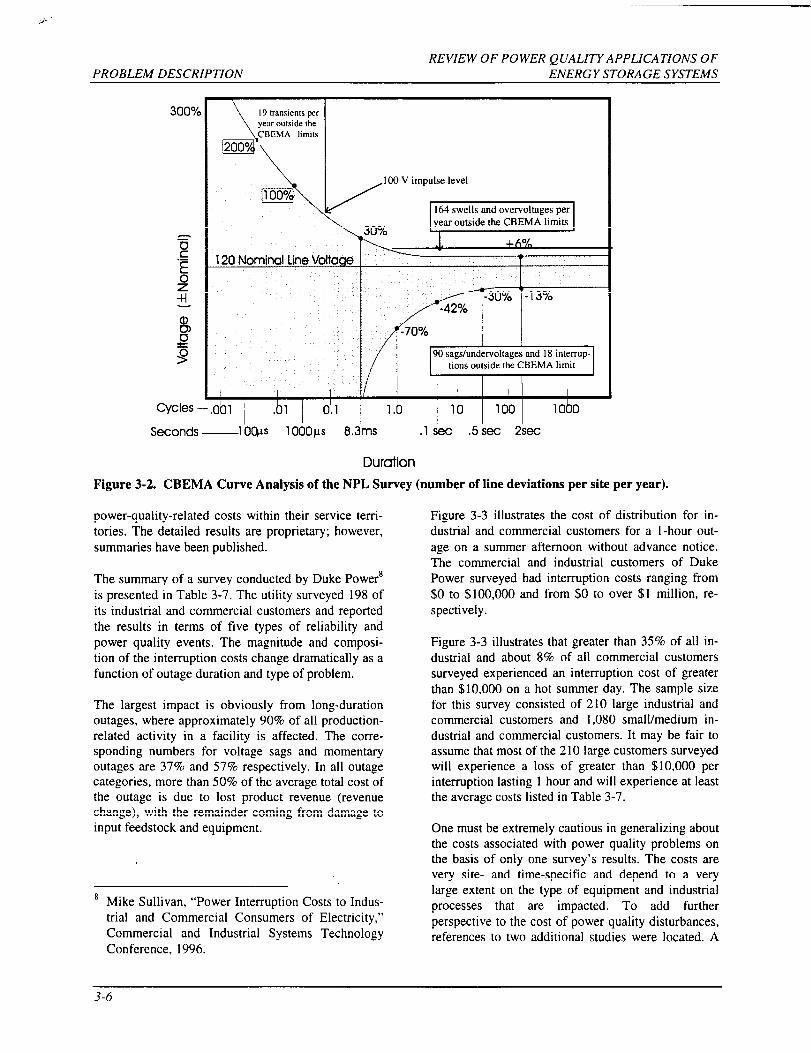
A CBEMA curve analysis of these events, as shown in Figure 3-2, results in 289 power line deviations per site per year (-24 events/site/month) falIing some- where outside the high and low threshold limits of the curve. Nineteen of such events lying outside the shaded region were transients, 164 were swells or overvoltages, 90 were sags or undervoltage condi-
tions, and 16 were interruptions. The median of the number of events given in Table 3-6 is comparable to this CBEMA curve analysis.
Cost of Poor Power Quality to Customers
Costs associated with power quality problems arise from lost production as well as other related disrup- tions suffered by customers, such as equipment dam- age, startup costs, etc. The costs of power-quality- reiated disruptions are largely dependent on the in- dustrial and commercial activities that are impacted, the time of occurrence, and the duration of the event. Many electric utilities have conducted surveys of
3-5
,,..
REVIEW OF PO WER QUALITY APPLICA TIONS OF PROBLEM DESCRIPTION ENERGY STORAGE SYSTEMS
300%
/
I 9 transients per
year outside the
CBEMA limits
m
L I
100 V impulse level
m 164 swells and ovet-voltages per] year outside the CBEMA-lirnits
120 Nominal Line Voltage
1/ F 90 sags/undervoltages and 18 interrup-
? 1 I , ,, , i
Cycles –,o~l .01 0:1 1 b lb 100 1 Otto
Seconds —1 Ocl.ls 1000 ps 8.3ms .1 Sec ,5 sec 2sec
Duration
Figure 3-2. CBEMA Curve Analysis of the NPL Survey (number of line deviations per site per year).
power-quality-related costs within their service terri- tories. The detailed results are proprietary; however, summaries have been published.
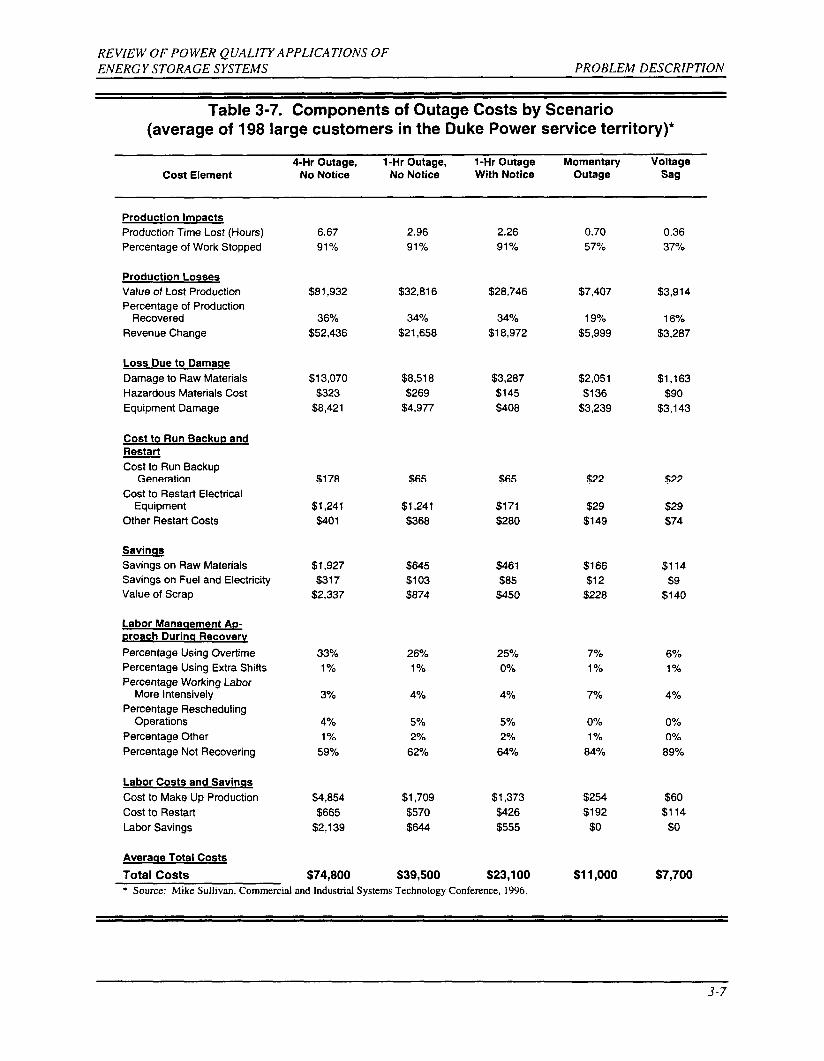
The summary of a survey conducted by Duke Powers is presented in Table 3-7. The utility surveyed 198 of its industrial and commercial customers and reported the results in terms of five types of reliability and power quality events. The magnitude and composi- tion of the interruption costs change dramatically as a function of outage duration and type of problem.
The largest impact is obviously from long-duration outages, where approximately 90% of all production- related activity in a facility is affected. The corre- sponding numbers for voltage sags and momentary outages are 379Z0 and 57% respectively. In all outage categories, more than 5070 of the average total cost of the outage is due to lost product revenue (revenue change), with the remainder coming from damage to input feedstock and equipment.
8 Mike Sullivan, “Power Interruption Costs to Indus- trial and Commercial Consumers of Electricity,” Commercial and Industrial Systems Technology Conference, 1996.
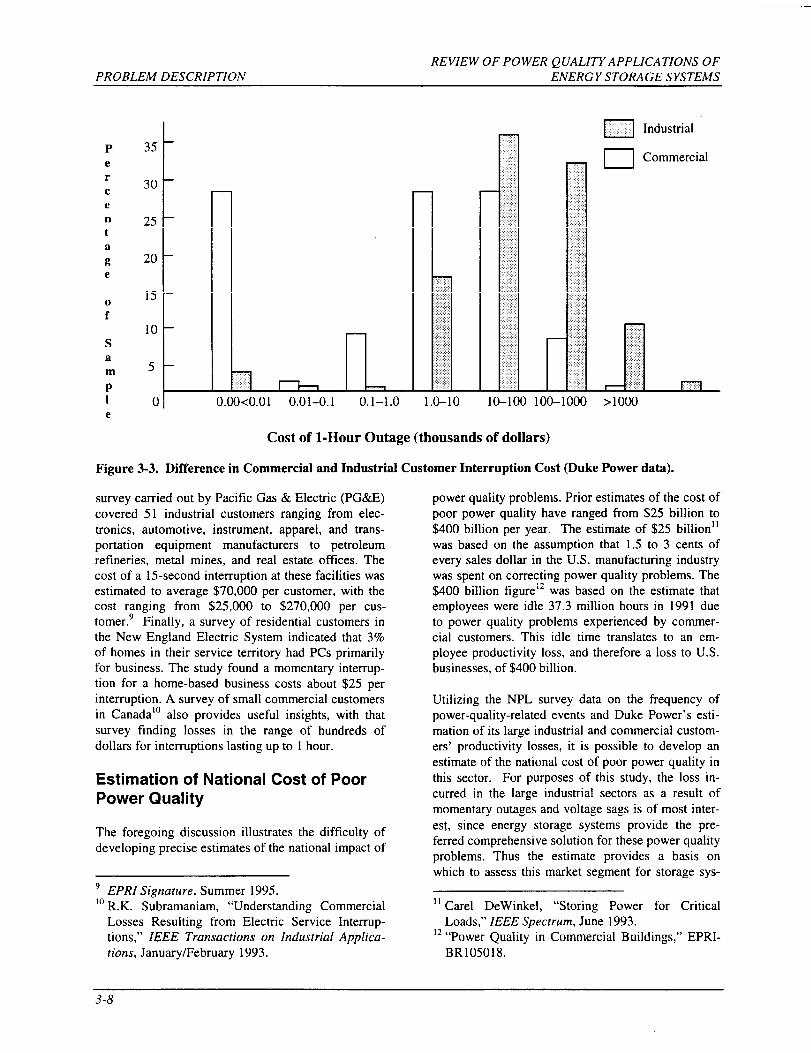
Figure 3-3 illustrates the cost of distribution for in- dustrial and commercial customers for a 1-hour out- age on a summer afternoon without advance notice. The commercial and industrial customers of Duke Power surveyed had interruption costs ranging from
$0 to $100,000 and from $0 to over $1 million, re- spectively.
Figure 3-3 illustrates that greater than 35% of all in- dustrial and about 8% of all commercial customers surveyed experienced an interruption cost of greater than $10,000 on a hot summer day. The sample size for this survey consisted of 210 large industrial and commercial customers and 1,080 small/medium in- dustrial and commercial customers. It may be fair to assume that most of the 210 large customers surveyed will experience a loss of greater than $10,000 per interruption lasting 1 hour and will experience at least the average costs listed in Table 3-7.
One must be extremely cautious in generalizing about the costs associated with power quality problems on the basis of only one survey’s results, The costs are very site- and time-specific and depend to a very large extent on the type of equipment and industrial processes that are impacted. To add further perspective to the cost of power quality disturbances, references to two additional studies were located. A
3-6
REVIEW OF PO WER QUALITY APPLICA TIONS OF ENERGY STORAGE SYSTEMS PROBLEM DESCRIPTION
Table 3-7. Components of Outage Costs by Scenario (average of 198 large customers in the Duke Power service territory~
4-Hr Outaga, l-Hr Outage, l-Hr Outage Momentary Voltage Coat Element No Notice No Notice With Notice Outage Sag
Production Impacts
Production Time Lost (Hours)
Percentage of Work Stopped
Production Losses
Value of Lost Production
Percentage of Production Recovered
Revenue Change
Loss Due to Damaae
Damage to Raw Materials
Hazardous Materials Cost
Equipment Damage
Cost to Run Backup and Restart
Cost to Run Backup Generation
Cost to Restart Electrical Equipment
Other Restart Costs
S12!@M Savings on Raw Materials
Savings on Fuel and Electricity
Value of Scrap
Labor Manacrement Ap- proach Durina Recovery
Percentage Using Overtime
Percentage Using Extra Shifts
Percentage Working Labor More intensively
Percentage Rescheduling Operations
Percentage Other
Percentage Not Recovering
Labor Costs and Savinqs
Cost to Make Up Production
Cost to Restart
Labor Savings
Averaqe Total Costs
Total Costs
6.67
91%
$81,932
36%
$52,436
$13,070
$323 $8,421
$178
$1,241
$401
$1,927
$317
$2,337
33%
1%
3%
4%
1%
59%
$4,854
$665
$2,139
$74,800
2.96
91%
$32,816
340/0
$21,658
$8,518
$269
$4,977
$65
$1,241
$368
$845
$103 $874
26%
1%
4%
s~o
2%
62?.
$1,709
$570
$644
$39,500
2.26
91%
$28,746
34%
$18,972
$3,287 $145
$408
$65
$171
$280
$461
$85
$450
25%
070
4%
5%
2%
640/.
$1,373
$426
$555
$23,100
0.70
57%
$7,407
19%
$5,999
$2,051
$136
$3,239
$22
$29
$149
$166
$12
$228
770 170
7%
070
170
84%
$254
$192
$0
$11,000
0.36
370/0
$3,914
16%
$3,287
$1,163
$90
$3,143
$22
$29
$74
$114
$9 $140
6%
190
4%
07’0
o%
890/.
$60
$114
$0
$7,700 * Source: Mike Sullivan, Commercial and Industrial Systems Technology Conference, 1996.
3-7
REVIEW OF PO WER QUALITY APPLICATIONS OF PROBLEM DESCRIPTION ENERGY STORAGE SYSTEMS
P e r c e n t
a
13 e
o f
s a m
P 1
e
35 –
30 –
25 –
20 –
15 –
10 –
5
11 - o\ 0.00<0.01 0.01-0.1 0.1-1.0
m Industrial
1o-1oo 100-1000 >1000
Cost of l-Hour Outage (thousands of dollars)
Figure 3-3. Difference in Commercial and Industrial Customer Interruption Cost (Duke Power data).
survey carried out by Pacific Gas & Electric (PG&E) covered 51 industrial customers ranging from elec- tronics, automotive, instrument, apparel, and trans- portation equipment manufacturers to petroleum refineries, metal mines, and real estate oftlces. The cost of a 15-second interruption at these facilities was estimated to average $70,000 per customer, with the cost ranging from $25,000 to $270,000 per cus- tomer.9 Finally, a survey of residential customers in the New England Electric System indicated that 3% of homes in their service territory had PCs primarily for business. The study found a momentary interrup- tion for a home-based business costs about $25 per interruption. A survey of small commercial customers
in Canada10 also provides useful insights, with that survey finding losses in the range of hundreds of dollars for interruptions lasting up to 1 hour.
Estimation of National Cost of Poor Power Quality
The foregoing discussion illustrates the difficulty of developing precise estimates of the national impact of
9 EPRI Signature, Summer 1995. 10 R.K. Subramaniam, “Understanding Commercial
Losses Resulting from Electric Service Interrup- tions,” IEEE Transactions on Industrial Applica- tions, January fFebruary 1993.
power quality problems. Prior estimates of the cost of poor power quality have ranged from $25 billion to
$400 billion per year. The estimate of $25 billion{ 1 was based on the assumption that 1.5 to 3 cents of every sales dollar in the U.S. manufacturing industry was spent on correcting power quality problems. The
$400 billion figure12 was based on the estimate that employees were idle 37.3 million hours in 1991 due to power quality problems experienced by commer- cial customers. This idle time translates to an em- ployee productivity loss, and therefore a loss to U.S. businesses, of $400 billion.
Utilizing the NPL survey data on the frequency of power-quality-related events and Duke Power’s esti- mation of its large industrial and commercial custom- ers’ productivity losses, it is possible to develop an estimate of the national cost of poor power quality in this sector. For purposes of this study, the loss in- curred in the large industrial sectors as a result of momentary outages and voltage sags is of most inter- est, since energy storage systems provide the pre- ferred comprehensive solution for these power quality problems. Thus the estimate provides a basis on which to assess this market segment for storage sys-
‘ 1 Carel DeWinkel, “Storing Power for Critical Loads,” IEEE Spectrum, June 1993.
12 “Power Quality in Commercial Buildings,” EPRI- BR105O18.
3-8
REVIEW OF PO WER QUALITY APPLICATIONS OF ENERGY STORAGE SYSTEMS PROBLEM DESCRIPTION
terns. In the interest of taking a conservative ap- proach, Sentech’s estimate is limited to the indus- trial/large customer sector, because the disruptions caused in this sector are the costliest (as discussed earlier under “Cost of Power Quality to Customer”), and hence investment in storage systems by this sec- tor may be justifiable.
The NPL survey data in Table 3-6 provide the aver- age and median interruptions and sags/undervoltages recorded in all 130 sites surveyed but do not differ- entiate between customer classes. Comparison of av- erages and medians indicates that there are a disproportionately smaller number of sites experienc- ing very poor power quality compared to the greater number of sites with good power quality records. The use of the median number instead of the average removes much of this distortion in the survey data and will indicate the extent of disturbance experi- enced by at least 50% of survey participants. There- fore, the survey medians will be assumed to be representative of what is experienced by at least 5070 of the larger industrial customers. Hence, from Ta- ble 3-6 it may be concluded that at least 50% of in- dustrial customers experience 12 interruptions and 49 sags/undervoltages per year.l 3
The figures in Table 3-7 indicate that it is fair to as- sume that the large industrial customers (excluding large commercial customers) in Duke Power’s service
territory will incur an average cost of $11,027 and
$7,694 for each occurrence of momentary outage and voltage sag, respectively. Multiplying the loss for each of these occurrences with the frequency of their occurrence14 results in an average 10ss of $509,000 per year for each of Duke Power’s large industrial customers. Given that there are 8,70015 large indus- trial customers in Duke Power’s service territory, the total loss by this customer class will be on the order of $4.4 billion.
The total industrial electricity sales in the U.S. and within Duke Power’s service territory are 1,004 TWh and 28.2 TWh, respective y. If one were to extrapo- late the estimated $4.4 billion loss experienced by
13 Twelve interruptions (12 months/year* 1 event/ month) and 49 sags/undervoltages (4.1 events/ month* 12 months/year) per year.
‘4 [(12*$1 1,027)+ (49* $7,694)= $509,000]
‘5 The EL&P Electric Utility Industry Directory— 1995 indicates that Duke Power has 8,693 indus- trial/large customers among its total customer base of 1.7 million.
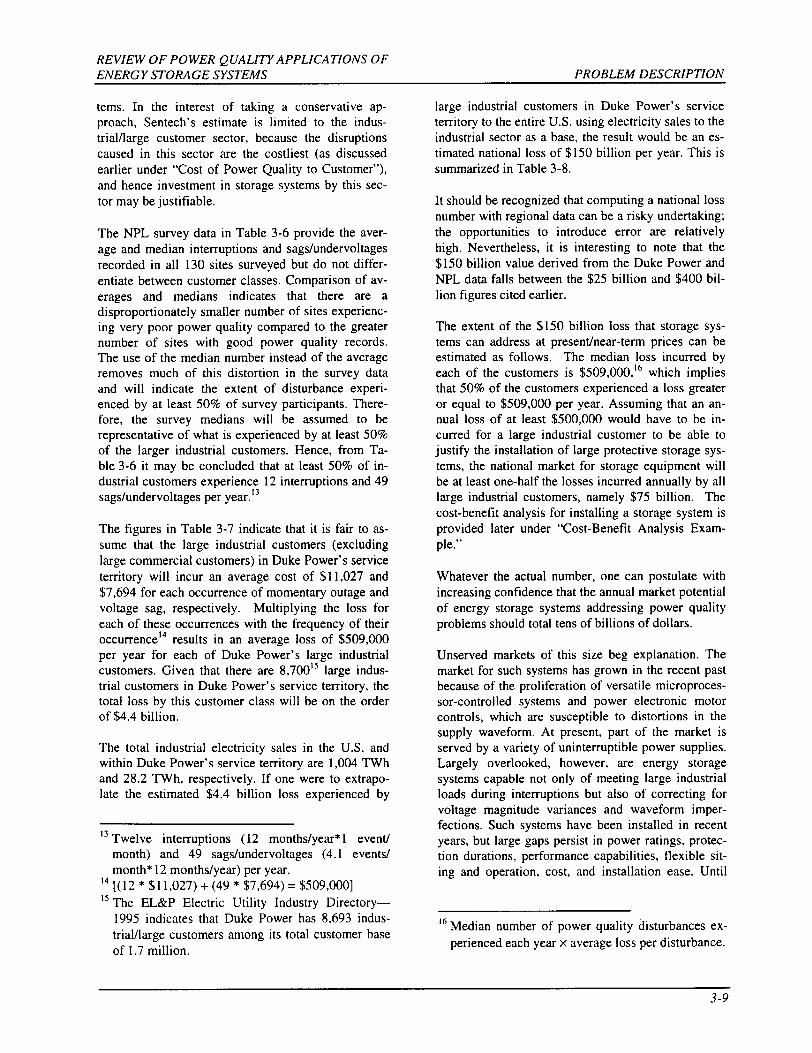
large industrial customers in Duke Power’s service territory to the entire U.S. using electricity sales to the industrial sector as a base, the result would be an es- timated national loss of $150 billion per year. This is summarized in Table 3-8.
It should be recognized that computing a national loss number with regional data can be a risky undertaking; the opportunities to introduce error are relatively high. Nevertheless, it is interesting to note that the $150 billion value derived from the Duke Power and NPL data falls between the $25 billion and $400 bil- lion figures cited earlier.
The extent of the $150 billion loss that storage sys- tems can address at presenthear-term prices can be estimated as follows. The median loss incurred by each of the customers is $509,000,16 which implies that 50% of the customers experienced a loss greater or equal to $509,000 per year. Assuming that an an- nual loss of at least $500,000 would have to be in- curred for a large industrial customer to be able to justify the installation of large protective storage sys- tems, the national market for storage equipment will be at least one-half the losses incurred annually by all large industrial customers, namely $75 billion. The cost-benefit analysis for installing a storage system is provided later under “Cost-Benefit Analysis Exam- ple.”
Whatever the actual number, one can postulate with increasing confidence that the annual market potential of energy storage systems addressing power quality problems should total tens of billions of dollars.
Unserved markets of this size beg explanation. The market for such systems has grown in the recent past because of the proliferation of versatile microproces- sor-controlled systems and power electronic motor controls, which are susceptible to distortions in the supply waveform. At present, part of the market is served by a variety of uninterruptible power supplies. Largely overlooked, however, are energy storage systems capable not only of meeting large industrial loads during interruptions but also of correcting for voltage magnitude variances and waveform imper- fections. Such systems have been installed in recent years, but large gaps persist in power ratings, protec- tion durations, performance capabilities, flexible sit- ing and operation, cost, and installation ease. Until
16 Median number of power quality disturbances ex-
perienced each year x average loss per disturbance.
3-9
REVIEW OF PO WER QUALITY APPLICA TIONS OF
PROBLEM DESCRIPTION ENERGY STORAGE SYSTEMS
Table 3-8. National Cost Estimate for Large Industrial Customers
Average Annual Cost to Large Estimated Cost for Estimated Cost for Industrial Customers Duke Power Customer National Customer
Group Group
Undervoltagesl $377,000 $ 3.2B $ 114B sags
Interruptions $132,000 $l.l B $ 39B
Total estimated U.S. cost (rounded): $ 150B
these gaps are overcome, manufacturers and their in the cost of goods sold, reducing U.S. competitive- customers will continue to experience higher than ness. The cost is ultimately paid by consumers, do- necessary costs. mestic and foreign. The mitigation of these costs
merits the attention of the affected industries, busi-
The large annual cost of poor power quality repre- nesses capable of developing solutions, and the DOE.
sents a form of national inefficiency and is reflected
3-1o
REVIEW OF PO WER QUALITY APPLICATIONS OF ENERGY STORAGE SYSTEMS TECHNOLOGY OPTIONS
4. Technology Options
There are three general approaches to solving power quality problems:
● Eliminate or modify the source of the distur- bances.
. Eliminate or modify the path for the disturbances between the source and the affected equipment.
● Protect the affected equipment.
Generally, consideration of all three options is neces- sary to develop a cost-effective solution. Determining the least-cost approach to mitigating power quality problems often requires that an industrial customer initiate an extensive internal survey to determine the nature of the problem. Such a survey is commonly done in partnership with the local utility, and the so- lutions that are implemented are often developed with strong input from the utility and in some instances even with financial assistance from the utility.
Many technology solutions exist to deal with the dif- ferent power quality events. Devices that are com- monly used for this purpose include the following:
● Surge arrestors
● Isolation transformers
. Uninterruptible power supply (UPS)/energy storage systems
● Static Var systems
. Wiring and grounding
. Shielding
. Fi hers
● Constant voltage transformers
. Backup generators
. Series capacitors
. Dynamic voltage restorer
. Humidity control
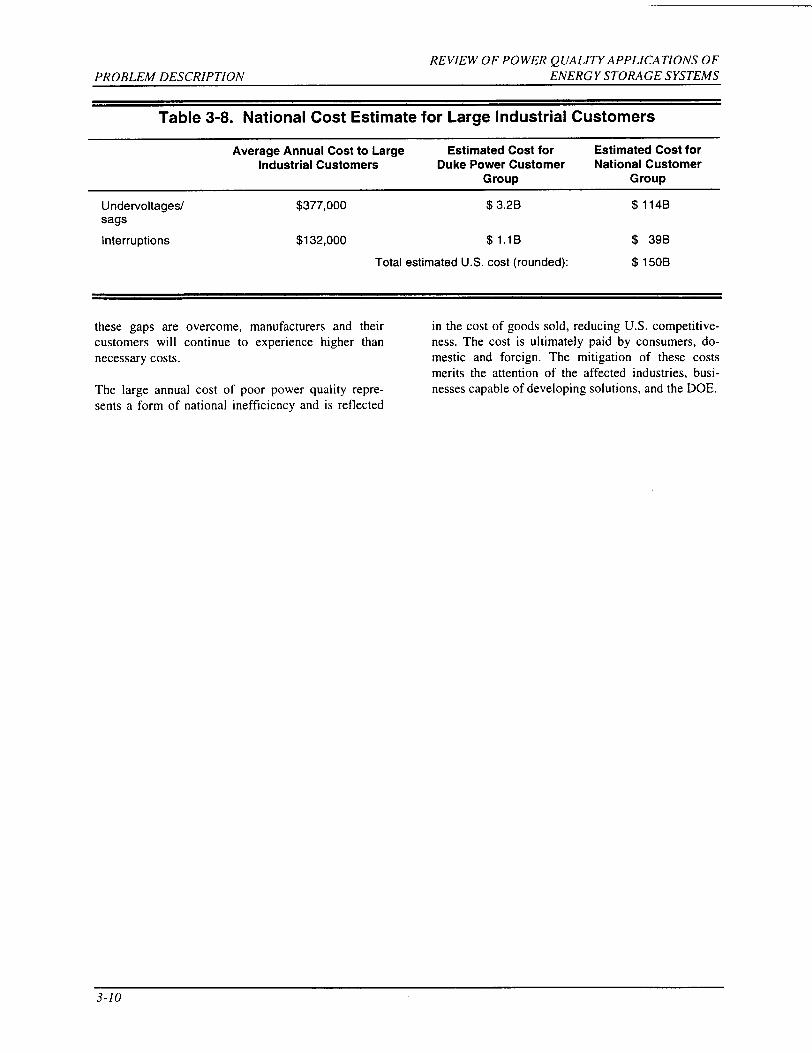
Energy storage systems can be placed off-line, in a line-interactive mode, or on-line to deal with power
quality problems. Off-line (also called standby) en- ergy storage systems (see Figure 4-1 ) are cost- effective for small, less critical, stand-alone applica- tions such as isolated PCs and peripherals. However, when an outage occurs in the utility supply, this con-
figuration may not be able to switch to its storage
power supply fast enough to prevent disturbances in highly sensitive equipment. If filters are present, standby systems will protect against most transients by limiting excess voltage, but their ability to protect against sags and surges is significantly less than on- line or line-interactive designs.
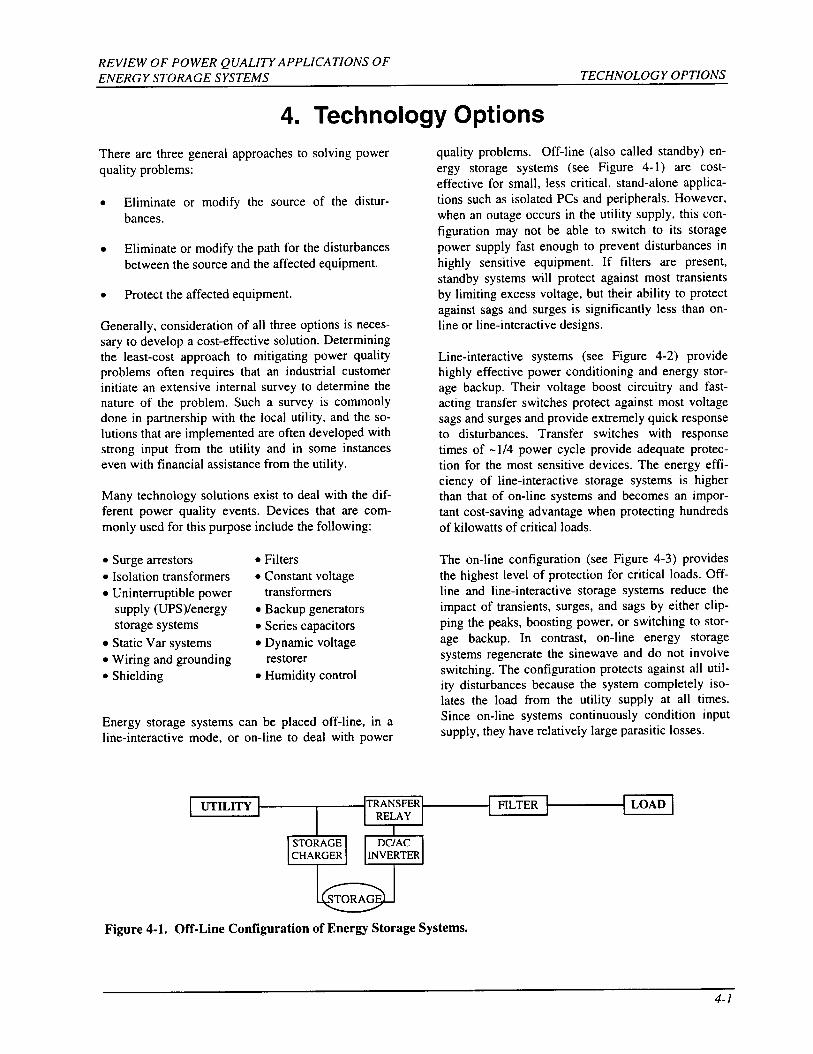
Line-interactive systems (see Figure 4-2) provide highly effective power conditioning and energy stor- age backup. Their voltage boost circuitry and fast- acting transfer switches protect against most voltage sags and surges and provide extremely quick response to disturbances. Transfer switches with response times of -1/4 power cycle provide adequate protec- tion for the most sensitive devices. The energy effi- ciency of line-interactive storage systems is higher than that of on-line systems and becomes an impor- tant cost-saving advantage when protecting hundreds of kilowatts of critical loads.
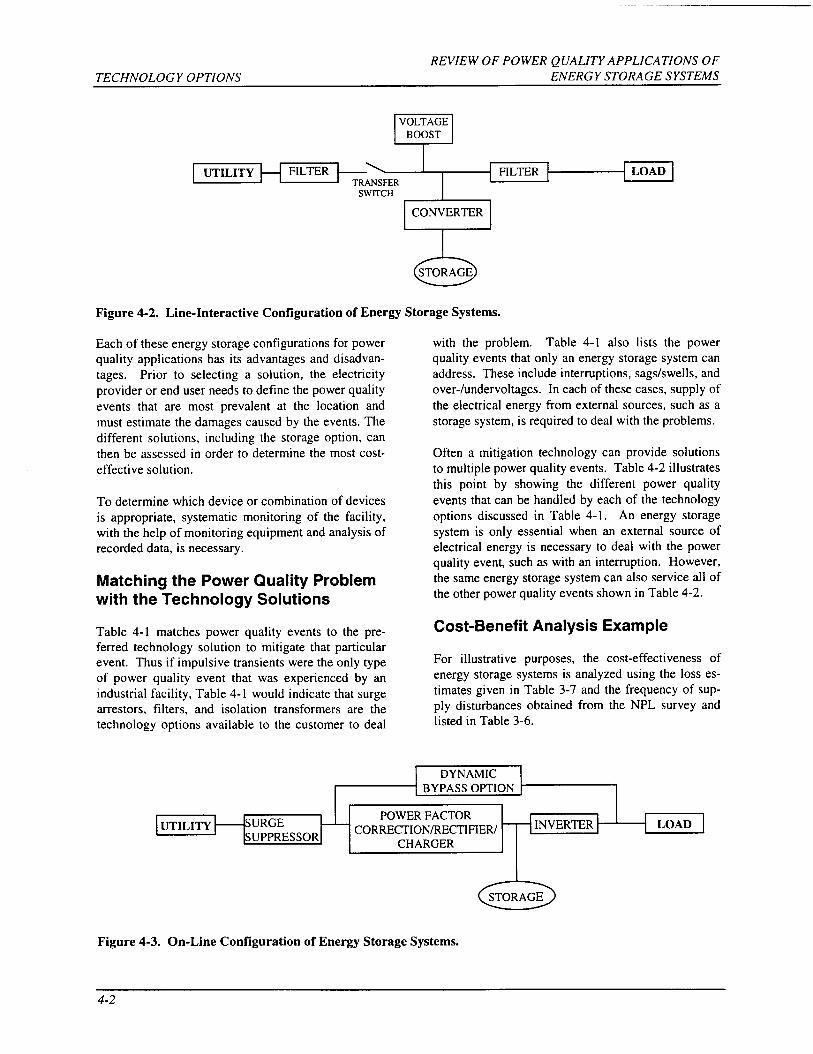
The on-line configuration (see Figure 4-3) provides the highest level of protection for critical loads. Off- line and line-interactive storage systems reduce the impact of transients, surges, and sags by either clip- ping the peaks, boosting power, or switching to stor- age backup. In contrast, on-line energy storage systems regenerate the sinewave and do not involve switching. The configuration protects against all util- ity disturbances because the system completely iso- lates the load from the utility supply at all times. Since on-line systems continuously condition input supply, they have relatively large parasitic losses.
I UTILITY TRANSFER FILTER LOAD RELAY
1 STORAGE DCJAC CHARGER lNVERTER
Figure 4-1. Off-Line Configuration of Energy Storage Systems.
4-1
REVIEW OF PO WER QUALITY APPLICATIONS OF TECHNOLOGY OPTIONS ENERGY STORAGE SYSTEMS
VOLTAGE BOOST
I UTILITY FILTER FILTER LOAD
SWITCH
CONVERTER
a STORAGE
Figure 4-2. Line-Interactive Configuration of Energy Storage Systems.
Each of these energy storage configurations for power quality applications has its advantages and disadvan- tages. Prior to selecting a solution, the electricity provider or end user needs to define the power quality events that are most prevalent at the location and must estimate the damages caused by the events. The different solutions, including the storage option, can then be assessed in order to determine the most cost- effective solution.
To determine which device or combination of devices is appropriate, systematic monitoring of the facility, with the help of monitoring equipment and analysis of recorded data, is necessary.
Matching the Power Quality Problem with the Technology Solutions
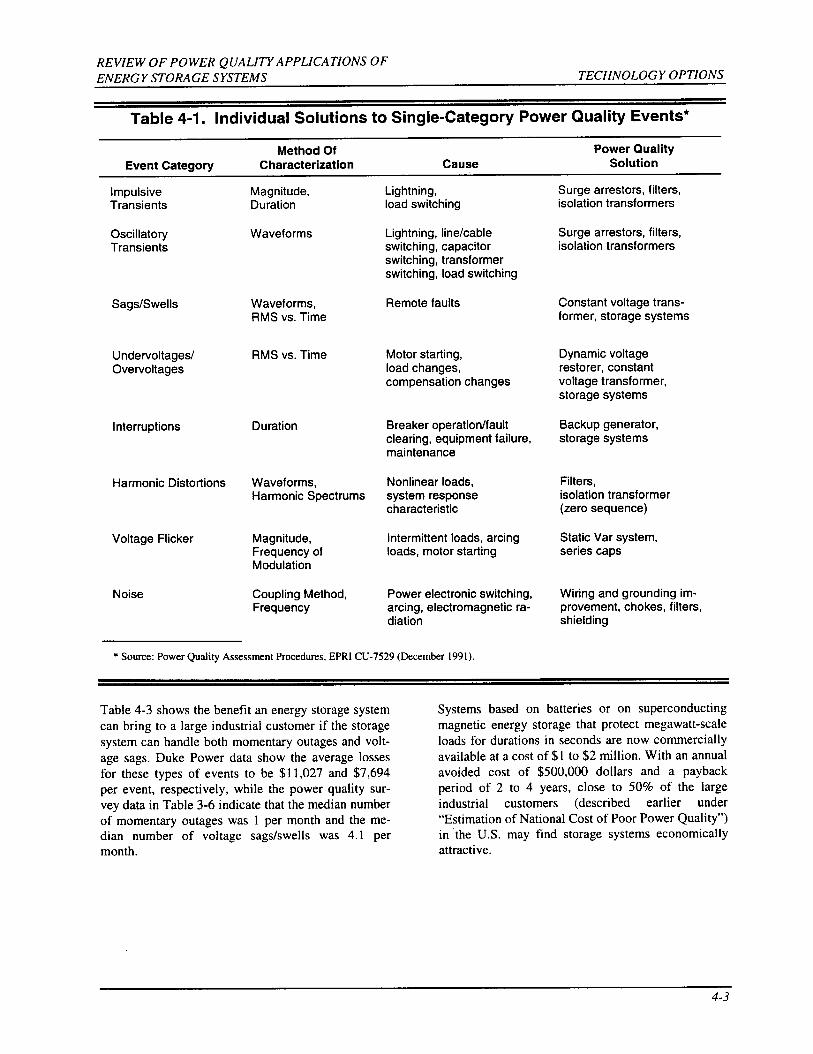
Table 4-l matches power quality events to the pre- ferred technology solution to mitigate that particular event. Thus if impulsive transients were the only type of power quality event that was experienced by an industrial facility, Table 4-1 would indicate that surge arrestors, filters, and isolation transformers are the technology options available to the customer to deal
with the problem. Table 4-1 also lists the power quality events that only an energy storage system can address. These include interruptions, sags/sweils, and over-/undervoltages. In each of these cases, supply of the electrical energy from external sources, such as a storage system, is required to deal with the problems.
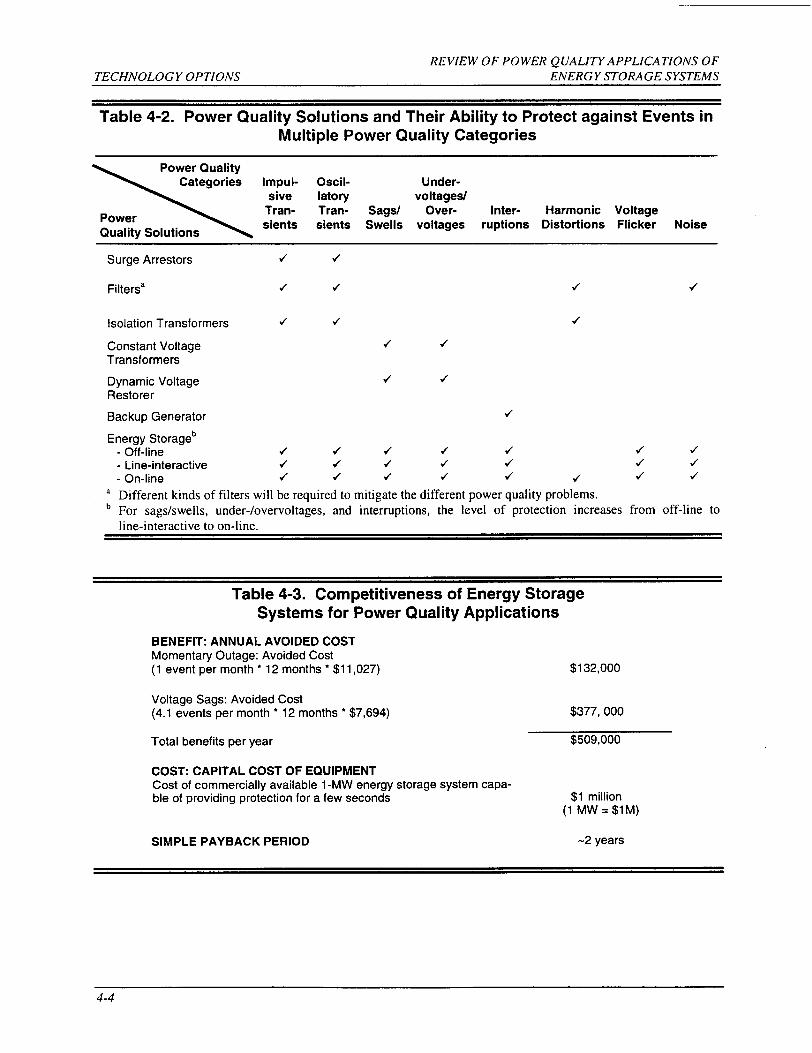
Often a mitigation technology can provide solutions to multiple power quality events. Table 4-2 illustrates this point by showing the different power quality events that can be handled by each of the technology options discussed in Table 4-1. An energy storage
system is only essential when an external source of electrical energy is necessary to deal with the power quality event, such as with an interruption. However, the same energy storage system can also service all of the other power quality events shown in Table 4-2.
Cost-Benefit Analysis Example
For illustrative purposes, the cost-effectiveness of energy storage systems is analyzed using the loss es- timates given in Table 3-7 and the frequency of sup- ply disturbances obtained from the NPL survey and listed in Table 3-6.
I DYNAMIC I ‘1 BYPASS OPTION I
UTILITY lWJRGE POWER FACTOR
CORRECTION/RECTIFIER/ INVERTER LOAD SUPPRESSOR
1 CHARGER
& Figure 4-3. On-Line Configuration of Energy Storage Systems.
4-2
REVIEW OF PO WER QUALITY APPLICATIONS OF ENERGY STORAGE SYSTEMS TECHNOLOGY OPTIONS
Table 4-1. Individual Solutions to Single-Category Power Quality Events*
Method Of Power Quality Event Categoty Characterization Cause Solution
Impulsive Transients
Oscillatory Transients
Sags/Swells
Undervoltagesd Overvoltages
Interruptions
Harmonic Distortions
Voltage Flicker
Noise
Magnitude, Duration
Waveforms
Waveforms, RMS vs. Time
RMS vs. Time
Duration
Waveforms, Harmonic Spectrums
Magnitude, Frequency of Modulation
Coupling Method, Frequency
Lightning, load switching
Lightning, line/cable switching, capacitor switching, transformer switching, load switching
Remote faults
Motor starting, load changes, compensation changes
Breaker operation/fault clearing, equipment failure, maintenance
Nonlinear loads, system response characteristic
Intermittent loads, arcing loads, motor starting
Power electronic switching, arcing, electromagnetic ra- diation
* Source: Power Quatity Assessment Procedures, EPRI CU-7529 (December 1991).
Surge arrestors, filters, isolation transformers
Surge arrestors, filters, isolation transformers
Constant voltage trans- former, storage systems
Dynamic voltage restorer, constant voltage transformer, storage systems
Backup generator, storage systems
Filters, isolation transformer (zero sequence)
Static Var system, series caps
Wiring and grounding im- provement, chokes, filters, shielding
Table 4-3 shows the benefit an energy storage system can bring to a large industrial customer if the storage system can handle both momentary outages and volt- age sags. Duke Power data show the average losses for these types of events to be $11,027 and $7,694 per event, respectively, while the power quality sur- vey data in Table 3-6 indicate that the median number of momentary outages was 1 per month and the me- dian number of voltage sags/swells was 4.1 per month.
Systems based on batteries or on superconducting magnetic energy storage that protect megawatt-scale loads for durations in seconds are now commercially available at a cost of $1 to $2 million. With an annual avoided cost of $500,000 dollars and a payback period of 2 to 4 years, close to 50% of the large industrial customers (described earlier under “Estimation of National Cost of Poor Power Quality”) in ‘the U.S. may find storage systems economically attractive.
4-3
REVIEW OF PO WER QUALITY APPLICATIONS OF TECHNOLOGY OPTIONS ENERGY STORAGE SYSTEMS
Table 4-2. Power Quality Solutions and Their Ability to Protect against Events in Multiple Power Quality Categories
Surge Arrestors 4 d
Filtersa / 4 4 4
Isolation Transformers 4 4 4
Constant Voltage 4 4
Transformers
Dynamic Voltage 4 /
Restorer
Backup Generator 4
Energy Storageb - Off-line 4 / 4 d / / 4
- Line-interactive 4 4 4 4 4 d 4
- On-line 4 d 4 / 4 4 4 /
‘ Different kinds of filters will be required to mitigate the different power quality problems. b For sags/swells, under-/overvoltages, and interruptions, the level of protection increases from off-line to
line-interactive to on-line.
Table 4-3. Competitiveness of Energy Storage Systems for Power Quality Applications
BENEFIT: ANNUAL AVOIDED COST Momenta~ Outage: Avoided Cost (1 event per month•12months*$11,027) $132,000
Voltage Sags: Avoided Cost (4.1 events per month * 12 months ● $7,694) $377,000
Total benefits per year $509,000
COST: CAPITAL COST OF EQUIPMENT Cost of commercially available 1 -MW energy storage system capa- ble of providing protection for a few seconds $1 million
(1 MW = $lM)
SIMPLE PAYBACK PERIOD -2 years
4-4
REVIEW OF PO WER QUALITY APPLICATIONS OF ENERGY STORAGE SYSTEMS CONCLUSIONS
5. Conclusions
Power quality issues have come to the forefront re- cently mainly because of the increased use of sophis- ticated microprocessor-controlled equipment in
industrial processes. Systems with loads that are
highly sensitive and interconnected in extensive net- works are vulnerable because they are dependent on the most sensitive device in the system when a distur- bance occurs. Surveys conducted by the electric util-
ity industry demonstrate that manufacturers incur large losses as a result of poor power quality.
Power quality problems arise from a variety of events. There are a number of technology options that electricity suppliers as well as end users can use to mitigate power quality problems. It is imperative that careful investigation of the frequency of events and their economic impacts be undertaken. Often it would be most cost-effective to implement solutions only for those power quality problems that have severe eco- nomic impacts rather than installing systems capable of dealing with all power quality events.
Data on the frequency of system disturbances and their economic impacts can be obtained through sys- tematic monitoring at end-user sites. Several such studies have been conducted; however, most of the results are considered to be proprietary and are thus not available in the public domain. Summaries of some of these surveys have been published that con- tain enough information to permit tentative conclu- sions to be drawn regarding the nature and frequency of power quality disturbances and the role energy storage systems can play in mitigating them. The sur- vey data suggest that storage systems are well suited to handle problems arising from unscheduled momen- tary outages. These types of events, although less frequent, cause the most severe economic impact. An energy storage system installed to handle outages
can also reduce the impacts of voltage sags, under- voltages, and other disturbances. On-line storage systems are capable of eliminating all power quality- related problems, but such a comprehensive solution may be justified only for the more critical processes.
Preliminary estimates based on both the NPL and Duke Power surveys indicate that a 2-to-4-yr payback period for commercially available energy storage systems is feasible for the industrial customer experi- encing typical disturbances. The data from these two surveys were used to obtain a rough estimate of $150 billion as the annual losses incurred nationally by the industrial sector because of momentary outages and voltage sags, two events for which storage systems are the primary solution. This number is between the $25 billion estimate made in an IEEE publication and the $400 billion estimate made in an EPRI publica- tion.
This study suggests that the accrued national benefit from mitigating power quality losses is very large. This conclusion is supported by studies conducted by EPRI and other entities. However, it is important to note that the numerical estimates of the benefits de- veloped in this study are based on limited data and on extrapolation from the available information. The numerical estimates therefore serve only to establish an order of magnitude of the accrued benefits of miti-
gating power quality problems. To establish more precise estimates, it would be necessary to further refine the analysis with better. more comulete data obtained through greater access to tric utilities.
more detailed surveying or through surveys already conducted by elec-
5-1
REVIEW OF PO WER QUALITY APPLICA TIONS OF
CONCLUSIONS ENERGY STORAGE SYSTEMS
Intentionally Left Blank
5-2

Graphical Illustration of Power Quality Events

REVIEW OF PO WER QUALITY APPLICATIONS OF ENERGY STORAGE SYSTEMS APPENDIX A
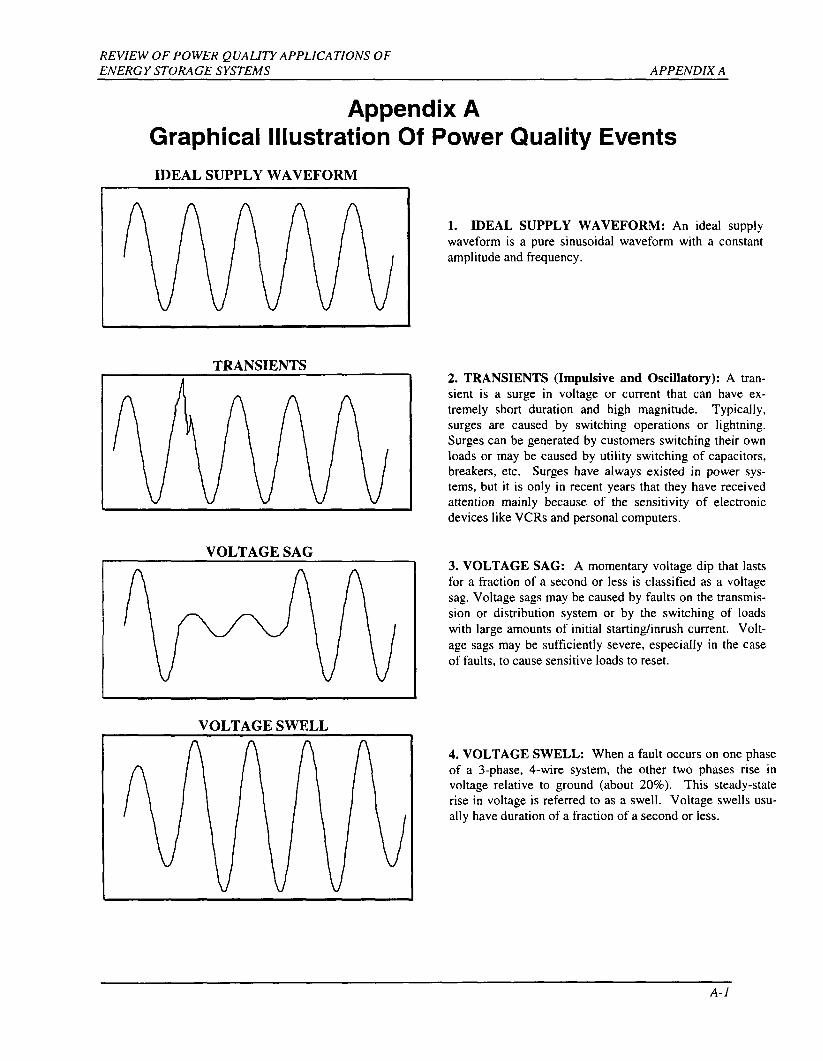
Appendix A Graphical Illustration Of Power Quality Events
IDEAL SUPPLY WAVEFORM
1. IDEAL SUPPLY WAVEFORM: An ideal supply waveform is a pure sinusoidal waveform with a constant
amplitude and frequency.
TRANSIENTS ‘1
VOLTAGE SAG
VOLTAGE SWELL
2. TRANSIENTS (Impulsive and Oscillatory): A tran- sient is a surge in voltage or current that can have ex- tremely short duration and high magnitude. Typically, surges are caused by switching operations or lightning. Surges can be generated by customers switching their own loads or may be caused by utility switching of capacitors, breakers, etc. Surges have always existed in power sys- tems, but it is only in recent years that they have received attention mainly because of the sensitivity of electronic devices like VCRs and personal computers.
3. VOLTAGE SAG: A momentary voltage dip that lasts for a fraction of a second or less is classified as a voltage sag. Voltage sags may be caused by faults on the transmis- sion or distribution system or by the switching of loads with large amounts of initial starting/inrush current. Volt-
age sags may be sufficiently severe, especially in the case of faults, to cause sensitive loads to reset.
4. VOLTAGE SWELL: When a fault occurs on one phase of a 3-phase, 4-wire system, the other two phases rise in voltage relative to ground (about 20%). This steady-state rise in voltage is referred to as a swell. Voltage swells usu- ally have duration of a fraction of a second or less.
A-1
REVIEW OF PO WER QUALITY APPLICATIONS OF
APPENDIX A ENERGY STORAGE SYSTEMS
UNDEWOVERVOLTAGE
,-1 ,. ,- ,n ‘,
,, ,, ,, ,,
A : ‘ :’ ‘ ‘ ‘ : ‘
POWER OUTAGE
HARMONICS
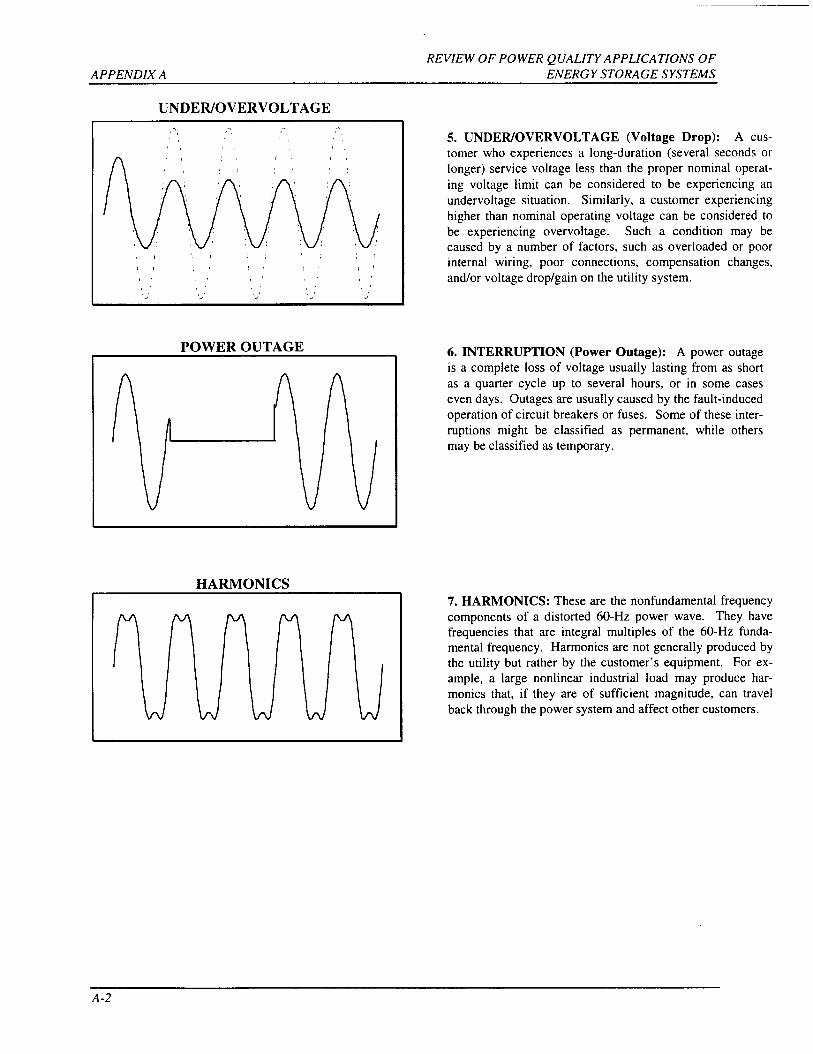
5. UNDEWOVERVOLTAGE (Voltage Drop): A cus- tomer who experiences a long-duration (several seconds or longer) service voltage less than the proper nominal operat- ing voltage limit can be considered to be experiencing an undervoltage situation. Similarly, a customer experiencing higher than nominal operating voltage can be considered to be experiencing overvoltage. Such a condition may be caused by a number of factors, such as overloaded or poor internal wiring, poor connections, compensation changes, andlor voltage droplgain on the utility system.
6. INTERRUPTION (Power Outage): A power outage is a complete loss of voltage usually lasting from as short as a quarter cycle up to several hours, or in some cases even days. Outages are usually caused by the fault-induced operation of circuit breakers or fuses. Some of these inter- ruptions might be classified as permanent, while others may be classified as temporary.
7. HARMONICS: These are the nonfundamental frequency components of a distorted 60-Hz power wave. They have frequencies that are integral multiples of the 60-Hz funda- mental frequency. Harmonics are not generally produced by the utility but rather by the customer’s equipment. For ex- ample, a large nonlinear industrial load may produce har- monics that, if they are of sufficient magnitude, can travel back through the power system and affect other customers.
A-2
Distribution
ABB Power T&D Co., Inc. Attn: P. Danfors 16250 West Glendale Drive
New Berlin, WI 53151
American Electric Power Service Corp. Attn: C. Shih
1 Riverside Plaza
Columbus, OH 43215
Applied Power Corporation Attn: Tim Ball Solar Engineering 1210 Homann Drive, SE Lacey, WA 98503
Ascension Technology
Attn: Edward Kern
Post Office Box 6314 Lincoln Center, MA O 773
Anchorage Municipal Light & Power Attn: Meera Kohler 1200 East lsl Avenue Anchorage, AK 99501
Bechtel Corporation Attn: W. Stolte P.O. BOX 193965
San Francisco, CA 94119-3965
Berliner Kraft und Licht (BEWAG)
Attn: K. Kramer Stauffenbergstrasse 26 1000 Berlin 30
GERMANY
Business Management Consulting
Attn: S. Jabbour
24704 Voorhees Drive Los Altos Hills, CA 94022
C&D Charter Power Systems, Inc. (2) Attn: Dr. Sudhan S. Misra
Attn: Dr. L. Holden Washington & Cherry Sts, Conshohocken. PA 19428
Argonne National Laboratories (2)
Attn: W. DeLuca G. Henriksen
CTD, Building 205 9700 South Cass Avenue Argonne, IL 60439
Arizona Public Service (2) Attn: R. Hobbs
Herb Hayden
400 North Fifth Street
P.O. BOX 53999, MS-8931 Phoenix, AZ 85072-3999
AVO International Attn: Gary Markle
510 Township Line Rd. Blue Bell, PA 19422
Babcock & Wilcox Attn: Glenn Campbell
P.O. BOX 785
Lynchburg, VA 24505
California State Air Resources Board Attn: J. Holmes Research Division
P,O. BOX 2815
Sacramento. CA 95812
Calpine Corp. Attn: R. Boucher 50 W. San Fernando, Ste. 550
San Jose, CA 95113
Chugach Electric Association, Inc. (2) Attn: T. LOWS
J. Cooley P.O. BOX 196300
Anchorage, AK 99519-6300
Consolidated Edison (2) Attn: M. Lebow
N. Tai 4 Irving Place New York, NY 10003
Corn Belt Electric Cooperative Attn: R. Stack
P.O. Box 816 Bloomington, IL 61702
Delphi Energy and Engine Management Systems (3) Attn: J. Michael Hinga
R. Galyen
R. Rider
P.O. BOX 502650
Indianapolis, IN 46250
Alaska State Division Of Energy (3) Attn: P. Frisbey
P. Crump B. Tiedeman
333 West Fourth Ave, Suite 220 Anchorage, AK 99501-2341
EA Technology, Ltd. Attn: J. Baker
Chester CH 1 6ES Capenhurst, England UNITED KINGDOM
Eagle-Picher Industries Attn: J. DeGruson
C & Porter Street Jo@n, MO 64802
Electrosource Attn: Michael Dodge P.O. Box7115 Loveland, CO 80537
Eltech Research Corporation Attn: Dr. E. Rudd 625 East Street Fairport Harbor, OH 44077
Energetic, Inc. (3)
Attn: H. Lowitt P. Taylor L. Charles
7164 Gateway Drive Columbia, MD 21046
Energetic, Inc. (4)
Attn: M. Farber R. Scheer J. Schilling P. DiPietro
501 School St. SW, Suite 500 Washington, DC 20024
Energy and Environmental Economics, Inc. Attn: Greg J. Ball 353 Sacramento St., Suite 1540 San Francisco, CA 94111
International Energy Systems, Ltd.
Attn: G. Barker Chester High Road Nestor, South Wirral
L64 UE UK
UNITED KINGDOM
East Penn Manufacturing Co., Inc. Attn: M. Stanton Deka Road
Lyon Station, PA 19536
Electric Power Research Institute (3)
Attn: S. Chapel
S. Eckroad R. Schainker
P. O. BOX 10412 Palo Alto, CA 94303-0813
Electrochemical Engineering Consultants, Inc.
Attn: P. Symons 1295 Kelly Park Circle
Morgan Hill, CA 95037
Electrochemical Energy Storage Systems, Inc. Attn: D. Feder
35 Ridgedale Avenue Madison, NJ 07940
Energy Systems Consulting Attn: A. Pivec 41 Springbrook Road Livingston, NJ 07039
Firing Circuits, Inc.
Attn: J. Mills P.O. BOX 2007 Norwalk, CT 06852-2007
General Electric Company Attn: N. Miller
Building 2, Room 605 1 River Road Schenectady, NY 12345
General Electric Drive Systems Attn: D. Daly 1501 Roanoke Blvd.
Salem, VA 24153
GE Industrial& Power Services Attn: Bob Zrebiec 640 Freedom Business Center King of Prussia, PA 19046
Giner, Inc. Attn: A. LaConti 14 Spring Street Waltham. MA 02254-9147
Golden Valley Electric Association, Inc. Attn: S. Haagensen BOX 71249 758 Illinois Street
Fairbanks, AK 99701
GNB Technologies (3) Industrial Battery Company Attn: G. Hunt
J, Szymborski R. Maresca
Woodlake Corporate Park
829 Parkview Blvd. Lombard, IL 60148-3249
Lawrence Berkeley Laboratory (3) Attn: E. Cairns
K. Kinoshita
F. McLarnon
University of California One Cyclotron Road Berkeley, CA 94720
Longitude 122 West
Attn: S. Schoenung
1241 Hobart St. Menlo Park. CA 94025
Lucent Technologies
Attn: C. Mak
3000 Skyline Drive Mesquite, TX 75149
Lucent Technologies, Inc.
Attn: J. Morabito
Director, Global Research and Development P.O. BOX 636 600 Mountain Avenue Murray Hill, NJ 07974-0636
GNB Technologies World Headquarters Attn: S. Deshpande’ 375 Northridge Road Atlanta. GA 30350
Hawaii Electric Light Co. Attn: C. Nagata P.O. BOX 1027 Hilo, HI 96720
ILZRO (3) Attn: J. Cole
P. Moseley C. Parker
P.O. BOX 12036
Research Triangle Park, NC 27709
Imperial Oil Resources, Ltd. Attn: R. Myers 3535 Research Rd N W Calgary, Alberta CANADA T2L 2K8
Innovative Power Sources
Attn: Ken Belfer 1419 Via Jon Jose Road
Alamo, CA 94507
Metlakatla Power& Light
Attn: H. Achenbach
P.O. Box 359 Metlakatla, AK 99926
Micron Corporation
Attn: D. Nowack 158 Orchard Lane Winchester, TN 37398
ZBB Technologies, LTD.
Attn: Robert J. Parry
Managing Director 16,Emerald Tee. West Perth Western Australia 6005
National Renewable Energy Laboratory (6) Attn: L. Flowers
J. Green S. Hock R. DeBlasio B. Stafford
H. Thomas
1617 Cole Blvd.
Golden, CO 80401-3393
New York Power Authority Attn: B. Chezar 1633 Broadway New York, NY 10019
NC Solar Center Attn: Bill Brooks
Comer of German and Western Box 7401 NCSU Raleigh, NC 27695-740
Northern States Power Attn: D. Zum 414 Nicollet Mall
Minneapolis, MN 55401
NPA Technology Attn: Jack Brown Suite 700, Two University Place Durham, NC 27707
Oak Ridge National LaboratoW (3) Attn: B. Hawsey, Bldg. 3025, MS-6040
J. Stoval, Bldg. 3147, MS-6070 J. VanCoevering, Bldg. 3147, MS-6070
B. Kirby, Bldg. 3147, MS-6070
P.O. BOX 2008
Oak Ridge, TN 37831
Public Service Company of New Mexico Attn: J. Neal
Manager, Premium Power Services
Alvarado Square MS-BA52 Albuquerque, NM 87158
PEPCO Attn: Brad Johnson 1900 Pennsylvania NW Washington, DC 20068
Oglethorpe Power Company Attn: C. Ward 2100 E. Exchange Place P.O. Box 1349
Tucker, GA 30085-1349
Chief Technology Officer Attn: Robert Wills Advanced Energy Systems Riverview Mill Post OffIce Box 262
Wilton, NH 0308
Omnion Power Engineering Corporation Attn: H. Meyer 2010 Energy Drive
P.O. BOX 879
East Troy, WI 53120
Orion Energy Corp. Attn: Doug Danley 10087 Tyler Place #5
Ijamsville, MD 21754
Public Service Company of New Mexico Attn: R. Flynn Senior Vice President Alvarado Square MS-2838 Albuquerque, NM 87158
International Business and Technology Services Inc. Attn: J. Neal
Administrator Research and Development
9220 Tayloes Neck Rd.
Nanjemoy, MD 20662
Gridwise Engineering Company Attn: B. Norris 121 Starlight Place
Danville, CA 94526
Pacific Northwest Laboratory (2) Attn: J. DeSteese, K5-02
D. Brown Battelle Blvd. Richland, WA 99352
Power Technologies, Inc. Attn: P. Prabhakara 1482 Erie Blvd. P.O. BOX 1058
Schenectady, NY 12301
Puerto Rico Electric Power Authority
Attn: W. Torres
G.P.O. BOX 4267
San Juan, Puerto RICO 00936-426
Solar Electric Specialists Co. Mr. Jim Trotter 232-Anacapa St. Santa Barbara, CA 93101
ENERTEC
Attn: D. Butler 349 Coronation Drive Auchenflower, Queensland, 4066 P.O. Box 1139 Milton BC Qld 4064 AUSTRALIA
Southern Company Services, Inc. (2) Research and Environmental Affairs 14N-8 195
Attn: B. R. Rauhe, Jr. K. Vakhshoorzadeh
600 North 18ti Street P.O. BOX 2625 Birmingham, Al 35202-2625
Trace Technologies (2) Attn: Michael Behnke
W. Erdman
6952 Preston Avenue
Livermore, CA 94550
TRACE Engineering Attn: B. Roppenecker President
5916 195* Northeast Arlington, Washington 98223
RMS Company Attn: K. Ferris 87 Martling Ave. Pleasantville, NY 10570
Powercell Corporation (2) Attn: Reznor L Orr
Rick Winter 10 Rogers Street
Cambridge, MA 02142
Raytheon Engineers and Constructors Attn: A. Randall
700 South Ash St.
P.O. BOX 5888 Denver, CO 80217
Siemens Solar Attn: Clay Aldrich 4650 Adohn Lane
Post Office Box 6032 Camarillo, CA 93011
R&D Associates
Attn: J. Thompson 2100 Washington Blvd. Arlington, VA 22204-5706
California Energy Commission Attn: Jon Edwards
1516 Ninth Street, MS-46
Sacramento, CA 95814
Sentech, Inc. (2) Attn: R. Sen
K. Klunder 4733 Bethesda Avenue, Suite 608
Bethesda, MD 20814
Sentech, Inc. Attn: Robert Reeves
9 Eaton Road Troy, NY 12180
Santa Clara University Attn: Charles Feinstein, Ph.D. Department of Decision and Information
Sciences Leavey School of Business and Administration Santa Clara, CA 95053
SAFT Research & Dev. Ctr, Attn: Guy Chagnon 107 Beaver Court Cockeysville, MD 21030
Salt River Project (2) Attn: H. Lundstrom
G.E. “Ernie” Palomino, P.E.
MS PAB 357, BOX 52025 Phoenix, AZ 85072-2025
Southern California Edison Attn: R. N. Schweinberg 6070 N. Irwindale Ave., Suite I Irwindale,CA91702
Soft Switching Technologies Ann: D. Divan
2224 Evergreen Rd., Ste. 6
Middleton, WI 53562
Solarex Attn: G. Braun 630 Soku-ex Court Frederick, MD 21701
The Solar Connection Attn: Michael Orians P.O. BOX ] 138 Morro Bay, CA 93443
Trojan Battery Company Attn: Jim Drizos 12380-Clark Street
Santa Fe Springs, CA 90670
U.S. Department of Energy Attn: C. Platt EE-12 FORSTL Washington, DC 20585
U.S. Department of Energy Attn: K. Heitner OffIce of Transportation Technologies
EE-32 FORSTL Washington, DC 20585
U.S. Department of Energy Attn: R. Brewer EE- 10 FORSTL Washington, DC 20585
SEIA Attn: S. Sklar 122 C Street NW 4’h Floor Washington, DC 20001-2104
SRI International Attn: C. Seitz
333 Ravenswood Ave.
Menlo Park, CA 94025
Stored Energy Engineering (2) Attn: George Zink
J.R. Bish 7601 E. 88* Place Indianapolis, IN 46256
Stuart Kuritzky
347 Madison Avenue New York, NY 10017
Superconductivity, Inc. (2) Attn: Jennifer Billman
Michael Gravely P.O. BOX 56074 Madison, WI 53705-4374
Switch Technologies
Attn: J. Hurwitch 4733 Bethesda Ave., Ste. 608
Bethesda, MD 20814
Trace Attn: Michael R. Behnke 6952 Precision Avenue Livermore, CA 94550
U.S. Department of Energy
Attn: P. Patil
Office of Transportation Technologies EE-32 FORSTL Washington, DC 20585
U.S. Department of Energy Attn: T. Duong EE-32 FORSTL Washington, DC 20585
U.S. Department of Energy Attn: J. Daley EE- 12 FORSTL Washington, DC 20585
U.S. Department of Energy Attn: N. Rossmeissl EE-13 FORSTL Washington, DC 20585
U.S. Department of Energy Attn: Jim Rannels Photovokaic Program EE- 11 FORSTL 1000 Independence Ave., S. W. Washington, DC 20585-0121
U.S. Department of Energy Attn: J. P. Archibald EE-90 FORSTL Washington, DC 20585
U.S. Department of Energy Attn: M. B. Ginsberg EE-90 FORSTL Washington, DC 20585
U.S. Department of Energy
Attn: G. Buckingham Albuquerque Operations Office Technology Development Division P.O. Box 5400 Albuquerque, NM 87185
TU Electric R&D Programs Attn: James Fangue P.O. Box 970
Fort Worth, TX 76101
University of Missouri - Rolls Attn: M. Anderson 112 Electrical Engineering Building Rolls, MO 65401-0249
U.S. Department of Energy Attn: R. Eynon
Nuclear and Electrical Analysis Branch EI-821 FORSTL Washington, DC 20585
R. Weaver 777 Wildwood Lane Palo Alto, CA 94303
U.S. Department of Energy Attn: A. Jelacic
EE-12 FORSTL Washington, DC 20585
U.S. Navy Attn: Wayne Taylor Code 83 BOOOD China Lake, CA 93555
U.S. Department of Energy Attn: A. G. Crawley EE-90 FORSTL
Washington, DC 20585
U.S. Department of Energy Attn: P. N. Overholt EE- 11 FORSTL Washington, DC 20585
U.S. Department of Energy Attn: J. Cadogan
EE- 11 FORSTL Washington, DC 20585
U.S. Department of Commerce Attn: Dr. Gerald P. Ceasar Building 101, Rm 623
Gaithersburg, MD 20899
Virginia Power Attn: Gary Vemo
Innsbrook Technical Center 5000 Dominion Boulevard Glen Ellen, VA 23233
Walt Disney World Design and Eng’g. Attn: Randy Bevin
P.O. Box 10,000 Lake Buena Vista, FL 32830-1000
Yuasa, Inc. (3) Attn: N. Magnani
F. Tarantino G. Cook
P.O. Box 14145
2366 Bemville Road
Reading, PA 19612-4145
U.S. Department of Energy Attn: A. Hoffman Office of Utility Technologies EE-1 O FORSTL Washington, DC 20585
U.S. Department of Energy Attn: R. Eaton
Golden Field Office 1617 Cole Blvd. Building 17 Golden, CO 80401
Westinghouse
Attn: Tom Matty
P.O. BOX 17230 Baltimore. MD 21023
Westinghouse STC
Attn: H. Saunders 1310 Beulah Road Pittsburgh, PA 15235
W. R. Grace& Company Attn: S. Strzempko
62 Whittemore Avenue Cambridge, MA 02140
Yuasa-Exide, Inc. Attn: R. Kristiansen
35 Loch Lomond Lane Middleton, NY 10941-1421
Crescent EMC Attn: R. B. Sloan Executive Vice President P.O. BOX 1831 Statesville, NC 28687
HL&P Energy Services Attn: George H. Nolin, CEM, P.E.
Product Manager Premium Power Services
P.O. Box 4300 Houston, TX 77210-4300
UFTO Attn: Edward Beardsworth 951 Lincoln Ave. Palo Alto, CA 94301-3041
The Technology Group, Inc. Attn: Tom Anyos 63 Linden Ave. Atherton, CA 94027-2161
ZBB Technologies, Inc. Attn: P. Eidler
11607 West Dearborn Wauwatosa, WI 53226-3961
ECG Consulting Group, Inc.
Attn: Daniel R. Bruck
Senior Associate 55-6 Woodlake Road Albany, NY 12203
Westinghouse Electric Corporation
Attn: Gerald J. Keane Manager, Venture Development Energy Management Division 4400 Alafaya Trail
Orlando, FL 32826-2399
The Brattle Group Attn: Thomas J. Jenkin 44 Brattle Street
Cambridge, MA 02138-3736
Exide Electronics Attn: John Breckenridge Director, Federal Systems Division
8609 Six Forks Road Raleigh, NC 27615
Northern States Power Company
Attn: Gary G. Kam, P.E. Consultant Electric Services 1518 Chestnut Avenue North Minneapolis, MN 55403
Frost & Sullivan (2)
Attn: Steven Krafl
Dave Coleman
2525 Charleston Road Mountain View, CA 94043
C&D Powercom Attn: Larry S. Meisner Manager Product Marketing 1400 Union Meeting Road P.O. Box 3053
Blue Bell, PA 19422-0858
Distributed Utility Associates Attn: Joseph Iannucci 1062 Concannon Blvd. Livermore, CA 94550
SAFT America, Inc.
Attn: Ole Vigerstol National Sales Manager 711 Industrial Blvd. Vaidosta, GA 13601
American Superconductor Corporation Attn: S. Amanda Chiu, P.E. Manager, Strategic Marketing Two Technology Drive
Westborough,MAO1581
University of Texas at Austin
Attn: John H. Price Research Associate Center for Electromechanics
J. J. Pickel Research Campus Mail Code R7000 Austin, TX 78712
U.S. Department of Energy Attn: W. Butler
PA-3 FORSTL Washington, DC 20585
U.S. Department of Energy Attn: J. A. Mazer EE-I 1 FORSTL Washington, DC 20585
VEDCO Energy
Attn: Rick Ubaldi
12 Agatha Lane
Wayne, New Jersey 07470
Intercon Limited (2) Attn: David Warar
6865 Lincoln Avenue Lincolnwood, IL 60646
Utility PhotoVoltaic Group Attn: Steve Hester
1800 M Street, N. W. Washington, DC 20036-5802
U.S. Department of Energy Attn: P. Maupin ER- 14 G-3431GTN Germantown, MD 20874-1290
Tampa Electric Company Attn: Terri Hensley, Engineer P.O. Box 111 Tarnpa, FL 33601-0111
U.S. Department of Energy Attn: R. J. King
EE- 11 FORSTL Washington, DC 20585
U.S. Department of Energy Attn: A. O. Bulawka EE-11 FORSTL Washington, DC 20585
Southern California Edison
Attn: N. Pinsky P.O. BOX 800
2244 Walnut Grove Ave., Rm418 Rosemead, CA 91770
U.S. Department of Energy Attn: D. T. Ton
EE-11 FORSTL Washington, DC 20585
U.S. Depattnent of Energy Attn: J. Galdo EE- 10 FORSTL Washington, DC 20585
Queensland Department of Mines and Energy
Attn: N. Lindsay
Senior Project Ofllcer
Energy Planning Division GPO Box 194 Brisbane 4001, Qld. Australia
Utility Power Group Attn: Mike Stem
9410-G DeSoto Avenue Chatsworth, CA 91311-4947
Amber Gray-Fenner 7204 Marigot Rd. NW
Albuquerque, NM 87120
ABB Power T&D Company, Inc. Attn: H. Weinerich 1460 Livingston Avenue North Brunswick, New Jersey
MS-0513, R. Eagan (1000) MS-0953, W. E. Alzheimer (1500) MS-0953, J. T. Cutchen (1501) MS-0741, S. Vamado (6200)
MS-0212, A. Phillips, (10230)
MS-0340, J. Braithwaite (1 832)
MS-0343, W. Cieslak (1832)
MS-0613, A. Akhil (1525) MS-0613, D. Doughty (1521) MS-0614, E. Binasiewicz (1522) MS-0613, G. Corey (1525) MS-06 14, G.P. Rodriguez, (1 523)
MS-06 13, I. Francis (1 525) MS-06 14, J.T. Crow (1523) MS-06 14, T.Unkelhaeuser(1523) MS-0614, D. Mitchell (1522) MS-0614, K.Grothaus(1523) MS-0613, N. Clark (1 525) MS-0613 R. Jungst (1521) MS-0704, P.C. Klimas (6201) MS-0708, H. Dodd (62 14) MS-0752, M, Tatro (6219) MS-0753, C. Cameron (6218)
MS-0753, R. Bonn (6218) MS-0753, T. Hund (62 18) MS-0753, W. Bower (6218)
MS-1 193, D. Rovang (9531) MS-0614, A Jimenez (1523)
MS-0537, S. Atcitty (23 14) MS-0613, J.D. Guillen (1525) MS-9403, Jim Wang (8713) MS-0613, P. Butler (1525) (20) MS-0619, Review & Approval Desk For DOE/OSTI (12690) (2) MS-0899, Technical Library (49 16) (2)
MS-901 8, Central Technical Files (8940-2)