Embed Size (px)
Citation preview

SANDIA REPORT SAND2021-9802 Printed August 2021
Review of Release Behavior of Hydrogen & Natural Gas Blends from Pipelines
Austin R. Baird, Austin M. Glover, Brian D. Ehrhart
Prepared by Sandia National Laboratories Albuquerque, New Mexico 87185 and Livermore, California 94550

2
Issued by Sandia National Laboratories, operated for the United States Department of Energy by National Technology & Engineering Solutions of Sandia, LLC. NOTICE: This report was prepared as an account of work sponsored by an agency of the United States Government. Neither the United States Government, nor any agency thereof, nor any of their employees, nor any of their contractors, subcontractors, or their employees, make any warranty, express or implied, or assume any legal liability or responsibility for the accuracy, completeness, or usefulness of any information, apparatus, product, or process disclosed, or represent that its use would not infringe privately owned rights. Reference herein to any specific commercial product, process, or service by trade name, trademark, manufacturer, or otherwise, does not necessarily constitute or imply its endorsement, recommendation, or favoring by the United States Government, any agency thereof, or any of their contractors or subcontractors. The views and opinions expressed herein do not necessarily state or reflect those of the United States Government, any agency thereof, or any of their contractors. Printed in the United States of America. This report has been reproduced directly from the best available copy. Available to DOE and DOE contractors from U.S. Department of Energy Office of Scientific and Technical Information P.O. Box 62 Oak Ridge, TN 37831 Telephone: (865) 576-8401 Facsimile: (865) 576-5728 E-Mail: [email protected] Online ordering: http://www.osti.gov/scitech Available to the public from U.S. Department of Commerce National Technical Information Service 5301 Shawnee Rd Alexandria, VA 22312 Telephone: (800) 553-6847 Facsimile: (703) 605-6900 E-Mail: [email protected] Online order: https://classic.ntis.gov/help/order-methods/

3
ABSTRACT Hydrogen can be used to reduce carbon emissions by blending into other gaseous energy carriers, such as natural gas. However, hydrogen blending into natural gas has important implications for safety which need to be evaluated. Hydrogen has different physical properties than natural gas, and these properties affect safety evaluations concerning a leak of the blended gas. The intent of this report is to begin to investigate the safety implications of blending hydrogen into the natural gas infrastructure with respect to a leak event from a pipeline. A literature review was conducted to identify existing data that will better inform future hazard and risk assessments for hydrogen/natural gas blends. Metrics with safety implications such as heat flux and dispersion behavior may be affected by the overall blend ratio of the mixture. Of the literature reviewed, there was no directly observed separation of the hydrogen from the natural gas or methane blend. No literature was identified that experimentally examined unconfined releases such as concentration fields or concentration at specific distances. Computational efforts have predicted concentration fields by modified versions of existing engineering models, but the validation of these models is limited by the unavailability of literature data. There are multiple literature sources that measured flame lengths and heat flux values, which are both relevant metrics to risk and hazard assessments. These data can be more directly compared to the outputs of existing engineering models for validation.

4
ACKNOWLEDGEMENTS This work was supported by the U.S. Department of Energy (DOE) Office of Energy Efficiency and Renewable Energy (EERE) Hydrogen and Fuel Cell Technologies Office (HFTO) and was directed by Laura Hill. The authors wish to thank Jay Keller (Zero Carbon Energy Solutions) for many useful discussions. The authors wish to thank Ethan Hecht and Chris LaFleur and Sandia National Laboratories for providing internal reviews of this document. Finally, the authors wish to thank Laura Hill and Neha Rustagi at DOE HFTO for their review of this document.

5
CONTENTS 1. Introduction ................................................................................................................................................. 9
1.1. Natural Gas Infrastructure Overview ............................................................................................ 9 1.2. Comparing Natural Gas and Hydrogen ...................................................................................... 12
2. Literature Review ...................................................................................................................................... 15 2.1. Dispersion Experiments ................................................................................................................ 15
2.1.1. Hydrogen & Methane Dispersion/Stratification Studies ............................................ 15 2.1.2. Hydrogen & Natural Gas Leak in Low Pressure Gas Infrastructure ........................ 17 2.1.3. Gas build-up in a domestic property following releases of methane/hydrogen
mixtures .............................................................................................................................. 19 2.2. Dispersion Modeling ...................................................................................................................... 21
2.2.1. CFD Modeling of Hydrogen and Methane Release from Pipelines .......................... 21 2.3. Jet Fire Experiments ....................................................................................................................... 24
2.3.1. Large Scale Experiment to Study High Pressure Pipeline Rupture ........................... 24 2.3.2. Large-Scale High-Pressure Jet Fire involving Natural Gas/Hydrogen ..................... 27 2.3.3. Properties of Large-Scale Methane/Hydrogen Fires ................................................... 31
2.4. Jet Fire Modeling ............................................................................................................................ 36 2.4.1. Transportation of Methane/Hydrogen Pipelines in Existing Infrastructure ........... 36 2.4.2. Predicting Radiative Characteristics of Hydrogen/Methane Jet Fires ...................... 40
2.5. Literature Summary and Results ................................................................................................... 45
3. Conclusions ................................................................................................................................................ 47
4. References .................................................................................................................................................. 49
LIST OF FIGURES Figure 1-1. Natural Gas Pipeline Infrastructure Diagram with Potential Hydrogen Injection
Locations (adapted from [4]) ................................................................................................................... 10 Figure 1-2. Pipeline Temperature vs. Distance- Summer Time (from [7]) ............................................. 11 Figure 1-3. Pipeline Temperature vs. Distance- Winter Time (from [7]) ................................................ 11 Figure 2-1. Sensor Position (from [14]) ........................................................................................................ 15 Figure 2-2. Dispersion Experiment 30% H2 & 70% CH4 (from [14]) ................................................... 16 Figure 2-3. Dispersion Experiment 10% H2 & 90% CH4 (from [14]) ................................................... 16 Figure 2-4. Leak Down Test at 471 kPa (from [15]) .................................................................................. 18 Figure 2-5. Pressure vs. Flow Rate though Valve w/ L/D of 7.81 (left) and 133 (right) (from [15]) . 19 Figure 2-6. Experimental Test Cell Layout (from [16]) .............................................................................. 20 Figure 2-7. Hydrogen Concentration at 4 sec w/ no wind (from [10]) ................................................... 21 Figure 2-8. Methane Concentration at 30 sec w/ no wind (from [10]) ................................................... 22 Figure 2-9. Hydrogen at 4% Vol after 4 sec release, 10 m/s wind blowing left to right (from [10]) .. 22 Figure 2-10. Methane at 5.3% Vol after 3.2 sec release, 10 m/s wind blowing left to right (from
[10]) ............................................................................................................................................................. 23 Figure 2-11. Total and flammable hydrogen mass in environment, 10 m/s wind blowing (from
[10]) ............................................................................................................................................................. 23 Figure 2-12. Test Layout and Radiometer Locations (from [17]) ............................................................. 24 Figure 2-13. Jet Flame in Test Images- Test 1 (22% hydrogen/natural gas blend) on Left, Test 2
(natural gas only) on Right (from [17]) .................................................................................................. 26

6
Figure 2-14. Incident Radiation at 20s (a), 60s (b), 100s (c)- Test 1 on Left, Test 2 on Right (from [17]) ............................................................................................................................................................. 27
Figure 2-15. Test Diagram (from [18]) ......................................................................................................... 28 Figure 2-16. Jet Flame in Test Images (not all the same scale) (from [18]) ............................................. 29 Figure 2-17. Incident heat flux- Top 20 mm, Middle 35 mm, Bottom 50 mm Release (from [18]) ... 30 Figure 2-18. Heat Loads to pipe- 50 mm: front (a), top (b), back (c), bottom (d) of pipe (from
[18]) ............................................................................................................................................................. 31 Figure 2-19. Test Setup for Flame Length Measurement (from [19]) ...................................................... 31 Figure 2-20. Flame Shape & Length over Time- 80% H2, P0=100 bar, dj=10mm (from [19]) ............ 32 Figure 2-21. Heat Flux over Time- 80% H2, P0=100 bar, dj=10mm (from [19]) ................................... 33 Figure 2-22. Flame Length vs. Froude Number (from [19]) ..................................................................... 34 Figure 2-23. Computed vs. Measured Transient Fluxes 4mm release- L: H2 R: 50:50 Mix (from
[19]) ............................................................................................................................................................. 35 Figure 2-24. Radiant Heat Flux vs Correlation (from [19]) ....................................................................... 35 Figure 2-25: Maximum Safe Transport Distance for 0.15 m (a) and 1.0 m (b) Pipe Diameters [21] .. 36 Figure 2-26: Hydrogen Concentration Effect on Compressor Performance [21] ................................. 37 Figure 2-27. Event Tree to damage a pipeline transporting natural gas and H2 (from [21]) ............... 37 Figure 2-28. Hazard zone for Methane Jet Fire (from [21]) ...................................................................... 38 Figure 2-29. Hazard zone for Methane/Hydrogen Jet Fire (from [21]) .................................................. 38 Figure 2-30. Hazard zone for Methane Explosion (from [21]) ................................................................. 39 Figure 2-31. Hazard zone for Methane/Hydrogen Explosion (from [21]) ............................................. 39 Figure 2-32. Risk of Pipeline Failure (from [21]) ........................................................................................ 40 Figure 2-33. Flame Shapes for Case 1 through 3 (from [22]) .................................................................... 42 Figure 2-34. Flame Length for Case 1 through 3 (from [22]) ................................................................... 43 Figure 2-35. Radiant Fraction for Case 1 through 3 (from [22]) .............................................................. 44
LIST OF TABLES Table 1-1. Typical Natural Gas Pipeline Types and Usage ........................................................................ 10 Table 1-2. Natural Gas Composition (from [2]) ......................................................................................... 12 Table 1-3. Hydrogen and Natural Gas Properties at Ambient Conditions ............................................. 13 Table 2-1. Experimental Pipe Sections (from [15]) .................................................................................... 17 Table 2-2. Leakage Ratio Data (from [15])................................................................................................... 19 Table 2-3. Experimental Conditions (from [16]) ......................................................................................... 20 Table 2-4. Experimental Results (from [16]) ............................................................................................... 20 Table 2-5. Test Characteristics (from [17]) .................................................................................................. 25 Table 2-6. Test Characteristics and Results (from [18]) ............................................................................. 28 Table 2-7. Additional Hazard Zones (from [21]) ........................................................................................ 39 Table 2-8. Operating Conditions of each Case (from [22]) ....................................................................... 41 Table 2-9. Flame Length Comparison (from [22]) ...................................................................................... 43 Table 2-10. Radiant Fraction Comparison (from [22])............................................................................... 44

7
ACRONYMS AND DEFINITIONS
Abbreviation Definition CFD computational fluid dynamics
DOE Department of Energy
EERE Office of Energy Efficiency and Renewable Energy
HFTO Hydrogen and Fuel Cell Technologies Office
HyRAM Hydrogen Risk Assessment Models
NFCRC National Fuel Cell Research Center
NPT national pipe thread

8
This page left blank
9
1. INTRODUCTION The intent of this report is to investigate the safety implications and characteristics of blending hydrogen into the natural gas infrastructure that have been investigated in existing published literature. The benefit of blending hydrogen into either existing or future pipeline systems is a reduction in greenhouse gases, especially if the hydrogen is produced by low-carbon sources such as wind, solar, or nuclear power. Additionally, blending will reduce dependency on fossil fuels [1].
The physical properties of hydrogen differ from that of natural gas. The composition of natural gas varies by both region and season. It is primarily composed of methane, with smaller amounts of ethane, propane, and butane as well as other higher order hydrocarbons and gases [2]. These hydrocarbons have a much higher molecular mass and heating value (on a volumetric basis) than that of hydrogen. Because of these (and other) differences, the behavior of the blended gas after a leak from a pipeline will vary as a function of the blend ratio. Characteristics such as heat flux from an ignited plume or dispersion rate from an unignited plume are of interest for safety risk assessments for hydrogen/natural gas blends.
This report documents the relevant research in dispersion and jet fire characteristics of hydrogen/natural gas blends. The goal of this literature review is to identify existing data in the literature that will better inform future hazard and risk assessments for hydrogen/natural gas blends. Of particular interest is literature data that could be used to validate computational fluid dynamics and engineering models such as those in the Hydrogen Risk Assessment Models (HyRAM) software toolkit [3].
1.1. Natural Gas Infrastructure Overview The natural gas infrastructure is used to transport gas from areas of production to areas of demand quickly, through a variety of pipelines and gas service lines. Figure 1-1 shows a general pipeline infrastructure diagram for natural gas. Gathering pipelines are used to transport raw natural gas from production wells, offshore drilling, and tankers. These gathering lines feed to a gas processing plant, where the raw natural gas is cleaned and treated, then fed to transmission lines and various compressor stations. At this point in the system, hydrogen may be injected into the natural gas transmission infrastructure, or alternatively, hydrogen can be injected at the city gate prior to being fed to the end user through distribution and residential lines.

10
Figure 1-1. Natural Gas Pipeline Infrastructure Diagram with Potential Hydrogen Injection Locations (adapted from [4])
Each type of pipeline in the natural gas infrastructure varies in size and pressure, which may lead to different properties of a leak. Table 1-1 below describes each of the types of pipelines:
Table 1-1. Typical Natural Gas Pipeline Types and Usage
Pipeline Type Pipeline
Diameter Pressure End Use
Mainline Transmission Lines [5] 6” to 48” 500 to 1400 psi Principle pipeline in a system that feeds to other pipelines and distribution lines
Interstate Pipeline [5] 24” to 36” 200 to 1500 psi Transport natural gas across the country to high demand locations, usually to densely populated urban areas
Distribution [6] 2” to 24” 10 to 200 psi
Comes after the gate station, the gas company can monitor and control pressures as this system is an interconnected grid which leads to improved safety
Residential Service Lines [6] 2” to 24” 10 to 200 psi Feeds both residential and commercial systems up to the gas meter system from the distribution system

11
The temperature of the gas in the pipeline may also affect the overall leak behavior. Mohsen and Mansoori [7] have evaluated the temperature profile of buried pipeline systems during different seasons. Figure 1-2 shows the temperature profile of a buried pipeline during the summer months with a nominal ground temperature of 80 ºF. As shown, the temperature of the pipeline approaches the ground temperature over longer distances.
Figure 1-2. Pipeline Temperature vs. Distance- Summer Time (from [7])
Figure 1-3 shows the temperature profile of a buried pipeline during the winter months with a nominal ground temperature of 60 ºF. Similar to the summer months temperature, over long distances the pipeline temperature approaches the ground temperature in winter as well.
Figure 1-3. Pipeline Temperature vs. Distance- Winter Time (from [7])

12
1.2. Comparing Natural Gas and Hydrogen Natural gas is mainly composed of methane, with lower concentrations of other hydrocarbons such as ethane, propane, butane, and lesser amount of non-hydrocarbon gases. Table 1-2 below gives the typical composition of natural gas.
Table 1-2. Natural Gas Composition (from [2])
Gas Chemical Formula Composition (% Vol.)
Hydrocarbons
Methane CH4 60-90%
Ethane C2H6 0-20%
Propane C3H8 0-20%
Butane C4H10 0-20%
Non-Hydrocarbons
Carbon Dioxide CO2 0-8%
Oxygen O2 0-0.2%
Nitrogen N2 0-5%
Hydrogen Sulfide H2S 0-5%
Rare Gases Ar, He, H2 0-2%

13
The composition of natural gas can vary widely as shown in Table 1-2. Therefore, the safety and operational metrics of hydrogen enriched natural gas will be dependent not only on the blend ratio but also the initial composition of natural gas. Table 1-3 compares some important characteristics of methane and hydrogen.
Table 1-3. Hydrogen and Natural Gas Properties at Ambient Conditions
Property Hydrogen Methane
Molecular Weight (g/mol) [8] 2.016 16.043
Buoyancy (ratio to air) 0.07 0.54
Density (kg/m3) [9] [10] 0.0899
~14 times lighter than air 0.668
~1.8 times lighter than air
Dynamic Viscosity @ 20°C (10-5 Pa-s) [11] 0.88 1.10
Flammability Limits (vol. %) [10] 4-74 5.3-15
Stoichiometric Concentration in Air (vol. %) [10] 29 9
Maximum laminar burning velocity (m/s) [10] 3.25 0.44
Relative radiative heat transfer (%) [10] 5-10 10-33
Diffusion Coefficient @ 20°C (cm2/s) [12] 0.756 0.21
Gross Heating Value (kJ/m3) [13] 12,109 37,669
Natural gas properties will generally be similar to that of pure methane; however, these properties will vary based on the specific composition. As higher order hydrocarbons increase in concentration, the molecular weight, density, and combustion properties of the natural gas are affected and become less similar to pure methane.

14
This page left blank
15
2. LITERATURE REVIEW The following section gives an overview of what modeling and experimental work has been completed for hydrogen and natural gas/methane blends. Specifically, dispersion and jet fire cases have been identified and are summarized in the following subsections. Section 2.1 reviews the various dispersion experiments completed to understand the characteristics of how hydrogen and natural gas blends behave when released in a leak event. Section 2.2 also focuses on dispersion, but through computational fluid dynamics (CFD) and other modeling and computational studies. Section 2.3 reviews jet fire experiments with hydrogen and natural gas to provide information on immediate ignition hazards. Section 2.4 also focuses on jet fires using blends, reviewing CFD and computational tools to model different scenarios.
2.1. Dispersion Experiments
2.1.1. Hydrogen & Methane Dispersion/Stratification Studies
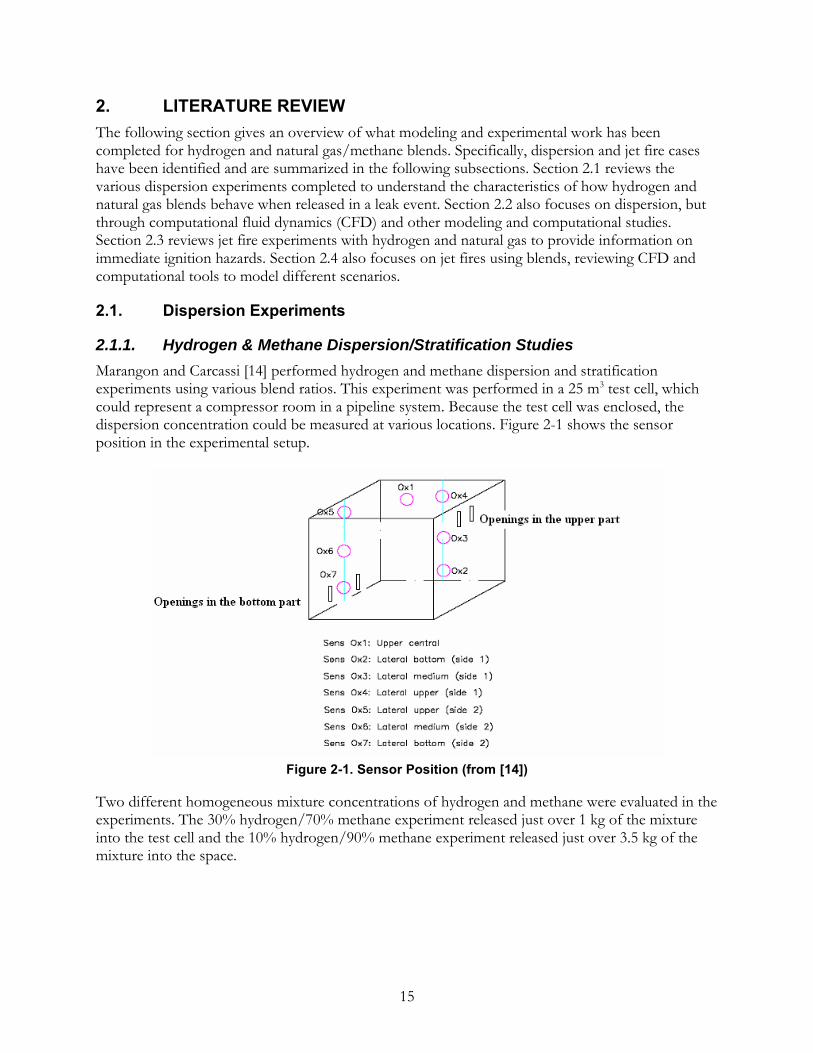
Marangon and Carcassi [14] performed hydrogen and methane dispersion and stratification experiments using various blend ratios. This experiment was performed in a 25 m3 test cell, which could represent a compressor room in a pipeline system. Because the test cell was enclosed, the dispersion concentration could be measured at various locations. Figure 2-1 shows the sensor position in the experimental setup.
Figure 2-1. Sensor Position (from [14])
Two different homogeneous mixture concentrations of hydrogen and methane were evaluated in the experiments. The 30% hydrogen/70% methane experiment released just over 1 kg of the mixture into the test cell and the 10% hydrogen/90% methane experiment released just over 3.5 kg of the mixture into the space.
16
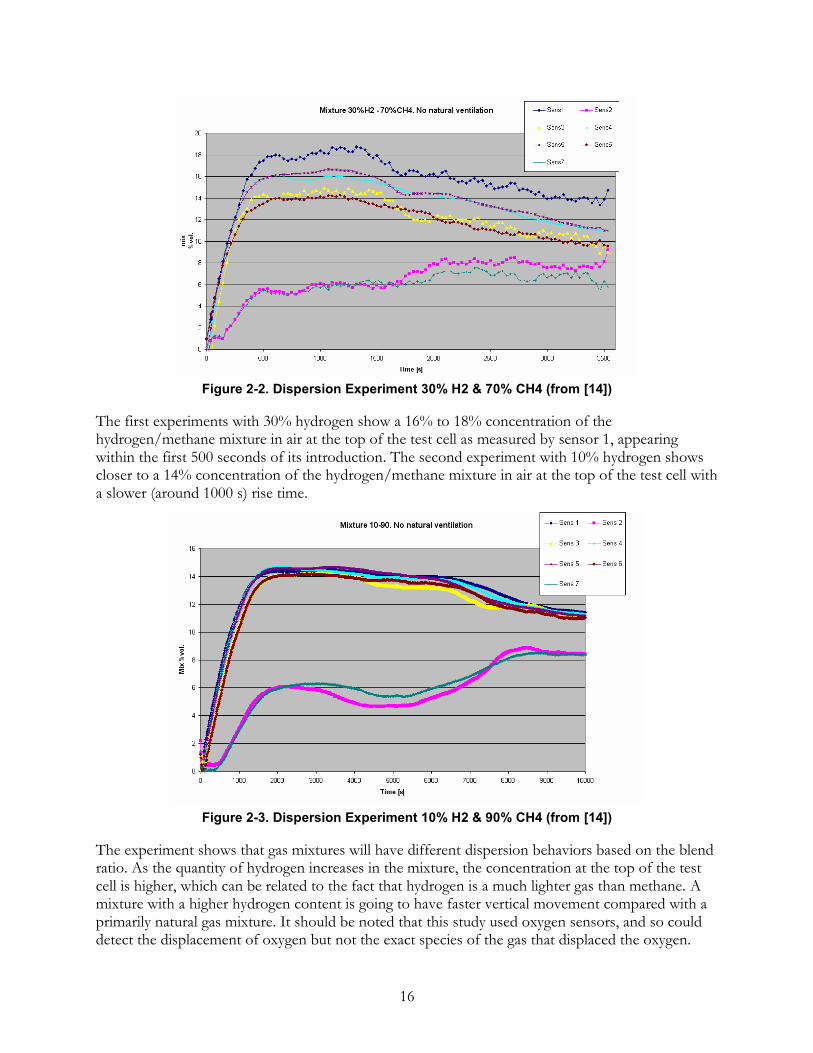
Figure 2-2. Dispersion Experiment 30% H2 & 70% CH4 (from [14])
The first experiments with 30% hydrogen show a 16% to 18% concentration of the hydrogen/methane mixture in air at the top of the test cell as measured by sensor 1, appearing within the first 500 seconds of its introduction. The second experiment with 10% hydrogen shows closer to a 14% concentration of the hydrogen/methane mixture in air at the top of the test cell with a slower (around 1000 s) rise time.
Figure 2-3. Dispersion Experiment 10% H2 & 90% CH4 (from [14])
The experiment shows that gas mixtures will have different dispersion behaviors based on the blend ratio. As the quantity of hydrogen increases in the mixture, the concentration at the top of the test cell is higher, which can be related to the fact that hydrogen is a much lighter gas than methane. A mixture with a higher hydrogen content is going to have faster vertical movement compared with a primarily natural gas mixture. It should be noted that this study used oxygen sensors, and so could detect the displacement of oxygen but not the exact species of the gas that displaced the oxygen.

17
Therefore, this data does not indicate if the hydrogen/methane blend itself exhibited different behavior based on the composition, or if the hydrogen preferentially rose more quickly to the top of the enclosure, resulting in separation of the blend mixture.
2.1.2. Hydrogen & Natural Gas Leak in Low Pressure Gas Infrastructure
Hormaza et al. [15] investigated the different behaviors of hydrogen and methane during a leak event. In low pressure systems, the authors note that most leaks will occur at fittings, through threads, and at mechanical joints. Initially, a review of classical methods used to calculate flow through an orifice (Q) was conducted. For lower Reynolds numbers, Hagen-Poiseuille equation for laminar flow is used:
𝑄 =∆𝑃𝜋𝐷4
128𝐿𝜇
∆𝑃 is the pressure drop across the leak, D is the diameter, L is the leak length, and 𝜇 is the dynamic viscosity. Since hydrogen has a viscosity that is 1.29x lower than that of methane, hydrogen should leak 1.29x faster (for a given pressure laminar flow). This will affect the dispersion behavior of a hydrogen and methane mixture. For higher Reynolds numbers, the authors propose the Darcy Weisbach equation:
𝑄 =0.354√∆𝑃𝜋𝐷2.5
√𝑓𝐿𝜌
Where 𝑓 is the friction factor and 𝜌 is the density. This equation shows that for a given leak with the same pressure drop and surface roughness, the volumetric flow rate is proportional to the inverse square root of the density. For hydrogen vs methane, the density ratio is 7.4. Therefore, hydrogen should leak at about 2.8x the speed of methane for higher Reynolds numbers. If there is diffusive mass transport, then Fick’s law of diffusion is the governing equation for transport:
𝑄 = 𝐴(−𝐷𝜕𝐶𝜕𝑥)
Where Q is the molar flowrate, A is the cross-sectional area, D is the gas diffusion constant, and 𝜕𝐶
𝜕𝑥
is the concentration gradient. For purely diffusive flows, hydrogen will leak 3.15x faster than methane due to the difference in the diffusion coefficients. Experiments were conducted at the National Fuel Cell Research Center (NFCRC) to understand leakage from an isolated section of the natural gas infrastructure and to understand the entrance effect of gaseous fuel leakage. Another experiment by the same research team at the Southern California Gas Company facilities was conducted to simulate leaks and understand how to mitigate them [15].
Table 2-1. Experimental Pipe Sections (from [15])
Piping Section Volume (m3) Pipe Length (m) Pipe Diameter # of Joints
A 0.0261 14.0 1 ½ NPT 24
18
Piping Section Volume (m3) Pipe Length (m) Pipe Diameter # of Joints
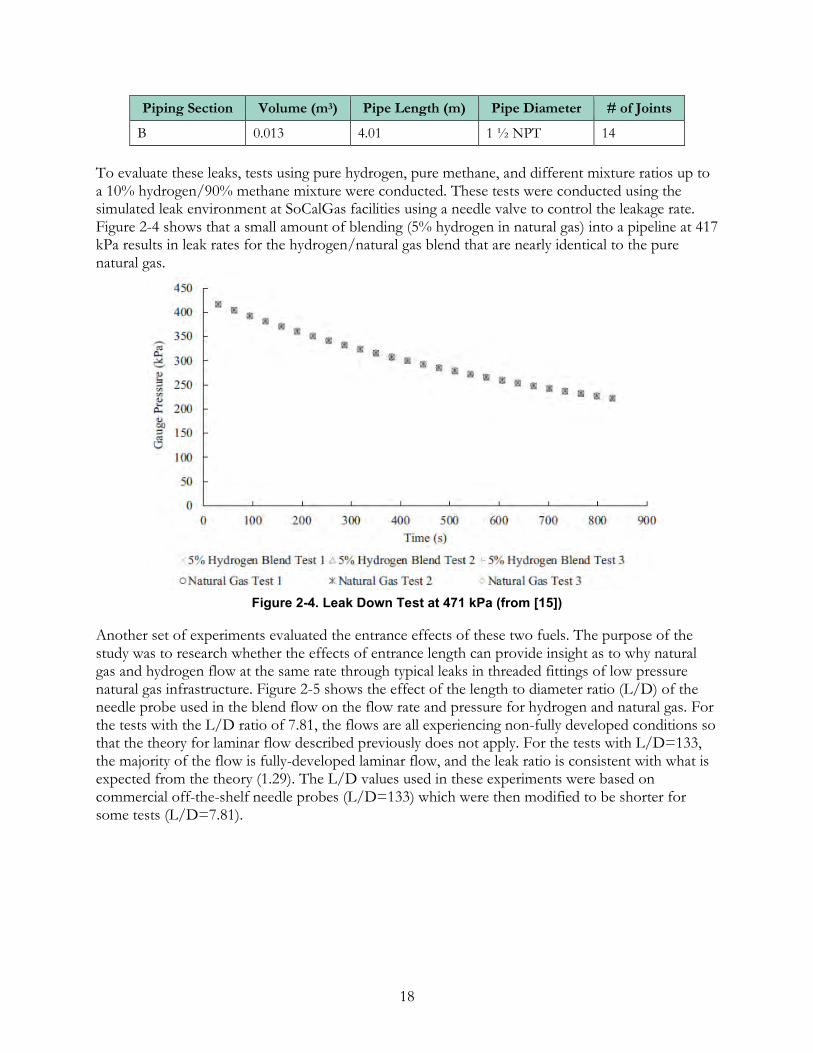
B 0.013 4.01 1 ½ NPT 14
To evaluate these leaks, tests using pure hydrogen, pure methane, and different mixture ratios up to a 10% hydrogen/90% methane mixture were conducted. These tests were conducted using the simulated leak environment at SoCalGas facilities using a needle valve to control the leakage rate. Figure 2-4 shows that a small amount of blending (5% hydrogen in natural gas) into a pipeline at 417 kPa results in leak rates for the hydrogen/natural gas blend that are nearly identical to the pure natural gas.
Figure 2-4. Leak Down Test at 471 kPa (from [15])
Another set of experiments evaluated the entrance effects of these two fuels. The purpose of the study was to research whether the effects of entrance length can provide insight as to why natural gas and hydrogen flow at the same rate through typical leaks in threaded fittings of low pressure natural gas infrastructure. Figure 2-5 shows the effect of the length to diameter ratio (L/D) of the needle probe used in the blend flow on the flow rate and pressure for hydrogen and natural gas. For the tests with the L/D ratio of 7.81, the flows are all experiencing non-fully developed conditions so that the theory for laminar flow described previously does not apply. For the tests with L/D=133, the majority of the flow is fully-developed laminar flow, and the leak ratio is consistent with what is expected from the theory (1.29). The L/D values used in these experiments were based on commercial off-the-shelf needle probes (L/D=133) which were then modified to be shorter for some tests (L/D=7.81).

19
Figure 2-5. Pressure vs. Flow Rate though Valve w/ L/D of 7.81 (left) and 133 (right) (from [15])
Table 2-2 shows that for flows that are not fully developed, there is a much higher amount of hydrogen leaking than in those that are fully developed. The laminar flow leak rate with an L/D of 1.33 has a slightly higher leakage ratio than the predicted 1.29 computed with the Hagen-Poiseuille equation. This shows entrance length effects might have an impact on the overall blending and leakage. With an L/D of 7.812, the leakage ratio ranges from 1.94 to 2.30. This shows that entrance effects due to bends and transitions does affect how these two fuels leak. This work can conclude that without well-mixed blends, transitions and other effects can affect the leak and dispersion behavior for natural gas and hydrogen blends.
Table 2-2. Leakage Ratio Data (from [15])
2.1.3. Gas build-up in a domestic property following releases of methane/hydrogen mixtures
Lowesmith and Hankinson [16] set up a test cell to investigate dispersion of hydrogen and methane mixtures, using blend ratios of 10%/90%, 20%/80%, and 50%/50% hydrogen to methane. This work was funded through the NATURALHY project. Leaks were through a 5 mm diameter hole at 0.2 Pa or 10 mm diameter at 0.3 Pa. The test cell was 3 m by 3 m and 2.3 m high.

20
Figure 2-6 shows the overall test cell layout as well as the location of the oxygen sensors and gas release point. Table 2-3 gives a summary of the overall test conditions.
Figure 2-6. Experimental Test Cell Layout (from [16])
Table 2-3. Experimental Conditions (from [16])
Table 2-4 gives the test results for all eight experiments. The results show that as the volume of hydrogen in a blended mixture increases, the volume flow rate of gas into the test container increases. Additionally, the concentration of gas measured increases with hydrogen volume increasing in the gas mixture.
Table 2-4. Experimental Results (from [16])
This work concludes that the leak rate is higher for equivalent leak conditions in which there is a higher hydrogen content in the pipe system. This is similar to the work in Section 2.1.2, which also concluded the hydrogen leak rate is higher than that of methane/natural gas.

21
2.2. Dispersion Modeling
2.2.1. CFD Modeling of Hydrogen and Methane Release from Pipelines
Wilkening and Baraldi [10] used CFD modeling to investigate the various properties of hydrogen and methane with regard to dispersion. Additionally, external factors such as geometry and wind were investigated. The authors note that the pressure differential between pipelines and the outside environment at atmospheric pressure create critical (choked) releases.
CFD-ACE is a commercial CFD code used by Wilkening and Baraldi to numerically solve the governing mass, momentum, energy, and species mass fraction equations on an arbitrary grid using implicit finite volume method. Species densities are calculated using the ideal gas law and viscosity, while molecular diffusivity and thermal conductivity are calculated using the gas kinetic theory.
The same scenario was evaluated for both hydrogen and methane. The simulated pipeline release is at a pressure of 11 bar, resulting in a release rate of 115 kg/m2 for hydrogen and 342 kg/m2 for methane. The m2 units are used due to this being a 2D simulation. The release orifice is 20 cm in diameter for all cases.
Figure 2-7 shows the hydrogen plume release after 4 seconds from the initial leak. Figure 2-8 shows the methane plume release after 30 seconds from the initial leak. These two cases show how much the two fuels differ during a release. Hydrogen has more vertical dispersion where methane stays closer to the leak source and begins to accumulate.
Figure 2-7. Hydrogen Concentration at 4 sec w/ no wind (from [10])

22
Figure 2-8. Methane Concentration at 30 sec w/ no wind (from [10])
Additionally, Figure 2-9 and Figure 2-10 show 3D simulations of a hydrogen and methane release. The hydrogen release rate is 42 kg/sec and the methane release rate 120 kg/sec. In Figure 2-9, the outer part of the narrow jet can be observed in the lower part of the plume. In the upper part, the transition from jet dominated transport to wind and buoyancy dominated convective transport is illustrated. In Figure 2-10, the outer part of the narrow jet can be observed in the lower part of the plume. The size of the flammable cloud is much smaller than the hydrogen case. The upper part of the plume is still dominated by the jet and not by buoyancy or wind.
Figure 2-9. Hydrogen at 4% Vol after 4 sec release, 10 m/s wind blowing left to right (from [10])

23
Figure 2-10. Methane at 5.3% Vol after 3.2 sec release, 10 m/s wind blowing left to right (from [10])
Figure 2-11 is a plot of the integrated hydrogen and methane energy within the environment modeled. The mass is scaled with the lower heating value for a better comparison. Although the mass flow rate is lower for hydrogen at a given pressure, the hydrogen is released from the pipeline at a higher velocity than the methane (1280 m/s vs. 400 m/s) due to the difference in density of the two fuels.
Figure 2-11. Total and flammable hydrogen mass in environment, 10 m/s wind blowing (from [10])
This work shows that 2D and 3D models can provide valuable insight into the difference in dispersion of these two distinct fuels. There are many different properties such as the density and buoyancy that affect the dispersion behavior. The difference in fuel properties causes hydrogen to have a much higher sonic speed and less ground-level accumulation when compared to methane. The authors note that accumulation at ground level is more likely to be ignited than accumulation or a cloud higher up, due to a generally higher likelihood of ignition sources being present closer to the ground. Additionally, obstacles (more likely to be on the ground level) can increase flame acceleration during an overpressure or explosion event. This data can help provide information for a risk analysis, but it should be noted that this study only considered separate releases of two pure fuels, not a release of a hydrogen/methane blend.

24
2.3. Jet Fire Experiments
2.3.1. Large Scale Experiment to Study High Pressure Pipeline Rupture
Lowesmith and Hankinson [17] performed experiments through the NATURALHY project on transmission pipelines to understand the safety implications of ruptures from a high-pressure hydrogen/natural gas blend. Experiments were conducted at GL Noble Denton Spadeadam Test Site in Cumbria, UK. The blend ratios used were a 22%/78% hydrogen/natural gas mixture for Test 1 and natural gas only for Test 2. For both tests, the leak was released at 70 bar through a 150 mm breach. The composition of natural gas in the experiments nominally consisted of 93% methane, 5% ethane, 0.3% propane, and 1.7% nitrogen. The artificial crater around the pipeline was 3.3 m long, 1.7 m wide, and up to 0.5 m deep, which represented a 1/6th scale crater in size that would be formed during an underground pipeline failure.
Radiometers and cameras were placed around the test site in order to measure the heat flux and record the event as shown in Figure 2-12. Explosive charges and incendiary devices were used to create a clean rupture with nearly instantaneous ignition. The mass flow rate for Test 1 was about 150 kg/s whereas the mass flow rate for Test 2 was about 178 kg/s, which leads to a slight increase in energy in Test 2.
Figure 2-12. Test Layout and Radiometer Locations (from [17])
Table 2-5 gives the testing charaterisitics including the wind speeds during the tests.
25
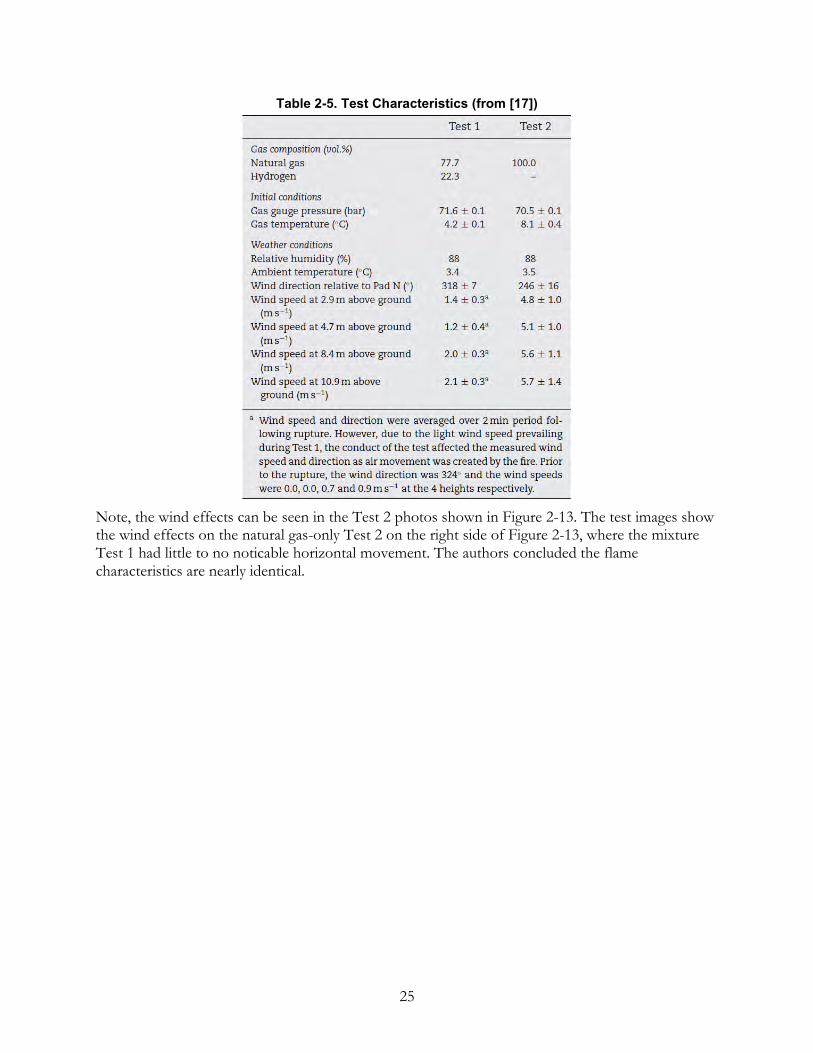
Table 2-5. Test Characteristics (from [17])
Note, the wind effects can be seen in the Test 2 photos shown in Figure 2-13. The test images show the wind effects on the natural gas-only Test 2 on the right side of Figure 2-13, where the mixture Test 1 had little to no noticable horizontal movement. The authors concluded the flame characteristics are nearly identical.
26
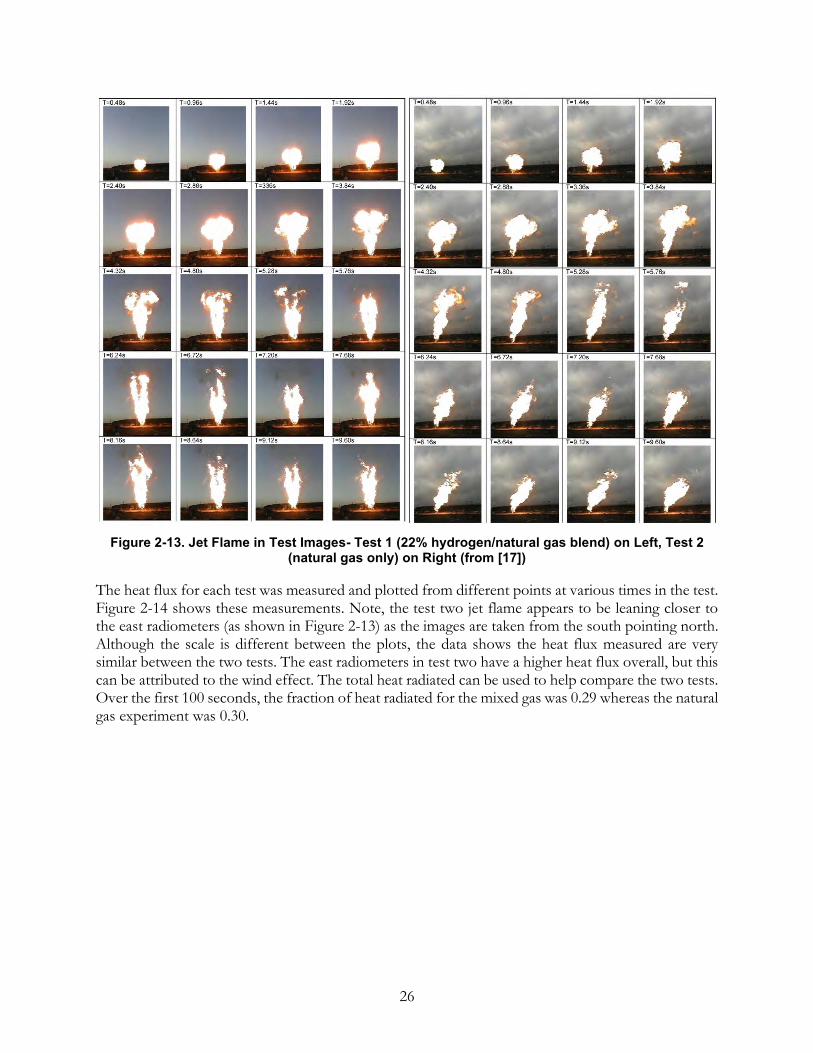
Figure 2-13. Jet Flame in Test Images- Test 1 (22% hydrogen/natural gas blend) on Left, Test 2 (natural gas only) on Right (from [17])
The heat flux for each test was measured and plotted from different points at various times in the test. Figure 2-14 shows these measurements. Note, the test two jet flame appears to be leaning closer to the east radiometers (as shown in Figure 2-13) as the images are taken from the south pointing north. Although the scale is different between the plots, the data shows the heat flux measured are very similar between the two tests. The east radiometers in test two have a higher heat flux overall, but this can be attributed to the wind effect. The total heat radiated can be used to help compare the two tests. Over the first 100 seconds, the fraction of heat radiated for the mixed gas was 0.29 whereas the natural gas experiment was 0.30.

27
Figure 2-14. Incident Radiation at 20s (a), 60s (b), 100s (c)- Test 1 on Left, Test 2 on Right (from [17])
These experiments show that the 23%/77% hydrogen/natural gas mixture has a very similar overall heat flux as the 100% natural gas jet fire.
2.3.2. Large-Scale High-Pressure Jet Fire involving Natural Gas/Hydrogen
Lowesmith and Hankinson [18] conducted six large scale, high pressure jet fire tests with both natural gas and natural gas/hydrogen mixtures. In this test series, high pressure gas was released in a horizontal configuration as shown in Figure 2-15. Flames were monitored by cameras and radiometers.

28
Figure 2-15. Test Diagram (from [18])
Table 2-6 shows the characteristics for each of the tests. The blend composition remained constant for each of the tests, 24%/76% hydrogen/natural gas, with 3 different release sizes tested. The natural gas composition in this test series is 93% methane, 5% ethane, 0.3% propane, and 1.7% nitrogen nominally. The test results are also shown in Table 2-6. The total power and flame extent are shown to be less for the blend than the natural gas jet flame in all tests. Additionally, the flame lift-off is farther out for the natural gas jet flame than the mixture jet flame.
Table 2-6. Test Characteristics and Results (from [18])
The jet flames for each test have similar characteristics, but as the author noted the images are not all scaled the same. However, when comparing the same release diameters, each test has similar curvatures and vertical behaviors, particularly Tests 3 and 6.

29
Figure 2-16. Jet Flame in Test Images (not all the same scale) (from [18])
Figure 2-17 shows the heat flux for each test. The natural gas only tests generally have a higher heat flux than when compared to the mixture jet flame, but in most cases the difference is fairly minor (1 to 3 kW/m2). This shows that there is not a considerable difference for a 24%/76% hydrogen/natural gas jet flame when compared to a 100% natural gas flame.
30
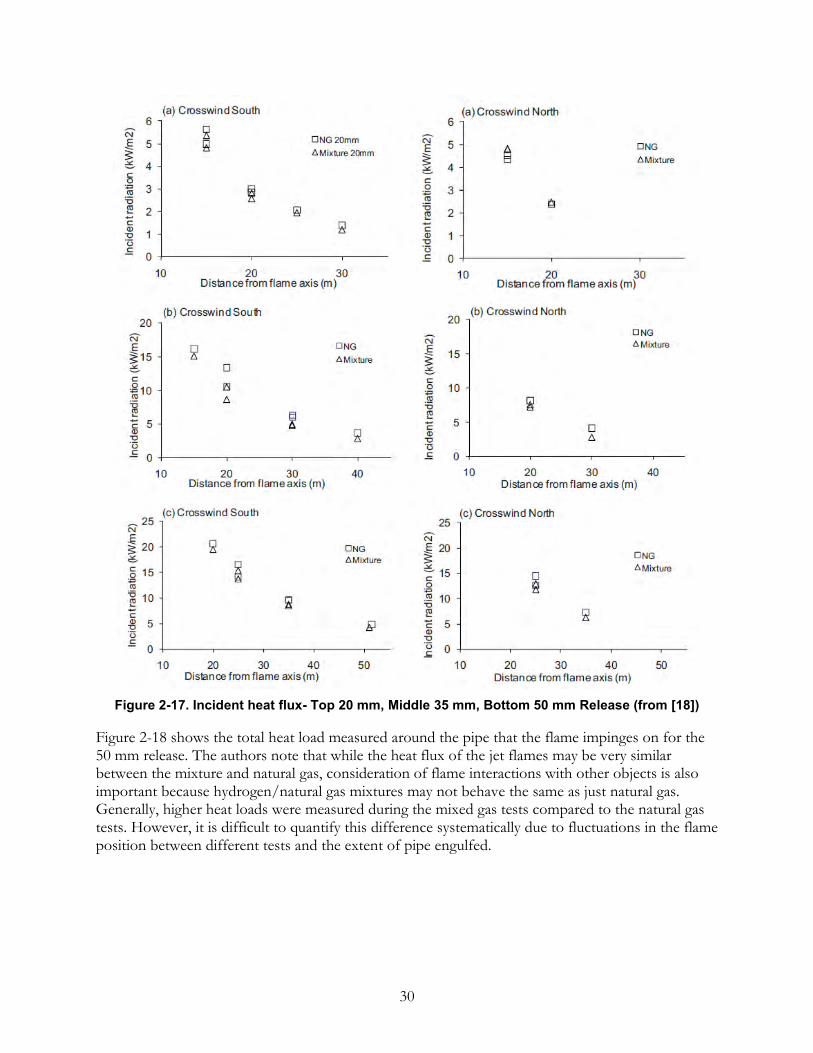
Figure 2-17. Incident heat flux- Top 20 mm, Middle 35 mm, Bottom 50 mm Release (from [18])
Figure 2-18 shows the total heat load measured around the pipe that the flame impinges on for the 50 mm release. The authors note that while the heat flux of the jet flames may be very similar between the mixture and natural gas, consideration of flame interactions with other objects is also important because hydrogen/natural gas mixtures may not behave the same as just natural gas. Generally, higher heat loads were measured during the mixed gas tests compared to the natural gas tests. However, it is difficult to quantify this difference systematically due to fluctuations in the flame position between different tests and the extent of pipe engulfed.

31
Figure 2-18. Heat Loads to pipe- 50 mm: front (a), top (b), back (c), bottom (d) of pipe (from [18])
2.3.3. Properties of Large-Scale Methane/Hydrogen Fires
Studer et al. [19] performed experiments to evaluate the consequence of accidental releases of hydrogen and methane blended fuel. These experiments were conducted in an 80 m long gallery with a 12 m2 cross section. Excess air flow into the gallery was established to avoid under-ventilated conditions during the tests. Figure 2-19 shows the test setup, including the cylinder and valve configuration as well as the instrumentation and flame measurement.
Figure 2-19. Test Setup for Flame Length Measurement (from [19])
Homogenous mixing was achieved through the partial pressure method. The gas cylinder with the target fuel has an internal volume of 25 liters and maximum pressure of 100 bar, with orifice sizes of

32
4, 7, and 10 mm for the release point. The tank was set up in a horizontal configuration with a remotely operated electropneumatic valve located upstream of the nozzle to control blowdown, followed by an electric ignitor. The jet flame release orifice was approximately 1.5 m off the ground.
The flame length was calculated based on an average of five frames captured by the camera. The flame length decreases over time due to the blowdown affecting the overall pressure as shown in Figure 2-20.
Figure 2-20. Flame Shape & Length over Time- 80% H2, P0=100 bar, dj=10mm (from [19])
The heat flux plotted over time is shown in Figure 2-21. As shown, similar to the flame length, the heat flux is reduced over time as the pressure drops during blowdown. Both the flame length and the heat flux are shown for the 80% hydrogen/20% methane mixture; however, none of the other tests are shown in these plots.

33
Figure 2-21. Heat Flux over Time- 80% H2, P0=100 bar, dj=10mm (from [19])
Figure 2-22 shows that as the hydrogen content increased in a mixture with methane, the Froude number and flame length also increase. The Froude number is the ratio of the inertial force on an element fluid to the weight of the element fluid. It can be defined by the following:
𝐹𝑟 =𝑣
(𝑔ℎ𝑚)1/2
Where 𝑣 is the velocity in m/s, 𝑔 is acceleration of gravity at 9.81 m/s2, and ℎ𝑚 is the characteristic length in m [20]. Hydrogen is lighter than methane, meaning that higher hydrogen concentrations are more likely to result in a more momentum-driven than buoyancy-driven flame due to the faster release velocity. This increased velocity and turbulence could also lead to more of the data point spread, as seen in Figure 2-22.
34
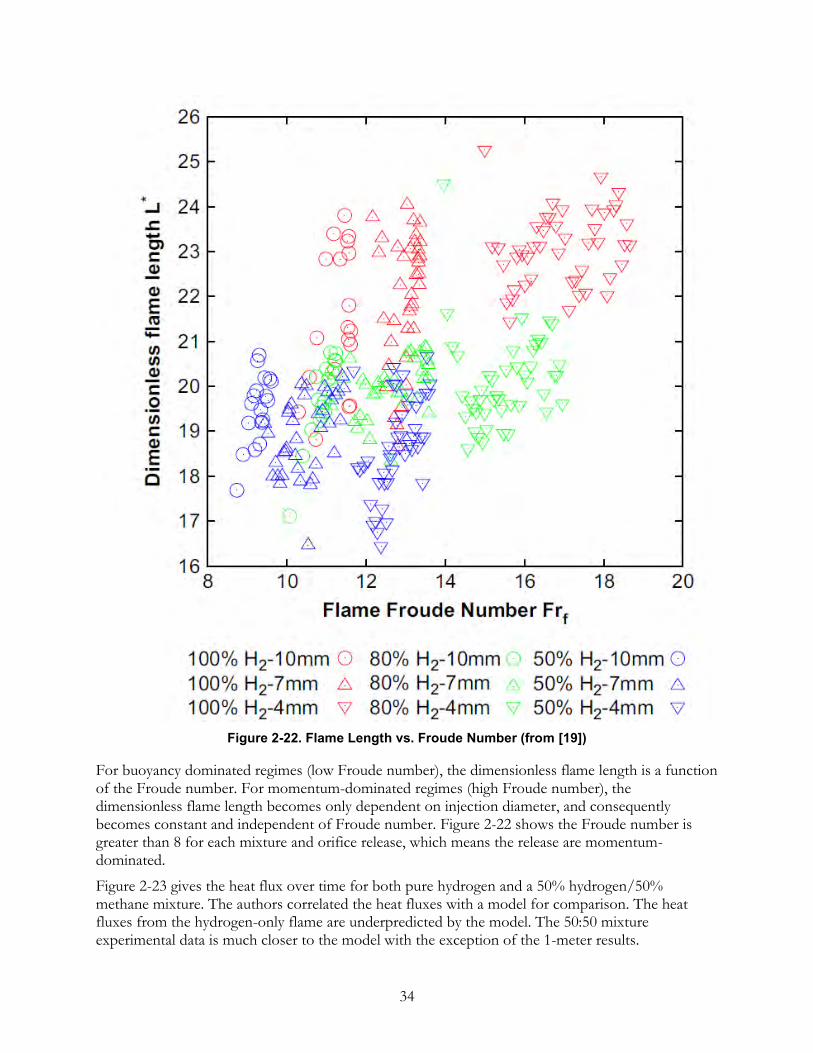
Figure 2-22. Flame Length vs. Froude Number (from [19])
For buoyancy dominated regimes (low Froude number), the dimensionless flame length is a function of the Froude number. For momentum-dominated regimes (high Froude number), the dimensionless flame length becomes only dependent on injection diameter, and consequently becomes constant and independent of Froude number. Figure 2-22 shows the Froude number is greater than 8 for each mixture and orifice release, which means the release are momentum-dominated.
Figure 2-23 gives the heat flux over time for both pure hydrogen and a 50% hydrogen/50% methane mixture. The authors correlated the heat fluxes with a model for comparison. The heat fluxes from the hydrogen-only flame are underpredicted by the model. The 50:50 mixture experimental data is much closer to the model with the exception of the 1-meter results.

35
Figure 2-23. Computed vs. Measured Transient Fluxes 4mm release- L: H2 R: 50:50 Mix (from [19])
The radiant fraction is compared with the term 𝜏𝑓𝑎𝑝𝑇𝐹4. This shows a very close scaling with the
experimental results as shown in Figure 2-24.
Figure 2-24. Radiant Heat Flux vs Correlation (from [19])
This work shows that the heat flux and radiant fraction for a mixture is higher than when compared to pure hydrogen. Additionally, the Froude number for hydrogen is higher than that of a mixture.
The radiant fraction for either mixtures or pure hydrogen scales very closely with 𝜏𝑓𝑎𝑝𝑇𝐹4 which is

36
useful for comparison between various mixtures. Note that 𝜏𝑓 is the flame residence time, 𝑎𝑝 is the
absorption coefficient, and 𝑇𝐹 is the flame temperature
2.4. Jet Fire Modeling
2.4.1. Transportation of Methane/Hydrogen Pipelines in Existing Infrastructure
Witkowski et al. [21] analyzed the process of compression and transport of natural gas/hydrogen mixtures through existing natural gas pipelines. A case study was evaluated to investigate the maximum safe transport distance without experiencing choked flow. Several variables were explored in the case study, including different inner diameters, maximum pressures, transportation distances, and hydrogen volume fractions. Figure 2-25 shows the maximum safe transport distance for pipelines with diameters of 0.15 m (a) and 1.0 m (b) at a hydrogen volume concentration of 10%. The vertical dashed line marked Lw
represents the different working transportation distance assumed for each case. The results of this choked flow analysis show that the working transportation distance is selected properly for each case with a significant safety margin.
Figure 2-25: Maximum Safe Transport Distance for 0.15 m (a) and 1.0 m (b) Pipe Diameters [21] Next, the authors evaluated different compression technology options. The concept of a centrifugal compressor train with four sections, three intercoolers, and 16-stage centrifugal compression was evaluated for different hydrogen concentrations. Figure 2-26 shows the influence of different hydrogen concentration levels on the mass flow rate and compressor power output. As shown, an increase in the hydrogen concentration level decreases the transmitted total mass flow rate and the compressor power output significantly.

37
Figure 2-26: Hydrogen Concentration Effect on Compressor Performance [21]
Additionally, the authors developed an event tree to understand the probability of consequences during a pipeline failure in Figure 2-27. This shows the probability of either a complete pipeline release or partial release due to automated valves isolating the leaking area. The consequences are either a jet fire due to immediate ignition or an explosion based on delayed ignition.
Figure 2-27. Event Tree to damage a pipeline transporting natural gas and H2 (from [21])

38
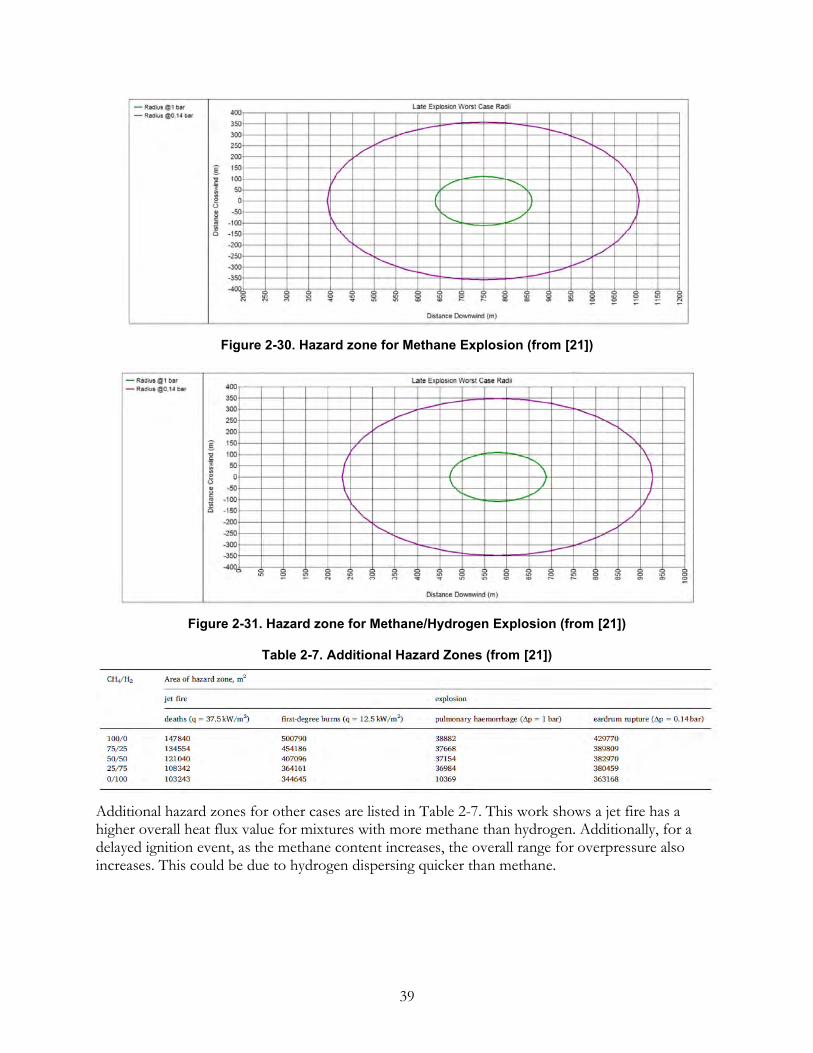
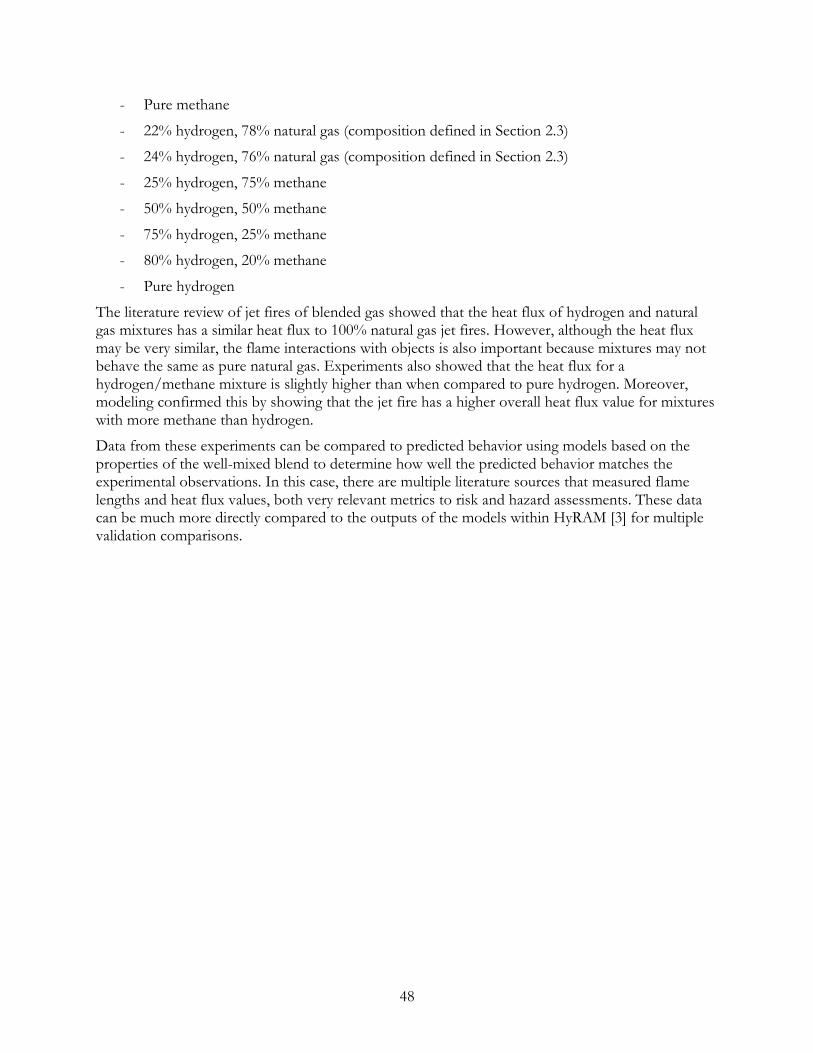
The damage radii are provided based on the wind direction and type of mixture released. PHAST v6.7 is the model used for creating the damage radii. The heat flux levels used for the ranges are 12.5 kW/m2 which corresponds to the radiation values that cause first-degree burns and 37.5 kW/m2 that cause death among humans in the immediate vicinity of the pipeline. These ranges for the jet fire hazard zone are shown in Figure 2-28 and Figure 2-29. Similarly, the levels of overpressure that are shown for the hazard zone is 1 bar which corresponds to human eardrum rupture and 0.14 bar which corresponds to pulmonary hemorrhage. These ranges for the overpressure hazard zone are shown in Figure 2-30 and Figure 2-31.
Figure 2-28. Hazard zone for Methane Jet Fire (from [21])
Figure 2-29. Hazard zone for Methane/Hydrogen Jet Fire (from [21])
39
Figure 2-30. Hazard zone for Methane Explosion (from [21])
Figure 2-31. Hazard zone for Methane/Hydrogen Explosion (from [21])
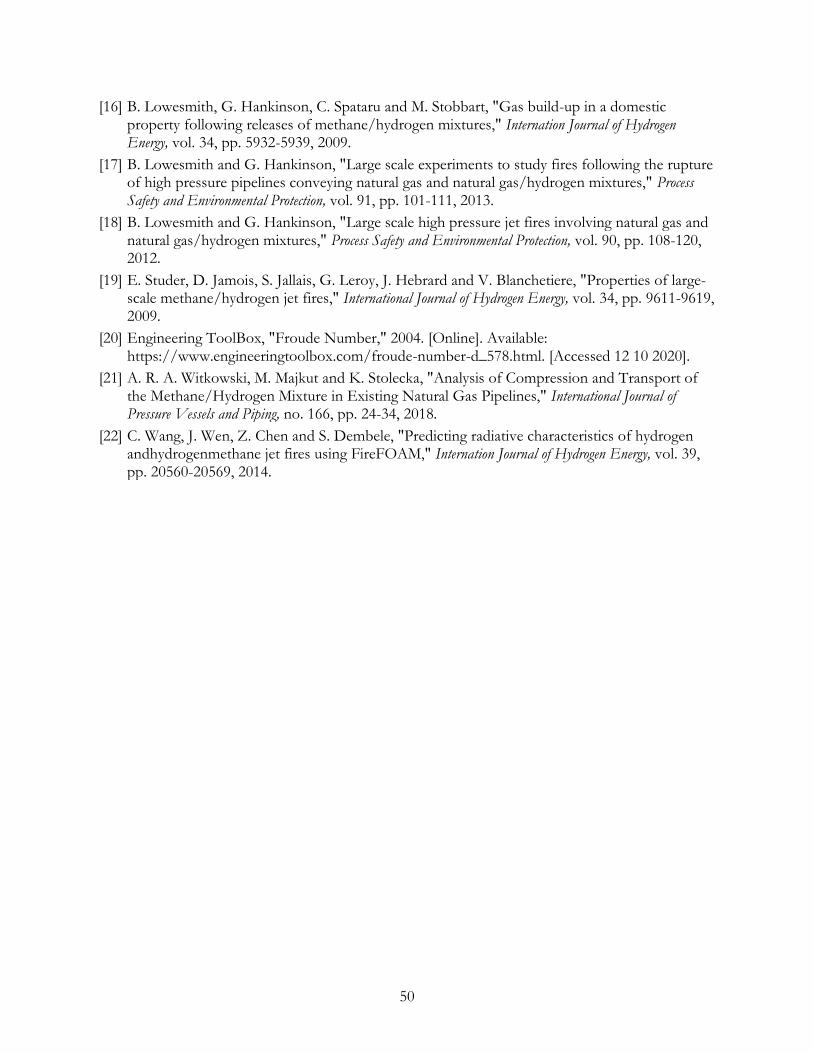
Table 2-7. Additional Hazard Zones (from [21])
Additional hazard zones for other cases are listed in Table 2-7. This work shows a jet fire has a higher overall heat flux value for mixtures with more methane than hydrogen. Additionally, for a delayed ignition event, as the methane content increases, the overall range for overpressure also increases. This could be due to hydrogen dispersing quicker than methane.

40
Figure 2-32. Risk of Pipeline Failure (from [21])
While the consequences of methane might be worse than hydrogen, the risk is a product of both the probability and the consequence. The authors note that due to a drop in steel fracture toughness from hydrogen, a rise in damage probability is expected for mixtures with higher hydrogen concentrations. This drop in fracture toughness for hydrogen blends leads to higher values of estimated risk for mixtures with higher concentrations of hydrogen, as shown in Figure 2-32. This is despite the fact hazardous distances for hydrogen/methane blends are smaller than for pure methane, and smaller still for pure hydrogen. This indicates that the effect of fracture toughness on failure probability and therefore risk needs to be better understood.
2.4.2. Predicting Radiative Characteristics of Hydrogen/Methane Jet Fires
Wang et al. [22] uses the open source CFD code FireFOAM to model and study radiation characteristics of hydrogen and hydrogen/methane jet fires. The radiant heat is computed using a finite volume discrete ordinates model along with a weighted sum of grey gas model for the absorption/emission coefficient. The flow is governed by the spatial filtering and Favre averaging of the reactive Navier-Stokes equations. The Eddy dissipation concept assumes turbulent mixing and combustion takes place on structures close to the Kolmogonov scale. The reaction rates are assumed to be based on infinitely fast chemistry for both hydrogen and hydrogen/methane reactions. To help reduce computation time, the weighted sum of the grey gas model is used to determine the

41
absorption and emission coefficients. The pseudo-diameter approach was used in which the corresponding parameters were calculated, with the thermodynamic properties corrected by the Able-Noble equation of state. The details of the mathematical modeling are provided in the literature in more detail.
Once the governing equations are set within the OpenFOAM toolbox, the different cases can be run. A total of 3 cases were evaluated with varying jet directions, nozzle diameters, tank temperatures, and hydrogen/methane concentrations, as shown in Table 2-8. Case 1 evaluated a vertical jet with a 5.08 mm nozzle diameter, 104.8 bar tank pressure, 231.4 K tank temperature, and pure hydrogen fuel. Case 2 evaluated a horizontal jet with a 10 mm nozzle diameter, 32.99 bar tank pressure, 276.01 K tank temperature, and 80/20 hydrogen/methane mixture. Case 3 evaluated a horizontal jet with a 22.9 mm nozzle diameter, 59.8 bar tank pressure, 308.7 tank temperature, and pure hydrogen fuel. An additional three parametric studies to explore the ground reflection effect on the radiative parameters were also evaluated, cases 4 through 6.
Table 2-8. Operating Conditions of each Case (from [22])
Figure 2-33 shows the measured and modeled flame lengths and shapes per Table 2-8. The experimental flame envelopes were measured by visible cameras and thermal imaging infrared cameras. Case 2 is an 80% hydrogen and 20% methane mix, whereas Case 3 is a hydrogen only jet flame. While it would be helpful to compare them, the orifice and the pressures differ for these two cases. The predicted flame shapes are represented using shaded temperature contours. As shown, the similarities between the two are evident, although they are not shown on the same scale.

42
Figure 2-33. Flame Shapes for Case 1 through 3 (from [22])
Figure 2-34 shows the visible flame length, including the predicted/simulated, theoretical, and measured. The theoretical flame length is calculated based on the overall Froude number. Each method to predict the flame length aligns very closely with the measured value as shown in Table 2-9.

43
Figure 2-34. Flame Length for Case 1 through 3 (from [22])
Table 2-9. Flame Length Comparison (from [22])
Case 2 has a 15.6% error between the measured and predicted value, which is the hydrogen/methane blend. This could be due to the characteristics of the blended mixture having a larger error in this model, which would need further investigation. Similarly, Figure 2-35 shows the radiant fraction, including the predicted/simulated, theoretical, and measured. The theoretical radiant fraction is based on the flame width, density, stoichiometric fuel to air molecular weight, and the universal gas constant. The details to determine the theoretical radiant fraction are detailed in the literature. Similar to the flame length, the radiant heat predictions align very well with the measured values.

44
Figure 2-35. Radiant Fraction for Case 1 through 3 (from [22])
Table 2-10 shows the error for case 2 is 8.1% between the predicted and experimental results. The predicted and theoretical have a larger discrepancy, showing the advantage of the FireFOAM model.
Table 2-10. Radiant Fraction Comparison (from [22])
This predictive tool is validated with both theoretical predictions and experimental data with discrepancies that are less than 16% between the simulations and experimental data. This work demonstrates that models in FireFOAM code can be used to reliably predict the hazards of jet fires from hydrogen/methane mixtures.

45
2.5. Literature Summary and Results There has been a variety of research ranging from experiments to modeling using hydrogen and natural gas blends. Each of these studies provides valuable information and insight into the hazard metrics of hydrogen and natural gas pipeline leaks. Section 2.1 provides experiments conducted to show the behavior of hydrogen and natural gas dispersions. Marangon and Carcassi [14] showed that as the quantity of hydrogen increases in a mixture with methane, the dispersion characteristics do change. When the hydrogen content increases, the overall plume has more vertical movement, whereas mixtures that have more methane do not disperse upward as much. This was shown by oxygen sensors within the test cell for this experiment. Hormaza at al. [15] performed experiments with various natural gas fittings and components to understand how hydrogen and natural gas have different leak characteristics. It is shown that as flow stabilizes and no longer is affected by transitions, the volumetric leakage ratio of hydrogen to natural gas is around 1.4 at pressures of 5 kPa and under. When the L/D is much smaller, the effect of transitions plays a bigger role, and this causes the leakage ratio of hydrogen to natural gas to be closer 2.25-2.30 for pressure of 5 kPa or under. Lowesmith and Hankinson [16] set up a test cell to investigate dispersion of hydrogen and methane mixtures, using blend ratios of 10%/90%, 20%/80%, and 50%/50% hydrogen to methane. This work is similar to the experiment conducted by Marangon and Carcassi [14]. The results from this experiment agree with Hormaza et al. [15] showing that a higher hydrogen concentration in a mixture will yield a higher overall release rate. These experiments show there are differences in both leak and dispersion behavior when adding hydrogen to natural gas.
Section 2.2 is also focused on dispersion characteristics of hydrogen and natural gas, but through modeling using CFD and other computational tools. Wilkening and Baraldi [10] use a commercially available code called CFD-ACE to investigate hydrogen and methane dispersions using both 2D and 3D simulations. CFD-ACE is used by many users and has been validated against various types of problems. Additionally, the authors performed their own validation simulations related to gas dispersion. The results of these models show that hydrogen has a greater vertical dispersion than methane which tends to accumulate closer to the ground. The authors mention that sources of ignition are more likely to be ground based and this information is useful for risk analysis. Additionally, the simulation results indicate a larger flammable cloud for hydrogen than for methane.
Section 2.3 is focused on immediate ignition events leading to jet fires. Lowesmith and Hankinson [17] performed large-scale high-pressure vertical jet fire experiments using a hydrogen and natural gas blend. The composition of natural gas was 93% methane, 5% ethane, 0.3% propane, and 1.7% nitrogen nominally. The two tests consisted of a 22%/78% hydrogen/natural gas mixture for test 1 and 100% natural gas for test 2 released at 70 bar through a 150 mm breach. Numerous heat flux gages and cameras capture data at various point around the jet fire. The radiated fraction over the first 100 seconds for the mixture is 0.29 whereas natural gas has a 0.30 radiant fraction. This shows a 22%/78% hydrogen/natural gas mixture has a very similar overall heat flux as a 100% natural gas jet fire. In a separate work, Lowesmith and Hankinson [18] conducted large-scale high-pressure jet fire experiments, with a horizontal jet flame. There was a total of six tests, three with a mixture of hydrogen and natural gas and three with only natural gas. Each mixture tested was a 24%/76% hydrogen/natural gas blend, with 3 different release sizes tested. The natural gas composition was 93% methane, 5% ethane, 0.3% propane, and 1.7% nitrogen nominally. This work also showed that the heat flux of a hydrogen/natural gas jet fire is very similar to natural gas only, but the flame interactions around objects generate a higher heat load for the mixture. The authors noted that this is important to understand the flame interactions of these blends around objects when performing

46
risk analysis. Studer et al. [19] performed experiments to measure the heat flux and flame length of hydrogen and methane mixtures. Additionally, Studer goes into detail on the Froude number showing that a smaller orifice increases the Froude number as well as the dimensionless flame length. Correlations between the radiative heat flux and models and scaling were also made. The
results show that the heat flux scales closely with 𝜏𝑓𝑎𝑝𝑇𝐹4.
The final section in the literature review, Section 2.4, gives an overview of models of hydrogen and natural gas jet fires. Witkowski et al. [21] analyzed the process of compression and transport of natural gas/hydrogen mixtures through existing natural gas pipelines. This was a very in-depth study that started with safe transportation distance analysis for pipelines with a 10% hydrogen concentration without experiencing choked flow. This included the influence on compressor stations on different concentrations of hydrogen in a pipeline. Pipeline failure probability and an event tree to understand the consequences of a pipeline failure were created by the authors as well. Using PHAST models, the jet fire heat flux radii were established for a variety of different blend ratios, showing the methane jet fires do have a higher overall heat flux and contribute more to the jet fire hazard than hydrogen does. Wang et al. [22] used the open source CFD code FireFOAM to study flame length and radiant heat behavior from hydrogen and mixed methane and hydrogen jet fires. This work was compared with actual experiments and theoretical values to help validate the flame lengths and radiant fractions. The model simulations and experimental data show no more than a 16% discrepancy on the flame length predications, and no more than an 8.1% discrepancy with the radiant fraction predications. This helped to demonstrate FireFOAM as a reliable code that can be used for predicting jet fire behavior for hydrogen and methane mixtures.

47
3. CONCLUSIONS This report has evaluated the safety implications of hydrogen and natural gas blends in pipelines, such as heat flux and dispersion behavior. The natural gas infrastructure was described, and hydrogen injection points were identified. Also, a comparison of the physical properties of natural gas and hydrogen was conducted with an emphasis on the differences that may be important in safety considerations. Additionally, a literature review was conducted on the current state of knowledge of the leak behavior of blended gases, specifically with respect to dispersion and jet fires. The literature review identified experiments and modeling efforts that have investigated leak events with hydrogen and natural gas blends.
A literature review on dispersion of hydrogen and natural gas blends during a leak event was presented. Through experiments and modeling, a variety of blend ratios were evaluated in the reviewed literature, including:
- 100% natural gas (composition not defined)
- 100% methane
- 10% hydrogen, 90% methane
- 20% hydrogen, 80% methane
- 30% hydrogen, 70% methane
- 50% hydrogen, 50% methane
- 100% hydrogen
The literature review of dispersion research identified that the dispersed gas mixtures will have different behaviors based on the blend ratio. A leak of a blend with more hydrogen was shown to accumulate at the ceiling of an enclosure more quickly than a blend with less hydrogen. However, it is not explicitly clear if this is due to the behavior of the blend itself or due to separation of the hydrogen from the methane. Without fully developed flow (i.e., laminar flow), transitions and other effects can affect the leak and dispersion behavior for hydrogen and methane blends. The volumetric leak rate of a blended fuel increases with the hydrogen content in the pipe system. The difference in fuel properties causes pure hydrogen to have a much higher sonic speed and less ground-level accumulation compared to pure methane.
Based on the literature reviewed, no sources were discovered that directly measured blend composition and tested for separation of hydrogen from natural gas during transport and dispersion. These experiments could be done directly, but as a first step properties and modeled behavior of the well-mixed blend could be compared to these literature data. Two literature sources were identified that focused on accumulation of a leak within an enclosure, and one that focused on flow characteristics of a blend. No sources were identified that examined unconfined releases such as concentration fields or concentration at specific distances. These concentration effects could be predicted by modified versions of the models within HyRAM [3] but the validation of these models would be limited by the unavailability of literature data.
The characteristics of a jet fire from a leak of blended hydrogen and natural gas fuel were also reviewed. Similar to the literature on dispersion, there were several different blend ratios evaluated through experiments and modeling with regard to jet fires:
- Pure natural gas (composition defined in Section 2.3)
48
- Pure methane
- 22% hydrogen, 78% natural gas (composition defined in Section 2.3)
- 24% hydrogen, 76% natural gas (composition defined in Section 2.3)
- 25% hydrogen, 75% methane
- 50% hydrogen, 50% methane
- 75% hydrogen, 25% methane
- 80% hydrogen, 20% methane
- Pure hydrogen
The literature review of jet fires of blended gas showed that the heat flux of hydrogen and natural gas mixtures has a similar heat flux to 100% natural gas jet fires. However, although the heat flux may be very similar, the flame interactions with objects is also important because mixtures may not behave the same as pure natural gas. Experiments also showed that the heat flux for a hydrogen/methane mixture is slightly higher than when compared to pure hydrogen. Moreover, modeling confirmed this by showing that the jet fire has a higher overall heat flux value for mixtures with more methane than hydrogen.
Data from these experiments can be compared to predicted behavior using models based on the properties of the well-mixed blend to determine how well the predicted behavior matches the experimental observations. In this case, there are multiple literature sources that measured flame lengths and heat flux values, both very relevant metrics to risk and hazard assessments. These data can be much more directly compared to the outputs of the models within HyRAM [3] for multiple validation comparisons.

49
4. REFERENCES
[1] M. W. Melaina, O. Antonia and M. Penev, "Blending Hydrogen into Natural Gas Pipeline Networks: A Review of Key Issues," NREL, Golden, 2013.
[2] P. Boehm and T. Saba, "Identification of Natural Gas Sources using Geochemical Forensic Tools," 2009. [Online]. Available: http://announce.exponent.com/practice/environmental/ef/vol5/index.html. [Accessed 07 10 2020].
[3] B. D. Ehrhart and E. S. Hecht, "Hydrogen Risk Assessment Models (HyRAM) Version 3.1 Technical Reference Manual," Sandia National Laboratories Report SAND2021-5812, 2021.
[4] DOT PHMSA, "Natural Gas Pipeline Systems," [Online]. Available: https://primis.phmsa.dot.gov/comm/NaturalGasPipelineSystems.htm?nocache=464. [Accessed 05 10 2020].
[5] NaturalGas.org, "The Transportation of Natural Gas," 20 09 2013. [Online]. Available: http://naturalgas.org/naturalgas/transport/. [Accessed 21 09 2020].
[6] American Gas Association, "How Does the Natural Gas Delivery System Work?," [Online]. Available: https://www.aga.org/natural-gas/delivery/how-does-the-natural-gas-delivery-system-work-/#:~:text=The%20pressure%20of%20gas%20in,actually%20reached%20in%20the%20system.. [Accessed 21 09 2020].
[7] M. Edalat and G. A. Mansoori, "Buried Gas Transmission Pipelines: Temeprature Profile Predicition," Energy Sources Journal, pp. 247-252, 1988.
[8] Engineering ToolBox, "Molecular Weight - Common Substances," 2009. [Online]. Available: https://www.engineeringtoolbox.com/molecular-weight-gas-vapor-d_1156.html. [Accessed 07 10 2020].
[9] Engineering ToolBox, "Gases - Densities," 2003. [Online]. Available: https://www.engineeringtoolbox.com/gas-density-d_158.html. [Accessed 08 10 2020].
[10] H. Wilkening and D. Baraldi, "CFD modelling of accidental hydrogen release from pipelines," International Journal of Hydrogen Energy, vol. 32, 2007.
[11] Engineering ToolBox, "Gases - Dynamic Viscosity," 2014. [Online]. Available: https://www.engineeringtoolbox.com/gases-absolute-dynamic-viscosity-d_1888.html. [Accessed 08 10 2020].
[12] Engineering ToolBox, "Air - Diffusion Coefficients of Gases in Excess of Air," 2018. [Online]. Available: https://www.engineeringtoolbox.com/air-diffusion-coefficient-gas-mixture-temperature-d_2010.html. [Accessed 15 June 2021].
[13] Engineering ToolBox, "Fuel Gases Heating Values," 2005. [Online]. Available: https://www.engineeringtoolbox.com/heating-values-fuel-gases-d_823.html. [Accessed 15 June 2021].
[14] A. Marangon and M. Carcassi, "HYDROGEN - METHANE MIXTURES : DISPERSION AND STRATIFICATION STUDIES," Department of Mechanical, Nuclear and Production Engineering, University of Pisa, Pisa.
[15] A. H. Mejia, J. Bruwer and M. M. Kinnin, "Hydrogen leaks at the same rate as natural gas in typical low-pressure gas infrastructure," International Jounral of Hydrogen Energy, vol. 45, pp. 8810-8826, 2020.
50
[16] B. Lowesmith, G. Hankinson, C. Spataru and M. Stobbart, "Gas build-up in a domestic property following releases of methane/hydrogen mixtures," Internation Journal of Hydrogen Energy, vol. 34, pp. 5932-5939, 2009.
[17] B. Lowesmith and G. Hankinson, "Large scale experiments to study fires following the rupture of high pressure pipelines conveying natural gas and natural gas/hydrogen mixtures," Process Safety and Environmental Protection, vol. 91, pp. 101-111, 2013.
[18] B. Lowesmith and G. Hankinson, "Large scale high pressure jet fires involving natural gas and natural gas/hydrogen mixtures," Process Safety and Environmental Protection, vol. 90, pp. 108-120, 2012.
[19] E. Studer, D. Jamois, S. Jallais, G. Leroy, J. Hebrard and V. Blanchetiere, "Properties of large-scale methane/hydrogen jet fires," International Journal of Hydrogen Energy, vol. 34, pp. 9611-9619, 2009.
[20] Engineering ToolBox, "Froude Number," 2004. [Online]. Available: https://www.engineeringtoolbox.com/froude-number-d_578.html. [Accessed 12 10 2020].
[21] A. R. A. Witkowski, M. Majkut and K. Stolecka, "Analysis of Compression and Transport of the Methane/Hydrogen Mixture in Existing Natural Gas Pipelines," International Journal of Pressure Vessels and Piping, no. 166, pp. 24-34, 2018.
[22] C. Wang, J. Wen, Z. Chen and S. Dembele, "Predicting radiative characteristics of hydrogen andhydrogenmethane jet fires using FireFOAM," Internation Journal of Hydrogen Energy, vol. 39, pp. 20560-20569, 2014.

51
DISTRIBUTION Email—Internal
Name Org. Sandia Email Address Ethan Hecht 08367 [email protected]
Kristin Hertz 08367 [email protected]
Chris San Marchi 08367 [email protected]
Myra Blaylock 08751 [email protected]
Austin Baird 08854 [email protected]
Brian Ehrhart 08854 [email protected]
Chris LaFleur 08854 [email protected]
Austin Glover 08854 [email protected]
Technical Library 01977 [email protected]
Email—External (encrypt for OUO)
Name Company Email
Address Company Name
Laura Hill [email protected] DOE HFTO

52
This page left blank

53
This page left blank

Sandia National Laboratories is a multimission laboratory managed and operated by National Technology & Engineering Solutions of Sandia LLC, a wholly owned subsidiary of Honeywell International Inc. for the U.S. Department of Energy’s National Nuclear Security Administration under contract DE-NA0003525.