Embed Size (px)
Citation preview
Joint Legislative Audit and Review CommissionJoint Legislative Audit and Review Commission
Review of State EmployeeReview of State Employee Total Compensation
House Appropriations Committee Retreat
November 19, 2008
JLARC
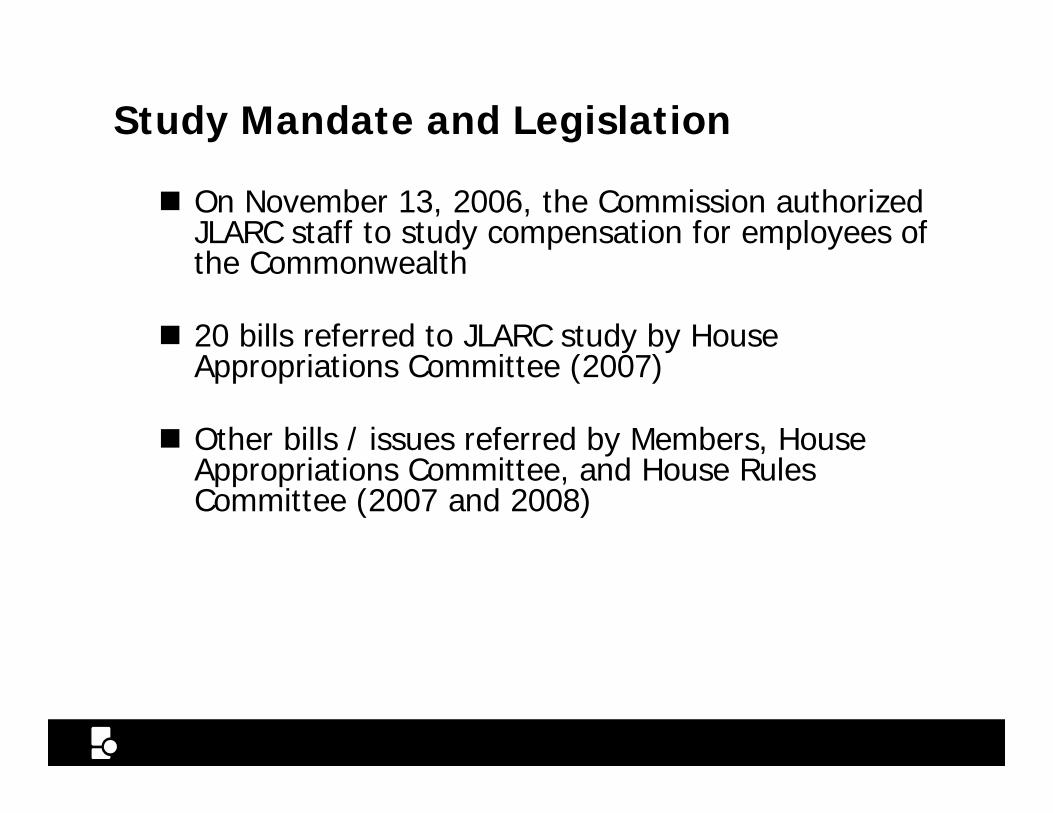
Study Mandate and Legislation
On November 13, 2006, the Commission authorized JLARC staff to study compensation for employees of th C lththe Commonwealth
20 bills referred to JLARC study by House A i ti C itt (2007)Appropriations Committee (2007)
Other bills / issues referred by Members, House A i i C i d H R lAppropriations Committee, and House Rules Committee (2007 and 2008)
JLARC 2
In This Presentation
Background
Assessment of Total Compensation
Assessment of Major Total Compensation ElementsAssessment of Major Total Compensation Elements
Summary of Potential Options
Summary of Total Compensation Options for Further Consideration and Analysisy
JLARC 3
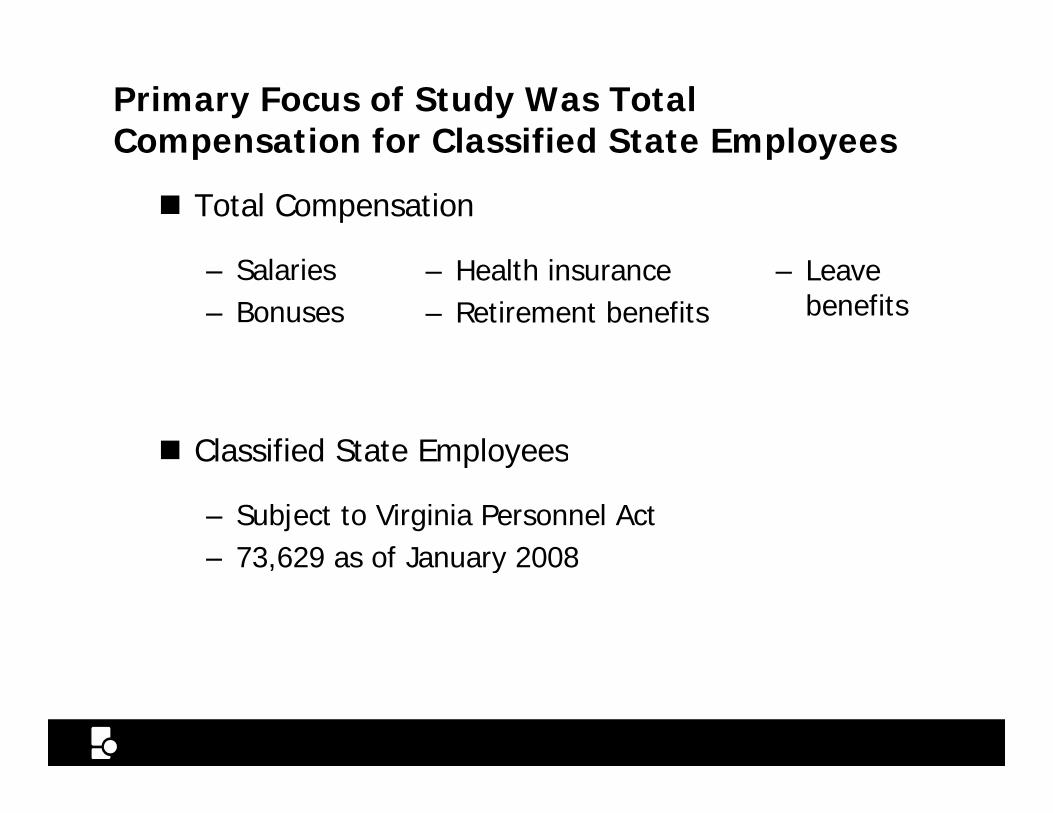
Primary Focus of Study Was Total Compensation for Classified State EmployeesCompensation for Classified State Employees
Total Compensation
– Salaries– Bonuses
– Health insurance– Retirement benefits
– Leave benefits
Classified State EmployeesClassified State Employees
– Subject to Virginia Personnel Act– 73 629 as of January 2008– 73,629 as of January 2008
JLARC 4
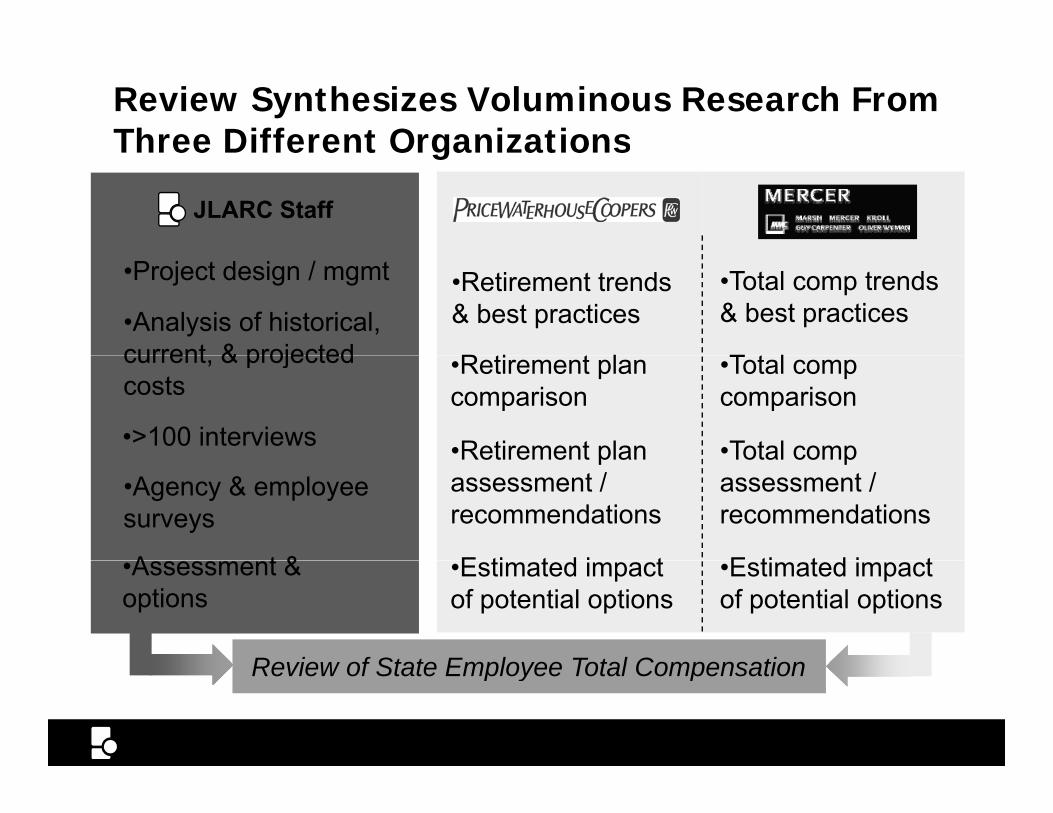
Review Synthesizes Voluminous Research From Three Different OrganizationsThree Different Organizations
JLARC Staff
•Analysis of historical, current & projected
•Total comp trends & best practices
•Retirement trends & best practices
T t l
•Project design / mgmt
R ti t l
•>100 interviews
current, & projected costs
•Total comp comparison
•Total comp•Retirement plan
•Retirement plan comparison
•Agency & employee surveys
Total comp assessment / recommendations
Retirement plan assessment / recommendations
E ti t d i tA t & E ti t d i t•Estimated impact of potential options
Review of State Employee Total Compensation
•Assessment & options
•Estimated impact of potential options
JLARC 5
Review of State Employee Total Compensation
Salaries and Benefits Are Intended to Achieve Six Key PurposesSix Key Purposes
Recruitment
Retention
Motivation & MoraleMotivation & Morale
Health & Productivity
Retirement
Work / Life Balance
JLARC 6

In This Presentation
Background
Assessment of Total Compensation
Assessment of Major Total Compensation ElementsAssessment of Major Total Compensation Elements
Summary of Potential Options
Total Compensation Options
JLARC 7
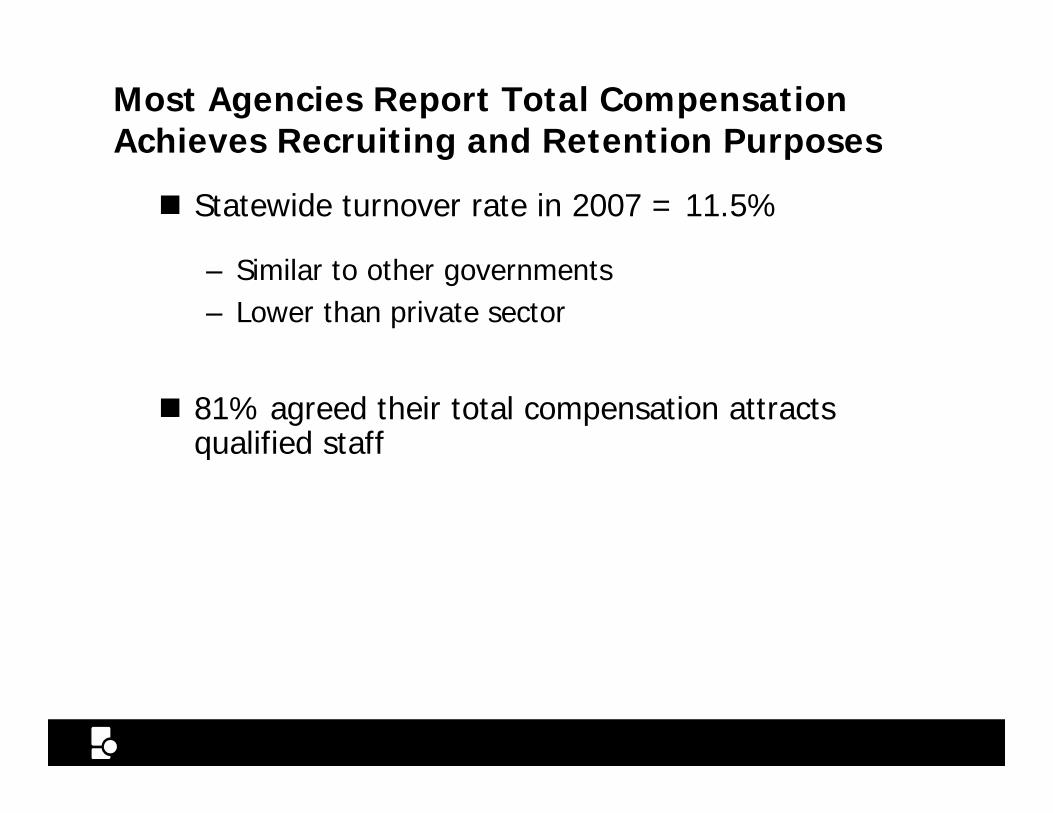
Most Agencies Report Total Compensation Achieves Recruiting and Retention PurposesAchieves Recruiting and Retention Purposes
Statewide turnover rate in 2007 = 11.5%
– Similar to other governments– Lower than private sector
81% agreed their total compensation attracts qualified staffq
JLARC 8Total Compensation
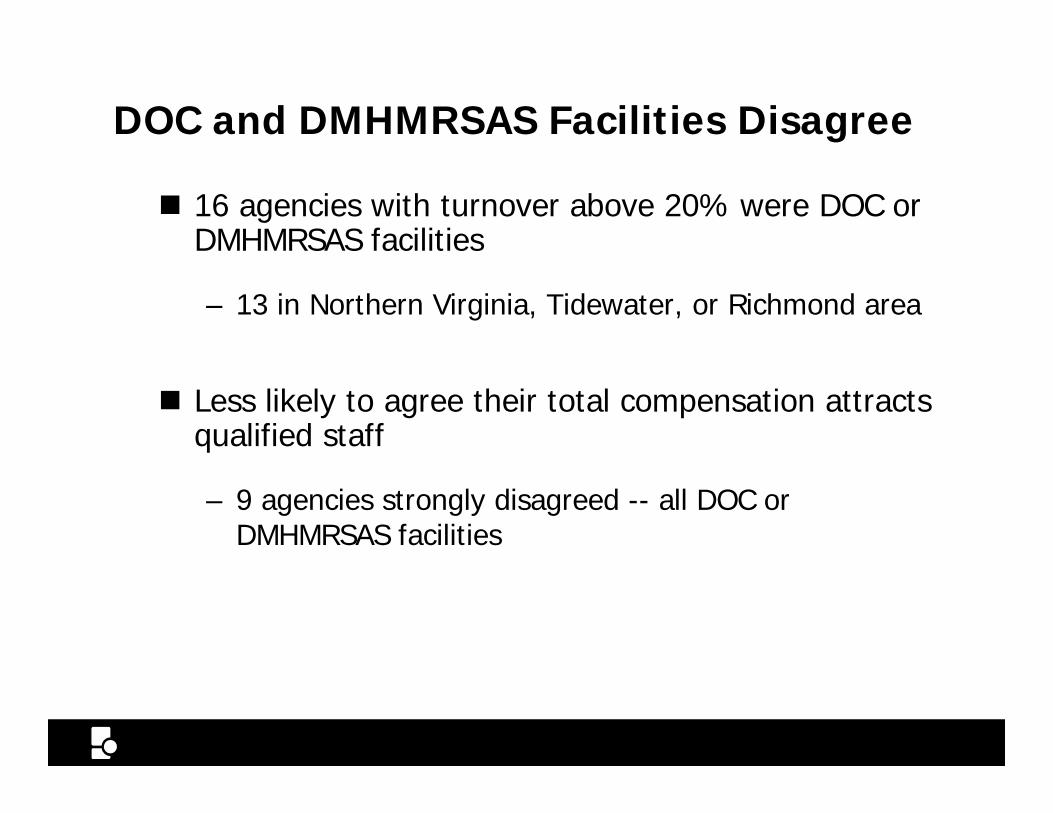
DOC and DMHMRSAS Facilities Disagree
16 agencies with turnover above 20% were DOC or DMHMRSAS facilities
– 13 in Northern Virginia, Tidewater, or Richmond area
Less likely to agree their total compensation attracts qualified staff
– 9 agencies strongly disagreed -- all DOC or DMHMRSAS facilities
JLARC 9Total Compensation
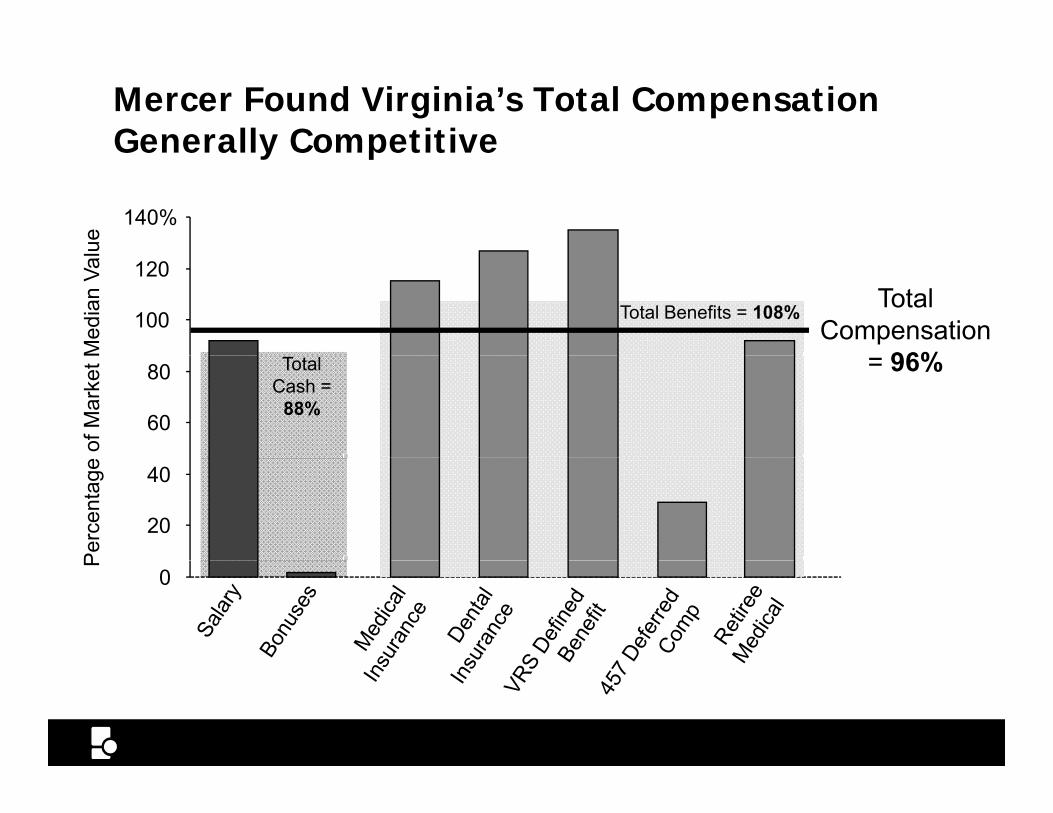
Mercer Found Virginia’s Total Compensation Generally Competitive
Generally Competitive
140%
ue
Total Compensation
96%100
120
Total Benefits = 108%
Med
ian
Val
= 96%
60
80 Total Cash =
88%
of M
arke
t M
20
40
Per
cent
age
0
P
JLARC 10Total Compensation
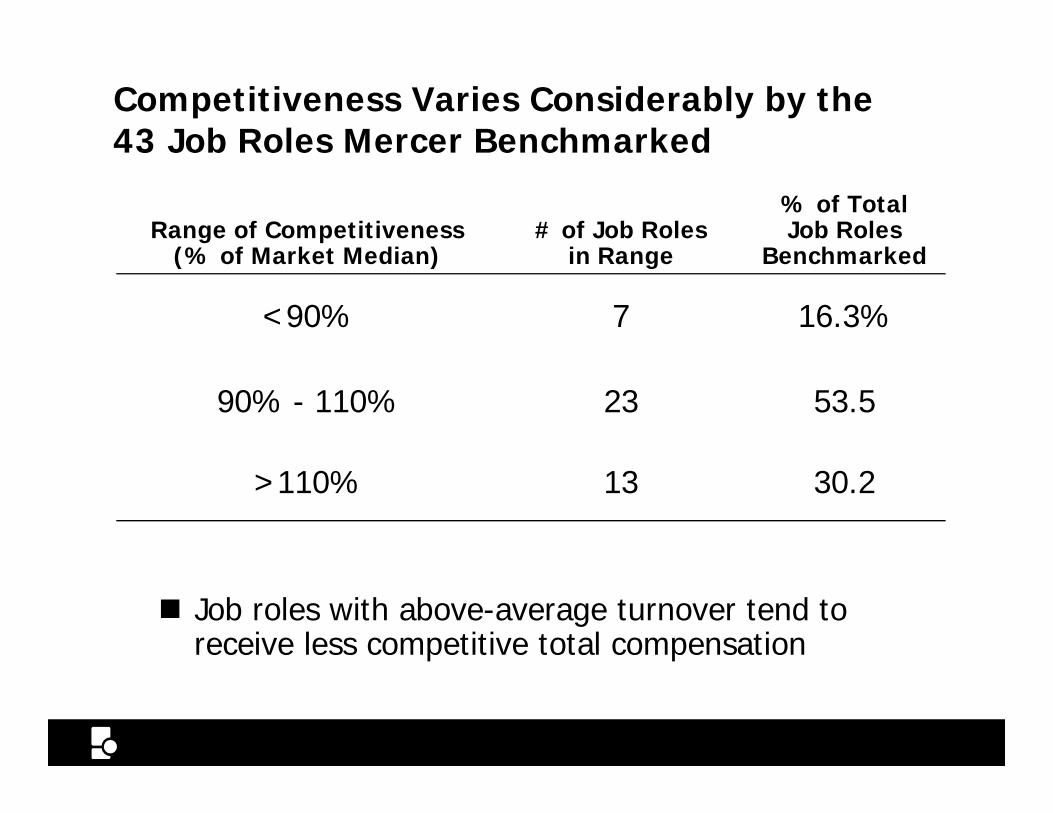
Competitiveness Varies Considerably by the 43 Job Roles Mercer Benchmarked43 Job Roles Mercer Benchmarked
Range of Competitiveness (% of Market Median)
# of Job Roles in Range
% of Total Job Roles
Benchmarked(% of Market Median) in Range Benchmarked
<90% 7 16.3%
90% - 110% 23 53.5
>110% 13 30.2
Job roles with above-average turnover tend to receive less competitive total compensation
JLARC 11Total Compensation
In This Presentation
Background
Assessment of Total Compensation
Assessment of Major Total Compensation ElementsAssessment of Major Total Compensation Elements
Summary of Potential Options
Total Compensation Options
JLARC 12
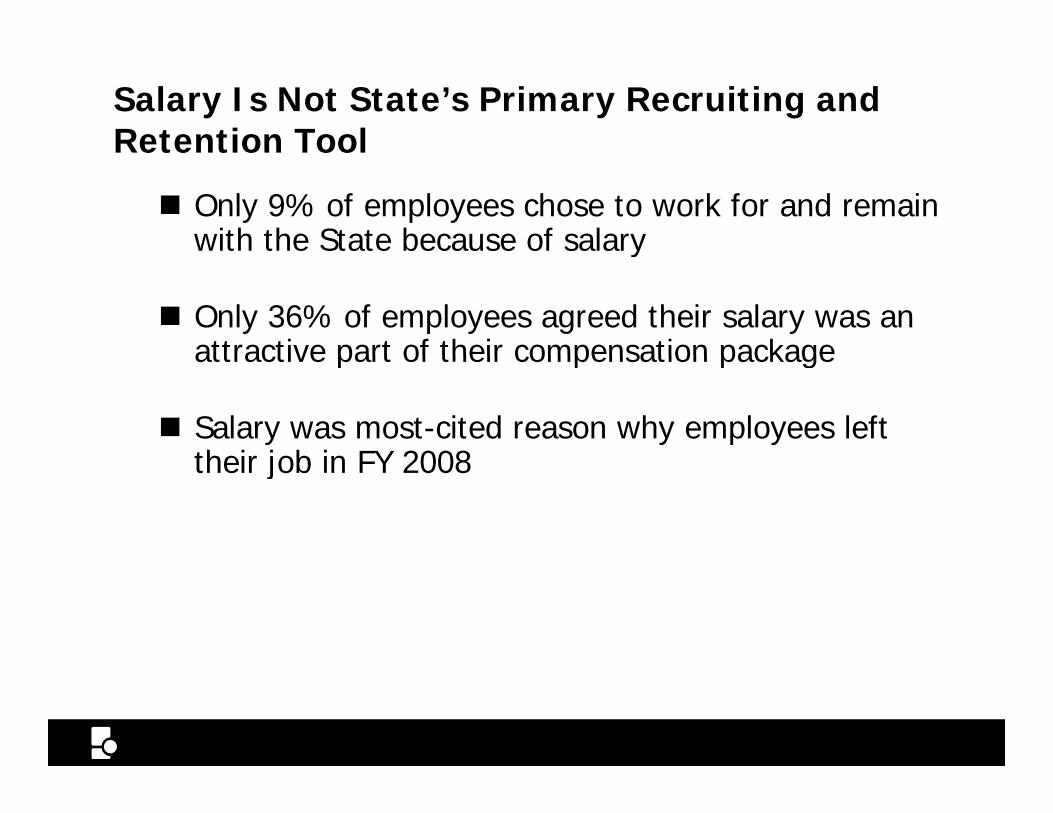
Salary Is Not State’s Primary Recruiting and Retention ToolRetention Tool
Only 9% of employees chose to work for and remain with the State because of salaryy
Only 36% of employees agreed their salary was an attractive part of their compensation packageattractive part of their compensation package
Salary was most-cited reason why employees left their job in FY 2008their job in FY 2008
JLARC 13Salary
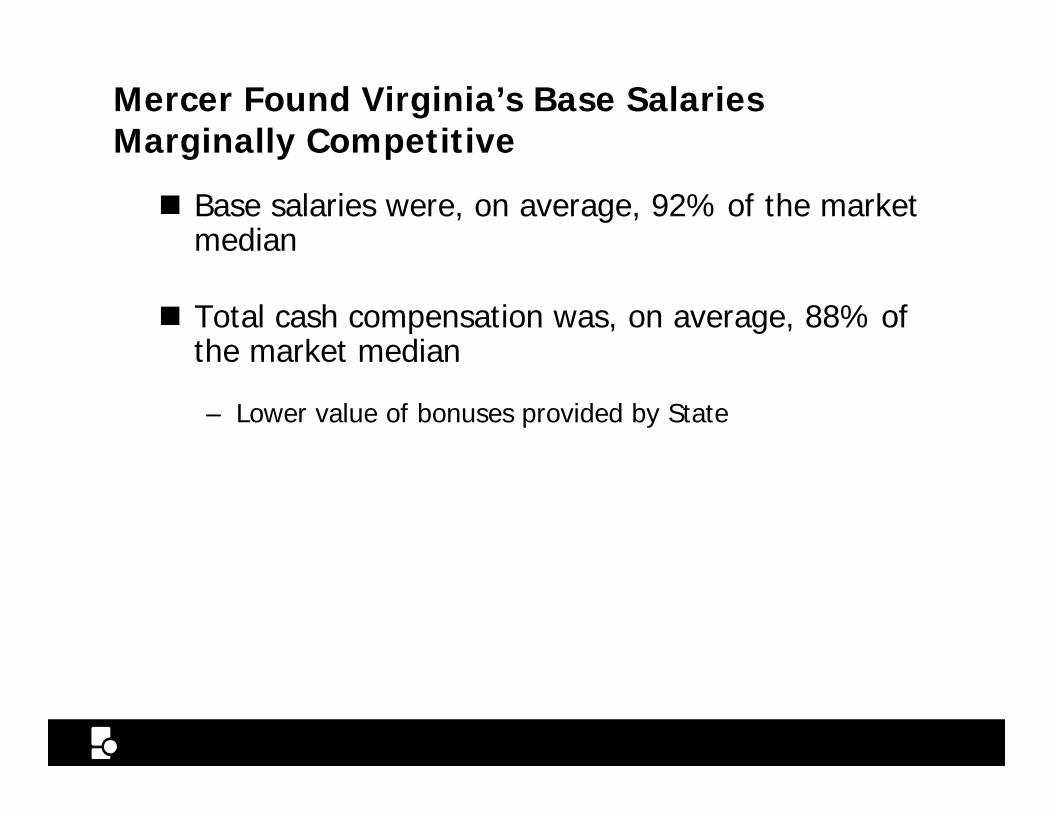
Mercer Found Virginia’s Base Salaries Marginally CompetitiveMarginally Competitive
Base salaries were, on average, 92% of the market median
Total cash compensation was, on average, 88% of the market medianthe market median
– Lower value of bonuses provided by State
JLARC 14Salary
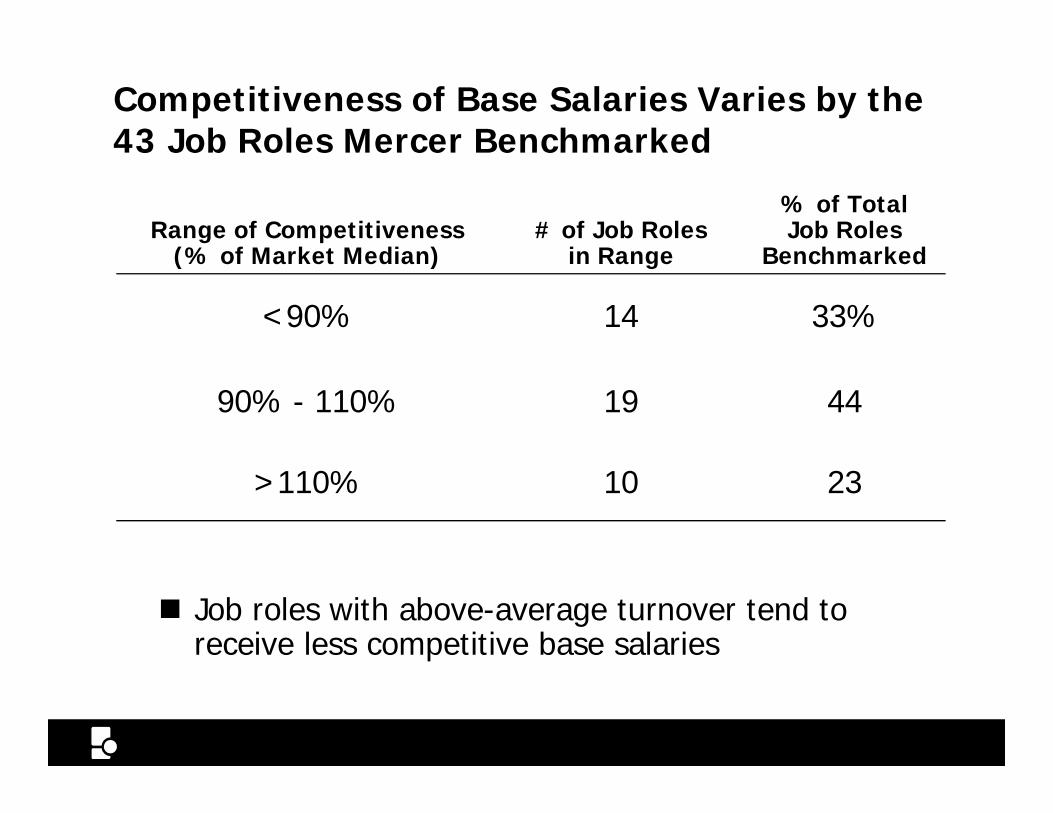
Competitiveness of Base Salaries Varies by the 43 Job Roles Mercer Benchmarked43 Job Roles Mercer Benchmarked
Range of Competitiveness (% of Market Median)
# of Job Roles in Range
% of Total Job Roles
Benchmarked(% of Market Median) in Range Benchmarked
<90% 14 33%
90% - 110% 19 44
>110% 10 23
Job roles with above-average turnover tend to receive less competitive base salaries
JLARC 15Salary
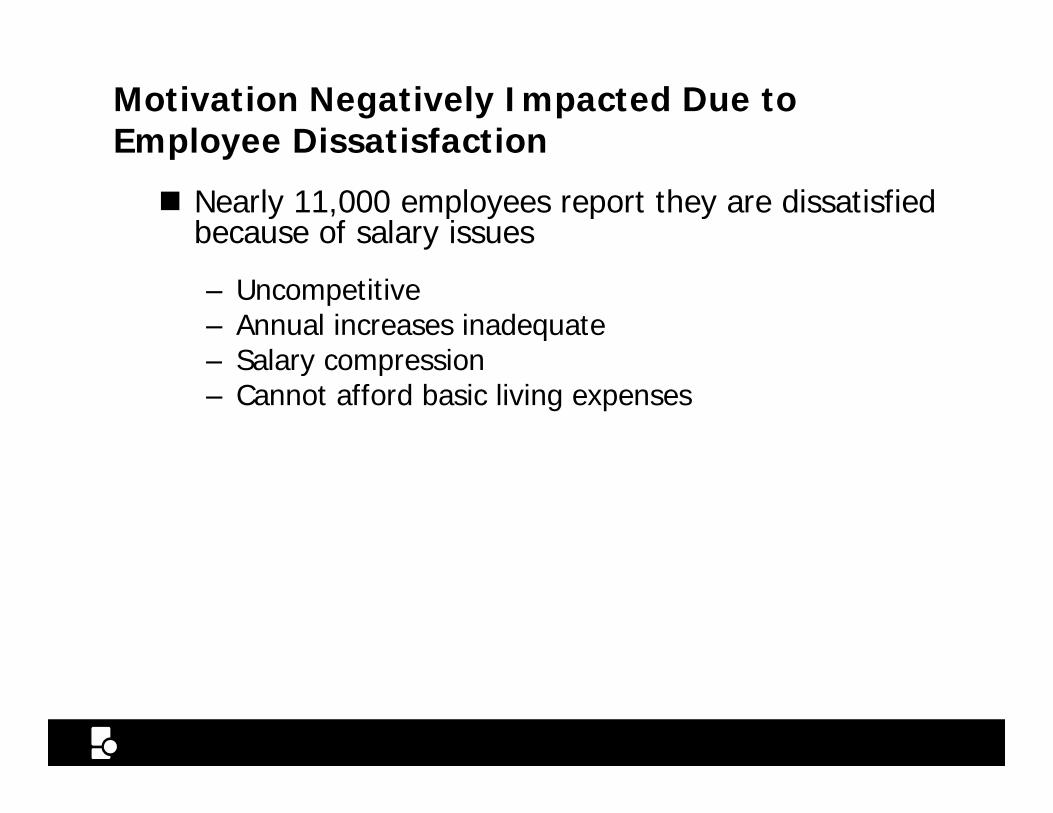
Motivation Negatively Impacted Due to Employee DissatisfactionEmployee Dissatisfaction
Nearly 11,000 employees report they are dissatisfied because of salary issues
– Uncompetitive – Annual increases inadequate
Salary compression– Salary compression – Cannot afford basic living expenses
JLARC 16Salary
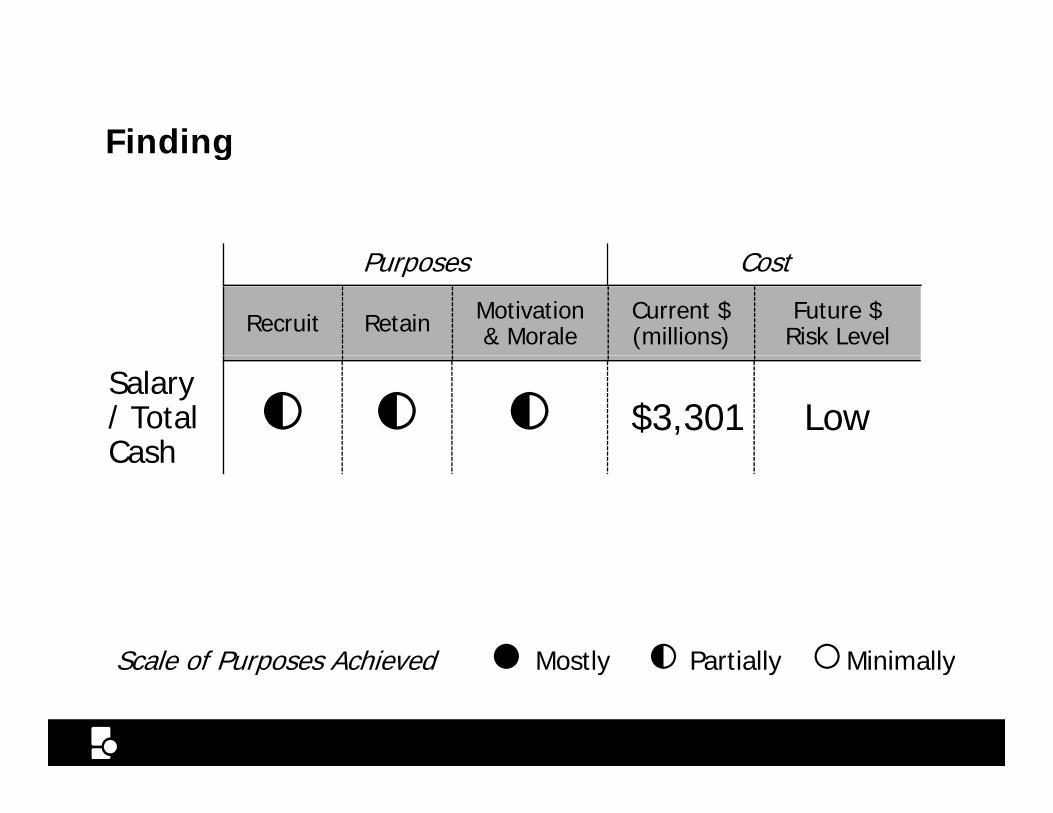
FindingFinding
P C tPurposes Cost
Recruit Retain Motivation & Morale
Current $ (millions)
Future $ Risk Level
Salary / Total Cash ◐ ◐ ◐ $3,301 LowCash
Scale of Purposes Achieved ● Mostly ◐ Partially ○Minimally
JLARC 17
Scale of Purposes Achieved ● Mostly ◐ Partially ○Minimally
Salary Assessment
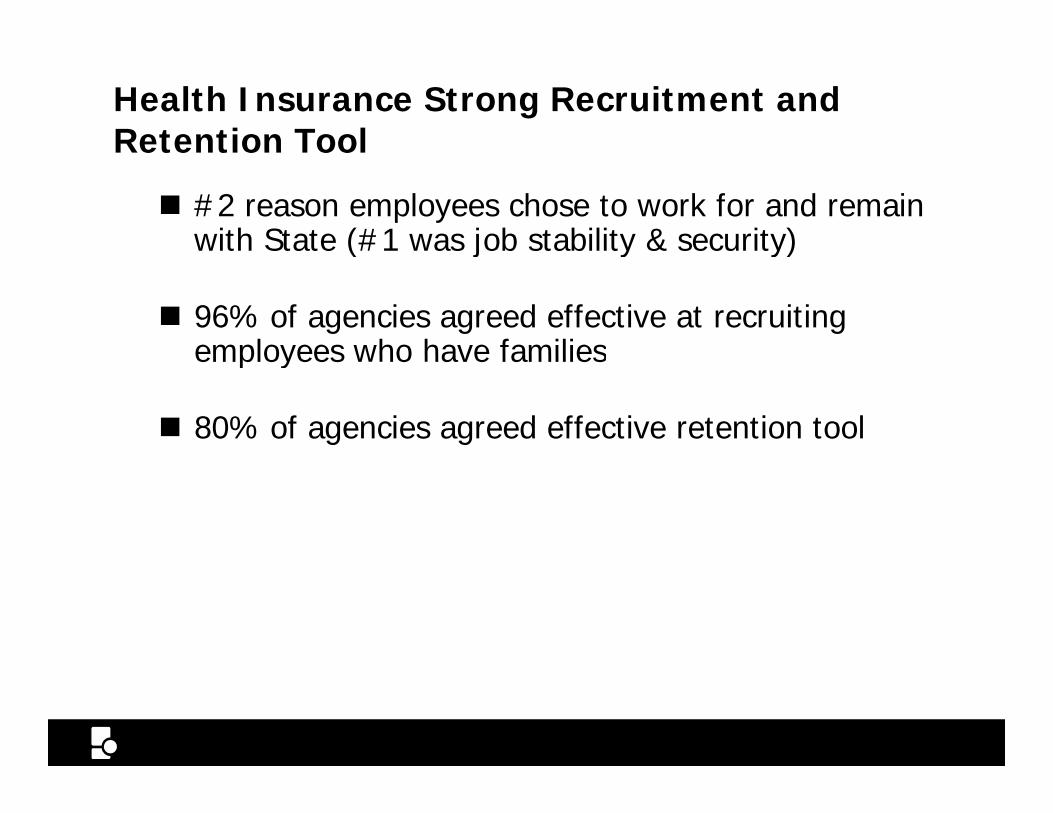
Health Insurance Strong Recruitment and Retention ToolRetention Tool
#2 reason employees chose to work for and remain with State (#1 was job stability & security)( j y y)
96% of agencies agreed effective at recruiting employees who have familiesemployees who have families
80% of agencies agreed effective retention tool
JLARC 18Health Benefits
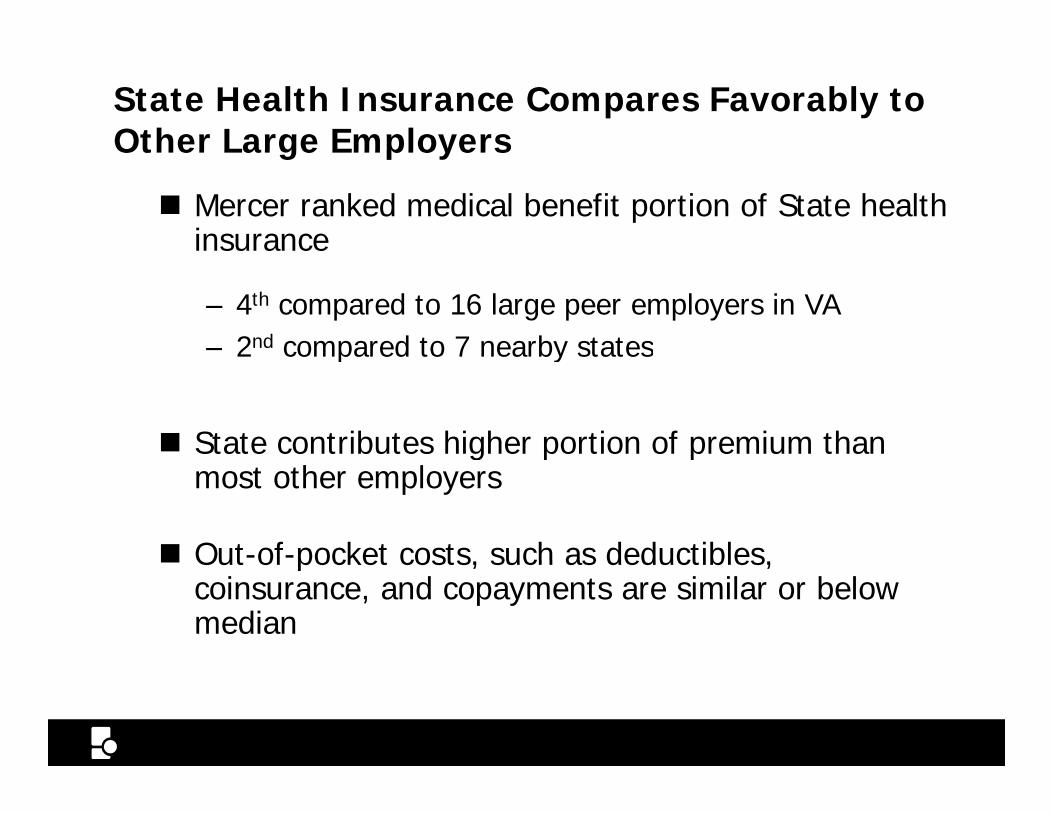
State Health Insurance Compares Favorably to Other Large EmployersOther Large Employers
Mercer ranked medical benefit portion of State health insurance
– 4th compared to 16 large peer employers in VA– 2nd compared to 7 nearby states2 compared to 7 nearby states
State contributes higher portion of premium than g p pmost other employers
Out-of-pocket costs, such as deductibles,Out of pocket costs, such as deductibles, coinsurance, and copayments are similar or below median
JLARC 19Health Benefits
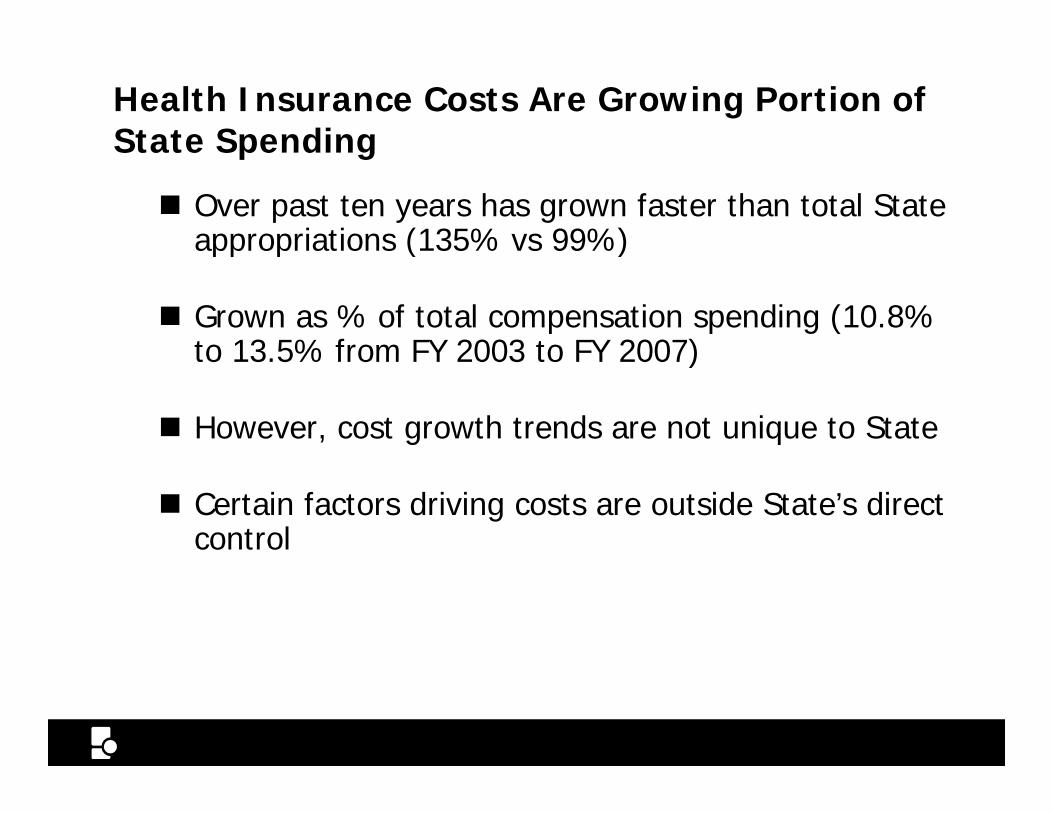
Health Insurance Costs Are Growing Portion of State SpendingState Spending
Over past ten years has grown faster than total State appropriations (135% vs 99%)pp p ( )
Grown as % of total compensation spending (10.8% to 13 5% from FY 2003 to FY 2007)to 13.5% from FY 2003 to FY 2007)
However, cost growth trends are not unique to State
Certain factors driving costs are outside State’s direct control
JLARC 20Health Benefits
Factors Within State’s Control Driving State Health Insurance CostsHealth Insurance Costs
State premium contributions
Fixed cost provisions of plan (deductibles and copayments)
Limited focus on efficiency
L k f h l h dLack of health data
JLARC 21Health Benefits
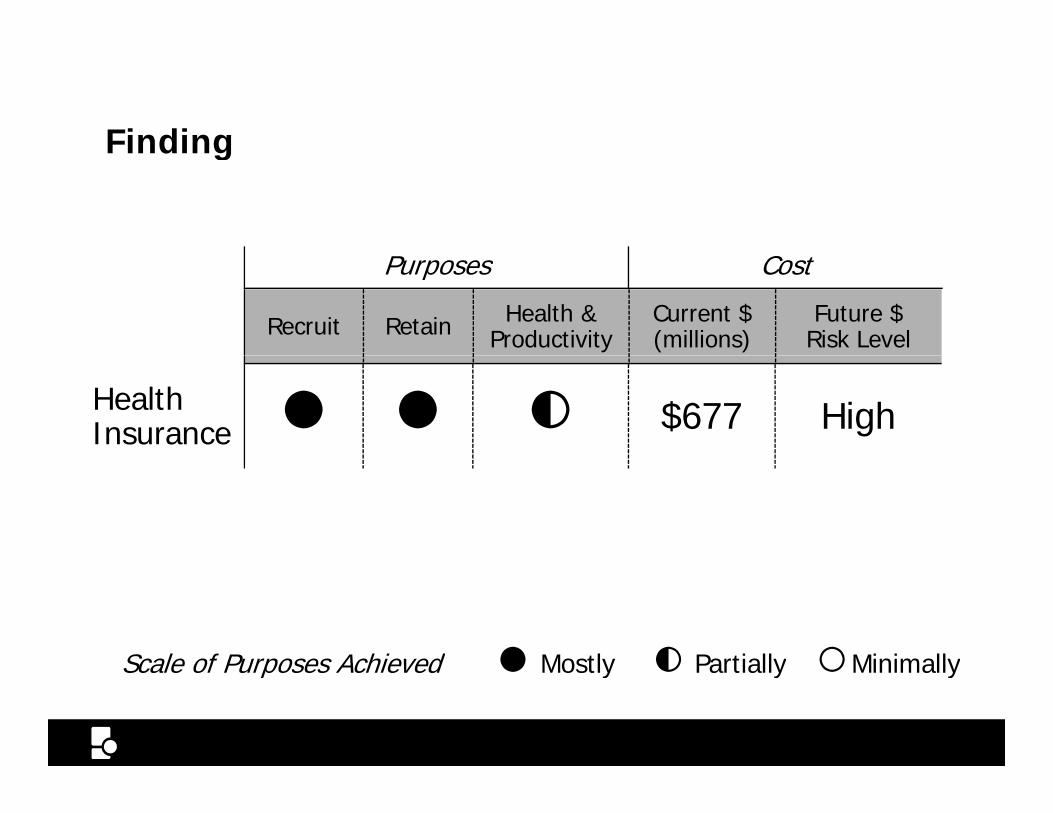
FindingFinding
Purposes Cost
Recruit Retain Health & Productivity
Current $ (millions)
Future $ Risk Level
Health Insurance ● ● ◐ $677 High
Scale of Purposes Achieved ● Mostly ◐ Partially ○Minimally
JLARC 22Health Benefits Assessment
Scale of Purposes Achieved ● Mostly ◐ Partially ○Minimally
Retirement Benefits Retain Longer-Tenured EmployeesEmployees
93% of agencies agreed
3/4 of employees within 5 yrs of retirement agreed
More important for longer tenured than for recentlyMore important for longer tenured than for recently hired employees (Mercer)
JLARC 23Retirement Benefits
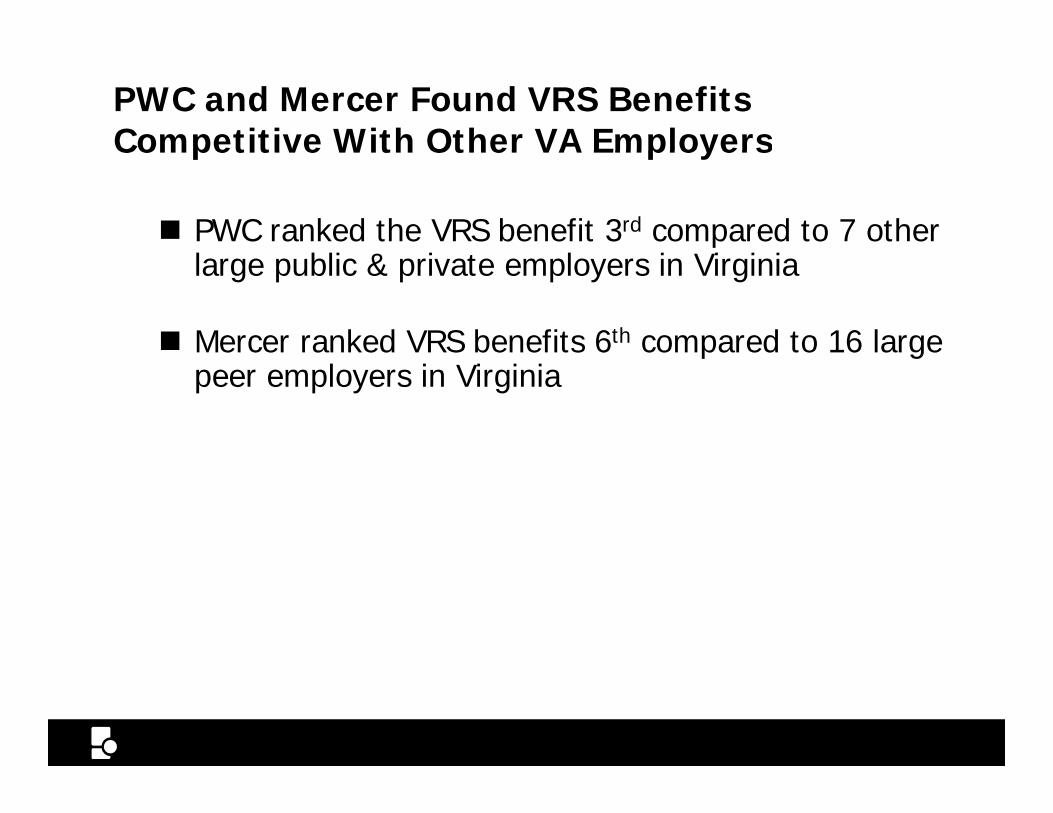
PWC and Mercer Found VRS Benefits Competitive With Other VA EmployersCompetitive With Other VA Employers
PWC ranked the VRS benefit 3rd compared to 7 other l bli & i l i Vi i ilarge public & private employers in Virginia
Mercer ranked VRS benefits 6th compared to 16 large p gpeer employers in Virginia
JLARC 24Retirement Benefits
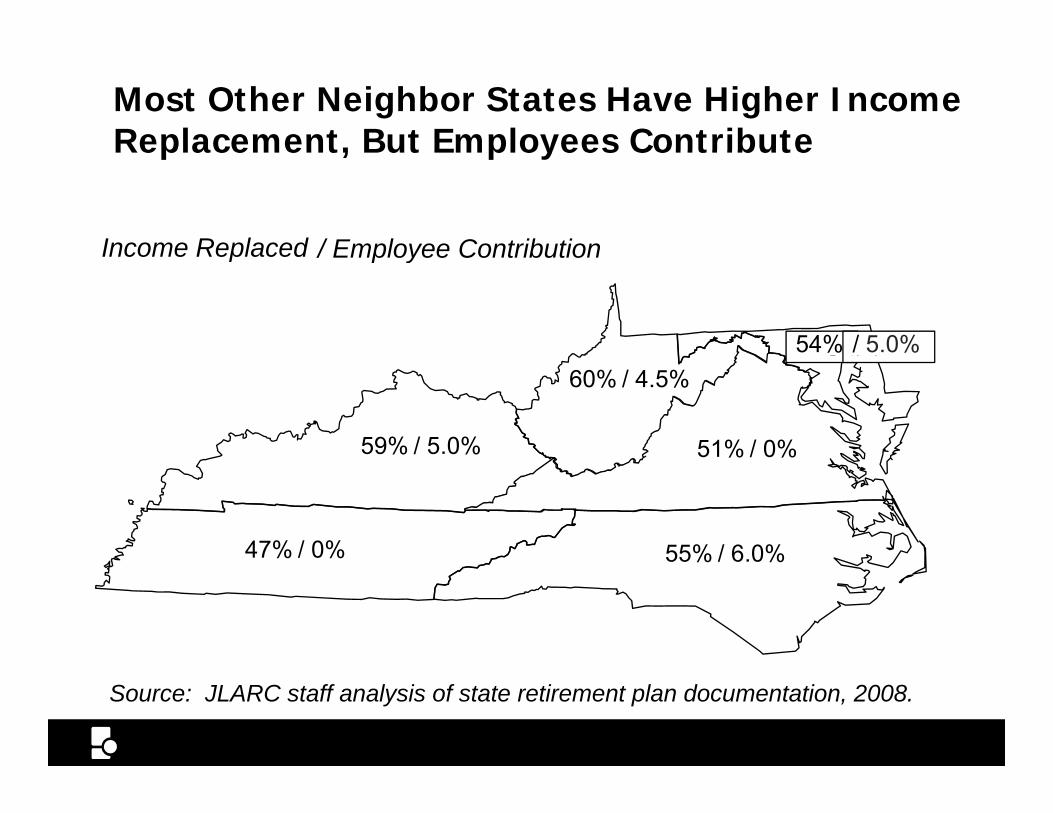
Most Other Neighbor States Have Higher Income Replacement, But Employees ContributeReplacement, But Employees Contribute
Income Replaced / Employee ContributionIncome Replaced
54% / 5.0%
/ Employee Contribution
60% / 4.5%
51% / 0%59% / 5.0%
55% / 6.0%47% / 0% 55% / 6.0%
JLARC 25
Source: JLARC staff analysis of state retirement plan documentation, 2008.
Retirement Benefits
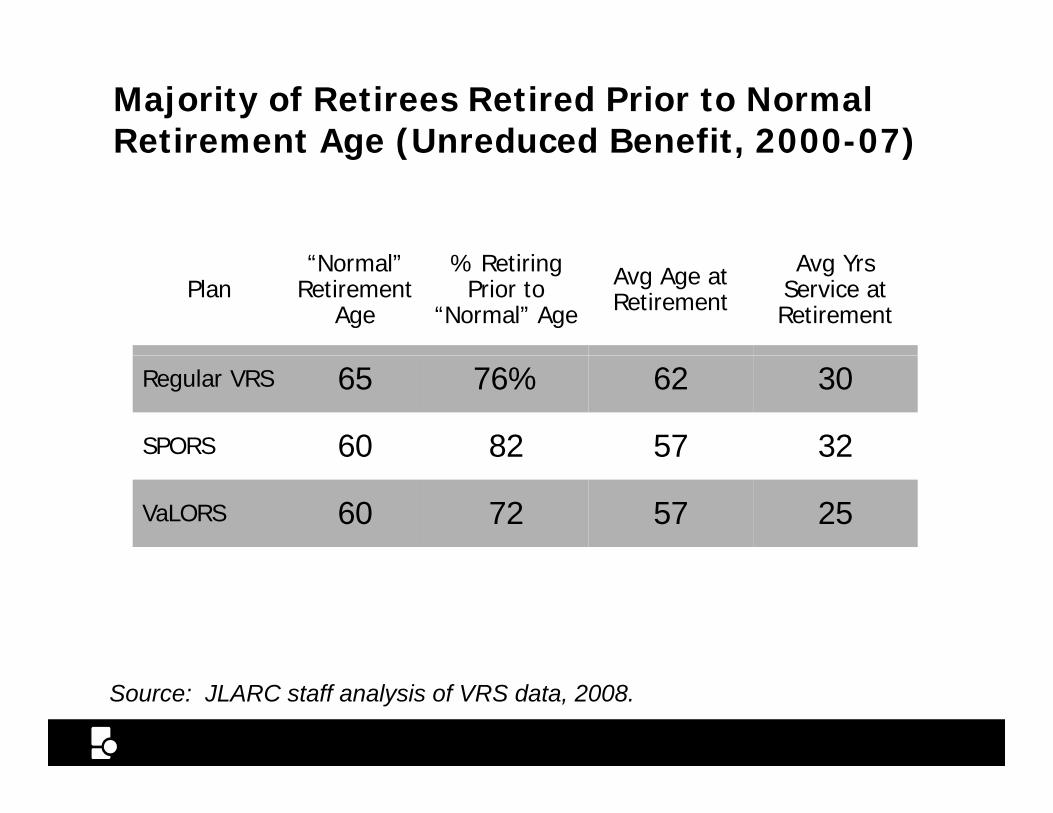
Majority of Retirees Retired Prior to Normal Retirement Age (Unreduced Benefit, 2000-07)Retirement Age (Unreduced Benefit, 2000 07)
Plan“Normal”
Retirement Age
% Retiring Prior to
“Normal” Age
Avg Age at Retirement
Avg Yrs Service at Retirement
Regular VRS 65
SPORS 60
76%
82
62
57
30
32
VaLORS 60 72 57 25
JLARC 26
Source: JLARC staff analysis of VRS data, 2008.
Retirement Benefits
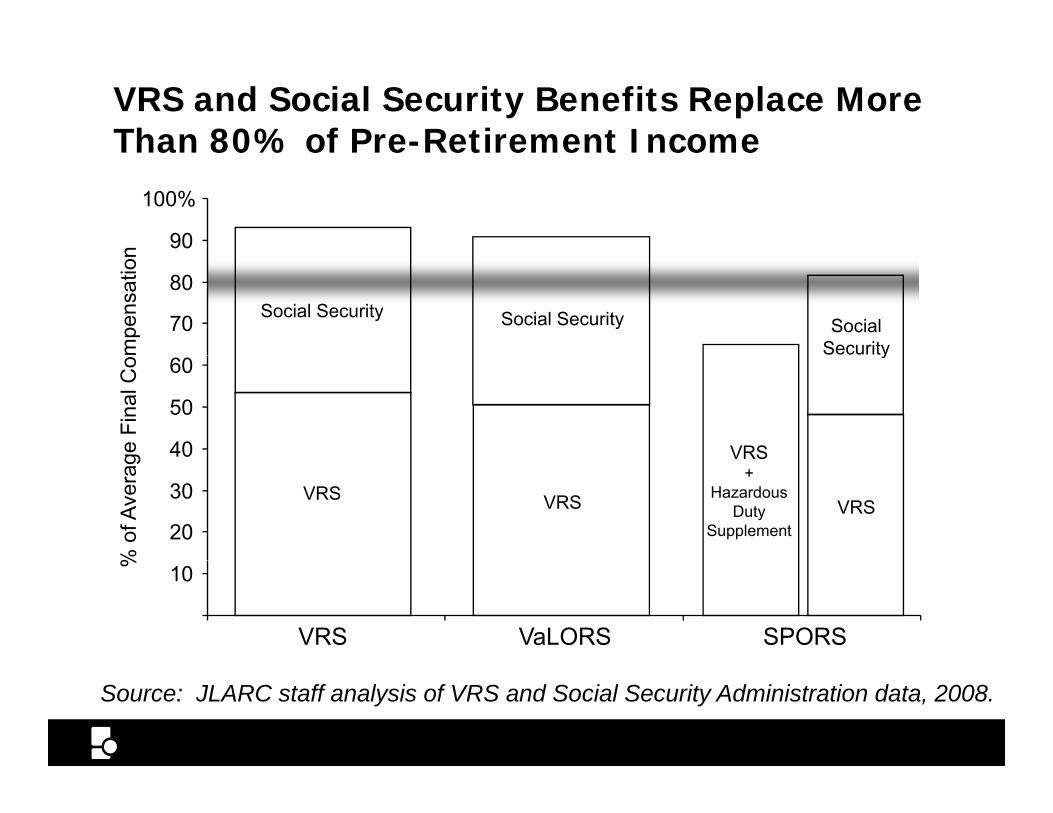
VRS and Social Security Benefits Replace More Than 80% of Pre-Retirement IncomeThan 80% of Pre Retirement Income
90
100%
n
70
80
mpe
nsat
ion
Social Security Social Security Social Security
40
50
60
ge F
inal
Co
VRS
y
20
30
% o
f Ave
rag
VRS VRS
VRS +
Hazardous Duty
SupplementVRS
10
VRS VaLORS SPORS
%
JLARC 27
Source: JLARC staff analysis of VRS and Social Security Administration data, 2008.
Retirement Benefits
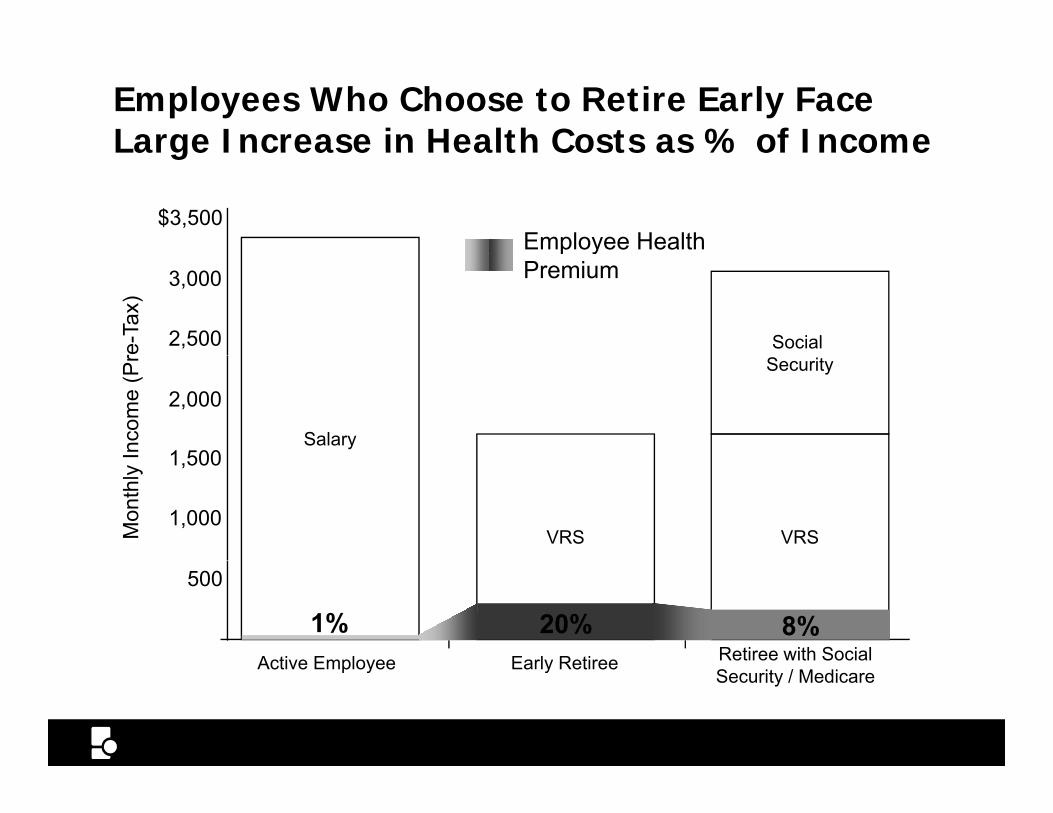
Employees Who Choose to Retire Early Face Large Increase in Health Costs as % of IncomeLarge Increase in Health Costs as % of Income
$3,500Employee Health
3,000
2,500
re-T
ax)
Social
p yPremium
2,000
1 500Inco
me
(Pr
Salary
Security
1,500
1,000
Mon
thly
VRS VRS
1%
500
Active Employee Early Retiree Retiree with Social 20% 8%
JLARC 28
Active Employee Early RetireeSecurity / Medicare
Retirement Benefits
Contributions to VRS Plans Lower Than VRS Board Certified Rate in 10 of Last 18 YearsBoard Certified Rate in 10 of Last 18 Years
Governmental Accounting Standards Board (GASB) recommends that employers fully pay Annual p y y p yRequired Contribution (ARC)
– Compliance with GASB is factor in bond rating
Virginia ranks 46th out of 50 states in average f ARC id (P C f h S )amount of ARC paid (Pew Center for the States)
VRS funded status = 85.1%
JLARC 29Retirement Benefits
PwC: State’s Payment of Employee Contribution to VRS Benefits Is Unique and Costlyto VRS Benefits Is Unique and Costly
Virginia unique in State payment of the employee portion of VRS costsp
– 4 other states have noncontributory plans
“…the noncontributory nature of the VRS plan…significantly increases the value and cost of h VRS b fi ” (P C)the VRS benefit.” (PwC)
State spent $168.2 million in FY 2007, roughly 42% p $ , g yof total retirement contributions
JLARC 30Retirement Benefits
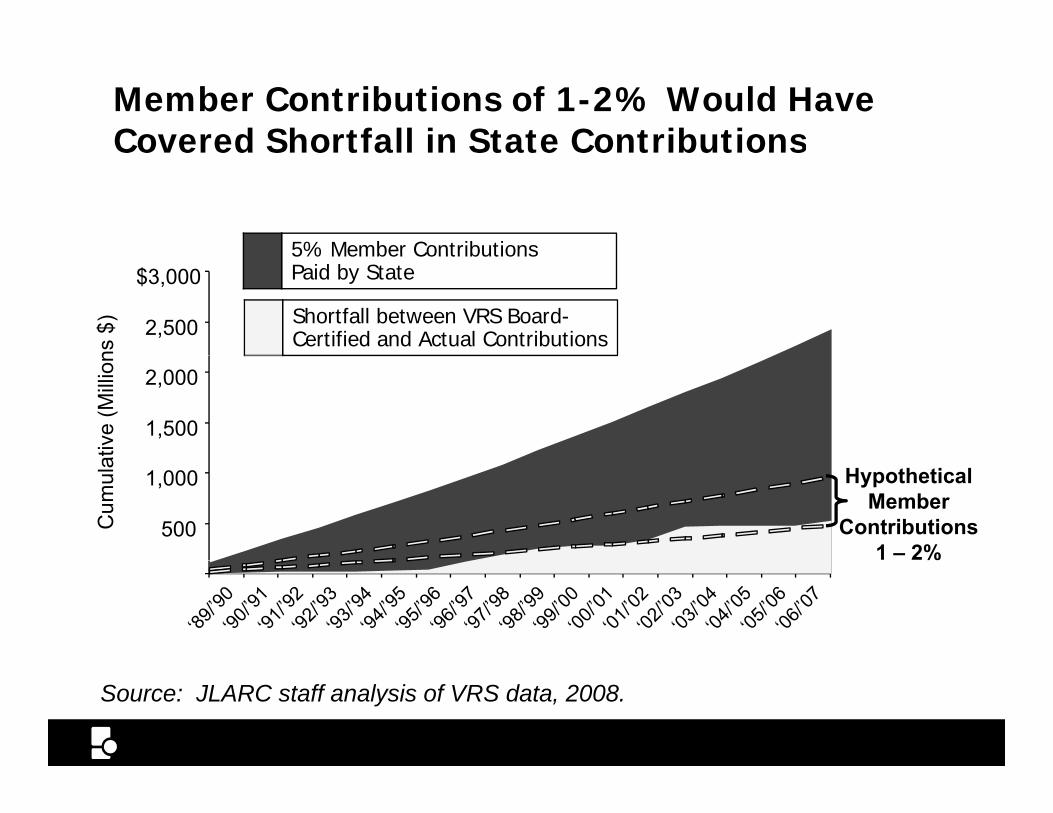
Member Contributions of 1-2% Would Have Covered Shortfall in State ContributionsCovered Shortfall in State Contributions
5% Member Contributions
ns $
) 2,500
$3,0005% Member Contributions Paid by State
Shortfall between VRS Board-Certified and Actual Contributions
ativ
e (M
illion
1,500
2,000
Cum
ula
500
1,000 Hypothetical Member
Contributions 1 – 2%
JLARC 31
Source: JLARC staff analysis of VRS data, 2008.
Retirement Benefits
PwC: COLA Protects Retirees’ Purchasing Power But Is Cost Driver for StatePower But Is Cost Driver for State
Without it, retirees would have lost about 2/3 of purchasing power over last 30 yrsp g p y
Greater than COLAs granted by all neighboring state retirement systemsretirement systems
Represents about 20% of plan costs (PwC)
JLARC 32Retirement Benefits
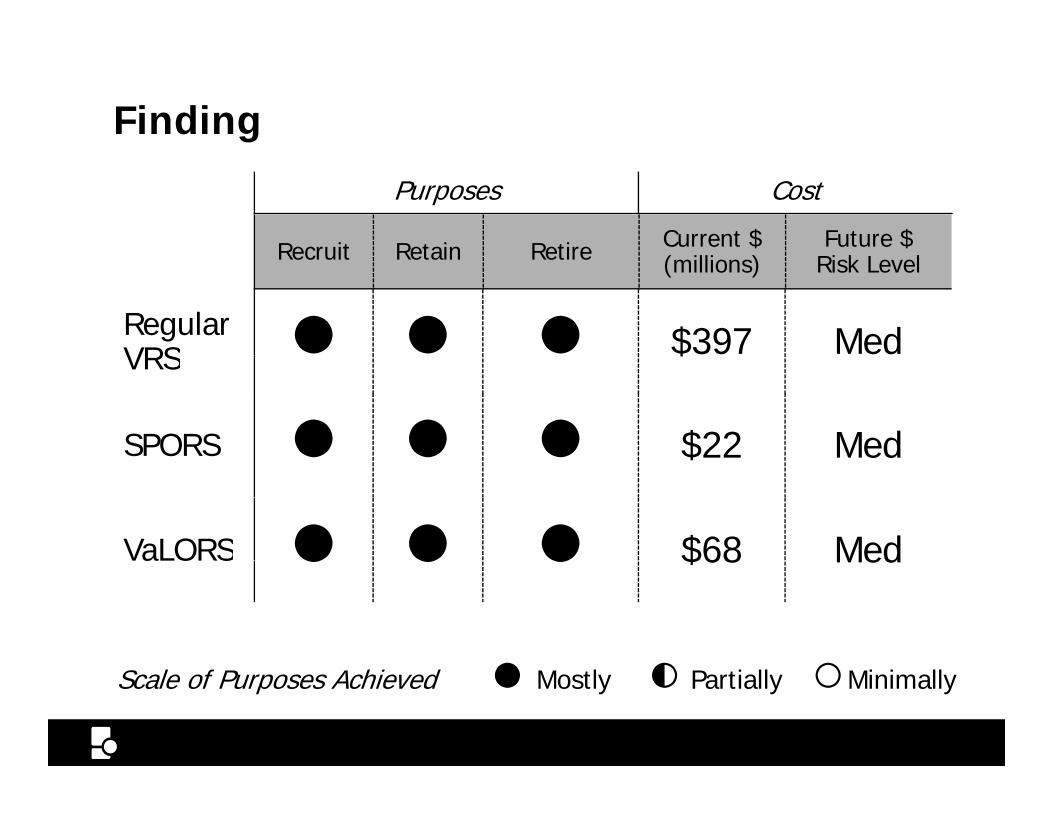
Finding
Purposes Cost
Recruit Retain Retire Current $ Future $ Recruit Retain Retire (millions) Risk Level
Regular VRS ● ● ● $397 MedVRS $
SPORS ● ● ● $22 Med$ ed
VaLORS ● ● ● $68 MedVaLORS ● ● ● $68 Med
● ◐ ○JLARC 33Retirement Benefits Assessment
Scale of Purposes Achieved ● Mostly ◐ Partially ○Minimally
Leave Benefits Effective Recruitment and Retention ToolRetention Tool
72% of agencies agreed
– for single employees or with few yrs of service
86% agreed
– for employees with families or more yrs of service
JLARC 34Leave Benefits
Leave Benefits Comparable to Other Large EmployersEmployers
Mercer ranked State’s total leave
– 9th compared to 16 large peer employers in VA– 3rd compared to 7 nearby states
Slightly more holidays, but less sick leave
12th out of 14 for annual leave
JLARC 35Leave Benefits
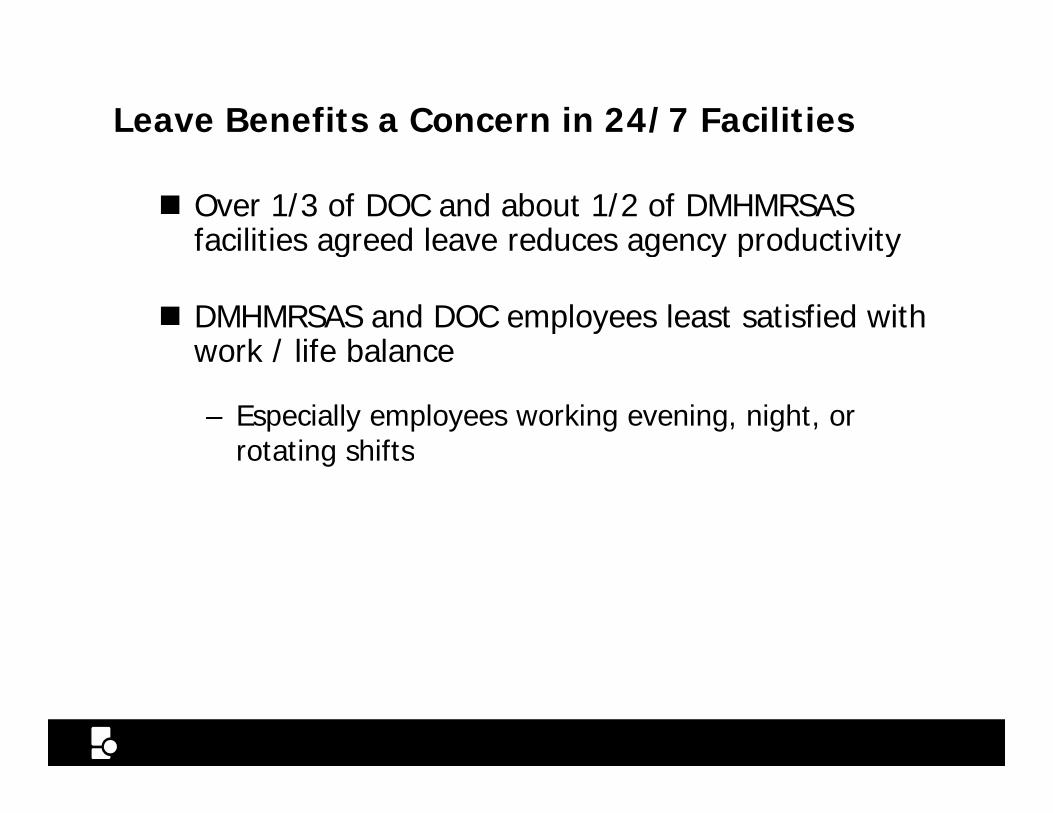
Leave Benefits a Concern in 24/7 Facilities
Over 1/3 of DOC and about 1/2 of DMHMRSAS facilities agreed leave reduces agency productivityg g y p y
DMHMRSAS and DOC employees least satisfied with work / life balancework / life balance
– Especially employees working evening, night, or rotating shiftsrotating shifts
JLARC 36Leave Benefits
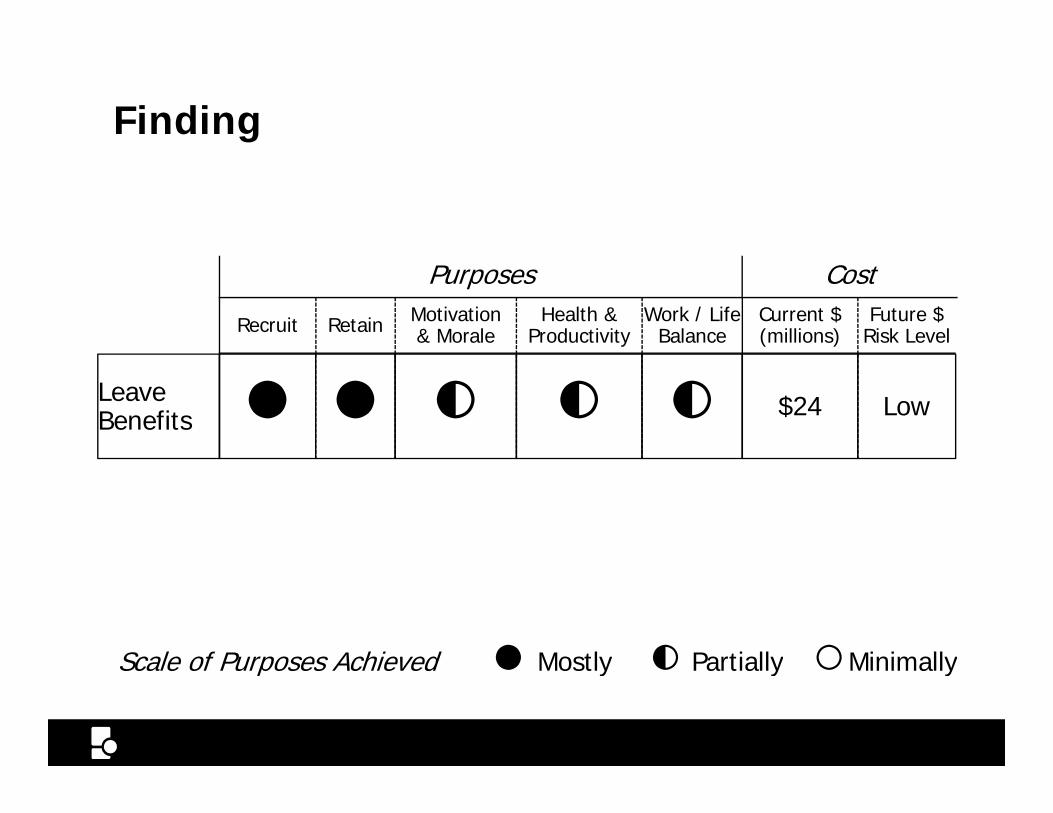
Finding
Recruit Retain Motivation & Morale
Health & Productivity
Work / Life Balance
Current $ (millions)
Future $ Risk Level
Purposes Cost
Leave Benefits ● ● ◐ ◐ ◐ $24 Low
Scale of Purposes Achieved ● Mostly ◐ Partially ○Minimally
JLARC 37Leave Benefits Assessment
Scale of Purposes Achieved ● Mostly ◐ Partially ○Minimally
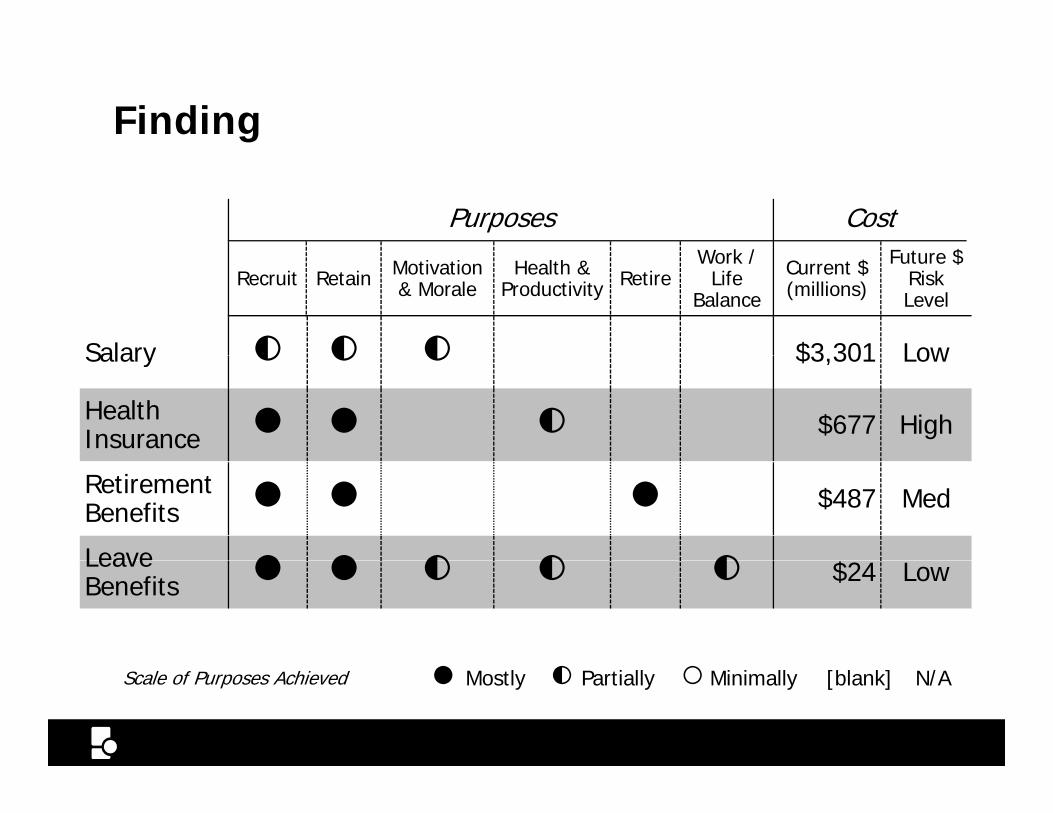
Finding
Work / Future $
Purposes Cost
Salary ◐ ◐ ◐ $3 301 Low
Recruit Retain Motivation & Morale
Health & Productivity Retire
Work / Life
Balance
Current $ (millions)
Future $ Risk Level
Salary ◐ ◐ ◐ $3,301 Low
Health Insurance ● ● ◐ $677 High
Retirement Benefits ● ● ● $487 Med
Leave ● ● ◐ ◐ ◐ $Leave Benefits ● ● ◐ ◐ ◐ $24 Low
JLARC 38
Scale of Purposes Achieved ● Mostly ◐ Partially ○Minimally [blank] N/A
Summary Assessment

In This Presentation
Background
Assessment of Total Compensation
Assessment of Major Total Compensation ElementsAssessment of Major Total Compensation Elements
Summary of Potential Options
Total Compensation Options
JLARC 39
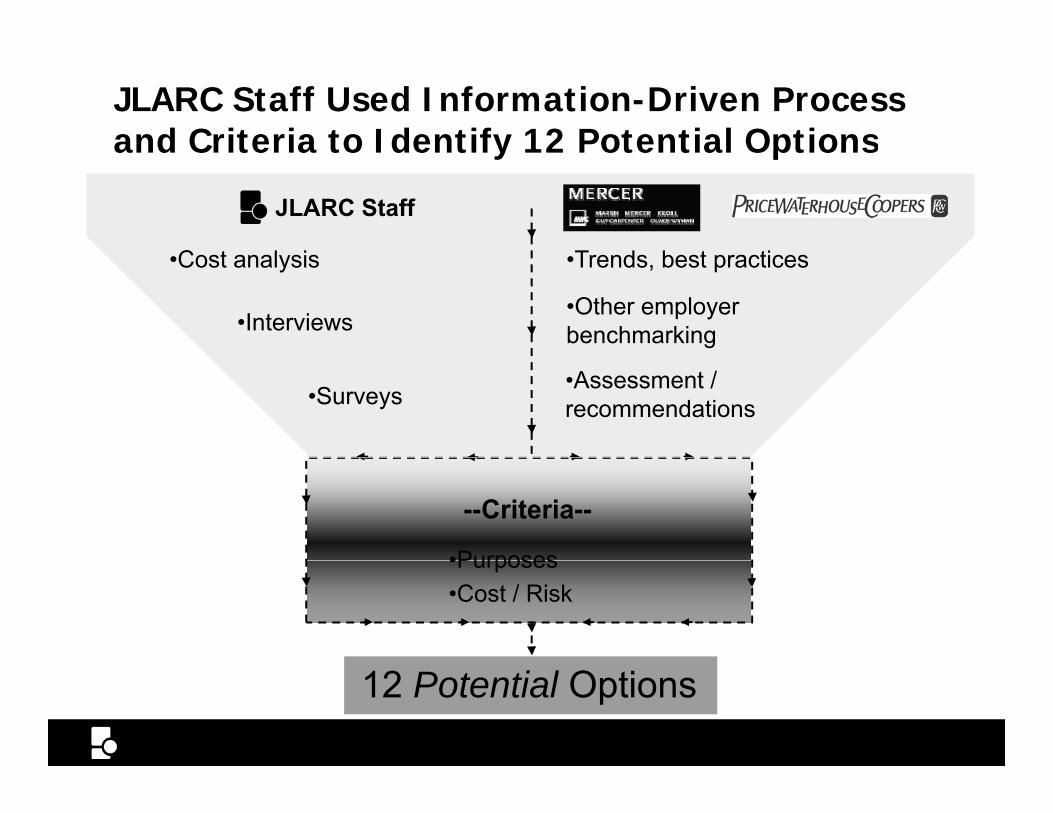
JLARC Staff Used Information-Driven Process and Criteria to Identify 12 Potential Options
JLARC Staff
C t l i T d b t ti
and Criteria to Identify 12 Potential Options
•Interviews
•Cost analysis •Trends, best practices
•Other employer benchmarking
•Surveys•Assessment / recommendations
--Criteria--
•Purposes•Purposes•Cost / Risk
JLARC 40
12 Potential Options
Finding
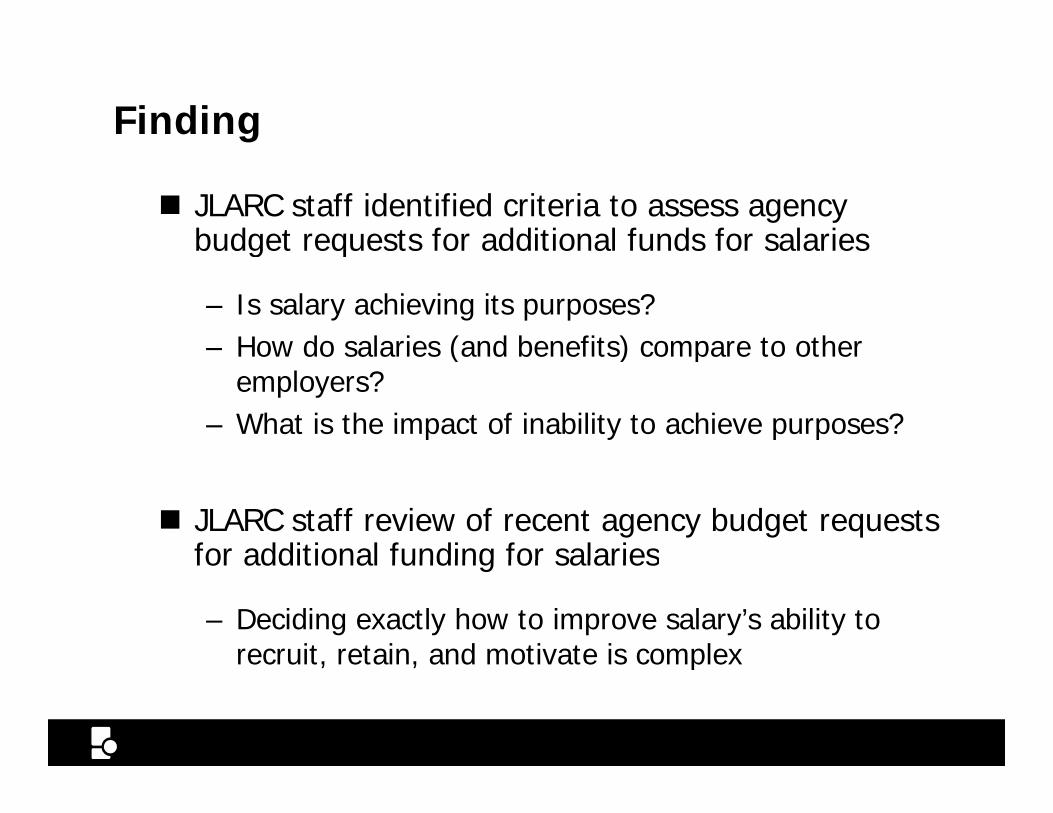
JLARC staff identified criteria to assess agency budget requests for additional funds for salariesg q
– Is salary achieving its purposes?– How do salaries (and benefits) compare to otherHow do salaries (and benefits) compare to other
employers?– What is the impact of inability to achieve purposes?
JLARC staff review of recent agency budget requests for additional funding for salariesfor additional funding for salaries
– Deciding exactly how to improve salary’s ability to recruit, retain, and motivate is complex
JLARC 41
recruit, retain, and motivate is complex
Salary
Recommendation
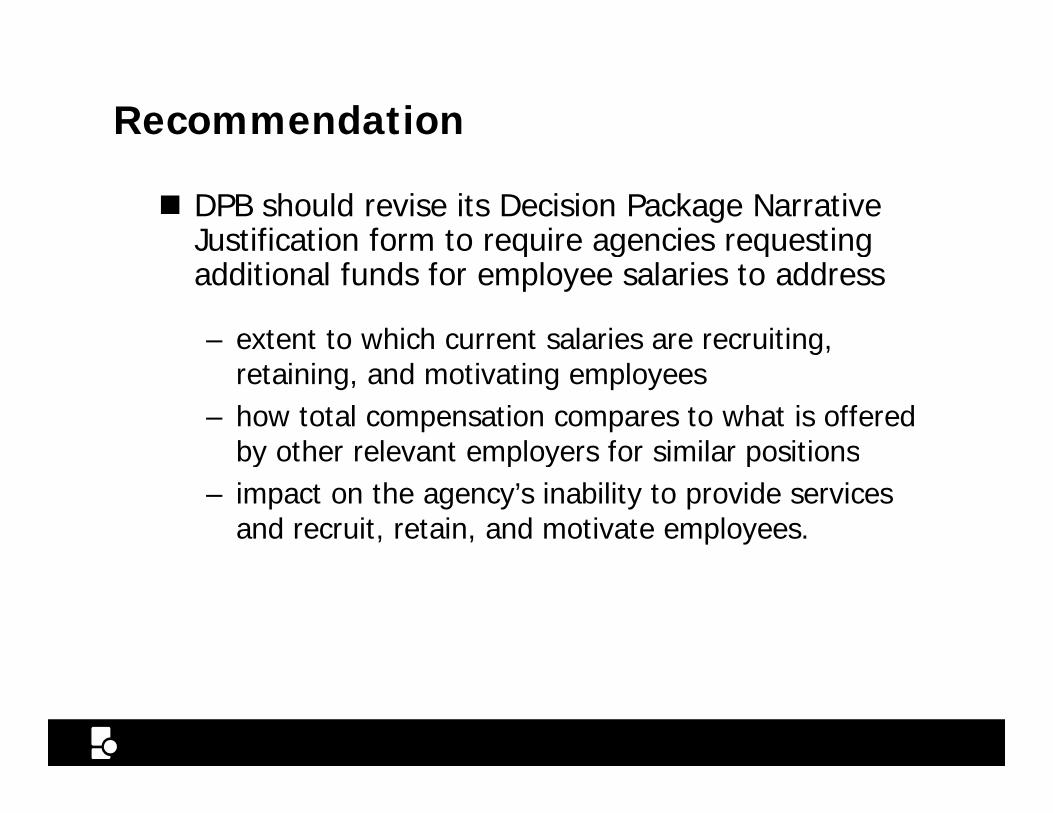
DPB should revise its Decision Package Narrative Justification form to require agencies requesting q g q gadditional funds for employee salaries to address
– extent to which current salaries are recruiting, retaining, and motivating employees
– how total compensation compares to what is offered by other relevant employers for similar positionsby other relevant employers for similar positions
– impact on the agency’s inability to provide services and recruit, retain, and motivate employees.
JLARC 42Salary
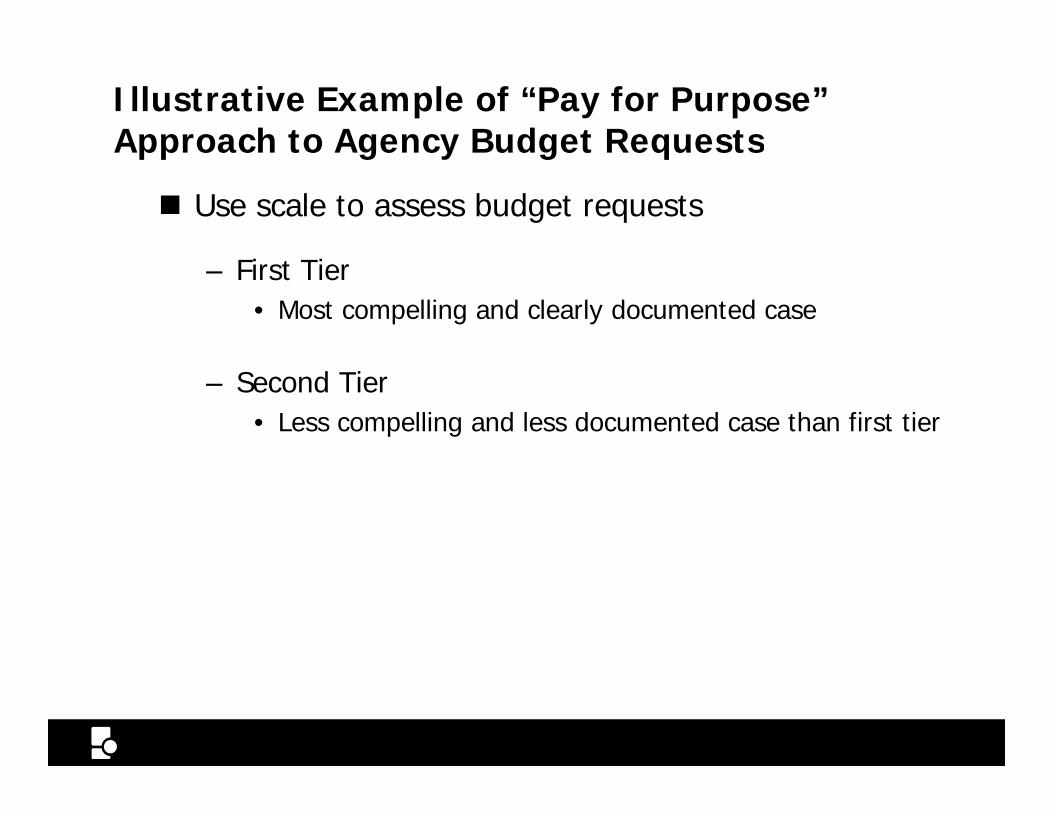
Illustrative Example of “Pay for Purpose” Approach to Agency Budget RequestsApproach to Agency Budget Requests
Use scale to assess budget requests
– First Tier • Most compelling and clearly documented case
– Second Tier • Less compelling and less documented case than first tier
JLARC 43Salary
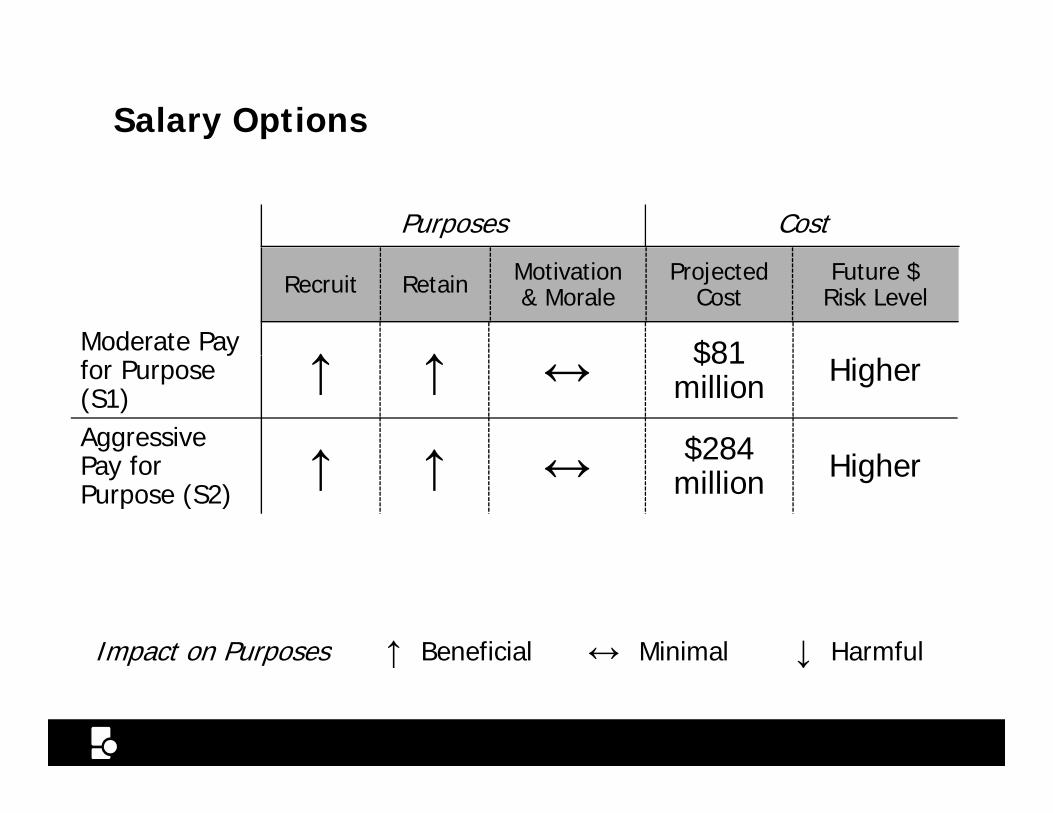
Salary Options
Purposes Cost
Recruit Retain Motivation & Morale
Projected Cost
Future $ Risk Level
Moderate Pay ↑ ↑ $81y
for Purpose (S1)
↑ ↑ ↔ $81 million Higher
Aggressive P f ↑ ↑ $284 Hi hPay for Purpose (S2)
↑ ↑ ↔ $284 million Higher
Impact on Purposes ↑ Beneficial ↔ Minimal ↓ Harmful
JLARC 44
p p ↑ ↓
Salary Options
Health Options Both Manage Future Growth of State CostsState Costs
Moderate (H1) to more aggressive (H2) options
Both options include changes that could be made to manage future cost growth
– Health plans require ongoing and active management each year
Illustrative examples of changes
– Plan design– Premium contributions– Health management
JLARC 45
– Health management
Health Options
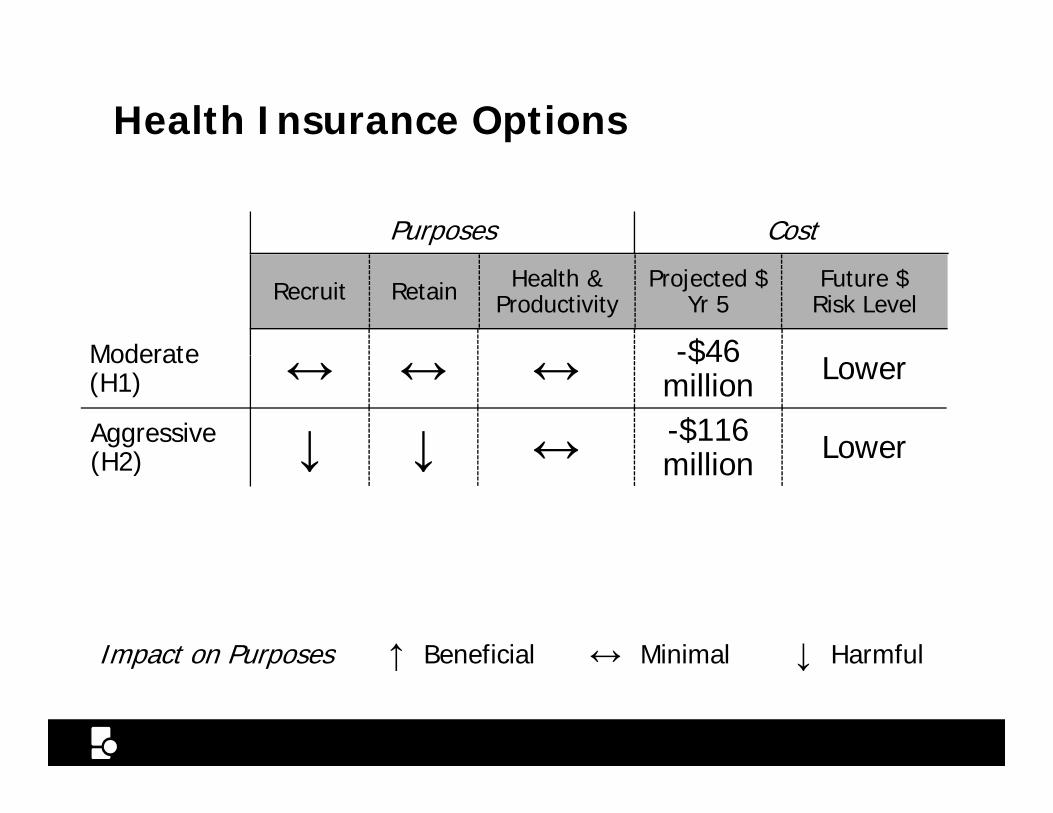
Health Insurance Options
Purposes Cost
Recruit Retain Health & Productivity
Projected $ Yr 5
Future $ Risk Level
Moderate -$46Moderate (H1) ↔ ↔ ↔ $46
million Lower
Aggressive (H2) ↓ ↓ ↔ -$116
million Lower(H2) ↓ ↓ ↔ million o e
Impact on Purposes ↑ Beneficial ↔ Minimal ↓ Harmful
JLARC 46Health Options
Impact on Purposes ↑ Beneficial Minimal ↓ Harmful
Two Groups of Retirement Options
Moderate Options
– Options for change within existing structure– Options R1 – R4
Aggressive Options
– Alternative retirement plan designs– Options R5 – R7
JLARC 47Retirement Options
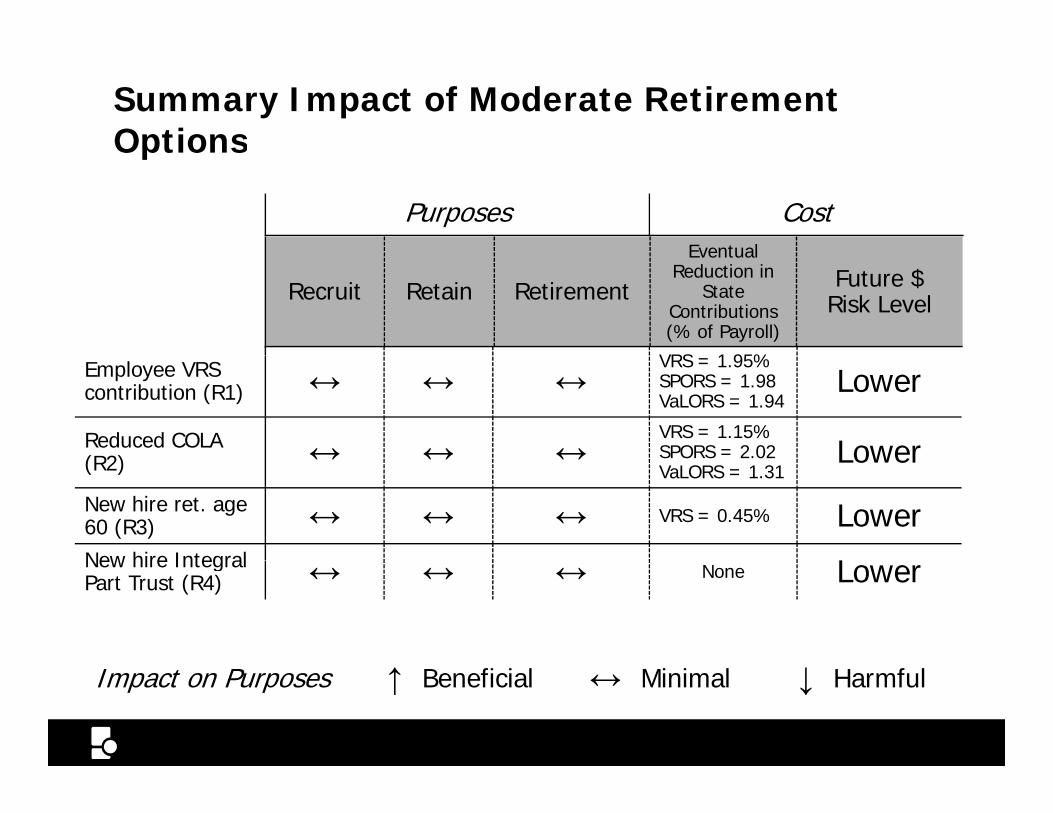
Summary Impact of Moderate Retirement OptionsOptions
Purposes CostEventual
Recruit Retain Retirement
Eventual Reduction in
State Contributions (% of Payroll)
Future $ Risk Level
VRS 1 95%Employee VRS contribution (R1) ↔ ↔ ↔
VRS = 1.95% SPORS = 1.98 VaLORS = 1.94
Lower
Reduced COLA (R2) ↔ ↔ ↔
VRS = 1.15% SPORS = 2.02 Lower(R2) ↔ ↔ ↔ SPORS 2.02 VaLORS = 1.31
LowerNew hire ret. age 60 (R3) ↔ ↔ ↔ VRS = 0.45% LowerNew hire Integral LNew hire Integral Part Trust (R4) ↔ ↔ ↔ None Lower
JLARC 48Moderate Retirement Options
Impact on Purposes ↑ Beneficial ↔ Minimal ↓ Harmful
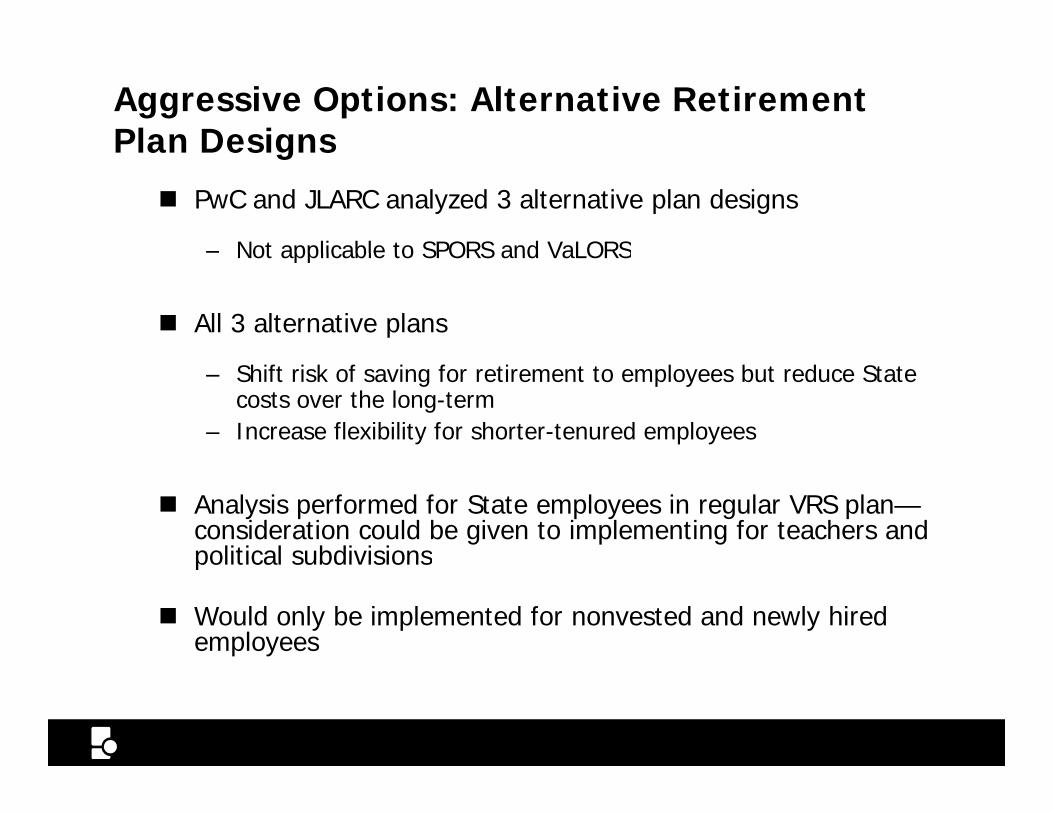
Aggressive Options: Alternative Retirement Plan DesignsPlan Designs
PwC and JLARC analyzed 3 alternative plan designs
– Not applicable to SPORS and VaLORSNot applicable to SPORS and VaLORS
All 3 alternative plans
– Shift risk of saving for retirement to employees but reduce State costs over the long-term
– Increase flexibility for shorter-tenured employees
Analysis performed for State employees in regular VRS plan—consideration could be given to implementing for teachers and political subdivisionspolitical subdivisions
Would only be implemented for nonvested and newly hired employees
JLARC 49Retirement Options
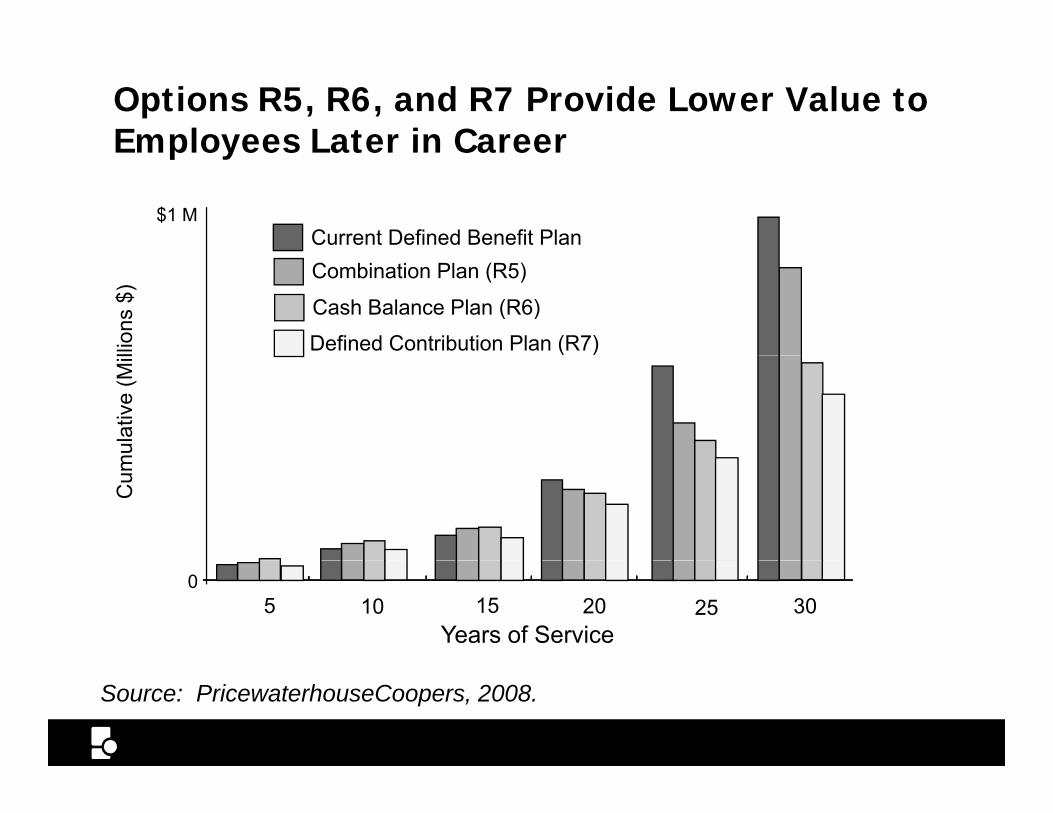
Options R5, R6, and R7 Provide Lower Value to Employees Later in CareerEmployees Later in Career
Current Defined Benefit Plan$1 M
Defined Contribution Plan (R7)
Cash Balance Plan (R6)
Combination Plan (R5)
llions
$)
mul
ativ
e (M
ilC
um
0
Years of Service305 10 15 20 25
JLARC 50
Source: PricewaterhouseCoopers, 2008.
Aggressive Retirement Options
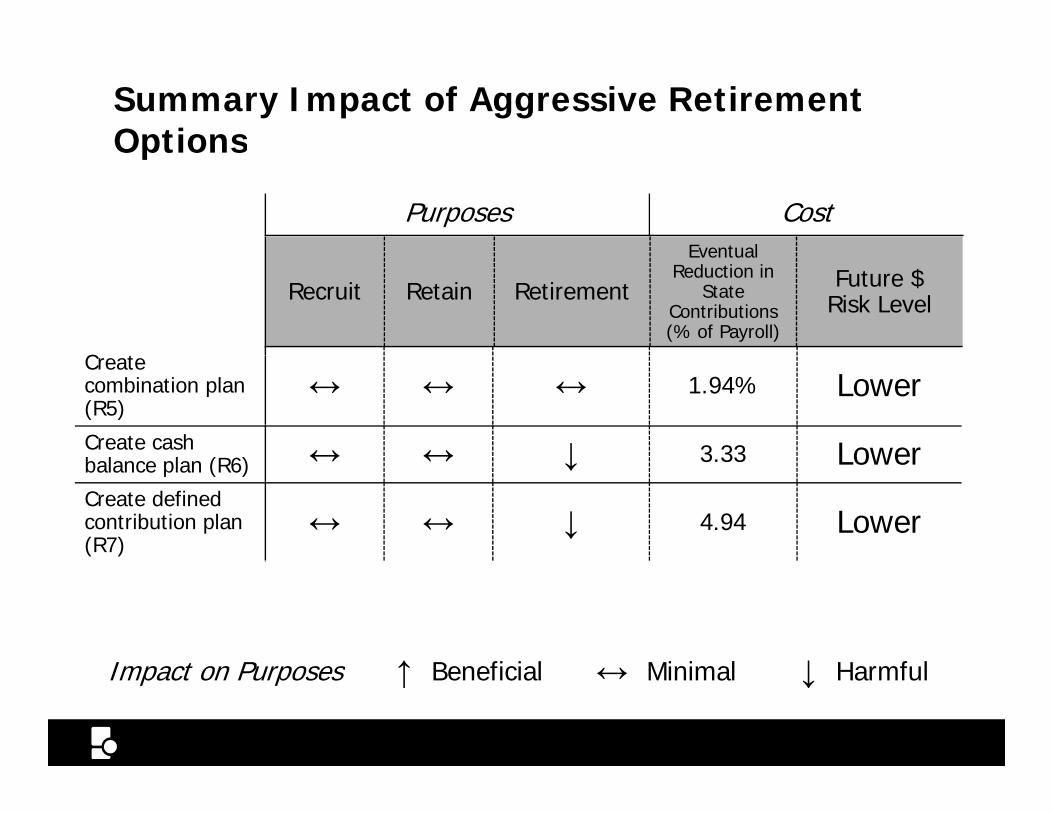
Summary Impact of Aggressive Retirement OptionsOptions
Purposes CostEventual
Recruit Retain Retirement
Eventual Reduction in
State Contributions (% of Payroll)
Future $ Risk Level
C tCreate combination plan (R5)
↔ ↔ ↔ 1.94% Lower
Create cash b l l (R6) ↔ ↔ ↓ 3 33 Lowerbalance plan (R6) ↔ ↔ ↓ 3.33 LowerCreate defined contribution plan (R7)
↔ ↔ ↓ 4.94 Lower
I t P ↑ B fi i l Mi i l ↓ H f l
JLARC 51Aggressive Retirement Options
Impact on Purposes ↑ Beneficial ↔ Minimal ↓ Harmful
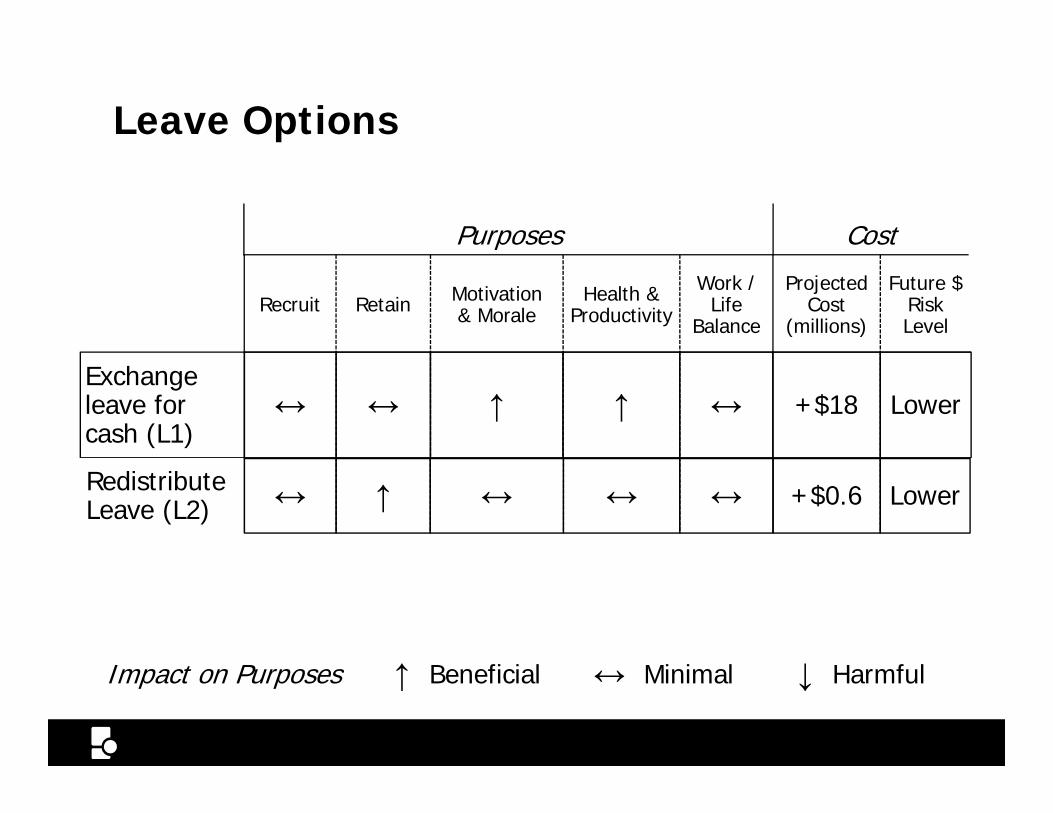
Leave Options
Purposes Cost
Recruit Retain Motivation & Morale
Health & Productivity
Work / Life
Balance
Projected Cost
(millions)
Future $ Risk Level
Exchange leave for cash (L1)
↔ ↔ ↑ ↑ ↔ +$18 Lower
Redistribute Leave (L2) ↔ ↑ ↔ ↔ ↔ +$0.6 Lower
f l l f l
JLARC 52Leave Options
Impact on Purposes ↑ Beneficial ↔ Minimal ↓ Harmful

In This Presentation
Background
Assessment of Total Compensation
Assessment of Major Total Compensation ElementsAssessment of Major Total Compensation Elements
Summary of Potential Options
Total Compensation Options
JLARC 53
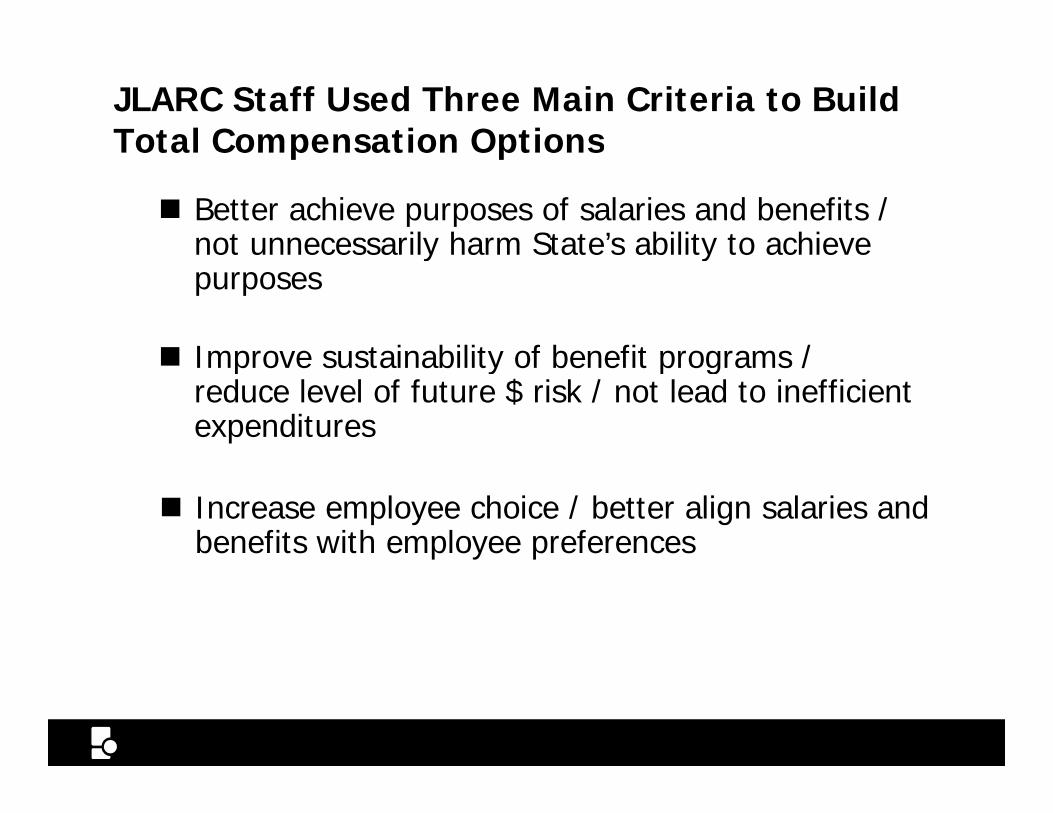
JLARC Staff Used Three Main Criteria to Build Total Compensation Options
Better achieve purposes of salaries and benefits / not unnecessarily harm State’s ability to achieve
Total Compensation Options
not unnecessarily harm State s ability to achieve purposes
Improve sustainability of benefit programs /Improve sustainability of benefit programs / reduce level of future $ risk / not lead to inefficient expenditures
Increase employee choice / better align salaries and benefits with employee preferences
JLARC 54
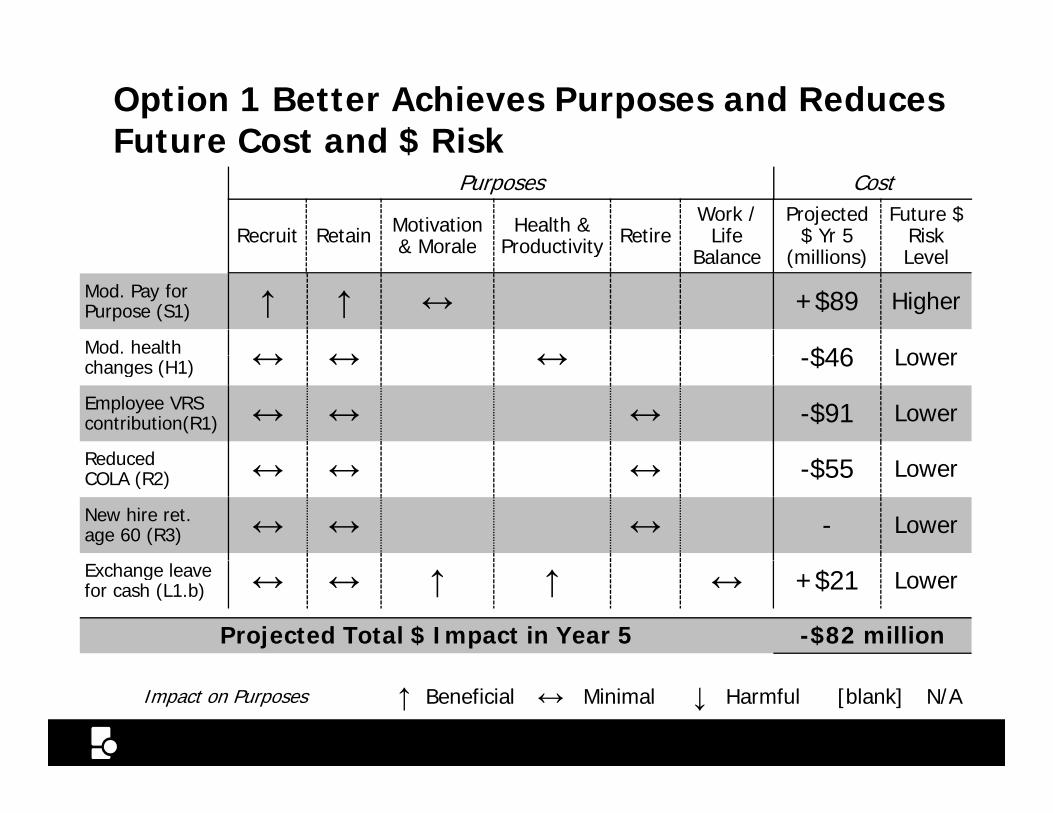
Option 1 Better Achieves Purposes and Reduces Future Cost and $ RiskFuture Cost and $ Risk
Purposes Cost
Recruit Retain Motivation & Morale
Health & Productivity Retire
Work / Life
Balance
Projected $ Yr 5
(millions)
Future $ Risk Le el
Mod. Pay for Purpose (S1) ↑ ↑ ↔ +$89 Higher
& Morale Productivity Balance (millions) Level
Mod. health ↔ ↔ ↔ $46 Lowerchanges (H1) ↔ ↔ ↔ -$46 Lower
Employee VRS contribution(R1) ↔ ↔ ↔ -$91 Lower
Reduced $Reduced COLA (R2) ↔ ↔ ↔ -$55 Lower
New hire ret. age 60 (R3) ↔ ↔ ↔ - Lower
Exchange leave for cash (L1.b) ↔ ↔ ↑ ↑ ↔ +$21 Lower
Projected Total $ Impact in Year 5 -$82 million
JLARC 55
Impact on Purposes ↑ Beneficial ↔ Minimal ↓ Harmful [blank] N/A
TOTAL COMPENSATION OPTION 1
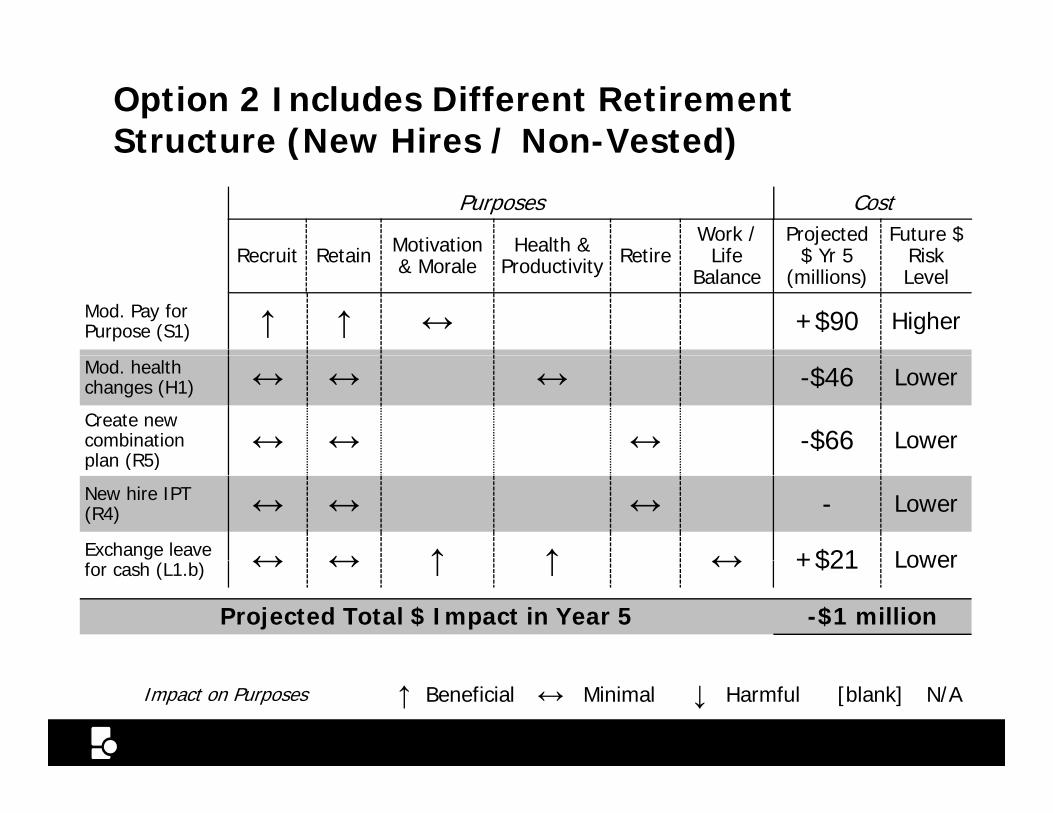
Option 2 Includes Different Retirement Structure (New Hires / Non-Vested)Structure (New Hires / Non Vested)
Purposes Cost
Recruit Retain Motivation Health & RetireWork /
LifeProjected
$ Yr 5Future $
Risk
Mod. Pay for Purpose (S1) ↑ ↑ ↔ +$90 Higher
Recruit Retain & Morale Productivity Retire Life Balance
$ Yr 5 (millions)
Risk Level
Mod. health changes (H1) ↔ ↔ ↔ -$46 Lower
Create new combination plan (R5)
↔ ↔ ↔ -$66 Lowerplan (R5)
New hire IPT (R4) ↔ ↔ ↔ - Lower
Exchange leave ↔ ↔ ↑ ↑ ↔ +$21 Lowerfor cash (L1.b) ↔ ↔ ↑ ↑ ↔ +$21 Lower
Projected Total $ Impact in Year 5 -$1 million
JLARC 56
Impact on Purposes ↑ Beneficial ↔ Minimal ↓ Harmful [blank] N/A
TOTAL COMPENSATION OPTION 2
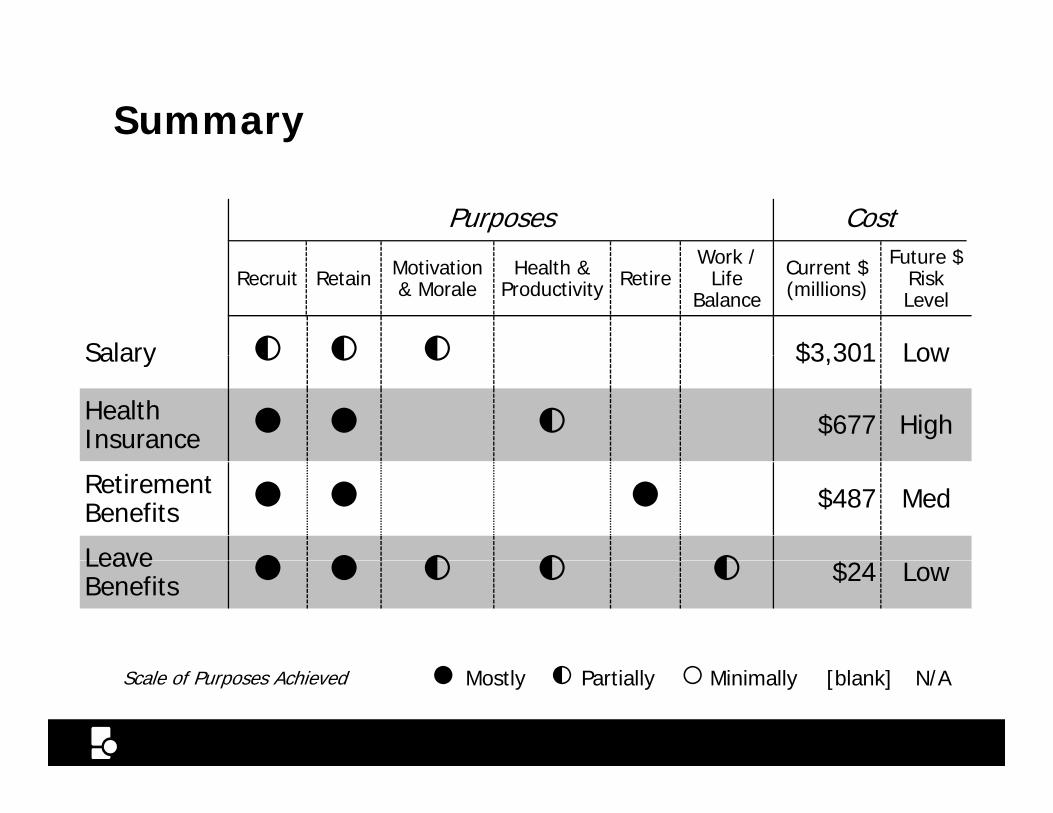
Summary
Work / Future $
Purposes Cost
Salary ◐ ◐ ◐ $3 301 Low
Recruit Retain Motivation & Morale
Health & Productivity Retire
Work / Life
Balance
Current $ (millions)
Future $ Risk Level
Salary ◐ ◐ ◐ $3,301 Low
Health Insurance ● ● ◐ $677 High
Retirement Benefits ● ● ● $487 Med
Leave ● ● ◐ ◐ ◐ $Leave Benefits ● ● ◐ ◐ ◐ $24 Low
JLARC 57
Scale of Purposes Achieved ● Mostly ◐ Partially ○Minimally [blank] N/A
Summary Assessment
JLARC Staff for This Report
Glen Tittermary, Deputy Director Justin Brown, Project Leader u o , oj adTrish Bishop Christine Wolfe
S hTracey Smith Janice Baab Mark GribbinMark Gribbin Shannon White
For More Information
htt //jl t t (804) 786 1258
JLARC 58
http://jlarc.state.va.us (804) 786-1258