Embed Size (px)
Citation preview

Review of the Big River Steel Incentive Proposal A Market Viability and Cost-Benefit Analysis
Prepared by: IHS, Inc.
1150 Connecticut Avenue NW Suite 401
Washington DC 20036
March 2013

Review of the Big River Steel Incentive Proposal A Market Viability and Cost-Benefit Analysis
IHS Page 2
About IHS (www.ihs.com) IHS (NYSE: IHS) is a leading source of information and insight in critical areas that shape today’s business landscape, including energy and power; design and supply chains; defense, risk and security; environmental, health, safety and sustainability; country and industry forecasting; and commodities, pricing and cost. IHS has been in business since 1959 and became a publicly traded company on the New York Stock Exchange in 2005. Headquartered in Englewood, Colorado, USA, IHS employs more than 5,100 people in more than 30 countries.
About IHS Global Insight IHS Global Insight is one of the leading economic analysis and forecasting firms, with an established track record for providing rigorous, objective data and forecast analysis to governments and businesses around the world. Among its areas of expertise are the economic impact, tax implications, and job-creation dynamics of multiple industry sectors core to national, state and local economies. Through our comprehensive data and modeling framework, IHS Global Insight helps companies and governments at all levels interpret the impact of proposed investments, policies, programs, and projects.
For more information, contact:
Brendan O’Neil Managing Director, Economic and Country Risk, IHS Consulting
(202) 481-9239
For press information, contact:
Jim Dorsey Senior Manager Media Relations, IHS Global Insight
COPYRIGHT NOTICE AND LEGAL DISCLAIMER
© 2013 IHS. No portion of [this report/these materials] may be reproduced, reused, or otherwise distributed
in any form without prior written consent, with the exception of any internal client distribution as may be
permitted in the license agreement between client and IHS. Content reproduced or redistributed with IHS
permission must display IHS legal notices and attributions of authorship. The information contained herein is
from sources considered reliable but its accuracy and completeness are not warranted, nor are the opinions
and analyses which are based upon it, and to the extent permitted by law, IHS shall not be liable for any
errors or omissions or any loss, damage or expense incurred by reliance on information or any statement
contained herein. For more information, please contact IHS at [email protected], +1 800 IHS CARE
(from North American locations), or +44 (0) 1344 328 300 (from outside North America). All products,
company names or other marks appearing in this publication are the trademarks and property of IHS or their
respective owners.
Review of the Big River Steel Incentive Proposal A Market Viability and Cost-Benefit Analysis
IHS Page 3
Project Directors
Phil Hopkins, Director, Economic & Public Sector Consulting
John Anton, Director, Steel Services
Project Team:
Paul Robinson, Senior Economist, Steel Services
Tasmina Ahmed, Analyst, Economics & Public Sector Consulting
Ana Orozco, Principal Economist, US Regional Economics Group
Mohsen Bonakdarpour, Managing Director, Economics & Public Sector Consulting
Contributors
Tabitha M. Bailey, Director, Economics & Public Sector Consulting
Brendan O’Neil, Managing Director, Economics & Public Sector Consulting
This report offers an independent assessment of the proposed Big River Steel Project. IHS is exclusively responsible for this report and all of the analysis and content contained herein. The analysis and metrics developed during the course of this research represent the independent views of IHS.
Review of the Big River Steel Incentive Proposal A Market Viability and Cost-Benefit Analysis
IHS Page 4
Table of Contents
Executive Summary ................................................................................................................. 5 Project Background ......................................................................................................................................... 5
Economic Viability of the Big River Steel Plant ................................................................................................ 5
Steel Market Sizing ...................................................................................................................................... 5
Financial Cost-Benefit Analysis ................................................................................................................... 6
Background and Purpose of Study .......................................................................................... 8
Project Description and Costs ................................................................................................. 9
Steel Facilities Description ............................................................................................................................... 9
Capital Costs .................................................................................................................................................... 9
Economic Incentives ............................................................................................................. 11
Grants and Loans from Arkansas and Local Governments ............................................................................ 11
Advantage Arkansas Program ....................................................................................................................... 11
Recycling Equipment Tax Credit .................................................................................................................... 11
Tax Back Program .......................................................................................................................................... 11
Customized Training Incentives ..................................................................................................................... 12
Sales and Use Tax Exemptions ...................................................................................................................... 12
Purchases of Machinery and Equipment .................................................................................................. 12
Purchase of Utilities .................................................................................................................................. 12
Steel Plant Economic Feasibility Analysis ............................................................................. 13
Market Sizing ................................................................................................................................................. 13
End Market Strength ................................................................................................................................. 13
Product Competition (Domestic and Import) ........................................................................................... 15
Export Possibilities .................................................................................................................................... 22
Long Term Viability of the Plant .................................................................................................................... 24
Zero Sum vs. Non-Zero Sum Production ................................................................................................... 24
Profitability ................................................................................................................................................ 25
Cost-Benefit Analysis ............................................................................................................ 27
Types of Costs ................................................................................................................................................ 27
Types of Benefits ........................................................................................................................................... 28
Results of the AEDC’s Cost-Benefit Analysis .................................................................................................. 29
IHS Global Insight’s Cost-Benefit Analysis ..................................................................................................... 32
Appendix A. Product Breakout Forecasts ............................................................................. 35
Appendix B: Auto Production Plant Locations ...................................................................... 38

Review of the Big River Steel Incentive Proposal A Market Viability and Cost-Benefit Analysis
IHS Page 5
Executive Summary
Project Background Amid the languid economic recovery from the Great Recession, public and private economic
development organizations are actively using incentives to attract employers that promise
sustainable, higher wage jobs while also capable of developing a network of local suppliers. Big
River Steel (BRS) proposes to build a $1.1 billion electric arc furnace (EAF) steel mill in Mississippi
County in northeast Arkansas. The proposed plant will be located on a 1,140-acre site about seven
miles southeast of the City of Osceola with frontage on the Mississippi River, have an initial annual
production capacity of 1.7 million short tons per year and create 525 full-time jobs.
Amendment 82 of the Arkansas Constitution enables the General Assembly to authorize the
issuance of general obligation (GO) bonds to attract large economic development projects having a
minimum investment of $500 million and creating at least 500 permanent jobs with an average
annual salary of at least $70,000. The State is considering Amendment 82 bonds to support the
development of the BRS Project. In order for the General Assembly to evaluate the bond issue, the
Arkansas Economic Development Commission (AEDC) has conducted a cost-benefit analysis of the
proposed incentive package that solely considers the costs incurred and benefits accrued by the
State. Amendment 82 grants the State the option to hire independent consultants to perform a
third party review of the AEDC’s cost-benefit analysis. IHS Global Insight (IHS) was retained by the
State of Arkansas to perform such a review, focusing on two areas: 1) the long-term economic
viability of the proposed BRS plant; and 2) the benefit-cost analysis performed by the AEDC. The
results of IHS Global Insight’s review are summarized below.
The economic incentive package being considered will consist of a $125 million GO bond issue with
two components: 1) a $75 million issue to pay for site improvements and 2) $50 million as a low-
interest loan to BRS. The State will also provide other types of economic incentives in form of tax
credits, deductions, and refunds and in-kind services. The major incentive being considered is a
credit against the State’s corporate income tax under the Recycling Equipment Tax Credit Program
that has a potential value of up to $216 million. Other incentives under consideration include: the
Arkansas Advantage Program; Tax Back Program; provision of $10 million in customized job
training; and exemptions to or refunds of the sales and use tax for purchases of equipment,
materials, electricity and natural gas. Further detail on the economic incentives is provided in the
full IHS report.
Economic Viability of the Big River Steel Plant
Steel Market Sizing
To determine the long term viability of Big River Steel, IHS assessed the potential market size for
the products the facility will produce. Over the next ten years, IHS research indicates the largest
total addressable US market available to BRS for its steel products is slightly less than 9 million
short tons. We define the market size opportunity for BRS as steel consumption in excess of pre-

Review of the Big River Steel Incentive Proposal A Market Viability and Cost-Benefit Analysis
IHS Page 6
recession levels and some portion of non-NAFTA imports that depend on the individual dynamics
of each market defined below. Each market is assessed based on our ten year forecast (i.e. market
conditions in 2023).
Using IHS estimates of operating costs for electric arc furnace facilities in the United States, we
expect an industry-wide average operating profit of $90/ton over the next decade. This equates to
an operating margin of 12%, based on our price and cost estimations. Projected BRS capital cost
figures are in line with comparable facilities built in recent years.
The steel industry can absorb the addition of Big River Steel, both Phase I and Phase II, from a
capacity perspective. However, if any other major facilities, other than projects already
announced, were to be added to the US steel stock, the industry would quickly find itself in a highly
competitive, zero-sum environment. If this occurs, the BRS production goals and operating margins
are not achieved. While decreasing margins will affect profits and corporate income taxes, the real
threat to not having a positive benefit-cost ratio is the level of production; if these decline, then
the indirect and induced effects decline, which drags down tax revenues.
Financial Cost-Benefit Analysis
The AEDC performed two cost-benefit scenarios that included the $10 million in job training
services: 1) a 20-year analysis with no early payoff of the $50 million incentive loan; and 2) a 20-
year analysis with an early payoff. The AEDC’s analysis estimated positive net economic benefits,
on a net present value basis (NPV), for both combinations, ranging from $54.2 million for the
former to $49.8 million for the latter. The AEDC did not provide any detail on the specific types and
values of the individual benefits in its report, but nonetheless identified and described the general
methodologies employed in a written response requested by IHS. In our judgment, the types of
benefits and costs considered in the AEDC cost-benefit analysis were appropriate, and to the best
of our judgment, the methodologies were sound. The AEDC also employed generally conservative
assumptions so as not to overestimate the benefits or underestimate the costs.
IHS asserts that the AEDC has, to some extent, overestimated the long-term, net economic
benefits of the incentives being considered for the BRS project, primarily because they did not fully
consider the uncertainties that surround some of the key assumptions identified in the following
paragraph. These uncertainties could negatively impact the project’s net economic benefits or
possibly result in costs exceeding benefits. IHS agrees with AEDC’s finding that modest net
economic benefits are likely to be generated from the incentive package if the BRS plant operates
consistently at the projected levels of employment and output, and achieves the operating margin
noted above. However, there is at least some chance that costs could exceed benefits if these
operating criteria are unmet and other uncertainties (see paragraph below) emerge. We
recommend the AEDC conduct additional sensitivity analyses to determine the extent to which
these uncertainties would significantly reduce the benefits or result in the State incurring higher
net costs for the benefit package being considered. The State has appropriately inserted claw back
and penalty language in its offer letter to recover costs if BRS does not meet defined performance
criteria.

Review of the Big River Steel Incentive Proposal A Market Viability and Cost-Benefit Analysis
IHS Page 7
The major sources of uncertainty affecting the cost-benefit analysis are: 1) the likelihood that the
BRS plant will operate consistently at the projected levels of production and employment so as to
yield the overall economic impacts and attendant increases in tax revenues necessary to pay off
the bonds; 2) the large size and timing of the Recycling Equipment tax credit which will prevent the
State from receiving any increase in corporate income tax revenues until late in the project; 3) the
share of inputs and supplies that will be purchased from Arkansas vendors during operations; and
4) the share of BRS’s income that will be subject to the corporate income tax since the majority of
the BRS plant’s production will be sold out of state. Other variables, such as the effective tax rates,
are also uncertain and will affect the level of tax revenues generated by the project.
IHS’ cost-benefit analysis yielded slightly lower net economic benefits than those estimated by the
AEDC, and in certain scenarios resulted in costs exceeding benefits. Our baseline scenario that
attempted to mirror AEDC’s analysis yielded positive net economic benefits with an NPV of +$50.4
million using the 3% discount rate, and +$30.13 million using a 5% discount rate. The AEDC did not
indicate the discount rate they used; the bond schedule indicates the State’s current cost of capital
is 3%. If AEDC used a 5% discount rate, then the net benefits of our baseline scenario are about
half the AEDC estimate; if AEDC used a 3% discount rate, our baseline results are similar.
IHS then performed a variety of sensitivity analyses to evaluate the areas of uncertainty by
decreasing performance (i.e., lowering the capacity utilization factor, allowing for a ramp up in
production, decreasing effective tax rates, changing growth rates in prices, etc.) to evaluate the
downside risk. In virtually all scenarios the net economic benefits were barely positive and in some
cases costs exceeded benefits.

Review of the Big River Steel Incentive Proposal A Market Viability and Cost-Benefit Analysis
IHS Page 8
Background and Purpose of Study The purpose of this study is to review the benefit cost analysis of the proposed Big River Steel
(BRS) project prepared by the Arkansas Economic Development Commission (AEDC). Legislative
review of the proposed development is required pursuant to Amendment 82 of the Arkansas
Constitution enabling the State to provide financing for qualified economic development projects.
IHS Global Insight’s review of AEDC’s assessment considers two issues: 1) the long-term economic
viability of the BRS project and whether the tax revenues generated by project-related economic
activity are sufficient to generate the tax revenues needed to repay the State for its investment;
and 2) the results of the benefit cost analysis prepared by the AEDC which concluded that there
would be positive, net economic benefits for the state.
The proposed BRS Plant would be located on an approximately 1,200 acres site in Mississippi
County in the northeast corner of the State, about 7 miles southeast of the City of Osceola.
Development of the proposed steel electric arc furnace would have a total capital cost of
approximately $1.1 billion. Once operations commence in calendar year 2016, phase 1 of the
proposed plant would have an annual production capacity of 1.7 million short tons, and create 525
full time jobs paying an average annual salary of $75,000. An additional 1.7 million tons of
production capacity may be installed in subsequent years depending on market conditions. Both
AEDC’s analysis and IHS Global Insight’s review consider only phase 1.
Amendment 82 authorizes the State of Arkansas to borrow money using general obligation bonds
(GO) and use the proceeds to help finance a portion of the capital costs of a “superproject”
specifically, a big employer that will invest at minimum $500 million and employ at minimum 500
people. The financing is intended to support start-up costs incurred by the beneficiary company. In
addition, state and local governments in Arkansas can provide additional economic incentives in
the form of tax credits, tax exemptions, tax refunds and grants.
In reviewing the incentives provided by the state and local governments of Arkansas, IHS Global
Insight also evaluates the perceived benefits and costs incurred by the state and local governments
of Arkansas. Ultimately, in order for the Big River Steel Project to receive any public funding, it will
need the Arkansas Legislature’s approval. If the legislature concludes that the Big River Project will
fulfill both the investment and job creation requirement as set forth by Amendment 82, only then
will it make funds available to the company. IHS Global Insight makes recommendations based on
its review of the AEDC’s analysis and commentary on the economic viability of the proposed steel
plant.
Review of the Big River Steel Incentive Proposal A Market Viability and Cost-Benefit Analysis
IHS Page 9
Project Description and Costs
Steel Facilities Description BRS is proposing a new steel mill in Arkansas that will use the electric arc furnace method of
steelmaking – which recycles steel scrap rather than melting virgin iron ore – to produce various
flat-rolled products. The company hopes to implement two separate phases of construction, each
involving 1.7 million short tons of annual capacity. If both phases are implemented, BRS would be
capable of producing 3.4 million short tons of steel in total.
The facility is equipped to produce four categories of steel products: hot-rolled carbon sheet, cold-
reduced carbon sheet, hot-dipped galvanized sheet, and electrical steel (both grain-oriented and
non-grain-oriented). Electrical steel capabilities would not be added until Phase II, when the
necessary equipment is added to the facility. All are considered flat-rolled products, meaning that
they are wider than they are thick, as opposed to long products which are longer than they are
wide.
Hot-rolled carbon sheet is the most commodity grade of flat-rolled steel products, serving nearly
every major end market in at least some capacity, but focused on the automotive industry.
Cold-reduced carbon sheet is similar to hot-rolled in every respect, except that it is rolled into
shape at cooler temperatures, which improves the strength and finish. This in turn allows cold-
reduced carbon sheet to be used in more demanding applications in both the automotive and
construction sectors, among others.
Hot-dipped galvanized sheet is the result of applying a thin layer of zinc coating to either hot-rolled
or cold-reduced sheet steel. The inclusion of zinc increases steel’s corrosive resistivity, allowing it
to be used in more demanding environments like the exposed steel on automobiles.
Electrical steel is an alloy steel that includes silicon to make steel more electrically resistive.
Subsequently, this means steel can be used in more electrically demanding environments such as
transformers and motors where electrical current is often present.
Capital Costs The initial capital cost estimates for the BRS facility, estimated at $1.1 billion, are consistent with
comparable facilities recently built in the United States. Specifically, the Severstal facility in
Columbus, Mississippi, in which lead BRS developer John Correnti was also involved, is almost the
exact same capacity and was built for $880 million from 2005 to 2008.1 The project shared the two
phase approach, capacity expectations, project length, targeted end markets, and management
team.
1 http://www.severstalna.com/files/315/SNAComms_Information%20Kit%202012-13.pdf

Review of the Big River Steel Incentive Proposal A Market Viability and Cost-Benefit Analysis
IHS Page 10
The second phase of the Columbus facility was completed four years after the first phase at a cost
of $550 million. Severstal required an additional $100 million in financing for the deal, although it
is unclear if the funding was related to project cost overruns or cash flow issues during the
recession (the funding was raised in October 2008, during the peak of the financial market
lockup).2 In total, for capital projects, the management of BRS has a good record in keeping costs in
line with expectations.
The similarities among these two projects, coupled with the success of the Columbus facility from a
capital cost and project time perspective, leads us to view the estimated capital costs for the Big
River Steel Facility as reasonable.
With respect to estimated job creation, Severstal Columbus employs 545 workers at an average
salary of $72,000 after starting with just 50 industry veterans. These statistics are almost identical
to the promises of the BRS management team, at 525 jobs at $75,000 average salary with 50
industry veterans.
Source: History, Bureau of Labor Statistics; Forecast, IHS.
The $50/hour construction labor cost estimate is above the latest estimates of the United States
Bureau of Labor Statistics for Heavy and Civil Construction Labor.3
Other recent steel facilities built in the United States are inferior points of comparison. The
ThyssenKrupp facility at Calvert Alabama is not a fair comparison because it is a part of a large
global supply chain – a “virtual integrated mill” as the company terms it – that was produced at a
much higher planned capital cost. The electric arc furnace production method utilized at the
Columbus facility and the planned Big River Steel facility is much less capital intensive.
Bottom Line: The capital cost estimates laid out by Big River Steel are consistent with similar
facilities constructed in recent years.
2 http://www.bloomberg.com/apps/news?pid=newsarchive&sid=a7PonFs8GEME
3 BRS Site Plan and Facility Descriptions
10
15
20
25
30
35
40
2000 2003 2006 2009 2012 2015 2018 2021
Avg Hourly Earnings, Construction & Civil Engineering
Construction Wages Well Below $50/hr
(Dollars/Hour)

Review of the Big River Steel Incentive Proposal A Market Viability and Cost-Benefit Analysis
IHS Page 11
Economic Incentives This section briefly describes the package of economic development incentives that the State of
Arkansas is considering providing to the project’s sponsor – Big River Steel.
Grants and Loans from Arkansas and Local Governments Contingent upon the requisite legislative approvals, Arkansas will issue Amendment 82 general
obligation (GO) bonds with a 20-year term to raise $125 million to pay for some of the capital costs
of the BRS Project in Mississippi County. The $75 million bond issue will be used for qualified site
preparation costs and piling costs. The State will also provide a $50 million incentive loan, which
will be used for the purchase of qualifying assets. An additional $14 million in grants will be
provided from two local governments; the city of Osceola will provide a $2 million grant and
Mississippi County will contribute $12 million. Mississippi County will receive a fixed annual
payment in lieu of taxes (PILOT) of $3.5 million over the 20 year term of the GO bonds.
Advantage Arkansas Program The Advantage Arkansas program provides an Arkansas income tax credit based upon a percentage
of the annual payroll paid to the new full-time permanent employees hired at BRS. The program
allows for a 4% income tax return on total net new payroll for jobs created in Mississippi County.
The income tax credit begins in which the new employees are hired and is earned each tax year for
a period of 5 years.
Recycling Equipment Tax Credit
As per Act 654 of 1993, the State of Arkansas provides for a tax credit of 30% of the cost of
equipment and installation costs used for the reduction, reuse or recycling of solid waste material
for commercial purposes. Since the proposed plant would use scrap metal, the equipment used in
its production process would qualify. This tax credit could be worth approximately $216 million
($721 million in projected equipment costs including installation times 30%) to BRS if they are able
to use all of it. The credit is earned in the year in which the purchase of eligible equipment is made.
The State of Arkansas is considering extending the current carry forward period from 3 years to 14
years, so that project’s sponsor would have a period of fifteen years in which to claim the credit.
Recipients of this tax credit are not entitled to any other state or local tax credit or deduction for
the purchase of machinery and equipment.
Tax Back Program The Tax Back Program provides a refund of a portion of the sales and use taxes paid on the
purchase of material used in the construction of a commercial project, and also for purchase of
eligible equipment. The current Arkansas sales and use tax rate is 6%, but the refund would be only
5% of the purchase costs. The refund of local sales and use taxes will be based on the rates that are
imposed in the host county and municipality. Mississippi County currently imposes a 2% sales and
use tax, while the City of Osceola imposes a 1% tax. The proposed steel plant would be located
about 7 miles southeast of the City of Osceola.

Review of the Big River Steel Incentive Proposal A Market Viability and Cost-Benefit Analysis
IHS Page 12
Customized Training Incentives The state of Arkansas will provide $10 million worth of training services during the first two years
of the construction project. Funds are applicable to costs associated with training BRS’s workforce
and will be spread equally over a two year period.
Sales and Use Tax Exemptions
Purchases of Machinery and Equipment
Manufacturing machinery and equipment that is purchased for use in a new manufacturing facility
in Arkansas are exempt from the sales and use tax. The incentive excludes the purchase of
pollution control equipment. Machinery and equipment for which a tax credit is obtained under
the Recycling Equipment Tax Credit program discussed above would not be eligible to receive this
tax exemption.
Purchase of Utilities
The State of Arkansas currently imposes a reduced sales and use tax rate of 2.75% for the purchase
of electricity and natural gas used in a manufacturing process. They are considering exempting all
electric and natural gas purchases from the sales and use tax for steel mills that invest at least
$500 million, and create at least 300 new jobs with an average annual wage of at least $70,000
(i.e., the proposed BRS Plant).
Understanding the types and values of the incentives being considered is necessary to determine if
the long-term economic benefits that will be received by the State of Arkansas produced by the
construction and operation of BRS Project will exceed the costs incurred by the State, or vice versa.
The State of Arkansas has provided penalty or claw back provisions in most of the incentives
described above, especially for the two bond issues, in order to recapture most or all of the value
of the incentive provided if BRS does not meet the performance criteria for each incentive.

Review of the Big River Steel Incentive Proposal A Market Viability and Cost-Benefit Analysis
IHS Page 13
Steel Plant Economic Feasibility Analysis This section evaluates the economic feasibility of the proposed BRS Project. State tax revenues
that flow from the direct, indirect, and induced increases in economic activity generated by the
plant’s operation will be used to reimburse the State for the costs of the incentives it provides. As
a result, the projected economic feasibility of the proposed BRS plant is crucial in evaluating
whether the State should offer the proposed incentive package to BRS.
Market Sizing
End Market Strength
BRS proposes primarily targeting two steel end markets: energy and automotive. These two
markets are among the strongest for steel and represent the most promise for growth beyond pre-
2008 production levels.
Source: History, American Iron and Steel Institute; Forecast, IHS
Source: History, American Iron and Steel Institute; Forecast, IHS.
Automotive Sector Outlook
The United States is among the largest producers of vehicles in the world, and one of the world's
largest automotive manufacturing hubs has long been established in the Detroit area. Four states
comprise the bulk of automotive manufacturing jobs in the United States: Michigan, Ohio, Indiana,
0
1
2
3
4
5
2000 2003 2006 2009 2012 2015 2018 2021
Shipments of Steel to the Energy Sector
Energy Sector Steel Demand to Rise
(Millions of Short Tons, Annual Rate)
5
10
15
20
2000 2003 2006 2009 2012 2015 2018 2021
Shipments of Steel to the Automotive Sector
Auto Sector Demand Pauses Until 2016
(Millions of Short Tons, Annual Rate)

Review of the Big River Steel Incentive Proposal A Market Viability and Cost-Benefit Analysis
IHS Page 14
and Illinois. Over the past three decades the US auto manufacturing base has grown in other areas,
to the detriment of these four states. Southeast Michigan bears the hallmarks of an industry in
decline, with U.S. automakers cutting capacity, closing plants and shifting production to lower cost
manufacturing locations overseas. Meanwhile European and Asian automakers have better access
to local production and to the local markets, opening production facilities in North America
(referred to as “transplants”).These transplants are newer, more modern facilities in the southern
states, which are far less unionized and better able to adapt their production schedules to volatile
demand levels.
North American production suffered greatly during the most recent recession. Production was
strong in 2007 with volumes above 15 million units. However, it slipped 16% in 2008 before
plummeting further in 2009. The strong 15 million unit volume across North American that existed
in 2007 shrank all the way to 8.6 million units in 2009. The industry bounced back over the next
two years, reaching 13 million units by 2011.
North America output recovered robustly in 2012 to exceed 15.4 million units, 2.3 million units
more than in 2011. Output is poised to climb even further in 2013 but at a much slower pace,
providing a net volume gain of nearly 450,000 units. Further production gains of nearly 400,000
units in 2014 and 800,000 units in 2015 will be realized as local sourcing plans are implemented.
While the growth rate for domestic automotive production will ease in 2013, the number of
anticipated product redesigns will surge as the market transitions into 2014, climbing to the
highest level in the past decade. This production surge could collide with capacity constraints,
given that assembly capacity and supply chain bandwidth remain under tremendous pressure as
production levels return to normal.
Energy Sector Outlook
The United States is the world's largest consumer of oil, and its third largest producer. In 2011, the
country produced 5.67 million barrels per day (b/d) of crude oil, with increasing domestic
unconventional output, natural gas liquids (NGL) production, and refinery gain having increased
the overall oil supply from domestic sources. Nevertheless, petroleum demand in the US outstrips
domestic production, requiring the country to import more than 40% of the oil it consumes.
The United States is one of the most mature oil-producing regions in the world, with more than
150 years’ worth of petroleum extraction. From aggregate total production of only around 175,000
b/d at the turn of the 20th century, US crude oil production continued to climb ever higher, hitting
a peak of 9.63 million b/d in 1970, according to the US Energy Information Administration. Crude
oil production began to decline in the 1970s, falling to 8.1 million b/d in 1976, then recovering as
high as 8.9 million b/d in 1985. Production has been declining since then. However, US crude oil
production is slowly rising again on the back of unconventional resource recovery – commonly
referred to as shale or ‘tight’ oil. IHS expects US crude production to grow to about 7 million b/d by
2021 before reversing into decline again.

Review of the Big River Steel Incentive Proposal A Market Viability and Cost-Benefit Analysis
IHS Page 15
The US has been producing natural gas since the early part of the 20th century, with production
rising rapidly from the 1930s through to the 1960s. Since the 1970s, however, it has struggled to
maintain output in the face of ever-growing consumption. The country's vast untapped shale gas
resources are critical for the future natural gas supply. Shale gas quickly turned a country that was
to be increasingly dependent on LNG imports into a major natural gas producer that is
contemplating natural gas exports. According to the US Energy Information Administration's (EIA)
2011 Annual Energy Outlook, US shale gas resource estimates were up from 35 trillion cubic feet
(tcf) in 2003 to 862 tcf in 2011.
Unconventional gas in the US is found mainly in the Eastern Appalachian Basin (Pennsylvania, New
York, West Virginia) and the Permian Basin (Texas, New Mexico). Other US states with shale gas
resources include Utah, Colorado, Oklahoma, Arkansas, Louisiana, Montana, North Dakota, Kansas,
Nebraska, and Wyoming. The major producing natural gas shales are the Barnett play (Texas;
oldest and largest production site), the Marcellus Shale (New York, Pennsylvania, West Virginia),
the Bakken formation (Montana, North Dakota), and the Haynesville play (Texas, Louisiana). IHS
analysis of the unconventional oil and gas market indicates that the cumulative capital investment
related to exploration and production activity will surpass $5.1 trillion by 2035, at an average of
$200 billion annually. In 2012, 33,100 jobs in Arkansas were directly or indirectly linked to
unconventional oil and gas activity.
Product Competition (Domestic and Import)
Big River Steel (BRS) proposes four main product categories: hot-rolled sheet, cold-reduced sheet,
galvanized sheet, and electrical steel sheet. We address each product category in turn from the
perspective of a potential market size in excess of what domestic producers already serve. We also
assume no displacement of NAFTA trading partners because the geographic proximity and
favorable trade treatment means steel mills in Mexico and Canada in many ways approximate
“domestic” American production. Therefore, we define the market opportunity for BRS as
consumption in excess of pre-recession levels and some portion of non-NAFTA imports to depend
on the individual dynamics of each market defined below. Each market is assessed based on our
ten year forecast (i.e. market conditions in 2023).
Hot-Rolled Carbon Sheet
Hot-rolled carbon sheet (HRCS) is in many ways the building block of finished steel products,
although it is a significant product in its own right. HRCS serves a wide variety of end markets, but
gets most of its demand from the auto sector and from conversion into other products – notably
the other products under examination: cold-reduced carbon sheet, galvanized sheet, and electrical
steel sheet.4 As such, it is representative of the larger steel market and our outlook aligns
4 The Service Center market segment represents shipments of steel that go through processors, stockists,
and distributors. Although the shipments become difficult to track at this level, it is a fair assumption that the proportion of shipments out of service centers to end users will approximate direct shipments from mills to end users. That is, the same end markets that buy direct from the mill will by and large also be making purchases from service centers.
Review of the Big River Steel Incentive Proposal A Market Viability and Cost-Benefit Analysis
IHS Page 16
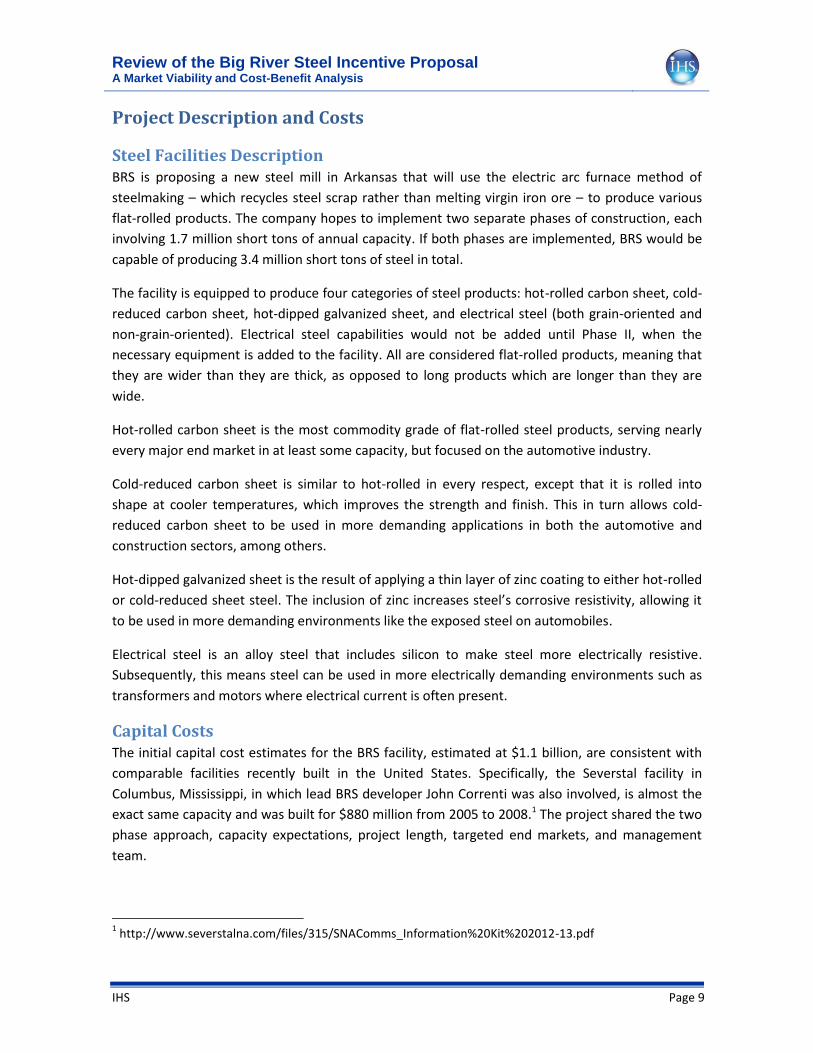
accordingly. Although HRCS has largely recovered from the recession, we do not see sustained
levels of shipments or consumption5 above pre-recession peaks until the very end of our 10 year
forecast horizon. Import penetration has been falling for more than a decade, on account of new
low cost mills being built in the United States. We expect this trend to continue, with import
penetration at or below 10% starting in 2014.
Source: History, American Iron and Steel Institute; Forecast, IHS.
Source: IHS.
BRS would be entering into a HRCS market that is highly competitive and generally sees lower
profit margins. BRS hopes to differentiate on quality. They are targeting more difficult grades of
steel to produce that are wider and thicker than existing capacity. However, there are no
completely un-served end-use markets, only under-served markets. Most of the hot-rolled
5 Apparent consumption is equal to shipments plus imports minus exports; Given that there is an implicit
assumption of no change in inventories, apparent supply is a similar concept.
10
15
20
25
30
0
2
4
6
8
2000 2003 2006 2009 2012 2015 2018 2021
Apparent Consumption (L)
Shipments (L)
Imports (R)
Exports (R)
Hot-Rolled Sheet
(Millions of Short Tons, Annual Rate)
0
5,000
10,000
15,000
20,000
25,000
30,000
2013 2014 2015 2016 2017 2018 2019 2020 2021 2022
Hot-Rolled Shipments by End Market
Automotive Oil & Gas Service Centers Net For Conversion Exports All Other End Markets
(Thousands of Short Tons)

Review of the Big River Steel Incentive Proposal A Market Viability and Cost-Benefit Analysis
IHS Page 17
production at the new facility would probably find itself competing in the commodity grade pile;
that is, generic steel that is not well differentiated by quality. Nucor facilities in the southeast
United States, especially the Berkeley, South Carolina facility, are already capable of producing
HRCS at widths of up to 67 inches; US Steel is capable of producing widths in excess of 70 inches;
AK steel claims even greater possible widths. The BRS facility would likely have a lower cost of
production than several mills within the United States, though attributable to lower labor costs
than lower material costs or other efficiencies. As such, BRS would be positioned to displace at
least some domestic producers by competing on price.
Source: Iron and Steel Statistics Bureau.
Total imports are around 2 million short tons per year, but over 30% of that comes from Canada
and over 10% from Mexico, both of which are unlikely to be entirely displaced. Furthermore, many
of the remaining tons are not consistent flows and rather represent steel buyers placing
opportunistic orders as a method of fighting back against domestic price increases. We estimate
BRS could displace no more than 250,000 short tons of HRCS imports per year.
Bottom Line: The hot-rolled carbon sheet market is expected to grow by 4 million short tons
beyond pre-recession levels in the next decade, with 250,000 tons available for displacement. At
best, the market potential for BRS in the HRCS market is 4.25 million short tons.
Cold-Reduced Carbon Sheet
The cold-reduced carbon sheet (CRCS) market shares many similarities with the HRCS market in
terms of end-use markets and competition both domestic and import. As such, a very similar story
emerges. Automotive is the single largest end market; conversion to other products like galvanized
sheet also takes a sizeable chunk of CRCS shipments. Like hot-rolled carbon sheet, the cold-
reduced carbon sheet market is quite large (consumption will likely exceed 12 million short tons in
2013), but also highly competitive. Just as in HRCS, the differentiating factor would be width,
serving markets that are currently under-served, but not un-served. The very same facilities and
specifications exist for CRCS as was laid out for HRCS above, with the exception that Nucor’s
Berkeley facilities can only produce CRCS at 65 inches, rather than 67 inches.
0%
20%
40%
60%
80%
100%
2011 2012
NAFTA Partners are Source of Over 40% of HRCS Imports
Total Canadian HR Imports Total Mexican HR Imports All Other HR Imports

Review of the Big River Steel Incentive Proposal A Market Viability and Cost-Benefit Analysis
IHS Page 18
Source: History, American Iron and Steel Institute; Forecast, IHS.
IHS sees some growth beyond pre-recession levels, but only by 1.5 million short tons. Import
penetration is even lower than for HRCS and is similarly concentrated in NAFTA trading partners
who would be difficult to displace.
Source: IHS.
The slightly smaller market size than HRCS means the potential for import displacement starts at
about 1.5 million short tons. After adjusting for the NAFTA trading partners’ share of imports, the
potential market shrinks to under 1 million short tons, again considering that most of the
remaining countries that import into the United States do not do so on a month to month basis,
but rather as needed by select suppliers and as higher domestic price conditions attract imports.
Import displacement would amount to no more than 150,000 short tons.
0
5
10
15
20
0
1
2
3
4
2000 2003 2006 2009 2012 2015 2018 2021
Apparent Consumption (L)
Shipments (L)
Imports (R)
Exports (R)
Cold-Reduced Sheet
(Millions of Short Tons, Annual Rate)
0
2,000
4,000
6,000
8,000
10,000
12,000
14,000
16,000
2013 2014 2015 2016 2017 2018 2019 2020 2021 2022
Cold-Reduced Shipments by End Market
Automotive Oil & Gas Service Centers Net For Conversion Exports All Other End Markets
Review of the Big River Steel Incentive Proposal A Market Viability and Cost-Benefit Analysis
IHS Page 19
Source: Iron and Steel Statistics Bureau.
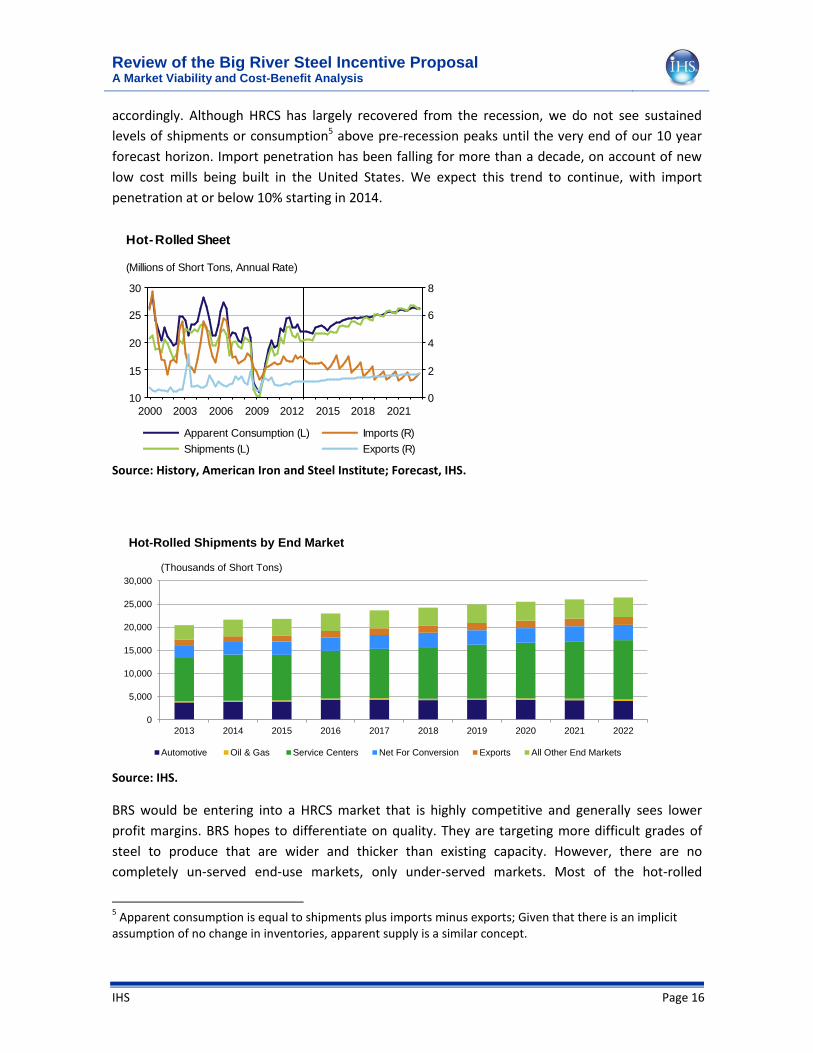
Bottom Line: The cold-reduced carbon sheet market is expected to grow by 1.5 million short tons
beyond pre-recession levels over the next decade, with 150,000 tons available for displacement.
At best, the market potential for BRS in the CRCS market is 1.65 million short tons.
Hot-Dipped Galvanized Sheet
The hot-dipped galvanized sheet (HDGS) demand is concentrated largely in the automotive and
construction markets. The application of zinc during the galvanizing process makes steel corrosion
resistant, a crucial element for automotive applications. This inclusion of zinc makes HDGS more
expensive, but also reduces global competition because all producers worldwide pay close to the
same amount for the most expensive galvanizing input material cost, zinc. As a result, the United
States is quite competitive globally and was briefly a net exporter of HDGS during the 2008-2009
recession. Consumption has a strong upward trend in the forecast period because of continued
growth in the automotive market and because HDGS is expected to take market share from
another (similar) steel product: electro-galvanized sheet steel. Shipments should exceed pre-
recession levels by over 2 million short tons on average.
Source: History, American Iron and Steel Institute; Forecast, IHS.
0%
20%
40%
60%
80%
100%
2011 2012
NAFTA Partners are Source of Nearly 40% of CRCS Imports
Total Canadian CR Imports Total Mexican CR Imports All Other Imports
5
10
15
20
25
0
1
2
3
4
2000 2003 2006 2009 2012 2015 2018 2021
Apparent Consumption (L)
Shipments (L)
Imports (R)
Exports (R)
Hot-Dipped Galvanized Sheet
(Millions of Short Tons, Annual Rate)
Review of the Big River Steel Incentive Proposal A Market Viability and Cost-Benefit Analysis
IHS Page 20
Source: IHS.
On the import side, the market is not as large as it seems beyond NAFTA trade flows. NAFTA
trading partners supply more than half of the 2 million short tons that the United States imports
each year. Canada alone is responsible for more than 40% of total tonnage imported to the US.
Still, the size of imports and the relative competitiveness of the United States in HDGS mean BRS
could displace as much as 300,000 short tons of imports. As with HRCS and CRCS, there is some risk
of domestic displacement as well, including Nucor’s Hickman, Arkansas mill (which can produce at
a width of 62.5 inches).
Source: Iron and Steel Statistics Bureau.
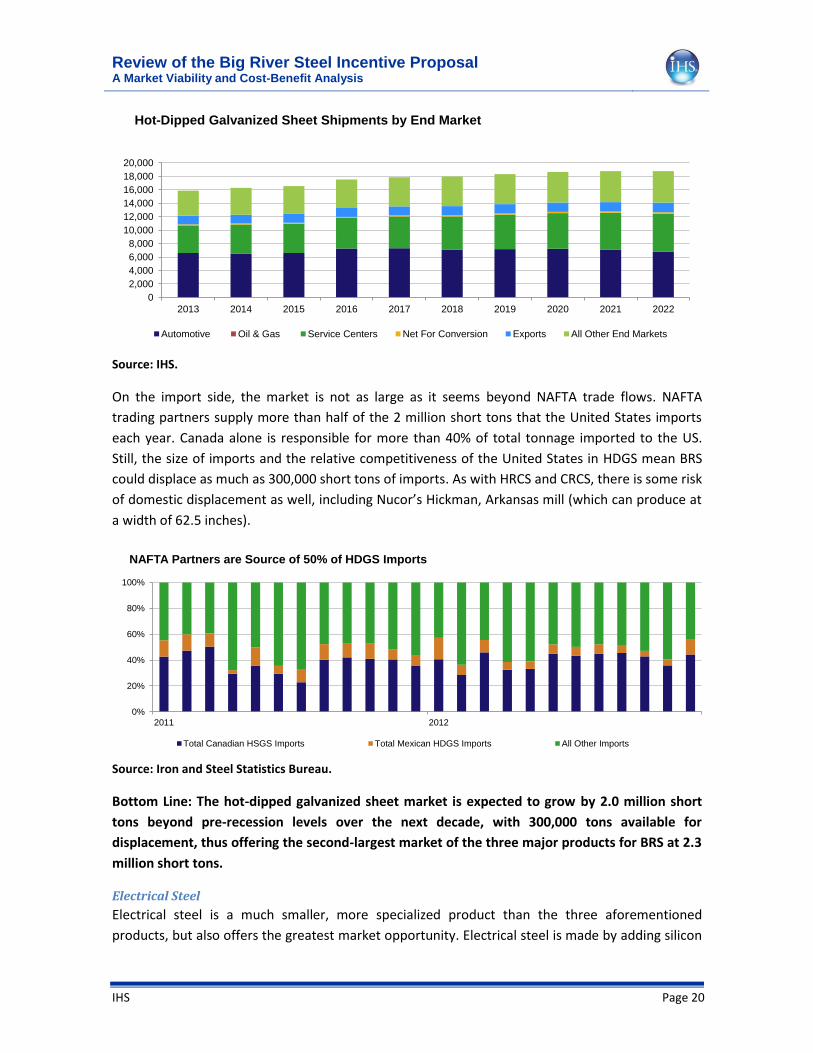
Bottom Line: The hot-dipped galvanized sheet market is expected to grow by 2.0 million short
tons beyond pre-recession levels over the next decade, with 300,000 tons available for
displacement, thus offering the second-largest market of the three major products for BRS at 2.3
million short tons.
Electrical Steel
Electrical steel is a much smaller, more specialized product than the three aforementioned
products, but also offers the greatest market opportunity. Electrical steel is made by adding silicon
0
2,000
4,000
6,000
8,000
10,000
12,000
14,000
16,000
18,000
20,000
2013 2014 2015 2016 2017 2018 2019 2020 2021 2022
Hot-Dipped Galvanized Sheet Shipments by End Market
Automotive Oil & Gas Service Centers Net For Conversion Exports All Other End Markets
0%
20%
40%
60%
80%
100%
2011 2012
NAFTA Partners are Source of 50% of HDGS Imports
Total Canadian HSGS Imports Total Mexican HDGS Imports All Other Imports

Review of the Big River Steel Incentive Proposal A Market Viability and Cost-Benefit Analysis
IHS Page 21
to carbon steel, which increases the electrical resistivity of steel and enables it to be used in more
applications such as transformers and motors. Electrical steels can be grain-oriented or non-grain-
oriented, referring to whether or not the steel has the same magnetic properties in each direction.
The market has too few domestic producers to enable a specific ‘reported shipments’ breakout by
the American Iron and Steel Institute, leaving little data available for market sizing. In the United
States, there are only two producers of electrical steel: Allegheny Ludlum (ATI Technologies) and
AK Steel. Although the domestic market is still recovering from a tonnage perspective, both
companies enjoy high margins on electrical steel products and have found export markets for their
products. In fact, the United States is a net exporter of electrical steel.
Source: Iron and Steel Statistics Bureau.
8%
9%
13%
23%
29%
18%
Electrical Steel Imports by Source
Sweden
South Korea
Germany
GreaterChina
Japan
All Others
33%
10%
14%
20%
23%
Electrical Steel Exports by Destination
Canada
India
Belgium
Mexico
All Other

Review of the Big River Steel Incentive Proposal A Market Viability and Cost-Benefit Analysis
IHS Page 22
Source: Iron and Steel Statistics Bureau.
The United States as currently a net exporter suggests two things: first, the cost of production
profile of the two producers is competitive globally; second, there is more capacity to produce in
the United States than is consumed in the United States. New capacity in the United States could
displace domestic tonnage in addition to building upon the export market. This would be beneficial
to electrical steel buyers, but would hinder the finances of existing producers.
Bottom Line: The electrical steel market is well served from a tonnage perspective, but is a high
margin business that could benefit from some competition. There is the possibility of expanded
exports from the United States, but the greater effect would almost certainly be domestic price
competition.
Export Possibilities
US Production Costs vs. the Rest of the World
The United States formerly enjoyed a significant cost advantage on the rest of the world because
of the large domestic supply of steel scrap that was recycled in electric arc furnaces for
steelmaking. However, much of the build-up of scrap over the past century of industrialization has
now been melted or exported, leaving only real-time supplies for use. There isn’t a shortage of
scrap, per say, but the glut that existed has passed and prices have adjusted accordingly.
Source: History, IHS; Forecast: IHS.
350
400
450
500
550
600
650
700
750
2010 2011 2012 2013 2014 2015 2016 2017 2018 2019 2020 2021 2022
Production Cost Comparison*
Brazil (BOF) China (BOF) Europe (BOF)
Japan (BOF) United States (BOF) United States (EAF)
(US Dollars/Metric Tonne)
Review of the Big River Steel Incentive Proposal A Market Viability and Cost-Benefit Analysis
IHS Page 23
NOTE: *Production cost is defined as the material cost of producing a ton of steel plus an industry wide
wage estimate. It is important to note that different facilities will have vastly different efficiencies as these
are top-level estimates only.
Today, the US has production costs towards the median of the rest of the world. The
(re)introduction of direct reduction iron (DRI) into the mix for steel mills in the US will suppress
costs in the future. IHS does not currently forecast DRI production costs because so few facilities
use the technology worldwide. Therefore, there is some upside risk to our forecast of exports, but
not large enough to impact our view of the viability of BRS.
The result of this analysis is to show that the United States is indeed now and will remain in the
future, cost competitive with the rest of the world. The United States is certainly not the low-cost
producer by any means, but it is in the middle of the pack from an industry wide perspective.
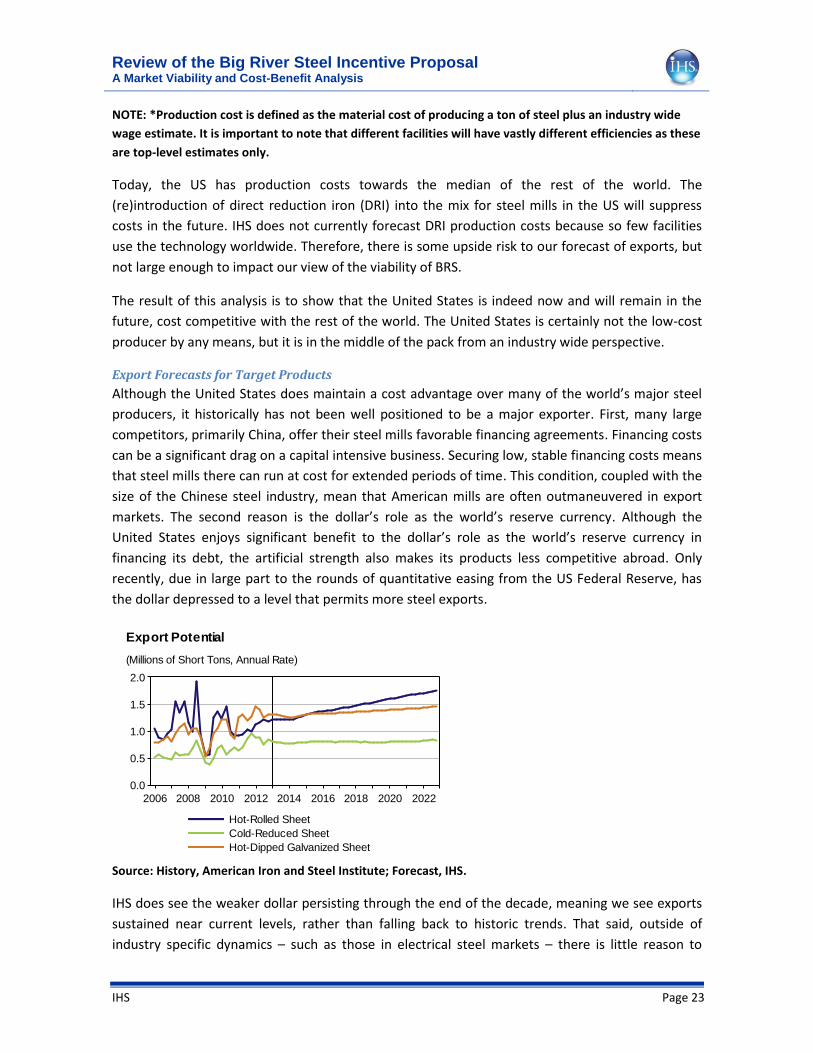
Export Forecasts for Target Products
Although the United States does maintain a cost advantage over many of the world’s major steel
producers, it historically has not been well positioned to be a major exporter. First, many large
competitors, primarily China, offer their steel mills favorable financing agreements. Financing costs
can be a significant drag on a capital intensive business. Securing low, stable financing costs means
that steel mills there can run at cost for extended periods of time. This condition, coupled with the
size of the Chinese steel industry, mean that American mills are often outmaneuvered in export
markets. The second reason is the dollar’s role as the world’s reserve currency. Although the
United States enjoys significant benefit to the dollar’s role as the world’s reserve currency in
financing its debt, the artificial strength also makes its products less competitive abroad. Only
recently, due in large part to the rounds of quantitative easing from the US Federal Reserve, has
the dollar depressed to a level that permits more steel exports.
Source: History, American Iron and Steel Institute; Forecast, IHS.
IHS does see the weaker dollar persisting through the end of the decade, meaning we see exports
sustained near current levels, rather than falling back to historic trends. That said, outside of
industry specific dynamics – such as those in electrical steel markets – there is little reason to
0.0
0.5
1.0
1.5
2.0
2006 2008 2010 2012 2014 2016 2018 2020 2022
Hot-Rolled Sheet
Cold-Reduced Sheet
Hot-Dipped Galvanized Sheet
Export Potential
(Millions of Short Tons, Annual Rate)

Review of the Big River Steel Incentive Proposal A Market Viability and Cost-Benefit Analysis
IHS Page 24
believe that a new steel mill would improve the competitiveness of American steel products
abroad, we only see levels being maintained. Electrical steel is the only product of those proposed
by BRS that has a high probability of succeeding outside of the United States and even then, only at
low tonnages. We estimate 250,000 short tons of exports would be possible.
Long Term Viability of the Plant
Zero Sum vs. Non-Zero Sum Production
To determine the long term viability of Big River Steel, we assessed the potential market size for
the products the facility will produce. Over the next ten years, we believe the absolute largest
market for BRS that would involve no material impact from a tonnage perspective (there would
certainly be an impact from a price, cost, and profitability perspective) to existing producers in the
United States is slightly less than 9 million short tons. However, it is important to note that this
estimate reflects ideal demand conditions and that IHS projects just 10 million short tons of
capacity for all steel products combined (including those that the BRS facility would not be able to
produce) to be added over the next decade prior to the announcement of the Big River Steel
Facility.
Units: Millions of Short Tons per Year
If both Phase I and Phase II come onto the market (a total of 3.4 million short tons of capacity), a
third of all steel production growth in the country over the next decade would be accounted for in
a single project. Considering competing projects that are already underway, such as Nucor’s DRI
facility in Louisiana and ThyssenKrupp’s facility in Alabama, the American steel industry could
quickly find itself in a troubling over-supply condition.
Product
(Millions of Short Tons)Growth
Import
Displacement
Export
PotentialTotal
Hot-Rolled Carbon Sheet 4.00 0.25 0.00 4.25
Cold-Reduced Carbon Sheet 1.50 0.15 0.00 1.65
Hot-Dipped Galvanized Sheet 2.00 0.30 0.00 2.30
Electrical Steel 0.25 0.00 0.25 0.50
Total 7.75 0.70 0.25 8.70

Review of the Big River Steel Incentive Proposal A Market Viability and Cost-Benefit Analysis
IHS Page 25
Source: History, American Iron and Steel Institute; Forecast, IHS.
Our forecasts for expected steel capacity growth rely on an assumption of a recovering steel
industry. If the automotive or construction industries were to experience a downturn on the scale
of the 2008-2009 recession again, many steel companies and a large portion of steel capacity
(including BRS) would be in a perilous position. IHS does not view this as a high probability scenario
and even our standard pessimistic forecast scenarios do not involve as deep of a recession in the
forecast horizon.
Although the Nucor facility in Louisiana and the ThyssenKrupp facility in Alabama present some
risk to our outlook, we believe that there is space in the market for all three. Nucor’s facility will be
a direct reduced iron (DRI) facility with no rolling capabilities, so it is likely that the facility will
actually displace scrap consumed in Nucor’s existing electric arc furnaces rather than add to the
total steelmaking capacity in the US, possibly offsetting the increased demand for scrap from the
BRS facility.
The ThyssenKrupp facility in Alabama has melting and rolling capabilities, but no steelmaking
capacity. Instead, the plant is served by semi-finished steel from Brazil. This facility does present a
risk because it shares many of the same finished steel capabilities and has better access to auto
plants. However, in our view the growth in automotive production capability in the American
South is sufficient to allow both facilities to thrive.
Bottom Line: The steel industry can handle the addition of Big River Steel, both Phase I and
Phase II, from a capacity perspective. However, if any other major facilities, other than projects
already announced, were to be added to the US steel stock, the industry would quickly find itself
in a highly competitive, zero-sum environment.
Profitability
Using IHS estimates of operating costs, for electric arc furnace facilities in the United States, we
expect an industry-wide average operating profit of $90/metric tonne over the long term. This
equates to an operating margin of 12%, based on our price and cost estimations.
110
115
120
125
130
135
140
145
2000 2002 2004 2006 2008 2010 2012 2014 2016 2018 2020 2022
Steel Capacity Forecast
(Millions of Short Tons)
10 million short tons of capacity to be added over the next decade

Review of the Big River Steel Incentive Proposal A Market Viability and Cost-Benefit Analysis
IHS Page 26
Source: History, IHS Steel Business Briefing; Forecast, IHS.
The margin is just barely sustainable for modern facilities and on the line of unsustainable for the
more dated facilities in the United States. We produced a number of scenarios using higher and
lower operating profit per metric tonne estimates, as well as different capacity utilizations to stress
test the various financial possibilities.
Bottom Line: In our estimation, the gross profits in almost every scenario are sufficient to service
the debt, especially considering the tax incentives that are also a part of the package.
0
60
120
180
240
300
0
100
200
300
400
500
600
700
800
900
1000
2009 2010 2011 2012 2013 2014 2015 2016 2017 2018 2019 2020 2021 2022
Operating Profits Average $90/ton in Future
Operating Profit (R) Hot-Rolled Carbon Sheet Price (L) Electric Arc Furnace Operating Costs (L)
(Dollars/Metric Tonne)
(A) (B) (C) (D)
Operating Profit
(Dollars/Metric Tonne)
Capacity Utilization
(Percent)
Capacity
(Metric Tonnes)
Gross Profit
(Dollars; A*B*C)
40 50% 1,500,000 30,000,000
40 70% 1,500,000 42,000,000
40 80% 1,500,000 48,000,000
90 50% 1,500,000 67,500,000
90 70% 1,500,000 94,500,000
90 80% 1,500,000 108,000,000
120 50% 1,500,000 90,000,000
120 70% 1,500,000 126,000,000
120 80% 1,500,000 144,000,000

Review of the Big River Steel Incentive Proposal A Market Viability and Cost-Benefit Analysis
IHS Page 27
Cost-Benefit Analysis This section reviews the AEDC’s cost-benefit analysis of the proposed economic incentive package
that Arkansas is considering providing to BRS. The purpose of AEDC’s analysis is to determine if the
value of the long-term economic benefits received by the State in supporting the BRS project will
exceed the long-term cost of the incentive package being offered. The first two sections of this
chapter discuss the types of costs and benefits that will occur during the 20-year term of the
general obligation (GO) bonds. In the third section IHS reviews the results of the AEDC’s cost-
benefit analysis. In the fourth section we present results of our own cost-benefit analysis which we
performed to better evaluate respond to AEDC’s analysis. This chapter considers only costs
incurred by and benefits received by the State.
Types of Costs The State of Arkansas will incur the following types of costs if it decides to provide economic
incentives for the BRS project based on the tables presented on pages 10 through 13 of the AEDC
report:
Annual debt service payments for the two bond issues – one for $75 million (20-year term
and 10 year call), and the other for $50 million (20-year term, 2-year call). The second issue
is a low-interest loan that BRS will repay over time;
Providing $10 million in job training services during the first two years of construction;
Foregone state tax revenues because of the tax credits, refunds, and deductions taken by,
or awarded to, BRS under the Tax Back and Recycling Equipment incentives;
The individual costs listed on these two tables do not consider the following incentives:
The Advantage Arkansas Program;
The sales and use tax exemption for the purchase of natural gas and electricity used by the
plant (a relatively small cost).
The AEDC properly excluded the cost of the sales and use tax exemption for the purchase of
manufacturing equipment as BRS would not be eligible for this incentive if they receive the tax
credits under Recycling Equipment incentive. Similarly, the refund of sales and use taxes under the
Tax Back program should include only the materials used during construction; the purchases of
equipment would also not be eligible under this program as they would already have been used to
claim the Recycling Equipment tax credit.
While it is not a direct cost to taxpayers of Arkansas and is properly not included in the cost-benefit
analysis, the $50 million incentive loan would provide an interest rate subsidy to BRS, especially if
it is not paid off early. The State’s cost of capital for the incentive loan is the all-in true interest cost
(TIC) of 4.33% as shown on the bond schedule. This rate is more than 4 percentage points lower
than BRS’s likely weighted average cost of capital of 8.5%; as a result the value of the estimated
Review of the Big River Steel Incentive Proposal A Market Viability and Cost-Benefit Analysis
IHS Page 28
subsidy could be as high as $28.5 million over 20 years. We agree with AEDC’s analysis showing
that the net present value (NPV) of the economic benefits of the project will increase with an early
payoff.
We agree largely with the assumptions presented on page 9 of AEDC’s report. The IMPLAN
input/output model for Arkansas IHS utilized yielded indirect employment effects that we felt were
too high given the supplier network present in the State. A review of our IHS Global Insight
Arkansas forecast model confirmed that the employment multipliers would be lower. There exists
the potential for a clustering effect given the other mills in proximity to the BRS site, thus some of
the supply chain will already exist. We concur that the site’s close proximity to the Missouri and
Tennessee borders, and the short travel time to the Memphis Metropolitan Statistical Area (MSA),
means that a significant amount of direct spending and employment will leak out of the State.
IHS assumes that AEDC’s cost-benefit analysis used nominal costs for all variables as the debt
service payments shown in analysis were based on nominal interest rates. If this is correct, then all
the other revenue and cost variables should have been expressed in nominal terms. The ADEC did
not indicate the discount rate they used, so we cannot confirm that a nominal analysis was done.
The State’s nominal cost of is 3% based on the all-in true interest cost for the $75 million bond
issue. Our analysis of costs and benefits was performed using only nominal values; we obtained
growth rates from our proprietary forecasts and data bases.
Types of Benefits The benefit to the State of Arkansas will be comprised of the increases in state tax revenues, a
significant portion of which will be used to pay off the $125 million in GO bonds. BRS will repay the
$50 million incentive loan. There will be three primary sources of state tax revenues:
The sales and use tax, currently at a rate of 6%;
The personal income tax;
The corporate net income tax.
These three taxes have accounted for approximately 78% of total state tax revenues, excluding
property taxes, in Arkansas since 2000. The increases in the other types of state level taxes, such as
the Motor Fuels Sales tax, would be small, are difficult to estimate, and are often deposited in
special funds where they cannot be used for debt service payments. Increases in state-level tax
revenues will be generated by the direct spending and employment effects, and by the
accompanying indirect and induced economic effects.
The tables on pages 10 and 11 of AEDC’s report present annual benefits in toto; so we could not
initially determine the individual benefits that comprise them. In response to a question from IHS
about the types of benefits, the AEDC indicated they consist of increases in individual income, sales
and use, and corporate income tax revenues generated by economic activity during the
construction and operations phases of the project, including indirect effects from company

Review of the Big River Steel Incentive Proposal A Market Viability and Cost-Benefit Analysis
IHS Page 29
purchases (i.e., supply chain effects), and induced effects (i.e., worker spending). IHS concurs that
the primary focus of the benefits analysis should be on these three tax revenue streams.
The AEDC also stated that effective tax rates were used to derive the revenue flows. IHS agrees in
principle with this approach based on our experience on similar tax studies. However, in order to
provide an in-depth review in these types of studies, it is necessary to obtain details on the
methodology and assumptions made to estimate each type of benefit. For example, the calculation
of an effective tax rate depends entirely on the taxable base (i.e., the denominator) used in the
calculation. Finally, AEDC’s report states on page 8 that an input-output (I/O) model was used to
derive sector-specific economic impacts and likely tax revenue flows. We generally agree with this
approach, especially in estimating tax revenues generated by indirect and induced multipliers. Our
own analysis constrained the multipliers to our forecast expectations for the Arkansas economy.
The AEDC correctly assumed that the State would not receive any corporate income tax revenues
for the first 15 years of the analysis period. The AEDC assumed that BRS will be organized as a
corporation instead of in another form such as an S Corporation, a Limited Liability Partnership
(LLp), or as a Limited Liability Company (LLc). The substantial jump in the annual benefits of $5
million starting in FY 2029 is a function of the expiration of the Recycling Equipment tax credit.
Only then would the State begin to realize an increase in corporate income taxes produced by the
plant’s construction and operation (including the indirect and induced effects). We agree with this
assumption, which implicitly assumes that the project sponsor would be able to take the full
amount of the tax credit. The state is considering increasing the number of years for which the
Recycling Equipment tax credit can be carried forward from three to 14 years, increasing the
likelihood that BRS will be able to use the entire credit.
We estimate the value of the Recycling Equipment tax credit to be about $216 million (2013$) over
a 15-year period ($721.1 million in equipment costs including installation times 30%). IHS would
like to obtain information on the methodology and assumptions used to estimate the increased
corporate income tax revenues that will flow because they comprise a significant share of the
project’s economic benefits, even though they occur relatively late in the analysis period.
Results of the AEDC’s Cost-Benefit Analysis The AEDC analyzed two cost-benefit scenarios, with two options for each as follows:
A 20-year analysis with no early payoff of the $50 million incentive loan
o Excluding the $10 million training costs during the first two years of construction,
resulting in net positive economic benefits with a total net present value of +$59.1
million and breaking even in year 5.
o Including the $10 million training costs during the first two years of construction,
resulting in net positive economic benefits with a total NPV of +$54.2 million and
breaking even in year 6.

Review of the Big River Steel Incentive Proposal A Market Viability and Cost-Benefit Analysis
IHS Page 30
An early payoff of the $50 million incentive loan in 2017. According to the commitment
letter of January 28, 2013, the project’s sponsor may repay the loan at any time without
penalty.
o Excluding the $10 million training costs during the first two years of construction,
resulting in net positive economic benefits with a total NPV of $54.6 million and
breaking even in year 6.
o Including the $10 million training costs during the first two years of construction,
resulting in net positive economic benefits with a total NPV of $49.8 million and
breaking even in year 8.
IHS believes that the AEDC has somewhat over-estimated the long-term, net economic benefits of
the incentive package being offered. This finding is based on information made available to IHS as
we did not, however, have access to the complete set of assumptions, calculations, and
methodologies used by AEDC, especially in calculating benefits. IHS’ own cost-benefit analysis
discussed below yields lower, but still positive, net economic benefits based on our effort to
replicate, as accurately possible, AEDC’s analysis.
Our principal finding is that the incentive package, as presently designed, is likely to generate a
modest level of economic benefits on a NPV basis under current operating assumptions. While we
agree that the AEDC was generally conservative in their assumptions, we are concerned that the
BRS project has the potential to produce higher costs than benefits (i.e., net costs) under some
conditions. This outcome is possible since there are some significant areas of uncertainty, primarily
in the long-term performance of the BRS plant and the amount of tax revenues that would flow
from the increased economic activity produced by it. We feel that the risk is on the downside – the
probability is higher that the project’s net economic benefits will be lower than estimated by the
AEDC, or that there could be net costs to the State under some conditions, than the probability
that the economic benefits will be higher than those estimated by the AEDC. These uncertainties
require more analysis, as we recommend below, in order to evaluate their potential effect on the
project’s net benefits. Major areas of uncertainty in the cost-benefit analysis are:
The proposed plant must operate continuously at the projected capacity utilization factor
to achieve the levels of production, sales, and operating to generate the tax revenues
necessary to cover the costs of the incentives. The IHS Steel group recommends an annual
capacity utilization factor of 70% and a steel product market price in 2016 of $713 per ton.
The proposed plant must also operate at the projected levels of output and employment in
order to generate the desired indirect and induced increases in economic activity across
the state, which will produce increases in the three primary state tax revenue streams,
especially personal income and sales & use taxes. For example, the 525 jobs at an annual
average salary of $75,000 each (2013$) must be maintained, along with the sizable

Review of the Big River Steel Incentive Proposal A Market Viability and Cost-Benefit Analysis
IHS Page 31
purchases of inputs from in-state suppliers, which should increase over time as the supply
chain develops.
As noted above in our Steel Market analysis, the threat always exists that another steel
manufacturing facility could be built in the US. The resulting competition, assuming that it
competes directly with the BRS plant, could result in lower prices and reduce the forecast
operating margin. As a low-cost and highly productive steel producer, BRS may compete
well in this type of market.
The $50 million loan must be fully repaid; the sooner the pay-off the higher the project’s
NPV of benefits and the lower the interest rate subsidy received by BRS.
The size, timing, and potential use of the entire Recycling Equipment Tax credit are major
sources of uncertainty. As the AEDC properly notes, this incentive will prevent the State
from receiving any increase, on a net basis, in corporate income tax revenues generated
directly or indirectly by the plant’s construction and operation until FY2029. BRS’s ability to
use this entire tax credit also depends on the plant’s ability to annually produce a profit
against which the credits can be taken.
Once the Recycling Equipment tax credit expires, the project will begin to generate an
annual increase in corporate income tax revenues as noted in Tables 10 and 11 of the
AEDC’s report. While we agree that a large increase in benefits will occur, two areas of
uncertainty exist with regard to how large it will be: 1) the percent share of the plant’s
sales that will be available as income subject to tax; and 2) the share of this income that
will be subject to Arkansas’s corporate net income tax. In allocating corporate income for
tax purposes, the State weights sales 50%, along with 25% weights for payroll and
property. The double weighting of sales would reduce the corporate income taxes paid to
the State as a very high share of the BRS plant’s output will be sold outside it.
Given the project’s location in northeast Arkansas near the Missouri and the Tennessee
borders, and its close proximity to the Memphis MSA, there is likely to be significant
leakage of direct spending out of the State’s economy, especially during operating phase.
The State will require that BRS purchase $250 million in goods and services from in-state
suppliers during the construction phase.
We recommend that AEDC consider conducting sensitivity analyses to assess the potential effects
of the sources of uncertainty discussed above on the incentive package’s likely benefits and costs.
A sensitivity analysis, such as a Monte Carlo simulation, could be performed by varying the key risk
factors such as: annual production and sales levels, the capacity utilization factor, steel price, share
of the corporate income subject to AR taxes, percent of in-state purchases, effective tax rates for
the three primary revenue streams; etc. Conducting such an analysis would identify the conditions
under which the State may not receive enough tax revenues to pay off the two bond issues. Our

Review of the Big River Steel Incentive Proposal A Market Viability and Cost-Benefit Analysis
IHS Page 32
own analysis demonstrates that one way to increase the probability that the economic benefits
will exceed the costs is to reduce the level of Recycling Equipment tax credit below 30%.
IHS Global Insight’s Cost-Benefit Analysis IHS Global Insight prepared its own estimates of costs and benefits in order to provide a thorough
review of AEDC’s results. We attempted to replicate AEDC’s approach in order to better
understand how they derived their results, and to identify variables that would have a significant
impact on the results. For certain benefits, we used a conservative approach (i.e., applied a low
effective corporate income tax rate, assumed a low capacity factor and low price per ton of steel,
considered a ramp up in production, etc.). We were able to estimate the costs of several additional
incentives using our proprietary data bases and forecasts, of which the State is a recipient.
The initial step in our benefit-cost analysis was to create a baseline scenario that incorporated the
assumptions used in the AEDC analysis and the additional ones described below. The baseline
scenario was based on the information provided to IHS. We then performed a series of sensitivity
analyses by changing key variables to determine how the project’s mix of costs and benefits would
be affected. The assumptions used by IHS are described below.
All figures were estimated in nominal dollars using growth rates derived from various IHS data bases and forecasts;
A nominal discount rate of 3% based on the all-in true interest cost for the $75 million GO
bond issue;
Total construction spending was distributed as follows: 10% in 2014; 50% in 2015, and 40%
in 2016 based on the labor loading schedule;
525 permanent jobs beginning during the first year of operation in 2017 and continuing at
that level every year thereafter;
Total annual capacity in phase 1 of 1.7 million short tons per year, a capacity utilization
factor of 70%, an average current price of $688 per ton, and average annual growth rate in
steel prices of 1.35%; the latter three assumptions are from the IHS Steel Group;
Performed the analysis on a calendar year basis; the debt service schedule was converted
from a fiscal year basis;
Included costs for the following incentives: the Advantage Arkansas program, and the sales
tax exemption for utility purchases;
Considered only benefits and costs to the state of Arkansas, those for Mississippi County
and the City Osceola were not included; these two local governments have agreed to
provide grants of $12 million and $2 million respectively for the project. Mississippi County

Review of the Big River Steel Incentive Proposal A Market Viability and Cost-Benefit Analysis
IHS Page 33
will receive a fixed annual payment in lieu of taxes (PILOT) of $3.5 million over a 30-year
period;
BRS would take the full amount of all tax credits granted to it by the State so as to
maximize potential costs to the State;
BRS will be organized as a corporation. If they were to organize in a different form, such as
an LLc or LLp, different tax rates on income may apply. This assumption enabled us to use
11 years of data from the Internal Revenue Service’s Statistics on Income (SOI) data on
steel mills to derive appropriate effective tax rates.
Economic multipliers and effective tax rates were derived from our proprietary economic
model for the State of Arkansas, and the IMPLAN input/output model for the State of
Arkansas.
We did not analyze scenario two – the early repayment of the $50 million incentive loan, since we
agree with the AEDC that if this pay-off occurs in fiscal year 2017 then the NPV of the benefits will
rise.
Our baseline scenario also yielded positive net economic benefits with an NPV of +$50.4 using the
3% discount rate, which declined to +$30.13 million using a 5% discount rate. The IHS baseline
scenario yielded a smaller, but still positive net economic benefit than the AEDC result assuming
that they had used discount rate of about 5%, and a comparable figure if they had used a lower
rate. The large change in the NPV of the benefits in our baseline scenario demonstrates the
sensitivity of the results to the selection of the discount rate. We then performed some sensitivity
analyses described below; for each one we made the change indicated and held all the other
variables and assumptions constant.
Reduced the percent share of income subject to AR’s corporate income tax to 50%, which
reduced the NPV of the net benefits to +$26.62 million using the 3% discount rate and to
+$10.87 million using the 5% rate. The large drop in the net benefits confirmed that it is
important for the State to evaluate the share of BRS’s income that will be subject to its
corporate net income tax;
Lowered the plant’s employment and output during the first two years of operation to
account for a ramp-up in production. Under this scenario, the NPV of the benefits declined
modestly to +$32.5 for the 3% rate, and to +$13.58 using the 5% discount rate;
Dropped the annual capacity utilization factor to 60% throughout the entire operating
period to simulate a lower than forecast market share. The project still had net economic
benefits of only +$3.53 million for the 3% rate, while it had net costs of -$7.59 million with
a 5% discount rate. This result further confirmed that it is essential for BRS plant to
operate at a minimum 70% capacity utilization from day one with a total of 525 workers in
order to increase the probability that the project will have net economic benefits;

Review of the Big River Steel Incentive Proposal A Market Viability and Cost-Benefit Analysis
IHS Page 34
Lowered the Recycling Equipment Tax credit to 25%, which raised the NPV of the economic
benefits to +$79.57 million at a 3% discount rate and to $54.73 million using a 5% discount
rate; the latter figure is comparable to the AEDC’s result for scenario 1 with no early loan
repayment.
The results of IHS cost-benefit analysis yields net economic benefits that are lower than those
presented in AEDC’s study, especially if they used a 5% or comparable discount rate. Our analysis
indicates the probability that the project will produce net economic benefits for the State is highly
dependent on the assumptions made for some key variables for which there is substantial
uncertainty, especially: the ability of the BRS plant to operate continuously at the projected levels
of capacity utilization employment and operating margin; the characteristics of the Recycling
Equipment Tax Credit; the effective tax rates, especially share of BRS’s income that will be subject
to State’s corporate income tax; and the share of inputs purchased from Arkansas vendors during
operations. IHS recommends the State evaluate these variables further to determine their
potential effects on the project’ s costs and benefits before making a final determination on the
economic incentives under consideration.
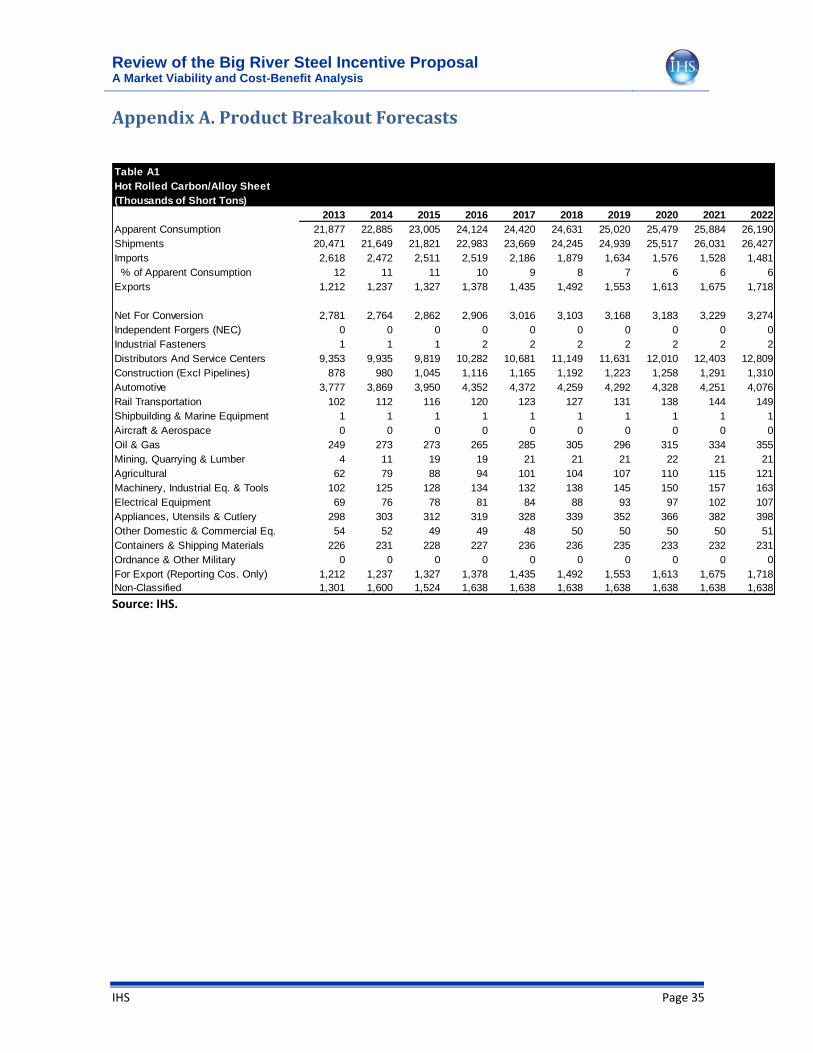
Review of the Big River Steel Incentive Proposal A Market Viability and Cost-Benefit Analysis
IHS Page 35
Appendix A. Product Breakout Forecasts
Source: IHS.
Table A1
Hot Rolled Carbon/Alloy Sheet
(Thousands of Short Tons)
2013 2014 2015 2016 2017 2018 2019 2020 2021 2022
Apparent Consumption 21,877 22,885 23,005 24,124 24,420 24,631 25,020 25,479 25,884 26,190
Shipments 20,471 21,649 21,821 22,983 23,669 24,245 24,939 25,517 26,031 26,427
Imports 2,618 2,472 2,511 2,519 2,186 1,879 1,634 1,576 1,528 1,481
% of Apparent Consumption 12 11 11 10 9 8 7 6 6 6
Exports 1,212 1,237 1,327 1,378 1,435 1,492 1,553 1,613 1,675 1,718
Net For Conversion 2,781 2,764 2,862 2,906 3,016 3,103 3,168 3,183 3,229 3,274
Independent Forgers (NEC) 0 0 0 0 0 0 0 0 0 0
Industrial Fasteners 1 1 1 2 2 2 2 2 2 2
Distributors And Service Centers 9,353 9,935 9,819 10,282 10,681 11,149 11,631 12,010 12,403 12,809
Construction (Excl Pipelines) 878 980 1,045 1,116 1,165 1,192 1,223 1,258 1,291 1,310
Automotive 3,777 3,869 3,950 4,352 4,372 4,259 4,292 4,328 4,251 4,076
Rail Transportation 102 112 116 120 123 127 131 138 144 149
Shipbuilding & Marine Equipment 1 1 1 1 1 1 1 1 1 1
Aircraft & Aerospace 0 0 0 0 0 0 0 0 0 0
Oil & Gas 249 273 273 265 285 305 296 315 334 355
Mining, Quarrying & Lumber 4 11 19 19 21 21 21 22 21 21
Agricultural 62 79 88 94 101 104 107 110 115 121
Machinery, Industrial Eq. & Tools 102 125 128 134 132 138 145 150 157 163
Electrical Equipment 69 76 78 81 84 88 93 97 102 107
Appliances, Utensils & Cutlery 298 303 312 319 328 339 352 366 382 398
Other Domestic & Commercial Eq. 54 52 49 49 48 50 50 50 50 51
Containers & Shipping Materials 226 231 228 227 236 236 235 233 232 231
Ordnance & Other Military 0 0 0 0 0 0 0 0 0 0
For Export (Reporting Cos. Only) 1,212 1,237 1,327 1,378 1,435 1,492 1,553 1,613 1,675 1,718
Non-Classified 1,301 1,600 1,524 1,638 1,638 1,638 1,638 1,638 1,638 1,638
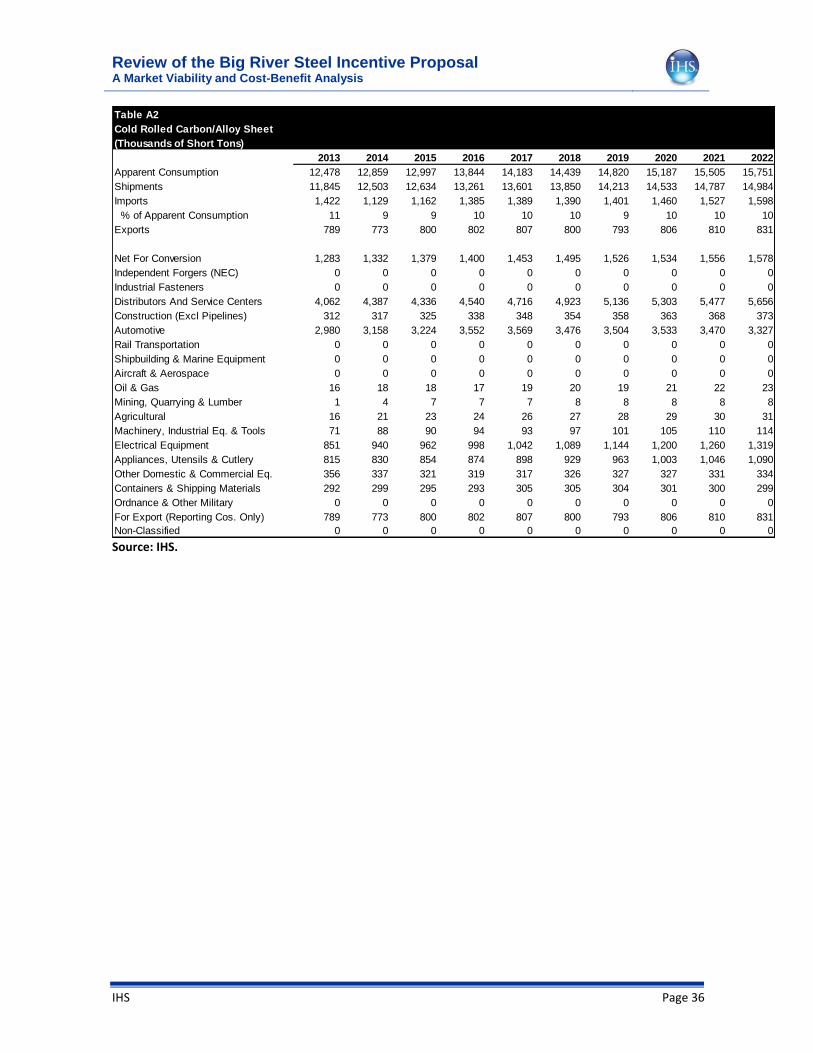
Review of the Big River Steel Incentive Proposal A Market Viability and Cost-Benefit Analysis
IHS Page 36
Source: IHS.
Table A2
Cold Rolled Carbon/Alloy Sheet
(Thousands of Short Tons)
2013 2014 2015 2016 2017 2018 2019 2020 2021 2022
Apparent Consumption 12,478 12,859 12,997 13,844 14,183 14,439 14,820 15,187 15,505 15,751
Shipments 11,845 12,503 12,634 13,261 13,601 13,850 14,213 14,533 14,787 14,984
Imports 1,422 1,129 1,162 1,385 1,389 1,390 1,401 1,460 1,527 1,598
% of Apparent Consumption 11 9 9 10 10 10 9 10 10 10
Exports 789 773 800 802 807 800 793 806 810 831
Net For Conversion 1,283 1,332 1,379 1,400 1,453 1,495 1,526 1,534 1,556 1,578
Independent Forgers (NEC) 0 0 0 0 0 0 0 0 0 0
Industrial Fasteners 0 0 0 0 0 0 0 0 0 0
Distributors And Service Centers 4,062 4,387 4,336 4,540 4,716 4,923 5,136 5,303 5,477 5,656
Construction (Excl Pipelines) 312 317 325 338 348 354 358 363 368 373
Automotive 2,980 3,158 3,224 3,552 3,569 3,476 3,504 3,533 3,470 3,327
Rail Transportation 0 0 0 0 0 0 0 0 0 0
Shipbuilding & Marine Equipment 0 0 0 0 0 0 0 0 0 0
Aircraft & Aerospace 0 0 0 0 0 0 0 0 0 0
Oil & Gas 16 18 18 17 19 20 19 21 22 23
Mining, Quarrying & Lumber 1 4 7 7 7 8 8 8 8 8
Agricultural 16 21 23 24 26 27 28 29 30 31
Machinery, Industrial Eq. & Tools 71 88 90 94 93 97 101 105 110 114
Electrical Equipment 851 940 962 998 1,042 1,089 1,144 1,200 1,260 1,319
Appliances, Utensils & Cutlery 815 830 854 874 898 929 963 1,003 1,046 1,090
Other Domestic & Commercial Eq. 356 337 321 319 317 326 327 327 331 334
Containers & Shipping Materials 292 299 295 293 305 305 304 301 300 299
Ordnance & Other Military 0 0 0 0 0 0 0 0 0 0
For Export (Reporting Cos. Only) 789 773 800 802 807 800 793 806 810 831
Non-Classified 0 0 0 0 0 0 0 0 0 0

Review of the Big River Steel Incentive Proposal A Market Viability and Cost-Benefit Analysis
IHS Page 37
Source: IHS.
Table A3
Galvanized Sheet, Hot Dipped
(Thousands of Short Tons)
2013 2014 2015 2016 2017 2018 2019 2020 2021 2022
Apparent Consumption 16,447 16,883 17,171 18,201 18,515 18,625 18,971 19,296 19,432 19,419
Shipments 15,903 16,313 16,547 17,556 17,883 17,996 18,344 18,658 18,790 18,785
Imports 1,834 1,840 1,942 1,972 1,974 1,988 2,004 2,035 2,058 2,081
% of Apparent Consumption 11 11 11 11 11 11 11 11 11 11
Exports 1,289 1,270 1,318 1,327 1,343 1,359 1,377 1,397 1,416 1,447
Net For Conversion 153 157 162 165 171 176 180 180 183 186
Independent Forgers (NEC) 0 0 0 0 0 0 0 0 0 0
Industrial Fasteners 0 0 0 0 0 0 0 0 0 0
Distributors And Service Centers 4,092 4,387 4,336 4,540 4,716 4,923 5,136 5,303 5,477 5,656
Construction (Excl Pipelines) 2,476 2,460 2,520 2,621 2,696 2,747 2,778 2,816 2,849 2,891
Automotive 6,621 6,474 6,610 7,282 7,317 7,127 7,183 7,243 7,114 6,821
Rail Transportation 15 16 17 17 18 18 19 20 21 21
Shipbuilding & Marine Equipment 0 0 0 0 0 0 0 0 0 0
Aircraft & Aerospace 0 0 0 0 0 0 0 0 0 0
Oil & Gas 0 0 0 0 0 0 0 0 0 0
Mining, Quarrying & Lumber 0 0 0 0 0 0 0 0 0 0
Agricultural 46 59 65 70 75 77 79 82 86 90
Machinery, Industrial Eq. & Tools 41 50 51 54 53 55 58 60 63 65
Electrical Equipment 80 89 91 94 99 103 108 114 119 125
Appliances, Utensils & Cutlery 360 367 378 387 397 411 426 444 462 482
Other Domestic & Commercial Eq. 30 28 27 27 26 27 27 27 28 28
Containers & Shipping Materials 27 27 27 27 28 28 28 27 27 27
Ordnance & Other Military 0 0 0 0 0 0 0 0 0 0
For Export (Reporting Cos. Only) 1,289 1,270 1,318 1,327 1,343 1,359 1,377 1,397 1,416 1,447
Non-Classified 672 930 945 945 945 945 945 945 945 945

Review of the Big River Steel Incentive Proposal A Market Viability and Cost-Benefit Analysis
IHS Page 38
Appendix B: Auto Production Plant Locations
Key: Red ≤ 100,000 Vehicles 100,000 < Yellow ≤ 200,000 200,000 Green ≤ 300,000 300,000 < Blue ≤ 400,000 Pink > 400,000 Vehicles


![PENNSYLVANIA RAILROAD MAP - dot.state.pa.us · PDF filePENNSYLVANIA RAILROAD MAP ... [BLRV] Belvidere & Lehigh River Railway Co. ... Mittal Steel USA Railways-BRVY Mittal Steel USA](https://img.pdfslide.net/doc/110x75/5aaa20987f8b9a86188db38d/pennsylvania-railroad-map-dotstatepaus-railroad-map-blrv-belvidere-lehigh.jpg)


![PENNSYLVANIA RAILROAD MAP - dot7.state.pa.us · PDF filePENNSYLVANIA RAILROAD MAP ... [BLRV] Belvidere & Lehigh River Railway Co. ... Mittal Steel USA Railways-SH Mittal Steel USA](https://img.pdfslide.net/doc/110x75/5aaa20987f8b9a86188db3af/pennsylvania-railroad-map-dot7statepaus-railroad-map-blrv-belvidere-lehigh.jpg)