Embed Size (px)
Citation preview
Kristie E. N. Clarke, MD MSCR, FAAP
US CENTERS FOR DISEASE CONTROL AND PREVENTION
REVIEW OF THE EPIDEMIOLOGY OF
DIPHTHERIA – 2000-2016
Background
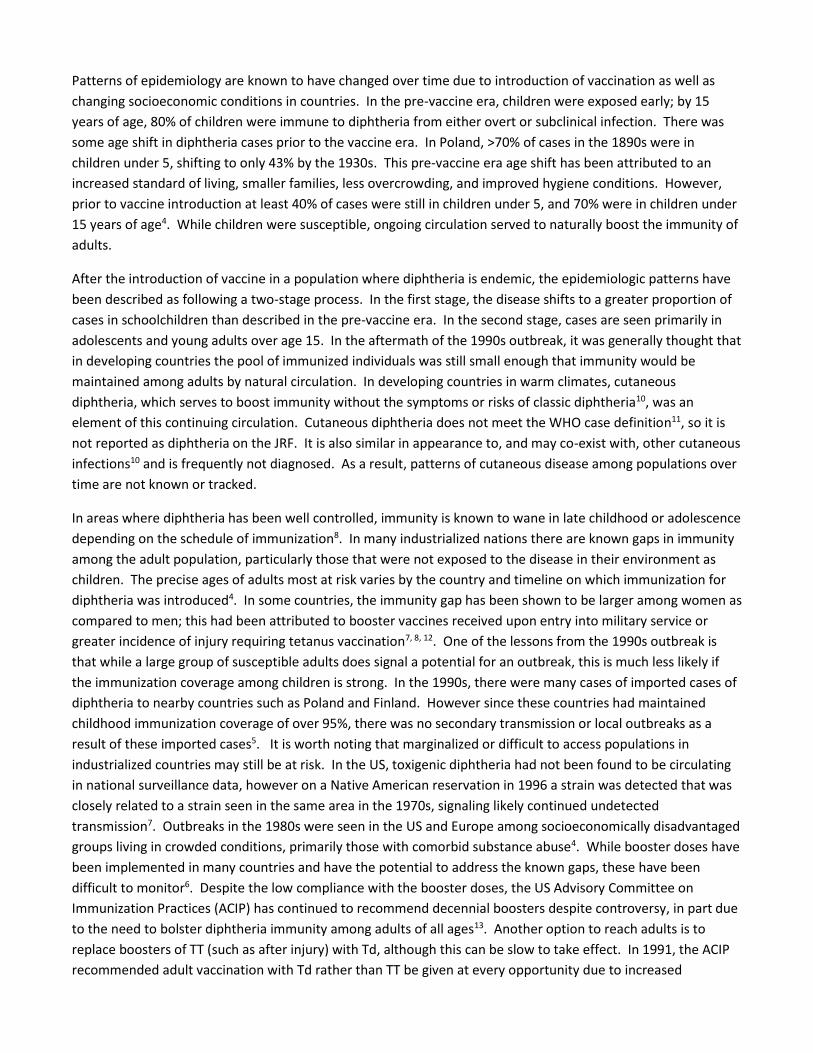
Diphtheria was one of the leading causes of childhood death in the pre-vaccine era1. However, after the
diphtheria toxoid vaccine was invented in 1923, and subsequently was used on a large scale in the United States
and other industrialized countries in the 1940s-1950s, incidence in these nations quickly declined. There was a
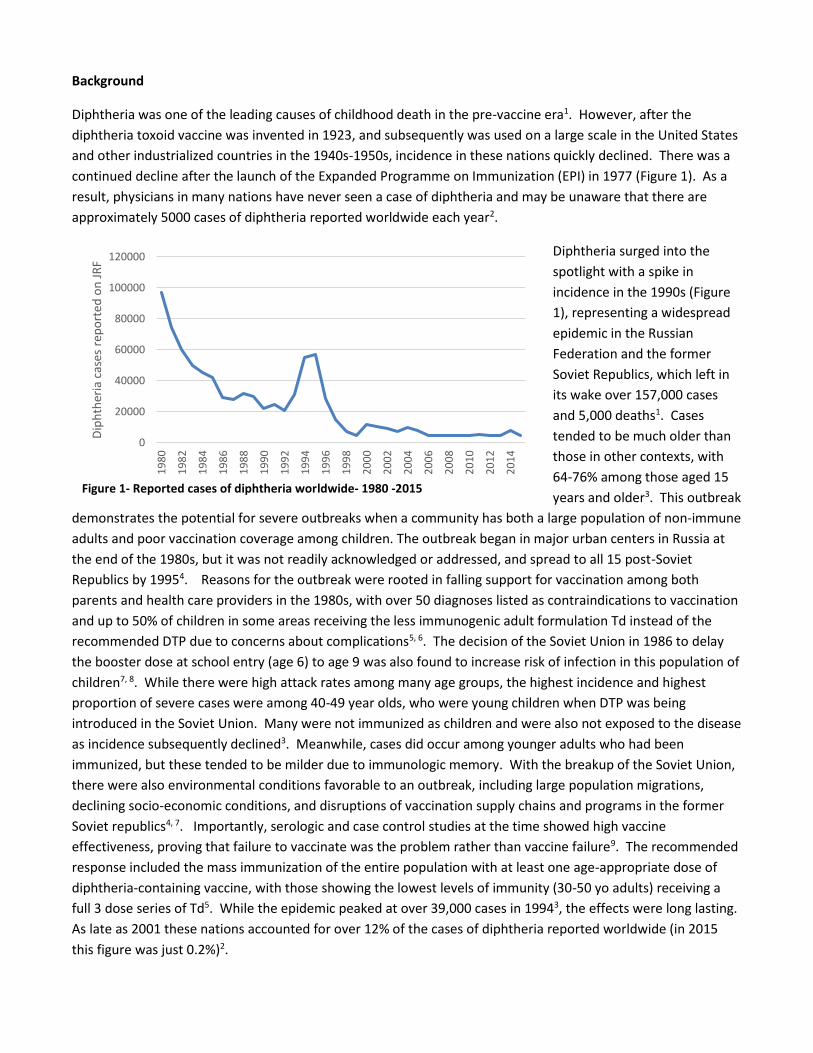
continued decline after the launch of the Expanded Programme on Immunization (EPI) in 1977 (Figure 1). As a
result, physicians in many nations have never seen a case of diphtheria and may be unaware that there are
approximately 5000 cases of diphtheria reported worldwide each year2.
Diphtheria surged into the
spotlight with a spike in
incidence in the 1990s (Figure
1), representing a widespread
epidemic in the Russian
Federation and the former
Soviet Republics, which left in
its wake over 157,000 cases
and 5,000 deaths1. Cases
tended to be much older than
those in other contexts, with
64-76% among those aged 15
years and older3. This outbreak
demonstrates the potential for severe outbreaks when a community has both a large population of non-immune
adults and poor vaccination coverage among children. The outbreak began in major urban centers in Russia at
the end of the 1980s, but it was not readily acknowledged or addressed, and spread to all 15 post-Soviet
Republics by 19954. Reasons for the outbreak were rooted in falling support for vaccination among both
parents and health care providers in the 1980s, with over 50 diagnoses listed as contraindications to vaccination
and up to 50% of children in some areas receiving the less immunogenic adult formulation Td instead of the
recommended DTP due to concerns about complications5, 6. The decision of the Soviet Union in 1986 to delay
the booster dose at school entry (age 6) to age 9 was also found to increase risk of infection in this population of
children7, 8. While there were high attack rates among many age groups, the highest incidence and highest
proportion of severe cases were among 40-49 year olds, who were young children when DTP was being
introduced in the Soviet Union. Many were not immunized as children and were also not exposed to the disease
as incidence subsequently declined3. Meanwhile, cases did occur among younger adults who had been
immunized, but these tended to be milder due to immunologic memory. With the breakup of the Soviet Union,
there were also environmental conditions favorable to an outbreak, including large population migrations,
declining socio-economic conditions, and disruptions of vaccination supply chains and programs in the former
Soviet republics4, 7. Importantly, serologic and case control studies at the time showed high vaccine
effectiveness, proving that failure to vaccinate was the problem rather than vaccine failure9. The recommended
response included the mass immunization of the entire population with at least one age-appropriate dose of
diphtheria-containing vaccine, with those showing the lowest levels of immunity (30-50 yo adults) receiving a
full 3 dose series of Td5. While the epidemic peaked at over 39,000 cases in 19943, the effects were long lasting.
As late as 2001 these nations accounted for over 12% of the cases of diphtheria reported worldwide (in 2015
this figure was just 0.2%)2.
0
20000
40000
60000
80000
100000
120000
19
80
19
82
19
84
19
86
19
88
19
90
19
92
19
94
19
96
19
98
20
00
20
02
20
04
20
06
20
08
20
10
20
12
20
14
Dip
hth
eria
cas
es r
epo
rted
on
JR
F
Figure 1- Reported cases of diphtheria worldwide- 1980 -2015
Patterns of epidemiology are known to have changed over time due to introduction of vaccination as well as
changing socioeconomic conditions in countries. In the pre-vaccine era, children were exposed early; by 15
years of age, 80% of children were immune to diphtheria from either overt or subclinical infection. There was
some age shift in diphtheria cases prior to the vaccine era. In Poland, >70% of cases in the 1890s were in
children under 5, shifting to only 43% by the 1930s. This pre-vaccine era age shift has been attributed to an
increased standard of living, smaller families, less overcrowding, and improved hygiene conditions. However,
prior to vaccine introduction at least 40% of cases were still in children under 5, and 70% were in children under
15 years of age4. While children were susceptible, ongoing circulation served to naturally boost the immunity of
adults.
After the introduction of vaccine in a population where diphtheria is endemic, the epidemiologic patterns have
been described as following a two-stage process. In the first stage, the disease shifts to a greater proportion of
cases in schoolchildren than described in the pre-vaccine era. In the second stage, cases are seen primarily in
adolescents and young adults over age 15. In the aftermath of the 1990s outbreak, it was generally thought that
in developing countries the pool of immunized individuals was still small enough that immunity would be
maintained among adults by natural circulation. In developing countries in warm climates, cutaneous
diphtheria, which serves to boost immunity without the symptoms or risks of classic diphtheria10, was an
element of this continuing circulation. Cutaneous diphtheria does not meet the WHO case definition11, so it is
not reported as diphtheria on the JRF. It is also similar in appearance to, and may co-exist with, other cutaneous
infections10 and is frequently not diagnosed. As a result, patterns of cutaneous disease among populations over
time are not known or tracked.
In areas where diphtheria has been well controlled, immunity is known to wane in late childhood or adolescence
depending on the schedule of immunization8. In many industrialized nations there are known gaps in immunity
among the adult population, particularly those that were not exposed to the disease in their environment as
children. The precise ages of adults most at risk varies by the country and timeline on which immunization for
diphtheria was introduced4. In some countries, the immunity gap has been shown to be larger among women as
compared to men; this had been attributed to booster vaccines received upon entry into military service or
greater incidence of injury requiring tetanus vaccination7, 8, 12. One of the lessons from the 1990s outbreak is
that while a large group of susceptible adults does signal a potential for an outbreak, this is much less likely if
the immunization coverage among children is strong. In the 1990s, there were many cases of imported cases of
diphtheria to nearby countries such as Poland and Finland. However since these countries had maintained
childhood immunization coverage of over 95%, there was no secondary transmission or local outbreaks as a
result of these imported cases5. It is worth noting that marginalized or difficult to access populations in
industrialized countries may still be at risk. In the US, toxigenic diphtheria had not been found to be circulating
in national surveillance data, however on a Native American reservation in 1996 a strain was detected that was
closely related to a strain seen in the same area in the 1970s, signaling likely continued undetected
transmission7. Outbreaks in the 1980s were seen in the US and Europe among socioeconomically disadvantaged
groups living in crowded conditions, primarily those with comorbid substance abuse4. While booster doses have
been implemented in many countries and have the potential to address the known gaps, these have been
difficult to monitor6. Despite the low compliance with the booster doses, the US Advisory Committee on
Immunization Practices (ACIP) has continued to recommend decennial boosters despite controversy, in part due
to the need to bolster diphtheria immunity among adults of all ages13. Another option to reach adults is to
replace boosters of TT (such as after injury) with Td, although this can be slow to take effect. In 1991, the ACIP
recommended adult vaccination with Td rather than TT be given at every opportunity due to increased
protection with only a marginal price difference; however, as late as 2000, 20% of adults were still receiving TT
boosters7. Over time demand continued to drop and TT has not been available from manufacturers in the US
since 2015.
With the exception of the universally recommended 3 dose primary series in infancy, the current WHO
recommendation on diphtheria vaccine depends on the epidemiologic pattern of disease in each country. The
first priority is attainment of 90% coverage for the primary series, with subsequent consideration of doses at the
end of the second year of life and possibly additional doses at school entry and school leaving. Booster doses
are especially recommended for industrialized countries which need to compensate for the loss of natural
boosting from the environment. Those living in non-endemic or low endemic areas may require additional
boosters at 10 year intervals10. There has recently been a call to reconsider these recommendations, with
authors in some endemic countries noting a resurgence of the disease or a shift to older populations14, 15, as well
as anecdotal reports in the public health community of an age shift in developing countries that may be similar
to that seen in previous years in industrialized countries. Therefore, this review gathered available case-based
data regarding age distribution and vaccination status of infected persons. These data were analyzed in the
context of available aggregate surveillance and coverage data in an attempt to shed light on the epidemiological
patterns of diphtheria after the year 2000 and offer an evidence base for future recommendations.
Methods
First, JRF data were examined for general epidemiologic trends of incidence over time and across regions.
Recent patterns in immunization coverage and incidence were examined more in depth for the 10 countries
reporting the most cases from 2010-2015. To contextualize the discussion of immunization recommendations,
available databases and other information on national immunization schedules were compiled.
Next, since there is no repository of data on the age or vaccination status of cases of diphtheria, one was
created using any accessible published or grey literature. An initial search was run on Medline and Embase with
the assistance of a library sciences professional using the search terms diphtheria AND outbreak, cluster, OR
epidemic. Once results were reviewed, a secondary search was performed to widen the scope of results on the
Medline, Embase, Global Health, CINAHL, Cochrane Library, LILACS, and Scopus databases. See Appendix A for
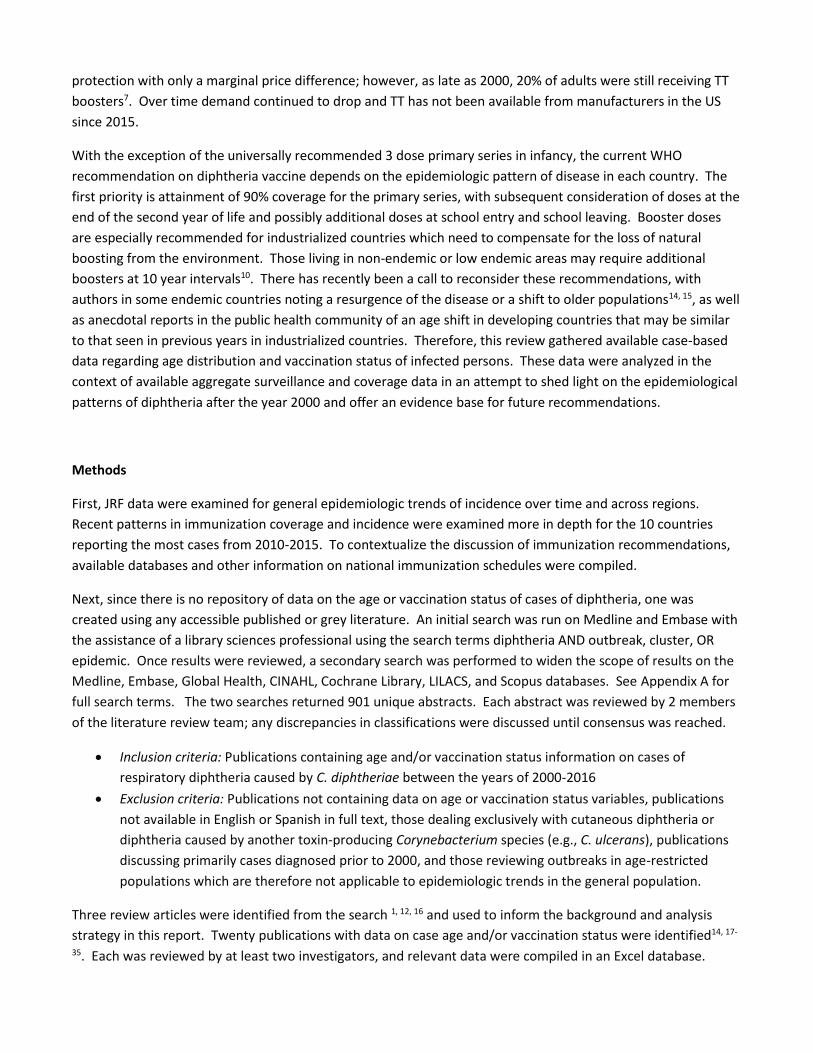
full search terms. The two searches returned 901 unique abstracts. Each abstract was reviewed by 2 members
of the literature review team; any discrepancies in classifications were discussed until consensus was reached.
Inclusion criteria: Publications containing age and/or vaccination status information on cases of
respiratory diphtheria caused by C. diphtheriae between the years of 2000-2016
Exclusion criteria: Publications not containing data on age or vaccination status variables, publications
not available in English or Spanish in full text, those dealing exclusively with cutaneous diphtheria or
diphtheria caused by another toxin-producing Corynebacterium species (e.g., C. ulcerans), publications
discussing primarily cases diagnosed prior to 2000, and those reviewing outbreaks in age-restricted
populations which are therefore not applicable to epidemiologic trends in the general population.
Three review articles were identified from the search 1, 12, 16 and used to inform the background and analysis
strategy in this report. Twenty publications with data on case age and/or vaccination status were identified14, 17-
35. Each was reviewed by at least two investigators, and relevant data were compiled in an Excel database.
Figure 2: Flow chart of literature review and sources for data used in analysis
901 unique
abstract results
779 not relevant
on abstract review
20 publications
with case
information
relevant to the
review
36 articles containing primarily pre-2000 data
2 full text articles not retrievable
29 eliminated due
to language
31 articles on diphtheria carriage or
antibody serosurveys
3 relevant
review articles
93 potentially
relevant abstract
results
54 results with dates
and populations inside
scope of review
91 retrievable
results
23 articles on cases or
trends of diphtheria
2000-2016
1 article on age-restricted population
9 sources
from grey
literature
11
unpublished
reports
17 additional
publications
found through
reference lists
ECDC
TESSy
dataset
During the review of the full-text articles, an additional 17 published manuscripts were identified through the
reference lists15, 36-51. A review of the grey literature resulted in 9 additional sources52-60, and communications
with colleagues and partners in the field resulted in access to 11 unpublished reports containing relevant data61-
71. In addition, diphtheria data from The European Surveillance System – TESSy, were provided by Spain, Latvia,
Germany, Italy, Lithuania, the Netherlands, the United Kingdom, Finland, Sweden, France, Austria, and Belgium
and released by the European Centre for Disease Prevention and Control72. See Figure 2 for the full flow
diagram of the literature search and compilation of other sources. Due to the multiple data sources, care was
taken that cases reported from the same country in the same year were not duplicates; if unclear, we
conservatively excluded the case from the dataset.
The number of cases on the JRF for each country in the same year or set of years was included in the dataset for
comparison. Since DTP3 coverage has been shown to be an important factor in the containment or spread of an
outbreak, the average of the national WHO-UNICEF estimates of DTP3 coverage73 for the previous 5 years were
taken for each set of reported cases and included in the dataset. Countries with data included in the review
were classified by the following categorical variables of interest (see Appendix B for a full list of variables and
datasets created for this analysis):
Frequency of cases: Higher case count countries (defined as reporting at least 10 cases in at least 3 years
of JRF incidence data between 2000 and 2015) versus countries with sporadic cases
Vaccination schedule type: Classified by age at last scheduled dose as 3 dose primary series in infancy
only; Last booster dose at <6 years old; Last booster dose between 6 and 17 years of age, and Adult
boosters (at least one dose of diphtheria-containing vaccine given at or after age 18).
The dataset was examined for patterns in both the age and vaccination status of reported cases. This analysis
was complicated by three main factors. First, the age distribution analysis was complicated by the diverse ways
in which age data were aggregated in sources. Our analysis used cutoffs at 5 years and 15 years for aggregation
of age data since these were most frequently mentioned in the historical literature as benchmarks for the age
shift in diphtheria incidence over time. In the 5 year analysis classifications were made using available cutoffs in
the sources between 3 to 6 years of age; in the 15 year analysis classifications were made using cutoffs from 9 to
20 years of age depending on available data. Second, sources also aggregated vaccination status data
differently. Cases with partial vaccination were grouped with fully vaccinated cases in several sources; these
were conservatively designated as ‘partially vaccinated’ in the main dataset for aggregate analysis. Reports of
cases with unknown vaccination status or partial vaccination were grouped with unvaccinated cases in other
sources. These cases were conservatively designated as ‘unvaccinated’ in the main dataset for aggregate
analysis. Finally, most reports or manuscripts did not have data that linked the age and vaccination status of
cases or groups of cases; even if vaccination data and age data were available, it was not stated what
percentage of cases in a specific age group were vaccinated, for example.
To analyze trends despite these limitations, 4 datasets were compiled for sensitivity analyses (see Appendix B):
Dataset “5 Year” included all cases with clear age data of cases around the 5 year cut-off (±1 year),
excluding reports without age data.
Dataset “15 Year” included those with clear case age data around this cutoff (±1 year), excluding reports
without age data.
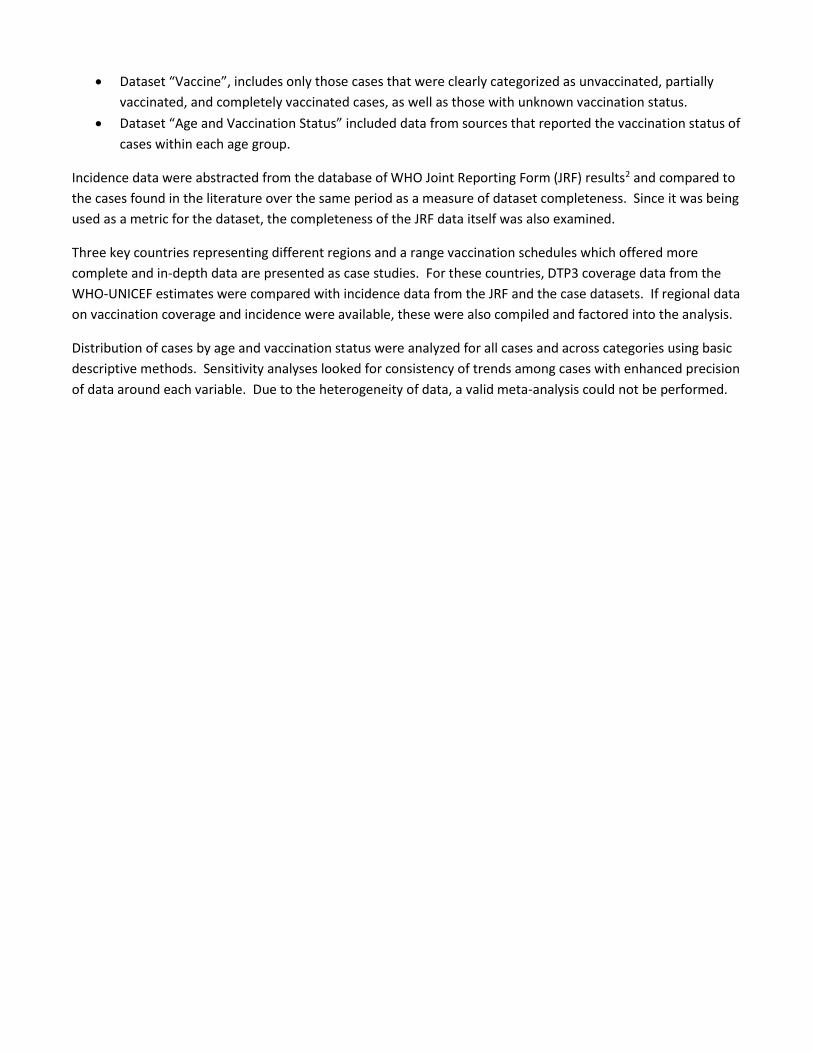
Dataset “Vaccine”, includes only those cases that were clearly categorized as unvaccinated, partially
vaccinated, and completely vaccinated cases, as well as those with unknown vaccination status.
Dataset “Age and Vaccination Status” included data from sources that reported the vaccination status of
cases within each age group.
Incidence data were abstracted from the database of WHO Joint Reporting Form (JRF) results2 and compared to
the cases found in the literature over the same period as a measure of dataset completeness. Since it was being
used as a metric for the dataset, the completeness of the JRF data itself was also examined.
Three key countries representing different regions and a range vaccination schedules which offered more
complete and in-depth data are presented as case studies. For these countries, DTP3 coverage data from the
WHO-UNICEF estimates were compared with incidence data from the JRF and the case datasets. If regional data
on vaccination coverage and incidence were available, these were also compiled and factored into the analysis.
Distribution of cases by age and vaccination status were analyzed for all cases and across categories using basic
descriptive methods. Sensitivity analyses looked for consistency of trends among cases with enhanced precision
of data around each variable. Due to the heterogeneity of data, a valid meta-analysis could not be performed.
Results and Discussion
General epidemiologic trends, 2000-2015
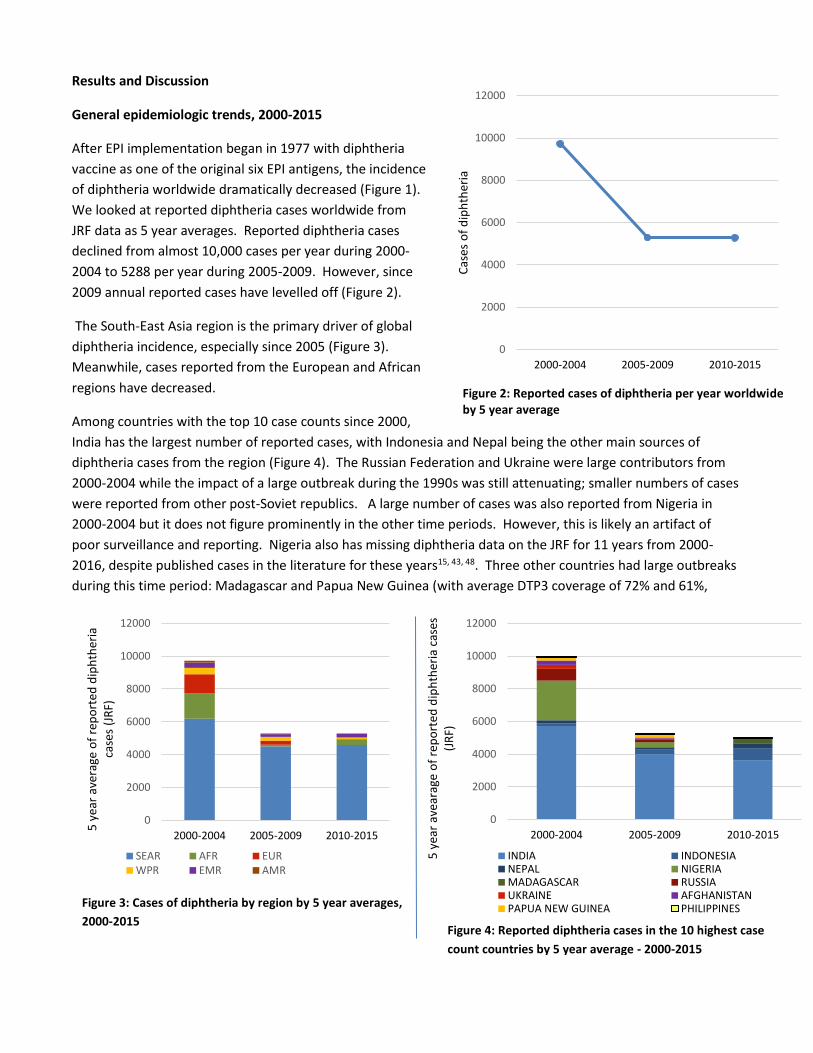
After EPI implementation began in 1977 with diphtheria
vaccine as one of the original six EPI antigens, the incidence
of diphtheria worldwide dramatically decreased (Figure 1).
We looked at reported diphtheria cases worldwide from
JRF data as 5 year averages. Reported diphtheria cases
declined from almost 10,000 cases per year during 2000-
2004 to 5288 per year during 2005-2009. However, since
2009 annual reported cases have levelled off (Figure 2).
The South-East Asia region is the primary driver of global
diphtheria incidence, especially since 2005 (Figure 3).
Meanwhile, cases reported from the European and African
regions have decreased.
Among countries with the top 10 case counts since 2000,
India has the largest number of reported cases, with Indonesia and Nepal being the other main sources of
diphtheria cases from the region (Figure 4). The Russian Federation and Ukraine were large contributors from
2000-2004 while the impact of a large outbreak during the 1990s was still attenuating; smaller numbers of cases
were reported from other post-Soviet republics. A large number of cases was also reported from Nigeria in
2000-2004 but it does not figure prominently in the other time periods. However, this is likely an artifact of
poor surveillance and reporting. Nigeria also has missing diphtheria data on the JRF for 11 years from 2000-
2016, despite published cases in the literature for these years15, 43, 48. Three other countries had large outbreaks
during this time period: Madagascar and Papua New Guinea (with average DTP3 coverage of 72% and 61%,
0
2000
4000
6000
8000
10000
12000
2000-2004 2005-2009 2010-2015
5 y
ear
aver
age
of
rep
ort
ed d
iph
ther
ia
case
s (J
RF)
SEAR AFR EURWPR EMR AMR
0
2000
4000
6000
8000
10000
12000
2000-2004 2005-2009 2010-2015
Cas
es o
f d
iph
ther
ia
0
2000
4000
6000
8000
10000
12000
2000-2004 2005-2009 2010-2015
5 y
ear
avea
rage
of
rep
ort
ed d
iph
ther
ia c
ases
(J
RF)
INDIA INDONESIANEPAL NIGERIAMADAGASCAR RUSSIAUKRAINE AFGHANISTANPAPUA NEW GUINEA PHILIPPINES
Figure 2: Reported cases of diphtheria per year worldwide by 5 year average
Figure 3: Cases of diphtheria by region by 5 year averages,
2000-2015 Figure 4: Reported diphtheria cases in the 10 highest case
count countries by 5 year average - 2000-2015
respectively, prior to their outbreaks) and Nepal (90% DTP3 coverage). All three of these countries recommend
3 dose primary schedule without booster doses.
National vaccination schedules, 2016
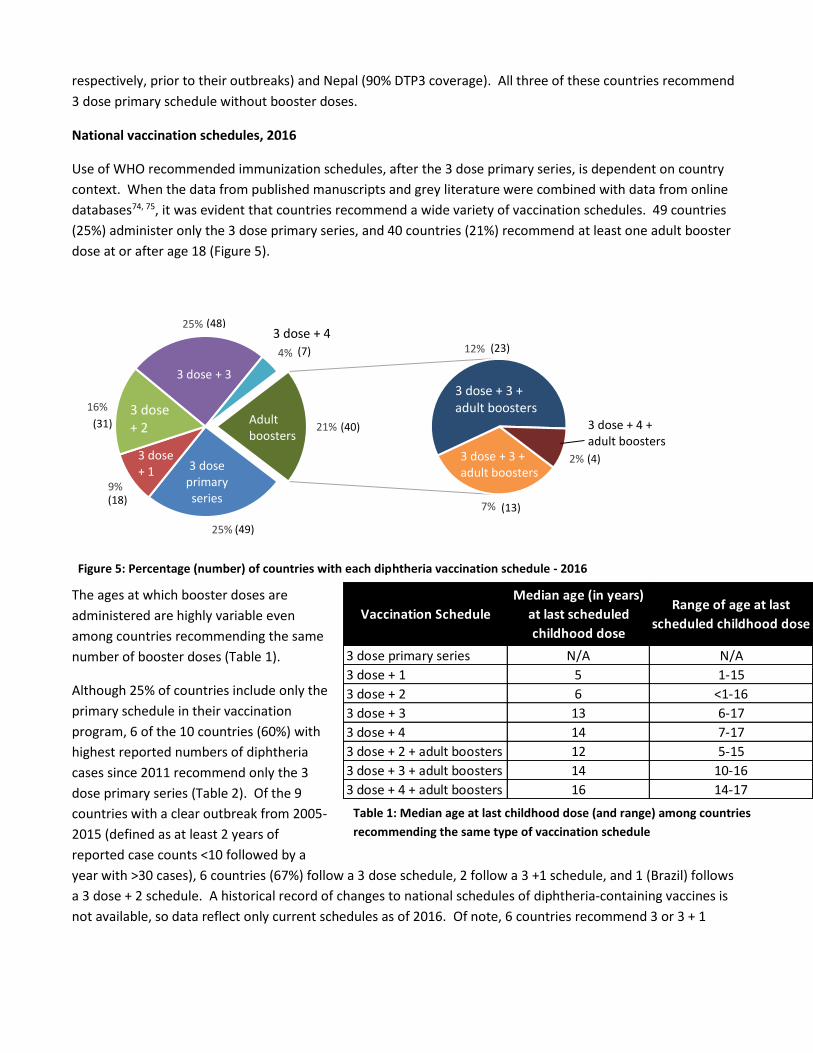
Use of WHO recommended immunization schedules, after the 3 dose primary series, is dependent on country
context. When the data from published manuscripts and grey literature were combined with data from online
databases74, 75, it was evident that countries recommend a wide variety of vaccination schedules. 49 countries
(25%) administer only the 3 dose primary series, and 40 countries (21%) recommend at least one adult booster
dose at or after age 18 (Figure 5).
The ages at which booster doses are
administered are highly variable even
among countries recommending the same
number of booster doses (Table 1).
Although 25% of countries include only the
primary schedule in their vaccination
program, 6 of the 10 countries (60%) with
highest reported numbers of diphtheria
cases since 2011 recommend only the 3
dose primary series (Table 2). Of the 9
countries with a clear outbreak from 2005-
2015 (defined as at least 2 years of
reported case counts <10 followed by a
year with >30 cases), 6 countries (67%) follow a 3 dose schedule, 2 follow a 3 +1 schedule, and 1 (Brazil) follows
a 3 dose + 2 schedule. A historical record of changes to national schedules of diphtheria-containing vaccines is
not available, so data reflect only current schedules as of 2016. Of note, 6 countries recommend 3 or 3 + 1
25%
9%
16%
25%
4%
7%
12%
2%
21%
3 dose + 3
Adultboosters
3 dose + 4 + adult boosters
3 dose + 3 + adult boosters
3 dose primary series
3 dose + 2
3 dose + 4
3 dose + 1
(48)
(40)
(49)
(18)
(31)
(13)
(4)
(23)(7)
3 dose + 3 + adult boosters
Figure 5: Percentage (number) of countries with each diphtheria vaccination schedule - 2016
Vaccination Schedule
Median age (in years)
at last scheduled
childhood dose
Range of age at last
scheduled childhood dose
3 dose primary series N/A N/A
3 dose + 1 5 1-15
3 dose + 2 6 <1-16
3 dose + 3 13 6-17
3 dose + 4 14 7-17
3 dose + 2 + adult boosters 12 5-15
3 dose + 3 + adult boosters 14 10-16
3 dose + 4 + adult boosters 16 14-17
Table 1: Median age at last childhood dose (and range) among countries
recommending the same type of vaccination schedule
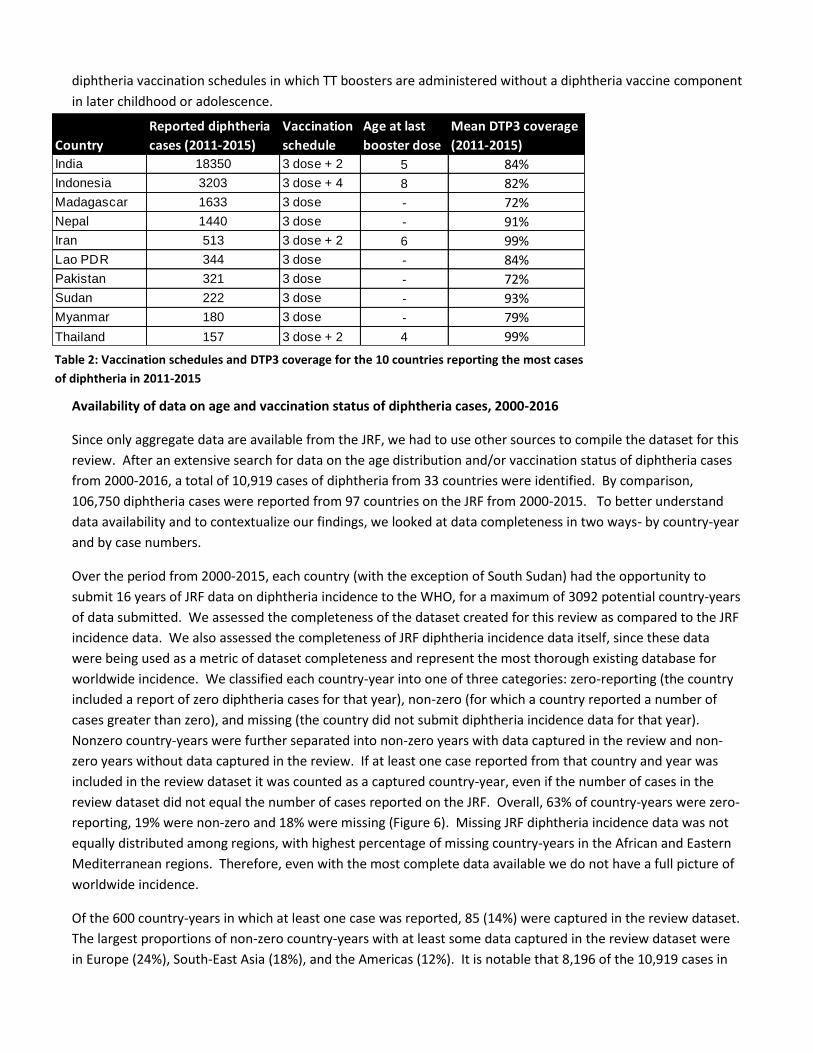
diphtheria vaccination schedules in which TT boosters are administered without a diphtheria vaccine component
in later childhood or adolescence.
Availability of data on age and vaccination status of diphtheria cases, 2000-2016
Since only aggregate data are available from the JRF, we had to use other sources to compile the dataset for this
review. After an extensive search for data on the age distribution and/or vaccination status of diphtheria cases
from 2000-2016, a total of 10,919 cases of diphtheria from 33 countries were identified. By comparison,
106,750 diphtheria cases were reported from 97 countries on the JRF from 2000-2015. To better understand
data availability and to contextualize our findings, we looked at data completeness in two ways- by country-year
and by case numbers.
Over the period from 2000-2015, each country (with the exception of South Sudan) had the opportunity to
submit 16 years of JRF data on diphtheria incidence to the WHO, for a maximum of 3092 potential country-years
of data submitted. We assessed the completeness of the dataset created for this review as compared to the JRF
incidence data. We also assessed the completeness of JRF diphtheria incidence data itself, since these data
were being used as a metric of dataset completeness and represent the most thorough existing database for
worldwide incidence. We classified each country-year into one of three categories: zero-reporting (the country
included a report of zero diphtheria cases for that year), non-zero (for which a country reported a number of
cases greater than zero), and missing (the country did not submit diphtheria incidence data for that year).
Nonzero country-years were further separated into non-zero years with data captured in the review and non-
zero years without data captured in the review. If at least one case reported from that country and year was
included in the review dataset it was counted as a captured country-year, even if the number of cases in the
review dataset did not equal the number of cases reported on the JRF. Overall, 63% of country-years were zero-
reporting, 19% were non-zero and 18% were missing (Figure 6). Missing JRF diphtheria incidence data was not
equally distributed among regions, with highest percentage of missing country-years in the African and Eastern
Mediterranean regions. Therefore, even with the most complete data available we do not have a full picture of
worldwide incidence.
Of the 600 country-years in which at least one case was reported, 85 (14%) were captured in the review dataset.
The largest proportions of non-zero country-years with at least some data captured in the review dataset were
in Europe (24%), South-East Asia (18%), and the Americas (12%). It is notable that 8,196 of the 10,919 cases in
Country
Reported diphtheria
cases (2011-2015)
Vaccination
schedule
Age at last
booster dose
Mean DTP3 coverage
(2011-2015)
India 18350 3 dose + 2 5 84%
Indonesia 3203 3 dose + 4 8 82%
Madagascar 1633 3 dose - 72%
Nepal 1440 3 dose - 91%
Iran 513 3 dose + 2 6 99%
Lao PDR 344 3 dose - 84%
Pakistan 321 3 dose - 72%
Sudan 222 3 dose - 93%
Myanmar 180 3 dose - 79%
Thailand 157 3 dose + 2 4 99%
Table 2: Vaccination schedules and DTP3 coverage for the 10 countries reporting the most cases
of diphtheria in 2011-2015
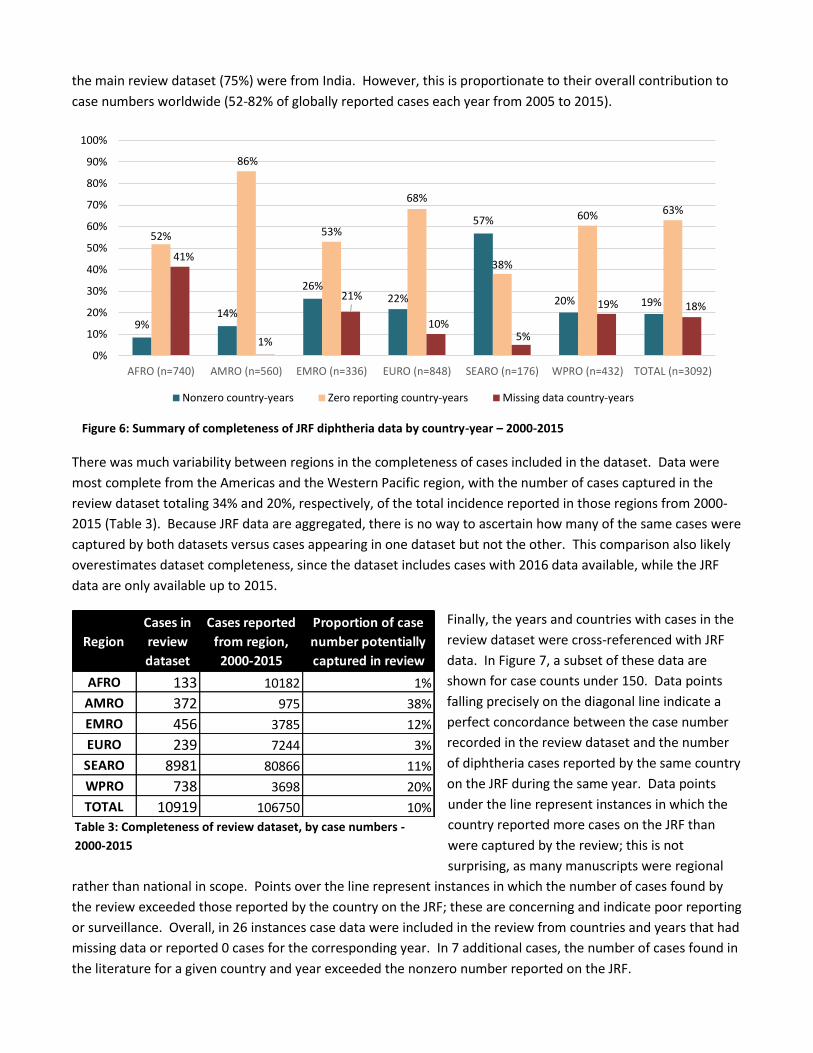
the main review dataset (75%) were from India. However, this is proportionate to their overall contribution to
case numbers worldwide (52-82% of globally reported cases each year from 2005 to 2015).
There was much variability between regions in the completeness of cases included in the dataset. Data were
most complete from the Americas and the Western Pacific region, with the number of cases captured in the
review dataset totaling 34% and 20%, respectively, of the total incidence reported in those regions from 2000-
2015 (Table 3). Because JRF data are aggregated, there is no way to ascertain how many of the same cases were
captured by both datasets versus cases appearing in one dataset but not the other. This comparison also likely
overestimates dataset completeness, since the dataset includes cases with 2016 data available, while the JRF
data are only available up to 2015.
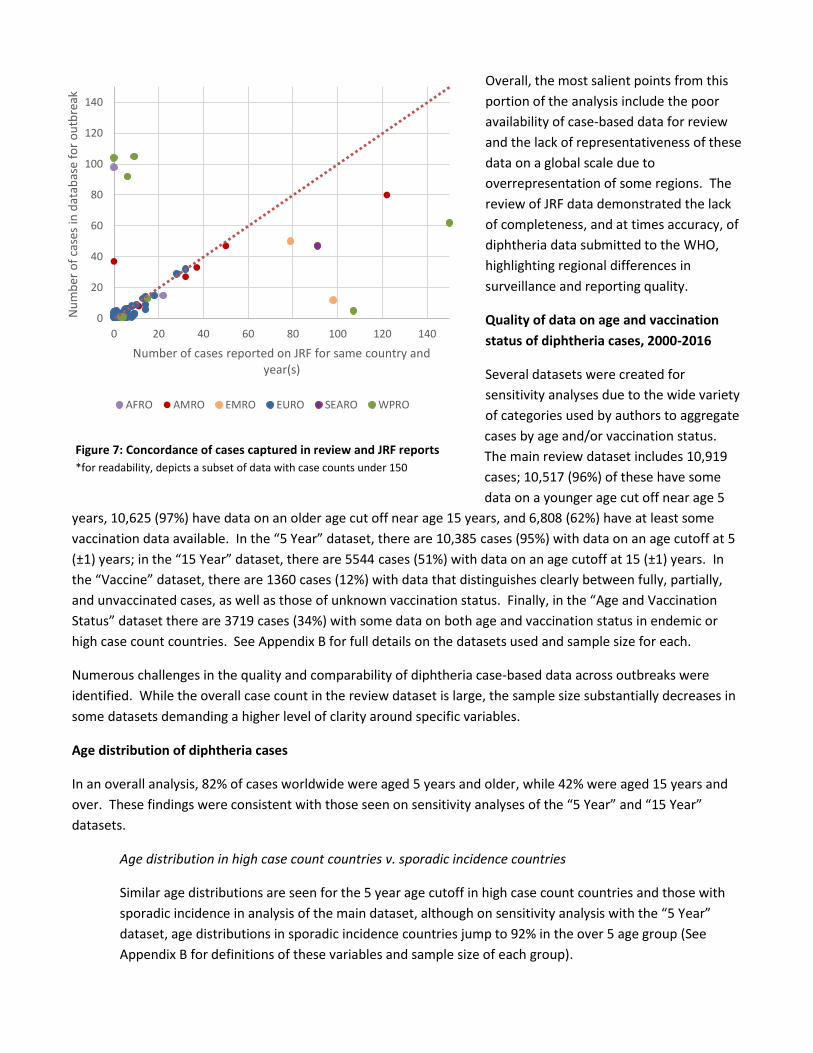
Finally, the years and countries with cases in the
review dataset were cross-referenced with JRF
data. In Figure 7, a subset of these data are
shown for case counts under 150. Data points
falling precisely on the diagonal line indicate a
perfect concordance between the case number
recorded in the review dataset and the number
of diphtheria cases reported by the same country
on the JRF during the same year. Data points
under the line represent instances in which the
country reported more cases on the JRF than
were captured by the review; this is not
surprising, as many manuscripts were regional
rather than national in scope. Points over the line represent instances in which the number of cases found by
the review exceeded those reported by the country on the JRF; these are concerning and indicate poor reporting
or surveillance. Overall, in 26 instances case data were included in the review from countries and years that had
missing data or reported 0 cases for the corresponding year. In 7 additional cases, the number of cases found in
the literature for a given country and year exceeded the nonzero number reported on the JRF.
9%14%
26%22%
57%
20% 19%
52%
86%
53%
68%
38%
60% 63%
41%
1%
21%
10%5%
19% 18%
0%
10%
20%
30%
40%
50%
60%
70%
80%
90%
100%
AFRO (n=740) AMRO (n=560) EMRO (n=336) EURO (n=848) SEARO (n=176) WPRO (n=432) TOTAL (n=3092)
Nonzero country-years Zero reporting country-years Missing data country-years
Figure 6: Summary of completeness of JRF diphtheria data by country-year – 2000-2015
2015
Table 3: Completeness of review dataset, by case numbers -
2000-2015
Region
Cases in
review
dataset
Cases reported
from region,
2000-2015
Proportion of case
number potentially
captured in review
AFRO 133 10182 1%
AMRO 372 975 38%
EMRO 456 3785 12%
EURO 239 7244 3%
SEARO 8981 80866 11%
WPRO 738 3698 20%
TOTAL 10919 106750 10%
Overall, the most salient points from this
portion of the analysis include the poor
availability of case-based data for review
and the lack of representativeness of these
data on a global scale due to
overrepresentation of some regions. The
review of JRF data demonstrated the lack
of completeness, and at times accuracy, of
diphtheria data submitted to the WHO,
highlighting regional differences in
surveillance and reporting quality.
Quality of data on age and vaccination
status of diphtheria cases, 2000-2016
Several datasets were created for
sensitivity analyses due to the wide variety
of categories used by authors to aggregate
cases by age and/or vaccination status.
The main review dataset includes 10,919
cases; 10,517 (96%) of these have some
data on a younger age cut off near age 5
years, 10,625 (97%) have data on an older age cut off near age 15 years, and 6,808 (62%) have at least some
vaccination data available. In the “5 Year” dataset, there are 10,385 cases (95%) with data on an age cutoff at 5
(±1) years; in the “15 Year” dataset, there are 5544 cases (51%) with data on an age cutoff at 15 (±1) years. In
the “Vaccine” dataset, there are 1360 cases (12%) with data that distinguishes clearly between fully, partially,
and unvaccinated cases, as well as those of unknown vaccination status. Finally, in the “Age and Vaccination
Status” dataset there are 3719 cases (34%) with some data on both age and vaccination status in endemic or
high case count countries. See Appendix B for full details on the datasets used and sample size for each.
Numerous challenges in the quality and comparability of diphtheria case-based data across outbreaks were
identified. While the overall case count in the review dataset is large, the sample size substantially decreases in
some datasets demanding a higher level of clarity around specific variables.
Age distribution of diphtheria cases
In an overall analysis, 82% of cases worldwide were aged 5 years and older, while 42% were aged 15 years and
over. These findings were consistent with those seen on sensitivity analyses of the “5 Year” and “15 Year”
datasets.
Age distribution in high case count countries v. sporadic incidence countries
Similar age distributions are seen for the 5 year age cutoff in high case count countries and those with
sporadic incidence in analysis of the main dataset, although on sensitivity analysis with the “5 Year”
dataset, age distributions in sporadic incidence countries jump to 92% in the over 5 age group (See
Appendix B for definitions of these variables and sample size of each group).
0
20
40
60
80
100
120
140
0 20 40 60 80 100 120 140
Nu
mb
er o
f ca
ses
in d
atab
ase
for
ou
tbre
ak
Number of cases reported on JRF for same country and year(s)
AFRO AMRO EMRO EURO SEARO WPRO
Figure 7: Concordance of cases captured in review and JRF reports
*for readability, depicts a subset of data with case counts under 150
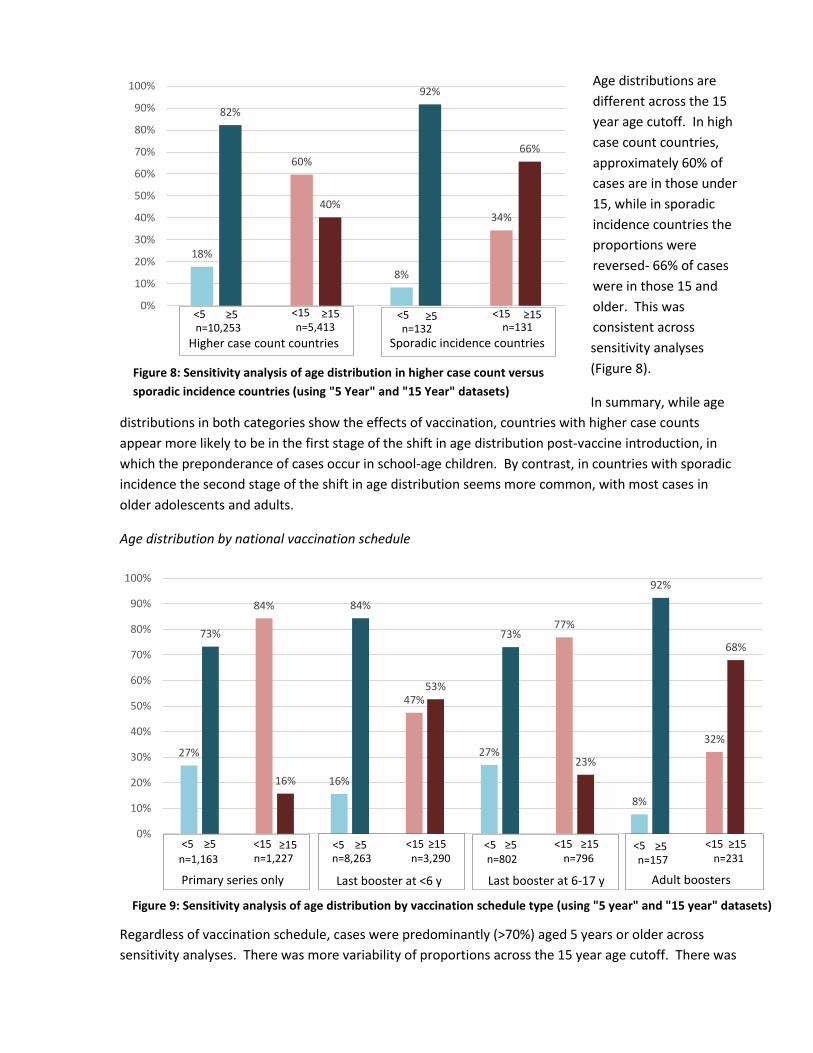
Age distributions are
different across the 15
year age cutoff. In high
case count countries,
approximately 60% of
cases are in those under
15, while in sporadic
incidence countries the
proportions were
reversed- 66% of cases
were in those 15 and
older. This was
consistent across
sensitivity analyses
(Figure 8).
In summary, while age
distributions in both categories show the effects of vaccination, countries with higher case counts
appear more likely to be in the first stage of the shift in age distribution post-vaccine introduction, in
which the preponderance of cases occur in school-age children. By contrast, in countries with sporadic
incidence the second stage of the shift in age distribution seems more common, with most cases in
older adolescents and adults.
Age distribution by national vaccination schedule
Regardless of vaccination schedule, cases were predominantly (>70%) aged 5 years or older across
sensitivity analyses. There was more variability of proportions across the 15 year age cutoff. There was
18%
60%
8%
34%
82%
40%
92%
66%
0%
10%
20%
30%
40%
50%
60%
70%
80%
90%
100%
Figure 8: Sensitivity analysis of age distribution in higher case count versus
sporadic incidence countries (using "5 Year" and "15 Year" datasets)
<5 <5 <15 <15 ≥5 ≥5 ≥15 ≥15
Higher case count countries
Sporadic incidence countries
n=10,253
n=5,413
n=132
n=131
Figure 9: Sensitivity analysis of age distribution by vaccination schedule type (using "5 year" and "15 year" datasets)
27%
84%
16%
47%
27%
77%
8%
32%
73%
16%
84%
53%
73%
23%
92%
68%
0%
10%
20%
30%
40%
50%
60%
70%
80%
90%
100%
<5 <5 <5 <5 ≥5 ≥5 ≥5 ≥5 <15 <15 <15 <15 ≥15 ≥15 ≥15 ≥15
Primary series only
Last booster at <6 y
Last booster at 6-17 y
yeayearsyearsyears
Adult boosters
yeayearsyearsyears
n=1,227
n=8,263
n=1,163
n=3,290
n=802
n=796
n=157
n=231
a predominance of cases among persons aged 15 and over only from countries offering adult boosters.
In contrast, a larger proportion of cases occurred among persons under 15 years of age in countries
offering just the primary series and those offering the last booster between 6-17 years of age. The age
distribution of cases in countries offering the last booster before 6 years of age was more evenly split
around the 15 year cutoff. However, this group was largely dominated by cases from India (75%) and
might better represent the trends from one nation rather than countries using the vaccination schedule
as a group. These cases showed a slight predominance (54%) of cases under 15 on analysis of the main
dataset, which switched to a predominance of cases 15 and up (53%) on sensitivity analysis with the “15
Year” dataset (Figure 9).
Overall, the first stage of the age shift (predominance of cases in school-age children) seems to apply to
countries in the dataset recommending either the primary schedule or giving the last booster to school-
age children. The group of countries giving the last dose prior to age 6 years (predominantly India) had a
pattern in which case counts were similar above and below age 15 years; this could potentially suggest a
transition between the first and second stage of the age shift, in which more cases are occurring in older
adolescents and adults but they still do not represent the majority of cases.
Vaccination status of diphtheria cases
On analysis, 65% of cases were unvaccinated, 12% were partially vaccinated, and 23% were fully vaccinated. On
sensitivity analysis with the “Vaccine” database, the proportion of unvaccinated cases rose to 73%, while there
were lower proportions of cases that received vaccines. It is notable that different sources had different
definitions (when stated) for “fully vaccinated” depending on the vaccination schedule of the country or
preferences of the investigators. However, in general fully vaccinated can be considered as receiving at least all
3 doses of the primary series.
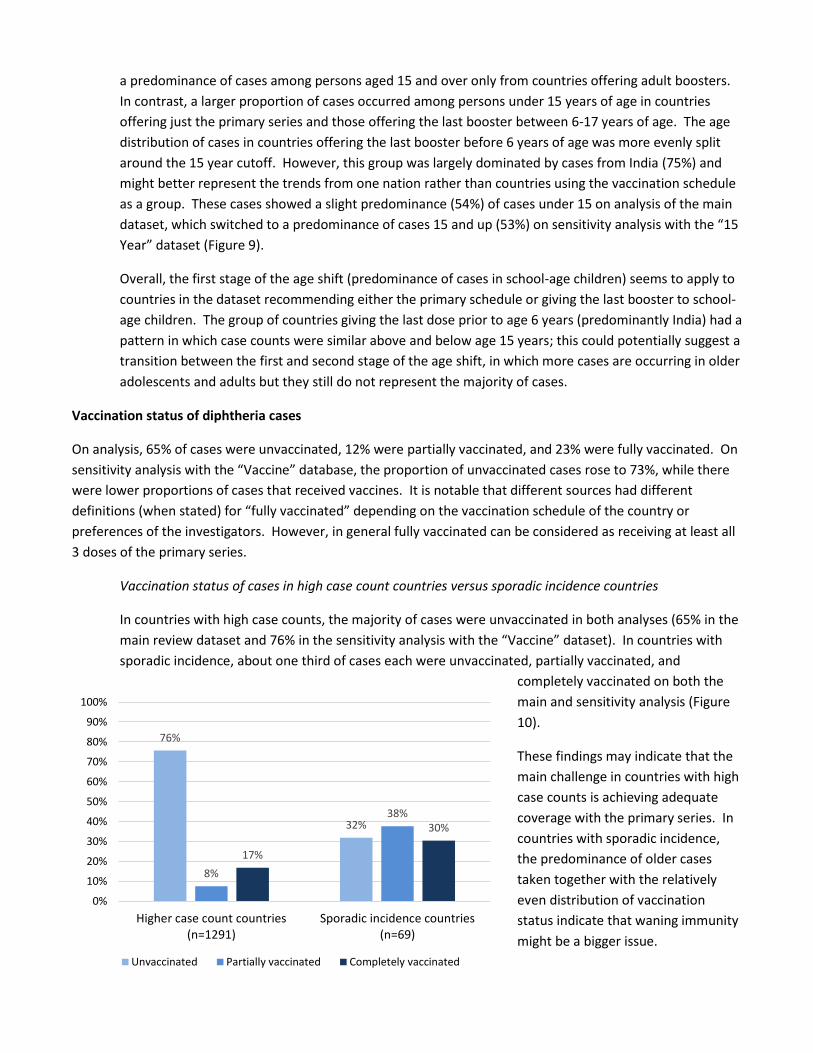
Vaccination status of cases in high case count countries versus sporadic incidence countries
In countries with high case counts, the majority of cases were unvaccinated in both analyses (65% in the
main review dataset and 76% in the sensitivity analysis with the “Vaccine” dataset). In countries with
sporadic incidence, about one third of cases each were unvaccinated, partially vaccinated, and
completely vaccinated on both the
main and sensitivity analysis (Figure
10).
These findings may indicate that the
main challenge in countries with high
case counts is achieving adequate
coverage with the primary series. In
countries with sporadic incidence,
the predominance of older cases
taken together with the relatively
even distribution of vaccination
status indicate that waning immunity
might be a bigger issue.
76%
32%
8%
38%
17%
30%
0%
10%
20%
30%
40%
50%
60%
70%
80%
90%
100%
Higher case count countries(n=1291)
Sporadic incidence countries(n=69)
Unvaccinated Partially vaccinated Completely vaccinated
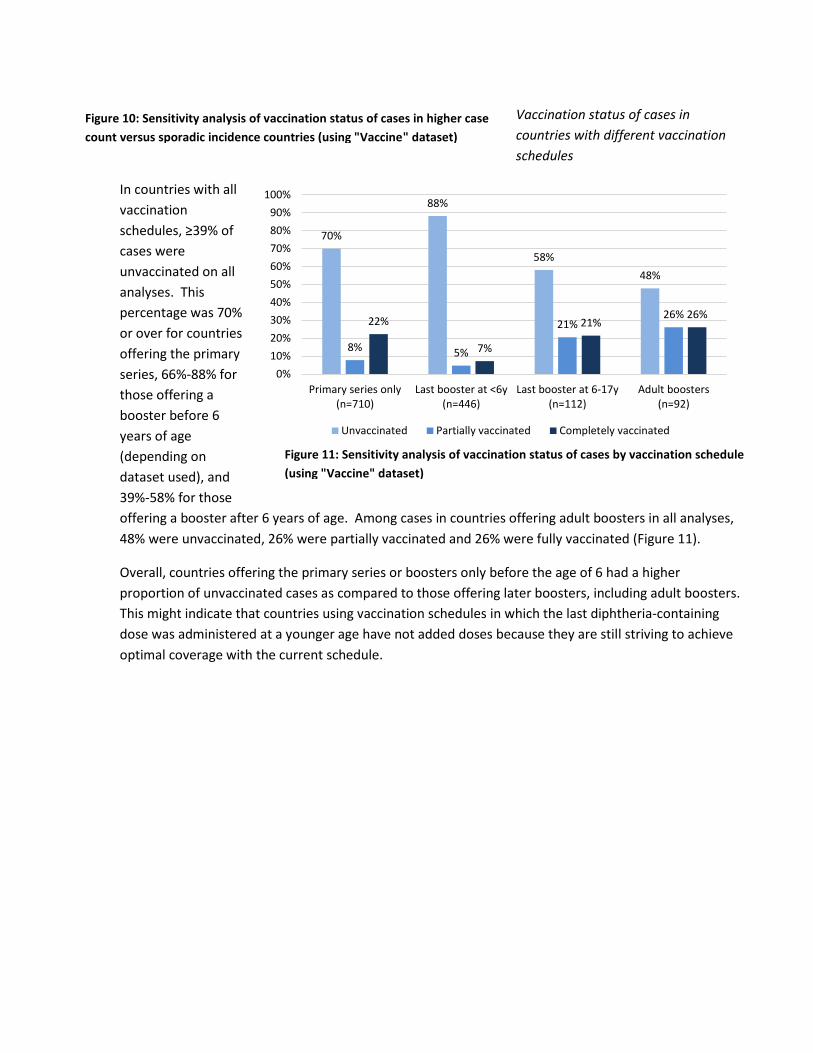
Vaccination status of cases in
countries with different vaccination
schedules
In countries with all
vaccination
schedules, ≥39% of
cases were
unvaccinated on all
analyses. This
percentage was 70%
or over for countries
offering the primary
series, 66%-88% for
those offering a
booster before 6
years of age
(depending on
dataset used), and
39%-58% for those
offering a booster after 6 years of age. Among cases in countries offering adult boosters in all analyses,
48% were unvaccinated, 26% were partially vaccinated and 26% were fully vaccinated (Figure 11).
Overall, countries offering the primary series or boosters only before the age of 6 had a higher
proportion of unvaccinated cases as compared to those offering later boosters, including adult boosters.
This might indicate that countries using vaccination schedules in which the last diphtheria-containing
dose was administered at a younger age have not added doses because they are still striving to achieve
optimal coverage with the current schedule.
70%
88%
58%
48%
8% 5%
21%26%
22%
7%
21%26%
0%
10%
20%
30%
40%
50%
60%
70%
80%
90%
100%
Primary series only(n=710)
Last booster at <6y(n=446)
Last booster at 6-17y(n=112)
Adult boosters(n=92)
Unvaccinated Partially vaccinated Completely vaccinated
Figure 10: Sensitivity analysis of vaccination status of cases in higher case
count versus sporadic incidence countries (using "Vaccine" dataset)
Figure 11: Sensitivity analysis of vaccination status of cases by vaccination schedule
(using "Vaccine" dataset)
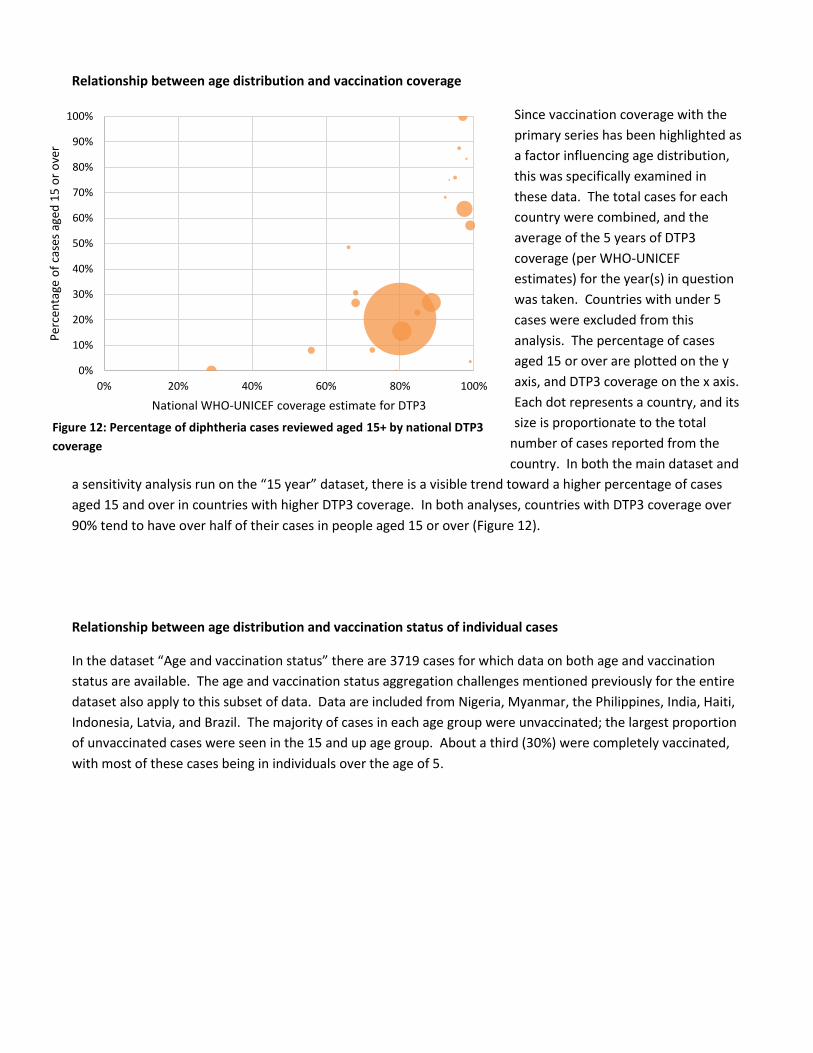
Relationship between age distribution and vaccination coverage
Since vaccination coverage with the
primary series has been highlighted as
a factor influencing age distribution,
this was specifically examined in
these data. The total cases for each
country were combined, and the
average of the 5 years of DTP3
coverage (per WHO-UNICEF
estimates) for the year(s) in question
was taken. Countries with under 5
cases were excluded from this
analysis. The percentage of cases
aged 15 or over are plotted on the y
axis, and DTP3 coverage on the x axis.
Each dot represents a country, and its
size is proportionate to the total
number of cases reported from the
country. In both the main dataset and
a sensitivity analysis run on the “15 year” dataset, there is a visible trend toward a higher percentage of cases
aged 15 and over in countries with higher DTP3 coverage. In both analyses, countries with DTP3 coverage over
90% tend to have over half of their cases in people aged 15 or over (Figure 12).
Relationship between age distribution and vaccination status of individual cases
In the dataset “Age and vaccination status” there are 3719 cases for which data on both age and vaccination
status are available. The age and vaccination status aggregation challenges mentioned previously for the entire
dataset also apply to this subset of data. Data are included from Nigeria, Myanmar, the Philippines, India, Haiti,
Indonesia, Latvia, and Brazil. The majority of cases in each age group were unvaccinated; the largest proportion
of unvaccinated cases were seen in the 15 and up age group. About a third (30%) were completely vaccinated,
with most of these cases being in individuals over the age of 5.
0%
10%
20%
30%
40%
50%
60%
70%
80%
90%
100%
0% 20% 40% 60% 80% 100%
Per
cen
tage
of
case
s ag
ed 1
5 o
r o
ver
National WHO-UNICEF coverage estimate for DTP3
Figure 12: Percentage of diphtheria cases reviewed aged 15+ by national DTP3
coverage
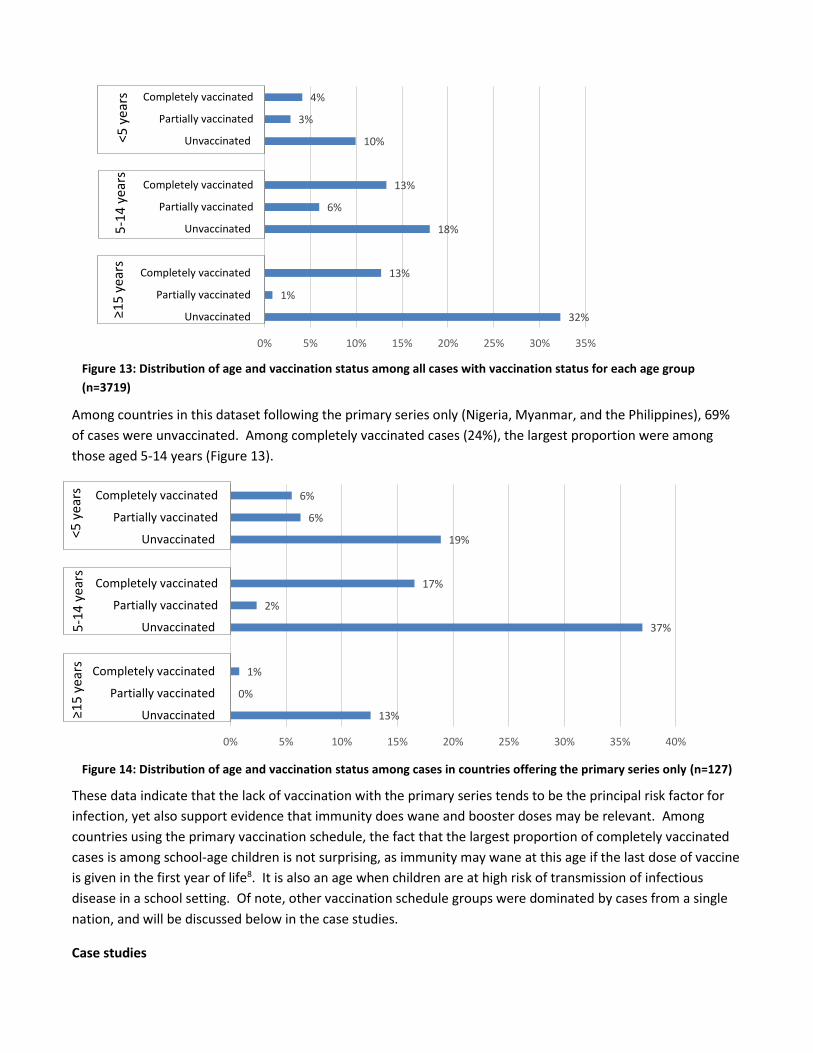
Among countries in this dataset following the primary series only (Nigeria, Myanmar, and the Philippines), 69%
of cases were unvaccinated. Among completely vaccinated cases (24%), the largest proportion were among
those aged 5-14 years (Figure 13).
These data indicate that the lack of vaccination with the primary series tends to be the principal risk factor for
infection, yet also support evidence that immunity does wane and booster doses may be relevant. Among
countries using the primary vaccination schedule, the fact that the largest proportion of completely vaccinated
cases is among school-age children is not surprising, as immunity may wane at this age if the last dose of vaccine
is given in the first year of life8. It is also an age when children are at high risk of transmission of infectious
disease in a school setting. Of note, other vaccination schedule groups were dominated by cases from a single
nation, and will be discussed below in the case studies.
Case studies
Figure 14: Distribution of age and vaccination status among cases in countries offering the primary series only (n=127)
<5 y
ears
13%
0%
1%
37%
2%
17%
19%
6%
6%
0% 5% 10% 15% 20% 25% 30% 35% 40%
Unvaccinated
Partially vaccinated
Completely vaccinated
Unvaccinated
Partially vaccinated
Completely vaccinated
Unvaccinated
Partially vaccinated
Completely vaccinated
5-1
4 y
ears
≥1
5 ye
ars
Figure 13: Distribution of age and vaccination status among all cases with vaccination status for each age group
(n=3719)
<5 y
ears
5
-14
yea
rs
year
syea
rs
≥1
5 y
ears
32%
1%
13%
18%
6%
13%
10%
3%
4%
0% 5% 10% 15% 20% 25% 30% 35%
Unvaccinated
Partially vaccinated
Completely vaccinated
Unvaccinated
Partially vaccinated
Completely vaccinated
Unvaccinated
Partially vaccinated
Completely vaccinated
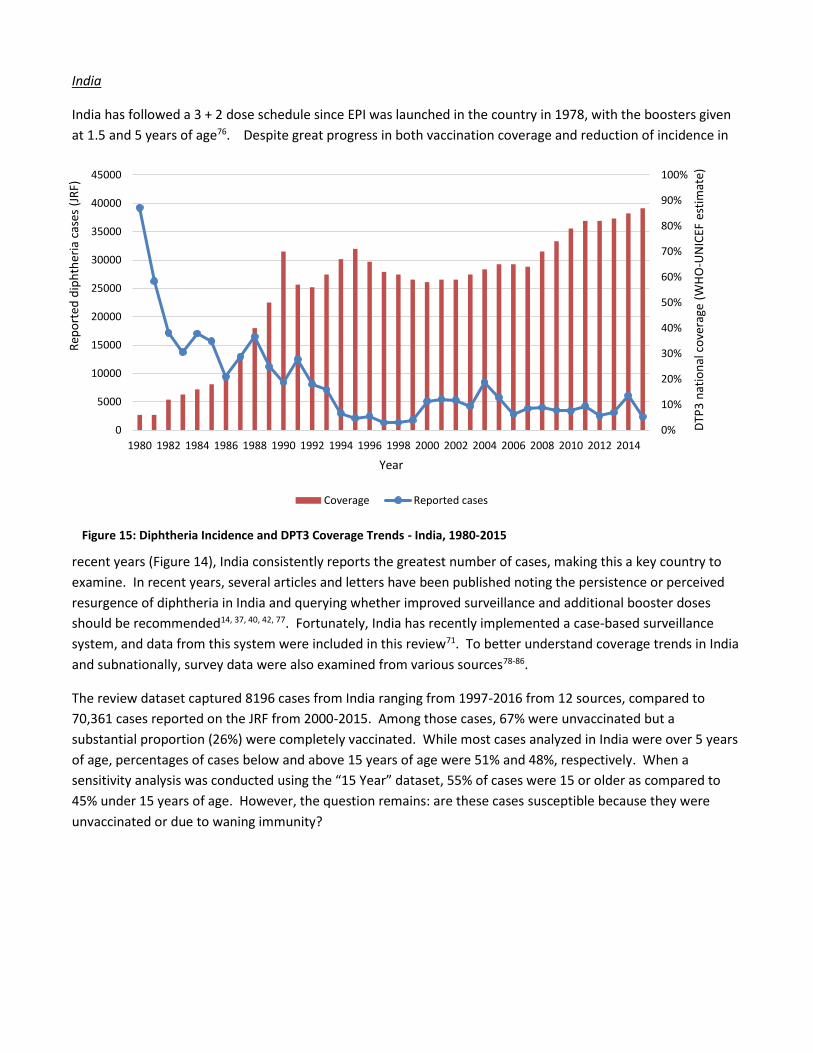
India
India has followed a 3 + 2 dose schedule since EPI was launched in the country in 1978, with the boosters given
at 1.5 and 5 years of age76. Despite great progress in both vaccination coverage and reduction of incidence in
recent years (Figure 14), India consistently reports the greatest number of cases, making this a key country to
examine. In recent years, several articles and letters have been published noting the persistence or perceived
resurgence of diphtheria in India and querying whether improved surveillance and additional booster doses
should be recommended14, 37, 40, 42, 77. Fortunately, India has recently implemented a case-based surveillance
system, and data from this system were included in this review71. To better understand coverage trends in India
and subnationally, survey data were also examined from various sources78-86.
The review dataset captured 8196 cases from India ranging from 1997-2016 from 12 sources, compared to
70,361 cases reported on the JRF from 2000-2015. Among those cases, 67% were unvaccinated but a
substantial proportion (26%) were completely vaccinated. While most cases analyzed in India were over 5 years
of age, percentages of cases below and above 15 years of age were 51% and 48%, respectively. When a
sensitivity analysis was conducted using the “15 Year” dataset, 55% of cases were 15 or older as compared to
45% under 15 years of age. However, the question remains: are these cases susceptible because they were
unvaccinated or due to waning immunity?
Figure 15: Diphtheria Incidence and DPT3 Coverage Trends - India, 1980-2015
0%
10%
20%
30%
40%
50%
60%
70%
80%
90%
100%
0
5000
10000
15000
20000
25000
30000
35000
40000
45000
1980 1982 1984 1986 1988 1990 1992 1994 1996 1998 2000 2002 2004 2006 2008 2010 2012 2014
DTP
3 n
atio
nal
co
vera
ge (
WH
O-U
NIC
EF e
stim
ate)
Rep
ort
ed d
iph
ther
ia c
ases
(JR
F)
Year
Coverage Reported cases
We approached this question in two ways; first, the incidence and coverage trends were assessed. Out of the
population analyzed above, cases 15 years of age would have been born in 1982- 1998, a period when DTP3
coverage was still ramping up (Figure 14). Therefore it is likely many of these cases in adolescents and adults are
in unvaccinated individuals. Because diphtheria incidence dropped sharply in the early 1980s, it is also likely
that, even if vaccinated, immunity in this population may have waned due to lower exposure to disease in the
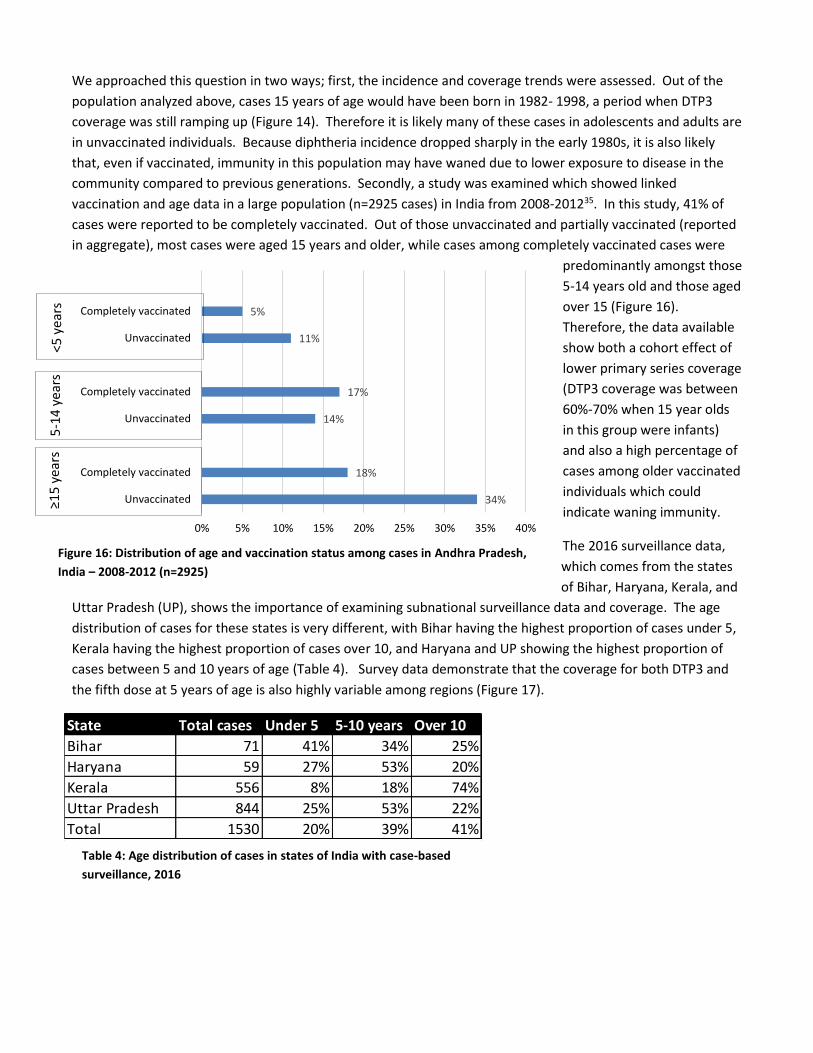
community compared to previous generations. Secondly, a study was examined which showed linked
vaccination and age data in a large population (n=2925 cases) in India from 2008-201235. In this study, 41% of
cases were reported to be completely vaccinated. Out of those unvaccinated and partially vaccinated (reported
in aggregate), most cases were aged 15 years and older, while cases among completely vaccinated cases were
predominantly amongst those
5-14 years old and those aged
over 15 (Figure 16).
Therefore, the data available
show both a cohort effect of
lower primary series coverage
(DTP3 coverage was between
60%-70% when 15 year olds
in this group were infants)
and also a high percentage of
cases among older vaccinated
individuals which could
indicate waning immunity.
The 2016 surveillance data,
which comes from the states
of Bihar, Haryana, Kerala, and
Uttar Pradesh (UP), shows the importance of examining subnational surveillance data and coverage. The age
distribution of cases for these states is very different, with Bihar having the highest proportion of cases under 5,
Kerala having the highest proportion of cases over 10, and Haryana and UP showing the highest proportion of
cases between 5 and 10 years of age (Table 4). Survey data demonstrate that the coverage for both DTP3 and
the fifth dose at 5 years of age is also highly variable among regions (Figure 17).
Table 4: Age distribution of cases in states of India with case-based
surveillance, 2016
State Total cases Under 5 5-10 years Over 10
Bihar 71 41% 34% 25%
Haryana 59 27% 53% 20%
Kerala 556 8% 18% 74%
Uttar Pradesh 844 25% 53% 22%
Total 1530 20% 39% 41%
≥15
yea
rs
5-1
4 y
ears
<5
yea
rs
34%
18%
14%
17%
11%
5%
0% 5% 10% 15% 20% 25% 30% 35% 40%
Unvaccinated
Completely vaccinated
Unvaccinated
Completely vaccinated
Unvaccinated
Completely vaccinated
Figure 16: Distribution of age and vaccination status among cases in Andhra Pradesh,
India – 2008-2012 (n=2925)
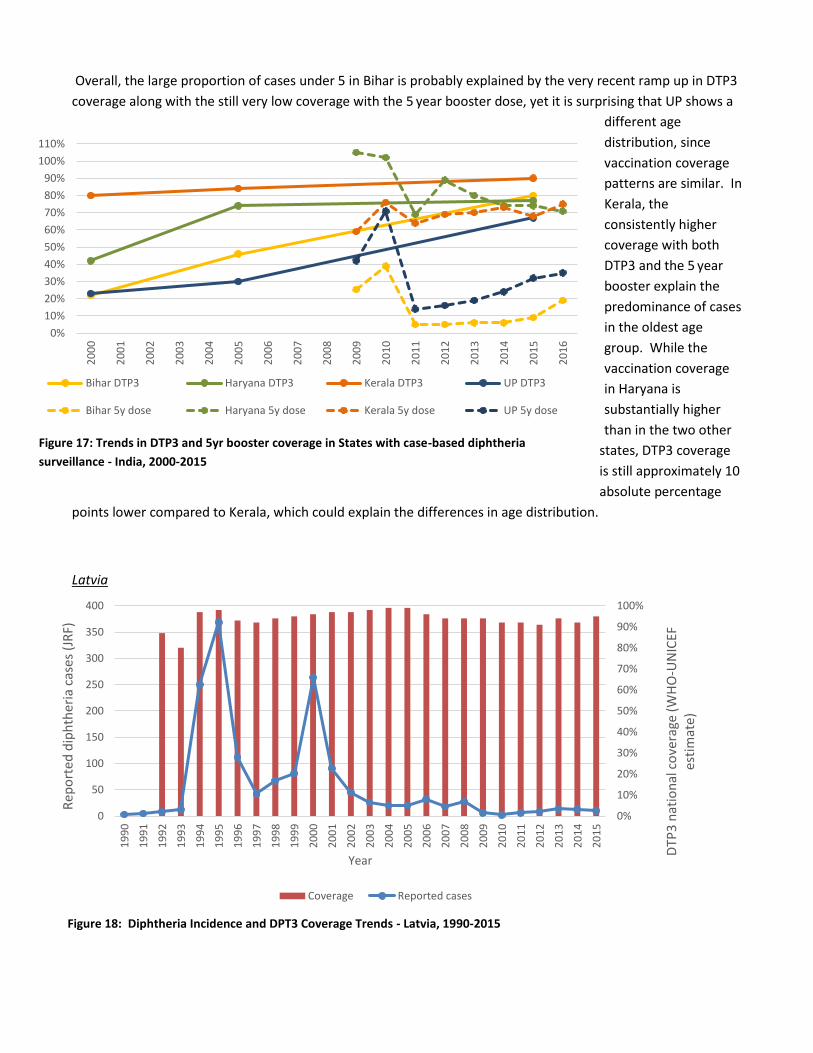
Overall, the large proportion of cases under 5 in Bihar is probably explained by the very recent ramp up in DTP3
coverage along with the still very low coverage with the 5 year booster dose, yet it is surprising that UP shows a
different age
distribution, since
vaccination coverage
patterns are similar. In
Kerala, the
consistently higher
coverage with both
DTP3 and the 5 year
booster explain the
predominance of cases
in the oldest age
group. While the
vaccination coverage
in Haryana is
substantially higher
than in the two other
states, DTP3 coverage
is still approximately 10
absolute percentage
points lower compared to Kerala, which could explain the differences in age distribution.
Latvia
0%
10%
20%
30%
40%
50%
60%
70%
80%
90%
100%
0
50
100
150
200
250
300
350
400
19
90
19
91
19
92
19
93
19
94
19
95
19
96
19
97
19
98
19
99
20
00
20
01
20
02
20
03
20
04
20
05
20
06
20
07
20
08
20
09
20
10
20
11
20
12
20
13
20
14
20
15
DTP
3 n
atio
nal
co
vera
ge (
WH
O-U
NIC
EF
esti
mat
e)
Rep
ort
ed d
iph
ther
ia c
ases
(JR
F)
Year
Coverage Reported cases
Figure 17: Trends in DTP3 and 5yr booster coverage in States with case-based diphtheria
surveillance - India, 2000-2015
0%
10%
20%
30%
40%
50%
60%
70%
80%
90%
100%
110%
20
00
20
01
20
02
20
03
20
04
20
05
20
06
20
07
20
08
20
09
20
10
20
11
20
12
20
13
20
14
20
15
20
16
Bihar DTP3 Haryana DTP3 Kerala DTP3 UP DTP3
Bihar 5y dose Haryana 5y dose Kerala 5y dose UP 5y dose
Figure 18: Diphtheria Incidence and DPT3 Coverage Trends - Latvia, 1990-2015
DTP3 coverage has historically been
high in Latvia, with a brief dip in the
early 1990s followed by the well-
documented outbreak in that
country and several other post-
Soviet republics (Figure 18). Routine
adult boosters have been
recommended since 1994. From
1994 to 2014, 43% of cases were in
individuals 40 years of age or older,
who were born near the time of the
introduction of DTP vaccine in the
former Soviet Union. Many in this
group were both missed by
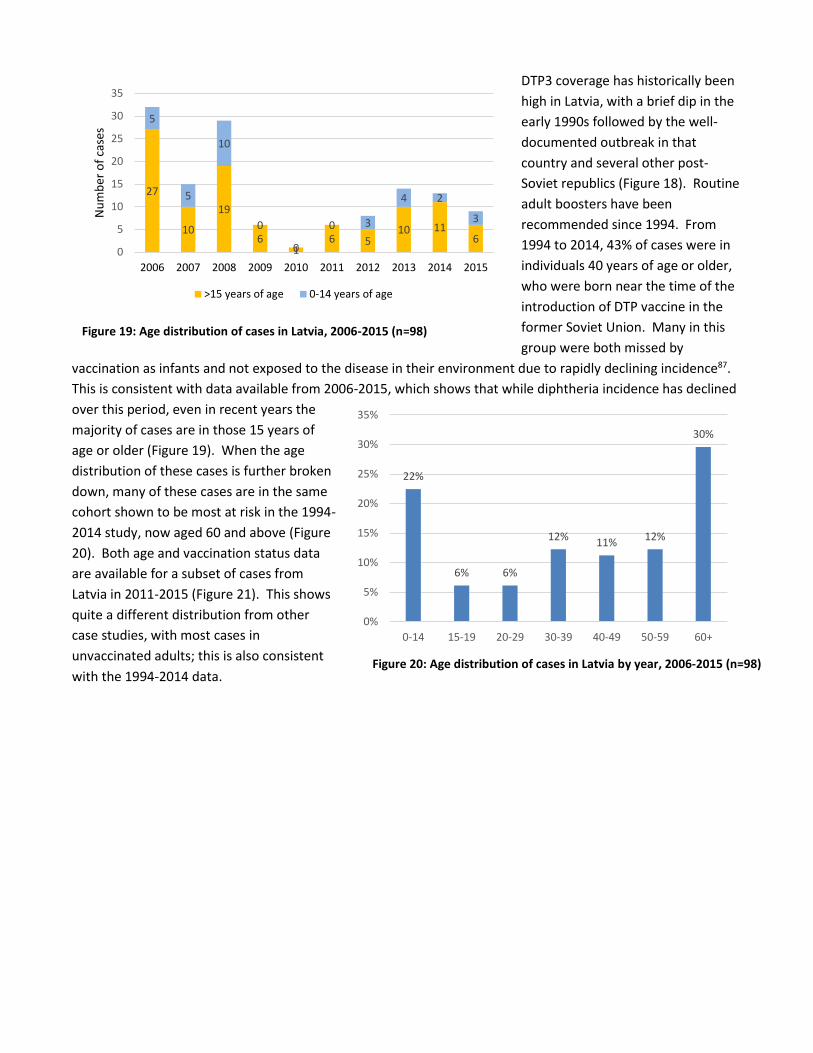
vaccination as infants and not exposed to the disease in their environment due to rapidly declining incidence87.
This is consistent with data available from 2006-2015, which shows that while diphtheria incidence has declined
over this period, even in recent years the
majority of cases are in those 15 years of
age or older (Figure 19). When the age
distribution of these cases is further broken
down, many of these cases are in the same
cohort shown to be most at risk in the 1994-
2014 study, now aged 60 and above (Figure
20). Both age and vaccination status data
are available for a subset of cases from
Latvia in 2011-2015 (Figure 21). This shows
quite a different distribution from other
case studies, with most cases in
unvaccinated adults; this is also consistent
with the 1994-2014 data.
27
10
19
61
6 510 11
6
5
5
10
0
0
0 3
4 2
3
0
5
10
15
20
25
30
35
2006 2007 2008 2009 2010 2011 2012 2013 2014 2015
Nu
mb
er o
f ca
ses
>15 years of age 0-14 years of age
22%
6% 6%
12%11%
12%
30%
0%
5%
10%
15%
20%
25%
30%
35%
0-14 15-19 20-29 30-39 40-49 50-59 60+
Figure 19: Age distribution of cases in Latvia, 2006-2015 (n=98)
Figure 20: Age distribution of cases in Latvia by year, 2006-2015 (n=98)
Philippines
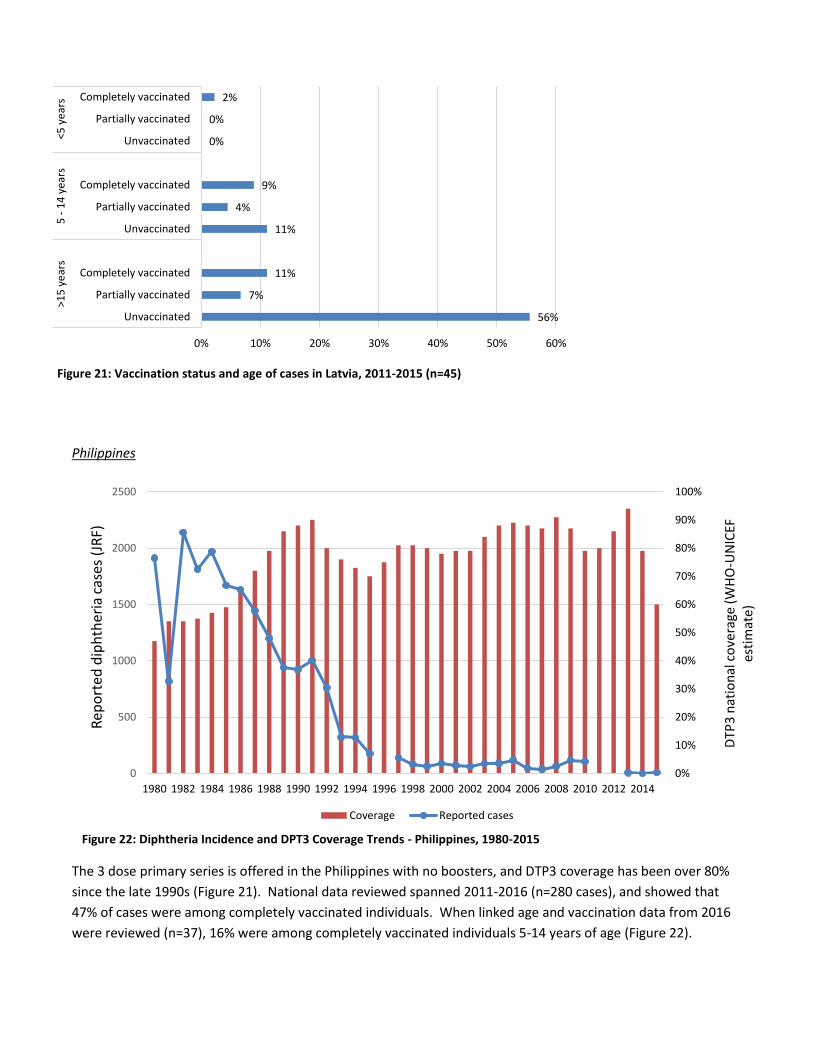
The 3 dose primary series is offered in the Philippines with no boosters, and DTP3 coverage has been over 80%
since the late 1990s (Figure 21). National data reviewed spanned 2011-2016 (n=280 cases), and showed that
47% of cases were among completely vaccinated individuals. When linked age and vaccination data from 2016
were reviewed (n=37), 16% were among completely vaccinated individuals 5-14 years of age (Figure 22).
Figure 22: Diphtheria Incidence and DPT3 Coverage Trends - Philippines, 1980-2015
0%
10%
20%
30%
40%
50%
60%
70%
80%
90%
100%
0
500
1000
1500
2000
2500
1980 1982 1984 1986 1988 1990 1992 1994 1996 1998 2000 2002 2004 2006 2008 2010 2012 2014
DTP
3 n
atio
nal
co
vera
ge (
WH
O-U
NIC
EF
esti
mat
e)
Rep
ort
ed d
iph
ther
ia c
ases
(JR
F)
Coverage Reported cases
56%
7%
11%
11%
4%
9%
0%
0%
2%
0% 10% 20% 30% 40% 50% 60%
Unvaccinated
Partially vaccinated
Completely vaccinated
Unvaccinated
Partially vaccinated
Completely vaccinated
Unvaccinated
Partially vaccinated
Completely vaccinated
>15
ye
ars
5 -
14
yea
rs<5
ye
ars
Figure 21: Vaccination status and age of cases in Latvia, 2011-2015 (n=45)
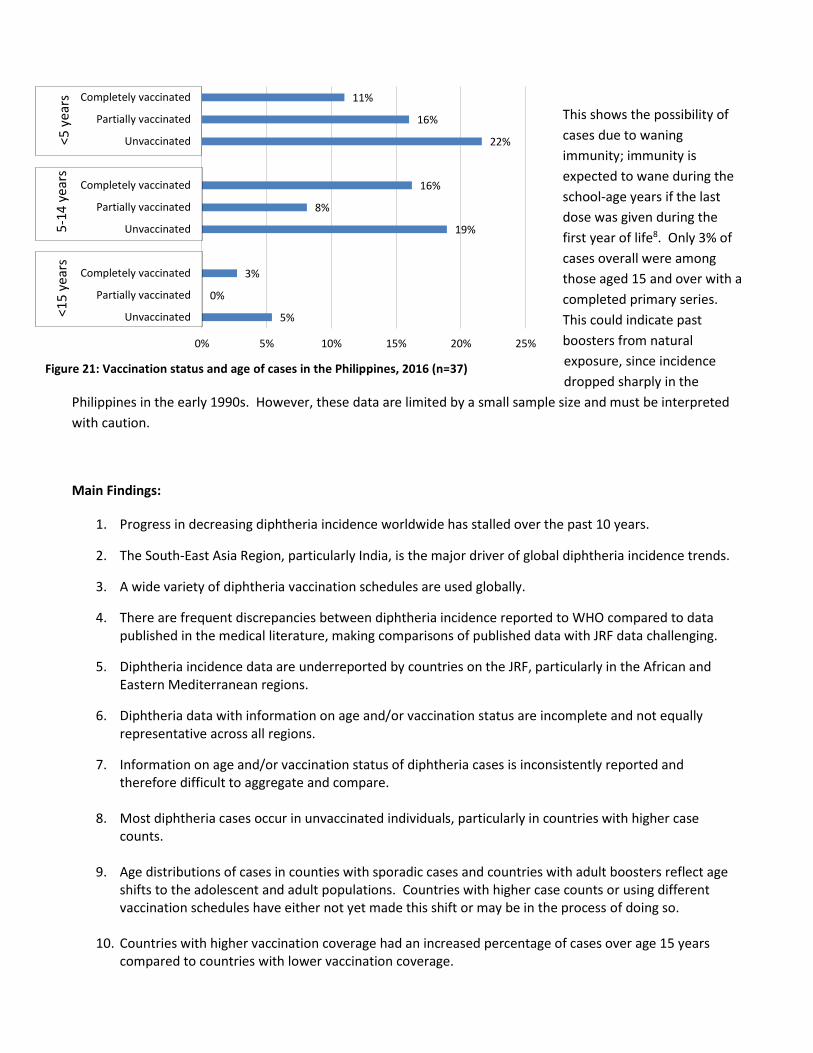
This shows the possibility of
cases due to waning
immunity; immunity is
expected to wane during the
school-age years if the last
dose was given during the
first year of life8. Only 3% of
cases overall were among
those aged 15 and over with a
completed primary series.
This could indicate past
boosters from natural
exposure, since incidence
dropped sharply in the
Philippines in the early 1990s. However, these data are limited by a small sample size and must be interpreted
with caution.
Main Findings:
1. Progress in decreasing diphtheria incidence worldwide has stalled over the past 10 years.
2. The South-East Asia Region, particularly India, is the major driver of global diphtheria incidence trends.
3. A wide variety of diphtheria vaccination schedules are used globally.
4. There are frequent discrepancies between diphtheria incidence reported to WHO compared to data published in the medical literature, making comparisons of published data with JRF data challenging.
5. Diphtheria incidence data are underreported by countries on the JRF, particularly in the African and Eastern Mediterranean regions.
6. Diphtheria data with information on age and/or vaccination status are incomplete and not equally representative across all regions.
7. Information on age and/or vaccination status of diphtheria cases is inconsistently reported and therefore difficult to aggregate and compare.
8. Most diphtheria cases occur in unvaccinated individuals, particularly in countries with higher case counts.
9. Age distributions of cases in counties with sporadic cases and countries with adult boosters reflect age shifts to the adolescent and adult populations. Countries with higher case counts or using different vaccination schedules have either not yet made this shift or may be in the process of doing so.
10. Countries with higher vaccination coverage had an increased percentage of cases over age 15 years compared to countries with lower vaccination coverage.
5%
0%
3%
19%
8%
16%
22%
16%
11%
0% 5% 10% 15% 20% 25%
Unvaccinated
Partially vaccinated
Completely vaccinated
Unvaccinated
Partially vaccinated
Completely vaccinated
Unvaccinated
Partially vaccinated
Completely vaccinated
<5 y
ears
5
-14
yea
rs
<15
yea
rs
Figure 21: Vaccination status and age of cases in the Philippines, 2016 (n=37)
11. In countries in the dataset using the primary schedule only, the highest proportion of cases are in
children 5-14 years of age among both unvaccinated and completely vaccinated individuals. This could be due to low vaccination rates and concentrated populations of children in a school setting, combined with potentially waning immunity after the primary series.
12. In analysis of vaccination status data across age groups, along with case studies of individual countries, there appears to be some evidence for cases in older vaccinated individuals due to waning immunity, especially in countries with higher current vaccination coverage.
13. Subnational coverage rates and age distributions, when available, can be important factors in explaining national incidence trends.
Recommendations:
1. Consider methods to increase the quality and consistency of data collected on diphtheria in order to
create a stronger evidence base for future recommendations. WHO could potentially standardize data
collection and reporting for diphtheria, including pre-defined categories for aggregation of age and
vaccination status data. Other options could include standardization of an outbreak protocol and case-
based reporting of diphtheria data from sentinel sites already established for data collection on other
diseases.
2. Raise awareness among countries of the importance of accurate and complete JRF data reporting,
perhaps by leveraging regular communications and EPI-related meetings to share ways these data could
be practically applied to alleviate public health problems and serve as an evidence base for future
recommendations.
3. Encourage countries to maximize coverage with already existing vaccination schedules, as most cases
continue to occur in unvaccinated individuals.
4. With recognition of the limitations of the data, consider whether evidence of potentially waning
immunity is sufficient to recommend additional doses of diphtheria vaccine as standard practice after
the first year of life. Diphtheria vaccine could be included in childhood schedules administered during
the second year of life. In addition, countries with higher vaccination coverage but continued high
diphtheria incidence should consider incorporation of doses at later ages into vaccination schedules.
WHO could also make the strong recommendation for use of Td over TT vaccine whenever indicated.
5. Given the wide variety of ages at which vaccines are administered (even among countries
recommending the same number of doses of diphtheria-containing vaccine), it may be helpful for WHO
to release guidelines regarding the optimal timing of 3 + 1 dose, 3 + 2 dose, 3 + 3 dose, and 3 + 4 dose
schedules with consideration of data on duration of immunity, leaving flexibility for the individual
country context.
Disclaimers
The findings and conclusions in this report are those of the author and do not necessarily represent the official
position of the US Centers for Disease Control and Prevention.
The views and opinions of the authors expressed herein do not necessarily state or reflect those of ECDC. The accuracy of the authors’ statistical analysis and the findings they report are not the responsibility of ECDC. ECDC is not responsible for conclusions or opinions drawn from the data provided. ECDC is not responsible for the correctness of the data and for data management, data merging and data collation after provision of the data. ECDC shall not be held liable for improper or incorrect use of the data.
Acknowledgements
Dr. Colleen Scott, Dr. Nita Patel, and Dr. Tejpratrap Tiwari reviewed abstracts and articles as part of the CDC
Literature review workgroup; their contributions were critical to compiling the case data analyzed and
interpreted in this report.
Dr. Eric Mast, Dr. Peter Bloland, Dr. Adam MacNeil, Dr. Stephen Hadler, Dr. Nita Patel, Dr. Colleen Scott, Dr.
Tejpratrap Tiwari, Dr. Kathleen Dooling, and Dr. Lina Nerlander of the US Centers for Disease Prevention and
Control assisted by providing feedback and guidance on early drafts or sections of this report. Dr. Steve Cochi
provided advice and guidance at the early stages of this analysis.
Dr. Thomas Cherian and Dr. Melanie Marti of WHO provided feedback and guidance on an early draft of this
report.
Dr. Howard Gary provided statistical support and methodological guidance for the analysis.
The author would like to recognize international organizations and colleagues for sharing data from outbreak
reports and surveillance systems for use in this analysis, particularly colleagues at the European CDC and Dr.
Sudhir Joshi and Dr. Lucky Sangal of WHO-India.
References
1. Zakikhany K, Efstratiou A. Diphtheria in Europe: current problems and new challenges. Future Microbiology 2012; 7(5): 595-607.
2. Diphtheria Reported Cases. In: Organization WH, (ed), 1980-2015.
3. Markina SS, Maksimova NM, Vitek CR, Bogatyreva EY, Monisov AA. Diphtheria in the Russian Federation
in the 1990s. Journal of Infectious Diseases 2000; 181(SUPPL. 1): S27-S34.
4. Galazka A. The Changing Epidemiology of Diphtheria in the Vaccine Era. Journal of Infectious Diseases
2000; 181(Suppl 1): 52-59.
5. Galazka A. Implications of the diphtheria epidemic in the Former Soviet Union for immunization
programs. Journal of Infectious Diseases 2000; 181 Suppl 1: S244-248.
6. Galazka A, Robertson SE. Immunization against diphtheria with special emphasis on immunization of
adults. Vaccine 1996; 14(9): 845-857.
7. Golaz A, Hardy IR, Strebel P, Bisgard KM, Vitek C, Popovic T et al. Epidemic diphtheria in the newly
independent states of the former Soviet Union: Implications for diphtheria control in the United States. Journal of Infectious Diseases 2000; 181(SUPPL. 1): S237-S243.
8. Tiwari T, Wharton M. Diphtheria Toxoid. In: Plotkin SA, Orenstein WA, Offit PA (eds). Vaccines, 6th edn.
Elsevier Saunders: Edinburgh, 2013, pp 153-166.
9. Golaz A, Vitek C, Popovic T, Wharton M. Epidemiology of diphtheria in the 1990s. Clinical Microbiology
Newsletter 2001; 23(5): 33-37.
10. Scheifele DW, Ochnio JJ. Diphtheria Update. World Health Organization: Geneva, 2009.
11. Organization WH. WHO–recommended standards for surveillance of selected vaccine-preventable
diseases. In. Geneva, 2014. pp 10-12.
12. Wagner KS, White JM, Lucenko I, Mercer D, Crowcroft NS, Neal S et al. Diphtheria in the postepidemic
period, Europe, 2000-2009. Emerging Infectious Diseases 2012; 18(2): 217-225.
13. Sutter RW, Stikas RA, Hadler SC, Fedson DS, Katz SL. Tetanus Immunization: Concerns about the Elderly
and about Diphtheria Reemergence. Journal of General Internal Medicine 1994; 9: 117-118.
14. Dravid MN, Joshi SA. Resurgence of diphtheria in Malegaon & Dhule regions of north Maharashtra.
Indian Journal of Medical Research 2008; 127(6): 616-617.
15. Sadoh AE, Oladokun RE. Re-emergence of diphtheria and pertussis: Implications for Nigeria. Vaccine
2012; 30(50): 7221-7228. doi: http://dx.doi.org/10.1016/j.vaccine.2012.10.014
16. Mattos-Guaraldi AL, Moreira LO, Damasco PV, Hirata Junior R. Diphtheria remains a threat to health in
the developing world--an overview. Memorias do Instituto Oswaldo Cruz 2003; 98(8): 987-993.
17. Landazabal Garcia N, Burgos Rodriguez MM, Pastor D. Diphtheria outbreak in Cali, Colombia, August-
October 2000. Epidemiological bulletin 2001; 22(3): 13-15.
18. Quarterly communicable disease review January to March 2002. Journal of Public Health Medicine 2002;
24(3): 232-238.
19. Disease watch. Expert Review of Anti-Infective Therapy 2003; 1(3): 355.
20. Anima H, Malay M, Santanu H, Rajashree R, Sita C, Baran SA. A study on determinants of occurrence of
complications and fatality among diphtheria cases admitted to ID & BG Hospital of Kolkata. J Commun Dis 2008; 40(1): 53-58. e-pub ahead of print 2009/01/09;
21. Bonmarin I, Guiso N, Le Fleche-Mateos A, Patey O, Grimont Patrick AD, Levy-Bruhl D. Diphtheria: A
zoonotic disease in France? Vaccine 2009; 27(31): 4196-4200.
22. Nath B, Mahanta TG. Investigation of an outbreak of diphtheria in borborooah block of dibrugarh
district, assam. Indian Journal of Community Medicine 2010; 35(3): 436-438.
23. Perkins S, Cordery R, Nixon G, Abrahams A, Andrews J, White J et al. Investigations and control measures
following a non-travel-associated case of toxigenic Cornyebacterium diphtheriae, London, United Kingdom, December 2009-January 2010. Euro Surveillance: Bulletin Europeen sur les Maladies Transmissibles = European Communicable Disease Bulletin 2010; 15(16): 22.
24. Saikia L, Nath R, Saikia NJ, Choudhury G, Sarkar M. A diphtheria outbreak in Assam, India. The Southeast
Asian journal of tropical medicine and public health 2010; 41(3): 647-652.
25. Chumachenko T, Podavalenko A, Glushkevich T. Spread of Corynebacterium diphtheriae in Ukraine
during post-epidemic period. Clinical Microbiology and Infection 2011; 17: S285.
26. Diphtheria Outbreak in an Urban City in Central Philippines, 2010. EIS Conference International Night;
Atlanta, GA, 2011.
27. Niti T, Jignesh C, Himanshu N, Chintul S, Krunal M, Jaydeep D. Investigation of an outbreak of diphtheria
in Dabela Village of Amirgagh Taluka and CHC, Banaskantha, Gujarat. National Journal of Community Medicine 2011; 2(2): 196-200.
28. Rasmussen I, Wallace S, Mengshoel AT, Hoiby EA, Brandtzaeg P. Diphtheria outbreak in Norway: Lessons
learned. Scandinavian Journal of Infectious Diseases 2011; 43(11-12): 986-989.
29. Besa NC, Coldiron ME, Bakri A, Raji A, Nsuami MJ, Rousseau C et al. Diphtheria outbreak with high
mortality in northeastern Nigeria. Epidemiology and Infection 2013; 142(4): 797-802.
30. Phalkey RK, Bhosale RV, Joshi AP, Wakchoure SS, Tambe MP, Awate P et al. Preventing the preventable
through effective surveillance: the case of diphtheria in a rural district of Maharashtra, India. BMC public health 2013; 13: 317.
31. Wanlapakorn N, Yoocharoen P, Tharmaphornpilas P, Theamboonlers A, Poovorawan Y. Diphtheria
outbreak in Thailand, 2012; seroprevalence of diphtheria antibodies among Thai adults and its implications for immunization programs. The Southeast Asian journal of tropical medicine and public health 2014; 45(5): 1132-1141.
32. Rashid ZZ, Mohamed NA, Fong TS. A case of fatal diphtheria in a paediatric patient. Internet Journal of
Microbiology 2015; 14(1): 1-5.
33. Santos LS, Sant'Anna LO, Ramos JN, Ladeira EM, Stavracakis-Peixoto R, Borges LLG et al. Diphtheria
outbreak in Maranhão, Brazil: Microbiological, clinical and epidemiological aspects. Epidemiology and Infection 2015; 143(4): 791-798. doi: 10.1017/S0950268814001241
34. Doanh PV, Pham TD, Vu NL, Chu VT, Do THH, Nguyen TTH et al. An outbreak of diphtheria in K'Bang
District, Gia Lai, Vietnam, October 2013 - July 2014. International Journal of Infectious Diseases 2016; 45: 172.
35. Meera M, Rajarao M. Diphtheria in Andhra Pradesh-a clinical-epidemiological study. International
Journal of Infectious Diseases 2014; 19: 74-78.
36. Lumio J SP, Olander RM, Saxen H, Salo E. Fatal case of diphtheria in an unvaccinated infant in Finland.
Pediatric Infectious Disease Journal 2003; 22(9): 844-846.
37. Nandi RD, Mriganka; Browning, Simon; Purkayastha, Prabhati; Bhattacharjee, A K. Diphtheria: the patch
remains. The Journal of Laryngology and Otology 2003; 117(10): 807.
38. Krumina A, Logina I, Donaghy M, Rozentale B, Kravale I, Griskevica A et al. Diphtheria with polyneuropathy in a closed community despite receiving recent booster vaccination. J Neurol Neurosurg Psychiatry 2005; 76(11): 1555-1557. doi: 10.1136/jnnp.2004.056523
39. Prasad KC KV, Shenoy S, Prasad SC. Upper Respiratory Tract and Cutaneous Diphtheria. Indian Journal of
Otolaryngology and Head and Neck Surgery 2005; 57(3): 250-252.
40. Sharma NCB, J N; Ranjan, Rajesh; Kumar, Rajnish. Bacteriological and epidemiological characteristics of
diphtheria cases in and around Delhi- a retrospective study. Indian Journal of Medical Research 2007; 126(6): 545.
41. Communicable disease and health protection quarterly review: July to September 2008. J Public Health
(Oxf) 2008; 30(4): 510-511. doi: 10.1093/pubmed/fdn090
42. Bitragunta S, Murhekar MV, Hutin YJ, Penumur PP, Gupte MD. Persistence of diphtheria, Hyderabad,
India, 2003-2006. Emerg Infect Dis 2008; 14(7): 1144-1146. doi: 10.3201/eid1407.071167
43. Fajolu IB TE, Egre-Okwaji MTC. Sporadic Emergence of Probable Cases of Diphtheria. Nigerian Journal of
Paediatrics 2009; 36: 87-90.
44. Fredlund H NT, Lepp T, Morfeldt E, Henriques Normark B. A case of diphtheria in Sweden, October 2011
Eurosurveillance 2011; 16(50).
45. Mattos-Guaraldi AL, Damasco PV, Gomes DL, Melendez MG, Santos LS, Marinelli RS et al. Concurrent
diphtheria and infectious mononucleosis: difficulties for management, investigation and control of diphtheria in developing countries. J Med Microbiol 2011; 60(Pt 11): 1685-1688. doi: 10.1099/jmm.0.027870-0
46. Rousseau C BE, Broche B, Badell E, Guiso N, Laharie I, Patey O, Lévy-Bruhl D. Diphtheria in the south of
France, March 2011. Euro Surveill 2011; 16(19).
47. Lindhusen-Lindhé E DL, Berglund M. Imported laryngeal and cutaneous diphtheria in tourists returning
from western Africa to Sweden, March 2012. Euro Surveillance 2012; 17(23).
48. Paul NI UR. Diphtheria in a 13 year old adolescent girl: Management challenges. Nigerian Journal of
Paediatrics 2014; 41(3): 247-250. doi: 10.4314/njp.v41i3,19
49. Garib Z, Danovaro-Holliday MC, Tavarez Y, Leal I, Pedreira C. Diphtheria in the Dominican Republic:
reduction of cases following a large outbreak. Revista Panamericana de Salud Pública 2015; 38: 292-299.
50. Sane J ST, Widerström* M, Kauma H, Kaukoniemi U, Tarkka E, Puumalainen T, Kuusi M, Salminen M, Lyytikäinen O. Respiratory diphtheria in an asylum seeker from Afghanistan arriving to Finland via Sweden, December 2015. Euro Surveill 2016; 21(2). doi: 10.2807/1560-7917
51. Sein C, Tiwari T, Macneil A, Wannemuehler K, Soulaphy C, Souliphone P et al. Diphtheria outbreak in Lao
People's Democratic Republic, 2012-2013. Vaccine 2016; 34(36): 4321-4326. doi: 10.1016/j.vaccine.2016.06.074
52. PAHO. Diphtheria Outbreak in Paraguay. PAHO Immunization Newsletter 2002; 24(3): 6.
53. PAHO. Diphtheria Outbreak in Paraguay – An Update. PAHO Immunization Newsletter 2002; 24(5): 7.
54. Lurie P SH, Tran P, Teacher C. Fatal Respiratory Diphtheria in a U.S. Traveler to Haiti. MMWR 2004;
52(53): 1285.
55. PAHO. Diphtheria Outbreak in the Dominican Republic. PAHO Immunization Newsletter 2004; 26(3): 1.
56. England PH. Death in a child infected with toxigenic Corynebacterium diphtheriae in London. Public
Health England, 2008.
57. PAHO. Diphtheria Outbreak in Haiti, 2009. PAHO Immunization Newsletter 2009; 31(6): 1.
58. Group NARW. Australia’s notifiable disease status, 2011: Annual report of the National Notifiable
Diseases Surveillance System. Communicable diseases intelligence 2013; 37(4): E313-E393.
59. Control ECfDPa. A case of diphtheria in Spain; Rapid Risk Assessment. ECDC: Stockholm, 2015.
60. ECDC. A fatal case of diphtheria in Belgium. In: CDC E, (ed) Rapid Risk Assessment: ECDC, 2016. pp 1-10.
61. Flambées de diphtérie en Haiti-2004 et 2009. In: Haiti MSPP; PanAmerican Health Organization, 2010.
62. Tiwari T, Estivariz C, Lam E. Report on the Centers for Disease Control and Prevention mission to assist
Indinesia's field epidemiology training program students to investigate and identify risk factors for the diphtheria outbreak in East Java during 2012. In, 2013.
63. Kaiser R. Diphtheria outbreak in KwaZulu-Natal, South Africa, March through June 2015. In: World
Health Organization, 2015.
64. Informe de brote de Difteria en Venezuela. In: Panamerican Health Organization, 2016.
65. Report on Diphtheria Outbreak in Haiti. In: US Centers for Disease Control and Prevention, 2016.
66. Situation of Diphtheria in Punjab as on 12-11-2016. In: WHO Punjab, 2016.
67. Crucena JJD. Diphtheria in the Philippines. In: Republic of the Philippines, 2016.
68. Division EBotPHS. In: Republic of the Philippines, 2016.
69. Nguyen TD, Tran NVN, Vien QM, Do H, Nolen L. A diphtheria outbreak in a remote mountainous area of
Quang Nam province, Viet Nam, 2015. In: World Health Organization, Vietnam; Pasteur Institute Nha Trong; US Centers for Disease Control and Prevention Vietnam, 2016.
70. Nihal A. Global and South-East Asia regional burden of diphtheria disease and strategies for control. In:
WHO SEARO, 2016.
71. Sangal L, Joshi S. VPD Surveillance in India: A glance. In: WHO India, 2017.
72. The European Surveillance System (TESSy). In: Control ECfDPa, (ed), 2006-2016.
73. Organization WH. WHO-UNICEF estimates of DTP3 coverage In, 1980-2015.
74. Organization WH. Immunization schedule by disease In, 2016.
75. Control ECfDPa. Vaccine Schedule Search Tool. In. ECDC Network, 2016.
76. Vashishtha VM, Kumar P. 50 years of immunization in India: Progress and Future. Indian Pediatrics 2013;
50: 111-118.
77. John TJ. Resurgence of diphtheria in India in the 21st century. Indian Journal of Medical Research 2008;
128(5): 669-670.
78. Ramesh BM AF, Roy TK, Kanitkar T, Govindasamy P, Retherford RD. National Family Health Survey (MCH
and Family Planning), India 1992-1993: Mumbai, 1995.
79. Roy TK AF, Kulkarni S, Kishor S, Gupta K, Mishra V, Nangia P, Retherford RD, Pandey A, Kumar S. National
Family Health Survey (NFHS-2), 1998–99: India. Government of India: Mumbai, 2000.
80. Multiple Indicator Survey 2000 India Summary Report. Government of India: New Delhi, 2001.
81. Bhat PNM AF, Gupta K, Kishor S, Parasuraman S, Arokiasamy P, Singh SK, Lhungdim H. National Family
Health Survey (NFHS-3), 2005–06: India. Government of India, 2007.
82. Health Information Management System. In: Government of India MoHaFW, (ed): Digital India, 2008-
2016.
83. Bhavan N. State Fact Sheet Bihar. Government of India Ministry of Health and Family Welfare: Mumbai,
2015-16.
84. Bhavan N. State Fact Sheet Kerala. Government of India Ministry of Health and Family Welfare: Mumbai,
2015-2016.
85. Bhavan N. State Fact Sheet Uttar Pradesh. Government of India Ministry of Health and Family Welfare:
Mumbai, 2015-2016.
86. Bhavan N. State Fact Sheet Haryana. Government of India Ministry of Health and Family Welfare:
Mumbai, 20015-16.
87. Kantsone I, Lucenko I, Perevoscikovs J. More than 20 years after re-emerging in the 1990s, diphtheria
remains a public health problem in Latvia. Euro Surveill 2016; 21(48). doi: 10.2807/1560-7917.ES.2016.21.48.30414
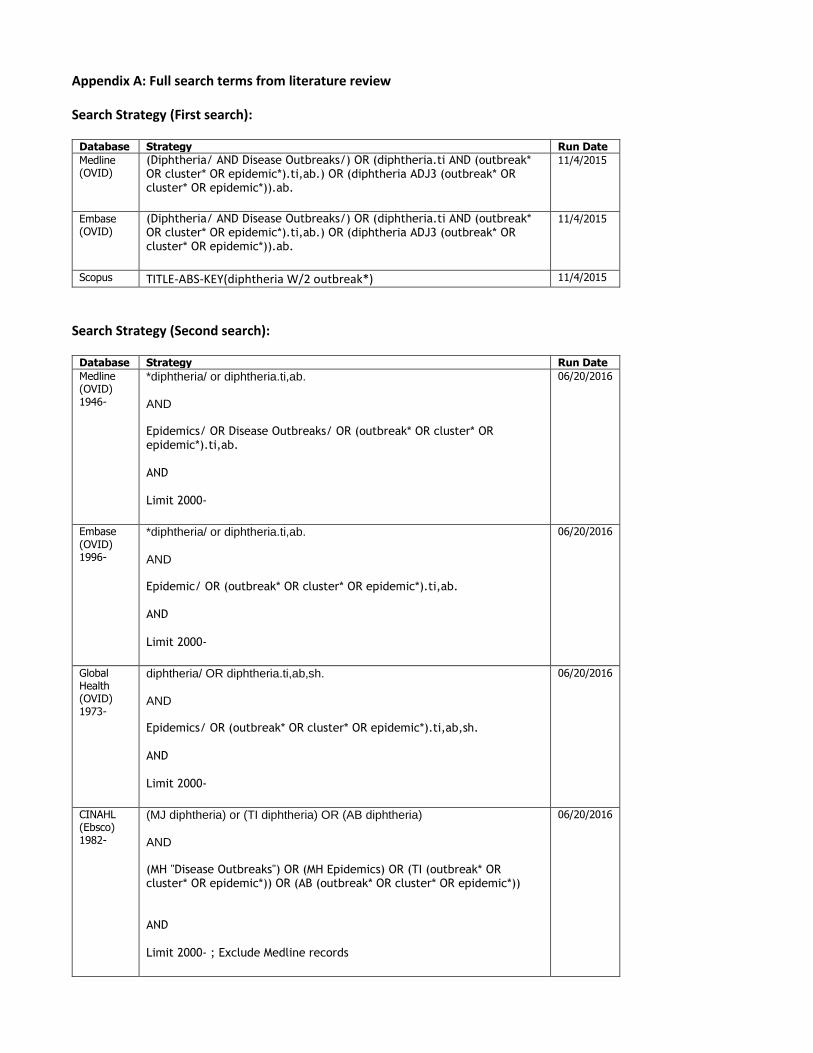
Appendix A: Full search terms from literature review
Search Strategy (First search):
Database Strategy Run Date
Medline (OVID)
(Diphtheria/ AND Disease Outbreaks/) OR (diphtheria.ti AND (outbreak* OR cluster* OR epidemic*).ti,ab.) OR (diphtheria ADJ3 (outbreak* OR cluster* OR epidemic*)).ab.
11/4/2015
Embase (OVID)
(Diphtheria/ AND Disease Outbreaks/) OR (diphtheria.ti AND (outbreak* OR cluster* OR epidemic*).ti,ab.) OR (diphtheria ADJ3 (outbreak* OR cluster* OR epidemic*)).ab.
11/4/2015
Scopus TITLE-ABS-KEY(diphtheria W/2 outbreak*) 11/4/2015
Search Strategy (Second search):
Database Strategy Run Date
Medline (OVID) 1946-
*diphtheria/ or diphtheria.ti,ab. AND Epidemics/ OR Disease Outbreaks/ OR (outbreak* OR cluster* OR epidemic*).ti,ab. AND Limit 2000-
06/20/2016
Embase (OVID) 1996-
*diphtheria/ or diphtheria.ti,ab. AND Epidemic/ OR (outbreak* OR cluster* OR epidemic*).ti,ab. AND Limit 2000-
06/20/2016
Global Health (OVID) 1973-
diphtheria/ OR diphtheria.ti,ab,sh. AND Epidemics/ OR (outbreak* OR cluster* OR epidemic*).ti,ab,sh. AND Limit 2000-
06/20/2016
CINAHL (Ebsco) 1982-
(MJ diphtheria) or (TI diphtheria) OR (AB diphtheria) AND (MH "Disease Outbreaks") OR (MH Epidemics) OR (TI (outbreak* OR cluster* OR epidemic*)) OR (AB (outbreak* OR cluster* OR epidemic*)) AND Limit 2000- ; Exclude Medline records
06/20/2016
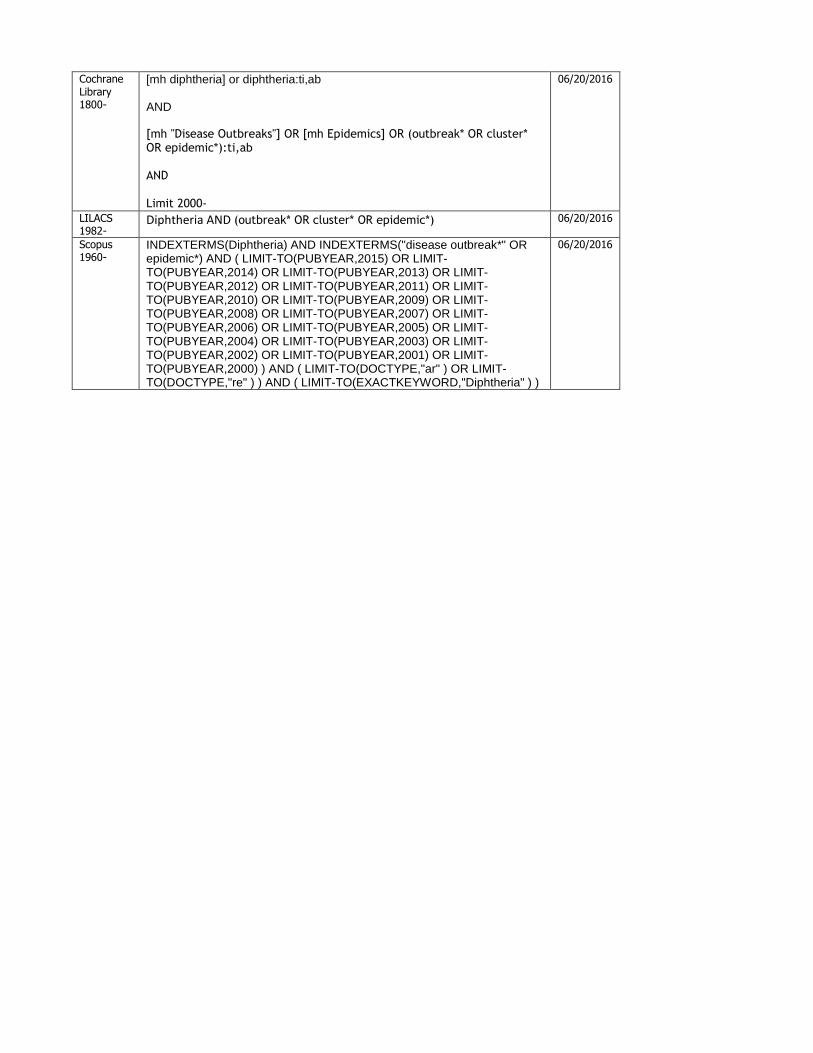
Cochrane Library 1800-
[mh diphtheria] or diphtheria:ti,ab AND [mh "Disease Outbreaks"] OR [mh Epidemics] OR (outbreak* OR cluster* OR epidemic*):ti,ab AND Limit 2000-
06/20/2016
LILACS 1982-
Diphtheria AND (outbreak* OR cluster* OR epidemic*) 06/20/2016
Scopus 1960-
INDEXTERMS(Diphtheria) AND INDEXTERMS("disease outbreak*" OR epidemic*) AND ( LIMIT-TO(PUBYEAR,2015) OR LIMIT-TO(PUBYEAR,2014) OR LIMIT-TO(PUBYEAR,2013) OR LIMIT-TO(PUBYEAR,2012) OR LIMIT-TO(PUBYEAR,2011) OR LIMIT-TO(PUBYEAR,2010) OR LIMIT-TO(PUBYEAR,2009) OR LIMIT-TO(PUBYEAR,2008) OR LIMIT-TO(PUBYEAR,2007) OR LIMIT-TO(PUBYEAR,2006) OR LIMIT-TO(PUBYEAR,2005) OR LIMIT-TO(PUBYEAR,2004) OR LIMIT-TO(PUBYEAR,2003) OR LIMIT-TO(PUBYEAR,2002) OR LIMIT-TO(PUBYEAR,2001) OR LIMIT-TO(PUBYEAR,2000) ) AND ( LIMIT-TO(DOCTYPE,"ar" ) OR LIMIT-TO(DOCTYPE,"re" ) ) AND ( LIMIT-TO(EXACTKEYWORD,"Diphtheria" ) )
06/20/2016
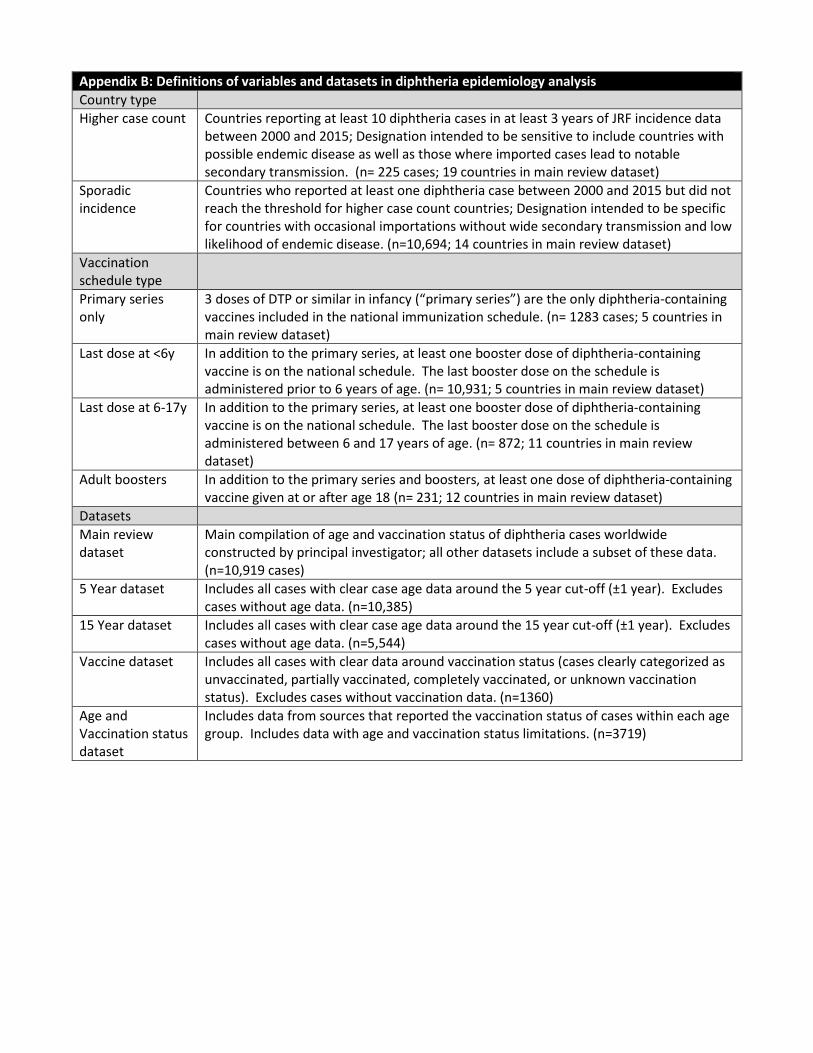
Appendix B: Definitions of variables and datasets in diphtheria epidemiology analysis
Country type
Higher case count Countries reporting at least 10 diphtheria cases in at least 3 years of JRF incidence data between 2000 and 2015; Designation intended to be sensitive to include countries with possible endemic disease as well as those where imported cases lead to notable secondary transmission. (n= 225 cases; 19 countries in main review dataset)
Sporadic incidence
Countries who reported at least one diphtheria case between 2000 and 2015 but did not reach the threshold for higher case count countries; Designation intended to be specific for countries with occasional importations without wide secondary transmission and low likelihood of endemic disease. (n=10,694; 14 countries in main review dataset)
Vaccination schedule type
Primary series only
3 doses of DTP or similar in infancy (“primary series”) are the only diphtheria-containing vaccines included in the national immunization schedule. (n= 1283 cases; 5 countries in main review dataset)
Last dose at <6y In addition to the primary series, at least one booster dose of diphtheria-containing vaccine is on the national schedule. The last booster dose on the schedule is administered prior to 6 years of age. (n= 10,931; 5 countries in main review dataset)
Last dose at 6-17y In addition to the primary series, at least one booster dose of diphtheria-containing vaccine is on the national schedule. The last booster dose on the schedule is administered between 6 and 17 years of age. (n= 872; 11 countries in main review dataset)
Adult boosters In addition to the primary series and boosters, at least one dose of diphtheria-containing vaccine given at or after age 18 (n= 231; 12 countries in main review dataset)
Datasets
Main review dataset
Main compilation of age and vaccination status of diphtheria cases worldwide constructed by principal investigator; all other datasets include a subset of these data. (n=10,919 cases)
5 Year dataset Includes all cases with clear case age data around the 5 year cut-off (±1 year). Excludes cases without age data. (n=10,385)
15 Year dataset Includes all cases with clear case age data around the 15 year cut-off (±1 year). Excludes cases without age data. (n=5,544)
Vaccine dataset Includes all cases with clear data around vaccination status (cases clearly categorized as unvaccinated, partially vaccinated, completely vaccinated, or unknown vaccination status). Excludes cases without vaccination data. (n=1360)
Age and Vaccination status dataset
Includes data from sources that reported the vaccination status of cases within each age group. Includes data with age and vaccination status limitations. (n=3719)