Embed Size (px)
Citation preview

REV IEW OF THE INTERNAT IONAL ROLE OF THE EURO
DECEMBER 2005

REV I EW OF THE INTERNAT IONALROLE O F THE EURO
DECEMBER 2005
In 2005 all ECB publications will feature
a motif taken from the
€50 banknote.

© European Central Bank, 2005
AddressKaiserstrasse 2960311 Frankfurt am Main, Germany
Postal addressPostfach 16 03 1960066 Frankfurt am Main, Germany
Telephone+49 69 1344 0
Websitehttp://www.ecb.int
Fax+49 69 1344 6000
Telex411 144 ecb d
All rights reserved. Reproduction foreducational and non-commercial purposesis permitted provided that the source isacknowledged.
As at December 2005.
ISSN 1725-2210 (print)ISSN 1725-6593 (online)

3c ECB
Review of the international role of the euroDecember 2005
TABLE OF CONTENTSFOREWORD 7
EXECUTIVE SUMMARY 8
KEY DATA 10
INTRODUCTION 11
A THE EURO IN GLOBAL MARKETS 12
1 THE EURO IN INTERNATIONAL DEBTMARKETS 12
1.1 Overall trends in internationaldebt securities supply 13
1.2 Specific trends across financinginstruments 13
1.3 Evidence available on demandtrends 16
1.4 Stocks of international debtsecurities, broken down bycurrency and region 18
2 THE EURO IN INTERNATIONAL LOAN ANDDEPOSIT MARKETS 21
2.1 The role of the euro ininternational loan markets 21
2.2 The role of the euro ininternational deposit markets 22
3 THE EURO IN FOREIGN EXCHANGEMARKETS 27
4 THE EURO IN INTERNATIONAL TRADE INGOODS AND SERVICES 29
4.1 The role of the euro ininternational trade in goods andservices by selected euro areacountries 29
4.2 The role of the euro ininternational trade in goods andservices by third countries 30
SPECIAL FOCUS: DETERMINANTS OF THECURRENCY INVOICING IN INTERNATIONALTRADE 33
1 Introduction 33
2 Review of the literature 34
3 A new panel dataset 39
4 Methodology and results 42
5 Conclusions 47
B THE EURO IN THIRD COUNTRIES 49
1 OFFICIAL USE: THE EURO IN THIRDCOUNTRIES’ EXCHANGE RATE POLICIES 49
1.1 The euro as an anchor currency 49
1.2 The euro as a reserve currency 51
1.3 The euro as an interventioncurrency 54
2 PRIVATE USE: THE EURO AS A PARALLELCURRENCY IN THIRD COUNTRIES 57
2.1 Currency substitution – the useof euro banknotes outside theeuro area 57
2.2 Asset substitution – the use ofeuro-denominated bank deposits 58
CONCLUSIONS 61
DATA SHEET 62
REFERENCES 63

4ECB cReview of the international role of the euroDecember 2005
LIST OF CHARTS, TABLES AND BOXES
CHARTS
Chart 1 Stock of international debt securities: currency shares 13
Chart 2 Euro-denominated bonds issued by non-euro area residents: frequencyof Asian and US investors’ primary market participation 16
Chart 3 Loans made by euro area banks to non-bank borrowers outside theeuro area: currency shares by region 21
Chart 4 Euro share in international loan and deposit markets 23
Chart 5 Settlement within the CLS system: currency breakdown 27
Chart 6 Average share of currencies used in exports and imports by region 40
Chart 7 Change in the share of trade invoiced/settled in euro vs. change in theshare of trade accounted for by the euro area 41
Chart 8 Correlation between share of differentiated goods and choice ofcurrency in exports 42
Chart 9 Global foreign exchange reserves 51
Chart 10 Net shipments of euro banknotes to destinations outside the euro area 57
TABLES
Table 1 Net issuance of international debt securities 13
Table 2 Major currencies’ shares in gross issuance of short-term internationaldebt securities 14
Table 3 Major currencies’ shares in gross issuance of long-term internationaldebt securities 14
Table 4 List of top 40 non-euro area issuers of euro-denominated bonds 15
Table 5 Currency breakdown of funds under management according to theeMaxx database 17
Table 6 Currencies’ shares in the stock of outstanding international debtsecurities in selected regions 19
Table 7 The share of the euro in international loan and deposits markets 24
Table 8 Share of the euro as a settlement/invoicing currency in extra-euro areaexports of goods and services of selected euro area countries 29
Table 9 Share of the euro as a settlement/invoicing currency in extra-euro areaimports of goods and services of selected euro area countries 30
Table 10 Share of the euro in exports of selected non-euro area countries 31
Table 11 Share of the euro in imports of selected non-euro area countries 32
Table 12 Key factors affecting the choice of invoicing currency as suggestedby the theoretical literature 38
Table 13 Summary of selected recent empirical studies 39
Table 14 The euro as an invoicing currency in the exports of non-euro areacountries 44
Table 15 Summary of stylised results from the econometric estimations 45

5ECB
Review of the international role of the euroDecember 2005
CONTENTS
Table 16 Countries with exchange rate regimes linked to the euro 50
Table 17 Official foreign exchange reserves: currency shares 52
Table 18 Currency composition of official holdings of foreign exchange,end of year 54
Table 19 Currency breakdown of total foreign exchange reserves of selectedcountries 55
Table 20 Outstanding euro-denominated bank deposits in selected countries 58
BOXES
Box 1 Alternative definitions of “international” issuance 12
Box 2 Currency breakdown of debt securities in the euro area balance ofpayments/international investment position 17
Box 3 The role of the euro in the recycling of oil revenues 24
Box 4 The role of network effects and market structures for the use ofcurrencies – the case of oil-invoicing 36
Box 5 Changes in the IMF’s method of compiling data on the currencycomposition of official foreign exchange reserves 53
Box 6 The role of the euro in Russia 55
Box 7 The euro in central, south-eastern and eastern Europe – survey results 59


7ECB
Review of the international role of the euroDecember 2005
FOREWORDFOREWORDThis report is the fifth review of theinternational role of the euro. As with previousissues, it reflects the ongoing efforts of theECB to monitor and analyse the role played bythe euro in global markets and in countriesoutside the euro area. In so doing, the reviewnot only provides information on the extent ofthe international use of the euro, i.e. its use bymarket participants and authorities outside theeuro area, but also sheds light on the factorsdriving developments in the international useof the euro.
This review, which focuses on developmentsbetween mid-2004 and mid-2005, confirms anumber of findings that had already beenidentified in previous years. The euro hascontinued to gradually expand some aspects ofits role as an international currency, while inother facets it has continued to show asignificant degree of stability. In particular,during the period under review the use of theeuro in international debt securities continuedto increase gradually. In other markets, such asinternational loan and deposits and globalforeign exchange, the use of the euro continuedto exhibit a substantial degree of stability.In addition, the review confirms the strong
institutional and regional pattern that continuesto characterise the internationalisation of theeuro. Further evidence of this pattern isprovided by the analysis of the factorsunderpinning the increase in the use of the euroin international trade, which is the subject of the“special focus” section of the review.
Developments in the international use of theeuro are the outcome of decisions taken bymarket participants. The ECB will continue itsmonitoring of the international role of theeuro and will provide regular information tothe public on related developments in theinternational financial arena.
Jean-Claude Trichet
President of the European Central Bank

8ECB cReview of the international role of the euroDecember 2005
EXECUTIVE SUMMARYThis is the fifth review of the international roleof the euro. Like previous issues, it examinesthe role of the euro in global markets andcountries outside the euro area, and aims toenhance the Eurosystem’s understanding ofthe current state of the internationalisation ofthe euro by identifying the main developmentsand underlying trends.
The review builds on the continued efforts ofthe European System of Central Banks (ESCB)to develop the statistical coverage and analysisof the international use of the euro. In thisregard, the review provides a “special focus”section on the use of the euro in internationaltrade, which is largely based on the datacollection efforts that the ESCB has made inrecent years in this area. The special focusaddresses the question of what factors could liebehind the increase in the use of the euro ininternational trade, particularly among anumber of EU countries and acceding andaccession countries, which was reported inprevious issues of this review. In addition tothis analysis, the review also providesinformation on how the structure of the oilmarkets can affect the use of currencies inthese markets.
The period under review extends from mid-2004 to mid-2005. Where appropriate, thereview also takes stock of the first six yearssince the introduction of the euro, drawingcomparisons between the situation at thebeginning of 2005 and that whichcharacterised the international role of the euroat the beginning of 1999. The main findings ofthe review can be summarised as follows:
INTERNATIONAL DEBT MARKETS
As a result of buoyant international issuance ofeuro-denominated debt during the reviewperiod, the share of the euro in the stock ofinternational debt securities rose gradually to31.5%. Despite some prominent issues byAsian and Latin American borrowers, theregional pattern of the international issuance
of euro-denominated bonds did not changematerially during the review period.Notwithstanding an increase in the share ofsovereign issuance in international euro-denominated debt, private sector issuersresident in the United Kingdom and the UnitedStates remain the most significant issuers ofinternational euro-denominated bonds andnotes. With regard to the demand forinternational euro-denominated securities, theavailable evidence continues to suggest thatthese issues have been targeted mainly atEuropean investors. Nevertheless, someevidence would appear to indicate that therehas been increased interest from Asian and, to alesser extent, North American investors.
INTERNATIONAL LOAN AND DEPOSIT MARKETS
During the review period, the share of the euroin international loans and deposit marketsremained broadly stable. Loans by non-euroarea banks, mainly by banks resident in theUnited Kingdom, to non-bank borrowers in theeuro area continued to be denominated mainlyin euro. The share of the euro in loans made byeuro area banks to non-bank borrowers outsidethe euro area remained somewhat lower. Withrespect to loan transactions carried out entirelyoutside the euro area, the role of the euro hasincreased slightly from a very low base. Asregards deposits, more than one-half ofinternational deposits, either by euro area non-banks in banks outside the euro area or by non-bank residents outside the euro area in euroarea banks, continue to be denominated ineuro. The share of the euro in deposits held bynon-euro area non-banks in banks outside theirhome country has remained small although itincreased somewhat during the review period.
FOREIGN EXCHANGE MARKETS
Evidence from foreign exchange trades settledvia Continuous Linked Settlement (CLS)suggests that during the period under reviewthe share of the euro in daily settlements

9ECB
Review of the international role of the euroDecember 2005
EXECUTIVE SUMMARY
remained broadly stable at around 43%,compared to 44% during the previous twelve-month period. This compares with a share forthe US dollar of 90%, unchanged from theprevious review period, and a share for theJapanese yen of 20%, down from 22% in theprevious period.1 This high degree of stabilityhas to be interpreted against the background ofan expansion in the number of currenciestraded within CLS and the overall increase inturnover within that system.
THE USE OF THE EURO IN INTERNATIONALTRADE
The increase in the use of the euro ininternational trade has been one of the keycharacteristics of the international role of theeuro in recent years. Following the continuedefforts of the ESCB to increase the amount ofinformation available on the use of the euro ininternational trade by a number of EU MemberStates, this review provides further evidence ofthe increase in such use of the euro in 2004 fora number of Member States. In other countries,however, the use of the euro appears to havelevelled off when compared to 2003.
In order to understand the factors behind theuse of the euro, the ECB launched a researchproject largely based on the dataset compiledby the ESCB. While the results of this researchhave to be seen as tentative given the stilllimited availability of data, analysis of theresults suggests that the euro is used as avehicle currency (defined as the use of the euroamong non-euro area trading partners) mainlyin countries with institutional links to the EU.In addition, the use of the euro in internationaltrade does not exhibit some of the patterns thathave traditionally been associated with vehiclecurrencies, such as strong use by countries thatmainly export raw materials and commodities.Overall, the results emphasise the importanceof institutional factors in explainingdevelopments in the use of the euro ininternational trade. In this regard, analysis ofthe results would appear to confirm the
1 The sum of currency percentage shares adds up to 200% asboth currencies involved in the settlement of a foreignexchange trade are counted individually.
regional pattern that characterises otheraspects of the internationalisation of the euro.
THIRD COUNTRIES
The role of the euro as an anchor currency hasincreased due to several changes of monetaryand exchange rate regimes in third countries.In the period under review, the main exchangerate regime changes involving the euro as ananchor currency took place in three newMember States which entered ERM II (Cyprus,Latvia and Malta). In addition, as an EUacceding country, Romania strengthened thereference role of the euro in its interventionpolicy while formally adopting an inflationtargeting framework. In EU neighbouringregions, Russia introduced a reference basketfor the daily management of its exchange ratewhich includes the euro along with the USdollar. Israel, on the other hand, formallyintroduced inflation targeting, abandoning theexchange rate band around a basket ofcurrencies, including the euro. As regards otherregions, China announced in July that it wouldoperate a managed floating exchange ratepolicy based on market supply and demandwith reference to a basket that includes the euroas one of its main components.
According to revised IMF figures, the share ofeuro-denominated assets in global foreignexchange reserves fell slightly from 25.3% atthe end of 2003 to 24.9% at the end of 2004. Indeveloping countries, the share of the euro inofficial foreign exchange reserves increasedsomewhat from 28.9% to 29.2%. However,it is difficult to draw inferences about globaltrends in the currency composition of officialreserves from these data since major reserveaccumulators, most notably in Asia, are nolonger covered.
As far as the role of the euro as an interventioncurrency is concerned, it appears that several

10ECB cReview of the international role of the euroDecember 2005
central banks in EU neighbouring countriescontinued during the review period to interveneby using the euro as the intervention currency.In particular, this applies to some new MemberStates and EU acceding and accessioncountries. More recently there have beenindications that, for the first time, the Bank ofRussia has intervened in the rouble/euromarket.
With regard to the private use of the euro as aparallel currency, shipments of euro banknotesby banks to destinations outside the euro areahave started to stabilise. However, transfers ofeuro banknotes to and from the euro area couldalso take place through channels other thanMFIs. The share of euro-denominateddeposits, on the other hand, increased in mostnew Member States and EU acceding andaccession countries. In addition, the share ofeuro-denominated deposits increased in someCIS and Middle East countries.
CONCLUSIONS
In the period under review, the euro continued toexpand some facets of its role as an internationalcurrency while in other market segments alevelling-off has been observed. In particular,the use of the euro in international debtsecurities, as an anchor and interventioncurrency and as a deposit currency in thirdcountries has continued to increase gradually.In markets such as international loan anddeposits and global foreign exchange, and ininternational trade, the use of the euro hasexhibited a substantial degree of stability. Inline with the conclusions drawn in previousreports, this review finds theinternationalisation of the euro to becharacterised by a strong institutional andregional pattern.
This review Previous review(latest data available)
Share of the euro in:
– narrowly defined stock of international debt securities1) 2005 Q2: 31.5% 2004 Q2: 30.7%
– cross-border loans from non-euro area banks to non-bankborrowers outside the euro area1 2005 Q1: 6.2% 2004 Q1: 4.9%
– cross-border deposits of non-euro area non-banks in banksoutside their country of residence excluding the euro area1 2005 Q1: 8.4% 2004 Q1: 7.7%
– daily foreign exchange trading (settled by CLS) 2 30 June 2005: 43% 30 June 2004: 44%
– settlement/invoicing of exports of goods to non-euro arearesidents of a number of euro area countries 2004: 44% to 63% 2003: 47% to 63%
– settlement/invoicing of imports of goods from non-euro arearesidents of a number of euro area countries 2004: 41% to 61% 2003: 40% to 60%
– share of the euro in global foreign exchange reserves(as per new IMF methodology) end-2004: 24.9% end-2003: 25.3%
Cumulative net shipments of euro banknotes to destinationsoutside the euro area June 2005: €55 billion June 2004: €46 billion
Key data
1) At constant 1994 Q1 exchange rates.2) Given the convention to account for both sides of each trade in foreign exchange markets, percentages add up to 200%, meaningthat the euro’s actual share in total turnover is half the percentage reported in this key data sheet.
11ECB
Review of the international role of the euroDecember 2005
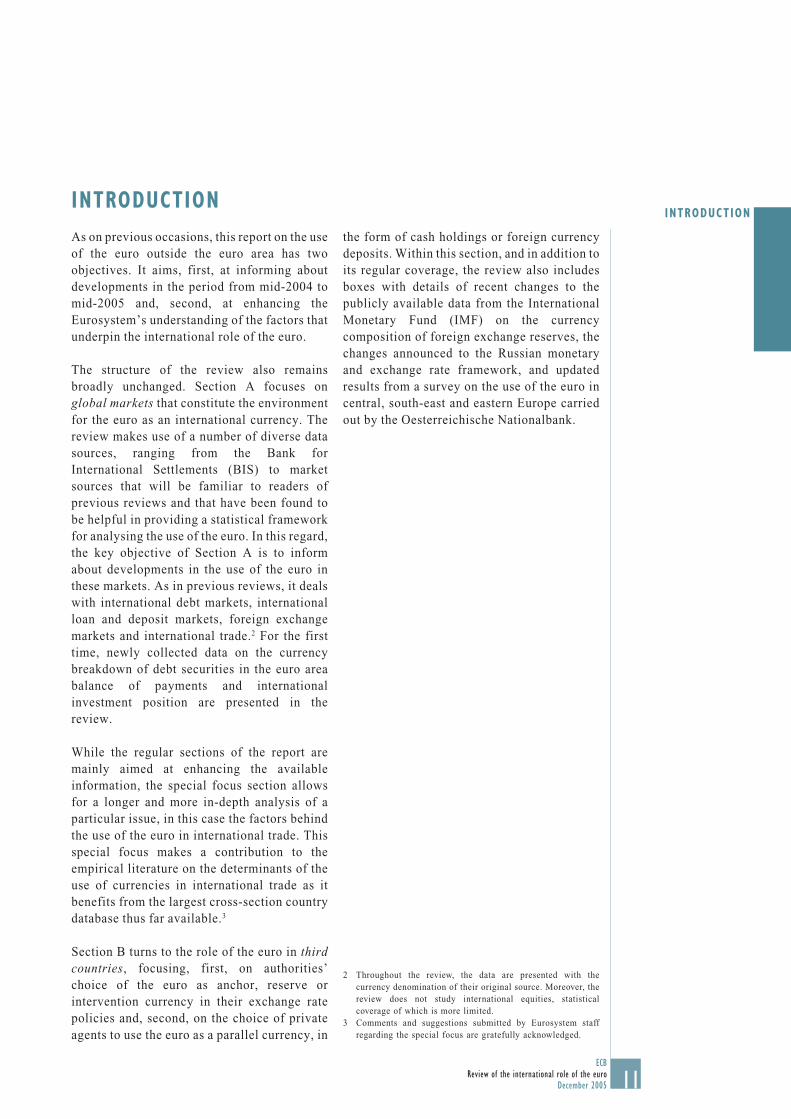
INTRODUCTIONINTRODUCTIONAs on previous occasions, this report on the useof the euro outside the euro area has twoobjectives. It aims, first, at informing aboutdevelopments in the period from mid-2004 tomid-2005 and, second, at enhancing theEurosystem’s understanding of the factors thatunderpin the international role of the euro.
The structure of the review also remainsbroadly unchanged. Section A focuses onglobal markets that constitute the environmentfor the euro as an international currency. Thereview makes use of a number of diverse datasources, ranging from the Bank forInternational Settlements (BIS) to marketsources that will be familiar to readers ofprevious reviews and that have been found tobe helpful in providing a statistical frameworkfor analysing the use of the euro. In this regard,the key objective of Section A is to informabout developments in the use of the euro inthese markets. As in previous reviews, it dealswith international debt markets, internationalloan and deposit markets, foreign exchangemarkets and international trade.2 For the firsttime, newly collected data on the currencybreakdown of debt securities in the euro areabalance of payments and internationalinvestment position are presented in thereview.
While the regular sections of the report aremainly aimed at enhancing the availableinformation, the special focus section allowsfor a longer and more in-depth analysis of aparticular issue, in this case the factors behindthe use of the euro in international trade. Thisspecial focus makes a contribution to theempirical literature on the determinants of theuse of currencies in international trade as itbenefits from the largest cross-section countrydatabase thus far available.3
Section B turns to the role of the euro in thirdcountries, focusing, first, on authorities’choice of the euro as anchor, reserve orintervention currency in their exchange ratepolicies and, second, on the choice of privateagents to use the euro as a parallel currency, in
the form of cash holdings or foreign currencydeposits. Within this section, and in addition toits regular coverage, the review also includesboxes with details of recent changes to thepublicly available data from the InternationalMonetary Fund (IMF) on the currencycomposition of foreign exchange reserves, thechanges announced to the Russian monetaryand exchange rate framework, and updatedresults from a survey on the use of the euro incentral, south-east and eastern Europe carriedout by the Oesterreichische Nationalbank.
2 Throughout the review, the data are presented with thecurrency denomination of their original source. Moreover, thereview does not study international equities, statisticalcoverage of which is more limited.
3 Comments and suggestions submitted by Eurosystem staffregarding the special focus are gratefully acknowledged.

12ECB cReview of the international role of the euroDecember 2005
This section reviews the role of the euro ininternational debt markets, which compriseinstruments with both long-term maturities(bonds and notes) and short-term maturities(money market instruments).4 As in previousyears, the focus of the analysis is on the so-called “narrow” definition of internationalsecurities, which comprises only issues in acurrency other than the currency of the countryin which the borrower resides (see Box 1 for adiscussion of alternative definitions of“international” issuance).5 With a view toanalysing the main developments in the
A TH E E URO I N G LOBA L MARKE T S
1 THE EURO IN INTERNATIONAL DEBT MARKETSinternational debt securities market from mid-2004 to mid-2005, sub-section 1.1 reviewssupply trends for debt securities as a whole,sub-section 1.2 covers trends across thevarious financing instruments and sub-section1.3 presents the evidence available on demand.
Box 1
A LT E RNAT I V E D E F I N I T I ON S O F TH E “ I N T ERNAT I ONA L” I S S UANC E O F D EB TS E CUR I T I E S
For the sake of clarity and simplicity, a single “narrow” concept of international issuance ofdebt securities (i.e. bonds and notes, as well as money market instruments) is used throughoutthis review. That “narrow” measure of international issuance is defined as issuance in acurrency other than the currency of the country in which the borrower resides.
Other possible definitions of an international bond exist and the ECB has in fact made referencein the past to these alternative measures (see ECB, 2002 and 2001). In particular, the “broad”measure adds to the “narrow” measure the issuance of debt securities denominated in the homecurrency of the borrower, provided that this issuance is targeted at the international financialmarket. While it is a measure of the total supply of debt securities available to a non-residentinvestor, the “broad” measure also includes bonds for which both the issuer and investorsoriginate in the euro area, even if they were initially targeted at non-euro area investors. The“global” measure of debt securities adds to the “broad” measure all domestic issues targeted atthe domestic market. It is a measure of the total supply in the world of debt securitiesdenominated in a given currency, be it domestic or international. For illustrative purposes, thetable hereafter reports the latest evidence available on these two alternative measures.
4 Bonds and notes have a maturity at issuance of more than oneyear, while money market instruments have a maturity atissuance of up to one year.
5 For further discussion of various analytical concepts withrespect to proper measurement of the international roles ofcurrencies in debt securities markets, see Detken, C. andP. Hartmann (2000).
Alternative measures of debt securit ies supply and major currencies’ shares
(first quarter of 2005, values at current exchange rates)
Shares (%)
Amounts outstanding(USD billions) Euro US dollar Japanese yen
“Narrow” measure, excluding home currency issuance 5,940 33.1 41.4 7.6“Broad” measure, including home currency issuance 14,117 46.4 36.9 3.8“Global” measure, including domestic issuance 58,051 27.3 42.2 16.2
Sources: BIS and ECB calculations.

13ECB
Review of the international role of the euroDecember 2005
1 THE EUROIN INTERNATIONAL
DEBT MARKETS1.1 OVERALL TRENDS IN INTERNATIONAL DEBTSECURITIES SUPPLY
Net issuance of euro-denominated debtsecurities by non-euro area residents amountedto close to USD 277 billion between the thirdquarter of 2004 and the second quarter of 2005,i.e. to about 34% more than in the same perioda year ago (see Table 1).6 According to theECB’s narrow measure (see Box 1), euro-denominated net issuance exceeded thecorresponding figure for other majorcurrencies in the third quarter of 2004 andduring the first quarter of 2005. This may tosome extent be due to valuation effects. Whilequarterly issuance of international debtsecurities remained fairly volatile, it appearsthat, on average during the review period, non-euro area residents tended to broaden theirinvestor base by issuing more (or reducingredemptions of) euro-denominated debt.7 Thisphenomenon appears to have been mainlydriven by corporate issuers based in the UnitedKingdom and the United States (see Table 1,and Table 4 which reports the largest issuersover the review period in gross terms).
As a result of these developments, the share ofthe euro in the stock of international debtsecurities, measured at constant exchangerates, rose slightly from 30.7% in June 2004 to31.5% (see Chart 1).8 The share of the USdollar declined moderately from 44.8 % inJune 2004 to 44%, while that of the Japaneseyen fell from 9.3% in June 2004 to 8%.
Pro memoria: 2004 2004 2005 2005 2004 Q3-2005 Q22003 Q3-2004 Q21) Q3 Q4 Q1 Q2 (total issuance)
Euro 51.6 86.7 60.7 82.7 46.9 277.0US dollar 69.6 52.3 65.5 62.9 50.3 231.0Japanese yen 0.8 2.1 -5.8 4.7 -10.2 -9.2
Total (incl. other currencies) 153.1 175.9 139.4 205.0 124.2 644.5
Sources: BIS and ECB calculations. 1) Average quarterly amount.
Table 1 Net issuance of international debt securit ies
(narrow measure, i.e. excluding home currency issuance, USD billions)
6 Net issuance of debt securities is def ined as gross issuanceminus repayments.
7 The effort of corporate issuers to broaden their investor base,as approximated by the volume of deposits in a certain region,has been found to be a statistically significant determinant ofthe currency choice in international bond issuance in a paneldata set including around 7,500 issues in the period from 1999to 2003. See ECB (2005) for details. See also Geis, A., A.Mehl and S. Wredenborg (2004).
8 As has already been explained in ECB (2002), currency sharesrelated to debt securities data are (i) derived at constant 1994Q1 exchange rates for stock data and (ii) at current exchangerates for flow data. Although correcting for exchange ratevaluation effects may imply some imprecision, the currencyvaluation effect for stock data has been deemed too importantto be neglected, as most stock variables cannot be adjusted bymarket participants in the face of exchange rate movements.
1.2 SPECIFIC TRENDS ACROSS FINANCINGINSTRUMENTS
In the short-term international debt securitiesmarket, the currency shares remained broadlystable. When measured at current exchangerates, thus to some extent reflecting valuation
Chart 1 Stock of international debtsecurit ies : currency shares
(bonds, notes and money market instruments, excluding homecurrency issuance, as a percentage of the total amount out-standing and at 1994 Q1 exchange rates)
Sources: BIS and ECB.
0
10
20
30
40
50
60
0
10
20
30
40
50
60
euroUS dollarJapanese yen
Start of Economic and Monetary Union
Review period
1994 1995 1996 1997 1998 1999 2000 2001 2002 2003 2004 2005

14ECB cReview of the international role of the euroDecember 2005
effects, the euro’s share increased to 37.1% oftotal gross issuance of international moneymarket instruments in the second quarter of2005, up from 35.5% in the second quarter of2004 (see Table 2). For the review period as awhole, the share of the euro in gross issuanceof international short-term securities stood onaverage at around 37%, which corresponds to agross amount of euro-denominated issues ofroughly USD 525 billion (compared with USD405 billion in the previous year). By contrast,the US dollar’s share in gross issuance ofinternational money market instrumentscontinued to decline, reaching 39% in thesecond quarter of 2005 and an average of39.6% during the whole review period,compared with an average of 40.6% during theprevious review period. Likewise, theJapanese yen’s share in gross issues ofinternational money market instrumentscontinued to decrease, reaching 1.7% in the
fourth quarter of 2004. However, the Japaneseyen’s share then recovered somewhat to standat 2.2% in the second quarter of 2005.
In the long-term segment, when measured atcurrent exchange rates and, thus, to someextent possibly reflecting valuation effects,the share of the euro in international issuanceof bonds and notes stood at 34.9% in thesecond quarter of 2005 (see Table 3). Acrossquarters, the share of the euro in internationalgross issues of bonds and notes was morevolatile than in the case of short-termsecurities. International issuance of euro-denominated bonds and notes was particularlyhigh in the third quarter of 2004 when euro-denominated issues accounted for close to 39%of all international bonds and notes issued, thehighest share recorded thus far. In the first halfof 2005 around USD 278 billion worth of euro-denominated international bonds and notes
Pro memoria: 2004 2004 2005 2005 2004 Q3-2005 Q21)
2003 Q3-2004 Q21) Q3 Q4 Q1 Q2 (total issuance)2)
Euro 31.7 38.7 33.8 34.5 34.9 35.5 (515.5)US dollar 43.4 37.6 41.7 38.8 39.2 39.3 (571.9)Japanese yen 7.0 5.5 6.9 6.3 6.3 6.3 (91)
Total (incl. other currencies) 100.0 100.0 100.0 100.0 100.0 100.0 (1,456)
Table 3 Major currencies’ shares in gross issuance of long-term international debt securit ies
(narrow measure, i.e. excluding home currency issuance, as a percentage of the total amount issued)
Sources: BIS and ECB calculations.Note: Shares at current exchange rates.1) Average quarterly percentage.2) Amounts in USD billions.
Pro memoria: 2004 2004 2005 2005 2004 Q3-2005 Q2 1)
2003 Q3-2004 Q21) Q3 Q4 Q1 Q2 (total issuance) 2)
Euro 34.9 36.8 36.5 37.7 37.1 37.0 (525.3)US dollar 40.6 40.7 41.0 37.7 39.0 39.6 (561.1)Japanese yen 2.7 1.9 1.7 2.5 2.2 2.1 (29.7)
Total (incl. other currencies) 100.0 100.0 100.0 100.0 100.0 100.0 (1,418)
Table 2 Major currencies’ shares in gross issuance of short-term international debt securit ies
(narrow measure, i.e. excluding home currency issuance, as a percentage of the total amount issued)
Sources: BIS and ECB calculations.Note: Shares at current exchange rates.1) Average quarterly percentage.2) Amounts in USD billions.
15ECB
Review of the international role of the euroDecember 2005
1 THE EUROIN INTERNATIONAL
DEBT MARKETS
were issued, compared with USD 312 billionissued in US dollars during the same period.
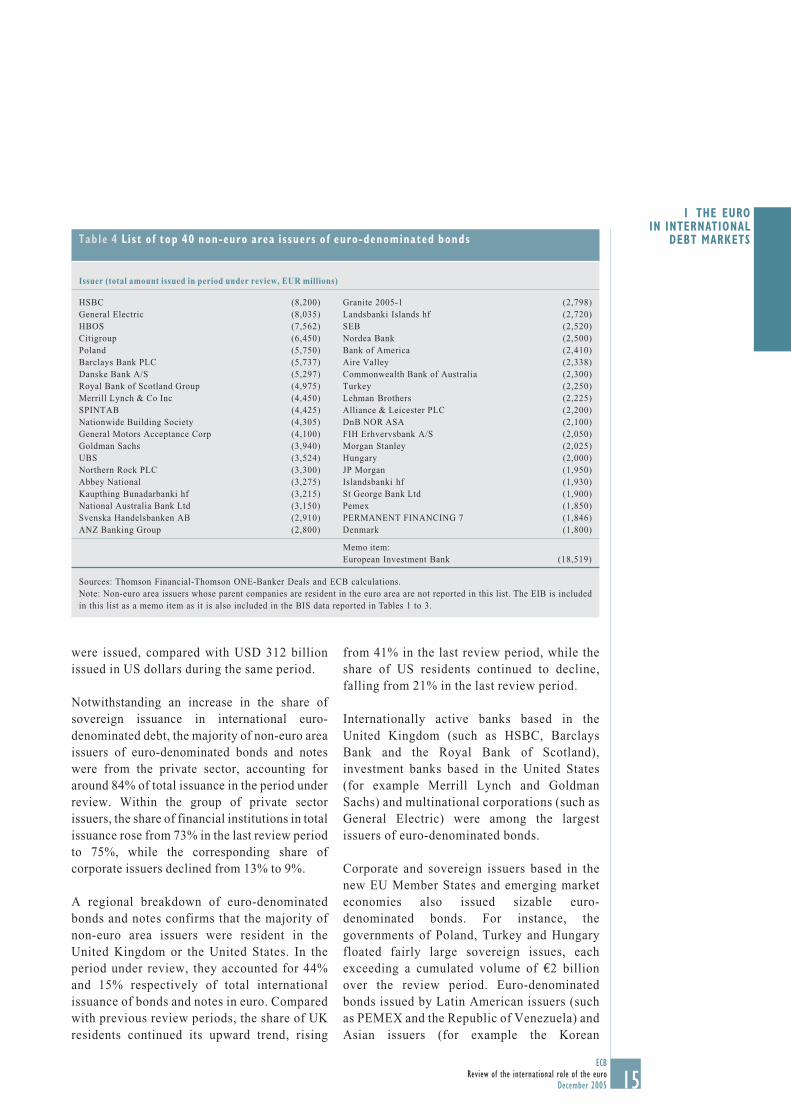
Notwithstanding an increase in the share ofsovereign issuance in international euro-denominated debt, the majority of non-euro areaissuers of euro-denominated bonds and noteswere from the private sector, accounting foraround 84% of total issuance in the period underreview. Within the group of private sectorissuers, the share of financial institutions in totalissuance rose from 73% in the last review periodto 75%, while the corresponding share ofcorporate issuers declined from 13% to 9%.
A regional breakdown of euro-denominatedbonds and notes confirms that the majority ofnon-euro area issuers were resident in theUnited Kingdom or the United States. In theperiod under review, they accounted for 44%and 15% respectively of total internationalissuance of bonds and notes in euro. Comparedwith previous review periods, the share of UKresidents continued its upward trend, rising
Issuer (total amount issued in period under review, EUR millions)
HSBC (8,200) Granite 2005-1 (2,798)General Electric (8,035) Landsbanki Islands hf (2,720)HBOS (7,562) SEB (2,520)Citigroup (6,450) Nordea Bank (2,500)Poland (5,750) Bank of America (2,410)Barclays Bank PLC (5,737) Aire Valley (2,338)Danske Bank A/S (5,297) Commonwealth Bank of Australia (2,300)Royal Bank of Scotland Group (4,975) Turkey (2,250)Merrill Lynch & Co Inc (4,450) Lehman Brothers (2,225)SPINTAB (4,425) Alliance & Leicester PLC (2,200)Nationwide Building Society (4,305) DnB NOR ASA (2,100)General Motors Acceptance Corp (4,100) FIH Erhvervsbank A/S (2,050)Goldman Sachs (3,940) Morgan Stanley (2,025)UBS (3,524) Hungary (2,000)Northern Rock PLC (3,300) JP Morgan (1,950)Abbey National (3,275) Islandsbanki hf (1,930)Kaupthing Bunadarbanki hf (3,215) St George Bank Ltd (1,900)National Australia Bank Ltd (3,150) Pemex (1,850)Svenska Handelsbanken AB (2,910) PERMANENT FINANCING 7 (1,846)ANZ Banking Group (2,800) Denmark (1,800)
Memo item:European Investment Bank (18,519)
Sources: Thomson Financial-Thomson ONE-Banker Deals and ECB calculations.Note: Non-euro area issuers whose parent companies are resident in the euro area are not reported in this list. The EIB is includedin this list as a memo item as it is also included in the BIS data reported in Tables 1 to 3.
Table 4 List of top 40 non-euro area issuers of euro-denominated bonds
from 41% in the last review period, while theshare of US residents continued to decline,falling from 21% in the last review period.
Internationally active banks based in theUnited Kingdom (such as HSBC, BarclaysBank and the Royal Bank of Scotland),investment banks based in the United States(for example Merrill Lynch and GoldmanSachs) and multinational corporations (such asGeneral Electric) were among the largestissuers of euro-denominated bonds.
Corporate and sovereign issuers based in thenew EU Member States and emerging marketeconomies also issued sizable euro-denominated bonds. For instance, thegovernments of Poland, Turkey and Hungaryfloated fairly large sovereign issues, eachexceeding a cumulated volume of €2 billionover the review period. Euro-denominatedbonds issued by Latin American issuers (suchas PEMEX and the Republic of Venezuela) andAsian issuers (for example the Korean

16ECB cReview of the international role of the euroDecember 2005
Development Bank and the Peoples Republicof China) and with an average size ofaround €1 billion were also well received ininternational capital markets. However, theregional pattern of international issuance ofeuro-denominated bonds did not changematerially during the review period as Asianand Latin American issuers accounted foronly 7% and 1% respectively of internationaleuro-denominated issuance.
1.3 EVIDENCE AVAILABLE ON DEMAND TRENDS
As in previous years, an analysis of thelocation of issuance and of the investor basehelps explain the main characteristics of thedemand for euro-denominated bonds issued bynon-euro area residents. A review of theavailable evidence appears to confirm thateuro-denominated bonds issued by non-euroarea residents have been targeted mainly atEuropean investors. Nevertheless, afterlevelling off slightly in 2004, there was anincreased interest from Asian and, to a lesserextent, North American investors in euro-denominated issues in the period under review(see Chart 2).9
Despite the increased participation by US-based investors in euro-denominated bondissues, the share of the euro in bond funds inNorth America (the United States and Canada)remains negligible. Evidence from data onbond portfolios surveyed in the eMaxxdatabase by Lipper, a financial informationprovider, suggests that the euro’s share inNorth America increased only slightly to 0.7%of bonds under management (see Table 5).10 Inabsolute terms, surveyed bond holdings in euroin North America only amounted to USD 34billion in June 2005, up from USD 28 billion inJune 2004. However, as stressed in previousreviews, market participants suggest that US-based investors mostly manage their portfoliosinvested in euro from the City of London. Theshare of the euro in the portfolios of funds innon-euro area Europe declined to 26.2%, downfrom 32.1% in June 2004. However, given the
limited coverage of the eMaxx database,inferences from these data should be treatedwith some caution.11
Additional evidence from The Economist’squarterly portfolio polls suggests that the shareof euro-denominated bonds in the portfolios ofmajor global asset managers increased slightlyin the second quarter of 2005 to 30%, up from27% in June 2004.12
Newly available data collected by theEurosystem on the currency composition of theeuro area’s portfolio investment confirm that
Chart 2 Euro-denominated bonds issued bynon-euro arearesidents: frequency of Asian andUS investors’ primarymarketparticipation(as a percentage of the total number of bond issues for whichinformation is available)
Sources: Thomson Financial-Thomson ONE Banker-Deals,International Financing Review (various issues) and ECBcalculations.Note: Based on information reported by the InternationalFinancing Review on 1042 bond issues. Inludes any Asian/USinvestment irrespective of its size.
0
20
40
0
20
40
1999 2000 2001 2002 2003 2004 first halfof 2005
AsiaUnited States
9 While the data seem to support the view of a recently risinginterest of Asian investors in euro-denominated issues, theycould also reveal a relative increase in information reportedby the International Financing Review on investments byAsian accounts on the primary market.
10 The evidence presented on demand trends may to some extentreflect valuation effects.
11 The eMaxx database reports holdings of debt securitiesmanaged by a number of mutual funds, pension funds andinsurance companies. These holdings are available on asecurity-by-security basis. The geographical coverage ismainly focused on the United States, Canada and Europe andthe degree of coverage of portfolios may not necessarily bethe same throughout time. Data refer to euro-denominatedbonds issued by non-euro area residents and euro arearesidents alike.
12 The Economist polls on a quarterly basis eight to nine majorglobal asset managers, including one to two from the euroarea. The polls include questions regarding the currencydistribution of bond holdings.

17ECB
Review of the international role of the euroDecember 2005
1 THE EUROIN INTERNATIONAL
DEBT MARKETS
Euro US dollar Japanese yen Others
Funds under management in the United States and CanadaDecember 1999 0.2 97.0 0.8 2.0December 2000 0.3 97.8 0.8 1.1December 2001 0.4 97.1 0.8 1.7December 2002 0.4 97.4 0.7 1.5December 2003 0.6 97.3 0.7 1.4June 2004 0.6 97.1 0.8 1.5December 2004 0.5 96.9 0.9 1.6June 2005 0.7 97.3 0.8 1.2
Funds under management in non-euro area Europe1)
December 1999 15.9 26.8 0.7 56.6December 2000 25.3 23.0 1.4 50.3December 2001 30.8 17.3 2.9 49.1December 2002 35.5 21.1 3.0 40.3December 2003 33.8 18.9 3.1 44.2June 2004 32.1 18.2 2.3 47.4December 2004 28.2 15.9 2.3 53.6June 2005 26.2 23.6 2.9 47.3
Sources: Lipper, a Reuters company, and ECB calculations. Data may be subject to revisions.1) Denmark, Monaco, Norway, Sweden, Switzerland, Liechtenstein and the United Kingdom.
Table 5 Currency breakdown of funds under management according to the eMaxx database
(based on most recent filings; end-of-period percentages)
euro-denominated bonds issued by non-euroarea residents have been targeted mainly ateuro area investors. Indeed, at the end of 2004the total value of euro-denominated assetsissued by non-residents and held by euro arearesidents was €958 billion (see Box 2). As theamount outstanding of international euro-denominated debt securities (narrow measure)at the end of 2004 was €1,453 billion, this
suggests that more than one-half ofinternational euro-denominated securities areheld by euro area residents.13
13 Due to the fact that the aggregate portfolio investment f iguresfor the euro area are reported at market value and the amountoutstanding of international euro-denominated securities isreported in nominal terms, these f igures are not directlycomparable. However, the comparison does illustrate theorder of magnitude of these aggregates.
Box 2
CURR ENCY B R E AKDOWN O F D EB T S E CUR I T I E S I N TH E EURO A R E A B A L ANC E O FPAYMENT S / I N T ERNAT I ONA L I N V E S TMENT PO S I T I ON
In 2005 the Eurosystem collected, for the first time, data on the currency breakdown of debtsecurities in the portfolio investment account of the euro area balance of payments (b.o.p.) andinternational investment position (i.i.p.).
On the asset side, i.i.p. data show that the holdings of euro-denominated debt securities (mainlybonds and notes) issued by non-residents of the euro area and held by euro area residentsreached €958 billion at the end of 2004, i.e. 54.9% of the total holdings of “foreign” securities.Transactions in the second half of 2004 showed net purchases in foreign debt securities inthe portfolios of euro area investors by €117 billion, consisting predominantly of foreign-denominated securities.

18ECB cReview of the international role of the euroDecember 2005
As regards euro area liabilities, the i.i.p. data recently collected indicate that €1,586 billion ofsecurities issued by euro area residents and denominated in euro (and therefore regarded as“domestic”, from the point of view of their issuance) were held by non-euro area residents at theend of 2004. This aggregate, measured at market value, may be compared in broad terms (due todifferences in valuation methods) with the outstanding amount of euro-denominated debtsecurities issued by euro area residents as at the same date, i.e. €8,570 billion. Furthermore, thei.i.p. data also indicate that 70.5% of the euro area debt securities held by non-euro areainvestors were denominated in euro at the end of 2004. In the second half of 2004 non-euro arearesident investors purchased €68 billion of euro area debt securities, two thirds of which weredenominated in euro.
1.4 STOCKS OF INTERNATIONAL DEBTSECURITIES, BROKEN DOWN BY CURRENCYAND REGION
As in the last review, a more detailedstocktaking exercise presents an overview ofthe currency composition of the stock ofinternational debt securities (according to thenarrow measure, measured at constant exchangerates), broken down into the regions in which theissuers reside (see Table 6).14 In line withprevious findings, European entities remain thelargest issuers of international debt securities,accounting for USD 2,501 billion, or around47%, of the total stock of international debt
securities in the second quarter of 2005.Compared with the end of the last review period,this constitutes a slight increase of about threepercentage points. Outside Europe, issuance byentities resident in offshore centres, by USresidents and by international organisationscontinue to account for the second, third andfourth largest stock of issues respectively.
As reported in sub-section 1.1, euro-denominated international issues accountedfor around 31% of the total stock ofinternational issues in the second quarter of
Outstanding amounts Shares (%)
All Other Other currencies Euro currencies Euro currencies
Total (nominal value) 9,408 8,570 837 91.1 8.9Held by non-euro area residents (market value) 2,251 1,586 665 70.5 29.5
Debt securit ies issued by euro area res idents
(EUR billions, outstanding amounts at end-2004)
Source: ECB.
Debt securit ies issued by non-euro area residents
(EUR billions, outstanding amounts at end-2004)
Sources: ECB, BIS and ECB calculations.
Outstanding amounts Shares (%)
All Other Othercurrencies Euro currencies Euro currencies
Total (nominal value) 33,061 1,453 31,608 4.4 95.6Held by euro area residents (market value) 1,745 958 788 54.9 45.1
14 It is worth noting that the total f igures reported in the last rowof Table 6 correspond to those shown in Chart 1.

19ECB
Review of the international role of the euroDecember 2005
1 THE EUROIN INTERNATIONAL
DEBT MARKETS2005. The largest stock of international debtsecurities in euro continues to be accounted forby Denmark, Sweden and the United Kingdom.Compared with the second quarter of 2004, theshare of the euro in the combined stock ofinternational debt securities issued byresidents in those three countries rose by closeto three and a half percentage points to around56%. Similarly, the share of the euro in thestock of international debt securities issued inthe new Member States increased by almosttwo percentage points to about 75%. Incontrast to developments in the pre-incountries and the new Member States, the shareof the euro in non-EU Europe has declined.And as far as other regions are concerned, the
share of the euro in the stock of internationaldebt securities in the Asia-Pacific regionincreased by around three percentage points.Most notably, the share of the euro increasedby 4.5 percentage points to 36.5% in Japan. Inthe Middle East and offshore centres, the shareof the euro declined by close to four and twopercentage points respectively. In otherregions of the world, including internationalorganisations, the share of euro remainedbroadly stable with changes from the secondquarter of 2004 being less than or equal to onepercentage point.
Overall, despite some gradual changes takingplace mainly in Asia, the regional breakdown
Table 6 Currencies’ shares in the stock of outstanding international debt securit ies inselected regions(narrow measure, i.e. excluding home currency issuance, as a percentage of the total amount outstanding and at constant 1994 Q1exchange rates)
Total amount of which denominated in:outstanding
US dollar Euro Japanese yen Other currencies
(Percent. (Percent. (Percent. (Percent.point point point point
All currencies change change change change(USD billions) (%) vis-à-vis) (%) vis-à-vis) (%) vis-à-vis) (%) vis-à-vis)
2005 2004 2005 2004 2005 2004 2005 2004 2005 2004 Q2 Q2 Q2 Q2 Q2 Q2 Q2 Q2 Q2 Q2
Africa 21 22 60.2 -2.6 28.4 2.2 10.7 0.4 0.7 0.0Asia and Pacific 470 398 65.9 -3.1 19.6 2.9 4.7 -0.7 9.7 0.9
of which:Japan 55 54 57.4 -1.6 36.5 4.5 ... ... 6.0 -2.9
Europe 2,501 2,077 42.6 -2.0 31.0 2.6 7.9 -1.1 18.5 0.5
of which:Euro area 1,066 916 52.7 -0.2 ... ... 12.3 -1.3 35.0 1.5Pre-Ins1) 1,196 968 34.2 -2.8 56.1 3.5 4.4 -0.9 5.3 0.2New Member States 65 46 13.7 -1.9 75.3 1.8 5.6 -1.4 5.4 1.5EU25 2,328 1,929 42.1 -2.0 30.9 2.8 8.0 -1.2 18.9 0.4Non-EU developed Europe2) 109 85 30.0 -1.1 41.5 -0.2 8.6 -0.6 19.9 1.9Non-EU developing Europe 65 63 81.7 2.0 16.5 -1.6 1.7 -0.5 0.0 0.0
International Organisations 506 492 35.4 -2.0 28.4 0.8 7.3 -0.3 28.9 1.5Latin America 288 310 80.2 1.9 17.3 -0.6 1.6 -1.3 0.9 0.0Middle East 57 47 79.6 5.2 18.9 -3.7 1.2 -1.4 0.3 -0.1North America 726 688 22.8 0.3 49.7 -0.6 9.5 -1.1 18.0 1.5
of which:Canada 223 215 74.3 2.2 11.8 -0.6 4.8 -0.8 9.0 -0.7United States 504 473 ... ... 66.5 -1.1 11.6 -1.3 21.9 2.3
Offshore centres 697 676 44.8 3.7 30.3 -1.7 16.0 -2.0 8.9 0.0
Total 5,267 4,708 44.1 -0.7 31.3 1.1 8.5 -1.2 16.1 0.9
Sources: BIS, ECB calculations.1) Denmark, Sweden and the United Kingdom.2) Iceland, Norway, Switzerland and European microstates.

20ECB cReview of the international role of the euroDecember 2005
continues to provide further evidence for thegeographical pattern of the international roleof the euro, which can also be found in othermarket segments and in the use of the euro bythird countries: the internationalisation of thesingle currency is still strongly focused on theeuro area’s neighbouring regions, in particularnon-euro area EU Member States, and maturemarket economies.

21ECB
Review of the international role of the euroDecember 2005
2 THE EUROIN INTERNATIONALLOAN AND DEPOSIT
MARKETSThis year’s review continues to deepen thereporting on non-securitised financialinstruments by describing developments in theuse of the euro by non-euro area residents ininternational loan and deposit markets. Thedata presented exclude interbank activity,given that the currency choice in interbankmarkets may reflect other factors than thosecorresponding to loans to/deposits by non-bank borrowers/depositors.
Compared with the last review, the format ofthe presentation has been changed (see Chart4) in order to facilitate comparison of the roleof the euro at three levels, namely activitybetween euro area banks and non-bank agentsoutside the euro area, activity between euroarea non-banks and banks outside the euro areaand activity entirely outside the euro areabetween banks and non-bank agents. For bothloans and deposits, data for the currencycomposition as of the first quarter of 2005 ispresented for all three levels of activity.15
Finally, the use of the euro as the currency ofdenomination of bank deposits in BISreporting banks by oil-exporting countries isanalysed in Box 3.
2.1 THE ROLE OF THE EURO ININTERNATIONAL LOAN MARKETS
The total stock of loans granted by euro areabanks to non-bank borrowers outside the euroarea amounted to around USD 806 billion inthe first quarter of 2005 (see Chart 4, upperpanel, left diagram).16 The share of the euro,measured at constant 1994 Q1 exchange rates,while continuing to exhibit a high degree ofstability over time, has increased slightly to39% in the first quarter of 2005, up from 38%in the first quarter of 2004. Broadly in line withprevious findings, a look at the regionaldestination of loans reveals a similar pattern tothat observed in the case of international debtsecurities. Non-bank entities in developedcountries outside the euro area constitute themain borrowers from euro area banks, with anoutstanding amount of USD 524 billion in the
2 THE EURO IN INTERNATIONAL LOAN ANDDEPOSIT MARKETS
first quarter of 2005, around 65% of suchloans.17 For these borrowers, the share of theeuro in the denomination of loans granted byeuro area banks rose somewhat to 37% in thefirst quarter of 2005, up from 36% in the firstquarter of 2004 (see Chart 3).
In emerging market countries, in line with theevidence presented in the last review, the eurowas the main currency of denomination ofloans granted by euro area banks to non-bankborrowers in developing countries in Africaand the Middle East, Asia and the Pacific andin Europe, with a share above 50% in the first
15 Data for the international loan market are available from theBIS one quarter later than data for debt securities. In contrastto the presentation in the last review, the reported currencyshares include countries for which a currency breakdown forsome of the activities in the international loan and depositmarket as described above is not available.
16 Throughout this section, BIS data are used since they areavailable by currency with a breakdown of the destinations ofloans and deposits. Similar f igures, without the regionalbreakdown outside the euro area, are reported in the ECB’sMonthly Bulletin (e.g. loans by euro area MFIs to non-euroarea residents amounted to €1,580 billion at the end of thef irst quarter of 2005 – see Table 2.8.3 in the statistical sectionof the Monthly Bulletin).
17 According to the BIS classif ication, developed countriesinclude (in addition to euro area countries) Andorra,Australia, Canada, Denmark, Iceland, Japan, Liechtenstein,New Zealand, Norway, Sweden, Switzerland, the UnitedKingdom, the United States and Vatican City.
Chart 3 Loans made by euro area banks tonon-bank borrowers outside the euro area:currency shares by region(as a percentage of the total amount outstanding by region in2005 Q1 and at current exchange rates)
Sources: BIS and ECB calculations.
0
20
40
60
80
100
0
20
40
60
80
100
1 International organisations2 Developing Africa and Middle East3 Developing Asia and Pacific4 Developing Europe
other currenciesUSDEUR
1 2 3 4 5 6 7
5 Developed, non-euro area6 Offshore centres7 Developing Latin America and Caribbean
524 76 79 USD billions
36 50 34 5

22ECB cReview of the international role of the euroDecember 2005
quarter of 2005 (see Chart 3). By contrast,lending by euro area banks to Latin Americaand the Caribbean, as well as to offshorecentres, took place mainly in US dollars.
Focusing on individual countries, non-bankentities from the United Kingdom and theUnited States are the largest borrowers fromeuro area banks, and together continued toaccount for around half of the amount of suchloans (about USD 240 billion and USD 179billion respectively) in the first quarter of2005. As regards euro-denominated loansonly, non-bank borrowers from the UnitedKingdom continued to be by far the largestborrowers from euro area banks, with a share ofaround 46% in the first quarter of 2005.
During the review period, loans made by non-euro area banks to non-bank borrowers in theeuro area (see Chart 4, upper panel, rightdiagram) continued to be predominantlydenominated in euro. In the first quarter of2005 the euro’s share stood at 56% while loansdenominated in US dollars accounted for 27%of the total amount of loans outstanding. Othercurrencies, including the Japanese yen, had acombined share of 17% (see Chart 4). In linewith previous findings, the largest non-euroarea lenders to non-bank borrowers in the euroarea are UK banks, which accounted for about69% of the USD 427 billion worth of loansoutstanding in the first quarter of 2005. Duringthe review period UK banks also continued tobe the largest lenders of euro to non-bankborrowers in the euro area, accounting forabout 76% of the USD 182 billion worth ofeuro-denominated loans outstanding in thefirst quarter of 2005.
With regard to loans made outside the euro areaby banks to non-banks (see Chart 4, upperpanel, lower left diagram), the euro accountsfor 7% of total lending entirely outside the euroarea.18 In line with previous evidence, thelargest lenders to non-bank borrowers outsidethe euro area are UK banks and offshorefinancial centres, accounting for about one-half and one-third respectively of the USD
2,098 billion worth of loans outstanding in thefirst quarter of 2005. UK banks are also thelargest lenders of euro outside the euro area,accounting for more than 77% of the USD 143billion worth of such loans outstanding in thefourth quarter of 2004.
2.2 THE ROLE OF THE EURO ININTERNATIONAL DEPOSIT MARKETS
The stock of deposits in euro area banks madeby non-banks outside the euro area amounted toUSD 916 billion in the first quarter of 2005 (seeChart 4, lower panel, left diagram). The euro isthe most widely used currency of denominationof deposits by non-euro area non-banks withbanks in the euro area, accounting for USD 478billion or around 51% of the total deposits in thefirst quarter of 2005. Of the total stock of suchdeposits, around 65% or USD 600 billion wereheld by residents of developed countries otherthan those in the euro area. From a geographicalperspective, and in line with previous findings,the largest share of deposits was held byresidents in the United Kingdom, followed bythose in offshore financial centres, accountingfor around one-third and one-fifth respectivelyof all deposits by non-euro area non-banks witheuro area banks in the first quarter of 2005.Deposits held by US non-banks remained inthird place with around one-fifth of all suchdeposits. Looking at euro-denominateddeposits only, the largest share was also heldby residents in the United Kingdom, whichaccounted for 51% of euro-denominateddeposits held with euro area banks by non-euroarea non-banks in the first quarter of 2005. Aswas broadly the case in previous years, residentsin offshore financial centres accounted foraround 18% of such deposits. By contrast, the
18 Any comparison with the shares of other currencies asreported in Chart 4 should be made bearing in mind the factthat lending by, for example, US banks to non-US residents isincluded while, in line with the narrow def inition of theinternational use of the euro used throughout the review,lending by euro area banks to non-euro area residents isexcluded. Likewise, lending to US residents is included whilelending to euro area residents is excluded. The same applies tothe data on international deposits shown in Chart 4.

23ECB
Review of the international role of the euroDecember 2005
2 THE EUROIN INTERNATIONALLOAN AND DEPOSIT
MARKETSChart 4 Euro share in international loan and deposit markets
(first quarter of 2005, values at current exchange rates)
Cross-border deposits between euro area and non-euro area entities
Cross-border loans between euro area and non-euro area entities
US dollar euro Japanese yen other currencies
Euro area
Banks Non-banks
Non-euro area
Non-banks Banks
Total volume (USD bln)806
Total volume (USD bln)427
44%
39%
2%15%
27%
56%
3%
14%
Total volume (USD bln)2,098
70%
7%
8%
15%
US dollar euro Japanese yen other currencies
Euro area
Banks Non-banks
Non-euro area
Non-banks Banks
Total volume (USD bln)916
Total volume (USD bln)556
31%
51%
2%
16%30%
54%
1%
15%
Total volume (USD bln)2,796
68%
9%
5%
18%
Sources: BIS and ECB calculations.Note: Excluding interbank loans and deposits.

24ECB cReview of the international role of the euroDecember 2005
share of US entities in such deposits was muchlower at around 9%.
The stock of deposits of euro area non-banks inbanks outside the euro area amounted to USD556 billion in the first quarter of 2005 (see Chart4, lower panel, right diagram). Of this amount,around 54% were denominated in euro. About73% of all deposits denominated in euro by euroarea non-banks and held in banks outside theeuro area are held with UK banks.
The total stock of deposits held by non-euro areanon-banks in banks outside their home country,excluding the euro area, amounted to aroundUSD 2,796 billion in the first quarter of 2005(see Chart 4, lower panel, lower left diagram).The amount of such cross-border deposits that isdenominated in euro remains relatively small,standing at around USD 257 billion in the firstquarter of 2005. From a geographicalperspective, the largest share of these cross-border deposits in the first quarter of 2005 was
Loans by Loans by Loans made Deposits in Deposits in Deposits held byeuro area non-euro area outside the euro area banks outside non-euro areabanks to banks to euro area banks made the euro area non-banks
non-bank non-bank by banks to by non-banks by euro area outside theirborrowers borrowers in non-banks outside the non-banks home country
outside the the euro area euro area euro area
March 2002 36.2 48.0 5.3 47.2 55.5 8.4March 2003 37.6 50.1 6.5 51.2 55.5 8.8March 2004 37.9 54.1 4.9 51.1 54.2 7.7March 2005 37.4 54.1 6.2 50.6 51.5 8.4
Table 7 The share of the euro in international loan and deposit markets
(as a percentage of the total amount outstanding and at constant 1994 Q1 exchange rates)
Sources: BIS and ECB calculations.
held with banks in offshore financial centres,accounting for around 44% of the total, followedby those held with UK banks (around 33% of thetotal). Looking at euro-denominated depositsonly, the largest shares were held with UK banks(around 48% of all euro-denominated cross-border deposits), financial offshore financialcentres (around 25%) and banks in Switzerland(around 21%).
When measured at constant exchange rates, theshare of the euro in all segments of internationalloan and deposit markets has been characterisedby a high degree of stability, with changes beingof the order of around one percentage point orless (see Table 7).
Notwithstanding the considerable degree ofstability of the share of the euro in aggregatedinternational loan and deposit markets, somechanges may be taking place at the countrylevel, in particular with respect to oil-exporting economies (see Box 3).
Box 3
TH E RO L E O F TH E EURO I N TH E R E C Y C L I NG O F O I L R E V ENUE S
Oil price increases and rising production volumes since 2003 have fuelled oil export revenuesin most oil-producing countries, in particular Russia, the world’s second largest oil exporter,and the members of the Organisation of the Petroleum Exporting Countries (OPEC). CombinedOPEC and Russian revenues are estimated to have increased from USD 250 billion in 2002 toaround USD 600 billion at the end of 2005. This transfer of wealth may induce, among others,

25ECB
Review of the international role of the euroDecember 2005
2 THE EUROIN INTERNATIONALLOAN AND DEPOSIT
MARKETS
the recycling of oil revenues by the oil-exporting countries in global financial markets throughdeposits with international banks and/or purchases of foreign equity and debt securities.
Traditionally, and in particular in the early 1980s in the aftermath of the second oil-price shock,the OPEC economies invested mainly in US assets and markets and maintained bankingdeposits almost exclusively in US dollars. However, since the most recent surge in oil prices in2003, the oil-exporting countries have seemed to diversify, to a certain extent, their portfolioallocation into both US dollar and euro-denominated assets, despite the fact that crude oilcontracts are still traded predominantly in US dollars. For example, the OPEC economies andRussia together have invested almost €8 billion in German equity and debt securities since thebeginning of 2003, compared with €41 billion in US securities.1 Moreover, since the beginningof 2005, OPEC holdings of US Treasury securities have declined by 14% in spite of thecontinued upward trend in oil prices and the appreciation of the US dollar vis-à-vis the euro.These figures could be indicative of the broader desire of the oil-exporting countries to recycleadditional oil export revenues in assets denominated in other currencies, including the euro.
The increasing role of the euro in both OPEC and Russia becomes particularly clear whenlooking at banking statistics as reported by the BIS. During past periods of high oil prices,OPEC member states used to deposit their export earnings with international banks, almostexclusively denominated in US dollars. More specifically, OPEC economies deposited aconsiderable proportion of their additional oil export revenues with international financialinstitutions after the surge in oil prices in 1999. However, this did not occur, at least not to thesame extent, during the most recent cycle which started in 2003 (see Chart A).2
Yet, in terms of currency denomination, the OPEC economies gradually increased the share ofeuro-denominated deposits from 11% at the beginning of 1999 to over 28% at the end of the firstquarter of 2004. This was accompanied by a steady fall in the share of US dollar-denominateddeposits. Since 2004, however, and despite the rather strong appreciation of the euro during
1 Sources: Deutsche Bundesbank and US Department of the Treasury.2 See BIS Quarterly Review (December 2004), pp. 25-27. Net assets refer to the difference between OPEC’s assets and liabilities
vis-à-vis BIS reporting banks and are a measure of the net channelling of funds into the international banking system.
Chart B Russia’s net assets and the currencyshare of its deposits
Chart A OPEC’s net assets and the currencyshare of its deposits
Sources: BIS and ECB caluclations.Note: Last observation refers to the f irst quarter of 2005.
Sources: BIS and ECB caluclations.Note: Last observation refers to the f irst quarter of 2005.
net assets (left-hand scale)US dollar-denominated deposits (right-hand scale)euro-denominated deposits (right-hand scale)
0
30
60
90
120
150
1999 2000 2001 2002 2003 2004 2005
USD billions
0
16
32
48
64
80%
-40
-20
0
20
40
60
1999 2000 2001 2002 2003 2004 2005
USD billions
0
20
40
60
80
100%
net assets (left-hand scale)US dollar-denominated deposits (right-hand scale)euro-denominated deposits (right-hand scale)

26ECB cReview of the international role of the euroDecember 2005
that year, the OPEC economies have gradually shifted their deposits back into US dollars,increasing the corresponding share from a low of 51% at the end of the first quarter of 2004 to61% a year later. This development coincided with a similar, in terms of magnitude, decline inthe share of deposits held in euro, which accounted for 20% at the end of the first quarter of2005.3
Net deposits by Russia, as opposed to OPEC, did not only change in currency decomposition,but have also increased strongly during the most recent oil price increases (see Chart B). Russiaeven turned into and remained a net creditor to BIS reporting banks in the aftermath of the firstsurge in oil prices in 1999. Moreover, the share of euro-denominated assets has almost tripled,rising from 11% in mid-2002 to 31% at the end of the first quarter of 2005. This rather sharpincrease during the past three years also reflects, to a certain extent, the strong appreciation ofthe euro vis-à-vis the US dollar and the growing role of the euro as a reserve currency held bythe Russian monetary authorities. Nevertheless, rising oil export revenues have contributedstrongly to the underlying increase in net deposits and, hence, to the gradual shift away from theUS dollar towards euro-denominated deposits.
3 In its December 2005 Quarterly Review, the BIS comes broadly to the same conclusions, when measuring the deposits of OPECcountries at BIS banks at constant exchange rates until the second quarter of 2005.

27ECB
Review of the international role of the euroDecember 2005
3 THE EUROIN FOREIGNEXCHANGE
MARKETSBased on the data on the settlement of foreignexchange transactions provided by theContinuous Linked Settlement (CLS) system,the role of the euro in the foreign exchangemarkets remained broadly unchanged.19 In July2005 CLS Bank settled on average over200,000 transactions with a gross valueequivalent to USD 2,000 billion per day.20 CLSBank now settles transactions in 15currencies.21
In the period under review, i.e. July 2004 toJune 2005, the euro remained the second mostwidely settled currency by CLS, accounting foran average of around 43% of daily settlements.The US dollar accounted, on average, foraround 90% of all daily transactions. Thisfigure, which is unchanged from that of theprevious review period, emphasises the use ofthe US dollar as a vehicle currency.22 Thecorresponding share of the Japanese yendecreased from 22% to 20%. Compared to theprevious review, these shares exhibit asubstantial degree of stability (see Chart 5).This is all the more significant given thepotential impact related to valuation effectsand to the increased number of currenciessettled in CLS.
Since the last issue of this review the BIS hasalso published the final results of the latest BISTriennial Central Bank Survey of ForeignExchange and Derivatives Market Activity,which was conducted in April 2004 (see BIS2004 and ECB 2004). This survey isparticularly useful since its coverage, in termsof both currencies and market participants, isbroader than that of the CLS. The final resultsconfirm the preliminary results reported in thelast issue of this review and reported here againfor convenience. At the global level, the 2004Triennial Survey showed a strong increase inthe activity of traditional foreign exchangemarkets, up from an overall average dailyturnover of USD 1,200 billion in 2001 to USD1,880 billion in 2004.23 The euro was thesecond most actively traded currency inforeign exchange markets worldwide, after the
3 THE EURO IN FOREIGN EXCHANGE MARKETS
Sources: CLS and ECB calculations.1) Only days when CHF, EUR, GBP, JPY and USD are tradedactively are considered.2) The sum of currency percentage shares adds up to 200% asboth currencies involved in the settlement of a foreignexchange trade are counted individually.
Chart 5 Sett lement CLS system: currencybreakdown1)
(as a percentage 2) of total transactions settled)
0
20
40
60
80
100
120
0
20
40
60
80
100
120
Sep. Dec. Mar. June Sep. Dec. Mar. June Sep. Dec. Mar. June
US dollareuroJapanese yenpound sterling
2002 2003 2004 2005
US dollar and ahead of the Japanese yen. Theeuro was involved in 37% of all foreignexchange transactions, a slight decrease of lessthan 1 percentage point when compared with
19 CLS was created in 1997 at the initiative of a group of majorforeign exchange market participants, known as the G20banks, to address the problem of foreign exchange settlementrisk on the basis of the payment-versus-payment principle.According to this principle, the two legs of a transaction aresettled simultaneously, and in such a way that the one cannotoccur without the other, i.e. the f inal transfer of one currencyoccurs only if a f inal transfer of the other currency takesplace.
20 The value of settled transactions amounts to double the valueof trades because every trade involves two settlement legs,one in each currency. Thus, CLS settled an average of 100,000trades a day with a total value equivalent to USD 1,000billion.
21 Settlements by CLS take place in euro, US dollar, Japaneseyen, pound sterling, Australian dollar, Canadian dollar,Danish krone, Norwegian krone, Singapore dollar, Swedishkrona, Swiss franc, Hong Kong dollar, Korean won, NewZealand dollar and South African rand.
22 A vehicle currency (B) is def ined as a currency that is used inthe foreign exchange market as a means of exchanging twoother currencies, so that currencies A and C are notexchanged directly (A against C) but via B in two transactions(A against B and B against C). In foreign exchange markets,most transactions between relatively illiquid currencies areeffected via vehicle currencies due to lower transaction costsand in order to avoid excess intraday volatility.
23 Traditional foreign exchange instruments refer to spottransactions, outright forwards and foreign exchange swaps.Average daily activity in the over-the-counter derivativesmarkets increased even more, from USD 575 billion in 2001to USD 1,403 billion in 2004.

28ECB cReview of the international role of the euroDecember 2005
the 2001 figure.24 This can be seen as astabilisation after the sharp decline observedbetween 1998 and 2001, following theelimination of intra-euro area foreignexchange trading after the introduction of theeuro.25 Therefore, the 2004 BIS TriennialSurvey also confirms that the US dollarremains the predominant vehicle currency.Globally, the euro continued to be tradedpredominantly against the US dollar. 76% ofall global activity involving the euro was intrading vis-à-vis the US dollar. The US dollar/euro currency pair also remained that mostactively traded, accounting for 28% of globalturnover, although its share was slightly downfrom the 30% registered in 2001.
24 This f igure is calculated after adjustment for both localand cross-border double-counting, which arises becausetransactions are reported by both the seller and the buyer. Itshould be noted that individual currencies are involved in onesettlement leg of a foreign exchange trade and anothercurrency is involved in the second settlement leg of the trade.Thus, the sum of currency percentages adds up to 200%.
25 In 1998 the combined share of the legacy currenciesaccounted for 53% of global foreign exchange turnover.

29ECB
Review of the international role of the euroDecember 2005
4 THE EUROIN INTERNATIONAL
TRADE INGOODS AND
SERVICES
This section presents updated informationregarding the role of the euro in internationaltrade, a topic which is also dealt with in greaterdepth in the special focus. As was the case in2004, the purpose here is therefore to providethe actual data that have been collected by theEuropean System of Central Banks (ESCB) onthe currency breakdown of invoicing orsettlement in foreign trade for a number of EUcountries.26
4.1 THE ROLE OF THE EURO ININTERNATIONAL TRADE IN GOODS ANDSERVICES BY SELECTED EURO AREACOUNTRIES
The use of the euro as a currency for thesettlement or invoicing of international tradetransactions by selected euro area countrieshas shown a notable increase in recent years.This trend appears to have continued in 2004,although in a number of cases there appears tohave been a levelling-off or even a slightdecrease in the share of the euro.
Concerning exports, in 2004 the share of theeuro in extra-euro area exports increased forboth goods and services in most euro area
Goods Services
2001 2002 2003 2004 2001 2002 2003 2004
Belgium 1) 46.7 53.5 55.3 57.7 ... 63.8 70.3 71.2France 2) 47.1 51.0 52.7 52.7 40.0 40.3 42.4 40.2Germany ... 49.0 63.0 61.1 ... ... ... ...Greece 23.5 39.3 47.3 44.3 11.3 13.3 16.3 14.1Italy 52.7 54.1 58.2 59.7 50.7 57.0 62.1 68.0Luxembourg ... 51.5 52.7 62.7 ... 40.4 43.0 42.6Portugal 43.5 48.4 54.6 57.6 37.4 44.1 48.6 54.9Spain 52.0 57.5 61.7 62.6 52.9 59.5 64.1 64.5
Table 8 Share of the euro as a sett lement/ invoic ing currency in extra-euro area exports ofgoods and services of selected euro area countries(as a percentage of the total)
Sources: National central banks and ECB calculations.Notes: (…) stands for “not available”. Data for 2001 include trade settled in euro and in legacy currencies. Data refer to the use ofthe euro as a settlement currency, except for Germany, which refer to invoicing. For Germany, data on trade in goods reflect theaverage value of data collected in surveys carried out in the f irst and third quarters of 2002, 2003 and 2004 on behalf of theDeutsche Bundesbank. Data on services for Belgium, Italy and Luxembourg include travel, whereas travel is excluded for France,Greece, Portugal and Spain.1) Data for 2001 refer to Belgium and Luxembourg.2) Data for goods for 2004 are an estimate based on 2003 data.
4 THE EURO IN INTERNATIONAL TRADE IN GOODSAND SERVICES
countries for which data are available (seeTable 8). According to the data available,notable increases were observed in the sharesof exports denominated in euro byLuxembourg (goods) and by Belgium andPortugal (services). In fact the use of the euroin exports of services is now broadlycomparable to its use in exports of goods, acharacteristic that is in contrast to previousyears when the use of the euro was moreprevalent in exports of goods. One exception tothis increasing trend in the use of the euro wasGreece, the only euro area country where theshare of the euro in exports of both goods andservices decreased in 2004. This may beexplained by the traditionally high exposure ofGreece’s exports to the maritimetransportation sector, which is characterisedby a high use of the US dollar.
26 Two counterparts may agree that trade is invoiced in a givencurrency, but settled in another currency. Therefore, datareported according to the currency of invoicing (i.e. thecurrency of denomination of contracts) and data reportedaccording to the currency of settlement (i.e. the currency inwhich the corresponding payments are made through thebanking system) may differ. While academic literature mainlyfocuses on invoicing as a determinant of the pricing behaviourof international corporations, available data refer to thesettlement currency in many cases.

30ECB cReview of the international role of the euroDecember 2005
Concerning imports, as reported in Table 9, theshare of the euro has seen a higher degree ofstability in 2004 compared with 2003. In thiscase, the exception is the large increase in theuse of the euro in Luxembourg’s imports ofgoods. Overall, the use of the euro in theimports of euro area countries remains lowerthan in the case of exports, although with someexceptions such as Portugal (with regard toboth goods and services).
4.2 THE ROLE OF THE EURO ININTERNATIONAL TRADE IN GOODS ANDSERVICES BY THIRD COUNTRIES
The evidence presented below on the currencybreakdown of international trade for non-euroarea EU countries and EU acceding countrieshas been compiled by the national centralbanks of the ESCB. Data for other non-EUcountries has been compiled from publiclyavailable sources and through bilateralrequests from the ECB to other central banks.
Available evidence regarding exports suggeststhat the share of the euro has increased in mostof the new Member States between 2003 and2004, continuing a trend already seen in
Table 9 Share of the euro as a sett lement/ invoic ing currency in extra-euro area imports ofgoods and services of selected euro area countries(as a percentage of the total)
Sources: National central banks and ECB calculations.Notes: (…) stands for “not available”. Data for 2001 include trade settled in euro and in legacy currencies. Data refer to the use ofthe euro as a settlement currency, except for Germany, which refer to invoicing. For Germany, data on trade in goods reflect theaverage value of data collected in surveys carried out in the f irst and third quarters of 2002, 2003 and 2004 on behalf of theDeutsche Bundesbank. Data on services for Belgium, Italy and Luxembourg include travel, whereas travel is excluded for France,Greece, Portugal and Spain.1) Data for 2001 refer to Belgium and Luxembourg.2) Data for goods for 2004 are an estimate based on 2003 data.
Goods Services
2001 2002 2003 2004 2001 2002 2003 2004
Belgium 1) 47.2 53.6 57.7 55.5 ... 60.1 65.6 68.6France 2) 44.4 46.9 45.3 45.3 43.3 44.0 46.6 48.3Germany ... 48.0 55.2 52.8 ... ... ... ...Greece 29.3 35.8 39.6 40.6 15.3 16.8 20.1 22.7Italy 40.8 44.2 44.5 44.5 49.9 56.1 67.1 68.9Luxembourg ... 31.6 41.6 49.4 ... 28.5 36.0 30.5Portugal 53.6 57.5 59.2 58.8 55.6 65.5 69.4 72.2Spain 49.7 55.9 61.1 61.1 45.1 48.7 54.2 56.8
previous years (see Table 10). In many cases,the share of exports settled or invoiced in eurohas continued to greatly exceed that of tradewith the euro area – an issue which is exploredin greater detail in the special focus of thisreview. The use of the euro in the exports ofthe EU acceding and accession countries hasbeen relatively stable, with Croatia exhibitinga slight decrease. Elsewhere, the FormerYugoslav Republic of Macedonia has seen thelargest increase in the use of the euro in itsexports, reaching a level surpassed only bySlovenia and Hungary.
Turning to available evidence on imports, wecan also observe slight increases in the share ofthe euro recorded for most new Member States(see Table 11). Elsewhere, the EU accedingand accession countries have seen a levelling-off in the relative use of the euro for imports.

31ECB
Review of the international role of the euroDecember 2005
4 THE EUROIN INTERNATIONAL
TRADE INGOODS AND
SERVICES
Table 10 Share of the euro in exports of selected non-euro area countries
(percentage of total exports)
Sources: IMF, national sources. Data for Turkey and the Former Yugoslav Republic of Macedonia have been kindly provided by theTurkish Undersecretariat of the Ministry for Foreign Trade and by the State Statistical Off ice of the Republic of Macedoniarespectively.Note: (...) stands for “not available”. Data for Malta, Slovakia and Sweden are not available.1) 2004 data for the Czech Republic and Estonia refer to the first quarter of 2004 as a result of changes in the way data arecollected from May 2004 onwards.2) In 2004, the methodology of compiling the geographical breakdown of exports has changed. The impact on the data regardingexports to the euro area is low.3) Share of the euro only, excluding all legacy currencies.
Exports invoiced in euro Exports to the euro area
2001 2002 2003 2004 2001 2002 2003 2004
Non-euro area EU countriesCyprus ... ... 30 32 19 22 23 28Czech Republic1) 69 68 70 72 62 61 63 62Denmark 33 36 35 34 44 43 44 44Estonia1) ... 65 70 72 41 37 39 40Hungary2) 79 83 85 ... 69 66 65 62Latvia 41 48 42 48 30 29 30 25Lithuania 28 37 47 50 26 26 27 30Poland 57 60 65 69 59 58 58 56Slovenia 85 87 87 88 58 55 55 53United Kingdom 23 21 ... ... 54 55 53 52
EU acceding and accession countriesBulgaria 48 52 61 62 51 52 53 51Croatia 63 69 72 69 51 49 52 49Romania 56 59 64 66 62 61 60 58Turkey ... 47 49 49 43 41 42 41
Other European countriesFYR Macedonia ... 66 67 76 46 44 40 38Ukraine 3 5 6 8 16 16 17 17
Other countriesAustralia3) 1 1 1 1 7 7 6 7Indonesia 2 2 2 1 11 11 11 10Japan 8 9 10 ... 12 11 12 12Pakistan 2 4 7 ... 19 19 20 21South Korea 1 6 8 ... 10 10 10 11Thailand 3 3 3 ... 12 11 11 11

32ECB cReview of the international role of the euroDecember 2005
Imports invoiced in euro Imports from the euro area
2001 2002 2003 2004 2001 2002 2003 2004
Non-euro area EU countriesCyprus ... ... 45 53 40 43 45 53Czech Republic1) 67 67 68 69 57 56 55 54Denmark 35 37 32 33 50 51 50 49Estonia1) ... 59 61 62 39 41 40 47Hungary2) 71 73 72 ... 53 51 51 58Latvia 41 39 50 53 40 41 39 34Lithuania 38 48 53 55 35 35 35 36Poland 57 60 60 62 53 53 53 52Slovenia 79 83 82 83 64 64 64 70United Kingdom 19 27 ... ... 49 53 52 50
EU acceding and accession countriesBulgaria 55 60 63 64 45 46 45 44Croatia 73 77 78 78 50 50 51 49Romania 61 66 68 70 52 53 53 51Turkey ... 37 40 40 38 39 39 38
Other European countriesFYR Macedonia 64 68 71 75 39 51 45 40Ukraine ... 11 15 14 19 20 20 20
Other countriesAustralia 9 9 9 9 15 16 17 17Indonesia 6 6 6 6 10 9 9 9Japan 3 4 5 ... 10 10 10 10Pakistan 4 7 9 ... 12 13 13 11South Korea 1 5 6 ... 8 9 9 8Thailand 5 5 4 ... 10 9 8 8
Table 11 Share of the euro in imports of selected non-euro area countries
Sources: IMF, national sources. Data for Turkey and the Former Yugoslav Republic of Macedonia have been kindly provided by theTurkish Undersecretariat of the Ministry for Foreign Trade and by the State Statistical Off ice of the Republic of Macedoniarespectively.Note: (...) stands for “not available”. Data for Malta, Slovakia and Sweden are not available.1) 2004 data for the Czech Republic and Estonia refer to the f irst quarter of 2004 as a result of changes in the way data arecollected from May 2004 onwards.2) In 2004, the methodology of compiling the geographical breakdown of imports has changed. This change increased the share ofthe euro area in Hungary’s imports by more than 10 percentage points.
(percentage of total exports)

33ECB
Review of the international role of the euroDecember 2005
SPECIALFOCUS
1 INTRODUCTION
What determines the choice of currency inwhich international trade is to be invoiced? Asthe last issue of this review noted, this questionhas attracted the attention of economistsworldwide for decades but the limitedavailability of data has meant that little isactually known beyond a number of broadstylised facts.27 This special focus contributesto an increasing body of empirical literaturethat makes use of the efforts undertaken by theEuropean System of Central Banks (ESCB) tocollect data, as well as a systematic survey ofpublicly available information from othercountries.
Until recently it was commonly assumed in theliterature that exporters preferred to set pricesin their own currency, a result commonlyreferred to as Grassman’s law, named after aseminal contribution that found a much higheruse of the Swedish kronor in Sweden’s exportsthan in its imports (Grassman, 1973).However, evidence challenging Grassman’slaw and a new focus on the impact ofconditions of monopolistic behaviour andsticky prices has translated into renewedinterest in the issue of the choice of currency ininternational trade. This holds, in particular, ifone allows for market imperfections andfrictions that may result, for example, in stickyprices resulting from “menu costs,” i.e. thephysical costs of re-pricing goods. As a resultthe law of one price, which states that theremust be a single price for two identical goods,may cease to hold true across countries.Another important phenomenon to consider isthe business practice of “pricing to market.”This term captures the behaviour ofmonopolistic firms that, exploiting theirability to take advantage of differences indemand elasticities across countries, are ableto set different prices in different nationalmarkets (Krugman, 1987 and Dornbusch,1987). In principle, exporters could price tomarket regardless of whether they invoice intheir own currency (known as “producercurrency pricing”) or in the currency of the
SPECIAL FOCUS: DETERMINANTS OF THE CURRENCYOF INVOICING IN INTERNATIONAL TRADE
local market where the products are sold(“local currency pricing”). However, thecombined effect of flexible exchange rates andthe menu costs of changing nominal pricesimplies that exporters facing a competitivelocal market may opt to use the local currencyin their pricing so as to avoid that exchangerate fluctuations would result in a loss ofcompetitiveness. The combination of marketpower and nominal rigidities has brought theissue of the choice of invoicing currency tocentre stage, not least since full local currencypricing of imports would also imply no pass-through from the exchange rate to domesticinflation for the importing country, at least inthe short run.
The question of what determines the choice ofcurrency in international trade has become allthe more topical given the increase seen duringrecent years in the use of the euro ininternational trade by a number of countries,primarily EU Member States and EU accedingand accession countries. This increase hasalready been documented in previous issues ofthis review and seems to be broadly confirmedin the data for 2004 which are published inthis issue (see section A). As noted above,such an increase would be expected tohave repercussions on the pass-through fromexchange rate movements into prices.28 Thereis also some evidence that the increase in theuse of the euro may partly reflect the growingrole of the euro as a vehicle currency, i.e. acurrency used between two counterpartiesoutside the country or area of issuance of thecurrency. For example, in Sweden the use ofthe euro in transactions involving non-euroarea countries roughly doubled between 1999and 2002 (Wilander, 2005). Similarly, in the
27 See Box 5 (“The choice of currency in international trade:theory and recent evidence”) in the Review of theinternational role of the euro published by the ECB in January2005, pp. 32-33.
28 However, a recent contribution by Campa et al. (2005) foundno strong statistical evidence that the introduction of the eurohas caused a structural break in the exchange rate pass-through in the euro area, with the exception of the case ofsome manufacturing industries. That notwithstanding, theauthors found that estimated point elasticities have indeeddeclined since the introduction of the euro.

34ECB cReview of the international role of the euroDecember 2005
case of the acceding countries, the share of theeuro in the exports of Bulgaria and Romanianow exceeds its share in their exports to theeuro area, indicating a vehicle currency role intheir trade with other trading partners. Incontrast, the euro does not appear to be usedmuch in transactions not involving EUMember States or acceding countries.
The research strategy underlying this specialfocus consists of three straightforward steps,which will also serve as a structure: (a) areview of theoretical and empirical literatureso as to identify the relevant factors that mayhelp to explain the currency of invoicing orsettlement in international trade; (b) collectionof a data set that is as wide as possible on theuse of the euro in international trade and on thefactors suggested to be important by earlierliterature; and, (c) empirical estimation of therelative importance of the different factors.This special focus presents detailed resultsonly regarding the use of the euro. However,where appropriate the results are alsocompared with those obtained for the USdollar. Those results are available in thebackground research paper on which thisspecial focus is based.29
2 REVIEW OF THE LITERATURE
The literature on the choice of currency ininternational trade can be traced back severaldecades. As early as 1968, Swoboda argued thatinternational trade was likely to be conducted inhighly liquid currencies with low transactionscosts, which in his view explained the use of theUS dollar as a vehicle currency, i.e. by twoparties neither of which were American. Shortlyafter, the hypothesis of Grassman prompted anumber of authors to provide possible rationalesfor the observed preference of exporters toinvoice in their own currency (see Bénassy-Quéré et al. (1998) for a review of the earlyliterature). Krugman (1984) and Black (1990)observed that the relative sizes of the tradingpartners mattered and that Grassman’s lawapplies unless the importing country is much
29 Kamps (2005), “The euro in international trade”, mimeo,European Central Bank. Both the background paper on whichthis research is based and the text of the special focus itselfhave also benef ited from comments from Eurosystem staff,in particular Juan Ruiz (Banco de España), Iris Nelissen(Deutsche Bundesbank), Lionel Potier (Banque de France)and Franz Nauschnigg (Oesterreichische Nationalbank).
larger than the exporter. A number of authorsstressed that currencies associated with ahistory of high inflation were used less in theircountry’s foreign trade than currencies withoutsuch an inflationary history. In addition,McKinnon (1979) emphasised the differencebetween trade in differentiated manufacturedgoods and the relatively homogeneous primarygoods. In his view the predominance ofdomestic currency pricing by Europeancountries was due to the fact that exporters ofindustrial products enjoy greater market powerand are thus able to avoid bearing the exchangerate risk. This would help to explain why, intrade between industrial and developingcountries, the industrial country’s currency or athird currency, usually the US dollar, is used inmost cases. Moreover, trade in homogeneouscommodities is often centralised, whichfacilitates the efficient communication ofrelative price information. As Tavlas (1997)points out, such commodity exchanges tend tobe centralised in only a few countries that have acomparative advantage as financial centres. Theexistence of such established exchanges in theUnited States and the United Kingdom reducesthe likelihood that commodities traded throughexchanges would be priced in currenciesother than the US dollar and the pound sterling(for a summary of stylised facts from the earlyliterature, see Hartmann 1998a). Hartmann(1998a) also suggests that factors such as lowliquidity in financial markets and capitalcontrols would increase transaction costs andwould therefore affect the choice of currency ininternational trade.
From a theoretical perspective, attempts atmodelling the choice of invoicing currencywithin a framework of a profit-maximisingfirm go back to the contributions of Giovannini(1988) and Donnenfeld and Zilcha (1991).These partial equilibrium models shed light on

35ECB
Review of the international role of the euroDecember 2005
SPECIALFOCUS
30 Extensions to these partial equilibrium models includeFriberg (1998), who introduces a forward currency marketand the possibility of setting prices in a third currency(vehicle currency pricing), and Johnson and Pick (1997), whoinclude the possibility that the exporting f irm facescompetition from exporters from other countries. Sincecompetitors from other countries also have a choice as to whatcurrency to use, this introduces an additional level ofuncertainty for the exporter, who now faces demanduncertainty even if the local currency is used. The result isthat the use of a vehicle currency becomes more likely.
31 In this regard, Engel (2005) suggests that, in situations whereit would be optimal for an exporter to keep its prices in its owncurrency stable (what Engel refers to as “producer currencystability”), it is likely that it will be optimal for the f irm toprice in its own currency.
the underlying trade-off between price anddemand uncertainty that the exporter faces. Onthe one hand, if the exporting firm chooses touse the local currency to price its goods, thequantity demanded will be known. However,exchange rate fluctuations would affect therevenue raised by the firm when convertedback to its own currency and, hence, its profit.On the other hand, if the exporting firmchooses to price in its own currency, exchangerate fluctuations will mean that the localconsumers will respond by changing thequantity demanded, since the exchange ratefluctuations effectively mean changes in pricein the local currency, leading to a quantityeffect. The key contribution from thisliterature is to formalise the conditions underwhich it is optimal for exporters to price intheir own currency or in the currency of thelocal market.30 As demonstrated by Bacchettaand van Wincoop (2005), in a generalequilibrium framework the shape of both thedemand and the cost curves affects theexporter’s choice. In general, a high elasticityof demand and steeply increasing marginalcosts will make pricing in local currency moreattractive. This is because a highly elasticdemand will imply large quantity effects,which will reduce revenue significantly in thecase of a reduction in the quantity demanded,while the higher marginal costs willincreasingly offset the higher revenues fromthe greater quantities of goods sold. Thus, incontrast to the early assumptions of theliterature, this research demonstrates that,under certain conditions, it may be optimal foran exporter to use the local currency. Inparticular, the higher the level of competitionin the local market (and hence the higher theelasticity of demand faced by the individualexporter), the more attractive local currencypricing becomes.
More ambiguous is the expected impact ofexchange rate volatility on the choice ofinvoicing currency. Recent theoreticalresearch has demonstrated that the choice of
exporters to use their own currency does notdepend on exchange rate volatility as such butrather on how the fluctuations of the exchangerate and those of other economic variables areinterrelated (Goldberg and Tille, 2005). Inaddition to exchange rate volatility, thesemodels include also volatility in wages andforeign demand as factors that affect the choiceof invoicing currency.31
The theoretical literature has also taken up theargument that, through positive externalitiesor economies of scale, the wide use of acurrency as a medium of exchange may proveto be self-reinforcing (see Box 4). Importantly,positive externalities may arise from the use ofa currency as regards other functions of money.For example, “thick market” externalitiesimply that low transactions costs associatedwith a currency trading in foreign exchangemarkets – as a result of high liquidity or “thick”trading in that currency – will make it morelikely that the currency is used in internationaltrade (Rey, 2001).

36ECB cReview of the international role of the euroDecember 2005
Box 4
TH E RO L E O F N E TWORK E F F E C T S AND MARKE T S T RUC TURE S F OR TH E U S EO F CURRENC I E S – TH E C A S E O F O I L I N VO I C I NG
The literature on trade invoicing suggests that primary commodities, in particular crude oil,tend to be priced in vehicle currencies. The US dollar has been the predominant currency ofinvoicing for crude oil since at least the 1950s, and researchers have argued that the role of thedollar as a vehicle currency is self-reinforcing as a result of network externalities.
In line with the three uses of money, network externalities fall into three categories. First, theexistence of transaction costs in foreign exchange markets may make it profitable for traders touse only one currency as a medium of exchange. If transaction costs are decreasing in the size ofthe foreign exchange market, the preference for an established vehicle currency will be self-reinforcing. Second, the larger the number of users and the longer the period of time duringwhich a given currency is used, the lower the information costs for using this currency will be,thereby strengthening its role as a unit of account. Third, externalities may also arise from theinterrelation between the role of money as a medium of exchange and its role as a store of value.For example, a currency already established as an investment currency will benefit from deeperfinancial markets and, hence, lower transaction costs, which will help to reinforce thepreference of agents to use that currency.
Oil is perceived as a homogenous good and is traded around the globe. Hence, quick pricecomparisons are necessary to permit a smooth global oil market, supporting the argument infavour of a single vehicle currency for the pricing, invoicing and settlement of oil trades. Acloser look at the structure of the oil market, however, reveals that there may be moresegmentation in the market than commonly thought. Presently, oil is traded in three kinds ofcontracts, namely term, spot and futures. About half of the global physical oil trade is settled interm contracts. In particular, the Gulf economies tend to sell in this manner. By contrast, lessthan 50 percent of the global physical oil trade is conducted as spot contracts.
Despite their relatively small share in physical trade, spot prices are the main determinants ofmost other petroleum prices, as they are used in pricing formulae for the term sales of OPEC andother oil-exporting countries. However, the spot market is not fully transparent (either in termsof prices or quantities), since physical spot market transactions lack a central clearing houseand are often confidential. In addition, trade deals often differ not only in terms of pricing butalso with respect to many other characteristics, such as cargo size and timing of delivery. Giventhis limited transparency, pricing service agencies calculate spot prices based on informationon these bilateral contracts. Platts, the leading agency, calculates daily prices for 62 grades ofcrude oil on the basis of prices of petroleum shipments from the main transportation hubs(maritime terminals or pipeline centres) under typical market conditions.
While overwhelmingly denominated in US dollars, spot contracts also differ in some cases inthe use of currencies in the pricing and settlement of oil trades. For example, some Canadiangrades are quoted in Canadian dollars. Also, Chinese oil companies price their locally-produced crude oil in US dollars based on international benchmark grades, but settle domesticcontracts (which account for the majority of their crude oil sales) entirely in renminbi. Since

37ECB
Review of the international role of the euroDecember 2005
SPECIALFOCUS
February 2005 Platts have reported certain benchmark grades, including Dated Brent and WTI,in euro as a supplement in order to allow for efficient price comparison across regions.1
Turning to the third type of contract under which oil is traded, futures contracts have grown inimportance in recent years. The New York Mercantile Exchange (NYMEX) and theInternational Petroleum Exchange (IPE)2 in London collectively trade annually nearly threetimes the actual volume of physical oil produced. The futures and spot markets are closelyinterrelated. On the one hand, the futures markets depend on the spot market at the point ofcontract delivery or settlement. On the other hand, prices from the futures markets areincreasingly acquiring prominence in the physical trade of crude oil. OPEC producers, forinstance, are now using a weighted average of daily Brent futures prices on the IPE in thepricing formulae for petroleum shipments to European customers. In addition, since purchasesof oil futures outnumber physical petroleum deals by a factor of ten, they provide high liquidityfor the oil market (Energy Intelligence, 2004).
It is noteworthy that not all futures exchanges are carried out in US dollars. The TokyoCommodity Exchange (TOCOM) lists a crude oil futures contract based on a benchmark Asiangrade of petroleum, which is quoted and settled in Japanese yen. Trading activity has been onthe rise since its establishment in September 2001. In February 2005 the Multi CommodityExchange of India introduced a crude oil futures contract priced in rupees and deliverable inMumbai. As a result of the success of this contract, the exchange listed a second Brent Crudecontract in June 2005. Although most companies trading on the Tokyo and MumbaiCommodity Exchanges are domestic, they do include large international petroleum companiessuch as Reliance Industries3 of India and Mitsui4 of Japan.
In sum, the analysis suggests that the crude oil market is less homogenous than commonlythought as it is quite segmented in terms of both geographic regions and grades of petroleum.Moreover, oil prices depend on complex relationships between spot, term and futures markets,the former often being non-transparent. In line with this, it was found that, in a few countries,domestic contracts, both spot and futures, are settled in the home currency. Moreover, in avariety of sub-markets, network effects do not appear to prevent oil contracts being concludedin other invoicing currencies. By contrast, network effects seem to be strongest with regard topricing, as oil prices are quoted almost solely in US dollars.
1 Platts also announced that it was launching euro-equivalent prices for some ref ined products (see the Platts press release of14 February 2005).
2 In 2001 the IPE was acquired by the Intercontinental Exchange, a conglomerate of major banks and oil companies whoseambition is to establish a platform for the trade of all physical, forward, futures, and over-the-counter derivatives in allcommodities (Energy Intelligence, 2004).
3 Business Standard, “Crude oil futures trade kicks off,” 10 February 2005, New Delhi, India.4 TOCOM website (2005).

38ECB cReview of the international role of the euroDecember 2005
Factor Expected effect
Macroeconomic: “hedging” motive
Monetary instability If a currency has a history of high inflation or high inflation variability, thelikelihood of that currency being used will decrease (e.g. Tavlas, 1991).
Exchange rate volatility Ambiguous. Under certain conditions a highly variable exchange rate will makeexporters prefer to set prices in their own currency (Devereux, Engel andStorgaard, 2004; cf. Donnenfeld and Haug, 2000). Absence of, or costly, hedginginstruments would exacerbate this preference (Magee and Rao, 1980).
Business cycle The volatility of wages and foreign demand affects the invoicing of differentiatedproducts (Goldberg and Tille, 2005; Engel, 2005)
Industry-specific: “herding” motive
Product differentiation Low differentiation is associated with vehicle currency pricing as these productsare often traded through organised exchanges (e.g. McKinnon, 1979).
Competition Producers in highly competitive industries with high demand elasticities are morelikely to display herding in their choice of currency (Bacchetta and van Wincoop,2005; Goldberg and Tille, 2005).
Market structure A high market share of producers from the same country/currency area is likely tolead to pricing in that currency being adopted by other producers as well. Thecurrency created as a result of a monetary union is therefore likely to be used morethan the sum of the currencies it replaces (e.g. Swoboda, 1968; Bacchetta and vanWincoop, 2005).
Table 12 Key factors af fect ing the choice of invoic ing currency as suggested by thetheoretical l i terature
Another important contribution to theliterature refers to the effect of the formation ofa monetary union on the choice of invoicingcurrency. Bacchetta and van Wincoop (2005)show that a new currency established as theresult of a monetary union is likely to be usedmore extensively than the sum of thecurrencies it replaces. This is because theformation of the monetary union implieschanges to the relative market shares ofexporters and importers resident in thecurrency union. For a monetary union, it is themarket share of the entire currency union thatmatters and the market share of the monetaryunion is now more likely to be dominant, bothwith regard to exports and imports. In addition,increased liquidity in the foreign exchangemarket for the common currency would furtherincrease the likelihood that it will be used.
A final contribution to the theoretical literatureto be mentioned here is that of Goldberg andTille (2005). These authors present a modelwhich highlights the importance of industry-specific features such as the degree ofcompetition and demand elasticity across
industries. Producers in industries with highdemand elasticities are more likely thanproducers in other industries to display“herding” in their choice of currency (i.e.using the same invoicing strategy as theircompetitors, regardless of whether this meanspricing in the local currency or using a vehiclecurrency). Such strategic or “herding” motivesare more important than the need to hedgeagainst certain macroeconomic contingencies.Using this distinction between “hedging” and“herding” factors, Table 12 provides asummary of some of the key determinantsbehind the choice of invoicing currency assuggested in the theoretical literature.
In parallel to the development of thetheoretical literature, progress has also beenmade in recent years on empirically exploringthe determinants behind the choice ofinvoicing currency. However, the limitedavailability of data has been a major obstacle inthis regard and, in this respect, the literature isstill in its infancy. The lack of empirical cross-country studies is particularly acute. The fewempirical studies to have been undertaken on

39ECB
Review of the international role of the euroDecember 2005
SPECIALFOCUS
Author Data coverage and estimation method Key results
Donnenfeld Canada Exchange rate volatility increases the likelihood of local currencyand Haug Bilateral flows (Canada – 16 pricing.(2003) countries), quarterly 1989-1994, Long distance between trading partners significantly increases the
industry-level likelihood of local currency pricing.Multinomial logit model
Oi, Otani Japan Japanese yen more often used in industries with differentiated products,and Shirota such as the automobile industry.(2004) Correlation analysis
Silva Netherlands Inflation in partner country increases the likelihood of invoicing in Dutch(2004) Bilateral flows (Netherlands – guilder.
OECD countries), 1987-2002 High share of a country in world exports increases the likelihood that thecountry’s currency is used.
Panel data – extended GLS Financial development increases the likelihood of pricing in the currencyof the country undergoing financial development.
Wilander Sweden Exchange rate volatility decreases the likelihood of local currencypricing.
(2005) Bilateral flows (Sweden – High GDP and GDP per capita in the importing country increases the69 countries), industry-level likelihood of local currency pricing.Multinomial logit model Large market share of a third country increases the likelihood of the
third’s country currency being used as vehicle.
Goldberg Cross section regression Producers in industries facing high demand elasticities are more likely toand Tille analysis based on 24 countries exhibit herding behaviour in their choice of currency.(2005) Business cycle volatility matters more for invoicing of differentiated
products.
Goldberg New EU Member States For most countries the share of the euro is larger than would be expected(2005) and Bulgaria given their trading partners, composition of trade and the variance and
covariance of macroeconomic conditions vis-à-vis trading partners.
Table 13 Summary of selected recent empir ical studies
the choice of invoicing currency consist almostexclusively of country-specific evidence. OnlyGoldberg and Tille (2005) and Goldberg(2005) provide empirical findings from abroader set of countries, albeit on the basis of alimited sample. Table 13 summarises some keyresults from these studies, which generallycorroborate the hypotheses put forward in therecent literature. In this regard, the differencesin the observed impact of exchange ratevolatility are not surprising given theambiguity of its impact as predicted by thetheory.
3 A NEW PANEL DATASET
Given the limited availability of data, a keypriority in order to understand thedeterminants of the use of the euro ininternational trade was to compile as broad a
dataset as possible. This has been greatlyfacilitated by the ESCB’s efforts in compilingdata for a number of EU countries. Togetherwith data obtained through the ECB’s requeststo other central banks and publicly availableinformation, a dataset has been assembled onthe use of the euro in the external trade of 38countries, including nine euro area countries.32
As shown in Chart 6, the increase in the use ofthe euro in international trade appears to havetaken place mainly among the euro areacountries and other European countries.
32 In addition to the 30 countries for which multi-annual data ispresented in Tables 8-11 (Belgium, France, Germany, Greece,Italy, Luxembourg, Portugal, Spain, Cyprus, Czech Republic,Denmark, Estonia, Hungary, Latvia, Lithuania, Poland,Slovenia, United Kingdom, Bulgaria, Croatia, Romania,Turkey, Former Yugoslav Republic of Macedonia, Ukraine,Australia, Indonesia, Japan, Pakistan, South Korea andThailand), less frequent observations were also included for anumber of other countries (Morocco, Serbia and Montenegro,South Africa and Tunisia).

40ECB cReview of the international role of the euroDecember 2005
Chart 6 Average share of currencies used in exports and imports by region
(percentages)
Sources: ECB and national sources, as compiled by Kamps (2005).
Euro area countries – Exports
0
20
40
60
80
100
2000 2001 2002 2003 2004
euroUS dollarPound sterlingother
0
20
40
60
80
100
Number of countries
6 8 9 9 8
0
20
40
60
80
100Euro area countries – Imports
2000 2001 2002 2003 20040
20
40
60
80
100
Number of countries
6 8 9 9 8
0
20
40
60
80
100European countries (excl. euro area) – Exports
2000 2001 2002 2003 20040
20
40
60
80
100
Number of countries
9 9 14 14 12
European countries (excl. euro area) – Imports
2000 2001 2002 2003 20040
20
40
60
80
100
0
20
40
60
80
100
Number of countries
9 9 14 14 12
Asia-Pacific countries – Exports
2000 2001 2002 2003 20040
20
40
60
80
100
0
20
40
60
80
100
Number of countries
6 6 6 6 2
Asia-Pacific countries – Imports
0
20
40
60
80
100
0
20
40
60
80
100
2000 2001 2002 2003 2004
Number of countries
6 6 6 6 2
However, these data should be interpreted withcaution. One reason is the lack ofharmonisation in the data, which often refer tothe currency of settlements rather thaninvoicing or pricing practices. An additional
factor is that the time series available differwidely across countries. While veryunbalanced, this panel dataset allows us tomake estimates on the basis of more than 140observations.

41ECB
Review of the international role of the euroDecember 2005
SPECIALFOCUS
Chart 7 Change in the share of trade invoiced/sett led in euro vs. change in the share of tradeaccounted for by the euro area(2002-2004, percentage points)
Sources: ECB and national sources, as compiled by Kamps (2005).
Exports
-10
-5
0
5
10
15
-10
-5
0
5
10
15
-10 -5 0 5 10 15
x-axis: Change in share of exports to the euro area to total exportsy-axis: Change in share of exports invoiced in euro
-10
-5
0
5
10
15
-10
-5
0
5
10
15
-10 -5 0 5 10 15
Imports
x-axis: Change in share of imports to the euro area to total importsy-axis: Change in share of imports invoiced in euro
It is also important to stress that the data foreuro area countries refer to extra-euro areatrade. Therefore, the increase seen in the shareof the euro cannot be related to an increase intrade flows among euro area countries.However, data for other countries refer to thetotal external trade of those countries.Increases in the share of the euro in the externaltrade of those countries could be driven bychanges in the geographical structure of theirtrade, possibly by increases in trade with euroarea countries in relative terms.
The unweighted average share of the euro inexports of euro area countries reached 58% in2004. This corresponds exactly with thebaseline scenario suggested by Hartmann(1998b) for the share of the euro in extra-euroarea exports after EMU. That baseline scenariowas constructed on the basis of the invoicingpractices of the five EU Member States forwhich data was available in the early 1990s.However, the share of the euro in 2004 isabout 8 percentage points higher than theunweighted average of own currency invoicingfor those five EU Member States in the early1990s.
The importance of the euro area as a tradingpartner in driving the patterns of internationaltrade invoicing in euro is testedeconometrically below. However, it mayalready be informative to show in graphicalform the correlation between the increase inthe share of the euro in international trade andthe increase in the role of the euro area as amarket for exports or a source of imports. Thiscorrelation, which is shown in Chart 7,suggests that, with very few exceptions, theincrease in the use of the euro is greater thanthe increase in the role of the euro area as atrading partner (i.e. most data points are abovethe 45-degree line). In fact, there are a numberof cases where the increase in the share of theeuro has taken place despite a reduction in theimportance of the euro area as a tradingpartner, particularly as regards imports. Thissuggests that the euro may be increasinglyused in the trade of these non-euro areacountries with other non-euro area countries,and that it is thus taking on the role of a vehiclecurrency.
However, the euro does not display one of thecharacteristics typically associated with

42ECB cReview of the international role of the euroDecember 2005
Chart 8 Correlat ion between share of di f ferentiated goods and choice of currencyin exports(2003)
Sources: ECB, national sources and UN Comtrade, as compiled by Kamps (2005).
US dollar
0
20
40
60
80
100
0
20
40
60
80
100
0 20 40 60 80
x-axis: Share of differentiated goods in exports (based on data for 28 countries)y-axis: Currency share in exports
Euro
0
20
40
60
80
100
0
20
40
60
80
100
0 20 40 60 80
x-axis: Share of differentiated goods in exports (based on data for 21 countries)y-axis: Currency share in exports
vehicle currencies – namely its use in the tradeof commodities and other goods exhibits a lowdegree of product differentiation. Chart 8shows how the use of the euro across the 22countries for which data are available for 2003appears to be positively correlated with theshare of exports account for by differentiatedgoods (as measured by the Rauch index asproposed by Goldberg and Tille, 2005). Thiscontrasts with the available evidence for theUS dollar, where the general rule is that thehigher the degree of product differentiation inexports, the lower the share of tradedenominated in US dollars.
4 METHODOLOGY AND RESULTS
The following section presents the tentativeresults of an econometric analysis of thedeterminants of the use of the euro using thepanel of data assembled.33 In particular, arandom effects model is estimated as follows:34
yit = a + � X’it + uit
where y is the share of exports (or imports)invoiced in euro, i represents the country
dimension, t represents time, � is a set ofcoefficients, X is a set of explanatory variables,and uit is the country-specific error term ci plusthe white noise eit.
To examine the extent to which the euro is usedby euro area exporters to price their goods(producer currency pricing), by euro areaimporters (local currency pricing) and by non-euro area trading parties (vehicle currencypricing) necessitates a look at the externaltrade of a different set of countries in each caseand also a look at slightly different variables.Therefore, when analysing the use of the euro
33 The panel approach allows us to explore the possible impactof the introduction of the euro, which would not be possible ifwe were to undertake a cross-section analysis.
34 Given the highly unbalanced nature of the panel across thetime dimension, the estimation method used is a one-wayrandom-effects GLS panel. The random effects model seemspreferable as it allows time-invariant explanatory variables tobe taken into consideration and avoids the loss of degrees offreedom that would result from estimating a f ixed effectsmodel with country-specif ic constants. The Breusch-PaganLagrange Multiplier test for a zero variance of the individualerrors could be rejected for every estimation, so that the datacould not be pooled. Hausman tests performed to compare thecoeff icients of the f ixed and the random effects estimationsuggest that the null hypothesis of no systematic differencescould not be rejected and that the random effects should bepreferred due to their higher eff iciency.

43ECB
Review of the international role of the euroDecember 2005
SPECIALFOCUS
35 Admittedly, this is an imperfect proxy that, insofar as it maybe correlated with other explanatory variables, wouldintroduce an unpredictable bias into the results.
36 Rauch (1999) provides a comprehensive list of commoditiestraded in organised exchanges (as reported by theInternational Commodity Markets Handbook and the Knight-Ridder CRB Commodity Yearbook) and of commodities forwhich reference prices are available (e.g. price quotationspublished in trade journals such as Chemical MarketingReporter).
as far as producer currency pricing isconcerned, the relevant independent variablewould be the share of exports from euro areacountries invoiced in euro. In contrast, if theanalysis was to be of the use of the euro as far aslocal currency pricing is concerned, the focuswould need to be on the share of the euro in theimports of euro area countries. While theseexercises were indeed conducted and a set ofstylised results is presented below, we willfocus here on presenting the results from theanalysis of the euro as a vehicle currency, sincesuch analysis is based on a larger dataset.
THE EURO IN VEHICLE CURRENCY PRICING
The use of the euro as a vehicle currency can beexamined from the perspective of both exportsand imports among non-euro area countries.This would allow two sets of regressions to berun and the estimated results contrasted forconsistency. However, one difficulty arisesfrom the fact that the data available on thecurrency invoicing patterns of these countriesrefer to their total foreign trade and, thus,include trade that they conduct with the euroarea. While this poses a problem, it is dealtwith in the econometric estimations bycontrolling for the share of exports (imports) to(from) the euro area in the total exports(imports) of these countries. The explanatoryvariables tested are as follows:
– Share of exports (imports) to (from) the euroarea in total exports (imports). Therationale, as discussed above, is to controlfor the importance of the euro area as atrading partner. Data are taken from the IMFDirection of Trade Statistics.35
– Share of differentiated goods in country i’sexports (imports). Following the approachin Goldberg and Tille (2005), this aims tocapture the possible link between non-differentiated products and pricing invehicle currencies. The variable is measuredaccording to Rauch’s (1999) definition ofnon-differentiated goods as being thosegoods for which reference prices are
available or which are traded in organisedexchanges.36 Data on trade by type of goodsup to the four-digit SITC code are takenfrom the UN Comtrade database.
– Exchange rate volatility vis-à-vis the euroand inflation differential vis-à-vis the euroarea. These two variables aim to capture thecommon argument in the literature thatmonetary stability would increase thelikelihood of a currency being used ininternational trade. The exchange ratevolatility is measured by the four-monthmoving average of the standard deviation ofthe exchange rate, while the inflationdifferential is expressed in terms ofpercentage points.
– Dummy variable to reflect countries thatare part of the EU or are candidatecountries. This is time-invariant as,arguably, prospective EU membership maybe as important in shaping invoicingpatterns as actual EU membership.
– Step dummy variable from 2002 onwards toreflect the euro cash changeover. Assuggested by the literature, the launch of amonetary union may affect the invoicingpatterns in international trade. Although theeuro was introduced in 1999, the limitedavailability of data before 1999 suggestedthat, in order to ensure robust estimations, thecash changeover in 2002 was chosen to markthe beginning of EMU. In addition, availableevidence suggests that the use of legacycurrencies was still common in internationaltrade settlements until 2001 (DNB, 2004).
– Dummy variable to reflect the presence of aforward market. This time-invariant

44ECB cReview of the international role of the euroDecember 2005
Regression (1) (2)I (3) (4) (5) (6)
Constant -4.07 -24.98 2) -26.13 2) -22.49 2) -19.52 1) -21.89 1)
(-0.82) (-2.32) (-2.44) (-2.1) (-1.76) (-1.95)Share of exports to euro area 0.59 3) 0.60 3) 0.60 3) 0.51 3) 0.48 3) 0.48 3)
(5.41) (5.68) (5.72) (4.84) (4.54) (4.65)EU25 and candidates (dummy) 25.11 3) 16.99 2) 17.17 2) 21.36 3) 20.23 3) 17.46 2)
(3.97) (2.41) (2.47) (3.04) (2.82) (2.38)Euro cash changeover (dummy) 8.07 3) 8.12 3) 8.31 3) 7.05 3) 7.02 3) 6.48 3)
(9.14) (9.21) (8.96) (7.56) (7.58) (7.27)Share of differentiated exports 0.44 2) 0.45 2) 0.43 2) 0.46 2) 0.51 2)
(2.15) (2.21) (2.13) (2.23) (2.43)Exchange rate volatility to euro 32.01 60.00 62.98 90.43 2)
(0.68) (1.34) (1.42) (2.11)Inflation differential to euro area -0.27 3) -0.28 3) -0.30 3)
(-3.91) (-4.05) (-4.56)Forward market (dummy) -7.56 -8.13
(-1.31) (-1.38)Peg to euro (dummy) 13.14 3)
(3.53)
Number of observations 144 144 143 143 143 143Number of countries 29 29 29 29 29 29Wald chi2 159.14 171.31 172.44 200.27 201.75 226.87R squared within 0.47 0.47 0.47 0.55 0.55 0.60R squared between 0.69 0.74 0.74 0.72 0.73 0.73R squared overall 0.73 0.75 0.75 0.72 0.76 0.75
Table 14 The euro as an invoic ing currency in the exports of non-euro area countries
Source: Kamps (2005).Note: Absolute value of z statistics in parentheses1) Signif icant at 10%.2) Signif icant at 5%.3) Signif icant at 1%.
dummy, which controls for whethercountries had a domestic forward market in1999 or not, aims to control for theavailability of opportunities to hedgeexchange rate exposures.
– Dummy variable to capture countries withan exchange rate regime consisting of a hardpeg to the euro.
Results are presented in Table 14 forestimations conducted on the exports of a totalof 29 non-euro area countries for whichinformation on the share of exports invoiced ineuro was available.
Three key results are worth highlighting. First,institutional factors related to the EU appear tobe particularly important. The dummyvariables capturing institutional factors suchas being part of the EU (or a candidate country)
and the euro cash changeover are highlysignificant, both from a statistical and aneconomic point of view, as they increase, in thebasic specification, the share of the euro ininvoicing by around 25 and 8 percentage pointsrespectively. These effects remain large androbust across a number of specifications andthe inclusion of other institutional variablessuch as pegs to the euro, which also prove to besignificant. It is important to stress that beingpart of the EU (or being a candidate country)has an impact on euro invoicing which is not aresult of higher trade flows.37 The importanceof trade with the euro area, picked up by the
37 An alternative specif ication was to include a geographicalmeasure of distance to the EU instead of the institutionaldummy variable reflecting EU membership or candidatecountry status. In the specif ication used the geographicaldistance was not signif icant. Only when both the institutionaldummy variable reflecting EU membership or candidatecountry status and the share of exports to the euro area wereexcluded did the measure of distance become signif icant.

45ECB
Review of the international role of the euroDecember 2005
SPECIALFOCUS
significance of the coefficients on the share ofexports going to the euro area, suggests that theuse of the euro outside bilateral trade with theeuro area is limited.
This second key result can also be interpretedas evidence that the use of the euro as a truevehicle currency is limited. This interpretationseems to be supported by the positiveestimated coefficients on the share ofdifferentiated goods, which indicate that thehigher the share of differentiated goods in theexports of these countries, the higher the shareof the euro in invoicing. This result confirmsthe suggestion from the correlation depicted inChart 8. Given that the effect of exchange rateuncertainty may depend on the price elasticityof demand, approximated here by the share ofdifferentiated goods in trade, we introduced an
interaction term which includes the share ofdifferentiated goods in exports with theexchange rate volatility variable so as tocapture the possibility that exchange ratevolatility may only matter for differentiatedgoods. However, this interaction variable didnot prove to be significant.
The third key result to be highlighted here isthe mixed evidence found regarding theimportance of economic variables that aim tocapture the hedging factors in the choice ofinvoicing currency, such as inflationdifferentials with the euro area, exchange ratevolatility vis-à-vis the euro, or the presence ofa forward market. The coefficient on theinflation differential has, in fact, a negativesign, which is the opposite of what we wouldhave expected, since the negative sign
Regression capturing Euro Euro Euro Euro US dollar US dollaras vehicle as vehicle as producer as local as vehicle as vehiclecurrency currency currency currency currency currency
pricing pricing
Coverage Exports by Imports by Exports by Imports by Exports by Imports bynon-euro area non-euro area euro area euro area any country any country
countries countries countries countries (excl. US) (excl. US)
Number of observations 143 145 42 42 166 155
Impact of (1) (2) (3) (4) (5) (6)
Share of exports (imports) to (from) Not Notthe euro area (US in regressions 5 and 6) + + ... ... significant significant
EU25 or candidate country dummy + + ... ... - -
Euro cash changeover dummy + + + + - -
Share of differentiated goods Not Not Not Notin exports (imports) + significant significant significant significant -
Exchange rate volatility vis-à-vis the Not Not Not Not Noteuro (US dollar in regressions 3, 4, 5 and 6) + significant significant significant significant significant
Inflation differential with the euro area Not Not(US in regressions 3, 4, 5 and 6) - - significant significant + +
Presence of forward market dummy Not Not Notsignificant - ... ... significant significant
Pegged exchange rate to the euro(US dollar in regressions 5 and 6) + + ... ... + +
Source: Kamps (2005).Notes: (...) indicates that this variable was not included in the regression as it was not applicable. Preliminary results reported hereare on the basis of regressions including all of the above variables, i.e. similar to regression (6) in Table 14, and on the basis ofcritical values at 5% statistical signif icance.
Table 15 Summary of styl ised results from the econometric est imations

46ECB cReview of the international role of the euroDecember 2005
38 In an alternative specif ication, private credit to GDP is usedas an indicator for f inancial development. For the vehiclecurrency estimations, this f inancial development indicator isalways insignif icant. Only for home currency importinvoicing does this measure of f inancial development have asignif icant positive (as expected) impact. For home currencyexport invoicing, the positive coeff icient is only signif icantwhen leaving out the forward market dummy from theregression.
indicates that the higher the inflationdifferential with the euro area, the lower theshare of exports invoiced in euro. Exchangerate volatility vis-à-vis the euro increases theshare of exports invoiced in euro in thepreferred regression number 6, but the result isnot robust across different specifications.Finally, the lack of a forward market does notincrease the use of the euro in the exports ofthese countries.38 Taken together, this third setof results suggests that, in the presence of highinflation and limited hedging opportunities,exporters from these countries choose acurrency other than the euro, possibly the USdollar. These results are therefore consistentwith the interpretation that the use of the euroas a vehicle currency is limited beyond its usein countries with institutional links to the EU.
Similar sets of regressions were run also on theshare of imports invoiced in euro among non-euro area countries, again attempting tocapture a measure of the extent to which theeuro was used as a vehicle currency bycontrolling for the importance of imports fromeuro area countries. In addition, Table 15summarises the results of regression for the useof the euro in producer and local currencypricing. Moreover, for the sake of comparison,results of regression for the use of the US dollaras a vehicle currency are also presented.Column 1 in Table 15 corresponds to theresults already presented in Table 14 for theuse of the euro in the exports of non-euro areacountries.
The interpretation of these preliminary resultsis nevertheless inherently difficult given thelimited availability of data. This is particularlythe case with regard to the use of the euro inproducer currency pricing (on the basis ofexports by euro area countries) or localcurrency pricing (on the basis of imports byeuro area countries). It should nevertheless benoted that the economic variables included inthe analysis do not seem to explain the use ofthe euro by euro area countries and that onlythe institutional variable capturing the cashchangeover has explanatory power. Not
forgetting the shortcomings of the data, acomparison of the results for the use of the euroin the foreign trade of non-euro area countries(columns 1 and 2) with those for the use of theUS dollar (columns 5 and 6) may still lead to anumber of highly tentative conclusions.
First, while the importance of the euro area as atrading partner helps to explain the use of theeuro, trading with the United States does notsignificantly help to explain the use of the USdollar. This result is consistent with theinterpretation that the US dollar is a truevehicle currency for trade among third partieswhile the euro is only now beginning to emergein this regard.
Second, the institutional variables related toEU membership and the euro cash changeoveraffect positively the share of trade invoiced inthe euro and negatively the share of tradeinvoiced in the US dollar. These results tend toconfirm the strong connection between theregional role of the euro and institutionalfactors, and also give support to the hypothesisput forward by Baccheta and van Wincoop(2005) that the establishment of a monetaryunion would per se increase the use of thecommon currency in trade.
Third, effects stemming from the type of goodstraded differ for the euro and for the US dollar.A higher proportion of trade in differentiatedgoods appears to increase the use of the eurowhile it appears to decrease the use of the USdollar, although this result does not hold acrossboth exports and imports. The impact ofinflation differentials on invoicing in the euroand the US dollar also appears to be somewhatdifferent. Higher inflation differentials vis-à-vis the euro area have the effect of reducing the

47ECB
Review of the international role of the euroDecember 2005
SPECIALFOCUS
39 In contrast with the results presented here, a recent study ofinvoicing practices in Korean exports found that exchangerate volatility of the won vis-à-vis the US dollar, the euroand the Japanese yen could help to explain the relative use ofthese three currencies in Korean exports (Yun, 2005).
share of trade invoiced in the euro while, incontrast, higher inflation differentials vis-à-vis the United States have the effect ofincreasing the share of trade invoiced in the USdollar. These results are consistent with theinterpretation that suggests the US dollar has atrue vehicle currency role.
There are, however, some common themes thatemerge from the sets of regressions on both theeuro and the US dollar, notably that hard pegsmatter in both cases while the presence of aforward market does not. This latter result maywell be due to the fact that the variable useddoes not capture sufficiently the availabilityand ease of methods for hedging exchange raterisk. One last result worth noting, and onewhich is also broadly common for both theeuro and the US dollar, is the non-significanceof exchange rate volatility. This finding isunsurprising given the ambiguous effectpredicted by the theoretical literature.
Overall, it should be stressed that thesetentative results must be interpreted with greatcaution. Not only is the dataset limited but it isalso overwhelmingly composed of Europeancountries.39 If specific characteristics ofthe trade patterns of these European countriesare not accurately controlled for with theindependent variables used in the analysis, abias would be introduced into the results.Ideally, a larger dataset including countriesfrom other regions of the world such as LatinAmerica would help to explore these possiblebiases. Unfortunately, however, there are stillonly very limited data available on theinvoicing practices of countries worldwide.
CONCLUSIONS
In recent years, the use of the euro ininternational trade has seen a notable increase,particularly among a number of EU MemberStates. What are the factors behind thisincrease in the use of the euro in internationaltrade? This special focus has addressed thisquestion, making use of a panel dataset on the
invoicing practices of countries in foreigntrade. The dataset was gathered largely thanksto the data collection efforts of the ESCB.
On the basis of this dataset, some tentativefindings have emerged, even though it isimportant to stress that these findings must beinterpreted with great caution given the limitedsample of largely European countries on whichthey are based. First, there is limited evidenceregarding the use of the euro as a vehiclecurrency in foreign trade, i.e. among the tradeof non-euro area countries. There is certainlyevidence from some non-euro area countrieswhere the share of trade denominated in euro ishigher than the share of trade with the euroarea, thus suggesting that some trade with non-euro area countries is conducted in euro.However, the preliminary results from theeconometric estimations point to somefeatures regarding the use of the euro that arenot consistent with the traditional view ofvehicle currency pricing. These relate, inparticular, to the type of goods traded and tothe inflation differentials vis-à-vis the euroarea. Traditionally, it would be expected that avehicle currency would be used more in thetrade of non-differentiated goods and in caseswhere the trading partners suffer from priceinstability. However, these effects do notfeature with regard to the use of the euro in theforeign trade of non-euro area countries. Thissuggests that the observed use of the euro as avehicle currency may be driven by otherfactors than those commonly cited in theliterature as causes of vehicle currency pricing.
A second tentative conclusion that hasemerged from this analysis relates to theimportance of institutional factors inexplaining the development in the use of theeuro in international trade. The results provideevidence that countries with clear prospects ofbeing part of the EU, as well as those with hard

48ECB cReview of the international role of the euroDecember 2005
pegs to the euro, make greater use of the euro intheir foreign trade even when controlling forthe actual trade with the euro area. The analysispresented here has also provided sometentative evidence supporting the view that,controlling for a number of economicvariables, Economic and Monetary Union hasled to an increase in the use of the euro ininternational trade. Overall, the analysisconducted in this special focus has confirmedthe gradual increase in the use of the euro ininternational trade, as well as its strongregional element.

49ECB
Review of the international role of the euroDecember 2005
B THE EUROIN THIRD
COUNTRIESThis chapter reviews the role of the euro in countries outside the euro area (so-called “thirdcountries”), distinguishing between official and private use. Official use refers mainly to theeuro’s role in third countries’ monetary and exchange rate policies, in the form of an anchor orreference currency, a reserve currency or an intervention currency. Private use refers to the use ofthe euro by private agents in third countries, mainly as a parallel currency in the accumulation offinancial assets or in the denomination of specific transactions and contracts.
1 OFFICIAL USE: THE EURO IN THIRD COUNTRIES’EXCHANGE RATE POLICIES
B THE EURO IN THIRD COUNTRIES
1.1 THE EURO AS AN ANCHOR CURRENCY
Choosing the appropriate exchange rateregime is one of the key policy choices formonetary authorities, with additionalimplications for the size and composition offoreign reserves and interventions. The IMFlists about 150 countries with exchange rateregimes involving a reference currency or abasket of reference currencies. In 40 of thesecountries, the euro serves as the anchor ofexchange rate policies (see Table 16), either asthe sole reference currency, or as part of acurrency basket.40
As in previous years, the use of the euro in thirdcountries’ exchange rate regimes has a stronggeographical and institutional underpinning,as it is observed mainly in EU neighbouringregions and in countries that have establishedspecial institutional arrangements with the EUor its Member States. With the exception ofthose countries participating in the exchangerate mechanism II (ERM II), the decision to usethe euro as an anchor currency is a unilateraldecision and does not involve any commitmenton the part of the Eurosystem.
DEVELOPMENTS IN THE PERIOD UNDERREVIEW
In the period under review, the main exchangerate regime changes involving the euro as ananchor currency took place in three newMember States which entered ERM II (Cyprus,Latvia and Malta). In addition, as an EUacceding country, Romania strengthened the
reference role of the euro in its interventionpolicy while formally adopting an inflationtargeting framework. In EU neighbouringregions, Russia introduced a reference basketfor the daily management of its exchange ratewhich includes the euro along with the USdollar. Israel, on the other hand, formallyintroduced inflation targeting and reduced therole of intervention in its monetary policyframework. As regards other regions, Chinaannounced in July that it would operate amanaged floating exchange rate policy basedon market supply and demand with reference toa basket of currencies that includes the euro asone of its main components.41
With effect from 2 May 2005 the currencies ofCyprus, Latvia and Malta have participated inERM II. Prior to their entry into ERM II, theCyprus pound and the Latvian lats were alreadyunilaterally pegged to the euro, Latvia havingmoved in January 2005 from an SDR to a europeg, while the Maltese lira was pegged to abasket including the euro, the pound sterlingand the US dollar with no fluctuation band. Forall three currencies, the standard fluctuationband of ±15% around the central parity willbe observed. In addition, the Latvian and the40 Other entities linking their exchange rate regimes to the euro
include the French territorial communities and overseasterritories (Saint-Pierre-et-Miquelon, Mayotte, FrenchPolynesia, New Caledonia, and Wallis and Futuna), theEuropean microstates that are not IMF members (the VaticanCity, and the principalities of Monaco and Andorra), as wellas Kosovo and Montenegro (see Table 16). As a result, acombined total of 50 countries and territories have anexchange rate regime involving the euro.
41 Finally, outside the review period, the IMF recentlyannounced that the share of the euro in the Special DrawingRight (SDR) will increase from 29% to 34% from 2006 on.

50ECB cReview of the international role of the euroDecember 2005
Maltese authorities have declared that theywill unilaterally maintain tighter fluctuationbands around the central parity (±1% in thecase of Latvia and zero percent in the case ofMalta). These unilateral commitments placeno additional obligations on the ECB. Outsidethe review period, Slovakia joined ERM II on25 November 2005.
In January 2005 the Romanian authoritiesannounced that the euro would be used as thede facto single reference currency for the leu,replacing a reference currency basket in whichthe euro had a weight of 75%. The euro hadalready become the main reference point ofBanca Naţională a României in 2003 when it
announced that it would carry out all foreignexchange interventions in euro. More recently,the monetary authorities have announced theintroduction of inflation targeting. It remainsto be seen to what extent this new frameworkfor monetary policy will affect Romania’sexchange rate policy.
In Russia, the euro has played a role in thecountry’s exchange rate policy for some years,with the Bank of Russia aiming to limit the realeffective appreciation of the rouble against atrade-weighted currency basket composed ofthe currencies of a large number of Russia’strading partners. Trade with euro areacountries accounts for over 36% of Russian
Region Exchange rate regimes Countries
European Union ERM II Cyprus, Denmark, Estonia1), Latvia2),(non-euro area) Lithuania1), Malta3), Slovenia, Slovakia
Peg arrangements based on the euro Hungary
Managed floating with the euro as reference Czech Republiccurrency
Pro memoria: Independent floating Sweden, United Kingdom, Poland
Acceding, accession and Unilateral euroisation Kosovo, Montenegropotential candidate countries Euro-based currency boards Bulgaria, Bosnia and Herzegovina
Peg arrangements or managed floating Croatia, FYR Macedonia, Romania, Serbiawith the euro as reference currency
Pro memoria: Independent floating Albania, Turkey
Others Euroisation European microstates 4), French territorialcommunities 5)
Peg arrangements based on the euro CFA Franc Zone6), French overseasterritories7), Cape Verde, Comoros
Peg arrangements and managed floats based Seychelles (37.7%), Russian Federation (35%)8),on the SDR and other currency baskets Libya, Botswana9), Morocco10), Tunisia11),involving the euro (share of the euro) Vanuatu12)
Sources: IMF and ECB compilation.1) Unilateral commitment to a currency board.2) Unilateral commitment to an exchange rate fluctuation band of ±1%.3) Unilateral commitment to maintain a f ixed exchange rate.4) Republic of San Marino, Vatican City, Principality of Monaco, Andorra. In the case of Andorra: unilateral euroisation. The othercountries and jurisdictions are entitled to use the euro as their off icial currency.5) Saint-Pierre-et-Miquelon, Mayotte.6) WAEMU (Benin, Burkina Faso, Côte d’Ivoire, Guinea-Bissau, Mali, Niger, Senegal, Togo) and CAEMC (Cameroon, CentralAfrican Republic, Chad, Republic of Congo, Equatorial Guinea, Gabon).7) French Polynesia, New Caledonia, Wallis and Futuna.8) Trade-weighted currency basket for monitoring and setting ceilings for real appreciation (euro share of 36.4%); since February2005 dollar-euro basket for daily exchange rate management (since August 2005 euro share of 35%).9) Weighted basket of currencies comprising the SDR and the South African rand.10) Weighted basket in accordance with the distribution of Morocco’s foreign trade and the pattern of currencies of settlement.11) Real effective exchange rate target.12) Weighted (trade and tourism receipts) basket of currencies of Vanuatu’s major trading partners.
Table 16 Countries with exchange rate regimes l inked to the euro
(as at 1 December 2005)

51ECB
Review of the international role of the euroDecember 2005
B THE EUROIN THIRD
COUNTRIESforeign trade. In February 2005 an operationalUS dollar/euro basket was introduced as areference for the daily management of therouble’s exchange rate. The weight of the euro,initially set at 0.10, has now increased to0.35.42 In line with this change in policy, dailyvolatility in the rouble/euro exchange rate hasdecreased slightly. Outside the review period,as of 2 December 2005, the weight of the euroin the Central Bank of Russia’s operationalbasket for daily exchange rate managementwas increased to 0.4.
As of June 2005 Israel formally introducedinflation targeting, abandoning the exchangerate band around a basket of currencies andrendering the shekel a free-floating currency.The basket was dominated by the US dollar andhad a euro share of 28%. As the band had beenirrelevant for the practical conduct of policiesin the preceding years due to its width, with thelast intervention by the Bank of Israel havingtaken place in 1997, this move does not imply amaterial change of exchange rate policy.
Outside the review period, on 21 July 2005China revalued its currency by 2% against theUS dollar and moved to a “managed floatingexchange rate regime based on market supplyand demand with reference to a basket ofcurrencies”, as stated by the People’s Bank ofChina (PBC). The PBC pointed out thatmanaging the exchange rate “with referenceto” a basket of currencies did not mean that therenminbi would actually be pegged to thatbasket of currencies. While the weights of thecurrencies in the reference basket were notdisclosed, the currencies were selected mainlyon the basis of the relative shares of China’spartners in the trading of goods and services(with the other variables considered includingthe sources of foreign direct investment intoChina and the currency composition ofChinese debt). The currencies with the highestweight in the basket include the US dollar, theeuro, the Japanese yen and the Korean won.However, following the PBC’s announcement,the actual movements of the renminbi againstthe US dollar have remained marginal. Thus,
for the time being the reform has resultedprimarily in a one-off revaluation against theUS dollar, with an otherwise tightly managedrenminbi/US dollar exchange rate.
1.2 THE EURO AS A RESERVE CURRENCY
The global reserve build-up continued during2004. In December 2004 global foreignexchange reserves stood at USD 3,738 billion,an increase of 23% from the figure of USD 3,028billion at the end of 2003 (see Chart 9).43 Thismainly reflected developments in emergingmarkets and developing countries, whereforeign exchange reserve assets continued togrow at a pace of 27% in US dollar terms. Bycontrast, reserve growth in industrialisedcountries slowed from 24% in 2003 to 17%,mainly as a consequence of Japan’s decision toterminate its interventions in the foreignexchange market as of March 2004.
According to revised IMF figures, the share ofeuro-denominated assets in global foreignexchange reserves fell slightly from 25.3% to24.9% (see Table 17). As a result of changes inthe IMF’s methodology for compiling data on
42 A recent statement by the authorities indicates that the basketis operated with fixed quantities and variable weights basedon price notation, with the US dollar as a reference currency.
43 The information on aggregate reserve holdings has been takenfrom IMF (2005), with SDR values being converted into USdollar values on the basis of end-of-period exchange rates.
Chart 9 Global foreign exchange reserves
(USD billions; year-end)
Sources: IMF (2005) and ECB calculations.
0500
1,0001,5002,0002,5003,0003,5004,000
05001,0001,5002,0002,5003,0003,5004,000
2000 2001 2002 2003 2004
all countriesindustrial countriesemerging markets and developing countries

52ECB cReview of the international role of the euroDecember 2005
the currency composition of global foreignexchange reserves, the revised figures cannotbe directly compared with previous data andshould be interpreted with caution due to theirlimited coverage (see Box 5). Having thiscaveat in mind, the euro share has beenmoderately decreasing among industrialisedcountries (from 22.1% to 20.9%) while it hasbeen gradually rising among developingcountries (from 28.9% to 29.2%). However, itis difficult to draw inferences about a globaltrend towards euro-denominated reserves indeveloping countries from the IMF’s reviseddata since major reserve accumulators, mostnotably in Asia, are not covered in these data(see Box 5).44 Thus, the gradual but steadyincrease of euro-denominated reserves since1999, in particular in developing and emergingmarket countries, is likely to reflect to aconsiderable extent an orientation towards theeuro in EU neighbouring countries.45
Decomposing the SDR change of foreignexchange reserves into quantity and valuation
(price) changes reveals that the euro benefitedin 2004, as in previous years, from positiveprice effects (see Table 18). In contrast, theincrease of US dollar reserve holdings was inpart offset by negative valuation effects,reflecting the depreciation of the US dollaragainst major currencies in the course of 2004.
44 Press reports about indications of shifts in foreign exchangereserve holdings by central banks in Asia, the Middle East andLatin America have not been substantiated by off icial f igures.Moreover, survey results on central banks’ holdings offoreign exchange reserves, as published by Central BankingPublications in January 2005 (“RBS Reserve ManagementTrends 2005”) and indicating that 70% of the 65 surveyedcentral banks have increased their exposure to the euro overthe past two years, also have to be interpreted with caution forthe following reasons: f irst, the largest reserve holders were,again, not included in the survey. Moreover, the true coverageof the survey is not known, as only 54 central banks answeredthe question about the currency breakdown of reserves andthe report only gives aggregated information for the 65central banks that answered any of the questions. Second, theresponding central banks stated merely that they increasedtheir exposure to the euro, but not by how much. Moreover, inthe context of rapid reserve accumulation, increases inexposure do not necessarily translate into a change in theshare of the euro.
45 See also the analysis presented in ECB (2003).
1999 2000 2001 2002 2003 2004
All countries
US dollar 71.0 70.5 70.7 66.5 65.8 65.9Euro 17.9 18.8 19.8 24.2 25.3 24.9Japanese yen 6.4 6.3 5.2 4.5 4.1 3.9Pound sterling 2.9 2.8 2.7 2.9 2.6 3.3Swiss franc 0.2 0.3 0.3 0.4 0.2 0.2Other currencies 1.6 1.4 1.2 1.4 1.9 1.8
Industrialised countries
US dollar 73.5 72.5 72.7 68.9 70.5 71.5Euro 16.1 17.1 18.0 22.4 22.1 20.9Japanese yen 6.7 6.5 5.6 4.4 3.8 3.6Pound sterling 2.2 2.0 1.9 2.1 1.5 1.9Swiss franc 0.1 0.2 0.3 0.6 0.2 0.1Other currencies 1.4 1.6 1.5 1.7 1.9 2.0
Developing and emerging market countries
US dollar 68.2 68.2 68.6 64.0 60.7 59.9Euro 19.9 20.6 21.8 26.1 28.9 29.2Japanese yen 6.0 6.0 4.9 4.7 4.4 4.3Pound sterling 3.7 3.6 3.6 3.8 3.9 4.8Swiss franc 0.4 0.3 0.3 0.2 0.2 0.2Other currencies 1.7 1.3 0.9 1.2 1.9 1.6
Source: IMF (2005).Note: Due to methodological changes, data are not comparable with previously available f igures (see box 5).
Table 17 Off ic ia l foreign exchange reserves: currency shares
(as a percentage of total identified holdings; end-of-year values)

53ECB
Review of the international role of the euroDecember 2005
B THE EUROIN THIRD
COUNTRIESBox 5
CHANGE S I N TH E IM F ’ S ME THOD O F COMP I L I NG DATA ON THE CURRENCYCOMPO S I T I ON O F O F F I C I A L F OR E I GN EX CHANGE R E S E RV E S
The revised figures published in the IMF’s 2005 Annual Report reflect three main changes to theIMF’s underlying database on the Composition of Official Foreign Exchange Reserves (COFER).
First, this year’s data were compiled under a new rule which strictly limits the use of estimateswhen the currency composition of reserves is not reported to the IMF. In previously publisheddata, the IMF often resorted to its own estimates when countries did not report the currencycomposition of their reserves. The new rule requires that any estimation of the currencycomposition is limited to short data gaps. Reserves held by non-reporting countries for which thecurrency composition was previously estimated have been moved to a new category called“unallocated reserves”. As a consequence of the new rule, the reported currency shares are basedon a substantially smaller country sample. While the rate of reporting compliance of industrialcountries is close to 100%, the reserves of developing country reporters accounted for only 50%to 65% of total developing country reserves during the period from 1995 to 2004. According tothe IMF, reporting compliance has been particularly low in Asia. The fact that the “reportinggap”, measured as the difference between reserve holdings with a reported currency compositionand total reserve holdings, is rising over time suggests that major Asian reserve accumulators arenot included in the survey.
Second, the revised data now differentiate between “other currencies” (currencies other than themajor ones identified in the table) and “unallocated currencies” (reserves held by countries thatdo/did not report to COFER). In previous years a category labelled “unspecified currencies”captured both foreign exchange reserves held in currencies other than the major currenciespresented and reserves held by those non-reporting countries for which the currency compositionwas not estimated.
And third, the revised data also reflect data improvements resulting, in part, from new andrevised figures reported by countries. These improvements entailed reclassifying some of thereserves that used to fall under “unspecified currencies” into the major currencies presented.
As a consequence of these changes, the revised figures are not directly comparable with thosepreviously published. The revised figures are based on a smaller country sample which iscomposed only of countries which actually report their currency composition to the IMF. In thatsense, the revised figures are more precise, but smaller in scope.
As major Asian reserve accumulators, which are believed to hold a comparatively small share oftheir reserves in euro, are apparently no longer part of the survey, the revised numbers show ahigher euro share than previously published data, particularly in developing countries. Accordingto the IMF, improved reporting by some countries, achieved by moving some reserve holdingspreviously labelled as “unspecified” into euro holdings, also contributed to a higher euro share.
Summing up, the revised IMF figures should be treated with caution and should not beinterpreted as evidence of a global trend towards euro-denominated foreign exchange reserves.In order to enlighten the public debate on global reserve diversification trends, the ECBsupports efforts to collect data on the currency composition of foreign exchange reserves fromall IMF member countries.

54ECB cReview of the international role of the euroDecember 2005
Evidence from the few central bankspublishing the currency breakdown of theirreserves (see Table 19) confirms that the shareof the euro in official foreign exchangereserves is increasing in the new EU MemberStates and in EU neighbouring countries, whilethe evidence has been more mixed in matureeconomies which publish the currencycomposition of their reserves.
Significant increases in the euro’s share inreserves holdings occurred in Latvia, which re-pegged its currency to the euro in January 2005and entered ERM II in May 2005. Similarly,the euro’s share increased considerably inSlovakia and Croatia. Both countries maintaina managed float exchange rate regime vis-à-visthe euro.
While the share of the euro in Canada’s foreignexchange reserves remained stable, the UnitedKingdom increased its holdings of euro-denominated foreign exchange reserveholdings, mostly at the expense of the USdollar. By contrast, the share of the euro inofficial reserve holdings decreased over thereview period in the remaining industrialisedcountries which report the currencycomposition of their reserves. In the UnitedStates, the euro’s share in official foreignexchange reserves fell from 56% to 44%, whilethe share of the Japanese yen increased from44% to 56%. In Australia, the trend of the
2000 2001 2002 2003 2004
US dollarChange in holdings 90.6 51.5 -8.8 95.9 128.3
Quantity change 51.2 21.9 58.3 176.9 176.1Price change 39.4 29.6 -67.1 -81.0 -47.8
Year-end value 802.2 853.8 845.0 940.9 1,069.2
EuroChange in holdings 34.0 25.8 67.5 54.8 42.1
Quantity change 37.8 29.5 41.4 21.9 29.3Price change -3.8 -3.7 26.1 32.9 12.8
Year-end value 213.9 239.7 307.2 362.0 404.1
Table 18 Currency composit ion of of f ic ia l holdings of foreign exchange, end of year
(in billions of SDR)
Source: IMF (2005).
euro’s share declining considerably continued.In Switzerland, the euro’s share dropped fromapproximately 51% to 45%, mainly due to anincrease in the share of pound sterling-denominated assets from approximately 5% to10%.
1.3 THE EURO AS AN INTERVENTION CURRENCY
The functions of anchor, reserve andintervention currency are intricatelyintertwined. Under a floating regime, foreignexchange market interventions are infrequent,as they are mainly conducted to calmdisorderly market conditions. By contrast,countries operating any form of exchange ratepeg and managed float intervene regularly toachieve an exchange rate consistent with thechosen regime. In conducting interventions,they prefer to use the anchor currency.
As in the case of reserves, most authorities donot publish the currency composition ofinterventions. Press reports and publiclyavailable statements by authorities indicatethat several central banks in EU neighbouringcountries intervened by using the euro as theintervention currency. This was also the casein most of the new EU Member States,particularly the Czech Republic, Hungary,Latvia, Slovakia and Slovenia. Moreover, bydesign, interventions in euro were conducted

55ECB
Review of the international role of the euroDecember 2005
B THE EUROIN THIRD
COUNTRIES
by authorities of countries operating a euro-based currency board. In addition, Romaniaand some western Balkan countries were againactive in the foreign exchange market inmanaging their exchange rate vis-à-vis theeuro. The Croatian National Bank, whichpublishes details of its interventions in the
foreign exchange market, carried out itsinterventions almost exclusively in euro – theyamounted to around €510 million during 2004.More recently, public statements by the Bankof Russia have suggested that, for the firsttime, the Russian central bank has intervenedin the rouble/euro market (see Box 6).
Box 6
TH E RO L E O F TH E EURO I N RU S S I A
Economic and financial links between the euro area and Russia have strengthened lastingrecent years (see ECB, 2005). The euro area is Russia’s most important trading partner,accounting for about 35% of Russia’s total trade in goods. To some extent, these strengtheningtrade links may have motivated the Bank of Russia to take steps that have led to an increasedrole of the euro as an anchor and intervention currency.
Euro US dollar Japanese yen Other currencies
June June June June June June June June2004 2005 2004 2005 2004 2005 2004 2005
G20 countriesAustralia 31 25 54 63 7 5 8 1) 7 1)
Canada 43 43 53 54 3 3 0 0United Kingdom 50 56 36 31 14 12 0 0United States 56 44 ... ... 44 56 0 0
New EU Member StatesLatvia2) 41 59 43 38 4 3 12 0Lithuania 100 ... 0 ... 0 ... 0 ...Slovakia 68 76 29 21 0 0 3 3
EU neighbouring countriesBulgaria 82 ... 5 ... 0 ... 11 1) ...Croatia 70 84 30 16 ... ... 0 3) 0 3)
Iceland 40 40 5 15Norway 53 54 39 38 ... 8 9Romania 54 ... 32 ... ... ... 5 ...Sweden 37 ... 37 ... 8 ... 18 ...Switzerland 51 45 38 37 0 1.3 11 16
Other countriesColombia 13 ... 84 ... 3 ... 0 ...Philippines 10 ... 83 ... 4 ... 4 ...
Table 19 Currency breakdown of total foreign exchange reserves of selected countries
(percentages)
Sources: Websites of countries’ authorities and ECB calculations.Notes: Bulgaria: 2004 data refer to the 2004 average. Columbia: 2004 data refer to end-2004. Iceland: 2004 data refer to theinvestment guideline for 2004. Lithuania: 2004 data refer to the average of 2004. Norway: Euro and US dollar currency f iguresinclude other American and European currencies; other currencies include holdings in Japanese yen; 2005 f igures as of March2005. Philippines: 2004 data refer to end-2004. Romania: 2004 data refer to end-2004. United Kingdom: Data refer to March 2005.1) Including SDRs and gold.2) Latvia is a member of ERM II since May 2005 and has repegged from SDR to the euro in January 2005.3) Including any holdings of Japanese yen.

56ECB cReview of the international role of the euroDecember 2005
Since 2003 the Bank of Russia’s exchange rate policy has aimed to limit the real effectiveappreciation of the rouble against a trade-weighted currency basket composed of the currenciesof a large number of Russia’s trading partners. In February 2005, an operational US dollar/eurobasket was introduced as a reference for the daily management of the rouble’s exchange rate.The weight of the euro, initially set at 0.10, has now increased to 0.35, mirroring the proportionof Russia’s trade which is carried out with the euro area. In line with this change in policy, dailyvolatility in the rouble/euro exchange rate has decreased slightly. Recently, public statementsby the Bank of Russia have suggested that, for the first time, the Russian central bank hasintervened in the rouble/euro market. According to the authorities, euro-denominated assetsaccount for one-third of Russia’s total foreign exchange reserves. With international reserveassets amounting to approximately USD 150 billion as at 30 June 2005, Russia is among thelargest holders of euro-denominated foreign exchange reserves.
Data on foreign exchange cash transactions by authorised Russian banks also suggest thatdemand for euro cash by Russian households has increased since the euro cash changeover,mainly – as indicated by the seasonal pattern of banks’ euro sales – for tourism purposes (seechart). By contrast, use of the euro as a vehicle currency in the foreign exchange market and asan investment and financing currency is still marginal. While the euro’s share in the foreignassets of Russian banks rose from 6-7% in early 2002 to around 20% in early 2005, its share inbanks’ foreign liabilities has remained at 6-7%. Domestically, foreign banknotes and foreignexchange deposits are held mainly in US dollars, while the share of euro-denominated assets atBIS reporting banks has almost tripled from 11% in 2002 to 31% at the end of the first quarter of2005 (see Box 3).
Summing up, while the role of the euro has been gradually increasing in Russia, the US dollarcontinues to be the most important currency in most cases.
Volume of cash transactions in US dol lars and euro in Russia1)
(USD millions)
Source: Central Bank of Russia and ECB calculations.Notes: Bank purchase = customer sale; bank sale = customer purchase.1) Between authorised banks and individuals.
0
500
1,000
1,500
2,000
2,500
3,000
3,500
0
500
1,000
1,500
2,000
2,500
3,000
3,500
purchases of DEM/euro by bankssales of DEM/euro by bankspurchases of USD by bankssales of USD by banks
Jan. July Jan. July Jan. July Jan. July Jan. July Jan. July Jan.1999 2000 2001 2002 2004 20052003

57ECB
Review of the international role of the euroDecember 2005
B THE EUROIN THIRD
COUNTRIESResidents of many developing, emergingmarket and transition economies hold asignificant share of their financial assets in theform of foreign currency-denominated assets,mostly as foreign cash or foreign currency-denominated bank deposits. Holdings of eurobanknotes and euro-denominated depositsoutside the euro area can be considered one ofthe facets of the international role of the euro,in particular in EU neighbouring regions. Thissection provides updated information on thelevel of euro-based currency (sub-section 2.1)and asset substitution (sub-section 2.2)observed in these countries.
2.1 CURRENCY SUBSTITUTION – THE USE OFEURO BANKNOTES OUTSIDE THE EUROAREA
Given that holders of banknotes cannot beidentified directly, information on non-resident demand for euro banknotes can onlybe derived indirectly and with a considerableamount of uncertainty.46
For example, one way of estimating theamount of euro banknotes circulating abroad isby totalling over time the net shipments ofeuro banknotes by euro area monetary andfinancial institutions (MFIs) to destinationsoutside the euro area.47 Following therelatively large shipments observed as a resultof the euro cash changeover, shipments of eurobanknotes by banks to destinations outside theeuro area have started to stabilise and appear tobe exhibiting an increasingly seasonal pattern(see Chart 10).48 As a result of net shipmentsbeing mostly positive, the stock of eurobanknotes accumulated outside the euro areacontinues to increase gradually. In the periodbetween June 2004 and June 2005 netshipments of euro banknotes to destinationsoutside the euro area amounted to €8.7 billion,compared with €9.4 billion in the twelvemonths ending in June 2004.49 In June 2005 thecumulative stock of euro banknotes shipped innet terms by euro area MFIs to destinationsoutside the euro area stood at around €55
2 PRIVATE USE: THE EURO AS A PARALLEL CURRENCYIN THIRD COUNTRIES
46 For a more complete overview of the methods for estimatingnon-resident demand for euro banknotes, see Boxes 7 and 8 inthe Review of the international role of the euro published bythe ECB in January 2005.
47 Net shipments are def ined as shipments of euro banknotes byeuro area MFIs to destinations outside the euro area minus thereturn of euro banknotes from destinations outside the euroarea to euro area MFIs.
48 The information was compiled in cooperation with thenational central banks of the Eurosystem.
49 The order of magnitude of these estimates for the annual netoutflow of euro banknotes (less than €9 billion) indicates thatthe impact of non-resident demand for euro banknotes on theannual growth rates of euro area monetary aggregates in thepast year has been negligible.
billion, compared with €46 billion in June2004.
However, such an estimate has to beconsidered as rough at best, as transfers of eurobanknotes to and from the euro area also takeplace through other channels, such as tourism,workers’ remittances or activity in the greyeconomy. It also has to be considered as alower-bound estimate, as anecdotal evidencesuggests that the outflows of euro banknotesvia non-MFI channels can often be consideredto be more important than the backflow of eurobanknotes via non-bank channels.
Chart 10 Net shipments1) of euro banknotesto dest inations outside the euro area
(EUR millions)
Source: Eurosystem.1) Net shipments = Euro banknotes sent abroad minus eurobanknotes received.
-1,000
-2,000
0
1,000
2,000
3,000
4,000
5,000
6,000
Dec. May Oct. Mar. Aug. Jan. June Nov. Apr.
-5,000
-10,000
5,000
15,000
25,000
35,000
45,000
55,000
initial frontloadingmonthly shipments (left-hand scale)cumulative shipments (right-hand scale)
2003 2004 200520022001
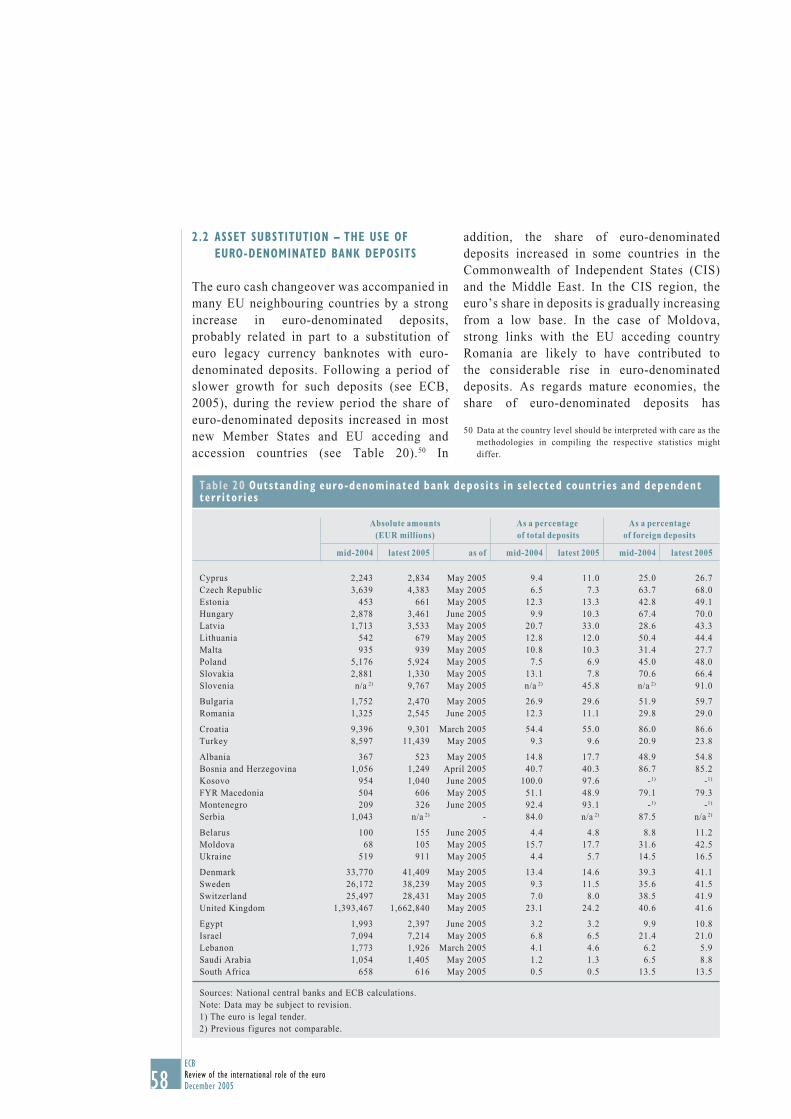
58ECB cReview of the international role of the euroDecember 2005
2.2 ASSET SUBSTITUTION – THE USE OFEURO-DENOMINATED BANK DEPOSITS
The euro cash changeover was accompanied inmany EU neighbouring countries by a strongincrease in euro-denominated deposits,probably related in part to a substitution ofeuro legacy currency banknotes with euro-denominated deposits. Following a period ofslower growth for such deposits (see ECB,2005), during the review period the share ofeuro-denominated deposits increased in mostnew Member States and EU acceding andaccession countries (see Table 20).50 In
50 Data at the country level should be interpreted with care as themethodologies in compiling the respective statistics mightdiffer.
addition, the share of euro-denominateddeposits increased in some countries in theCommonwealth of Independent States (CIS)and the Middle East. In the CIS region, theeuro’s share in deposits is gradually increasingfrom a low base. In the case of Moldova,strong links with the EU acceding countryRomania are likely to have contributed tothe considerable rise in euro-denominateddeposits. As regards mature economies, theshare of euro-denominated deposits has
Table 20 Outstanding euro-denominated bank deposits in selected countries and dependentterr i tor ies
Sources: National central banks and ECB calculations.Note: Data may be subject to revision.1) The euro is legal tender.2) Previous f igures not comparable.
Absolute amounts As a percentage As a percentage(EUR millions) of total deposits of foreign deposits
mid-2004 latest 2005 as of mid-2004 latest 2005 mid-2004 latest 2005
Cyprus 2,243 2,834 May 2005 9.4 11.0 25.0 26.7Czech Republic 3,639 4,383 May 2005 6.5 7.3 63.7 68.0Estonia 453 661 May 2005 12.3 13.3 42.8 49.1Hungary 2,878 3,461 June 2005 9.9 10.3 67.4 70.0Latvia 1,713 3,533 May 2005 20.7 33.0 28.6 43.3Lithuania 542 679 May 2005 12.8 12.0 50.4 44.4Malta 935 939 May 2005 10.8 10.3 31.4 27.7Poland 5,176 5,924 May 2005 7.5 6.9 45.0 48.0Slovakia 2,881 1,330 May 2005 13.1 7.8 70.6 66.4Slovenia n/a 2) 9,767 May 2005 n/a 2) 45.8 n/a 2) 91.0
Bulgaria 1,752 2,470 May 2005 26.9 29.6 51.9 59.7Romania 1,325 2,545 June 2005 12.3 11.1 29.8 29.0
Croatia 9,396 9,301 March 2005 54.4 55.0 86.0 86.6Turkey 8,597 11,439 May 2005 9.3 9.6 20.9 23.8
Albania 367 523 May 2005 14.8 17.7 48.9 54.8Bosnia and Herzegovina 1,056 1,249 April 2005 40.7 40.3 86.7 85.2Kosovo 954 1,040 June 2005 100.0 97.6 -1) -1)
FYR Macedonia 504 606 May 2005 51.1 48.9 79.1 79.3Montenegro 209 326 June 2005 92.4 93.1 -1) -1)
Serbia 1,043 n/a 2) - 84.0 n/a 2) 87.5 n/a 2)
Belarus 100 155 June 2005 4.4 4.8 8.8 11.2Moldova 68 105 May 2005 15.7 17.7 31.6 42.5Ukraine 519 911 May 2005 4.4 5.7 14.5 16.5
Denmark 33,770 41,409 May 2005 13.4 14.6 39.3 41.1Sweden 26,172 38,239 May 2005 9.3 11.5 35.6 41.5Switzerland 25,497 28,431 May 2005 7.0 8.0 38.5 41.9United Kingdom 1,393,467 1,662,840 May 2005 23.1 24.2 40.6 41.6
Egypt 1,993 2,397 June 2005 3.2 3.2 9.9 10.8Israel 7,094 7,214 May 2005 6.8 6.5 21.4 21.0Lebanon 1,773 1,926 March 2005 4.1 4.6 6.2 5.9Saudi Arabia 1,054 1,405 May 2005 1.2 1.3 6.5 8.8South Africa 658 616 May 2005 0.5 0.5 13.5 13.5

59ECB
Review of the international role of the euroDecember 2005
B THE EUROIN THIRD
COUNTRIESremained relatively stable, with the exceptionof in Sweden.
With regard to asset substitution in cashholdings, surveys carried out by the
Oesterreichische Nationalbank indicate thatthe share of the euro in cash holdings byindividuals in central, south-eastern andeastern Europe has continued its upward trendover the years in most countries (see Box 7).
Box 7
THE EURO I N C EN TRA L , S OU TH - E A S T E RN AND E A S T E RN EUROPE – S URV EY R E SU LT S
Surveys conducted by the Oesterreichische Nationalbank1 in Croatia, Hungary, the CzechRepublic, Slovenia and Slovakia since 1997 reveal important information about the role playedby cash holdings in foreign currencies, including the euro, in these countries.
Before the euro cash changeover, the Deutsche Mark was the most important foreign currencyin these countries, but its share was declining. Available figures which summarise theevolution of respondents’ euro and US dollar cash holdings since 2002 clearly show that thetrend over the years in the Czech Republic, Hungary, Slovakia and Slovenia has been for theshare of euro holdings to increase. In Croatia, the euro’s share has been more or less constant forseveral years. In the spring of 2005 about 48% of Slovenians, 33% of Czechs, 29% of Croats,27% of Slovaks and 10% of Hungarians were holding euro cash balances. It is noteworthy thatthe figures in Slovakia, Slovenia und Hungary are now higher than the corresponding figuresfor the Deutsche Mark were in the late 1990s. A similar development can also be observed in theamounts of euro that circulate in all five countries. In comparison with the 1990s, demand forthe euro was low at the end of 2001. However, survey estimates indicate a steady increase,totalling 60%, between 2002 and 2005.2
US dollars, in turn, are held by a much smaller proportion of respondents, and this share hasremained more or less constant. At the same time, the surveys indicate that the amount of USdollars circulating in those countries has declined by about 23% since 2002.
A comparison of survey participants’ responses from 1999 and 2000 on their motives to holdDeutsche Mark with participants’ responses from 2004 and 2005 on their motives to hold euroreveals some interesting changes. In particular, the transaction demand motive (“spendingabroad”) has increased in the Czech Republic, Slovakia and Slovenia. In Hungary, the motive“spending at home” has increased. For Croatia, no change in motives can be observed. Inabsolute terms, the general reserve motive still dominates as the reason for euro holdings inCroatia (72% of those holding euro) and Slovenia (55%), while “spending abroad” is the mostimportant motive for euro holdings in the Czech Republic (87%), Slovakia (68%) and Hungary(56%).
As far as the use of the euro for payments in the respective countries is concerned, surveyrespondents were asked whether they had noticed that it was possible to make payments in euro
1 About 1,000 people over the age of 14 were interviewed per survey and country in April/May, and then again in October/November. For a detailed description see Stix (2001, 2004) and Nauschnigg (2003).
2 This value may be overestimated due to an unusually high value of foreign currency holdings in Croatia in the May 2005 survey.Even without Croatia, holdings have still increased by 36%.
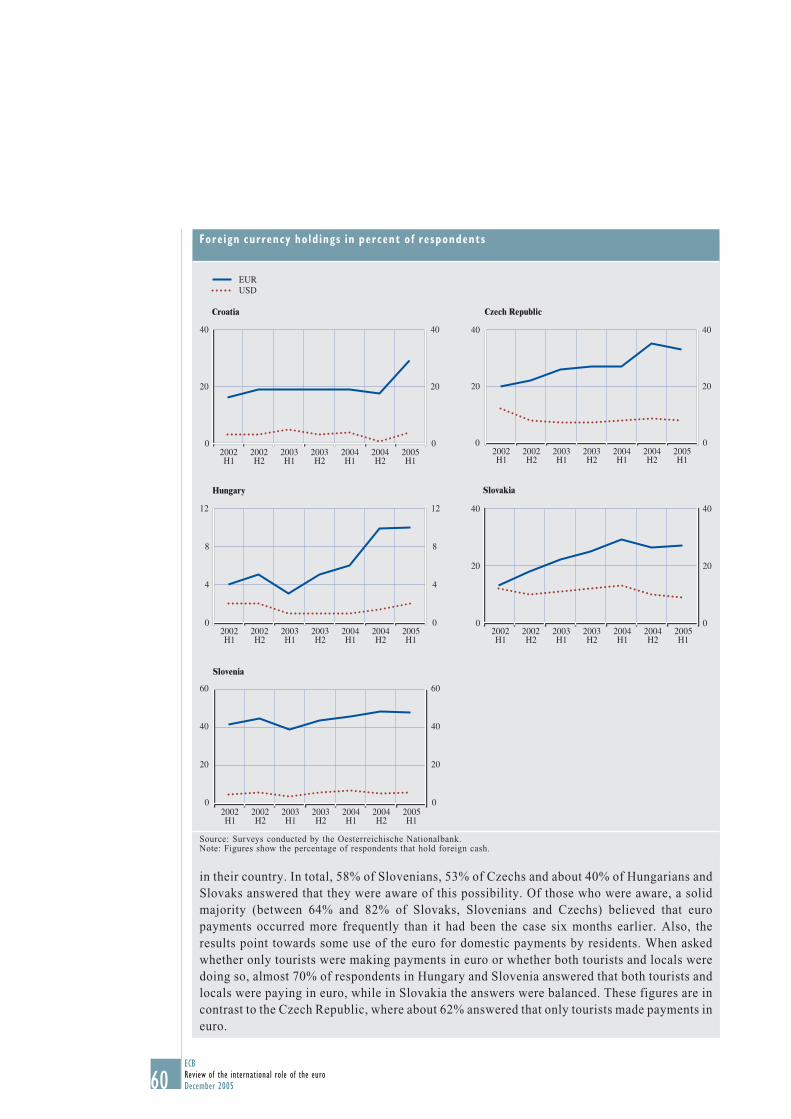
60ECB cReview of the international role of the euroDecember 2005
in their country. In total, 58% of Slovenians, 53% of Czechs and about 40% of Hungarians andSlovaks answered that they were aware of this possibility. Of those who were aware, a solidmajority (between 64% and 82% of Slovaks, Slovenians and Czechs) believed that europayments occurred more frequently than it had been the case six months earlier. Also, theresults point towards some use of the euro for domestic payments by residents. When askedwhether only tourists were making payments in euro or whether both tourists and locals weredoing so, almost 70% of respondents in Hungary and Slovenia answered that both tourists andlocals were paying in euro, while in Slovakia the answers were balanced. These figures are incontrast to the Czech Republic, where about 62% answered that only tourists made payments ineuro.
Foreign currency holdings in percent of respondents
Source: Surveys conducted by the Oesterreichische Nationalbank.Note: Figures show the percentage of respondents that hold foreign cash.
EURUSD
H120022002H2
20032003H1 H2
2004H1
2004H2
2005H1
Croatia
0
20
40
0
20
40
H120022002H2
20032003H1 H2
2004H1
2004H2
2005H1
Czech Republic
0
20
40
0
20
40
Hungary
0
4
8
12
0
4
8
12
H120022002H2
20032003H1 H2
2004H1
2004H2
2005H1
Slovakia
0
20
40
0
20
40
H120022002H2
20032003H1 H2
2004H1
2004H2
2005H1
Slovenia
0
20
40
60
0
20
40
60
H120022002H2
20032003H1 H2
2004H1
2004H2
2005H1

61ECB
Review of the international role of the euroDecember 2005
B THE EUROIN THIRD
COUNTRIESIn the period under review, the euro continuedto expand some facets of its role as aninternational currency, while in other marketsegments a levelling-off has set in.
In particular, the share of the euro in the stockof international debt securities has continuedto gradually increase. Given the magnitude ofthe stocks involved, the increase of the euro’sshare in global bond markets is naturally avery gradual process. In other global markets,such as international loan and deposit marketsand the global foreign exchange market, theeuro showed signs of stability during theperiod under review.
With regard to the use of the euro ininternational trade, the increases seen inprevious years have continued in somecountries, while in others use appears tohave levelled off. In addition, the tentativefindings of the special focus suggest that theeuro does not exhibit some of the patternsthat are traditionally associated with vehiclecurrencies in international trade. Moreover,the robustness of institutional factors inexplaining the developments in the use ofthe euro in international trade confirms theregional pattern that characterises otheraspects of the internationalisation of the euro.
During the review period, the use of the euroas an anchor and intervention currencyincreased in a number of third countries. Thisphenomenon was increasingly observed in thenew EU Member States, in the EU accedingand accession countries and in other EUneighbouring regions, again suggesting thatinstitutional factors along with geographicproximity and strong trade links are importantdrivers of these developments. As regards theshare of the euro in official foreign exchangereserves, the available evidence remainslimited, in particular with respect todeveloping countries.
As far as the use of the euro as a parallelcurrency is concerned, evidence on netshipments of banknotes indicates that some
CONCLUSIONSstabilisation has set in. However, transfers ofeuro banknotes to and from the euro area couldalso have taken place through channels otherthan MFIs. The share of the euro in the depositsof third countries, on the other hand, hasincreased in most new Member States, EUacceding and accession countries and othercountries neighbouring the EU, confirming thegeographic focus of the euro’s internationaluse.

62ECB cReview of the international role of the euroDecember 2005
DATA SHEET
1) At constant 1994 Q1 exchange rates.2) Given the convention to account for both sides of each trade in foreign exchange markets, percentages add up to 200%, meaningthat the euro’s actual share, in total turnover is half the percentage reported in this key data sheet.3) Data refer to 27 countries and territories for which data are available for both 2004 and 2005, excluding Denmark, Sweden,Switzerland and the United Kingdom (which are shown in Table 20).
This review Previous review(latest data available)
The euro in international debt marketsShare of the euro in:– globally defined stock of debt securities1) 2005 Q1: 27.3% 2004 Q1: 25.6%– broadly defined stock of international debt securities1) 2005 Q1: 46.6% 2004 Q1: 43.2%– narrowly defined stock of international debt securities1) 2005 Q2: 31.5% 2004 Q2: 30.7%– narrowly defined issues of international bonds and notes 2005 Q2: 34.9% 2004 Q2: 36.1%
(gross issues at current exchange rates)– narrowly defined issues of international money market 2005 Q2: 37.1% 2004 Q2: 35.5%
instruments (gross issues at current exchange rates)– bond portfolio sample surveyed by The Economist mid-2005: 30% mid-2004: 27%– portfolios of funds under management in the United States and mid-2005: 0.7% mid-2004: 0.6%
Canada included in eMaxx database– portfolios of funds under management in non-euro area
Europe included in eMaxx database mid-2005: 26.2% mid-2004: 32.1%
The euro in international loan and deposit marketsShare of the euro in:– cross-border loans from euro area banks to non-bank borrowers 2005 Q1: 37.4% 2004 Q1: 37.9%
outside the euro area1)
– cross-border loans from non-euro area banks to non-bank borrowers 2005 Q1: 54.1% 2004 Q1: 54.1%in the euro area1)
– cross-border loans from non-euro area banks to non-bank borrowers 2005 Q1: 6.2% 2004 Q1: 4.9%outside the euro area1)
– cross-border deposits of non-euro area non-banks in banks 2005 Q1: 50.6% 2004 Q1: 51.1%in the euro area1)
– cross-border deposits of euro area non-banks in banks 2005 Q1: 51.5% 2004 Q1: 54.2%outside the euro area1)
– cross-border deposits of non-euro area non-banks in banks outside 2005 Q1: 8.4% 2004 Q1: 7.7%their country of residence excluding the euro area1)
The euro in foreign exchange marketsShare of the euro in:– total foreign exchange turnover2) April 2004: 37.2% April 2001: 37.6%– daily settlement with CLS2) 30 June 2005: 43% 30 June 2004: 44%
The euro in trade in goods and servicesShare of the euro in:– settlement/invoicing of exports of goods to non-euro area 2004: 44% to 63% 2003: 47% to 63%
residents of a number of euro area countries– settlement/invoicing of imports of goods from non-euro area 2004: 41% to 61% 2003: 40% to 60%
residents of a number of euro area countries– settlement/invoicing of exports of services to non-euro area 2004: 14% to 71% 2003: 16% to 70%
residents of a number of euro area countries– settlement/invoicing of imports of services from non-euro area 2004: 22% to 72% 2003: 20% to 69%
residents of a number of euro area countries
The euro in third countries– number of countries or territories whose exchange rate regimes were mid-2005: 50 mid-2004: 50
linked to the euro– share of the euro in global foreign exchange reserves end-2004: 24.9% end-2003: 25.3%
(as per new IMF methodology)– cumulative net shipments of euro banknotes to destinations outside June 2005: €55 billion June 2004: €46 billion
the euro area– total stock of euro-denominated bank deposits in June 2005: €68.0 billion June 2004: €57.9 billion
EU neighbouring regions3)

63ECB
Review of the international role of the euroDecember 2005
REFERENCES
Bacchetta, P. and E. van Wincoop (2005), “A Theory of the Currency Denomination ofInternational Trade”, Journal of International Economics, forthcoming, in press.
Bank of International Settlements (2004), Press release – Central bank survey of foreignexchange and derivatives market activity in April 2004, 28 September, Basel.
Bank of International Settlements (2005), Quarterly Review, December, Basel.
Bénassy-Quéré, A., B. Mojon and A.-D. Schor (1998), “The international role of the euro”,CEPII Working Paper No 98 – 03, July.
Black, S. (1990), “The international use of currencies”, in Y. Suzuki, J. Miyake and M. Okabe(eds.), The Evolution of the International Monetary System (Tokyo: University of TokyoPress), pp. 175-94.
Business Standard (2005), “Crude oil futures trade kicks off”, New Delhi, India, 10 February.http://www.business-standard.com/
Campa, J. M., L. Goldberg, J. M. González-Mínguez (2005), “Exchange rate pass-through toimport prices in the euro area”, NBER Working Paper 11632, September.
De Nederlandsche Bank (2004), “Currency practices in Dutch exports and imports (1975-2002)”, Quarterly March, pp. 50-55.
Detken, C. and P. Hartmann (2000), “The euro and international capital markets”, ECB WorkingPaper No 19, April. Published in International Finance, April 2000, Issue 3, Vol. 1, pp. 53-94.
Devereux, M., C. Engel and P. E. Storegaard (2004), “Endogenous Exchange Rate Pass-Throughwhen Nominal Prices are set in Advance”, Journal of International Economics, Vol. 63 (2),pp. 263-291.
Donnenfeld, S. and A. Haug (2003), “Currency Invoicing in International Trade: an EmpiricalInvestigation”, Review of International Economics, Vol. 11 (2), pp. 332-345.
Donnenfeld, S., and I. Zilcha (1991), “Pricing of Exports and Exchange Rate Uncertainty”,International Economic Review, Vol. 32 (4), pp. 1009-1022.
Dornbusch, R. (1987), “Exchange Rates and Prices”, American Economic Review, 77, pp. 93-106.
Energy Intelligence (2004), Understanding the oil and gas industries, New York, July.
Engel, C. (2005), “Equivalence results for optimal pass-through, optimal indexing to exchangerates, and optimal choice of currency for export pricing”, NBER Working Paper 11209,March.
European Central Bank (1999), “The international role of the euro”, ECB Monthly Bulletin,August, Frankfurt am Main, pp. 31-53.
REFERENCES

64ECB cReview of the international role of the euroDecember 2005
European Central Bank (2001), Review of the international role of the euro, September,Frankfurt am Main.
European Central Bank (2002), Review of the international role of the euro, December,Frankfurt am Main.
European Central Bank (2003), Review of the international role of the euro, December,Frankfurt am Main.
European Central Bank (2004), Press release – BIS Triennial Survey 2004, 28 September,Frankfurt am Main.
European Central Bank (2005), Review of the international role of the euro, January,Frankfurt am Main.
Friberg, R. (1998), “In which currency should exporters set their prices?”, Journal ofInternational Economics, Vol. 45, pp. 59-76.
Geis, A., A. Mehl and S. Wredenborg (2004), “The international role of the euro: evidencefrom bonds issued by non-euro area residents”, ECB Occasional Paper No 18, July,Frankfurt am Main.
Giovannini, A. (1988), “Exchange Rates and Traded Goods Prices”, Journal of InternationalEconomics, Vol. 24, pp. 45-68.
Goldberg, L. S. (2005), “Trade Invoicing in the Accession Countries: Are They Suited to theEuro?”, NBER Working Paper 11653, September.
Goldberg, L. S. and C. Tille (2005), “Vehicle Currency Use in International Trade”, NBERWorking Paper 11127, February.
Grassman, S. (1973), “A Fundamental Symmetry in International Payments Patterns”, Journal ofInternational Economics, May, 3(2), pp. 105-16.
Hartmann, P. (1998a), Currency Competition and Foreign Exchange Markets. The Dollar, theYen and the Euro (Cambridge: Cambridge University Press).
Hartmann, P. (1998b), “The Future of the Euro as an International Currency: A TransactionsPerspective”, Journal of the Japanese and International Economics, Vol. 12, pp. 424-454.
International Monetary Fund (2005), Annual report, September, Washington, D.C.
Johnson, M. and D. Pick (1997), “Currency Quandary: The Choice of the InvoicingCurrency under Exchange-Rate Uncertainty”, Review of International Economics, Vol. 5 (1),pp. 118-128.
Kamps, A. (2005), “The euro in international trade”, mimeo, European Central Bank.

65ECB
Review of the international role of the euroDecember 2005
REFERENCES
Krugman, P. (1984), “The international role of the dollar”, in J. Bilson and R. Marston (eds.),Exchange Rate Theory and Practice (Chicago: University of Chicago Press), pp. 261-78.
Krugman, P. (1987), “Pricing to Market when the Exchange Rate Changes”, in S. W. Arndt andJ. D. Richardson (eds.), Real Financial Linkages among Open Economies (Cambridge,Mass.: MIT Press).
McKinnon, R. (1979), Money in International Exchange (New York: Oxford University Press).
Magee, S. P. and R. K. S. Rao (1980), “Vehicle and Nonvehicle Currencies in InternationalTrade”, American Economic Review, Vol. 70 (2), pp. 368-373.
Nauschnigg, F. (2003), “The Use of Euro and Other Foreign Currencies in Central and EasternEurope: A Survey of the Austrian National Bank”, INFER Studies, Vol. 8, pp. 89-106.
Oi, H., A. Otani and T. Shirota (2004), “The Choice of Invoice Currency in International Trade:Implications for the Internationalization of the Yen”, Monetary and Economic Studies,March, pp. 27-64.
Platts (2005), “Platts adds euro prices values for key oil benchmarks”, Press Release, London,14 February. http://www.platts.com/Resources/Press%20Room/2005/021405.xml
Pringle, R. and N. Carver (eds.) (2005), RBS Reserve Management Trends, Central BankingPublications, London.
Rauch, J. (1999), “Networks versus markets in international trade”, Journal of InternationalEconomics, Vol. 48, pp. 7-35.
Rey, H. (2001), “International Trade and Currency Exchange”, Review of Economic Studies,Vol. 68, pp. 443-64.
Silva, J. A. (2004), “Determinants of the Choice of Invoicing Currency: From Guilders to Eurosin Dutch Goods Trade”, mimeo, CentER, Tilburg University.
Stix, H. (2001), “Survey Results about Foreign Currency Holdings in Five Central and EasternEuropean Countries”, CESifo Forum (3), pp. 41-48.
Stix, H. (2004), “Foreign Currency Demand Since 2002 – Evidence from Five Central andEastern European Countries”, CESifo Forum (4), pp. 19-24.
Swoboda, A. (1968), “The Euro-Dollar Market: An Interpretation”, Essays in InternationalFinance 64, Princeton University.
Tavlas, G. S. (1991), “On the International Use of Currencies: The Case of the Deutsche Mark,”Essays in International Finance 181, Princeton University.
Tavlas, G. S. (1997), “The International Use of the US Dollar: An Optimum Currency AreaPerspective”, World Economy, September, 20 (6), pp. 709-47.

66ECB cReview of the international role of the euroDecember 2005
Tokyo Commodity Exchange (TOCOM) (2005), http://www.tocom.or.jp/souba/all/index.html
Wilander, F. (2005), “An Empirical Analysis of the Currency Denomination in InternationalTrade”, mimeo, Stockholm School of Economics.
Yun, S.-H. (2005), “An Essay on Invoicing Currency Practices for Korean Exports”, Bank ofKorea Economic Papers, Vol. 8 (1), pp. 75-101.