Embed Size (px)
Citation preview

rpmsddef.doc
REVIEW OF THE LITERATURE ON REFERENCEPRICING *
April 14th, 2000
Guillem López-CasasnovasJaume Puig-Junoy
Department of Economics and BusinessResearch Center for Health and Economics (CRES)
Universitat Pompeu FabraTrias Fargas, 25-27, 08005 Barcelona (Spain)
ABSTRACTThis paper reviews the literature on reference pricing (RP) in pharmaceutical markets.The RP strategy for cost containment of expenditure on drugs is analyzed as part of theprocurement mechanism. We review the existing literature and the state-of-the-artregarding RP by focusing on its economic effects. In particular, we consider: (1) theinstitutional context and problem-related factors which appear to underline the need toimplement an RP strategy; i.e., its nature, characteristics and the sort of health careproblems commonly addressed; (2) how RP operates in practice; that is, how third party-payers (the insurers/buyers) have established the RP systems existing on the internationalscene (i.e., information methods, monitoring procedures and legislative provisions); (3)the range of effects resulting from particular RP strategies (including effects on choice ofappropriate pharmaceuticals, insurer savings, total drug expenditures, prices ofreferenced and non-referenced products and dynamic efficiency; (4) the market failureswhich an RP policy is supposed to address and the main advantages and drawbackswhich emerge from an analysis of its effects. Results suggest that RP systems achievebetter their postulated goals (1) if cost inflation in pharmaceuticals is due to high pricesrather than to the excess of prescription rates, (2) when the larger is the existingdifference in prices among equivalent drugs, and (3) more important is the actual marketfor generics.
Keywords: Reference Pricing, Pharmaceutical Expenditure, Generic Drugs, Drug Patents.
(*) Funding for this paper was provided in part by an education grant from Merck & Co., Inc.,Whitehouse Station, New Jersey, USA, which also supported an international research meeting held on14-16 December 1998 at the Pompeu Fabra University in Barcelona, Spain. The paper and others werediscussed at this research meeting which was chaired by Professor Bengt Jönsson of the StockholmSchool of Economics, Sweden. We are also indebted to Lluís Segú, Josep Darbà and Zoé Fairtlough forproviding bibliographic references.

2
1. INTRODUCTION TO THE REFERENCE PRICINGLITERATURE
The purpose of this paper is to assess the status of the literature on reference pricing(henceforth referred to as RP). We identify several studies, either published in the healthand economics journals or under the Working Paper format, since the introduction of RPin 1989 till the end of 1998. Studies were found searching different computerizeddatabases, and examining partial review papers, as well as from personal bibliographiesand contacts. The review also includes papers published in journals, book chapters, assome working papers and technical reports. Short papers only expressing author’s viewswithout any evidence and short paper news (such as those appeared in Scrip magazine)were excluded of the study. A total of 45 studies have been identified according to theinclusion criteria [1-45].
1.1 CLASSIFICATION OF THE LITERATURE
The papers are classified using four descriptive criteria.First, the type of journal in which the study has been published, or any other
identification on the publication source (chapter books, academic working papers andprivate or governmental technical reports).
Second, the country the RP system is referring to. We limit our attention to thosecountries which introduced a RP system during the period.
Third, the type of study, according to three different categories:(a) studies which provide descriptive, institutional and policy details on the
countries’ implementation strategy of RP;(b) studies which include some sort of modeling of the pharmaceutical and health
services market on which RP effects can be observed and tested; and(c) empirical studies which describe the results from the introduction of the RP
policy once in place.Of course, many papers may involve a non-proportional mix of these three approachestoo.
And, fourth, we consider the particular area of the empirical studies:(a) expenditure, volume and prices of pharmaceuticals;(b) health outcomes and other related effects; and(c) dynamic effects and others.
Studies have been grouped according to journal types. Half of the total number of studies(22) were published in scientific journals: 6 in clinical journals, 5 in health policyjournals, 10 in health economics journals, and only one in economic (non-health)journals1. Another important part of the RP literature comes from academic workingpapers and papers presented at conferences2. The remaining are technical reports financed bygovernments and private firms. With regard to their contents, more than half of the studies
1 This is the case despite the fact that RP can be understood as a procurement measure. Clinicaljournals: Canadian Journal of Cardiology (3), Canadian Medical Association Journal (2), and NewZealand Journal of Medicine (1). Health policy journals: Health Policy (5). Health Economics: HealthCare Financing Review (1), Pharma Pricing Review (2), and PharmacoEconomics (7). Economic (nonhealth) journals: Journal of Regulatory Economics (1).2 - They represent a 27% of all studies. These papers may end in journals too.
3
consist of institutional descriptions and limited reviews of country specific RP strategies(26 studies), and only 5 examine RP in the grounds of some sort of theoretical model. 21empirical studies identify the impacts of RP, but none of them explore the dynamic effectsof RP, say on I&D. Most part of the empirical studies (18 over 21) analyze the effects onexpenditure, prices and consumption; few (7) intend to quantify health outcome andrelated effects.
1.2 THE FOCUS OF THE ANALYSIS
As explained above, the first thing one should notice is that the bulk of the RP literature ismainly descriptive3. This is an important limitation of the existing research on RP, sinceits empirical effects cannot be universally applied, thereafter, in absence of a commontheoretical framework. Although dual pricing economics may provide this basicframework for RP modeling, few papers seem to base their research on this approach4,with the notable exception of Danzon and Liu’s contribution [10]5. Only this paper, andthose of Zweifel and Crivelli [45] and Woodfield et al [42], estimate the effects of RPand the behavior of the agents using a theoretical model of the pharmaceutical and thehealth services market6. One of the possible difficulties in order to fully incorporate RPin the optimal health insurance literature may be the fact that quality and informationproblems are here crucial in order to capture the nature and the effects of several RPschemes.
The second important limitation of the RP empirical literature is that it does not allow fora clear-cut identification of the effects of RP in isolation from other regulatory policies orinfluential factors. Most of the empirical studies often present simple after and beforecomparisons which are not much useful to obtain valid conclusions on the effects of RP7.The difficulty to isolate RP effects from other regulatory measures or external factors ismainly due to the following features: (i) at any given point in time, it is very hard toisolate RP effects of the results derived from other policies on health expenditure control;(ii) RP strategies in health care overlap with changes in the social and economicscenario. This makes particularly implausible the ‘ceteris paribus’ assumption inassessing the long-term effects of the RP policy; (iii) finally, the lack of measurement of
3 - Descriptive status, the quasi absence of theoretical models and limitations derived from the ‘beforeand after’ methodology are, probably, the main reason to explain why only few RP papers have appearedtill now in leading international journals.4 The most favored-customer rule also may provide some useful insights on the industrial economicseffects of RP. See F. Scott Morton [46, 47].5 Their theoretical analysis uses a model of physician decision-making under assumptions of imperfectagency. This is the case despite the fact that its results are not fully taken into account in the empiricalestimation on the effects of the German regulatory initiatives to control pharmaceutical expenditure.6 - Danzon and Liu [10] predict price responses to RP according to a kinked demand model in thecontext of a model of physician decision-making under the assumption of imperfect agency. Zweifeland Crivelli [45] concentrate their analysis on market reactions to RP by pharmaceutical firms in thecontext of a Bertrand duopoly model (in which each producer chooses its price, instead of quantity, andassumes that the other will not change the price level). And Woodfield et al [42] discuss RP impactadapting a simple model of an oligopolistic pharmaceutical market developed by Johnston andZeckhauser [48], where the firms engage in Bertrand price competition (the market determinesquantities). In their model exist differentiated products, firms have identical costs and face identicaldemand functions.7 - As Roberts [29] states: “Such studies can attribute all changes in dependent variables to policychanges, when they can equally well be due to other short or long run social and economic trends”.
4
some indirect effects (both complementary and substitutive to the drug expenditure effect)produced by RP (on primary care, pharmaceutical employment, etc.) may bias theestimation of RP policies. Consequently, observation of changes before and after theintroduction of RP policies does not provide enough evidence from which to drawconclusions as to the effects of RP.
In fact, from a methodological point of view, and with regard to RP’s impact onpharmaceutical expenditure, one can draw a further distinction for the purpose of theanalysis (i) changes which affect the average rate of expenditure increase (for instance,before and after the introduction of RP); (ii) changes which produce a one-off saving,with a shift, say, in the expenditure line without affecting the rate of increase (i.e.gradient); (iii) perverse changes, when the expenditure, after a once-for-all saving, riseseven at a higher rate; and (iv) successful reforms with a one-off saving and a reduction ofthe expenditure growth once RP is implemented.
Descriptive and empirical literature has concentrated in the experience of the Europeancountries which first introduced RP. It is the case of Germany, Netherlands and Denmark.Amongst them, the German case offers a more accurate arena, since the introduction in1989, for evidence on RP (44.4% of the empirical studies are devoted to this Germanexperience), although an increasing number of bibliographical reference related to theother countries is there too8.
1.3 THE MAIN TOPICS
The subject of the literature has mainly focused on the impact of RP on the followingtopics: (a) pharmaceutical expenditure, drug consumption and prices; (b) health effectsand other related impacts; c) physician choice; (d) dynamic efficiency; and (e) overallwelfare effects. However, in assessing RP as a whole from a health policy point of view,and not just as a health expenditure mechanism, we have to consider which sort of drugmarket is substituting: was there a pre-existing market of generics working on acompetitive basis?. Do exist a ‘basic package’ for health care in a social insurancemechanism where RP may fit in?. Is there an already existing consumer’s culture onwillingness to pay for additional amenities?. In our view, the answer of these questionsmay provide the relevant k-factors to understand the success or failure in theimplementations of RP policies.
We plan to offer to the reader in the following sections a review of the internationalexperience on the market responses to RP. We will assess its overall impact onpharmaceutical expenditure, drug consumption and prices, on the innovator’s price,dynamic efficiency, on physician choice, competition and welfare. However, in doing sowe will take a broad view of the pharmaceutical sector. In this sense, the role of drugswill be seen in the context of the health care sector, bearing in mind the relevance ofinnovation for the long term productivity and efficiency of the entire health care system.
2. REFERENCE PRICING IN CONTEXT
8 - Complementary bibliographic references, classified by country and author, are included at the end ofthe paper.
5
We outline here the major features of RP systems, and the institutional background whichseems to favor RP as one of the preferred strategies for drug expenditure control.
2.1 DEFINITION AND OBJECTIVES
What does reference pricing mean in pharmaceutical markets? Despite the basic feature(a system where a buying agent decides on a reimbursement price and then theuser/patient or insurer pays the difference if the chosen medicine is more expensive),reference pricing differs in details and scope [10, 11, 26, 44]. Since the introduction ofRP in Germany in 1989, reference pricing schemes have been applied in some othercountries such as The Netherlands, Sweden, Denmark, New Zealand, Poland, Slovenia,Spain, USA, British Columbia (Canada), Italy and Australia. However, these schemesreveal significant differences.
The goal of RP seems to be the control of third-party expenditure on prescription drugs,not the limitation of overall pharmaceutical expenditure. By limiting the level of publicreimbursement, RP aims to reduce the price of referenced products, either through (i) arelative decrease in the demand for highly-priced products (a demand-side approach) or(ii) cutting drug prices by encouraging self restraint (a supply side approach) oncemanufacturers face the threat of losing markets. Other issues may also be involved, suchas the concern about the appropriate use of drugs, but in a less explicit way.
Two related conditions are important here. The first has to do with the possibility ofpromoting price competition in the drug market9: this is, as a result of RP, firms shouldprice products around the reference price. The second relates to the chances to achieve amore cost effective approach to prescription by increasing cost consciousness in puttingfinancial pressure on consumers and/or drug prescribers.
2.2 INTERNATIONAL EXPERIENCE
At any rate, a common factor leading to the introduction of RP has been the concern ofthese countries about the relative impact of pharmaceutical expenditure on public funds.However, the factors explaining this situation differ. For instance, Germany, with thehighest European per capita level of drug expenses in 1989 (the RP implementation year),seems to show a problem with prices of drugs more than with consumption. In fact,German expenditure captures the impact of a very high weighted average prices fordrugs10, but a middle of the range prescription rates (per capita and per year). TheNetherlands offers a similar profile on prices (very high pharmaceutical prices), but has arelatively low prescription rate (one third of the German level). Northern Europeancountries do not currently reveal a clear trend in pharmaceutical cost inflation: thepressure on public funds at an age of economic stagflation seems to be the problem.In addition, a different public versus private share of expenditure, and financing mix ofprices and taxation (see Table 1), make a different impact, at least in welfare terms, fromthe resulting cost shifting towards consumers.
9 “When circumstances allow, reference prices should be preferred to price controls, to the extentthat they spur, rather than stifle, competition” , page 17, European Commission, [49].10 With a high VAT incidence (around 13%).
6
Most of the countries first to introduce reference pricing share three significant features.First, before introducing RP, these countries did not directly regulate the price ofmedicines (free pricing prevailed). This was the case of Germany, Denmark and NewZealand. Second, generic products in these countries already accounted for a significantshare of the market: in Germany they represented 16.1% of the total retail pharmaceuticalmarket in 1995 [26]. The comparable figure for Denmark was 22%, and 12.6% for TheNetherlands. Third, as can be seen in Table 1, public purchasing accounted for more thanhalf of the pharmaceutical sales: 64.2 % in The Netherlands, 71.4 % in Germany, 71.2 %in Sweden, 58.8 % in New Zealand, and 50.5 % in Denmark.
[Table 1]
The main features of the international experience of reference pricing policies aredescriptively summarized in Tables A1 to A7 for Australia, British Columbia, Denmark,Germany, The Netherlands, New Zealand and Sweden. The descriptive aspects reviewedinclude11:
- the main supply conditions for medicines,- the date of introduction of each scheme,- the types of drugs covered by the initial and subsequent versions of each scheme,- the method of calculating the reference price and the method for grouping each class ofdrug,- how often the list of drugs included in each system is updated, and how frequently thereference price for each class of drug is revised;- the measured impact of each scheme on prices and on the use of generic drugs,- the measured impact of each scheme in the mix of innovative (patented) drugs andgeneric drugs in each market,- the expected savings to the government drug budget identified by government at theannouncement or launch of each scheme, and- the actual impact of each system on total government expenditures on drugs.
Reference systems reviewed show significant differences in their product coverage: levelof equivalence (chemical, pharmacological and therapeutic) and inclusion or exclusion ofpatented drugs. A simple characterization of existing reference price systems according toproduct coverage is presented in Table 2. Sweden and Denmark apply the referencesystem only to identical products with the same active substance (level 1). BritishColumbia and Australia reference systems cluster drugs from a group of related butdifferent drugs, regardless of indication, including patented drugs. However, othercountries like Germany, New Zealand and The Netherlands have extended productcoverage to all classes used to treat a particular condition. Germany excluded patenteddrugs from the reference coverage in January 1996. Exceptions at the patient level havebeen put forward in British Columbia, Denmark and Sweden, in order to manage theproblem of heterogeneity at the individual level.
[ Table 2 ]
11 This Section updates Gross and Fortescue (1997), Section 2.

7
3. ECONOMICS OF REFERENCE PRICING
3.1 JUSTIFICATION
What distinguishes the market for pharmaceutical products and creates the need forestablishing reimbursement ceilings such as those implied by a RP scheme? Thepharmaceutical industry differs from other industries in several important respects [50].Some of the most important ones are agency imperfections, information imperfections,moral hazard, and global, sunk, fixed costs. In short, pharmaceutical market imperfectionscreate: (i) a reduced price sensitivity on the demand side; (ii) a certain degree of marketpower on the supply side; and, (iii) demand curves that do not reflect true social benefits.Pharmaceutical demand is stronger and less price-elastic than it might otherwise be. Thereasons are the price insensitivity of consumers, especially when their drug expendituresare reimbursed by public or private insurers. Insurance tends to encourage over-use,higher prices and therefore welfare losses.
On the supply side, patents allow for substantial price discretion to the innovator firmsproducing new drugs. However, new products can be complements or substitutes forrivals’ products. Firms face competition, first via R&D to discover new products andthen after their discovery, via pricing and marketing strategies for gaining market share. Infact, drug companies are in a oligopolistic market typified by a limited number ofcompetitors (especially in sub-markets such as the cardio-vascular or the gastric-duodenal ulcer markets), differentiated products and strong innovation strategies, etc.[50]. In such a context, demand curves may not reflect the social benefits.
In addition, agency and imperfect information issues, together with supply side problems,may result in pricing power, even when patent protection has expired. Indeed, after patentexpiration, the expected outcome from generic entry is an increase in price competitionand lower prices for brand name drugs. In the long run, it may be reasonable to expectthat competition will push generic drug prices down to a level approaching the marginalcost of production12. In practice, the so-called “generic paradox” expounded by Scherer[50] hold true: average prices for brand name products have tended to increase followingentry by generics13. Evidence shows a high degree of brand loyalty for pioneeringbrands: the result is that brand names are able to retain large market shares relative tolower-priced generic entrants after the patent expires14. Despite high rates of lower-priced generics, in some cases brand producers have continued to increase prices at anaverage rate that exceeds general inflation. Several authors observed that ‘several firms’products had prices more than 50 percent greater than the minimum and still had asignificant share of the generic market’. Frank and Salkever [54] also concluded that‘increased competition from generics was not accompanied by lower prices of brand-
12 Generic drug producers compete largely with one another on the basis of price: “Prices follow aCournot-like path, approaching marginal cost as more firms enter” (P. Temin, 1991, in Commentsand Discussion to [52]).13 “The most common scenario, then, is for the incumbent to maintain or increase its price, whileceding a substantial share of the market to much lower-priced generic rivals” [50, , p. 101].14 “Pharmaceuticals represent an extreme on two of these dimensions - the difficulty of judgingquality in advance of consumption, and the risk of bad choices - and as a result, first-mover brandimage advantages significantly supplement patent protection as barriers to rapid imitation” [53,page 372].

8
name drugs; on the contrary, evidence suggests small price rises tied to expandedcompetition’. This may be the case despite the fact that a positive correlation is notalways found between generic entry and brand-name price levels.
The “generic paradox” may be observed as an expression of brand loyalty. According tothe Schmalensee model of first-mover pricing advantages, “the image advantage thatcomes from consumer recognition as the first mover in some product category maypermit its possessor to hold prices above costs for significant periods of time whileretaining a large share of the relevant market” [55, page 585]. Thus first-moveradvantages confer pricing power in the pharmaceutical market. The first mover advantagealso appears to hold true for the first generic entrant, which is able to retain a substantialmarket share with a higher price than later generic entrants. The relative quality of theproduct of the first mover is more a consumer perception than an objective standard(product image); higher perceived quality may lead to prices above those of competitorsand allow the company to hold on to a substantial share of the market.
Frank and Salkever [51] provided a market segmentation model to explain the priceresponse to generic entry of brand-name products. Their price discrimination modelsuggests that entry of generics leads price-sensitive buyers to shift to generics, leavingonly price-insensitive buyers to purchase brand-name products. Thus brand-nameproducers’ demand becomes less elastic, “allowing the profit-maximizing brand-namefirm to raise its price” [54, page 77].
Reasons that confer pricing power on the innovating firm are: (i) imperfect agencybetween the physician (the agent) and the insurer (the principal). The prescriber mayprefer the brand name product in which, he has gained experience during the period ofpatent protection (risk averse physicians); (ii) the patient, and sometimes the physician,may have imperfect information as to whether a lower priced product meets the quality ofthe extensively tested pioneering drug; and (iii) lack of incentives to change prescriptionhabits (moral hazard). Hellerstein [56] observed that there are potentially large socialcosts from prescription of trade-name drugs after patent expire which cannot be explainedby patient-specific characteristics. This is, “when physicians make prescriptiondecisions based on incomplete information combined with agency problems, they donot make cost-effective decisions” [56, page 130].
Public expenditure control efforts to reduce pricing power after patent expire thereforeseem to require incentives to prescribers and dispensers in order to substitute lower-priced generics for brands. Managed care organizations, as well as more price sensitivebuyers in the market may help to achieve this purpose too. In this context, RP may bejustified on the grounds of reducing the welfare losses involved in choosing moreexpensive drugs when appropriate low-priced substitutes are available.
3.2 REFERENCE PRICING AS A PROCUREMENT MECHANISM
One should first note that RP strategy is characterized by five features:
1. The third-party payer (public or private insurer) directly sets a ceiling for the amountreimbursable to the manufacturer for a prescribed pharmaceutical product. In this sense,RP success requires the exercise of a relative purchasing power from the insurer’s side.

9
2. RP is equivalent to setting a co-payment which: (i) implies a variable amountdepending on the price of the selected drug; and (ii) may be avoided if the drug does notexceed the reference price.
3. Identical reimbursement ceilings are defined for groups of pharmaceutical products.‘Clusters’ of pharmaceuticals are defined in terms of their interchangeability. This maybe interpreted more strictly or loosely depending on chemical, pharmacological ortherapeutic equivalence. Clusters may or may not include patented products.
4. For the reimbursement ceilings the insurer usually applies the observed domesticprices of the products included in the same cluster or group as a benchmark15.
5. These reimbursement ceilings are adjusted periodically by an adjustment factor whichmay or may not be previously announced. In many cases this factor is not exogenous to theprice behavior of the benchmark product(s) or to the price of new products included inthe same group. The concept of interchangeability and the selection criteria for setting theselect the reference price are reviewed every few years and changed where necessary.
A second point well worth noting is that RP implies a reimbursement limit, not a finalmarket price. Reference pricing is not, strictly speaking, a pricing system. Rather it isonly a reimbursement or procurement mechanism: the third-party payer establishes themaximum “reasonable” price he is willing to pay. The supplier is allowed to set a marketprice above the reference price if he believes that the patient will be willing to pay thedifference. In spite of this, as noted by Drummond et al [12], pricing and reimbursementdecisions are conceptually linked: reimbursement decisions (inclusion or exclusion, orthe extent of reimbursement) are dependent on the price, but price changes or theintroductory price of a new product are also dependent on the reimbursement. However,in practice, the influence of RP on firm pricing may be very strong if firms are led to setmarket prices at the reference level. In this case, it is not only a reimbursement controlbut, some authors argue, also a price cap in all but name.
The influence of RP on market prices depends on the power of the buyer, the own pricedemand elasticity, cross-price elasticities for pharmaceutical products, and how wide thesystem’s coverage is. The most favorable circumstances under which the reference pricewould virtually constitute a price cap are where there is a large buyer, wide productcoverage and a high demand elasticity.
Differences in existing RP schemes may obscure, however, the difference between apricing and a reimbursement system. Reference pricing may become a pricing systemwhen the decision to include or exclude a product from public reimbursement depends onits price level. The use of reference pricing in Italy and New Zealand may illustrate thissituation. Italy introduced a stringent reference pricing system in July 1996. This was aspecial case because the reimbursement ceiling immediately set the maximum price sincepatients had to pay the full amount for drugs which were priced above the reference price
15 Thus, in a restricted sense, reference pricing would be similar to a yardstick competition mechanism,without considering the existence of the avoidable co-payment. The yardstick competition is aregulatory pricing policy in which the average cost of all competing firms is used to determine the pricelevel in order to induce the firms to engage in cost-cutting innovations. The Prospective PaymentSystem to hospital in United States is an application of yardstick competition.

10
rather than simply the difference16. Only the cheapest product in the group of identicaldrugs are reimbursed. Products with prices above the reference (cheapest) value aredelisted (i.e. receive no public reimbursement). However, practically all companies havenow agreed to cut prices, to avoid de-listing. Thus Italian reference pricing policyeffectively excludes patient co-payment and the possibility of selecting a drug pricedabove the RP since there are very few patients around who are prepared to meet thewhole cost out of their own pockets. In New Zealand, Woodfield et al [42] report thatreference pricing appears to involve listing a new drug in a given cluster only if its priceis set below that of the currently reference-priced product.
The basics of the RP approach are as follows:
We call Pr the reference price, Pc the price faced by the consumer, Pl the price chargedby laboratories and k the existing co-payment percentage17. Two cases are possible:Case 1: If Pl1 < Pr, Pc is set at kPl.Case 2: If Pl2 > Pr, Pc is set at Pl-Pr+kPr.
The implicit unit subsidy in each case is T1 =(1-k) and T2= (Pl2-Pc)/ Pl2 = Pr(1- k)/ Pl2 .Since Pl1 < Pl2 and Pl2 > Pr, T1 will compare with T2 according to k and Pr. That is, theper product net subsidy is larger the lower the difference between Pr and Pl2 , and thelower co-payment k.
From a welfare point of view, at an equal amount of public subsidy, it will be noted thatreference pricing replaces an ad valorem subsidy. Before this, the amount of the publicsubsidy depended on commercial prices, whereas in RP the subsidy is bounded by (1-k)Pr, a limited amount that does not depend on the Pl. However, this new approach stillcan be considered Pareto inferior to a lump sum voucher system.
Notice, in addition, that RP will have the desired effects on drug expenditure controldepending on the exact level of the set prices. When Pr is the lowest price in thetherapeutical subgroup and no interchangeability between subgroups occurs (say througha different treatment or condition classification), savings will appear.
This may be the case of the new Spanish RP Bill: For each homogeneous set of products,Pr is calculated on the weighted average (year on year) of the lowest-priced productswhich account for at least 20% of the market sales. If the difference of this calculatedprice and the highest price for the group is less than 10%, Pr will be the result of applyinga 10% reduction to the highest price (thus achieving at least a 10% saving). If thedifference between the calculated price and the highest priced product is more than 50%,Pr is recalculated to amount exactly the 50% of the highest priced product (thus foregoingsome potential savings). In all the cases, Pr never will be less that the generic with thelowest price.
Otherwise, products already priced at below benchmark prices may take advantage ofincreasing their prices at no consumer cost. This increase may or may not be offset bypotential savings arising from greater pressure on drug companies pricing over reference
16 According to our definition of reference pricing, the Italian system is not a pure reference pricingsystem.17 Although a k parameter depending on (Pl-Pr) might be postulated too.
11
price levels. This ultimately depends on the price elasticity of demand for their productsand the prevailing product differentiation policy18. This issue may affect whichcompanies enter the market since only low cost (and perhaps poor quality) productsinvolving low R+D overheads may prove commercially attractive under such a scheme.
In addition, if savings have to be shared by some other agents, as is the case in TheNetherlands for drug dispensers, this will further reduce the amount of savings. InNorway reform is being considered to strengthen incentives to prescribe the cheapestdrug available. This is done through a central electronic database. Therefore, thepharmacist should provide the cheapest brand or a parallel imported version of theprescribed brand unless the prescription states otherwise. This reform can usefullycomplement the RP system introduced in 1993 which uses the price of the cheapest brandavailable. Moreover, the system is to be extended from March 1998 to patent protecteddrugs but parallel imported or manufactured under license at a lower price [38].
A third relevant feature is that of RP as an avoidable co-payment. In contrast withpositive or negative lists, the choice of medicines available to the patients and theirphysicians is not restricted. If a doctor prescribes a product that is more expensive thanthe fixed payment level, then the patient will pay the difference.In the case of differential co-payments, doctors must tell the patient if he wishes toprescribe a product that requires the co-payment [58]. Since doctors dislike discussingthis, they frequently choose a product at or below the fixed level. If there is a discussionwith the patient, the patient often selects a product which does not involve co-payment[57]. This reimbursement mechanism is intended to make patients more aware of costsand to promote the rational use of ‘similar’ or interchangeable medicines.In the context of a public decision maker with the objetive of maximizing health returns(e.g., quality adjusted life years, -QALYs-), the ceiling on the drug reimbursement levelcould be interpreted as the use of a decision rule based on the maximum price the insureris prepared to pay to gain one unit of “health” and thus lead to budgeting decisions.However, this equivalence of reference pricing with a social decision rule dependsheavily on the appropriateness of treatment and measurement of effectiveness implied indrug interchangeability. At the same time, avoidable co-payments can sometimes becomeunavoidable if drugs clustered in the same group are not ‘perfectly’ interchangeable for aspecific patient and depending on the pricing strategies adopted by the companiesmarketing these products [41].
A fourth basic aspect is that of the concept of interchangeability.- Reference pricesystems observed in the international arena present remarkable differences in theproportion of the pharmaceutical market or sub-markets covered, according to theequivalence criteria selected, and the exclusion/inclusion of patented drugs. In thissection we review reference price systems according to the equivalence criteria used andthe policy in relation to patented drugs.
18 Another alternative co-payment scheme may be based on a fixed price per item and a percentage co-payment which decreases according the distance between Pl and Pr. In addition, whenever there is astop-loss co-payment, the deterrent effect of Pr will depend not just on prices but also on the amount ofdrugs (full bill). In this sense, holding the fixed per item price may avoid the perverse incentives whichwould otherwise exist.
12
There are three levels or criteria of interchangeability (equivalence) observed in the useof reference price schemes: chemical, pharmacological and therapeutic equivalence [12,21]. The first level corresponds to establishing groups with the same active ingredient.All products included here are patent-expired drugs, usually clustering generics andbranded products after the patent ends. The second level clusters products in the sametherapeutic category (drugs with pharmacological and therapeutically comparable activeingredients), for instance, angiotensin-converting enzyme (ACE) inhibitors. The thirdlevel clusters products with the same therapeutic function, such as, for instance, all anti-hypertensives. Level two and three may include or exclude products under patentprotection.
The issue of lack of equivalence or interchangeability between drugs included in the samegroup (heterogeneous clusters) probably constitutes the most controversial issue in theliterature on reference pricing. Zammit-Lucia and Dasgupta [44] stated that the conceptof interchangeability between drugs cannot always be objectively defined, and as a resultit varies from country to country, and can be considered a bureaucratic concept, not amedical one. If the groups include drugs with different dosages, as it is the case in Italy, itimposes a penalty on low dose drugs because their price, expressed in cost per mg. oftherapeutic agent will be higher than that of higher dose products [26].
Three questions arise in relation to heterogeneity in the same group of medicines19. First,what are the main forms of potential heterogeneity between medicines grouped with onesingle common and uniform reference price? Secondly, does the degree of potentialheterogeneity differ between levels of interchangeability? Thirdly, what are the expectedeffects of heterogeneity in the same group of medicines?
We may distinguish, therefore, different cases:1. Individual patients have physiologically different responses to the administered drugs.Heterogeneity between medicines with the same level and price reference group maystem from [21]:- differences in drug quality (e.g., the presence of impurities);- performance (speed of absorption, indications, effects);- differences in the chemical preparation of drugs (e.g., structural formula, molecularweight and dissociation constant, which may result in different indications);- differences in application form (e.g., oral, topical, rectal or parental, which may implysignificant differences in production costs);- differences in power/dosage form (weak, medium, strong dosage);- differences in bio-availability (fast/slow action; retard; half life);- differences in the number and type of admitted indications;- differences in the type and frequency of unwanted effects;- differences in side-effects (contra-indications);- differences in additional services provided by the pharmaceutical entrepreneur
(breadth of range, therapy-supporting services provided).
If not adequately considered, these sources of heterogeneity between groups of medicinesin the same category and price may lead to differences in effectiveness and in the cost ofproducts as a result of applying uniform reimbursement.
19 This Section is mainly based on Maassen [21].

13
2. The degree of potential heterogeneity differs between levels of interchangeability. Asdescribed, the first level is the more homogeneous group. In this sense, for instance, theCanadian Cardiovascular Society [5] considers reference pricing appropriate (‘insituations of constrained resources’) for drugs which have identical active ingredientsand are therapeutically interchangeable for a specific disease. However, no significantdifferences in absorption, bioavailability, efficacy, safety or tolerance are expected ingeneric and non-generic products with identical bio-active ingredient and formulation.But even when the active ingredient, can be the same, Maassen [21] has reported thepossible wide variations stemming from differences in chemical preparation, bio-availability and performance.
Diversity among patients is always a complex issue, particularly when the unit of analysisis a broad patient category, as it usually the case of second and third levels ofequivalence.Differences between medicines are greater at the much less homogeneous second andthird levels. Medicines with different active ingredients may differ in performance,effects, absorption, contra-indications, undesired effects and all other sources ofheterogeneity20, 21.
3. What are the expected effects of heterogeneity in the same group of medicines? Threedifferent kinds of arguments have been highlighted in the literature. First, if there is nointerchangeability at the level of the individual patient, as commented, then the co-payment may become not avoidable and the reference price system may discriminateagainst some patients22. Second, selection of a drug under a RP category may result in alower level of effectiveness and potentially harmful side-effects for the patient becausethe drug is chosen simply with a view to avoiding the co-payment. This in turn mayinvolve increased expenditure on other complementary health care services or evenadditional drugs. Third, the adoption of a single price for drugs with reducedinterchangeability may distort competition between products and discriminate againstparticular firms23. In particular this may prove to be the case at levels 2 and 3 since thepatient’s willingness to pay may not adequately reflect a fully informed preference for theadditional benefits obtainable by choosing a product priced above the referencebenchmark.In addition, using a single reimbursement level may also imply that even where significanttherapeutic differences exist, the insurer may place greater importance on his budgetconstraints than on the potential additional health benefits conferred by choosing a moreexpensive drug. This does not distort competition by itself; but it recognizes a sort of
20 The Canadian Cardiovascular Society [5] only accepted the application of reference price systems atthese levels if supported by level 1 medical evidence (Sackett criteria). Maassen [21] observed furtherheterogeneity problems in Germany at levels 1 and 2 arising from: (i) from the inadequacy of theaverage daily dose (ADD) concept (different opinions on the ADD, existence of ADD ranges,differences between initial and maintenance ADD, varying ADDs according to indications); and (ii) fromthe co-existence of level 1 and level 2-3 reference price groups with different price levels21 “If the active ingredient in a level I reference price group on the one hand and the active ingredients inthe level II or III reference price group on the other hand are therapeutically comparable, differentreference prices will apply in spite of a comparable performance of the active ingredients which shouldbe rewarded with the same reference price” [21, , page 10].22 As an example, Zammit-Lucia and Dasgupta [44] cite the case of patient suffering intolerable adverseeffects from one calcium antagonist, but tolerating another, both being included in the same group.23 “The basic principle of equal treatment -’like price for like performance’- is violated” [21].
14
buyer’s right to limit willingness to pay and to establish priorities as a resourceallocation mechanism in order to improve efficiency. Thus, in theory, the patient -or thephysician acting on their behalf- has to decide if he is willing to face a co-payment inorder to obtain additional health benefits. In the case of perfect information abouteffectiveness, costs borne by the patient would be the measure of the willingness to payfor extra benefits above those of the benchmark product of the group. This will happenwhen the expressed insurer’s marginal willingness to pay is lower than that of the leasteffective financed service. However it should be noted that patients are not privy toperfect information regarding therapeutic effectiveness. Indeed, perceptions may bedistorted since RP encourages the belief that all products clustered in the same group areperfectly interchangeable24 and hence equally effective. Providing information aboutadditional benefits and co-payments impose costs on the physician side. As a result, pricedemand elasticity would be higher than in the case of perfect information as additionalbenefits above the reference benchmark are assigned little importance. Furthermore, theprice elasticity of a pharmaceutical product faced by the manufacturer depends on thedifference between the market price and the reference price, which only represents anarbitrary proportion of the whole price if there is no perfect interchangeability. Ingeneral, RP systems have responded to these problems by increasing the number ofgroups (trying to reduce heterogeneity in the same group) or by considering specialsafeguards to the mechanism at the patient level25.
In brief, we have identified two sorts of problems arising from heterogeneity amongclustered drugs (“the costly consequences of assuming all patients are the same”, inLooney’s words, 1997), particularly important in level 2 and 3 groups. First, clusterheterogeneity may produce unjustified inequalities between patients if the referencesystem fails to accommodate differentiation at the individual patient level. Second,heterogeneity may lead to inefficiencies when there is additional imperfect informationinvolved in considering differences with respect to the benchmark product in the group.This may increase other health care costs, lower health and distort competition in thepharmaceutical market. Health policy, and not just health expenditure control, matters.
A fifth relevant aspect of RP is the treatment of drugs under patent protection. InitiallyGermany included patented drugs, but later on (January 1996) they were exempted fromRP. In other countries like Denmark and Sweden the system covers only products withexpired patents and generic equivalents. Maassen [21] points out that RP applied topatented drugs produces an economic erosion of patent rights by lower performing in thesame reference price group26.
The literature unanimously agrees on the potential negative incentives for pharmaceuticalinnovation when patented products are covered by RP. If this is the case, companies will
24 Note that the argument applies to additional imperfect information induced by the reference pricingsystem.25 For example, in British Columbia a special authorization permits full reimbursement above thereference price if the doctor provides the insurer with convincing medical reasons for his prescriptionchoice.
26 However, the erosion of patented drugs may not only be attributed to reference pricing given thatpatent protection does not guarantee isolation from competition in any pharmaceutical sub-market.“Erosion” also occurs because the patented drug has to compete with older and newer products in thesame therapeutic group.
15
have reduced financial incentives to develop: (i) incremental improvements in already-established drugs that are subject to reference prices27; (ii) new drugs which fall into aclass of drugs subject to a reference price; and (iii) additional indications for an activeingredient that is already covered by a reference price. In order to maximize profits, firmswill invest more in the development of new, innovative drugs which are not classifiedunder RP. The bias against innovative new drugs will be higher if a market price ceilingfor the new product is imposed when old and newer products are clustered in the samegroup and when a larger share of profits is obtained before the patent expires.
The welfare effects of these disincentives to innovate will depend, however, on howcomplete information plays when selecting a drug. Under perfect information, if thepatient’s willingness to pay for an incremental improvement is very low the disincentiveto invest in innovation would be maximized. If follows that the risk of adverse effectsresulting from imperfect information increases when the potential differences betweendrugs clustered in the same RP group are greater, as may be the case for levels 2 and 3.
Does the exemption of patented drug from RP solve the negative effects on research anddevelopment capacity of the pharmaceutical industry? The exclusion of patented drugsfrom the system may reduce the economic erosion of patent rights and the disincentive toinvest in research and development. However, the negative effects on innovation will notfully disappear because: (i) reference pricing increases uncertainty about the expectedreturn on a given investment; (ii) innovation incentives will be reduced because of thejoint aspects of research and development given the decrease in overall profitabilityimplied by reference pricing; and (iii) exclusion of patented drugs has proven to beincomplete in some cases (e.g., drugs with a process patent, with a patented new galenicform and with a patent for a further indication). The impact on investment R&D decisionsof RP applied to off-patent drugs is also limited because of the very long time lagbetween investment and sales (because of discounting, the existence of RP for off-patentproducts should have a little impact on R&D).
4. IMPACT OF REFERENCE PRICING POLICIES
4.1 DESCRIPTIVE OBSERVATIONS
As commented in the first section of the paper, RP in most countries has beenaccompanied by a wider range of reforms affecting both supply and demand. In this caseit is unreasonable to attribute all changes in expenditure and market prices to referencepricing alone. From a descriptive point of view, the implementation of RP since 1989may be roughly summarized by considering its impact on drug expenditures, prices andmarket shares (see Tables A1 to A7, and their references). However, descriptiveobservations are unable to separate the effects of reference pricing from the results ofother policy measures applied at the same time.
27 “Why should a pharmaceutical manufacturer have an interest in incremental improvements inalready-established drugs that are subject to reference prices? There would be no point, forexample, in developing an innovative benzodiazepine tranquilizer that was non-addictive and didnot interact with alcohol, when it would immediately be reference-priced alongside the oldercompounds of the same class.” [21, , p. 8].
16
1. It appears that RP produced short term reductions in insurer’s expenditure. Its globalimpact of the reduction seems to depend on product coverage. This shows a large rangeof market coverage: from 8% in Sweden (1996) up to 90% in The Netherlands (1991).Short term savings require changes in the prescribing behavior of doctors (switch to lessexpensive drugs), lower market prices, changes in the extension of the reference pricemechanism, and increased focus on patient charges (i.e, cost over the RP being paid bythe consumer). In Germany, the net effect on total insurers expenditures for drugs in 1993compared to 1992 was a one off 19.5% decrease. In Denmark, the first year producedslower growth in pharmaceutical expenditure than at any time during the previous sixyears.
2. The experience proves that RP does not result in important long term savings.Following the initial impact, expenditure growth resumes, partly due to new and moreexpensive drugs. In Germany, the share of patent protected prescribed drugs increasedfrom 11.7% in 1991 to 20.0% in 1995. Generally speaking, there is a increase inprescriptions, prices and expenditure of non-referenced products over time28. In thefollowing years after the introduction of RP, countries need to implement further controlson the drugs bill. As the case of Denmark or Germany shows, results suggest that RP arenot likely to affect the trend in insurer drug costs in a meaningful, ongoing way.Table 3 shows the evolution of public pharmaceutical expenditure as a proportion ofpublic health expenditure since 1985 in those countries which first introduced RP. OnlyGermany showed a significant decline in the proportion of pharmaceuticals healthexpenditure (for which the contribution of complementary regulatory measures needs tobe borne in mind). In other countries this proportion continued to increase despite RPintroduction.
[ Table 3 ]
3. The price of products covered by RP tends to decrease. Initial price reductions arereported in all countries which introduced this mechanism. In Sweden, the price forproducts within RP, with some few exceptions, dropped to the reimbursement level; alsogeneric prices lowered to the price of the lowest generic. In Germany most firms chose toreduce their prices to the reference level; according to Danzon and Liu [10]. There wasan immediate price cut of about 13 % in the first year and an additional 2% to 10%thereafter. In New Zealand there is evidence of a downward trend in the real price ofsubsidized pharmaceuticals prior to RP. In The Netherlands, the system showed an initialeffect with lower prices (5% between 1991 and 1993) for those drugs that were clusteredand reimbursed under RP.
In general, no incentives to set a price lower than the reference prices were observed: inGermany it has been reported that some generic producers increased their prices to thereference level, the benchmark being set through a statistically derived median price. Ifmarket prices decrease, the difference between brand name drugs and generics isconsequently reduced. Even so, it has to be said that RP in New Zealand has failed todeliver low prices for generics by international standards.Price and market share of non-covered products increased notably. Generally,pharmaceutical firms increased the prices of products not directly affected by RP. In
28 The result was that in 1995 referenced products represent 66% of the total sickness fundsexpenditure on medicines for the 1988 basket of available drugs; but because of the addition of newproducts to the list, the share for the actual drug expenditure is only about 37%.
17
Germany, prices of drugs subjected to reference prices decreased by 1.5% between1991-92 whereas the prices of those under the RP scheme increased by 4.1%. In TheNetherlands the price increased of those drugs which could not be clustered. In somecases, products have been de-listed from the reimbursement system, as in Sweden andNew Zealand, and their prices have increased. Not surprisingly, in Italy manypharmaceutical companies reduced prices to maintain their products under publiccoverage (given that Italian patients are forced to meet the full cost of drugs priced abovethe reference level). However, some other companies decided not to reduce prices andtheir drugs were consequently delisted. As a result, more than 400 products were delistedand more than 150 had their prices reduced by an average 7% [13]. In Sweden, salesgrowth in the non-referenced price segment was 18.3% in 1993 while overall growth inthe Swedish market was 12.6%.
When the generic substitution rate was higher before implementing reference pricing, aswas the case in British Columbia, the effect of RP on generic market share was minimal.A low penetration of generics is also observed in New Zealand due to small pricedifferences. However, in some countries such as Germany, a moderate increase in theshare of generics is observed: share volume of generics increased from 34% in 1991 to38.6% in 1995. An increase in market share for generic products is also observed inSweden. In the Netherlands, market share of generics (and parallel imports) increasedfrom 18% by volume in 1990 to about 30% in 1993.
Advantages and disadvantages.- Briefly, the main arguments for reference pricing, arethree-fold. First, from the companies’ point of view [26], manufacturers remain free to setany price they wish in order to increase their market share in a fully transparent context.Second, in contrast with positive and negative lists, RP does not set legal limitations onthe freedom of the doctor to prescribe drugs since all drugs are available.
And third, potential reductions in pharmaceutical expenditure (the cost containmenteffect) may be achieved without any sacrifice in effectiveness (i.e. RP promotes anongoing improvement in cost-effectiveness) by increasing cost-conscious drugconsumption. The conditions for success of RP as a reimbursement mechanism relybasically on the existence of important price differentials between products clustered inthe same group and the scope of the previously existing generic market.
The main arguments against the incentive and efficiency postulated effects of RP may besummarized as follows. The desired cost-containment of pharmaceutical and healthservices expenditure is not always achieved and when it is, it is less than expected andshort-lived. Reference pricing fails to contain pharmaceutical spending [26, 44]. Thislimited cost containment effect of RP can be explained by several factors:
(a) RP can only be applied to a small proportion of the pharmaceutical market and isusually not the driving factor behind the growth in spending on drugs (limited scope).
(b) Firms may minimize the effect of RP on total pharmaceutical revenues: firms attemptto recover losses in the referenced product market by increasing the prices of thosepharmaceuticals not covered by RP [12]. RP stimulates the industry to make a majoreffort in order to promote drugs that do not fall under the scheme.
18
(c) RP only addresses the price component driving growth in pharmaceutical expenditure.Growth in volume and prescribing composition are not affected. Under the assumption oflow demand elasticity, RP would only be useful in situations where pharmaceuticalexpenditure growth is mainly price driven.
(d) Savings in pharmaceutical expenditure under RP are basically achieved at the expenseof increased expenditures in the utilization of other health care services in the form ofhigher hospital admission rates or higher rates of referral to other physicians29 (highercosts faced by some other agents in the health system).
RP is also questioned because of its insensitivity to differences in the clinical profile ofdrugs [28]. As has been observed, the heterogeneity problem is present at equivalencelevels 2 and 3. The result is that RP: (a) may discriminate against individual patients, andindividual health outcomes may be adversely affected; (b) product differentiation may notbe adequately rewarded and may bias the system against innovative new drugs wheneverthey are grouped with existing products and therefore reimbursed at the same price; and(c) competition between products may be distorted.
Finally, RP is also controversial because of the possible negative effects on efficiency.Inefficiency may arise from: (i) increased uncertainty about payback of R&D costs (patentrights may be additionally eroded when the system clusters patented and off patentproducts in the same group). This may result in a cut in R&D expenditure leading to lesspharmaceutical innovation (dynamic efficiency problems); (ii) it imposes an importantadministrative regulatory burden on authorities and firms; and, (iii) it distortscompetition: RP does not supply incentives to price a product below the reference levelif savings are accrued by the insurer30.
As commented on earlier, it is difficult to isolate RP effects from those related to othercost containment measures applied at the same time such as, for instance, the introductionof a global budget for pharmaceutical expenditure funded by insurers. In this sense, itshould be noted that the term ‘reference prices is something of a misnomer.Reimbursement level would be a much more accurate description.31 In addition, referencepricing, when exclusively applied to off-patent drugs, may be interpreted as a tool whichimproves information in the pharmaceutical market so that generic products become moreefficient substitutes when patents expire.
4.2 THE IMPACT OF RP
• The impact on pharmaceutical expenditure, drug consumption and prices
Giuliani et al [15] investigated the effects of introducing RP in Germany in order toassess whether the system has been effective in containing public spending onpharmaceuticals during the period 1990-1996. They observed that average price per 29 This would be a consequence of considering prescription drugs, physician services, and perhaps othermedical services as bundled goods, as previous studies on the effects of co-payment and prescriptiondrug use suggest.30 The same argument applies if there is competition but a cost saving process innovation is introducedby the manufacturer.31 Selke [35, page 149].
19
Defined Daily Dose (DDD) declined after the introduction of RP, but that the decrease inunit cost failed to fully offset the increase in expenditure, except in the case of NSAIDsand (to a lesser extent) analgesics. Savings were offset by the growth in spending on thoseproducts not subject to RP. An obvious limitation of RP is that it cannot be applied toinnovative drugs.
Danzon and Liu [10] show how the short-run effect of RP is to put a kink in themanufacturer’s demand curve at the reference price, assuming that physicians have perfectprice information. The pure kinked demand model implies that brand prices fall andgeneric prices increase in response to RP (those price priced at or below the referencelevel). According to these authors, in a kinked demand curve model, it is never optimalto price below the kink. The optimal pricing strategy for a manufacturer of non RP drugsmay be to pursue a market segmentation strategy. By abandoning the more price sensitivemarket segment to RP drugs, the manufacturer faces a less price-elastic demand in the nonRP market of brand-loyal consumers. The profit maximizing ‘non-referenced’ pricetherefore increases. Empirical evidence from Germany quoted by Danzon and Liu seemsto be consistent with the convergence hypothesis of the kinked demand model amongstprices for brand and generic products. The effect of RP schemes on price changes may also be heavily dependent on factors suchas the proportion of over the counter (OTC) sales of the product, and may be alsoinfluenced by the inclusion of the product price in one country in cross border pricingmechanisms.
• Health effects and other health related impacts
Schneeweiss et al [31] argued that the effect of RP on health or overall resource use hasnever been validly evaluated. Given that level one is not expected to show a systematicdifference in health outcomes and resource utilization, they focus on level 2 clusters.These authors point out two broad categories of limitations to explain why there no validconclusions can be drawn regarding the effect of RP in Germany: (1) the lack of studiesusing time series analysis to individual level data over a reasonable length of time beforeand after the introduction of RP and with a suitable time trend control group; and (2) thedifficulty of monitoring simultaneous changes in the health care system.
Schulenburg and Schöffski [33] observed substitution processes and economic losses inother areas as a result of implementing limits on prescription drugs in Germany. The rateof referral to other physicians rose by almost 9% in the first seven months of 1993compared with the same period the year earlier. The hospital admission rate rose by10%. However, McGregor [24] reports that in British Columbia, “there has been noincrease in physicians’ office visits or in the rates of hospitalization of seniorsassociated with any of the sentinel illnesses” since the introduction of RP in 1995. Finally, in relation to pharmacists substituting generic equivalents, the potential healthrisk to consumers is assumed to be small given the regulatory bio-equivalencyrequirements. However, a recent survey of 254 doctors in 1997 in British Columbiaidentified some of these problems: (a) 90% of physicians reported at least one or moreproblems experienced by their patients as a result of RP, and (b) 75% of physicians who

20
had changed prescriptions reported that some of their patients experienced a worsening ofsymptoms [22]. Comparison of health effects on patients switching from drug A to drug B as a result ofthe introduction of RP could be a more appropriate way to observe health effects. Theonly study of this type is Thomas et al [36], which asses the impact in patients switchingfrom simvastatin to fluvastatin following the introduction of RP in New Zealand. Theseauthors observed a significant increase in total cholesterol, low density lipoprotein(LDL) cholesterol and triglyceride levels. Thomas et al [36] concluded that the lipidelevations observed in their study were related both to the lesser potency of fluvastatinand underdosing. However, note that drug underdosing may be attributed to inadequateclinical management, which is independent of the introduction of RP.
• The effects of RP on Physician Choice If the innovator firm sets prices at the reference level, the introduction of RP does notaffect the physician’s choice. It the innovator’s price is higher than the reference level,physicians who are highly aware of adverse drug reactions may continue to exclusivelyprescribe the original brand, albeit in smaller amounts. Otherwise, physicians mayprescribe a smaller quantity of branded products, possibly substituting generics instead.As far as we know, there is no empirical evidence of this.
• The effect of RP on the Innovator’s Price The optimal seller response to the introduction of RP depends on the characteristics of thephysician [45]. Drugs prescribed by physicians with a strong interest in the uniqueproperties of the original drug are predicted to be priced above RP, while others shouldbe priced at the RP level. By assuming that the patient is fully informed, with no influenceexerted by his physician, Zweifel and Breyer [70] conclude that suppliers will react tothe introduction of RP by accepting the reference level for drugs with large (absolute)price elasticity of demand and small sales, while requiring co-payment for drugs havingsmall price elasticity and large sales (this was the case in Germany). In this sense,manufacturers with prices higher than the reference level lowered prices to maintain theirmarket shares.
• Dynamic efficiency The welfare effects of the exercise of purchasing power in the pharmaceutical sectordiffer from the standard monopsony analysis because of the role of sunk costs [60]. Inmarkets where the innovator faces competition from entrants after patent expiration, themonopsonist can force prices down to short run marginal cost. The welfare distortion isnot the sub-optimal consumption of drugs which is argued in the traditional monopsonymodel. The welfare loss occurs because the monopsonist’s price does not cover the sunkR&D costs, leading to a sub-optimal rate of investment and a decrease in the supply ofnew products in the long run. Note that if off-patent products are excluded from RP, and ifthe patent system is appropriately designed, dynamic inefficiency does not necessarilyresult. This will occur when innovative and generic drugs are clustered in the same
21
group, or when patented drugs with specific therapeutic advantages are combined withother patented drugs that do not possess such advantages [17, 21].
• Welfare effects
Welfare effects will depend on the following considerations:On the one hand, reference prices can make the demand for prescription drugs moreelastic than would otherwise be the case, although they may prove ineffective inpreventing inefficient extension of the use of a pharmaceutical product to new indicationsfor which much cheaper alternatives are available.On the other hand, welfare losses may arise from RP with regard to transaction costs.Gross and Fortescue [17] identified the following costs associated with a referencepricing system:
1. Costs to government: (a) administrative costs related to the RP system (design of themechanism, updating the scheme for new drugs, litigation, the cost of managingexemptions, etc.); and (b) increased costs to other parts of the health sector.
2. Costs to patients: (a) social costs (derived from new regulation on access, or justconvenience); (b) economic costs of changing prescriptions (prescription costs andextra visits to doctors); (c) costs of extra medical visits as a result of complicationsfrom changed prescriptions.
3. Costs to physicians: time and costs of counseling.
4. Costs to manufacturers: (a) policy delays or non-listing; (b) reduced investment andinnovation.
• Effects on Competition
RP increase the de facto degree of substitutability between the drugs. However, byemphasizing competition based on product differentiation, drug manufacturers were ableto attenuate price competition. Promotional information to physicians is intended toconvince them of the therapeutic superiority of their drugs over alternative drugs..
5. CONCLUDING REMARKS
In assessing the policy implications of RP some conclusions may be raised:
1- From a theoretical and health policy view, without going into the practical details ofRP, it is very difficult to be against a RP strategy. Indeed, RP shows a great capacityto raise political support across different governments’ ideologies. Its principles looksound: medical equivalence, consumers’ cost consciousness, limited reimbursementand cost control of the drug bill. However, if we look at the details, we will find the k-elements to assess the actual RP effects.
2- Regarding reality, a first issue is that of the definition of ‘equivalence’: a directrelationship exists between broadening the groups affected by RP (relaxing thebioequivalence principle) and the relevance of RP in terms of its impact on drugexpenditure control. However, an indirect relationship seems to be also present

22
between enlarging the field of RP and causing medical and social disagreement on RP.In this sense, a potential marginal impact on cost savings comes out at a very highprice in terms of transaction costs and other related problems (for instance, on the lackof incentives in I&D if patented products are covered by RP).
3- RP systems achieve better their postulated goals (i) if cost inflation in pharmaceuticalsis due to high prices rather than to the excess of prescription rates, (ii) when the largeris the existing difference in prices among equivalent drugs, and (iii) more important isthe actual market for generics.
4- In order to appraise each individual RP strategy, it is very important to identify pre-existing alternatives: for instance, whether a competitive market on generics exists orwhether drug prescribers or dispensers may have compatible incentives to third partyreimbursers and consumers (given the cost-shifting nature of the RP effects).
5- In fact, this is the case since the generalization of RP policies among differentcountries, economic context, and social insurance schemes have distorted RP initialpurposes. RP today is not any more a control device of pharmaceuticalsreimbursement in markets with free prices for drugs, but a quasi universal complementof the countries’ general pricing policy on drugs.
6- RP has thus become one more of a set of policy measures for drug expenditure control.This loss of focus has the danger of further eroding the whole spectrum of the drugpolicy, with health expenditure control substituting health policy, promotingundesirable side effects on I&D, raising new issues on medical equivalence or partialviews on consumers’ responsiveness to changing financial environments in health caresystems.
23
REFERENCES
1. Abel-Smith B., and Mossialos E. (1994), “Cost Containment and Health CareReform. A Study of the European Union”, LSE Health, February.
2. Bartels-Petersen, J. (1994), Pharmaceutical consumption in a low consuming country:The case of Denmark, in Cost Containment Pricing and Financing of Pharmaceuticalsin the European Community: The Policy-Makers’ View, E. Mossialos, C. Ranos and B.Abel-Smith (eds.), LSE Health and Pharmetrica S.A.: 173-181.
3. Boulet A.P., and Tessier G. (1997), “Reference-based pricing in British Columbia:Implications for cardiologists - An analysis”, Canadian Journal of Cardiology, Vol. 13,No. 1: 46-51.
4. Cambridge Pharma Consultancy Ltd. (1996), “Reference Pricing and Cross BorderReference Pricing Systems”, October.
5. Canadian Cardiovascular Society (1997), “A position paper on drug-pricingstrategies for prescription pharmaceuticals in Canada”, Canadian Journal ofCardiology, 13(1): 33-38.
6. Clausen J. (1995), “Financing of prescription drugs in Denmark - alternativedesigns of the reimbursement system”, The Third European Conference on HealthEconomics, Stockholm, Sweden 20-22 August.
7. Clement, W. and Pichler, E. (1998), “Are there Economic Criteria Reference Pricingis Referring to?”, Conference on The Effects of Reference Pricing of Medicines,Barcelona, Spain, December 14-16.
8. Danzon, P. (1998), “Reference pricing: efficient insurance design or monopsony freeriding?”, Pharma Pricing Review, 3(7): 127-130.
9. Danzon, P. (1998), “Reference Pricing: Theory and Evidence”, Conference on TheEffects of Reference Pricing of Medicines, Barcelona, Spain, December 14-16.
10. Danzon P. and Liu H. (1997), “Reference Pricing and Physician Drug Budgets: TheGerman Experience in Controlling Pharmaceutical Expenditures”, Working Paper,Philadelphia: The Wharton School.
11. Dickson M. and Redwood, H. (1998), “Pharmaceutical Reference Prices. How doThey Work in Practice?”, PharmacoEconomics, 14(5): 471-9.
12. Drummond M., Jönsson B. and Rutten F. (1997), “The role of economics evaluationin the pricing and reimbursement of medicines”, Health Policy, 40: 199-215.
13. Fattore G. and Jommi C. (1998), The new pharmaceutical policy in Italy, HealthPolicy, 46(1): 21-41.
24
14. Garattini L., Giuliani G., and Chiara G. (1997), “Is Reference Pricing Effective inCost Containment? The German Experience, 1989-1992”, Pharma Pricing Review,2(7): 131-135.
15. Giuliani G, Selke G, Garattini L (1998), The German experience in referencepricing, Health Policy, 44: 73-85.
16. Gross D.J., Ratner J., Perez J., and Glavin S.L. (1994), InternationalPharmaceutical Spending Controls: France, Germany, Sweden, and the UnitedKingdom, Health Care Financing Review, 15(3): 127-140.
17. Gross P.F. and Fortescue R. (1997), “Therapeutic pricing for prescribed medicinesin Australia: review of similar reforms internationally and likely impact of theGovernment’s 1997/98 Budget proposals”, Health Economics Monograph No. 70.Institute of Health Economics and technology Assessment, St Christophe en Brionnais,Burgundy France.
18. Jönsson B. (1994), “Pricing and Reimbursement of Pharmaceuticals in Sweden”,PharmacoEconomics, 6, suppl. 1: 51-60.
19. Jönsson, B., Ekelund, M, and Persson, B. (1998), “Reference pricing and innovation, Conference on The Effects of Reference Pricing of Medicines, Barcelona,
Spain, December 14-16.
20. Lindsey, R. and West, D.S. (1998), “National Pharmacare, Reference-BasedPricing, and Drug R&D: A Critique of the National Forum on Health’sRecommendations for Pharmaceutical Policy”, Working Paper 98-3, Institute ofPharmaco-Economics, Canada.
21. Maassen, B.M. (1996), “Reimbursement of Medicinal Products: The GermanReference Price System”, Pharma, February. (Maassen, B.M. (1998), “Reimbursementof Medicinal Products: The German Reference Price System - Law, AdministrativePractice and Economics”, Cuadernos de Derecho Europeo Farmacéutico, 8: 69-100).
22. MarkTrend Research (1998), “Reference Based Pricing Study”, 98-083, Vancouver.
23. McArthur, W.J. (1998), “Reference Based Pricing, Patient Outcomes and PublicHealth Consequences”, Conference on The Effects of Reference Pricing of Medicines,Barcelona, Spain, December 14-16.
24. McGregor, M. (1998), “Coverage of drug costs: Reference-based pricing”,Canadian Journal of Cardiology, 14(5): 666-8.
25. Moore, D. and Scott, A. (1996), “The great debate about reference pricing of, in “Healthy Incentives: Canadian health Reform in an International
, eds. W.J. McArthur, C. Ramsay and M. Walker. Vancouver: The FraserInstitute: 103-8.
25
26. Mossialos E. (1998), “Pharmaceutical Pricing, Financing and Cost Containment inthe European Union Member States”, in R. Leidl (Ed.), “Health Care and itsFinancing in the Single European Market”, IOS Press: Amsterdam; 85-113.
27. Mullens, A. (1998), “Reference-based pricing: Will other provinces follow the BClead?”, Canadian medical Association Journal, 158(2): 239-41.
28. Rigter H. (1994), “Recent Public Policies in The Netherlands to ControlPharmaceutical Pricing and Reimbursement”, PharmacoEconomics, 6, suppl. 1: 15-21.
29. Roberts, M.J. (1998), “Would We Be Able to Recognize A Socially DesirableReference Pricing System It It Bit Us On The Ankle?”, Conference on The Effects ofReference Pricing of Medicines, Barcelona, Spain, December 14-16.
30. Schmeinck W. (1994), Overview of the German health insurance system, in CostContainment Pricing and Financing of Pharmaceuticals in the European Community:The Policy-Makers’ View, E. Mossialos, C. Ranos and B. Abel-Smith (eds.), LSE Healthand Pharmetrica S.A.: 161-166.
31. Schneeweiss S, Schöffski O, Selke G.W. (1998), What is Germany’s experience onreference based drug pricing and the etiology of adverse health outcomes orsubstitution?, Health Policy, 44: 253-260.
32. Schöffski O. (1996), “Consequences of Implementing a Drug Budget for Office-Based Physicians in Germany”, PharmacoEconomics, 10, suppl. 2: 37-47.
33. Schulenburg J.M.G. von der, and Schöffski O. (1993), “Implications of theStructural Reform of Healthcare Act on the referral and hospital admission practice ofprimary care physicians”, University of Hanover, Discussion Paper No. 34, November.
34. Scott, A. (1995), “Reference Pricing: A Sham and Shambles”, The Health CareDilemma - Fraser Institute Conference, Toronto and Vancouver, November 6-7.Reprinted in “Healthy Incentives: Canadian Health Reform in an International
, eds. W.J. McArthur, C. Ramsay and M. Walker. Vancouver: The FraserInstitute: 91-9.
35. Selke G. (1994), Reference price systems in the European Community, in CostContainment Pricing and Financing of Pharmaceuticals in the European Community:The Policy-Makers’ View, E. Mossialos, C. Ranos and B. Abel-Smith (eds.), LSE Healthand Pharmetrica S.A.: 147-160.
36. Thomas, M.C., Mann, J., and Williams, S. (1998), “The impact of reference pricingon clinical liped control”, New Zealand Journal of Medicine, 14 August: 292-294.
37. Ulrich V., and Wille E. (1996), “Expenditure on Drugs and Healthcare Reform: TheGerman Situation”, PharmacoEconomics, 10, suppl. 2: 81-88.
38. Van den Noord P., Hagen T. and Iversen T. (1998), “The Norwegian Health CareSystem” OECD Economics Department Working Papers, no 198.
26
39. Vandergrift M. and Kanavos P. (1997), “Health policy versus industrial policy inthe pharmaceutical sector: the case of Canada”, Health Policy, 41: 241-260.
40. de Vos C. (1994), Financing of medicines in Netherlands, in Cost ContainmentPricing and Financing of Pharmaceuticals in the European Community: The Policy-Makers’ View, E. Mossialos, C. Ranos and B. Abel-Smith (eds.), LSE Health andPharmetrica S.A.: 167-172.
41. Vos C.M. de (1996), “The 1996 Pricing and Reimbursement Policy in The, PharmacoEconomics, 10, Sup. 2: 75-80.
42. Woodfield A., Fountain J. and Borren P. (1997), “Money & Medicines. An EconomicAnalysis of Reference Pricing and Related Public-sector Cost-containment Systems forPharmaceuticals with Special Reference to New Zealand”, Merck Sharp & Dome, NewZealand.
43. Woollard, R.F. (1996), “Opportunity lost: a frontline view of reference-based, Canadian Medical Association Journal, 154(8): 1185-1188.
44. Zammit-Lucia J. and Dasgupta R. (1995), “Reference Pricing. The Europeanexperience”, Health Policy Review, Paper No. 10, St. Mary’s Hospital Medical School,London.
45. Zweifel P and Crivelli L (1996), Price Regulation of Drugs: Lessons fromGermany, Journal of Regulatory Economics, 10: 257-273.
46. Morton, F.S. (1997), The interaction between a most favoured customer clause andprice dispersion: An empirical examination of the Medicaid rebate rules of 1990,Journal of Economics & Management Strategy, 6(1): 151-174.
47. Morton, F.S. (1997), The strategic response by pharmaceutical firms to Medicaidmost-favoured-customer rules, Rand Journal of Economics, 28(2): 269-290.
48. Johnston, M., and Zeckhauser, R. (1991), “The Australian Pharmaceutical SubsidyGambit: Transmuting deadweight Loss and Oligopoly Rents to Consumer Surplus”,NBER Working Paper No. 3783, July.
49. European Commission (1998), “Commission Communication on the Single Marketin Pharmaceuticals”, adopted by the Commission on 25 November 1998, DirectorateGeneral III - Industry.
50. Scherer, F.M. (1993), “Pricing, profits, and technological progress in thepharmaceutical industry”, Journal of Economic Perspectives, 7(3): 97-115.
51. Frank R.G. and Salkever D.S. (1992), “Pricing, Patent Loss and the Market for, Southern Economic Journal, 59(2): 165-179.
52. Caves R.E., Whinston M.D. and Hurwitz M.A. (1991), “Patent Expiration, Entry,and Competition in the U.S. Pharmaceutical Industry”, Brooking Papers on EconomicActivity: 1-66.
27
53. Scherer, F.M. (1996), “Industry, Structure, Strategy, and Public Policy”,HaperCollins College Pub, New York.
54. Frank R.G. and Salkever D.S. (1997), “Generic Entry and the Pricing of, Journal of Economics & Management Strategy, 6(1): 75-90.
55. Scherer, F.M. and Ross, D. (1990), “Industrial Market Structure and Economic, third edition, Boston: Houghton-Mifflin.
56. Hellerstein J.K. (1998), “The importance of the physician in the generic versustrade-name prescription decision”, RAND Journal of Economics, 29(1): 108-136.
57. Wilkes D. (1991), “Germany. coming to terms with reference pricing”, Scrip, 16-18, February.
58. Levy R.A. (1992), “Prescription Cost Sharing. Economic and Health Impacts, andImplications for Health Policy”, PharmacoEconomics, 2(3): 219-237.
59. Zweifel P and Breyer F (1997), Health Economics, Oxford University Press, NewYork.
28
REFERENCES CLASSIFIED BY COUNTRY
Australia
Cambridge Pharma Consultancy Ltd. (1996), “Reference Pricing and Cross BorderReference Pricing Systems”, October.
Gross P.F. and Fortescue R. (1997), “Therapeutic pricing for prescribed medicines inAustralia: review of similar reforms internationally and likely impact of theGovernment’s 1997/98 Budget proposals”, Health Economics Monograph No. 70.Institute of Health Economics and technology Assessment, St Christophe en Brionnais,Burgundy France.
Canada
Boulet A.P., and Tessier G. (1997), “Reference-based pricing in British Columbia:Implications for cardiologists - An analysis”, Canadian Journal of Cardiology, Vol. 13,No. 1: 46-51.
Cambridge Pharma Consultancy Ltd. (1996), “Reference Pricing and Cross BorderReference Pricing Systems”, October.
Canadian Cardiovascular Society (1997), “A position paper on drug-pricing strategiesfor prescription pharmaceuticals in Canada”, Canadian Journal of Cardiology, 13(1):33-38.
Grootendorst P., Goldsmith L., Hurley J., O’Brien B., and Dolovich L. (1996),“Financial Incentives to Dispense Low-Cost Drugs. A Case Study of British ColumbiaPharmacare”, McMaster University Center for Health Economics and Policy AnalysisWorking Paper 96-8, August.
Gross P.F. and Fortescue R. (1997), “Therapeutic pricing for prescribed medicines inAustralia: review of similar reforms internationally and likely impact of theGovernment’s 1997/98 Budget proposals”, Health Economics Monograph No. 70.Institute of Health Economics and technology Assessment, St Christophe en Brionnais,Burgundy France.
Lindsey, R. and West, D.S. (1998), “National Pharmacare, Reference-Based Pricing,and Drug R&D: A Critique of the National Forum on Health’s Recommendations for
, Working Paper 98-3, Institute of Pharmaco-Economics,Canada.
MarkTrend Research (1998), “Reference Based Pricing Study”, 98-083, Vancouver.
McArthur, W.J. (1998), “Reference Based Pricing, Patient Outcomes and PublicHealth Consequences”, Conference on The Effects of Reference Pricing of Medicines,Barcelona, Spain, December 14-16.
29
McGregor, M. (1998), “Coverage of drug costs: Reference-based pricing”, CanadianJournal of Cardiology, 14(5): 666-8.
Moore, D. and Scott, A. (1996), “The great debate about reference pricing of, in “Healthy Incentives: Canadian health Reform in an International
, eds. W.J. McArthur, C. Ramsay and M. Walker. Vancouver: The FraserInstitute: 103-8.
Mullens, A. (1998), “Reference-based pricing: Will other provinces follow the BClead?”, Canadian medical Association Journal, 158(2): 239-41.
Olley, P.M. and McLaughlin, P.R. (1998), “The Canadian Cardiovascular Society andreference-based drug pricing”, Canadian Journal of Cardiology, 14(5): 669.
Scott, A. (1995), “Reference Pricing: A Sham and Shambles”, The Health CareDilemma - Fraser Institute Conference, Toronto and Vancouver, November 6-7.Reprinted in “Healthy Incentives: Canadian Health Reform in an International
, eds. W.J. McArthur, C. Ramsay and M. Walker. Vancouver: The FraserInstitute: 91-9.
Vandergrift M. and Kanavos P. (1997), “Health policy versus industrial policy in thepharmaceutical sector: the case of Canada”, Health Policy, 41: 241-260.
Woollard, R.F. (1996), “Opportunity lost: a frontline view of reference-based, Canadian Medical Association Journal, 154(8): 1185-1188.
Denmark
Abel-Smith B., and Mossialos E. (1994), “Cost Containment and Health Care Reform.A Study of the European Union”, LSE Health, February.
Bartels-Petersen, J. (1994), Pharmaceutical consumption in a low consuming country:The case of Denmark, in Cost Containment Pricing and Financing of Pharmaceuticalsin the European Community: The Policy-Makers’ View, E. Mossialos, C. Ranos and B.Abel-Smith (eds.), LSE Health and Pharmetrica S.A.: 173-181.
Cambridge Pharma Consultancy Ltd. (1996), “Reference Pricing and Cross BorderReference Pricing Systems”, October.
Clausen J. (1995), “Financing of prescription drugs in Denmark - alternative designs, The Third European Conference on Health Economics,
Stockholm, Sweden 20-22 August.
Drummond M., Jönsson B. and Rutten F. (1997), “The role of economics evaluation inthe pricing and reimbursement of medicines”, Health Policy, 40: 199-215.
Gross P.F. and Fortescue R. (1997), “Therapeutic pricing for prescribed medicines inAustralia: review of similar reforms internationally and likely impact of theGovernment’s 1997/98 Budget proposals”, Health Economics Monograph No. 70.
30
Institute of Health Economics and technology Assessment, St Christophe en Brionnais,Burgundy France.
Mossialos E. (1998), “Pharmaceutical Pricing, Financing and Cost Containment in theEuropean Union Member States”, in R. Leidl (Ed.), “Health Care and its Financing inthe Single European Market”, IOS Press: Amsterdam; 85-113.
Selke G. (1994), Reference price systems in the European Community, in CostContainment Pricing and Financing of Pharmaceuticals in the European Community:The Policy-Makers’ View, E. Mossialos, C. Ranos and B. Abel-Smith (eds.), LSE Healthand Pharmetrica S.A.: 147-160.
Zammit-Lucia J. and Dasgupta R. (1995), “Reference Pricing. The Europeanexperience”, Health Policy Review, Paper No. 10, St. Mary’s Hospital Medical School,London.
Germany
Abel-Smith B., and Mossialos E. (1994), “Cost Containment and Health Care Reform.A Study of the European Union”, LSE Health, February.
Cambridge Pharma Consultancy Ltd. (1996), “Reference Pricing and Cross BorderReference Pricing Systems”, October.
Danzon, P. (1998), “Reference Pricing: Theory and Evidence”, Conference on TheEffects of Reference Pricing of Medicines, Barcelona, Spain, December 14-16.
Danzon P. and Liu H. (1997), “Reference Pricing and Physician Drug Budgets: TheGerman Experience in Controlling Pharmaceutical Expenditures”, Working Paper,Philadelphia: The Wharton School.
Drummond M., Jönsson B. and Rutten F. (1997), “The role of economics evaluation inthe pricing and reimbursement of medicines”, Health Policy, 40: 199-215.
Garattini L., Giuliani G., and Chiara G. (1997), “Is Reference Pricing Effective in CostContainment? The German Experience, 1989-1992”, Pharma Pricing Review, 2(7):131-135.
Giuliani G, Selke G, Garattini L (1998), The German experience in reference pricing,Health Policy, 44: 73-85.
Gross P.F. and Fortescue R. (1997), “Therapeutic pricing for prescribed medicines inAustralia: review of similar reforms internationally and likely impact of theGovernment’s 1997/98 Budget proposals”, Health Economics Monograph No. 70.Institute of Health Economics and technology Assessment, St Christophe en Brionnais,Burgundy France.

31
Gross D.J., Ratner J., Perez J., and Glavin S.L. (1994), International PharmaceuticalSpending Controls: France, Germany, Sweden, and the United Kingdom, Health CareFinancing Review, 15(3): 127-140.
Maassen, B.M. (1996), “Reimbursement of Medicinal Products: The German Reference, Pharma, February.
Maassen, B.M. (1998), “Reimbursement of Medicinal Products: The German ReferencePrice System - Law, Administrative Practice and Economics”, Cuadernos de DerechoEuropeo Farmacéutico, 8: 69-100.
Mossialos E. (1998), “Pharmaceutical Pricing, Financing and Cost Containment in theEuropean Union Member States”, in R. Leidl (Ed.), “Health Care and its Financing inthe Single European Market”, IOS Press: Amsterdam; 85-113.
Schmeinck W. (1994), Overview of the German health insurance system, in CostContainment Pricing and Financing of Pharmaceuticals in the European Community:The Policy-Makers’ View, E. Mossialos, C. Ranos and B. Abel-Smith (eds.), LSE Healthand Pharmetrica S.A.: 161-166.
Schneeweiss S, Schöffski O, Selke G.W. (1998), What is Germany’s experience onreference based drug pricing and the etiology of adverse health outcomes orsubstitution?, Health Policy, 44: 253-260.
Schöffski O. (1996), “Consequences of Implementing a Drug Budget for Office-BasedPhysicians in Germany”, PharmacoEconomics, 10, suppl. 2: 37-47.
Schulenburg J.M.G. von der (1997), “Management of cost and utilization ofpharmaceuticals in Germany”, Health Policy, 41 suppl.: S45-S53.
Schulenburg J.M.G. von der, and Schöffski O. (1993), “Implications of the StructuralReform of Healthcare Act on the referral and hospital admission practice of primarycare physicians”, University of Hanover, Discussion Paper No. 34, November.
Selke G. (1994), Reference price systems in the European Community, in CostContainment Pricing and Financing of Pharmaceuticals in the European Community:The Policy-Makers’ View, E. Mossialos, C. Ranos and B. Abel-Smith (eds.), LSE Healthand Pharmetrica S.A.: 147-160.
Ulrich V., and Wille E. (1996), “Expenditure on Drugs and Healthcare Reform: TheGerman Situation”, PharmacoEconomics, 10, suppl. 2: 81-88.
Wilkes D. (1991), “Germany. coming to terms with reference pricing”, Scrip, 16-18,February.
Zammit-Lucia J. and Dasgupta R. (1995), “Reference Pricing. The Europeanexperience”, Health Policy Review, Paper No. 10, St. Mary’s Hospital Medical School,London.
32
Zweifel P and Crivelli L (1996), Price Regulation of Drugs: Lessons from Germany,Journal of Regulatory Economics, 10: 257-273.
Italy
Abel-Smith B., and Mossialos E. (1994), “Cost Containment and Health Care Reform.A Study of the European Union”, LSE Health, February.
Cambridge Pharma Consultancy Ltd. (1996), “Reference Pricing and Cross BorderReference Pricing Systems”, October.
Fattore G. and Jommi C. (1998), The new pharmaceutical policy in Italy, Health Policy,46(1).
Mossialos E. (1998), “Pharmaceutical Pricing, Financing and Cost Containment in theEuropean Union Member States”, in R. Leidl (Ed.), “Health Care and its Financing inthe Single European Market”, IOS Press: Amsterdam; 85-113.
Zammit-Lucia J. and Dasgupta R. (1995), “Reference Pricing. The Europeanexperience”, Health Policy Review, Paper No. 10, St. Mary’s Hospital Medical School,London.
The Netherlands
Abel-Smith B., and Mossialos E. (1994), “Cost Containment and Health Care Reform.A Study of the European Union”, LSE Health, February.
Cambridge Pharma Consultancy Ltd. (1996), “Reference Pricing and Cross BorderReference Pricing Systems”, October.
Danzon, P. (1998), “Reference Pricing: Theory and Evidence”, Conference on TheEffects of Reference Pricing of Medicines, Barcelona, Spain, December 14-16.
Drummond M., Jönsson B. and Rutten F. (1997), “The role of economics evaluation inthe pricing and reimbursement of medicines”, Health Policy, 40: 199-215.
Gross P.F. and Fortescue R. (1997), “Therapeutic pricing for prescribed medicines inAustralia: review of similar reforms internationally and likely impact of theGovernment’s 1997/98 Budget proposals”, Health Economics Monograph No. 70.Institute of Health Economics and technology Assessment, St Christophe en Brionnais,Burgundy France.
Mossialos E. (1998), “Pharmaceutical Pricing, Financing and Cost Containment in theEuropean Union Member States”, in R. Leidl (Ed.), “Health Care and its Financing inthe Single European Market”, IOS Press: Amsterdam; 85-113.
33
Rigter H. (1994), “Recent Public Policies in The Netherlands to ControlPharmaceutical Pricing and Reimbursement”, PharmacoEconomics, 6, suppl. 1: 15-21.
Selke G. (1994), Reference price systems in the European Community, in CostContainment Pricing and Financing of Pharmaceuticals in the European Community:The Policy-Makers’ View, E. Mossialos, C. Ranos and B. Abel-Smith (eds.), LSE Healthand Pharmetrica S.A.: 147-160.
de Vos C. (1994), Financing of medicines in Netherlands, in Cost Containment Pricingand Financing of Pharmaceuticals in the European Community: The Policy-Makers’View, E. Mossialos, C. Ranos and B. Abel-Smith (eds.), LSE Health and PharmetricaS.A.: 167-172.
Vos C.M. de (1996), “The 1996 Pricing and Reimbursement Policy in The, PharmacoEconomics, 10, Sup. 2: 75-80.
Zammit-Lucia J. and Dasgupta R. (1995), “Reference Pricing. The Europeanexperience”, Health Policy Review, Paper No. 10, St. Mary’s Hospital Medical School,London.
New Zealand
Cambridge Pharma Consultancy Ltd. (1996), “Reference Pricing and Cross BorderReference Pricing Systems”, October.
Danzon, P. (1998), “Reference Pricing: Theory and Evidence”, Conference on TheEffects of Reference Pricing of Medicines, Barcelona, Spain, December 14-16.
Gross P.F. and Fortescue R. (1997), “Therapeutic pricing for prescribed medicines inAustralia: review of similar reforms internationally and likely impact of theGovernment’s 1997/98 Budget proposals”, Health Economics Monograph No. 70.Institute of Health Economics and technology Assessment, St Christophe en Brionnais,Burgundy France.
Thomas, M.C., Mann, J., and Williams, S. (1998), “The impact of reference pricing onclinical liped control”, New Zealand Journal of Medicine, 14 August: 292-294.
Woodfield, A.E. (1998), “Reference Pricing: Theory and Evidence. Comments onPatricia Danzon’s Paper”, Conference on The Effects of Reference Pricing onMedicines, Barcelona, Spain, December, 14-16.
Woodfield A., Fountain J. and Borren P. (1997), “Money & Medicines. An EconomicAnalysis of Reference Pricing and Related Public-sector Cost-containment Systems forPharmaceuticals with Special Reference to New Zealand”, Merck Sharp & Dome, NewZealand.
Norway
Van den Noord P., Hagen T. and Iversen T. (1998), “The Norwegian Health CareSystem” OECD Economics Department Working Papers, no 198.
34
Sorensen R.J., G. Rongen and J. Grytten (1997), “Does Public Provision of Primary CarePhysicians Services Secure Equity in Access?. The Norwegian Experience”,International Journal of Health Services.
Sweden
Abel-Smith B., and Mossialos E. (1994), “Cost Containment and Health Care Reform.A Study of the European Union”, LSE Health, February.
Cambridge Pharma Consultancy Ltd. (1996), “Reference Pricing and Cross BorderReference Pricing Systems”, October.
Gross D.J., Ratner J., Perez J., and Glavin S.L. (1994), International PharmaceuticalSpending Controls: France, Germany, Sweden, and the United Kingdom, Health CareFinancing Review, 15(3): 127-140.
Jönsson B. (1994), “Pricing and Reimbursement of Pharmaceuticals in Sweden”,PharmacoEconomics, 6, suppl. 1: 51-60.
Mossialos E. (1998), “Pharmaceutical Pricing, Financing and Cost Containment in theEuropean Union Member States”, in R. Leidl (Ed.), “Health Care and its Financing inthe Single European Market”, IOS Press: Amsterdam; 85-113.
Selke G. (1994), Reference price systems in the European Community, in CostContainment Pricing and Financing of Pharmaceuticals in the European Community:The Policy-Makers’ View, E. Mossialos, C. Ranos and B. Abel-Smith (eds.), LSE Healthand Pharmetrica S.A.: 147-160.
Zammit-Lucia J. and Dasgupta R. (1995), “Reference Pricing. The Europeanexperience”, Health Policy Review, Paper No. 10, St. Mary’s Hospital Medical School,London.
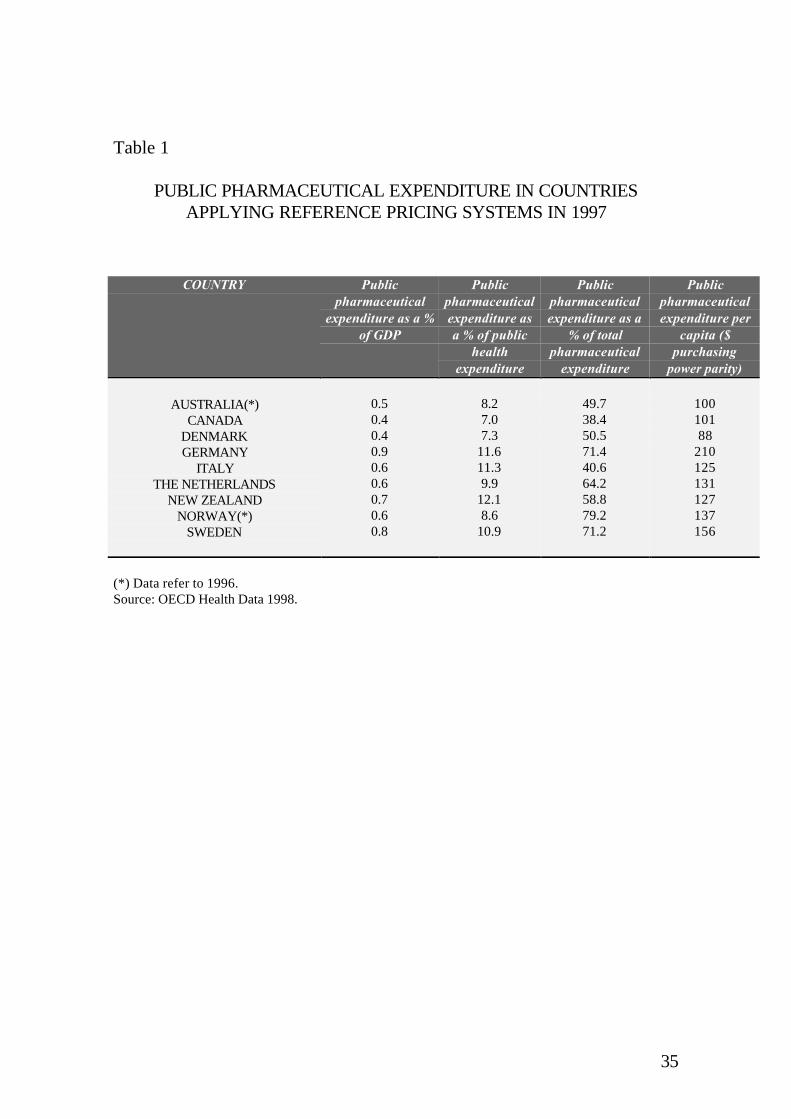
35
Table 1
PUBLIC PHARMACEUTICAL EXPENDITURE IN COUNTRIESAPPLYING REFERENCE PRICING SYSTEMS IN 1997
COUNTRY Publicpharmaceutical
expenditure as a %of GDP
Publicpharmaceuticalexpenditure asa % of public
healthexpenditure
Publicpharmaceuticalexpenditure as a
% of totalpharmaceutical
expenditure
Publicpharmaceuticalexpenditure per
capita ($purchasing
power parity)
AUSTRALIA(*)CANADA
DENMARKGERMANY
ITALYTHE NETHERLANDS
NEW ZEALANDNORWAY(*)
SWEDEN
0.50.40.40.90.60.60.70.60.8
8.27.07.3
11.611.39.9
12.18.6
10.9
49.738.450.571.440.664.258.879.271.2
10010188
210125131127137156
(*) Data refer to 1996.Source: OECD Health Data 1998.
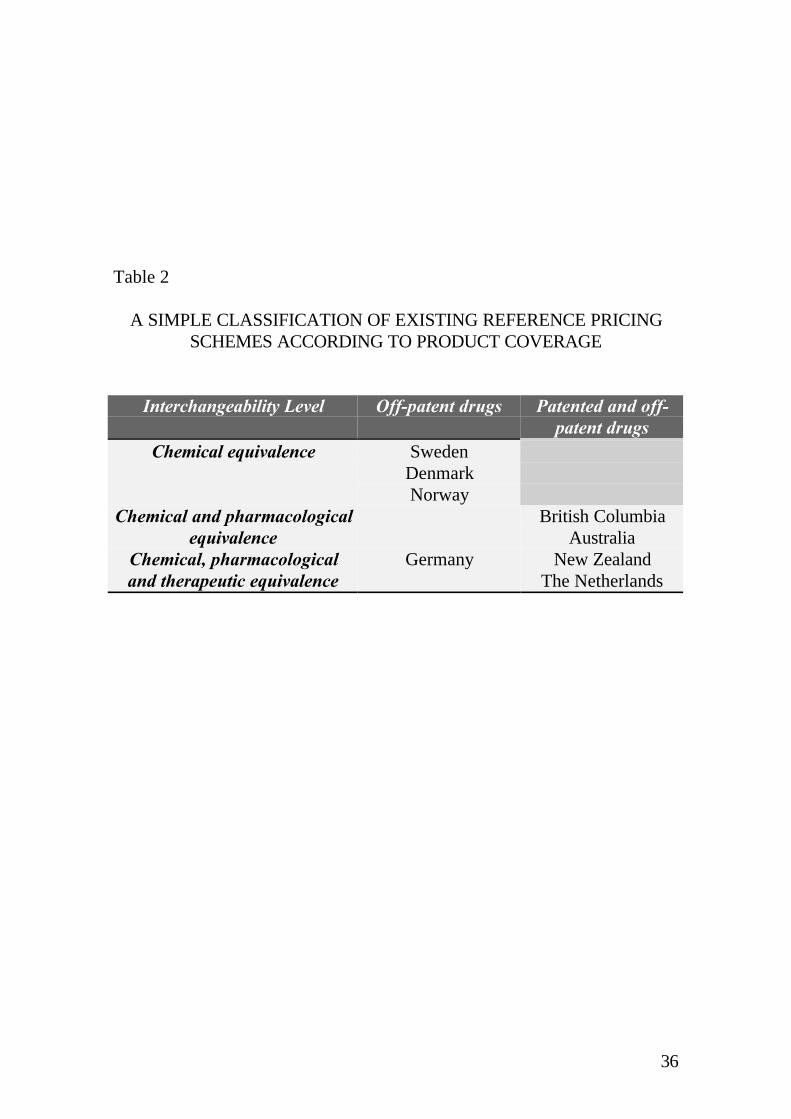
36
Table 2
A SIMPLE CLASSIFICATION OF EXISTING REFERENCE PRICINGSCHEMES ACCORDING TO PRODUCT COVERAGE
Interchangeability Level Off-patent drugs Patented and off-patent drugs
Chemical equivalence SwedenDenmarkNorway
Chemical and pharmacologicalequivalence
British ColumbiaAustralia
Chemical, pharmacologicaland therapeutic equivalence
Germany New ZealandThe Netherlands
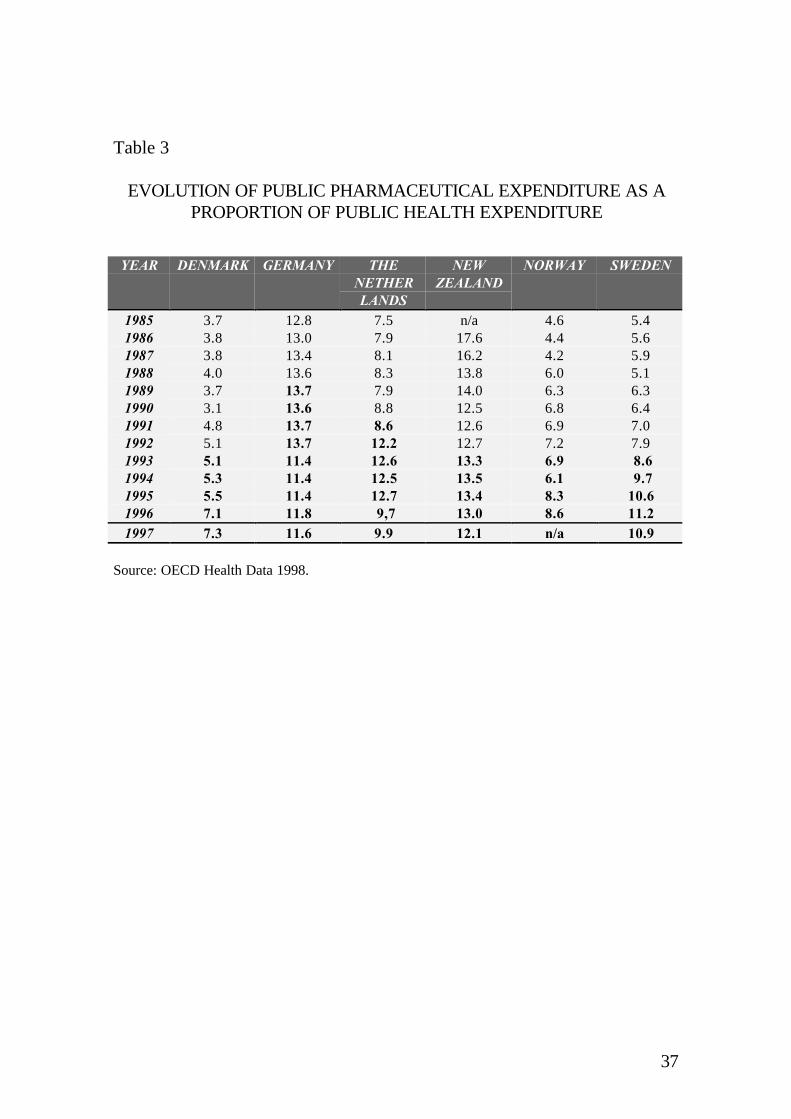
37
Table 3
EVOLUTION OF PUBLIC PHARMACEUTICAL EXPENDITURE AS APROPORTION OF PUBLIC HEALTH EXPENDITURE
YEAR DENMARK GERMANY THENETHERLANDS
NEWZEALAND
NORWAY SWEDEN
1985 3.7 12.8 7.5 n/a 4.6 5.41986 3.8 13.0 7.9 17.6 4.4 5.61987 3.8 13.4 8.1 16.2 4.2 5.91988 4.0 13.6 8.3 13.8 6.0 5.11989 3.7 13.7 7.9 14.0 6.3 6.31990 3.1 13.6 8.8 12.5 6.8 6.41991 4.8 13.7 8.6 12.6 6.9 7.01992 5.1 13.7 12.2 12.7 7.2 7.91993 5.1 11.4 12.6 13.3 6.9 8.61994 5.3 11.4 12.5 13.5 6.1 9.71995 5.5 11.4 12.7 13.4 8.3 10.61996 7.1 11.8 9,7 13.0 8.6 11.21997 7.3 11.6 9.9 12.1 n/a 10.9
Source: OECD Health Data 1998.

38
ANNEXCHARACTERIZATION OF INTERNATIONAL EXPERIENCE ONREFERENCE PRICING SCHEMES
Table A1. AUSTRALIATable A2. BRITISH COLUMBIATable A3. DENMARKTable A4. GERMANYTable A5. THE NETHERLANDSTable A6. NEW ZEALANDTable A7. SWEDEN
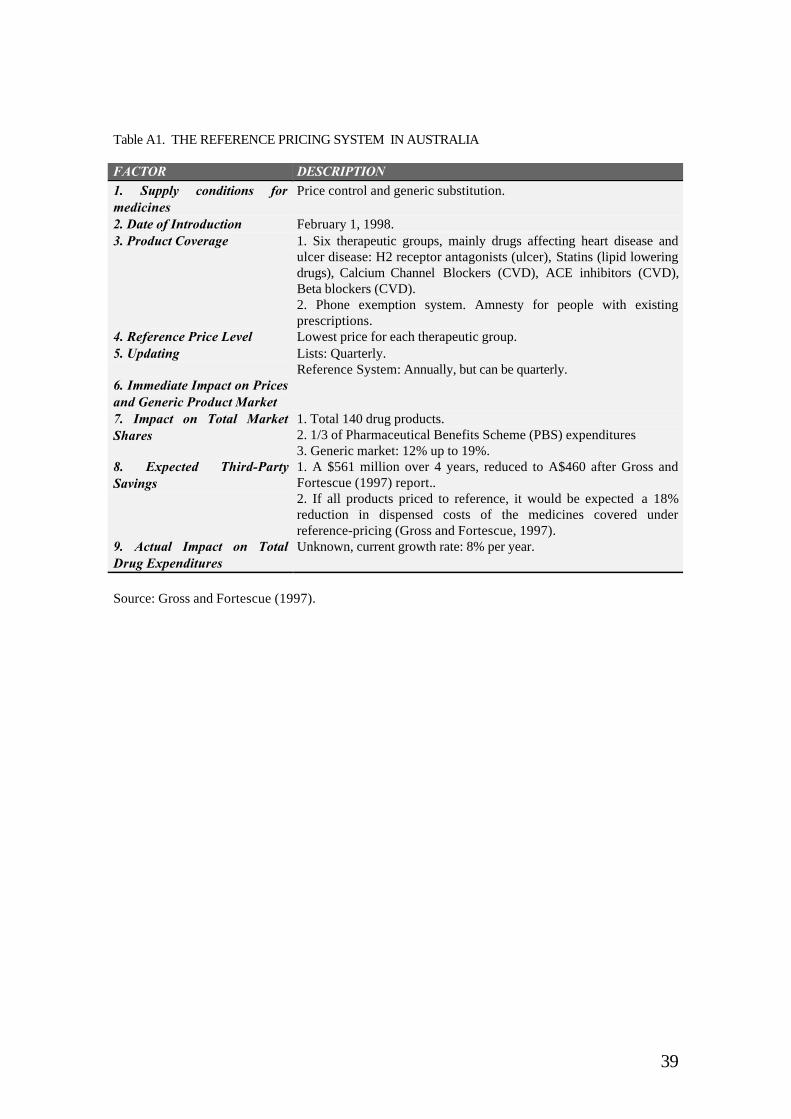
39
Table A1. THE REFERENCE PRICING SYSTEM IN AUSTRALIA
FACTOR DESCRIPTION1. Supply conditions formedicines
Price control and generic substitution.
2. Date of Introduction February 1, 1998.3. Product Coverage 1. Six therapeutic groups, mainly drugs affecting heart disease and
ulcer disease: H2 receptor antagonists (ulcer), Statins (lipid loweringdrugs), Calcium Channel Blockers (CVD), ACE inhibitors (CVD),Beta blockers (CVD).2. Phone exemption system. Amnesty for people with existingprescriptions.
4. Reference Price Level Lowest price for each therapeutic group.5. Updating Lists: Quarterly.
Reference System: Annually, but can be quarterly.6. Immediate Impact on Pricesand Generic Product Market7. Impact on Total MarketShares
1. Total 140 drug products.2. 1/3 of Pharmaceutical Benefits Scheme (PBS) expenditures3. Generic market: 12% up to 19%.
8. Expected Third-PartySavings
1. A $561 million over 4 years, reduced to A$460 after Gross andFortescue (1997) report..2. If all products priced to reference, it would be expected a 18%reduction in dispensed costs of the medicines covered underreference-pricing (Gross and Fortescue, 1997).
9. Actual Impact on TotalDrug Expenditures
Unknown, current growth rate: 8% per year.
Source: Gross and Fortescue (1997).

40
Table A2. THE REFERENCE PRICING SYSTEM IN BRITISH COLUMBIA
FACTOR DESCRIPTION1. Supply conditions formedicines
1. Price control (excessive price guidelines for new products).2. Negative list of products not available for reimbursement3. Generic substitution4. Low Cost Alternative (April 1994): limits reimbursement to thelowest priced drug when there are alternatives available.
2. Date of Introduction October 19953. Product Coverage 1. Drugs composed of different active ingredients from the same
therapeutic category are grouped together:- H2 Antagonists- Oral and transdermal states (excluded in April 1996)- Non-steroidal Anti-inflammatory- Angiotensin converting enzyme (ACE) inhibitors (included inJanuary 1997)- Dihydropyridine calcium channel blokers (CCB), (included inJanuary 1997)2. Physicians can complete a Special Authorization form on behalf ofthe patient to be reimbursed for a non-referenced product
4. Reference Price Level 1. Full price is paid for one drug in each therapeutic group and this isthe maximum price that will be reimbursed for any drugs in that group.2. Usually the reference for reimbursement is the least expensiveproduct: Average price of 30 day supply of referenced drug
5. Updating On going and ad hoc6. Immediate Impact on Pricesand Generic Product Market
1. British Columbia had the highest generic substitution rate in Canadabefore implementing reference pricing.2. The effect on generics has been minimal.3. There are indications of greater price competition into the market.
7. Impact on Total MarketShares
1. Increased market share for referenced products.2. Increased number of prescriptions.3. December 1995: generics = 45% of all prescribed drugs.
8. Expected Third-PartySavings
Government claims to have saved $30 million in the first year and $44million in the second year. However,- $15 million additional funding given to Gps and an extra $250million to pharmacists- administrative costs in just 7 months for special authorizationsestimated at $3.7m
9. Actual Impact on TotalDrug Expenditures
1. Total drug expenditures:1995/96: C$406m1996/97: C$396m1997/98: C$430m2. RP is saving the province about $44 million per year, according todata from the Ministry of Health.
Source: Cambridge Pharma Consultancy (1996), Vanderift and Kanavos (1997), Boulet and Tessier(1997), and Gross and Fortescue (1997).
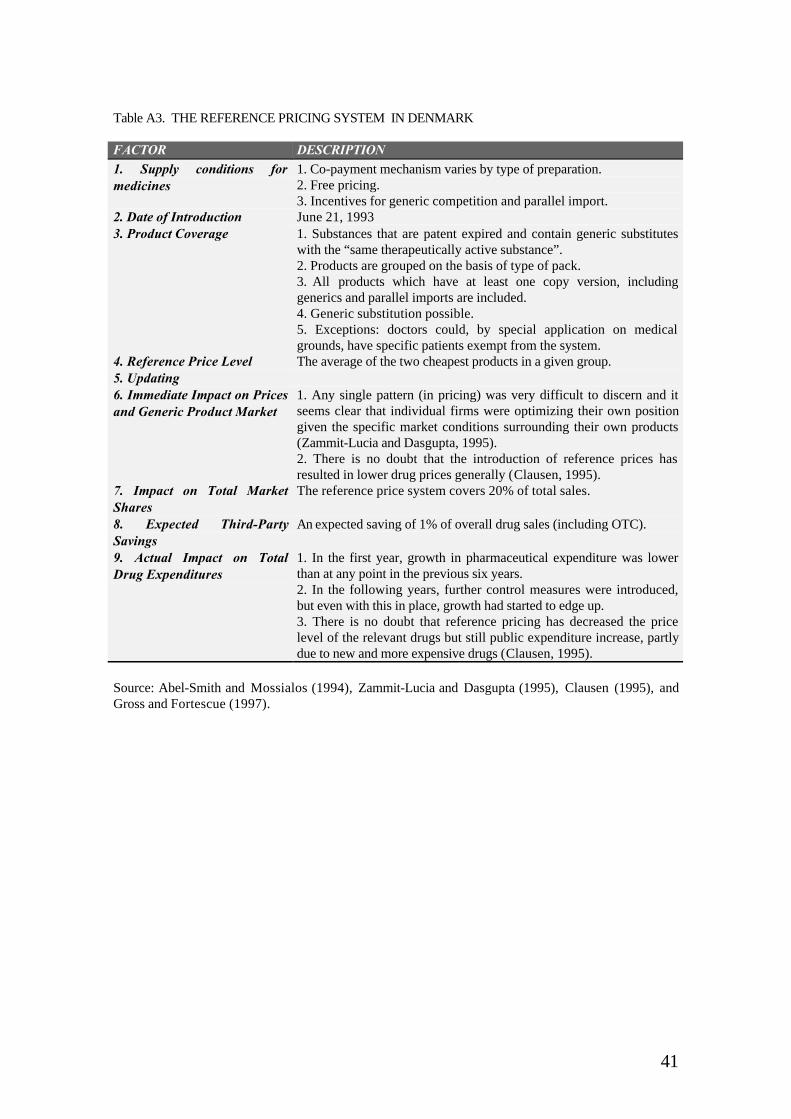
41
Table A3. THE REFERENCE PRICING SYSTEM IN DENMARK
FACTOR DESCRIPTION1. Supply conditions formedicines
1. Co-payment mechanism varies by type of preparation.2. Free pricing.3. Incentives for generic competition and parallel import.
2. Date of Introduction June 21, 19933. Product Coverage 1. Substances that are patent expired and contain generic substitutes
with the “same therapeutically active substance”.2. Products are grouped on the basis of type of pack.3. All products which have at least one copy version, includinggenerics and parallel imports are included.4. Generic substitution possible.5. Exceptions: doctors could, by special application on medicalgrounds, have specific patients exempt from the system.
4. Reference Price Level The average of the two cheapest products in a given group.5. Updating6. Immediate Impact on Pricesand Generic Product Market
1. Any single pattern (in pricing) was very difficult to discern and itseems clear that individual firms were optimizing their own positiongiven the specific market conditions surrounding their own products(Zammit-Lucia and Dasgupta, 1995).2. There is no doubt that the introduction of reference prices hasresulted in lower drug prices generally (Clausen, 1995).
7. Impact on Total MarketShares
The reference price system covers 20% of total sales.
8. Expected Third-PartySavings
An expected saving of 1% of overall drug sales (including OTC).
9. Actual Impact on TotalDrug Expenditures
1. In the first year, growth in pharmaceutical expenditure was lowerthan at any point in the previous six years.2. In the following years, further control measures were introduced,but even with this in place, growth had started to edge up.3. There is no doubt that reference pricing has decreased the pricelevel of the relevant drugs but still public expenditure increase, partlydue to new and more expensive drugs (Clausen, 1995).
Source: Abel-Smith and Mossialos (1994), Zammit-Lucia and Dasgupta (1995), Clausen (1995), andGross and Fortescue (1997).
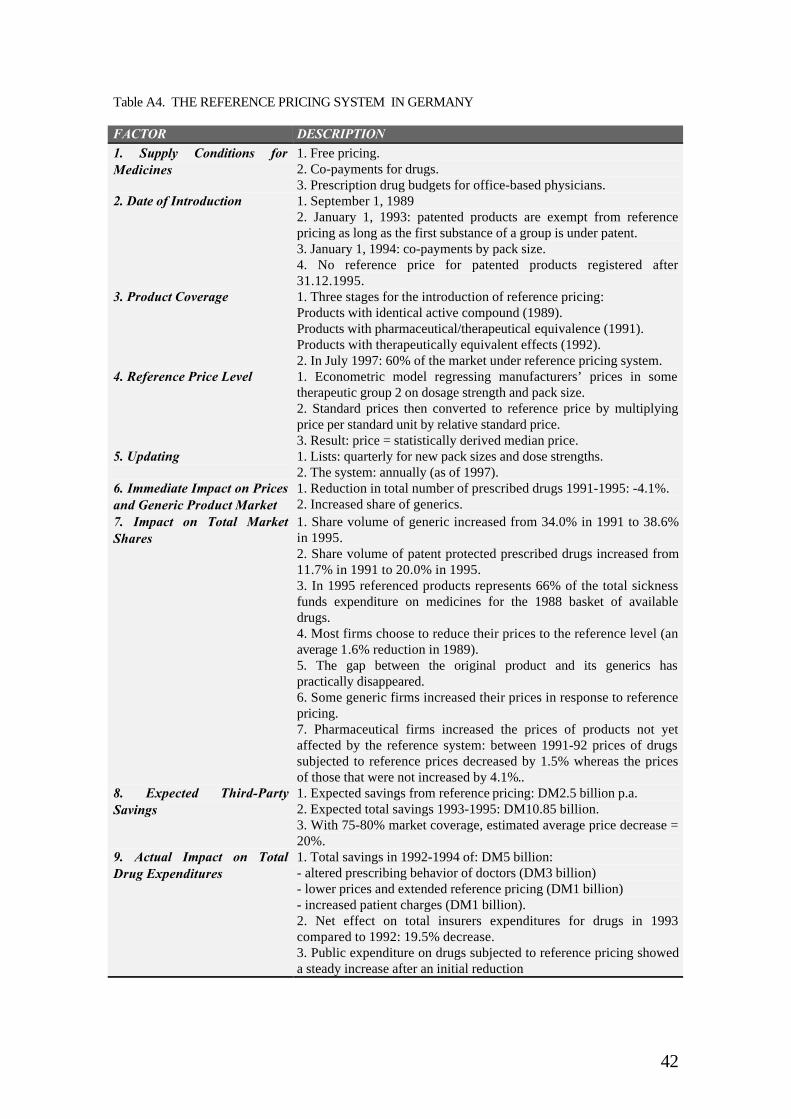
42
Table A4. THE REFERENCE PRICING SYSTEM IN GERMANY
FACTOR DESCRIPTION1. Supply Conditions forMedicines
1. Free pricing.2. Co-payments for drugs.3. Prescription drug budgets for office-based physicians.
2. Date of Introduction 1. September 1, 19892. January 1, 1993: patented products are exempt from referencepricing as long as the first substance of a group is under patent.3. January 1, 1994: co-payments by pack size.4. No reference price for patented products registered after31.12.1995.
3. Product Coverage 1. Three stages for the introduction of reference pricing:Products with identical active compound (1989).Products with pharmaceutical/therapeutical equivalence (1991).Products with therapeutically equivalent effects (1992).2. In July 1997: 60% of the market under reference pricing system.
4. Reference Price Level 1. Econometric model regressing manufacturers’ prices in sometherapeutic group 2 on dosage strength and pack size.2. Standard prices then converted to reference price by multiplyingprice per standard unit by relative standard price.3. Result: price = statistically derived median price.
5. Updating 1. Lists: quarterly for new pack sizes and dose strengths.2. The system: annually (as of 1997).
6. Immediate Impact on Pricesand Generic Product Market
1. Reduction in total number of prescribed drugs 1991-1995: -4.1%.2. Increased share of generics.
7. Impact on Total MarketShares
1. Share volume of generic increased from 34.0% in 1991 to 38.6%in 1995.2. Share volume of patent protected prescribed drugs increased from11.7% in 1991 to 20.0% in 1995.3. In 1995 referenced products represents 66% of the total sicknessfunds expenditure on medicines for the 1988 basket of availabledrugs.4. Most firms choose to reduce their prices to the reference level (anaverage 1.6% reduction in 1989).5. The gap between the original product and its generics haspractically disappeared.6. Some generic firms increased their prices in response to referencepricing.7. Pharmaceutical firms increased the prices of products not yetaffected by the reference system: between 1991-92 prices of drugssubjected to reference prices decreased by 1.5% whereas the pricesof those that were not increased by 4.1%..
8. Expected Third-PartySavings
1. Expected savings from reference pricing: DM2.5 billion p.a.2. Expected total savings 1993-1995: DM10.85 billion.3. With 75-80% market coverage, estimated average price decrease =20%.
9. Actual Impact on TotalDrug Expenditures
1. Total savings in 1992-1994 of: DM5 billion:- altered prescribing behavior of doctors (DM3 billion)- lower prices and extended reference pricing (DM1 billion)- increased patient charges (DM1 billion).2. Net effect on total insurers expenditures for drugs in 1993compared to 1992: 19.5% decrease.3. Public expenditure on drugs subjected to reference pricing showeda steady increase after an initial reduction
43
Source: Schulenburg (1993 and 1997), Zammit-Lucia and Dasgupta (1995), Schöffski (1996), Ulrichand Wille (1996), Maassen (1996), Zweifel and Crivelli (1996), Danzon and Liu (1996), Drummond,Jönsson and Rutten (1997), Garattini, Giuliani and Chiara (1997), Gross and Fortescue (1997).
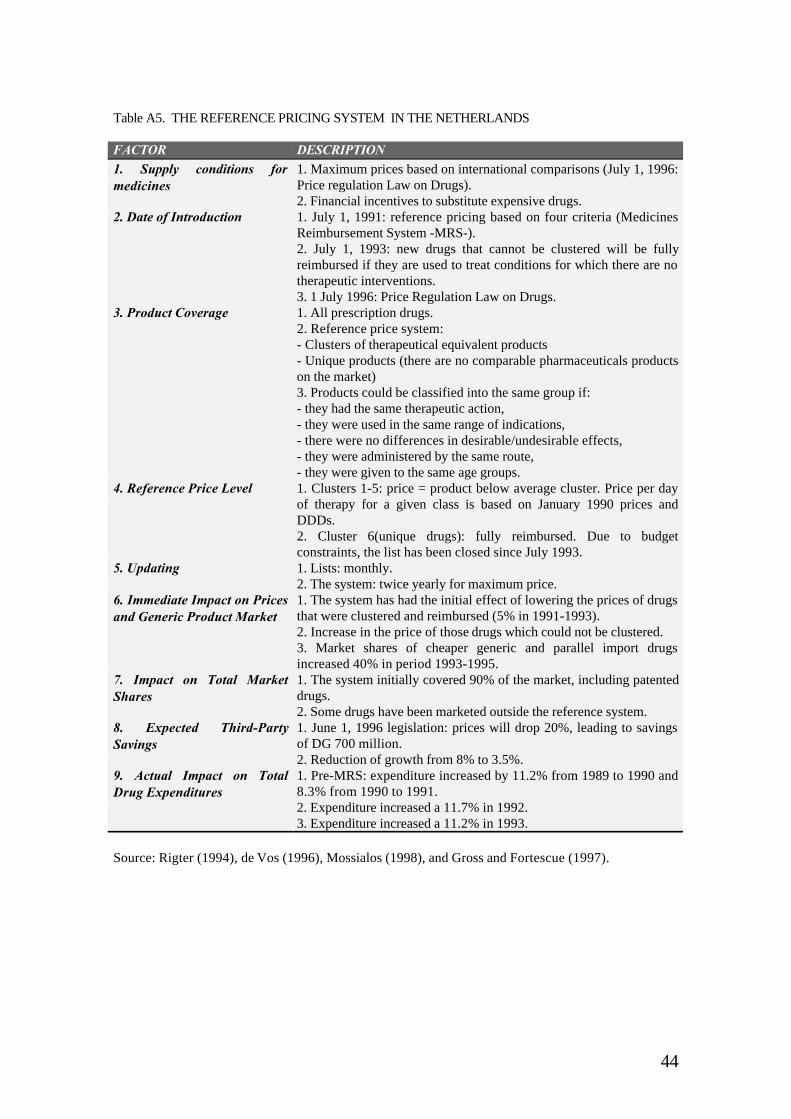
44
Table A5. THE REFERENCE PRICING SYSTEM IN THE NETHERLANDS
FACTOR DESCRIPTION1. Supply conditions formedicines
1. Maximum prices based on international comparisons (July 1, 1996:Price regulation Law on Drugs).2. Financial incentives to substitute expensive drugs.
2. Date of Introduction 1. July 1, 1991: reference pricing based on four criteria (MedicinesReimbursement System -MRS-).2. July 1, 1993: new drugs that cannot be clustered will be fullyreimbursed if they are used to treat conditions for which there are notherapeutic interventions.3. 1 July 1996: Price Regulation Law on Drugs.
3. Product Coverage 1. All prescription drugs.2. Reference price system:- Clusters of therapeutical equivalent products- Unique products (there are no comparable pharmaceuticals productson the market)3. Products could be classified into the same group if:- they had the same therapeutic action,- they were used in the same range of indications,- there were no differences in desirable/undesirable effects,- they were administered by the same route,- they were given to the same age groups.
4. Reference Price Level 1. Clusters 1-5: price = product below average cluster. Price per dayof therapy for a given class is based on January 1990 prices andDDDs.2. Cluster 6(unique drugs): fully reimbursed. Due to budgetconstraints, the list has been closed since July 1993.
5. Updating 1. Lists: monthly.2. The system: twice yearly for maximum price.
6. Immediate Impact on Pricesand Generic Product Market
1. The system has had the initial effect of lowering the prices of drugsthat were clustered and reimbursed (5% in 1991-1993).2. Increase in the price of those drugs which could not be clustered.3. Market shares of cheaper generic and parallel import drugsincreased 40% in period 1993-1995.
7. Impact on Total MarketShares
1. The system initially covered 90% of the market, including patenteddrugs.2. Some drugs have been marketed outside the reference system.
8. Expected Third-PartySavings
1. June 1, 1996 legislation: prices will drop 20%, leading to savingsof DG 700 million.2. Reduction of growth from 8% to 3.5%.
9. Actual Impact on TotalDrug Expenditures
1. Pre-MRS: expenditure increased by 11.2% from 1989 to 1990 and8.3% from 1990 to 1991.2. Expenditure increased a 11.7% in 1992.3. Expenditure increased a 11.2% in 1993.
Source: Rigter (1994), de Vos (1996), Mossialos (1998), and Gross and Fortescue (1997).
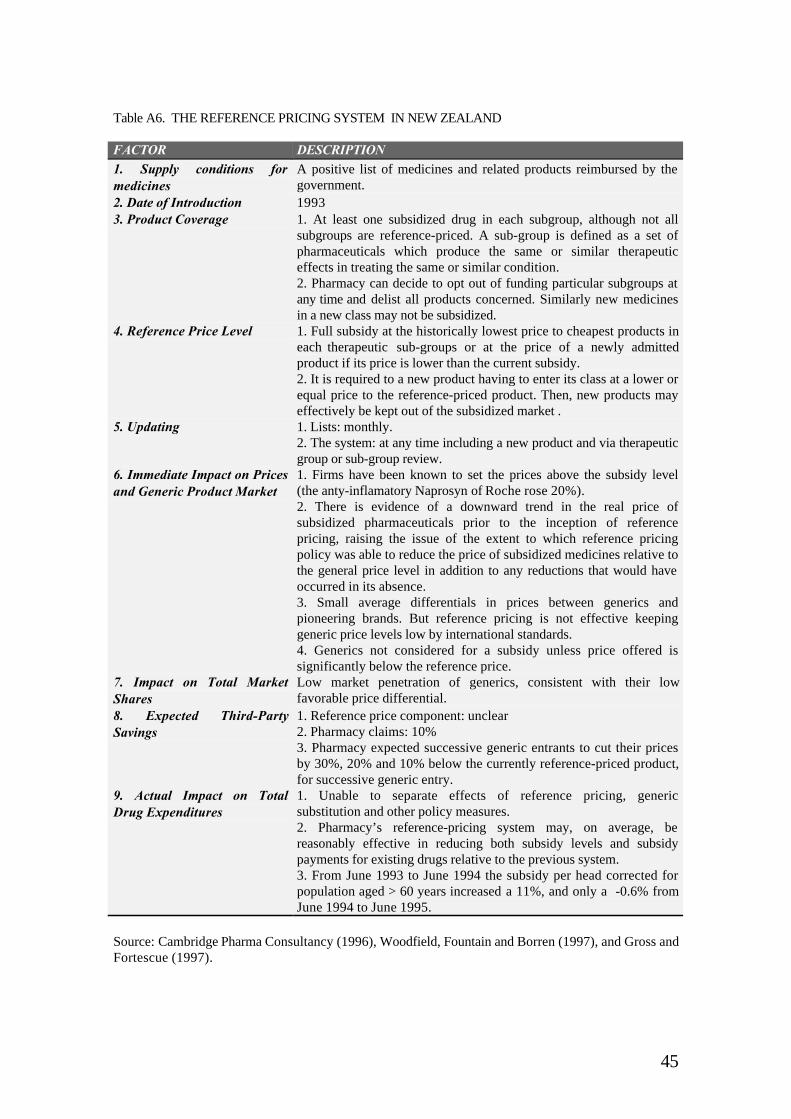
45
Table A6. THE REFERENCE PRICING SYSTEM IN NEW ZEALAND
FACTOR DESCRIPTION1. Supply conditions formedicines
A positive list of medicines and related products reimbursed by thegovernment.
2. Date of Introduction 19933. Product Coverage 1. At least one subsidized drug in each subgroup, although not all
subgroups are reference-priced. A sub-group is defined as a set ofpharmaceuticals which produce the same or similar therapeuticeffects in treating the same or similar condition.2. Pharmacy can decide to opt out of funding particular subgroups atany time and delist all products concerned. Similarly new medicinesin a new class may not be subsidized.
4. Reference Price Level 1. Full subsidy at the historically lowest price to cheapest products ineach therapeutic sub-groups or at the price of a newly admittedproduct if its price is lower than the current subsidy.2. It is required to a new product having to enter its class at a lower orequal price to the reference-priced product. Then, new products mayeffectively be kept out of the subsidized market .
5. Updating 1. Lists: monthly.2. The system: at any time including a new product and via therapeuticgroup or sub-group review.
6. Immediate Impact on Pricesand Generic Product Market
1. Firms have been known to set the prices above the subsidy level(the anty-inflamatory Naprosyn of Roche rose 20%).2. There is evidence of a downward trend in the real price ofsubsidized pharmaceuticals prior to the inception of referencepricing, raising the issue of the extent to which reference pricingpolicy was able to reduce the price of subsidized medicines relative tothe general price level in addition to any reductions that would haveoccurred in its absence.3. Small average differentials in prices between generics andpioneering brands. But reference pricing is not effective keepinggeneric price levels low by international standards.4. Generics not considered for a subsidy unless price offered issignificantly below the reference price.
7. Impact on Total MarketShares
Low market penetration of generics, consistent with their lowfavorable price differential.
8. Expected Third-PartySavings
1. Reference price component: unclear2. Pharmacy claims: 10%3. Pharmacy expected successive generic entrants to cut their pricesby 30%, 20% and 10% below the currently reference-priced product,for successive generic entry.
9. Actual Impact on TotalDrug Expenditures
1. Unable to separate effects of reference pricing, genericsubstitution and other policy measures.2. Pharmacy’s reference-pricing system may, on average, bereasonably effective in reducing both subsidy levels and subsidypayments for existing drugs relative to the previous system.3. From June 1993 to June 1994 the subsidy per head corrected forpopulation aged > 60 years increased a 11%, and only a -0.6% fromJune 1994 to June 1995.
Source: Cambridge Pharma Consultancy (1996), Woodfield, Fountain and Borren (1997), and Gross andFortescue (1997).
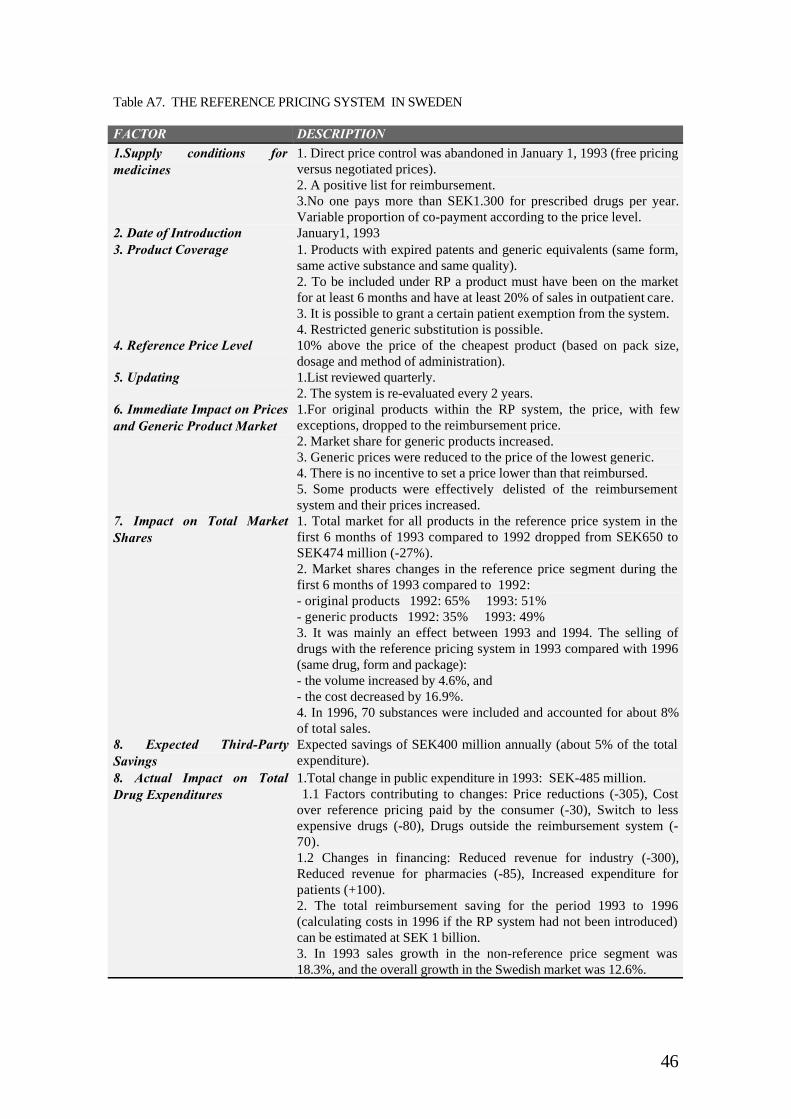
46
Table A7. THE REFERENCE PRICING SYSTEM IN SWEDEN
FACTOR DESCRIPTION1.Supply conditions formedicines
1. Direct price control was abandoned in January 1, 1993 (free pricingversus negotiated prices).2. A positive list for reimbursement.3.No one pays more than SEK1.300 for prescribed drugs per year.Variable proportion of co-payment according to the price level.
2. Date of Introduction January1, 19933. Product Coverage 1. Products with expired patents and generic equivalents (same form,
same active substance and same quality).2. To be included under RP a product must have been on the marketfor at least 6 months and have at least 20% of sales in outpatient care.3. It is possible to grant a certain patient exemption from the system.4. Restricted generic substitution is possible.
4. Reference Price Level 10% above the price of the cheapest product (based on pack size,dosage and method of administration).
5. Updating 1.List reviewed quarterly.2. The system is re-evaluated every 2 years.
6. Immediate Impact on Pricesand Generic Product Market
1.For original products within the RP system, the price, with fewexceptions, dropped to the reimbursement price.2. Market share for generic products increased.3. Generic prices were reduced to the price of the lowest generic.4. There is no incentive to set a price lower than that reimbursed.5. Some products were effectively delisted of the reimbursementsystem and their prices increased.
7. Impact on Total MarketShares
1. Total market for all products in the reference price system in thefirst 6 months of 1993 compared to 1992 dropped from SEK650 toSEK474 million (-27%).2. Market shares changes in the reference price segment during thefirst 6 months of 1993 compared to 1992:- original products 1992: 65% 1993: 51%- generic products 1992: 35% 1993: 49%3. It was mainly an effect between 1993 and 1994. The selling ofdrugs with the reference pricing system in 1993 compared with 1996(same drug, form and package):- the volume increased by 4.6%, and- the cost decreased by 16.9%.4. In 1996, 70 substances were included and accounted for about 8%of total sales.
8. Expected Third-PartySavings
Expected savings of SEK400 million annually (about 5% of the totalexpenditure).
8. Actual Impact on TotalDrug Expenditures
1.Total change in public expenditure in 1993: SEK-485 million. 1.1 Factors contributing to changes: Price reductions (-305), Costover reference pricing paid by the consumer (-30), Switch to lessexpensive drugs (-80), Drugs outside the reimbursement system (-70).1.2 Changes in financing: Reduced revenue for industry (-300),Reduced revenue for pharmacies (-85), Increased expenditure forpatients (+100).2. The total reimbursement saving for the period 1993 to 1996(calculating costs in 1996 if the RP system had not been introduced)can be estimated at SEK 1 billion.3. In 1993 sales growth in the non-reference price segment was18.3%, and the overall growth in the Swedish market was 12.6%.

47
Source: Jönsson (1994), Zammit-Lucia and Dasgupta (1995), Jönsson (1996), Andersson (1998) andGross and Fortescue (1997).