Embed Size (px)
Citation preview

Review of the MSC Productivity Susceptibility
Analysis for Out-of-Scope Species

3
Table of Contents Executive Summary ............................................................................................................................... 4
1 Background .................................................................................................................................... 5
2 Methods ......................................................................................................................................... 6
2.1 Comparison of MSC default tree and PSA scores .............................................................. 6
2.2 Review of scoring attributes in CAB application of MSC PSA ........................................... 7
2.3 Literature review .................................................................................................................... 8
3 Results and Discussion .............................................................................................................. 11
3.1 Comparison of MSC default tree and PSA scores ............................................................ 11
3.2 Review of scoring attributes in CAB application of MSC PSA ......................................... 13
3.3 Review of appropriateness of attributes and thresholds ................................................ 13
3.3.1 Seabirds (Pelagic seabirds & diving seabirds) ........................................................ 13
3.3.2 Marine mammals (cetaceans and pinnipeds) .......................................................... 21
3.3.4 Reptiles (sea turtles and sea snakes) ....................................................................... 28
3.3.5 Amphibians (frogs/toads and salamanders) ........................................................... 36
3.4 Review of alternative attributes ......................................................................................... 39
3.4.1 Seabird-specific attributes ......................................................................................... 39
3.4.2 Cetacean-specific attributes ...................................................................................... 40
3.4.3 Sea turtle-specific attributes ...................................................................................... 41
3.4.4 Sea snake-specific attributes .................................................................................... 41
3.4.5 Other general assessment attributes ........................................................................ 42
4 Recommendations ...................................................................................................................... 42
4.1 General PSA approach ........................................................................................................ 42
4.2 Attribute selection and species grouping ......................................................................... 44
4.2.1 SWOT analysis ............................................................................................................. 49
5 Conclusion ................................................................................................................................... 53
References ........................................................................................................................................... 54
Appendix 1 Productivity and Susceptibility scores per species group .......................................... 59
Appendix 2 Other PSA attributes ....................................................................................................... 64
4
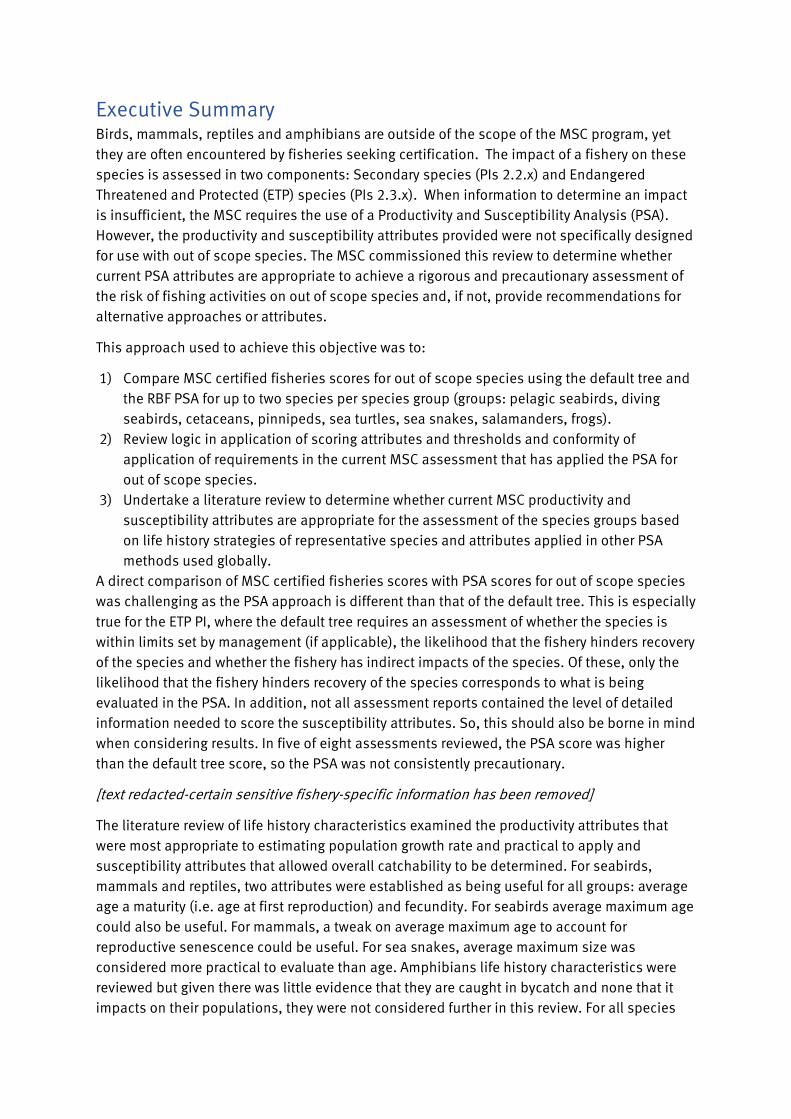
Executive Summary Birds, mammals, reptiles and amphibians are outside of the scope of the MSC program, yet
they are often encountered by fisheries seeking certification. The impact of a fishery on these
species is assessed in two components: Secondary species (PIs 2.2.x) and Endangered
Threatened and Protected (ETP) species (PIs 2.3.x). When information to determine an impact
is insufficient, the MSC requires the use of a Productivity and Susceptibility Analysis (PSA).
However, the productivity and susceptibility attributes provided were not specifically designed
for use with out of scope species. The MSC commissioned this review to determine whether
current PSA attributes are appropriate to achieve a rigorous and precautionary assessment of
the risk of fishing activities on out of scope species and, if not, provide recommendations for
alternative approaches or attributes.
This approach used to achieve this objective was to:
1) Compare MSC certified fisheries scores for out of scope species using the default tree and
the RBF PSA for up to two species per species group (groups: pelagic seabirds, diving
seabirds, cetaceans, pinnipeds, sea turtles, sea snakes, salamanders, frogs).
2) Review logic in application of scoring attributes and thresholds and conformity of
application of requirements in the current MSC assessment that has applied the PSA for
out of scope species.
3) Undertake a literature review to determine whether current MSC productivity and
susceptibility attributes are appropriate for the assessment of the species groups based
on life history strategies of representative species and attributes applied in other PSA
methods used globally.
A direct comparison of MSC certified fisheries scores with PSA scores for out of scope species
was challenging as the PSA approach is different than that of the default tree. This is especially
true for the ETP PI, where the default tree requires an assessment of whether the species is
within limits set by management (if applicable), the likelihood that the fishery hinders recovery
of the species and whether the fishery has indirect impacts of the species. Of these, only the
likelihood that the fishery hinders recovery of the species corresponds to what is being
evaluated in the PSA. In addition, not all assessment reports contained the level of detailed
information needed to score the susceptibility attributes. So, this should also be borne in mind
when considering results. In five of eight assessments reviewed, the PSA score was higher
than the default tree score, so the PSA was not consistently precautionary.
[text redacted-certain sensitive fishery-specific information has been removed]
The literature review of life history characteristics examined the productivity attributes that
were most appropriate to estimating population growth rate and practical to apply and
susceptibility attributes that allowed overall catchability to be determined. For seabirds,
mammals and reptiles, two attributes were established as being useful for all groups: average
age a maturity (i.e. age at first reproduction) and fecundity. For seabirds average maximum age
could also be useful. For mammals, a tweak on average maximum age to account for
reproductive senescence could be useful. For sea snakes, average maximum size was
considered more practical to evaluate than age. Amphibians life history characteristics were
reviewed but given there was little evidence that they are caught in bycatch and none that it
impacts on their populations, they were not considered further in this review. For all species

5
groups, the current susceptibility attributes were appropriate but more guidance on
application would be useful.
For the review of application of other PSA approaches for out of scope species, a total of 14
different assessments were reviewed: three for seabirds, two for sea turtles, one for sea
snakes, two for cetaceans and six multi-species assessments including one or more out of
scope species groups, but also including fish. For the taxa-specific assessments, a number of
attributes or thresholds differed from those used in the current PSA. Some of these were
considered useful, either on their own or as a way of adapting or interpreting current attributes
or thresholds (see Appendix 2).
In conclusion, the review of MSC PSA compared to default tree scores, despite caveats,
indicates that the current PSA approach is not precautionary when applied to out of scope
species. In addition, the review of the only current application of the PSA for out of scope
species in an MSC assessment shows that it is challenging to apply the PSA for out of scope
species, which leads to incorrect or inconsistent outcomes. The overall review of the
appropriateness of attributes considering the life history characteristics of the different
species groups also showed that many of the current attributes and thresholds are either
inappropriate or redundant. To address this, it is recommended that attributes and thresholds
are revised (see Table 11 for recommended attributes by species group). In addition, the
following recommendations were made: 1) Consider and clearly specify the objectives for
using the PSA, as linked to PIs in the default assessment tree; 2) Undertake new calibration
precaution level in RBF scores for PI 2.2.1 and 2.3.1, using a range of out-of-scope species; 3)
Specify that scoring of PSA attributes should be done at the smallest relevant unit
(population); 4) Review elements of PIs where out of scope species are scored that are not
currently captured in PSA and consider how they could be incorporated (if deemed relevant) in
PSA attributes, thresholds or associated guidance.
Background Birds, mammals, reptiles and amphibians cannot be certified to carry the Marine Stewardship
Council (MSC) ecolabel and are therefore considered ‘out of scope’ species. However, these
species may be encountered by fisheries seeking certification, and the impact of the fishery on
the populations of these species must be considered. The impact of a fishery on these species
is assessed in two components: Secondary species (Performance Indicator (PIs) 2.2.x) and
Endangered Threatened and Protected (ETP) species (PIs 2.3.x) (MSC 2018a).
Conformity assessment bodies (CABs) conducting MSC fishery assessments are required to
determine whether each species can be assessed using the default assessment tree or
whether the Risk Based Framework (RBF) must be triggered. The criteria for secondary species
to be allowed to use the default assessment tree is that there are biologically based limits
available, derived either from analytical stock assessment or using empirical approaches. The
criteria for ETP species to be allowed to use the default assessment tree is that the impact of
the fishery in assessment on the ETP species can be analytically determined (MSC 2018a).
If the RBF is triggered, the out of scope species is assessed using a Productivity Susceptibility
Analysis (PSA). The PSA is a semi-quantitative, relative risk method developed under the
Ecological Risk Assessment for the Effects of Fishing (ERAEF) in Australian fisheries by Hobday
6
et al (2007, 2011) and adapted for use by the MSC to ensure that its assessment process is
accessible to data-deficient fisheries that are operating in a precautionary manner (MSC
2018b). Risk is defined by Hobday et al 2011 as the probability that a (specified) fishery
management objective is not achieved, however in the MSC context it is not explained how the
risk categories relate to the probability of the fishery failing to achieve the MSC objectives
(Hordyk and Carruthers 2018).
The PSA is used to assess the relative risk that fishing activities cause an unacceptable
amount of change to the population dynamics of the species in question (Hobday et al 2011).
The PSA assumes that this risk is based on the inherent productivity of a species and the
susceptibility of the species to fishing activities (Hobday et al 2007). Attributes that contribute
or reflect productivity and susceptibility were thus selected to allow calculation of the relative
risk.
The attributes selected and the threshold values for scoring the productivity attributes as low,
medium and high were developed after considering the distribution of attribute values for a
wide range of taxa within Australia (Hobday et al 2007). The MSC adopted these same
attributes and thresholds. The MSC Guidance to FCP v2.1 (2018b) recognizes that “in testing
this approach in subsequent discussion…and validating the attributes against the intrinsic
rate of increase (r), we have improved our understanding to recognise that taxa-specific cut-
offs and geographic (tropical vs temperate vs deep sea) maybe appropriate. This can be further
improved by additional research, and MSC work is ongoing to progress this.”
The MSC have commissioned this review with the objective of determining whether the current
PSA attributes are appropriate to achieve a rigorous and precautionary assessment of the risk
of fishing activities on out of scope species and if not, provide recommendations for
alternative approaches or attributes.
Methods
Comparison of MSC default tree and PSA scores The MSC databases ‘MSC_P2_Species’, ‘P2 ETP Species Designations’ and
‘20190624_All_ScoringIssues’ were used to identify up to two out of scope species within
each species group for review. The species groups were identified in the Terms of Reference for
this review as: Pelagic seabirds, Diving seabirds, Cetaceans, Pinnipeds, Sea turtles, Sea
snakes, Salamanders and Frogs. Selection of species for review within these groups was based
on the following criteria:
• Recent assessment (FCR v2.0 ideal, but some CR v1.3 acceptable)
• Ensure diversity of species within species group (e.g. different sizes, life history
strategies)
• Ensure diversity of fishing gears being assessed
• Risk (e.g. if there was a condition applied to the default tree score for the species)
• Enough information in the assessment to score susceptibility attributes
These criteria were used to select species for all species groups except for amphibians. Based
on review of all available databases, no MSC certified fishery has recorded an interaction with
an amphibian in its assessment. A literature review only revealed one paper reporting on
amphibian bycatch – mudpuppies were caught in a Canadian recreational ice fishery (Lennox

7
et al 2018). Although many amphibian species are in decline globally, bycatch in fisheries is
not listed amongst the factors driving this (Collins & Storfer 2003; Sodhi et al 2008). The
mudpuppy was selected as one species due to its lone bycatch report, and the other species
selected were those known to be targeted, either as bait or the pet trade (Eastern tiger
salamander), or directly for human consumption (Indian bullfrog, Goliath frog).
For all species selected an Excel database was compiled with information from the relevant
fishery assessment including PI, gear, species and default tree score for the relevant scoring
issue and scoring element within the assessment. For example, for ETP species, the scoring
element (species) score for PI 2.3.1, scoring issue b was used. This is because in PI 2.3.1
scoring issue a is about whether a species is within limits, which is a different question than
what is being assessed as a risk in the PSA. The PSA risk assessment is more closely aligned
with PI 2.3.1 SI b, which looks at the likelihood that the fishery is hindering recovery of the ETP
population.
A list of the current PSA attributes was added for each species in the Excel database. A risk
score was then recorded for each attribute, along with a rationale. For productivity attributes,
information was collected from the literature (see 2.3 Literature Review).
For susceptibility attributes, information was taken from the relevant fishery assessment. This
latter point proved challenging, as most assessments reviewed did not have the level of detail
needed to score all susceptibility attributes, particularly encounterability and selectivity. In
some cases, assumptions could be made based on information provided but in others it was
not possible to conduct a meaningful analysis (i.e. one where not all scores would default to
high risk due to lack of information in the report, where there would likely be more information
in reality).
The PSA combined risk scores and resulting MSC scores, calculated using the MSC RBF
worksheet v2, were recorded (where possible, given not all susceptibility attributes were
scored) so that they could be compared to the default tree score.
In addition, each attribute and threshold were reviewed to see if they were logical and
precautionary for the species being assessed. This logic review included whether the attribute
and thresholds were applicable for the species based on information from the literature (see
2.3 Literature Review). This was also recorded in the Excel file so the data could be analysed.
Review of scoring attributes in CAB application of MSC PSA The MSC database ‘RBF Data_FSR_2019’ was used to identify MSC fishery assessments that
used the PSA for out of scope species. The PSA methodology has only been applied to out of
scope species in one fishery assessment to date, [text redacted].
An Excel database was compiled with information from [text redacted] including: species,
species group, Performance Indicator (PI), attribute, attribute score, rationale for attribute
score and overall risk score and MSC score. The attribute scores and rationales assigned were
reviewed and, where the review resulted in a change of score, these were recorded in the Excel
file along with rationale. Any resulting changes to overall risk score and MSC score, calculated
using the MSC RBF worksheet v2, were also noted.

8
Each attribute and threshold were reviewed to see if they were logical for the species being
assessed. This logic review included whether the attribute and thresholds were applicable for
the species, and – if applicable – if there were any issues with how they were implemented.
This was also recorded in the Excel file so the data could be analysed.
Literature review A literature review was undertaken to address the following two objectives:
1. Define life history strategies of representative species
2. Identify attributes applied in other PSA methods used globally.
Objective 1 required sources with demographic information for a multitude of species. The
Ecological Risk Assessment for Effects of Fishing (ERAEEF) on which the MSC Risk-Based
Framework is based approach relies on FishBase1, and a similar database exists for out of
scope species: SeaLifeBase2. The International Union for the Conservation of Nature (IUCN)
RedList3 is also a useful source of information on specific species/populations. In addition,
some demographic information on species groups and impacts of fisheries on species can be
found in through sites of non-governmental organisations (NGOs) or international agreements,
e.g. State of the World’s Sea Turtles (SWOT)4; BirdLife International Data Zone5; Agreement on
Conservation of Albatross and Petrels (ACAP) species assessments6; International Whaling
Commission (IWC)7; the Agreement on the Conservation of Small Cetaceans of the Baltic, North
East Atlantic, Irish and North Seas (ASCOBANS)8; Amphibian Survival Network (Amphibiaweb)9.
Where information is not obtainable from these sources, then a search using the databases
and tools described for objective 2 will be conducted for the specific species and the
demographic characteristics related to the attribute in question.
The databases and search engines included for the literature search for objective 2 includes
Web of Science (WoS), Google Scholar10 and Google11. WoS and Google Scholar would return
results primarily for scientific papers. Google was used as a Web browser in order to identify
results from grey literature, including governments, RFMOs, international agreements or
instruments (e.g. ACAP, ASCOBANS, IWC) and NGOs. In addition, where any reviews of risk-
based approaches for any of the species groups have been undertaken (e.g. for seabirds,
Small et al 2013), the tertiary sources within those documents will be identified and included
in the literature review. This should also help identify approaches used that are from grey
literature.
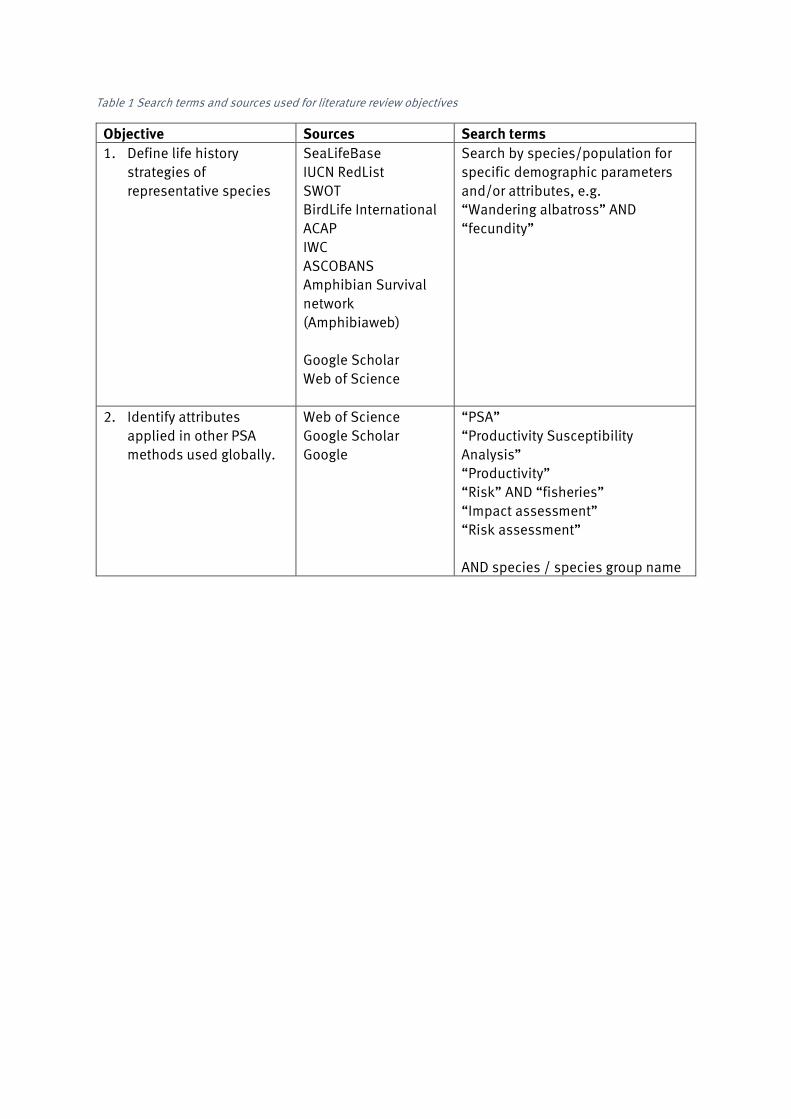
The list of search terms and sources used for each topic are identified in Table 1.
1 www.fishbase.org/ 2 https://www.sealifebase.ca/ 3 https://www.iucnredlist.org/ 4 https://www.seaturtlestatus.org/ 5 http://datazone.birdlife.org/species/search 6 https://www.acap.aq/en/acap-species 7 https://iwc.int/status 8 https://www.ascobans.org/en/species 9 https://amphibiaweb.org/ 10 https://scholar.google.com/ 11 https://www.google.co.uk/

9
10
Table 1 Search terms and sources used for literature review objectives
Objective Sources Search terms
1. Define life history
strategies of
representative species
SeaLifeBase
IUCN RedList
SWOT
BirdLife International
ACAP
IWC
ASCOBANS
Amphibian Survival
network
(Amphibiaweb)
Google Scholar
Web of Science
Search by species/population for
specific demographic parameters
and/or attributes, e.g.
“Wandering albatross” AND
“fecundity”
2. Identify attributes
applied in other PSA
methods used globally.
Web of Science
Google Scholar
“PSA”
“Productivity Susceptibility
Analysis”
“Productivity”
“Risk” AND “fisheries”
“Impact assessment”
“Risk assessment”
AND species / species group name

11
Results and Discussion
Comparison of MSC default tree and PSA scores It is difficult to directly compare the PSA scores with the default tree scores. The approach and
requirements being assessed are slightly different – the PSA provides an estimate of relative
risk of impact from a UoA, which is then converted into the MSC score. The PIs within the
default tree are assessed against specific criteria and an absolute MSC score is assigned
directly. For the Secondary species outcome PI (PI 2.2.1) the requirement evaluated is the
likelihood that species is above its biologically based limit (or if below limit,
measures/strategy in place to ensure fishery does not hinder recovery). It is more complicated
in the Endangered, Threatened and Protected species PI (PI 2.3.1). There are three separate
scoring issues in PI 2.3.1 – the first is scored if there are limits for protection and rebuilding of
the ETP species and relate to whether the impacts from the fishery are likely to be within those
limits. The second is about the likelihood that direct effects of the UoA do not hinder recovery
of the species – this is the most similar aspect to what is being evaluated in the PSA. The third
scoring issue is about whether the fishery has indirect (e.g. food web) impacts on the species.
An overall score is assigned based on an assessment of the species against these three
scoring issues. However, if the PSA is used, then a score for species is assigned for the whole
PI, although the PSA does not include an assessment of whether the impacts are within limits
or whether there are indirect impacts. Therefore, results of a direct comparison between the
default tree and the PSA scores should be treated with caution. Generally speaking, however, it
would be expected that the PSA-derived MSC scores would be lower than those for the default
tree as the PSA was designed to be more precautionary.
A further difficulty with this analysis was that there was not enough information provided in all
assessment reports to score susceptibility attributes, namely there was not enough detail on
the area of fishery operation and gear configuration in all reports. In an actual PSA,
stakeholders would be invited to provide information and expertise on scoring the
susceptibility attributes. In the full assessments reviewed, even where there was some
information on susceptibility, results should be interpreted with caution as they are based on
assumptions and information provided, rather than interviews with wide group of expert
stakeholders.
With these caveats in mind, Table 2 provides an overview of the PSA and default tree
Performance Indicator 2.3.1 overall and scoring issue b score for eight species from five
species groups where this was possible and results would be meaningful for this analysis (i.e.
where there were too many attributes that would score the default high risk due to lack of
information only, it was not considered meaningful). In five of eight assessments reviewed, the
PSA score was higher than the default tree score (both PI and scoring issue), although in all but
one of these the scoring range (<60, 60-80, 80+) assigned was consistent with the default
score. However, since the actual value PSA score is used for the PI, the higher value could
make a difference to the aggregate Principle score. This indicates that the PSA may not be
precautionary for out of scope species.

Table 2 PSA vs default tree score (PI and scoring issue). Grey shading indicates where PSA score is higher than that given for the default tree. *note that the score provided is based on that for the particular scoring element (species).
Species Species group Assessment PI PSA score Risk category PSA
MSC
score
Scoring
issue b
score*
Overall
PI score*
White-chinned petrel
(Procellaria aequinoctialis)
Pelagic seabird [text redacted] 2.3.1 3.06 Medium (60-79) 65 60 75
Marbled murrelet
(Brachyramphus marmoratus)
Diving seabird [text redacted] 2.3.1 2.26 Low (>=80) 90 80 80
Common loon (Gavia immer)
Diving seabird [text redacted] 2.3.1 2.82 Medium (60-79) 74 60 65
North Atlantic right
whale (Eubalaena glacialis)
Cetacean [text redacted] 2.3.1 3.14 Medium (60-79) 62 80 75
Harbour porpoise
(Phocoena phocoena)
Cetacean [text redacted] 2.3.1 2.94 Medium (60-79) 70 80 90
Leatherback turtle
(Dermochelys coriacea)
Sea turtle [text redacted] 2.3.1 2.81 Medium (60-79) 75 60 70
Short-nosed sea
snake (Aipysurus apraefrontalis)
Sea snake [text redacted] 2.3.1 2.49 Low (>=80) 84 60 75
Elegant sea snake
(Hydrophis elegans)
Sea snake [text redacted] 2.3.1 2.69 Medium (60-79) 78 60 75
13
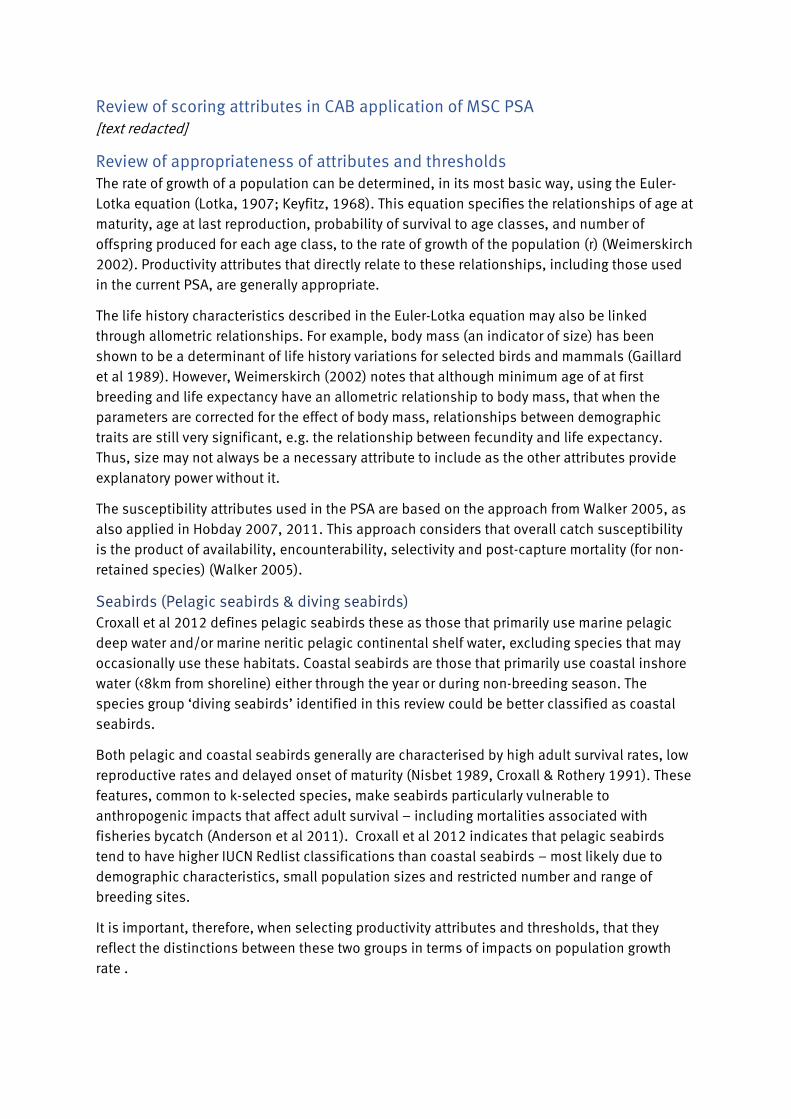
Review of scoring attributes in CAB application of MSC PSA [text redacted]
Review of appropriateness of attributes and thresholds The rate of growth of a population can be determined, in its most basic way, using the Euler-
Lotka equation (Lotka, 1907; Keyfitz, 1968). This equation specifies the relationships of age at
maturity, age at last reproduction, probability of survival to age classes, and number of
offspring produced for each age class, to the rate of growth of the population (r) (Weimerskirch
2002). Productivity attributes that directly relate to these relationships, including those used
in the current PSA, are generally appropriate.
The life history characteristics described in the Euler-Lotka equation may also be linked
through allometric relationships. For example, body mass (an indicator of size) has been
shown to be a determinant of life history variations for selected birds and mammals (Gaillard
et al 1989). However, Weimerskirch (2002) notes that although minimum age of at first
breeding and life expectancy have an allometric relationship to body mass, that when the
parameters are corrected for the effect of body mass, relationships between demographic
traits are still very significant, e.g. the relationship between fecundity and life expectancy.
Thus, size may not always be a necessary attribute to include as the other attributes provide
explanatory power without it.
The susceptibility attributes used in the PSA are based on the approach from Walker 2005, as
also applied in Hobday 2007, 2011. This approach considers that overall catch susceptibility
is the product of availability, encounterability, selectivity and post-capture mortality (for non-
retained species) (Walker 2005).
Seabirds (Pelagic seabirds & diving seabirds)
Croxall et al 2012 defines pelagic seabirds these as those that primarily use marine pelagic
deep water and/or marine neritic pelagic continental shelf water, excluding species that may
occasionally use these habitats. Coastal seabirds are those that primarily use coastal inshore
water (<8km from shoreline) either through the year or during non-breeding season. The
species group ‘diving seabirds’ identified in this review could be better classified as coastal
seabirds.
Both pelagic and coastal seabirds generally are characterised by high adult survival rates, low
reproductive rates and delayed onset of maturity (Nisbet 1989, Croxall & Rothery 1991). These
features, common to k-selected species, make seabirds particularly vulnerable to
anthropogenic impacts that affect adult survival – including mortalities associated with
fisheries bycatch (Anderson et al 2011). Croxall et al 2012 indicates that pelagic seabirds
tend to have higher IUCN Redlist classifications than coastal seabirds – most likely due to
demographic characteristics, small population sizes and restricted number and range of
breeding sites.
It is important, therefore, when selecting productivity attributes and thresholds, that they
reflect the distinctions between these two groups in terms of impacts on population growth
rate .

14
When the current PSA is applied to selected species, in general the species with lower
maximum growth rate (rmax) had higher risk scores (Appendix 1, Table A1.1). However, it is
likely that there would be greater differentiation in overall productivity scores if only key
attributes were selected and the thresholds were calibrated to the species group.
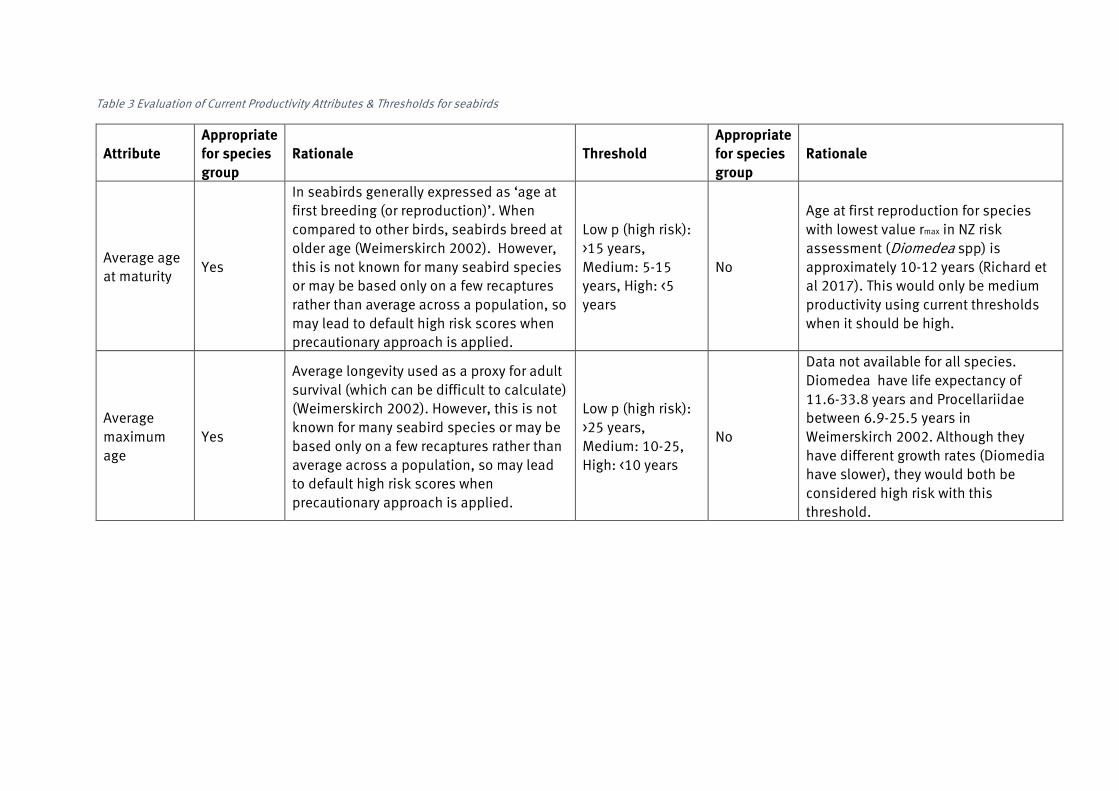
The current attributes considered most appropriate for seabirds based on the outputs of the
literature review and analysis of application of the attributes using the current PSA method on
example species, were average age at maturity, average maximum age and fecundity (Table
4). None of the current thresholds were appropriate for seabird species (Table 4).
In a review of risk-based approaches for seabirds Small et al 2013 considered susceptibility as
measuring the degree overlap of fishing effort and seabird distribution, but also taking into
account selectivity (e.g. such as longline hook size affects the size range of species caught)
and encounterability (e.g. surface feeders like albatrosses and petrels are captured by
longlines whereas diving species like shags, penguins, shearwaters, alcids and ducks are
more likely to encounter to gillnets). These susceptibility considerations are in line with those
currently used in the MSC requirements, but the thresholds for most seabird risk assessments
are more specific.
In addition, Small et al 2013 reviews how seabird distribution should be considered in a PSA,
depending on the level of information available, from expert opinion through to modelling of
distribution based on analysis of habitat preference (including use of tracking data). The
middle levels of data would include using range maps and assuming homogeneous
distribution throughout the range, using range maps to represent non-breeding distribution
and a foraging radius to represent breeding distribution, or using a combination of range map,
foraging radius and tracking data, as available. Small et al 2013 provide general advice on the
approach, given each of the types of information used has its own drawbacks. Using tracking
data to estimate foraging radius based on a mean maximum of all trips, where this information
is available, is recommended. Also, estimation of distribution at least quarterly is
recommended given the highly seasonal nature of seabird (and fishing effort) distribution. For
the SeafoodWatch standard, Monterey Bay Aquarium are considering adding an attribute on
seasonality to account for seasonal overlap (Monterey Bay Aquarium 2019). This method could
be compared to that of having the availability attribute score account for the period with
highest overlap.
All of the current susceptibility attributes were considered appropriate for seabirds (Table 5).
Only the post-capture mortality thresholds, however, were considered appropriate (Table 5).
15
Table 3 Evaluation of Current Productivity Attributes & Thresholds for seabirds
Attribute
Appropriate
for species
group
Rationale Threshold
Appropriate
for species
group
Rationale
Average age
at maturity Yes
In seabirds generally expressed as ‘age at
first breeding (or reproduction)’. When
compared to other birds, seabirds breed at
older age (Weimerskirch 2002). However,
this is not known for many seabird species
or may be based only on a few recaptures
rather than average across a population, so
may lead to default high risk scores when
precautionary approach is applied.
Low p (high risk):
>15 years,
Medium: 5-15
years, High: <5
years
No
Age at first reproduction for species
with lowest value rmax in NZ risk
assessment (Diomedea spp) is
approximately 10-12 years (Richard et
al 2017). This would only be medium
productivity using current thresholds
when it should be high.
Average
maximum
age
Yes
Average longevity used as a proxy for adult
survival (which can be difficult to calculate)
(Weimerskirch 2002). However, this is not
known for many seabird species or may be
based only on a few recaptures rather than
average across a population, so may lead
to default high risk scores when
precautionary approach is applied.
Low p (high risk):
>25 years,
Medium: 10-25,
High: <10 years
No
Data not available for all species.
Diomedea have life expectancy of
11.6-33.8 years and Procellariidae
between 6.9-25.5 years in
Weimerskirch 2002. Although they
have different growth rates (Diomedia
have slower), they would both be
considered high risk with this
threshold.

16
Attribute
Appropriate
for species
group
Rationale Threshold
Appropriate
for species
group
Rationale
Fecundity Yes
Seabirds tend to have low fecundity (taking
into account clutch size, breeding
frequency and breeding success) but there
is variability within this parameter, e.g.
with the great albatrosses laying one egg
every two years compared to species of gull
which lay three eggs every year and may be
able to reproduce a second time within the
year if their first clutch is lost
(Weimerskrich 2002).
Low p (high risk):
<100 eggs per
year; Medium:
100-20,000 eggs
per years; High
>20,000 eggs per
year
No
Only considers number of eggs, all
seabirds lay less than 100, so all
would be high risk. Also should
consider other elements of fecundity
such as frequency of breeding.
Average
maximum
size
No
Body mass (size) is significant but not
fundamental determinant of variation in
demographic rates of seabirds
(Weimerskirch 2002). However, age at first
breeding and maximum age have
significant relationship to population
growth rate when parameters are corrected
for body mass (Weimerskirch 2002), so
size-related parameters may be redundant
here. Moreover, it is not clear what aspect
of size should be considered for seabirds,
e.g. wingspan, body length, mass.
Low p (high risk):
>300cm, Medium:
100-300 cm; High:
< 100 cm
No
Not clear how this should be measured
for seabirds – body length or
wingspan. If using longer of the two
measurements to be precautionary,
largest seabird would be wandering
albatross (wingspan >300cm) but most
other species would fit in low/medium
categories.

17
Attribute
Appropriate
for species
group
Rationale Threshold
Appropriate
for species
group
Rationale
Average size
at maturity No As for average maximum size.
Low p (high risk):
>200 cm, Medium:
40-200 cm, High
<40 cm
No
Not clear how this should be measured
for seabirds – body length or
wingspan. Thresholds may be more
appropriate than for average maximum
age as set lower, although, as seabirds
tend to breed later, size at maturity is
close to maximum size so thresholds
should be aligned.
Reproductive
strategy No
All seabirds are egg-layers. Hobday et al
(2007, 2011) group birds with live bearers.
Therefore, all species within this group
would be high risk. If the frequency of
breeding and clutch size are taken into
account in fecundity, this attribute
becomes redundant.
Low p (high risk):
Live bearer;
Medium:
Demersal egg
layer; High:
Broadcast
spawners
No
Seabirds do not fit into any of the
categories provided – they are not live
bearers, demersal egg layers or
broadcast spawners. Hobday et al
2007, 2011 include bird species with
live bearers. All would be high risk.

18
Attribute
Appropriate
for species
group
Rationale Threshold
Appropriate
for species
group
Rationale
Trophic level No
TL often increases with longevity and size
but these attributes are already covered
(Duffy & Griffiths 2017, Hordyk and
Carruthers 2018).
Seabirds cover a range of trophic levels but
data on a specific trophic level is not
always provided (more common to use
rations of stable isotopes of nitrogen and
carbon to identify trophic levels) (Shealer
2002). Trophic level can be different
between populations within the same
species, or even within the same
population over different seasons, based
on where they forage and prevailing
environmental conditions (Gagne et al
2018).
Low p (high risk):
>3.25, Medium:
2.75-3.25, High
<2.75
No
This information was not available for
most species. Where it was (white-
chinned petrel), it was 3.6 so would be
high. The CAB assessment did not
specify a trophic level but listed all
seabirds as high. They would in fact
have greater diversity than this, as they
feed at a range of trophic levels
(Shealer 2002).

19
Table 4 Evaluation of Current Susceptibility Attributes & Thresholds for seabirds
Attribute
Appropriate
for species
group
Rationale Threshold
Appropriate
for species
group
Rationale
Areal overlap
(Availability) Yes
Overlap with fisheries is a
main element of
catchability (Walker 2005)
Low risk: <10% overlap,
Medium: 10-30% overlap;
High: >30% overlap
No
Seabirds are generally wide-ranging
except e.g. during breeding season,
so overlap generally scored as low.
Need to identify distribution period
and/or population/ age / sex where
there is most risk, describe
approaches to use based on Small
et al 2013 guidance, and score on
that to be precautionary. Also could
look at % overlaps and risk scores
overall.
Encounterability
(water column
position and
habitat)
Yes
Encounterability is a main
element of catchability
(Walker 2005). May need to
be defined for species that
interact with gear at/above
surface (Hobday et al
2007).
Low risk: Low overlap with
fishing gear (low
encounterability)
Medium: Medium overlap
with fishing gear. High: High
overlap with fishing gear (high
encounterability).
No
Can be described based on species
within water column relative to the
gear or overlap with habitat. But
seabird interactions occur at/above
the surface for active gear
interactions and usually during
specific periods (setting/hauling).
More specificity needed on
thresholds.

20
Attribute
Appropriate
for species
group
Rationale Threshold
Appropriate
for species
group
Rationale
Selectivity Yes
Selectivity is a main
element of catchability
(Walker 2005). This is very
gear and species specific.
a: Low risk: individuals < size
at maturity are rarely caught.
Medium: individuals < size at
maturity are regularly caught.
High: individuals < size at
maturity are frequently
caught.
b: Low risk: individuals < size
at maturity can escape or
avoid gear. Medium:
Individuals < half the size at
maturity can escape or avoid
gear. High: Individuals < half
the size at maturity are
retained by the gear.
No
As long-lived species, adult survival
has more impact on population
growth than juvenile. So basing the
thresholds on size / age here not
useful in terms of risk
categorisation. Also selectivity
varies depending on gear used and
species attributes. More appropriate
to develop gear/species matrix.
Post-capture
mortality Yes
PCM is important to
consider for species not
retained to estimate risk of
overall catchability (Walker
2005)
Low risk: Evidence of majority
post-capture release and
survival; Medium: Evidence of
some released post-capture
and survival; High: Retained
species or majority dead
when released. Default for
retained species
Yes
Requires evidence to support risk
category. There is some information
on PCM for seabirds in some
fisheries, but default should be to
score as high risk where there is no
information.

21
Marine mammals (cetaceans and pinnipeds)
Like seabirds, marine mammals tend to have life history strategies that comprise high adult
survival, late maturity and low fecundity (Lewison et al 2004). In general, cetaceans have a
lower maximum growth rate than pinnipeds, and they therefore are more susceptible to
anthropogenic mortality (Breen 2017, Wade 1998).
Cetaceans can be broadly categorised into two main groups: baleen whales (mysticetes) and
toothed whales (odontocetes) (Reeves et al 2002). Baleen whales include some of the largest
mammals on earth but feed on zooplankton, crustaceans and small fish. Toothed whales,
which also include dolphins and porpoises, vary in size and tend to feed on fish and squid, but
some feed on mammals and birds. Across and within these groups (and sometimes even
within species) there are life history parameters that make some more inherently vulnerable
than others, and this is not always related to size. For example, the Maui’s dolphin is a small
cetacean (1.2-1.7m) with a short lifespan compared to other cetaceans, but who have a
relatively late age at maturity and low fecundity (Currey et al 2011). This makes them
particularly vulnerable to anthropogenic mortality despite their small size.
Pinnipeds can be broadly split into three groups eared seals (Otariidae), walrus (Odobenidae)
and true seals (Phocide) (Reeves et al 2002). There are a variety of life history strategies within
and these groups. For example, reproductive strategies for elephant seals are characterised as
extreme polygamy and in harbour seals and monk seals are monogamous (Reeves et al 2002).
Despite the differences in breeding social structure, all pinnipeds give birth once a year to a
single pup (Reeves et al 2002). Polygamous pinnipeds often show sexual dimorphism, so
when considering size at maturity and maximum size, it is important to decide which sex
should be considered. A consistent maximum population growth rate is used to calculate
Potential Biological Removal (PBR) for all pinnipeds in the US Marine Mammal Risk
Assessment (Wade 1998). In Canada, for walrus the maximum growth rate used to calculate
PBR is slightly lower than for pinniped species in other assessments (Hammill 2016). In the
New Zealand risk assessment for marine mammals, there is little difference in the calculated
maximum growth rates between the three pinniped species included (New Zealand fur seal,
New Zealand sea lion, Southern elephant seal), and these values are similar to those used in
the US (Abraham et al 2017). So, it may be appropriate that similar risk values come out of the
PSA for these species, particularly if they are grouped in the same category as other marine
mammals.
When the current PSA is applied to selected species across the marine mammal group, the
productivity scores did not correspond to the maximum growth rates as would be expected if
the attributes and thresholds were appropriate (Appendix 1, Table A1.2). For example, it would
be expected that all of the pinnipeds had lower productivity scores than cetaceans given their
higher maximum growth rate, but this was not the case. This shows that the current application
of the PSA is not appropriate for marine mammals as a group.
There were groups of marine mammals not considered here, but which may be subject to
bycatch include sea otters and sirenians (e.g. dugongs and manatees). Calibration of
attributes should consider life history strategies of these species groups as well.
Two of the seven current productivity attributes were considered appropriate for marine
mammals (age at first reproduction and fecundity), with a further one potentially being useful

22
if tweaked (average maximum age). None of the thresholds were considered appropriate. If
cetaceans and pinnipeds are to be considered within the same grouping, it would be expected
that most cetaceans score higher risk for productivity than pinnipeds. The key factor to ensure
is represented is fecundity, particularly the breeding frequency.
As with other species, the likelihood of a marine mammal being caught and killed combines
factors including areal overlap, gear, species size and behaviour. All of the current PSA
susceptibility attributes are therefore appropriate but only the PCM threshold is appropriate.
All the others would need to be calibrated across the species groups and potential gear
interactions.
23
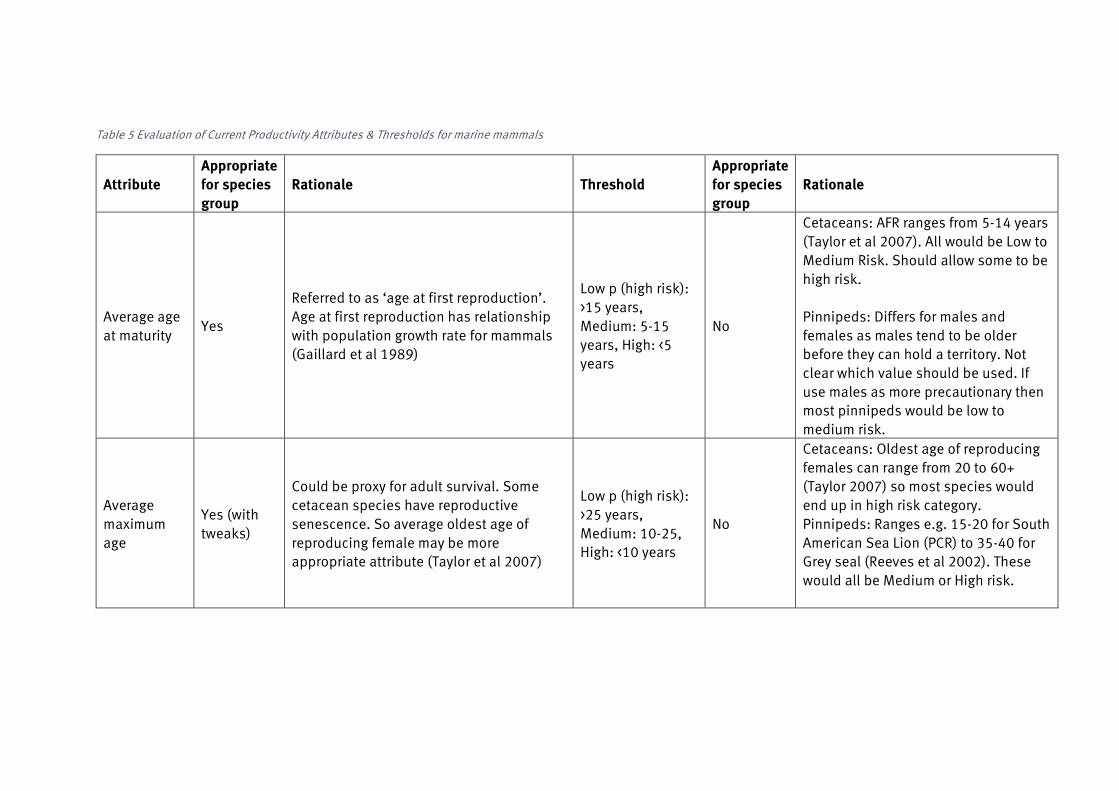
Table 5 Evaluation of Current Productivity Attributes & Thresholds for marine mammals
Attribute
Appropriate
for species
group
Rationale Threshold
Appropriate
for species
group
Rationale
Average age
at maturity Yes
Referred to as ‘age at first reproduction’.
Age at first reproduction has relationship
with population growth rate for mammals
(Gaillard et al 1989)
Low p (high risk):
>15 years,
Medium: 5-15
years, High: <5
years
No
Cetaceans: AFR ranges from 5-14 years
(Taylor et al 2007). All would be Low to
Medium Risk. Should allow some to be
high risk.
Pinnipeds: Differs for males and
females as males tend to be older
before they can hold a territory. Not
clear which value should be used. If
use males as more precautionary then
most pinnipeds would be low to
medium risk.
Average
maximum
age
Yes (with
tweaks)
Could be proxy for adult survival. Some
cetacean species have reproductive
senescence. So average oldest age of
reproducing female may be more
appropriate attribute (Taylor et al 2007)
Low p (high risk):
>25 years,
Medium: 10-25,
High: <10 years
No
Cetaceans: Oldest age of reproducing
females can range from 20 to 60+
(Taylor 2007) so most species would
end up in high risk category.
Pinnipeds: Ranges e.g. 15-20 for South
American Sea Lion (PCR) to 35-40 for
Grey seal (Reeves et al 2002). These
would all be Medium or High risk.
24
Attribute
Appropriate
for species
group
Rationale Threshold
Appropriate
for species
group
Rationale
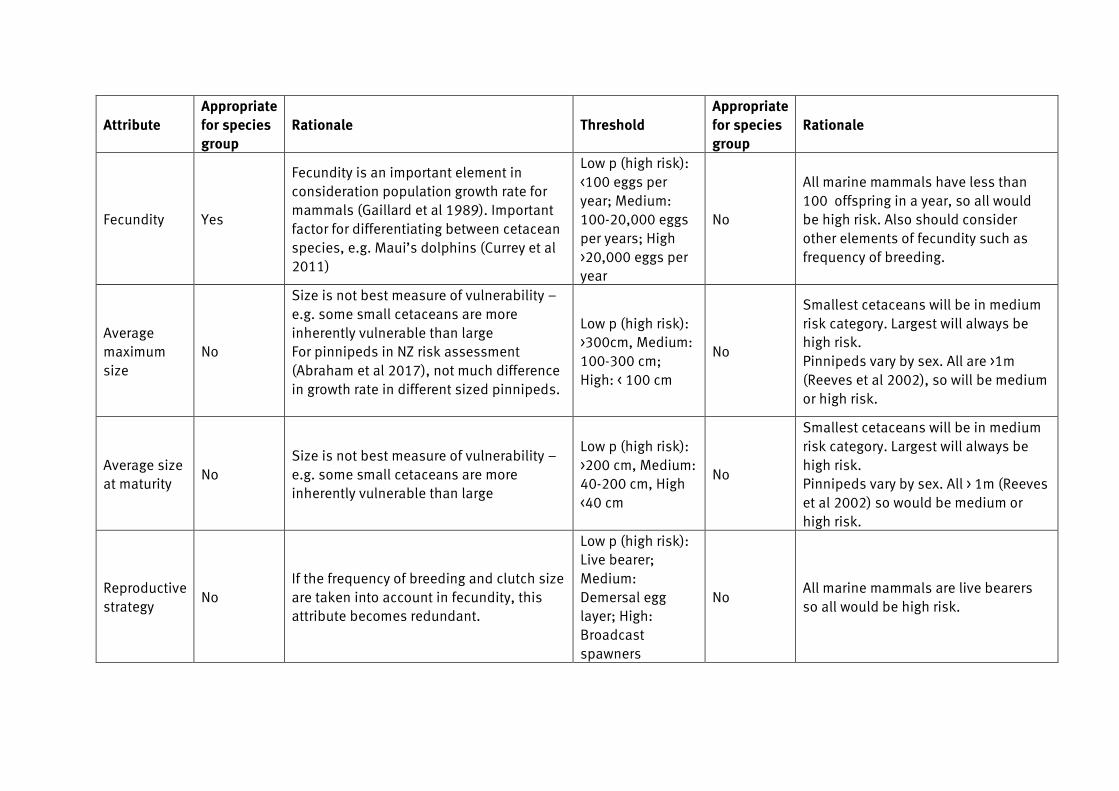
Fecundity Yes
Fecundity is an important element in
consideration population growth rate for
mammals (Gaillard et al 1989). Important
factor for differentiating between cetacean
species, e.g. Maui’s dolphins (Currey et al
2011)
Low p (high risk):
<100 eggs per
year; Medium:
100-20,000 eggs
per years; High
>20,000 eggs per
year
No
All marine mammals have less than
100 offspring in a year, so all would
be high risk. Also should consider
other elements of fecundity such as
frequency of breeding.
Average
maximum
size
No
Size is not best measure of vulnerability –
e.g. some small cetaceans are more
inherently vulnerable than large
For pinnipeds in NZ risk assessment
(Abraham et al 2017), not much difference
in growth rate in different sized pinnipeds.
Low p (high risk):
>300cm, Medium:
100-300 cm;
High: < 100 cm
No
Smallest cetaceans will be in medium
risk category. Largest will always be
high risk.
Pinnipeds vary by sex. All are >1m
(Reeves et al 2002), so will be medium
or high risk.
Average size
at maturity No
Size is not best measure of vulnerability –
e.g. some small cetaceans are more
inherently vulnerable than large
Low p (high risk):
>200 cm, Medium:
40-200 cm, High
<40 cm
No
Smallest cetaceans will be in medium
risk category. Largest will always be
high risk.
Pinnipeds vary by sex. All > 1m (Reeves
et al 2002) so would be medium or
high risk.
Reproductive
strategy No
If the frequency of breeding and clutch size
are taken into account in fecundity, this
attribute becomes redundant.
Low p (high risk):
Live bearer;
Medium:
Demersal egg
layer; High:
Broadcast
spawners
No All marine mammals are live bearers
so all would be high risk.

25
Attribute
Appropriate
for species
group
Rationale Threshold
Appropriate
for species
group
Rationale
Trophic level No
TL often increases with longevity and size
but these attributes are already covered
(Duffy & Griffiths 2017, Hordyk and
Carruthers 2018).
Low p (high risk):
>3.25, Medium:
2.75-3.25, High
<2.75
No
Trophic levels ranged from 3.2–3.4 in
baleen whales, 3.8–4.4 in most
pinnipeds and odontocete whales, to
4.5–4.6 in killer whales (Pauly et al
1998). All would be considered high
risk.
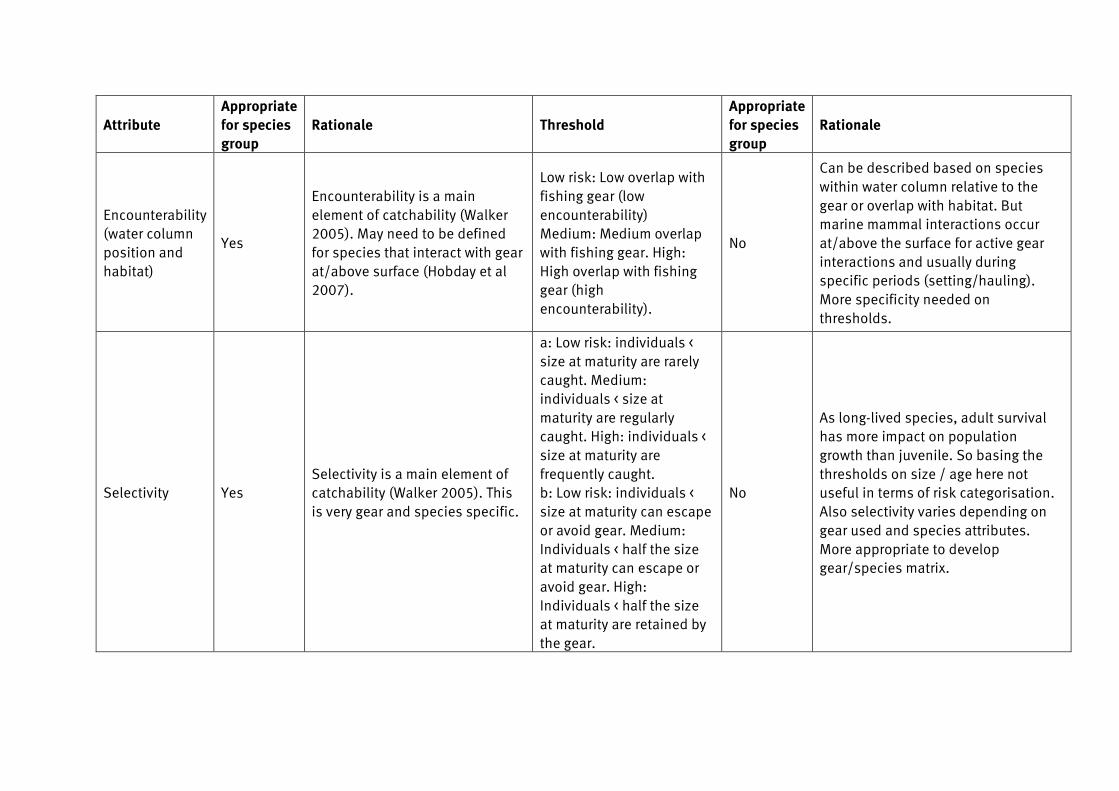
Table 6 Evaluation of Current Susceptibility Attributes & Thresholds for marine mammals
Attribute
Appropriate
for species
group
Rationale Threshold
Appropriate
for species
group
Rationale
Areal overlap
(Availability) Yes
Overlap with fisheries is a main
element of catchability (Walker
2005)
Low risk: <10% overlap,
Medium: 10-30% overlap;
High: >30% overlap
No
Cetaceans are generally wide-ranging
except e.g. during breeding season,
so overlap generally scored as low.
May need to identify distribution
period and/or population/ age / sex
where there is most risk and score on
that to be precautionary. Also could
look at % overlaps and risk scores
overall.
Pinnipeds are more localised in
distribution so may be easier to score.
26
Attribute
Appropriate
for species
group
Rationale Threshold
Appropriate
for species
group
Rationale
Encounterability
(water column
position and
habitat)
Yes
Encounterability is a main
element of catchability (Walker
2005). May need to be defined
for species that interact with gear
at/above surface (Hobday et al
2007).
Low risk: Low overlap with
fishing gear (low
encounterability)
Medium: Medium overlap
with fishing gear. High:
High overlap with fishing
gear (high
encounterability).
No
Can be described based on species
within water column relative to the
gear or overlap with habitat. But
marine mammal interactions occur
at/above the surface for active gear
interactions and usually during
specific periods (setting/hauling).
More specificity needed on
thresholds.
Selectivity Yes
Selectivity is a main element of
catchability (Walker 2005). This
is very gear and species specific.
a: Low risk: individuals <
size at maturity are rarely
caught. Medium:
individuals < size at
maturity are regularly
caught. High: individuals <
size at maturity are
frequently caught.
b: Low risk: individuals <
size at maturity can escape
or avoid gear. Medium:
Individuals < half the size
at maturity can escape or
avoid gear. High:
Individuals < half the size
at maturity are retained by
the gear.
No
As long-lived species, adult survival
has more impact on population
growth than juvenile. So basing the
thresholds on size / age here not
useful in terms of risk categorisation.
Also selectivity varies depending on
gear used and species attributes.
More appropriate to develop
gear/species matrix.

27
Attribute
Appropriate
for species
group
Rationale Threshold
Appropriate
for species
group
Rationale
Post-capture
mortality Yes
PCM is important to consider for
species not retained to estimate
risk of overall catchability
(Walker 2005)
Low risk: Evidence of
majority post-capture
release and survival;
Medium: Evidence of some
released post-capture and
survival; High: Retained
species or majority dead
when released. Default for
retained species
Yes
Requires evidence to support risk
category. There is some information
on PCM for bycatch mortality in some
fisheries, but default should be to
score as high risk where there is no
information.

28
Reptiles (sea turtles and sea snakes)
There are seven species of marine turtles, and within these there are 58 individual regional
management units (RMUs) – or populations – based on nesting locations and distribution data
(Wallace et al 2011). Marine turtles vary in population size and trends, as well as reproduction
and morphology across these RMUs (Wallace et al 2011).
Sea turtles, like seabirds and marine mammals are long-lived, late-maturing species, which
makes them particularly susceptible to impacts like fisheries mortality that affect the adult life
stages (Wallace et al 2013). Unlike seabirds and marine mammals, however, ontogenetic
stages for marine turtles change radically from hatchling to adult in terms of relative
contribution to population growth (Curtis & Moore 2013). The long time to maturity for sea
turtles means that an individual juvenile turtle is likely to die before it reaches adulthood and
contributes to population growth, however there is higher reproductive value for sub-adult
turtles compared with hatchlings (Heppell 2005). However, there is generally a lack of age-
specific information for the individual populations (Heppell 2005).
Population productivity is also highly dependent on local conditions that influence a number
of factors relating to fecundity including: nest success (% nests producing hatchlings),
emergence success (% eggs per nest emerging as hatchlings), mean number of eggs per
female, the number of clutches per female per season and the remigration interval (i.e. the
period between successive breeding seasons) (Nel et al 2013).
The current productivity attributes reviewed that were considered appropriate for sea turtles
include age at maturity and fecundity (Table 8). None of the productivity thresholds were
considered appropriate for this species (Table 8).
As with other out of scope species, the susceptibility to capture is based on a range of factors
including overlap with fisheries, gears used, size of species, behaviour and diet. All current
susceptibility attributes are therefore appropriate, but only the PCM threshold is appropriate
(Table 9).
Sea snakes are venomous elapid snakes that inhabit the marine environment for most of their
lives, predominantly in the tropical Pacific and Indian Oceans (Damotharan et al 2010). There
are about 80 species of sea snakes, although identification to species can be difficult, and
they inhabit shallow waters along coasts, around islands and coral reefs, river mouths and
rivers (Rasmussen et al 2011). Although some species have wide distributions, others are
highly localised, making them more vulnerable to impact (Rasmussen et al 2011). Sea snakes
feed mainly on fish and eels (Rasmussen et al 2011). In tropical Australia and south-east Asia,
sea snakes may be caught in trawls (Milton 2001). Bycatch mortality is one of the two most
significant anthropogenic impacts on sea snake populations (Courtney et al 2010).
Most sea snakes are viviparous (one genus is oviparous) and tend to reproduce annually, with
clutch size increasing with the size of the female (Rasmussen et al 2011). Lemen & Voris
(1981) found than in 14 species of sea snakes collected around Malaysia, that average clutch
size ranged from 2.9-17.8 young but most species had between 3 and 7 young. Fry et al (2001)
found that in Australian waters clutch size ranged from 1-20 young.

29
Sea snakes share traits with other out-of-scope species reviewed here as they are live-bearing,
have small clutches, are long-lived and have low reproductive output. Despite this, Rasmussen
et al 2011 indicate that for most species there is a lack of information on breeding cycles,
growth rates, population density, sexual maturity and taxonomy.
The current productivity attributes reviewed that were considered appropriate for sea snakes
include age at maturity, average maximum size and fecundity (Table 8). None of the
productivity thresholds were considered appropriate for this species (Table 8).
As with other out of scope species, the susceptibility to capture is based on a range of factors
including overlap with fisheries, gears used and size of species. Some sea snake species are
sexually dimorphic, with females being larger, which meant they were more susceptible to
capture in Australian trawl fisheries (Fry et al 2001). All current PSA attributes are considered
appropriate, but only the PCM threshold is appropriate (Table 9). Selectivity could also include
some consideration of sex-specific mortality.
Given the differences in biology and available demographic information between sea turtles
and sea snakes, separate PSA attributes and thresholds may be useful.

30
Table 7 Evaluation of Current Productivity Attributes & Thresholds for marine reptiles (turtles and snakes)
Attribute
Appropriate
for species
group
Rationale Threshold
Appropriate
for species
group
Rationale
Average age
at maturity Yes
Referred to as ‘age at sexual maturity’.
Turtles & snakes: Has relationship with
population growth rate (Heppell 2005). For
turtles: some turtle species have very late
maturation (+40 years) (Curtis & Moore
2013). However, very few data for this
across species so may default to high risk.
Low p (high risk):
>15 years,
Medium: 5-15
years, High: <5
years
No
Turtles: Estimates are highly variable
and uncertain and based on species
rather than populations in many cases.
For example, leatherhead turtle (largest
turtle) estimates are 9-15 years in one
study but 26-32 in another (IUCN RL)
Snakes: For two species evaluated have
low to medium risk (age range 2-5)
even though one is largest sea snake in
Australia. Need to compare across
wider group to calibrate.
Average
maximum
age
No
Turtles & snakes: Could be proxy for adult
survival. However, very few data for this
across populations.
Low p (high risk):
>25 years,
Medium: 10-25,
High: <10 years
No
Turtles: No reliable data found for
average maximum age. Some estimates
are available through
skeletochronology (Heppell 2005).
Estimates for largest turtle are about 43
and for smallest in rate of 18-20 (Eckert
et al 2012, Reichart 1993). So would be
med to high risk.
Snakes: For two species evaluated,
would be medium risk (10 years) even
though one is largest sea snake in
Australia. Need to compare across
wider group to calibrate.

31
Attribute
Appropriate
for species
group
Rationale Threshold
Appropriate
for species
group
Rationale
Fecundity Yes
Fecundity is an important element in
consideration population growth rate. For
sea turtles the number of nests per year,
number of eggs and hatchings per nest and
female remigration (frequency of breeding)
important to capture (Casale & Heppell
2016).
Low p (high risk):
<100 eggs per
year; Medium:
100-20,000 eggs
per years; High
>20,000 eggs per
year
No
Turtles: All sea turtles would lay in
regions of 10s to 100s of eggs per year,
so all would be high risk. Also does not
provide info on how to incorporate
multiple nests and remigration in
estimate.
Snakes: Variable. Fry et al 2001 found
clutch size was between 1-20 young. All
would be high risk.
Average
maximum
size
No (Turtles)
Yes
(Snakes)
Could be proxy for maximum age but little
information available for turtles. More info
provided on snakes.
Low p (high risk):
>300cm, Medium:
100-300 cm; High:
< 100 cm
No
Turtles: Largest turtle (leatherback)
would only be in medium risk category
(1.9m estimated based on one
population, Eckert 2012)
Snakes: For two species evaluated, one
is 60 cm and one is 210 cm, so low and
med risk even though one is largest sea
snake in Australia.
Average size
at maturity No
Could be proxy for age at maturity, but little
information available for either turtles or
snakes
Low p (high risk):
>200 cm, Medium:
40-200 cm, High
<40 cm
No
Turtles: Largest turtle (leatherback)
would only be in medium risk category
(1.4m estimated based on one
population, Eckert 2012)
Snakes: Unknown for 1 of 2 species
evaluated. For other size a maturity at
100cm (IUCN RedList), medium risk,
despite being largest sea snake in
Australia.

32
Attribute
Appropriate
for species
group
Rationale Threshold
Appropriate
for species
group
Rationale
Reproductive
strategy No
If the frequency of breeding and nest size
are considered in fecundity, this attribute
becomes redundant for both turtles and
snakes.
Low p (high risk):
Live bearer;
Medium:
Demersal egg
layer; High:
Broadcast
spawners
No
Sea turtles do not fit into any of these
categories.
Sea snakes are mostly viviparous so
would all be scored high risk.
Trophic level No
TL often increases with longevity and size
but these attributes are already covered
(Duffy & Griffiths 2017, Hordyk and
Carruthers 2018).
Turtles: TL likely to vary based on location,
size (life history stage) and species (Godley
et al 1998). Not all populations (or even
species) have estimates based on TL
Snakes: No info found on specific TL for this
species (or other sea snakes). Davenport
2011 also indicates that there are
correlations between body size of snake the
size of prey, so larger sea snakes would
generally consume larger and more varied
prey.
Low p (high risk):
>3.25, Medium:
2.75-3.25, High
<2.75
No
Turtles: Comparison of loggerhead,
leatherhead and green turtles by
Godley et al 1998 showed that
loggerhead occupy higher trophic level
than leatherhead, which occupy higher
TL than green. However, most trophic
indication reported based on stable
isotope analysis rather than specific TL
Snakes: No information found
33
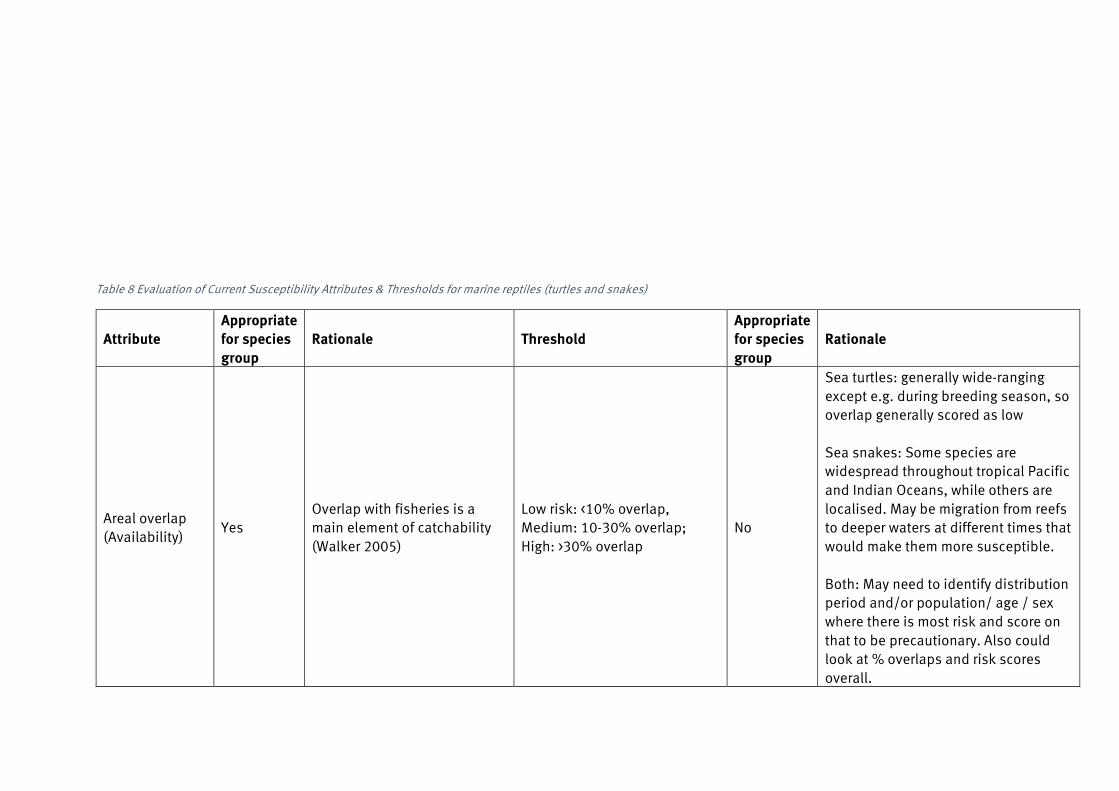
Table 8 Evaluation of Current Susceptibility Attributes & Thresholds for marine reptiles (turtles and snakes)
Attribute
Appropriate
for species
group
Rationale Threshold
Appropriate
for species
group
Rationale
Areal overlap
(Availability) Yes
Overlap with fisheries is a
main element of catchability
(Walker 2005)
Low risk: <10% overlap,
Medium: 10-30% overlap;
High: >30% overlap
No
Sea turtles: generally wide-ranging
except e.g. during breeding season, so
overlap generally scored as low
Sea snakes: Some species are
widespread throughout tropical Pacific
and Indian Oceans, while others are
localised. May be migration from reefs
to deeper waters at different times that
would make them more susceptible.
Both: May need to identify distribution
period and/or population/ age / sex
where there is most risk and score on
that to be precautionary. Also could
look at % overlaps and risk scores
overall.

34
Attribute
Appropriate
for species
group
Rationale Threshold
Appropriate
for species
group
Rationale
Encounterability
(water column
position and
habitat)
Yes
Encounterability is a main
element of catchability
(Walker 2005). May need to be
defined for species that
interact with gear at/above
surface (Hobday et al 2007).
Low risk: Low overlap with
fishing gear (low
encounterability)
Medium: Medium overlap with
fishing gear. High: High overlap
with fishing gear (high
encounterability).
No
Can be described based on species
within water column relative to the
gear or overlap with habitat. But sea
turtle interactions occur at/above the
surface for active gear interactions and
usually during specific periods
(setting/hauling). More specificity
needed on thresholds.

35
Attribute
Appropriate
for species
group
Rationale Threshold
Appropriate
for species
group
Rationale
Selectivity Yes
Selectivity is a main element
of catchability (Walker 2005).
This is very gear and species
specific.
a: Low risk: individuals < size at
maturity are rarely caught.
Medium: individuals < size at
maturity are regularly caught.
High: individuals < size at
maturity are frequently caught.
b: Low risk: individuals < size at
maturity can escape or avoid
gear. Medium: Individuals <
half the size at maturity can
escape or avoid gear. High:
Individuals < half the size at
maturity are retained by the
gear.
No
As long-lived species, adult survival
has more impact on population growth
than juvenile. So basing the
thresholds on size / age here not
useful in terms of risk categorisation.
Also selectivity varies depending on
gear used and species attributes. More
appropriate to develop gear/species
matrix.
Juvenile sea snakes of most species
are not caught in Australia prawn
trawls, suggesting there is little impact
on this age class (Fry et al 2001).
However, there is a larger proportion of
females caught for sea snake species
that are sexually dimorphic (females
are larger) (Fry et al 2001). This could
be considered as part of the selectivity
thresholds.
Post-capture
mortality Yes
PCM is important to consider
for species not retained to
estimate risk of overall
catchability (Walker 2005)
Low risk: Evidence of majority
post-capture release and
survival; Medium: Evidence of
some released post-capture
and survival; High: Retained
species or majority dead when
released. Default for retained
species
Yes
Requires evidence to support risk
category. There is some information on
PCM for sea turtles and sea snakes in
some fisheries, but default should be
to score as high risk where there is no
information.

36
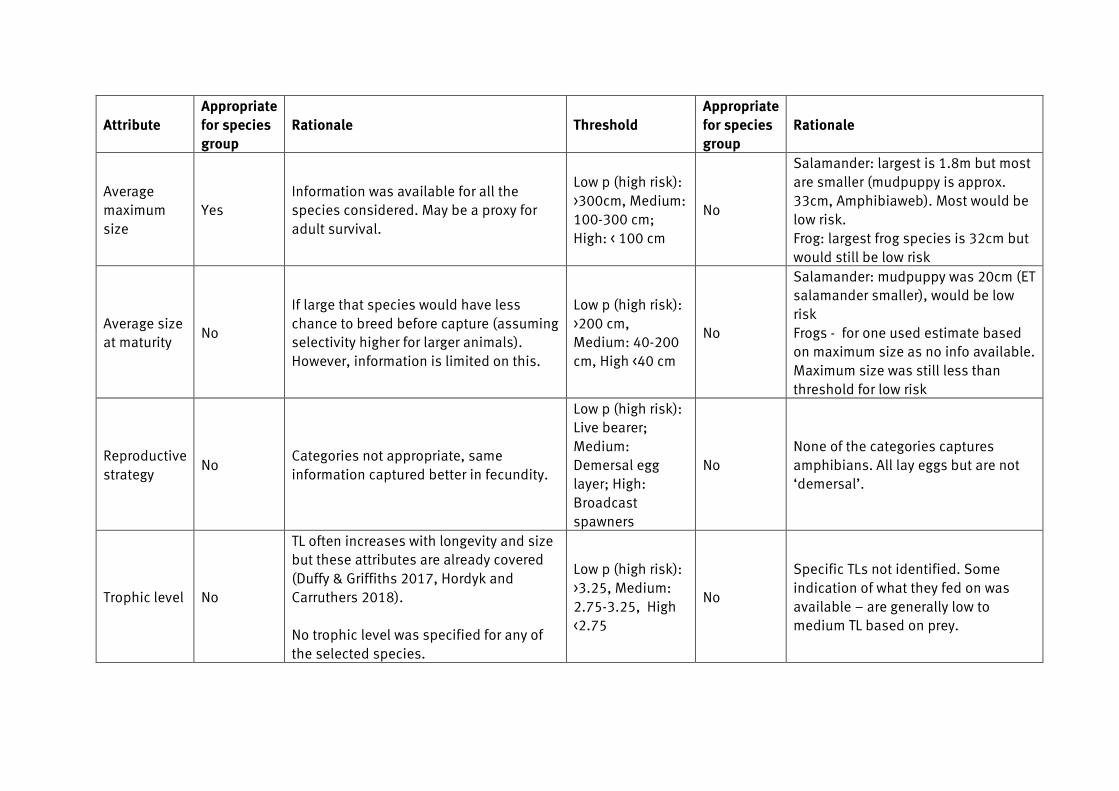
Amphibians (frogs/toads and salamanders)
Amphibians are included by the MSC as the out of scope species but are very different
biologically from the other species groups in this category. There is very little information on
amphibian life history, particularly for Asian and African frogs selected for this review. Few
studies have examined how life history traits correlate with recovery potential after population
crashes (Sodhi et al 2008). In general, larger body sizes were thought to link to slower
population growth rates, making this a key factor to consider (Sodhi et al 2008). However,
bycatch in fisheries is not considered a main factor driving global declines in amphibians
(Collins & Storfer 2003; Sodhi et al 2008).
The productivity attributes of the current PSA were reviewed for two salamander and two frog
species to evaluate their appropriateness – the average maximum size and fecundity were
both considered appropriate (Table 10). In the case of the Goliath frog, it had a higher risk
score than might otherwise be warranted as there was very little life history information
available on this species, so many values had to be scored as high risk as a default (Appendix
1, Table A1.4). This highlights the level of precaution inherent in the PSA methodology but also
the problem of using attributes where very little data is available across a species group.
None of the thresholds were considered appropriate. As there were no MSC fisheries identified
where susceptibility could be reviewed, this was not evaluated.

37
Table 9 Evaluation of current Productivity Attributes & Thresholds for amphibians (salamanders and frogs)
Attribute
Appropriate
for species
group
Rationale Threshold
Appropriate
for species
group
Rationale
Average age
at maturity No
Age at reproduction and longevity poorly
understood for many amphibians. Some
information was found for the two
salamander species but not for both
frogs.
Low p (high risk):
>15 years,
Medium: 5-15
years, High: <5
years
No
For mudpuppy was 5-8 years
(Amphibiaweb) – high risk. For others
was 10-24 months (low risk). For one
there was no information so defaulted
to high risk score.
Average
maximum
age
No
Age at reproduction and longevity poorly
understood for many amphibians. Some
information was found for the two
salamander species but not for both
frogs.
Low p (high risk):
>25 years,
Medium: 10-25,
High: <10 years
No
The two salamander species were 25+
years (Amphibiaweb) – high risk. One
frog was estimated 7 years (low risk)
and no information for the other so
defaulted to high risk.
Fecundity Yes
Amphibians have diverse reproductive
cycles, and as a result various
reproductive outputs (Hoque & Saidapur
1994). Frequency of breeding is variable,
largely based on environmental and food
conditions.
Low p (high risk):
<100 eggs per
year; Medium:
100-20,000 eggs
per years; High
>20,000 eggs per
year
No
Salamanders: mudpuppy was 36-85
eggs depending on region
(Amphibiaweb); ET salamander der
was between 421-7631 eggs.
Frogs: Indian bullfrog only known
based on one captive study (4000
eggs) (Hoque & Saidapur 1994)
Goliath frog “several hundred eggs”
(Amphibiaweb)
All would be in low to medium risk
category
38
Attribute
Appropriate
for species
group
Rationale Threshold
Appropriate
for species
group
Rationale
Average
maximum
size
Yes
Information was available for all the
species considered. May be a proxy for
adult survival.
Low p (high risk):
>300cm, Medium:
100-300 cm;
High: < 100 cm
No
Salamander: largest is 1.8m but most
are smaller (mudpuppy is approx.
33cm, Amphibiaweb). Most would be
low risk.
Frog: largest frog species is 32cm but
would still be low risk
Average size
at maturity No
If large that species would have less
chance to breed before capture (assuming
selectivity higher for larger animals).
However, information is limited on this.
Low p (high risk):
>200 cm,
Medium: 40-200
cm, High <40 cm
No
Salamander: mudpuppy was 20cm (ET
salamander smaller), would be low
risk
Frogs - for one used estimate based
on maximum size as no info available.
Maximum size was still less than
threshold for low risk
Reproductive
strategy No
Categories not appropriate, same
information captured better in fecundity.
Low p (high risk):
Live bearer;
Medium:
Demersal egg
layer; High:
Broadcast
spawners
No
None of the categories captures
amphibians. All lay eggs but are not
‘demersal’.
Trophic level No
TL often increases with longevity and size
but these attributes are already covered
(Duffy & Griffiths 2017, Hordyk and
Carruthers 2018).
No trophic level was specified for any of
the selected species.
Low p (high risk):
>3.25, Medium:
2.75-3.25, High
<2.75
No
Specific TLs not identified. Some
indication of what they fed on was
available – are generally low to
medium TL based on prey.

39
Review of alternative attributes A total of 14 different assessments using Productivity Susceptibility Analysis or a similar
approach were reviewed: three for seabirds, two for sea turtles, one for sea snakes, two for
cetaceans and six multi-species assessments including one or more out of scope species
groups, but also including fish. Most of these were undertaken as a risk assessment of fishing
within a Regional Fisheries Management Organisation (RFMO). In addition, three national
assessments are included (Australia, Mexico and Uruguay) and three regional assessments
(NE Atlantic, Irish Sea and SW Indian Ocean). A range of gear types are included comprising
longline, purse seine, trawl, gillnets, pots and traps, divers.
Appendix 2 contains a table with all attributes reviewed, their thresholds and whether they are
recommended as appropriate for inclusion in the MSC PSA.
Seabird-specific attributes
Three types of productivity attributes are included for seabirds: a Fecundity Factors Index
(based on life history strategy and age at first breeding), Life history strategy and Demographic
Invariant Method (using maximum growth rate, rmax). When deciding to select life history
strategy as their only productivity attribute, Tuck et al (2011) evaluated other parameters but
decided that life history strategy adequately captured the key differences between population
growth rates of relevant species (Small et al 2013). The method using maximum growth rate
was used in the Uruguayan risk assessment, but this approach is more quantitative and
requires reliable data on adult survival and age at first breeding to determine (Small et al
2013). Observed values of population growth should not be substituted for rmax as they would
already account for additional mortalities, e.g. though fisheries bycatch, and the productivity
should be based on intrinsic parameters (Sharp 2017; Small et al 2013). Waugh et al (2012) in
the risk assessment for WCPFC compared using rmax with the Fecundity Factors Index, which
included life history strategy and age at first breeding and found them correlated. Thus, the
age at first reproduction and life history strategy, which would incorporate elements of number
of eggs and frequency of breeding are recommended as the seabird productivity attributes.
These can be adapted from the current productivity attributes for age at maturity and fecundity.
With regard to susceptibility attributes for seabirds many of those used in the risk
assessments reviewed required specific data to be collected and analysed, including raw data
on fisheries and seabird distribution (WCPFC attribute on susceptibility – spatial component),
bycatch rate (WCPFC attribute on susceptibility – vulnerability component) and observer data
on number of birds present and attacking hooks (Uruguay attribute on access to bait) (Jimenez
et al 2012, Waugh et al 2012). As this information would not necessarily be available in all
cases, and for spatial data may require the assessment team to perform these analyses
themselves, they are not recommended for inclusion.
Other attributes reviewed including behavioural susceptibility to capture (ICCAT attribute) and
post-capture mortality (Uruguayan attribute) were considered appropriate, although the
thresholds may need to be revised. The first is scored high or low risk (no medium category)
based on information about the tendency of specific birds to follow fishing vessels and relative
incidence of bycatch of that species in the gear type, either in the ICCAT area or other fisheries
(Tuck et al 2011). The thresholds could be amended to include species/gear behaviours
and/or level of bycatch incidence, if known, in the fishery.

40
Another attribute used in the Uruguayan assessment was hook selectivity. This was developed
specifically for longline encounters with albatross and petrels and compared the culmen (bill)
length to the front length of hook to determine if the bird was likely to be retained by the hook.
This is too specific to apply across MSC fisheries but modifying the current selectivity attribute
to account for a number of different selectivity scenarios like this could be useful. For example,
a matrix approach with default scores for specific species group and gear scores could be
developed in consultation with experts.
Although not reviewed as a specific PSA approach, a risk analysis performed for diving
seabirds interacting with gillnets undertaken by Sonntag et al (2012) considered diving and
aggregation behaviour of the different birds on the likelihood of their interacting with gillnets.
This type of information could be considered in the current encounterability attribute, again
possibly with a risk matrix containing default scores.
Cetacean-specific attributes
Although there are two PSA assessments specific to cetaceans, they use the same set of
attributes (Brown 2013, Brown 2015). Productivity attributes that could be useful for the MSC
PSA include age at female sexual maturity, oldest reproducing female and inter-calving
interval. Calf survival was an attribute used but not recommended because in general adult
survival has more influence on population growth rate than calf survival. Population trend was
another attribute not recommended because it is not necessarily an indicator of population
growth in the absence of impact – there may be instances where a highly productive
population is decreasing due to other factors. If these factors include bycatch mortality, then it
would be considering an element of susceptibility rather than productivity. Other attributes
better capture intrinsic factors influencing population growth.
The age at female sexual maturity could be included in the current age at maturity attribute. As
all marine mammals have one live young, the attribute on inter-calving interval – or breeding
frequency – could be applied to capture variation in growth rate. Finally, oldest reproducing
female could replace the current PSA attribute on maximum age since many cetacean species
experience reproductive senescence and may not breed their whole lives.
These additional productivity attributes are based on cetaceans, so if pinnipeds and sirenians
were also included in the same grouping, the thresholds would need to be determined on the
range across these species groups and tested.
For susceptibility, the titles of the attributes are similar as for the current PSA but they are
assessed differently. Availability is similar to areal overlap but the thresholds are specific to
the NE Atlantic; encounterability uses a spatial, habitat-use approach rather than a vertical
overlap approach; selectivity is based on potential for capture; and potential for lethal
encounter is similar to post-capture mortality but allows for cases where the animal may be
injured by the gear (Brown et al 2013, 2015). Of these, the availability attribute is coarser, but
potentially easier to apply than the one currently used in the PSA. The thresholds, although
specific to the Atlantic (High: NE Atlantic distribution/subspecies/subpopulation. Medium: N
Atlantic distribution/subspecies/subpopulation. Low: Atlantic distribution), could be adapted
more widely. It also allows for the presence of subspecies or subpopulations.

41
The selectivity attribute is quite general but Brown et al 2013 compiled a species/gear type
selectivity matrix that was reviewed by bycatch experts to come up with scores. Scoring was
based on opinion as to whether a particular gear could feasibly capture a particular species
assuming it encountered it and was informed, in part, by knowledge of the occurrence of
bycatch of that species in that gear, or of similar species in similar gears. For susceptibility, the
potential for entanglement of larger species, such as humpback whales, in the lines
supporting gear was considered along with the potential for capture in the main body of the
gear. If this approach was used in MSC, specific requirements and guidance could be provided
to ensure such an approach is auditable. Or, as suggested for seabirds, the MSC could develop
a matrix of default scores, with expert involvement, and allow assessment teams to vary from
this matrix in specific cases, such as when mitigation measures are applied.
The potential for lethal encounter is a useful attribute to replace the post-capture mortality
attribute as it considers both potential for injury and death. In many cases, injured animals are
returned but their ultimate fate is unknown, so this approach could add precaution to this
attribute.
Sea turtle-specific attributes
Two assessments used a PSA method specific to sea turtles (Angel et al 2014, Nel et al 2013).
Attributes used in both cases are similar. Additional productivity attributes that could be
useful for the MSC PSA include number of breeding (nesting) females, age at maturity,
hatchling success, emergence success, mean clutch size, nests/female/season, and
remigration interval. As with cetaceans, the population trend attribute was not selected.
A number of the attributes relate to fecundity and could be combined in a similar way as is
done for the seabirds, or a couple of the attributes judged most important could be selected.
For the susceptibility attributes, the overlap is useful for MSC, but they have calculated this on
number of squares of species overlap in RFMO area (Angel et al 2014, Nel et al 2013). Not all
fisheries will have specific grid cells to do this, but the method itself could be included as an
example in guidance of how to estimate % areal overlap when this information is available.
Other susceptibility attributes such as confidence estimate in distribution data and spawner
biomass (number of breeding females) were not selected because they do not relate to the
catchability of the species specifically. The final attribute on bycatch estimate relative to
natural mortality requires data on bycatch mortality and, as it already scales the mortalities by
a productivity value rather than relying on the overall risk score to do this.
Sea snake-specific attributes
Only one assessment specific to sea snakes was carried out (Milton 2001). For productivity
they use maximum weight, % of biomass removed, length at maturity, mortality index and
annual fecundity. Of these, maximum weight, length at maturity and annual fecundity are the
most useful, but both the weight and length may not be necessary as they are both proxies for
size. The % of biomass removed and mortality index were not recommended as they are more
related to susceptibility and require bycatch data, which may not always be available.
Of the susceptibility attributes, preferred habitat (similar to encounterability-habitat), survival
(similar to post-capture mortality) and range (similar to areal overlap) are most useful. There is
an attribute on whether the species is caught in day or night but it is not clear why one would

42
be more susceptible than the other – it could be related to when this specific fishery operates.
Diet is also included to account for whether the species would be attracted to the trawl
grounds, but this could be considered as part of encounterability in terms of likelihood to
increase encounterability due to species behaviour (attraction to bait or discards).
Other general assessment attributes
Other assessments undertaken included out of scope species but were not necessarily
specifically designed for them. Of these, some had a composite approach to scoring
productivity and susceptibility, e.g. using reproductive strategy and length at maturity and
maximum length to get an overall productivity score rather than assigning each attribute a
score and calculating overall risk (Arrizabalaga et al 2011, Kirby 2006, Murua et al 2009). The
MSC could consider an approach like this in future, but it is not clear that changing to this
method would have any advantage over the current approach. These are therefore not
considered further.
The remaining assessments include an EREAF assessment from Australia (as all use the
Hobday et al 2007 approach and attributes, only one example of application was selected), a
risk assessment for the SW Indian Ocean and a risk assessment for Baja, Mexico. Attributes for
all of these assessments are similar, being based on the Hobday et al 2007, 2011 approach
(Daly et al 2007, Kiszka 2012, Micheli et al 2014). Additional productivity attributes in the SW
Indian Ocean approach included range, global population size, habitat characteristics and diet
(Kiszka 2012). However, none of these were selected either because they were either not
relevant to, or of smaller influence, on population growth rate. All of the other productivity
attributes have already been discussed as they are similar to the current MSC PSA approach.
For susceptibility, the attributes for the Mexico and Australia risk assessments have already
been discussed as they are similar to the current MSC PSA approach. The thresholds used
were specifically calculated for those particular ecosystems. The attributes for the SW Indian
Ocean approach include as different attributes mean regional bycatch incidents and
commercial value. The first requires specific data, and the second may not be relevant for out
of scope species in most instances. Therefore, neither are selected.
Recommendations
General PSA approach Before deciding on the final selection of attributes and thresholds to be applied, some thought
needs to be given to the overall objective associated with using the PSA for out of scope
species. In general, PSA was created as a tool to allow measuring of relative risk, e.g. the risk
of a management objective not being achieved, to allow prioritisation of further analysis or
management action for higher risk species (Hobday 2011). In the context of MSC, the objective
is slightly different. It is effectively being used to determine a level of sustainability and may
differ by performance indicator. One of the MSC objectives for ETP species is to ensure that
each fishery is not hindering recovery of those species (PI 2.3.1 outcome status). The PSA
results, then, indicate the level of relative risk associated with not achieving that for each
species but do not define how the risk categories relate to the probability of the fishery failing
to achieve the objectives (Hordyk and Carruthers 2018). It would help create clarity around the
use of the RBF, both for those applying it and those reviewing it, if the objectives of using the

43
RBF for each PI were specified, and the relationship between associated risk levels relates and
sustainability levels in the default tree made clear.
Recommendation 1: Consider and clearly specify the objectives for using the PSA, as linked to
PIs in the default assessment tree
It is important that the RBF is precautionary for all species groups for which it is applied. The
MSC intention is that incorporating a level of precaution provides an incentive to use the
conventional methods (i.e. default tree) when data is available. The Guidance to the MSC
Fisheries Certification Process (v2.1) indicates that “precautionary levels can be defined as the
probability that the resulting RBF score is greater than the score obtained if using the default
assessment tree (DAT).” RBF parameters have previously been calibrated against the default
tree. For PI 2.2.1, the probability that the RBF score is greater than the DAT is <0.2, or resulting
scores are on average less than 10 scoring points above PI 2.1.1. For PI 2.3.1, the probability
that the RBF score is greater than the DAT is <0.05 (MSC 2018b). However, it is not clear if the
previous calibration was conducted using a range of out of scope species in these PIs. Given
the outputs of the comparison between default and PSA scores undertaken here (although also
noting caveats, see section 3.1), the current levels of precaution for out of scope species may
not be appropriate.
Recommendation 2: Undertake new calibration precaution level in RBF scores for PI 2.2.1 and
2.3.1, using a range of out-of-scope species
Another topic that should be considered by MSC is specificity in defining the unit that is being
assessed. Ideally, this should be the smallest relevant unit – a population. However, specific
populations may not be defined for many out of scope species (indeed this is the case with
IUCN Red List assessments for many out of scope species). Marine mammal stock
assessments and sea turtle regional management units are two cases where distinct
populations have been defined, but guidance could be provided to ensure that the assessment
team are being as precautionary as possible when identifying the unit.
Recommendation 3: Specify that scoring of PSA attributes should be done at the smallest
relevant unit, a population ideally
There are some aspects of the current default tree PIs that are not fully captured when the RBF
is applied. For Principle 2 species generally this includes consideration of unobserved
mortality, including impacts from IUU fishing, animals that are injured and subsequently die as
a result of coming into contact with fishing gear, animals that are stressed and die as result of
attempting to avoid capture in gear and ghost fishing (MSC 2018b). None of this is directly
captured in the current attributes, but there may be options for including them in a revised PSA
or associated guidance. For example, the attribute used for a cetacean risk assessment in the
NE Atlantic instead of post-capture mortality is ‘potential for lethal encounter’ (Brown et a
2013). The thresholds consider likelihood that the interaction will result in death, but also
consider if it will result in injury. Using this attribute would cover one element of unobserved
mortality. Other elements could be included by providing guidance, e.g. encounterability and
selectivity considering active gears but also ghost gear interactions, areal overlap including
consideration of IUU fishing.

44
Both PIs 2.2.1 and 2.3.1 have an element of cumulative impact included, which is not be
captured in the PSA for out of scope species. Depending on the outcome of the ETP review in
the next standard review, it should be considered to include all MSC UoAs in evaluation of
susceptibility for out of scope species.
Within PI 2.3.1, the default tree also requires an assessment of indirect impact on the species,
but this is not included in the PSA. This is one reason why the scores for the PI for 2.3.1 do not
correspond directly with the outputs of the PSA (see section 3.1). As the Fishery Standard
Review may include review and/or revision of the ETP requirements, this should be considered
alongside that review. If the indirect impacts are maintained in the default tree PI, it may be
worth considering how they could be applied using the RBF. There is currently a Scale Intensity
Consequence Analysis (SICA) developed for the ecosystem PI, so elements of this could be
brought into the ETP RBF. Consultation with experts in ecosystem impacts could be consulted
to develop this. Altneratively, as the ecosystem PI should already capture indirect effects of the
fishery, the default tree scoring issue could be dropped. In that case, no change would be
needed to the PSA approach to include indirect impacts.
Recommendation 4: Review elements of PIs where out of scope species are scored that are
not currently captured in PSA and consider how they could be incorporated (if deemed
relevant) in PSA attributes, thresholds or associated guidance
Attribute selection and species grouping Table 11 identifies the attributes that are recommended for further evaluation for each species
group based on the results of this review. The susceptibility attributes are the same for all
species but would require further elaboration in some cases related to species behaviour, size
and gear type they are interacting with.
Many of the attributes of the current PSA were shown in this review to have the same score
(e.g. Fecundity and Reproductive strategy) and others were shown to not be relevant or
practical for the species group in question (e.g. size attributes for seabirds). Hordyk and
Carruthers (2018) also found that the PSA scoring may be over-parameterized, with irrelevant
or correlated attributes lowering the predictive capacity of the overall approach. Decreasing
the overall number of attributes, if doing so would ensure robust and precautionary
assessments, would also be beneficial in terms of the time spent in conducting the RBF and
reducing associated costs of application. It is recommended to evaluate the PSA with different
numbers of attributes, and for multiple species in each species group, to determine the
optimum number of attributes to get reliable results.
It would also be useful to consider whether any default scoring could be provided for the
encounterability and selectivity scores based on species group and gear characteristics (e.g.
for selectivity of longline, hook type and likelihood for species group to be retained). This
matrix approach could be similar to that used in the MSC Consequence Spatial Analysis for
habitats when scoring removability of biota and substratum attributes for different gear types.
Deviations from the default could be allowed if justified, e.g. if there were modifications made
to the gear or mitigation measures. A workshop with experts on species-gear interactions for
each of the species groups could be held to create the matrices. If the matrix approach was not
determined to be appropriate, then the workshop outputs could be included as guidance for
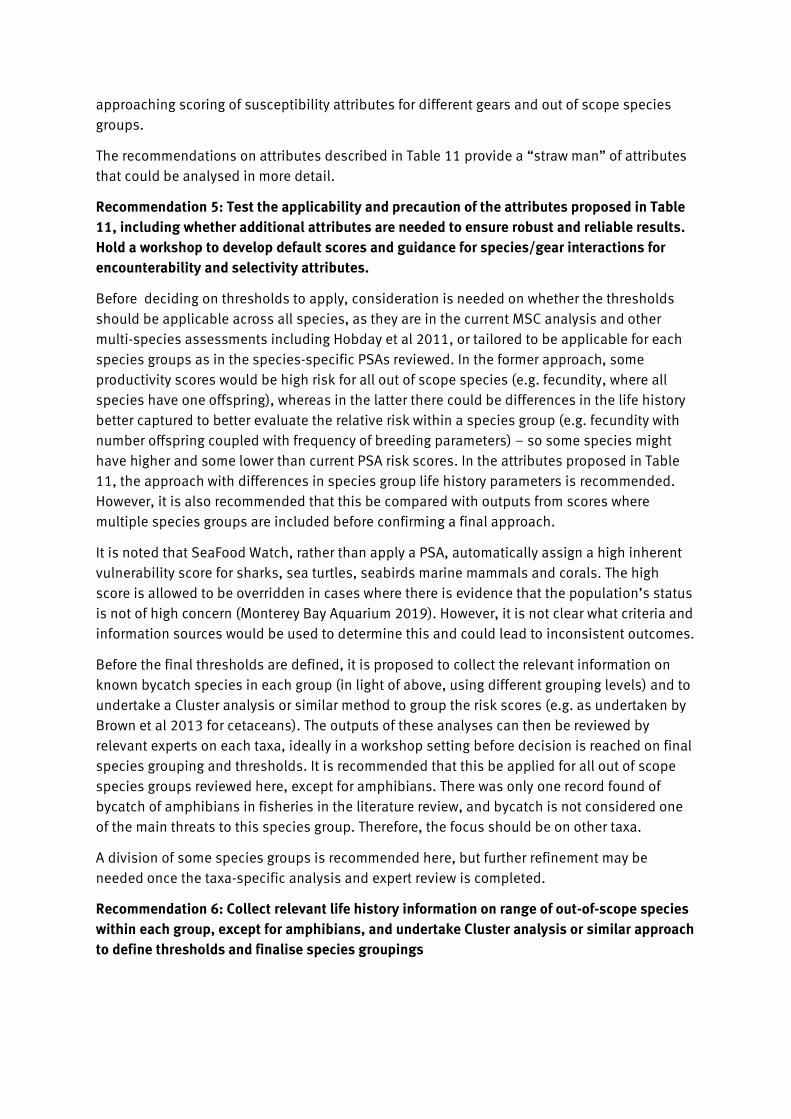
45
approaching scoring of susceptibility attributes for different gears and out of scope species
groups.
The recommendations on attributes described in Table 11 provide a “straw man” of attributes
that could be analysed in more detail.
Recommendation 5: Test the applicability and precaution of the attributes proposed in Table
11, including whether additional attributes are needed to ensure robust and reliable results.
Hold a workshop to develop default scores and guidance for species/gear interactions for
encounterability and selectivity attributes.
Before deciding on thresholds to apply, consideration is needed on whether the thresholds
should be applicable across all species, as they are in the current MSC analysis and other
multi-species assessments including Hobday et al 2011, or tailored to be applicable for each
species groups as in the species-specific PSAs reviewed. In the former approach, some
productivity scores would be high risk for all out of scope species (e.g. fecundity, where all
species have one offspring), whereas in the latter there could be differences in the life history
better captured to better evaluate the relative risk within a species group (e.g. fecundity with
number offspring coupled with frequency of breeding parameters) – so some species might
have higher and some lower than current PSA risk scores. In the attributes proposed in Table
11, the approach with differences in species group life history parameters is recommended.
However, it is also recommended that this be compared with outputs from scores where
multiple species groups are included before confirming a final approach.
It is noted that SeaFood Watch, rather than apply a PSA, automatically assign a high inherent
vulnerability score for sharks, sea turtles, seabirds marine mammals and corals. The high
score is allowed to be overridden in cases where there is evidence that the population’s status
is not of high concern (Monterey Bay Aquarium 2019). However, it is not clear what criteria and
information sources would be used to determine this and could lead to inconsistent outcomes.
Before the final thresholds are defined, it is proposed to collect the relevant information on
known bycatch species in each group (in light of above, using different grouping levels) and to
undertake a Cluster analysis or similar method to group the risk scores (e.g. as undertaken by
Brown et al 2013 for cetaceans). The outputs of these analyses can then be reviewed by
relevant experts on each taxa, ideally in a workshop setting before decision is reached on final
species grouping and thresholds. It is recommended that this be applied for all out of scope
species groups reviewed here, except for amphibians. There was only one record found of
bycatch of amphibians in fisheries in the literature review, and bycatch is not considered one
of the main threats to this species group. Therefore, the focus should be on other taxa.
A division of some species groups is recommended here, but further refinement may be
needed once the taxa-specific analysis and expert review is completed.
Recommendation 6: Collect relevant life history information on range of out-of-scope species
within each group, except for amphibians, and undertake Cluster analysis or similar approach
to define thresholds and finalise species groupings

46
Table 10 Attributes and thresholds recommended for out of scope species groups (except amphibians)
Species group Attribute P or S Thresholds Rationale
Seabirds (all) Age at first
reproduction
P Calibrate based on range of known
bycatch species
Captures variation in life history
characteristics within species group
Explanatory power for population growth
Used in seabird-specific risk assessments
Seabirds (all) Fecundity P Low risk: >1 egg, annual breeder
Medium risk: 1 egg / annual breeder
High risk: 1 egg / biannual breeder
Captures variation in life history
characteristics within species group
Explanatory power for population growth
Used in seabird-specific risk assessments –
developed mainly for albatross and petrel
species but likely to apply more widely
Marine mammals
(Cetaceans,
Pinnipeds,
Sirenians)
Age at first
reproduction
(female sexual
maturity)
P Calibrate based on range of known
bycatch species – determine if can group
all marine mammals or keep separate
Captures variation in life history
characteristics within species group
Explanatory power for population growth
Used in cetacean-specific risk assessments
Marine mammals
(Cetaceans,
Pinnipeds,
Sirenians)
Fecundity (inter-
calving interval /
breeding frequency)
P All have one young.
For cetaceans: High risk >3.5 years,
Medium: 2.6-3.5, Low <=2.5 years
Need to calibrate for other groups.
Captures variation in life history
characteristics within species group (traits
not captured by difference in size, e.g.
Maui’s dolphin)
Explanatory power for population growth
Used in cetacean-specific risk assessment,
so thresholds already cover wide range of
species (need to calibrate for other groups)

47
Species group Attribute P or S Thresholds Rationale
Marine mammals
(Cetaceans,
Pinnipeds,
Sirenians)
Oldest reproducing
female
P For cetaceans: High risk >=61 years,
Medium: 45-60 years; Low risk <=44 years
Need to calibrate for other groups.
Captures variation in life history
characteristics within species group and
considers reproductive senescence (rather
than using maximum age)
Explanatory power for population growth
Used in cetacean-specific risk assessments
so thresholds already cover wide range of
species (need to calibrate for other groups)
Sea turtles Age at first
reproduction
P Calibrate based on range of known
bycatch species
Captures variation in life history
characteristics within species group
Explanatory power for population growth
Used in sea turtle-specific risk assessments
Sea turtles Fecundity P Reproductive output per female per
season (need clutch size, number of nests
per season and remigration interval) e.g.
low = (90 eggs x 4 nests)/4 years = <90
Medium = 90-277
High = (120 eggs *6 nests)/2.6=>277
Captures variation in life history
characteristics within species group
Explanatory power for population growth
Combines multiple attributes used in sea
turtle-specific risk assessments (need to test
that the thresholds are still applicable as
such once combined)
Sea turtles Number of nesting
females in RMU
P Low p (high risk): very small & small;
Medium: medium & large: High: very large
RMU-specific guidance can be provided
(data available)
Captures variation in life history
characteristics within species group
Explanatory power for population growth
Used in sea turtle-specific risk assessments
Sea snakes Age at maturity P Calibrate based on range of known
bycatch species
Captures variation in life history
characteristics within species group
Explanatory power for population growth
Used in sea snake -specific risk assessments

48
Species group Attribute P or S Thresholds Rationale
Sea snakes Annual fecundity P Calibrate based on range of known
bycatch species
Captures variation in life history
characteristics within species group
Explanatory power for population growth
Used in sea snake-specific risk assessments
Sea snakes Average maximum
size
P Calibrate based on range of known
bycatch species. Consider if use length or
weight.
Captures variation in life history
characteristics within species group
Explanatory power for population growth
Used in sea snake-specific risk assessments
All out of scope
Areal overlap S As in current PSA. Provide specific
requirements on how to select e.g. the
season where greatest overlap occurs.
Provide guidance on methods for
estimating distribution of different
species groups (e.g. Small et al 2013
recommendations for seabirds).
Maintains attributes of catchability as set out
in Walker (2005) but guidance will allow
more consistent and precautionary
approaches by CABs
All out of scope
Encounterability S Develop a default set of scores in a
species/gear matrix based on behavioural
and gear-based factors, e.g. for gillnets
could be vertical overlap vs for pelagic
longline attraction to bait at surface for
surface feeders. Or make clear that all air-
breathing species will have high risk score
as per Hobday et al 2007.
Allow consideration of any mitigation
measures. If they are ‘best practice’ as
identified by ACAP, for example, may
reduce risk score.
Add guidance on how to score if ghost
fishing may occur in fishery
Maintains attributes of catchability as set out
in Walker (2005) but guidance will allow
more consistent and precautionary
approaches by CABs
Includes one of the unobserved mortality
elements

49
Species group Attribute P or S Thresholds Rationale
All out of scope
Selectivity S Develop a default set of scores in a
species/gear matrix based on likelihood
of gear to retain species if encountered.
Allow modifications under certain
conditions (e.g. different mesh sizes,
hook shapes etc)
Maintains attributes of catchability as set out
in Walker (2005) but guidance will allow
more consistent and precautionary
approaches by CABs
All out of scope
Potential for lethal
encounter
S High risk: interaction with gear likely to
result in death; Medium: interaction with
gear likely to result in injury; low:
interaction with gear unlikely to result in
injury or death
Maintains attributes of catchability as set out
in Walker (2005) but guidance will allow
more consistent and precautionary
approaches by CABs
Includes one of the unobserved mortality
elements
SWOT analysis
A Strengths, Weaknesses, Opportunities, Threats (SWOT) analysis was undertaken for each of the recommendations. Results are presented in
Table 12.
Table 11 SWOT Analysis of Recommendations compared to no change (or only guidance added)
Recommendation Strengths Weaknesses Opportunities Threats
Recommendation 1:
Consider and clearly specify
the objectives for using the
PSA, as linked to PIs in the
default assessment tree
Provides clearer
understanding for those
undertaking PSA and
stakeholders on how default
tree and RBF is linked
Justifies level of precaution
needed
Highlights that PSA is not
direct sustainability
measure
Highlights importance of
precautionary approach, so
some stakeholders may
support its use
Could allow development of
other metrics to better
evaluate sustainability
directly for data-deficient,
out of scope species
If not considered direct
sustainability measure,
some stakeholders may not
support use of approach as
method of assessing MSC
standard

50
Recommendation Strengths Weaknesses Opportunities Threats
Recommendation 2:
Undertake new calibration
precaution level in RBF
scores for PI 2.2.1 and
2.3.1, using a range of out-
of-scope species
Ensures overall risk scores
are aligned such that they
are more precautionary than
default tree PIs
If level of precaution
increased, may mean harder
for fisheries to pass or pass
without condition
If increase precaution, some
stakeholders will see this as
a positive step to increase
bar
If more fisheries get
conditions, could lead to
more on the water
improvements
If increase precaution, some
stakeholders will see this as
a negative step to increase
bar
More conditions are more
costly for clients
Recommendation 3: Specify
that scoring of PSA
attributes should be done at
the smallest relevant unit, a
population ideally
This is consistent with
default tree, but is not
always captured effectively
in default tree or RBF
Not all species can be
identified to population
level, so some level of
expert judgement will still
be included
May incentivise groups to
better define populations,
e.g. use of Regional
Management Units for sea
turtles
Risk with expert judgement
that there may be
inconsistency in how this is
approached particularly if
only guidance is provided
Also, scoring at species
level can be less
precautionary when e.g.
scoring areal overlap
Recommendation 4: Review
elements of PIs where out of
scope species are scored
that are not currently
captured in PSA and
consider how they could be
incorporated (if deemed
relevant) in PSA attributes,
thresholds or associated
guidance
Creates more consistency
between default tree and
RBF
Ensures sustainability
issues other than direct,
observed mortalities are
considered
Could make assessment
more onerous
May not be information
available to assess this
adequately in data-deficient
situations
May incentivise groups to
consider all sources of
impact
If more fisheries get
conditions because these
elements are considered, it
could lead to more on the
water improvements
Potential for more
conditions as more
elements considered – this
is more costly for clients
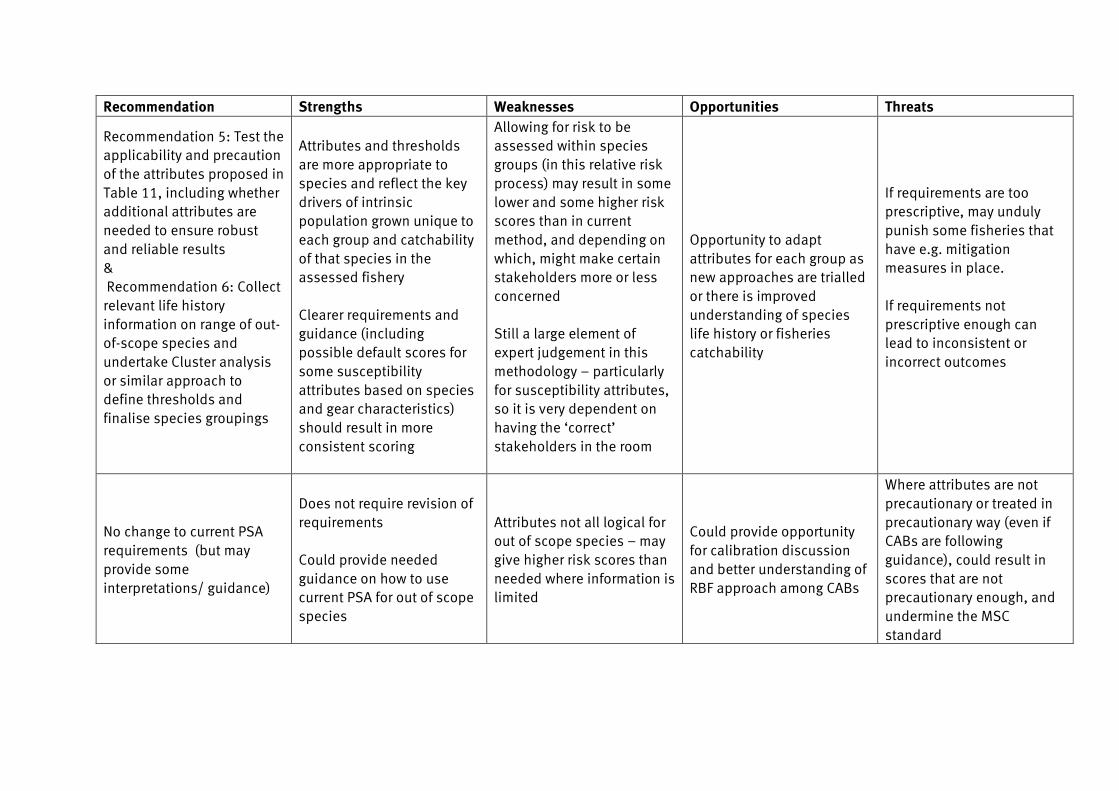
51
Recommendation Strengths Weaknesses Opportunities Threats
Recommendation 5: Test the
applicability and precaution
of the attributes proposed in
Table 11, including whether
additional attributes are
needed to ensure robust
and reliable results
&
Recommendation 6: Collect
relevant life history
information on range of out-
of-scope species and
undertake Cluster analysis
or similar approach to
define thresholds and
finalise species groupings
Attributes and thresholds
are more appropriate to
species and reflect the key
drivers of intrinsic
population grown unique to
each group and catchability
of that species in the
assessed fishery
Clearer requirements and
guidance (including
possible default scores for
some susceptibility
attributes based on species
and gear characteristics)
should result in more
consistent scoring
Allowing for risk to be
assessed within species
groups (in this relative risk
process) may result in some
lower and some higher risk
scores than in current
method, and depending on
which, might make certain
stakeholders more or less
concerned
Still a large element of
expert judgement in this
methodology – particularly
for susceptibility attributes,
so it is very dependent on
having the ‘correct’
stakeholders in the room
Opportunity to adapt
attributes for each group as
new approaches are trialled
or there is improved
understanding of species
life history or fisheries
catchability
If requirements are too
prescriptive, may unduly
punish some fisheries that
have e.g. mitigation
measures in place.
If requirements not
prescriptive enough can
lead to inconsistent or
incorrect outcomes
No change to current PSA
requirements (but may
provide some
interpretations/ guidance)
Does not require revision of
requirements
Could provide needed
guidance on how to use
current PSA for out of scope
species
Attributes not all logical for
out of scope species – may
give higher risk scores than
needed where information is
limited
Could provide opportunity
for calibration discussion
and better understanding of
RBF approach among CABs
Where attributes are not
precautionary or treated in
precautionary way (even if
CABs are following
guidance), could result in
scores that are not
precautionary enough, and
undermine the MSC
standard

52

53
Conclusion In conclusion, the review of MSC PSA compared to default tree scores, despite caveats,
indicates that the current PSA approach is not precautionary when applied to out of scope
species. In addition, the review of the only current application of the PSA for out of scope
species in the [text redacted] shows that it is challenging to apply the current PSA for out of
scope species, which can lead to incorrect or inconsistent outcomes. The overall review of the
logic of attributes considering the life history characteristics of the different out of scope
species also showed that many of the current attributes and thresholds are either
inappropriate or redundant. To address this, a number of recommendations were made to
review and revise attributes (Table 11). It is suggested that each species group have two to
three productivity attributes (compared to current seven) and the four susceptibility attributes
currently used are retained but that thresholds are redefined and requirements specific to gear
and out of scope species interactions are included.
Other recommendations were also made about considering out of scope species PSA going
forward, including linking objectives and risk levels for PSA to the default tree, re-calibrating
the level of precaution ensuring that out of scope species are adequately covered, defining the
unit (e.g. population) to be assessed and considering elements from the default tree like
unobserved mortality and indirect impacts in the PSA.
54
References Abraham ER, Neubauer P, Berkenbusch K, Richard Y. 2017. Assessment of the risk to New
Zealand marine mammals from commercial fisheries. New Zealand Aquatic Environment and
Biodiversity Report 189. Wellington: MPI. 123pp.
[text redacted]
Anderson ORJ, Small CJ, Croxall JP, Dunn EK, Sullivan BJ, Yates O, Black A. 2011. Global seabird
bycatch in longline fisheries. Endangered Species Research 14: 91-106.
[text redacted]
Angel A, Nel R, Wanless RM, Mellett B, Harris L, Wilson I. 2014. Ecological Risk Assessment of
Sea Turtles to Tuna Fishing in the ICCAT Region. Collect. Vol. Sci. Pap. ICCAT, 70(5):2226–59.
Arrizabalaga H, de Bruyn P, Diaz GA, Murua H, Chavance P, de Molina AD, et al. 2011.
Productivity and susceptibility analysis for species caught in Atlantic tuna fisheries. Aquatic
Living Resources (1):1–12.
[text redacted]
Breen P, Brown S, Reid D, Rogan E. 2017. Where is the risk? Integrating a spatial distribution
model and a risk assessment to identify areas of cetacean interaction with fisheries in the
northeast Atlantic. Ocean & Coastal Management 136: 148-155.
Brown SL, Reid D, Rogan E. 2013. A risk-based approach to rapidly screen vulnerability of
cetaceans to impacts from fisheries bycatch. Biol Conserv. 168:78–87.
Brown SL, Reid D, Rogan E. 2015. Spatial and temporal assessment of potential risk to
cetaceans from static fishing gears. Marine Policy 51: 267-280.
[text redacted]
Casale P & Heppell SS. 2016. How much sea turtle bycatch is too much? A stationary age
distribution model for simulating populatin abundance and potential biological removal in the
Mediterranean. Endangered Species Research 29: 239-254.
Courtney AJ, Schemel BL, Wallace R, Campbell MJ, Mayer DG, Young, B. 2010. Reducing the
impact of Queensland's trawl fisheries on protected sea snakes. Report to the Fisheries
Research and Development Corporation Project No. 2005/053. Queensland: Fisheries
Research and Development Corporation. 121pp.
Croxall JP, Butchart SHM, Lascelles B, Stattersfield AJ, Sullivan B, Symes A, Taylor P. 2012.
Seabird conservation status, threats and priority actions: a global assessment. Bird
Conservation International 22: 1-34.
Croxall JP & Rothery P. 1991 Population regulation of seabirds: implications of their
demography for conservation. In: Perrins CM; Lebreton J-D; Hirons GM, (eds.) Bird population
studies: relevance to conservation and management. Oxford, Oxford University Press, 272-
296.

55
Currey RJC, Boren LJ, Sharp BR, Peterson D. 2012: A risk assessment of threats to Maui’s
dolphins. Ministry for Primary Industries and Department of Conservation, Wellington. 51 pp.
Curtis KA & Moore JE. 2013. Calculating reference points for anthropogenic mortality of marine
turtles. Aquatic Conservation: Marine and Freshwater Ecosystems 23: 441-459.
Daley R, Webb H, Hobday A, Timmiss T, Walker T, Smith T, Dowdney, Williams A. 2007.
Ecological Risk Assessment for the Effects of Fishing. Report for the automatic longline sub-
fishery of the Southern and Eastern Scalefish and Shark Fishery. Report for the Australian
Fisheries Management Authority, Canberra.
Damortharan P, Arumuguam M, Vijayalakshmi S, Balasubramanian T. 2010. Diversity, biology
and ecology of sea snakes (Hydrophiidae) distributed along the Parangipettai coast, southeast
coast of India. International Journal of Current Research 4: 62-69.
Duffy, L & Griffiths S. 2017. Resolving potential redundancy of productivity attributes to
improve ecological risk assessments. Inter-American Tropical Tuna Commission Scientific
Advisory Committee. Eighth Meeting, La Jolla, CA. 8-12 May 2017.
Eckert KL, Wallace BP, Frazier JG, Eckert SA, Pritchard PCH. 2012. Synopsis of the Biological
Data on the Leatherback Sea Turtle (Dermochelys coriacea). Biological Technical Publication
BTP-R4015-2012. US Fish & Wildlife Service. 172pp.
Fry GC, Milton DA, Wassenberg TJ. 2011. The reproductive biology and diet of sea snake
bycatch of prawn trawling in northern Australia: characteristics important for assessing the
impacts on populations. Pacific Conservation Biology 7: 55-73.
Gagné TO, Hyrenbach KD, Hagemann ME, Bass OL, Pimm SL, MacDonald M, Peck B, Van
Houtan KS. 2018. Seabird Trophic Position Across Three Ocean Regions Tracks Ecosystem
Differences. Front. Mar. Sci. 5:317.
Gaillard J-M, Pontier D, Allaine D, Lebreton, JD, Trouvilliez J, Clobert J. 1989. An analysis of
demographic tactics in birds and mammals. Oikos 56: 59-76.
[text redacted]
Hammill MO, Blanchfield P, Higdon JW, Steward DB, Ferguson SH. 2016. Estimating abundance
and total allowable removals for walrus in Foxe Basin. DFO Can. Sci. Advis. Sec. Res. Doc.
2016/014. 20pp.
Heppell SS. 2005. Development of alternative quantitative tools to assist in jeopardy
evaluation for sea turtles. Final Report for the Southeast Fisheries Science Center. Department
of Fisheries and Wildlife, Oregon State University.
Hobday AJ, Smith ADM, Stobutzki IC, Bulman C, Daley R, Dambacher JM, et al. 2011. Ecological
risk assessment for the effects of fishing. Fish Res. 108(2–3):372–84.
Hobday AJ, Smith A, Webb H, Daley R, Wayte S, Bulman C, et al. 2007. Ecological Risk
Assessment for Effects of Fishing: Methodology. Canberra: Australian Fisheries Management
Authority R04/1072.
56
Hoque B & Saidapur SK. 1994. Dynamics of oogenesis in the tropical anuran Rana tigrina
(Amphibia: Ranidae) with special reference to vitellogenic cycles in wild-caught and captive
frogs. Journal of biosciences 19(3): 339-352.
Hordyk, A.R., Carruthers, T.R. (2018) A quantitative evaluation of a qualitative risk assessment
framework: Examining the assumptions and predictions of the Productivity Susceptibility
Analysis (PSA). PLOS One 13(6): e0198298.
Jiménez, S., Domingo, A., Abreu, M., & Brazeiro, A. (2012) Risk assessment and relative impact
of Uruguayan pelagic longliners on seabirds. Aquatic Living Resources, 25(4), 281–295.
Keyfitz, N. 1968. “Introduction to the Mathematics of Population,'' Addison-Wesley, Reading,
MA.
Kirby, D.S. 2006. Ecological risk assessment for species caught in WCPO Tuna fisheries:
inherent risk as determined by productivity-susceptibility analysis. Pap EB WP–1 2nd Meet Sci
Comm West Cent Pacific Fish Comm WCPFC–SC1, Manila, Philipp.; 7–18
Kiszka JJ. 2012. An Ecological Risk Assessment (ERA) for marine mammals, sea turtles and
elasmobranchs captured in artisanal fisheries of the SW Indian Ocean based on interview
survey data. IOTC WPEB 2012. 14pp.
Lemen CA, Voris HK. 1981. A Comparison of Reproductive Strategies among Marine Snakes.
Journal of Animal Ecology 50: 89-101.
Lennox RJ, Twardek WM, Cooke SJ. 2018. Observations of Mudpuppy (Necturus maculosus)
bycatch in a recreational ice fishery in northern Ontario. Canadian Field-Naturalist 132(1): 61-
66.
Lewison RL, Crowder LB, Read AJ, Freeman SJ. 2004. Understanding impacts of fisheries
bycatch on marine megafauna. Trends in Ecology and Evolution 19(11): 598-604.
Lotka A. 1907. Relation between birth rates and death rates. Science 26: 21-22.
MSC. 2018a. Fisheries Certification Process v2.1. London: Marine Stewardship Council.
MSC. 2018b. Guidance to the Fisheries Certification Process v2.1. London: Marine Stewardship
Council.
Mateo I, Ennis GP, Dunne E. 2018. Public Certification Report for Newfoundland & Labrador
snow crab. Dundalk, IE: SAI Global. 257pp.
Micheli F, De Leo G, Butner C, Martone RG, Shester G. 2014. A risk-based framework for
assessing the cumulative impact of multiple fisheries. Biol Conserv.; 176:224–35.
Milton, DA. 2001. Assessing the susceptibility to fishing of populations of rare trawl bycatch:
Sea snakes caught by Australia’s northern prawn fishery. Biol Conserv. 2001, 101(3):281–90.
Monterey Bay Aquarium. 2019. Seafood Watch Standard for Fisheries, Public comment period
– 2. Online: https://www.montereybayaquarium.org/-
/m/C73BE3D0AEA244D8A29BA9DD11CAE920.pdf?mpweb=1321-2440-619140 (accessed 2
September 2019).

57
Murua H, Arrizabalaga H, Julia Hsiang-Wen Huang J, Romanov E, Bach P, de Bruyn P, et al.
2009. Ecological Risk Assessment (ERA) for species caught in fisheries managed by the Indian
Ocean Tuna (IOTC): a first attempt.
Nel R, Wanless RM, Angel A, Mellet B, Harris L. 2013. Ecological Risk Assessment and
Productivity Susceptibility Analysis of sea turtles overlapping with fisheries in the IOTC region.
Unpublished Report to IOTC and IOSEA Marine Turtle MoU. 99pp.
Nisbet ICT. 1989. Long-Term Ecological Studies of Seabirds. Colonial Waterbirds 12(2): 143-
147.
Pauly D, Trites AW, Capuli E, Christensen V. 1998. Diet composition and trophic levels of
marine mammals. ICES Journal of Marine Science, 55: 467–481.
[text redacted]
Rasmussen AR, Murphy JC, Ompi M, Gibons JW, Uetz P. 2011. Marine Reptiles. PLoS ONE 6(11):
e27373.
Reeves RR, Folkens PA et al. 2002. National Audubon Society Guide to Marine Mammals of the
World. New York: AA Knopf. 527pp.
Reichart, HA. 1993. Synopsis of Biological Data on the Olive Ridley Sea Turtle Lepidochelys
olivacea in the Western Atlantic. Miami: National Marine Fisheries Service Southeast Fisheries
Science Center. 86pp.
Richard Y, Abraham ER. 2017. Assessment of the risk of commercial fisheries to New Zealand
seabirds, 2006-07 to 2014-15. New Zealand Aquatic Environment and Biodiversity Report No.
191. Wellington: MPI.
Sharp BR. 2017. Spatially Explicit Fisheries Risk Assessment (SEFRA): A framework for
quantifying and managing incidental commercial fisheries impacts on non-target species. In
Aquatic Environment and Biodiversity Annual Review (AEBAR) 2017: A summary of
environmental interactions between the seafood sector and the aquatic environment. Ministry
for Primary Industries, New Zealand, 724 pp.
Shealer DA. 2002. Foraging behaviour and food of seabirds. In Schrieber EA, Burger J (Eds)
Biology of Marine Birds. New York: CRC Press: 137-170.
Small C; Waugh SM; Phillips RA. 2013. The justification, design and implementation of
Ecological Risk Assessments of the effects of fishing on seabirds. Marine Policy 37: 192-199.
Sonntag N, Schwemmer H, Fock HO, Bellebaum J, and Garthe S. 2012. Seabirds, set-nets, and
conservation management: assessment of conflict potential and vulnerability of birds to
bycatch in gillnets. ICES Journal of Marine Science 69: 578–589.
Sodhi NS, Bickford D, Diesmos AC, Lee TM, Koh LP, et al. 2008. Measuring the Meltdown:
Drivers of Global Amphibian Extinction and Decline. PLoS ONE 3(2): e1636.
Stobutzki I, Miller M, Brewer D. 2001. Sustainability of fishery bycatch: a process for assessing
highly diverse and numerous bycatch. Environmental Conservation 28(2):167–81.

58
Taylor BL, Chivers SJ, Larese J, Perrin WF. 2007. Generation length and percent mature
estimates for IUCN assessments of cetaceans. Administrative report LJ-07-01. Southwest
Fisheries Science Center, National Marine Fisheries Service.
Tuck GN, Phillips RA, Small C, Thomson RB, Klaer NL, Taylor F, … Arrizabalaga H. (2011) An
assessment of seabird – fishery interactions in the Atlantic Ocean. ICES Journal of Marine
Science, 68(8), 1628–1637.
Wade, PR. 1998. Calculating limits to the allowable human-caused mortality of cetaceans and
pinnipeds. Marine Mammal Science 14(1): 1-37.
Walker TL. 2005. 13 Management measures. In Musick JA, Bonfil R (Eds.) Management
techniques for elasmobranch fisheries. FAO Fisheries Technical Paper 474: 216-242.
Wallace BP, DiMatteo AD, Bolten AB, Chaloupka MY, Hutchinson BJ, et al. 2011. Global
Conservation Priorities for Marine Turtles. PLoS ONE 6(9): e24510.
Wallace BP, Kot CY, DiMatteo AD, Lee T, Crowder LB, Lewison RL. 2013. Impacts of fisheries
bycatch on marine turtle populations worldwide: toward conservation and research priorities.
Ecosphere 4(3):40.
Warden ML. 2010. Bycatch of wintering common and red-throated loons in gillnets off the USA
Atlantic coast 1996-2007. Aquatic Biology 10: 167-180.
Waugh SM, Filippi DP, Kirby DS, Abraham E, Walker, N. 2012 Ecological Risk Assessment for
seabird interactions in Western and Central Pacific longline fisheries. Marine Policy, 36(4),
933–946.
Weimerskirch H. 2002 Seabird Demography and its Relationship with the marine Environment.
In Biology of Marine Birds

59
Appendix 1 Productivity and Susceptibility scores per species group
Table A1.1 Productivity attribute scores by species group: seabirds
Species Sub-group rmax AM MA F MS SM RS TL Overall
P
Black-browed albatross
(Thalassarche melanophris)
Pelagic seabird Campbell black
browed: 0.058*
2 3 3 2 2 3 3 2.57
White-chinned petrel
(Procellaria aequinoctialis)
Pelagic seabird 0.076* 2 3 3 2 2 3 3 2.57
Great shearwater (Ardenna gravis)
Pelagic seabird Sooty
shearwater :
0.088*
2 2 3 2 2 3 3 2.43
Common loon (Gavia immer) Coastal seabird? 0.086-0.122** 2 2 3 2 2 3 3 2.43
Kelp Gull (Larus dominicanus) Coastal seabird 0.142* 1 2 3 2 2 3 3 2.29
Marbled murrelet
(Brachyramphus marmoratus)
Coastal seabird? unknown 1 1 3 1 2 3 3 2.00
*rmax values from Richard et al 2017, used similar species where specific species not available
**estimated from data in Warden 2010
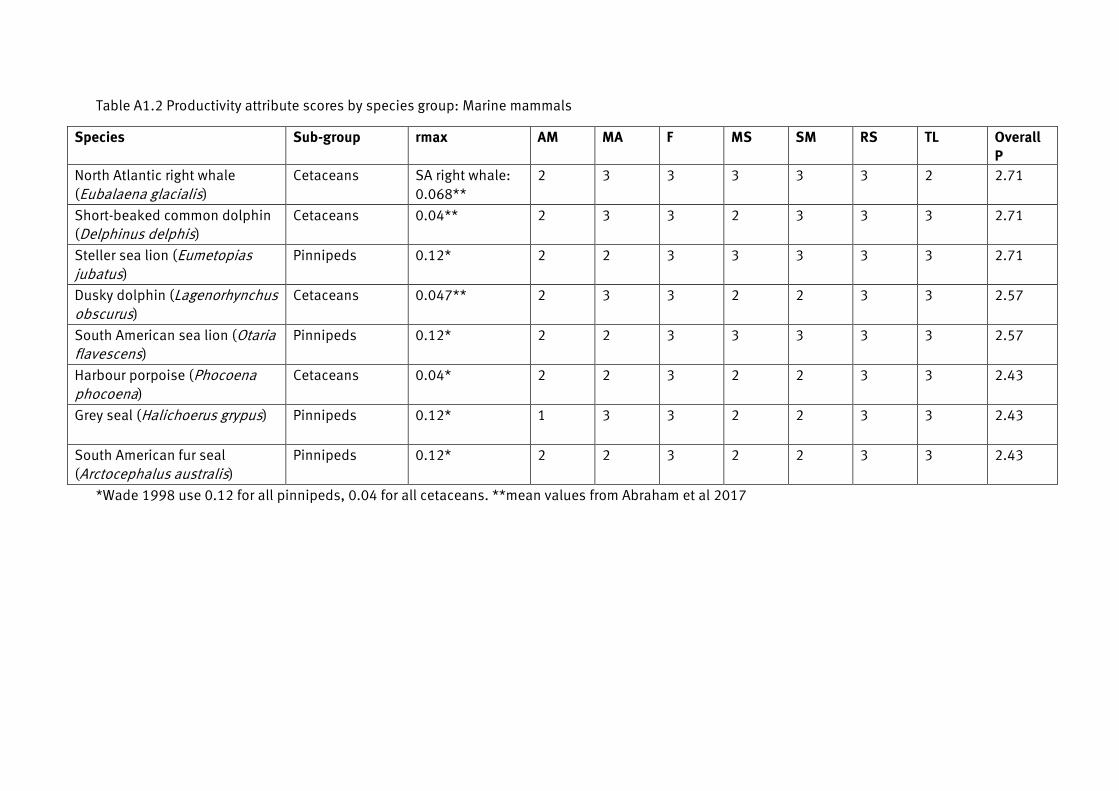
60
Table A1.2 Productivity attribute scores by species group: Marine mammals
Species Sub-group rmax AM MA F MS SM RS TL Overall
P
North Atlantic right whale
(Eubalaena glacialis)
Cetaceans SA right whale:
0.068**
2 3 3 3 3 3 2 2.71
Short-beaked common dolphin
(Delphinus delphis)
Cetaceans 0.04** 2 3 3 2 3 3 3 2.71
Steller sea lion (Eumetopias jubatus)
Pinnipeds 0.12* 2 2 3 3 3 3 3 2.71
Dusky dolphin (Lagenorhynchus obscurus)
Cetaceans 0.047** 2 3 3 2 2 3 3 2.57
South American sea lion (Otaria flavescens)
Pinnipeds 0.12* 2 2 3 3 3 3 3 2.57
Harbour porpoise (Phocoena phocoena)
Cetaceans 0.04* 2 2 3 2 2 3 3 2.43
Grey seal (Halichoerus grypus) Pinnipeds 0.12* 1 3 3 2 2 3 3 2.43
South American fur seal
(Arctocephalus australis)
Pinnipeds 0.12* 2 2 3 2 2 3 3 2.43
*Wade 1998 use 0.12 for all pinnipeds, 0.04 for all cetaceans. **mean values from Abraham et al 2017

61
Table A1.3 Productivity attribute scores by species group: Marine reptiles (Note rmax not included as value not found in literature review for these
species)
Species Sub-group AM MA F MS SM RS TL Overall P
Leatherback turtle (Dermochelys coriacea)
Sea turtle 3 3 3 2 2 2 3 2.57
Elegant sea snake (Hydrophis elegans)
Sea snake 1 2 3 2 2 3 3 2.29
Short-nosed sea snake
(Aipysurus apraefrontalis)
Sea snake 2 2 3 1 2 3 2 2.14
Olive ridley turtle (Lepidochelys olivacea)
Sea turtle 2 2 2 1 2 2 2 1.86
Table A1.4 Productivity attribute scores by species group: Amphibians (Note rmax not included as value not found in literature review for these
species)
Species Sub-group AM MA F MS SM RS TL Overall P
Mudpuppy (Necturus maculosus)
Salamander 2 3 3 1 1 2 1 1.86
Goliath frog (Conraua goliath)
Frog 3* 3* 1 1 1 2 2 1.86
Eastern Tiger salamander /
Waterdogs (Ambystoma tigrinum)
Salamander 1 2 2 1 1 2 1 1.43
Indian bullfrog (Hoplobatrachus
tigerinus / Rana tigerinus)
Frog 1 1 2 1 1 2 2 1.43
*Default high risk score as no information found

62
Table A1.5 Susceptibility attributes and gear evaluated for seabird species
Species Sub-group Gear evaluated AO E S PCM Overall S
White-chinned petrel (Procellaria
aequinoctialis) Pelagic seabird
Demersal
longline 3 3 1 3 1.65
Common loon AKA Great northern
diver (Gavia immer) Diving seabird Gillnet 3 2 1 3 1.43
Black-browed albatross
(Thalassarche melanophris) Pelagic seabird Mid-water trawl 2 3 1 1 1.13
Great shearwater (Ardenna
gravis) Pelagic seabird Mid-water trawl 1 3 1 1 1.05
Kelp Gull (Larus dominicanus) Pelagic seabird Mid-water trawl 1 3 1 1 1.05
Marbled murrelet
(Brachyramphus marmoratus) Diving seabird Gillnet 1 1 1 3 1.05

63
Table A1.6 Susceptibility attributes and gear evaluated for marine mammal species
Species Sub-group Gear evaluated AO E S PCM Overall S
Dusky dolphin (Lagenorhynchus
obscurus) Cetaceans Mid-water trawl 2 3 2 3 1.88
Short-beaked common dolphin
(Delphinus delphis) Cetaceans Mid-water trawl 2 3 2 3 1.88
Harbour porpoise (Phocoena
phocoena) Cetacean Gillnet 3 1 3 3 1.65
North Atlantic right whale
(Eubalaena glacialis) Cetacean Pots/traps 2 3 2 2 1.58
South American fur seal
(Arctocephalus australis) Pinnipeds Mid-water trawl 3 3 2 1 1.43
South American sea lion (Otaria
flavescens) Pinnipeds Mid-water trawl 2 3 2 1 1.28
Table A1.7 Susceptibility attributes and gear evaluated for reptile species
Species Sub-group Gear evaluated AO E S PCM Overall S
Elegant sea snake (Hydrophis
elegans) Sea snakes Otter trawl
1 3
3
2
1.43
Short-nosed sea snake
(Aipysurus apraefrontalis) Sea snakes Otter trawl
2 3
1
2
1.28
Leatherback turtle (Dermochelys
coriacea) Turtles Pelagic longline
1 3
1
2
1.13

64
Appendix 2 Other PSA attributes Table A2.1 Attributes from PSA approaches applied to one or more out of scope species group. Medium blue highlight indicates that the attribute and threshold were both considered useful to consider for the MSC PSA.
Lighter blue highlight indicates that either the was considered useful but the threshold was not.
Species group Assessment (ref) Geographical
area Gear(s) P or S Attribute
Attribute
useful MSC
(Y/N)
Threshold
Threshold
useful
MSC (Y/N)
Pelagic seabirds
WCPFC ERA for
seabirds (Waugh et al
2012)
WCPFC Longline
P Fecundity Factors Index (FFI) Y
Life-history strategy (annual breeding, multiple-egg clutches=1;
annual-breeding, single-egg clutches=2; biennial breeding,
single-egg clutches=3) and median age at first breeding (<5years=
1, 5–7.5 years group= 2, >7.5 years= 3).
Y
S Susceptibility N
Product of fishing effort (number of hooks in 5x5 squares for
period 2002-2009 from WCPFC database) and normalised species
distributions (i.e. proportion of a species' range). This was
weighted with the vulnerability (V is equivalent to the average
number of birds of a particular taxon group caught per 1000
longline sets).
N/A
Pelagic seabirds
ICCAT ERA for
seabirds - objective 1
(Tuck et al 2011)
ICCAT Longline
P Life history strategy Y High risk: Biennial breeder, single egg, Medium: annual breeder,
single-egg clutch, Low: Annual breeder, multiple-egg clutch Y
S IUCN status N Critically endangered/Endangered=3, Vulnerable=2, Near
Threatened=1, and Least Concern=0 N/A
S Breeding population status N Rapid decline (>2% per year)=3, decline=2, stable=1, increase=0 N/A
S Behavioural susceptibility to
capture Y
High=3, low=1. The last was based on the tendency of seabirds to
follow fishing vessels and the relative incidence of bycatch in
ICCAT or other fisheries. N
Pelagic seabirds
Uruguay ERA for
seabirds in longline
fisheries
SW Atlantic Longline
P
Demographic Invariant
Method (DIM): use λmax
(maximum annual growth
rate)
N Calculated with overall risk - no thresholds assigned
N/A
S
Frequency of occurrence:
number of counts in which a
species occurred as a
percent of the total number
of counts of seabirds
associated with the boats
N
Low (0.33): If population size is >100,000 breeding pairs, FO<25%;
if population size is 10,000-100000 bp, FO<10%, if pop size
<10,000 bp, FO<5%
Medium (0.67): pop size large, FO 25-50%; pop size medium FO
10-25%, pop size small FO 5-10%
High (1.00): large FO >50%, medium FO >25%, small FO >10% N/A
S Access to bait Maybe N of bait access/ N of bird present during observations: High
>67%ile, Medium 33<x<67%ile, Low <33%ile
Y but see
attribute
S Hook selectivity Maybe High: Culmen>Total length (TL) of hook, Medium: Front length of
hook<Culmen<TL, Low: Culmen<FL N
S Post-capture mortality Y High: number of dead birds/number captured approx 1 N
Sea turtles ICCAT ERA for turtles
(Angel et al 2014) ICCAT
Longline, purse
seine P
Number of breeding females
(threshold diff for each
species)
Y
Diff for each species. Number of breeding females per RMU
(population), e.g. Dermochlelys coriacea. Low productivity (high
risk): Very small <10 or Small (10-100); Medium productivity:
Medium (100-500) or large (500-1000). High productivity: very
large (>1000) Y

65
Species group Assessment (ref) Geographical
area Gear(s) P or S Attribute
Attribute
useful MSC
(Y/N)
Threshold
Threshold
useful
MSC (Y/N)
P Population trend N Low p (high risk): declining/uncertain; medium: stable, high p:
increasing Y
P Age at maturity Y low p: >30 years, medium: 16-30 years, high p: <16 years Y
P Hatching success Y low p: <50%, medium 50-75%, high >75% Y
P Emergence success Y low p: <50%, medium 50-75%, high >75% Y
P Mean clutch size Y Low p: <90 eggs, Medium: 90-120, High p: >120 Y
P Nests/female/season Y Low p: <4 nests, Medium: 4-6, High p: >6 Y
P Remigration interval Y Low p: >4 years, Medium: 4-2.6, High p: <2.6 Y
S
Overlap with ICCAT region
(no. of 2.5 degree squares
covered by a RMU's
distribution as a proportion
of all squres (2000) in the
ICCAT region)
Y Low s (low risk): <50, Medium: 50-100, High >100
Maybe
S Confidence (no. of satellite
tracks) N Low s: <5, Medium: 5-30, High: >30
N/A
S Bycatch mortality relative to
breeding females (%) Maybe Low s: <30, Medium: 30-100, High s: >100
Maybe but
see
attribute
Sea turtles
ERA for sea turtles in
IOTC region (Nel et al
2013)
IOTC Longline, purse
seine, gillnet
P Population trend N Low p (high risk): declining/uncertain; medium: stable, high p:
increasing N/A
P RMU size/clades (no. of
nesting females) Y
Low p (high risk): very small & small; Medium: medium & large:
High: very large N
P Age at maturity Y low p: >30 years, medium: 16-30 years, high p: <16 years Y
P
Natural survivorship: Nest
success (inferred from
literature on land based
threats if not stated
explicitly)
Maybe low p (high risk): <50%; medium: 50-75%; high >75%
Y but see
attribute
P
Natural survivorship:
Hatching and Emergence
success (% of nests
producing eggs)
Y low p (high risk): <50%; medium: 50-75%; high >75%
Y
P Number of eggs per female Y Low p: <90 eggs, Medium: 90-120, High p: >120 Y
P No of clutches per individual
per season Y Low p: <4 nests, Medium: 4-6, High p: >6
Y
P Remigration interval Y Low p: >4 years, Medium: 4-2.6, High p: <2.6 Y
S Management Strategy /
Recovery plan N Wallace et al 2011 threat score
N/A

66
Species group Assessment (ref) Geographical
area Gear(s) P or S Attribute
Attribute
useful MSC
(Y/N)
Threshold
Threshold
useful
MSC (Y/N)
S
Spatial overlap RMU with
IOTC region (based on
number of 2.5x2.5 degree
squares with presence of
turtle)
Y Low s (low risk): <30; Medium: 30-60, High>60 squares
Maybe
S
Confidence estimate in
distribution data (based on
number of tracks)
N Low s: 1, Medium: 2, High: 3
N/A
S Bycatch estimate relative to
natural mortality Maybe
Low risk, Medium risk, High risk. Natural mortality for adult turtles
was 5-10%. Values were rated as low at 30% catch rate to total
estimated adult female numbers, medium at 100% and high
>100% of estimated adult female numbers (or RMU size). For hard-
shelled turtles this translates roughly as low if <500 individuals
are caught and high if >1500 individuals are caught.
Maybe but
see
attribute
Cetaceans
Risk-based approach
for screening
vulnerability of
cetaceans to fisheries
bycatch (Brown et al
2013)
NE Atlantic
Gillnet, demersal
longline, pots,
otter trawls,
seines, pelagic
trawls
P Age at female sexual
maturity Y High risk: >=11 years; Medium: 6-10 years; Low risk: <=5 years
Y
P Oldest reproducing female Y High risk >=61 years, Medium: 45-60 years; Low risk <=44 years Y
P Calf survival (proportion) N High risk <=0.76, Medium: 0.77-0.89; low risk >=0.90 N/A
P Intercalving interval Y High risk >3.5 years, Medium: 2.6-3.5, Low <=2.5 years Y
S Availability Y
High: NE Atlantic distribution/subspecies/subpopulation.
Medium: N Atlantic distribution/subspecies/subpopulation. Low:
Atlantic distribution Maybe
S Encounterability Maybe
High: Total spatial or temporal overlap; Medium: Spatial and
temporal overlap and less than half of habitat range unaffected;
Low: Spatial and temporal overlap but more than half of habitat
range unaffected.
Y but see
attribute
S Selectivity Y High: high potential for capture; Medium: moderate potential for
capture; Low: low potential for capture Y
S Potential for lethal
encounter Y
High risk: interaction with gear likely to result in death; Medium:
interaction with gear likely to result in injury; low: interaction with
gear unlikely to result in injury or death Y
Cetaceans
Harbour porpoise &
minke whale risk
assessment in Irish
Sea (Brown et al
2015)
Irish Sea Gillnet,
longlines, pots
P Age at female sexual
maturity Y High risk: >=11 years; Medium: 6-10 years; Low risk: <=5 years
Y
P Oldest reproducing female Y High risk >=61 years, Medium: 45-60 years; Low risk <=44 years Y
P Calf survival (proportion) N High risk <=0.76, Medium: 0.77-0.89; low risk >=0.90 Y but see
attribute
P Intercalving interval Y High risk >3.5 years, Medium: 2.6-3.5, Low <=2.5 years Y
S Availability Y High risk: >30% overlap between fishing activity & species
distribution; Medium: 10-30% overlap; Low <10% overlap Y
S Encounterability Maybe
High risk: Overlaps with fishery year-round; Medium: overlaps
with fishery beyond the assessment period but not year round;
Low: overlap limited to the assessment period
Y but see
attribute

67
Species group Assessment (ref) Geographical
area Gear(s) P or S Attribute
Attribute
useful MSC
(Y/N)
Threshold
Threshold
useful
MSC (Y/N)
S Selectivity Y High: high potential for capture; Medium: moderate potential for
capture; Low: low potential for capture Maybe
S Potential for lethal
encounter Y
High risk: interaction with gear likely to result in death; Medium:
interaction with gear likely to result in injury; low: interaction with
gear unlikely to result in injury or death Y
Sea snakes
Risk assessment for
sea snakes in
Australia Northern
Prawn fishery (Milton
2001)
Australia Prawn trawl
P Maximum weight Y Low p (high risk): Max weight >3546g, Medium: 1974-3546g,
High: <1974 g Maybe
P % of biomass removed N
Low p (high risk): Species where the estimated proportion of the
biomass removed was greater than a quarter; Medium: Species
where estimated proportion of the biomass removed was between
a sixth and a quarter; High: Species where the estimated
proportion of the biomass removed was between a sixth and a
quarter N/A
P Length at maturity Maybe
Low p (high risk): Mean length of the snakes caught is
significantly less than the length at sexual maturity. Medium:
Mean length of the catch is statistically similar to the length at
sexual maturity. High: The mean length of the catch is significantly
longer than the length at sexual maturity.
Maybe but
see
attribute
P Mortality index N L p (high risk): Species with relative mortality (Z) >1.35; medium: Z
between 0.88 and 1.35; High: Z<0.88 N/A
P Annual fecundity Y Low p (high risk): Annual fecundity <5.3 eggs (clutch size);
Medium: Fecundity 5.3-8.2; Fecundity >8.2 Maybe
S Preferred habitat Maybe
Low s (high risk): Species that primarily occur on soft or muddy
sediments or prawn trawl grounds; Medium: Species that occur in
soft sediment areas, but are known to migrate to coastal waters
and use estuaries; High: Species that prefer habitats outside trawl
areas ,such as reef habitat Maybe
S Survival Y Low s (high risk): Species with the lowest survival rate from
trawling (62-73%); Medium: 74-87%; High: 88-100% Maybe
S Range Y Low s (high risk): Species that occurred in < 5 of 9 bioregions;
Medium: 5-7 bioregions; High: >7 bioregions Maybe
S Day/night N
Low s (high risk): Species with higher catch rates in prawn trawls
at night; Medium: Similar catch rates day and night: high: species
with higher catch rates during the day N/A
S Diet Maybe
Low s (high risk): Species that eat benthic fish species that are
regularly discarded from trawls; Medium: ate benthic species that
did not regularly appear in prawn trawl catches; High: species eat
only reef-associated species N
Multi: sea
turtles + fish
PSA Bycatch of
Atlantic tuna: EU
Tropical Purse seine
& US pelagic longline
fisheries
ICCAT Longline, purse
seine P1
Productivity methodology 1=
(RS)/3+(Lmat/Lmax) where
RS= reproductive strategy.
Lmat is length at maturity.
Lmax is maximum length.
N Calculated with overall risk - no thresholds assigned
N/A
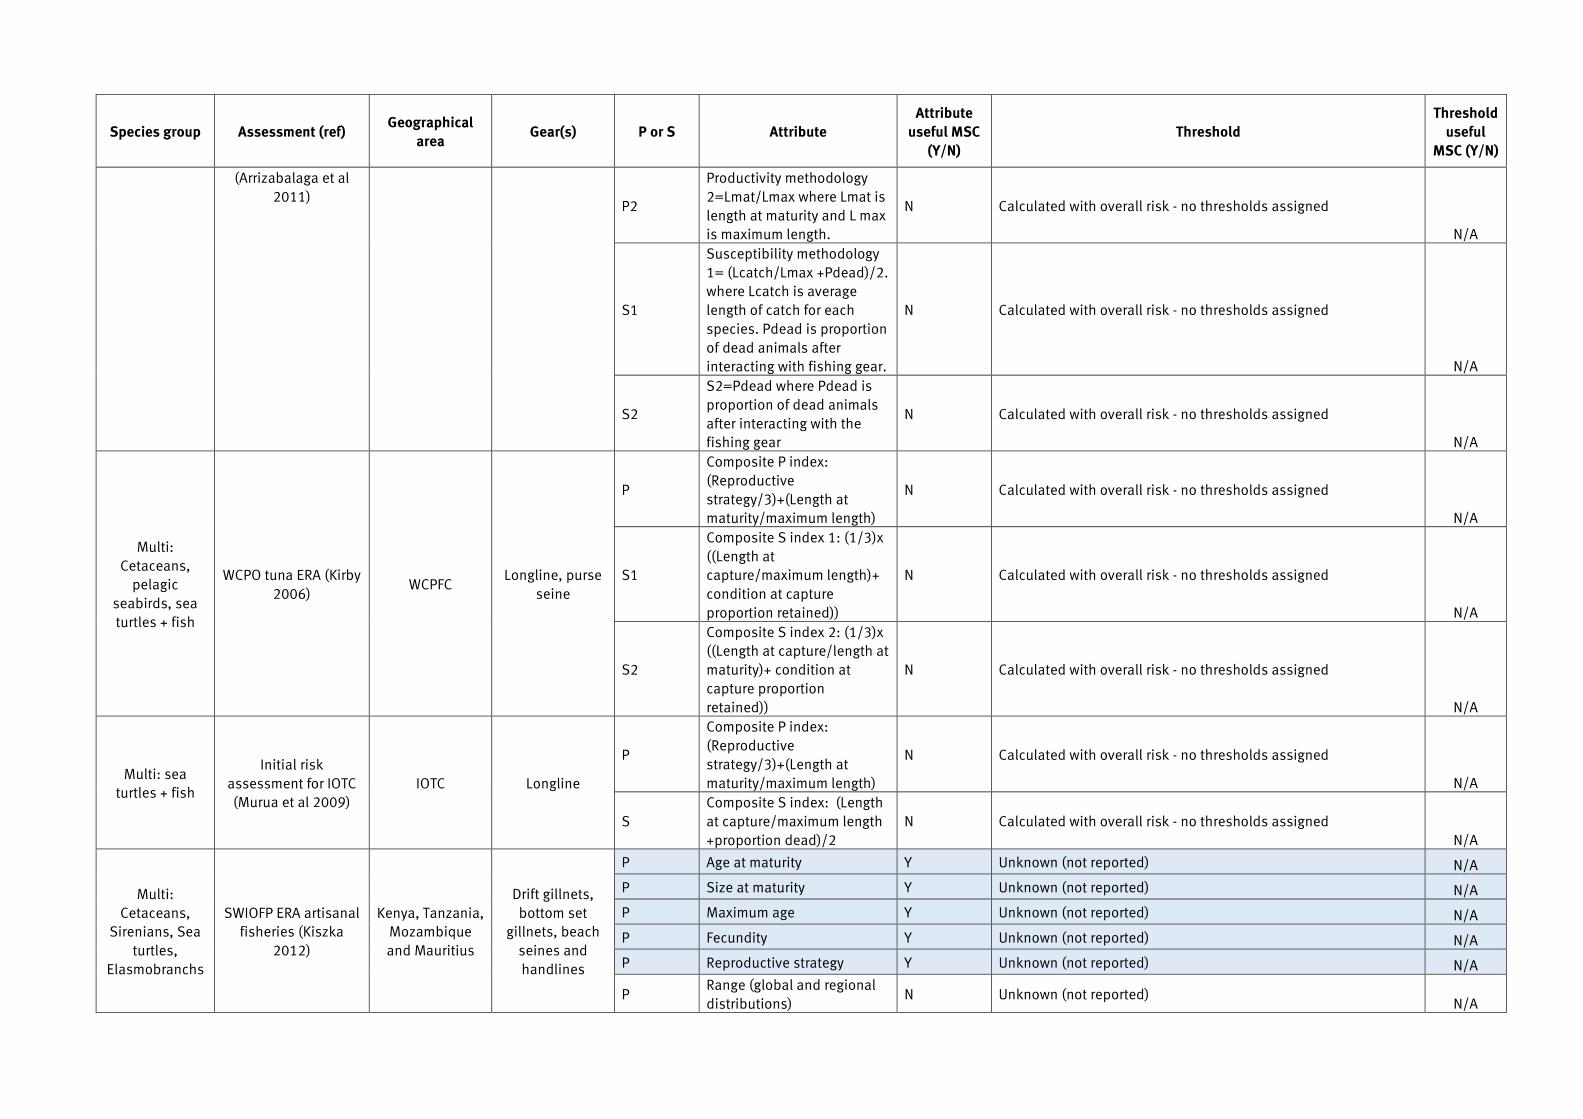
68
Species group Assessment (ref) Geographical
area Gear(s) P or S Attribute
Attribute
useful MSC
(Y/N)
Threshold
Threshold
useful
MSC (Y/N)
(Arrizabalaga et al
2011) P2
Productivity methodology
2=Lmat/Lmax where Lmat is
length at maturity and L max
is maximum length.
N Calculated with overall risk - no thresholds assigned
N/A
S1
Susceptibility methodology
1= (Lcatch/Lmax +Pdead)/2.
where Lcatch is average
length of catch for each
species. Pdead is proportion
of dead animals after
interacting with fishing gear.
N Calculated with overall risk - no thresholds assigned
N/A
S2
S2=Pdead where Pdead is
proportion of dead animals
after interacting with the
fishing gear
N Calculated with overall risk - no thresholds assigned
N/A
Multi:
Cetaceans,
pelagic
seabirds, sea
turtles + fish
WCPO tuna ERA (Kirby
2006) WCPFC
Longline, purse
seine
P
Composite P index:
(Reproductive
strategy/3)+(Length at
maturity/maximum length)
N Calculated with overall risk - no thresholds assigned
N/A
S1
Composite S index 1: (1/3)x
((Length at
capture/maximum length)+
condition at capture
proportion retained))
N Calculated with overall risk - no thresholds assigned
N/A
S2
Composite S index 2: (1/3)x
((Length at capture/length at
maturity)+ condition at
capture proportion
retained))
N Calculated with overall risk - no thresholds assigned
N/A
Multi: sea
turtles + fish
Initial risk
assessment for IOTC
(Murua et al 2009)
IOTC Longline
P
Composite P index:
(Reproductive
strategy/3)+(Length at
maturity/maximum length)
N Calculated with overall risk - no thresholds assigned
N/A
S
Composite S index: (Length
at capture/maximum length
+proportion dead)/2
N Calculated with overall risk - no thresholds assigned
N/A
Multi:
Cetaceans,
Sirenians, Sea
turtles,
Elasmobranchs
SWIOFP ERA artisanal
fisheries (Kiszka
2012)
Kenya, Tanzania,
Mozambique
and Mauritius
Drift gillnets,
bottom set
gillnets, beach
seines and
handlines
P Age at maturity Y Unknown (not reported) N/A
P Size at maturity Y Unknown (not reported) N/A
P Maximum age Y Unknown (not reported) N/A
P Fecundity Y Unknown (not reported) N/A
P Reproductive strategy Y Unknown (not reported) N/A
P Range (global and regional
distributions) N Unknown (not reported)
N/A
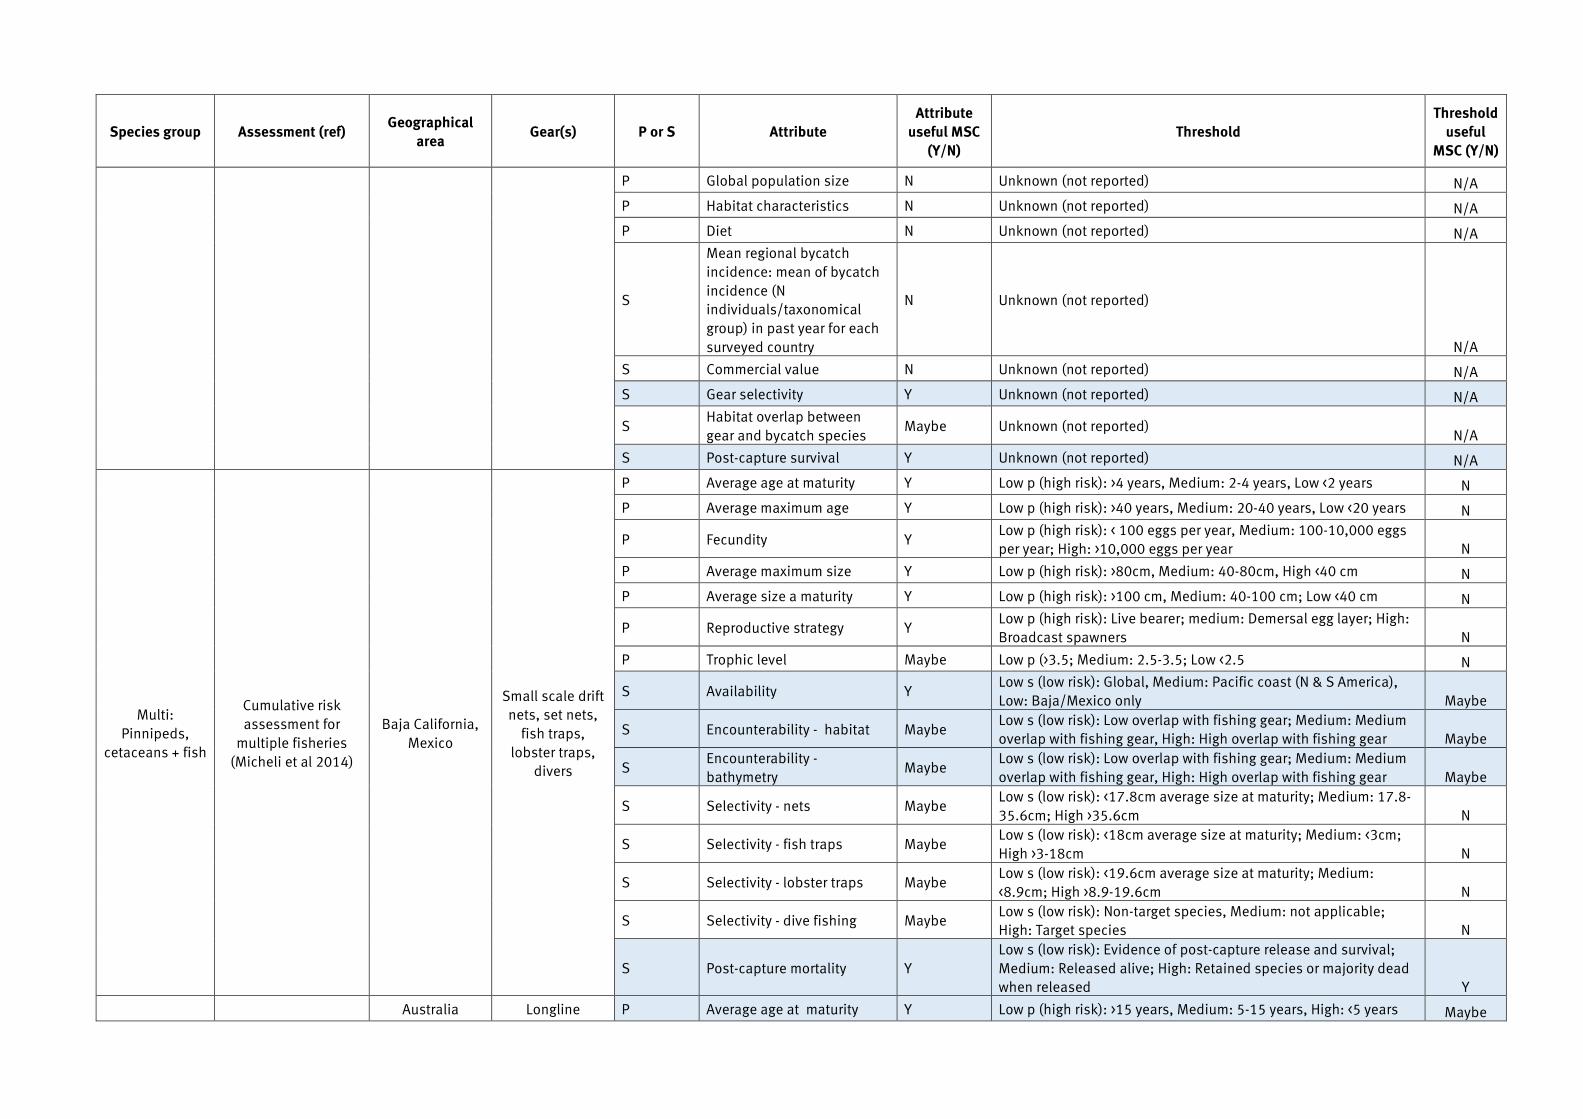
69
Species group Assessment (ref) Geographical
area Gear(s) P or S Attribute
Attribute
useful MSC
(Y/N)
Threshold
Threshold
useful
MSC (Y/N)
P Global population size N Unknown (not reported) N/A
P Habitat characteristics N Unknown (not reported) N/A
P Diet N Unknown (not reported) N/A
S
Mean regional bycatch
incidence: mean of bycatch
incidence (N
individuals/taxonomical
group) in past year for each
surveyed country
N Unknown (not reported)
N/A
S Commercial value N Unknown (not reported) N/A
S Gear selectivity Y Unknown (not reported) N/A
S Habitat overlap between
gear and bycatch species Maybe Unknown (not reported)
N/A
S Post-capture survival Y Unknown (not reported) N/A
Multi:
Pinnipeds,
cetaceans + fish
Cumulative risk
assessment for
multiple fisheries
(Micheli et al 2014)
Baja California,
Mexico
Small scale drift
nets, set nets,
fish traps,
lobster traps,
divers
P Average age at maturity Y Low p (high risk): >4 years, Medium: 2-4 years, Low <2 years N
P Average maximum age Y Low p (high risk): >40 years, Medium: 20-40 years, Low <20 years N
P Fecundity Y Low p (high risk): < 100 eggs per year, Medium: 100-10,000 eggs
per year; High: >10,000 eggs per year N
P Average maximum size Y Low p (high risk): >80cm, Medium: 40-80cm, High <40 cm N
P Average size a maturity Y Low p (high risk): >100 cm, Medium: 40-100 cm; Low <40 cm N
P Reproductive strategy Y Low p (high risk): Live bearer; medium: Demersal egg layer; High:
Broadcast spawners N
P Trophic level Maybe Low p (>3.5; Medium: 2.5-3.5; Low <2.5 N
S Availability Y Low s (low risk): Global, Medium: Pacific coast (N & S America),
Low: Baja/Mexico only Maybe
S Encounterability - habitat Maybe Low s (low risk): Low overlap with fishing gear; Medium: Medium
overlap with fishing gear, High: High overlap with fishing gear Maybe
S Encounterability -
bathymetry Maybe
Low s (low risk): Low overlap with fishing gear; Medium: Medium
overlap with fishing gear, High: High overlap with fishing gear Maybe
S Selectivity - nets Maybe Low s (low risk): <17.8cm average size at maturity; Medium: 17.8-
35.6cm; High >35.6cm N
S Selectivity - fish traps Maybe Low s (low risk): <18cm average size at maturity; Medium: <3cm;
High >3-18cm N
S Selectivity - lobster traps Maybe Low s (low risk): <19.6cm average size at maturity; Medium:
<8.9cm; High >8.9-19.6cm N
S Selectivity - dive fishing Maybe Low s (low risk): Non-target species, Medium: not applicable;
High: Target species N
S Post-capture mortality Y
Low s (low risk): Evidence of post-capture release and survival;
Medium: Released alive; High: Retained species or majority dead
when released Y
Australia Longline P Average age at maturity Y Low p (high risk): >15 years, Medium: 5-15 years, High: <5 years Maybe

70
Species group Assessment (ref) Geographical
area Gear(s) P or S Attribute
Attribute
useful MSC
(Y/N)
Threshold
Threshold
useful
MSC (Y/N)
Multi:
Cetaceans,
pinnipeds,
pelagic
seabirds,
turtles, sea
snakes + fish
ERAEF for the
automatic longline
sub-fishery of the
Southern and Eastern
Shark and Scalefish
fishery* (Daly et al
2007)
P Average maximum age Y Low p (high risk): >25 years, Medium: 10-25, High: <10 years Maybe
P Fecundity Y Low p (high risk): <100 eggs per year; Medium: 100-20,000 eggs
per years; High >20,000 eggs per year Maybe
P Average maximum size Maybe Low p (high risk): >300cm, Medium: 100-300 cm; High: < 100 cm
Maybe but
see
attribute
P Average size at maturity Maybe Low p (high risk): >200 cm, Medium: 40-200 cm, High <40 cm
Maybe but
see
attribute
P Reproductive strategy Maybe Low p (high risk): Live bearer (and birds); Medium: Demersal egg
layer; High: Broadcast spawners
Maybe but
see
attribute
P Trophic level Maybe Low p (high risk): >3.25, Medium: 2.75-3.25, High <2.75
Maybe but
see
attribute
S Areal overlap Y
2 options: where good distribution maps available=distributional
range in Australia (km2)/fraction of the species distribution where
effort occurs. Low s (low risk): <10% overlap, medium: 10-30%
overlap, high>30% overlap. Where good distribution maps not
available, low s(low risk): Globally distributed; medium: Southern
Hemisphere; high: Australian endemic Maybe

71
Species group Assessment (ref) Geographical
area Gear(s) P or S Attribute
Attribute
useful MSC
(Y/N)
Threshold
Threshold
useful
MSC (Y/N)
S Encounterability (habitat
and bathymetry) Y
Low/medium/high overlap with fishing gear. For habitat overlap:
Species are divided into benthic (bottom) species, water column
(pelagic) species and air column species (birds, mammals,
reptiles). Benthic species are further divided into hard bottom
(e.g. rock/reef) species and soft bottom (e.g. sand/mud) species.
Species that occur in the water column are further divided into
benthopelagic (bottom third of the water column) mesopelagic
(middle third of the water column) and epipelagic (upper third of
the water column). Species that occur in poorly known parts of the
deep ocean (700–3,000 m), where the water column is poorly
defined, may be scored bathypelagic. Some species occur in more
than one habitat and a number of habitat codes will be assigned.
For these species, the risk score is initially set for the worst case
code. The bathymetry check is used to check the encounterability
risk score for false positives. A species may be vulnerable to a
particular gear type due to a common position within the water
column or on a common bottom type–high potential risk. However
if the species occurs outside the bathymetric range of a fishery
the actual risk is low. Habitat for marine birds, reptiles and
mammals is epipelagic/air. All species are potentially
encountered during deployment and retrieval of either demersal
or pelagic gear. These species are vulnerable to drowning before
capture. The default encounterability score for these groups is
high. Actual encounterability for birds depends, in part, on
mitigation measures which may or may not be effective. In
fisheries that have observer programs, encounterability scores
may be reduced. For example, if an observer sees pilot whales
every day he/she observes auto-longline fishing but the pilot
whales never approach the gear or take fish off the hooks, then
availability is high but encounterability is over-ridden to low. Y
S Selectivity Y
Scores vary by gear type - body size in relation to gear size. For
hooks defined by typical weights of the species caught relative to
the breaking strain of the snod and gaffing method used in the
fishery Maybe
S PCM Y
Low s (low risk): Evidence of post-capture release and survival;
Medium: Released alive; High: Retained species or majority dead
when released Y
*multiple ERAEF assessments but selected this as all attributes and thresholds are the same.


![Nitrogen, phosphorus and zinc enhance Maize hybrid productivity … · 2016-12-29 · [16, 17]. Zn deficiency causes stunted growth, slow cell division, susceptibility to disease](https://img.pdfslide.net/doc/110x75/5f5150aae5f918157102baab/nitrogen-phosphorus-and-zinc-enhance-maize-hybrid-productivity-2016-12-29-16.jpg)