Embed Size (px)
Citation preview

Biosensors 2011, 1, 70-92; doi:10.3390/bios1030070
biosensors ISSN 2079-6374
www.mdpi.com/journal/biosensors/
Review
Review of Transducer Principles for Label-Free Biomolecular
Interaction Analysis
Martin Nirschl 1,*, Florian Reuter
2 and Janos Vörös
1
1 Laboratory of Biosensors and Bioelectronics, Institute for Biomedical Engineering, ETH Zurich,
Switzerland; E-Mail: [email protected] 2 Siemens Technology Accelerator GmbH, Otto-Hahn-Ring 6, 81739 Munich, Germany;
E-Mail: [email protected]
* Author to whom correspondence should be addressed; E-Mail: [email protected];
Tel.: +49-163-698-6859.
Received: 19 May 2011; in revised form: 18 June 2011 / Accepted: 29 June 2011 /
Published: 1 July 2011
Abstract: Label-free biomolecular interaction analysis is an important technique to study
the chemical binding between e.g., protein and protein or protein and small molecule in
real-time. The parameters obtained with this technique, such as the affinity, are important
for drug development. While the surface plasmon resonance (SPR) instruments are most
widely used, new types of sensors are emerging. These developments are generally driven
by the need for higher throughput, lower sample consumption or by the need of
complimentary information to the SPR data. This review aims to give an overview about a
wide range of sensor transducers, the working principles and the peculiarities of each
technology, e.g., concerning the set-up, sensitivity, sensor size or required sample volume.
Starting from optical technologies like the SPR and waveguide based sensors, acoustic
sensors like the quartz crystal microbalance (QCM) and the film bulk acoustic resonator
(FBAR), calorimetric and electrochemical sensors are covered. Technologies long
established in the market are presented together with those newly commercially available
and with technologies in the early development stage. Finally, the commercially available
instruments are summarized together with their sensitivity and the number of sensors
usable in parallel and an outlook for potential future developments is given.
Keywords: biomolecular interaction analysis; BIA; sensor; transducer; drug discovery;
drug development
OPEN ACCESS

Biosensors 2011, 1 71
1. Introduction
Biomolecular interaction analysis (BIA) is an important method for drug discovery and drug
development [1]. Label-free sensors have the advantage that the adsorbed molecules do not require a
chemical treatment like radioactive, fluorescent or other types of markers. The use of markers can be
unproblematic when only the presence or quantity of a substance should be detected like in pregnancy
tests. However, for the study of the interaction between molecules the presence of a label might
alter the interaction process. In this case, the use of a label-free is a significant advantage and also
saves resources.
Several parameters are important when selecting a transducer to use for BIA: The most obvious is
the limit of detection (LOD), which can be measured as the smallest detectable concentration of a
certain substance or the lowest detectable molecular mass of a certain concentration of molecules, the
lowest detectable affinity of a chemical reaction or for surface-based sensors the lowest detectable
surface mass density. As only the transducer principles should be compared here, the smallest
detectable surface mass will be focused on because this measure is only dependent on the transducer.
Other parameters like the smallest detectable concentration depend highly on factors independent from
the transducer like the used surface chemistry or the fluidic system. But other parameters besides the
sensitivity are also equally important: The required sample volume is crucial if many substances or
many different concentrations are measured like in high-throughput screening (HTS) or the sample
volume is available in very limited amounts (e.g., human drug targets) or the transducer integrated
into other processes delivering small sample amounts like on-bead screening [2]. The number of
measurements that can be done at the same time with one sensor is important if a high throughput in a
short time is desired. The more multiplexed a sensor is, the more parallel measurements can be
performed without significantly increasing the equipment size and cost. A wide range of transducer
principles were developed and used for BIA in the last decades. This section aims to give an overview
of the state-of-the-art of different transducers used for label-free BIA. The most important parameters
are summarized in Table 1.
There are detailed reviews available for the acoustic [3,4], optical [5-7], electrochemical [8] and
nanostructure-based [9,10] transducers. While there are also reviews about the most commonly used
equipment and techniques used in BIA [11,12], this paper aims to give a more complete overview of
both commercially available label-free transducers and transducers currently under development with a
special emphasis on the transducer principles.
Covering topics related to label-free biosensors, the reviews with a special emphasis on highly
multiplexed technologies [13,14], microdispensing of liquids for biosensor arrays [15] and label-free
cell-based assays in drug discovery [16] might be of interest to the reader.

Biosensors 2011, 1 72
Table 1. Overview of the commercially transducer systems for Biomolecular interaction analysis (BIA). Information is taken from the website
of the companies where not stated differently.
Company name Product name 2 Technology Limit of
detection
[ng/cm2]
Number of
parallel sensors
Sample volume 6 Sample volume
per sensor/pixel 7
Web address Comments
SPR 1 GE Healthcare Biacore 4000 optical 0.01 16 60 µL
(For 4 flow cells)
4 µL www.biacore.com
Biacore T100 0.01 4 20 to 50 µL 21 to 50 µL
SPRi 3 Horiba SPRi-Plex™ optical 0.5 up to 1,000 1.6 mL 2 µL (target)/
1.6 mL (ligand)
www.horiba.com Up to 1,000 substances
can be spotted, only
one substance can be
measured in flow
BLI ForteBio Octet RED384 optical 0.1 16 n/a 200 µL www.fortebio.com
Diffraction
Grating Based 4
Optical
Waveguide Based
SRU Biosystems BIND optical 0.01 96-, 384- and 1,536-
well microplate
n/a down to 5 µL www.srubiosystems.com
Corning Epic 0.5 384-well microplate n/a 15–30 µL typical www.corning.com
MicroVacuum Ltd. OWLS 210 optical 0.5 1 n/a 20 to 250 µL www.owls-sensors.com
Farfield AnaLight 4D 0.01 1 n/a 50 µL www.farfield-group.com
ELM Maven Biotechnologies LFIRE optical 0.1 1 n/a n/a www.mavenbiotech.com
QCM 5 Q-Sense E4 Auto acoustic 0.5 4 n/a 400 µL www.q-sense.com
SAW SAW instruments GmbH sam5 acoustic 0.05 5 40 to 80 µL 8 to 16 µL www.saw-instruments.de
Electrochemical Eco Chemie n/a n/a n/a n/a n/a www.ecochemie.nl
ITC MicroCal iTC200 calorimetric n/a 1 n/a n/a (at least
10 µg protein)
www.microcal.com in-solution, no
immobilization needed
1 Other SPR systems: Bio-Rad ProteOn XPR36 (www.bio-rad.com), Eco Chemie Autolab TWINGLE (www.ecochemie.nl), Reichert Inc. SR7000DC (www.reichertspr.com), Sierra Sensors
GmbH (www.sierrasensors.com). 2 List of product is not complete, only the most sensitive products are listed. 3 Other SPRi systems: Biacore Flexchip (discontinued), Plerxera Bioscience PlexArray™ (www.plexera.com), GWC Technologies SPRimagerÆII (www.gwctechnologies.com), IBIS
Technologies IBIS-iSPR (www.ibis-spr.nl). 4 Other diffraction grating based systems: Axela dotLab (www.axelabiosensors.com). 5 Other QCM systems: Sierra Sensors QCMA-1 (www.sierrasensors.com), TTP LabTech RAP (www.ttplabtech.com), Attana A200 (www.attana.com). 6 Sample volume means the minimum of sample volume required to follow one binding interaction. 7 The sample volume per pixel can vary from the overall sample volume if more than one pixel is in one flow cell.

Biosensors 2011, 1 73
2. Transducer Principles
2.1. Acoustic Sensors
Acoustic sensors comprise one or more vibrating elements that create acoustic waves. These waves
can propagate on the surface, i.e., surface acoustic wave (SAW) or in the bulk of the resonator, i.e.,
bulk acoustic wave (BAW). These waves change their properties (e.g., amplitude or frequency) when
molecules adsorb and physically or chemically bind to the sensor surface. This change is detected and
contains information e.g., about the amount of adsorbed molecules.
This overview of acoustic sensors is limited to acoustic sensors vibrating parallel to the sensor
surface, as resonators vibrating vertically to the sensor surface (e.g., in the longitudinal mode) have a
high loss of energy into the liquid and are limited in sensitivity and thus difficult to be used to monitor
adsorbents of biomolecules in real-time. An overview over all acoustic microsensors including
cantilever-based sensors or micromachined ultrasonic transducers (CMUTs) can be found in [17].
2.1.1. Quartz Crystal Microbalance (QCM) and Quartz Crystal Microbalance with Dissipation
Monitoring (QCM-D)
The QCM is a bulk acoustic wave (BAW) device, which consists of a piezoelectric quartz crystal,
which resonates if it is electrically excited using two electrodes (Figure 1). Sauerbrey found that the
resonance frequency decreases linearly if additional mass is attached to the sensor [18]. However, this
is only true if the attached mass is rigid and small compared to the sensor mass. If the attached mass is
not rigid, the viscoelastic properties have to be taken into account. This is mostly the case for operation
in liquids [19] and for the adsorption of soft materials. With a model where the adsorbed soft material
is represented by a viscous and an elastic element connected in parallel (i.e., a Kelvin-Voigt material) under
a Newtonian liquid it is possible to describe the frequency response also in liquid environment [20-24].
The frequency shift, which is influenced by the amount of attached mass, the liquid environment
around the sensor and the viscoelastic properties of the adsorbent is hereby given by:
(1)
with
2 22 /2 where η is the viscosity, m the mass, ρ the density,
the angular frequency, h
the thickness of the adsorbent, G‘ the storage and G‘‘ the loss modulus of the adsorbent. The index ‗1‘
corresponds to the adsorbed layer, the index ‗q‘ to the quartz and the index ‗2‘ to the bulk liquid [25].
This model assumes that the viscosity of the adsorbent is constant over frequency, which is most likely
not the case for most materials and should be therefore be carefully used especially if the measurement
covers a broad range of frequencies [26].
The QCM has a LOD lower than 1 ng/cm2 and can also be used for adsorbents with several
hundreds of nanometers thickness. Due to this high dynamic range the QCM is used in a broad
application field, from small molecules up to cells [27].
More recently, attention was not only drawn to measuring the adsorbed mass but also to investigate
the viscoelastic properties of the adsorbent. This can be done by not only reading out the resonance
frequency, but also the motional resistance [28], the conductance [29] or the energy dissipation [30].

Biosensors 2011, 1
74
The latter system is named quartz crystal microbalance with dissipation monitoring (QCM-D). With this
technique, novel types of investigations like on the changes of viscoelastic properties of polymers [22],
vesicle adsorption and lipid bilayer formation [31], cross-linking of protein layers [32] and folding or
unfolding of proteins were performed.
In most commercially available QCM systems a sample volume of more than 50 µL is needed per
flow cell, which motivates the search for a smaller BAW device with smaller sensor area.
Figure 1. (a) Schematic diagram of the quartz crystal microbalance (QCM) and (b) the
electrical characteristic with (loaded) and without (unloaded) adsorbed mass. From [22]—
Reproduced by permission of the PCCP Owner Societies.
2.1.2. Surface Acoustic Wave (SAW) Devices
A SAW biosensor, schematically shown in Figure 2, consists of one or more interdigital transducers
(ITD) built on a piezoelectric substrate, such as quartz (α-SiO2), lithium niobate (LiNbO3), or lithium
tantalite (LiTaO3) [33]. The IDTs are interleaved electrodes that work as a sender to transfer electrical
waves to acoustic waves and a receiver to transfer acoustic waves into an electrical signal. Between
sender and receiver, the acoustic waves travel along the substrate, where the amplitude and velocity
of the wave is influenced by adsorbed mass, viscoelastic changes and the conductivity of the
surrounding liquid.
In addition to this rather simple set-up, the IDTs might be covered with a protective layer to avoid
corrosion of the metal electrodes in buffer solution or the sensitive area can be covered with a layer
with low acoustic velocity (e.g., a polymer [34] or SiO2 [35]) in order to trap the wave close to the
surface and minimize the energy dispersed into the substrate or the liquid. The effect of trapping the
energy in a layer with an acoustic velocity lower than the surrounding is called the Love wave effect.
Another way to confine the acoustic energy near the surface is to use a mass grating with a pitch of
half the wavelength of the acoustic waves; the resulting waves are called shear horizontal waves
(SHW). While there were many different device types tested for usage in biosensors, so called surface
transverse waves (STW) or Love waves, or a combination of both seem to be most promising for a
high performance sensor. An overview over the recent developments towards SAW biosensors can be
found in [3].
The SAW devices can be structured using photolithography which allows to integrate a high number
of sensors on a small area. Devices with fluidic volumes well below 1 µL have been developed [36].
SAW sensors have the highest theoretical mass sensitivity among the acoustic resonators [37] and with
a shown limit of detection of lower than 0.08 ng/cm2 [38], a robust sensor system based on SAW

Biosensors 2011, 1
75
would be extremely competitive to existing commercially available technology. The drawback of the
SAW sensors is that it is difficult to build a robust device, because the frequency change is influenced
by many factors like the conductance of the liquid and the conductance, dielectric and elastic constants
of the adsorbent [39]. These perturbations make quantitative measurement challenging.
Figure 2. Typical set-up of a surface acoustic wave (SAW) biosensor: An acoustic wave
propagates from a sender (1) to a receiver (2) passing the active sensor area (3) where its
amplitude and velocity is influenced by the sensor surrounding (i.e., liquid or adsorbed
mass). Adopted from [40].
2.1.3. Film Bulk Acoustic Resonator (FBAR)
FBARs (Figure 3) are bulk acoustic wave (BAW) devices and operate in the thickness shear mode
(TSM) like the QCM. However, while the QCM has been used for decades for the analysis of
intermolecular interactions, FBARs have been produced just recently for the application in
liquid [41-44]. Thin film bulk acoustic resonators vibrating in longitudinal mode have been produced
before e.g., for filter applications [45]. For application in liquid, however, acoustic resonators operating
in shear mode were developed, as the acoustic losses caused by longitudinal waves propagating into
the liquid are too high to achieve sufficient Q-factors. Piezoelectric thin-films with the c-axis being
inclined from the film normal were developed to achieve sufficiently high piezoelectric shear coupling
coefficients [46-53]. While the working principle of FBAR and QCM is similar, the QCM is produced
in a top-down and FBAR in a bottom-up process using thin-film technology. As a result FBARs can be
made thinner, which results in a higher resonance frequency. FBARs operating from some hundreds of
MHz to several GHz have been presented [45]. However, also determining the resonance frequency
becomes more difficult for smaller devices, so that the noise increases. It was shown that the small size
makes it possible to integrate many resonators on a small area [54]. This makes the FBAR especially
promising for biomolecular interaction analysis with high throughput.
Figure 3. Film bulk acoustic resonators (FBARs) consist of a piezoelectric layer
sandwiched between two electrodes over which the piezo layer is acoustically excited. The
FBAR is isolated from the substrate by (a) an air gap or (b) an acoustic mirror. Reprinted
from [55] and [56] with permission from Elsevier.

Biosensors 2011, 1
76
2.2. Optical Sensors
The label-free optical biosensors introduced in this section are based on the interaction of light with
the adsorbed biomolecules. Light is reflected at the active sensors surface where it is affected by the
amount of adsorbent present at the surface. The adsorption of biomolecules can be quantified in
real-time by monitoring the changes (e.g., intensity, wavelength, polarization, and phase) of the light
after being reflected at the active sensor surface.
Unlike acoustic sensors, most optical sensors are vicinity sensitive that means that substances do
not need to be bound to the surface to be detected but within the penetration depth of the evanescent
wave. Both substances bound to the sensor surface and substances that are close to the surface as well
of changes in the optical properties (e.g., solvent concentration) of the liquid cause a signal. Bound and
unbound substances can be distinguished using a reference channel with a passivated surface.
2.2.1. Surface Plasmon Resonance (SPR)
The SPR is the transducer with clearly the highest market share in the BIA market. This can be
accredited to the high sensitivity of the technique [57], but also to the successful marketing concept of
the leading vendor Biacore (GE Healthcare, Uppsala, Sweden) [58] and their high investments into
the development of the technology [59] and especially their sensitivity-increasing dextran matrix
surfaces [60].
Surface plasmons are oscillations of the free electron density in e.g., a metal. These plasmons can
be excited when polarized light is diffracted on an interface between a dielectric and some metals at
the angle of total reflection, with gold being the most commonly metal used for BIA. The angle of total
reflection depends on the refractive index of the surrounding media within the decay length of that
electromagnetic wave (called evanescent wave). One way to readout the sensor signal is to measure the
intensity of the reflected light for different angles. At the angle where the plasmons are excited, energy
is adsorbed and the intensity of the reflected light has a minimum. This angle depends on the amount
of mass adsorbed at the surface.
Figure 4 shows the set-up of an SPR sensor: The light emitted by a monochromatic light source is
reflected at the interface between gold and liquid surrounding. The reflected light is detected and
analyzed. As an alternative to the prism shown in the figure, the light can be coupled in using an
optical grating. As an alternative for reading out the angle, the wavelength or the intensity at a certain
angle can be measured. However, a prism coupler in combination with reading out the angle with a
minimum in intensity is the mostly widely used as it has the highest sensitivity [61].
A more detailed overview about the SPR technology can be found in [6]. Even though the SPR
requires a metal surface, many other functional layers can be put on top, e.g., the carboxymethylated
dextran surface introduced in 1990 by Löfås et al. [61]. One limitation of the SPR technology might be
the substantial cost especially for systems with higher number of sensors usable in parallel like the
Biacore 4000 with 20 individually accessible sensors in 4 different flow cells [62].

Biosensors 2011, 1
77
Figure 4. Schematic diagram of the surface plasmon resonance (SPR). Monochromatic
light is reflected on a gold surface. At a certain angle, where the surface plasmons are
excited, the reflected light has a minimum, which is continuously measured. This angle is
directly connected with the analyte bound to the surface. Reprinted from [1] with
permission from Elsevier.
2.2.2. Surface Plasmon Resonance Imaging (SPRi)
The SPRi technology enables to build microarrays based on SPR. In order to measure multiple
sensitive spots using the same set-up, a CCD camera is used to record the intensity of the reflected
light at a fixed incident angle and wavelength (Figure 5). Due to the higher complexity of this
technique, the SPRi systems have a somewhat lower sensitivity than the SPR [63]. However, the
published detection limit of 0.1–1 ng/cm2 is sufficient for e.g., DNA [64] and protein [65] detection.
The number of parallel measurements in the literature is in the range of thousands but the possible
number of sensors on an area of 1.4 cm2 has been estimated to be more than 10,000 [66]. The number
of sensitive spots is basically only limited by the available area and the number of individually
accessible spots. While a high number of different substances can be easily immobilized by addressing
single spots e.g., using a microspotter [67], it is difficult to access the functionalized spots with
different ligand solutions.
Figure 5. Surface plasmon resonance imaging (SPRi) setup: Instead of measuring at one
spot like with the SPR, the reflection of a number of spots is measured using a CCD
camera. Reproduced from [68] with permission from Elsevier.

Biosensors 2011, 1
78
2.2.3. Biolayer Interferometry (BLI)
BLI uses white light interferometry, a rather old technique commonly used to measure the thickness
of transparent thin-films [69], to quantify the biomolecules adsorbed to the end of optical fibres. White
light travelling through an optical fiber is reflected at the two surfaces: At the fiber-biomolecular layer
interface and at the biomolecular layer—buffer interface. The reflected beams interfere generating a
signal that directly depends on the amount of adsorbed molecules (Figure 6) [70].
The set-up using optical fibers makes an innovative sample delivery system possible: Instead of
using a fluidic system to deliver the sample liquids to the sensor, the sensors (i.e., the optical fibres)
are moved and dipped into well plates. A measurement sequence is performed by dipping the sensors
into different reagent solutions. This makes the use of a fluidic system obsolete, which adds robustness
to the systems and decreases maintenance and operating costs. Flow can be created, e.g., for diffusion
limited reactions or to reduce rebinding when measuring off rates, by shaking the well in an orbital
motion. Up to 16 sensors can be used in parallel by the Octet system (ForteBio, Menlo Park, CA).
Because only substances bound to the sensor surface are detected, there is little influence from the
media surrounding the sensor and thus no reference channel is needed. The downside of the BLI might
be the limit of detection of around 0.1 ng/cm2, which makes it difficult to follow the adsorption of
small molecules [71].
Figure 6. An optical fiber used for Bio-Layer Interferometry and a typical optical signal.
Reproduced from [70] with permission from Elsevier.
2.2.4. Diffraction Grating Based Sensors
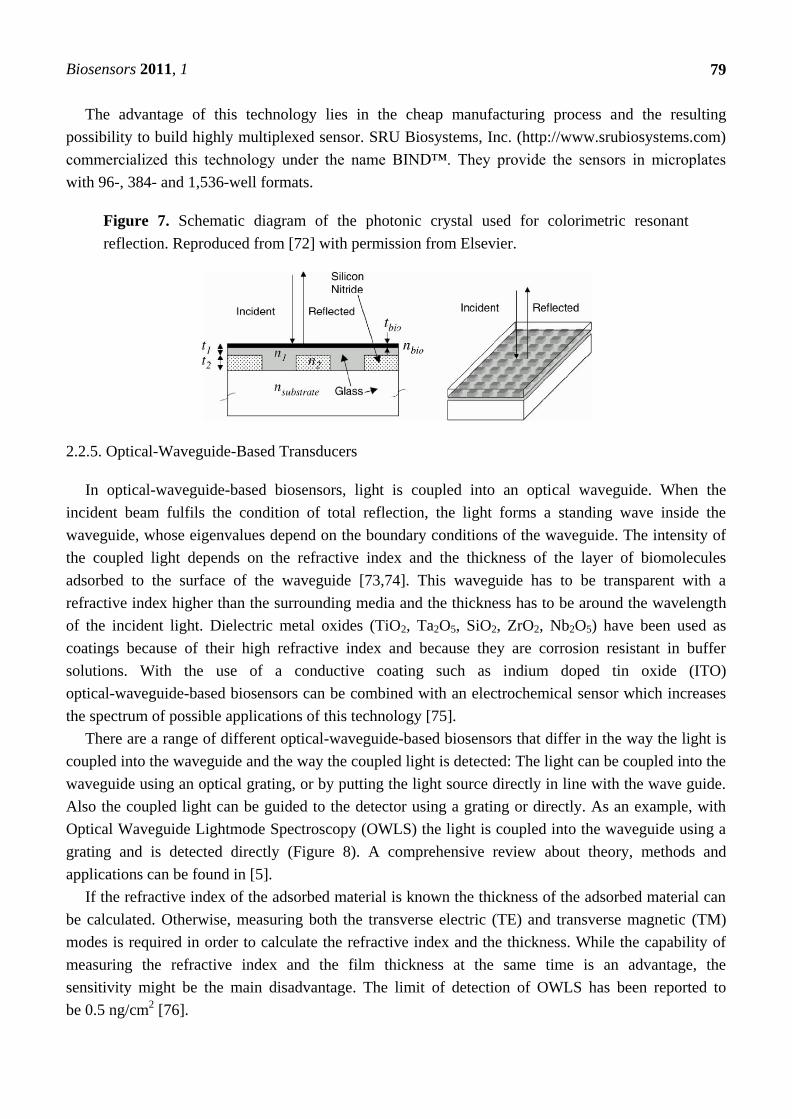
Diffraction grating based sensors measure the reflection of light on a photonic crystal. A photonic
crystal is an optically regular structure made of a dielectric material, e.g., a grating comprising holes and
spaces in the nanometer dimension (Figure 7). Such a grating has been presented for usage as a
biosensor [72]. When white light is radiated onto the grating, light of only a single wavelength is
reflected. The wavelength of this light changes when biomolecules adsorb to the surface of the
photonic crystal. For this type of photonic crystal a detection limit for protein of around 0.1 ng/cm2 has
been reported [13].
Biosensors 2011, 1
79
The advantage of this technology lies in the cheap manufacturing process and the resulting
possibility to build highly multiplexed sensor. SRU Biosystems, Inc. (http://www.srubiosystems.com)
commercialized this technology under the name BIND™. They provide the sensors in microplates
with 96-, 384- and 1,536-well formats.
Figure 7. Schematic diagram of the photonic crystal used for colorimetric resonant
reflection. Reproduced from [72] with permission from Elsevier.
2.2.5. Optical-Waveguide-Based Transducers
In optical-waveguide-based biosensors, light is coupled into an optical waveguide. When the
incident beam fulfils the condition of total reflection, the light forms a standing wave inside the
waveguide, whose eigenvalues depend on the boundary conditions of the waveguide. The intensity of
the coupled light depends on the refractive index and the thickness of the layer of biomolecules
adsorbed to the surface of the waveguide [73,74]. This waveguide has to be transparent with a
refractive index higher than the surrounding media and the thickness has to be around the wavelength
of the incident light. Dielectric metal oxides (TiO2, Ta2O5, SiO2, ZrO2, Nb2O5) have been used as
coatings because of their high refractive index and because they are corrosion resistant in buffer
solutions. With the use of a conductive coating such as indium doped tin oxide (ITO)
optical-waveguide-based biosensors can be combined with an electrochemical sensor which increases
the spectrum of possible applications of this technology [75].
There are a range of different optical-waveguide-based biosensors that differ in the way the light is
coupled into the waveguide and the way the coupled light is detected: The light can be coupled into the
waveguide using an optical grating, or by putting the light source directly in line with the wave guide.
Also the coupled light can be guided to the detector using a grating or directly. As an example, with
Optical Waveguide Lightmode Spectroscopy (OWLS) the light is coupled into the waveguide using a
grating and is detected directly (Figure 8). A comprehensive review about theory, methods and
applications can be found in [5].
If the refractive index of the adsorbed material is known the thickness of the adsorbed material can
be calculated. Otherwise, measuring both the transverse electric (TE) and transverse magnetic (TM)
modes is required in order to calculate the refractive index and the thickness. While the capability of
measuring the refractive index and the film thickness at the same time is an advantage, the
sensitivity might be the main disadvantage. The limit of detection of OWLS has been reported to
be 0.5 ng/cm2 [76].

Biosensors 2011, 1
80
With Dual-Polarization Interferometry (DPI) the light goes through two waveguides, one is for
reference without liquid contact, the other is in contact with the liquid surrounding. After exiting from
the waveguide, the light is allowed to interfere. As one of the light beams has undergone a phase shift
because of the contact with the liquid surrounding, the amount of adsorbed biomolecules can be
determined from the interference pattern [77,78].
Figure 8. Working principle of Optical waveguide lightmode spectroscopy (OWLS):
(a) Light is coupled into an optical waveguide via an optical grating and the intensity is
measured as a function of the incident angle. From the two peaks in the intensity spectrum
(incoupling angles) (b), the thickness and the refractive index of the adsorbed layer can be
calculated. (Reproduced from [76] with permission from Elsevier).
2.2.6. Ellipsometry (ELM)
Ellipsometry (ELM) is a technique that measures the changes in the state of polarization of
elliptically polarized light, which is reflected at planar surfaces (Figure 9) [79]. If the available
measurement data is very accurate, both the refractive index and the thickness of the adsorbed layer
can be obtained from the changes in the ellipsometric angles [80]. Assuming that the refractive index
of protein films is around 1.5 the film thickness can be calculated more easily [76]. The complex
theory behind the calculations, especially if systems with unknown optical properties are investigated,
together with the requirement of reflecting surfaces might be named as main disadvantages of
this technique.
Figure 9. Set-up of the ellipsometry (ELM) (a) and the surface plasmon enhanced
ELM (b). Reproduced from [81,82] with permission from Elsevier.

Biosensors 2011, 1
81
Imaging ellipsometry has been reported to allow measuring more than 105 pixels on an area of less
than one cm2 in one second. For this technique a CCD camera was used as a detector. ELM allows
determining the thickness of solid thin-films in air with accuracy well below 1 Angstrom, the detection
limit for the adsorption of biomolecules is average: A detection limit of around 1 ng/cm2 has been
reported for surface plasmon enhanced ellipsometry [81].
2.3. Isothermal Titration Calorimetry (ITC)
In isothermal titration calorimetry (ITC) (Figure 10) a solution of one type of biomolecule is titrated
into the solution of a binding partner and the heat adsorbed or generated by the biochemical reaction is
measured. From the heat of reaction for different concentrations the binding constant, K, the number of
binding sites or the stoichiometry (n) and the thermodynamic data, the enthalpy (ΔH_) and entropy
(ΔS) of the binding, can be determined in a single measurement.
Being able to measure heat effects as small as 0.4 μJ (0.1 μcal) allows the determination of binding
constants, K‘s, as large as 108 to 10
9 M
–1. The typical setup consists of a sample and a reference cell in
a thermostatted environment, a syringe to introduce the ligand solution into the sample cell, a means to
keep the sample cell at the same temperature as the reference cell and to measure the heat changes. The
cell volume is typically in the ml range and the injected volume can range from about 1 to 20 μL [83].
The high number of parameters that can be measured at the same time and the fact that the reaction
can be performed in solution and neither a label nor the immobilization on a surface is needed are the
unique features of this technique. The high experimental effort for planning and performing the
measurement and the high sample consumption are the drawbacks of this technique.
A related technique is the differential scanning calorimetry (DSC), where the temperature of a
biomolecular solution is changed and the resulting heat change is measured. This gives information
about e.g., conformational changes of proteins [84,85].
Figure 10. Isothermal titration calorimetry (ITC) setup (inlet) and typical measurement
curve: the raw data and the isothermal. Reproduced from [86] with permission from Elsevier.
Biosensors 2011, 1
82
2.4. Electrochemical Sensors
Electrochemical sensors are of high importance for the biosensor market. While this section can
only give a rough overview, the interested reader is referred to [8] for a more complete review.
Label-free electrochemical sensors are based on measuring the change in charge, current, potential or
conductivity that takes place when the target molecule binds to the functionalized sensor surface.
Also the conductivity of the solution can be measured, as many reactions produce or consume
electrons and thereby alter the overall electrical conductivity of the solution. However, because the
conductivity of a solution depends on all present ions, this sensing principle is considered to be rather
non-specific. Amperometric biosensors measure a change in current. However, many biomolecules
like proteins are not electroactive, and therefore a label is required [87].
Impedance sensors measure the electrical impedance between an electrode and the solution at a
fixed or variable frequency. The latter approach is called electrochemical impedance spectroscopy
(EIS). On adsorption of the target molecule to the electrode, the impedance undergoes a detectable
change, which has been shown for a variety of chemical systems [88]. In cyclic voltammetry (CV), the
applied voltage is changed at a low velocity and the resulting current is measured. A change in current
represents a change of electron transfer resistance using a redox couple such as ferri/ferrocyanide.
Molecules adsorbed to the surface act as insulator and increase the resistance Figure 11(a) shows CV
curves for a bare gold electrode (a), the adsorption of protein A (b) and IgG (c) at a scan rate
of 50 mV/s. Figure 11(b) shows the corresponding EIS measurement. Plotted is the real part versus the
imaginary part of the electrical impedance from a frequency range from 100 kHz to 0.1 Hz.
This makes it easy to immobilize a high number of substances (e.g., proteins) and investigate their
interaction with one or few ligands (e.g., small molecules) but difficult the other way round. The fact
that a wide range of measurements requires the immobilization of few ligand targets and test them
against a high number of molecules like in drug discovery motivates developments towards the
possibility of accessing a high number of pixels individually in flow [89,90].
Electrochemical sensors based on field effect transistors (FET) consist of a transistor where the
metal gate is replaced with an appropriate functionalization. On adsorption of the target molecule the
potential at the gate oxide changes resulting in a measurable signal between source and drain [91]. One
hindrance to commercial success of FET based biosensors apart from the high cross-sensitivity e.g., to
changes in pH might be the unsolved challenge to incorporate a high quality but economic reference
electrode [87].
Electrochemical sensors can be combined with other label-free transducers by integrating a
conductive electrode to the setup. This has been shown e.g., for OWLS [92,93], SPR [94,95],
ELM [96-98], QCM-D [99,100]. These combined set-ups enable to measure the adsorption under
applied electric field or to simultaneous measure the adsorption and electrochemically analyze
the adsorbent.

Biosensors 2011, 1
83
Figure 11. Examples for a measurement curve of cyclic voltammetry (CV) (a) and
electrochemical impedance spectroscopy (EIS) (b). The adsorption of molecules to the
surface can be seen from a decrease in current (CV) and an increase in impedance (EIS).
Reproduced from [101] with permission from Elsevier.
2.5. Nanostructure Biosensors
Feynman‘s ―Plenty of Room at the Bottom‖ [102] might be valid for label-free biosensors, too.
There are nanostructured biosensors emerging that are based on transducers with at least one of the
dimensions of the biosensor down to the nanoscale. Along with lower detection limits come a lower
liquid and sample consumption and the possibility to integrate a high number of sensors within little
space or area.
2.5.1. Nanoplasmonics
While the conventional SPR uses surface plasmons excited at the interface between a dielectric and
a macroscopic gold film, localized surface plasmons resonance (LSPR) can be excited in noble metal
nanostructures. These nanostructures can be particles like disks [103], rings [104] or nanoholes in
thin-films [105]. They can also be arranged in lines [106] or arrays [106,107]. A peak in the adsorption
spectrum appears if the wavelength of the incident phonon is resonant with the localized surface
plasmons of conduction electrons of the nanostructure [108]. The position and height of this
peak depends on the size, shape and composition of the nanostructure and the local dielectric
environment [109,110]. The latter enables to measure the adsorption of molecules on or in between the
nanostructures as the adsorption of molecules causes a shift of the peak in the spectrum.
The small size of the particles allows detecting very low amounts of adsorbents. The combination of
detection limits that are comparable to current commercial instruments together with the small size of
the particles makes single molecule detection probable [111]. But apart from the sensitivity in terms of
signal-to-noise ratio, which is similar to commercially available SPR systems [112], there are other
advantages: the sensitivity to bulk refractive index changes is more than one order of magnitude lower,
which might make temperature stabilization obsolete and increase the stability towards small changes
in organic solvent (e.g., DMSO in the drug discovery process [113]). Additionally, the required set-up
Biosensors 2011, 1
84
is simpler than for the SPR as the light can be irradiated by a white light source at any angle and
therefore does not need any prism for coupling [9]. For a successful commercialization the challenge
of producing the required nanostructures in a cheap, robust and reproducible way has to be overcome.
2.5.2. Nanowire Biosensors
Nanowire biosensors are mainly employed as the miniaturization of electrochemical sensors.
Biochemically functionalized, they can be used, e.g., for AC voltammetry [111] or function as gate in
FETs [114] by connecting them between source and drain. Like with electrochemical sensors using
thin-films, adsorbed biomolecules change the dielectric environment around the nanowire. Due to the
small size of the nanowires and the resulting small surface-to-volume ratio, biomolecules binding to
the nanowire results in a significant change in the electrical properties of the nanowire [14]. An
increasing sensitivity for smaller nanowire diameter has been shown in theory and experimentally [115].
With the diameters being comparable to the size of the biochemical analytes under analysis [8],
extremely high sensitivities up to the detection of a single virus has been shown [116]. Also the
multiplexed detection of proteins was demonstrated on a multiplexed nanowire sensor [117]. However,
the sensitivity is significantly reduced in solutions with high ion concentrations when the analyte
adsorbs at a distance from the nanowire that is higher than the Debye length, because this means that
the charge of the analyte is shielded by the ions in solution [118]. Three possible materials for
nanowires are carbon nanotubes (CNTs), silicon nanowires (SiNWs) and conducting polymer
nanowires (CP NWs). CNTs are interesting because they are mechanically stable and exist
structure-dependent both as semiconductor and conductor, so that they might be used for several parts
of the FET and the connectors. SiNWs and CNTs have a high tensile strength and Young‘s Modulus,
however, they are always semiconducting. Both the CNTs and the SiNWs are produced under harsh
conditions, so the biochemical functionalization has to be done after the production. This is different
for the CP NWs, which can be synthesized at ambient conditions using well-known chemical processes
and therefore can be functionalized before or during synthesis. A variety of techniques have been
employed to assemble the nanowires into functioning devices: Alignment in electric and magnetic
field, lithography, Langmuir–Blodgett techniques or biomolecule mediated self-assembly [119].
3. Conclusions
A broad variety of transducer principles for BIA have been introduced. These were optical (SPR,
SPRi, BLI, Diffraction grating based sensors, waveguide-based sensors, ELM), acoustic (QCM, SAW
and FBAR), electrochemical and calorimetric sensors. Their different working principles result in
different properties like sensitivity, sample consumption or the ability for multiplexed sensing. While
the sensitivities were stated for all transducers it should be kept in mind that it is especially the
perceived sensitivity of an operator in daily routine that will count for successful commercialization.
For this, in addition to sensitivity, also usability, easy handling, reproducibility and robustness play an
important role.
It is also important to take the state of development of the technology into account. The sensitivity
of a sensor technology can change largely in course of time and with higher recourses for research and
development. Biacore, for example, improved the surface mass sensitivity by a factor of 20 to 30 and

Biosensors 2011, 1
85
the association constants by nearly three orders of magnitude in only one decade [120]. It can be thus
expected that sensors in early development stages can undergo a similar improvement.
In addition, also other factors such as the possibility to integrate a high number of sensors in one
device can play an important role. While the sensor principles with implemented nanostructures have
the most promising properties among the presented transducers in terms of sensitivity, sample
consumption and number of parallel measurements they might have the longest road to commercialization
in front of them. Apart from the potential toxicity of the nanoparticles [121] which have to be taken
into account, the problem of producing them in an economic way at high quantities and quality offers
lots of interesting working tasks for research and development.
References
1. Zimmermann, B.; Hahnefeld, C.; Herberg, F.W. Applications of biomolecular interaction
analysis in drug development. TARGETS 2002, 1, 66-73.
2. Hintersteiner, M.; Buehler, C.; Uhl, V.; Schmied, M.; Müller, J.; Kottig, K.; Auer, M. Confocal
Nanoscanning, Bead Picking (CONA): PickoScreen microscopes for automated and quantitative
screening of one-bead one-compound libraries. J. Comb. Chem. 2009, 11, 886-894.
3. Längee, K.; Rapp, B.; Rapp, M. Surface acoustic wave biosensors: A review. Anal. Bioanal.
Chem. 2008, 391, 1509-1519.
4. Milyutin, E.; Muralt, P. Thin film bulk acoustic wave resonators for gravimetric sensing.
Nanosyst. Des. Technol. 2009, doi: 10.1007/978-1-4419-0255-9_5.
5. Vörös, J.; Ramsden, J.; Csucs, G.; Szendr, I.; De Paul, S.; Textor, M.; Spencer, N. Optical
grating coupler biosensors. Biomaterials 2002, 23, 3699-3710.
6. Homola, J. Present and future of surface plasmon resonance biosensors. Anal. Bioanal. Chem.
2003, 377, 528-539.
7. Bally, M.; Halter, M.; Vörös, J.; Grandin, H. Optical microarray biosensing techniques. Surf.
Interface Anal. 2006, 38, 1442-1458.
8. Grieshaber, D.; MacKenzie, R.; Voeroes, J.; Riemhult, E. Electrochemical biosensors—sensor
principles and architectures. Sensors 2008, 8, 1440-1168.
9. Stewart, M.; Anderton, C.; Thompson, L.; Maria, J.; Gray, S.; Rogers, J.; Nuzzo, R.
Nanostructured plasmonic sensors. Chem. Rev. 2008, 108, 494-521.
10. Yan, R.; Gargas, D.; Yang, P. Nanowire photonics. Nat. Photonics 2009, 3, 569-576.
11. Rich, R.L.; Myszka, D.G. Higher-throughput, label-free, real-time molecular interaction analysis.
Anal. Biochem. 2007, 361, 1-6.
12. Cooper, M.A. Label-free screening of bio-molecular interactions. Anal. Bioanal. Chem. 2003,
377, 834-842.
13. Cunningham, B.; Laing, L. Microplate-based, label-free detection of biomolecular interactions:
Applications in proteomics. Expert Rev. Proteomics 2006, 3, 271-281.
14. Qavi, A.; Washburn, A.; Byeon, J.; Bailey, R. Label-free technologies for quantitative
multiparameter biological analysis. Anal. Bioanal. Chem. 2009, 394, 121-135.
15. Barbulovic-Nad, I.; Lucente, M.; Sun, Y.; Zhang, M.; Wheeler, A.; Bussmann, M. Bio-microarray
fabrication techniques—A review. Crit. Rev. Biotechnol. 2006, 26, 237-259.

Biosensors 2011, 1
86
16. Fang, Y. Label-free cell-based assays with optical biosensors in drug discovery. Assay Drug Dev.
Technol. 2006, 4, 583-595.
17. Lucklum, R.; Hauptmann, P. Acoustic microsensors—the challenge behind microgravimetry.
Anal. Bioanal. Chem. 2006, 384, 667-682.
18. Sauerbrey, G. Verwendung von Schwingquarzen zur Wägung dünner Schichten und zur
Mikrowägung. EPJA 1959, 155, 206-222.
19. Kanazawa, K.K.; Gordon, J.G. Frequency of a quartz microbalance in contact with liquid. Anal.
Chem. 1985, 57, 1770-1771.
20. Johannsmann, D.; Mathauer, K.; Wegner, G.; Knoll, W. Viscoelastic properties of thin films
probed with a quartz-crystal resonator. Phys. Rev. B 1992, 46, 7808-7815.
21. Voinova, M.; Rodahl, M.; Jonson, M.; Kasemo, B. Viscoelastic acoustic response of layered
polymer films at fluid-solid interfaces: Continuum mechanics approach. Phys. Scr. 1999, 59,
391-399.
22. Johannsmann, D. Viscoelastic, mechanical, and dielectric measurements on complex samples
with the quartz crystal microbalance. Phys. Chem. Chem. Phys. 2008, 10, 4516-4534.
23. Domack, A.; Prucker, O.; Rühe, J.; Johannsmann, D. Swelling of a polymer brush probed with a
quartz crystal resonator. Phys. Rev. E 1997, 56, 680-689.
24. Borovikov, A. Measurement of viscosity of media by means of shear vibration of plane
piezoresonators. Instrum. Exp. Tech. 1976, 19, 223-224.
25. Voinova, M.; Jonson, M.; Kasemo, B. Dynamics of viscous amphiphilic films supported by
elastic solid substrates. J. Phys. Condens. Matter 1997, 9, 7799-7808.
26. Johannsmann, D. Studies of viscoelasticity with the QCM. In Piezoelectric Sensors; Janshoff, A.,
Steinem, C., Eds.; Springer: Heidelberg, Germany, 2007; Volume 5, pp. 49-109.
27. Cooper, M.A.; Singleton, V.T. A survey of the 2001 to 2005 quartz crystal microbalance
biosensor literature: Applications of acoustic physics to the analysis of biomolecular interactions.
J. Mol. Recognit. 2007, 20, 154-184.
28. Wang, X.; Ellis, J.; Lyle, E.; Sundaram, P.; Thompson, M. Conformational chemistry of
surface-attached calmodulin detected by acoustic shear wave propagation. Mol. BioSyst. 2006, 2,
184-192.
29. Furusawa, H.; Komatsu, M.; Okahata, Y. In situ monitoring of conformational changes of and
peptide bindings to calmodulin on a 27 MHz quartz-crystal microbalance. Anal. Chem. 2009, 81,
1841-1847.
30. Rodahl, M.; Höök, F.; Fredriksson, C.; Keller, C.; Krozer, A.; Brzezinski, P.; Voinova, M.;
Kasemo, B. Simultaneous frequency and dissipation factor QCM measurements of biomolecular
adsorption and cell adhesion. Faraday Discuss. 1997, 107, 229-246.
31. Keller, C.; Kasemo, B. Surface specific kinetics of lipid vesicle adsorption measured with a
quartz crystal microbalance. Biophys. J. 1998, 75, 1397-1402.
32. Höök, F.; Kasemo, B.; Nylander, T.; Fant, C.; Sott, K.; Elwing, H. Variations in coupled water,
viscoelastic properties, and film thickness of a Mefp-1 protein film during adsorption and
cross-linking: A quartz crystal microbalance with dissipation monitoring, ellipsometry, and
surface plasmon resonance study. Anal. Chem. 2001, 73, 5796-5804.

Biosensors 2011, 1
87
33. Weigel, R.; Morgan, D.; Owens, J.; Ballato, A.; Lakin, K.; Hashimoto, K.; Ruppel, C.
Microwave acoustic materials, devices, and applications. IEEE Trans. Microw. Theory Tech.
2002, 50, 738-749.
34. Gizeli, E.; Goddard, N.; Lowe, C.; Stevenson, A. A Love plate biosensor utilising a polymer
layer. Sens. Actuat. B 1992, 6, 131-137.
35. Kovacs, G.; Vellekoop, M.; Haueis, R.; Lubking, G.; Venema, A. A Love wave sensor for (bio)
chemical sensing in liquids. Sens. Actuat. A 1994, 43, 38-43.
36. Länge, K.; Blaess, G.; Voigt, A.; Rapp, M.; Hansjosten, E.; Schygulla, U. Packaging of surface
acoustic wave (SAW) based biosensors: An important issue for future biomedical applications. In
Proceedings of the 2004 IEEE International Frequency Control Symposium and Exposition,
Montreal, Canada, 23–27 August 2004; pp. 321-325.
37. Drafts, B. Acoustic wave technology sensors. IEEE Trans. Microw Theory 2001, 49, 795-802.
38. Gronewold, T. Surface acoustic wave sensors in the bioanalytical field: Recent trends and
challenges. Anal. Chim. Acta 2007, 603, 119-128.
39. Benes, E.; Groschl, M.; Seifert, F.; Pohl, A. Comparison between BAW and SAW sensor
principles. IEEE Trans. Ultrason. Ferroelectr. Freq. Control 1998, 45, 1314-1330.
40. El Gowini, M.M.; Moussa, W.A. A reduced three dimensional model for saw sensors using finite
element analysis. Sensors 2009, 9, 9945-9964.
41. Bjurstrom, J.; Wingqvist, G.; Yantchev, V.; Katardjiev, I. 3I-5 design and fabrication of
temperature compensated liquid FBAR sensors. In Proceedings of IEEE International
Ultrasonics Symposium, Vancouver, Canada, 2–6 October 2006; pp. 898-901.
42. Dickherber, A.; Corso, C.D.; Hunt, W. Lateral field excitation (LFE) of thickness shear mode
(TSM) acoustic waves in thin film bulk acoustic resonators (FBAR) as a potential biosensor.
Conf. Proc. IEEE Eng. Med. Biol. Soc. 2006, 1, 4590-4593.
43. Link, M.; Schreiter, M.; Weber, J.; Gabl, R.; Pitzer, D.; Primig, R.; Wersing, W.; Assouar, M.B.;
Elmazria, O. C-axis inclined ZnO films for shear-wave transducers deposited by reactive
sputtering using an additional blind. J. Vac. Sci. Technol. A 2006, 24, 218-222.
44. Weber, J.; Albers, W.M.; Tuppurainen, J.; Link, M.; Gabl, R.; Wersing, W.; Schreiter, M. Shear
mode FBARs as highly sensitive liquid biosensors. Sens. Actuat. A 2006, 128, 84-88.
45. Lakin, K.M. Thin film resonators and filters. In Proceedings of IEEE Ultrasonics Symposium
1999, Lake Tahoe, NV, USA, 1999; Volume 892, pp. 895-906.
46. Wang, J.S.; Lakin, K.M. Sputtered c-axis inclined ZnO films for shear wave resonators. In
Proceedings of Ultrasonics Symposium 1982, San Diego, CA, USA, 27–29 October 1982;
pp. 480-483.
47. Carlotti, G.; Fioretto, D.; Socino, G.; Palmieri, L.; Petri, A.; Verona, E. Surface acoustic waves in
c-axis inclined ZnO films. In Proceedings of IEEE Ultrasonics Symposium 1990, Honolulu, HI,
USA, 4–7 December 1990; pp. 449-453.
48. Fardeheb-Mammeri, A.; Assouar, M.B.; Elmazria, O.; Gatel, C.; Fundenberger, J.J.; Benyoucef, B.
C-axis inclined AlN film growth in planar system for shear wave devices. Diamond Relat. Mater.
2008, 17, 1770-1774.

Biosensors 2011, 1
88
49. Link, M.; Schreiter, M.; Weber, J.; Pitzer, D.; Primig, R.; Assouar, M.B.; Elmazria, O. C-axis
inclined ZnO films deposited by reactive sputtering using an additional blind for shear BAW
devices. In Proceedings of IEEE Ultrasonics Symposium 2005, Rotterdam, The Netherlands,
18–21 September 2005; pp. 202-205.
50. Akiyama, M.; Nagao, K.; Ueno, N.; Tateyama, H.; Yamada, T. Influence of metal electrodes on
crystal orientation of aluminum nitride thin films. Vacuum 2004, 74, 699-703.
51. Martin, F.; Jan, M.E.; Rey-Mermet, S.; Su, D.; Muralt, P.; Cantoni, M. Shear mode coupling and
tilted grain growth of AlN thin films in BAW resonators. In Proceedings of IEEE Ultrasonics
Symposium 2005, Rotterdam, The Netherlands, 18–21 September 2005; pp. 333-336.
52. Yanagitani, T.; Kiuchi, M.; Matsukawa, M.; Watanabe, Y. Characteristics of pure-shear mode
BAW resonators consisting of (1120) textured ZnO films. IEEE Trans. Ultrason. Ferroelectr.
Freq. Control 2007, 54, 1680-1686.
53. Wingqvist, G.; Bjurstrom, J.; Katardjiev, I. Shear mode AlN thin film electroacoustic resonator
for biosensor applications. In Proceedings of IEEE Ultrasonics Symposium 2005, Rotterdam,
The Netherlands, 18–21 September 2005; pp. 50-53.
54. Nirschl, M.; Rantala, A.; Tukkiniemi, K.; Auer, S.; Hellgren, A.C.; Pitzer, D.; Schreiter, M.;
Vikholm-Lundin, I. CMOS-Integrated film bulk acoustic resonators for label-free biosensing.
Sensors 2010, 10, 4180-4193.
55. Link, M. Study and Realization of Shear Wave Mode Solidly Mounted Film Bulk Acoustic
Resonators (FBAR) Made of Caxis Inclined Zinc Oxide (Zno) Thin Films: Application as
Gravimetric Sensors in Liquid Environments. Ph.D. Thesis, UniversitÈ Henri PoincarÈ, Nancy I,
Nancy Cedex, France, 2006.
56. Nirschl, M.; Blüher, A.; Erler, C.; Katzschner, B.; Vikholm-Lundin, I.; Auer, S.; Vörös, J.;
Pompe, W.; Schreiter, M.; Mertig, M. Film bulk acoustic resonators for DNA and protein
detection and investigation of in vitro bacterial S-layer formation. Sens. Actuat. A 2009, 156,
180-184.
57. Hoa, X.D.; Kirk, A.G.; Tabrizian, M. Towards integrated and sensitive surface plasmon
resonance biosensors: A review of recent progress. Biosens. Bioelectron. 2007, 23, 151-160.
58. Harrison, D.; Kjellberg, H. Segmenting a market in the making: Industrial market segmentation
as construction. Ind. Mark. Manage. 2010, 39, 784-792.
59. Siontorou, C.; Batzias, F. Innovation in biotechnology: Moving from academic research to
product development-the case of biosensors. Crit. Rev. Biotechnol. 2010, 30, 79-98.
60. Bergstrom, J.; Lofaas, S.; Johnsson, B. Matrix Coating for Sensing Surfaces Capable of Selective
Biomolecular Interactions, to be Used in Biosensor Systems. U.S. Patent 5,436,161, 25 July
1995.
61. Löfås, S.; Johnsson, B. A novel hydrogel matrix on gold surfaces in surface plasmon resonance
sensors for fast and efficient covalent immobilization of ligands. J. Chem. Soc. Chem. Commun.
1990, 1990, 1526-1528.
62. Hearty, S.; Conroy, P.; Ayyar, B.; Byrne, B.; OKennedy, R. Surface plasmon resonance for
vaccine design and efficacy studies: Recent applications and future trends. Expert Rev. Vaccines
2010, 9, 645-664.

Biosensors 2011, 1
89
63. Homola, J. Surface plasmon resonance sensors for detection of chemical and biological species.
Chem. Rev. 2008, 108, 462-493.
64. Nelson, B.P.; Grimsrud, T.E.; Liles, M.R.; Goodman, R.M.; Robert, M. Surface plasmon
resonance imaging measurements of DNA and RNA hybridization adsorption onto DNA
microarrays. Anal. Chem. 2001, 73, 1-7.
65. Shumaker-Parry, J.S.; Campbell, C.T. Quantitative methods for spatially resolved
adsorption/desorption measurements in real time by surface plasmon resonance microscopy.
Anal. Chem. 2004, 76, 907-917.
66. Boozer, C.; Kim, G.; Cong, S.; Guan, H.W.; Londergan, T. Looking towards label-free
biomolecular interaction analysis in a high-throughput format: A review of new surface plasmon
resonance technologies. Curr. Opin. Biotechnol. 2006, 17, 400-405.
67. Shumaker-Parry, J.S.; Zareie, M.H.; Aebersold, R.; Campbell, C.T. Microspotting streptavidin
and double-stranded DNA arrays on gold for high-throughput studies of protein-DNA
interactions by surface plasmon resonance microscopy. Anal. Chem. 2004, 76, 918-929.
68. Scarano, S.; Scuffi, C.; Mascini, M.; Minunni, M. Surface plasmon resonance imaging
(SPRi)-based sensing: A new approach in signal sampling and management. Biosens.
Bioelectron. 2010, 26, 1380-1385.
69. Flournoy, P.; McClure, R.; Wyntjes, G. White-Light interferometric thickness gauge. Appl. Opt.
1972, 11, 1907-1915.
70. Do, T.; Ho, F.; Heidecker, B.; Witte, K.; Chang, L.; Lerner, L. A rapid method for determining
dynamic binding capacity of resins for the purification of proteins. Protein Expr. Purif. 2008, 60,
147-150.
71. Abdiche, Y.; Malashock, D.; Pinkerton, A.; Pons, J. Determining kinetics and affinities of protein
interactions using a parallel real-time label-free biosensor, the Octet. Anal. Biochem. 2008, 377,
209-217.
72. Cunningham, B.; Li, P.; Lin, B.; Pepper, J. Colorimetric resonant reflection as a direct
biochemical assay technique. Sens. Actuat. B 2002, 81, 316-328.
73. Tiefenthaler, K.; Lukosz, W. Sensitivity of grating couplers as integrated-optical chemical
sensors. J. Opt. Soc. Am. B 1989, 6, 209-220.
74. Ramsden, J. Review of new experimental techniques for investigating random sequential
adsorption. J. Stat. Phys. 1993, 73, 853-877.
75. Brusatori, M.; Tie, Y.; Van Tassel, P. Protein adsorption kinetics under an applied electric field:
An optical waveguide lightmode spectroscopy study. Langmuir 2003, 19, 5089-5097.
76. Höök, F.; Vörös, J.; Rodahl, M.; Kurrat, R.; Böni, P.; Ramsden, J.; Textor, M.; Spencer, N.;
Tengvall, P.; Gold, J. A comparative study of protein adsorption on titanium oxide surfaces
using in situ ellipsometry, optical waveguide lightmode spectroscopy, and quartz crystal
microbalance/dissipation. Colloids Surf. B 2002, 24, 155-170.
77. Cross, G.; Reeves, A.; Brand, S.; Swann, M.; Peel, L.; Freeman, N.; Lu, J. The metrics of surface
adsorbed small molecules on the Young's fringe dual-slab waveguide interferometer. J. Phys. D
2004, 37, 74-80.
78. Cross, G.; Reeves, A.; Brand, S.; Popplewell, J.; Peel, L.; Swann, M.; Freeman, N. A new
quantitative optical biosensor for protein characterisation. Biosens. Bioelectron. 2003, 19, 383-390.

Biosensors 2011, 1
90
79. Rothen, A. The ellipsometer, an apparatus to measure thicknesses of thin surface films. Rev. Sci.
Instrum. 1945, 16, 26-30.
80. Tompkins, H.; Irene, E. Handbook of Ellipsometry; William Andrew: Mona Vale, Australia, 2005.
81. Westphal, P.; Bornmann, A. Biomolecular detection by surface plasmon enhanced ellipsometry.
Sens. Actuat. B 2002, 84, 278-282.
82. Kurrat, R.; Wälivaara, B.; Marti, A.; Textor, M.; Tengvall, P.; Ramsden, J.; Spencer, N. Plasma
protein adsorption on titanium: Comparative in situ studies using optical waveguide lightmode
spectroscopy and ellipsometry. Colloids Surf. B 1998, 11, 187-201.
83. Freire, E. Isothermal titration calorimetry. Curr. Protoc Cell Biol. 2004, 17, 11-24.
84. Bruylants, G.; Wouters, J.; Michaux, C. Differential scanning calorimetry in life science:
Thermodynamics, stability, molecular recognition and application in drug design. Curr. Med.
Chem. 2005, 12, 2011-2020.
85. Brown, M.E. Introduction to Thermal Analysis: Techniques and Applications; Springer:
Dordrecht, The Netherlands, 2001; Volume 1.
86. Leavitt, S.; Freire, E., Direct measurement of protein binding energetics by isothermal titration
calorimetry. Current Opinion in Structural Biology 2001, 11, 560-566.
87. Sethi, R. Transducer aspects of biosensors. Biosens. Bioelectron. 1994, 9, 243-264.
88. Macdonald, J. Impedence Spectroscopy—Emphasizing Solid Materials and Systems; John Wiley
and Sons: Hoboken, NJ, USA, 1987; pp. 1-346.
89. Bravman, T.; Bronner, V.; Lavie, K.; Notcovich, A.; Papalia, G.; Myszka, D. Exploring one-shot
kinetics and small molecule analysis using the ProteOn XPR36 array biosensor. Anal. Biochem.
2006, 358, 281-288.
90. Chang-Yen, D.; Myszka, D.; Gale, B. A novel PDMS microfluidic spotter for fabrication of
protein chips and microarrays. J. Microelectromech. Syst. 2006, 15, 1145-1151.
91. Schöning, M.; Poghossian, A. Bio FEDs (field-effect devices): State-of-the-art and new
directions. Electroanalysis 2006, 18, 1893-1900.
92. Bearinger, J.; Vörös, J.; Hubbell, J.; Textor, M. Electrochemical optical waveguide lightmode
spectroscopy (EC-OWLS): A pilot study using evanescent-field optical sensing under voltage
control to monitor polycationic polymer adsorption onto indium tin oxide (ITO)-coated
waveguide chips. Biotechnol. Bioeng. 2003, 82, 465-473.
93. Brusatori, M.; Van Tassel, P. Biosensing under an applied voltage using optical waveguide
lightmode spectroscopy. Biosens. Bioelectron. 2003, 18, 1269-1277.
94. Kang, X.; Cheng, G.; Dong, S. A novel electrochemical SPR biosensor. Electrochem. Commun.
2001, 3, 489-493.
95. Lavers, C.; Harris, R.; Hao, S.; Wilkinson, J.; O‘Dwyer, K.; Brust, M.; Schiffrin, D.
Electrochemically-controlled waveguide-coupled surface plasmon sensing. J. Electroanal. Chem.
1995, 387, 11-22.
96. Ying, P.; Viana, A.; Abrantes, L.; Jin, G. Adsorption of human serum albumin onto gold: A
combined electrochemical and ellipsometric study. J. Colloid Interface Sci. 2004, 279, 95-99.
97. Wang, Z.; Viana, A.; Jin, G.; Abrantes, L. Immunosensor interface based on physical
and chemical immunoglobulin G adsorption onto mixed self-assembled monolayers.
Bioelectrochemistry 2006, 69, 180-186.

Biosensors 2011, 1
91
98. Yu, Y.; Jin, G. Influence of electrostatic interaction on fibrinogen adsorption on gold studied by
imaging ellipsometry combined with electrochemical methods. J. Colloid Interface Sci. 2005,
283, 477-481.
99. Marx, K.A. Quartz crystal microbalance: a useful tool for studying thin polymer films and
complex biomolecular systems at the solution-surface interface. Biomacromolecules 2003, 4,
1099-1120.
100. Dong, Y. The frequency response of QCM in electrochemically characterizing the
immobilization on gold electrode. Sens. Actuat. B 2005, 108, 622-626.
101. Fu, Y.; Yuan, R.; Xu, L.; Chai, Y.; Liu, Y.; Tang, D.; Zhang, Y. Electrochemical impedance
behavior of DNA biosensor based on colloidal Ag and bilayer two-dimensional sol-gel as
matrices. J. Biochem. Biophys. Methods 2005, 62, 163-174.
102. Feynman, R. There‘s plenty of room at the bottom. Available online: http://www.zyvex.com/
nanotech/feynman.html (accessed on 28 April 2011).
103. Dahlin, A.; Chen, S.; Jonsson, M.; Gunnarsson, L.; Käll, M.; Höök, F. High-resolution
microspectroscopy of plasmonic nanostructures for miniaturized biosensing. Anal. Chem. 2009,
81, 6572-6580.
104. Larsson, C.; Rodahl, M.; Hook, F. Characterization of DNA immobilization and subsequent
hybridization on a 2D arrangement of streptavidin on a biotin-modified lipid bilayer supported on
SiO2. Anal. Chem. 2003, 75, 5080-5087.
105. Rindzevicius, T.; Alaverdyan, Y.; Dahlin, A.; Höök, F.; Sutherland, D.; Käll, M. Plasmonic
sensing characteristics of single nanometric holes. Nano Lett. 2005, 5, 2335-2339.
106. MacKenzie, R.; Auzelyte, V.; Olliges, S.; Spolenak, R.; Solak, H.; Vörös, J. Nanowire
development and characterization for applications in biosensing. Nanosyst. Des. Technol. 2009,
doi: 10.1007/978-1-4419-0255-9_7.
107. Sannomiya, T.; Sahoo, P.; Mahcicek, D.; Solak, H.; Hafner, C.; Grieshaber, D.; Vörös, J.
Biosensing by densely packed and optically coupled plasmonic particle arrays. Small 2009, 5,
1889-1896.
108. Willets, K.; Van Duyne, R. Localized surface plasmon resonance spectroscopy and sensing.
Annu Rev. Phys. Chem. 2007, 58, 267-297.
109. Ghosh, S.K.; Nath, S.; Kundu, S.; Esumi, K.; Pal, T. Solvent and ligand effects on the localized
surface plasmon resonance (LSPR) of gold colloids. J. Phys. Chem. B 2004, 108, 13963-13971.
110. Hutter, E.; Fendler, J. Exploitation of localized surface plasmon resonance. Adv. Mater. 2004, 16,
1685-1706.
111. Koehne, J.; Chen, H.; Cassell, A.; Ye, Q.; Han, J.; Meyyappan, M.; Li, J. Miniaturized multiplex
label-free electronic chip for rapid nucleic acid analysis based on carbon nanotube nanoelectrode
arrays. Clin. Chem. 2004, 50, 1886-1893.
112. Svedendahl, M.; Chen, S.; Dmitriev, A.; Käll, M. Refractometric sensing using propagating
versus localized surface plasmons: A direct comparison. Nano Lett. 2009, 9, 4428-4433.
113. Karlsson, R.; Kullman-Magnusson, M.; Hämäläinen, M.; Remaeus, A.; Andersson, K.; Borg, P.;
Gyzander, E.; Deinum, J. Biosensor analysis of drug-target interactions: Direct and competitive
binding assays for investigation of interactions between thrombin and thrombin inhibitors. Anal.
Biochem. 2000, 278, 1-13.

Biosensors 2011, 1
92
114. Gao, Z.; Agarwal, A.; Trigg, A.; Singh, N.; Fang, C.; Tung, C.; Fan, Y.; Buddharaju, K.; Kong, J.
Silicon nanowire arrays for label-free detection of DNA. Anal. Chem. 2007, 79, 3291-3297.
115. Elfström, N.; Juhasz, R.; Sychugov, I.; Engfeldt, T.; Karlström, A.; Linnros, J. Surface charge
sensitivity of silicon nanowires: Size dependence. Nano Lett. 2007, 7, 2608-2612.
116. Patolsky, F.; Zheng, G.; Hayden, O.; Lakadamyali, M.; Zhuang, X.; Lieber, C. Electrical
detection of single viruses. Proc. Natl. Acad. Sci. USA 2004, 101, 14017-14022.
117. Zheng, G.; Patolsky, F.; Cui, Y.; Wang, W.; Lieber, C. Multiplexed electrical detection of cancer
markers with nanowire sensor arrays. Nat. Biotechnol. 2005, 23, 1294-1301.
118. Stern, E.; Wagner, R.; Sigworth, F.; Breaker, R.; Fahmy, T.; Reed, M. Importance of the Debye
screening length on nanowire field effect transistor sensors. Nano Lett. 2007, 7, 3405-3409.
119. Wanekaya, A.; Chen, W.; Myung, N.; Mulchandani, A. Nanowire-based electrochemical
biosensors. Electroanalysis 2006, 18, 533-550.
120. Karlsson, R. Affinity analysis of non-steady-state data obtained under mass transport limited
conditions using BIAcore technology. J. Mol. Recognit. 1999, 12, 285-292.
121. Nel, A.; Xia, T.; Madler, L.; Li, N. Toxic potential of materials at the nanolevel. Science 2006,
311, 622-627.
© 2011 by the authors; licensee MDPI, Basel, Switzerland. This article is an open access article
distributed under the terms and conditions of the Creative Commons Attribution license
(http://creativecommons.org/licenses/by/3.0/)