Embed Size (px)
Citation preview

Review of UML
The purpose of this chapter is to set the scene by reviewing the key UML concepts, the main diagramtypes, and the role of those diagrams within the software development process. If you're quite new toUML this will serve as a practical introduction that will help you make sense of the rest of the book,before you move on to further reading. If you're experienced with UML the chapter will serve as handyrevision and you might just find some nuggets of information that have so far eluded you.
Either way we'll all be moving on from roughly the same starting point: with the same appreciation ofUML notation, with an understanding of relevant software development processes, and with a commonbias towards .NET and the Visio for Enterprise Architects tool.
The final point is quite important, and the raison d'être for this book. In recent years the body of UMLliterature has focused mainly on Java development and the use of modeling tools such as Rational Rose.In this book we're applying a .NET development perspective at the same time as demonstrating the sofar under-documented Visio modeling tool that comes bundled with the Visual Studio .NETEnterprise Architect.
With all this in mind we can now press on with the introduction to – or revision of, depending on yourbackground – the Unified Modeling Language.
What is the Unified Modeling Language?When discussing UML, we need to establish one important point right up front.
The Unified Modeling Language is a notation; that is a set of diagrams and diagram elementsthat may be arranged to describe the design of a software system. UML is not a process, nor is it amethod comprising a notation and a process.
1

Chapter 1
10
In theory you can apply aspects of the notation according to the steps prescribed by any process thatyou care to choose – traditional waterfall, extreme programming, RAD – but there are processes thathave been developed specifically to complement the UML notation. You'll read more about thecomplementary process(es) later in this chapter.
Why use UML?Hidden inside that specific question there's a more generic question, which is "Why use a formal analysisand design notation, UML or otherwise?" Let's start to answer that question by drawing an analogy.
Suppose you wanted to make a bridge across a small stream. You could just place a plank of woodacross from one side to the other, and you could do so on your own. Even if it failed to hold yourweight, the only downside would be wet feet.
Now suppose you wanted to make a bridge across a narrow river. You'd need to do some forwardplanning to estimate what materials you'd need – wood, brick, or metal – and how much of each. You'dneed some help, and your helpers would want to know what kind of bridge you're building.
Finally, suppose you wanted to build a bridge across a very wide river. You'd need to do the same kind offorward planning as well a communicating your ideas to a much bigger team. This would be a commercialproposition with payback from fare-paying passengers, so you'd need to liaise with the relevant authoritiesand comply with health-and-safety requirements. You'd also be required to leave behind sufficientdocumentation to allow future generations to maintain the structure long into the future.
In a software context, this means that formal design becomes increasingly important as a function of the sizeand complexity of the project; in particular, as a function of the number of people involved. Based on thatanalogy, and wider project experience, we could conclude that a formal design notation is important in:
❑ Establishing a blueprint from the application
❑ Estimating and planning the time and materials
❑ Communicating between teams, and within a team
❑ Documenting the project
Of course, we've probably all encountered projects in which little or no formal design has been doneup-front (corresponding with the first three bullet points in that list); in fact more projects than we careto mention! Even in those situations, UML notation has been found to be invaluable in documenting theend result (the last bullet point in that list). Though not recommended, if that's the extent of yourcommitment to UML you'll be most interested in the Reverse Engineering discussion in Chapter 5.
Now that we've answered the generic question, let's return to the specific question of why use UML?
Well it's become something of an industry standard, which means that there's a good chance of findingother people who understand it. That's very important in terms of the communication anddocumentation bullet points in our list. Also if you or anyone else in the team does not understand it,there's a good chance of finding relevant training courses, or books like this one.
That's very pragmatic reasoning and perhaps more convincing than a more academic (or evencommercial) argument such as:
Review of UML
11
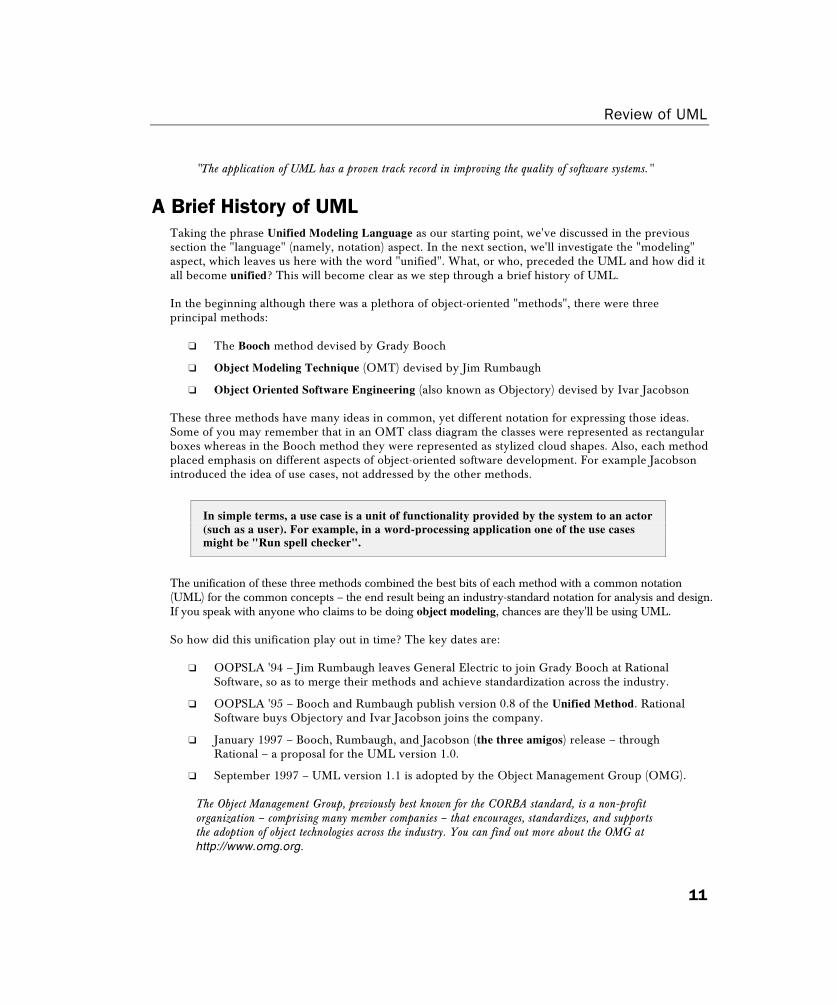
"The application of UML has a proven track record in improving the quality of software systems."
A Brief History of UMLTaking the phrase Unified Modeling Language as our starting point, we've discussed in the previoussection the "language" (namely, notation) aspect. In the next section, we'll investigate the "modeling"aspect, which leaves us here with the word "unified". What, or who, preceded the UML and how did itall become unified? This will become clear as we step through a brief history of UML.
In the beginning although there was a plethora of object-oriented "methods", there were threeprincipal methods:
❑ The Booch method devised by Grady Booch
❑ Object Modeling Technique (OMT) devised by Jim Rumbaugh
❑ Object Oriented Software Engineering (also known as Objectory) devised by Ivar Jacobson
These three methods have many ideas in common, yet different notation for expressing those ideas.Some of you may remember that in an OMT class diagram the classes were represented as rectangularboxes whereas in the Booch method they were represented as stylized cloud shapes. Also, each methodplaced emphasis on different aspects of object-oriented software development. For example Jacobsonintroduced the idea of use cases, not addressed by the other methods.
In simple terms, a use case is a unit of functionality provided by the system to an actor(such as a user). For example, in a word-processing application one of the use casesmight be "Run spell checker".
The unification of these three methods combined the best bits of each method with a common notation(UML) for the common concepts – the end result being an industry-standard notation for analysis and design.If you speak with anyone who claims to be doing object modeling, chances are they'll be using UML.
So how did this unification play out in time? The key dates are:
❑ OOPSLA '94 – Jim Rumbaugh leaves General Electric to join Grady Booch at RationalSoftware, so as to merge their methods and achieve standardization across the industry.
❑ OOPSLA '95 – Booch and Rumbaugh publish version 0.8 of the Unified Method. RationalSoftware buys Objectory and Ivar Jacobson joins the company.
❑ January 1997 – Booch, Rumbaugh, and Jacobson (the three amigos) release – throughRational – a proposal for the UML version 1.0.
❑ September 1997 – UML version 1.1 is adopted by the Object Management Group (OMG).
The Object Management Group, previously best known for the CORBA standard, is a non-profitorganization – comprising many member companies – that encourages, standardizes, and supportsthe adoption of object technologies across the industry. You can find out more about the OMG athttp://www.omg.org.
Chapter 1
12
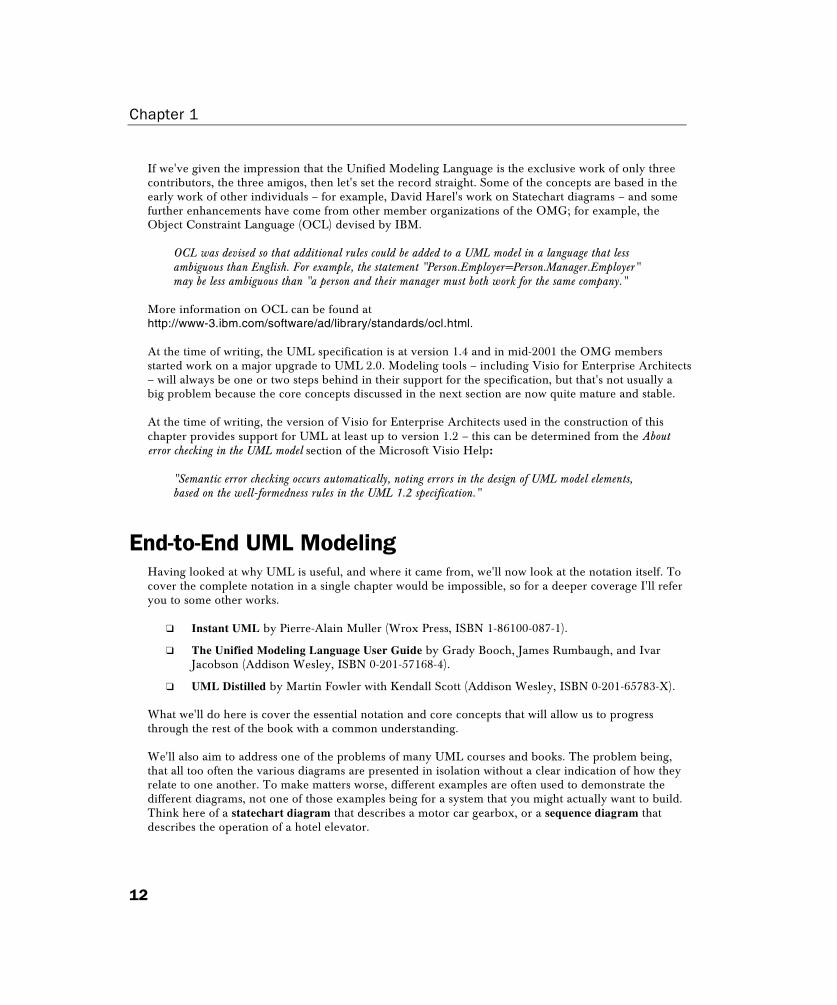
If we've given the impression that the Unified Modeling Language is the exclusive work of only threecontributors, the three amigos, then let's set the record straight. Some of the concepts are based in theearly work of other individuals – for example, David Harel's work on Statechart diagrams – and somefurther enhancements have come from other member organizations of the OMG; for example, theObject Constraint Language (OCL) devised by IBM.
OCL was devised so that additional rules could be added to a UML model in a language that lessambiguous than English. For example, the statement "Person.Employer=Person.Manager.Employer"may be less ambiguous than "a person and their manager must both work for the same company."
More information on OCL can be found athttp://www-3.ibm.com/software/ad/library/standards/ocl.html.
At the time of writing, the UML specification is at version 1.4 and in mid-2001 the OMG membersstarted work on a major upgrade to UML 2.0. Modeling tools – including Visio for Enterprise Architects– will always be one or two steps behind in their support for the specification, but that's not usually abig problem because the core concepts discussed in the next section are now quite mature and stable.
At the time of writing, the version of Visio for Enterprise Architects used in the construction of thischapter provides support for UML at least up to version 1.2 – this can be determined from the Abouterror checking in the UML model section of the Microsoft Visio Help:
"Semantic error checking occurs automatically, noting errors in the design of UML model elements,based on the well-formedness rules in the UML 1.2 specification."
End-to-End UML ModelingHaving looked at why UML is useful, and where it came from, we'll now look at the notation itself. Tocover the complete notation in a single chapter would be impossible, so for a deeper coverage I'll referyou to some other works.
❑ Instant UML by Pierre-Alain Muller (Wrox Press, ISBN 1-86100-087-1).
❑ The Unified Modeling Language User Guide by Grady Booch, James Rumbaugh, and IvarJacobson (Addison Wesley, ISBN 0-201-57168-4).
❑ UML Distilled by Martin Fowler with Kendall Scott (Addison Wesley, ISBN 0-201-65783-X).
What we'll do here is cover the essential notation and core concepts that will allow us to progressthrough the rest of the book with a common understanding.
We'll also aim to address one of the problems of many UML courses and books. The problem being,that all too often the various diagrams are presented in isolation without a clear indication of how theyrelate to one another. To make matters worse, different examples are often used to demonstrate thedifferent diagrams, not one of those examples being for a system that you might actually want to build.Think here of a statechart diagram that describes a motor car gearbox, or a sequence diagram thatdescribes the operation of a hotel elevator.

Review of UML
13
So in the following section we'll have a single example, an Order Processing system, which you should beable to relate to even if you don't intend to build such a thing, and at the end, we'll pull it all together.
UML Essential Notation and Core ConceptsNow we'll step through the UML diagrams in turn, all the way from an activity diagram through to adeployment diagram in this order:
❑ Activity Diagram
❑ Use Case Diagram
❑ Sequence and Collaboration Diagram
❑ Statechart Diagram
❑ Static Structure Diagram
❑ Component Diagram
❑ Deployment Diagram
Each diagram is labeled in light gray with some of the names given to the UML elements that areshown, which – for the record – reflects the UML metamodel.
The UML Metamodel is itself a UML model, which defines the rules for constructingother UML models. Whereas in one of your own models you might state "Bank isassociated with one or more Accounts", the metamodel would state a more genericrelationship of "a Class may be associated with any Other Class".
On the whole, the model elements have been labeled using Visio EA terminology so as to reduce thepotential for confusion when you come to use the tool. Historically – and in other modeling tools – youmay have encountered alternative UML terminology. The alternative terms have been tabulatedtowards the end of this chapter.
As you'll see later in this chapter, the software development process that you follow might well bedescribed as use-case driven, which implies the use case diagram as an obvious starting point. But thoseuse cases will doubtless fit into some kind of overall business process, perhaps modeled up-front by abusiness analyst. So we'll take a business process as our starting point and use this as a vehicle fordemonstrating the most suitable diagram for that purpose; the activity diagram.
Activity DiagramThe activity diagram is the closest you'll get in UML to a flow chart, and the closest you'll get to abusiness process diagram. Here is a sample activity diagram with the important UML elements labeled,followed by a description of those elements.

Chapter 1
14
OrderClerk Logistics Accounts
Take Order
unpicked : Order Pick Stock
Deliver Item(s)Prepare Invoice
object in state
entry action
initial stateswim lane
Send Invoice
entry/Print Invoice
transition (fork)
transition (join)
state
control flow
❑ Initial state is where the diagram begins.
❑ Control flow shows a transfer of control from one activity to another.
❑ State represents a period of time during which a piece of work is carried out by personor team.
❑ Transition (fork) shows the point as which two or more parallel activities will commence.
❑ Transition (join) shows the point as which two or more parallel activities must synchronizeand converge.
❑ Swim lane allows all of the activities carried out by a particular person or team arranged intoa column.
❑ Entry action shows what must happen when the activity begins.
❑ Object in state shows an object that is produced or consumed in the course of an activity, withthe production or consumption (object flow) being represented by the dashed line.
Review of UML
15
What the diagram shows
The Order Processing business process begins when an Order Clerk performs the Take Order activity.This activity results in an Order object being created in unpicked state. Next, the Pick Stock activity isperformed (for the Order) by the Logistics team.
At this point some parallel behavior occurs – the Logistics team Deliver Item(s) around the same timethat the Accounts department Prepare Invoice. Only when the items have been delivered and theinvoice has been prepared can the Accounts department then Send Invoice. Immediately prior tosending the invoice they must Print Invoice.
Those are the essential points of an activity diagram, but not a complete coverage. In particular you willsee some additional syntax in the description of a Statechart diagram.
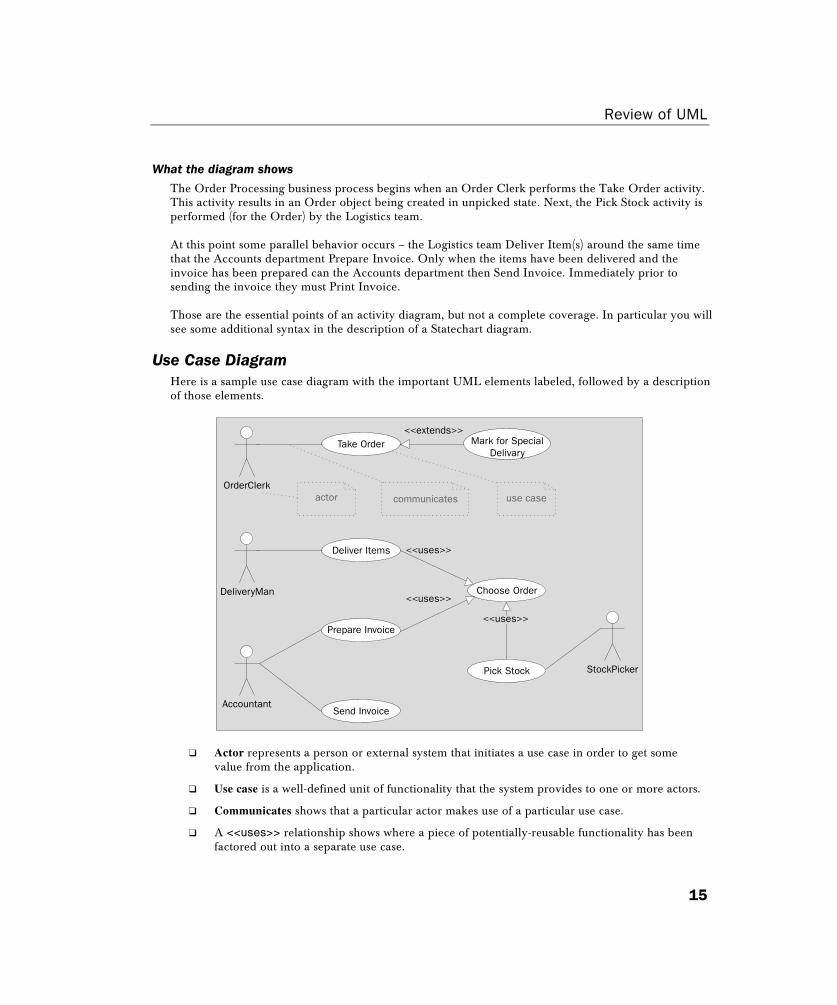
Use Case DiagramHere is a sample use case diagram with the important UML elements labeled, followed by a descriptionof those elements.
Take Order<<extends>>
Mark for SpecialDelivary
OrderClerk
DeliveryMan
Accountant
Deliver Items
Prepare Invoice
Send Invoice
<<uses>>
<<uses>>Choose Order
Pick Stock StockPicker
<<uses>>
actor use casecommunicates
❑ Actor represents a person or external system that initiates a use case in order to get somevalue from the application.
❑ Use case is a well-defined unit of functionality that the system provides to one or more actors.
❑ Communicates shows that a particular actor makes use of a particular use case.
❑ A <<uses>> relationship shows where a piece of potentially-reusable functionality has beenfactored out into a separate use case.
Chapter 1
16
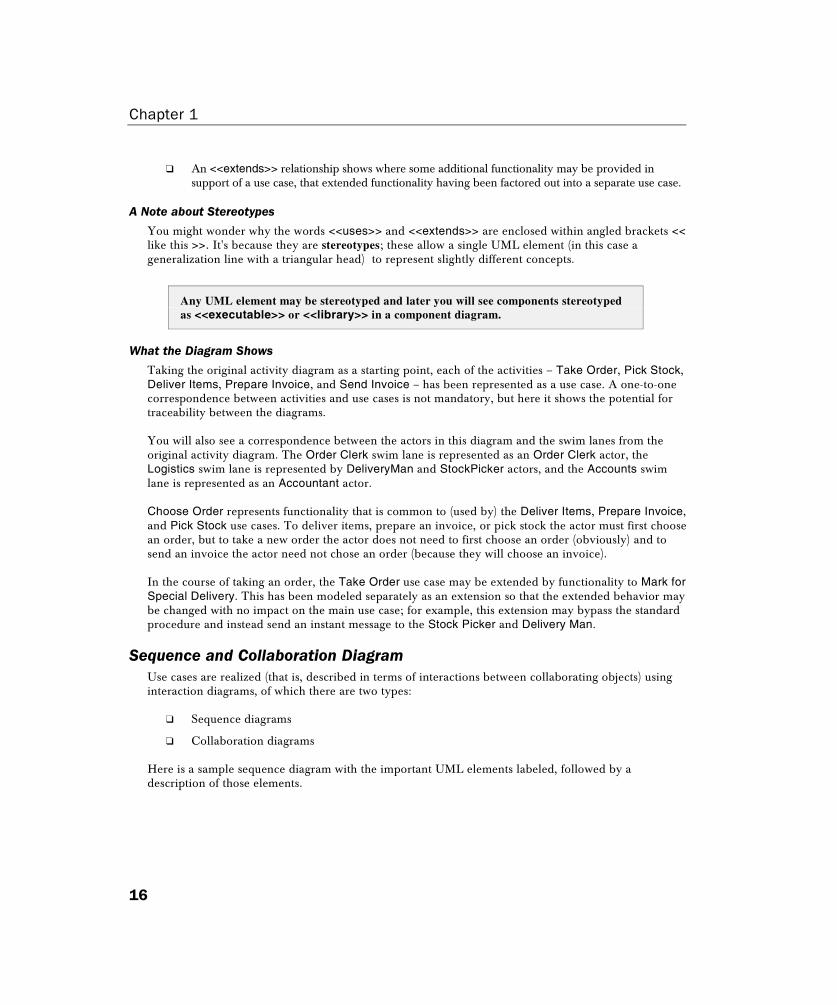
❑ An <<extends>> relationship shows where some additional functionality may be provided insupport of a use case, that extended functionality having been factored out into a separate use case.
A Note about Stereotypes
You might wonder why the words <<uses>> and <<extends>> are enclosed within angled brackets <<like this >>. It's because they are stereotypes; these allow a single UML element (in this case ageneralization line with a triangular head) to represent slightly different concepts.
Any UML element may be stereotyped and later you will see components stereotypedas <<executable>> or <<library>> in a component diagram.
What the Diagram Shows
Taking the original activity diagram as a starting point, each of the activities – Take Order, Pick Stock,Deliver Items, Prepare Invoice, and Send Invoice – has been represented as a use case. A one-to-onecorrespondence between activities and use cases is not mandatory, but here it shows the potential fortraceability between the diagrams.
You will also see a correspondence between the actors in this diagram and the swim lanes from theoriginal activity diagram. The Order Clerk swim lane is represented as an Order Clerk actor, theLogistics swim lane is represented by DeliveryMan and StockPicker actors, and the Accounts swimlane is represented as an Accountant actor.
Choose Order represents functionality that is common to (used by) the Deliver Items, Prepare Invoice,and Pick Stock use cases. To deliver items, prepare an invoice, or pick stock the actor must first choosean order, but to take a new order the actor does not need to first choose an order (obviously) and tosend an invoice the actor need not chose an order (because they will choose an invoice).
In the course of taking an order, the Take Order use case may be extended by functionality to Mark forSpecial Delivery. This has been modeled separately as an extension so that the extended behavior maybe changed with no impact on the main use case; for example, this extension may bypass the standardprocedure and instead send an instant message to the Stock Picker and Delivery Man.
Sequence and Collaboration DiagramUse cases are realized (that is, described in terms of interactions between collaborating objects) usinginteraction diagrams, of which there are two types:
❑ Sequence diagrams
❑ Collaboration diagrams
Here is a sample sequence diagram with the important UML elements labeled, followed by adescription of those elements.

Review of UML
17
stockPicker StockPicker
: PickStockController : ChooseOrderController : StockItemsForm chosenOrder : Order : Warehouse
run
chooseOrder()
chosenOrder
display()
select stock item
allocateStock(stockItem)
removeItem(stockItem)
message
object
stockItem
❑ Object refers to an object instance that sends messages to, or receives messages from, otherobject instances. The objects are labeled as instanceName : ClassName where the instancename is commonly omitted to show no particular instance of the class in question.
❑ Message shows an interaction between two objects, which may be labeled using descriptivetext (such as select stock item above) or may be labeled with the name of an operation on thereceiving class, such as allocateStock above. A return message may be shown as a dotted line.
Here is an equivalent collaboration diagram showing the same set of interactions. Whereas a sequencediagram has a top-to-bottom time line to show the order of events, a collaboration diagram uses anumbering scheme. Apart from the visualization style, sequence diagrams and collaboration diagramsmay be thought of as equivalent to the extent that some modeling tools, such as Rational Rose, allowautomatic switching between the visualization styles.

Chapter 1
18
stockPicker StockPicker : Warehouse
chosenOrder2: c
hoos
eOrde
r()
3: cho
senO
rder
4: display()
5: select stock item
7: allocateStock(stockItem)
8: removeItem(stockItem)6: stockItem
: StockItemsForm
: ChooseOrderController
: PickStockController1: run
What these Diagrams Show
Both diagrams show the sequence of object interactions that support the PickStock use case. Thesequence is:
1. The StockPicker actor runs the PickStockController (which in this design is a control classresponsible for the use case).
2. The PickStockController calls the chooseOrder() operation on the ChooseOrderControllerwhich results in...
3. a chosenOrder being returned. This interaction represents the fact that the Pick Stock usecase <<uses>> the Choose Order use case.
4. The PickStockController calls the display() operation of a StockItemsForm.
5. The StockPicker actor selects a stock item on the StockItemsForm.
6. The selected stockItem is returned to the controller.
7. To allocate the stock to the order, the PickStockController calls the allocateStock()operation of the Order – specifically the chosenOrder that was retrieved in Step 3. ThestockItem from Step 6 is passed as a parameter.
8. To remove the item from stock, the PickStockController calls the removeItem() operationof the Warehouse passing stockItem as a parameter.
Statechart DiagramThe inclusion of Order as an object in state in the original activity diagram hints at the fact that this willbe a state-full class. We could have included the object multiple times on that diagram to show the statechanges of an Order that result from the various activities, but for clarity we didn't.
Review of UML
19
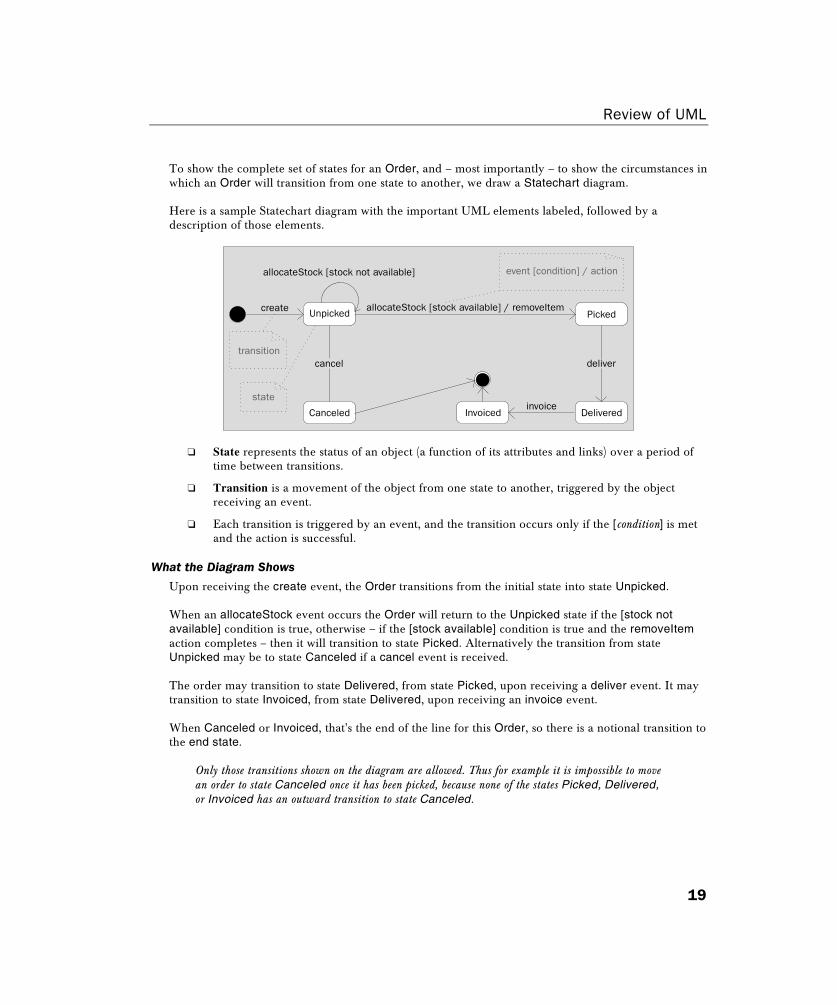
To show the complete set of states for an Order, and – most importantly – to show the circumstances inwhich an Order will transition from one state to another, we draw a Statechart diagram.
Here is a sample Statechart diagram with the important UML elements labeled, followed by adescription of those elements.
create
allocateStock [stock not available]
Unpicked
Canceled Invoicedinvoice
Delivered
PickedallocateStock [stock available] / removeItem
cancel delivertransition
event [condition] / action
state
❑ State represents the status of an object (a function of its attributes and links) over a period oftime between transitions.
❑ Transition is a movement of the object from one state to another, triggered by the objectreceiving an event.
❑ Each transition is triggered by an event, and the transition occurs only if the [condition] is metand the action is successful.
What the Diagram Shows
Upon receiving the create event, the Order transitions from the initial state into state Unpicked.
When an allocateStock event occurs the Order will return to the Unpicked state if the [stock notavailable] condition is true, otherwise – if the [stock available] condition is true and the removeItemaction completes – then it will transition to state Picked. Alternatively the transition from stateUnpicked may be to state Canceled if a cancel event is received.
The order may transition to state Delivered, from state Picked, upon receiving a deliver event. It maytransition to state Invoiced, from state Delivered, upon receiving an invoice event.
When Canceled or Invoiced, that's the end of the line for this Order, so there is a notional transition tothe end state.
Only those transitions shown on the diagram are allowed. Thus for example it is impossible to movean order to state Canceled once it has been picked, because none of the states Picked, Delivered,or Invoiced has an outward transition to state Canceled.
Chapter 1
20
Static Structure DiagramThe sequence diagrams, collaboration diagrams, and statechart diagrams that we've encountered in theprevious two sections are termed dynamic diagrams. They represent the dynamic model, which is themodel showing how our system will behave over time.
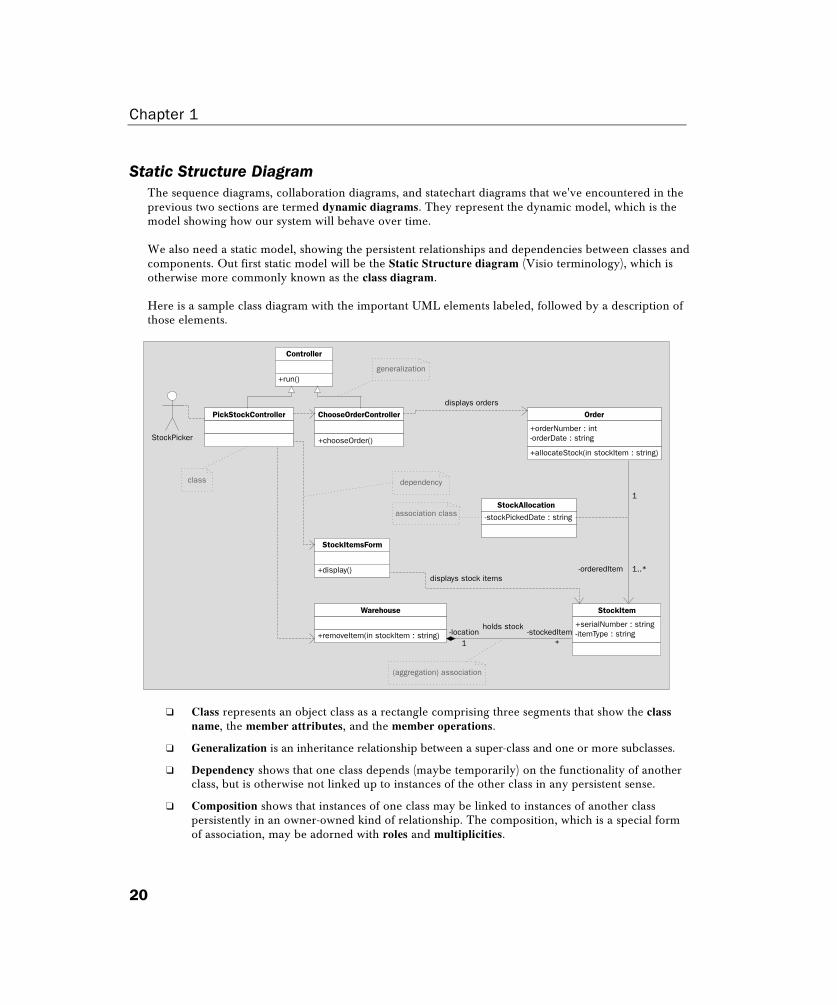
We also need a static model, showing the persistent relationships and dependencies between classes andcomponents. Out first static model will be the Static Structure diagram (Visio terminology), which isotherwise more commonly known as the class diagram.
Here is a sample class diagram with the important UML elements labeled, followed by a description ofthose elements.
StockPicker
class
association class
(aggregation) association
dependency
PickStockController ChooseOrderController
+chooseOrder()
displays orders
Order
+orderNumber : int-orderDate : string
+allocateStock(in stockItem : string)
1
1..*-orderedItem
-stockedItem
displays stock items
holds stock-location
Warehouse
+removeItem(in stockItem : string)
StockItemsForm
+display()
StockAllocation
-stockPickedDate : string
StockItem
+serialNumber : string-itemType : string
1 *
Controller
+run()generalization
❑ Class represents an object class as a rectangle comprising three segments that show the classname, the member attributes, and the member operations.
❑ Generalization is an inheritance relationship between a super-class and one or more subclasses.
❑ Dependency shows that one class depends (maybe temporarily) on the functionality of anotherclass, but is otherwise not linked up to instances of the other class in any persistent sense.
❑ Composition shows that instances of one class may be linked to instances of another classpersistently in an owner-owned kind of relationship. The composition, which is a special formof association, may be adorned with roles and multiplicities.
Review of UML
21
❑ Association is a more general form of linkage between class instances, which does not implyan owner-owned relationship. The association may be adorned with an association class,instances of which occur only for each link between the two associated classes.
What the Diagram Shows
PickStockController and ChooseOrderController are specializations of a generalized class calledController. In our design, all controller classes will be subclasses of the Controller super-class.
The PickStockController class depends on the ChooseOrderClass class, the StockItemsForm class, andthe Warehouse class. Look back at the sample sequence diagram to see how the PickStockControllercalls operations of those other classes.
The ChooseOrderController depends on the Order class by virtue of the fact that it displays orders.
A Warehouse instance owns aggregate StockItem instances according to the following aggregation:
1 (multiplicity) Warehouse (class) location (role) holds stock (association name) of * (many multiplicity)stockedItem (role) StockItems (class).
Each Order instance is associated with one or more (1..*) StockItems, with linked stock items taking therole of orderedItem. For each such link there arises a StockAllocation instance that holds the date thatthe stock was picked and allocated.
The static structure diagram (class diagram) shown here as an example does not contain the completeset of classes for the entire application, but rather those classes that are relevant to the Pick Stock usecase. As such, it represents View of Participating Classes (VOPC) for that use case.
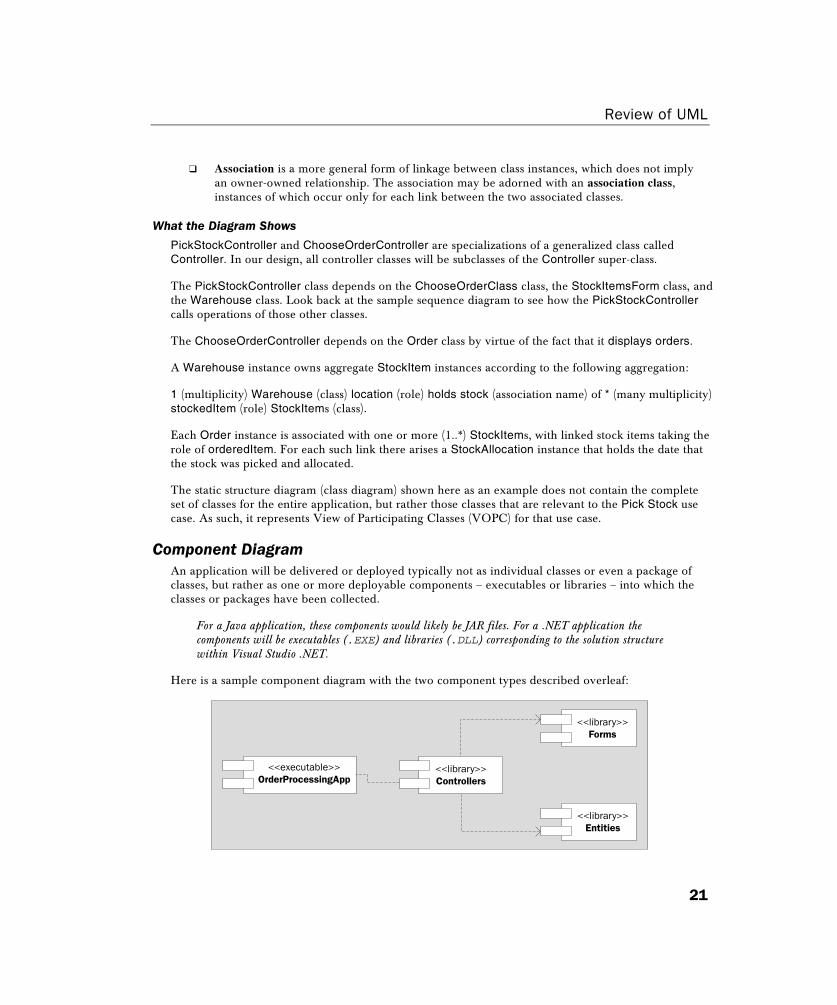
Component DiagramAn application will be delivered or deployed typically not as individual classes or even a package ofclasses, but rather as one or more deployable components – executables or libraries – into which theclasses or packages have been collected.
For a Java application, these components would likely be JAR files. For a .NET application thecomponents will be executables (.EXE) and libraries (.DLL) corresponding to the solution structurewithin Visual Studio .NET.
Here is a sample component diagram with the two component types described overleaf:
<<executable>>OrderProcessingApp
<<library>>Controllers
<<library>>Forms
<<library>>Entities

Chapter 1
22
❑ <<executable>> represents a .EXE file, a program that you would actually run.
❑ <<library>> represents a .DLL file, a collection of classes that you might reference in a project.
The component diagram is a static diagram, just like the class diagram, because it shows how theapplication is organized rather than how it will behave over time.
What the Diagram Shows
Our application will comprise a main executable program, the OrderProcessingApp deployed as fileOrderProcessingApp.exe. This program will depend on a library of control classes deployed as fileControllers.dll, which in turn will depend on two more component libraries: Forms.dll andEntities.dll.
We've hinted at the fact that components represent deployable collections of classes. For this example,the mapping of classes onto the <<library>> components will be:
❑ The Controllers <<library>> component realizes classes PickStockController andChooseOrderController.
❑ The Forms <<library>> component realizes the StockItemsForm class.
❑ The Entities <<library>> component realizes classes Order, Warehouse, StockAllocationand StockItem.
Note that this is just one way in which classes may be mapped on to components, in this case accordingto the types of each class: form, control, or entity. You might instead decide to package classes ontocomponents according to application subsystems, for example StockControl.dll (containing forms,controls, and entities relating to stock control functionality) and OrderHandling.dll (containing forms,controls, and entities relating to order handling functionality).
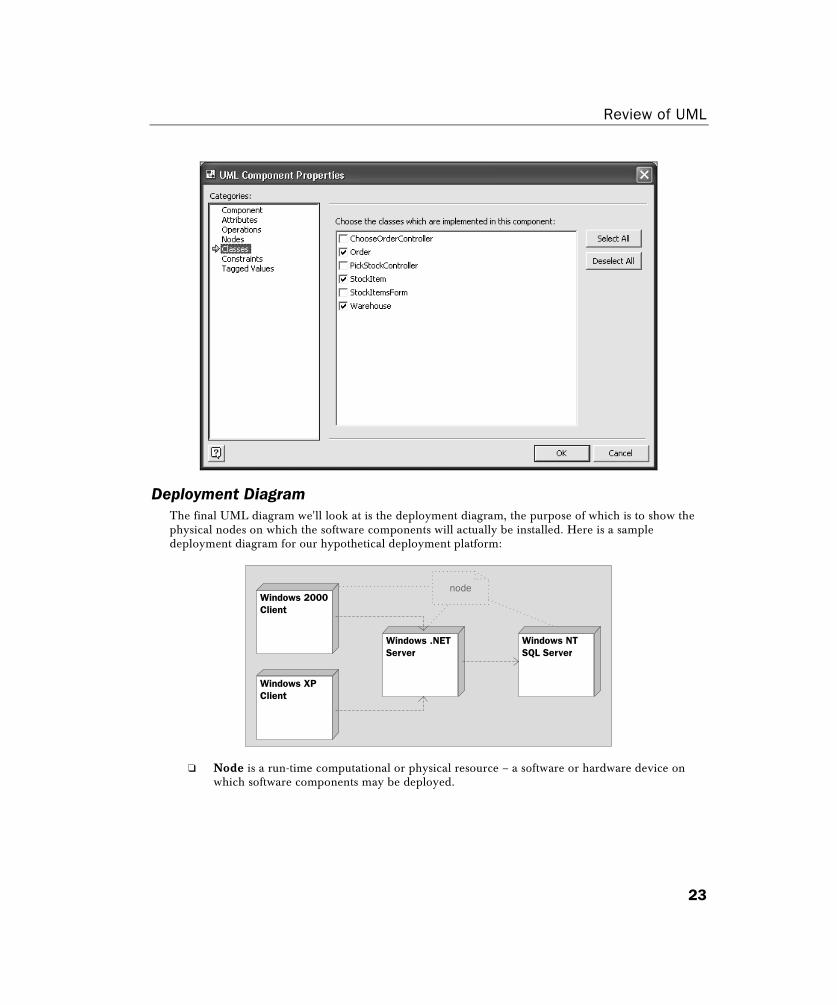
Visio for Enterprise Architects note – although you can't see in this diagram theclasses that are mapped to each component, you can double-click any component inVisio EA to view and set the list of mapped classes as shown in the following figure.
Review of UML
23
Deployment DiagramThe final UML diagram we'll look at is the deployment diagram, the purpose of which is to show thephysical nodes on which the software components will actually be installed. Here is a sampledeployment diagram for our hypothetical deployment platform:
Windows 2000Client
Windows XPClient
Windows NTSQL Server
Windows .NETServer
node
❑ Node is a run-time computational or physical resource – a software or hardware device onwhich software components may be deployed.

Chapter 1
24
What the diagram shows
Our deployment platform will comprise a backend Windows NT server running a SQL Server database,with the Entities.dll component deployed to this node. There will also be a Windows .NETapplication server that services Windows 2000 and Windows XP clients.
Whether the Forms.dll component and the Controllers.dll component are deployed on theWindows .NET Server or on the clients themselves will depend on our choice of a thin- or fat-clientarchitecture. For the sake of argument, we'll assume these components to be deployed to the Windows.NET Server. In either case, we'll deploy the main OrderProcessingApp.exe executable programdirectly on the client nodes.
Visio for Enterprise Architects note – although you can't see in this diagram thecomponents that are deployed to each node, you can double-click any node in Visio EAto view and set the list of deployed components as shown in the following figure.
Fitting the Pieces into the UML JigsawAs stated earlier, the problem with many UML books and training courses is that they often present thevarious diagram types in isolation. To make things worse, the examples are often disjointed and notrelevant to any system that you're ever likely to build: a vehicle gearbox as the state diagram example, atelephone handset as the sequence diagram example, an insect classification for the class diagram. All ofwhich leaves you wondering about the relevance of these modeling techniques and the relationshipsbetween the various techniques.
To address the issues of relevance and consistency of examples you will notice that all of the diagramsin the previous section relate to a common application, the order processing application, which is onethat should be familiar to you, whatever your background.
Review of UML
25
Now, what of the relationships between the diagrams that we've alluded to? Well, each diagram shows adifferent aspect of the same application design so they should be taken, not individually in isolation, but asa consistent whole. The word consistent in that sentence is important because you affect the correctnessand completeness of your design significantly by ensuring consistency between the diagrams.
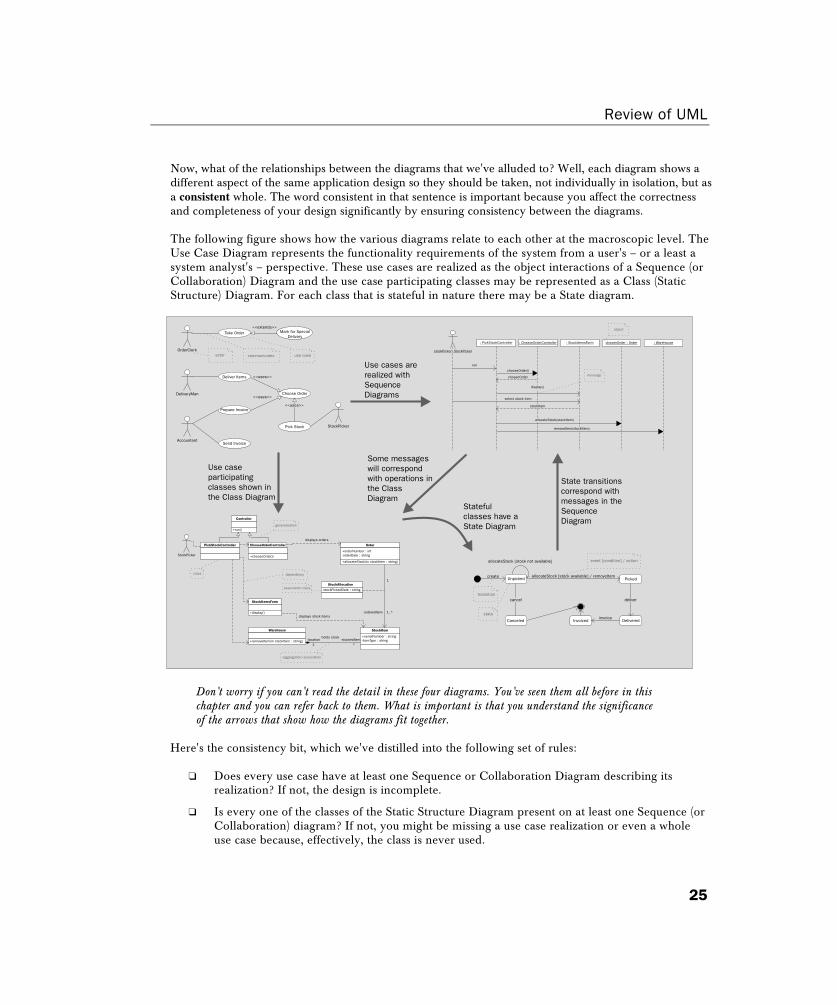
The following figure shows how the various diagrams relate to each other at the macroscopic level. TheUse Case Diagram represents the functionality requirements of the system from a user's – or a least asystem analyst's – perspective. These use cases are realized as the object interactions of a Sequence (orCollaboration) Diagram and the use case participating classes may be represented as a Class (StaticStructure) Diagram. For each class that is stateful in nature there may be a State diagram.
Take Order<<extends>>
Mark for SpecialDelivary
OrderClerk
DeliveryMan
Accountant
Deliver Items
Prepare Invoice
Send Invoice
<<uses>>
<<uses>>Choose Order
Pick Stock StockPicker
<<uses>>
actor use casecommunicatesstockPicker StockPicker
: PickStockController : ChooseOrderController : StockItemsForm chosenOrder : Order : Warehouse
run
chooseOrder()
chosenOrder
display()
select stock item
allocateStock(stockItem)
removeItem(stockItem)
message
object
stockItem
StockPicker
class
association class
(aggregation) association
dependency
PickStockController ChooseOrderController
+chooseOrde()r
displays orders
Order
+orderNumber : int-orderDate : string
+allocateStock(in stockItem : string)
1
1..*-orderedItem
-stockedItem
displays stock items
holds stock-location
Warehouse
+removeItem(in stockItem : string)
StockItemsForm
+display()
StockAllocation
-stockPickedDate : string
StockItem
+serialNumber : string-itemType : string
1 *
Controller
+run()generalization
create
allocateStock [stock not available]
Unpicked
Canceled Invoicedinvoice
Delivered
PickedallocateStock [stock available] / removeItem
cancel delivertransition
event [condition] / action
state
Use cases arerealized withSequenceDiagrams
Use caseparticipatingclasses shown inthe Class Diagram
Some messageswill correspondwith operations inthe ClassDiagram
Statefulclasses have aState Diagram
State transitionscorrespond withmessages in theSequenceDiagram
Don't worry if you can't read the detail in these four diagrams. You've seen them all before in thischapter and you can refer back to them. What is important is that you understand the significanceof the arrows that show how the diagrams fit together.
Here's the consistency bit, which we've distilled into the following set of rules:
❑ Does every use case have at least one Sequence or Collaboration Diagram describing itsrealization? If not, the design is incomplete.
❑ Is every one of the classes of the Static Structure Diagram present on at least one Sequence (orCollaboration) diagram? If not, you might be missing a use case realization or even a wholeuse case because, effectively, the class is never used.
Chapter 1
26
❑ For all stateful classes is there a corresponding Statechart Diagram? If not, the rules forallowable state changes will be ambiguous or unknown.
❑ For each event in a Statechart Diagram is there a corresponding message in a SequenceDiagram that provides a context in which the event actually occurs? If not, the state transitionmay never occur.
Depending on your approach to analysis and design, and the kind of application you're developing,those rules may be more or less important and you're unlikely ever to achieve 100% mutual consistency.So treat them not as revealed truth but as rules of thumb – I've found that they've certainly served mewell in my development work.
The fact that the previous figure has arrows emitting from the Use Case Diagram – with none going in –suggests that as the starting point. That's true unless you draw some activity diagrams up-front, and itmakes perfect sense to start with the diagram that represents the functional requirements doesn't it?However, the diagram to start with is not really a question of UML but a question of process.
We'll conclude this chapter by looking at the process side of things, just after a brief mention of the toolsthat support the modeling effort.
UML Modeling ToolsIt's doubtful that anyone would be working with UML these days without the aid of a modeling tool,because these tools are to software design what a word processor is to writing.
In creating a chapter like this one, few authors would ever dream of writing out the words long-handwith pencil and paper. How would they delete unwanted paragraphs, rephrase sentences and insert thepictures without making the first draft a complete mess? – and how time-consuming would it be to writeit all out again for the final draft?
Now make the analogy with UML diagrams and a modeling tool. How would you add an operation to aclass on a static structure diagram, or change the order of events in a collaboration diagram, or change arelationship between an actor and a use case in a use case diagram without a significant amountof redrawing?
At this point, the following question might occur to you:
"OK, but we could just use a good drawing package to solve those problems. They're onlydiagrams, right?"
Wrong! The whole point about a modeling tool is that besides allowing you to draw the diagrams, itactually understands the model you're creating. It knows that a line between two classes is anassociation or aggregation so an instance of one class must be linked to an instance of another class,perhaps via a member variable. It's this understanding of the model that allows the modeling tool toprovide added value to your software development effort through code generation, documentationproduction, and model semantic checking.
Before the arrival of Visual Studio .NET on the software development scene, your choice of modelingtool would most likely have been one of Rational Rose, Select Enterprise, or Together Control Center –none of which cater specifically for UML in the context of .NET. The main contenders in the .NETmodeling space are Rational XDE and Visio for Enterprise Architects.

Review of UML
27
Rational XDE has the Rational pedigree, some impressive .NET-related features, and tight integrationwith Visual Studio .NET; so it's well worth a look if you're from a Rational tools background. The mainproblem is that you may have to shell out on an expensive license on top of what you've already paidfor Visual Studio .NET, and – on that subject – it actually won't run without the IDE.
Visio for Enterprise Architects comes bundled with the Visual Studio .NET (Enterprise Architectversion) and/or an MSDN Universal Subscription, so you may already have it at no extra cost. Itsupports UML notation as well as the back-catalogue of other Visio diagram types. Code generation,reverse engineering, model semantic checking, and document production are supported, plusintegration with the Visual Studio .NET IDE. All of which make this not just a drawing tool, or – moreaccurately – no longer just a drawing tool.
Process EssentialsUML is a notation not a process, but invariably you will use UML in the context of a softwaredevelopment process; so which one to choose?
As indicated already, you are not compelled to use any particular process. You could adopt a pureRapid Application Development (RAD) approach, or join the growing band of practitioners adopting theeXtreme Programming approach. Just a few years ago you might have been tempted by the SelectPerspective method, which was – and still is – biased towards component-based development and basedon an iterative-incremental approach. In all cases there would be nothing to stop you using UML as theanalysis and design notation.
To round off this chapter we'll focus in on two processes in particular, the (Rational) Unified Processand the Microsoft Solutions Framework; the former because has been devised by the authors of UMLas the preferred partner process, and the latter because in this book we're interested in designingsoftware for the Microsoft environment.
(Rational) Unified ProcessThe Unified Process has its roots in the Objectory method devised originally by Ivar Jacobson. Itrepresents the unification of the process ideas of the three amigos, thus it is complementary to the UnifiedModeling Language and is marketed by Rational Software as the Rational Unified Process (RUP).
In practical terms what you get when you purchase this product is a set of HTML pages describing theprocess, its roles, activities, and artifacts, along with a set of Microsoft Word templates that provide astarting point for those artifacts – not to mention a great deal of encouragement to buy the Rational Suite.
Three of the essential points of this process are that it is:
❑ Use-case driven – this ensures that the system we build will actually meet the requirements ofthe business.
❑ Architecture-centric – so we won't complete the analysis under the blind assumption that wecan build the application on our chosen technical platform. Early on we'll do sometechnical prototyping.
Chapter 1
28
❑ Risk managed – with an emphasis on tackling the tricky parts of the system – thearchitecturally significant use cases – at the beginning rather than at the end to reduce thelikelihood of nasty surprises later on.
The fact that the process is use-case driven suggests that we start with the use case diagram(s). That'strue to an extent, but not the whole story. We've already suggested that activity diagrams may add valueearly on by describing the workflow of the business, in essence the ordering of the use cases. There's alot to be gained by producing a static structure diagram (class diagram) of fundamental business entitiesup front, to be called the domain model.
The point is that although the various diagrams will each have a lesser, or greater, impact as we movethrough various stages of the process, we won't simply be stepping through the diagrams in waterfall fashion.Rather, we'll analyze, design, and build the software as a series of increments via a set of iterations.
Within each iteration, any combination of diagrams may be valuable, those diagrams becoming moredetailed as we go along. However, it goes without saying that as we approach implementation we'll havemuch greater need for component diagrams than for use case diagrams!
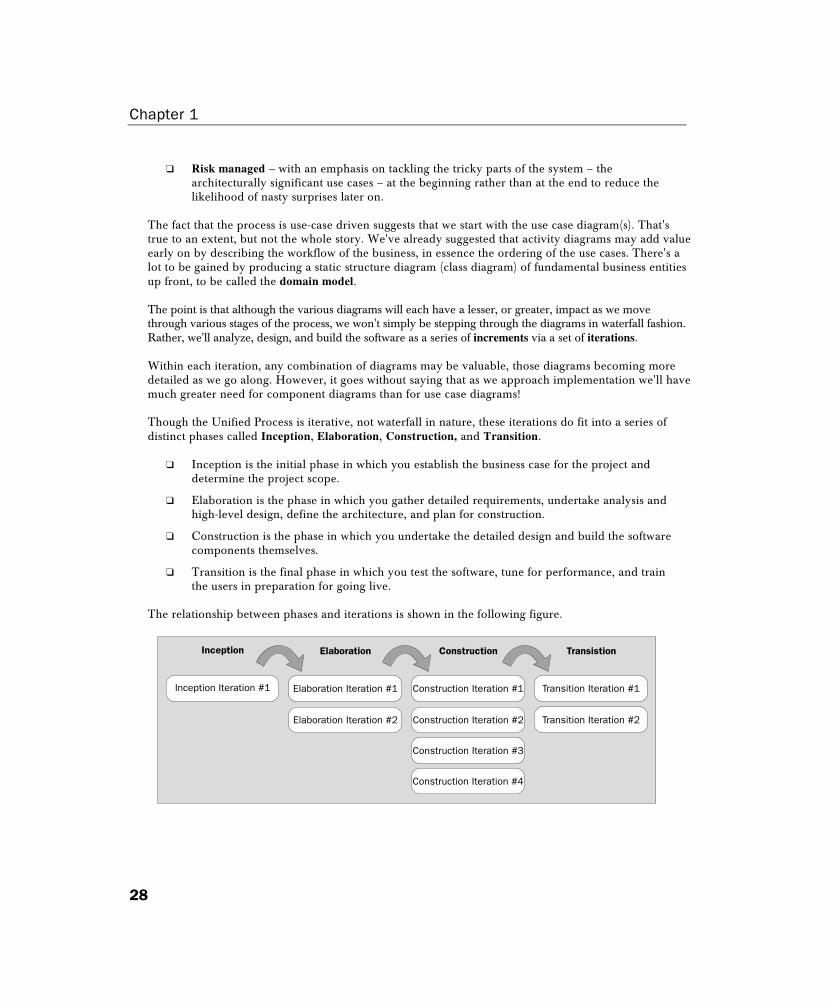
Though the Unified Process is iterative, not waterfall in nature, these iterations do fit into a series ofdistinct phases called Inception, Elaboration, Construction, and Transition.
❑ Inception is the initial phase in which you establish the business case for the project anddetermine the project scope.
❑ Elaboration is the phase in which you gather detailed requirements, undertake analysis andhigh-level design, define the architecture, and plan for construction.
❑ Construction is the phase in which you undertake the detailed design and build the softwarecomponents themselves.
❑ Transition is the final phase in which you test the software, tune for performance, and trainthe users in preparation for going live.
The relationship between phases and iterations is shown in the following figure.
Elaboration Construction TransistionInception
Inception Iteration #1 Elaboration Iteration #1
Elaboration Iteration #2
Construction Iteration #1
Construction Iteration #2
Construction Iteration #3
Construction Iteration #4
Transition Iteration #1
Transition Iteration #2
Review of UML
29
RUP .NET Developer's ConfigurationSince we're dealing specifically with .NET application design in this book it's worth mentioning that theRational Software web site (http://www.rational.com/products/rup/sample.jsp) describes a variant of theRational Unified Process called RNDC, which is defined as the following:
"The RUP .NET Developers' Configuration (RNDC) is a straightforward, lightweight processconfiguration of the Rational Unified Process® that has been specifically customized to address theneeds of the .NET software developer."
There are two important aspects here.
Firstly, it's a customization of the Rational Unified Process specifically for the .NET developmentenvironment. Historically RUP has been biased towards Java software development and tools, with.NET now presenting some new technical challenges – and marketing opportunities – for customizedversion of the process.
Secondly, it's aimed specifically at software developers rather than all the team members defined byRUP. Presumably, no customization was required for technology-independent business analysts, but thisalso seems to reflect Rational's positioning of UML in the context of .NET. Experimentation with thenew Rational XDE UML modeling tool shows this to be much more of a developer tool than RationalRose ever was.
At the URL listed above is the RNDC roadmap, which provides a somewhat disappointing overview ofthe customized process. Under the headings Requirements Activities and Analysis Activities it simplystates the following, which is at least consistent with the presumption that certain aspects of the processrequire no customization:
"Requirements activities are technology independent."
"Analysis activities are technology independent."
Under the heading Define an Initial Architecture, the reader is encouraged to use the .NET Framework– in particular Enterprise Templates – "to create reusable reference architecture templates for .NET applicationsthat can be tailored to support a certain application structure or a specific application domain"
Finally, the RNDC roadmap references several concepts and guidelines such as "Concepts: Microsoft .NETArchitectural Mechanisms" and "Guidelines: Partitioning Strategies in Microsoft .NET". Unfortunately theseadditional references are not hyperlinked in the RNDC, which renders it not too useful in itself. For acomplete picture – with hyperlinks to all the required content – we need to look into the RUP .NET Plug-in.
RUP .NET Plug-inThe vanilla Rational Unified Process may be enhanced by applying various plug-ins for:
❑ Compatibility with alternative approaches, such as eXtreme Programming
❑ Technologies such as IBM Websphere and, of course, .NET
You can find general information about the .NET Plug-in at URLhttp://www.rational.com/tryit/rup/seeit.jsp and, more usefully, you can step through a slide-showpresentation at URL http://www.rational.com/demos/viewlets/rup/msnet/MSNET_Tour_viewlet.html.
Chapter 1
30
In that presentation you will see that this plug-in contains detailed information in the form of workflows,roadmaps, guidelines, and links to relevant information on the Microsoft Developer Network (MSDN)and Rational Developer Connection web sites.
Microsoft Solutions FrameworkThe Microsoft Solutions Framework (MSF) is a process-methodology for development in a Microsoftenvironment. In effect, we can view MSF to be a potential substitute for the Rational Unified Process,perhaps one that is more relevant to the Microsoft tools we'll be working with.
A Framework not a ProcessWe've referred to the MSF as a process, to justify a comparison with RUP. In fact, it's a frameworkincorporating a Process Model (the process), a Team Model, and a Risk Management Model. Let's startwith the process model.
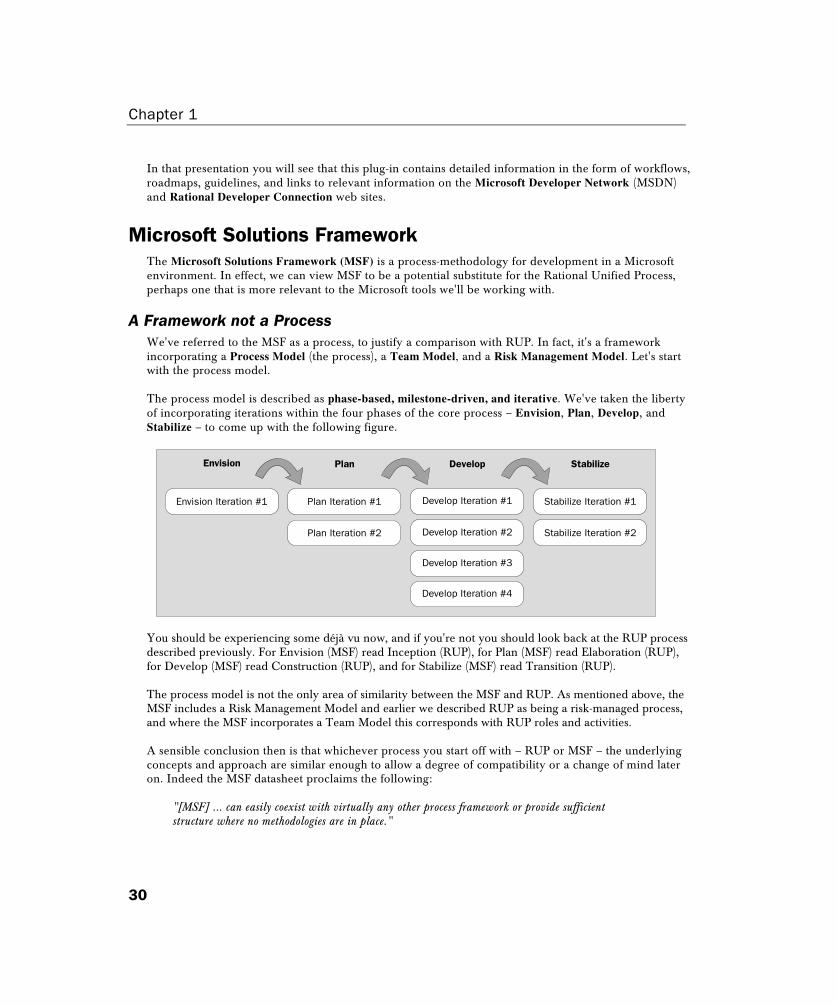
The process model is described as phase-based, milestone-driven, and iterative. We've taken the libertyof incorporating iterations within the four phases of the core process – Envision, Plan, Develop, andStabilize – to come up with the following figure.
Plan Develop StabilizeEnvision
Envision Iteration #1 Plan Iteration #1
Plan Iteration #2
Develop Iteration #1
Develop Iteration #2
Develop Iteration #3
Develop Iteration #4
Stabilize Iteration #1
Stabilize Iteration #2
You should be experiencing some déjà vu now, and if you're not you should look back at the RUP processdescribed previously. For Envision (MSF) read Inception (RUP), for Plan (MSF) read Elaboration (RUP),for Develop (MSF) read Construction (RUP), and for Stabilize (MSF) read Transition (RUP).
The process model is not the only area of similarity between the MSF and RUP. As mentioned above, theMSF includes a Risk Management Model and earlier we described RUP as being a risk-managed process,and where the MSF incorporates a Team Model this corresponds with RUP roles and activities.
A sensible conclusion then is that whichever process you start off with – RUP or MSF – the underlyingconcepts and approach are similar enough to allow a degree of compatibility or a change of mind lateron. Indeed the MSF datasheet proclaims the following:
"[MSF] ... can easily coexist with virtually any other process framework or provide sufficientstructure where no methodologies are in place."

Review of UML
31
SummaryIn this chapter we've introduced the Unified Modeling Language in terms of what it is (an analysis /design notation) and what it is not (a software development process). We said that the notationrepresents a synthesis of three predecessor methods – Object Modeling Technique (OMT), the BoochMethod, and Object-Oriented Software Engineering (OOSE) – with contributions from some others.
In terms of why you might use UML at all, we offer four main reasons:
❑ Establishing a blueprint from the application
❑ Estimating and planning the time and materials
❑ Communicating between teams, and within the team
❑ Documenting the project
The remainder of the chapter was divided into two main sections, End-to-End UML Modeling dealingwith the UML notation and Process Essentials dealing with the companion process(es). Let's now reviewthe modeling and process sections.
Modeling SummaryIn this section, we looked at seven UML diagram types:
❑ Activity diagrams
❑ Use Case diagrams
❑ Sequence diagrams
❑ Collaboration diagrams
❑ Statechart diagrams
❑ Component diagrams
❑ Deployment diagrams
Each kind of diagram was annotated with the UML metatypes such as actor, use case, class,dependency, association, and so on.
Each diagram represented a different view of exactly the same application, so that you could relate thediagrams to each other with the help of the What this diagram shows sections. We consider therelationships between the diagrams to be so important – and all too often ignored – that we placedfurther emphasis on this point in the Fitting the Pieces into the UML Jigsaw section.
Finally, we suggested that you will almost certainly be doing UML modeling with a dedicated modelingtool, and that doesn't just mean a good drawing tool. Visio for Enterprise Architects represents such amodeling tool, no longer just a drawing tool, that we set out as the preferred tool on which the rest ofthis book has been based.

Chapter 1
32
In the main, Visio terminology has been used in this chapter so as to avoid confusion when you come touse the tool. Other modeling tools may use slightly different terminology and, in fact, the UML termsthemselves have changed slightly over the years. To help with the transition to – or from – other booksand tools, here is a summary of this chapter's Visio UML terms and the alternative terminology that youmay encounter:
Visio Terminology Other Terminologies
Static Structure Diagram Class Diagram
Package Category
<<uses>> <<import>>
State Activity (on Activity Diagram), State (on Statechart)
Statechart Diagram State Transition Diagram
Transition (fork) Synchronization (start)
Transition (join) Synchronization (end)
Process SummaryAs to which software development process you should adopt, two were picked out two for discussion.The Unified Process, because it's the natural companion for the Unified Modeling Language, and theMicrosoft Solutions Framework, because it's the Microsoft process offering. What these have incommon with each other – and with other good object oriented software processes, such as the SelectPerspective – is that they are:
❑ Iterative and incremental
❑ Use-case driven
❑ Focused on Risk Management
You also have a choice of eXtreme Programming, traditional waterfall, or RAD, and as the UMLnotation is independent of the process, ultimately the choice is yours.
In the next chapter, to complete our foundations for working with Visio for Enterprise Architects, we'lltake a tour of the Visio environment and look at some of the available diagram features relevant to thesoftware developer.

Review of UML
33