Embed Size (px)
Citation preview

REVIEW OF UNM COLLEGE OF ARTS AND SCIENCES OPERATIONS
THE UNIVERSITY OF NEW MEXICO
Report 2013-01 February 13, 2013
Audit Committee Members J.E. “Gene” Gallegos, Chair
Lt. General Bradley Hosmer, Vice Chair James Koch
Audit Staff
Manilal Patel, Audit Director Chien-Chih Yeh, Internal Audit Manager
Lisa Wauneka, IT Auditor Victor Griego, Internal Auditor II
Victoria Gorman, Internal Audit Student Intern

_____________________________________________________________________________ CONTENTS
EXECUTIVE SUMMARY .......................................................................................................... 1
CONCLUSION ......................................................................................................................... 5
INTRODUCTION......................................................................................................................... 7
BACKGROUND ...................................................................................................................... 7
PURPOSE ................................................................................................................................. 7
SCOPE ...................................................................................................................................... 8
OBSERVATIONS, RECOMMENDATIONS AND RESPONSES .......................................... 9
FINANCIAL ANALYSIS ........................................................................................................ 9
RESERVES............................................................................................................................. 15
BUDGET ANALYSIS............................................................................................................ 19
FACULTY WORKLOAD ...................................................................................................... 20
STUDENT ACADEMIC PROGRESS ................................................................................... 25
APPROVALS .............................................................................................................................. 29
ABBREVIATIONS College College of Arts and Sciences C&G Contracts and Grants F&A Facilities and Administration HED Higher Education Department IDC Indirect Cost Recovery ITV Interactive Television FY Fiscal Year I&G Instructional and General Internal Audit University of New Mexico Internal Audit Department MTS Media Technology Services PBB Performance Based Budgeting RCM Responsibility Center Management STEM Science, Technology, Engineering, and Math T/TTL Tenure/Tenure-Track and Lecturer Faculty Members University The University of New Mexico UNM The University of New Mexico

February 13, 2013 Review of UNM College of Arts and Sciences Operations Page 1 Report 2013-01
_____________________________________________________________________________ EXECUTIVE SUMMARY During fiscal year (FY) 2012, the College of Arts and Sciences (College) hired 85 new faculty members to fill empty and vacated faculty positions. The new members included 59 tenure and tenure-track faculty, along with 26 full-time lecturers. The University of New Mexico’s (University) President requested a review of the College’s financial operations to determine if the College’s revenues are sufficient to support its expenses with the addition of new faculty lines. In addition, the University President and the University of New Mexico (UNM) Audit Committee requested that the UNM Internal Audit Department (Internal Audit) complete a performance review of the College regarding use of reserves, faculty workload, student academic progress, and hiring methodology. In addition to the College as a whole, Internal Audit also selected seven of the College’s departments to complete a financial and operational review for FY 2012, including Biology, Physics and Astronomy, Earth and Planetary Sciences, Mathematics and Statistics, Chemistry, English, and the Dean’s Administrative Department. FINANCIAL ANALYSIS The College is primarily funded by Contracts and Grants (C&Gs) and Instruction and General (I&G) funds. Internal Audit compiled financial information, including revenues by funding sources and related expenses for the College. Internal Audit completed a high-level trend analysis for the College for FYs 2010-2012. Revenues exceeded expenditures for each year during the three-year period. Internal Audit also completed a detailed financial analysis of revenues and expenses for the College and selected departments for FY 2012. Revenues and expenses were reviewed to determine if the College and its selected departments have adequate funding to meet their annual expenditures. During FY 2012, the College’s revenues of $113,057,096 exceeded their expenses of $107,401,881, resulting in net income of $5,655,215. Exhibits 1 through 8 show that revenues exceeded expenses for the College and each of the departments included in our financial analysis, except for Earth and Planetary Sciences, which had a slight loss of $43,088. During 2012, the College experienced significant growth in Extended University revenues. Additional base funding of approximately $6.9 million from Extended University revenues is expected to contribute significant funding to support a potential increase in future expenditures due to the hiring of new faculty lines. Start-up packages for new STEM faculty are primarily funded with Facilities and Administration (F&A) revenue generated through federal contracts and grants. Potential declines in federal funding for research could result in challenges for the College in the form of start-up packages related to future new STEM faculty hiring. In addition, the College faces challenges related to financing unbudgeted part-time instruction. Although progress has been made in reducing the amount of unbudgeted expenditures for part-time instruction, the College may pay up to $1.5 million for unbudgeted part-time instruction through FY 2014.

_____________________________________________________________________________________________________________________ EXECUTIVE SUMMARY
February 13, 2013 Review of UNM College of Arts and Sciences Operations Page 2
Report 2013-01
RESERVES ANALYSIS Reserves represent unrestricted carry-over funds available for spending at the beginning of the fiscal year. Internal Audit compiled reserve information for the College and selected departments. Internal Audit then completed a trend analysis of the College’s reserve balances by unrestricted funding source for FYs 2009-2012. Reserve balances have increased from $11.8 million in FY 2009 to $20.1 million in FY 2012. At the end of FY 2012, I&G and Research have accumulated the largest reserve balances at $8.3 million and $6.4 million, respectively. At the beginning of each fiscal year, departments commit or dedicate portions of reserve balances for specific purposes. Reservations must be accurately recorded and supported by appropriate documentation. Internal Audit completed detailed test work for Biology, Physics and Astronomy, Earth and Planetary Sciences, Mathematics and Statistics, Chemistry, English, and the Dean’s Administrative Department to ensure reserve balances are recorded in the proper category. Internal Audit noted findings for four of the seven departments selected for reserves test work including Biology, Earth and Planetary Sciences, Chemistry, and the Dean’s Administrative Department regarding non-compliance with supporting documentation for FY 2013 reserve designation amounts. The supporting documentation for eleven out of thirty-five reserves tested did not indicate a clear and direct correlation for committed and/or dedicated reserve designations as required by the University’s reserve policies. Although, the record keeping and supporting documentation policy for categorizing reserves was not consistently followed. However, the new leadership at the College of Arts and Sciences and the Provost is commended for effectively utilizing these reserves to rebuild the Arts and Sciences faculty and research capabilities to enhance academic mission of the College and University.
BUDGET ANALYSIS Internal Audit obtained an understanding of the College’s budget process and performed an analysis on budgeted unrestricted and restricted funds. Budgeted unrestricted funds, which primarily consist of I&G funding, are prepared by the Provost’s office, and approved by the UNM Board of Regents on an annual basis. Budgeted restricted funds are primarily from federal and non-federal contracts and grants. An annual budget for each contract and grant is prepared and monitored by the University’s Contracts and Grants department. The College practices the University’s budget process for preparing and adjusting its annual budget. The University is in the process of implementing the Responsibility Center Management (RCM) and Performance Based Budgeting (PBB) budget model. The RCM budget model is a decentralized approach to budgeting that assigns greater control over resource allocation decisions to the Deans of colleges and schools. RCM gives a college, faculty, or department control over the income that it generates and the expenses that it incurs, including indirect and overhead costs. PBB is the process by which decisions are made as to which parts of an

_____________________________________________________________________________________________________________________ EXECUTIVE SUMMARY
February 13, 2013 Review of UNM College of Arts and Sciences Operations Page 3
Report 2013-01
organization are to be grown, maintained, and eliminated. It uses performance metrics as the basis for funding decisions. FACULTY WORKLOAD AND NEW HIRING ANALYSIS UNM full-time tenure and tenure-track faculty workload consists of three components, including Instructional, Research, and Public Service. Informal guidelines exist that allocate each type of workload at 40% Instructional, 40% Research, and 20% Public Service, but there is not a current method in place to formally track Research and Public Service activities. To meet the instructional obligations of the Colleges and its students, the University has policies for minimum academic load requirements for tenure and tenure-track faculty. Academic load requirements are met through a combination of instructional, research, and public service efforts. The typical academic load consists of 23 load units. This includes the sum of 9 instructional load units, 9 research load units, and 5 public service load units. Load units are based on a formula established by the Provost’s office. There is not currently a formal process in place to determine if teaching load requirements are met by tenure and tenure-track faculty members, since as mentioned previously the other components, research and public service activities, are not formally tracked. The University is in the process of developing methods that will provide the ability to effectively track both research and public service activities. The College has a significant amount of courses that are instructed by teaching assistants, part-time, and temporary faculty members. These non-tenure/ tenure-track and lecturer faculty members taught 51% of approximately 391,000 student credit hours during FY 2012. During FY 2012, the College initiated efforts to reduce its reliance on teaching assistants and part-time instructors, primarily by increasing the number of tenure/tenure-track and lecturer faculty (T/TTL). The College completed a hiring plan that included the hiring of 59 tenure and tenure-track faculty and 26 full-time lecturers. Internal Audit reviewed the placement of new hires by department to determine if the faculty members were hired for the departments and positions with the most need. Internal Audit also reviewed whether the additional salaries are fully funded with sufficient revenue sources, and will continue to be funded in the near future. The College appears to have appropriately hired new faculty members for each department and has the funding to cover the expenses of new faculty. COURSE UTILIZATION The College offers several courses with multiple sections available to its students. Internal Audit analyzed course utilization for each of the College’s departments for the fall 2011 and spring 2012 semesters. The College appears to be efficiently utilizing course capacity as determined by the Dean and Department Chairs. However, certain courses that did not appear to be efficiently utilized were primarily due to maximum enrollments being set significantly higher than actual enrollment needs.

_____________________________________________________________________________________________________________________ EXECUTIVE SUMMARY
February 13, 2013 Review of UNM College of Arts and Sciences Operations Page 4
Report 2013-01
STUDENT ACADEMIC PROGRESS Internal Audit compiled the number of degrees awarded by department for FYs 2010-2012. The College awards the most degrees compared to any other college or school in the University. Internal Audit performed an analysis to determine which departments awarded the most undergraduate and graduate level degrees. Psychology, Biology, and Sociology awarded the most undergraduate degrees; whereas Physics, Mathematics, and Anthropology awarded the most graduate degrees since FY 2010. The following schedule presents the number of degrees awarded by department.
Department Undergraduate Graduate Undergraduate Graduate Undergraduate GraduatePsychology 264 18 280 17 329 23Biology 220 14 235 14 230 11Sociology 159 6 170 6 171 7Communication Journalism 135 20 158 11 143 16English 101 18 109 24 115 20Political Science 97 5 124 6 84 9History 75 5 70 26 67 17Anthropology 66 24 60 18 71 30Spanish Portuguese 25 13 28 14 35 15Chemistry 52 10 55 11 64 8Economics 52 12 53 17 51 12Foreign Languages Literatures 26 7 22 12 38 11Philosophy 25 4 32 8 17 5Linguistics 29 5 30 7 24 6Interdisciplinary Courses 31 8 42 13 26 15Earth & Planetary Sciences 26 9 32 12 19 14Mathematics Statistics 21 27 33 21 38 24Speech & Hearing Sciences 22 14 22 16 26 13Religious Studies 9 - 8 - 7 -Physics Astronomy 11 33 11 32 18 28American Studies 9 4 3 8 8 12Geography 10 4 12 4 21 5Women Studies 1 0 1 2 1 2African American Studies - - 1 - 3 - Total Arts and Sciences 1,466 260 1,591 299 1,606 303Total University 3,096 1,533 3,350 1,693 3,403 1,777
Source: Office of Institutional Research
FY 2010 FY 2011 FY 2012
Despite tracking degrees awarded by department, academic progress related to retention and graduation rates for college students within the College and its departments is not reported. Tracking of retention and graduation rates is difficult to accomplish at the college and department level because students can enroll as undeclared/undecided or can switch majors and/or colleges over their academic career. This could result in students being counted in one college’s retention or graduation rate, but actually graduating from another. Although retention

_____________________________________________________________________________________________________________________ EXECUTIVE SUMMARY
February 13, 2013 Review of UNM College of Arts and Sciences Operations Page 5
Report 2013-01
and graduation rate data is available, there is not a current process that ties retention and graduation rate data to individual colleges or schools, and their related departments. The UNM Office of Institutional Research is currently developing metrics to capture applicable data, which will allow reporting of retention and graduation rates at both the college and department levels. CONCLUSION The College and its departments have sufficient funding to meet annual expenditures. With additional funding provided by Extended University revenues and unrestricted available reserves, funding also appears sufficient to meet a potential increase in future expenditures due to the hiring of new faculty members. The College operates in an effective and efficient manner. However, Internal Audit noted findings related to non-compliance with the University’s reserve policies and recommendations during the review. The following is a summary of recommendations made in the report. Recommendations
• The Dean should enforce UNM Reserve policies which require preparing and maintaining adequate supporting documentation for committed and dedicated reservations. Documentation should indicate the initial amount and purpose for which reserves are committed or dedicated. Committed reservations should include formal written communication, and dedicated amounts should have a statement of purpose from the individual dedicating the funds. This will ensure that every department is in compliance with the University’s policies related to reserve designations.
• The Provost should implement a process that enables colleges to effectively track and
monitor time that faculty members spend on research and public service activities. This will help management determine if faculty members are meeting teaching load requirements and workload guidelines.
• The Provost should carefully evaluate maximum enrollments to ensure maximum efficiency for all courses offered. Department Chairs should adjust maximum enrollment capacity to reflect actual student enrollment needs. A process could include a review of course schedules and class sizes from at least the past two years to determine which courses, if any, need adjustments to maximize enrollment size.
• The Provost should implement a process that provides the ability to capture and present
retention and graduation rates for colleges and schools, and their related departments. Such processes could include an electronic program that captures retention and graduation rate data based on the time period when students enroll and declare a major within a college or school through their graduation date. Retention and graduate rate data
_____________________________________________________________________________________________________________________ EXECUTIVE SUMMARY
February 13, 2013 Review of UNM College of Arts and Sciences Operations Page 6
Report 2013-01
could then be tied to each college or school, and be available for presentation and analysis. This process can be an important tool for tracking academic progress and success of students within each of the University’s colleges and schools and their departments.

February 13, 2013 Review of UNM College of Arts and Sciences Operations Page 7
Report 2013-01
________________________________________________________________________ INTRODUCTION BACKGROUND The College is the largest college at the University of New Mexico. The College’s goal is to provide the classic liberal arts education to its students in academic departments across humanities, social sciences, physical science, and mathematical sciences. The College offers almost the entire core curriculum and supports students enrolled in all other colleges including Anderson School of Management, School of Engineering, College of Fine Arts, etc. The College consists of 20 academic departments, which include 7 humanities, 5 sciences and mathematics, and 8 social sciences. The College offers 113 degree programs, including 56 undergraduate majors, 26 masters programs, 21 doctoral programs, and 10 interdisciplinary majors. The College significantly contributes to UNM’s reputation as a Carnegie Very High Research (Research 1) institution. Research grants awarded to the College support research laboratories, as well as equipment and training facilities for graduate students. Almost every faculty member undertakes research activities, whether funded by outside agencies, internally through UNM’s Research Allocations Committee, or as part of their regular responsibilities during the academic year. Public service is also a major commitment among the College’s departments and other sub-units. Faculty members contribute a significant amount of their efforts to enhance higher education through teacher education programs, student competitions, and other events within the community and outside the State of New Mexico. The College teaches more students than any other college or school within the University. For FY 2012, the College’s class enrollment was 134,080, and credit hours taught was 391,293. The College also graduates more students than any of the other University’s college or school. During 2012, the College awarded 1,909 undergraduate and graduate degrees. There were approximately 470 tenure/ tenure-track and lecturer faculty, and approximately 730 teaching assistants, graduate assistants, and part-time/temporary faculty members. PURPOSE During FY 2012, the College announced the hiring of 59 tenure/tenure-track faculty members, along with several full-time lecturers. Additional funding generated from Extended University classes taught by the College’s faculty made the hiring of new faculty lines possible. As a result of the hiring, the UNM President and UNM Board of

________________________________________________________________________ INTRODUCTION
February 13, 2013 Review of UNM College of Arts and Sciences Operations Page 8
Report 2013-01
Regents’ Audit Committee requested an Internal Audit review of the College’s financial position and operational performance. SCOPE The scope of the review included compiling and analyzing financial information for the College’s operations from FYs 2010 to 2012 to determine if funding is sufficient to support annual expenses. Internal Audit’s procedures included:
• Reviewing the budget process • Analyzing reserve balances and performing detailed test work on reserve
categories • Analyzing faculty workload • Analyzing the College’s hiring plan • Reviewing student statistical data
We did not test the internal controls of the College; therefore, an assessment of internal controls is not included in this report.

February 13, 2013 Review of UNM College of Arts and Sciences Operations Page 9
Report 2013-01
________________________________________________________________________ OBSERVATIONS, RECOMMENDATIONS AND RESPONSES FINANCIAL ANALYSIS Funding Sources Funding for the College is provided from various sources and is for either restricted or unrestricted purposes. Unrestricted funding includes I&G, Research, Public Service, and other program income. Significant components of I&G funding include state appropriations, tuition and fees, and Extended University revenues. These funding sources are allocated to the College based on budget allocations prepared by the Provost’s Office. Research revenues are unrestricted funds primarily generated by indirect cost recovery (IDC) from federal contracts and grants, based on the approved indirect cost rate (currently 51%). Public Service and other funding sources primarily consist of non-endowed contributions and program income generated by the College’s departments. Restricted funding sources include contracts and grants and endowments. Spending of such funds is restricted for specific purposes as indicated in the contract or agreement (C&Gs) or by donor intent (endowments). Restricted revenues are generally allocated to departments generating the funds. I&G and federal contracts and grants are the largest sources of funding for the College. These funds made up approximately 56% and 31%, respectively, of total funding for the College during FY 2012. Revenues by funding sources and related expenses for FYs 2010-2012 are presented in the graphs below.
$-
$10
$20
$30
$40
$50
$60
$70
FY 2010 FY 2011 FY 2012
(In M
illio
ns)
Fiscal Year
Revenues by Funding Source
I&G Federal C&G Non-Federal C&G Research Endowment Public Services Other
Source: Banner Accounting System

________________________________________________________________________ OBSERVATIONS, RECOMMENDATIONS AND RESPONSES
February 13, 2013 Review of UNM College of Arts and Sciences Operations Page 10
Report 2013-01
$-
$10
$20
$30
$40
$50
$60
2010 2011 2012
(In M
illio
ns)
Fiscal Year
Expenses by Funding Source
I&G Federal G&C Non-Federal G&C Research Endowment Public Services Other
Extended University Extended University offers courses using live off-campus courses, Internet and Interactive Television (ITV) based instruction (Distance Education). Distance Education allows students to access primary content and instruction through the Internet, using a variety of tools including email, chat, discussion boards, web pages, and multimedia technologies. Typically, the majority (if not all) of coursework takes place online. Some online courses have face-to-face meetings scheduled; however, the courses are designed for out of town students to take the class. Usually, some sort of synchronous web communication is arranged so that distance students can attend. Likewise, group activities are usually conducted online, since people often are not living in the same locale. ITV is a unit within Media Technology Services (MTS) utilizing two-way videoconferencing technology to provide educational access to students at distant locations. Main Campus courses are video-conferenced to Extended University field centers, including locations in Farmington, Gallup, Hobbs, Kirtland Air Force Base, Los Alamos, Santa Fe, Taos, Valencia, UNM West (Rio Rancho), and at Sandia National Labs. The cost for online classes does not differ per credit hour from face-to-face courses; however, in addition to tuition and fees, there is an additional $100 delivery fee charged for each online course. The $100 fee is retained by Extended University and is utilized to support the staffing and software support for the UNM Learning Management System. Extended University classes have been steadily increasing over the last few years. The College of Arts and Sciences has generated the most Extended University revenues and has achieved the most growth compared to other schools and colleges within the University. The funding the College receives from Extended University is determined by the base budget prepared by the Provost’s

________________________________________________________________________ OBSERVATIONS, RECOMMENDATIONS AND RESPONSES
February 13, 2013 Review of UNM College of Arts and Sciences Operations Page 11
Report 2013-01
Office. During FY 2012, the College received approximately $6.9 million of $11.5 million in revenues that the University generated through Extended University classes. Beginning in FY 2013, the College is guaranteed at least a base budget of approximately $6.9 million each year, unless there are significant changes in revenues that the University generates through Extended University classes. Extended University revenues are included within I&G funding sources. Financial Analysis for FYs 2010-2012 Over the three-year period of FYs 2010-2012, contracts and grants and I&G funds made up between 82% and 87% of the College’s total revenues and related expenses. Revenues significantly increased since FY 2010, while expenses remained consistent over the three-year period. Expenses primarily consist of labor, which is approximately 73% of total expenses. I&G funds provide the primary funding source for labor-related expenses. For FYs 2010-2012, the College had sufficient funding to meet its annual expenditures each year. Total revenues by funding sources and the related expenses for FYs 2010-2012 are presented below.
Revenues I&G Research Public Svcs Other Federal C&G Non-Federal C&G Endowment TotalFY 2010 56,629,430$ 4,052,731$ 1,853,000$ 3,589,444$ 34,084,154$ 6,135,393$ 2,656,824$ 109,000,976$
% of Total 51.95% 3.72% 1.70% 3.29% 31.27% 5.63% 2.44%
FY 2011 57,659,843$ 3,612,457$ 1,878,602$ 3,455,749$ 36,643,645$ 5,335,223$ 5,389,318$ 113,974,837$ % of Total 50.59% 3.17% 1.65% 3.03% 32.15% 4.68% 4.73%
FY 2012 63,341,143$ 4,601,269$ 1,694,168$ 3,142,621$ 35,159,281$ 4,400,725$ 717,889$ 113,057,096$ % of Total 56.03% 4.07% 1.50% 2.78% 31.10% 3.89% 0.63%
Expenses FY 2010 56,795,247$ 3,826,121$ 1,986,401$ 2,974,812$ 34,084,154$ 5,757,882$ 1,621,866$ 107,046,483$
% of Total 53.06% 3.57% 1.86% 2.78% 31.84% 5.38% 1.52%
FY 2011 57,091,980$ 3,331,073$ 1,861,455$ 2,655,186$ 36,643,645$ 5,045,561$ 1,107,025$ 107,735,925$ % of Total 52.99% 3.09% 1.73% 2.46% 34.01% 4.68% 1.03%
FY 2012 58,604,880$ 3,381,009$ 1,835,838$ 2,919,451$ 35,159,281$ 4,438,127$ 1,063,295$ 107,401,881$ % of Total 54.57% 3.15% 1.71% 2.72% 32.74% 4.13% 0.99%
RestrictedUnrestricted
Source: Banner Operating Ledger Exhibits 1 through 8 present FY 2012 revenues and expenses for the College and selected departments. Faculty and teaching assistants typically make up the largest portion of labor expenses. Faculty and staff base contracts are funded by I&G funds. Labor expenses charged to other funding sources are related to additional compensation for services not included in base contracts. Non-labor expenses are primarily funded by contracts and grants, and represent approximately 27% of the College’s expenses. For FY 2012, the College had revenues over expenses of $5.6 million, which was primarily due to growth of Extended University revenues.

________________________________________________________________________ OBSERVATIONS, RECOMMENDATIONS AND RESPONSES
February 13, 2013 Review of UNM College of Arts and Sciences Operations Page 12
Report 2013-01
The Extended University revenues generated by the College grew by approximately $4.3 million, resulting in additional funding provided to the College. The College has sufficient funding to meet its annual expenditures. With additional funding provided by Extended University revenues and unrestricted available reserves, it appears funding could support potential increases in future expenditures as a result of new faculty lines. Like the College as a whole, departmental funding primarily consists of federal contracts and grants and I&G. The Departments’ related expenses primarily consist of labor, including faculty and staff salaries. For FY 2012, each department included in our financial analysis had revenues over expenses and has sufficient revenues to meet its annual expenditures. Although the College and its departments have sufficient revenues to meet their annual expenditures, they face future challenges related to start-up packages for new Science, Technology, Engineering, and Math (STEM) faculty, and for financing unbudgeted salary expenses related to part-time instruction. Start-up packages for new STEM faculty are primarily funded with Facilities and Administration (F&A) revenue generated through federal contracts and grants. Potential declines in federal funding for research could result in challenges for the College in the form of start-up packages related to future new STEM faculty hiring. In addition, the College faces challenges related to financing unbudgeted part-time instruction. Although progress has been made in reducing the amount of unbudgeted expenditures for part-time instruction, the College may pay up to $1.5 million for unbudgeted part-time instruction through FY 2014. Estimated Tuition and State Appropriation Funding by Department The University generates the majority of I&G revenues through tuition and state appropriations. State appropriations are calculated based on a funding formula established by the Higher Education Department (HED). Procedures were performed by the UNM Financial Planning Project Team to determine approximate tuition and state appropriation revenue generated by each of UNM’s schools and colleges. The methodology used by the Financial Project Planning Team for calculating estimated tuition and state appropriation funds for FY 2012 is as follows: Estimated Tuition:
• Obtain published tuition rates, per college, including any tuition differential (excluding mandatory student fees).
• Calculate the average full-time course load at the undergraduate and graduate levels and divide the published full-time tuition rate by the average course load to obtain the discounted tuition rate.

________________________________________________________________________ OBSERVATIONS, RECOMMENDATIONS AND RESPONSES
February 13, 2013 Review of UNM College of Arts and Sciences Operations Page 13
Report 2013-01
• Calculate the average mix of enrollments between full-time resident, part-time resident, full-time non-resident, and part-time non-resident. Residency tuition as reported to the Higher Education Department was used for this purpose.
• Calculate the average cost per credit hour for undergraduate and graduate level courses. • Calculate the estimated tuition revenue per course by applying the average tuition rate to
the enrolled credit hours in each section. Estimated Funding Formula:
• Obtain the published Higher Education Department funding formula credit hour matrix and group each course into its appropriate “category” (level 1, 2, or 3, tier 1, 2, or 3) in the matrix.
• Multiply the credit hours in each cell of the matrix by the published rate to obtain an estimate of formula funding gross of the tuition credit.
• Using the actual FY12 state formula appropriation, create a discount factor to reflect actual funding net of the tuition credit, and apply this discount to each cell of the HED matrix.
• Use the new discounted rate on the matrix; multiply the credit hours to get the funding estimate.
The following tables present the University’s undergraduate and graduate student mix and tuition rates per credit hour by resident, non-resident, full time (FT) and part time (PT) students.
Undergraduate Student Mix Resident Non-Resident Total
FT 86.3% 1.6% 87.8% PT 12.0% 0.2% 12.2%
Total 98.3% 1.7% 100.0% Graduate Student Mix
Resident Non-Resident Total FT 42.1% 1.0% 43.1% PT 55.9% 1.0% 56.9%
Total 97.9% 2.1% 100.0% Source: UNM Financial Project Planning Team
Tuition Rate Per Credit Hour
College Resident
PT Resident
FT
Non-Resident
PT
Non-Resident
FT Avg/Student Credit Hour Dissertation
A&S Undergraduate $193.80 $157.14 $781.70 $633.81 $169.96 N/A A&S Graduate $216.30 $178.01 $803.30 $664.80 $210.94 $99.00
Source: UNM Financial Planning Project Team
________________________________________________________________________ OBSERVATIONS, RECOMMENDATIONS AND RESPONSES
February 13, 2013 Review of UNM College of Arts and Sciences Operations Page 14
Report 2013-01
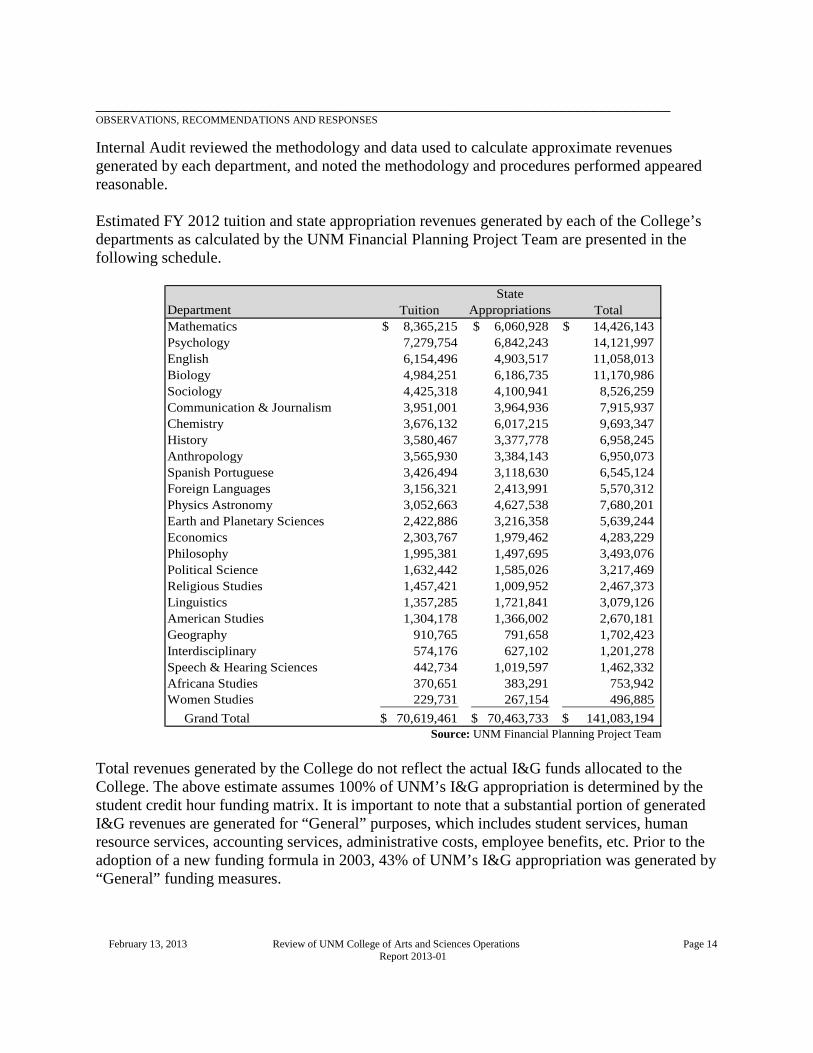
Internal Audit reviewed the methodology and data used to calculate approximate revenues generated by each department, and noted the methodology and procedures performed appeared reasonable. Estimated FY 2012 tuition and state appropriation revenues generated by each of the College’s departments as calculated by the UNM Financial Planning Project Team are presented in the following schedule.
Department TuitionState
Appropriations TotalMathematics 8,365,215$ 6,060,928$ 14,426,143$ Psychology 7,279,754 6,842,243 14,121,997 English 6,154,496 4,903,517 11,058,013 Biology 4,984,251 6,186,735 11,170,986 Sociology 4,425,318 4,100,941 8,526,259 Communication & Journalism 3,951,001 3,964,936 7,915,937 Chemistry 3,676,132 6,017,215 9,693,347 History 3,580,467 3,377,778 6,958,245 Anthropology 3,565,930 3,384,143 6,950,073 Spanish Portuguese 3,426,494 3,118,630 6,545,124 Foreign Languages 3,156,321 2,413,991 5,570,312 Physics Astronomy 3,052,663 4,627,538 7,680,201 Earth and Planetary Sciences 2,422,886 3,216,358 5,639,244 Economics 2,303,767 1,979,462 4,283,229 Philosophy 1,995,381 1,497,695 3,493,076 Political Science 1,632,442 1,585,026 3,217,469 Religious Studies 1,457,421 1,009,952 2,467,373 Linguistics 1,357,285 1,721,841 3,079,126 American Studies 1,304,178 1,366,002 2,670,181 Geography 910,765 791,658 1,702,423 Interdisciplinary 574,176 627,102 1,201,278 Speech & Hearing Sciences 442,734 1,019,597 1,462,332 Africana Studies 370,651 383,291 753,942 Women Studies 229,731 267,154 496,885 Grand Total 70,619,461$ 70,463,733$ 141,083,194$
Source: UNM Financial Planning Project Team Total revenues generated by the College do not reflect the actual I&G funds allocated to the College. The above estimate assumes 100% of UNM’s I&G appropriation is determined by the student credit hour funding matrix. It is important to note that a substantial portion of generated I&G revenues are generated for “General” purposes, which includes student services, human resource services, accounting services, administrative costs, employee benefits, etc. Prior to the adoption of a new funding formula in 2003, 43% of UNM’s I&G appropriation was generated by “General” funding measures.

________________________________________________________________________ OBSERVATIONS, RECOMMENDATIONS AND RESPONSES
February 13, 2013 Review of UNM College of Arts and Sciences Operations Page 15
Report 2013-01
RESERVES Reserves represent unrestricted carry-over funds from the prior year available for spending at the beginning of the fiscal year. Unrestricted funds include balances in I&G, Public Service, Research, F&A, course fees and Foundation-based Endowed and Non-Endowed spending accounts. Internal Audit noted that unrestricted carry-over funds properly roll forward from year to year. The College’s reserve balances have steadily increased since FY 2009 due to revenues exceeding expenses each year. Reserves significantly increased from $14 million in FY 2011 to $20.1 million in FY 2012 due to unrestricted revenues over expenses of approximately $6 million in FY 2012. This net income was primarily from a significant growth in Extended University revenues generated by the College. Extended University had growth of $4.3 million, which increased the College’s Extended University funding to $6.9 million during FY 2012. This resulted in a significant increase in I&G reserve balances at the end of FY 2012. I&G and Research have the College’s largest reserve balances for FY 2012 - at $8.3 million and $6.4 million, respectively. Of the College’s $20.1 million in reserve balances available for FY 2013, approximately $14.5 million is committed and/or dedicated for specific purposes and the remaining reserve of $5.6 million is discretionary. The following graphs illustrate trends in fiscal year reserve balances for FYs 2009-2012.
$11,817,092 $12,359,115 $14,026,070
$20,064,093
FY 2009 FY 2010 FY 2011 FY 2012
College of Arts and Sciences Fiscal Year Reserve Balances
Source: Banner Accounting System

________________________________________________________________________ OBSERVATIONS, RECOMMENDATIONS AND RESPONSES
February 13, 2013 Review of UNM College of Arts and Sciences Operations Page 16
Report 2013-01
$-
$1,000,000
$2,000,000
$3,000,000
$4,000,000
$5,000,000
$6,000,000
$7,000,000
$8,000,000
$9,000,000
FY 2009 FY 2010 FY 2011 FY 2012
College of Arts and Sciences Reserves by Funding Source
I&G Research Public Service Other
Source: Banner Accounting System Reserves are classified into three categories: committed, dedicated and discretionary. The following table presents reserve balances by category as of fiscal year ended June 30, 2012.

________________________________________________________________________ OBSERVATIONS, RECOMMENDATIONS AND RESPONSES
February 13, 2013 Review of UNM College of Arts and Sciences Operations Page 17
Report 2013-01
Department Committed Dedicated Discretionary TotalAdministrative 245,973$ 3,807,716$ 2,333,036$ 6,386,725$ Biology 1,837,018 - - 1,837,018 Physics Astronomy 551,438 64,205 747,475 1,363,118 Psychology 288,385 1,000,414 17,861 1,306,661 Earth & Planetary Sciences 138,204 579,337 450,232 1,167,772 Anthropology 843,409 158,852 - 1,002,261 Chemistry 14,067 - 886,853 900,920 English 592,617 271,584 12,212 876,412 Communication Journalism 580,837 82,658 13,110 676,606 Foreign Languages Literatures 137,838 480,925 16,418 635,181 Sociology 33,299 430,016 115,118 578,432 Mathematics & Statistics 244,492 256,835 (351) 500,976 Linguistics 9,196 369,994 45,787 424,977 Religious Studies 245,651 54,746 122,871 423,268 History 137,706 145,992 134,804 418,501 American Studies 28,403 128,633 142,657 299,693 Earth Data Analysis Center 7,813 - 190,797 198,610 Maxwell Museum 19,005 178,099 (25,254) 171,850 Political Science 21,463 75,094 64,428 160,985 Spanish Portuguese 16,736 105,450 21,063 143,250 Philosophy 43,668 13,006 83,557 140,231 Geography 45,296 56,223 5,870 107,390 Economics 52,290 43,269 102 95,661 Other Programs 4,104 21,658 61,336 87,098 African American Studies (1,562) 8,000 56,068 62,506 Speech & Hearing Sciences 13,002 6,413 40,451 59,866 Women Studies 726 20,558 16,841 38,125 Total Arts and Sciences 6,151,073$ 8,359,678$ 5,553,343$ 20,064,093$
Source: Banner Accounting System Compliance with Reserve Designations At the beginning of each fiscal year, departments assign portions of reserve balances for either committed or dedicated purposes. Once commitments and dedications have been determined, the remaining reserve balances are discretionary and will only be used if needed. The College completed and submitted FY 2013 reserve designations by the required deadline. As stated by University policy UBPP 7000, committed reservations are initiated by a formal, written commitment to use a portion of unrestricted reserve balances. Examples include signed offer letters for faculty start-up funds, documented cost share requirements, direct state appropriations for a special project, institutional bond debt service payments, etc.
________________________________________________________________________ OBSERVATIONS, RECOMMENDATIONS AND RESPONSES
February 13, 2013 Review of UNM College of Arts and Sciences Operations Page 18
Report 2013-01
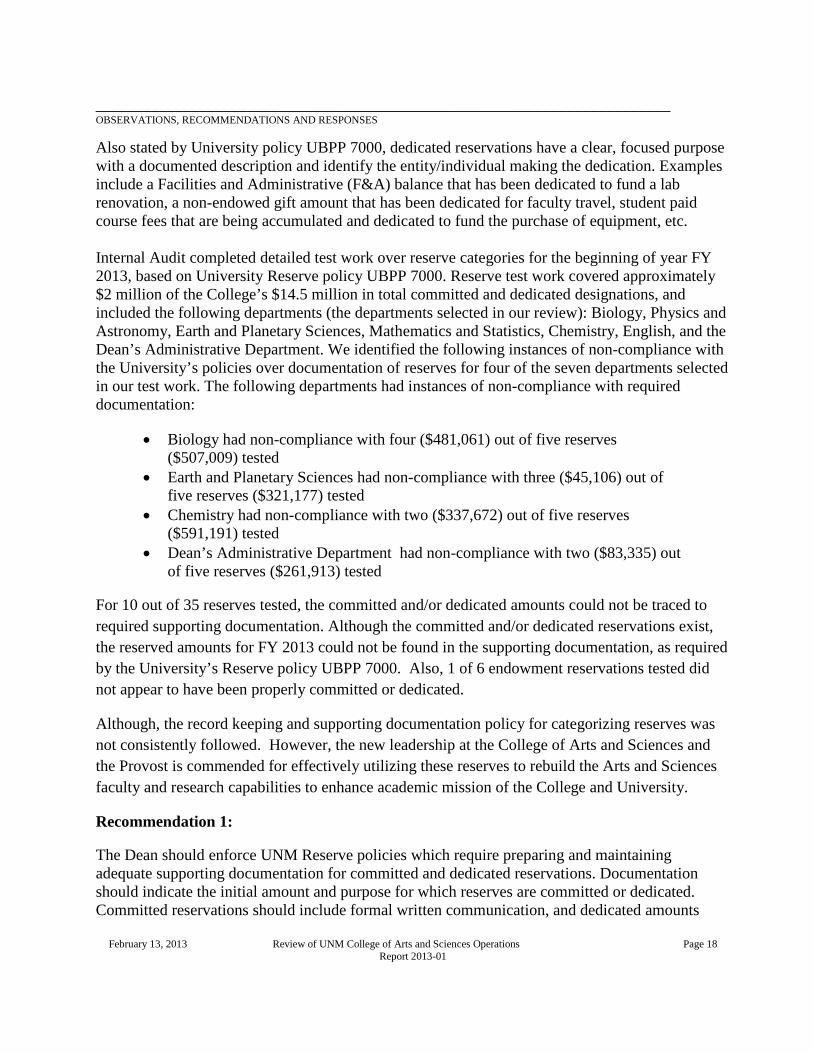
Also stated by University policy UBPP 7000, dedicated reservations have a clear, focused purpose with a documented description and identify the entity/individual making the dedication. Examples include a Facilities and Administrative (F&A) balance that has been dedicated to fund a lab renovation, a non-endowed gift amount that has been dedicated for faculty travel, student paid course fees that are being accumulated and dedicated to fund the purchase of equipment, etc. Internal Audit completed detailed test work over reserve categories for the beginning of year FY 2013, based on University Reserve policy UBPP 7000. Reserve test work covered approximately $2 million of the College’s $14.5 million in total committed and dedicated designations, and included the following departments (the departments selected in our review): Biology, Physics and Astronomy, Earth and Planetary Sciences, Mathematics and Statistics, Chemistry, English, and the Dean’s Administrative Department. We identified the following instances of non-compliance with the University’s policies over documentation of reserves for four of the seven departments selected in our test work. The following departments had instances of non-compliance with required documentation:
• Biology had non-compliance with four ($481,061) out of five reserves ($507,009) tested
• Earth and Planetary Sciences had non-compliance with three ($45,106) out of five reserves ($321,177) tested
• Chemistry had non-compliance with two ($337,672) out of five reserves ($591,191) tested
• Dean’s Administrative Department had non-compliance with two ($83,335) out of five reserves ($261,913) tested
For 10 out of 35 reserves tested, the committed and/or dedicated amounts could not be traced to required supporting documentation. Although the committed and/or dedicated reservations exist, the reserved amounts for FY 2013 could not be found in the supporting documentation, as required by the University’s Reserve policy UBPP 7000. Also, 1 of 6 endowment reservations tested did not appear to have been properly committed or dedicated.
Although, the record keeping and supporting documentation policy for categorizing reserves was not consistently followed. However, the new leadership at the College of Arts and Sciences and the Provost is commended for effectively utilizing these reserves to rebuild the Arts and Sciences faculty and research capabilities to enhance academic mission of the College and University.
Recommendation 1: The Dean should enforce UNM Reserve policies which require preparing and maintaining adequate supporting documentation for committed and dedicated reservations. Documentation should indicate the initial amount and purpose for which reserves are committed or dedicated. Committed reservations should include formal written communication, and dedicated amounts

________________________________________________________________________ OBSERVATIONS, RECOMMENDATIONS AND RESPONSES
February 13, 2013 Review of UNM College of Arts and Sciences Operations Page 19
Report 2013-01
should have a statement of purpose from the individual dedicating the funds. This will ensure that every department is in compliance with the University’s policies related to reserve designations. Response from the Dean for the UNM College of Arts and Sciences:
Action Items
Targeted Completion Date: 8/31/2013
Assigned to: Dean’s Office Fiscal Staff – Richard Goshorn lead
Corrective Action Planned: We concur. (1) The College will develop a standardized, one page form that all units will use to report reserve categorization. The Dean’s office will develop standard operating procedures for completing this form in compliance with UBPP 7000. (2) The College will develop a training schedule for department administrators and Chairs regarding reserve categorization procedures. (3) The College will continue to review all reserve categorizations and develop statistical methods to ensure thorough and regular reviews of categorizations. BUDGET ANALYSIS Budgeted unrestricted funds are primarily I&G revenues from state appropriations, tuition and fees, and Extended University. Revenues from these sources are captured in the University’s central pooled account and allocated to each of the University’s schools, colleges and departments; they are based on budgeted allocations prepared by the Provost’s office and approved by the University’s Board of Regents. The College’s base budget from I&G funding related to State appropriations and tuition and fees was $51.1 million for FYs 2012 and 2013. The College had a base budget from Extended University of approximately $6.9 million for FY 2013. The base budget from Extended University revenue is expected to be steady for future years unless there are significant changes in Extended University’s revenues or budgeting model. The College’s budget process for unrestricted funds is consistent with the University’s current budget process. Budgeted restricted funds are primarily from contracts and grants. Budgeted amounts are entered into UNM’s Banner accounting system based on the award period rather than a fiscal year period. Any budget adjustments entered into the accounting system reflect changes made for the award period. Fiscal year budgets are monitored by each individual contract and grant by the University’s Contracts and Grants department to ensure grants are not over-expended. The College and its departments also provide input during the budget process. Exhibit 9 presents a budget trend for unrestricted funds for FYs 2010-2013. Exhibits 10 and11 present unrestricted and restricted budget to actual comparisons for FYs 2010-2012.

________________________________________________________________________ OBSERVATIONS, RECOMMENDATIONS AND RESPONSES
February 13, 2013 Review of UNM College of Arts and Sciences Operations Page 20
Report 2013-01
The University is in the process of implementing the Responsibility Center Management (RCM) and Performance Based Budgeting (PBB) budget model. The RCM budget model is a decentralized approach to budgeting that assigns greater control over resource allocation decisions to the Deans of colleges and schools. RCM gives a college, faculty, or department control over the income that it generates and the expenses that it incurs, including indirect and overhead costs. PBB is the process by which decisions are made as to which parts of an organization are to be grown, maintained, and eliminated. It uses performance metrics as the basis for funding decisions. FACULTY WORKLOAD UNM full-time tenure and tenure-track faculty workload consists of all recognized University duties including Instructional, Research, and Public Service. Instructional Instructional activities are primarily the instruction of classes in a classroom or online setting. Faculty also spend considerable time preparing for lectures, evaluating student performance, advising students, and conducting related administrative tasks (supervising teaching assistants, preparing student progress reports, and writing reference letters for students). Research Faculty members, particularly those at a research institution such as UNM, are required to conduct research related to their discipline or specialty area. Faculty conducting research may seek external funding to support costs associated with research and publish their findings. Such research activities could include grant writing and publications. Public Service Public service activities include disseminating knowledge to students and the community. Faculty members sometimes serve as experts or resource persons for local communities, state, or the nation. They often serve their disciplines by taking leadership roles in professional organizations. In addition to these responsibilities, some faculty members also serve on university committees or fill administrative roles that may require additional time and commitment, such as department chair. Informal guidelines exist that allocate each type of workload at 40% Instructional, 40% Research, and 20% Public Service. Although the workload allocation is not formally documented, it is considered during the faculty evaluation process. Internal Audit attempted to perform a workload analysis on the three duties of faculty workload; however, there is not a current method in place to formally track research and public service activities. Although tenure and tenure-track faculty members spend considerable time engaging in research and public service, the time spent on these activities is not recorded. The University is in the process of developing methods to effectively track research and public service activities. However, implementation is in the early phases, and full implementation will require further resources.

________________________________________________________________________ OBSERVATIONS, RECOMMENDATIONS AND RESPONSES
February 13, 2013 Review of UNM College of Arts and Sciences Operations Page 21
Report 2013-01
To meet the instructional obligations of the Colleges and their students, the University has policies for minimum academic load requirements for tenure and tenure-track faculty. Academic load requirements are met through a combination of instructional, research, and public service efforts. The typical academic load consists of 23 load units. This includes the sum of 9 instructional load units, 9 research load units, and 5 public service load units. Load units are based on a formula established by the Provost’s office. There is not currently a formal process in place to determine if academic load requirements are met by tenure and tenure-track faculty members because other components such as research and public service activities are not formally tracked. Recommendation 2: The Provost should implement a process that enables colleges to effectively track and monitor time that faculty members spend on research and public service activities. Such processes could include software, which is used for recording time spent on research or public service events and activities and has the ability to generate reports for review. This will help management to effectively determine if faculty members are meeting academic load requirements and workload guidelines. Response from the UNM Provost office:
Action Items
Targeted Completion Date: Revised implementation plan completed by 6/30/2013
Assigned to: Banner Faculty Workload Project Team (Nancy Middlebrook, Provost's Office, project lead)
Corrective Action Planned: We concur. Processes to enable tracking of faculty workload are in development, with a significant amount of work still to be done. Banner has a module new to version 8 called “Faculty Workload and Compensation” and a project has been created to implement the module. The module includes a self-service portion where department chairs or designees can enter and adjust faculty instructional workload values, and input non-instructional workload measures for areas such as research, public service, administrative duties, and special assignments. The implementation is in its early phase, and full implementation would require significant further work, including work by a number of units, especially Faculty Contracts, Enrollment Management, Information Technologies, and Institutional Analytics. Also, departments and colleges will have to be trained on how to use the module to input faculty workload information.

________________________________________________________________________ OBSERVATIONS, RECOMMENDATIONS AND RESPONSES
February 13, 2013 Review of UNM College of Arts and Sciences Operations Page 22
Report 2013-01
Instructional Workload Analysis Internal Audit performed an analysis on instructional workload by faculty status, faculty rank, and course level. Tenure/tenure-track and lecturer (T/TTL) faculty members consist of Assistant Professors, Associate Professors, Professors, and Lecturers. Non-T/TTL consist of teaching assistants (includes graduate assistants), part-time faculty, and temporary faculty members (includes visiting professors). Assistant Professors, Associate Professors and Professors are tenure or tenure-track faculty. Lecturers are not typically on a tenure track. During FY 2012, there were approximately 391,000 credit hours taught within the College. The College has a substantial number of classes instructed by teaching assistants, part-time and temporary faculty members. Of the total credit hours, 47% were taught by T/TTL faculty members and 53% were taught by Non-T/TTL faculty members. The following graph illustrates the percentage of credit hours taught by faculty rank.
Assistant Professor7%
Associate Professor14%
Professor 11%
Lecturer15%
Teaching Assistant28%
Part Time/Temporary
23%
Other2%
Percentage of Credit Hours by Faculty Rank
Source: Office of institutional Research
Exhibits 12 and 13 present detailed information of the College’s instructional workload by faculty status, faculty rank and class level. Full-time faculty members taught approximately 184,000 credit hours, of which 43% (78,506) were taught to upper level and graduate students. Non-T/TTL faculty members taught approximately 207,000 credit hours, of which 77% (160,200) consisted of lower level undergraduate courses. This indicates that T/TTL faculty are primarily responsible for teaching upper level and graduate courses, whereas Non-T/TTL faculty are primarily responsible for teaching lower level courses. Upper level and graduate courses are primarily taught by Professors and Associate Professors, which are higher ranking T/TTL faculty members. Teaching

________________________________________________________________________ OBSERVATIONS, RECOMMENDATIONS AND RESPONSES
February 13, 2013 Review of UNM College of Arts and Sciences Operations Page 23
Report 2013-01
assistants instructed approximately 91,000 credit hours of lower level courses, which make up 23% of the College’s total credit hours in FY 2012. The following graphs present the percentage of lower level, upper level and graduate credit hours taught by faculty rank.
34%
26%
24%
16%
Lower Level Credit Hours Taught by Faculty Rank
Teaching Assistants
Part-Time/Temporary
Tenure/Tenure Track
Lecturer
Source: Office of Institutional Research
14%
23%
51%
12%
Upper and Graduate Level Hours Taught by Faculty Rank
Teaching Assistants
Part-Time/Temporary
Tenure/Tenure Track
Lecturer
Source: Office ofInstitutional Research
Although there are a significant number of credit hours taught by teaching assistants, class instruction is an important part of the professional growth of UNM’s graduate students. Teaching assistants received mentoring and instructional guidance from tenure and tenure-track faculty members.

________________________________________________________________________ OBSERVATIONS, RECOMMENDATIONS AND RESPONSES
February 13, 2013 Review of UNM College of Arts and Sciences Operations Page 24
Report 2013-01
Course Utilization The College offers several courses with multiple sections available to its students. When developing course schedules, department chairs prepare the schedules, setting maximum course enrollment for each section. In order to fully utilize course capacity, the goal is to enroll as many students in each section as possible. Course sections should be evaluated carefully to ensure the College can operate efficiently while maintaining the quality of its academic programs. During the fall 2011 and spring 2012 semesters, the College offered a significant number of courses with multiple sections. Internal Audit analyzed course utilization during these semesters to determine if courses efficiently met instructional capacity. During each semester, 212 of 219 courses (96.8%), and 206 of 214 (96.3%) courses had course utilization greater than 80% of capacity. The College appears to have efficiently utilized course offerings during the two semesters, as overall course utilization was 83% and 80%, respectively. However, the courses that did not appear to be efficiently utilized were primarily due to maximum enrollments being set significantly higher than actual enrollment needs. In some cases, maximum course enrollments are determined by seating capacities of classrooms designated for each course. The recorded instructional capacity may be inappropriately determined by the size of the classroom where instruction takes place, rather than by a determination of course demand. Recommendation 3: The Provost should carefully evaluate maximum enrollments to ensure maximum efficiency for all courses offered. Department Chairs should adjust maximum enrollment capacity to reflect actual student enrollment needs. A process could include a review of course schedules and class sizes from at least the past two years to determine which courses, if any, need adjustments to maximum enrollment size. Response from the UNM Provost office:
Action Items
Targeted Completion Date: 6/30/2013
Assigned to: Alex Gonzalez, University Registrar
Corrective Action Planned: We concur. Decisions about the appropriate maximum instructional capacity for a class are determined according to best didactic practices by the faculty and department responsible for the course. It is possible that the maximum instructional capacity for some course sections is inadvertently limited when the size of the classroom could accommodate more students AND the instructor has no pedagogical rationale for limiting course registrations. Enrollment needs should be addressed by increasing capacity where possible and creating additional course sections where necessary. A review of course demand, availability and capacities for a two year period is reasonable and will be completed.

________________________________________________________________________ OBSERVATIONS, RECOMMENDATIONS AND RESPONSES
February 13, 2013 Review of UNM College of Arts and Sciences Operations Page 25
Report 2013-01
Faculty Hiring During FY 2012, the College initiated efforts to reduce its reliance on teaching assistants and part-time instructors, by increasing the number of tenure/tenure-track and lecturer faculty. The College completed a hiring plan that included the hiring of 59 tenure and tenure-track faculty and 26 full-time lecturers (including six visiting lecturers). The hiring of new T/TTL faculty members was due in part to increased funding from Extended University revenues. However, the new hires that took place were also due to turnover over the last few years. In 2011, there were 20 T/TTL faculty members that retired or resigned, which significantly contributed to the need for new T/TTL hires. Over the three-year period of FYs 2009-2011, there were 94 T/TTL faculty members that retired or resigned, but only 72 were replaced. The faculty hiring that took place in FY 2012 to replace the 22 unfilled positions does not require any significant increases in budget funds. The College’s hiring plan is heavily based on placing T/TTL faculty members in departments with the most need. A focus point for the College was to hire more T/TTLs in the Mathematics and English departments. These departments have the most teaching assistants, part-time faculty, and temporary faculty members that taught approximately 62,000 credit hours (16% of total credit hours) in FY 2012. The English and Mathematics departments lost 39 T/TTL faculty members due to retirement or resignation between FY 2009 and FY 2011, and only replaced 17. The College appears to have conducted a thorough hiring plan and appropriately hired T/TTL faculty members for each department. The College’s T/TTL faculty hiring for each department is presented Exhibit 12. STUDENT ACADEMIC PROGRESS Enrollment and Credit Hours by Department The College has the largest class enrollment and credit hours instructed compared to any other college or school in the University.

________________________________________________________________________ OBSERVATIONS, RECOMMENDATIONS AND RESPONSES
February 13, 2013 Review of UNM College of Arts and Sciences Operations Page 26
Report 2013-01
The following schedule presents enrollment and credit hours, by department, for FY 2012.
Department Class Enrollment % of Total Credit Hours % of TotalMathematics Statistics 15,842 11.82% 48,440 12.38%Psychology 13,879 10.35% 41,396 10.58%English 11,532 8.60% 34,622 8.85%Biology 9,846 7.34% 27,510 7.03%Sociology 8,468 6.32% 25,602 6.54%Chemistry 8,098 6.04% 19,501 4.98%Communication Journalism 7,496 5.59% 22,375 5.72%Physics Astronomy 7,018 5.23% 16,455 4.21%History 6,775 5.05% 20,325 5.19%Anthropology 6,700 5.00% 19,843 5.07%Spanish Portuguese 6,422 4.79% 19,605 5.01%Foreign Languages 5,583 4.16% 17,079 4.36%Economics 4,339 3.24% 12,998 3.32%Philosophy 3,826 2.85% 11,456 2.93%Political Science 3,021 2.25% 9,049 2.31%Religious Studies 2,847 2.12% 8,553 2.19%Linguistics 2,730 2.04% 8,168 2.09%Earth & Planetary Sciences 2,521 1.88% 7,357 1.88%American Studies 2,408 1.80% 7,224 1.85%Geography 1,807 1.35% 5,178 1.32%Interdisciplinary Courses 1,031 0.76% 2,917 0.73%Speech & Hearing Sciences 734 0.55% 2,202 0.56%African American Studies 718 0.54% 2,121 0.54%Women Studies 439 0.33% 1,317 0.34% Total Arts and Sciences 134,080 100.00% 391,293 100.00%Total UNM 232,698 698,094 Arts and Sciences as a percent of total
58% 56%
Source: UNM Financial Planning Project Team
Degrees Awarded by Department The College also awards the most degrees compared to any other college of school in the University. During FY 2012, the college awarded a total of 1,909 degrees (Undergraduate and Graduate), which represents 37% of 5,180 total degrees awarded by the University’s main campus. Since FY 2010, the number of degrees awarded has increased by 183, or 10.6%, from 1,726 to 1,909. Awarded undergraduate degrees have increased by 140, or 9.55%; graduate degrees have increased by 43, or 16.54%. Psychology, Biology, Sociology, Communications and Journalism, and English have awarded the most degrees over the three-year period. These five departments have awarded over half of the College’s degrees each year since FY 2010. The most graduate-level degrees were awarded by the Physics, Mathematics, and Anthropology departments over the same period.
________________________________________________________________________ OBSERVATIONS, RECOMMENDATIONS AND RESPONSES
February 13, 2013 Review of UNM College of Arts and Sciences Operations Page 27
Report 2013-01
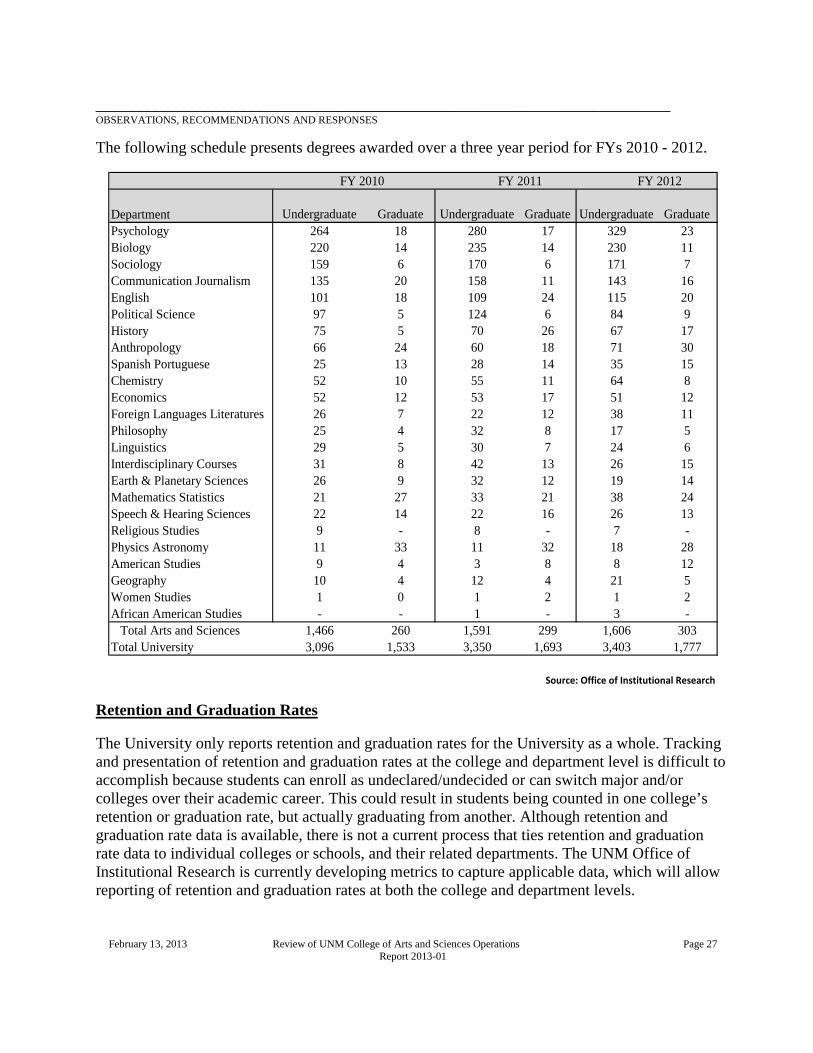
The following schedule presents degrees awarded over a three year period for FYs 2010 - 2012.
Department Undergraduate Graduate Undergraduate Graduate Undergraduate GraduatePsychology 264 18 280 17 329 23Biology 220 14 235 14 230 11Sociology 159 6 170 6 171 7Communication Journalism 135 20 158 11 143 16English 101 18 109 24 115 20Political Science 97 5 124 6 84 9History 75 5 70 26 67 17Anthropology 66 24 60 18 71 30Spanish Portuguese 25 13 28 14 35 15Chemistry 52 10 55 11 64 8Economics 52 12 53 17 51 12Foreign Languages Literatures 26 7 22 12 38 11Philosophy 25 4 32 8 17 5Linguistics 29 5 30 7 24 6Interdisciplinary Courses 31 8 42 13 26 15Earth & Planetary Sciences 26 9 32 12 19 14Mathematics Statistics 21 27 33 21 38 24Speech & Hearing Sciences 22 14 22 16 26 13Religious Studies 9 - 8 - 7 -Physics Astronomy 11 33 11 32 18 28American Studies 9 4 3 8 8 12Geography 10 4 12 4 21 5Women Studies 1 0 1 2 1 2African American Studies - - 1 - 3 - Total Arts and Sciences 1,466 260 1,591 299 1,606 303Total University 3,096 1,533 3,350 1,693 3,403 1,777
Source: Office of Institutional Research
FY 2010 FY 2011 FY 2012
Retention and Graduation Rates The University only reports retention and graduation rates for the University as a whole. Tracking and presentation of retention and graduation rates at the college and department level is difficult to accomplish because students can enroll as undeclared/undecided or can switch major and/or colleges over their academic career. This could result in students being counted in one college’s retention or graduation rate, but actually graduating from another. Although retention and graduation rate data is available, there is not a current process that ties retention and graduation rate data to individual colleges or schools, and their related departments. The UNM Office of Institutional Research is currently developing metrics to capture applicable data, which will allow reporting of retention and graduation rates at both the college and department levels.

________________________________________________________________________ OBSERVATIONS, RECOMMENDATIONS AND RESPONSES
February 13, 2013 Review of UNM College of Arts and Sciences Operations Page 28
Report 2013-01
Recommendation 4: The Provost should implement a process that provides the ability to capture and present retention and graduation rates for colleges and schools, and their related departments. Such processes could include an electronic program that captures retention and graduation rate data, based on the time period when students enroll and declare a major within a college or school, through their graduation date. Retention and graduate rate data could then be tied to each college or school, and available for presentation and analysis. This process can be an important tool for tracking academic progress and success of students within each of the University’s colleges and schools and their departments. Response from the UNM Provost office:
Action Items
Targeted Completion Date: 6/30/2013
Assigned to: Vicky Dueer, Institutional Analytics
Corrective Action Planned: We concur. The Office of Institutional Analytics has begun development of metrics to estimate retention and graduation rates at both the college and departmental levels. Furthermore, metrics will include tracking of students’ ACT, SAT, School District and High School information.

Revenues I&G Research Public Services Other Federal C&G Non-Federal C&G Endowment TotalI&G 62,509,509$ 94,047$ 23,970$ 43,962$ -$ -$ -$ 62,671,488$ Federal C&G's - - - - 35,175,052 (4,828) - 35,170,224 Non-Federal C&G's - - - - 583 3,414,029 - 3,414,612 Other Revenues 831,634 4,507,223 1,670,198 3,098,659 (16,355) 991,524 717,889 11,800,772 Total Revenues 63,341,143$ 4,601,270$ 1,694,168$ 3,142,621$ 35,159,280$ 4,400,725$ 717,889$ 113,057,096$
Expenses Faculty 34,617,753$ 503,417$ 165,981$ 120,319$ 6,147,357$ 635,323$ -$ 42,190,150$ GA/TA 9,418,992 212,580 85,671 174,807 4,250,189 207,205 - 14,349,444 Staff 7,661,758 647,916 225,092 512,179 3,480,067 1,314,993 - 13,842,005 Student 488,432 23,956 71,125 46,691 988,846 42,654 - 1,661,704 Tuition/Benefits 2,476,995 299,698 19,038 195,938 2,461,491 587,380 - 6,040,540 Total Labor 54,663,930$ 1,687,567$ 566,907$ 1,049,934$ 17,327,950$ 2,787,555$ -$ 78,083,843$
Non-LaborSupplies 1,280,989 668,517 223,641 514,221 1,986,581 122,242 - 4,796,190 Facilities and administration - - - - 8,360,248 357,396 - 8,717,644 Scholarships and awards 1,082,757 31,300 382,763 278,606 1,307,509 200,929 - 3,283,864 Services and fees 671,771 306,702 345,932 195,821 1,603,941 125,232 - 3,249,399 Travel 549,237 411,246 154,536 139,260 1,300,346 154,449 - 2,709,074 Subcontracts 1,342 (5,307) 452 1,111 1,775,304 405,225 - 2,178,127 Capital 72,945 156,232 16,000 223,415 1,322,172 141,973 - 1,932,736 Other 281,912 124,748 145,607 517,086 175,229 143,126 1,063,296 2,451,004 Total Non-Labor 3,940,951$ 1,693,438$ 1,268,932$ 1,869,520$ 17,831,330$ 1,650,572$ 1,063,296$ 29,318,038$ Total Expenses 58,604,881$ 3,381,005$ 1,835,839$ 2,919,454$ 35,159,280$ 4,438,127$ 1,063,296$ 107,401,881$
Revenues Over (Under) Expenses 4,736,262$ 1,220,265$ (141,671)$ 223,167$ -$ (37,402)$ (345,407)$ 5,655,215$
Reserves, beginning of year 3,602,838$ 5,225,313$ 2,301,211$ 2,896,708$ -$ -$ -$ 14,026,070$ Reserves, end of year 8,339,100$ 6,445,578$ 2,159,540$ 3,119,875$ -$ -$ -$ 20,064,093$
Source: UNM Banner Accounting System Exhibit 1
Unrestricted
UNM College of Arts and SciencesFY 2012 Financial Analysis - College of Arts and Sciences
Fiscal Year Ended June 30, 2012
Note: The College's revenues exceeded expenses by $5.6 million. Unrestricted net income of $6,038,023 in addition to beginning of year reserves of $14,026,070 is $20,064,093, which is carried over to FY 2013 and is available for use.
Restricted

Revenues I&G Research Public Service Other Federal C&G Non-Federal C&G Endowment TotalI&G 5,566,527$ 164,974$ 18,230$ 11,200$ -$ -$ -$ 5,760,931$ Federal C&G's - - - - 11,830,851 - - 11,830,851 Non-Federal C&G's - - - - - 404,542 - 404,542 Other Revenues 177,647 1,228,609 120,214 488,214 (12,537) 391,178 92,953 2,486,278 Total Revenues 5,744,174$ 1,393,583$ 138,444$ 499,414$ 11,818,314$ 795,720$ 92,953$ 20,482,602$
Expenses Faculty 3,305,889$ 188,244$ 10,713$ -$ 1,909,929$ 127,445$ -$ 5,542,220$ GA/TA 848,271 86,355 861 13,983 875,840 105,887 1,931,197 Staff 1,176,785 236,123 16,315 1,311 1,435,563 182,024 - 3,048,121 Student 37,242 15,273 3,796 2,490 719,475 18,407 - 796,683 Tuition/Benefits 1,328 112,533 10,019 1,947 857,883 84,828 - 1,068,538 Total Labor 5,369,515$ 638,528$ 41,704$ 19,731$ 5,798,690$ 518,591$ -$ 12,386,759$
Non-LaborSupplies 152,139$ 226,993$ 24,451$ 164,001$ 924,667$ 61,120$ -$ 1,553,371$ Facilities and administration - - - - 2,714,329 36,132 - 2,750,461 Scholarships and awards 1,426 18,223 11,143 18,699 448,149 2,436 - 500,076 Services and fees 119,819 99,984 8,807 44,934 356,461 44,362 - 674,368 Travel 64,001 124,397 37,154 17,959 461,611 12,414 - 717,536 Subcontracts - 10,549 6 730,989 69,691 - 811,235 Capital - 34,496 - 112,310 350,378 131,937 - 629,121 Other 35,880 61,872 (2,106) 14,801 33,040 37,406 87,463 268,356 Total Non-Labor 373,265$ 576,514$ 79,455$ 372,704$ 6,019,624$ 395,499$ 87,463$ 7,904,524$ Total Expenses 5,742,780$ 1,215,042$ 121,159$ 392,435$ 11,818,314$ 914,090$ 87,463$ 20,291,283$
Revenues Over (Under) Expenses 1,394$ 178,541$ 17,285$ 106,979$ -$ (118,370)$ 5,490$ 191,319$
Reserves, beginning of year 4,078$ 890,489$ 199,890$ 438,362$ -$ -$ -$ 1,532,819$ Reserves, end of year 5,472$ 1,069,030$ 217,175$ 545,341$ -$ -$ -$ 1,837,018$
Source: UNM Banner Accounting System Exhibit 2
UNM College of Arts and SciencesFY 2012 Financial Analysis - Biology Department
Fiscal Year Ended June 30, 2012
Note: The Biology department's funding sources primarily consist of federal contracts and grants (58%) and I&G (28%). The Department's related expenses primarily consist of labor, which make up approximately 61% of total expenses. Faculty and staff make up the largest portion of labor expenses at 45% and 25%, respectively. The Department had revenues over expenses of $191,319. Unrestricted net income of $304,199 in addition to beginning of year reserves of $1,532,819 is $1,837,018, which is carried over to FY 2013 and is available for use.
RestrictedUnrestricted

Revenues I&G Research Public Service Other Federal C&G Non-Federal C&G Endowment TotalI&G 3,796,120$ -$ -$ 2,900$ -$ -$ -$ 3,799,020$ Federal C&G's - - - - 7,510,545 (4,828) - 7,505,717 Non-Federal C&G's - - - - - 33,391 - 33,391 Other Revenues 45,593 316,201 81,501 86,992 - 200,923 2,419 733,629 Total Revenues 3,841,713$ 316,201$ 81,501$ 89,892$ 7,510,545$ 229,486$ 2,419$ 12,071,757$
Expenses Faculty 2,533,734$ 85,456$ -$ 2,338$ 1,422,010$ 15,986$ -$ 4,059,524$ GA/TA 488,698 53,075 - 1,700 1,381,063 5,674 - 1,930,210 Staff 557,779 58,017 633 17,775 281,531 16,968 - 932,702 Student 11,646 - - 876 56,982 - - 69,503 Tuition/Benefits 2 35,971 133 2,816 441,758 7,454 - 488,134 Total Labor 3,591,858$ 232,519$ 766$ 25,504$ 3,583,344$ 46,082$ -$ 7,480,073$
Non-LaborSupplies 104,146 42,893 8,174 26,452 337,818 13,566 - 533,049 Facilities and administration - - - - 1,753,069 7,542 - 1,760,611 Scholarships and awards 75 1,496 4,000 800 56,926 - - 63,297 Services and fees 56,307 15,757 70,756 21,294 174,909 3,359 - 342,383 Travel 8,116 62,077 3,984 - 245,919 2,755 - 322,852 Subcontracts - 748 - - 633,669 - - 634,417 Capital - 2,457 - 776 707,317 - - 710,550 Other 8,830 32,002 800 566 17,574 33 3,675 63,479 Total Non-Labor 177,474$ 157,431$ 87,714$ 49,888$ 3,927,201$ 27,255$ 3,675$ 4,430,638$ Total Expenses 3,769,332$ 389,950$ 88,480$ 75,392$ 7,510,545$ 73,337$ 3,675$ 11,910,711$
Revenues Over (Under) Expenses 72,381$ (73,749)$ (6,979)$ 14,500$ -$ 156,149$ (1,256)$ 161,046$
Reserves, beginning of year 72,821$ 1,101,594$ 84,956$ 97,594$ -$ -$ -$ 1,356,965$ Reserves, end of year 145,202$ 1,027,845$ 77,977$ 112,094$ -$ -$ -$ 1,363,118$
Source: UNM Banner Accounting System Exhibit 3
Unrestricted
UNM College of Arts and SciencesFY 2012 Financial Analysis - Physics and Astronomy Department
Fiscal Year Ended June 30, 2012
Restricted
Note: The Physics & Astronomy Department's funding sources primarily consist of federal contracts and grants (62%) and I&G (32%). The Department's related expenses primarily consist of labor, which make up approximately 63% of total expenses. Faculty and GA/TA's make up the largest portion of labor expenses at 54% and 26%, respectively. The Department had revenues over expenses of $161,046. Unrestricted net income of $6,153 in addition to beginning of year reserves of $1,356,965 is $1,363,118, which is carried over to FY 2013 and is available for use.
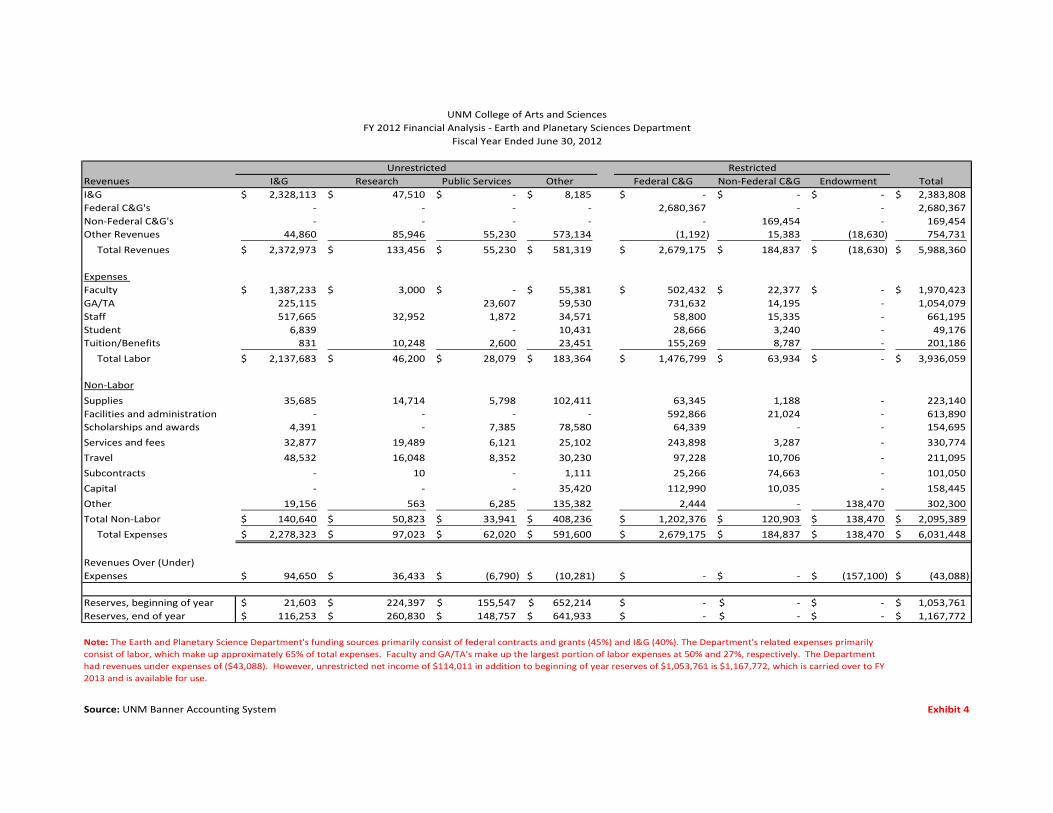
Revenues I&G Research Public Services Other Federal C&G Non-Federal C&G Endowment TotalI&G 2,328,113$ 47,510$ -$ 8,185$ -$ -$ -$ 2,383,808$ Federal C&G's - - - - 2,680,367 - - 2,680,367 Non-Federal C&G's - - - - - 169,454 - 169,454 Other Revenues 44,860 85,946 55,230 573,134 (1,192) 15,383 (18,630) 754,731 Total Revenues 2,372,973$ 133,456$ 55,230$ 581,319$ 2,679,175$ 184,837$ (18,630)$ 5,988,360$
Expenses Faculty 1,387,233$ 3,000$ -$ 55,381$ 502,432$ 22,377$ -$ 1,970,423$ GA/TA 225,115 23,607 59,530 731,632 14,195 - 1,054,079 Staff 517,665 32,952 1,872 34,571 58,800 15,335 - 661,195 Student 6,839 - 10,431 28,666 3,240 - 49,176 Tuition/Benefits 831 10,248 2,600 23,451 155,269 8,787 - 201,186 Total Labor 2,137,683$ 46,200$ 28,079$ 183,364$ 1,476,799$ 63,934$ -$ 3,936,059$
Non-LaborSupplies 35,685 14,714 5,798 102,411 63,345 1,188 - 223,140 Facilities and administration - - - - 592,866 21,024 - 613,890 Scholarships and awards 4,391 - 7,385 78,580 64,339 - - 154,695 Services and fees 32,877 19,489 6,121 25,102 243,898 3,287 - 330,774 Travel 48,532 16,048 8,352 30,230 97,228 10,706 - 211,095 Subcontracts - 10 - 1,111 25,266 74,663 - 101,050 Capital - - - 35,420 112,990 10,035 - 158,445 Other 19,156 563 6,285 135,382 2,444 - 138,470 302,300 Total Non-Labor 140,640$ 50,823$ 33,941$ 408,236$ 1,202,376$ 120,903$ 138,470$ 2,095,389$ Total Expenses 2,278,323$ 97,023$ 62,020$ 591,600$ 2,679,175$ 184,837$ 138,470$ 6,031,448$
Revenues Over (Under) Expenses 94,650$ 36,433$ (6,790)$ (10,281)$ -$ -$ (157,100)$ (43,088)$
Reserves, beginning of year 21,603$ 224,397$ 155,547$ 652,214$ -$ -$ -$ 1,053,761$ Reserves, end of year 116,253$ 260,830$ 148,757$ 641,933$ -$ -$ -$ 1,167,772$
Source: UNM Banner Accounting System Exhibit 4
Unrestricted
Note: The Earth and Planetary Science Department's funding sources primarily consist of federal contracts and grants (45%) and I&G (40%). The Department's related expenses primarily consist of labor, which make up approximately 65% of total expenses. Faculty and GA/TA's make up the largest portion of labor expenses at 50% and 27%, respectively. The Department had revenues under expenses of ($43,088). However, unrestricted net income of $114,011 in addition to beginning of year reserves of $1,053,761 is $1,167,772, which is carried over to FY 2013 and is available for use.
Restricted
UNM College of Arts and SciencesFY 2012 Financial Analysis - Earth and Planetary Sciences Department
Fiscal Year Ended June 30, 2012

Revenues I&G Research Public Services Other Federal C&G Non-Federal C&G Endowment TotalI&G 3,413,448$ 74,719$ -$ -$ -$ -$ -$ 3,488,167$ Federal C&G's - - - - 1,496,498 - - 1,496,498 Non-Federal C&G's - - - - - 16,379 - 16,379 Other Revenues 19,642 58,200 14,583 18,630 - 13,616 (8,919) 115,752 Total Revenues 3,433,090$ 132,919$ 14,583$ 18,630$ 1,496,498$ 29,995$ (8,919)$ 5,116,796$
ExpensesFaculty 2,315,982$ -$ -$ -$ 462,641$ 8,550$ -$ 2,787,173$ GA/TA 720,981 7,432 - 4,504 171,401 - - 904,318 Staff 247,568 751 - - 19,503 - - 267,822 Student 42,975 - - - 648 - - 43,623 Tuition/Benefits 11,738 549 - 4,106 98,030 2,863 - 117,286 Total Labor 3,339,244$ 8,732$ -$ 8,610$ 752,223$ 11,413$ -$ 4,120,222$
Non-LaborSupplies 30,877 20,691 10,436 387 12,200 813 - 75,404 Facilities and administration - - - - 409,436 2,141 - 411,577 Scholarships and awards 545 - 6,270 - 47,676 - - 54,491 Services and fees 10,764 8,755 5,899 68 12,564 330 - 38,381 Travel 1,539 35,176 11,475 8,098 58,134 2,936 - 117,357 Subcontracts - 426 - - 182,060 - - 182,486 Capital 7,522 6,275 - - 22,205 - - 36,002 Other 9,197 1,247 276 83 - - 16,139 26,942 Total Non-Labor 60,444$ 72,570$ 34,356$ 8,636$ 744,275$ 6,220$ 16,139$ 942,640$ Total Expenses 3,399,688$ 81,302$ 34,356$ 17,246$ 1,496,498$ 17,633$ 16,139$ 5,062,862$
Revenues Over (Under) Expenses 33,402$ 51,617$ (19,773)$ 1,384$ -$ 12,362$ (25,058)$ 53,934$
Reserves, beginning of year 70,913$ 168,949$ 86,949$ 107,535$ -$ -$ -$ 434,346$ Reserves, end of year 104,315$ 220,566$ 67,176$ 108,919$ -$ -$ -$ 500,976$
Source: UNM Banner Accounting System Exhibit 5
Unrestricted
Note: The Mathematics and Statistics Department's funding sources primarily consist of I&G (67%) and federal contracts and grants (29%). The Department's related expenses primarily consist of labor, which make up approximately 81% of total expenses. Faculty and GA/TA's make up the largest portion of labor expenses at 68% and 22%, respectively. The Department had revenues over expenses of $53,934. Unrestricted net income of $66,630 in addition to beginning of year reserves of $434,346 is $500,976, which is carried over to FY 2013 and is available for use.
Restricted
UNM College of Arts and SciencesFY 2012 Financial Analysis - Mathematics and Statistics Department
Fiscal Year Ended June 30, 2012

Revenues I&G Research Public Service Other Federal C&G Non-Federal C&G Endowment TotalI&G 3,480,222$ 439,931$ -$ -$ -$ -$ -$ 3,920,153$ Federal C&G's - - - - 2,228,815 - - 2,228,815 Non-Federal C&G's - - - - - 54,030 - 54,030 Other Revenues 200,486 227,348 (8,900) 221,023 - - 66,736 706,693 Total Revenues 3,680,708$ 667,279$ (8,900)$ 221,023$ 2,228,815$ 54,030$ 66,736$ 6,909,691$
Expenses Faculty 1,683,934$ 147,569$ -$ -$ 541,847$ 21,000$ -$ 2,394,350$ GA/TA 565,810 23,159 - 4,634 295,202 28,143 - 916,948 Staff 570,749 996 660 30,898 22,059 - - 625,362 Student 182,499 (918) 705 - 27,409 - - 209,695 Tuition/Benefits 5,604 28,432 56 6,459 99,670 4,338 - 144,559 Total Labor 3,008,596$ 199,238$ 1,421$ 41,991$ 986,187$ 53,481$ -$ 4,290,914$
Non-LaborSupplies 225,982 165,612 9,918 18,146 297,167 246 - 717,071 Facilities and administration - - - - 651,633 - - 651,633 Scholarships and awards 4,925 600 300 24,000 - - - 29,825 Services and fees 61,877 10,808 165 1,917 81,762 - - 156,529 Travel 27,336 11,959 - 1,642 39,922 303 - 81,162 Subcontracts - 30 - - 125,937 - - 125,967 Capital - 51,579 - 67,984 43,257 - - 162,820 Other 56,056 15,792 101 16,471 2,950 - 85,407 176,776 Total Non-Labor 376,175$ 256,380$ 10,484$ 130,159$ 1,242,628$ 549$ 85,407$ 2,101,782$ Total Expenses 3,384,771$ 455,618$ 11,905$ 172,150$ 2,228,815$ 54,030$ 85,407$ 6,392,696$
Revenues Over (Under) Expenses 295,937$ 211,661$ (20,805)$ 48,873$ -$ -$ (18,671)$ 516,995$
Reserves, beginning of year 36,994$ 217,108$ 105,118$ 6,034$ -$ -$ -$ 365,254$ Reserves, end of year 332,931$ 428,769$ 84,313$ 54,907$ -$ -$ -$ 900,920$
Source: UNM Banner Accounting System Exhibit 6
UNM College of Arts and SciencesFY 2012 Financial Analysis - Chemistry Department
Fiscal Year Ended June 30, 2012
Unrestricted
Note: The Chemistry Department's funding sources primarily consist of I&G (53%) and federal contracts and grants (32%). The Department's related expenses primarily consist of labor, which make up approximately 67% of total expenses. Faculty and GA/TA's make up the largest portion of labor expenses at 56% and 21%, respectively. The Department had revenues over expenses of $516,995. Unrestricted net income of $535,666 in addition to beginning of year reserves of $365,254 is $900,920, which is carried over to FY 2013 and is available for use.
Restricted

Revenues I&G Research Public Services Other Federal C&G Non-Federal C&G Endowment TotalI&G 3,743,632$ 12,931$ 4,500$ 10,409$ -$ -$ -$ 3,771,472$ Federal C&G's - - - - - - - - Non-Federal C&G's - - - - - 86,920 - 86,920 Other Revenues 49,668 5,927 235,366 108,685 (7,793) (1,543) (18,850) 371,460 Total Revenues 3,793,300$ 18,858$ 239,866$ 119,094$ (7,793)$ 85,377$ (18,850)$ 4,229,852$
Expenses Faculty 2,168,024$ -$ 70,362$ 45,000$ 2,975$ 97,052$ -$ 2,383,413$ GA/TA 1,001,441 - 9,591 - - - - 1,011,032 Staff 249,288 - 240 - - - - 249,528 Student 5,609 - - - - - - 5,609 Tuition/Benefits 10,132 - 7,222 11,530 (15,367) 34,841 - 48,358 Total Labor 3,434,494$ -$ 87,415$ 56,530$ (12,392)$ 131,893$ -$ 3,697,940$
Non-LaborSupplies 56,880 7,869 13,118 2,278 500 1,014 - 81,660 Scholarships and awards 3,300 959 11,641 26,973 - - - 42,873 Services and fees 7,336 265 38,458 705 4,044 437 - 51,244 Travel 33,848 15,537 18,406 5,206 1,250 500 - 74,746 Capital 5,829 - - - - - - 5,829 Other 23,233 1,432 32,519 82 (1,195) - 121,490 177,560 Total Non-Labor 130,426$ 26,062$ 114,142$ 35,244$ 4,599$ 1,950$ 121,490$ 433,913$ Total Expenses 3,564,920$ 26,062$ 201,557$ 91,774$ (7,793)$ 133,843$ 121,490$ 4,131,853$
Revenues Over (Under) Expenses 228,380$ (7,204)$ 38,309$ 27,320$ -$ (48,466)$ (140,340)$ 97,999$
Reserves, beginning of year 209,322$ 16,478$ 222,638$ 141,169$ -$ -$ -$ 589,607$ Reserves, end of year 437,702$ 9,274$ 260,947$ 168,489$ -$ -$ -$ 876,412$
Source: UNM Banner Accounting System Exhibit 7
Unrestricted
Note: The English Department's funding sources primarily consist of I&G (90%). The Department's related expenses primarily consist of labor, which make up approximately 89% of total expenses. Faculty and GA/TA's make up the largest portion of labor expenses at 64% and 27%, respectively. The Department had revenues over expenses of $97,999. Unrestricted net income of $286,805 in addition to beginning of year reserves of $589,607 is $876,412 which is carried over to FY 2013 and is available for use.
Restricted
UNM College of Arts and SciencesFY 2012 Financial Analysis - English Department
Fiscal Year Ended June 30, 2012

Revenues I&G Research Public Services Other Federal C&G Non-Federal C&G Endowment TotalI&G 10,948,968$ (955,598)$ (3,100)$ -$ -$ -$ -$ 9,990,270$ Federal C&G's - - - - - - - - Non-Federal C&G's - - - - - - - - Other Revenues (209,968) 1,568,185 (21,375) 147,039 - 4,485 39,783 1,528,149 Total Revenues 10,739,000$ 612,587$ (24,475)$ 147,039$ -$ 4,485$ 39,783$ 11,518,419$
Expenses Faculty 3,841,475 953$ 23,200$ -$ -$ -$ -$ 3,865,628$ GA/TA 2,021,045 - 1,650 - - - - 2,022,695 Staff 1,153,278 66,776 3,456 - - - - 1,223,510 Student 71,486 - - - - - - 71,486 Tuition/Benefits 2,188,847 16,020 3,556 - - - - 2,208,423 Total Labor 9,276,130$ 83,749$ 31,862$ -$ -$ -$ -$ 9,391,741$
Non-LaborSupplies 76,917 140 9,667 25,650 - - - 112,374 Scholarships and awards 3,256 - 21,000 41,400 - - - 65,656 Services and fees 57,359 - 14,001 - - - - 71,361 Travel 45,119 - 13,218 - - - - 58,337 Other 12,628 6,153 593 228 - - 76,974 96,576 Total Non-Labor 195,279$ 6,293$ 58,479$ 67,278$ -$ -$ 76,974$ 404,304$ Total Expenses 9,471,409$ 90,042$ 90,341$ 67,278$ -$ -$ 76,974$ 9,796,045$
Revenues Over (Under) Expenses 1,267,591$ 522,545$ (114,816)$ 79,761$ -$ 4,485$ (37,191)$ 1,722,374$
Reserves, beginning of year 2,263,568 1,795,315$ 294,522$ 278,240$ -$ -$ -$ 4,631,645$ Reserves, end of year 3,531,159$ 2,317,860$ 179,706$ 358,001$ -$ -$ -$ 6,386,725$
Source: UNM Banner Accounting System Exhibit 8
Unrestricted
UNM College of Arts and SciencesFY 2012 Financial Analysis - Dean's Administrative Department
Fiscal Year Ended June 30, 2012
Note: The Administrative department's funding sources primarily consist of I&G (93%). Administrative related expenses primarily consist of labor, which make up approximately 96% of total expenses. Faculty and Tuition/Benefits make up the largest portion of labor expenses at 41% and 24%, respectively. Tuition/Benefits primarily consists of tuition waivers for graduate and teaching assistants. The Administration department had revenues over expenses of $1,722,374. Unrestricted net income of $1,755,080 in addition to beginning of year reserves of $4,631,645 is $6,386,725, which is carried over to FY 2013 and is available for use.
Restricted

Budgeted Revenues FY 2010 FY 2011 FY 2012 FY 2013I&G 56,996,166$ 59,430,757$ 62,811,847$ 58,642,031$ Other Revenues 15,194,268 13,381,629 15,171,822 18,213,469 Total Budgeted Revenues 72,190,434$ 72,812,386$ 77,983,669$ 76,855,500$
Budgeted ExpensesFaculty 34,331,302$ 34,336,445$ 34,810,292$ 37,740,291$ GA/TA 9,011,121 9,974,883 8,431,139 7,693,839 Staff 10,665,134 11,089,149 11,673,020 10,599,649 Student 401,305 477,629 454,091 423,664 Tuition/Benefits 2,713,606 2,694,591 2,836,820 3,549,162 Total Budgeted Labor 57,122,468$ 58,572,697$ 58,205,362$ 60,006,605$
Non-LaborSupplies 6,913,745$ 8,514,184$ 5,127,864$ 3,750,689$ Scholarships and awards 1,761,816 2,402,953 1,869,827 1,914,427 Services and fees 1,227,219 1,291,764 1,283,511 1,130,836 Travel 1,244,725 1,453,949 1,418,094 1,371,848 Subcontracts - 15,000 - 5,500 Capital 891,353 261,623 106,228 564,897 Other 3,029,108 300,216 9,972,783 8,110,698 Total Non-Labor 15,067,966$ 14,239,689$ 19,778,307$ 16,848,895$ Total Budgeted Expenses 72,190,434$ 72,812,386$ 77,983,669$ 76,855,500$
Budgeted Revenues Over (Under) Expenses - - - -
Source: UNM Banner Accounting System
Exhibit 9
Unrestricted Budget
UNM College of Arts and SciencesBudget Trend Analysis - Unrestricted Funds
Fiscal Years Ended June 30, 2010 - 2013

Over (under) Over (under) Over (under)Revenues Budget Actual Budget Revenues Budget Actual Budget Revenues Budget Actual Budget I&G 56,996,166$ 56,960,118$ (36,048)$ I&G 59,430,757$ 59,217,064$ (213,693)$ I&G 62,811,847$ 62,671,488$ (140,359)$ Other Revenues 15,194,268 9,164,486 (6,029,782) Other revenues 13,381,629 7,389,586 (5,992,043) Other revenues 15,171,821 10,107,714 (5,064,107) Total Revenues 72,190,434$ 66,124,604$ (6,065,830)$ Total Revenues 72,812,386$ 66,606,651$ (6,205,735)$ Total Revenues 77,983,668$ 72,779,201$ (5,204,467)$
Expenses Expenses ExpensesFaculty 34,331,302$ 35,110,710$ 779,408$ Faculty 34,336,445$ 35,247,363$ 910,918$ Faculty 34,810,292$ 35,407,470$ 597,178$ GA/TA 9,011,121 9,406,186 395,065 GA/TA 9,974,883 9,316,250 (658,633) GA/TA 8,431,139 9,892,052 1,460,913 Staff 10,665,134 9,431,827 (1,233,307) Staff 11,089,149 8,799,857 (2,289,292) Staff 11,673,020 9,046,944 (2,626,076) Student 401,305 577,986 176,681 Student 477,629 568,084 90,455 Student 454,091 630,204 176,113 Tuitions/Benefits 2,713,606 2,751,548 37,942 Tuitions/Benefits 2,694,591 2,637,075 (57,516) Tuitions/Benefits 2,836,820 2,991,667 154,847 Total labor 57,122,468$ 57,278,258$ 155,790$ Total labor 58,572,697$ 56,568,629$ (2,004,068)$ Total labor 58,205,362$ 57,968,338$ (237,024)$
Non-Labor Non-Labor Non-LaborSupplies 6,913,747$ 2,256,256$ (4,657,491)$ Supplies 8,514,185$ 2,550,254$ (5,963,931)$ Supplies 5,127,864$ 2,687,368$ (2,440,496)$ Scholarships and awards 1,761,816 1,775,384 13,568 Scholarships and awards 2,402,953 1,724,759 (678,194) Scholarships and awards 1,869,827 1,775,427 (94,400) Services and fees 1,227,219 1,486,996 259,777 Services and fees 1,291,764 1,424,386 132,622 Services and fees 1,283,511 1,520,230 236,719 Subcontracts - 126,270 126,270 Subcontracts 15,000 210,598 195,598 Subcontracts - (2,402) (2,402) Travel 1,244,725 1,163,586 (81,139) Travel 1,453,949 1,273,467 (180,482) Travel 1,418,094 1,254,279 (163,815) Capital 891,353 484,584 (406,769) Capital 261,623 485,383 223,760 Capital 106,228 468,587 362,359 Other 3,029,106 1,011,246 (2,017,860) Other 300,215 702,218 402,003 Other 9,972,782 1,069,352 (8,903,430) Total Non-Labor 15,067,966$ 8,304,323$ (6,763,643)$ Total Non-Labor 14,239,689$ 8,371,065$ (5,868,624)$ Total Non-Labor 19,778,306$ 8,772,841$ (11,005,465)$ Total expenses 72,190,434$ 65,582,581$ (6,607,853)$ Total expenses 72,812,386$ 64,939,694$ (7,872,692)$ Total expenses 77,983,668$ 66,741,179$ (11,242,489)$
Revenues over (under) expenses -$ 542,024$ 542,024$ Revenues over (under) expenses -$ 1,666,956$ 1,666,956$
Revenues over (under) expenses -$ 6,038,023$ 6,038,023$
Source: UNM Banner Accounting System
Exhibit 10
FY 2010 Budget vs. Actual FY 2011 Budget vs. Actual FY 2012 Budget vs. Actual
UNM College of Arts and SciencesBudget vs. Actual Analysis - Unrestricted Funds
Fiscal Years Ended June 30, 2010-2012

Over (under) Over (under) Over (under)Revenues Budget Actual Budget Revenues Budget Actual Budget Revenues Budget Actual BudgetFed C&G's 79,875,853$ 34,159,824$ (45,716,029)$ Fed C&G's 81,873,567$ 36,692,889$ (45,180,678)$ Fed C&G's 77,052,762$ 35,170,224$ (41,882,538)$ Non-Federal C&G's 8,427,057 4,991,239 (3,435,819) Non-Federal C&G's 7,874,803 4,268,926 (3,605,878) Non-Federal C&G's 7,404,170 3,414,613 (3,989,558) Other Revenues (6,716,058) 3,725,308 10,441,366 Other revenues (6,586,847) 6,406,372 12,993,220 Other Revenues (4,649,531) 1,693,059 6,342,590 Total Revenues 81,586,852$ 42,876,370$ (38,710,482)$ Total Revenues 83,161,523$ 47,368,187$ (35,793,336)$ Total Revenues 79,807,401$ 40,277,895$ (39,529,506)$
Expenses Expenses ExpensesFaculty 12,469,245$ 6,075,220$ (6,394,025)$ Faculty 13,258,209$ 6,867,378$ (6,390,832)$ Faculty 12,379,765$ 6,782,681$ (5,597,084)$ GA/TA 6,752,567 4,169,036 (2,583,532) GA/TA 7,174,424 4,498,356 (2,676,068) GA/TA 7,771,422 4,457,394 (3,314,028) Staff 13,503,974 4,903,419 (8,600,555) Staff 13,556,831 5,404,458 (8,152,373) Staff 11,772,667 4,795,060 (6,977,607) Student 267,537 926,890 659,353 Student 722,861 903,279 180,417 Student 1,910,229 1,031,501 (878,728) Tuitions/Benefits 9,392,141 3,208,667 (6,183,474) Tuitions/Benefits 9,995,024 3,542,349 (6,452,675) Tuitions/Benefits 9,206,110 3,048,871 (6,157,239) Total labor 42,385,465$ 19,283,232$ (23,102,233)$ Total labor 44,707,349$ 21,215,819$ (23,491,531)$ Total labor 43,040,193$ 20,115,506$ (22,924,687)$
Non-Labor Non-Labor Non-LaborSupplies 6,115,222$ 2,150,014$ (3,965,208)$ Supplies 5,900,551$ 2,045,054$ (3,855,497)$ Supplies 4,888,210$ 2,108,823$ (2,779,387)$ Scholarships and awards 7,460,105 2,977,019 (4,483,086) Scholarships and awards 5,992,808 1,998,365 (3,994,443) Scholarships and awards 5,721,835 1,508,438 (4,213,397) Facilities and Administration 17,876,658 7,918,852 (9,957,805) Facilities and Administration 19,063,502 8,548,718 (10,514,784) Facilities and Administration 18,852,097 8,717,645 (10,134,453) Services and fees 1,640,251 1,489,657 (150,593) Services and fees 1,533,854 1,891,926 358,072 Services and fees 1,567,705 1,729,168 161,463 Travel 3,261,992 1,470,412 (1,791,580) Travel 3,628,685 1,467,312 (2,161,373) Travel 3,556,499 1,454,795 (2,101,704) Subcontracts 4,679,197 2,040,901 (2,638,296) Subcontracts 4,695,155 2,239,267 (2,455,888) Subcontracts 5,136,576 2,180,528 (2,956,048) Capital 5,893,772 2,191,203 (3,702,569) Capital 5,013,889 2,013,354 (3,000,535) Capital 2,853,383 1,464,145 (1,389,238) Other (7,573,268) 1,942,612 9,515,879 Other (6,513,574) 1,376,416 7,889,990 Other (4,845,071) 1,381,654 6,226,724 Total Non-Labor 39,353,929$ 22,180,670$ (17,173,259)$ Total Non-Labor 39,314,869$ 21,580,413$ (17,734,456)$ Total Non-Labor 37,731,235$ 20,545,196$ (17,186,039)$ Total expenses 81,739,393$ 41,463,902$ (40,275,491)$ Total expenses 84,022,219$ 42,796,231$ (41,225,987)$ Total expenses 80,771,428$ 40,660,702$ (40,110,726)$
Revenues over (under) expenses (152,541)$ 1,412,469$ 1,565,010$ Revenues over (under) expenses (860,696)$ 4,571,955$ 5,432,651$ Revenues over (under) expenses (964,027)$ (382,807)$ 581,220$
Source: UNM Banner Accounting System
Exhibit 11
Note: Restricted budget amounts primarily reflect federal and non-federal contracts and grants. Budget amounts for contracts and grants are entered into Banner for the award period rather than a fiscal year period.
UNM College of Arts and SciencesBudget vs. Actual Analysis - Restricted Funds
Fiscal Years Ended June 30, 2010 - 2012
FY 2010 Budget vs. Actual FY 2011 Budget vs. Actual FY 2012 Budget vs. Actual

Department/ProgramNew T/TTL
Hires Lower Level Credit Hours
Upper Level Credit Hours
Graduate Credit Hours
Total Credit Hours T/TTL
Credit Hours Taught
Credit Hour to FTE
% Total Credit Hours
Non-T/TTL
Credit Hours Taught
Credit Hour to Non-FTE
% Total Credit Hours
Mathematics Statistics 10 41,933 5,660 847 48,440 37 10,498 284 21.67% 79 37,942 480 78.33%Psychology 1 23,701 16,550 1,145 41,396 27 19,531 723 47.18% 41 21,865 533 52.82%English 13 27,309 6,309 1,004 34,622 40 10,142 254 29.29% 121 24,480 202 70.71%Biology 5 21,168 5,843 499 27,510 43 24,134 561 87.73% 22 3,376 153 12.27%Sociology 6 13,728 11,538 336 25,602 19 5,388 284 21.05% 38 20,214 532 78.95%Communication Journalism 8 10,215 11,652 508 22,375 20 7,401 370 33.08% 68 14,974 220 66.92%History 3 11,892 8,019 414 20,325 28 17,166 613 84.46% 10 3,159 316 15.54%Anthropology 3 14,090 4,983 770 19,843 30 11,196 373 56.42% 45 8,647 192 43.58%Spanish Portuguese 4 12,048 6,801 756 19,605 18 3,141 175 16.02% 70 16,464 235 83.98%Chemistry 3 11,950 7,072 479 19,501 20 14,319 716 73.43% 6 5,182 864 26.57%Foreign Languages Literatures 5 12,672 4,046 361 17,079 15 8,268 551 48.41% 44 8,811 200 51.59%Physics Astronomy 2 14,579 1,390 486 16,455 33 11,053 335 67.17% 10 5,402 540 32.83%Economics 3 9,576 2,948 474 12,998 13 5,471 421 42.09% 19 7,527 396 57.91%Philosophy 2 9,072 2,280 104 11,456 13 5,417 417 47.29% 21 6,039 288 52.71%Political Science 2 5,277 3,480 292 9,049 19 5,839 307 64.53% 16 3,210 201 35.47%Religious Studies 1 6,963 1,590 - 8,553 6 6,030 1,005 70.50% 10 2,523 252 29.50%Linguistics 2 4,860 3,005 303 8,168 17 4,745 279 58.09% 20 3,423 171 41.91%Earth and Planetary Sciences 2 5,038 2,109 210 7,357 18 5,823 324 79.15% 13 1,534 118 20.85%American Studies 2 3,882 3,012 330 7,224 12 1,782 149 24.67% 30 5,442 181 75.33%Geography 2 3,468 1,404 306 5,178 10 2,841 284 54.87% 9 2,337 260 45.13%Interdisciplinary courses - 1,673 1,244 - 2,917 20 1,328 66 45.53% 14 1,589 114 54.47%Speech and Hearing Sciences 5 - 1,620 582 2,202 6 1,431 239 64.99% 4 771 193 35.01%African American Studies 1 660 1,461 - 2,121 4 1,155 289 54.46% 17 966 57 45.54%Womens Studies - 324 906 87 1,317 2 243 122 18.45% 9 1,074 119 81.55% Totals 85 266,078 114,922 10,293 391,293 470 184,342 736 206,951
(1)
Note 2: The credit hours reflected in the above schedule are for summer 2011, fall 2011 and spring 2012 school semesters.
Exhibit 12
Source: UNM Financial Planning Project Team and Dean's Administrative officeNote: T/TTL faculty consists of Assistant Professors, Associate Professors, Professors and Lecturers. Non-TTLs consist of Teacher Assistants
and Part-Time/Temporary faculty. Certain departments are primarily instructed by Part-Time/Temporary faculty members. Mathematics, English, Sociology and Spanish Portuguese are departments that have over 10,000 credit hours with over 70% of the credit hours taught by Part-Time/Temporary faculty members. These departments also have the lowest credit hour to T/TTL ratios. Classes within these disciplines are significantly instructed by Non-T/TTL faculty due to the significant number of lower level classes needed by undergraduate students. Based on new hires of T/TTLs, it appears that there was a focus on hiring T/TTLs for these disciplines.
(1) New hires consist of 59 Tenure/Track faculty and 26 full-time Lecturers. New Tenure Track faculty primarily consists of Assistant Professors (49).
UNM College of Arts and SciencesInstructional Workload Analysis
Fiscal Year 2012
Non-T/TTL FacultyT/TTL FacultyCredit Hours by Level

Department/ProgramAssistant Professor
Associate Professor Professor Lecturer
Assistant Professor
Associate professor Professor Lecturer
Assistant Professor
Associate Professor Professor Lecturer
Total T/TTL Faculty Hours
Mathematics Statistics 138 658 72 5,232 1,207 321 1,417 738 231 52 432 - 10,498 Psychology 1,356 6,537 669 1,890 1,344 5,399 324 909 48 791 264 - 19,531 English 480 330 255 3,783 1,029 327 1,797 1,161 259 343 336 42 10,142 Biology Department 648 4,368 1,160 12,460 257 1,119 3,094 560 135 7 326 - 24,134 Sociology Department 381 57 279 234 987 947 1,027 1,167 30 141 138 - 5,388 Communication Journalism 78 429 261 1,773 555 2,049 153 1,791 132 66 96 18 7,401 History Department 774 6,582 1,197 639 669 2,865 3,114 912 36 231 147 - 17,166 Anthropology 1,401 4,121 1,520 - 678 1,503 1,077 171 15 102 608 - 11,196 Spanish Portuguese 279 - - 3 453 897 363 390 180 417 87 72 3,141 Chemistry 4,175 - 1,765 1,432 740 644 1,484 3,600 182 64 233 - 14,319 Foreign Languages 936 72 2,766 987 81 1,115 1,428 550 21 138 51 123 8,268 Physics Astronomy 111 2,715 3,932 2,665 321 197 665 9 60 18 360 - 11,053 Economics 534 1,899 948 - 183 482 951 - 72 123 279 - 5,471 Philosophy - 1,788 1,011 783 843 759 159 - 42 32 - 5,417 Political Science 774 666 69 1,086 579 678 630 1,065 24 147 121 - 5,839 Religious Studies - - - 5,469 - - 108 453 - - - - 6,030 Linguistics - 168 363 1,497 522 698 1,062 177 93 39 126 - 4,745 Earth and Planetary Sciences - 264 1,004 2,499 311 1,625 - - 51 69 - 5,823 American Studies 324 54 - 198 177 357 180 162 69 66 195 - 1,782 Geography 1,332 - 549 - 438 183 156 - 108 - 75 - 2,841 Interdisciplinary Courses 78 354 192 - 186 126 353 39 - - - - 1,328 Speech and Hearing Sciences - - - - - 1,131 33 - - 267 - - 1,431 African American Studies - - - 333 60 129 - 633 - - - - 1,155 Womens Studies - - - - 96 - - 99 - - - 48 243 Totals 13,799 31,062 18,012 42,963 10,562 22,321 21,800 14,745 1,695 3,105 3,975 303 184,342
% of total credit hours 3.53% 7.94% 4.60% 10.98% 2.70% 5.70% 5.57% 3.77% 0.43% 0.79% 1.02% 0.08% 47.11%
Note 2: The credit hours reflected in the above schedule are for Summer 2011, Fall 2011 and Spring 2012 school semesters. Exhibit 13, 1 of 2
Note: Of the 391,293 credit hours taught during FY 2012, 47.11% were taught by T/TTL faculty and 52.89% by Teaching Assistants and Part-Time/Temporary faculty . Of the credit hours taught by T/TTL faculty, 78,506 (43%) were taught to upper level undergraduate and graduate level students. Of the credit hours taught by Non-T/TTLs 160,200 (77%) were taught to lower level undergraduate students. This indicates that T/TTL faculty are primarily responsible for teaching upper level undergraduate and graduate courses and Non-T/TTL faculty are primarly responsible for teaching lower level undergraduate courses. In addition, it appears upper level graduate and graduate courses are primarily taught by Professors and Associate Professors. Teacher Assistants are primarily responsible for teaching lower level courses (23%).
T/TTL Faculty by Rank
College of Arts and SciencesInstructional Workload Analysis by Faculty Rank
Fiscal Year 2012
Lower Level Credit Hours Upper Level Credit Hours Graduate Level Credit Hours

Department/ProgramTeaching Assistants
Temporary / Part-Time
Teaching Assistants
Temporary / Part-Time
Teaching Assistants
Temporary / Part-Time
Total Non-T/TTL Faculty
HoursTotal Credit
HoursMathematics Statistics 10,466 25,367 666 1,311 - 132 37,942 48,440 Psychology 4,645 8,604 3,210 5,364 - 42 21,865 41,396 English 19,296 3,165 135 1,860 - 24 24,480 34,622 Biology Department 951 1,581 31 782 - 31 3,376 27,510 Sociology Department 9,843 2,934 3,114 4,296 - 27 20,214 25,602 Communication Journalism 6,714 960 4,716 2,388 46 150 14,974 22,375 History Department 789 1,911 240 219 - - 3,159 20,325 Anthropology 4,270 2,778 234 1,320 - 45 8,647 19,843 Spanish Portuguese 11,352 414 3,018 1,680 - - 16,464 19,605 Chemistry - 4,578 - 604 - - 5,182 19,501 Foreign Languages 6,753 1,158 221 651 - 28 8,811 17,079 Physics Astronomy - 5,156 - 198 - 48 5,402 16,455 Economics 2,904 3,291 1,008 324 - - 7,527 12,998 Philosophy 4,419 1,071 270 249 - 30 6,039 11,456 Political Science 2,436 246 165 363 - - 3,210 9,049 Religious Studies - 1,494 - 1,029 - - 2,523 8,553 Linguistics 2,091 741 288 258 - 45 3,423 8,168 Earth and Planetary Sciences 575 696 84 89 - 90 1,534 7,357 American Studies 2,862 444 507 1,629 - - 5,442 7,224 Geography 183 1,404 80 547 - 123 2,337 5,178 Interdisciplinary Courses - 1,007 6 576 - - 1,589 2,917 Speech and Hearing Sciences - - - 456 - 315 771 2,202 African American Studies 261 66 219 420 - - 966 2,121 Womens Studies 234 90 72 639 - 39 1,074 1,317 Totals 91,044 69,156 18,284 27,252 46 1,169 206,951 391,293
% of total credit hours 23.27% 17.67% 4.67% 6.96% 0.01% 0.30% 52.89%
Source: UNM Financial Planning Project Team
Exhibit 13, 2 of 2
Upper Level Credit HoursLower Level Credit HoursNon-T/TTL Faculty by Rank
Graduate level Credit Hours
College of Arts and SciencesInstructional Workload Analysis by Faculty Rank
Fiscal Year 2012