Embed Size (px)
Citation preview

Prepared by
Andrea Turner (ISF, UTS) Greg Hausler (Cardno) Naomi Carrard (ISF, UTS) Alex Kazaglis (ISF, UTS) Stuart White (ISF, UTS) Aneurin Hughes (Cardno) Trevor Johnson (Cardno)
for
Mary River Council of Mayors
Review of Water Supply-Demand Options
for South East Queensland
Final Report
UTS February 2007
Institute for Sustainable Futures University of Technology, Sydney PO Box 123 Broadway, NSW, 2007
Cardno PO Box 388 Toowong, Qld, 4066


Institute for Sustainable Futures, UTS and Cardno February 2007
Review of Water Supply-Demand Options for South East Qld – Final Report
Document status and history:
No. Description Date 1.0 Draft report 09 January 2007 2.0 Draft report 31 January 2007 3.0 Draft report 5 February 2007 4.0 Final report 14 February 2007
Cite this report as:
Turner, A., Hausler, G., Carrard, N., Kazaglis, A., White, S., Hughes, A. and Johnson, T. (2007) Review of Water Supply-Demand Options for South East Queensland, Institute for Sustainable Futures, Sydney and Cardno, Brisbane, February.
Disclaimer:
While all due care and attention has been taken to establish the accuracy of the material published, UTS/ISF and Cardno and the authors disclaim liability for any loss that may arise from any person acting in reliance upon the contents of this document.


Institute for Sustainable Futures, UTS and Cardno February 2007
Review of Water Supply-Demand Options for South East Qld – Final Report i
EXECUTIVE SUMMARY
This independent Review aims to assess the Queensland Government’s proposed strategy for meeting the long-term water supply-demand balance for South East Queensland, of which the Traveston Crossing scheme is a major and controversial component. The Review, conducted by a team from the Institute for Sustainable Futures at the University of Technology, Sydney and Cardno, concludes that a diverse portfolio of options can ensure supply security for South East Queensland (SEQ) well into the future, certainly to 2050. Such options include: increasing water supply availability (supply-side options); decreasing the demand for water (demand-side options); and meeting water supply needs during deep droughts (drought response options).
A number of the elements of such a portfolio are already being implemented as part of the current Queensland Government strategy. With the extension and addition of low unit cost demand-side options and supply-side drought response ‘readiness’ options, a clear conclusion of this Study is that the proposed dam at Traveston Crossing on the Mary River is neither necessary nor desirable as a part of the portfolio for ensuring supply security to 2050. The increase in supply from this proposed dam will not assist in the short-term during the current severe drought in which water (from savings and supply) is needed over the next two to three years. Planned completion of the Traveston Crossing Dam Stage 1 is in 2012. Additional time will be needed for the Dam to fill, which could take an additional two years, resulting in the yield from this source only potentially being available in 2014. Neither is the Traveston Crossing scheme needed for supply-demand balance in the longer term with the suite of other more appropriate drought response measures being implemented by the Queensland Government and strategy being proposed as part of this Study. The proposed dam at Traveston Crossing on the Mary River represents a high total cost, high unit cost, high risk and high environmental and social impact option. Hence using key decision-making criteria the Traveston Crossing scheme should not be considered for implementation and human and financial resources currently allocated to this project should be re-allocated to dealing with the response to the current drought.
The objective of urban water planning is to ensure that supply availability (system yield) meets the demand for the planning period at the least economic, environmental and social cost. In the current planning for the SEQ system, estimates of system yield for SEQ have been significantly reduced from 635 GL/a to 450 GL/a. This is primarily as a result of recent changes in the way system yield is calculated and the assumptions regarding the level of restrictions (frequency, depth, duration) that are deemed acceptable by the community. The assumptions now being used are very conservative, and differ significantly from standards that apply in comparable cities. In addition there is no clear evidence that these changes have been based on any surveys or community engagement processes to determine what is deemed acceptable to the community.
The projections of business-as-usual (or reference case) water demand assume a residential demand (not including non residential and non revenue water) of 300 litres per capita per day for a period extending to 2050. Climate, lot size and the proportion of single detached households compared to flats and units and the associated number of occupants play a major role in how much water is used per person and per household. The figure of 300 litres per capita per day being used for projections is significantly higher than the demand in comparable eastern seaboard capital cities. This projection being used to forecast to 2050 is therefore likely to be a significant overestimate, as it does not adequately take into consideration expected downward pressure on water demand due to changes in land use (urban consolidation and the shift to more flats and units with the associated reduction in lawn and garden area) and the improving efficiency of water using equipment such as dual flush toilets and washing machines.
The Queensland Government estimate of the supply-demand gap is considered to be extreme and unjustified. The combination of these projections of reduced yield and elevated demand has implications for the supply-demand balance in 2050 of several hundred billion litres per year (GL/a). This difference in the supply-demand balance estimate is significantly greater than the yield of the proposed dam at Traveston Crossing on the Mary River. Nonetheless, for the analysis in this Study,

Institute for Sustainable Futures, UTS and Cardno February 2007
Review of Water Supply-Demand Options for South East Qld – Final Report ii
we have used the yield and demand projections as stated in SEQ planning documents to enable direct comparison with publicly available Queensland Government data.
The suite of supply and demand-side options currently being implemented by the Queensland Government to address the current drought, not including a dam at Traveston Crossing on the Mary River will mean that the long-term supply-demand balance will be met until around 2030, even using these extreme projections of yield and demand. These options range from groundwater, source renewal, desalination and demand management to reuse.
To meet the supply-demand balance beyond 2030, a diverse range of additional supply and demand-side options have been assessed, in order to develop a robust strategy. The package of options with the lowest economic, environmental and social cost, which is sufficient to meet the assumed supply-demand balance to 2050, comprises a diverse suite of extended and new demand management options. The most effective option, based on current experience in many places around Australia, including Pimpama Coomera on the Gold Coast, focus on improving the efficiency of water use and increasing recycling and rainwater capture in new developments. New developments are driving the increase in demand, so a strategy which directs attention towards this growth sector, is likely to be most effective at curbing the upward pressure on demand. Other options include water efficiency standards for water using appliances and fixtures, extending the existing rebate, retrofit and business water saving programs and outdoor water efficiency programs.
With the implementation of these demand-side options, in addition to the existing suite of supply-side and demand-side options proposed by the Queensland Government, there will be no need for a dam at Traveston Crossing on the Mary River, or other additional supply infrastructure, in order to meet the supply-demand balance over the period to 2050. Depending on how such demand-side options are implemented this suite of options has the potential to save over 180 GL/a of water by 2050 at an average unit cost of $1.15 /kL. For comparison, the Traveston Crossing scheme will supply approximately 150 GL/a by 2050 at a unit cost of approximately $3.00 /kL, which is likely to increase further as the cost estimates for this scheme are refined. Further, the proposed strategy will reduce greenhouse gas emissions relative to the Traveston Crossing scheme by approximately 1,000,000 tonnes per year.
In the event of a deep drought worse than the current drought (which is itself the worst on record for the Wivenhoe-Somerset system) or a worsening of the current drought, ‘readiness’ options, which are non rainfall dependent, offer a much lower risk and lower unit cost alternative to the Traveston Crossing scheme. The idea of readiness options is that the planning, design, land acquisition and approvals are all obtained. However, the construction is triggered only in the event of a deep and prolonged drought, thus offering effective insurance against a low probability event and the ability to adaptively respond to changed circumstances. The risk-weighted cost of such a strategy is a fraction of the cost of pre-emptively building new supply options, especially such a high cost, high-risk alternative as the proposed dam at Traveston Crossing on the Mary River. Suitable candidates for such a readiness strategy include indirect potable reuse in a range of locations, followed by scaleable desalination capacity at Bribie Island. Indirect potable reuse is preferable in terms of the greenhouse gas emission intensity and other environmental benefits, but is dependent on suitable community engagement processes. Indirect potable reuse was to be the subject of a plebiscite in March 2007. However, the plebiscite was cancelled as this report was being finalised and indirect potable reuse will now be used to assist in the current drought strategy as part of the Western Corridor Recycled Water Scheme.
This Study outlines a robust strategy for meeting the supply-demand balance within the planning horizon of 2050, without needing to construct a dam at Traveston Crossing on the Mary River. This is a strategy that has significantly lower costs, reduced greenhouse gas emissions and reduced environmental and social impact. It also offers an adaptive approach to changing circumstances in terms of yield and demand. This Study also makes a series of recommendations to improve the transparency and level of community engagement in water planning in SEQ.

Institute for Sustainable Futures, UTS and Cardno February 2007
Review of Water Supply-Demand Options for South East Qld – Final Report iii
TABLE OF CONTENTS
1 INTRODUCTION................................................................................................... 1
1.1 Background .........................................................................................................................................................1
1.2 This Study ............................................................................................................................................................1
1.3 Approach..............................................................................................................................................................2
1.4 Report Structure.................................................................................................................................................3
2 THE STUDY AREA............................................................................................... 4
2.1 Boundary of analysis ..........................................................................................................................................4
2.2 SEQ demographics .............................................................................................................................................5 2.2.1 Current and projected population.................................................................................................................5 2.2.2 Current and projected water demand...........................................................................................................8
2.3 SEQ water supplies ..........................................................................................................................................12 2.3.1 Urban Surface Water Supply Systems.......................................................................................................15 2.3.2 Urban Groundwater Supply Systems.........................................................................................................15 2.3.3 Irrigation and Surface Water Supply Sources ...........................................................................................16 2.3.4 Strategic Reserve – Water Resource Plan .................................................................................................16
2.4 Levels of Service................................................................................................................................................18
2.5 The current supply-demand balance.............................................................................................................20
3 SEQ PROPOSED SUPPLY-DEMAND STRATEGY........................................... 21
3.1 SEQ water management: drought response and long-term planning .....................................................21
3.2 Demand side initiatives ....................................................................................................................................22
3.3 Supply side initiatives.......................................................................................................................................26
3.4 Gaps and opportunities in current planning................................................................................................34
4 STUDY TEAM PROPOSED STRATEGY ........................................................... 36
4.1 Overview of approach......................................................................................................................................36
4.2 Economic analysis.............................................................................................................................................36
4.3 Demand-side options ........................................................................................................................................37
4.4 Supply-side options...........................................................................................................................................42 4.4.1 Groundwater Sources..................................................................................................................................44 4.4.2 Surface Water Sources................................................................................................................................45 4.4.3 Desalination.................................................................................................................................................46 4.4.4 Recycled Water (Indirect Potable Reuse)..................................................................................................47 4.4.5 Recommissioning of Existing Inactive Water Sources ............................................................................50 4.4.6 Acquisition of Rural Water Allocation......................................................................................................51

Institute for Sustainable Futures, UTS and Cardno February 2007
Review of Water Supply-Demand Options for South East Qld – Final Report iv
4.4.7 Transfer of water from Northern New South Wales rivers ......................................................................52 4.4.8 Benefits of Interconnection of Sources .....................................................................................................53 4.4.9 Supply-side Readiness Options..................................................................................................................55 4.4.10 Summary of costs and yields....................................................................................................................56
4.5 Options Comparison ........................................................................................................................................58 4.5.1 Quantifiable indicators ...............................................................................................................................58 4.5.2 Greenhouse Gas Impacts ............................................................................................................................61 4.5.3 Other externalities and impacts ..................................................................................................................63 4.5.4 Community engagement.............................................................................................................................66
4.6 The Strategy ......................................................................................................................................................68
5 FINDINGS AND RECOMMENDATIONS ............................................................ 69
6 REFERENCES.................................................................................................... 75
LIST OF FIGURES FIGURE 2-1 STUDY AREA ................................................................................................................................. 4 FIGURE 2-2 VARIATION IN POPULATION PROJECTIONS ..................................................................................... 6 FIGURE 2-3 POPULATION GROWTH AREAS....................................................................................................... 7 FIGURE 2-4 A SNAPSHOT OF EXISTING WATER DEMAND BY LGA AND SECTOR ............................................... 9 FIGURE 2-5 STUDY TEAM PROJECTED REFERENCE CASE DEMAND BY SECTOR .............................................. 11 FIGURE 2-6 STUDY TEAM PROJECTED REFERENCE CASE DEMAND BY LGA (GROUPED BY GEOGRAPHICAL LOCATION) ..................................................................................................................................................... 11 FIGURE 2-7 EXISTING WATER SUPPLY SOURCES – SEQ................................................................................ 14 FIGURE 2-8 THE SUPPLY-DEMAND BALANCE.................................................................................................. 20 FIGURE 3-1 SEQ DEMAND-SIDE INITIATIVES .................................................................................................. 25 FIGURE 3-2 SEQ PROPOSED SUPPLY-SIDE INITIATIVES ................................................................................. 30 FIGURE 3-3 RELATIVE YIELD FROM SEQ PROPOSED SUPPLY-SIDE INITIATIVES COMPARED TO POPULATION GROWTH AREAS ............................................................................................................................................. 31 FIGURE 3-4 THE SEQ PROPOSED SUPPLY-DEMAND BALANCE ...................................................................... 32 FIGURE 3-5 SUPPLY-DEMAND BALANCE ........................................................................................................ 34 FIGURE 4-1 SEQ AND NEW STUDY TEAM PROPOSED DEMAND-SIDE OPTIONS ................................................ 40 FIGURE 4-2 SUPPLY CURVE OF NEW STUDY TEAM PROPOSED DEMAND-SIDE OPTIONS (2050) ....................... 41 FIGURE 4-3 POTENTIAL WATER SUPPLY SOURCES IN SEQ .......................................................................... 43 FIGURE 4-4 DIAGRAM ILLUSTRATING MULTI-BARRIER TREATMENT PROCESSES IN IPR................................ 48 FIGURE 4-5 DIAGRAM OF PROPOSED SEQ WATER GRID .............................................................................. 53 FIGURE 4-6 UNIT COST AND YIELD OF VARIOUS OPTIONS VERSUS THE TRAVESTON CROSSING SCHEME (2050)...................................................................................................................................................................... 60 FIGURE 4-7 GREENHOUSE INTENSITY OF OPTIONS......................................................................................... 61 FIGURE 4-8 GREENHOUSE IMPACTS OF OPTION PORTFOLIOS......................................................................... 62 FIGURE 4-9 THE ROLE OF DELIBERATIVE PROCESSES FOR COMMUNITY ENGAGEMENT IN WATER SUPPLY-DEMAND PLANNING (FROM WHITE ET AL. 2006B). ......................................................................................... 67

Institute for Sustainable Futures, UTS and Cardno February 2007
Review of Water Supply-Demand Options for South East Qld – Final Report v
LIST OF TABLES TABLE 2-1 PIFU 2006 POPULATION PROJECTIONS BY LGA (MEDIUM SERIES) ............................................... 5 TABLE 2-2 POPULATION PROJECTIONS............................................................................................................ 6 TABLE 2-3 EXISTING URBAN WATER SUPPLY STORAGES IN SEQ ................................................................ 13 TABLE 2-4 ALLOCATIONS FOR THREE SUNWATER WATER SUPPLY SCHEMES.............................................. 16 TABLE 2-5 COMMITMENT OF STRATEGIC RESERVE ....................................................................................... 17 TABLE 3-1 TARGETS FOR RESIDENTIAL WATER DEMAND IN SEQ .................................................................. 22 TABLE 3-2 SEQ DEMAND MANAGEMENT PROGRAMS AND ANTICIPATED WATER SAVINGS.............................. 24 TABLE 3-3 SEQ PROPOSED SUPPLY-SIDE INITIATIVES................................................................................... 28 TABLE 4-1 EFFICIENCY LEVELS IN THE RESIDENTIAL SECTOR ........................................................................ 37 TABLE 4-2 STUDY TEAM PROPOSED NEW DEMAND-SIDE OPTIONS ................................................................. 38 TABLE 4-3 SUMMARY OF COSTS AND SAVINGS OF NEW STUDY TEAM PROPOSED DEMAND-SIDE OPTIONS...... 41 TABLE 4-4 STUDY TEAM NEW SUPPLY-SIDE OPTIONS..................................................................................... 42 TABLE 4-5 ESTIMATED SET-UP COSTS FOR BRIBIE ISLAND DESALINATION CAPACITY .................................... 56 TABLE 4-6 SUMMARY OF COSTS AND YIELD OF STUDY TEAM NEW PROPOSED SUPPLY-SIDE “READINESS” OPTIONS......................................................................................................................................................... 56 TABLE 4-7 SUMMARY OF COSTS AND YIELDS OF STUDY TEAM NEW GROWTH SUPPLY-SIDE OPTIONS............. 57 TABLE 4-8 SUMMARY OF COSTS AND YIELDS OF VARIOUS STAGES OF THE TRAVESTON CROSSING SCHEME 57 TABLE 4-9 SUMMARY OF QUANTIFIABLE CRITERIA CONSIDERED.................................................................... 59 TABLE 4-10 BRIEF SUMMARY OF NON QUANTIFIABLE EXTERNALITIES ........................................................... 64
APPENDICES APPENDIX A SEQ PROPOSED OPTIONS – FACT SHEETS
APPENDIX B NEW STUDY PROPOSED OPTIONS – FACT SHEETS
APPENDIX C CALCULAITON OF UNIT COST

Institute for Sustainable Futures, UTS and Cardno February 2007
Review of Water Supply-Demand Options for South East Qld – Final Report vi
ABBREVIATIONS
ABS Australian Bureau of Statistics
BWEP Business Water Efficiency Program
CARL current annual real losses
DLGP Queensland Department of Local Government and Planning
DNRM Queensland Department of Natural Resources, Mines and Water (now DNRW)
DNRW Queensland Department of Natural Resources and Water
EPA Queensland Environmental Protection Agency
EPBC Act Environmental Protection and Biodiversity Conservation Act 1999 (Cth)
FSL full supply level
HNFY historical no failure yield
GHG greenhouse gas
GL/a gigalitres per annum (billion litres per annum)
IPR Indirect Potable Reuse
IROL Interim Resource Operations Licence
IRP Integrated Resource Planning
IWA International Water Association
kL/a kilolitres per annum (thousand litres = 1 cubic metre)
kL/hh/a kilolitres per household per annum
kWh kilowatt hours of electricity use
LCD litres of water used per capita per day
LGA Local Government Area
LOS Levels of Service
ML/a megalitres per annum (million litres per annum)
OESR Queensland Office of Economic and Social Research
OUM Queensland Office of Urban Management
PIFU Queensland Population Information Forecasting Unit
QDC Queensland Development Code
Qld Queensland
QWC Queensland Water Commission
SEQ South East Queensland
SEQRWSS South East Queensland Regional Water Supply Strategy
UARL unavoidable annual real losses
WRP Water Resource Plan
WSAA Water Services Association of Australia

Institute for Sustainable Futures, UTS and Cardno February 2007
Review of Water Supply-Demand Options for South East Qld – Final Report 1
1 INTRODUCTION
1.1 Background South East Queensland (SEQ) is one of the fastest growing areas in Australia. In response to growth, the Queensland (Qld) Government set up the SEQ Regional Water Supply Strategy (SEQRWSS) to focus on long-term water planning of the SEQ area over the next 50 years. A significant number of investigations have recently been conducted by the SEQRWSS including water demand forecasting, assessment of the yield from current supply sources and investigation into both demand and supply-side options to meet the future anticipated supply-demand gap.
The recent drought in SEQ has forced the Qld Government to turn its attention not only to long-term planning but to also consider short-term emergency drought response measures. Following the development of the drought strategy in 2005 (SEQWater, 2005) emergency legislation was passed in 2006 in the form of the Water Amendment Regulation No. 6. The purpose of this legislation is to facilitate implementation of a number of drought response measures in the Government’s drought strategy. One option – the Traveston Crossing scheme Stage 1 – identified as a potential medium to long-term option (DNRW, 2006), but not originally included in the documented drought strategy, has now been included as a drought response measure in the Water Amendment Regulation.
Hence the Qld Government has identified that the Traveston Crossing scheme will be constructed as a major supply source for the SEQ region. The Traveston Crossing scheme aims to supply 150,000 ML/annum (prudent yield) once fully developed. The scheme is currently still under detailed investigation. From available information Stage 1 is planned for completion in 2012 and will supply 70,000 ML/a. With the raising of Borumba Dam on a tributary of the Mary River (known as Borumba Stage 3) in 2025 a further 40,000 ML/a of prudent yield will be available. The remaining 40,000 ML/a prudent yield is planned for 2042 with a significant portion of the land acquisition, dam wall construction, road modifications and pipeline connections included as part of Stage 1.
The Traveston Crossing scheme represents a major component of what the Qld Government have developed as their drought response and medium to long-term water planning strategies.
1.2 This Study The Mary River Council of Mayors represents a community of half a million people to the north of the SEQ region. Due to:
• the direct and significant impact of the Traveston Crossing scheme on their area and community;
• the perceived deficiency in community consultation and the decision-making processes; and
• concerns that the Traveston Crossing scheme is inappropriate from economic, social, environmental and risk perspectives,
the Mary River Council of Mayors has commissioned an independent review of supply and demand-side options for the SEQ region.
This Study “Review of Water Supply-Demand Options for South East Queensland” (the Study) has been undertaken by the Institute for Sustainable Futures (ISF), part of the University of Technology, Sydney, and Cardno. Both organisations are well respected for their work in the water industry including ISF’s recent work with the NSW Cabinet Office on the “Review of the Metropolitan Water Plan” for Sydney (White et al, 2006), which uses a similar approach to the one used for this Study.

Institute for Sustainable Futures, UTS and Cardno February 2007
Review of Water Supply-Demand Options for South East Qld – Final Report 2
The Study provides an overarching independent review of the supply-demand balance over the planning horizon, using the most recently available information1. The review focuses on the medium to long-term supply-demand balance and aims to determine what portfolio of options are most appropriate from economic and social, environmental and risk perspectives. It takes into consideration the significant drought response measures already being implemented by the Qld Government and how the SEQ options will benefit the short, medium and long-term. During the review process the Study team has highlighted where there are opportunities to refine the analysis already undertaken and identified alternative options that could be implemented to meet the needs of the SEQ community.
The Mary River Council of Mayors believes that alternatives to the construction of the Traveston Crossing scheme are available and preferable. These alternatives will not only meet the water needs of SEQ but also be advantageous when the full costs (and where possible benefits) are considered. This will give the Qld Government the opportunity of providing the Qld community affected by this important decision with a better outcome (economically, socially and environmentally and from a risk perspective).
1.3 Approach The Study team have reviewed and used data and information from publicly available reports. During the finalisation of this Study additional information has been released. Where possible such information has been incorporated. A significant number of additional reports have been undertaken by and for various Qld Government departments, which contain more detailed data/information and updates on the costs and yields of various options and the projected supply-demand balance. The Study team have requested these key documents from both the Department of Natural Resources and Water (DNRW) and the Qld Water Commission (QWC).
Unfortunately these reports have not been made available to the Study team. Hence the most recent publicly available information has been used to inform the Study team and for analysis purposes. This information has been combined with the professional knowledge of the Study team and of individuals involved in various aspects of water planning in SEQ.
Recommendation 1.1
Whilst it is acknowledged that in some cases water planning studies being undertaken in the SEQ region may contain information that is commercially sensitive, it is recommended that reports be structured in a way that allows analysis undertaken on behalf of the community of Queensland to be made publicly available as part of a transparent decision making process.
The approach used by the Study team as part of the review process is based on the principles of integrated resource planning (IRP) which is considered best practice internationally. The key principles of IRP include (Turner et al, 2007):
Water service provision – This principle recognises that water is a derived demand, and that customers require the service that water provides (e.g. clean clothes, sanitation, landscapes) rather than the water itself. This means that if the same level of service can be provided with differently sourced water, or through improved efficiency, then a kilolitre of water saved per year is equivalent to a kilolitre of water supplied per year.
1 The majority of this Study was undertaken at the end of 2006. Additional information released in January 2007 has been added where possible during the finalisation of the Study report.

Institute for Sustainable Futures, UTS and Cardno February 2007
Review of Water Supply-Demand Options for South East Qld – Final Report 3
Detailed demand forecasting – Disaggregation of demand into end uses of water such as toilets, showers and outdoor use enables detailed demand forecasting but also the determination of the water conservation potential, which is the potential amount of water that can be saved from that end use.
Consideration of a broad range of options that can meet the water service needs - For water resources, this means that water efficiency, source substitution, reuse and supply options are all considered.
Comparison of options using a common metric, boundary and assumptions - In this way the economic analysis ensures that the water service provider supplies services at the lowest cost to society, considering the costs and benefits to all stakeholders including the water utility, customer and government. A common metric, such as the unit cost or net present value, can be used for comparison of options or portfolios of options. A common boundary for analysis (what is included and what is not) means decision-makers can consider benefits and externalities such as energy savings, greenhouse gases, social, environmental and risk issues for all options equally using the same basic assumptions including discount rate and timeframe.
A participatory process – This principle recognises that water service provision interacts with many other facets of natural resource management, urban development and citizen preferences. Hence the involvement of a diverse group of stakeholders, and strong community engagement at appropriate points of the planning process will be necessary to identify and respond to multiple needs and objectives and accommodate different values.
Adaptive management – Emphasis on iteration both within the IRP process and repeating the steps of the IRP process at regular intervals over time assists in providing outcomes and solutions to planning needs that can be modified over time. In this way short-term needs are addressed, at the same time as ensuring movement towards desirable long-term outcomes.
As part of the review process these principles have been used to assist in determining potential opportunities in how the current Qld Government approach to water planning could be improved.
The Study team have undertaken analysis and limited modelling within the feasible scope of the Study. The figures such as yield and costs provide indicative figures from available information and the knowledge and experience of the Study team. This analysis therefore provides a broad assessment of the key issues using the principles of IRP. It aims to provide this in one document for the community of SEQ affected by the construction of the dam at Traveston Crossing on the Mary River, the broader community of SEQ who will use and need to pay for augmentation of the current water supply system and decision makers alike that are grappling with large volumes of information from diverse sources.
1.4 Report Structure • Section 2 provides an overview of the study area looking at population, water supplies and water
demand.
• Section 3 reviews the SEQ proposed demand and supply-side options.
• Section 4 presents an alternative preferred strategy proposed by the study team.
• Appendices A and B provide fact sheets for each of the SEQ proposed options and new study proposed options. Each fact sheet describes costs and anticipated yields of each option as well as other key information.
• Appendix C provides further details on the calculation of unit cost.
The executive summary and key findings and recommendations are provided at the front of the report.

Institute for Sustainable Futures, UTS and Cardno February 2007
Review of Water Supply-Demand Options for South East Qld – Final Report 4
2 THE STUDY AREA
2.1 Boundary of analysis The analysis undertaken for this Study in terms of both supply and demand focuses predominantly on the 18 SEQ Local Government Areas (LGAs) identified in Figure 2-1. Other adjacent areas such as Cooloola (affected by the proposed Traveston Crossing scheme) have been incorporated where necessary.
Figure 2-1 Study area
Source – DNRM, 2005

Institute for Sustainable Futures, UTS and Cardno February 2007
Review of Water Supply-Demand Options for South East Qld – Final Report 5
2.2 SEQ demographics
2.2.1 Current and projected population During the preparation of various reports as part of the SEQRWSS, population projections have changed significantly. The Dept of Local Government and Planning (DLGP) and associated Population Information and Forecasting Unit (PIFU) provide these population projections at an LGA level to 2026 and at the state level between 2026 and 2050. Medium series population projections by LGA to 2026 are shown in Table 2-1.
Brisbane City and Gold Coast alone represent over 50% of the population in both 2001 and 2026.
Table 2-1 PIFU 2006 population projections by LGA (medium series)
LGA 2001 2026 Beaudesert Shire 53,977 133,149 Boonah Shire 8,387 10,125 Brisbane City 896,649 1,164,095 Caboolture Shire 114,338 210,231 Caloundra City 76,207 165,883 Esk Shire 14,773 19,652 Gatton Shire 15,579 21,967 Gold Coast City 423,719 762,523 Ipswich City 126,663 347,453 Kilcoy Shire 3,312 4,619 Laidley Shire 13,089 25,069 Logan City 167,507 210,233 Maroochy Shire 127,202 249,412 Noosa Shire 43,758 58,432 Pine Rivers Shire 122,303 215,700 Redcliffe City 49,891 62,673 Redland Shire 117,252 182,678 Toowoomba City 90,027 115,587
Source – PIFU 2006
The 2003, 2005 and 2006 population projections have been used in various reports, which have subsequently been used to project water demand. The latest projections used in publicly available SEQRWSS reports are based on PIFU 2006 projections (DNRW, 2006). The difference between 2005 and 2006 projections are shown in Table 2-2. The difference between the 2003, 2005 and latest 2006 PIFU projections are also shown in Figure 2-1. The latest PIFU population figures are significantly higher by 20502.
2 It should be noted that a proportion of the existing and growing population may not be serviced by a reticulated water system (DNRM, 2004, p37).

Institute for Sustainable Futures, UTS and Cardno February 2007
Review of Water Supply-Demand Options for South East Qld – Final Report 6
Table 2-2 Population projections
Year 2005 Population projections
2006 Population projections
2001 2,470,000 2,470,000 2004 2,650,000 2,650,000 2006 2,780,000 2,780,000 2016 3,265,000 3,375,000 2026 3,709,000 3,960,000 2050 4,500,000 5,080,000
Source – DNRW (2006) “Water for Queensland: A long term solution”3.
Figure 2-2 Variation in population projections
Source – DNRM 2004 and DNRW 2006 based on 2003, 2005, 2006 projections
These changes in population projections will have significant implications for projections of water demand. For example, for the residential sector alone a shift in assumed population in 2050 of 580,000 will result in an increase in demand of 64 GL/a (assuming a residential demand of 300 litres/capita/day). Associated non residential and non revenue water will increase this water demand further.
The significant increase in population will mainly be located in the southern end of the SEQ region as shown in Figure 2-3. This is a significant distance from the proposed Traveston Crossing scheme, in Cooloola to the north that is expected to supply approximately half of the SEQRWSS proposed additional water supply.
3 Note 2001 populations differ from PIFU 2003. This may be a typographical error.

Institute for Sustainable Futures, UTS and Cardno February 2007
Review of Water Supply-Demand Options for South East Qld – Final Report 7
Figure 2-3 Population growth areas
Source – Population figures based on PIFU 2006. Growth from 2026 to 2050 assumes proportional growth by LGA, in the absence of specific LGA data, to reach the total population of 5,080,000.

Institute for Sustainable Futures, UTS and Cardno February 2007
Review of Water Supply-Demand Options for South East Qld – Final Report 8
It should be noted that whilst population growth has the potential to increase water demand significantly it also provides major opportunities in terms of the potential to save water in new developments. The current number of households in the area is just over 1 million. This is predicted to double by 2050 according to current population projections.
Recommendation 2.1
Due to the significant growth in the southern area of the SEQ region it is recommended that demand and supply-side options to cater for this growth are concentrated, as far as possible, in close proximity to where the growth is occurring. This will minimise the costs and greenhouse gas emissions associated with transferring additional water across such a large region and take advantage of reducing demand in the key growth areas.
2.2.2 Current and projected water demand A significant body of work is being carried out by the SEQRWSS on water demand forecasting. The Study team understands that the demand forecasting that is being undertaken uses some form of detailed breakdown of water demand using a sector and end use based approach. Such an approach is considered international best practice. However, this detailed work associated with demand forecasting is not publicly available and has not been made available to the Study team. Hence the final assessment of the business as usual (or reference case) water demand has not yet been released to the public.
To obtain an understanding of the reference case demand, which will assist in determining the supply-demand balance, previously released SEQ demand data has been used by the Study team and assessed based on the team’s extensive knowledge of sector and end use based approaches.
The reference case demand should be considered as the “do nothing” scenario assuming that no demand management interventions such as rebate schemes for water saving devices have been implemented. This reference case can then be compared against the system yield over time. The gap between the two can be filled either through demand-side or supply-side initiatives or a combination of the two. Clear definition of what is included in the reference case is extremely important to ensure that savings obtained through demand management initiatives are not double counted (i.e. the natural attrition of inefficient toilets and regulations that ensure that only water efficient toilets are used in all new and refurbished houses).
Figure 2-4 provides a useful snapshot breakdown of water demand per person per day by LGA in the residential, non residential and non revenue water sectors. Whilst this specific year may not represent an average year in terms of weather, a major influence on demand, it represents the most detailed publicly available snapshot of water demand by LGA and sector.

Institute for Sustainable Futures, UTS and Cardno February 2007
Review of Water Supply-Demand Options for South East Qld – Final Report 9
Figure 2-4 A snapshot of existing water demand by LGA and sector
Source - DNRM, 2004, p34
Current weighted average demand in the SEQ region is approximately:
• 300 litres/capita/day (LCD) in the residential sector,
• 100 LCD in the non residential sector, and
• 50 LCD in the non revenue water sector4
Hence total average demand is approximately 450 LCD.
Whilst the SEQ area is affected by high temperatures it also has relatively high rainfall compared to other major cities in Australia5. Hence the figure of 300 LCD in the residential sector appears high compared to other major cities such as Sydney approximately 250 LCD and areas such as Melbourne which on average have an even lower LCD (WSAA Facts 2005). If this high total LCD is accurate there is likely to be significant conservation potential in both the residential indoor and outdoor demand. Other investigations indicate that the per household demand for the period between 2001/02 and 2003/04 was impacted by hotter and dryer weather than average, and that weather-corrected demand may have been as low as 230 kL/household/annum (Beatty et al, 2005). This would make the average per capita residential demand closer to 250 LCD. Additionally, SEQRWSS documentation (DNRM 2004) states that a value of 270 LCD should be taken for projecting demand but that more
4 Over recent years it has become common practice to use the International Water Association (IWA) and Water Services Association of Australia (WSAA) term “non revenue water” rather than “unaccounted for water” to describe leakage and losses associated with current annual real losses (CARL), unavoidable annual real losses (UARL) and apparent losses. These are described in detail in WSAA Facts (WSAA Facts, 2004).
5 From WSAA Facts (2005), average maximum temperature and mean rainfall are Sydney (23 Deg C and 1,165 mm), Melbourne (21 Deg C and 571 mm) and Brisbane (25 Deg C and 995 mm).

Institute for Sustainable Futures, UTS and Cardno February 2007
Review of Water Supply-Demand Options for South East Qld – Final Report 10
rigorous demand forecasting will be conducted as part of the SEQRWSS investigations which is likely to result in a lower unit demand.
It is extremely important that demand projections are taken from average weather years, or from weather-corrected demand in the starting year. If indeed the reference case demand is closer to 250 LCD, then this has implications for total demand in 2050 of almost 100 GL/a.
Using publicly available data, the Study team have projected the business-as-usual (or reference case) water demand using conservative assumptions, including the following:
• PIFU 2006 population figures;
• current demand of 300 LCD for the residential sector;
• the current single residential/multi residential mix of dwellings (from the Australian Bureau of Statistics, ABS) and assumed that this proportion remains constant over the next 50 years (there is in fact a trend in all capital cities towards growth in multi residential dwellings and urban infill which tends to reduce water demand per person due to the reduced area of outdoor demand and associated irrigation);
• a decrease in overall occupancy ratio up to 2026, this is assumed to remain constant after 2026 as there is no available ABS information post 2026 on occupancy ratios;
• no allowance for the natural attrition and replacement of non efficient stock (e.g. showers, toilets and washing machines) which would tend to reduce demand;
• no allowance for recent regulations that require houses to become more water efficient or large estate scale developments that use less water such as Pimpama Coomera in the Gold Coast (these are considered later in Sections 3 and 4 as options rather than part of the reference case);
• that the current demand per non-residential property remains constant and the increase in the number of such properties increases at the same rate as population growth; and
• that the current leakage and losses associated with non revenue water per connection remain constant in the absence of active pressure and leakage programs (these are considered as a current SEQ demand-side initiative in Section 3).
Note that these assumptions are used to define the reference case, from which the impact on demand of the current programs being implemented by the Qld Government is subtracted. It is an important starting point for analysis, and one which requires as much rigour in estimation as is possible with the data and analytical methods available.
Most of the conservative assumptions listed above would over estimate the reference case.
Figure 2-5 provides a sector breakdown of the reference case. Figure 2-6 indicates how each LGA (grouped into the Sunshine Coast, Northern, Western, Brisbane and Southern regions) is expected to grow based on the assumptions identified.

Institute for Sustainable Futures, UTS and Cardno February 2007
Review of Water Supply-Demand Options for South East Qld – Final Report 11
Figure 2-5 Study team projected reference case demand by sector
Figure 2-6 Study team projected reference case demand by LGA (grouped by geographical location)
The SEQRWSS has projected the reference case demand as 930 GL/a (DNRMW, 2006, p. 17) by 2050 using 300 LCD for the residential sector and the latest PIFU 2006 population projects. The Study team’s projected reference case, which uses conservative assumptions, only projects approximately 860 GL/a by 2050, a difference of 70 GL/a (the equivalent volume of water proposed by the Traveston Crossing scheme Stage 1). The assumptions used to achieve the DNRMW estimated 2050 demand,

Institute for Sustainable Futures, UTS and Cardno February 2007
Review of Water Supply-Demand Options for South East Qld – Final Report 12
such as occupancy ratio, trends in technology stock and size of the non residential and non revenue water sectors, are unclear. With the change in population projection assumptions (refer to Figure 2-2) producing a potential change in projected demand of more than 60 GL/a and other assumptions described above potentially meaning a difference in projection of more than 70 GL/a, this demonstrates the uncertainty in projecting demand out to 2050. It also shows the importance of transparency in assumptions and how these can change demand projections significantly.
Recommendation 2.2
The current SEQRWSS investigations into current and forecast water demand (including assumptions, limitations of data and levels of confidence) should be released to the public as soon as possible. This will assist in identifying how the reference case water demand component of the supply-demand balance has been determined, the associated levels of confidence in water demand projections and what additional information needs to be collected and analysed.
Recommendation 2.3
Even with the current SEQRWSS investigations into water demand forecasting, very little is actually known about how water is currently being used in the SEQ region on a per household or property basis and thus how it can be projected more accurately. In 2006 the Qld EPA released a Brief to investigate current water demand per household type in more detail to assist in forecasting water demand and determining the conservation potential available. It is recommended that such a study and collection of data during current demand management program implementation be undertaken as soon as possible to fill this knowledge gap and assist in refining the reference case demand.
The 930 GL/a reference case demand assumed by the SEQRWSS is considered very conservative. Coupled with the likely underestimate of yield (discussed in Section 2.4) this is likely to lead to an extreme estimate of the supply-demand gap in 2030, which is likely to increase by 2050.
Nonetheless, to assist in determining the supply-demand gap the conservative SEQRWSS reference case of 930 GL/a by 2050 has been used for this Study. To assist in determining the conservation potential available the more detailed split in water demand identified by the Study team has been used.
2.3 SEQ water supplies Nineteen existing surface water storages in SEQ provide significant water supplies for urban use. There are other storages in the region that are predominantly used for irrigation purposes. There are also two currently developed groundwater supplies for urban use. The adopted yields for these water supply sources are listed in Table 2-3 (from DNRW 2006). The locations of significant water sources are shown in Figure 2-7.

Institute for Sustainable Futures, UTS and Cardno February 2007
Review of Water Supply-Demand Options for South East Qld – Final Report 13
Table 2-3 Existing Urban Water Supply Storages in SEQ
Supply system Catchment
Existing System Yield
(High Priority Urban Supply)
(ML/a)
Owner Storage Location by LGA
Comment
Surface Water
Caboolture Weir Caboolture River 3,000 Caboolture Shire Council Caboolture
Cressbrook/ Perseverance Brisbane River 10,000
Toowoomba City Council Esk
Cooby Dam Condamine River 2,610 Toowoomba City Council Crows Nest
Lake Kurwongbah Pine River 4,100 Pine Rivers Shire Council Pine Rivers
Moogerah Dam Brisbane River 9,400 SunWater Boonah Irrigation supplies also sourced from this dam.
North Pine Pine River 58,500 Pine Rivers Shire Council Pine Rivers
Wivenhoe/ Somerset Brisbane River 373,000 SEQWater Esk
Main Supply is from Mt Crosby Weir
Baroon Pocket Mary River 34,750 AquaGen Caloundra
Borumba Mary River 11,689 SunWater Cooloola Irrigation supplies also sourced from this dam.
Lake MacDonald Mary River 4,210 Noosa Shire Council Noosa South Maroochy (Wappa, Poona, Cooloolabin) Maroochy River 9,100
Maroochy Shire Council Maroochy
Ewan Maddock Adlington Creek 3,800 AquaGen Caloundra Not utilised currently Hinze/Little Nerang Nerang River 69,800
Gold Coast City Council Gold Coast
Leslie Harrison Tingalpa Creek 7,600 Redland Shire Council Redland
Maroon Dam Logan River 9,900 SunWater Beaudesert Irrigation supplies also sourced from this dam.
Groundwater
Bribie Island 2,000 Caboolture Shire Council Caboolture
North Stradbroke Island 21,900 Redland Shire Council Redland
Supply piped to mainland
Total 635,359

Institute for Sustainable Futures, UTS and Cardno February 2007
Review of Water Supply-Demand Options for South East Qld – Final Report 14
Figure 2-7 Existing water supply sources – SEQ

Institute for Sustainable Futures, UTS and Cardno February 2007
Review of Water Supply-Demand Options for South East Qld – Final Report 15
2.3.1 Urban Surface Water Supply Systems The major water supply sources for the region are the Wivenhoe/Somerset System, Hinze Dam/Little Nerang Dam, North Pine Dam and Baroon Pocket Dam. The supplies from these storages account for over 80% of the total supply.
Over half of the region’s urban water supply is sourced from the Wivenhoe/Somerset Dam system, owned by SEQWater. Somerset Dam is located on the Stanley River, a tributary of the Brisbane River. Water from Somerset Dam is released to Wivenhoe Dam - the region’s major storage – and from Wivenhoe Dam water is released down the Brisbane River to Mt Crosby Weir from where it is pumped to adjacent water treatment plants (Mt Crosby East and West) and then to Brisbane and surrounding urban areas. The catchment area of Mt Crosby Weir includes Lockyer Creek. Water from this system supplies parts of Ipswich, Logan City, and the northern section of the Gold Coast, and can supply Pine Rivers, Redcliffe and Caboolture when North Pine Treatment Plant is not available (e.g. during major maintenance).
North Pine Dam (Lake Samsonvale) is owned by SEQWater and is located on North Pine River near Petrie. This dam supplies water to the northern suburbs of Brisbane, the Pine Rivers Shire Council area, Caboolture and Redcliffe. Pine Rivers Shire Council owns Lake Kurwongbah, a dam located on Sidling Creek, a tributary of North Pine River. Lake Kurwongbah supplies part of Pine Rivers Shire Council’s urban water requirements.
Hinze Dam (on the Nerang River) and Little Nerang Dam (on Little Nerang Creek) comprise the major water supply system for the Gold Coast area. Water is piped from these dams to Molendinar and Mudgeeraba Water Treatment Plants from where it is reticulated within the Gold Coast City6.
Baroon Pocket Dam is located near Maleny on Obi Obi Creek, a tributary of Mary River. The dam is owned by Aquagen (Caloundra-Maroochy Water Supply Board). Water from the dam gravitates through a tunnel under the Blackall Range to the Landers Shute Treatment Plant where it is treated prior to distribution to Caloundra, and parts of Maroochy Shire. The Cooloolabin Dam-Wappa Dam-Poona Dam water supply scheme also provides urban supplies to the Maroochy Shire.
Toowoomba’s main water supply is from the Perseverance Dam-Cressbrook Dam water supply system, located within the Brisbane River catchment. Other water sources for Toowoomba are Cooby Creek Dam and bores within the city area7.
2.3.2 Urban Groundwater Supply Systems Water is drawn from shallow unconfined sand aquifers on Bribie Island for urban water use locally. Redland Shire draws water from North Stradbroke Island from a borefield with a maximum daily extraction rate of 22.5 ML/day8.
6 Construction of the Southern Regional Water Pipeline has commenced. This pipeline is being constructed by SWRP Co, an incorporated company with six major shareholders: Ipswich, Brisbane, Logan and Gold Coast city councils, Beaudesert Shire Council and SEQWater and will connect the Hinze Dam/Little Nerang Dam System, the Wivenhoe/Somerset Dam System, and ultimately the proposed Tugun Desalination plant water sources.
7 It is intended to construct a 47 km pipeline from Wivenhoe Dam to Perseverance Dam to supplement Toowoomba’s water supply.
8 Water is also pumped from Herring Lagoon, part of the Eighteen Mile Swamp on the eastern side of North Stradbroke Island. Between 8 and 11 ML/day is drawn from Herring Lagoon, the amount depending on water quality and the level of water in the lagoon. Water from these sources is piped to the mainland for use in the Redland LGA. Combined surface water and groundwater allocations for town water supply purposes from the Island total 22,578 ML/a.
Institute for Sustainable Futures, UTS and Cardno February 2007
Review of Water Supply-Demand Options for South East Qld – Final Report 16
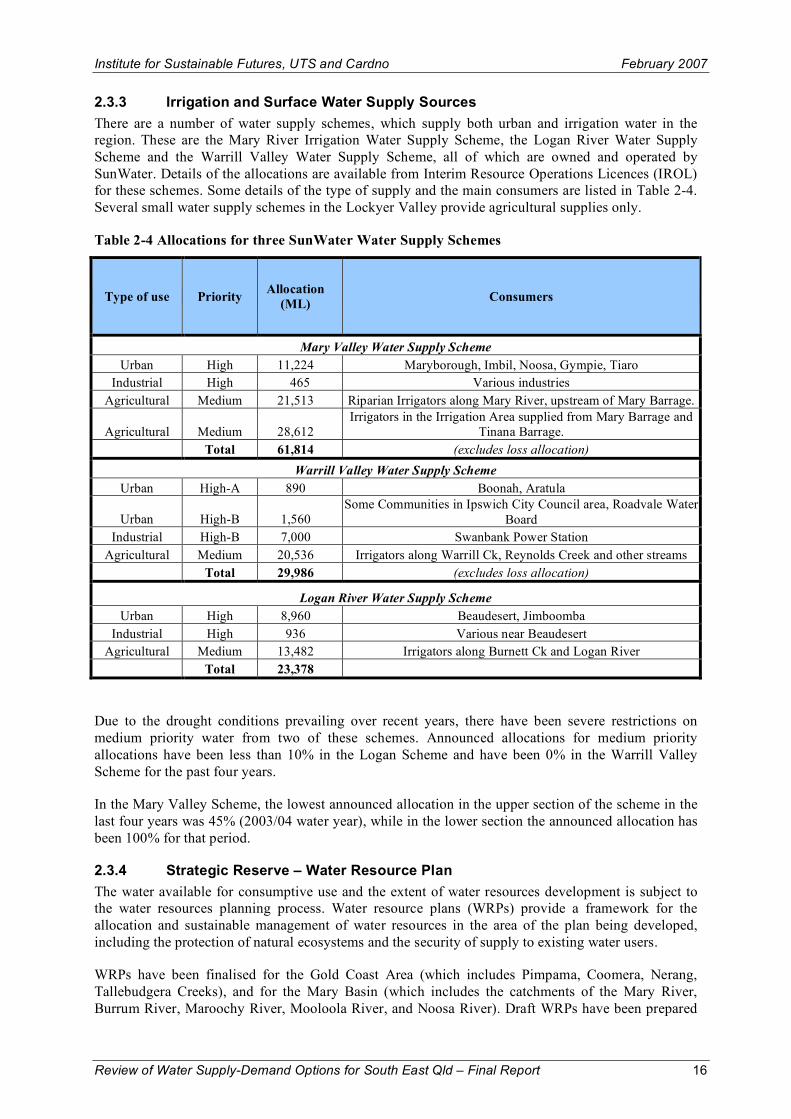
2.3.3 Irrigation and Surface Water Supply Sources There are a number of water supply schemes, which supply both urban and irrigation water in the region. These are the Mary River Irrigation Water Supply Scheme, the Logan River Water Supply Scheme and the Warrill Valley Water Supply Scheme, all of which are owned and operated by SunWater. Details of the allocations are available from Interim Resource Operations Licences (IROL) for these schemes. Some details of the type of supply and the main consumers are listed in Table 2-4. Several small water supply schemes in the Lockyer Valley provide agricultural supplies only.
Table 2-4 Allocations for three SunWater Water Supply Schemes
Type of use Priority Allocation (ML) Consumers
Mary Valley Water Supply Scheme Urban High 11,224 Maryborough, Imbil, Noosa, Gympie, Tiaro
Industrial High 465 Various industries Agricultural Medium 21,513 Riparian Irrigators along Mary River, upstream of Mary Barrage.
Agricultural Medium 28,612 Irrigators in the Irrigation Area supplied from Mary Barrage and
Tinana Barrage. Total 61,814 (excludes loss allocation)
Warrill Valley Water Supply Scheme Urban High-A 890 Boonah, Aratula
Urban High-B 1,560 Some Communities in Ipswich City Council area, Roadvale Water
Board Industrial High-B 7,000 Swanbank Power Station
Agricultural Medium 20,536 Irrigators along Warrill Ck, Reynolds Creek and other streams Total 29,986 (excludes loss allocation)
Logan River Water Supply Scheme Urban High 8,960 Beaudesert, Jimboomba
Industrial High 936 Various near Beaudesert Agricultural Medium 13,482 Irrigators along Burnett Ck and Logan River
Total 23,378
Due to the drought conditions prevailing over recent years, there have been severe restrictions on medium priority water from two of these schemes. Announced allocations for medium priority allocations have been less than 10% in the Logan Scheme and have been 0% in the Warrill Valley Scheme for the past four years.
In the Mary Valley Scheme, the lowest announced allocation in the upper section of the scheme in the last four years was 45% (2003/04 water year), while in the lower section the announced allocation has been 100% for that period.
2.3.4 Strategic Reserve – Water Resource Plan The water available for consumptive use and the extent of water resources development is subject to the water resources planning process. Water resource plans (WRPs) provide a framework for the allocation and sustainable management of water resources in the area of the plan being developed, including the protection of natural ecosystems and the security of supply to existing water users.
WRPs have been finalised for the Gold Coast Area (which includes Pimpama, Coomera, Nerang, Tallebudgera Creeks), and for the Mary Basin (which includes the catchments of the Mary River, Burrum River, Maroochy River, Mooloola River, and Noosa River). Draft WRPs have been prepared

Institute for Sustainable Futures, UTS and Cardno February 2007
Review of Water Supply-Demand Options for South East Qld – Final Report 17
for the Moreton Region (includes catchments of the Brisbane River, Pine Rivers, and Caboolture River), and the Logan (includes catchments of the Logan River, Albert River and Redlands Creeks).
These plans refer to strategic reserves, which are reserves of unallocated water to accommodate urban growth in the SEQ region. Access to the reserve for a WRP area is possible through the Resource Operations Plan or could be granted or reserved for infrastructure identified by the Coordinator-General for the SEQ regional plan.
Whilst WRPs aim to provide a consistent framework for the allocation and sustainable management of water resources in each area, these plans have been developed over time and with input from a number of different specialists. As such there is some question as to the consistency in approach, aims and assumptions across the WRPs, especially in relation to complex issues such as the calculation and subsequent allocation of environmental flows. Hence care needs to be taken in fully committing such strategic reserves without further validation.
From the available information the strategic reserves for each of the WRP areas are listed in Table 2-5 (DNRW 2006) together with the amount committed by SEQ proposed options (discussed in Section 3).
Table 2-5 Commitment of Strategic Reserve
Water Resource Plan Area
Strategic Reserve*
(ML/a)
Amount Committed in SEQ Planning Study
(ML/a)
Remaining Amount of Reserve
(ML/a)
Mary Basin 150,000 150,000 0 Moreton 20,000 5,000 15,000 Logan 55,000 26,000 29,000 Gold Coast 30,000 16,000 14,000
Note - *The strategic reserve does not apply to recycled water or supplies from desalination plants.
The proposed Traveston Crossing scheme Stages 1, 2 (raising Borumba) and 3, commit the whole 150,000 ML/a of the strategic reserve for the Mary Basin. The reserves are not fully committed in the Moreton, Logan and Gold Coast areas, and a total of 58,000 ML/a remains in these areas.
Recommendation 2.4
There is some question as to the consistency of approach and assumptions used to identify the strategic reserve of Water Resource Plans in the SEQ area, especially in relation to complex issues such as the allocation of environmental flows. Hence it is recommended that full allocation of such reserves are not committed until further checking and validation across each of the Water Resource Plans developed for the SEQ region is undertaken.
Recommendation 2.5
Following validation of the strategic reserve of each of the Water Resource Plans it is recommended that further investigation is undertaken into the potential of utilising part of the 58,000 ML/a unallocated reserves in the Moreton, Logan and Gold Coast areas.

Institute for Sustainable Futures, UTS and Cardno February 2007
Review of Water Supply-Demand Options for South East Qld – Final Report 18
2.4 Levels of Service The yields of the surface water supplies previously identified in Table 2-3 are historical no-failure yield (HNFY) estimates. The HNFY of a water supply storage is the maximum annual volume that could have been drawn over a past historical period for which climatic information is available, such that the minimum storage volume reached (during the worst drought period) approached but did not fall below the dead storage volume, that is, the supply did not fail.
Similar considerations apply to groundwater yield estimates. The maximum yield from a groundwater source should not exceed the average recharge rate, and should not result in drawdown during low recharge periods that would cause wells to dry up, intrusion of saltwater or damage to groundwater dependent ecosystems.
The yields of the individual urban water supply systems listed in Table 2-3 total 635,000 ML/a on an HNFY basis.
The report “Water for South East Queensland – A Long Term Solution” (DNRW 2006) includes a discussion of water yields determined by levels of service (LOS) criteria and contingency planning. The Water Services Association of Australia advocates the adoption of a LOS approach in the determination of yield by urban water providers in Australia (Erlanger and Neal 2005). LOS criteria are a set of performance targets for the reliability of water supply. The targets relate to the frequency, duration and severity of restrictions. The performance criteria ideally should reflect the community’s expectations of the reliability and security of its water supply.
For urban water supply planning purposes in the SEQ region, DNRW has adopted the following levels of service:
• annual probability of Level 2 restrictions is less than 2% (1 year in 50 on average);
• mean duration of restrictions is 12 months; and
• level 2 restrictions to achieve a demand reduction of 15% and apply for no more than 3% of time.
The above criteria have been applied to the Somerset Dam – Wivenhoe Dam water supply system. To allow for contingency planning, it was assumed that there would be at least two year’s supply in storage at the onset of Level 2 restrictions. Applying the foregoing criteria reduced the yield from the Somerset Dam – Wivenhoe Dam system from 373,000 ML/a (HNFY) to about 285,000 ML/a, which approximates the current unrestricted demand from the system. This represents a 24% downgrading of the available supply.
According to the planning report, the water yields for the other systems listed in Table 2-3 have also been downgraded, based on similar considerations, although details of reductions for individual sources have not been made available. The report states that the yields have been reduced by an average of 29%. The reduced or “prudent” yield of the combined sources in Table 2-3 totals 450,000 ML/a, a reduction of 185,000 ML/a over the aggregate HNFY estimates.
It is understood that water balance studies of the water supply network are currently being carried out by DNRW, and that there may be refinement of the estimates of prudent yield.
Small changes in the LOS criteria and contingency storage volumes (for example allowing restrictions to occur say 1 year in 25 on average rather than the 1 in 50 year adopted) may have the same effect on the overall yield as the development of a new water source, therefore it is important that the LOS and contingency storage volumes chosen strike a balance between risk of shortfalls in supply and acceptability and cost to the community.

Institute for Sustainable Futures, UTS and Cardno February 2007
Review of Water Supply-Demand Options for South East Qld – Final Report 19
There is no publicly available evidence that customer surveys, community engagement processes or other empirical analysis has been undertaken to set the LOS. The LOS that has been chosen assumes that the community are particularly averse to restrictions. This is not borne out by the evidence from surveys (see for example Taverner 2005, p44), which suggest strong support for restrictions in similar cities and regions, including in Gosford-Wyong where more severe restrictions have been in place for an extended period. A slight increase in the probability of restrictions is likely to significantly increase the prudent yield, which will reduce the supply-demand gap in 2030 and 2050. For example, in the Sydney water supply system, a small change in the frequency of restrictions, from an average of 3% of the time to 5% of the time, results in an increase of 50 GL/a in the yield from a base of approximately 600 GL/a.
A survey9 is currently being conducted on behalf of Queensland Water Infrastructure, the organisation established to build major infrastructure such as Traveston Crossing Dam Stage 1. This survey is investigating some of the questions that need to be asked concerning the appropriate LOS. However, the focus of the questions and information being provided to the participants appears to have a different focus and may in fact be providing participants with incorrect information upon which they will be making decisions. The media report indicates that information being provided to participants identifies that without major investment, Level 4 restrictions would be necessary every four years and would run for two years at a time. Depending on the assumptions being used this is highly unlikely with the level of infrastructure investment (excluding the Traveston Crossing scheme) which has already been committed by the Qld Government (refer to Section 3).
The issues associated with investment in infrastructure, which options should be implemented, how much they cost, who should pay, willingness to pay and how this relates to restrictions etc. are extremely complex and need to be very carefully presented to the community through the use of rigorous and transparent community engagement processes with an opportunity for participants to become well informed, rather than through the use of opinion polls or surveys.
Recommendation 2.6
The prudent yield of the existing supply system is highly dependent on the frequency and severity of restrictions that are deemed acceptable to the community. It is crucial that the community is involved in the decision making process for establishing the level of acceptability, through the use of rigorous and transparent processes for community engagement. It is recommended that such a process be undertaken in SEQ and the prudent yield of the system reassessed using the results of the process.
Even though there is uncertainty around the conservative assumptions behind the LOS estimates, for the purposes of this Study, the conservative prudent yield of 450,000 ML/a has been used for the aggregate supply available from the existing urban water supply schemes.
9 A recent article in the Courier Mail [http://www.news.com.au/couriermail/story/0,23739,21189974-3102,00.html – accessed 08/02/07]

Institute for Sustainable Futures, UTS and Cardno February 2007
Review of Water Supply-Demand Options for South East Qld – Final Report 20
2.5 The current supply-demand balance Figure 2-8 shows the supply-demand balance in SEQ, that is, how the gap between the yield available from current supplies is being outstripped by the increase in demand being driven predominantly by the increase in population. The supply-demand balance shown assumes the SEQRWSS reference case demand (currently approximately 450 GL/a rising to 930 GL/a by 2050) and downgrading of the current supply system yield in 2005/06 (450 GL/a prudent yield instead of the HNFY figure of 630 GL/a). Both the reference case demand and the system yield are considered “worst case” and thus the supply-demand gap shown is likely to be an extreme scenario.
Figure 2-8 The supply-demand balance
Nonetheless, this extreme scenario for the supply-demand gap has been used as the basis of options assessment in Sections 3 and 4. Section 3 identifies the suite of SEQRWSS demand and supply-side options that have been developed to fill the supply-demand gap and discusses some of the concerns associated with this suite of options, which includes the Traveston Crossing scheme. Section 4 identifies a lower cost, more adaptive and risk averse strategy developed by the Study team that takes into consideration short, medium and long-term planning.

Institute for Sustainable Futures, UTS and Cardno February 2007
Review of Water Supply-Demand Options for South East Qld – Final Report 21
3 SEQ PROPOSED SUPPLY-DEMAND STRATEGY
Over recent years the Qld Government has taken leadership in setting up investigations into how much water is being used in the SEQ region, how much water is available from current supplies, what supply and demand-side initiatives need to be considered to fill the gap and how institutional arrangements should be changed to accommodate this.
This Section identifies and analyses the suite of demand and supply-side initiatives that have been developed and considers some of the gaps and opportunities for improvement in the current approach.
3.1 SEQ water management: drought response and long-term planning Local Government has traditionally been responsible for water supply and planning in Queensland. More recently, the perceived need for regional coordination to respond to drought and to provide water security for the whole of the SEQ region in the longer-term has resulted in the establishment of two regional water management institutions: the South East Queensland Regional Water Supply Strategy (SEQRWSS) and the Queensland Water Commission (QWC).
The SEQRWSS is a partnership between the state government and the SEQ Council of Mayors. The objective of the SEQRWSS is to “examine alternative water sources and demand management options, developing a strategic direction for water supply in the region through to 2050” (SEQ Regional Plan, Office of Urban Management, p99). With this goal in mind, the SEQRWSS has been instrumental in developing a number of medium to long-term water infrastructure projects detailed in the key Qld water planning document “Water for Queensland: A long term solution” (DNRW, 2006).
The QWC, reporting directly to Deputy Premier Anna Bligh, was established in June 2006 by the Water Amendment Act 2006. The QWC is responsible for imposing water restrictions when required and for facilitating regional water supply programs including drought response measures. As such, the Commission has been instrumental in coordinating drought response measures for SEQ over recent months.
Drought response measures coordinated by the QWC are those provided for under the Water Amendment Regulation (No. 6) 2006. The Water Amendment Regulation (No. 6), made under the Water Act 2000 is emergency drought response legislation designed to “implement a strategy to secure the essential water supply needs of the region” (Preamble, p2).
To facilitate the implementation of such a strategy, the Water Amendment Regulation (No. 6) provides for the development of a number of “measures, outcomes and works”, details financial contributions to be made by the Qld Government and sets target dates for implementation of each project. Water projects facilitated by the Regulation comprise a mixture of demand and supply-side initiatives (from Clause 3):
• Construction of the Western Corridor Recycled Water Scheme
• Construction of the Southern Regional Water Pipeline
• Construction of the Eastern Pipeline Inter-connector
• Construction of the Northern Pipeline Inter-connector
• Construction of the SEQ (Gold Coast) Desalination Facility
• Construction of Traveston Crossing Dam Stage 1
• Construction of Wyaralong Dam
• Raising Mount Crosby Weir

Institute for Sustainable Futures, UTS and Cardno February 2007
Review of Water Supply-Demand Options for South East Qld – Final Report 22
• Raising Hinze Dam and preparation for associated water harvesting
• Development of Bribie Island and Brisbane aquifers
• Demand management strategies including pressure and leakage reduction and domestic retrofits
• Provision of recycled water for industry
• Maximising the take of groundwater from North Stradbroke Island
• Construction of Cedar Grove Weir
• Construction of Bromelton Off-stream Storage
These drought response measures, as well as other longer-term water projects planned by the SEQRWSS, are discussed in more detail below as either demand or supply-side initiatives.
3.2 Demand side initiatives The Regional Plan for SEQ (Regional Plan 2005) sets targets for reduced residential water demand per person per day. Existing residential water demand is approximately 300 LCD (DNRM, 2004) as indicated in Section 2, excluding non residential and non revenue water. Table 3-1 shows the residential water demand targets for 2010, 2015 and 2020, excluding consideration of non residential and non revenue water.
Table 3-1 Targets for residential water demand in SEQ
Year 2010 2015 2020
Per capita demand in litres/capita/day (LCD)
270 250 230
Source – South East Queensland Regional Plan Section F11
To reduce water demand in SEQ and achieve the targets a number of demand-side water saving initiatives have been developed by the Qld Government and are currently being implemented. These include:
The residential sector
• Domestic rebate program where rebates are offered for rainwater tanks, washing machines, dual flush toilets, efficient showerheads, greywater systems and swimming pool covers (DNRW WaterWise website10).
• Domestic retrofit program which aims to refit 150,000 houses with water efficient appliances. The retrofit program will be administered by local governments. Houses will be audited by a qualified plumber and where potential for water savings are identified, water saving devices such as showerheads and toilet displacement devices installed.
• New sustainable building regulations (Part 29 of the Queensland Development Code) requiring that all new houses are fitted with efficient toilets and showers. This regulation also applies to existing houses where bathrooms are renovated. Under the regulations, new detached and semi-detached houses are also subject to water pressure limitations.
• New water saving building regulations (Part 25 of the Queensland Development Code) which requires that all new detached and semi-detached houses are fitted with a rainwater tank, dual
10 DNRW WaterWise website http://www.nrw.qld.gov.au/water/saverscheme/index.html accessed 22/12/06.

Institute for Sustainable Futures, UTS and Cardno February 2007
Review of Water Supply-Demand Options for South East Qld – Final Report 23
reticulation system or stormwater reuse system to reduce demand on reticulated town water supply systems.
• Other residential programs such as Pimpama Coomera Smart Growth and targets for capped demand in Caloundra. The Pimpama Coomera (Gold Coast) model of Smart Growth requires homes to achieve an 80% reduction in the use of potable water (Gold Coast Water and Gold Coast City Council, 2004). Caloundra City Council is in the process of developing a similar scheme through the draft Local Growth Management Strategy (Caloundra City, 2006 p38). In the Strategy, a target of a possible 80% reduction in use of potable water is to be achieved for new developments through the implementation of water efficiency and demand management measures.
The non residential sector
• The Business Water Efficiency Program (BWEP) aims to reduce water use by assisting high water using businesses to adopt and implement water saving practices.
• Water recycling to supply large industrial water users and reduce demand on the potable supply. Water recycling initiatives are being undertaken in the Brisbane, Ipswich, Logan, Maroochy and Pine Rivers LGAs.
The non revenue water sector
• Pressure and leakage reduction program implemented by local governments requires all local governments in SEQ excluding Toowoomba to develop detailed plans for reducing pressure and leakage in water storage and supply systems.
Table 3-211 summarises demand management programs and anticipated associated water savings. More detailed information about each of the SEQ proposed demand-side options can be found in Appendix A12.
11 During the finalisation of this study an additional demand management program the “Home Garden WaterWise Rebate Scheme” was released. The program is “a package of new incentives designed to support householders throughout Queensland by making their gardens more water efficient during this time of severe drought” [http://www.nrw.qld.gov.au/water/saverscheme/pdf/garden_scheme.pdf. accessed 09/02/07]. The program provides a rebate of 50% (up to a maximum of $50) off of the purchase price of defined products. The program commenced in mid December 2006 and will run to mid December 2008. $5 M is being spent on the rebates which will help more than 100,000 householders across Qld. http://statements.cabinet.qld.gov.au/MMS/StatementDisplaySingle.aspx?id=49677 [accessed 09/02/07]. This program will assist in reducing water over the drought period. The program has not been included in the modelling of savings. It may assist in changing the behaviour of a proportion of the householders participating resulting in medium to long term savings and thus contribute to the demand management targets and supply demand balance. This is likely to be small unless the program is augmented in the future.
12 Note – Reference to unit cost in Appendix A for existing SEQ demand-side initiatives is likely to be low as the costs identified are only those identified by the Qld Government. A number of these options will require additional customer expenditure such as rainwater tanks.

Institute for Sustainable Futures, UTS and Cardno February 2007
Review of Water Supply-Demand Options for South East Qld – Final Report 24
Table 3-2 SEQ demand management programs and anticipated water savings
Code Demand Management Initiative Estimated savings ML/d
Estimated savings ML/a Timing
SEQ-D1 Domestic rebates2 8.15* 2,974* Incremental 2007 to 2009
SEQ-D2 Retrofits 7 2,689 Incremental 2007 to 2009
SEQ-D3 Building regulations (Part 29 of QDC**) 55* 20,066* (average)
35,472 (by 2050) Incremental from 20073
SEQ-D4 Building regulations (Part 25 of QDC) 91* 30,019* (average)
53,066 (by 2050) Incremental from 2007
SEQ-D5 Business Water Efficiency Program (BWEP) 12 4,380 Incremental 2007-
2008 SEQ-D6 Capped Demand in Caloundra2 12.36 7,382 (average)
12,209 (by 2050) Incremental from 20071
SEQ-D7 Pimpama Coomera2 16.2 5,913 (average) 10,512 (by 2050)
Incremental from 20071
SEQ-D8 Water recycling for industry - Brisbane 6.1 2,227 20081
SEQ-D9 Water recycling for industry - Gold Coast 0.3 106 20081
SEQ-D10
Water recycling for industry - Ipswich 3 1,000 Incremental 2006-
2008 SEQ-D11
Water recycling for industry - Logan unknown unknown 20081
SEQ-D12
Water recycling for industry - Maroochy unknown unknown 20081
SEQ-D13
Water recycling for industry - Pine Rivers 4 1,460 20081
SEQ-D14 Pressure and leakage reduction 64 23,360 Incremental 2006-
2012 * Yields marked with an asterisk have been determined by the study team (see Fact Sheets in Appendix A for assumptions). All other yields are from QWC Water Regulation (No. 6) October Progress Report (released 30 November 2006). ** QDC - Queensland Development Code 1 Assumed date 2 These initiatives are not part of the QWC Water Regulation (No.6) drought strategy. 3 This regulation also applies to existing class 1 and 2 buildings. There is limited experience on how effective the compliance of this form of regulation is. To be conservative only the savings associated with new households have been considered here. In Section 4 an option that uses a regulatory instrument that requires existing households “sold” to participate in an efficiency program, has been considered. The Qld Government has committed significant investment in demand-side initiatives to assist in achieving the medium-term demand reduction targets. Figure 3-1 shows the savings anticipated by the SEQ demand-side initiatives relative to the targets, based on the assumed reference case of 930 GL/a by 2050.

Institute for Sustainable Futures, UTS and Cardno February 2007
Review of Water Supply-Demand Options for South East Qld – Final Report 25
Figure 3-1 SEQ demand-side initiatives
The targets specifically relate to the residential sector. The current suite of residential initiatives alone will not achieve the targets identified. However, the combination of initiatives currently being implemented will reduce demand to a level close to the targets. With additional investment these targets can be achieved.
The current suite of demand-side initiatives covers the residential (existing and new households), non- residential and non-revenue water sectors and includes both demand management and source substitution potential. Hence the current mix of initiatives is attempting to tap into conservation potential in all sectors. However, there is still significant opportunity to go further in terms of participation rates, end uses and reducing demand further in both existing and new properties. There is significant potential for savings in new properties as new properties are driving the increase in water demand.
Some demand-side options in the current suite have a relatively high unit cost when assessed from the combined perspective of the customer and the government, especially initiatives such as the rainwater tank rebates for existing households. Hence there is significant opportunity for the Qld Government to invest in demand-side initiatives that have a lower unit cost. Such options are considered in Section 4.
In addition a number of retrofits and rebates are being offered at regional and state levels. The potential disconnect in management of these retrofits/rebates is likely to mean that customers are obtaining higher incentives than necessary, may be participating in rebates and retrofits or missing the opportunity of maximum savings provided through the retrofit program. This may lead to the unit cost of achieving the savings being considerably higher than necessary or result in savings opportunities being missed. A more co-ordinated approach to the rebates and retrofits and careful accounting of who has participated and subsequent evaluation is essential if optimum savings both in the drought period and longer-term are to be obtained.

Institute for Sustainable Futures, UTS and Cardno February 2007
Review of Water Supply-Demand Options for South East Qld – Final Report 26
In addition a number of the initiatives are tapping into the non residential (business) sector and the potential for reuse. There is significant potential to both modify existing properties, design new properties to be as efficient as possible and for water reuse to be used in SEQ. Again these opportunities are explored in more detail in Section 4.
The demand-side initiatives being implemented are valuable in terms of providing both short (drought response) and medium to long-term savings. However, consideration of how to maximise savings, minimise costs and minimise the risk of decay in savings will be required. Again this is considered in Section 4.
In addition care will need to be taken not to double count potential savings or overlook conservation potential. For example, under the “sustainable building regulations” savings associated with efficient showers and toilets are identified for all new households (detached, semi-detached and multi-residential). However, if the business as usual or reference case demand has been calculated using an end use based approach then the savings associated with toilets may already be included in the reference case demand because only 6/3 and now 4.5/3 L dual flush toilets are available. In addition, savings associated with pressure reduction within new detached and semi-detached households will mean that assumed savings in showers would be reduced.
Recommendation 3.1
The Qld Government is currently investing in and implementing a diverse range of demand management initiatives that will provide benefits both in the short and long term. Care needs to be taken that the initiatives being implemented are the most cost effective and are implemented in such a way that they achieve the savings required. Ongoing evaluation of costs, savings and participation rates are recommended to ensure costs are minimised and estimated savings achieved.
Recommendation 3.2
Care needs to be taken that the estimated savings of each demand management, source substitution and reuse initiative are not double counted within the baseline or reference case demand or that opportunities for conservation potential are not overlooked. It is recommended that the assumptions of the demand forecasting and options analysis are provided in a transparent format and made publicly available.
3.3 Supply side initiatives In addition to the demand-side initiatives outlined, SEQRWSS has developed a suite of supply-side options to provide for the increase in water demand in SEQ over the next 50 years. These include:
• Bribie Island Groundwater abstraction to substitute 10 ML/day13 (3,650 ML/a) from the existing water supply system with underground water sourced from Bribie Island.
• Brisbane Aquifer development to source 20 ML/day (7,300 ML/a) from groundwater from seven borefields in Brisbane City Council LGA.
• Raised Hinze Dam for dam safety, flood mitigation, and water supply purposes. An additional 8,760 ML/a is expected to be available from the raised structure.
13Yield estimates and project descriptions, unless otherwise stated, are from Queensland Water Commission Water Regulation (No. 6) October Progress Report (released 30 November 2006).

Institute for Sustainable Futures, UTS and Cardno February 2007
Review of Water Supply-Demand Options for South East Qld – Final Report 27
• Water Harvesting to Hinze Dam investigations have commenced on diversion of high flows (water harvesting) into Hinze Dam from adjacent catchments including the Coomera River, Mudgeeraba Creek, and Canungra Creek. DNRW estimates an additional supply of 10,000 ML/a (DNRW, 2006) would be available from water harvesting.
• Cedar Grove Weir to be located on the Logan River. The weir is estimated to supply approximately 3,000 ML/a.
• Wyaralong Dam to be located on Teviot Brook, a tributary of the Logan River. The dam is planned to have a capacity of 135,000 ML, and will provide a supply of 18,000 ML/a (prudent DNRW estimated yield, additional to supply from Cedar Grove Weir). The dam is estimated to cost approximately $500 million.
• Bromelton Off-stream Storage to be located near the Logan River in the vicinity of Beaudesert. An off-stream storage of 8,000 ML capacity would yield approximately 5,000 ML/a.
• Traveston Crossing Dam Stage 1 to be constructed on the Mary River 16 km south of Gympie near Traveston Crossing. Stage 1 has a planned capacity of 180,000 ML and an estimated prudent yield of 70,000 ML/a (DNRW, 2006). Costs for stage 1 of the dam are estimated to be $1.7 billion. This does not include the delivery system (pump stations, pipelines, and balancing storages) from the dam to the Pine Rivers area. The cost of this connection is estimated to be of the order of $900 million, giving a total cost for the stage 1 including delivery network of $2.6 billion.
• Traveston Crossing Dam Stage 2 (Raising Borumba Dam) is situated on Yabba Creek which is a tributary of the Mary River. It is planned to construct stage 3 of the dam by 2025 to provide additional yield of 40,000 ML/a (DNRW, 2006) when operated in conjunction with Traveston Crossing Dam Stage 1.
• Traveston Crossing Dam Stage 3 has a planned capacity of 660,000 ML, and an incremental yield of 40,000 ML/a (DNRW, 2006) in addition to stages 1 and 2. Stage 3 is planned to follow construction of Borumba Dam, and may not be completed until 2042.
• SEQ (Gold Coast) Desalination Plant to be located at Tugun. The plant will provide additional water to the order of 125 ML/day (45,000 ML/a) and is estimated to cost approximately $1.13 billion.
• Raising Mount Crosby Weir to supply an additional yield of 15 ML/day (5,475 ML/a).
• Western Corridor Recycled Water Scheme Stage 1 involving the advanced treatment of sewage effluent to supply Swanbank and Tarong Power Stations. A yield of 100 ML/day (36,500 ML/a) is expected to be made available. The cost of the scheme is estimated to be $1.7 billion.
• Western Corridor Recycled Water Scheme Stage 2 involving the construction of advanced water treatment plants at Luggage Point and Gibson Island. Estimated yield from Stage 2 is 110 ML/day (40,150 ML/a) bringing the total yield from the Western Corridor Recycled Water Scheme to 210 ML/day (76,650 ML/a). If the drought breaks prior to the construction of this scheme, it is assumed that the development of Stage 2 will depend upon Qld Government decisions regarding use of recycled water to supplement the Wivenhoe-Somerset system in the absence of drought. This has become unclear following the recent cancellation of the March 2007 plebiscite on indirect potable reuse (IPR) (Ministerial Media Statement 30 November 2006) and therefore this contribution to the total system yield has not been included in the figures for total system yield resulting from new SEQ supply projects.

Institute for Sustainable Futures, UTS and Cardno February 2007
Review of Water Supply-Demand Options for South East Qld – Final Report 28
• Eastern Pipeline Inter-connector project involving the construction of a new borefield at Dunwich on North Stradbroke Island and pipeline to enable transfer of water between reservoirs. Additional supplies amount to 22 ML/day (8,030 ML/a).
Table 3-3 summarises the proposed supply-side options noting the location and Water Resources Plan area within which each of the options is located. In addition the HNFY and prudent yields for each of the options considered as part of the “Water for Queensland: A long term solution” (DNRW 2006) is identified where applicable together with the more up-to-date yields identified in the Queensland Water Commission Water Regulation (No. 6) October Progress Report (released 30 November 2006). The majority of the options identified in Table 3-3 have been included as part of the Water Amendment Regulation (No.6) drought response measures.
More detailed information about each of the SEQ proposed supply-side options can be found in Appendix A. The location of each supply option is shown in Figure 3-2.
Table 3-3 SEQ proposed supply-side initiatives
DNRW Yields (2006) Historical No Failure Yield
Prudent Yield14
QWC Yields (2006)
Location Code Water Source
(ML/a) (ML/a) (ML/a) LGA WRP Area
Comment
Committed project SEQ-
S1 Bribie Island Groundwater* NA NA 3,650 Caboolture Not part of
WRP Completion 2008 Committed project SEQ-
S2 Brisbane Aquifer* NA NA 7,300 Brisbane Brisbane
Completion 2007 Committed project SEQ-
S3 Raised Hinze Dam Stage 3* 8,000 6,000 8,760 Gold Coast Gold Coast
Completion 2010
SEQ-S4
Water harvesting to Hinze15
14,000 10,000 NA Gold Coast Gold Coast Target completion 2016 Committed project SEQ-
S5 Cedar Grove Weir* 4,000 3,000 2,993 Beaudesert Logan
Completion 2007
SEQ-S6
Wyaralong Dam (additional to Cedar Grove)*
23,000 18,000 not specified Beaudesert Logan
Target completion 2011
SEQ-S7
Bromelton Offstream Storage*
8,000 5,000 5,000 Beaudesert Logan Target completion 2011
14 Prudent Yield – See section 2.2 for definition. 15 Water harvesting to Hinze Dam is not included as a drought response project under the Water Amendment Regulation (No. 6) 2006, however the regulation requires that preparation for water harvesting be undertaken.

Institute for Sustainable Futures, UTS and Cardno February 2007
Review of Water Supply-Demand Options for South East Qld – Final Report 29
DNRW Yields (2006) Historical No Failure Yield
Prudent Yield16
QWC Yields (2006)
Location Code Water Source
(ML/a) (ML/a) (ML/a) LGA WRP Area
Comment
SEQ-S8
Traveston Crossing Dam Stage 1*
80,000 70,000 not specified Cooloola Mary
Target completion 2011
SEQ-S9
Traveston Crossing Dam Stage 2 (Raise Borumba)
50,000 40,000 NA Cooloola Mary Target completion 2025
SEQ-S10
Traveston Crossing Dam Stage 3
70,000 40,000 NA Cooloola Mary Target completion 2042
SEQ-S11
Raised Mt Crosby Weir* 6,000 5,000 5,475 Ipswich Moreton
Target Completion 2008
SEQ-S12
SEQ (Gold Coast) Desalination Plant*
45,000 45,000 45,625 Gold Coast Not part of WRP
Target Completion 2008
Committed project SEQ-
S13
Western Corridor Recycled Water Scheme Stage 1*
30,000 30,000 36,500 Brisbane/ Ipswich/Esk
Not part of WRP Target
completion 2008
SEQ-S13
Western Corridor Recycled Water Scheme Stage 2*†
NA 47,000 40,150 Brisbane/ Ipswich/Esk
Not part of WRP
Target completion 2008
SEQ-S14
Eastern pipeline inter-connector* NA NA 8,030 Redland Logan
Target completion 2008
* Supply-side initiatives listed as drought response measures in the Water Amendment Regulation (No 6) 2006. †Western Corridor Recycled Water Scheme Stage 2 is included in the Water Amendment Regulation (No. 6) 2006 but has not been included in the figures for total system yield due to the recent announcement that the development of IPR, unless required due to worsening of the current drought, will be dependent on the outcome of the March 2007 plebiscite (Ministerial Media Statement 30 November 2006) and the subsequent cancellation of the plebiscite.
16 Prudent Yield – See section 2.2 for definition.

Institute for Sustainable Futures, UTS and Cardno February 2007
Review of Water Supply-Demand Options for South East Qld – Final Report 30
Figure 3-2 SEQ proposed supply-side initiatives
Note – Traveston Crossing Dam shows the location of proposed stages 1 and 3. Borumba Dam shows the locations of the Raising of the Borumba Dam (Traveston Stage 2).

Institute for Sustainable Futures, UTS and Cardno February 2007
Review of Water Supply-Demand Options for South East Qld – Final Report 31
Figure 3-3 shows the location of the supply-side initiatives together with their relative increase in yield and proximity to population growth areas. As indicated the Traveston Crossing scheme dominates the SEQ proposed yield yet is located a significant distance from the major growth areas in the south of the region. This will result in the need for significant pumping which will have major operating costs and greenhouse gas implications.
Figure 3-3 Relative yield from SEQ proposed supply-side initiatives compared to population growth areas

Institute for Sustainable Futures, UTS and Cardno February 2007
Review of Water Supply-Demand Options for South East Qld – Final Report 32
Figure 3-4 shows the SEQ proposed supply-demand balance. The figure illustrates how the increased yield from the supply-side initiatives will add to the down-rated yield of the existing supply system over time and how this compares to the reference case demand and anticipated demand after SEQ proposed demand-side initiatives are implemented.
Figure 3-4 The SEQ proposed supply-demand balance
Note – the indirect potable reuse component of the Western Corridor Recycling Scheme is not included due to uncertainty over its contribution to the medium to long-term supply-demand balance.
Figure 3-4 helps to illustrate the significant commitment that the Qld Government is making to both supply and demand-side initiatives. However, it also shows the significant “excess yield” that could potentially result if all the SEQ proposed supply-side initiatives are implemented. With the existing yield having already been down-rated to prudent yield and the yield of the new SEQ proposed supply-side initiatives taking into consideration the revised DNRW prudent yield assumptions, the combination of SEQ proposed supply-side initiatives provides an extremely conservative medium to long-term planning approach. In terms of short-term planning it is also difficult to justify a number of the SEQ proposed supply-side initiatives as part of a drought response. Hence, the SEQ proposed planning approach “as a whole” is considered inappropriate for several reasons as described below. A lower cost, lower risk strategy is proposed in Section 4.
In terms of short-term drought response planning a number of the demand and supply-side options will provide relief within a timeframe that could assist in slowing the rate of drawdown from storages to such an extent that the probability of the system “failing” in the current drought is significantly reduced. The exact timing that such options would need to be brought on-line needs to be assessed as part of a complex modelling exercise and the use of drawdown curves of the existing and modified (i.e. existing plus new sources) supply system. With the current drought and existing surface water storage levels being so low it is highly unlikely that options implemented after the next 2 to 3 years (i.e. post 2009) could assist in the current drought situation.
On Figure 3-4 this would mean that several of the SEQ proposed supply-side initiatives might be considered “too late” for the current drought situation. This includes all stages of the Traveston Crossing scheme, included as part of the Water Amendment Regulation (No.6) drought response
Institute for Sustainable Futures, UTS and Cardno February 2007
Review of Water Supply-Demand Options for South East Qld – Final Report 33
measures and represents just under half of the yield of the SEQ proposed supply-side initiatives identified in Table 3-3.
The SEQ proposed 2007 to 2009 supply-side initiatives are a mixture of smaller surface water, ground water, reuse and desalination. Considering these options as a whole (without considering the economic, social or environmental perspectives in detail) they represent a diverse mixture of sources that are less affected by climate variability than the existing predominantly “rain fed” SEQ supply sources currently affected by the drought. As such the suite of SEQ proposed 2007 to 2009 options, that will provide approximately 110 GL/a, will be useful in terms of providing water for both the short (drought) and medium to long-term and assist in diversifying the supply source portfolio.
Considering the medium to long-term planning, if these 2007 to 2009 SEQ proposed supply-side options are implemented and the SEQ proposed demand-side initiatives are also implemented the prudent yield of the system (which allows for worst case scenarios associated with drought) would return to over 560 GL/a providing excess yield to around 2025.
If the additional supply-side options post 2009 (including all stages of the Traveston Crossing scheme, Wyaralong Dam, both modifications to Hinze Dam and Bromelton Offstream) were also constructed this would potentially increase supply by approximately an additional 190 GL/a. This suite of options would rely predominantly on a single large “rain fed” storage (the Traveston Crossing scheme) and mean that the Qld Government would be investing in excess yield now that may not be required until 2050 if at all (i.e. dependent on the assumed water demand associated with the assumed population projections and the assumed prudent yields). As indicated earlier in Section 3.3, Stage 1 of the Traveston Crossing scheme alone is anticipated to cost over $2.6 billion. Hence this approach is considered risky in economic terms as it is committing public funds now to a high cost single “rain fed” source that may not actually be required. A more risk averse approach would be to use an adaptive management approach, as discussed further in Section 4.
To assist in determining which options should be considered further as part of the Study team “proposed strategy” detailed in Section 4, the existing SEQ proposed options need to be clearly separated into those that are effectively “committed” and thus will contribute to filling the SEQ supply-demand balance and those that will be considered further in Section 4. Three basic criteria have been used to determine this:
• Drought relief potential The extent to which the measure can deliver water during the critical drought period this has been assumed to be over the next 2 to 3 years (2007 to 2009).
• Level of commitment The extent to which the decision to proceed with implementation/construction is irreversible such as approvals obtained or construction commenced.
• Level of risk The risk associated with each measure in economic terms, for example a high risk option has high (up front) capital expenditure and some uncertainty that it may not deliver anticipated safe yield within the required timeframe whereas a low risk option has relatively low capital expenditure and high probability that it will deliver anticipated water in the required time.
When the SEQ proposed supply-side options are assessed according to these criteria it is evident that the large dam projects such as Traveston Crossing and Wyaralong Dam fail such criteria. For example they will not provide additional water in the critical drought period, cannot be considered committed as requisite Commonwealth approvals have not yet been obtained (i.e. both projects require approval under the Environmental Protection and Biodiversity Conservation Act 1999) and are high risk due to their high upfront costs and the fact they are “rain fed” adding to the vulnerability of the current predominantly rain fed supply system.

Institute for Sustainable Futures, UTS and Cardno February 2007
Review of Water Supply-Demand Options for South East Qld – Final Report 34
Due to the scope of this Study only the Traveston Crossing scheme has been considered further in Section 4.
Figure 3-5 shows the supply-demand balance removing all three stages of the Traveston Crossing scheme. With the remaining mixture of supply and demand-side initiatives being implemented by the Qld Government the supply-demand balance can be met until approximately 2030.
Figure 3-5 Supply-demand balance
Recommendation 3.3
Due to the scope of this Study only the Traveston Crossing scheme has been compared against a new suite of demand and supply-side options. However, it is recommended that at least Wyaralong Dam, with a capital cost alone of approximately $500 million and unit cost of over $2.00 /kL (without taking into consideration operating costs) should also be considered in more detail from an economic and risk perspective. This should be undertaken as soon as possible before implementation to ensure that this SEQ proposed supply-side option is appropriate economically, socially, environmentally and from a risk perspective.
3.4 Gaps and opportunities in current planning Assessment of the SEQ proposed demand and supply-side options reveals significant potential for improvements in planning for both drought relief and medium to long-term water security.
Despite significant investment in demand management initiatives and the setting of targets for reduced per capita water consumption, there remains significant opportunity to tap into additional water savings. Many of these additional demand-side options are likely to have lower unit costs than those currently being implemented by the Qld Government.

Institute for Sustainable Futures, UTS and Cardno February 2007
Review of Water Supply-Demand Options for South East Qld – Final Report 35
On the supply-side, there is potential to re-visit the SEQ-proposed strategy and develop a suite of options that are more risk-averse, lower in unit cost and provide more security for both drought response and medium to long-term supply security, if these additional supplies are found to be required.
As the Traveston Crossing scheme fails to meet any of the criteria identified in Section 3.3 and represents nearly half of the yield associated with the SEQ proposed drought and medium to long-term planning this option is considered “not committed”. It has therefore been assessed in greater detail along with other potential additional demand and supply-side options (within the framework of an adaptive management approach) in Section 4 – The Study Team Proposed Strategy.
In addition, due to the uncertainty of whether indirect potable reuse will be accepted by the community as part of medium to long-term planning, the indirect potable reuse component of the Western Corridor Recycling Scheme has also been removed from the SEQ committed supply-side initiatives and considered further in Section 4 together with additional indirect potable reuse opportunities.
Recommendation 3.4
The Traveston Crossing scheme is geographically disconnected from the high growth areas in the south of the SEQ region, is rain fed and therefore augments an already vulnerable rain fed dependent supply system and has a high upfront cost. It is therefore considered to be a high risk in economic terms. In addition assuming the drought response measures are needed over the next 2 to 3 years, to alleviate the current drought situation, Traveston Crossing Dam Stage 1 cannot provide assistance in the current drought (even though it has been included in the emergency drought response legislation) as it is due to be completed by 2012 and will then need time to fill to provide yield. Hence on these criteria alone the decision to build the Traveston Crossing scheme is not recommended and should be reconsidered by the Qld Government.

Institute for Sustainable Futures, UTS and Cardno February 2007
Review of Water Supply-Demand Options for South East Qld – Final Report 36
4 STUDY TEAM PROPOSED STRATEGY
4.1 Overview of approach As identified in Section 1.3 this Study has used the principles of integrated resource planning (IRP) as the basis for the review. IRP is considered a best practice approach to urban water planning and management internationally (Turner et al, 2007). As part of this approach a suite of additional demand and supply-side options have been developed to complement those already committed as part of the SEQ proposed supply-demand strategy (excluding the Traveston Crossing scheme).
In addition to the use of IRP a number of criteria have been used to assist in reviewing the existing SEQ proposed supply-side options and those proposed by the Study team.
The criteria identified in Section 3.3 include:
• drought relief potential (i.e. to what extent can the option assist in the current drought)
• level of commitment (i.e. to what extent are the costs of the option ‘sunk’)
• level of risk (i.e. does the option involve a large upfront capital cost, or increase the reliance on rain fed supply sources)
The “level of commitment” criteria are not relevant when considering new options. However, the following additional criteria have been considered (to the extent possible within the scope) when developing options:
• economic – low unit cost and the avoidance of options with a high upfront cost
• social impacts
• environmental impacts
To minimise risk and cost, a portfolio of options should be developed that as closely as possible matches the demand and supply over the planning period. This favours low unit cost, modular options combined with options that can be developed rapidly during severe droughts. The risk of historical droughts occurring is built into the prudent yield, therefore for yield to exceed demand represents an over-investment in water supply infrastructure at the expense of other public services.
Sections 4.3 and 4.4 outline the suite of additional demand-side and supply-side options that have been analysed as part of this Study and their associated yields and costs. These are used to develop a strategy that addresses medium to long-term planning as well as response to severe drought.
Before this the economic analysis method used is briefly explained in Section 4.2 below.
4.2 Economic analysis As indicated in Section 1.3 comparing options using a common metric is key to IRP. Hence to assist in obtaining a first cut ranking of the suite of demand and supply-side options the total cost to society (the total resource cost), estimated yield and resulting unit cost ($/kL) have been identified for each option over the 2050 planning horizon.

Institute for Sustainable Futures, UTS and Cardno February 2007
Review of Water Supply-Demand Options for South East Qld – Final Report 37
The total costs include all capital and ongoing operating costs to all stakeholders including customers, each utility and the Qld Government over the 2050 planning horizon. The yield in terms of water supplied or saved is similarly considered over the same period. Appendix C provides an explanation of how the unit cost ($/kL), which is considered for each option, is calculated.
4.3 Demand-side options As indicated in Sections 2.2.2 and 3.2, there is still significant conservation potential that can be tapped into in both existing and new properties in the residential and non residential sectors and in non revenue water. By tapping into this potential the demand can be further reduced to not only achieve but exceed the demand reduction targets, thereby reducing the supply-demand gap further.
Additional demand-side options have been investigated by the Qld Government. Unfortunately, this information has not been released publicly or made available to the Study team and therefore a high level independent assessment has been undertaken to provide an “indication” of the level of additional savings available and “what it might take” to achieve such savings for example in terms of various instruments (i.e. regulations). In addition, unit costs have been determined to enable comparison with supply-side options.
To assist in identifying potential savings in the residential sector a summary of the efficiency of the current stock of appliances has been compiled as shown in Table 4-1.
Table 4-1 Efficiency levels in the residential sector
End Use 2001 2002 2003 2004 2005 Showers (efficient) 36.9% 43.9% - people taking shorter showers 14.2% 15.4% Toilets (dual flush) 62.1% 74.7% Front loading washing machines sales* 9.1% 12.6% 19.8% 23.6% 25.4% Front loading washing machines in households 6.6% 10.3% - people using full loads 13.3% 13.7% - < 3 loads per week 25.0% 24.6% - 3 to 5 loads per week 37.1% 42.6% Households with evaporative air conditioners 4.5% 5.7% use < 1 month per year 13.6% 18.2% use < 1 month per year to < 3 months per year 27.5% 31.7% Households with rainwater tanks 17.5% 17.4% Households with rainwater tanks in Brisbane 4.8%
Sources – ABS 2004 and ABS 2005 and *GFK 2006 This information is provided at a state level and is therefore only used to provide an indication of efficiency of stock in the SEQ area.
Table 4-2 provides a summary of the options considered. Appendix B provides a more detailed description of each option and the associated assumptions. It should be noted that additional conservation potential is still available but can only be assessed with more detailed data and modelling.

Institute for Sustainable Futures, UTS and Cardno February 2007
Review of Water Supply-Demand Options for South East Qld – Final Report 38
Table 4-2 Study team proposed new demand-side options
No. Option Residential sector SP – D1 Retrofit program (extension) - Extension of the current retrofit program on existing
households to 75% of existing households, over a long period and based on the turnover (sales) of housing stock. To achieve this high level of uptake regulations would be used to ensure that at ‘point of sale’ all existing households need to be certified that they have undertaken a retrofit. It is assumed that the majority of the cost of this service would be provided by government or the water service provider, therefore providing a minimum financial barrier to the house owner and reducing community resistance to the scheme. This option assumes a saving of 21 kL/household/annum (Turner et al, 2005).
SP – D2 Rainwater tank (extension) – Extension of the rainwater tank program for existing households. This program would require connection of the tank to outdoor and selected indoor end uses to optimise the rainwater tank savings. In some locations in (for example) Brisbane there are localised constraints experienced by the stormwater system or peak water supply. Rainwater tanks in such areas could reduce costs associated with upgrading stormwater or water reticulation systems (Turner et al, 2003). This is very area-specific and requires further research, but it can be assumed that such opportunities will reduce the unit cost of rainwater tank retrofits, which would otherwise be very high. It is assumed that a high uptake could be achieved in this option if it were linked to regulations that affect specific zones that would benefit from avoided stormwater infrastructure upgrading and mains upgrading associated with fire fighting. Savings of 70 kL/household/a have been assumed (Coombes & Kuczera, 2003).
SP – D3 Mandatory Water Efficiency Performance Standards (MWEPS) – This option assumes savings in existing and new households by introducing minimum efficiency standards on appliances such as washing machines, showers and toilets. To minimise double counting only savings associated with washing machines have been assumed, a saving of 24 kL/household/annum (pers com Spaninks, 2006). An additional benefit of this option would be to assist in locking in the savings associated with other programs such as the retrofit program though mandatory efficiency standards on showerheads and taps.
SP – D4 Outdoor garden program – This option assumes an outdoor ‘tune up’ program involving an inspection, assessment, advice and hardware support, would be implemented for existing households and could obtain 20% savings of the outdoor component of demand. Such a program would be implemented in a similar way to the retrofit program. To ensure the high level of uptake and the maintenance of savings the use of regulations would be used to ensure that at point of sale all households must undertake the outdoor garden program inspection and service. To maintain these savings it is assumed that such households would participate in the program several times over the 2050 planning horizon as they are re-sold.17
SP – D5 Smart growth (new) – Significant savings are already being assumed as part of the SEQ requirements for new developments. However, the practical experience in, for example, Pimpama-Coomera on the Gold Coast, and proposed requirements in Caloundra has gone much further, assuming an 80% reduction in demand compared to current household use. This is achieved through ultra-high efficiency fixtures and appliances, maximising the capture of rainwater on site, and maximising the reuse of treated effluent. Costs are reduced through integration of the water supply
17 This program would effectively be a significant extension of the Home Garden Waterwise Rebate Scheme recently released by the Qld Government [http://www.nrw.qld.gov.au/water/saverscheme/pdf/garden_scheme.pdf - accessed 09/07/02].

Institute for Sustainable Futures, UTS and Cardno February 2007
Review of Water Supply-Demand Options for South East Qld – Final Report 39
No. Option components and infrastructure and the use of ‘smart sewers’ and localised treatment to reduce water and effluent reticulation and transport costs. For modelling purposes the date for implementation of such a requirement for all new developments has been deferred until 2020 and care has been taken not to double count with the existing SEQ demand-side initiatives. This option is particularly powerful as it deals with the main driver for growth in demand in the SEQ region – new developments.
Non residential sector SP – D6 Non residential high water users (BWEPS – extension) - Extension of the high water
users program to additional customers, assuming a 25% saving is available. This option is rolled out over a longer period than the current program to increase the probability of adoption and also assumes that sufficient incentives are provided to attract customers to implement the results of audit and assessment recommendations. Regulatory instruments could be used to increase the uptake of this option.
SP – D7 Non residential users (non residential - smart growth) – This option assumes a 40% saving could be achieved in new non residential properties. This option would be supported by regulations (development consent conditions) to ensure uptake.
Non revenue water Pressure and leakage – The existing SEQ demand-side initiative on pressure and
leakage management is extensive. Without more detailed information on the current annual real losses and unavoidable annual real losses an extension of this option is difficult to model. With more detailed information further savings and additional investment would be available. No additional savings have been assumed.
Figure 4-1 illustrates the existing SEQ demand-side initiatives and the additional savings that could be obtained from the new proposed demand-side options developed by the Study team. These options have assumed high participation rates could be achieved because a combination of economic, regulatory and communicative instruments would be used to “break barriers” to their implementation. These options are not exhaustive and additional conservation potential is still available but requires more detailed modelling.

Institute for Sustainable Futures, UTS and Cardno February 2007
Review of Water Supply-Demand Options for South East Qld – Final Report 40
Figure 4-1 SEQ and new study team proposed demand-side options
Note – Care needs to be taken in interpreting the savings of the existing SEQ demand management and new study team proposed options when comparing these to the reference case. The reference case demand used in this study is considered conservative, as it does not take into consideration the natural attrition of inefficient appliances or urban consolidation. In assessing the demand management options care has be taken to avoid double counting potential savings.
Figure 4-1 shows the combination of the suite of committed SEQ demand-side initiatives and Study team new proposed demand-side options would exceed the identified demand reduction targets and assist in capping the increase in demand being driven by population growth. In addition if the SEQ proposed supply-side options (except those associated with the Traveston Crossing scheme) are also considered, the supply-demand balance could be maintained until approximately 2050.
The total costs, unit costs and potential savings of each of these options are summarised in Table 4-3. Figure 4-2 shows a supply curve for the options, which illustrates the unit cost and estimated volume of water saved by 2050. The assumptions used to obtain the costs, savings and unit costs are summarised in Appendix B.
The unit costs and cumulative savings have been compared against the Traveston Crossing scheme. All options except the rainwater tank rebate extension program have a significantly lower unit cost than the Traveston Crossing scheme, they can provide more yield and in many cases are related to the main driver of the increase in water demand – growth.
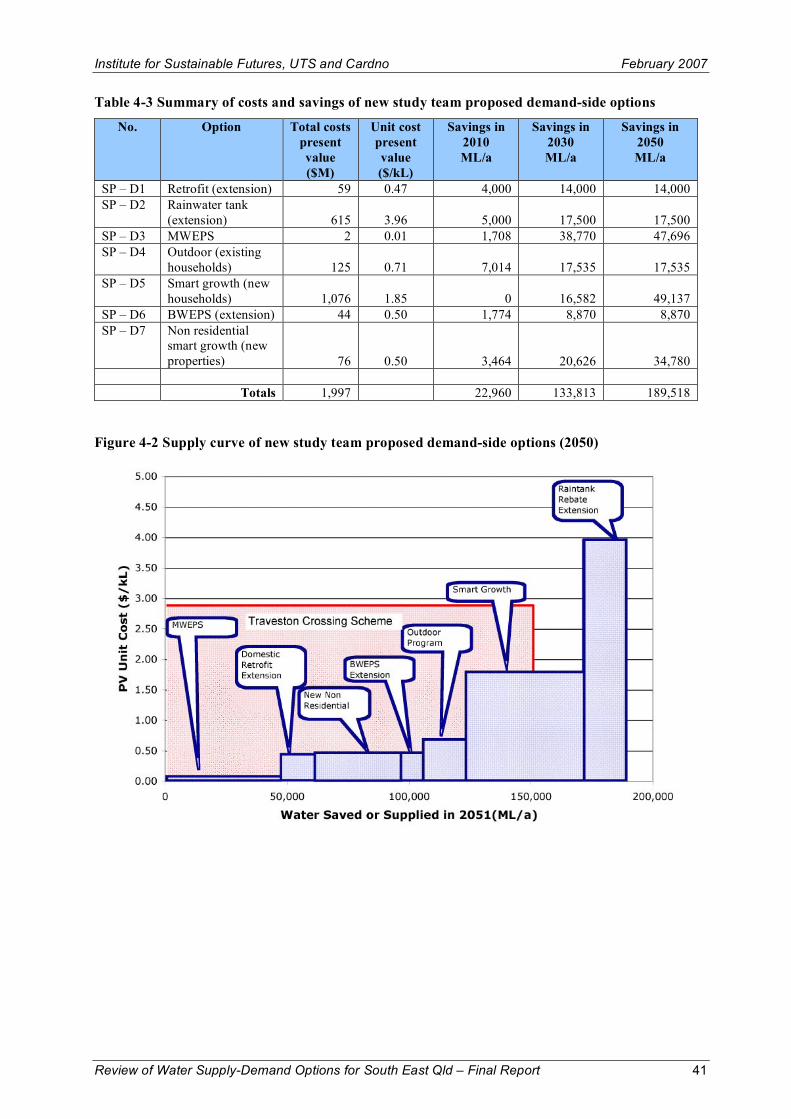
Institute for Sustainable Futures, UTS and Cardno February 2007
Review of Water Supply-Demand Options for South East Qld – Final Report 41
Table 4-3 Summary of costs and savings of new study team proposed demand-side options
No. Option Total costs present value ($M)
Unit cost present value ($/kL)
Savings in 2010 ML/a
Savings in 2030 ML/a
Savings in 2050 ML/a
SP – D1 Retrofit (extension) 59 0.47 4,000 14,000 14,000 SP – D2 Rainwater tank
(extension) 615 3.96 5,000 17,500 17,500 SP – D3 MWEPS 2 0.01 1,708 38,770 47,696 SP – D4 Outdoor (existing
households) 125 0.71 7,014 17,535 17,535 SP – D5 Smart growth (new
households) 1,076 1.85 0 16,582 49,137 SP – D6 BWEPS (extension) 44 0.50 1,774 8,870 8,870 SP – D7 Non residential
smart growth (new properties) 76 0.50 3,464 20,626 34,780
Totals 1,997 22,960 133,813 189,518
Figure 4-2 Supply curve of new study team proposed demand-side options (2050)

Institute for Sustainable Futures, UTS and Cardno February 2007
Review of Water Supply-Demand Options for South East Qld – Final Report 42
4.4 Supply-side options A number of new supply-side options have also been considered. These are summarised in Table 4-4 together with their estimated additional yield that could be used to increase the yield of the system. Costs of each of these options are provided later in this Section. For full details and assumptions of each option refer to Appendix B. Figure 4-3 shows their locations.
Table 4-4 Study team new supply-side options
No. Option Estimated Additional Yield ML/a
Desalination SP – S1 Bribie Island Desalination (125 ML/day) 45,600 SP – S2 Bribie Island Desalination (250 ML/day) 91,250 SP – S3 Bribie Island Desalination (400 ML/day) 146,000 Indirect potable reuse (IPR) SP – S4 Western Corridor IPR 40,000 SP – S5 Sandgate to North Pine Dam IPR 5,620 SP – S6 Brendale to North Pine Dam IPR 1,680 SP – S7 Murrumba Downs to North Pine Dam IPR 4,230 SP – S8 Merrimac to Hinze Dam IPR 7,330 SP – S9 Noosa to Lake MacDonald IPR 2,040 SP – S10 Maroochy to Wappa Dam IPR 6,170 SP – S11 Caboolture to Moodlu Storage IPR 2,550 SP – S12 Kawana to Ewan Maddock Dam IPR 6,600 Surface water SP – S13 Glendower Dam & Albert River Barrage 18,000 SP – S14 Amamoor Dam to Narrangba 20,000 SP – S15 Cambroon Dam to Stanley River 32,000 SP – S16 Borumba-Coles-to North Brisbane 31,000 SP - S17 Borumba-Narangba 15,000 SP – S18 Wappa-Landershute 8,500 Other options SP – S19 System optimisation (benefits) 10,000

Institute for Sustainable Futures, UTS and Cardno February 2007
Review of Water Supply-Demand Options for South East Qld – Final Report 43
Figure 4-3 Potential Water Supply Sources in SEQ

Institute for Sustainable Futures, UTS and Cardno February 2007
Review of Water Supply-Demand Options for South East Qld – Final Report 44
There are a significant number of new supply-side options that can be considered. Many of these options have been investigated in past water resources planning studies described in reports such as:
• Water Supply Sources in South East Queensland Volume 2 – Main Report, by Water Resources Commission, DPI, Brisbane, 1991;
• An Appraisal Study of Water Supply Sources for the Sunshine Coast and the Mary River Valley – Main Report, Water Resources, Dept of Primary Industries, Brisbane 1994; and,
• South East Queensland Water and Wastewater Management Study, Final Report for Phase 1 – Water Services and Infrastructure Needs, Volume 1, Kinhill and GHD, 1999.
Options investigated as part of this Study have included:
• further development of groundwater sources • new surface water sources, or modifications to the proposed sources • desalination both as a pre-emptive option for growth and as a readiness option • recycled water, in particular, indirect potable reuse both as a pre-emptive and readiness option • recommissioning of existing sources • purchase or trading of water allocation from irrigation • transfer of water from other catchments • benefits from system optimisation due to interconnection • supply-side readiness options
The following sections describe these potential water sources, while Appendix B contains Fact Sheets on selected options. The fact sheets include capital and operating costs of the various options. Figure 4-3 shows the locations of these potential sources.
4.4.1 Groundwater Sources There has been a significant amount of investigation recently of potential groundwater sources in the SEQ region with an aim to develop additional groundwater supplies for short-term drought emergency measures and long-term supply. Most of these sources are assumed to be included in the existing system yield, or as additional yield being developed as part of the drought response. None of the potential groundwater sources have been included in this Study. The Brisbane Aquifer Project, Bribie Island Groundwater Project and North Stradbroke Island (part of the Eastern Pipeline Interconnector) are all included as part of the SEQ supply-side initiatives.
Other Groundwater Sources.
Other potential sources, which have been investigated, are the Cooloola Sand Mass, Moreton Island, and aquifers in the costal area between Brisbane and Caloundra. The Cooloola Sand Mass and Moreton Island are capable of yielding significant supplies, however significant areas of these sand masses are National Park, or high value conservation areas, and the amount of borefield development would be very limited.
It is understood that groundwater investigations in the coastal areas between Brisbane and Caloundra have failed to find any significant potential supplies.
Investigation, drilling and development of bores are occurring in Toowoomba, with the aim of increasing the supply from Toowoomba’s bores to its full water entitlement from this source.

Institute for Sustainable Futures, UTS and Cardno February 2007
Review of Water Supply-Demand Options for South East Qld – Final Report 45
4.4.2 Surface Water Sources The surface water sources proposed for construction as part of the current SEQ proposed supply-side initiatives are listed in Section 3.3. There are many other options that have been put forward as part of earlier water resource planning studies. A small number of options have been selected and proposed in this study as potential medium to long-term supply options, should they be required. These are described briefly in the following sections. Summaries of the options including yield, capital cost, operating cost, energy requirements and a brief description of the option with references are contained in Appendix B.
Glendower Dam – Albert River Barrage.
Glendower Dam which is located on the Albert River had been proposed as a future water source for SEQ in earlier planning studies. Consequently the Qld Government resumed land for this storage. In conjunction with Glendower Dam, it was planned also to construct a barrage on the Albert River at 18.7 km (near Yatala). Water would be drawn from the barrage. The advantage of this water supply system is its proximity to the Southern Regional Pipeline and the land acquisition that has already occurred for the Glendower Dam. A recent review by DNRW has identified impacts of this development on the riparian zone of the Albert River downstream of the dam.
The supply from this option is estimated as 18,000 ML/a at Albert River barrage for a Glendower Dam with a full supply level of RL 79.17 m AHD and capacity 111,800 ML.
Costs in the appendix include a pump station, treatment plant and pipeline to treat and deliver the supply to the Stapylton balancing storage on the Southern Regional Pipeline, as well as the cost of the dam itself.
Amamoor Dam
Amamoor Dam was proposed as a future water supply for the Mary Valley and North Coast area in past planning studies. Subsequently the Qld Government acquired all privately owned property that would be required for the development of this site. Development of this site however has been rejected in favour of the proposed Traveston Crossing scheme.
Amamoor Dam site is located on Amamoor Creek, a tributary of the Mary River. Costs for a dam with a full supply level of RL 135 m AHD and capacity of 220,000 ML were taken from the GHD 2006 Desk Top Study Report (GHD 2006). The yield from a dam of capacity 200,000 ML has been re-estimated recently by DNRW as 21,500 ML/a.
Treatment and delivery costs assume delivery of the supply from this dam by pipeline to the Narangba area.
Cambroon Dam
Cambroon Dam site is located on Mary River upstream of Kenilworth. This was investigated as one of the potential future water supply sources in the Mary Valley, but rejected in favour of the Traveston Crossing scheme. The dam is located 67 kilometres further upstream than the Traveston Crossing Dam, and development of this site would have much less impact on the Mary River than development of the Traveston Crossing Dam.
A storage with full supply level of RL 130 m AHD and capacity 120,000 ML has been assumed. A storage with this full supply level may affect parts of Conondale township, although most of the town is sited above 135 metres elevation. The yield of this dam has been recently re-estimated by DNRW. For a storage of 100,000 ML, the HNFY is estimated as 32,000 ML/a, exclusive of high flow and low flow compensation releases necessary to comply with the Mary Basin WRP.

Institute for Sustainable Futures, UTS and Cardno February 2007
Review of Water Supply-Demand Options for South East Qld – Final Report 46
The costing has included a pipeline and tunnel to convey the supply from this dam to Somerset Dam. A tunnel of 5.5 km length would be required.
The supply from this dam would supplement the supplies extracted from the Wivenhoe Dam - Somerset Dam system at Mt Crosby Weir, and also for the proposed pipeline to Perseverance Dam for Toowoomba’s water supply.
Borumba Dam plus Coles Crossing Weir.
Borumba Dam is included as one of the proposed storage developments for SEQ, but as a storage constructed after Traveston Crossing Stage 1 and operating in combination with Traveston Crossing Stage 1.
There remains an option for Borumba Dam to be constructed independently of the Traveston Crossing Dam. The option of Borumba Dam to be constructed in conjunction with Coles Crossing Weir on the Mary River has been included in this report. Borumba Dam with a full supply level of RL 169.9 m AHD and capacity of 460,000 ML has been assumed. Releases would be made to Coles Crossing Weir, from where supply from this system would be drawn. The yield (at Coles Crossing Weir) of this storage system has recently been revised by DNRW as 31,000 ML/a exclusive of existing commitments.
The cost for the dam has been taken from the GHD 2006 Desktop study, and adjusted to conform with the revised DNRW costs for a smaller capacity dam from the report “Water for South East Queensland – A Long Term Solution”. Treatment and delivery costs to the north Brisbane area have been included in the cost estimates.
Borumba Dam
This option considers the supply directly from Borumba Dam without any weir on the Mary River. The yield directly from a 460,000 ML capacity dam is estimated to be 15,000 ML/a exclusive of existing commitments.
The cost for the dam is as described above. Delivery and treatment costs have also been included assuming that the supply would be treated and delivered as far as the Narangba area.
Raised Wappa Dam
Raising of Wappa Dam is one of the options that has been considered in past planning studies. Recent advice from DNRW is that for compliance with the WRP there are fairly severe environmental flow releases required from Wappa Dam that result in very little additional yield for storage sizes above about 30,000 ML. For a storage capacity of 30,000 ML (Full Supply Level 63 m), the yield is estimated to be 8,500 ML/a in excess of the existing entitlements from the storage (16,500 ML/a).
The dam costs have been taken from the GHD 2006 Desktop Study. Treatment and delivery of the additional supply to the Landershute area has been assumed in the costing of the delivery system.
The raised Wappa Dam could be considered in conjunction with the indirect potable reuse option for supply from Maroochydore Wastewater Treatment Plant.
4.4.3 Desalination A desalination plant is currently being constructed at Tugun as one of the Water Supply Emergency Projects included in the QWC projects. The plant will deliver 125 ML/day.
A similar type of plant could be constructed on the middle to northern part of Bribie Island on the ocean side. This appears to be a suitable location as the inlet and outlet works could be constructed in

Institute for Sustainable Futures, UTS and Cardno February 2007
Review of Water Supply-Demand Options for South East Qld – Final Report 47
an area where there would be good dispersion of the reject brine. Suitable State owned land appears to be available in this area. This location appears preferable to other locations in SEQ.
Preliminary costs have been prepared for three plant sizes: 125 ML/day (45,600 ML/a), 250 ML/day (91,200 ML/a) and 400 ML/day (146,000 ML/a). The location appears to be suitable for plant sizes to 400 ML/day.
For the 125 ML/day, a delivery system has been assumed to as far as the Pine Rivers area. For the larger capacity plants delivery has been assumed to go as far as the north Brisbane area. The estimated costs of the three plants are contained in Appendix B.
The desalination plant costs are Cardno preliminary estimates, based on cost information for Tugun Plant, Kwinana Plant, and approximate costs provided by suppliers. Supplier costs are significantly lower than these costs. For example desalination capital cost estimates provided by suppliers are around $1.5 million/ML/day supply (excluding inlet and outlet works). The figure estimated by Cardno is $3.2 million/ML/day (excluding inlet and outlet works). The Tugun Plant (excluding inlet and outlet works) is $4.8 million/ML/day. The Kwinana plant cost is approximately $3.0 million/ML/day including auxiliary infrastructure. A major supplier of desalination equipment has quoted $1.10/kL sale price for desalinated water. For comparison, it is understood that the sale price for desalinated water at the port of Singapore is approximately $1.70 AUD per kL.
Costs of the pump stations, and pipelines for delivery to significant areas of demand are included in the total plant costs.
4.4.4 Recycled Water (Indirect Potable Reuse) Any set of water supply options must include consideration of the use of recycled water, in particular indirect potable reuse (IPR). Indirect potable reuse is where highly treated recycled water is placed in an environmental buffer such as a river, storage, aquifer, or other water body and mixed with the existing water source before extraction, re-treatment, distribution and potable use.
The Water Services Association of Australia (WSAA) has recently released a position paper “Refilling the Glass – Exploring the Issues Surrounding the Use of Recycled Water in Australia”. This position paper explores the issues surrounding use of recycled water including IPR.
Any advanced treatment process for IPR will require multiple barriers. Several physical and chemical barriers are required for pathogens, which can cause problems even if they are present only for a short time. Figure 4-4 shows a diagram from the WSAA position paper, which illustrates the multiple barrier treatment approach.

Institute for Sustainable Futures, UTS and Cardno February 2007
Review of Water Supply-Demand Options for South East Qld – Final Report 48
Figure 4-4 Diagram Illustrating Multi-Barrier Treatment Processes in IPR
(Source: WSAA Position Paper)
There are at least 12 IPR schemes in operation around the world, and in Australia, IPR is being considered for Goulburn. IPR was proposed for Toowoomba, but was rejected in a plebiscite in July 2006.
Advantages of IPR include security of supply, and a supply that can utilise existing water distribution infrastructure, rather than needing a separate pipe network for non-potable supply.
The IPR options presented here all involve the advanced treatment of treated wastewater from secondary or tertiary wastewater treatment plants by a number of processes including microfiltration, reverse osmosis, and disinfection, then placement in or upstream of a water supply storage, for mixing, exposure to sunlight, and re-treatment before potable use. The component recycled in most cases will constitute less than 15% of the total supply.
The potential IPR schemes are listed in the fact sheets in Appendix B, and the summary table in this section. Brief descriptions of the potential schemes are as follows.
Western Corridor Recycled Water Scheme
Recycled water of a standard suitable for IPR is to be produced by this scheme. Some of the supply will be used at Tarong and Swanbank Power Stations to substitute for potable supply passing to these power stations. Additional recycled water will be available beyond these uses and supply and it is proposed that this be placed in Somerset or Wivenhoe Dams. A total of approximately 40,000 ML/a will potentially be available for IPR. If all of this were used for IPR, the recycled component of the supply would make up approximately 12% of the total supply from the Wivenhoe Somerset water supply system.
Sandgate to North Pine Dam
A major upgrade of the Sandgate wastewater treatment plant to tertiary treatment standard is underway. A further advanced treatment stage could be added, and the recycled water piped to North Pine Dam for storage, re-treatment and reuse. If 5,600 ML/a were produced (the approximate maximum volume which could be produced from the plant with its current loading), the recycled component would represent less than 10% of the total supply from the dam.

Institute for Sustainable Futures, UTS and Cardno February 2007
Review of Water Supply-Demand Options for South East Qld – Final Report 49
Brendale to North Pine Dam
A tertiary wastewater treatment plant is located at Brendale. This option involves further advanced treatment of the effluent and piping it to North Pine Dam for storage, re-treatment and reuse. The recycled component would be approximately 1,700 ML/a, or about 3% of the total supply from North Pine Dam.
Murrumba Downs to North Pine Dam
A tertiary wastewater treatment plant is located at Murrumba Downs. This option involves further advanced treatment of the effluent and piping it to North Pine Dam for storage, re-treatment and reuse. The recycled component would be approximately 4,230 ML/a, or about 7% of the total supply from North Pine Dam. If recycled water from Sandgate and Brendale plants is also pumped to North Pine Dam, the recycled component of the total supply from North Pine dam will be about 16% of the total supply from the dam.
Merrimac to Hinze Dam
Merrimac treats wastewater from the Gold Coast area to tertiary standard. This option is to treat water to a higher standard and pipe it to Hinze Dam for reuse. The quantity recycled would be approximately 7,300 ML/a (the amount potentially available from the existing plant), and the recycled component would make up approximately 9% of the total supply from Hinze Dam.
Noosa to Lake MacDonald
The Noosa plant is a tertiary treatment plant. With this option, further advanced treatment of the wastewater would occur, then the recycled water would be piped to Six Mile Creek upstream of Lake MacDonald. If all the output of the Noosa Wastewater Treatment Plant (less currently re-used fraction and the process waste stream) were treated, then the recycled component would represent approximately 33% of the current supply from Lake MacDonald.
Maroochy to Wappa Dam
The Maroochydore Wastewater Treatment Plant is currently being upgraded to tertiary treatment with the capacity to produce Grade A recycled water. With this option, further advanced treatment of the wastewater would occur, then the recycled water would be piped to North Maroochy River upstream of Wappa Dam. If all the output of the Maroochydore Wastewater Treatment Plant (less currently re-used fraction and the process waste stream), then the recycled component would represent approximately 40% of the current supply from Cooloolabin-Wappa Dam-Poona water supply system. The recycled component would be less if Wappa Dam were to be raised.
Caboolture to Moodlu Storage
The South Caboolture Wastewater Treatment Plant has advanced water treatment processes that are able to treat recycled water to standards suitable for IPR. Currently, most of this recycled water is discharged to the river although 1 to 2 ML/day is currently being reused. An option is to pump the remaining available recycled water (approximately 7 ML/day) to the Moodlu Storage. Water could be released from the storage into Wararba Creek to be captured and re-treated in the water treatment plant for potable use, or drawn directly from the Moodlu Storage.
Kawana to Ewan Maddock Dam
With this indirect potable reuse option, tertiary treated effluent from the Kawana Wastewater Treatment Plant undergoes further advanced treatment by reverse osmosis and other processes, then is

Institute for Sustainable Futures, UTS and Cardno February 2007
Review of Water Supply-Demand Options for South East Qld – Final Report 50
piped to a point just upstream of Ewan Maddock Dam to be mixed with runoff from its catchment and recycled for urban use.
There are plans to recommission Ewan Maddock Dam as a water supply storage. The water yield from this storage is estimated to be 3,800 ML/a.
The recycled component will represent approximately 63% of the total supply available from Ewan Maddock Dam. The supply from Ewan Maddock Dam (including the recycled component) could possibly be mixed with the supply from other water sources.
General
The potential IPR schemes described above are not an exhaustive list of the IPR options in SEQ, but include ones that will offer significant recycled water supplies. There are approximately 60 wastewater treatment plants in SEQ many of which are small capacity plants. An additional option offering a significant recycled water supply and worthy of further investigation is IPR from Loganholme Wastewater Treatment Plant. Treated wastewater from the Loganholme wastewater treatment plant could be purified and piped to a storage in the Logan River catchment such as the proposed Bromelton Off-stream Storage or the proposed Wyaralong Dam for IPR.
The recycled component of each of the supply sources mentioned above is a time-averaged figure. The recycled component will increase during drought periods, and reduce during periods of high runoff and overflows.
Some of the above IPR options may require upgrading of the downstream water treatment plants to include ozonation and BAC filtration processes as additional measures of protection against possible failure of the advanced wastewater treatment plants due to such events as lightning strikes.
IPR options will be affected by demand management initiatives. In future detailed modelling both the yield and costs of such options will need to take this into consideration.
4.4.5 Recommissioning of Existing Inactive Water Sources Enoggera Dam and Lake Manchester are water storages owned by Brisbane City Council and were originally used for Brisbane’s water supply. Following the construction of other major water sources including Wivenhoe Dam, these storages ceased being utilised as water sources. In response to the current drought situation, Brisbane City Council is reactivating them.
Lake Manchester is located on Cabbage Tree Creek, a tributary of the Brisbane River upstream of Mt Crosby Weir. Releases of up to 30 ML/day are now being made from Lake Manchester to Mt Crosby. The HNFY of this storage has recently been re-estimated by DNRW as 5,800 ML/a, although this yield will be revised downwards, as the current drought is the critical period in the historical simulation period for this storage. The prudent yield estimate for this storage is of the order of 5,000 ML/a.
Enoggera Dam is located on Enoggera Creek and is one of Brisbane’s earliest water storages, being constructed in 1866. The water treatment plant at this storage is being re-commissioned, and it is expected that 6 to 8 ML/day will be drawn from this source. The HNFY of this storage has recently been estimated by DNRW to be 1,700 ML/a.
Assuming that these two storages will remain active supplies, an additional 6,700 ML/a will be available for urban water supply. These water sources are not included in the lists of supplies from the existing and proposed water sources in the report “Water For South East Queensland – A Long Term Solution”. The supplies from these storages also are not included in the QWC Water Supply Emergency Projects.

Institute for Sustainable Futures, UTS and Cardno February 2007
Review of Water Supply-Demand Options for South East Qld – Final Report 51
Ewan Maddock dam is an urban water supply storage located on Adlington Creek, constructed in 1975, which provided water supply for the Caloundra area. Because of the condition of delivery mains and water treatment facilities, this storage has been inactive as a supply source in recent years. There are plans to reconstruct the treatment and delivery system and bring this storage on line as part of the drought management strategy. This storage has been included in the list of existing supplies in the SEQRWSS planning study, therefore cannot be considered as an additional supply.
4.4.6 Acquisition of Rural Water Allocation There are a number of water supply schemes that provide water for rural uses within the SEQ area. These schemes are owned by SunWater and are:
• Central Lockyer Valley Water Supply Scheme • Logan River Water Supply Scheme • Lower Lockyer Valley Water Supply Scheme • Mary River Water Supply Scheme • Warrill Valley Water Supply Scheme
There have been proposals to acquire some of this rural allocation for urban use, either as a seasonal assignment (temporary transfer) of interim water allocation or a permanent transfer of water allocation. Seasonal assignment is possible under the Interim Resources Operations Licences (IROL) for these schemes but permanent transfer is not possible until Resource Operations Plans (ROP) have been prepared for the particular schemes.
As no ROPs have been prepared for areas encompassing these schemes, seasonal assignment of water allocation appears to be the only current avenue for acquisition of water for urban water supply purposes.
There is virtually no scope in all these schemes except the Mary River Water Supply Scheme for seasonal assignment of interim water allocation, as the announced allocations for medium priority interim water allocations in these schemes have been zero or close to zero for a number of years recently, because of the continuing severe drought conditions.
The Mary River Water Supply Scheme has three sub-schemes: Lower Mary River Water Supply Scheme; Mary Valley Water Supply Scheme; and Cedar Pocket Water Supply Scheme. Potential for transfer of allocation in the Lower Mary Water Supply Scheme is very limited because of its distance from the centres of demand. Potential is also limited in the Cedar Pocket scheme because it has a very small allocation relative to the other schemes.
Noosa draws part of its supply from Mary River at Coles Crossing, and its allocation is from the Mary Valley Water Supply Scheme. Some potential may exist for seasonal assignment of water from this sub-scheme. There is 21,513 ML/a of medium priority interim water allocation for agricultural purposes in the Mary Valley Scheme, 3,000 ML/a of which is held by SunWater as unallocated water (according to the IROL). The announced allocation for this scheme is currently 82%. It has been as low as 45% during the 2003/04 water year.
Seasonal assignment of the medium priority water would be subject to the price offered and the willingness of holders of medium priority water to make their allocations available for temporary transfer. The quantity potentially available would be subject to the announced allocation, which historically has been as low as 45%, but could be even lower during more severe drought periods. There may be potential for up to approximately 9,000 ML/a water to be seasonally assigned for urban use, but infrastructure would have to be in place to convey this water to the urban demand areas. It is unlikely that pipelines and pump stations would be constructed without some assurance of this quantity being available on a regular basis.
Institute for Sustainable Futures, UTS and Cardno February 2007
Review of Water Supply-Demand Options for South East Qld – Final Report 52
Permanent transfer of water allocation will not be possible until a ROP is completed. The ROP will contain rules, which will most likely:
• limit the transfer of water allocation from the lower sections of the scheme (Lower Mary) to the mid and upper sections of the scheme (Mary Valley) for hydrological reasons;
• limit the amounts to be transferred from medium priority to high priority for protection of rural industries; and
• specify conversion factors for conversion of medium priority allocation high priority allocation.
These factors will be determined as an outcome of hydrological modelling. It is understood that a conversion factor of 4 ML of medium priority allocation for 1 ML of high priority allocation has been suggested. With that conversion factor, 5,000 ML/a of high priority water allocation could potentially be available from the Mary Valley Water Supply Scheme.
The maximum quantum of allocation potentially available for permanent transfer and conversion to high priority allocation suitable for urban water will not be known until the ROP is released. A very preliminary assessment of the maximum amount potentially available is of the order of 5,000 ML/a.
4.4.7 Transfer of water from Northern New South Wales rivers Transfer of water from northern New South Wales catchments to SEQ for emergency or permanent urban water supplies is another possibility that is being investigated.
The National Water Commission has recently commissioned a desktop feasibility study of the interstate transfer of water from northern NSW catchments (including the Clarence River and Tweed River catchments) to southern Qld.
The purpose of the study is to determine if there are under-utilised water resources in north-eastern NSW, the feasibility of transfer of water to SEQ, and the relative costs and benefits of transfer schemes. Within these overall objectives, the sub-objectives are to supply a large quantity of water (in excess of 50,000 ML/a) while protecting the environment, water quality and supply security for existing users. The study is being undertaken for NWC by SMEC, with a report due early in 2007. At this stage no outcomes of the study are available.
Some preliminary enquiries have been made to the NSW Department of Natural Resources regarding its policies on additional allocation from the Tweed River, and interstate transfer of water from the Tweed River. It is understood that no new water allocations from the Tweed are permitted except to Local Governments that currently have allocations from the river or its tributaries for urban use, and who can demonstrate that additional supplies from the Tweed River are necessary to satisfy increasing demand from population growth, provided there are no other options available including demand management. It is also understood that the current state legislation does not allow the transfer of water from the Tweed River into Qld.
The Tweed and Clarence catchments have significant runoff, and have relatively insignificant storage development. On hydrological grounds there appears to be significant potential for further water resources development, but there are a number of factors, which may limit the opportunities for short or long-term utilisation of these resources for urban use in SEQ. These include:
• Environmental impacts;
• NSW State Government policies on granting additional allocation of water from these catchments;
• NSW State Government legislation regarding interstate transfer of water from these catchments;
• The distance of the potential sources from the demand centres in SEQ (the proposed Tugun Desalination Plant has the capacity to provide all of the urban demands for the southern part of the

Institute for Sustainable Futures, UTS and Cardno February 2007
Review of Water Supply-Demand Options for South East Qld – Final Report 53
Gold Coast area, therefore any additional supply would need to be piped north as far as the areas south of Brisbane); and
• The rugged topography separating the northern NSW catchments from the coastal SEQ catchments, which would mean high pumping heads and energy costs for the most direct routes.
In consideration of these factors, no option for transfer of water from northern NSW catchments has been proposed in this Study. If the desktop study referred to above finds there is potential for transfer of significant quantities then some transfer options may be considered and costed.
4.4.8 Benefits of Interconnection of Sources As part of the drought emergency measures, as well as for long-term water management, a number of pipelines are being constructed to provide multiple potential water sources for urban water demand areas. This project has been described as the “SEQ Water Grid”
A diagram showing the proposed major water pipeline network is shown as Figure 4-5.
Figure 4-5 Diagram of Proposed SEQ Water Grid
Source: DNRW website <http://www.nrw.qld.gov.au/water/water_infrastructure/pdf/seq_water_grid.pdf>

Institute for Sustainable Futures, UTS and Cardno February 2007
Review of Water Supply-Demand Options for South East Qld – Final Report 54
The main elements in the SEQ water grid are as follows:
The Southern Regional Pipeline.
This pipeline will convey treated water, and link Molendinar Water Treatment Plant (which treats water from Hinze Dam) with the water treatment plants at Mt Crosby Weir. Ultimately the Tugun desalination plant and the proposed Cedar Grove Weir will be linked into this pipeline. The pipeline will pass through a number of residential development areas including the Pimpama Coomera area and Springfield. This pipeline will provide the ability for many residential areas from Brisbane to the Gold Coast to be supplied from a range of water sources, namely:
• Wivenhoe Somerset Water Supply System;
• Hinze Dam – Little Nerang Dam Water Supply System;
• The Tugun Desalination Plant; and
• The proposed Wyaralong Dam - Cedar Grove Weir water supply system.
Construction of the Southern Regional Pipeline has commenced, with pipe laying and pump station earthworks underway.
The Northern Pipeline Interconnector.
This pipeline will link AquaGen’s coastal mains near Eudlo to Caboolture and then to North Pine Dam. The pipeline will be able to transfer water northwards or southwards depending on the demands. It will have a transfer capacity of 65 ML/day. A pipeline is also planned linking the Noosa and Maroochy water distribution systems. With this interconnector, it will be possible to provide water to urban areas in north Brisbane, Caboolture and the North Coast area to a greater or lesser extent from the following sources:
• Baroon Pocket Dam;
• North Pine Dam;
• Cooloolabin-Wappa-Poona Water Supply System; and
• Mary River.
The Eastern Pipeline Interconnector.
This pipeline will connect the North Stradbroke Island water sources, which currently supply parts of the Redland Shire to the Logan City water distribution network. The intent is to make available some or all of the additional supply from the proposed central borefield on North Stradbroke Island to the Logan City area. The capacity of the system is 22 ML/day, and the target completion date is December 2008.
These pipelines will enable interconnection of water sources, subject to limitations on transfer capacity. The total water supply available from water sources within the SEQ region as reported in the “Water for South East Queensland – A Long Term Solution” has been estimated as the sum of the supplies available from the individual water supply schemes.
With interconnection of the water supply systems, the total yield of the interconnected system is expected to be somewhat greater than the sum of the yields of the individual systems, due to the critical drought periods occurring at different times. When one supply is near failure, other sources can be substituted. The amount of this increase in supply due to interconnection will depend on the spatial

Institute for Sustainable Futures, UTS and Cardno February 2007
Review of Water Supply-Demand Options for South East Qld – Final Report 55
variability of the climate in the SEQ region. It is understood that DNRW is carrying out hydrological modelling of the interconnected water supply system to make an estimate of the combined yield, and the increase in yield due to interconnection. Until results of this study are available only a preliminary estimate of the additional supply available can be made.
Cardno carried out a preliminary estimate of the additional yield available through interconnection of the Hinze Dam and the Wivenhoe Somerset Dam system. The results indicated that an additional yield of at least 5,400 ML/a would have been available over the sum of the yields of the two systems operating independently, on a HNFY basis. With the inclusion of other water supply systems including North Pine Dam, and Baroon Pocket Dam, covering a larger geographic area, it is estimated that the additional yield for conjunctive operation of the storages in the SEQ region may be of the order of 10,000 ML/a over the sum of the yields of the individual systems.
For the purposes of this study, a benefit of 10,000 ML/a of additional yield has been assumed through interconnection of the urban water supply sources in the SEQ region.
4.4.9 Supply-side Readiness Options The intrinsic uncertainty associated with water supply systems means that there is a strong advantage in having options available which allow adaptation to changed circumstances. The major uncertainty is the incidence of drought, and while the historical incidence of drought is factored into the yield estimates for a supply system, it is possible that severe droughts occur that are outside of this experience (as is indeed currently the case for the Wivenhoe-Somerset system). In terms of supply-side options, there are two possible responses to this uncertainty. The first is to try and build sufficient capacity to cope with even less likely droughts, capacity which will be needed less than once per hundred years on average.
The second approach is to have supply options available, which are not constructed, but are ready to build within sufficient time when storages are low during such extreme droughts. These ‘readiness options’ have a very low cost, since it should be calculated as the risk-weighted (i.e. probabilistic) cost of the option. The costs of planning, design, approvals, land purchase and maintenance of a site are relatively low compared to the cost of construction. This logic is based on the principles of real options analysis (see McDonald and Siegel 1986). These principles make it clear that it is preferable to delay investment in large irreversible capital works until the very last point at which it is needed. These principles have been used in a recent review by ISF and ACIL Tasman of the Sydney Metropolitan Water Plan (White et al. 2006).
Groundwater resources, inter-basin transfers, desalination and IPR are all options that are suitable as readiness options. In fact, this suite reflects the approach of the Qld Government to the existing drought. For future planning this Study has assumed that there is limited future scope for further increases in groundwater resource extraction and inter-basin transfers. As far as supply-side options are concerned, this leaves desalination capacity and IPR.
On the basis of results obtained in this Study, there is no need for additional supply capacity to replace the Traveston Crossing scheme. However, should there be in the future, a drought that exceeds the worst drought on record, there is the option available to construct desalination capacity at that time, and in a sufficiently timely way depending on the trigger level. In the case of the Bribie Island options, the lead time, once approvals were in place is likely to be of the order of 24 months.
The estimated costs of establishing readiness for the three desalination options are shown in Table 4-5.

Institute for Sustainable Futures, UTS and Cardno February 2007
Review of Water Supply-Demand Options for South East Qld – Final Report 56
Table 4-5 Estimated set-up costs for Bribie Island desalination capacity
Set Up Costs ($M) Item Bribie
125 ML/d Bribie
250 ML/d Bribie
400 ML/d Land acquisition – plant and land easements 2.6 3.1 3.1 EIA 1.0 1.2 1.2 Planning/Design 22.4 37.1 48.0
TOTALS 26.0 41.4 52.3
Even more promising may be the idea of IPR readiness. The Qld Premier has already stated that IPR would be employed for the Wivenhoe-Somerset system during the current drought should it be required. As indicated in Section 4.4 there are several other IPR options available in SEQ that could be considered in addition to Wivenhoe-Somerset. The timescales and readiness costs would be similar for IPR. The key factor would be social acceptance.
4.4.10 Summary of costs and yields The yield, costs and unit costs for each of the supply-side options considered are summarised in Tables 4-6 and 4-7. Note that these yields and costs assume that the options are constructed to deal with growth rather than as a drought response ‘readiness’ option. In the case of the potential readiness options shown in Table 4-6 for desalination capacity and IPR the risk-weighted costs would be a fraction of those shown, typically less than 1% of these costs.
Table 4-6 Summary of costs and yield of study team new proposed supply-side “readiness” options
No. Option Total costs present value
($M)
Unit costs present value
($/kL)
Yield in 2050 ML/a
Desalination SP – S1 Bribie Island Desalination (125
ML/day) 1,104 2.55 45,600
SP – S2 Bribie Island Desalination (250 ML/day) 2,030 2.34 91,250
SP – S3 Bribie Island Desalination (400 ML/day) 2,865 2.06 146,000
Indirect potable reuse (IPR) SP – S4 Western Corridor IPR 352 0.65 40,000 SP – S5 Sandgate to North Pine Dam IPR 96 1.93 5,620 SP – S6 Brendale to North Pine Dam IPR 25 1.68 1,680 SP – S7 Murrumba Downs to North Pine Dam
IPR 61 1.62 4,230
SP – S8 Merrimac to Hinze Dam IPR 116 1.79 7,330 SP – S9 Noosa to Lake MacDonald IPR 37 2.07 2,040 SP – S10 Maroochy to Wappa Dam IPR 116 2.12 6,170 SP – S11 Caboolture to Moodlu Storage IPR 15 0.65 2,550 SP – S12 Kawana to Ewan Maddock Dam IPR 219 2.44 6,600

Institute for Sustainable Futures, UTS and Cardno February 2007
Review of Water Supply-Demand Options for South East Qld – Final Report 57
Table 4-7 shows the costs and yield of a suite of potential options that could provide additional yield for the system for growth, if found necessary in the future. These supply-side options are modular and spread across the SEQ region and thus can be used to take advantage of adding to the supply system over time, in close proximity to where it is needed and in varying climatic rain fed areas.
Table 4-7 Summary of costs and yields of study team new growth supply-side options
No. Option Total costs present value
($M)
Unit costs present value
($/kL)
Yield in 2050 ML/a
Surface water SP – S13 Glendower Dam & Albert River Barrage 235 1.48 18,000 SP – S14 Amamoor Dam to Narangba 490 2.77 20,000 SP – S15 Cambroon Dam to Stanley River 356 1.26 32,000 SP – S16 Borumba-Coles-to North Brisbane 732 2.67 31,000 SP – S17 Borumba-Narangba 475 3.58 15,000 SP – S18 Wappa-Landershute 152 2.03 8,500 Other options SP- S19 System optimisation (benefits) 71 0.75 10,000
Table 4-8 provides similar information for the various stages of the SEQ proposed Traveston Crossing scheme.
Table 4-8 Summary of costs and yields of various stages of the Traveston Crossing scheme
No. Option Total costs present value
($M)
Unit costs present value
($/kL)
Yield in 2050 ML/a
The Traveston Crossing scheme SEQ-S8 Traveston Crossing Dam - Stage 1 2,250 3.38 70,000 SEQ-S9 Traveston Stage 2 (Raise Borumba) 69 0.49 40,000 SEQ-S10 Traveston Crossing Dam - Stage 3 122 4.65 40,000 Combined Traveston Crossing scheme 2,440 2.93 150,000
Note – For each stage the capital, operating and yields vary over time therefore the combined unit cost needs to be calculated taking this into consideration and is not merely an average.
When just considering unit cost, often used as the first indicator of an options screening process in terms of ranking, all of the supply-side options proposed (except Borumba-Narangba at $3.58 /kL) have a lower unit cost than Traveston Crossing Dam Stage 1 ($3.38 /kL). This is also the case when considering the combined Traveston Crossing scheme as a whole ($2.93 /kL). Hence, using the first economic indicator used in a decision making process, the Traveston Crossing scheme should be one of the last supply-side options considered.
Assumptions for all the options considered are presented in the Fact Sheets in Appendix B. The methodology used to obtain unit costs is identified in Section 4.2 and Appendix C.

Institute for Sustainable Futures, UTS and Cardno February 2007
Review of Water Supply-Demand Options for South East Qld – Final Report 58
4.5 Options Comparison As indicated in Section 4.1 the options need to be considered using a number of criteria based on integrated resource planning.
In the first instance the Study has identified that with the current SEQ committed demand and supply-side options (excluding the Traveston Crossing scheme) no additional supply is needed until approximately 2030. This takes into consideration the Qld Government estimated supply-demand gap, which is considered extreme and therefore requires further justification before investment in additional demand and supply-side options for the medium to long-term.
Any new demand or supply-side options not only need to consider the factors already discussed such as geographical proximity to growth areas, assistance in addressing the cause of increased demand (predominantly population growth) and ability to assist in drought, but also factors such as:
• economic indicators (i.e. unit cost);
• level of risk (i.e. large upfront cost, reliance on a single rain fed supply source thereby adding to the vulnerability of the current supply system); and
• social and environmental impacts.
These can be assessed in terms of quantifiable and non quantifiable costs and benefits. These have been addressed as far as possible within the scope of this Study and using publicly available information.
4.5.1 Quantifiable indicators Table 4-9 summarises the supply and demand-side options considered by the Study team, together with the Traveston Crossing scheme. It also shows:
• the present value of the options (i.e. the present value of the combination of all capital and operating costs over the 2050 period considered);
• the unit cost of the option which assists in ranking options from an economic perspective;
• the total capital cost spent at any point in time (excluding the operating costs) which in the case of the supply-side options gives some indication of the associated risk of capital commitment;
• the estimated yield from each option; and
• the net greenhouse gas emissions.
Further details and assumptions are provided in the Fact Sheets in Appendices A and B.

Institute for Sustainable Futures, UTS and Cardno February 2007
Review of Water Supply-Demand Options for South East Qld – Final Report 59
Table 4-9 Summary of quantifiable criteria considered
No. Options Total costs
present value ($M)
Unit cost present value ($/kL)
Capital cost ($M)
Savings in 2050
(ML/a)
Net GHG*
(tonnes/a)
Demand management options SP – D1 Retrofit (extension) 59 0.47 n/a** 14,000 -420,000 SP – D2 Rainwater tank (extension) 615 3.96 n/a 17,500 17,500 SP – D3 MWEPS 2 0.01 n/a 47,696 -388,800 SP – D4 Outdoor (existing households) 125 0.71 n/a 17,535 -4,384 SP – D5 Smart growth (new households) 1,076 1.85 n/a 49,137 0 SP – D6 BWEPS (extension) 44 0.50 n/a 8,870 -5,322 SP – D7 Non residential smart growth
(new properties) 76 0.50 n/a 34,780 -10,226 Desalination SP – S1 Bribie Island Desalination (125
ML/day) 1,104 2.55 947 45,600 289,047 SP – S2 Bribie Island Desalination (250
ML/day) 2,030 2.34 1,643 91,250 584,139 SP – S3 Bribie Island Desalination (400
ML/day) 2,865 2.06 2,184 146,000 922,405 Indirect potable reuse (IPR) SP – S4 Western Corridor IPR 352 0.65 0 40,000 159,829 SP – S5 Sandgate to North Pine Dam IPR 96 1.93 96 5,620 7,718 SP – S6 Brendale to North Pine Dam IPR 25 1.68 24 1,680 1,933 SP – S7 Murrumba Downs to North Pine
Dam IPR 61 1.62 55 4,230 5,796 SP – S8 Merrimac to Hinze Dam IPR 116 1.79 106 7,330 11,884 SP – S9 Noosa to Lake MacDonald IPR 37 2.07 38 2,040 2,936 SP – S10 Maroochy to Wappa Dam IPR 116 2.12 113 6,170 10,907 SP – S11 Caboolture to Moodlu Storage
IPR 15 0.65 8 2,550 2,907 SP – S12 Kawana to Ewan Maddock Dam
IPR 219 2.44 134 6,600 8,547
Surface water SP – S13 Glendower Dam & Albert River
Barrage 235 1.48 314 18,000 3,728 SP – S14 Amamoor Dam to Narrangba 490 2.77 576 20,000 45,375 SP – S15 Cambroon Dam to Stanley River 356 1.26 457 32,000 25,807 SP – S16 Borumba-Coles-to North
Brisbane 732 2.67 873 31,000 62,550 SP – S17 Borumba-Narangba 475 3.58 609 15,000 26,281 SP – S18 Wappa-Landershute 152 2.03 205 8,500 3,210 Traveston Crossing Scheme Traveston Crossing Dam - Stage
1 2,250 3.38 2,600 70,000
143,804 Traveston Stage 2 (Raise
Borumba) 69 0.49 250 40,000
55,354 Traveston Crossing Dam - Stage
3 122 4.65 1,280 40,000
55,354 * In some cases the energy and associated GHGs for options increase over time and in these cases an average figure has been used. ** Costs associated with demand management options are small and incremental over time, rolled out on a customer-by-customer basis

Institute for Sustainable Futures, UTS and Cardno February 2007
Review of Water Supply-Demand Options for South East Qld – Final Report 60
Figure 4-6 shows the unit cost and associated yield in 2050 of the smallest and largest desalination plants, an aggregate of the IPR options and an aggregate of the study team demand-side options. It also shows the aggregate of the Traveston Crossing scheme to enable comparison.
Figure 4-6 Unit cost and yield of various options versus the Traveston Crossing scheme (2050)
From high level analysis the combined suite of demand management options, which is an extension of the demand-side options being implemented by the Qld Government, can provide a significant additional yield of approximately 180 GL/a at a low unit cost of $1.15 /kL. As discussed in Section 4.3, if managed well and making good use of a combination of regulatory, economic and communication instruments to maximise participation and avoid the risk of savings decay, these savings can be achieved and potentially more. As indicated in Section 4.4 there is also a significant volume of water available from a suite of additional supply-side options. Virtually all of the additional demand and supply-side options considered have a lower unit cost than the Traveston Crossing scheme. In addition, when considering the upfront capital cost all of the options (except only the larger desalination options) the Traveston Crossing scheme would be considered the highest economic risk. Hence from an economic perspective virtually all the options identified in Table 4-9 should be considered in preference to the Traveston Crossing scheme.

Institute for Sustainable Futures, UTS and Cardno February 2007
Review of Water Supply-Demand Options for South East Qld – Final Report 61
4.5.2 Greenhouse Gas Impacts One of the important quantifiable externalities associated with the water supply industry is the associated energy use and GHG emissions. As shown in Figure 4-7 some options have a particularly high energy intensity, including desalination plants, advanced wastewater treatment or those that involve pumping water long distances. In some cases, such as demand management options, there is a net reduction in energy use and a consequent reduction in GHG emissions. For options which improve the efficiency of hot water use, this can be very significant. When the relative intensity of GHG18 emissions for the options are compared, again the majority of the options have less impact than the Traveston Crossing scheme.
In many cases, such as the Kwinana desalination plant in Western Australia, GHG impacts are “off-set” by the construction of, for example, wind turbines to effectively reduce energy impacts. Such an “off-set” approach can be considered for virtually any of the supply-side options but can add significantly to the capital costs of such options. To maintain consistency in the boundary of the analysis undertaken as part of this Study “off-setting” has not been considered. Of all the options considered only the demand management options actually reduce GHG without the need for “off-setting”.
Figure 4-7 Greenhouse intensity of options
18 The Australian Greenhouse Office have recently published data for the greenhouse intensity of states within Australia (DEH, 2006). Greenhouse intensity is a measure of the quantity of emissions resulting from a particular activity, in this instance the generation of electricity for the state of QLD. Greenhouse intensity for direct and indirect emissions is 1.046 tonnes/MWhr. Direct emissions are the carbon dioxide equivalent emitted per unit activity at the point of emission release, while indirect emissions are those physically produced by the burning of fuels at the power station or facility.
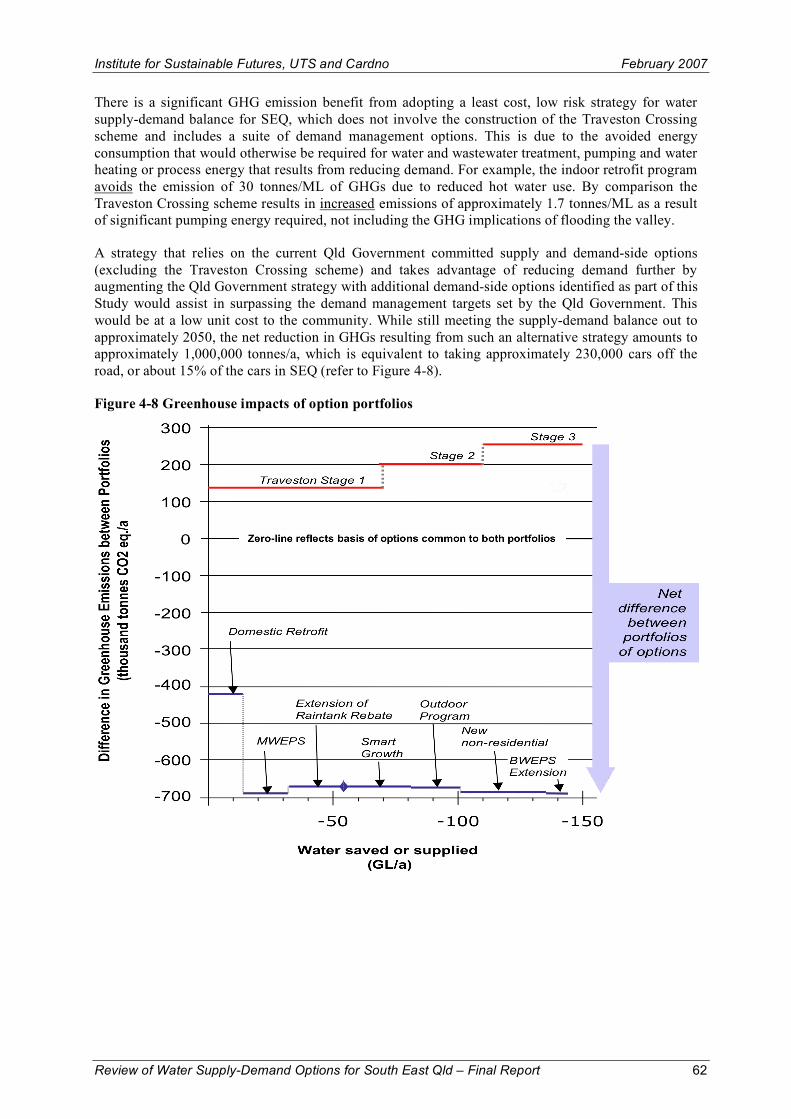
Institute for Sustainable Futures, UTS and Cardno February 2007
Review of Water Supply-Demand Options for South East Qld – Final Report 62
There is a significant GHG emission benefit from adopting a least cost, low risk strategy for water supply-demand balance for SEQ, which does not involve the construction of the Traveston Crossing scheme and includes a suite of demand management options. This is due to the avoided energy consumption that would otherwise be required for water and wastewater treatment, pumping and water heating or process energy that results from reducing demand. For example, the indoor retrofit program avoids the emission of 30 tonnes/ML of GHGs due to reduced hot water use. By comparison the Traveston Crossing scheme results in increased emissions of approximately 1.7 tonnes/ML as a result of significant pumping energy required, not including the GHG implications of flooding the valley.
A strategy that relies on the current Qld Government committed supply and demand-side options (excluding the Traveston Crossing scheme) and takes advantage of reducing demand further by augmenting the Qld Government strategy with additional demand-side options identified as part of this Study would assist in surpassing the demand management targets set by the Qld Government. This would be at a low unit cost to the community. While still meeting the supply-demand balance out to approximately 2050, the net reduction in GHGs resulting from such an alternative strategy amounts to approximately 1,000,000 tonnes/a, which is equivalent to taking approximately 230,000 cars off the road, or about 15% of the cars in SEQ (refer to Figure 4-8).
Figure 4-8 Greenhouse impacts of option portfolios

Institute for Sustainable Futures, UTS and Cardno February 2007
Review of Water Supply-Demand Options for South East Qld – Final Report 63
Recommendation 4.1
From assessment of quantifiable costs and benefits and from an economic perspective the Traveston Crossing scheme is one of the highest cost and risk options that have been considered. It is recommended that the Qld Government assess the suite of options identified in this Study in more depth with all the latest information to assist in making a more informed decision. This will enable the Qld Government to identify which options are least cost and have least energy and GHG impact and thus should be used for both drought response and medium to long-term planning in the future as the need arises.
4.5.3 Other externalities and impacts To assist in deciding which options and portfolios of options make most sense in a region other non quantifiable externalities should also be considered such as social and environmental impacts. This should be undertaken with a broad group of stakeholders as part of a transparent deliberative and participatory process (White et al, 2006). A brief summary of some of the non quantifiable social and environmental issues that affect the suite of options considered are summarised in Table 4-10.

Institute for Sustainable Futures, UTS and Cardno February 2007
Review of Water Supply-Demand Options for South East Qld – Final Report 64
Table 4-10 Brief summary of non quantifiable externalities
No. Option Social impacts Environmental impacts Demand management options
SP-D1 Retrofit (extension) SP-D2 Rainwater tank (extension) SP-D3 MWEPS SP-D4 Outdoor (existing households) SP-D5 Smart growth (new households) SP-D6 BWEPS (extension)
SP-D7 Non residential smart growth (new properties)
Neutral impact. Demand management options are designed to meet the same level of service or amenity as the reference case, unlike restrictions which curtail the level of service.
Neutral impact. Many demand management options also reduce wastewater discharge, and in some cases (eg through the use of rain water tanks) have stormwater benefits. While the quantifiable components of these can be included in the net cost, many benefits are harder to quantify.
Desalination
SP-S1 Bribie Desalination 125ML/d
SP-S2 Bribie Desalination 250ML/d
SP-S3 Bribie Desalination 400ML/d
Minor negative impacts. Some resumption along pipeline route.
Neutral impact. No significant impacts known, although inlet and outlet works will need to traverse a narrow strip of national park along Bribie Island foreshore. Potentially high energy impact is considered separately above.
Indirect potable reuse SP-S4 Western Corridor IPR SP-S5 Sandgate to North Pine Dam IPR SP-S6 Brendale to North Pine Dam IPR
SP-S7 Murrumba Downs to North Pine Dam IPR
SP-S8 Merrimac to Hinze Dam IPR SP-S9 Noosa to Lake MacDonald IPR SP-S10 Maroochy to Wappa Dam IPR
SP-S11 Caboolture to Moodlu Storage IPR
SP-S12 Kawana to Ewan Maddock Dam IPR
Minor negative impacts due to possible resumptions for pipeline installation. Rigorous community engagement process essential.
Neutral/positive impact. Possible benefit to environment with respect to reduction of discharge of nutrients to Moreton Bay, Broadwater etc.
Surface Water
SP-S13 Glendower Dam & Albert River Barrage
Minor negative impacts. 98% of the land for the Glendower Dam has been purchased. No (or very minor) resumptions would be expected for the Barrage.
Negative impact. Potentially significant impacts on fish passage and riparian habitat along the Logan River. Development would trigger EPBC Act.
SP-S14 Amamoor Dam to Narangba
Minor social impact. All the privately owned land required for this dam has been purchased, although some popular campsites would be affected.
Negative impact but not expected to be significant in comparison with Traveston Crossing Stage 1. Some native forests would be inundated. Development would trigger EPBC Act.

Institute for Sustainable Futures, UTS and Cardno February 2007
Review of Water Supply-Demand Options for South East Qld – Final Report 65
No. Option Social impacts Environmental impacts
SP-S15 Cambroon Dam to Stanley River
Some social impact expected. A dam with FSL 130m should not affect Conondale, but around 121 properties would be affected.
Negative impact but not expected to be significant in comparison with Traveston Crossing Stage 1. Development would trigger EPBC Act.
SP-S16 Borumba-Coles-North Brisbane Minimal negative social impact as, few if any properties affected.
Negative impact but not expected to be significant in comparison with Traveston Crossing Stage 1.
SP-S17 Borumba2_Narangba Minimal social impact as land required is unoccupied.
Negative impact but not expected to be significant in comparison with Traveston Crossing Stage 1.
SP-S18 Wappa raised - Landershute
Negative impact. Some social impact expected. Resumption costs are a significant part of total costs of dam.
Negative impact. Some high conservation value vegetation may be affected. Dam is in riparian corridor.
Other options
SP-S19 System optimisation (benefits) Neutral impact – assuming that the pipelines are already constructed.
Neutral impact assuming that the pipelines are already constructed. The potentially high energy and greenhouse gas emissions impact from pumping is considered separately above.
Traveston Crossing Dam
SEQ-S8/S9/S10 Traveston Crossing Dam
Negative impacts. Significant impacts in the inundation area including loss of homes and properties (approximately 900). Stress associated with the planned dam has resulted in social problems including depression (Robson, 2006). Economic impacts including loss of livelihood in the agriculture (10% of the local dairy industry production), fishing and tourism industries are likely to negatively impact Mary River communities.
Negative impacts. Significant potential impacts in the inundation area and downstream of the dam including impacts on threatened species (the lung fish), sedimentation, increase in nutrients, erosion, impact on Ramsar listed wetland (Great Sandy Straits). Environmental impacts of the proposed dam have warranted referral to the Commonwealth Government for assessment under the EPBC Act 1999.

Institute for Sustainable Futures, UTS and Cardno February 2007
Review of Water Supply-Demand Options for South East Qld – Final Report 66
From a brief assessment virtually all of the options considered have less social and environmental impacts than the Traveston Crossing scheme. The scheme is likely to have major social and environmental implications at a local, state, national and international level if it proceeds. For example the inundation will not only directly affect 900 properties but the Queensland Dairy Organisation reports it will also cause major milk production loss, approximately 20 million litres of milk production or 10% of local production19. From an environmental perspective threatened species of national importance such as the Mary River lungfish, cod and tortoise will be directly affected and the internationally recognised Ramsar listed wetland the Great Sandy Straits. The threat of such environmental impacts have warranted referral to the Commonwealth Government for assessment under the EPBC Act 1999.
Recommendation 4.2
The Traveston Crossing scheme has the potential to cause significant social and environmental impacts at a local, state, national and international level. These potential impacts must be considered alongside other potential options as part of a transparent decision making process and not in isolation. It is recommended that the Qld Government carry out a more detailed social and environmental assessment of the suite of demand and supply-side options proposed by this Study using a consistent boundary of analysis. This will assist in assessing fairly the opportunities and barriers of a broad suite of options available. If such assessment already exists this must be released to the public as part of a transparent decision making process.
4.5.4 Community engagement To determine an appropriate portfolio of options requires a consistent, logical, rigorous and transparent process, which takes account of the relative cost of options, as well as their relative risk and social and environmental impact. Deliberative processes of community engagement are required at various stages of this process, as shown in Figure 4-9 below.
19 http://www.abc.net.au/widebay/stories/s1625767.htm [accessed 09/02/07]

Institute for Sustainable Futures, UTS and Cardno February 2007
Review of Water Supply-Demand Options for South East Qld – Final Report 67
Figure 4-9 The role of deliberative processes for community engagement in water supply-demand planning (from White et al. 2006b).
Following the assessment of costs, benefits and yield, and GHG impacts, processes such as multi-criteria analysis can be used to assist in the process of assessing options and portfolios of options in terms of the less tangible criteria20. This kind of analysis can be enhanced through the use of deliberative processes. However, as distinct from many multi criteria analysis (MCA) processes, it is preferable not to use the MCA to rank options, but rather to interactively screen or filter options and to test the impact of such filtering on the total cost of the portfolio which meets the supply-demand balance over the planning horizon. The cost or the yield of individual options, or any criteria that is strongly correlated to the cost or yield, should be excluded as criteria from the MCA assessment exercise. This avoids the risk of double counting, and the inevitable potential for informed participants to ‘game’ the process. The process is an iterative cost-effectiveness exercise. It asks the question ‘what portfolio of options will meet the supply-demand balance at least cost, while considered acceptable in relation to an agreed set of non-cost criteria?’.
The definition of considered acceptable is at the heart of the appropriate choice of deliberative processes for community engagement. The question stated above can be informed by scientific and technical knowledge, and can be subject to suasion by stakeholder or interest group preferences, but the acceptability should ultimately be determined or informed by the collective judgement of a representative group of citizens engaged in informed dialogue. There are now many excellent examples of the application of appropriate community engagement processes which do embody the principles of:
• representativeness (using random selection and a stratified sample of participants);
• deliberation (dialogue between participants with sufficient time to move toward consensus—minimum 2 days—with a skilled, neutral moderator, and access to experts and resources); and
• influence (a clear ‘charge’ for the participants to address, and a contract with the organisers regarding the fate of the outcome of the process).
Some of these example processes are described by Carson and Hart (2005) and Carson and Hartz-Karp (2005).
20 The following paragraphs are substantially drawn from White et al. (2006b).

Institute for Sustainable Futures, UTS and Cardno February 2007
Review of Water Supply-Demand Options for South East Qld – Final Report 68
Recommendation 4.3
The determination of an appropriate least cost portfolio of options which minimise risk and social and environmental impacts is a process that requires analytical assessment as well as robust community engagement with representative participants and well designed deliberative processes as part of a community engagement strategy. Such methods should be implemented as soon as possible in planning Qld’s future water strategy.
4.6 The Strategy The suite of supply and demand-side options currently being implemented under the Water Amendment Regulation (No. 6) 2006 to address the current drought (excluding the Traveston Crossing scheme) will mean that the long-term supply-demand balance will be met until around 2030, even using the extreme combined projections of yield and demand based on the SEQ planning documents.
To meet the supply-demand balance beyond 2030, there are a range of options available, including extending the demand-side options beyond those currently in place. These options have the lowest cost and risk and the lowest social and environmental impacts and should be prioritised. The demand-side options should focus on both existing properties, which have significant conservation potential, but especially focus on new properties, which are driving the projections in the reference case water demand. By concentrating on such options, this will take advantage of the growth in new properties, lock in water savings in both existing and new properties and utilise low unit cost and environmentally and socially beneficial options.
To accommodate unforeseen circumstances, such as a future drought more severe than the worst on record, the lowest cost and lowest risk options are those that are based on “readiness” principles, that is, those that are not constructed but are able to be constructed during a severe drought. The best available options for this adaptive strategy include IPR at various sites as outlined in Section 4.4, and desalination at Bribie Island.
If additional water for growth is needed post 2050 there is a suite of additional supply-side options available that have lower unit cost and risk and less social and environmental impacts than the Traveston Crossing scheme. These options must be considered in more detail now using the process identified in Section 4.5.4 before any further action is taken on the Traveston Crossing scheme.
Recommendation 4.4
The individual demand and supply-side options, that represent lower unit cost, less risk and reduced social and environmental impact, should be considered as an alternative to the Traveston Crossing scheme. It is recommended that these options are taken forward by the Qld Government as part of a transparent decision making process before any further action is taken on the construction of the Traveston Crossing scheme.

Institute for Sustainable Futures, UTS and Cardno February 2007
Review of Water Supply-Demand Options for South East Qld – Final Report 69
5 FINDINGS AND RECOMMENDATIONS
Throughout this report findings have been identified and a series of recommendations made. These are summarised below for each section.
1 Introduction
Findings
The Study team has reviewed and used data and information from publicly available reports. During the finalisation of this Study additional information has been released and where possible incorporated. A significant number of additional reports have been undertaken by and for various Qld Government departments, which contain more detailed data/information and updates on the costs and yields of various options and the projected supply-demand balance. Unfortunately these reports are not publicly available and have not been made available to the Study team. Hence the most recent publicly available information has been used to inform the Study team and for analysis purposes. This information has been combined with the professional knowledge of the Study team and of individuals involved in various aspects of water planning in SEQ. The lack of publicly available information on urban water supply planning in Qld is a major barrier to transparency and good decision-making.
Recommendations
1.1 Whilst it is acknowledged that in some cases water planning studies being undertaken in the SEQ region may contain information that is commercially sensitive, it is recommended that reports be structured in a way that allows analysis undertaken on behalf of the community of Queensland to be made publicly available as part of a transparent decision making process.
2 The Study Area – Current Demand and Supply
Findings
There are significant differences between the 2003 and 2006 Population and Forecasting Information Unit population projections for SEQ. Changes in population projections will have significant implications for projections in demand. For example, for the residential sector alone the shift in recent estimates of population in 2050 of 580,000 will result in an increase in demand of 64 GL/a (assuming a residential demand of 300 litres/capita/day). Associated non residential and non revenue water will increase this water demand further.
The significant increase in population will mainly be located in the southern end of the SEQ region. This is a significant distance from the proposed Traveston Crossing scheme, in Cooloola to the north, which is expected to supply approximately half of the SEQRWSS proposed additional water supply.
Available Qld Government documentation on the projections of business-as-usual (or reference case) water demand assume a residential demand of 300 litres per capita per day for a period extending to 2050. Whilst the SEQ area is affected by relatively high average temperatures it also has relatively high rainfall compared to other major cities in Australia. The figure of 300 litres per capita per day is significantly higher than the demand in comparable eastern seaboard capital cities. This projection is likely to be a significant overestimate, and does not appear to adequately take into consideration expected downward pressure on water demand due to changes in land use (urban consolidation and the shift to more flats and units with the associated reduction in lawn and garden area) and the improving efficiency of water using equipment such as dual flush toilets and washing machines.
Water Resource Plans (WRP) have been finalised for the Gold Coast area and Mary Basin. Draft plans have been prepared for the Moreton and Logan regions. The strategic reserve identified for the Mary

Institute for Sustainable Futures, UTS and Cardno February 2007
Review of Water Supply-Demand Options for South East Qld – Final Report 70
Basin has been fully allocated (i.e. the Traveston Crossing scheme of 150 GL/a). In the other three regions a total of 58 GL/a still remains unallocated. Whilst WRPs aim to provide a consistent framework for the allocation and sustainable management of water resources in each area, these plans have been developed over time and with input from a number of different specialists. As such there is some question as to the consistency of approach in the development of WRPs, especially with respect to complex issues such as the allocation of environmental flows. Hence care needs to be taken in fully committing such strategic reserves without further validation.
Estimates of system yield for SEQ have been significantly reduced from 630 GL/a to 450 GL/a. This is primarily as a result of changed assumptions used to model the existing yield. In the past a historical no-failure yield approach has been used. Now DNRW are using criteria relating to prudent yield and the level of service (LOS), which consider the level of restrictions (frequency, depth) that are deemed acceptable to the community. However, there is no evidence that these changes were based on any community engagement processes that seeks input from the community. A survey is currently being conducted on behalf of Queensland Water Infrastructure, the organisation established to build major infrastructure such as Traveston Crossing Dam Stage 1. This survey is investigating some of the questions that need to be asked concerning the appropriate LOS. However, the focus of the questions and information being provided to the participants appears to have a different focus and may in fact be providing participants with incorrect information upon which they will be making decisions. The issues associated with LOS, restrictions and investment in infrastructure etc. are extremely complex and need to be very carefully presented to the community through the use of rigorous and transparent community engagement processes.
Recommendations
2.1 Due to the significant growth in the southern area of the SEQ region it is recommended that demand and supply-side options to cater for this growth are concentrated, as far as possible, in close proximity to where the growth is occurring. This will minimise the costs and greenhouse gas emissions associated with transferring additional water across such a large region and take advantage of reducing demand in the key growth areas.
2.2 The current SEQRWSS investigations into current and forecast water demand (including assumptions, limitations of data and levels of confidence) should be released to the public as soon as possible. This will assist in identifying how the reference case water demand component of the supply demand balance has been determined, the associated levels of confidence in water demand projections and what additional information needs to be collected and analysed.
2.3 Even with the current SEQRWSS investigations into water demand forecasting, very little is actually known about how water is currently being used in the SEQ region on a per household or property basis and thus how it can be projected more accurately. In 2006 the Qld EPA released a Brief to investigate current water demand per household type in more detail to assist in forecasting water demand and determining the conservation potential available. It is recommended that such a study and collection of data during current demand management program implementation be undertaken as soon as possible to fill this knowledge gap and assist in refining the reference case demand.
2.4 There is some question as to the consistency of approach and assumptions used to identify the strategic reserve of Water Resource Plans in the SEQ area, especially in relation to complex issues such as the allocation of environmental flows. Hence it is recommended that full allocation of such reserves are not committed until further checking and validation across each of the Water Resource Plans developed for the SEQ region is undertaken.

Institute for Sustainable Futures, UTS and Cardno February 2007
Review of Water Supply-Demand Options for South East Qld – Final Report 71
2.5 Following validation of the strategic reserve of each of the Water Resource Plans it is recommended that further investigation is undertaken into the potential of utilising part of the 58,000 ML/a unallocated reserves in the Moreton, Logan and Gold Coast areas.
2.6 The prudent yield of the existing supply system is highly dependent on the frequency and severity of restrictions that are deemed acceptable to the community. It is crucial that the community is involved in the decision making process for establishing the level of acceptability, through the use of rigorous and transparent processes for community engagement. It is recommended that such a process be undertaken in SEQ and the prudent yield of the system reassessed using the results of the process.
3 SEQ Proposed Supply-Demand Strategy
Findings
The demand management targets identified by the Qld Government specifically relate to the residential sector. The current suite of residential initiatives alone will not achieve the targets identified. However, the combination of initiatives currently being implemented that cover the residential, non residential and non revenue water sectors will reduce demand to a level close to the targets. With careful additional investment these targets can be achieved.
There is still significant opportunity to go further in terms of participation rates, end uses and reducing demand further in both existing and new properties as well as reducing demand in the non residential sector through water efficiency and reuse initiatives. There is significant potential for savings in new properties as new properties are driving the increase in water demand. Some of the initiatives in the current suite have a relatively high cost when assessed from the combined perspective of the customer, government and utility. These costs can be reduced enabling investment in additional lower unit cost demand-side options.
The SEQ proposed 2007 to 2009 supply-side initiatives are a mixture of smaller surface water, ground water, reuse and desalination. Considering these options as a whole (without considering the economic, social or environmental perspectives in detail) they represent a diverse mixture of sources that are less affected by climate variability than the existing predominantly “rain fed” SEQ supply sources currently affected by the drought. As such, a number of the SEQ proposed demand and supply-side options will provide relief within a timeframe that could assist in slowing the rate of drawdown from storages to such an extent that the probability of the system “failing” in the current drought is significantly reduced.
With the current drought and existing surface water storage levels being so low it is highly unlikely that options implemented after the next 2 to 3 years (i.e. post 2009) could assist in the current drought situation. Supply-side options post 2009 (including all stages of the Traveston Crossing scheme, Wyaralong Dam, both modifications to Hinze Dam and Bromelton Offstream) will therefore not provide any additional water during the current drought.
In the medium to longer term the additional yield provided by the post 2009 options provides “excess yield” to 2050 with significant reliance on a single “rain fed” option (the Traveston Crossing scheme). Investment in the provision of “excess yield” now for a planning horizon of 2050 and reliance on such a large and high cost rain fed option is considered risky in economic terms. If the suite of demand and supply-side options currently being implemented to address the current drought, excluding the Traveston Crossing scheme is implemented, this will mean that the medium to long-term supply-demand balance will be met until approximately 2030. This provides significant time to determine the most appropriate strategy to meet the supply-demand balance in the longer term with lower cost and more risk averse options using an adaptive management approach.

Institute for Sustainable Futures, UTS and Cardno February 2007
Review of Water Supply-Demand Options for South East Qld – Final Report 72
The proposed Traveston Crossing scheme on the Mary River is neither necessary nor desirable as a part of the portfolio for ensuring supply security to 2050. The increase in supply from this proposed dam will not assist in the short-term during the current severe drought, and is not needed for supply-demand balance in the longer term. It represents a high cost, high risk option.
Recommendations
3.1 The Qld Government is currently investing in and implementing a diverse range of demand management initiatives that will provide benefits both in the short and long term. Care needs to be taken that the initiatives being implemented are the most cost effective and are implemented in such a way that they achieve the savings required. Ongoing evaluation of costs, savings and participation rates are recommended to ensure costs are minimised and estimated savings achieved.
3.2 Care needs to be taken that the estimated savings of each demand management, source substitution and reuse initiative are not double counted within the baseline or reference case demand or that opportunities for conservation potential are not overlooked. It is recommended that the assumptions of the demand forecasting and options analysis are provided in a transparent format and made publicly available.
3.3 Due to the scope of this Study only the Traveston Crossing scheme has been compared against a new suite of demand and supply-side options. However, it is recommended that at least Wyaralong Dam, with a capital cost alone of approximately $500 million and unit cost of over $2.00 /kL (without taking into consideration operating costs) should also be considered in more detail from an economic and risk perspective. This should be undertaken as soon as possible before implementation to ensure that this SEQ proposed supply-side option is appropriate economically, socially, environmentally and from a risk perspective.
3.4 The Traveston Crossing scheme is geographically disconnected from the high growth areas in the south of the SEQ region, is rain fed and therefore augments an already vulnerable rain fed dependent supply system and has a high upfront cost. It is therefore considered to be a high risk in economic terms. In addition assuming the drought response measures are needed over the next 2 to 3 years, to alleviate the current drought situation, Traveston Crossing Dam Stage 1 cannot provide assistance in the current drought (even though it has been included in the emergency drought response legislation) as it is due to be completed by 2012 and will then need time to fill to provide yield. Hence on these criteria alone the decision to build the Traveston Crossing scheme is not recommended and should be reconsidered by the Qld Government.
4 Study Team Proposed Strategy
Findings
A diverse portfolio of options can ensure supply security for South East Queensland (SEQ) well into the future, certainly to 2050. Such options include: increasing water supply availability (supply-side options); decreasing the demand for water (demand-side options); and meeting water supply needs during deep droughts (drought response options).
With the implementation of demand-side options, in addition to the existing suite of supply-side and demand-side options proposed by the Queensland Government, there will be no need for the Traveston Crossing scheme, or other additional supply infrastructure, in order to meet the supply-demand balance over the period to 2050 (refer to Figure). This suite of options has the potential to save approximately 180 GL/a of water by 2050 at an average unit cost of $1.15 /kL. For comparison, the Traveston Crossing scheme will supply approximately 150 GL/a by 2050 at a unit cost of

Institute for Sustainable Futures, UTS and Cardno February 2007
Review of Water Supply-Demand Options for South East Qld – Final Report 73
approximately $3.00 /kL. Further, the proposed strategy will reduce greenhouse gas emissions relative to the Traveston Crossing scheme by more than 1,000,000 tonnes per year.
In the event of a deep drought worse than the current drought (which is itself the worst on record for the Wivenhoe-Somerset system), ‘readiness’ options, which are not rainfall dependent, offer a much lower risk and lower unit cost alternative to the Traveston Crossing scheme. The idea of readiness options is that the planning, design, land acquisition and approvals are all obtained. However, the construction is triggered only in the event of a deep and prolonged drought, thus offering effective insurance against a low probability event and the ability to adaptively respond to changed circumstances. Suitable candidates for such a readiness strategy include scaleable desalination capacity at Bribie Island and indirect potable reuse in a range of locations.
Recommendations
4.1 From assessment of quantifiable costs and benefits and from an economic perspective the Traveston Crossing scheme is one of the highest cost and risk options that have been considered. It is recommended that the Qld Government assess the suite of options identified in this Study in more depth with all the latest information to assist in making a more informed decision. This will enable the Qld Government to identify which options are least cost and have least energy and GHG impact and thus should be used for both drought response and medium to long-term planning in the future as the need arises.
4.2 The Traveston Crossing scheme has the potential to cause significant social and environmental impacts at a local, state, national and international level. These potential impacts must be considered alongside other potential options as part of a transparent decision making process and not in isolation. It is recommended that the Qld Government carry out a more detailed social and environmental assessment of the suite of demand and supply-side options proposed by this Study using a consistent boundary of analysis. This will assist in assessing fairly the opportunities and barriers of a broad suite of options available. If such assessment already exists this must be released to the public as part of a transparent decision making process.

Institute for Sustainable Futures, UTS and Cardno February 2007
Review of Water Supply-Demand Options for South East Qld – Final Report 74
4.3 The determination of an appropriate least cost portfolio of options which minimise risk and social and environmental impacts is a process that requires analytical assessment as well as robust community engagement with representative participants and well designed deliberative processes as part of a community engagement strategy. Such methods should be implemented as soon as possible in planning Qld’s future water strategy.
4.4 The individual demand and supply-side options, that represent lower unit cost, less risk and reduced social and environmental impact, should be considered as an alternative to the Traveston Crossing scheme. It is recommended that these options are taken forward by the Qld Government as part of a transparent decision making process before any further action is taken on the construction of the Traveston Crossing scheme.

Institute for Sustainable Futures, UTS and Cardno February 2007
Review of Water Supply-Demand Options for South East Qld – Final Report 75
6 REFERENCES
AGO Factors and Methods Workbook - For use in Australian greenhouse emissions reporting. Australian Greenhouse Office, Department of the Environment and Heritage, December 2006
Beatty, R., O’Brien, S. and Beatty, K. (2006) ‘Fifteen Years of Drought, Demand Management and Pricing Reform in Urban Water. What's Gone Right, What's Gone Wrong and What's Needed for the Future?’, paper presented at Enviro 06 Conference and Exhibition, Melbourne.
Caloundra City Council (2006) Draft Local Growth Management Strategy.
Carson, L. & Hart, P. 2005 ‘What Randomness and Deliberation can do for Community Engagement’ International Conference on Engaging Communities, Brisbane, Australia, 14-17 August [http://www.activedemocracy.net/ accessed 29 Oct 2006].
Carson, L. & Hartz-Karp, J. 2005 ‘Adapting and Combining Deliberative Designs: Juries, Polls, and Forums’ in J. Gastil, & P. Levine (eds) The Deliberative Democracy Handbook: Strategies for Effective Civic Engagement in the Twenty-First Century, San Francisco: Jossey-Bass, pp. 120-138.
Coombes P and Kuczera G (2003) ‘A Sensitivity Analysis of an Investment Model Used to Determine the Economic Benefits of Rainwater Tanks’ The Institution of Engineers, Australia 28th International Hydrology and Water resources Symposium 10 -14 November 2003, Wollongong, NSW
Coombes, P., Spinks, A., Evans, C. & Dunstan, H. (2004) Performance of Rainwater Tanks at an Inner City House in Carrington NSW During a Drought, WSUD 2004 conference, Adelaide, South Australia.
DLGP (2006) Queensland Development Code Part 25 Water Saving Targets.
DLGP (2006). Queensland Development Code Part 29 Sustainable Buildings.
DNRM (2004) South East Queensland Regional Water Supply Strategy - Stage 1 Report, South East Queensland Regional Organisation of Councils and Department of Natural Resources and Mines, Brisbane.
DNRM (2005) South East Queensland Regional Water Supply Strategy: State 2 Interim Report, Department of Natural Resources and Water, Brisbane.
DNRM (2005) Queensland Water Plan 2005-2010: An action plan to meet our future water needs, Department of Natural Resources and Mines, Brisbane.
DNRW (2005) Mary Basin Water Resource Plan: incorporating the Mary River, Burrum River and Sunshine Coast Catchments - overview report and draft plan, Department of Natural Resources and Mines, Brisbane.
DNRW (2006) Gold Coast Water Resource Plan.
DNRW (2006) Logan Basin Water Resource Plan.
DNRW (2006) Moreton Water Resource Plan.

Institute for Sustainable Futures, UTS and Cardno February 2007
Review of Water Supply-Demand Options for South East Qld – Final Report 76
DNRW (2006) South East Queensland Regional Water Supply Strategy—Logan River catchment water projects.
DNRW (2006) South East Queensland Regional Water Supply Strategy Stage 2 Interim Report.
DNRW (2006) Water for South East Queensland: A long term Solution, Department of Natural Resources, Mines and Water, Brisbane.
DNRW (2006) South East Queensland Regional Water Supply Strategy Integrated Urban Water Management and Accounting Task: WMA-03 - Legislative and policy impediments to Integrated Urban Water Management and water use efficiency - Draft Report, Department of Natural Resources, Mines and Water, Brisbane.
Erlanger, P. & Neal, B. 2005, ‘Framework for Urban Water Resource Planning’, Occasional Paper No. 14, Water Services Association of Australia.
Fane, S.A., Robinson, D. & White, S.B. 2003, ‘The Use of Levelised Cost in Comparing Supply and Demand Side Options for Water Supply and Wastewater Treatment', Water Supply Vol 3 No 3 pp185-192.
Gardener, T., Coombes, P. & Marks, R. (2001) Use of Rainwater at a Range of Scale in Australian Urban Environments, Presented at the 10th International Rainwater Conference, Germany, September 2001.
GHD (2006) Desktop Review of Identified Dam and Weir Sites: Report to the Bulk Supply Infrastructure Task Group, GHD Brisbane.
GHD (2006) Desk Top Review and TOR Development Consultancy: Desktop Review of Identified Dam and Weir Sites, Report to the Bulk Supply Infrastructure Task Group, GHD Brisbane.
Gold Coast Water and Gold Coast City Council (2004) Pimpama Coomera Waterfuture Master Plan 2004.
McDonald, R. and Siegel, D. 1986 ‘The Value of Waiting to Invest’, The Quarterly Journal of Economics, Vol. 101, No. 4, pp 707-727.
Ministerial Media Statement 30 November 2006 from Deputy Premier Anna Bligh and Premier Peter Beattie, ‘Beattie sets March 17 for SEQ recycled water vote’ <http://www.cabinet.qld.gov.au/MMS/StatementDisplaySingle.aspx?id=49278> accessed 08 January 2007.
Mitchell, C, Fane, S, Willetts, J, Plant, R, (2007) Costing for Sustainable Outcomes in Urban Water Systems - A Guidebook, Institute for Sustainable Futures, Sydney.
Office of Urban Management (2005) South East Queensland Regional Plan.
PIFU (2003) Queensland's Future Population.
PIFU (2006) Queensland's Future Population.
Plant, R., Kazaglis, A & Simard, S., (2006) Every Drop Counts Business Program Water Savings & Costs - Independent Verification of savings calculation methods Final Report for Sydney Water Corporation. Institute for Sustainable Futures, Sydney.
Queensland Water Amendment Regulation (No.6) 2006.

Institute for Sustainable Futures, UTS and Cardno February 2007
Review of Water Supply-Demand Options for South East Qld – Final Report 77
Queensland Water Commission (2006) Water Supply Emergency Projects - October 2006 Report.
Queensland Water Commission (2006) Water Supply Emergency Projects - September 2006 Report.
Robson, L (2006) “Suicide watch as dam fear increases” The Sunday Mail, 10 December 2006, section 2 page 14.
SEQWater (2005) Responding to Drought in South East Queensland: Contingency Planning for Urban Water Supply - SEQWater Technical Report Series 1, SEQWater, Brisbane.
Taverner Research (2005) Survey of Household Water Attitudes, report prepared for the Independent Pricing and Regulatory Tribunal, < http://www.ipart.nsw.gov.au/files/Final%20Report%20-%20Taverner%20Report%20on%20Survey%20of%20Household%20Water%20Attitudes%20-%20Released%2021%20March%202005%20-%20web%20document.pdf> accessed 08 January 2007.
Turner, A., White, S., Chanan, V., (2003) Brisbane City Least Cost Planning and Demand Management Study Stage II – Scoping Study, report prepared by the Institute for Sustainable Futures, for Brisbane City Council
Turner, A., White, S., Beatty, K. & Gregory, A. 2005 'Results of the Largest Residential Demand Management Program in Australia', International Conference on the Efficient Use and Management of Urban Water, Santiago, Chile, 15-17 March 2005.
Turner, A, Willetts, J, Fane, S, Giurco, D, Kazaglis, A and White, S (2007) Planning Our Future Urban Water Resources: A Guide to Demand Management in the Context of Integrated Resource Planning, report prepared for the Water Services Association of Australia by the Institute for Sustainable Futures, University of Technology, Sydney.
Water Services Association of Australia (2004) WSAA Facts 2005.
White, S. et al 2006a ‘Review of the Metropolitan Water Plan: Final Report’, report prepared for NSW Cabinet Office, Sydney, April. <http://www.waterforlife.nsw.gov.au/__data/assets/pdf_file/1483/isf_acil_review_april06_final_1.pdf>.
White, S, Fane, S, Giurco, D, and Turner, A, 2006b ‘Putting the economics in its place: decision making in an uncertain environment’, Paper presented at International Society for Ecological Economics Conference, New Delhi, 15-18 December.
White, S. & Howe, C. 1998, ‘Water efficiency and reuse: a least cost planning approach’, Proceedings of the 6th NSW Recycled Water Seminar, November.

Institute for Sustainable Futures, UTS and Cardno February 2007
Review of Water Supply-Demand Options for South East Qld – Final Report 78
APPENDIX A – SEQ PROPOSED OPTIONS - FACT SHEETS

Institute for Sustainable Futures, UTS and Cardno February 2007
Review of Water Supply-Demand Options for South East Qld Appendix A
Project summary
Option Name Domestic rebate program
Supply or Demand Demand
Description
Model inputs
Years (s) Component Capex ($) Opex ($/a) Replacement Costs ($)
2007-2010 Raintanks 5,799,821
Clothes Washer 21,230,861
Showerhead 244,266
Pool Cover 830,503
Toilet 894,549
Total 29,000,000
Yield (ML/a) Uncertainty Energy use (MWh/ML)
Raintanks 116
Clothes Washer 2548
Showerhead 183
Pool Cover 25
Toilet 101
Notes/references/
assumptions
Model outputs
PV Total Cost ($) $25,368,388PV Total Water Saved or
Supplied (ML)37,739
Unit Cost - full capacity
(PV$/PVkL)$0.67
Unit Cost - to meet demand
growth (PV$/PVkL)$0.67
Unit Cost (other)
Sustainability
Energy use (MWh/a) GHG emission/reduction (t/a)
Environmental Impact Social Impact
Additional Notes
Option Code SEQ - D1
Notes
References
QWC (2006) Water Supply Emergency Projects Monthly Progress Reports October 2006.
NRW (2006) Water for South East Queensland: A Long Term Solution.
Assumptions
Rebates for households are:
- $1000 for rainwater tank and accessories
- $200 for washing machine
- $150 for dual flush toilet suite
- 50% of purchase price up to $200 for above ground greywater system
- 50% of purchase price up to $500 for below ground greywater system
- 50% of purchase price up to $30 for showerhead
- $200 for swimming pool cover and/or roller
Reference: NRW WaterWise website
A rebate scheme for garden products has also been announced. The Queensland Government is providing a rebate of 50% of the total purchase cost for defined garden products up to a maximum rebate of $50, for products purchased on or after 18
December 2006. It is anticipated that
the scheme will run to 17 December 2008.
Reference: NRW WaterWise website
Notes
Cost of $29 million is cited in NRW 2006.
References
NRW (2006) WaterWise website <http://www.nrw.qld.gov.au/water/saverscheme/index.html> accessed 18/12/06.
NRW (2006) Water for South East Queensland: A Long Term Solution.
Assumptions
Notes
References
QWC (2006) Water Supply Emergency Projects Monthly Progress Reports October 2006.
NRW (2006) Water for South East Queensland: A Long Term Solution.
Assumptions
Rebates for households are:
- $1000 for rainwater tank and accessories- $200 for washing machine
- $150 for dual flush toilet suite
- 50% of purchase price up to $200 for above ground greywater system- 50% of purchase price up to $500 for below ground greywater system
- 50% of purchase price up to $30 for showerhead
- $200 for swimming pool cover and/or rollerReference: NRW WaterWise website
The program runs from 13/6/2006 to 30/6/2009
A rebate scheme for garden products has also been announced. The Queensland Government is providing a rebate of 50% of the total
purchase cost for defined garden products up to a maximum rebate of $50, for products purchased on or after 18 December 2006. It is
anticipated that the scheme will run to 17 December 2008.Reference: NRW WaterWise website
Notes
Cost of $29 million is cited in NRW 2006.
References
NRW (2006) WaterWise website <http://www.nrw.qld.gov.au/water/saverscheme/index.html> accessed 18/12/06.NRW (2006) Water for South East Queensland: A Long Term Solution.
Assumptions
To estimte the proportion of costs and savings attributable to the program the participation rates achieved under the Gold Coast rebate program have been extrapolated to the whole of South East Queensland. ISF GCW evaluation study (2006)

Institute for Sustainable Futures, UTS and Cardno February 2007
Review of Water Supply-Demand Options for South East Qld Appendix A
Project summary
Option Name Domestic Retrofit
Supply or Demand Demand
Description
Model inputs
Years (s) Component Capex ($) Opex ($/a) Replacement Costs ($)
2007-2008 130000 houses 22,500,000
Yield (ML/a) Uncertainty Energy use (MWh/ML)
2008 2,689
Notes/references/
assumptions
Model outputs
PV Total Cost ($) $20,340,204PV Total Water Saved or
Supplied (ML)35,329
Unit Cost - full capacity
(PV$/PVkL)$0.58
Unit Cost - to meet demand
growth (PV$/PVkL)0.58
Unit Cost (other)
Sustainability
Energy use (MWh/a) GHG emission/reduction (t/a)
Environmental Impact Social Impact
Additional Notes
Option Code SEQ - D2
Service providors in each local government area will collectively retrofit 150,000 domestic premises with water saving devices. Projected savings are 8.5ML/day (equivalent 3100GL/a). Project is to be delivered according to staged targets with half the
total number of houses to be retrofitted by August 2007 and the total target number of 150,000 to be retrofitted by end December 2007. Present anticipated timing is completion of 130,000 homes by April 2008. The remaining 20,000 homes will be
retrofit subject to additional funding being made available.
Target completion date is 31 December 2007.
Reference: QWC 2006
Notes
130,000 homes completed is 87% of the target 150,000 therefore yield of 130000 homes assumed to be 87% of target yield (3100ML/a) which is 2689ML/a.
References
QWC (2006) Water Supply Emergency Projects Monthly Progress Reports October 2006
Assumptions
Yield calculated based on conservative assumption that 130,000 homes will be completed
Water assumed to be available 2008 as project completion is end December 2007.
Service providors in each local government area will collectively retrofit 150,000 domestic premises with water saving devices. Projected
savings are 8.5 ML/day (equivalent 3,100 ML/a). Project is to be delivered according to staged targets with half the total number of
houses to be retrofitted by August 2007 and the total target number of 150,000 to be retrofitted by end December 2007. Present
anticipated timing is completion of 130,000 homes by April 2008. The remaining 20,000 homes will be retrofit subject to additional
funding being made available.
Target completion date is 31 December 2007.
Reference: QWC 2006
Notes
130,000 homes completed is 87% of the target 150,000 therefore yield of 130,000 homes assumed to be 87% of target yield (3,100
ML/a) which is 2,689 ML/a.
References
QWC (2006) Water Supply Emergency Projects Monthly Progress Reports October 2006
Assumptions
Yield calculated based on conservative assumption that 130,000 homes will be completed (i.e. additional funding not achieved)
Water assumed to be available 2008 as project completion is end December 2007.

Institute for Sustainable Futures, UTS and Cardno February 2007
Review of Water Supply-Demand Options for South East Qld Appendix A
Project summary
Option Name Building regulations (P29 QDC)
Supply or Demand Demand
Description
Model inputs
Years (s) Component Capex ($) Opex ($/a) Replacement Costs ($)
2007 - 2051 Program roll out
Yield (ML/a) Uncertainty Energy use (MWh/ML)
Average from 2007 - 2051 20,066
Notes/references/
assumptions
Model outputs
PV Total Cost ($)PV Total Water Saved or
Supplied (ML)161,760
Unit Cost - full capacity
(PV$/PVkL)
Unit Cost - to meet demand
growth (PV$/PVkL)
Unit Cost (other)
Sustainability
Energy use (MWh/a) GHG emission/reduction (t/a)
Environmental Impact Social Impact
Additional Notes
Option Code SEQ-D3
Notes
References
QWC (2006) Water Supply Emergency Projects Monthly Progress Reports October 2006.
NRW (2006) Water for South East Queensland: A Long Term Solution.
Assumptions
Parts 25 and 29 of the Queensland Development Code address water efficiency measures for new and renovated houses.
Part 29 requires all new Class 1 buildings (detached or semi-detached dwellings) and Class 2 buildings (buildings with two or more sole-occupancy dwellings) to have water efficient showers and toilets. Water supplies in class 1 dwellings are also
subject to pressure restrictions. Part 29 has been in effect since 1 March 2006.
Notes
Savings of up to 36% per household stated by NRW 2006. The raintank provisions are not included in this 36% according to NRW 2006.
References
Queensland Development Code <http://www.lgp.qld.gov.au/?id=247> accessed 18/12/06.
NRW (2006) Water for South East Queensland: A Long Term Solution.
Assumptions
35 kL/hh (new households after 2006) is saved. 35 kL = estimation of savings from toilets (20 kL) and shower head (15kL) (Turner, A. et
al. 2005 and ISF estimates).
Due to uncertainty in the level of compliance of existing households where bathrooms are renovated, to be conservative savings
associated with existing househods have not been incuded.
This option also excludes savings that have been attributed to Pimpama Coomera and capped demand in Caloundra.
Parts 25 and 29 of the Queensland Development Code address water efficiency measures for new and renovated houses.
Part 29 requires all new Class 1 buildings (detached or semi-detached dwellings) and Class 2 buildings (buildings with two or more sole-
occupancy dwellings) to have water efficient showers and toilets. Existing households where bathrooms are renovated are also included
in this regulation. Water supplies in class 1 dwellings are also subject to pressure restrictions. Part 29 has been in effect since 1 March
2006.

Institute for Sustainable Futures, UTS and Cardno February 2007
Review of Water Supply-Demand Options for South East Qld Appendix A
Project summary
Option Name Building regulations (P25 QDC)
Supply or Demand Demand
Description
Model inputs
Years (s) Component Capex ($) Opex ($/a) Replacement Costs ($)
Yield (ML/hh/a) Uncertainty Energy use (MWh/ML)
78% of new houses 0.052
Average Yield 30,019
Notes/references/ assumptions
Model outputs
PV Total Cost ($)PV Total Water Saved or
Supplied (ML)241,993
Unit Cost - full capacity
(PV$/PVkL)
Unit Cost - to meet demand
growth (PV$/PVkL)
Unit Cost (other)
Sustainability
Energy use (MWh/a) GHG emission/reduction (t/a)
Environmental Impact Social Impact
Additional Notes
Option Code SEQ-D4
Notes
References
QWC (2006) Water Supply Emergency Projects Monthly Progress Reports October 2006.
NRW (2006) Water for South East Queensland: A Long Term Solution.
Assumptions
Parts 25 and 29 of the Queensland Development Code address water efficiency measures for new and renovated houses.
Part 25 requires that all Class 1 buildings supplied with water from the reticulated town water supply system must achieve water savings targets by installing a rainwater tank or equivalent supply system. For South East Queensland, water saving
targets are 70kL/a for new detached houses and 42kL/a for new semi-detached dwellings. Part 25 commences on 1 January 2007.
Reference: Queensland Development Code
Notes
References
Queensland Development Code <http://www.lgp.qld.gov.au/?id=247> accessed 18/12/06.
NRW (2006) Water for South East Queensland: A Long Term Solution.
Assumptions
Notes
References
Queensland Development Code <http://www.lgp.qld.gov.au/?id=247> accessed 18/12/06.
NRW (2006) Water for South East Queensland: A Long Term Solution.
Assumptions
Composition of households in SEQ 70% detached houses and 8% semi detached. This translates to a saving for all new houses of
approximately 0.70*70kL/hh + 0.08*42kL/hh = 52.32 kL/hh
This option excludes savings that have been attributed to Pimpama Coomera and capped demand in Caloundra.
Parts 25 and 29 of the Queensland Development Code address water efficiency measures for new and renovated houses.
Part 25 requires that all Class 1 buildings supplied with water from the reticulated town water supply system must achieve water savings
targets by installing a rainwater tank or equivalent supply system. For South East Queensland, water saving targets are 70 kL/a for new detached houses and 42 kL/a for new semi-detached dwellings. Part 25 commences on 1 January 2007.
Reference: Queensland Development Code
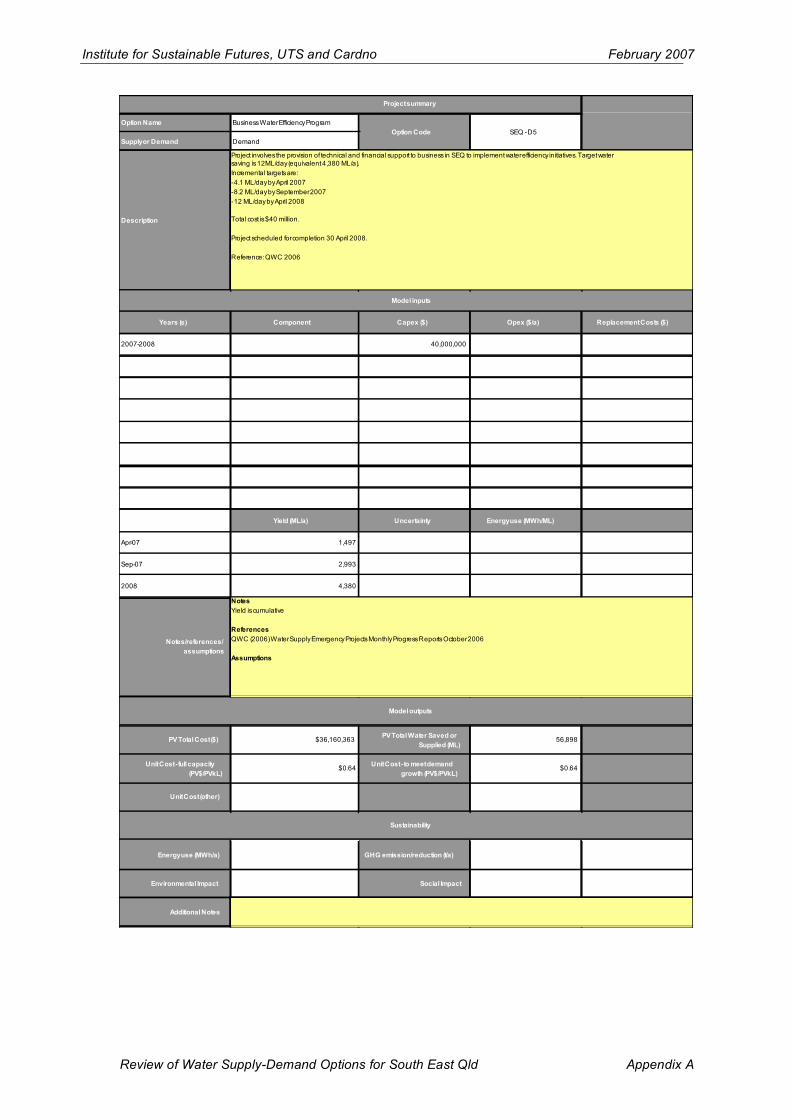
Institute for Sustainable Futures, UTS and Cardno February 2007
Review of Water Supply-Demand Options for South East Qld Appendix A
Project summary
Option Name Business Water Efficiency Program
Supply or Demand Demand
Description
Model inputs
Years (s) Component Capex ($) Opex ($/a) Replacement Costs ($)
2007-2008 40,000,000
Yield (ML/a) Uncertainty Energy use (MWh/ML)
Apr-07 1,497
Sep-07 2,993
2008 4,380
Notes/references/
assumptions
Model outputs
PV Total Cost ($) $36,160,363PV Total Water Saved or
Supplied (ML)56,898
Unit Cost - full capacity
(PV$/PVkL)$0.64
Unit Cost - to meet demand
growth (PV$/PVkL)$0.64
Unit Cost (other)
Sustainability
Energy use (MWh/a) GHG emission/reduction (t/a)
Environmental Impact Social Impact
Additional Notes
Option Code SEQ - D5
P roject involves the provision of technical and financial support to business in S E Q to implement water efficiency initiatives. Target water saving is 12ML/day (equivalent 4380GL/a).
Incremental targets are:
- 4.1ML/day by A pril 2007
- 8.2ML/day by S eptember 2007
- 12ML/day by A pril 2008
Total cost is $40 million.
P roject scheduled for completion 30 A pril 2008.
Reference: QWC 2006
Notes
Y ield is cumulative
References
QWC (2006) Water S upply E mergency P rojects Monthly P rogress Reports October 2006
Assumptions
Project involves the provision of technical and financial support to business in SEQ to implement water efficiency initiatives. Target water saving is 12ML/day (equivalent 4,380 ML/a).
Incremental targets are:
- 4.1 ML/day by April 2007
- 8.2 ML/day by September 2007
- 12 ML/day by April 2008
Total cost is $40 million.
Project scheduled for completion 30 April 2008.
Reference: QWC 2006
Notes
Yield is cumulative
References
QWC (2006) Water Supply Emergency Projects Monthly Progress Reports October 2006
Assumptions

Institute for Sustainable Futures, UTS and Cardno February 2007
Review of Water Supply-Demand Options for South East Qld Appendix A
Project summary
Option Name Capped Demand in Caloundra
Supply or Demand Demand
Description
Model inputs
Years (s) Component Capex ($) Opex ($/a) Replacement Costs ($)
Yield Uncertainty Energy use (MWh/ML)
kL/hh reduction in new areas 216
Average Reduction (ML/a) 7,382
Reduction in 2051 (ML/a) 12,209
Notes/references/
assumptions.
Model outputs
PV Total Cost ($)PV Total Water Saved or
Supplied (ML)61,749
Unit Cost - full capacity
(PV$/PVkL)
Unit Cost - to meet demand
growth (PV$/PVkL)
Unit Cost (other)
Sustainability
Energy use (MWh/a) GHG emission/reduction (t/a)
Environmental Impact Social Impact
Additional Notes
Option Code SEQ-D6
Notes
References
Assumptions
Caloundra City Council is in the process of developing a demand management scheme for new developments similar to that already
implemented in Pimpama Coomera. The scheme has been flagged in the draft Local Growth Management Strategy (Caloundra City,
2006 p38). In the Strategy, a target of a possible 80% reduction in use of potable water is to be achieved for new developments through
the implementation of water efficiency and demand management measures.
Notes
References
Assumptions
The Coloundra Local Growth Management Strategy (draft) 2006, states a possible 80% reduction in water demand in new
developments. Assuming an average consumptions of approcximately 270 kL/hh/a this implies a saving of 216 kL/hh/a could be
achieved in this area.
The potential for double counting with other regulations has been taken into consideration in other initiatives.

Institute for Sustainable Futures, UTS and Cardno February 2007
Review of Water Supply-Demand Options for South East Qld Appendix A
Project summary
Option Name Pimpama Coomera
Supply or Demand Demand
Description
Model inputs
Years (s) Component Capex ($) Opex ($/a) Replacement Costs ($)
2007 - 2051 1,600 200
Yield (ML/a) Uncertainty Energy use (MWh/ML)
Average water Saved 5,913
Water Saved In 2051 10,512
Notes/references/
assumptions
Model outputs
PV Total Cost ($) $80,683,850PV Total Water Saved or
Supplied (ML)52,110
Unit Cost - full capacity
(PV$/PVkL)$1.55
Unit Cost - to meet demand
growth (PV$/PVkL)$1.55
Unit Cost (other)
Sustainability
Energy use (MWh/a) GHG emission/reduction (t/a)
Environmental Impact Social Impact
Additional Notes
Option Code SEQ-D7
A model of smart growth based on the current Pimpama Coomera (Gold Coast) model. Under the model, homes are required to achieve
an 80% reduction in the use of potable water. Water savings in Pimpama Coomera have been achieved through:
- Dual Retic: 21.4 ML/day (equivalent 7,811 ML/a)
- Rainwater 11.6 ML/day (equivalent 4,234 ML/a)
Notes
References
Gold Coast Water and Gold Coast City Council (2004) Pimpama Coomera Waterfuture Master Plan 2004.
Assumptions
$1,600 /hh capital cost (Apostolidis N., (2003) Integrated Water Management - Pushing the Boundaries, IPWEAQ 2003 State
Conference, Mackay)
$200 /hh operating cost (ISF (2005) Costing for sustainable outcomes in urban water systems, a guidebook)
Greenhouse gas emission - assumed neutral
The population of Pimpama Coomera is 15,000 in 2006 and assumed to be 120,000 in 2051.
Potential for double counting with other regulations has been taken into consideration in other initiatives

Institute for Sustainable Futures, UTS and Cardno February 2007
Review of Water Supply-Demand Options for South East Qld Appendix A
Project summary
Option NameRecycled Water for Industrial and
Commercial Customers - Brisbane
Supply or Demand Demand
Description
Model inputs
Years (s) Component Capex ($) Opex ($/a) Replacement Costs ($)
2006-2007Construction of pipeline for stage 2
Trade Coast North West3,500,000
2006-2007Construction and delivery of 5 tanker
sites2,000,000
2006-2008Construction and commissioning of stage 2 Trade Coast South
13,000,000
Total 18,500,000
Yield (ML/a) Uncertainty Energy use (MWh/ML)
2008 2,227 High
Notes/references/
assumptions
Model outputs
PV Total Cost ($) $16,494,890PV Total Water Saved or
Supplied (ML)28,218
Unit Cost - full capacity
(PV$/PVkL)$0.58
Unit Cost - to meet demand
growth (PV$/PVkL)$0.58
Unit Cost (other)
Sustainability
Energy use (MWh/a) GHG emission/reduction (t/a)
Environmental Impact Social Impact
Additional Notes
SEQ - D8Option Code
Substitution of existing supply of water to industrial and commercial customers in the Brisbane area who use more than 100ML/a with recycled water amounting to at least 20ML/day (equivalent 7.3GL/a) new available supplies. Substitution is to occur
in increments:
- 10ML/day March 2007
- 20ML/day March 2008
Project comprises:
- Australia Trade Coast (North West) stage: construction of new pipeline to Brisbane Airport Corporation to supply water from the Gibson Island WTP
- Australia Trade Coast (South) stage: design construction and commissioning of a 'Micro-Filtration/Reverse Osmosis' (MF/RO) plant at the Wynnum WTP and construction of a new pipeline from Wynnum WTP to the adjacent Caltex site
- Commerial Tankers stage: provision of 5 tanker filling stations to supply commercial tankers with recycled water
Project scheduled for completion 31 March 2008.
Reference: QWC 2006
Notes
Confusing yield estimates in QWC 2006:
Australia Trade Coast (North West)
Target Outcome: 20ML/day; Forecast Performance against Target 0.4ML/d.
Australia Trade Coast South (Caltex)
Target Outcome: 20ML/day; Forecast Performance against Target 4.5ML/d.
Commercial Tankers
Target Outcome: 20ML/day; Forecast Performance against Target 1.2ML/d.
References
QWC (2006) Water Supply Emergency Projects Monthly Progress Reports October 2006.
NRW (2006) Water for South East Queensland: A Long Term Solution.
Assumptions
Assumed committed...
Substitution of existing supply of water to industrial and commercial customers in the Brisbane area who use more than 100 ML/a with
recycled water amounting to at least 20 ML/day (equivalent 7.3 GL/a) new available supplies. Substitution is to occur in increments:- 10ML/day March 2007
- 20ML/day March 2008
Project comprises:- Australia Trade Coast (North West) stage: construction of new pipeline to Brisbane Airport Corporation to supply water from the Gibson
Island WTP - Australia Trade Coast (South) stage: design construction and commissioning of a 'Micro-Filtration/Reverse Osmosis' (MF/RO) plant at
the Wynnum WTP and construction of a new pipeline from Wynnum WTP to the adjacent Caltex site - Commerial Tankers stage: provision of 5 tanker filling stations to supply commercial tankers with recycled water
Project scheduled for completion 31 March 2008.
Reference: QWC 2006
Notes
Confusing yield estimates in QWC 2006:Australia Trade Coast (North West)
Target Outcome: 20 ML/day; Forecast Performance against Target 0.4ML/d. Australia Trade Coast South (Caltex)
Target Outcome: 20 ML/day; Forecast Performance against Target 4.5ML/d. Commercial Tankers
Target Outcome: 20 ML/day; Forecast Performance against Target 1.2ML/d.
Used forecast performance for yield
ReferencesQWC (2006) Water Supply Emergency Projects Monthly Progress Reports October 2006.
NRW (2006) Water for South East Queensland: A Long Term Solution.
AssumptionsAssumed that this program is committed.

Institute for Sustainable Futures, UTS and Cardno February 2007
Review of Water Supply-Demand Options for South East Qld Appendix A
Project summary
Option NameRecycled Water for Industrial and
Commercial Customers - Gold Coast
Supply or Demand Demand
Description
Model inputs
Years (s) Component Capex ($) Opex ($/a) Replacement Costs ($)
2006-2007 Planning
2008 Implementation
Yield (ML/a) Uncertainty Energy use (MWh/ML)
2008 106
Notes/references/
assumptions
Model outputs
PV Total Cost ($)PV Total Water Saved or
Supplied (ML)1,343
Unit Cost - full capacity
(PV$/PVkL)
Unit Cost - to meet demand
growth (PV$/PVkL)
Unit Cost (other)
Sustainability
Energy use (MWh/a) GHG emission/reduction (t/a)
Environmental Impact Social Impact
Additional Notes
Option Code SEQ - D9
The project scope is to identify industrial and commercial users of water in the Gold Coast area who use more than 100ML/a and develop detailed plans for:
a) deciding which customers can be supplied with recycled water
b) supplying recyled water to those customers
Target yields are:
- 0.51ML/day (186ML/a) by October 2006
- 0.6ML/day (219ML/a) by October 2007
- 0.8ML/day (292ML/a)by Septermber 2008
Notes
References
QWC (2006) Water Supply Emergency Projects Monthly Progress Reports October 2006.
Assumptions
Current use of recycled water is 0.51ML/day so this is subtracted from the target of 0.8ML/day to find additional water. Additional water is therefore 0.29ML/day equivalent to 105.85ML/a.
The project scope is to identify industrial and commercial users of water in the Gold Coast area who use more than 100 ML/a and
develop detailed plans for:
a) deciding which customers can be supplied with recycled water
b) supplying recyled water to those customers
Target yields are:
- 0.51 ML/day (186 ML/a) by October 2006
- 0.6 ML/day (219 ML/a) by October 2007
- 0.8 ML/day (292 ML/a)by Septermber 2008
Notes
References
QWC (2006) Water Supply Emergency Projects Monthly Progress Reports October 2006.
Assumptions
Current use of recycled water is 0.51 ML/day so this is subtracted from the target of 0.8 ML/day to find additional water. Additional water
is therefore 0.29 ML/day equivalent to 105.85 ML/a.

Institute for Sustainable Futures, UTS and Cardno February 2007
Review of Water Supply-Demand Options for South East Qld Appendix A
Project summary
Option NameRecycled Water for Industrial and
Commercial Customers - Ipswich
Supply or Demand Demand
Description
Model inputs
Years (s) Component Capex ($) Opex ($/a) Replacement Costs ($)
2006-2007Supply of wastewater treatment to
WCRWP Stage 1A
2006-2008Supply of wastewater treatment to
WCRWP Stage 1B
2006-2007 Supply to major construction projects
2006-2007 Development of tanker filling stations
2006-2007 Interim supply to Springfield
2007-2008
Development of detailed supply
plans for WCRWP Aligned Supply
Zones
Yield (ML/a) Uncertainty Energy use (MWh/ML)
2006 52
2007 203
2008 1,000
Notes/references/
assumptions
Model outputs
PV Total Cost ($)PV Total Water Saved or
Supplied (ML)12,861
Unit Cost - full capacity
(PV$/PVkL)
Unit Cost - to meet demand
growth (PV$/PVkL)
Unit Cost (other)
Sustainability
Energy use (MWh/a) GHG emission/reduction (t/a)
Environmental Impact Social Impact
Additional Notes
Option Code SEQ - D10
The project scope is to identify industrial and commercial users of water who use more than 100ML/a and develop detailed plans for:
a) deciding which customers can be supplied with recycled water
b) supplying recyled water to those customers
The project will supply bulk water to the Western Corridor Recycled Water P roject (WCRWP ) S tages 1A and 1B .
P roject includes:
- S upply of wastewater treatment to WCRWP S tage 1A
- S upply of wastewater treatment to WCRWP S tage 1B
- S upply to major construction projects
- Development of tanker filling stations
- Interim supply to S pringfield
- Development of detailed supply plans for WCRWP A ligned S upply Zones
P roject scheduled for completion 30 S eptember 2008.
Reference: QWC 2006
Notes
Costs unknown at this stage
References
QWC (2006) Water S upply E mergency P rojects Monthly P rogress Reports October 2006.
Assumptions
Y ield targets are 52ML/a in 2006, 203ML/a in 2007 and 1000ML/a in 2008. Do we assume this is cumulative?
The project scope is to identify industrial and commercial users of water who use more than 100 ML/a and develop detailed plans for:
a) deciding which customers can be supplied with recycled water
b) supplying recyled water to those customers
The project will supply bulk water to the Western Corridor Recycled Water Project (WCRWP) Stages 1A and 1B.
Project includes:
- Supply of wastewater treatment to WCRWP Stage 1A
- Supply of wastewater treatment to WCRWP Stage 1B
- Supply to major construction projects
- Development of tanker filling stations
- Interim supply to Springfield
- Development of detailed supply plans for WCRWP Aligned Supply Zones
Project scheduled for completion 30 September 2008.
Notes
Costs unknown at this stage
References
QWC (2006) Water Supply Emergency Projects Monthly Progress Reports October 2006.
Assumptions

Institute for Sustainable Futures, UTS and Cardno February 2007
Review of Water Supply-Demand Options for South East Qld Appendix A
Project summary
Option NameRecycled Water for Industrial and
Commercial Customers - Logan
Supply or Demand Demand
Description
Model inputs
Years (s) Component Capex ($) Opex ($/a) Replacement Costs ($)
Yield (ML/a) Uncertainty Energy use (MWh/ML)
Unknown
Notes/references/
assumptions
Model outputs
PV Total Cost ($)PV Total Water Saved or
Supplied (ML)
Unit Cost - full capacity
(PV$/PVkL)
Unit Cost - to meet demand
growth (PV$/PVkL)
Unit Cost (other)
Sustainability
Energy use (MWh/a) GHG emission/reduction (t/a)
Environmental Impact Social Impact
Additional Notes
Option Code SEQ - D11
The project scope is to identify industrial and commercial users of water who use more than 100ML/a and develop detailed plans for:
a) deciding which customers can be supplied with recycled water
b) supplying recyled water to those customers
Project time frame 2006-2008.
Reference: QWC 2006
Notes
In planning stage (feasibility study not yet released). Few details available.
References
QWC (2006) Water Supply Emergency Projects Monthly Progress Reports October 2006.
Assumptions
The project scope is to identify industrial and commercial users of water who use more than 100 ML/a and develop detailed plans for:
a) deciding which customers can be supplied with recycled water
b) supplying recyled water to those customers
Project time frame 2006-2008.
Reference: QWC 2006
Notes
In planning stage (feasibility study not yet released). Few details available.
References
QWC (2006) Water Supply Emergency Projects Monthly Progress Reports October 2006.
Assumptions

Institute for Sustainable Futures, UTS and Cardno February 2007
Review of Water Supply-Demand Options for South East Qld Appendix A
Project summary
Option NameRecycled Water for Industrial and
Commercial Customers - Maroochy
Supply or Demand Demand
Description
Model inputs
Years (s) Component Capex ($) Opex ($/a) Replacement Costs ($)
Yield (ML/a) Uncertainty Energy use (MWh/ML)
Unknown
Notes/references/
assumptions
Model outputs
PV Total Cost ($)PV Total Water Saved or
Supplied (ML)
Unit Cost - full capacity
(PV$/PVkL)
Unit Cost - to meet demand
growth (PV$/PVkL)
Unit Cost (other)
Sustainability
Energy use (MWh/a) GHG emission/reduction (t/a)
Environmental Impact Social Impact
Additional Notes
Option Code SEQ - D12
The project scope is to identify industrial and commercial users of water who use more than 100ML/a and develop detailed plans for:
a) deciding which customers can be supplied with recycled water
b) supplying recyled water to those customers
To date four industrial customers have been identified. It has been determined that there is limited scope to supply these customers with
recycled water additional to what is currently used (two currently use recycled water) due to the nature of their businesses (shopping
centre, resort, hospital, food processing).
Project timeframe 2006-2008.
Reference: QWC 2006
Notes
In planning stage (feasibility study not yet released). Few details available.
References
QWC (2006) Water Supply Emergency Projects Monthly Progress Reports October 2006.
Assumptions
Notes
In planning stage (feasibility study not yet released). Few details available.
References
QWC (2006) Water Supply Emergency Projects Monthly Progress Reports October 2006.
Assumptions

Institute for Sustainable Futures, UTS and Cardno February 2007
Review of Water Supply-Demand Options for South East Qld Appendix A
Project summary
Option NameRecycled Water for Industrial and
Commercial Customers - Pine Rivers
Supply or Demand Demand
Description
Model inputs
Years (s) Component Capex ($) Opex ($/a) Replacement Costs ($)
2007-2008Construction of recycled water
factory
2007-2008 Construction of pump stations
2007-2008 Extensions to recycled water main
Total 6,511,000
Yield (ML/a) Uncertainty Energy use (MWh/ML)
2008 1,460
Notes/references/
assumptions
Model outputs
PV Total Cost ($) $5,686,960PV Total Water Saved or
Supplied (ML)18,500
Unit Cost - full capacity
(PV$/PVkL)$0.31
Unit Cost - to meet demand
growth (PV$/PVkL)$0.31
Unit Cost (other)
Sustainability
Energy use (MWh/a) GHG emission/reduction (t/a)
Environmental Impact Social Impact
Additional Notes
Option Code SEQ - D13
The project scope is to identify industrial and commercial users of water in Pine Rivers who use more than 100ML/a and develop detailed a detailed plan for supplying recyled water to those customers. One customer has been identified as suitable in
the Pine rivers area. Projected savings are 4ML/day (equivalent 1460ML/a). Project involves construction and commissioning of a recycled water factory, pump stations and extensions to a recycled water main.
Reference: QWC 2006
Notes
Budget is preliminary estimate only
References
QWC (2006) Water Supply Emergency Projects Monthly Progress Reports October 2006.
Assumptions
The project scope is to identify industrial and commercial users of water in Pine Rivers who use more than 100 ML/a and develop a
detailed plan for supplying recyled water to those customers. One customer has been identified as suitable in the Pine rivers area.
Projected savings are 4ML/day (equivalent 1,460 ML/a). Project involves construction and commissioning of a recycled water factory,
pump stations and extensions to a recycled water main.
Reference: QWC 2006
Notes
Budget is preliminary estimate only
References
QWC (2006) Water Supply Emergency Projects Monthly Progress Reports October 2006.
Assumptions

Institute for Sustainable Futures, UTS and Cardno February 2007
Review of Water Supply-Demand Options for South East Qld Appendix A
Project summary
Option Name Pressure and leakage reduction
Supply or Demand Demand
Description
Model inputs
Years (s) Component Capex ($) Opex ($/a) Replacement Costs ($)
2006-2012Pressure and leakage works in all
local government areas
Total 90,000,000
Yield (ML/a) Uncertainty Energy use (MWh/ML)
2006 1,825
2007 9,125
2009 16,425
2009 19,710
2012 23,360
Notes/references/
assumptions
Model outputs
PV Total Cost ($) $61,502,962PV Total Water Saved or
Supplied (ML)290,097
Unit Cost - full capacity
(PV$/PVkL)$0.21
Unit Cost - to meet demand
growth (PV$/PVkL)$0.23
Unit Cost (other)
Sustainability
Energy use (MWh/a) GHG emission/reduction (t/a)
Environmental Impact Social Impact
Additional Notes
Option Code SEQ - D14
Water leakage and pressure management project across all 18 south east Queensland local government areas. Water saving target of 60ML/day (equivalent 21900ML/a) in stages from 2006 to A ugust 2008.
P roject phases are:
1. P reliminary planning by all councils
2. Detailed implementation planning
3. Meaured and reported water loss savings
Target dates according to current forecast:
- 74% of outcome achieved by A uust 2008
- 90% of outcome achieved by A ugust 2009
- 107% of outcome achieved by A ugust 2012
Reference: QWC 2006
Notes
S tate contribution to costs is $32 million
References
QWC (2006) Water S upply E mergency P rojects Monthly P rogress Reports October 2006.
NRW (2006) Water for S outh E ast Queensland: A Long Term S olution.
Assumptions
Water leakage and pressure management project across all 18 south east Queensland local government areas. Water saving target of
60 ML/day (equivalent 21,900 ML/a) in stages from 2006 to August 2008.
Project phases are:
1. Preliminary planning by all councils
2. Detailed implementation planning3. Meaured and reported water loss savings
Target dates according to current forecast:
- 74% of outcome achieved by August 2008
- 90% of outcome achieved by August 2009
- 107% of outcome achieved by August 2012
Reference: QWC 2006
Notes
State contribution to costs is $32 million
References
QWC (2006) Water Supply Emergency Projects Monthly Progress Reports October 2006.NRW (2006) Water for South East Queensland: A Long Term Solution.
Assumptions

Institute for Sustainable Futures, UTS and Cardno February 2007
Review of Water Supply-Demand Options for South East Qld Appendix A
Project summary
Option Name Bribie Island Groundwater Project
Supply or Demand Supply
Description
Model inputs
Years (s) Component Capex ($) Opex ($/a) Replacement Costs ($)
2006-2007 Test drilling
2006-2007 Construction of production bores
2006-2007Installation of mechanical and
electrical equipment
2006-2007Construction of groundwater
pipelines
2006-2007Construction of additional WTP
capacity
2006-2007 Construction of new trunk water main
Total 25,000,000
Yield (ML/a) Uncertainty Energy use (MWh/ML)
2008 1,825
Current modelling predicts
8ML/d (2,920 ML/a) rather than
target of 10 which would reduce new yield to 1,825 ML/a (see
below notes)
Notes/references/
assumptions
Model outputs
PV Total Cost ($) $23,364,486PV Total Water Saved or
Supplied (ML)23,124
Unit Cost - full capacity
(PV$/PVkL)$1.01
Unit Cost - to meet demand
growth (PV$/PVkL)1.01
Unit Cost (other)
Sustainability
Energy use (MWh/a) GHG emission/reduction (t/a)
Environmental Impact Social Impact
Additional Notes
Option Code SEQ - S1
BWEP
Notes
According to QWC (2006) current yield from Bribie Island Groundwater is 2-3ML/d equivalent to 730-1095ML/a. According to NRW (2006) current yield is 2000. Even if NRW yield estimates are reduced by 30% to estimate
prudent yield (which would be 1400) these figures do not match. As the QWC report is more recent, we have assumed these figures correct and taken the higher estimate of current yield (1095ML/a) so that predicted
additional yield estimate is conservative.
References
QWC (2006) Water Supply Emergency Projects Monthly Progress Reports October 2006.
NRW (2006) Water for South East Queensland: A Long Term Solution.
Assumptions
Substitution of 10 ML/day (equivalent to 3,650 ML/a) from the existing water supply system with underground water sourced from Bribie Island.
Project involves:
- Development of configurations of ground-water abstraction bores
- Installation of mechanical and electrical equipment (with the provision of power 6km into the northern field a particular challenge)
- Construction of groundwater piplelines connecting bores to Water Treatment Plants- Construction of 10 ML/d additional treatment plant capacity
- Construction of a new trunk water main to supply treated water to Council's existing storages at Bellara (from where water will be
distributed to Bribie Island and Sandstone Point on the mainland)
Reference: QWC 2006
Notes
According to QWC (2006) current yield from Bribie Island Groundwater is 2-3 ML/d equivalent to 730-1,095 ML/a. According to NRW
(2006) current yield is 2000. Even if DNRW yield estimates are reduced by 30% to estimate prudent yield (which would be 1,400) these
figures do not match. As the QWC report is more recent, we have assumed these figures correct and taken the higher estimate of
current yield (1,095 ML/a) so that predicted additional yield estimate is conservative.
References
QWC (2006) Water Supply Emergency Projects Monthly Progress Reports October 2006.
DNRW (2006) Water for South East Queensland: A Long Term Solution.
Assumptions

Institute for Sustainable Futures, UTS and Cardno February 2007
Review of Water Supply-Demand Options for South East Qld Appendix A
Project summary
Option Name Brisbane Aquifer Project
Supply or Demand Supply
Description
Model inputs
Years (s) Component Capex ($) Opex ($/a) Replacement Costs ($)
2006 Borefield investigation 8,000,000
2007 Reticulation pipework 14,000,000
2006-2007 WTP design and construction etc.
Total 45,000,000
Yield (ML/a) Uncertainty Energy use (MWh/ML)
2007 7,300 Low
Notes/references/
assumptions
Model outputs
PV Total Cost ($) $42,056,075PV Total Water Saved or
Supplied (ML)92,498
Unit Cost - full capacity
(PV$/PVkL)$0.45
Unit Cost - to meet demand
growth (PV$/PVkL)0.45
Unit Cost (other)
Sustainability
Energy use (MWh/a) GHG emission/reduction (t/a)
Environmental Impact Social Impact
Additional Notes
Option Code SEQ - S2
Source 20ML/day (equivalent 7300ML/a) from groundwater from seven borefields in Brisbane City Council LGA.
Three main project phases are:
1. Investigation involving drilling and testing bores to identify those suitable for supplying groundwater
2. Construction of pipework connecting bores, water treatment plants and connections to existing reticulation network (2 borefields will be connected to existing WTPs with remaining 5 having their own individual plants)
3. Construction of WTPs (likely total of 6)
Reference: QWC 2006
Notes
References
QWC (2006) Water Supply Emergency Projects Monthly Progress Reports October 2006.
NRW (2006) Water for South East Queensland: A Long Term Solution.
Assumptions
Source 20ML/day (equivalent 7,300 ML/a) from groundwater from seven borefields in Brisbane City Council LGA.Three main project phases are:
1. Investigation involving drilling and testing bores to identify those suitable for supplying groundwater
2. Construction of pipework connecting bores, water treatment plants and connections to existing reticulation network (2 borefields will be connected to existing WTPs with remaining 5 having their own individual plants)
3. Construction of WTPs (likely total of 6)
Reference: QWC 2006
Notes
References
QWC (2006) Water Supply Emergency Projects Monthly Progress Reports October 2006.
NRW (2006) Water for South East Queensland: A Long Term Solution.
Assumptions
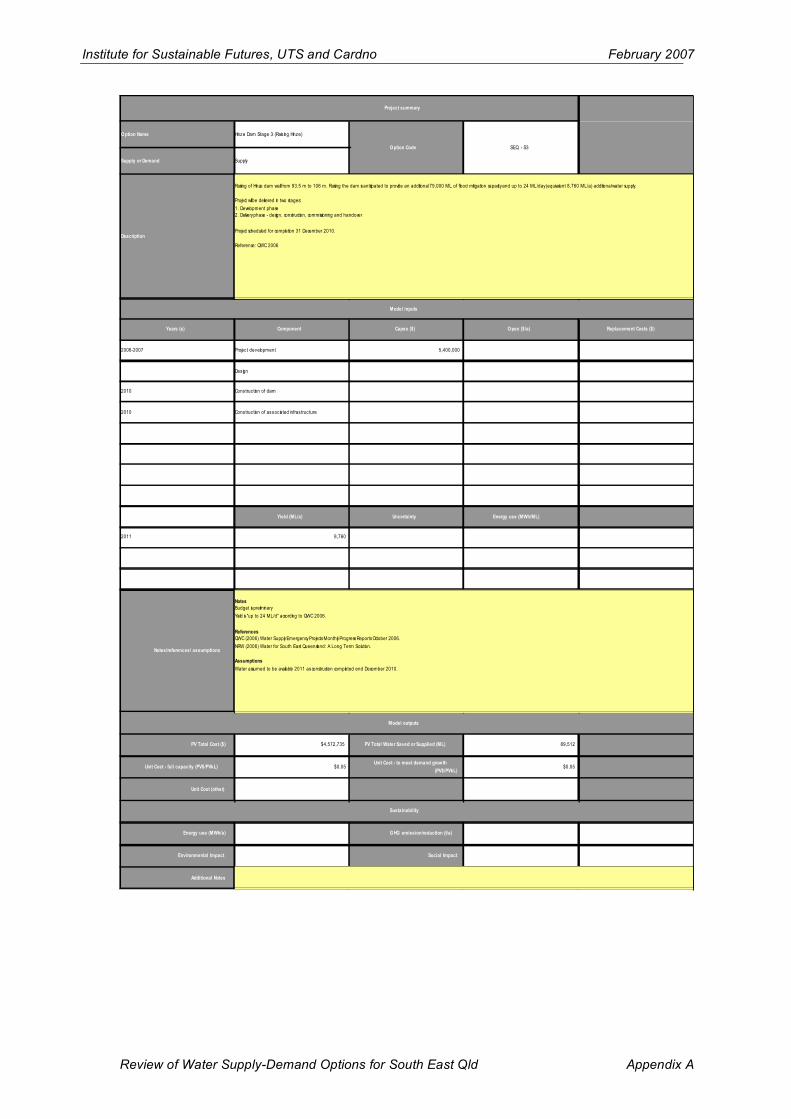
Institute for Sustainable Futures, UTS and Cardno February 2007
Review of Water Supply-Demand Options for South East Qld Appendix A
Project summary
Option Name Hinze Dam Stage 3 (Rais ing Hinze)
Supply or Demand Supply
Description
Model inputs
Years (s) Component Capex ($) Opex ($/a) Replacement Costs ($)
2006-2007 Project development 5,400,000
Design
2010 Construction of dam
2010 Construction of associated infrastructure
Yield (ML/a) Uncertainty Energy use (MWh/ML)
2011 8,760
Notes/references/ assumptions
Model outputs
PV Total Cost ($) $4,572,735 PV Total Water Saved or Supplied (ML) 89,512
Unit Cost - full capacity (PV$/PVkL) $0.05Unit Cost - to meet demand growth
(PV$/PVkL)$0.05
Unit Cost (other)
Sustainability
Energy use (MWh/a) GHG emission/reduction (t/a)
Environmental Impact Social Impact
Additional Notes
Option Code SEQ - S3
Raising of Hinze dam wall from 93.5m to 106m. Raising the dam is anticipated to provide an additional 79,000ML of flood mitigation capacity and up to 24ML/day (equivalent 8760ML/a) additional water supply.
P roject will be delivered in two stages:
1. Development phase
2. Delivery phase - design, construction, commissioning and handover
P roject scheduled for completion 31 December 2010.
Reference: QW C 2006
No tes
B udget is preliminary
Y ield is "up to 24ML/d" according to QW C 2006.
Referen ces
QW C (2006) W ater S upply E mergency P rojects Monthly P rogress Reports October 2006.
NRW (2006) W ater for S outh E ast Queensland: A Long T erm S olution.
Assu mp tio n s
W ater assumed to be available 2011 as construction completed end December 2010.
Raising of Hinze dam wall from 93.5 m to 106 m. Raising the dam is anticipated to provide an additional 79,000 ML of flood mitigation capacity and up to 24 ML/day (equivalent 8,760 ML/a) additional water supply.
Project will be delivered in two stages:
1. Development phase
2. Delivery phase - design, construction, commissioning and handover
Project scheduled for completion 31 December 2010.
Reference: QWC 2006
Notes
Budget is preliminary
Yield is "up to 24 ML/d" according to QWC 2006.
References
QWC (2006) Water Supply Emergency Projects Monthly Progress Reports October 2006.
NRW (2006) Water for South East Queensland: A Long Term Solution.
Assumptions
Water assumed to be available 2011 as construction completed end December 2010.

Institute for Sustainable Futures, UTS and Cardno February 2007
Review of Water Supply-Demand Options for South East Qld Appendix A
Project summary
Option Name Water Harvesting into Hinze Dam
Supply or Demand Supply
Description
Model inputs
Years (s) Component Capex ($) Opex ($/a) Replacement Costs ($)
2016 Construction of diversion infrastructure 100,000,000
Yield (ML/a) Uncertainty Energy use (MWh/ML)
2016 10,000
Notes/references/
assumptions
Model outputs
PV Total Cost ($) $50,834,929PV Total Water Saved or
Supplied (ML)70,903
Unit Cost - full capacity
(PV$/PVkL)$0.72
Unit Cost - to meet demand
growth (PV$/PVkL)$0.72
Unit Cost (other)
Sustainability
Energy use (MWh/a)GHG emission/reduction
(t/a)
Environmental Impact Social Impact
Additional Notes
Option Code SEQ - S4
Following the raising of Hinze dam wall, water diversions from adjacent watercourses such as the Coomera River, Canungra and Mudgeeraba
Creeks is planned to increase the yield of the dam by a further 10,000 ML/a.
Reference: NRW 2006
Notes
Project is at preliminary investigations stage
References
NRW (2006) Water for South East Queensland: A Long Term Solution.

Institute for Sustainable Futures, UTS and Cardno February 2007
Review of Water Supply-Demand Options for South East Qld Appendix A
Project summary
Option Name Cedar Grove Weir
Supply or Demand Supply
Description
Model inputs
Years (s) Component Capex ($) Opex ($/a) Replacement Costs ($)
2006-2007 Construction of weir
2006-2007 Construction of fishways
2006-2007 Construction of outlet works
2006-2007 Bank protection measures
15,000,000
Yield (ML/a) Uncertainty Energy use (MWh/ML)
2008 2,993
Notes/references/
assumptions
Model outputs
PV Total Cost ($) $14,018,692PV Total Water Saved or
Supplied (ML)37,924
Unit Cost - full capacity
(PV$/PVkL)$0.37
Unit Cost - to meet demand
growth (PV$/PVkL)$0.37
Unit Cost (other)
Sustainability
Energy use (MWh/a) GHG emission/reduction (t/a)
Environmental Impact Social Impact
Additional Notes
Option Code SEQ - S5
Project involves construction of a weir on the Logan River to supply 8.2ML/day (equivalent 2993ML/a) and construction of associated infrastructure including a fishway, outlet works and bank protection measures.
Project is currently in pre-construction phase and still requires approvals.
Total cost anticipated to be $15 million.
Target completion date is December 2007.
Reference: QWC 2006
Notes
Yield from QWC 2006 same as prudent yield from NRW 2006.
References
QWC (2006) Water Supply Emergency Projects Monthly Progress Reports October 2006.
NRW (2006) Water for South East Queensland: A Long Term Solution.
Assumptions
Water assumed to be available 2008 as construction scheduled to be completed December 2007.
Project involves construction of a weir on the Logan River to supply 8.2 ML/day (equivalent 2,993 ML/a) and construction of associated infrastructure including a fishway, outlet works and bank protection measures.
Project is currently in pre-construction phase and still requires approvals.
Total cost anticipated to be $15 million.
Target completion date is December 2007.
Reference: QWC 2006
Notes
Yield from QWC 2006 same as prudent yield from NRW 2006.
References
QWC (2006) Water Supply Emergency Projects Monthly Progress Reports October 2006.
NRW (2006) Water for South East Queensland: A Long Term Solution.
Assumptions
Water assumed to be available 2008 as construction scheduled to be completed December 2007.

Institute for Sustainable Futures, UTS and Cardno February 2007
Review of Water Supply-Demand Options for South East Qld Appendix A
Project summary
Option Name Wyaralong Dam
Supply or Demand Supply
Description
Model inputs
Years (s) Component Capex ($) Opex ($/a) Replacement Costs ($)
Land resumption
Access road construction
Relocation of existing roads
2009-2011 Construction of dam
Total 500,000,000
Yield (ML/a) Uncertainty Energy use (MWh/ML)
post-2012 18,000
Notes/references/
assumptions
Model outputs
PV Total Cost ($) $382,029,878PV Total Water Saved or
Supplied (ML)171,096
Unit Cost - full capacity
(PV$/PVkL)$2.23
Unit Cost - to meet demand
growth (PV$/PVkL)$2.30
Unit Cost (other)
Sustainability
Energy use (MWh/a) GHG emission/reduction (t/a)
Environmental Impact Social Impact
Additional Notes
SEQ - S6Option Code
Design and construction of W yaralong Dam including:
- E nvironmental approvals and pre-construction approvals
- P urchase of necessary land
- Construction of access road to the dam construction area
- Relocation of 12km of the road between B eaudesert and B oonah
- P rocurement of design and construction contractors
- Design and construction of the dam
Dam scheduled to be completed by 31 December 2011.
Reference: QW C 2006
No tes
Y ield noted here is prudent yield from NRW 2006 as QW C report does not indicate anticipated yield.
Referen ces
QW C (2006) W ater S upply E mergency P rojects Monthly P rogress Reports October 2006.
NRW (2006) W ater for S outh E ast Queensland: A Long T erm S olution.
Assu mp tio n s
W ater assumed to be available 2012 as construction completed end December 2011.
Design and construction of Wyaralong Dam including:
- Environmental approvals and pre-construction approvals
- Purchase of necessary land
- Construction of access road to the dam construction area
- Relocation of 12 km of the road between Beaudesert and Boonah
- Procurement of design and construction contractors
- Design and construction of the dam
Dam scheduled to be completed by 31 December 2011.
Reference: QWC 2006
Notes
Yield noted here is prudent yield from NRW 2006 as QWC report does not indicate anticipated yield.
References
QWC (2006) Water Supply Emergency Projects Monthly Progress Reports October 2006.
NRW (2006) Water for South East Queensland: A Long Term Solution.
Assumptions
Water assumed to be available 2012 as construction completed end December 2011.

Institute for Sustainable Futures, UTS and Cardno February 2007
Review of Water Supply-Demand Options for South East Qld Appendix A
Project summary
Option Name Bromelton Offstream Storage
Supply or Demand Supply
Description
Model inputs
Years (s) Component Capex ($) Opex ($/a) Replacement Costs ($)
2006-2011 38,000,000
Yield (ML/a) Uncertainty Energy use (MWh/ML)
2012 5,000
Notes/references/
assumptions
Model outputs
PV Total Cost ($) $31,161,501PV Total Water Saved or
Supplied (ML)47,527
Unit Cost - full capacity
(PV$/PVkL)$0.66
Unit Cost - to meet demand
growth (PV$/PVkL)$0.66
Unit Cost (other)
Sustainability
Energy use (MWh/a) GHG emission/reduction (t/a)
Environmental Impact Social Impact
Additional Notes
Option Code SEQ - S7
Notes
References
QWC (2006) Water Supply Emergency Projects Monthly Progress Reports October 2006.
NRW (2006) Water for South East Queensland: A Long Term Solution.
Assumptions
Project involves the investigation, site selection, design and development of an off-stream storage facility in the vicinity of Bromelton to supply 13.7ML/day (equivalent 5000ML/a) additional water. Project is currently at concept development stage.
Target completion date is 2011.
Reference: QWC 2006
Notes
References
QWC (2006) Water Supply Emergency Projects Monthly Progress Reports October 2006.
NRW (2006) Water for South East Queensland: A Long Term Solution.
Assumptions
Notes
References
QWC (2006) Water Supply Emergency Projects Monthly Progress Reports October 2006.
NRW (2006) Water for South East Queensland: A Long Term Solution.
Assumptions
Project involves the investigation, site selection, design and development of an off-stream storage facility in the vicinity of Bromelton to
supply 13.7 ML/day (equivalent 5,000 ML/a) additional water. Project is currently at concept development stage. Target completion date
is 2011.
Reference: QWC 2006
Notes
References
QWC (2006) Water Supply Emergency Projects Monthly Progress Reports October 2006.
NRW (2006) Water for South East Queensland: A Long Term Solution.
Assumptions

Institute for Sustainable Futures, UTS and Cardno February 2007
Review of Water Supply-Demand Options for South East Qld Appendix A
Project summary
Option Name Traveston Crossing Dam - Stage 1
Supply or Demand Supply
Description
Model inputs
Years (s) Component Capex ($) Opex ($/a) Replacement Costs ($)
2008 to 2012Dam construction (incl. roads and
land resumption)1,700,000,000
2012Delivery System (incl. pipeline connection)
893,000,000
Post 2012 37,300,000
Post 2012
Total
Yield (ML/a) Uncertainty Energy use (MWh/ML)
Post 2012 70,000 medium 1.96
Notes/references/ assumptions
Model outputs
PV Total Cost ($) $2,248,493,782PV Total Water Saved or
Supplied (ML)665,373
Unit Cost - full capacity
(PV$/PVkL)$3.38
Unit Cost - to meet demand
growth (PV$/PVkL)4.10
Unit Cost (other)
Sustainability
Energy use (MWh/a) 137,480 GHG emission/reduction (t/a) 143,804
Environmental Impact Social Impact
Additional Notes
Option Code SEQ - S8
Notes
References
QWC (2006) Water Supply Emergency Projects Monthly Progress Reports October 2006.
NRW (2006) Water for South East Queensland: A Long Term Solution.
Assumptions
Design and Construction of Traveston Crossing Dam (Stage 1), including:
• Environmental and preconstruction approvals
• Purchase of all necessary land for the project
• Construction of access road to the dam construction area
• Relocation of 37.3km of local roads
• Procurement of design and construction contractors
• Design and construction of Traveston Crossing Dam (Stage 1) ( height - ??? )
• Pipeline connections (???)
Notes
Yield increases gradually over 5 years from 2012 as dam fills
Replacement costs for pumps every 15 years
References
QWC (2006) Water Supply Emergency Projects Monthly Progress Reports October 2006.
NRW (2006) Water for South East Queensland: A Long Term Solution.
KBR (2006)
Assumptions
Notes
ReferencesQWC (2006) Water Supply Emergency Projects Monthly Progress Reports October 2006.
NRW (2006) Water for South East Queensland: A Long Term Solution.Assumptions
Opex and energy use - Carndo preliminary estimates.Delivery system (incl. pipeline connection) - Cardno preliminary estimates
Design and Construction of Traveston Crossing Dam (Stage 1), including:
• Environmental and preconstruction approvals • Purchase of all necessary land for the project
• Construction of access road to the dam construction area • Relocation of 37.3km of local roads
• Procurement of design and construction contractors • Design and construction of Traveston Crossing Dam (Stage 1) (FSL 71 metres, 180,000 ML capacity) • Delivery System (pipeline, Pump Stations, Balancing Storages) for delivery to North Brisbane area,

Institute for Sustainable Futures, UTS and Cardno February 2007
Review of Water Supply-Demand Options for South East Qld Appendix A
Project summary
Raise Traveston Stage 2 (Raise Borumba)
Supply or Demand Supply
Description
Model inputs
Years (s) Component Capex ($) Opex ($/a) Replacement Costs ($)
Construction and commissioning 250,000,000
Yield (ML/a) Uncertainty Energy use (MWh/ML)
2025 40,000 1.32
Notes/references/
assumptions
Model outputs
PV Total Cost ($) $69,127,083PV Total Water Saved or
Supplied (ML)141,857
Unit Cost - full capacity
(PV$/PVkL)0.49
Unit Cost - to meet demand
growth (PV$/PVkL)0.49
Unit Cost (other)
Sustainability
Energy use (MWh/a) 52,920 GHG emission/reduction (t/a) 55,354
Environmental Impact Social Impact
Additional Notes
Option Code SEQ - S9
Raise Borumba Dam to increase water supplies from the Traveston dam system. Total new capacity of 350,000 ML. Estimated new
40,000 ML/a water in 2025.
Notes
This project is not committed. The decision has been deferred.
References
NRW (2006) Water for South East Queensland: A Long Term Solution.
Assumptions

Institute for Sustainable Futures, UTS and Cardno February 2007
Review of Water Supply-Demand Options for South East Qld Appendix A
Project summary
Option Name Traveston Crossing Dam - Stage 3 Option Code No. SEQ - S10
Supply or Demand Supply Option Status Not Committed
Description
Model inputs
Years (s) Component Capex ($) Opex ($/a) Replacement Costs ($)
2042Stage 3 of Dam (additional cost over
Stage 1)600,000,000
2042 Delivery System 684,500,000
17,400,000
Yield (ML/a) Uncertainty Energy use (MWh/ML)
Post 2042 40,000 medium 1.323
Notes/references/
assumptions
Model outputs
PV Total Cost ($) $122,362,755PV Total Water Saved or
Supplied (ML)26,314
Unit Cost - full
capacity (PV$/PVkL)$4.65
Unit Cost - to meet
demand growth
(PV$/PVkL)
$5.71
Unit Cost (other)
Sustainability
Energy use (MWh/a) 52,920GHG
emission/reduction (t/a)55,354
Environmental
ImpactSocial Impact
Additional Notes
Stage 3 represents the third component of the Traveston Crossing scheme with the Raising of Borumba representing Stage
2.
Design and Construction of Traveston Crossing Dam (Stage 3), including:
• Environmental and preconstruction approvals
• Purchase of all necessary additional land for the project
• Relocation of roads affected by Stage 3
• Spillway modifications etc necessary for increased capacity to 660,000 ML (Stage 3) (FSL 79.5 metres)
• Delivery System (pipeline, Pump Stations, Balancing Storages) for delivery to North Brisbane area,
Notes
Assumes construction of Stage 1 is completed.
References
Capex for Stage 2 of dam from Table 13 of "Water for SE Qld - A Long Term Solution".
Capex for delivery system (which includes pipeline, pump stations, balancing storages and treatment plants for delivery to
Northern Brisbane) - Cardno Preliminary Estimates
Opex and Energy Use - Cardno Preliminary Estimates
Assumptions
Preliminary estimates of costs of delivery system have been made as there are no estimates available for costs of the
northern pipeline connectors.

Institute for Sustainable Futures, UTS and Cardno February 2007
Review of Water Supply-Demand Options for South East Qld Appendix A
Project summary
Option Name Raising of Mount Crosby Weir
Supply or Demand Supply
Description
Model inputs
Years (s) Component Capex ($) Opex ($/a) Replacement Costs ($)
2006-2008 73,300,000
Yield (ML/a) Uncertainty Energy use (MWh/ML)
2009 5,000
Notes/references/
assumptions
Model outputs
PV Total Cost ($) $66,263,866PV Total Water Saved or
Supplied (ML)58,988
Unit Cost - full capacity
(PV$/PVkL)$1.12
Unit Cost - to meet demand
growth (PV$/PVkL)$1.12
Unit Cost (other)
Sustainability
Energy use (MWh/a) GHG emission/reduction (t/a)
Environmental Impact Social Impact
Additional Notes
Option Code SEQ - S11
Raise Mount Crosby Weir (situated on the Brisbane River downstream of Wivenhoe Dam) to supply an additional 15ML/day (equivalent to 5475GL/a). Construction due to be completed 31 December 2008.
Reference: QWC 2006
Notes
QWC 2006 information only reports on feasibility study. Forecast final cost is $225,000 for studies. Other information including costs, yield and timing is sourced from NRW 2006.
Notes that three separate dam heights and associated costs are estimated by NRW. $73.3 million is cost for raising by 5.3m. Other options are raising by 2m or by 4m which have respective costs of $50.6 million and $64 million. All three options are
estimated to have yield of "up to 5000ML/a". Should we take the higher or lower option??
References
QWC (2006) Water Supply Emergency Projects Monthly Progress Reports October 2006.
NRW (2006) Water for South East Queensland: A Long Term Solution.
Assumptions
Water assumed to be available 2009 as construction completed end December 2008.
Raise Mount Crosby Weir (situated on the Brisbane River downstream of Wivenhoe Dam) to supply an additional 15 ML/day (equivalent
to 5,475 ML/a). Construction due to be completed 31 December 2008.
Reference: QWC 2006
Notes
QWC 2006 information only reports on feasibility study. Forecast final cost is $225,000 for studies. Other information including costs, yield and timing is sourced from NRW 2006.
Notes that three separate dam heights and associated costs are estimated by NRW. $73.3 million is cost for raising by 5.3m. Other
options are raising by 2m or by 4m which have respective costs of $50.6 million and $64 million. All three options are estimated to have yield of "up to 5,000ML/a".
References
QWC (2006) Water Supply Emergency Projects Monthly Progress Reports October 2006.NRW (2006) Water for South East Queensland: A Long Term Solution.
AssumptionsWater assumed to be available 2009 as construction completed end December 2008.

Institute for Sustainable Futures, UTS and Cardno February 2007
Review of Water Supply-Demand Options for South East Qld Appendix A
Project summary
Option NameSouth East Queensland (Gold Coast)
Desalination Facility
Supply or Demand Supply
Description
Model inputs
Years (s) Component Capex ($) Opex ($/a) Replacement Costs ($)
2006
Site preparation including relocation
of landfill refuse and placement of
engineered fill
2007-2008Design and construct desalination
plant
2007-2008Design and construct associated
infrastructure
2008Performance trials (operating at
33%)
2009 Production at 100% capacity
Total 1,126,000,000 49,800,000
Yield (ML/a) Uncertainty Energy use (MWh/ML)
2008 15,056
2009 45,625
Notes/references/
assumptions
Model outputs
PV Total Cost ($) $1,662,548,264PV Total Water Saved or
Supplied (ML)551,412
Unit Cost - full capacity
(PV$/PVkL)$3.02
Unit Cost - to meet demand
growth (PV$/PVkL)3.26
Unit Cost (other)
Sustainability
Energy use (MWh/a) GHG emission/reduction (t/a)
Environmental Impact Social Impact
Additional Notes
Option Code SEQ - S12
Construction of a reverse osmosis desalination plant at Tugun on the Gold Coast to deliver 125ML/day (equivalent to 45,625ML/a). The project requires construction of a pipeline network to connect the desalination plant to the existing water grid.
Reference: QWC 2006
Notes
Asset renewal and replacement for Operation and Maintenance Term of 10 years is planned (with 5 year option).
Yield is cumulative
References
QWC (2006) Water Supply Emergency Projects Monthly Progress Reports October 2006.
Assumptions
Construction of a reverse osmosis desalination plant at Tugun on the Gold Coast to deliver 125 ML/day (equivalent to 45,625 ML/a). The
project requires construction of a pipeline network to connect the desalination plant to the existing water grid.
Reference: QWC 2006
Notes
Asset renewal and replacement for Operation and Maintenance Term of 10 years is planned (with 5 year option).
Yield is cumulative.
References
QWC (2006) Water Supply Emergency Projects Monthly Progress Reports October 2006.
Assumptions
Opex is assumed to be the same as the Cardno opex estimate for the study team proposed Bribie 125 ML/day desalination plant.

Institute for Sustainable Futures, UTS and Cardno February 2007
Review of Water Supply-Demand Options for South East Qld Appendix A
Project summary
Option NameWestern Corridor Recycled Water
Scheme
Supply or Demand Supply
Description
Model inputs
Years (s) Component Capex ($) Opex ($/a) Replacement Costs ($)
2007 Stage 1A Water to Swanbank
2008 Stage 1B Water to Tarong
Total 1,700,000,000 25,020,000
Yield (ML/a) Uncertainty Energy use (MWh/ML)
2007 7,300
2008 36,500
Notes/references/
assumptions
Model outputs
PV Total Cost ($) $1,537,277,932PV Total Water Saved or
Supplied (ML)469,312
Unit Cost - full capacity
(PV$/PVkL)$3.28
Unit Cost - to meet demand
growth (PV$/PVkL)$3.59
Unit Cost (other)
Sustainability
Energy use (MWh/a) GHG emission/reduction (t/a)
Environmental Impact Social Impact
Additional Notes
Option Code SEQ - S13
Source substitution measure to reduce demands on the Somerset-Wivenhoe dam system. Main aim is to supply power stations with recycled water instead of raw drinking water from dams. (NRW 2006).
Project will eventually yield 210 ML/day (equivalent to 76,650 ML/a) with Stage 1A yielding 20 ML/day, Stage 1B 75 ML/day and Stage 2
115 ML/day.
Project involves:
Stage 1A
- Advanced Water Treatment Plant at Bundamba- 800mm diameter pipeline from Budamba to Swanbank
Stage 1B
- 1086mm diameter effluent pipleine from Oxley, Wacol and Goodna WWTPs
- 1500mm diameter pipeline from Bundamba to Lowood
- 1000mm diameter pipeline from Lowood to Caboonah
Stage 2
- Advanced WWTPs at Luggage Point and Gibson Island
- 1086mm diameter effluent pipeline from Luggage Point to Bundamba
Reference: QWC 2006
Notes
Y ield is cumulative.
References
QWC (2006) Water S upply E mergency P rojects Monthly P rogress Reports October 2006.
NRW (2006) Water for S outh E ast Queensland: A Long Term S olution.
Assumptions
Notes
Yield is cumulative.
References
QWC (2006) Water Supply Emergency Projects Monthly Progress Reports October 2006.
NRW (2006) Water for South East Queensland: A Long Term Solution.
Assumptions

Institute for Sustainable Futures, UTS and Cardno February 2007
Review of Water Supply-Demand Options for South East Qld Appendix A
Project summary
Option Name Eastern Pipeline Interconnector
Supply or Demand Supply
Description
Model inputs
Years (s) Component Capex ($) Opex ($/a) Replacement Costs ($)
2006-2007 Borefield investigations
2007-2008 Borefield construction
2007-2008Pipeline construction from borefield to WTP
2007-2008 Heinemann Reservoir construction
2007-2008Pipeline construction from Heinemann to Kimberley Park
2007-2008 Construction of booster pump station
Total 34,200,000
Yield (ML/a) Uncertainty Energy use (MWh/ML)
2009 8,030
Notes/references/ assumptions
Model outputs
PV Total Cost ($) $29,871,605PV Total Water Saved or
Supplied (ML)94,734
Unit Cost - full capacity (PV$/PVkL)
$0.32Unit Cost - to meet demand
growth (PV$/PVkL)0.32
Unit Cost (other)
Sustainability
Energy use (MWh/a) GHG emission/reduction (t/a)
Environmental Impact Social Impact
Additional Notes
Option Code SEQ - S14
Construction of new central borefield in Dunwich and pipeline to enable transfer of water between reservoirs. Additional supplies amount to 22ML/day (equivalent 8030ML/a). Project scheduled for completion 31 December 2008.
Project involves:
- Construction of a 600mm pipeline from the borefield to the NSI Water Treatment Plant
- Modify the NSI WTP
- Construction of a new 20ML Reservoir at Heinemann Road Reservoir Complex
- Construction of a 600mm pipeline between Heinemann Rd Reservoirs and Kimberley Park Reservoir
- Construction of a 305L/s booster pump station at Mt Cotton
Reference: QWC 2006
Notes
Budget is preliminary
References
QWC (2006) Water Supply Emergency Projects Monthly Progress Reports October 2006.
NRW (2006) Water for South East Queensland: A Long Term Solution.
Assumptions
Water assumed to be available 2009 as construction completed end December 2008.
Construction of new central borefield in Dunwich and pipeline to enable transfer of water between reservoirs. Additional supplies amount to 22 ML/day (equivalent 8,030 ML/a). Project scheduled for completion 31 December 2008.
Project involves:- Construction of a 600mm pipeline from the borefield to the NSI Water Treatment Plant- Modify the NSI WTP- Construction of a new 20 ML Reservoir at Heinemann Road Reservoir Complex- Construction of a 600mm pipeline between Heinemann Rd Reservoirs and Kimberley Park Reservoir- Construction of a 305 L/s booster pump station at Mt Cotton
Reference: QWC 2006
NotesBudget is preliminary
References
QWC (2006) Water Supply Emergency Projects Monthly Progress Reports October 2006.NRW (2006) Water for South East Queensland: A Long Term Solution.
AssumptionsWater assumed to be available 2009 as construction completed end December 2008.

Institute for Sustainable Futures, UTS and Cardno February 2007
Review of Water Supply-Demand Options for South East Qld Appendix A
Project summary
Option Name Southern Regional Water Pipeline
Supply or Demand Transfer
Description
Model inputs
Years (s) Component Capex ($) Opex ($/a) Replacement Costs ($)
2006-2007
Pipe from Bundumba to Swanbank
(includes WCRWS Stage 1A
pipeline)
2008Pipe from Cameron's Hill to
Helensvale
2008Pipe from Cameron's Hill to
Molendinar
Total 600,000,000
Yield (ML/a) Uncertainty Energy use (MWh/ML)
0
Notes/references/
assumptions
Model outputs
PV Total Cost ($) $524,063,237PV Total Water Saved or
Supplied (ML)
Unit Cost - full capacity
(PV$/PVkL)
Unit Cost - to meet demand
growth (PV$/PVkL)
Unit Cost (other)
Sustainability
Energy use (MWh/a) GHG emission/reduction (t/a)
Environmental Impact Social Impact
Additional Notes
Option Code SEQ - T1
B i-directional pipeline connecting water supply networks of B risbane and the Gold Coast with a reverse flow drought contingency capacity to transfer 130ML/day to or from the Gold Coast to supply B risbane, Ipswich, B eaudesert, Logan and Gold
Coast City Councils.
P roject includes:
- A bout 100km pipeline
- 5 pumping stations
- 3 reservoir/balance tank facilities
- 11 offtakes
Reference: QW C 2006
No tes
T otal of $600 million a low end estimate (QW C report states cost "more than $600 million")
Referen ces
QW C (2006) W ater S upply E mergency P rojects Monthly P rogress Reports October 2006.
NRW (2006) W ater for S outh E ast Queensland: A Long T erm S olution.
Assu mp tio n s
Bi-directional pipeline connecting water supply networks of Brisbane and the Gold Coast with a reverse flow drought contingency
capacity to transfer 130 ML/day to or from the Gold Coast to supply Brisbane, Ipswich, Beaudesert, Logan and Gold Coast City Councils.
Project includes:
- About 100 km pipeline
- 5 pumping stations
- 3 reservoir/balance tank facilities
- 11 offtakes
Reference: QWC 2006
Notes
Total of $600 million a low end estimate (QWC report states cost "more than $600 million")
References
QWC (2006) Water Supply Emergency Projects Monthly Progress Reports October 2006.
NRW (2006) Water for South East Queensland: A Long Term Solution.
Assumptions

Institute for Sustainable Futures, UTS and Cardno February 2007
Review of Water Supply-Demand Options for South East Qld Appendix A
Project summary
Option Name Northern Pipeline Interconnector
Supply or Demand Transfer
Description
Model inputs
Years (s) Component Capex ($) Opex ($/a) Replacement Costs ($)
2006-2008 Construction of northern pipeline
2006-2008Construction of pipeline linking
Noosa and Maroochy
2006-2008 Construction of WTP
Yield (ML/a) Uncertainty Energy use (MWh/ML)
0
Notes/references/
assumptions
Model outputs
PV Total Cost ($)PV Total Water Saved or
Supplied (ML)
Unit Cost - full capacity
(PV$/PVkL)
Unit Cost - to meet demand
growth (PV$/PVkL)
Unit Cost (other)
Sustainability
Energy use (MWh/a) GHG emission/reduction (t/a)
Environmental Impact Social Impact
Additional Notes
Option Code SEQ - T2
Notes
References
QWC (2006) Water Supply Emergency Projects Monthly Progress Reports October 2006.
NRW (2006) Water for South East Queensland: A Long Term Solution.
Assumptions
Connection between AquaGen coastal mains (near Eudlo) to Caboolture and then to North Pine Dam.
Project includes
- Construction of Northern Inter-connector pipeline
- Pipeline linking Noosa and Maroochy water distribution systems
- New regional water treatment plant
- Capture of water from the Landsborough aquifer borefields
Project scheduled for completion 31 December 2008.
Reference: QWC 2006
Notes
Does capture of water from borefields imply there is additional water from this project (rather than just transfer of water)?
Total cost under development. Committed funds to date $325,000.
References
QWC (2006) Water Supply Emergency Projects Monthly Progress Reports October 2006.
NRW (2006) Water for South East Queensland: A Long Term Solution.
Assumptions
Notes
References
QWC (2006) Water Supply Emergency Projects Monthly Progress Reports October 2006.
NRW (2006) Water for South East Queensland: A Long Term Solution.
Assumptions
Connection between AquaGen coastal mains (near Eudlo) to Caboolture and then to North Pine Dam.Project includes
- Construction of Northern Interconnector pipeline
- Pipeline linking Noosa and Maroochy water distribution systems- New regional water treatment plant
- Capture of water from the Landsborough aquifer borefields
Project scheduled for completion 31 December 2008.
Reference: QWC 2006
Notes
Total cost under development. Committed funds to date $325,000.
ReferencesQWC (2006) Water Supply Emergency Projects Monthly Progress Reports October 2006.
NRW (2006) Water for South East Queensland: A Long Term Solution.
Assumptions

Institute for Sustainable Futures, UTS and Cardno February 2007
Review of Water Supply-Demand Options for South East Qld Appendix A
Project summary
Option NameAlternate Supply - Gold Coast supply
to Logan City Council
Supply or Demand Transfer
Description
Model inputs
Years (s) Component Capex ($) Opex ($/a) Replacement Costs ($)
2006-2007 Investigations
2006-2007 Construction
Total 15,500,000
Yield (ML/a) Uncertainty Energy use (MWh/ML)
0
Notes/references/
assumptions
Model outputs
PV Total Cost ($) $14,485,981PV Total Water Saved or
Supplied (ML)
Unit Cost - full capacity
(PV$/PVkL)
Unit Cost - to meet demand
growth (PV$/PVkL)
Unit Cost (other)
Sustainability
Energy use (MWh/a) GHG emission/reduction (t/a)
Environmental Impact Social Impact
Additional Notes
Option Code SEQ - T3
Transfer of water from Molendinar WTP to Logan City to reduce pressure on Wivenhoe by 20ML/day (equivalent 7.3GL/a). Project completion date June 2007 however stages from approvals and investigations to construction have not yet been
allocated times.
Notes
No new water but reduces pressure on Wivenhoe supplies.
References
QWC (2006) Water Supply Emergency Projects Monthly Progress Reports October 2006.
NRW (2006) Water for South East Queensland: A Long Term Solution.
Assumptions
Transfer of water from Molendinar WTP to Logan City to reduce pressure on Wivenhoe by 20 ML/day (equivalent 7.3 GL/a). Project completion date June 2007 however stages from approvals and investigations to construction have not yet been allocated times.
Notes
No new water but reduces pressure on Wivenhoe supplies.
References
QWC (2006) Water Supply Emergency Projects Monthly Progress Reports October 2006.NRW (2006) Water for South East Queensland: A Long Term Solution.
Assumptions

Institute for Sustainable Futures, UTS and Cardno February 2007
Review of Water Supply-Demand Options for South East Qld – Final Report 79
APPENDIX B – NEW STUDY TEAM PROPOSED OPTIONS - FACT SHEETS

Institute for Sustainable Futures, UTS and Cardno February 2007
Review of Water Supply-Demand Options for South East Qld Appendix B
Project summary
Option Name Domestic Retrofit Extension
Supply or Demand Demand
Description
Model inputs
Years (s) Component Capex ($) Opex ($/a) Replacement Costs ($)
2007 - 2021 Initial cost of program 5,714,285
2007 - 2021 Marketing and Administration 1,000,000
Yield (ML/a) Uncertainty Energy use (MWh/ML)
2021 14,000
Notes/references/
assumptions
Model outputs
PV Total Cost ($) $58,719,565PV Total Water Saved or
Supplied (ML)124,158
Unit Cost - full capacity
(PV$/PVkL)$0.47
Unit Cost - to meet demand
growth (PV$/PVkL)0.47
Unit Cost (other)
Sustainability
Energy use (MWh/a) -401530 GHG emission/reduction (t/a) -420,000
Environmental Impact Social Impact
Additional Notes
Option Code Study proposed-D1
E xtension of retrofit program from committed 130,000 (planned 150,000) to 450,000 domestic premises.
Notes
References
Assumptions
Retrofit program (extension) - Extension of the current retrofit program on existing households to 75% of remaining existing households,
over a long period and based on the turnover (sales) of housing stock. To achieve this high level of uptake regulations would be used to
ensure that at ‘point of sale’ all existing households need to be certified that they have undertaken a retrofit. It is assumed that the majority of the cost of this service would be provided by government or the water service provider, therefore providing a minimum
financial barrier to the house owner and reducing community resistance to the scheme. This option assumes a saving of 21
kL/household/annum (Turner et al, 2005).
Assumptions
Yield Calculations:
Program has a water saving of approximately21 kL/hh/a
Exsiting hh = 1,095,923 (2006)
75 % retrofitted = 0.75 * 21/1000 * 1,095,923 = 17,260 ML
Initial program achieves 2,689 ML/a, therefore extension = 17,260 - 2,689 ~ 14,000 ML/a Cost Calculations:
Govt = $100 /hh
Customer = $20 /hh
14,000 ML/a / 0.021 ML/hh *$120/hh over approximately14 years = $5.7 m/a
Operating costs (marketing and administration) an additional $1 m/a
Assumed greenhouse gas emission : -30,000 kg/ML

Institute for Sustainable Futures, UTS and Cardno February 2007
Review of Water Supply-Demand Options for South East Qld Appendix B
Project summary
Option NameExtension of Raintank Rebate
Program
Supply or Demand Demand
Description
Model inputs
Years (s) Component Capex ($) Opex ($) Replacement Costs ($)
2007 - 2021 Initial costs (per household) 2,350 75
2007 - 2021 Marketing and Administration (per year) 1,000,000
Yield (ML/a) Uncertainty Energy use (MWh/ML)
17,500
Notes/references/
assumptions
Model outputs
PV Total Cost ($) $615,425,321PV Total Water Saved or
Supplied (ML)155,198
Unit Cost - full capacity
(PV$/PVkL)$3.97
Unit Cost - to meet demand
growth (PV$/PVkL)3.97
Unit Cost (other)
Sustainability
Energy use (MWh/a) 16,730 GHG emission/reduction (t/a) 17,500
Environmental Impact Social Impact
Additional Notes
Option Code Study proposed-D2
Notes
References
Assumptions
Rainwater tank (extension) – Extension of the rainwater tank program for existing households. This program would require connection of
the tank to outdoor and selected indoor end uses to optimise the rainwater tank savings. In some locations in (for example) Brisbane
there are localised constraints experienced by the stormwater system or peak water supply. Rainwater tanks in such areas could reduce
costs associated with upgrading stormwater or water reticulation systems (Turner et al, 2003). This is very area-specific and requires
further research, but it can be assumed that such opportunities will reduce the unit cost of rainwater tank retrofits which would otherwise
be high. It is assumed that a high uptake could be achieved in this option if it were linked to regulations that affect specific zones that
would benefit from avoided stormwater infrastructure upgrading and mains upgrading associated with fire fighting. Savings of 70
kL/household/a have been assumed (Coombes & Kuczera, 2003).
Notes
Aim: Achieve an additional 25% of houses (i.e. 250,000) using a "point of sale" mechnism when houses are bought and sold, mandatory
for some areas (flood prone areas to counter stormwater issues) and voluntary in others.
Costs
Customer $1,350
Government $1,000 (Coombes. Spinks, Evans & Dunstan 2004, Performance of rawater tanks at an inner city house in carrington NSW
during a drought)
Operational Costs $75 /hh/a (Gardener, T., et al. 2001) ; Marketing and Administration = $1 M/a
18,000 hh per year over 14 years (2007 - 2020)
Water saving: 70 kL/hh/a (Coombes & Kuczera 2003, Analysis of the performance of rainwater tanks in Australian Cities)
Net greenhouse gas emission : 1,000 kg/ML

Institute for Sustainable Futures, UTS and Cardno February 2007
Review of Water Supply-Demand Options for South East Qld Appendix B
Project summary
Option Name MWEPS
Supply or Demand Demand
Description
Model inputs
Years (s) Component Capex ($) Opex ($/a) Replacement Costs ($)
2007 - 2009 Administration 100,000
2009 - 2014 Marketing 500,000
Yield Uncertainty Energy use (MWh/ML)
2010 - 2051 (ML/a) 25,920
2010 - 2051 (kL/new hh) 24
Notes/references/
assumptions
Model outputs
PV Total Cost ($) $2,344,072PV Total Water Saved or
Supplied (ML)323,964
Unit Cost - full capacity
(PV$/PVkL)$0.01
Unit Cost - to meet demand
growth (PV$/PVkL)0.01
Unit Cost (other)
Sustainability
Energy use (MWh/a) -371702 GHG emission/reduction (t/a) -388,800
Environmental Impact Social Impact
Additional Notes
Option Code Study proposed-D3
Notes
References
QWC (2006) Water Supply Emergency Projects Monthly Progress Reports October 2006.
NRW (2006) Water for South East Queensland: A Long Term Solution.
Assumptions
Mandatory Water Efficiency Performance Standards (MWEPS) – This option assumes savings in existing and new households by introducing minimum efficiency standards on appliances such as washing machines, showers and toilets. To minimise double counting
only savings associated with washing machines have been assumed, a saving of 24 kL/household/annum (Spaninks, 2006). An
additional benefit of this option would be to assist in locking in the savings associated with other programs such as the retrofit program though mandatory efficiency standards on showerheads and taps.
Notes
References
Savings of 24 kL/hh/a based on pers com Frank Spaninks SWC, 2006.
Assumptions
All new households save 24 kL/a (on washing machines) beginning in 2010. Existing households have a saving of 25.92 GL/a
(approximately 90% of 1.2 million houses) achieved over a number of years as washing machines need to be replaced also beginning in
2010. Assumed that estimated savings associated with washing machine rebates included in the currnet domestic rebate scheme have been excluded from this option.
Greenhouse gas emission: -15,000 kg/ML

Institute for Sustainable Futures, UTS and Cardno February 2007
Review of Water Supply-Demand Options for South East Qld Appendix B
Project summary
Option Name Outdoor Program
Supply or Demand Demand
Description
Model inputs
Years (s) Component Capex ($) Opex ($/a) Replacement Costs ($)
2007 - 2051 Marketing / Administration Personnel 1,000,000
2007 - 2051 Initial cost of tune Up (per hh) 130
Number of houses (80% of
existing)876738
Savings per house (kL/a) 20
Yield (ML/a) Uncertainty Energy use (MWh/ML)
By 2020 17,535
Notes/references/
assumptions
Model outputs
PV Total Cost ($) $124,668,416PV Total Water Saved or
Supplied (ML)176,327
Unit Cost - full capacity
(PV$/PVkL)$0.71
Unit Cost - to meet demand
growth (PV$/PVkL)$0.71
Unit Cost (other)
Sustainability
Energy use (MWh/a) -4190.91 GHG emission/reduction (t/a) -4,384
Environmental Impact Social Impact
Additional Notes
Option Code Study proposed-D4
Outdoor garden program – This option assumes an outdoor ‘tune up’ program involving an inspection, assessment, advice and hardware
support, would be implemented for existing households and could obtain 20% savings of the outdoor component of demand. Such a
program would be implemented in a similar way to the retrofit program. To ensure the high level of uptake and the maintenance of
savings the use of regulations would be used to ensure that at point of sale all households must undertake the outdoor garden program inspection and service.
Notes
Assumptions: $1,000,000 for administration of program
$20 per property for certification
$50 for outdoor water saving devices, e.g. soil moisture content recorder, tap timers, soil wetting agent crystals$60 for a garden audit to locate water saving potential
To maintain savngs over time it is assumed that households waould participate in the program several times over the 2050 planning
horizon as they are re-sold.
20% of existing outdoor component is savedNet greenhouse gas emission = -250 kg/ML
Number of households existing (2006) = 1,095,923. Outdoor component assumed to be approximately 100 kL/year
Savings by 2020 = 20% x 80% of existing houses x 100 kL/1000 = 17,535 ML/a

Institute for Sustainable Futures, UTS and Cardno February 2007
Review of Water Supply-Demand Options for South East Qld Appendix B
Project summary
Option Name Smart Growth
Supply or Demand Demand
Description
Model inputs
Years (s) Component Capex ($) Opex ($/a) Replacement Costs ($)
2020 - 2051 (marginal cost per lot) 1,600 200
Yield (ML/a) Uncertainty Energy use (MWh/ML)
Average saving per year 26,357
Saving (%) 80%
Notes/references/ assumptions
Model outputs
PV Total Cost ($) $1,075,819,328PV Total Water Saved or
Supplied (ML)213,996
Unit Cost - full capacity
(PV$/PVkL)$1.85
Unit Cost - to meet demand
growth (PV$/PVkL)$1.85
Unit Cost (other)
Sustainability
Energy use (MWh/a) GHG emission/reduction (t/a)
Environmental Impact Social Impact
Additional Notes
Option Code Study proposed-D5
Smart growth (new) – Significant savings are already being assumed as part of the SEQ requirements for new developments. However, the practical experience in, for example, Pimpama-Coomera on the Gold Coast, and proposed requirements in Caloundra has gone
much further, assuming an 80% reduction in demand compared to current household use. This is achieved through ultra-high efficiency
fixtures and appliances, maximising the capture of rainwater on site, and maximising the reuse of treated effluent. Costs are reduced
through integration of the water supply components and infrastructure and the use of ‘smart sewers’ and localised treatment to reduce water and effluent reticulation and transport costs. For modelling purposes the date for implementation of such a requirement for all new
developments has been deferred until 2020 and care has been taken not to double count with the existing SEQ demand-side initiatives.
This option is particularly powerful as it deals with the main driver for growth in demand – new developments.
Notes
References
Gold Coast Water and Gold Coast City Council (2004) Pimpama Coomera Waterfuture Master Plan 2004.
Assumptions
$1,600 /hh capital cost (Apostolidis, 2003, Integrated Water Management - Pushing the Boundaries, IPWEAQ 2003 State Conference, Mackay)
$200 /hh operating cost (ISF, 2005, CRC Best Practice Costing)
The program begins in 2020 with 100% of homes saving 80% of water use. Assume no net increase in GHG emission.

Institute for Sustainable Futures, UTS and Cardno February 2007
Review of Water Supply-Demand Options for South East Qld Appendix B
Project summary
Option Name BWEPS Extension
Supply or Demand Demand
Description
Model inputs
Years (s) Component Capex ($) Opex ($/a) Replacement Costs ($)
2009- 2018 7,198,531
Yield (ML/a) Uncertainty Energy use (MWh/ML)
8,870
Notes/references/
assumptions
Model outputs
PV Total Cost ($) $44,160,596PV Total Water Saved or
Supplied (ML)88,321
Unit Cost - full capacity
(PV$/PVkL)$0.50
Unit Cost - to meet demand
growth (PV$/PVkL)$0.50
Unit Cost (other)
Sustainability
Energy use (MWh/a) -5087.95 GHG emission/reduction (t/a) -5,322
Environmental Impact Social Impact
Additional Notes
Option Code Study proposed-D6
Non residential high water users (BWEPS – extension) - Extension of the high water users program to additional customers, assuming a
25% saving available. This option is rolled out over a longer period than the current program to increase the probability of adoption and
also assumes that sufficient incentives are provided to attract customers to implement the results of audit and assessment
recommendations.
Notes
Assumptions:
8,870 ML/a building up over 10 years
Typical unit cost of such a program including auditing and subsequent fitting of water saving devices according to agreed action plans
typically
$0.50 /kL
In the BWEPS program (existing and the extension) assume a 25%reduction in water use of 50% of the properties. This gives 12.5%,
water use reduction of the non residential sector in total (currently approximately 106,000 ML/a), of which 4,380 ML/a has already been
saved by the existing BWEPS program. Therefore this program saves 12.5%*106,000 ML/a - 4,380 = 8,870 ML/a
Consideration of this option with the existing reuse potential would also be required.
Net greenhouse emission: -600 kg/ML

Institute for Sustainable Futures, UTS and Cardno February 2007
Review of Water Supply-Demand Options for South East Qld Appendix B
Project summary
Option Name Non-Res New
Supply or Demand Demand
Description
Model inputs
Years (s) Component Capex ($) Opex ($/a) Replacement Costs ($)
2007 - 2051 Ramping up to this by 2051 17,389,870
Yield (ML/a) Uncertainty Energy use (MWh/ML)
Average total saving 34,780
Percentage saving 40%
Notes/references/
assumptions
Model outputs
PV Total Cost ($) $76,123,687PV Total Water Saved or
Supplied (ML)152,247
Unit Cost - full capacity
(PV$/PVkL)$0.50
Unit Cost - to meet demand
growth (PV$/PVkL)0.50
Unit Cost (other)
Sustainability
Energy use (MWh/a) -9814.22 GHG emission/reduction (t/a) -10,266
Environmental Impact Social Impact
Additional Notes
Option Code Study proposed-D7
Non residential users (non residential - smart growth) – This option assumes a 40% saving could be achieved in all new non residential
properties. This option would be supported by regulations (development consent conditions) to ensure uptake.
Notes
Assumptions:
40% of new non-residential water savings at approximately $ 0.50 /kL total resource cost made up of:
- 0.30 $/kL is administrative costs (from ISF 2005, Every Drop Counts Savings and Costs, Independent verification of savings
calculation methods) and,
- 0.20 $/kL estimated additional installation of hardware
Net greenhouse emission: -600 kg/ML

Institute for Sustainable Futures, UTS and Cardno February 2007
Review of Water Supply-Demand Options for South East Qld Appendix B
Project summary
Option Name Bribie Island 125 ML/day Desalination Plant Option Code No. SP - S1
Supply or Demand Supply Option Status Potential
Description
Model inputs
Years (s) Component Capex ($) Opex ($/a)Replacement Costs
($)Desalination Plant (incl intake and outlet
works)614,000,000
Delivery System 333,000,000
Total power, and O&M 49,800,000
Opex includes
membrane
Yield (ML/a) Uncertainty Energy use (MWh/ML)
45,600 Low 6.060
Notes/references/
assumptions
Model outputs
PV Total Cost ($) $1,104,391,229PV Total Water Saved
or Supplied (ML)433,443
Unit Cost - full
capacity (PV$/PVkL)$2.55
Unit Cost - to meet
demand growth
(PV$/PVkL)
$2.86
Unit Cost (other)
Sustainability
Energy use (MWh/a) 276,336
GHG
emission/reduction
(t/a)
289,047
Environmental Impact Social Impact
Additional Notes
Construction of a 125ML/day desalination plant on the middle to northern part of Bribie Island on the ocean side.
This appears to be a suitable location as the inlet and outlet works could be constructed in an area where there
would be good dispersion of the reject brine. Suitable State owned land appears to be available in this area. This
location appears preferable to other locations in the south-east corner of the state
Preliminary costs have been prepared for three plant sizes: 125 ML/day (45,600 ML/yr); 250 ML/day (91,200 Mlyr)
and 400 ML/day (146,000 ML/yr). The location appears to be suitable for plant sizes to 400 ML/day.
For the 125 ML/day, a delivery system has been assumed to as far as the Pine Rivers area. For the larger capacity
plants delivery has been assumed to as far as the north Brisbane area.
Includes:
- Desalination Plant including intake and outlet works
- Delivery system (pipeline and pump stations)
Notes
Desalination Plant costs are Cardno preliminary estimates, based on cost information for Tugun Plant, Kwinana
Plant, and approximate costs provided by suppliers. Suppliers costs are significantly lower than these costs. For
example desalination capex estimates provided by suppliers are around $1.5m/ML (excl inlet and outlet works) The
figure estimated by Cardno is $3.2m/ML (excl inlet and outlet works). The Tugun Plant (excl inlet and outlet works)
is $4.8m/ML. The Kwinana plant is around $3.0m/ML including auxiliary infrastructure. A major supplier of
desalination equipment has quoted $1.10/kL sale price for desalinated water.
- No environmental impacts known, although inlet and outlet works will need to traverse a narrow strip of national
park along Bribie Island foreshore
- Minor social impacts – some resumptions along pipeline route

Institute for Sustainable Futures, UTS and Cardno February 2007
Review of Water Supply-Demand Options for South East Qld Appendix B
Project summary
Option NameBribie Island 250 ML/day
Desalination Plant Option Code No. SP - S2
Supply or Demand Supply Option Status Potential
Description
Model inputs
Years (s) Component Capex ($) Opex ($/a) Replacement Costs ($)
Desalination Plant 1,090,000,000
Delivery System 553,000,000
Total power, and O&M 98,100,000
Opex includes membrane
replacements etc
Yield (ML/a) Uncertainty Energy use (MWh/ML)
91,250 Low 6.120
Notes/references/
assumptions
Model outputs
PV Total Cost ($) $2,027,272,573PV Total Water Saved or
Supplied (ML)867,361
Unit Cost - full
capacity (PV$/PVkL)$2.34
Unit Cost - to meet
demand growth
(PV$/PVkL)
$3.03
Unit Cost (other)
Sustainability
Energy use (MWh/a) 558,450GHG
emission/reduction (t/a)584,139
Environmental
ImpactSocial Impact
Additional Notes
Construction of a 250 ML/day desalination plant on on the middle to northern part of Bribie Island on the ocean side.
This appears to be a suitable location as the inlet and outlet works could be constructed in an area where there would
be good dispersion of the reject brine. Suitable State owned land appears to be available in this area. This location
appears preferable to other locations in the south-east corner of the state
Preliminary costs have been prepared for three plant sizes: 125 ML/day (45,600 ML/yr); 250 ML/day (91,200 Mlyr)
and 400 ML/day (146,000 ML/yr). The location appears to be suitable for plant sizes to 400 ML/day.
Construction of a desalination plant on Bribie Island with a capacity of 250 ML/day involves construction of a delivery
system to the Caboolture, Pine Rivers and North Brisbane Areas.
Includes:
- Desalination Plant including intake and outlet works
- Delivery system (pipeline and pump stations)
Notes
Desalination Plant costs are Cardno preliminary estimates, based on cost information for Tugun Plant, Kwinana Plant,
and approximate costs provided by suppliers. Suppliers costs are significantly lower than these costs. For example
desalination capex estimates provided by suppliers are around $1.5m/ML (excl inlet and outlet works) The figure
estimated by Cardno is $3.2m/ML (excl inlet and outlet works). The Tugun Plant (excl inlet and outlet works) is
$4.8m/ML. The Kwinana plant is around $3.0m/ML including auxiliary infrastructure. A major supplier of desalination
equipment has quoted $1.10/kL sale price for desalinated water.
References
Assumptions
- No environmental impacts known, although inlet and outlet works will need to traverse a narrow strip of national
park along Bribie Island foreshore
- Minor social impacts – some resumptions along pipeline route

Institute for Sustainable Futures, UTS and Cardno February 2007
Review of Water Supply-Demand Options for South East Qld Appendix B
Project summary
Option NameBribie Island 400 ML/day
Desalination Plant Option Code No. SP - S3
Supply or Demand Supply Option Status Potential
Description
Model inputs
Years (s) Component Capex ($) Opex ($/a) Replacement Costs ($)
Desalination Plant 1,470,000,000
Delivery System 713,600,000
Total power, and O&M 148,400,000
Opex includes membrane
replacements etc
Yield (ML/a) Uncertainty Energy use (MWh/ML)
146,000 Low 6.040
Notes/references/
assumptions
Model outputs
PV Total Cost ($) $2,865,614,984PV Total Water Saved or
Supplied (ML)1,387,777
Unit Cost - full
capacity (PV$/PVkL)$2.06
Unit Cost - to meet
demand growth
(PV$/PVkL)
$3.17
Unit Cost (other)
Sustainability
Energy use (MWh/a) 881,840GHG
emission/reduction (t/a)922,405
Environmental
ImpactSocial Impact
Additional Notes
Construction of a 400ML/day desalination plant on on the middle to northern part of Bribie Island on the ocean side.
This appears to be a suitable location as the inlet and outlet works would be could constructed in an area where there
would be good dispersion of the reject brine. Suitable State owned land appears to be available in this area. This
location appears preferable to other locations in the south-east corner of the state
Preliminary costs have been prepared for three plant sizes: 125 ML/day (45,600 ML/yr); 250 ML/day (91,200 Mlyr) and
400 ML/day (146,000 ML/yr). The location appears to be suitable for plant sizes to 400 ML/day.
Construction of a desalination plant on Bribie Island with a capacity of 400 ML/day involves construction of a delivery
system to the Caboolture, Pine Rivers and North Brisbane Areas.
Includes:
- Desalination Plant including intake and outlet works
- Delivery system (pipeline and pump stations)
Notes
Desalination Plant costs are Cardno preliminary estimates, based on cost information for Tugun Plant, Kwinana Plant,
and approximate costs provided by suppliers. Suppliers costs are significantly lower than these costs. For example
desalination capex estimates provided by suppliers are around $1.5m/ML (excl inlet and outlet works) The figure
estimated by Cardno is $3.2m/ML (excl inlet and outlet works). The Tugun Plant (excl inlet and outlet works) is
$4.8m/ML. The Kwinana plant is around $3.0m/ML including auxiliary infrastructure. A major supplier of desalination
equipment has quoted $1.10/kL sale price for desalinated water.
References
Assumptions
- No environmental impacts known, although inlet and outlet works will need to traverse a narrow strip of national park
along Bribie Island foreshore
- Minor social impacts – some resumptions along pipeline route

Institute for Sustainable Futures, UTS and Cardno February 2007
Review of Water Supply-Demand Options for South East Qld Appendix B
Project summary
Option Name Western Corridor IPR Option Code No. SP - S4
Supply or Demand Supply Option Status Potential
Description
Model inputs
Years (s) Component Capex ($) Opex ($/a) Replacement Costs ($)
2008 Scheme completion
Post 2008 27,800,000
Yield (ML/a) Uncertainty Energy use (MWh/ML)
Post 200840,000
Low, but depends on
outcome of plebiscite3.820
Notes/references/
assumptions
Model outputs
PV Total Cost ($) $352,252,192PV Total Water Saved or
Supplied (ML)542,316
Unit Cost - full
capacity (PV$/PVkL)$0.65
Unit Cost - to meet
demand growth
(PV$/PVkL)
$0.65
Unit Cost (other)
Sustainability
Energy use (MWh/a) 152,800GHG
emission/reduction (t/a)159,829
Environmental
ImpactSocial Impact
Additional Notes
This proposal is for recycled water supplied from the Western Corridor Recycled Water Supply Scheme that is not
committed for source substitution at Swanbank and Tarong Power Stations to be diverted to Somerset Dam (or
Wivenhoe Dam) for indirect potable reuse. The total amount of recycled water available from the WCRWSS is
77,000 ML/yr. It is assumed that 40,000 ML/yr of this will be input to Somerset Dam for IPR. The 40,000 ML/yr will
contribute 12% of the total supply available (including the recycled component) from the Wivenhoe Somerset Dam
system.
The WCRWSS non-potable supply to Swanbank and Tarong Power Stations is a measure included in the drought
emegency measures (Measures Nos 6,7, and 8 - Western Corridor Recycled Water Project (Water Amendment
Regulation (No 6) 2006.
Notes
Construction commenced.
References
Capex from QWC - October 2006 project reports for South East Queensland's Water Supply Emergency Projects.
Capex has been taken as 40/77 of estimated capital cost of $1,700,000,000.
Opex and Energy Use - Cardno preliminary estimates, for that component of the supply potentially to be used for
IPR.
Assumptions
This scheme as a permanent supply is dependent on community acceptance.

Institute for Sustainable Futures, UTS and Cardno February 2007
Review of Water Supply-Demand Options for South East Qld Appendix B
Project summary
Option Name Sandgate to North Pine Dam IPR Option Code No. SP - S5
Supply or Demand Supply Option Status Potential
Description
Model inputs
Years (s) Component Capex ($) Opex ($/a) Replacement Costs ($)
Treatment plant and delivery 95,500,000
Power and O&M total 3,670,000
Yield (ML/a) Uncertainty Energy use (MWh/ML)
5,620Low, but depends on
outcome of plebiscite1.313
Notes/references/
assumptions
Model outputs
PV Total Cost ($) $96,074,746PV Total Water Saved or
Supplied (ML)49,675
Unit Cost - full
capacity (PV$/PVkL)$1.93
Unit Cost - to meet
demand growth
(PV$/PVkL)
$1.93
Unit Cost (other)
Sustainability
Energy use (MWh/a) 7,379GHG
emission/reduction (t/a)7,718
Environmental
ImpactSocial Impact
Additional Notes
A major upgrade of the Sandgate wastewater treatment plant to tertiary treatment standard is underway. A further advanced treatment
stage could be added, and the recycled water piped to North Pine Dam for storage, re-treatment and reuse. If 5,600 Ml/yr were
produced (the approximate maximum volume which could be produced from the plant with its current loading), the recycled component
would represent less than 10% of the total supply from the dam.
With this indirect potable reuse option, tertiary treated effluent from the Sandgate Wastewater Treament Plant undegoes further
advanced treatment by reverse osmosis and other processes, then is piped to North Pine Dam to be mixed with runoff from its
catchment and recycled for urban use. The recycled component will represent approximately 9% of the total supply from the dam.
If recycled water from Brendale and Murrumba Downs plants is also pumped to North Pine Dam, the recycled component of the total
supply from North Pine dam will be about 16% of the total supply from the dam.
The supply available from the IPR plant is assumed to be equal to the current wastewater treatment plant output, less any component
currently reused, less the waste stream from an the RO treatment plant. Sizing of the infrastructure is based on an assumed growth in
flows by 2% pa until 2026 and 1.5% pa thereafter.
Notes
Cost includes the Treatment Plant, pipeline, and pump stations to deliver recycled water to North Pine Dam.
Costs are Cardno preliminary costs. Potential cost savings exist through linkage with supply from Murrumba Downs and Brendale.
References
Assumptions
This scheme as a permanent supply is dependent on community acceptance.
Notes for all IPR other than Western Corridor:
- Possible benefit to environment with respect to reduction of discharge to Moreton Bay, Broadwater etc.
- Minor social impacts possibly due to pipeline resumptions
- Public Education campaign required. Community acceptance essential.

Institute for Sustainable Futures, UTS and Cardno February 2007
Review of Water Supply-Demand Options for South East Qld Appendix B
Project summary
Option Name Brendale to North Pine Dam IPR Option Code No. SP - S6
Supply or Demand Supply Option Status Potential
Description
Model inputs
Years (s) Component Capex ($) Opex ($/a) Replacement Costs ($)
Treatment plant and delivery 24,020,000
Power and O&M total 1,007,000
Yield (ML/a) Uncertainty Energy use (MWh/ML)
1,680Low, but depends on
outcome of plebiscite1.100
Notes/references/
assumptions
Model outputs
PV Total Cost ($) $24,906,395PV Total Water Saved or
Supplied (ML)14,849
Unit Cost - full
capacity (PV$/PVkL)$1.68
Unit Cost - to meet
demand growth
(PV$/PVkL)
$1.68
Unit Cost (other)
Sustainability
Energy use (MWh/a) 1,848GHG
emission/reduction (t/a)1,933
Environmental
ImpactSocial Impact
Additional Notes
A tertiary wastewater treatment plant is located at Brendale. This option involves further advanced treatment of the effluent and piping
it to North Pine Dam for storage, re-treatment and reuse. The recycled component would be approximately 1,700 Ml/yr, or about 3%
of the total supply from North Pine Dam.
With this indirect potable reuse option, tertiary treated effluent from the Brendale Wastewater Treament Plant undegoes further
advanced treatment by reverse osmosis and other processes, then is piped to North Pine Dam to be mixed with runoff from its
catchment and recycled for urban use. The recycled component will represent approximately 3% of the total supply from the dam.
If recycled water from Sandgate and Murrumba Downs plants is also pumped to North Pine Dam, the recycled component of the total
supply from North Pine dam will be about 16% of the total supply from the dam.
The supply available from the IPR plant is assumed to be equal to the current wastewater treatment plant output, less any component
currently reused, less the waste stream from an the RO treatment plant. Sizing of the infrastructure is based on an assumed growth in
flows by 2% pa until 2026 and 1.5% pa thereafter.
Notes
Cost includes the Treatment Plant, pipeline, and pump stations to deliver recycled water to North Pine Dam.
Costs are Cardno preliminary costs. Potential cost savings exist through linkage with supply from Sandgate and Brendale.
References
Assumptions
This scheme as a permanent supply is dependent on community acceptance.
Notes for all IPR other than Western Corridor:
- Possible benefit to environment with respect to reduction of discharge to Moreton Bay, Broadwater etc.
- Minor social impacts possibly due to pipeline resumptions
- Public Education campaign required. Community acceptance essential.

Institute for Sustainable Futures, UTS and Cardno February 2007
Review of Water Supply-Demand Options for South East Qld Appendix B
Project summary
Option Name Murrumba Downs to North Pine Dam IPR Option Code No. SP - S7
Supply or Demand Supply Option Status Potential
Description
Model inputs
Years (s) Component Capex ($) Opex ($/a) Replacement Costs ($)
Treatment plant and delivery 55,170,000
Power and O&M total 2,690,000
Yield (ML/a) Uncertainty Energy use (MWh/ML)
4,230Low, but depends on
outcome of plebiscite1.310
Notes/references/
assumptions
Model outputs
PV Total Cost ($) $60,538,962PV Total Water Saved or
Supplied (ML)37,389
Unit Cost - full
capacity (PV$/PVkL)$1.62
Unit Cost - to meet
demand growth
(PV$/PVkL)
$1.62
Unit Cost (other)
Sustainability
Energy use (MWh/a) 5,541GHG
emission/reduction (t/a)5,796
Environmental
ImpactSocial Impact
Additional Notes
A tertiary wastewater treatment plant is located at Murrumba Downs. This option involves further advanced treatment of the effluent
and piping it to North Pine Dam for storage, re-treatment and reuse. The recycled component would be approximately 4,230 Ml/yr,
or about 7% of the total supply from North Pine Dam. If recycled water from Sandgate and Brendale plants is also pumped to North
Pine Dam, the recycled component of the total supply from North Pine dam will be about 16% of the total supply from the dam.
With this indirect potable reuse option, tertiary treated effluent from the Murrumba Downs Wastewater Treament Plant undegoes
further advanced treatment by reverse osmosis and other processes, then is piped to North Pine Dam to be mixed with runoff from
its catchment and recycled for urban use. The recycled component will represent approximately 7% of the total supply from the
dam.
If recycled water from Sandgate and Brendale plants is also pumped to North Pine Dam, the recycled component of the total supply
from North Pine dam will be about 16% of the total supply from the dam.
The supply available from the IPR plant is assumed to be equal to the current wastewater treatment plant output, less any
component currently reused, less the waste stream from an the RO treatment plant. Sizing of the infrastructure is based on an
assumed growth in flows by 2% pa until 2026 and 1.5% pa thereafter.
Notes
Cost includes the Treatment Plant, pipeline, and pump stations to deliver recycled water to North Pine Dam.
Costs are Cardno preliminary costs. Potential cost savings exist through linkage with supply from Murrumba Downs and Sandgate.
References
Assumptions
This scheme as a permanent supply is dependent on community acceptance.
Notes for all IPR other than Western Corridor:
- Possible benefit to environment with respect to reduction of discharge to Moreton Bay, Broadwater etc.
- Minor social impacts possibly due to pipeline resumptions
- Public Education campaign required. Community acceptance essential.

Institute for Sustainable Futures, UTS and Cardno February 2007
Review of Water Supply-Demand Options for South East Qld Appendix B
Project summary
Option Name Merrimac to Hinze Dam IPR Option Code No. SP - S8
Supply or Demand Supply Option Status Potential
Description
Model inputs
Years (s) Component Capex ($) Opex ($/a) Replacement Costs ($)
Treatment plant and delivery 106,060,000
Power and O&M total 5,130,000
Yield (ML/a) Uncertainty Energy use (MWh/ML)
7,330Low, but depends on
outcome of plebiscite1.550
Notes/references/
assumptions
Model outputs
PV Total Cost ($) $116,016,234PV Total Water Saved or
Supplied (ML)37,389
Unit Cost - full
capacity (PV$/PVkL)$1.79
Unit Cost - to meet
demand growth
(PV$/PVkL)
$1.79
Unit Cost (other)
Sustainability
Energy use (MWh/a) 11,362GHG
emission/reduction (t/a)11,884
Environmental
ImpactSocial Impact
Additional Notes
Merrimac treats wastewater from the Gold Coast area to tertiary standard. This option is to treat water to a higher standard and
pipe it to Hinze Dam for reuse. The quantity recycled would be approximately 7,300 ML/yr (the amount potentially available from
the existing plant), and the recycled component would make up approximately 9% of the total supply from Hinze Dam.
With this indirect potable reuse option, tertiary treated effluent from the Merrimac Wastewater Treament Plant undegoes further
advanced treatment by reverse osmosis and other processes, then is piped to Hinze Dam to be mixed with runoff from its
catchment and recycled for urban use. The recycled component will represent approximately 9% of the total supply from the
dam.
The supply available from the IPR plant is assumed to be equal to the current wastewater treatment plant output, less any
component currently reused, less the waste stream from an the RO treatment plant. Sizing of the infrastructure is based on an
assumed growth in flows by 2% pa until 2026 and 1.5% pa thereafter.
Notes
Cost includes the Treatment Plant, pipeline, and pump stations to deliver recycled water to Hinze Dam.
Costs are Cardno preliminary costs.
References
Assumptions
This scheme as a permanent supply is dependent on community acceptance.
Notes for all IPR other than Western Corridor:
- Possible benefit to environment with respect to reduction of discharge to Moreton Bay, Broadwater etc.
- Minor social impacts possibly due to pipeline resumptions
- Public Education campaign required. Community acceptance essential.

Institute for Sustainable Futures, UTS and Cardno February 2007
Review of Water Supply-Demand Options for South East Qld Appendix B
Project summary
Option Name Noosa to Lake MacDonald IPR Option Code No. SP - S9
Supply or Demand Supply Option Status Potential
Description
Model inputs
Years (s) Component Capex ($) Opex ($/a) Replacement Costs ($)
Treatment plant and delivery 37,900,000
Power and O&M total 1,360,000
Yield (ML/a) Uncertainty Energy use (MWh/ML)
2,040Low, but depends on
outcome of plebiscite1.376
Notes/references/
assumptions
Model outputs
PV Total Cost ($) $37,275,386PV Total Water Saved or
Supplied (ML)18,032
Unit Cost - full
capacity (PV$/PVkL)$2.07
Unit Cost - to meet
demand growth
(PV$/PVkL)
$2.07
Unit Cost (other)
Sustainability
Energy use (MWh/a) 2,807GHG
emission/reduction (t/a)2,936
Environmental
ImpactSocial Impact
Additional Notes
The Noosa plant is a tertiary treatment plant. With this option, further advanced treatment of the wastewater would occur, then the
recycled water would be piped to Six Mile Creek upstream of Lake MacDonald. If all the output of the Noosa Wastewater Treatment
Plant (less currently re-used fraction and the process waste stream) were treated, then the recycled component would represent
approximately 33% of the current supply from Lake MacDonald.
With this indirect potable reuse option, tertiary treated effluent from the Noosa Wastewater Treament Plant undegoes further
advanced treatment by reverse osmosis and other processes, then is piped to a point upstream of Lake MacDonald to be mixed with
runoff from its catchment and recycled for urban use. The recycled component will represent approximately 33% of the total supply
available from the dam, or about 20% of the total water consumption for Noosa LGA (including the supply from Mary River).
The supply available from the IPR plant is assumed to be equal to the current wastewater treatment plant output, less any
component currently reused, less the waste stream from an the RO treatment plant. Sizing of the infrastructure is based on an
assumed growth in flows by 2% pa until 2026.
Notes
Cost includes the Treatment Plant, pipeline, and pump stations to deliver recycled water to Lake MacDonald.
Costs are Cardno preliminary costs.
References
Assumptions
This scheme as a permanent supply is dependent on community acceptance.
Notes for all IPR other than Western Corridor:
- Possible benefit to environment with respect to reduction of discharge to Moreton Bay, Broadwater etc.
- Minor social impacts possibly due to pipeline resumptions
- Public Education campaign required. Community acceptance essential.

Institute for Sustainable Futures, UTS and Cardno February 2007
Review of Water Supply-Demand Options for South East Qld Appendix B
Project summary
Option Name Maroochy to Wappa Dam IPR Option Code No. SP - S10
Supply or Demand Supply Option Status Potential
Description
Model inputs
Years (s) Component Capex ($) Opex ($/a) Replacement Costs ($)
Treatment plant and delivery 112,900,000
Power and O&M total 4,580,000
Yield (ML/a) Uncertainty Energy use (MWh/ML)
6,170Low, but depends on
outcome of plebiscite1.690
Notes/references/
assumptions
Model outputs
PV Total Cost ($) $115,712,574PV Total Water Saved or
Supplied (ML)54,537
Unit Cost - full
capacity (PV$/PVkL)$2.12
Unit Cost - to meet
demand growth
(PV$/PVkL)
$2.12
Unit Cost (other)
Sustainability
Energy use (MWh/a) 10,427GHG
emission/reduction (t/a)10,907
Environmental
ImpactSocial Impact
Additional Notes
The Maroochydore Wastewater Treatment Plant is currently being upgraded to tertiary treatment with the capacity to produce Grad A
recycled water. With this option, further advanced treatment of the wastewater would occur, then the recycled water would be piped to
North Maroochy River upstream of Wappa Dam. If all the output of the Maroochydore Wastewater Treatment Plant (less currently re-
used fraction and the process waste stream), then the recycled component would represent approximately 40% of the current supply
from Cooloolabin-Wappa Dam-Poona water supply system. The recycled component would be less if Wappa Dam were to be raised.
With this indirect potable reuse option, tertiary treated effluent from the Maroochydore Wastewater Treament Plant undegoes further
advanced treatment by reverse osmosis and other processes, then is piped to a point upstream of Wappa Dam to be mixed with runoff
from its catchment and recycled for urban use. The recycled component will represent approximately 40% of the total supply available
from the Cooloolabin-Wappa-Poona Water Supply System.
If Wappa Dam were to be raised, and used as a holding storage for water piped from potential storages in the Mary River catchment,
the recycled component of the total supply from the Cooloolabin-Wappa-Poona Water Supply System would be substantially less.
The supply available from the IPR plant is assumed to be equal to the current wastewater treatment plant output, less any component
currently reused, less the waste stream from an the RO treatment plant. Sizing of the infrastructure is based on an assumed growth in
flows by 2% pa until 2026 and 1.5% pa thereafter.
Notes
Cost includes the Treatment Plant, pipeline, and pump stations to deliver recycled water to Wappa Dam.
Costs are Cardno preliminary costs.
References
Assumptions
This scheme as a permanent supply is dependent on community acceptance.
Notes for all IPR other than Western Corridor:
- Possible benefit to environment with respect to reduction of discharge to Moreton Bay, Broadwater etc.
- Minor social impacts possibly due to pipeline resumptions
- Public Education campaign required. Community acceptance essential.

Institute for Sustainable Futures, UTS and Cardno February 2007
Review of Water Supply-Demand Options for South East Qld Appendix B
Project summary
Option Name Caboolture to Moodlu Storage Option Code No. SP - S11
Supply or Demand Supply Option Status Potential
Description
Model inputsYears (s) Component Capex ($) Opex ($/a) Replacement Costs ($)
Delivery system 8,440,000
Power and O&M total 1,024,000
Yield (ML/a) Uncertainty Energy use (MWh/ML)
2,550Low, but depends on
outcome of plebiscite1.09
Notes/references/
assumptions
Model outputs
PV Total Cost ($) $14,675,046PV Total Water Saved or
Supplied (ML)22,539
Unit Cost - full
capacity (PV$/PVkL)$0.65
Unit Cost - to meet
demand growth
(PV$/PVkL)
$0.65
Unit Cost (other)
Sustainability
Energy use (MWh/a) 2,780GHG
emission/reduction (t/a)2,907
Environmental
ImpactSocial Impact
Additional Notes
The South Caboolture Wastewater Treatment Plant has advanced water treatment processes that are able to treat recycled water to
standards suitable for indirect potable reuse. Currently, most of this recycled water is discharged to the river although 1 to 2ML/day is
currently being reused. An option is to pump the remaining availble recycled water (approximately 7 ML/day) to the Moodlu Storage.
Water could be released from the storage into Wararba Creek to be captured and re-treated in the water treatment plant for potable
use, or drawn directly from the Moodlu Storage.
Notes
Cost includes the pipeline, and pump station to deliver recycled water to Moodlu Dam.
Costs are Cardno preliminary costs.
References
Assumptions
This scheme as a permanent supply is dependent on community acceptance.
Notes for all IPR other than Western Corridor:
- Possible benefit to environment with respect to reduction of discharge to Moreton Bay, Broadwater etc.
- Minor social impacts possibly due to pipeline resumptions
- Public Education campaign required. Community acceptance essential.

Institute for Sustainable Futures, UTS and Cardno February 2007
Review of Water Supply-Demand Options for South East Qld Appendix B
Project summary
Option Name Kawana to Ewan Maddock Dam IPR Option Code No. SP - S12
Supply or Demand Supply Option Status Potential
Description
Model inputs
Years (s) Component Capex ($) Opex ($/a)Replacement Costs
($)Treatment plant and delivery 133,900,000
Power and O&M total 6,930,000
Yield (ML/a) Uncertainty Energy use (MWh/ML)
6,600
Low, but depends on
community engagement
and acceptance
1.238
Notes/references/
assumptions
Model outputs
PV Total Cost ($) $219,426,452PV Total Water Saved
or Supplied (ML)89,796
Unit Cost - full
capacity (PV$/PVkL)$2.44
Unit Cost - to meet
demand growth
(PV$/PVkL)
$2.44
Unit Cost (other)
Sustainability
Energy use (MWh/a) 8,171GHG
emission/reduction (t/a)8,547
Environmental
ImpactSocial Impact
Additional Notes
With this indirect potable reuse option, tertiary treated effluent from the Kawana Wastewater Treament Plant undegoes further
advanced treatment by reverse osmosis and other processes, then is piped to a point just upstream of Ewan Maddock Dam to be
mixed with runoff from its catchment and recycled for urban use.
There are plans to recommission Ewan Maddock Dam as a water supply storage. The water yield from this storage is estimated to
be 3,800 ML/yr (from "Water from South East Queensland - Long term solution" ).
The recycled component will represent approximately 63% of the total supply available from Ewan Maddock Dam. The supply from
Ewan Maddock Dam (including the recycled component) could possibly be mixed with the supply from other water sources.
The supply available from the IPR plant is assumed to be equal to the current wastewater treatment plant output, less any
component currently reused, less the waste stream from an RO treatment plant. Sizing of the infrastructure is based on an assumed
growth in flows by 2% pa until 2026 and 1.5% pa thereafter.
Notes
Cost includes the Treatment Plant, pipeline, and pump stations to deliver recycled water to Ewan Maddock Dam.
Costs are Cardno preliminary costs.
References
Assumptions
This scheme as a permanent supply is dependent on community acceptance.

Institute for Sustainable Futures, UTS and Cardno February 2007
Review of Water Supply-Demand Options for South East Qld Appendix B
Project summary
Option Name Glendower Dam & Albert River Barrage Option Code No. SP - S13
Supply or Demand Supply Option Status Potential
Description
Model inputsYears (s) Component Capex ($) Opex ($/a) Replacement Costs ($)
Dam, & Barrage 262,000,000
Treatment and delivery to Stapylton 51,600,000
O&M and Power Costs Total 2,930,000
Yield (ML/a) Uncertainty Energy use (MWh/ML)
18,000 medium 0.198
Notes/references/
assumptions
Model outputs
PV Total Cost ($) $234,863,138PV Total Water Saved or
Supplied (ML)159,102
Unit Cost - full
capacity (PV$/PVkL)$1.48
Unit Cost - to meet
demand growth
(PV$/PVkL)
$1.48
Unit Cost (other)
Sustainability
Energy use (MWh/a) 3,564GHG
emission/reduction (t/a)3,728
Environmental
ImpactSocial Impact
Additional Notes
Glendower Dam which is located on the Albert River had been proposed as a future water source for south east Queensland in
earlier planning studies. Consequently the Queensland Government resumed land for this storage. In conjunction with
Glendower Dam, it was planned also to construct a barrage on the Albert River at 18.7 km (near Yatala). Water would be
drawn from the barrage. The advantage of this water supply system is its proximity to the Southern Regional Pipeline and the
land acquisition that has already occurred for the Glendower Dam. A recent review by NR&W has identified impacts of this
development on the riparian zone of the Albert River downstream of the dam.
The supply from this option is estimated as 18,000 ML/yr at Albert River barrage for a Glendower Dam with a full supply level
of RL 79.17 m AHD and capacity 111,800 ML.
Costs in the include a pump station, treatment plant and pipeline to treat and deliver the supply to the Stapylton balancing
storage on the Southern Regional Pipeline, as well as the cost of the dam itself.
Notes
This storage option has been considered by NR&W as a supply option in the SEQRWSS, but rejected in favour of water
resources development in the neighbouring Logan River catchment. Discussion of the impacts of this storage on the Albert
River is contained in the Appendix of " Water For South East Queensland - A Long Term Solution ". Most of the land for this
storage has been resumed, as the storage had been planned as a future water supply source for the Moreton Region..
References
Capex for Dam from June 2006 GHD Desk-top Study. Cost is for a storage with FSL = 79.17m and capacity of 111,800 ML.
Capex for delivery system (which includes pipeline, pump station, and treatment plant for delivery to Stapylton Balancing
Storage - Cardno Preliminary Estimates
Opex and Energy Use - Cardno Preliminary Estimates.
Yield estimate of 18,000 ML/yr is from the July 2006 Information Paper which gives updated yields
- Potentially significant impacts on fish passage and riparian habitat along the Logan River.
- Minor social impacts – 98% of the land for the Glendower Dam has been purchased. No (or very minor) resumptions would
be expected for the Barrage
- Development would trigger EPBC Act

Institute for Sustainable Futures, UTS and Cardno February 2007
Review of Water Supply-Demand Options for South East Qld Appendix B
Project summary
Option Name Amamoor Dam to Narangba Option Code No. SP - S14
Supply or Demand Supply Option Status Potential
Description
Model inputs
Years (s) Component Capex ($) Opex ($/a) Replacement Costs ($)
Amamoor Dam 162,200,000
Delivery system including Pipeline, Pump Stations,
Balancing Storages, and Treatment)
413,700,000
O&M and Power Costs Total 11,970,000
Yield (ML/a) Uncertainty Energy use (MWh/ML)
20,000 medium 2.169
Notes/references/
assumptions
Model outputs
PV Total Cost ($) $489,549,100PV Total Water Saved or
Supplied (ML)176,780
Unit Cost - full
capacity (PV$/PVkL)$2.77
Unit Cost - to meet
demand growth
(PV$/PVkL)
$2.77
Unit Cost (other)
Sustainability
Energy use (MWh/a) 43,380GHG
emission/reduction (t/a)45,375
Environmental
ImpactSocial Impact
Additional Notes
Amamoor Dam was proposed as a future water supply for the Mary Valley and North Coast area in past planning studies.
Subsequently the Queensland Government acquired all privately owned property that would be required for the development of this
site. Development of this site however has been rejected in favour of the proposed Traveston Crossing Dam.
Amamoor damsite is located on Amamoor Creek, a tributary of the Mary River. Costs for a dam with a full supply level of RL 135 m
AHD and capacity of 220,000 ML were taken from the GHD 2006 Desk Top study report. The yield from a dam of capacity 200,000
ML has been re-estimated recently by Dept NR&W as 21,500 ML/yr.
Treatment and delivery costs assume delivery of the supply from this dam by pipeline to the Narangba area.
Yield is taken directly from Amamoor Dam.
Notes
This storage option has been considered by NR&W as a supply option in the SEQRWSS, but rejected in favour of Traveston Crossing
Dam. Discussion of the impacts of this storage on the Mary River is contained in the Appendix of " Water For South East Queensland -
A Long Term Solution ". The land for this storage has been resumed.
References
Capex for Dam from June 2006 GHD Desk-top Study. Cost is for a storage with FSL = 145m and capacity of approximately 220,000
ML.
Capex for the delivery system (which includes pipeline, pump stations and balancing storages to Narangba area) from Cardno
preliminary estimates.
Opex and Energy Use - Cardno preliminary estimates.
Yield estimate of 20,000 ML/yr is from the July 2006 Information Paper which gives updated yields. Recent (18/12/2006) advice from
Dept NR&W is that the yield of a 200,000 ML storage is 21,500 ML/yr at dam, after allowing for compensation releases necessary to
meet the Mary River WRP plan objectives.
- Not expected to be significant environmental impacts, at least in relation to Traveston Crossing Stage 1. Some native forests
inundated.
- Minor social impacts – All the privately owned land required for this dam has been purchased, although some popular campsites
would be affected.
- Development would trigger EPBC Act

Institute for Sustainable Futures, UTS and Cardno February 2007
Review of Water Supply-Demand Options for South East Qld Appendix B
Project summary
Option Name Cambroon Dam to Stanley River Option Code No. SP - S15
Supply or Demand Supply Option Status Potential
Description
Model inputs
Years (s) Component Capex ($) Opex ($/a) Replacement Costs ($)
Cambroon Dam 206,300,000
Pipeline, Pump Stations and Tunnel 250,600,000
O&M and Power Costs Total 5,780,000
Yield (ML/a) Uncertainty Energy use (MWh/ML)
32,000 medium 0.771
Notes/references/
assumptions
Model outputs
PV Total Cost ($) $355,541,078PV Total Water Saved or
Supplied (ML)282,847
Unit Cost - full
capacity (PV$/PVkL)$1.26
Unit Cost - to meet
demand growth
(PV$/PVkL)
$1.29
Unit Cost (other)
Sustainability
Energy use (MWh/a) 24,672GHG
emission/reduction (t/a)25,807
Environmental
ImpactSocial Impact
Additional Notes
Water supply from a dam on Mary River at Cambroon. Cambroon damsite is located on Mary River upstream of Kenilworth. This was
investigated as one of the potential future water supply sources in the Mary Valley, but rejected in favour of Traveston Crossing Dam.
The dam is located 67 kilometres further upstream than Traveston Crossing Dam, and development of this site would have much less
impact on the Mary River than development of Traveston Crossing Dam. Water would be conveyed via pipeline and tunnel to Stanley
River for storage in Somerset Dam, released to Wivenhoe Dam, then treatment and distribution at Mt Crosby Weir. The pipeline
distance to Stanley River is approximately 38.5 km. A tunnel of length 5.5 km would be required.
A storage with full supply level of RL 130 m AHD and capacity 120,000 ML has been assumed. A storage with this full supply level
may affect parts of Conondale township, although most of the town is sited above 135 metres elevation. The yield of this dam has
been recently re-estimated by Dept NR&W. For a storage of 100,000 ML, the historical no-failure yield is estimated as 32,000 ML/yr,
exclusive of high flow and low flow compensation releases necessary to comply with the Mary Basin WRP.
The costing has included a pipeline and tunnel to convey the supply from this dam to Somerset Dam.
The supply from this dam would supplement the supplies extracted from the Wivenhoe Dam - Somerset Dam system at Mt Crosby
Weir, and also for the proposed pipeline to Perseverance Dam for Toowoomba’s water supply.
Costs include
- construction of Cambroon Dam to FSL 130 m (capacity 120,000 ML)
- (dam costs include resumptions and relocation of services, and roads)
- pipeline, tunnel and pump stations from Cambroon Dam to Stanley River, via McColls Creek.
Yield is taken directly from Cambroon Dam
Notes
This storage option has been considered by NR&W as a supply option in the SEQRWSS, but rejected in favour of Traveston Crossing
Dam. Discussion of the impacts of this storage on the Mary River is contained in the Appendix of " Water For South East Queensland
- A Long Term Solution ".
References
Capex for Dam from June 2006 GHD Desk-top Study. Cost is for a storage with FSL = 130m and capacity of approximately 120,000
ML.
Capex for the delivery system (which includes pipeline, pump stations and tunnel to Stanley River from Cardno preliminary estimates
Opex and Energy Use - Cardno preliminary estimates.
Yield estimate of 32,000 ML/yr is from Dept NR&W. It is the historical no-failure yield (at dam) for a 100,000 ML storage, with
compensation releases required to satisfy the Mary River Water Reource Plan flow objectives.
- Not expected to be significant environmental impacts, at least in comparison Traveston Crossing Stage 1.
- Some social impact expected. A dam with FSL 130m should not affect Conondale, but around 121 properties will be affected.
- Development would trigger EPBC Act
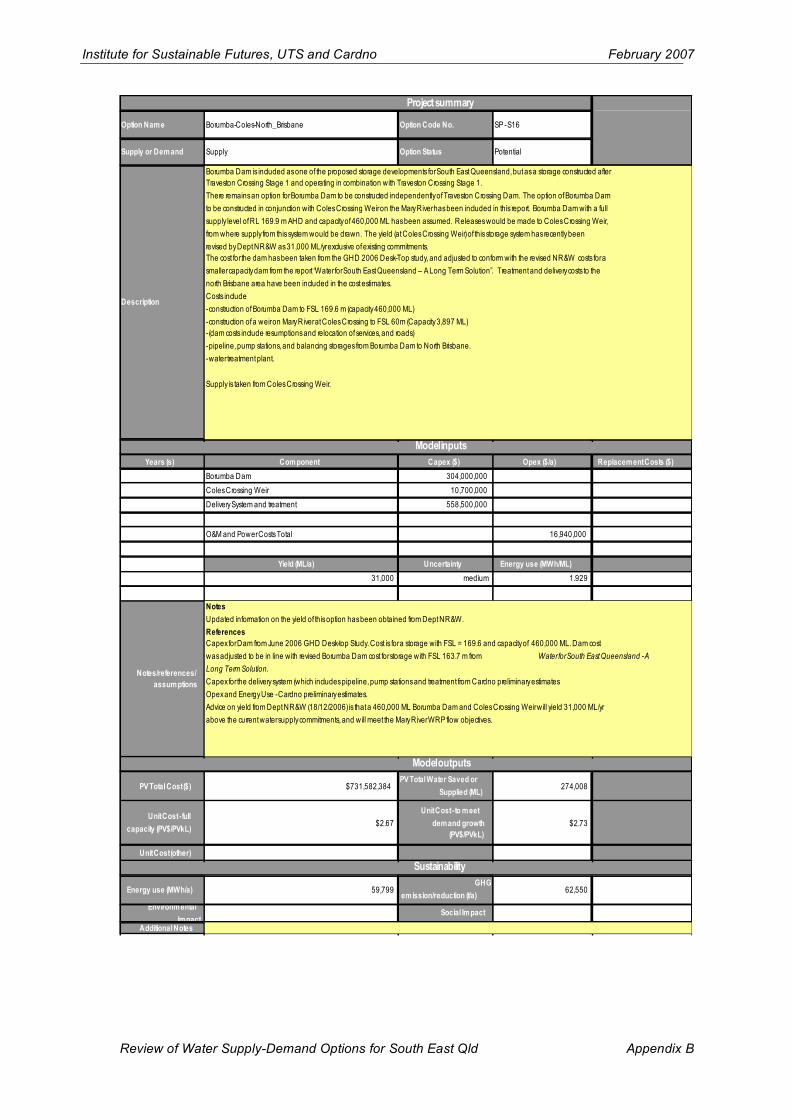
Institute for Sustainable Futures, UTS and Cardno February 2007
Review of Water Supply-Demand Options for South East Qld Appendix B
Project summary
Option Name Borumba-Coles-North_Brisbane Option Code No. SP - S16
Supply or Demand Supply Option Status Potential
Description
Model inputs
Years (s) Component Capex ($) Opex ($/a) Replacement Costs ($)
Borumba Dam 304,000,000
Coles Crossing Weir 10,700,000
Delivery System and treatment 558,500,000
O&M and Power Costs Total 16,940,000
Yield (ML/a) Uncertainty Energy use (MWh/ML)
31,000 medium 1.929
Notes/references/
assumptions
Model outputs
PV Total Cost ($) $731,582,384PV Total Water Saved or
Supplied (ML)274,008
Unit Cost - full
capacity (PV$/PVkL)$2.67
Unit Cost - to meet
demand growth
(PV$/PVkL)
$2.73
Unit Cost (other)
Sustainability
Energy use (MWh/a) 59,799GHG
emission/reduction (t/a)62,550
Environmental
ImpactSocial Impact
Additional Notes
Borumba Dam is included as one of the proposed storage developments for South East Queensland, but as a storage constructed after
Traveston Crossing Stage 1 and operating in combination with Traveston Crossing Stage 1.
There remains an option for Borumba Dam to be constructed independently of Traveston Crossing Dam. The option of Borumba Dam
to be constructed in conjunction with Coles Crossing Weir on the Mary River has been included in this report. Borumba Dam with a full
supply level of RL 169.9 m AHD and capacity of 460,000 ML has been assumed. Releases would be made to Coles Crossing Weir,
from where supply from this system would be drawn. The yield (at Coles Crossing Weir) of this storage system has recently been
revised by Dept NR&W as 31,000 ML/yr exclusive of existing commitments.
The cost for the dam has been taken from the GHD 2006 Desk-Top study, and adjusted to conform with the revised NR&W costs for a
smaller capacity dam from the report “Water for South East Queensland – A Long Term Solution”. Treatment and delivery costs to the
north Brisbane area have been included in the cost estimates.
Costs include
- construction of Borumba Dam to FSL 169.6 m (capacity 460,000 ML)
- construction of a weir on Mary River at Coles Crossing to FSL 60m (Capacity 3,897 ML)
- (dam costs include resumptions and relocation of services, and roads)
- pipeline, pump stations, and balancing storages from Borumba Dam to North Brisbane.
- water treatment plant.
Supply is taken from Coles Crossing Weir.
Notes
Updated information on the yield of this option has been obtained from Dept NR&W.
References
Capex for Dam from June 2006 GHD Desk-top Study. Cost is for a storage with FSL = 169.6 and capacity of 460,000 ML. Dam cost
was adjusted to be in line with revised Borumba Dam cost for storage with FSL 163.7 m from Water for South East Queensland - A
Long Term Solution.
Capex for the delivery system (which includes pipeline, pump stations and treatment from Cardno preliminary estimates
Opex and Energy Use - Cardno preliminary estimates.
Advice on yield from Dept NR&W (18/12/2006) is that a 460,000 ML Borumba Dam and Coles Crossing Weir will yield 31,000 ML/yr
above the current water supply commitments, and will meet the Mary River WRP flow objectives.

Institute for Sustainable Futures, UTS and Cardno February 2007
Review of Water Supply-Demand Options for South East Qld Appendix B
Project summary
Option Name Borumba2_Narangba Option Code No. SP - S17
Supply or Demand Supply Option Status Potential
Description
Model inputsYears (s) Component Capex ($) Opex ($/a) Replacement Costs ($)
Borumba Dam 304,000,000
Delivery System and treatment 304,600,000
O&M and Power Costs Total 7,850,000
Yield (ML/a) Uncertainty Energy use (MWh/ML)
15,000 medium 1.675
Notes/references/
assumptions
Model outputs
PV Total Cost ($) $474,921,886PV Total Water Saved or
Supplied (ML)132,585
Unit Cost - full
capacity (PV$/PVkL)$3.58
Unit Cost - to meet
demand growth
(PV$/PVkL)
$3.58
Unit Cost (other)
Sustainability
Energy use (MWh/a) 25,125GHG
emission/reduction (t/a)26,281
Environmental
ImpactSocial Impact
Additional Notes
This option considers the supply directly from a raised Borumba Dam without any weir on Mary River. The yield directly from a 460,000 ML
capacity dam is estimated to be 15,000 ML/yr. Water would be conveyed via pipeline to Wappa Dam for treatment and distribution as far
as Narangba.
Costs include
- construction of Borumba Dam to FSL 169.6 m (capacity 460,000 ML)
- (dam costs include resumptions and relocation of services, and roads)
- pipeline, and pump stations from Borumba Dam to Wappa Dam.
- upgrade of Image Flat water treatment plant.
- pipeline and pumps from Image Flat to Narangba
Supply is taken directly from Borumba Dam (No weir on Mary River at Coles Crossing)
Notes
Option excludes Coles Crossing Weir, and assumes supply taken directly from Borumba Dam.
References
Capex for Dam from June 2006 GHD Desk-top Study. Cost is for a storage with FSL = 169.6 and capacity of 460,000 ML. Dam cost was
adjusted to be in line with revised Borumba Dam cost for storage with FSL 163.7 m from Water for South East Queensland - A Long Term
Solution.
Capex for the delivery system (which includes pipeline, pump stations and treatment ) from Cardno preliminary estimates.
Opex and Energy Use - Cardno preliminary estimates.
Advice on yield from Dept NR&W (18/12/2006) is that a 460,000 ML Borumba Dam will yield 15,000 ML/yr at dam above the current water
supply commitments, and will meet the Mary River WRP flow objectives.

Institute for Sustainable Futures, UTS and Cardno February 2007
Review of Water Supply-Demand Options for South East Qld Appendix B
Project summary
Option Name Wappa raised - Landershute Option Code No. SP - S18
Supply or Demand Supply Option Status Potential
Description
Model inputs
Years (s) Component Capex ($) Opex ($/a) Replacement Costs ($)
Wappa Dam 172,000,000
Delivery System and treatment 33,000,000
O&M and Power Costs Total 1,780,000
Yield (ML/a) Uncertainty Energy use (MWh/ML)
8,500 medium 0.361
Notes/references/
assumptions
Model outputs
PV Total Cost ($) $152,333,544PV Total Water Saved or
Supplied (ML)75,131
Unit Cost - full
capacity (PV$/PVkL)$2.03
Unit Cost - to meet
demand growth
(PV$/PVkL)
$2.03
Unit Cost (other)
Sustainability
Energy use (MWh/a) 3,069GHG
emission/reduction (t/a)3,210
Environmental
ImpactSocial Impact
Additional Notes
Raising of Wappa Dam is one of the options that has been considered in past planning studies. Water would be treated at Image
Flat, and be piped to Landershute for distribution. Recent advice from Dept NR&W is that for compliance with the Water Resources
Plan there are fairly severe environmental flow releases required from Wappa Dam that result in very little additional yield for
storage sizes above about 30,000 ML. For a storage capacity of 30,000 ML (Full Supply Level 63 m), the yield is estimated to be
8,500 ML/yr in excess of the existing entitlements from the storage (16,500 ML/yr).
The dam costs have been taken from the GHD 2006 Desk-Top Study. Treatment and delivery of the additional supply to the
Landershute area has been assumed in the costing of the delivery system.
The raised Wappa Dam could be considered in conjunction with the indirect potable reuse option for supply from Maroochydore
Wastewater Treatment Plant.
Costs include
- construction of raised Wappa Dam (FSL 63 m (capacity 30,000 ML)
- (dam costs include resumptions and relocation of services, and roads)
- pipeline, and pump stations from Wappa Dam to Image Flat.
- upgrade of Image Flat water treatment plant.
- pipeline and pumps from Image Flat to Landershute.
Notes
Updated information on the yield of this option has been supplied by Dept NR&W.
The yield of the Wappa-Cooloolabin-Poona dam system with a 30,000 ML capacity Wappa Dam is 8,500 ML/yr in excess of the
Maroochy Shire Council entitlement of 16,500 ML/yr from this system. Yield of the existing system is approximately 9,100 ML/yr,
significantly less than the entitlement..
References
Capex for Dam from June 2006 GHD Desk-top Study (interpolated). Cost is for a storage with FSL = 63 and capacity of 30,000
ML.
Capex for the delivery system (which includes pipeline, pump stations and treatment) from Cardno preliminary estimates
Opex and Energy Use - Cardno preliminary estimates.
Yield estimate of 8,500 ML/yr (yield in excess of the current entitlement) is fromNR&W for 30,000 ML storage.
- Some high conservation value vegetation may be affected. Dam is in riparian corridor
- Some social impact expected. Resumption costs are a significant part of total costs of dam.

Institute for Sustainable Futures, UTS and Cardno February 2007
Review of Water Supply-Demand Options for South East Qld – Final Report 80
APPENDIX C – CALCULATION OF UNIT COST
The “Average Incremental Cost” (AIC) is considered a best practice assessment of unit cost ($/kL) internationally (Turner et al, 2007). The use of this metric involves dividing the present value of the stream of costs (and benefits where these are available) by the present value of the stream of water saved or supplied over time. See Fane, Robinson and White (2003) for explanation of the use of this unit cost metric, and also the example box below.
Hunter Water 2003 Integrated Water Resources Plan
Use of the AIC Metric: Hunter Water 2003 Integrated Water Resources Plan
Based on the recommendations of the economic regulator (the NSW Independent Pricing and Regulatory Tribunal) Hunter Water used the AIC methodology outlined in White and Howe (1998) in its 2003 Integrated Water Resources Plan (IWRP) where the unit cost of conserved water is:
!
LC=
Ct/(" 1+r)
t
St/(" 1+r)
t
Where Ct is the cost (capital and operating) of the option in the year t,
St is the water supplied or saved in year t, and
r is the real discount rate.
The sum was taken over the same length of time for numerator and denominator. Both the numerator (costs) and denominator (water savings or yield) are discounted because the water savings are the stream of satisfied demand provided by an option. Even though it is measured in kilolitres, it is a metric of the provision of utility, in an economic sense.
This approach generated a unit cost of water, which is equivalent to the ‘constant price’ of water from that option. Hunter Water employed this method to compare the cost effectiveness of supply augmentation and water efficiency options available. Hunter Water used a time span of 30 years and examined the implications of options against a reference case. Hunter Water then examined the lowest cost (based on economic, social and environmental factors) of providing customers with water.