Embed Size (px)
Citation preview

Materials and Structures manuscript No.(will be inserted by the editor)
Review: Optical Fiber Sensors for Civil Engineering
Applications
Christopher K.Y. Leung · Kai Tai Wan · Daniele
Inaudi · Xiaoyi Bao · Wolfgang Habel · Zhi
Zhou · Jinping Ou · Masoud Ghandehari · Hwai
Chung Wu · Michio Imai
Received: date / Accepted: date
Christopher K.Y. Leung
Hong Kong University of Science and Technology, Hong Kong
E-mail: [email protected]
Kai Tai Wan
Nano and Advanced Materials Institute Limited, Hong Kong
E-mail: [email protected]
Daniele Inaudi
Smartec, Switzerland
Xiaoyi Bao
University of Ottwa, Canada
Wolfgang Habel
BAM, Germany
Zhi Zhou
Harbin institute of Technology, China
Jinping Ou
Dalian University of Technology, China

2 Leung and Wan et al
Masoud Ghandehari
Polytechnic Institute of New York University, USA
Hwai Chung Wu
Wayne State University, USA
Michio Imai
Kajima Technical Research Institute, Japan
This work is derived from a study by the RILEM Technical Committee on Optical Fiber Sensors for Civil
Engineering Applications. Other members of the committee are:
· Farhad Ansari
University of Illinois, Chicago, USA
Evangelos Astrinidis
CRD Group, Greece
Muhammed Basheer
Queen’s University, Belfast, UK
Rolf Broennimann
EMPA, Switzerland
Paulo Cruz
University of Minho, Portugal
Wei-Liang Jin
Zhejiang University, China
Ki Soo Kim
Stijn Matthys
Ghent University, Belgium
Aftab Mufti
University of Manitoba
John Newhook
Review: Optical Fiber Sensors for Civil Engineering Applications 3
Abstract Optical fiber sensor (OFS) technologies have developed rapidly over the last
few decades, and various types of OFS have found practical applications in the field of
civil engineering. In this paper, which is resulting from the work of the RILEM technical
committee “Optical fiber sensors for civil engineering applications’’, different kinds of
sensing techniques, including change of light intensity, interferometry, fiber Bragg grating,
adsorption measurement and distributed sensing, are briefly reviewed to introduce the basic
sensing principles. Then, the applications of OFS in highway structures, building structures,
geotechnical structures, pipelines as well as cables monitoring are described, with focus on
sensor design, installation technique and sensor performance. It is believed that the State-of-
the-Art review is helpful to engineers considering the use of OFS in their projects, and can
facilitate the wider application of OFS technologies in construction industry.
Keywords optical fiber sensors · monitoring · fiber Bragg grating · distributed sensor ·
interferometry · time domain reflectometry · frequency domain reflectometry
Dalhousie University, Canada
Stephanie Schuler
BAM, Germany
Joe Seinfield
Purdue University, USA
Gamil Tadros
Speco Engineering, Ltd, Canada
Leon Wegner
University of Saskatchewan, Canada
Zhishen Wu
Ibaraki University, Japan
4 Leung and Wan et al
1 Introduction
Infrastructure decay is a big problem faced by many developed countries in the world. After
years of service, many structures, such as bridges, tunnels, dams and power plants, are
showing severe deterioration. To ensure safety of these structures and to perform proper
maintenance/rehabilitation, there is a need to monitor the structural condition or “health” over
time. Also, for important new structures, sensors are often installed during the construction
phase so minor degradations can be identified at an early stage. Low-cost minor repair
can then be performed to avoid major damages that require costly renovations or even re-
construction. The use of new materials in construction also creates a need for monitoring.
For example, fiber reinforced polymers (FRP) are now being employed for the fabrication
of components for bridge construction and repair. While the performance of these materials
has been verified in the laboratory, real-world experience is still limited. The installation of
monitoring system in a FRP structure allows engineers to assess its in-situ performance and
ensure safe operation. The obtained information can also be employed to improve the future
design of structures with these new materials.
The use of any structural health monitoring system, if correctly designed and used,
can have a positive impact on the lifetime cost of a structure. By providing quantitative
information on the state of a structure, it allows a better management of its maintenance
and inspections, resulting in a positive benefit to cost comparison. Conventionally, electrical
gauges and transducers have been the technology of choice for measuring many physical and
chemical parameters. Recently, fiber optic based monitoring systems have been successfully
developed and employed. In optical sensing, the sensing element is part of an optical fiber
which transforms a change in the monitored parameter into a corresponding change in the
properties of the guided light, which can be its intensity, phase, spectral content, polarization
Review: Optical Fiber Sensors for Civil Engineering Applications 5
state or a combination of these. The sensor is linked to the data acquisition system through
an optical fiber communication link. In some cases, the signal from many sensors can be
transmitted through the same fiber link. Field installation can hence be simplified.
For various kinds of optical fiber sensors, there are corresponding data acquisition units
that would convert the optical measurement into the parameter of interest. Being a new
technology, an optical fiber sensing system is more expensive than its electrical counterpart,
with the exception of distributed sensing where the cost per measurement point can be much
lower than individual conventional sensors. However, optical sensing technology possesses a
number of advantages that justify its use in practical applications. Optical fiber sensors (OFS)
are intrinsically immune to electromagnetic interference (EMI), such as those generated by
lightning strikes, nearby power lines or wireless communication systems. By design, OFS are
intrinsically safe and naturally explosion proof, making them particularly suitable for health
monitoring applications of risky civil structures such as gas pipelines or chemical plants.
Another advantage of OFS is their small size. The diameter of bare OFS, usually in the range
of 125 µm to 1000 µm, makes them applicable in space-restricted environments such as
thin composite structures. The ability of measuring over long distances (of several tens of
kilometers), without the need for any electrically active component, is an important feature
in the monitoring of large and remote structures such as pipelines or multiple bridges along a
single highway. Depending on the length of the sensing element, the sensor can be configured
into a “point” sensor performing measurement at a particular point or an “integrated” (or
long-gauge) sensor obtaining the averaged information over a particular region. Along a
single fiber, several “point” sensors can be multiplexed to obtain information at a number
of specific points. Also, sensors on the same fiber can be configured to measure different
parameters (e.g., strain and temperature). More importantly, since an optical fiber possesses
sensing capacity at any point along its length, it is possible to perform truly “distributed”
6 Leung and Wan et al
measurement along the fiber. The capability for multiplexing and distributed sensing extends
the repertoire of existing monitoring techniques. If designed and packaged properly, OFS can
be very robust, and last for a long time in the most challenging environments. With the long-
term durability and low maintenance of OFS, it is possible for the life-cycle cost of an optical
sensing system to be lower than an electrical one. With the above advantages, OFS have been
employed (though in limited extent) to replace conventional sensors in structural monitoring
applications. They have also been used in experimental research as tools to provide accurate
and stable measurements in the laboratory. Actually, by exploiting the special properties of
optical fibers, novel sensors can be designed to provide sensing capabilities not achievable
with existing instruments, and hence make possible the acquisition of new information useful
to engineers.
As discussed above, optical fiber sensing systems can replace existing electrical systems
if (i) conventional sensor fails to satisfy performance requirements (e.g., stability, accuracy,
durability, etc) under specific conditions, or (ii) the optical sensor can provide useful in-
formation not obtainable with conventional sensors. In many cases it is also possible to
combine traditional sensors and fiber optic sensors (e.g. vibrating-wire piezometers and fiber
optic distributed leakage detection systems in the same dam), to get the best of both worlds.
Data from the two systems can be combined at the processing stage. To identify suitable
applications of the optical fiber sensor, a good understanding of the principles and advantages
of such sensors is required. Such understanding, however, is often lacking for civil engineers.
The major objective of this paper is to review the current State-of-the-Art for the application
of optical fiber sensors in civil engineering. Such information can hopefully facilitate the
further application of this new technology in civil engineering practice. In the next section,
common optical sensing principles are first briefly described. Then, practical applications of
Review: Optical Fiber Sensors for Civil Engineering Applications 7
OFS in monitoring highway structures, building structures, geotechnical structures, pipelines
and cables will be discussed in Section 3.
2 Optical Fiber Sensing Principles
In this section, common optical fiber sensing principles are reviewed to provide the required
background for readers to appreciate the various practical applications to be described in
Section 3. To serve this purpose, the description for each kind of sensor will be kept very brief,
in order not to duplicate the effort of other works in the literature. In general every fiber optic
sensor is designed to somehow change the properties of the light that is transmitted through
or reflected from the sensors. Changes can include variations of intensity, polarization and
spectral content of phase. Readers interested in more information, should refer to the cited
references.
2.1 Change of light intensity
The intensity of light signal passing through an optical fiber or reflected from its end is easy
to measure. The breakage of a fiber can result in a sudden drop in the forward signal (or a
sudden increase in the reflected signal). If a fiber is bonded strongly to a structure, a crack
formed in the structure can induce fiber breakage [?,?]. If several parallel fibers are placed
perpendicular to the anticipated direction of crack growth, the propagation of a crack can then
be monitored [?]. The major disadvantage of these sensors lies in the difficulty in controlling
the failure consistency. To achieve consistency, all fibers need to be coupled to the structure
in exactly the same way - a task not easily accomplished on site. Also, since glass is a brittle
material with high material variability, even fibers bond in the same way may fail under very
different strains. Signal intensity change due to fiber breakage is hence not very useful if
8 Leung and Wan et al
accurate quantitative information is required. Bending of an optical fiber is another way to
induce change in the light intensity. In a straight optical fiber, the light wave is guided within
the core of the optical fiber. As the fiber is bent, part of the light will escape through the
cladding into the surrounding. The light intensity passing through the fiber is hence reduced.
Sensors based on a fiber loop have been developed by Wolff and Messelier [?] and Ansari et
al [?]. For these sensors, the fiber loops are coupled to a concrete structure in such a way that
cracking will induce change in the loop geometry and hence the amount of bending loss. The
formation and opening of cracks can hence be monitored.
Monitoring of signal intensity can also be employed to study the chemical condition of a
certain environment. For example, a thin reflective film can be coated on the smooth cleaved
end of an optical fiber. If the presence of a certain chemical will lead to depletion of the film,
the fiber can be employed as a sensor for that particular chemical. By leaving the fiber in a
certain environment, a sudden drop in reflected signal indicates significant loss of the coated
film, which reveals the presence of the chemical.
Intensity monitoring exhibits an inherent problem. The light source itself may fluctuate
in power over time. Also, local microbending along the connecting fiber induces losses
that vary with time and the insertion loss may vary if the connection is removed after each
measurement. Therefore, the measured change in signal intensity is not necessarily due
to change in the measured parameter alone. If the magnitude of a reflected signal is to be
measured, the above-mentioned problem can be alleviated with the use of a time domain
reflectometer (which will be discussed further in Section 2.5), where the reflected signal is
compared directly to the signal right before the reflection point to obtain a relative reading
that is not affected by light intensity of the source or losses at other points.
Review: Optical Fiber Sensors for Civil Engineering Applications 9
2.2 Interferometry
Interferometry involves the combination of two separate light signals from the same source.
To explain the technique, it is best to consider the Mach-Zehnder interferometer in which a
light beam is split and coupled into two separate fibers. One fiber is attached to a structure
while the other is left free. At the other end, signal from the two fibers are re-combined
and monitored. When the structure is loaded, the length of the attached fiber will change,
leading to an increase in optical path for the light. The corresponding phase shift will lead to
a periodic variation of light intensity when light from the two fibers are re-combined. Since
each fringe (or complete periodic variation of light intensity) corresponds to a change in
length equal to the wavelength of light, which is around one micron, counting the number of
fringes can provide enough resolution for the measurement of relative large strains. For small
strain measurements, feedback loops can be employed to convert the periodic intensity into a
linearly varying in voltage output [?].
The Mach-Zehnder interferometer has several disadvantages. Two fibers need to be
used at each sensing point. Very tight control of bonded fiber length is required to ensure a
consistent gauge length, so the measured length change can be correctly translated into a strain
value. Also, when low-cost light sources such as LED are employed, the low coherence length
requires close matching of the length of the attached and free fibers. In the instrumentation
of large structures, long fiber lengths are required and close length matching can be very
difficult.
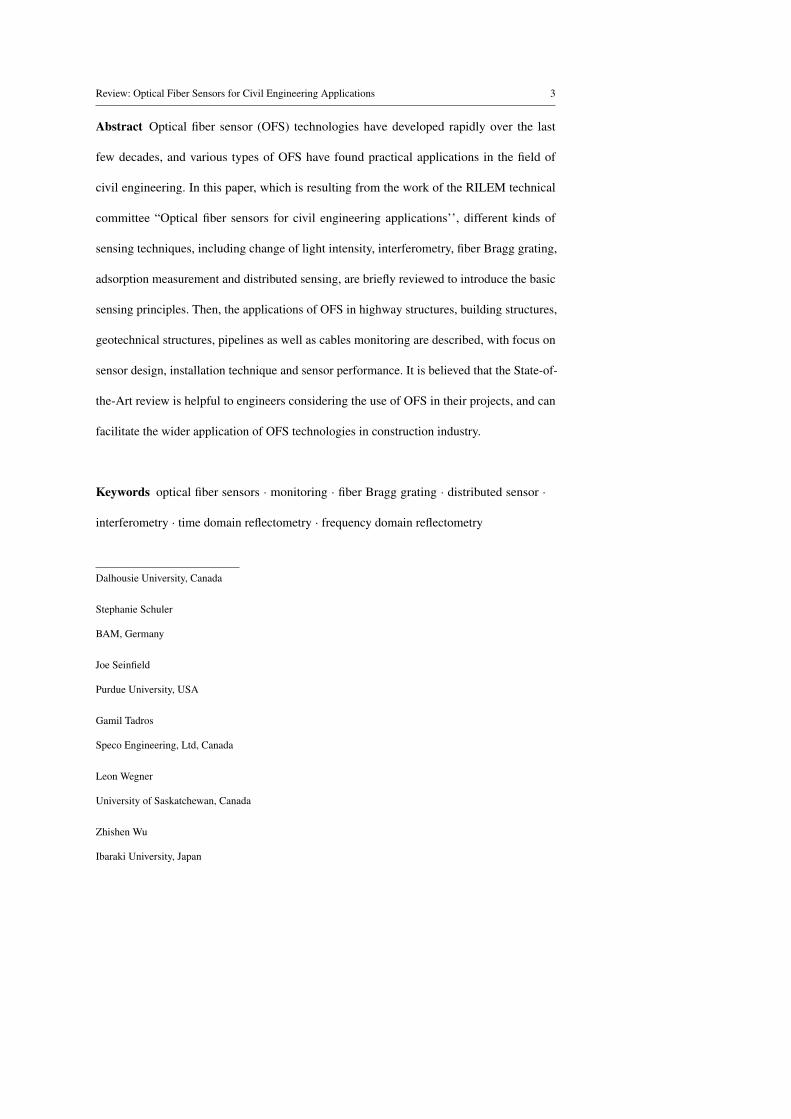
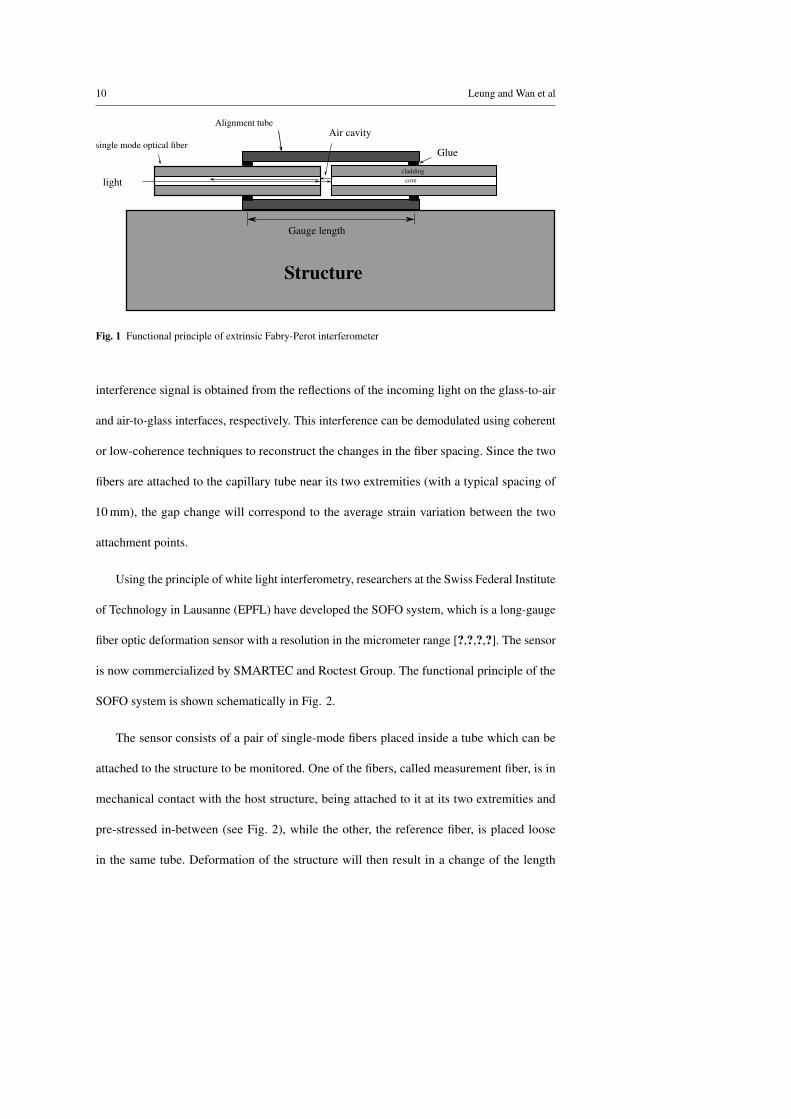
To overcome the above shortcomings, the extrinsic Fabry-Perot Interferometer (EFPI)
can be employed [?,?,?]. The EFPI is constituted by a capillary tube containing two cleaved
optical fibers facing each other (Fig. 1), but leaving an air gap of a few microns or tens
of microns between them. When light is launched into one of the fibers, a back-reflected
10 Leung and Wan et al
Structure
Air cavity
Glue
Gauge length
Alignment tube
corecladding
light
single mode optical fiber
Fig. 1 Functional principle of extrinsic Fabry-Perot interferometer
interference signal is obtained from the reflections of the incoming light on the glass-to-air
and air-to-glass interfaces, respectively. This interference can be demodulated using coherent
or low-coherence techniques to reconstruct the changes in the fiber spacing. Since the two
fibers are attached to the capillary tube near its two extremities (with a typical spacing of
10 mm), the gap change will correspond to the average strain variation between the two
attachment points.
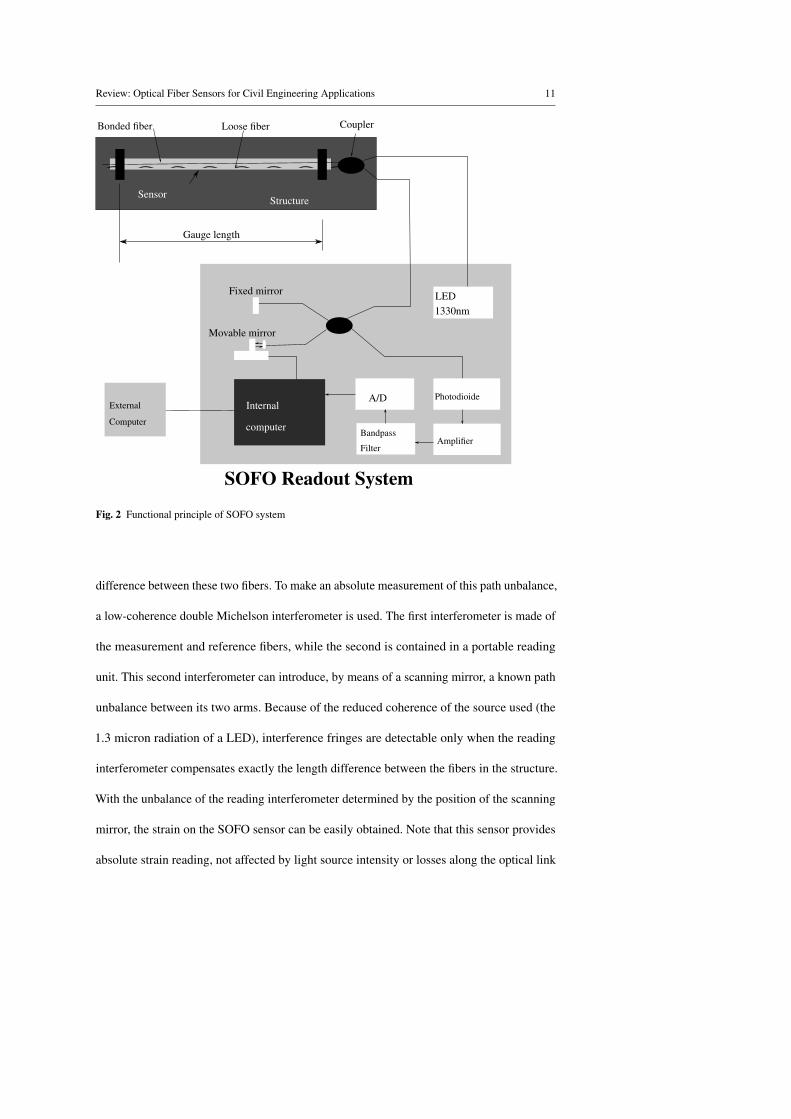
Using the principle of white light interferometry, researchers at the Swiss Federal Institute
of Technology in Lausanne (EPFL) have developed the SOFO system, which is a long-gauge
fiber optic deformation sensor with a resolution in the micrometer range [?,?,?,?]. The sensor
is now commercialized by SMARTEC and Roctest Group. The functional principle of the
SOFO system is shown schematically in Fig. 2.
The sensor consists of a pair of single-mode fibers placed inside a tube which can be
attached to the structure to be monitored. One of the fibers, called measurement fiber, is in
mechanical contact with the host structure, being attached to it at its two extremities and
pre-stressed in-between (see Fig. 2), while the other, the reference fiber, is placed loose
in the same tube. Deformation of the structure will then result in a change of the length
Review: Optical Fiber Sensors for Civil Engineering Applications 11
InternalExternal
LED
Bandpass
Fixed mirror
Movable mirror
A/D
Amplifier
Photodioide
StructureSensor
Bonded fiber Loose fiber Coupler
Gauge length
SOFO Readout System
Computer computer
Filter
1330nm
Fig. 2 Functional principle of SOFO system
difference between these two fibers. To make an absolute measurement of this path unbalance,
a low-coherence double Michelson interferometer is used. The first interferometer is made of
the measurement and reference fibers, while the second is contained in a portable reading
unit. This second interferometer can introduce, by means of a scanning mirror, a known path
unbalance between its two arms. Because of the reduced coherence of the source used (the
1.3 micron radiation of a LED), interference fringes are detectable only when the reading
interferometer compensates exactly the length difference between the fibers in the structure.
With the unbalance of the reading interferometer determined by the position of the scanning
mirror, the strain on the SOFO sensor can be easily obtained. Note that this sensor provides
absolute strain reading, not affected by light source intensity or losses along the optical link
12 Leung and Wan et al
as well as change of temperature that affects both fibers equally so the effects cancel each
other.
2.3 Fiber Bragg Gratings
A Bragg grating is a periodic variation of refractive index along the length of the fiber,
normally about 10 mm in total length. Gratings with periods Λ are commonly fabricated by
holographic [?] or phase-mask technique [?,?]. The working principle of the Bragg grating
sensor is shown in Fig. 3. When a broadband or tunable signal passes through the optical
fiber, the wavelength corresponding to the period of index variation (λB) will be preferentially
reflected. The relationship between Bragg wavelength and the periodic spacing of the grating
is given by Equation 1 [?,?].
λB = 2neΛ (1)
where ne is the effective refractive index of the core of the grating. When the fiber is under
mechanical strain (εmech ) or temperature variation (∆T ), the index variation period will
change, leading to a peak shift in the reflected wavelength. To perform measurement, a tunable
laser, spectrometer or wavelength filter is normally employed. The relationship between the
shift of Bragg wavelength and the total induced axial strain is given by Equation 2.
∆λB
λB= (1− pe )εmech+(α +ζ )∆T (2)
where pe, α and ζ are strain-optic coefficient, thermal expansion coefficient and thermal-
optic coefficient, respectively. To compensate the thermal induced strain, additional thermal
compensation FBG sensor should be installed in the same sensing region. The wavelength of
the thermal compensation FBG sensor (λT ) is different from the mechanical strain sensitive
FBG sensor and it should be isolated from any mechanical strain. The mechanical induced

Review: Optical Fiber Sensors for Civil Engineering Applications 13
λ1
Λ1
Board band
Core
Cladding
Λ2
λ2
incident light
Fig. 3 Working principle of fiber Bragg grating
strain can be estimated from the change in Bragg wavelength of the total strain and thermal
induced strain by Equation 3.
εmech =1
1− pe
(∆λB
λB− ∆λT
λT
)(3)
When strain values are required at more than one point along the fiber, gratings of
different periods can be placed at the corresponding points. The reflected signal will then
exhibit a number of peaks corresponding to individual gratings. By monitoring the shifts of
all the peaks, strain at each point can be deduced. Typically, 4 to 16 gratings can be measured
on a single fiber line. It should be noticed that since the gratings have to share the spectrum
of the source used to illuminate them, there is a trade-off between the number of gratings and
the dynamic range of their measurements.
2.4 Absorption measurement
Absorption measurement is normally employed for the sensing of chemicals. For example,
when light is sent through an optical fiber into a chemical environment with preferential
absorption of a particular wavelength, the spectrum of the reflected signal will show a drop
in the absorbed wavelength. Similarly, one can design a sensor with two flat-end fibers
separated by a small gap. Light passing through the gap will exhibit a change in its spectrum
if chemicals that absorb certain wavelengths are present in the surrounding environment and
enter the inter-fiber gap. Absorption spectroscopy is to measure the electromagnetic radiation
14 Leung and Wan et al
absorbed by atoms, molecules or other chemical entities. In microwave spectroscopy, the
absorption is accompanied by a transition from one rotational energy level of a molecule
to another. In infrared spectroscopy, the transition is from one vibrational energy level of
a molecule to another. In ultraviolet-visible electronic absorption spectroscopy, transition
levels relate to valence electrons in the molecule.
For a step-index multimode optical fiber, the number of possible modes guided through the
fiber increases with increasing core diameter and wavelength. The energy guided through the
core by total internal reflection also generates a surface-specific, electromagnetic disturbance
at the interface between the two dielectric media (the core and the cladding). There is a
standing wave at every point of interface incidence. This harmonic wave, which penetrates
the cladding over a small distance, is called the evanescent field. For chemical sensing,
the cladding is replaced by chromoionophores which are indicator molecules that, in the
presence of specific ions (H+, Ca2+, Cl−, K+, etc.), exhibit a change in color, i.e. a change
in the absorption spectrum. As chromoionophores exhibiting unique absorption spectra with
different wavelengths of maximum absorption (λmax) in the absence/presence of the specific
ions, chemical sensing can be performed by sending a broad band light signal into the fiber
and measuring the spectrum at the other side.
2.5 Time domain reflectometry
Developed for telecommunication applications, OTDRs (Optical Time Domain Reflectome-
ters) have been the starting point of distributed sensing techniques. Conventionally, the
Rayleigh scattered light has been used to measure the attenuation profiles of long-haul fiber
optics links. In OTDR technique, a short optical pulse is launched into the fiber and a photo
detector measures the amount of light that is backscattered as the pulse propagates down the
Review: Optical Fiber Sensors for Civil Engineering Applications 15
Raman Raman
Brillouin
Rayleigh
Brillouin
Anti-stokes components Stokes components
Wavelengthλ0
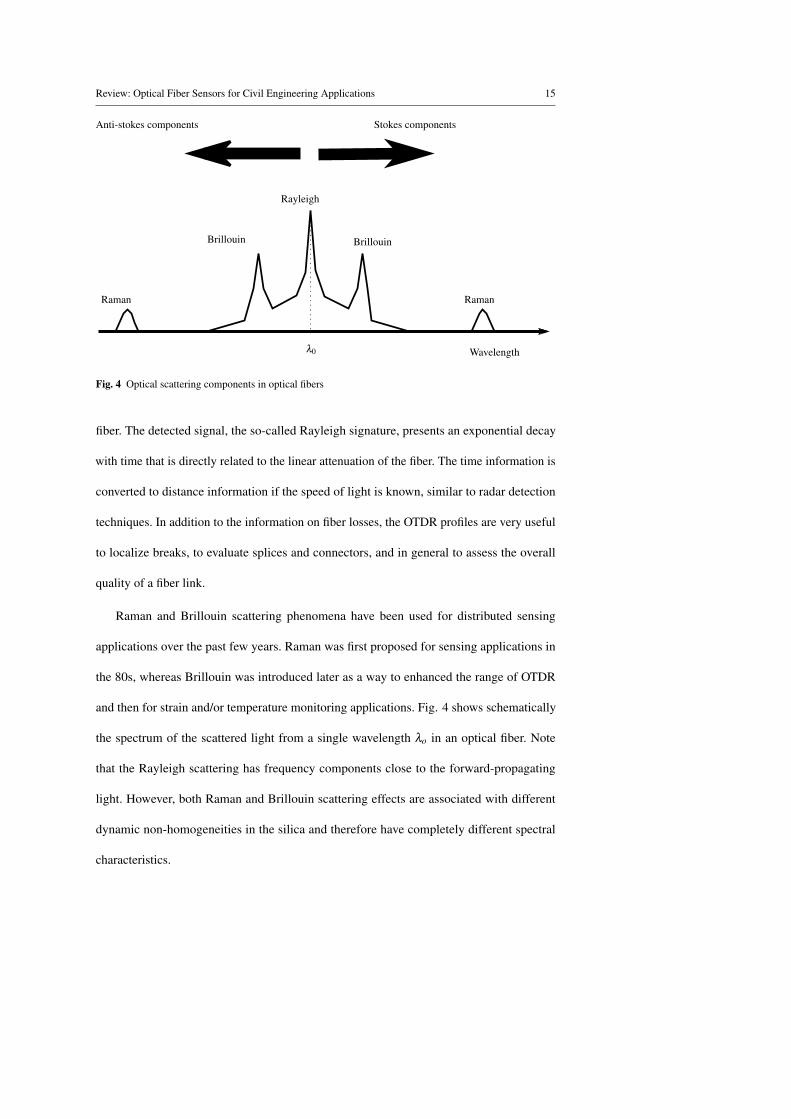
Fig. 4 Optical scattering components in optical fibers
fiber. The detected signal, the so-called Rayleigh signature, presents an exponential decay
with time that is directly related to the linear attenuation of the fiber. The time information is
converted to distance information if the speed of light is known, similar to radar detection
techniques. In addition to the information on fiber losses, the OTDR profiles are very useful
to localize breaks, to evaluate splices and connectors, and in general to assess the overall
quality of a fiber link.
Raman and Brillouin scattering phenomena have been used for distributed sensing
applications over the past few years. Raman was first proposed for sensing applications in
the 80s, whereas Brillouin was introduced later as a way to enhanced the range of OTDR
and then for strain and/or temperature monitoring applications. Fig. 4 shows schematically
the spectrum of the scattered light from a single wavelength λo in an optical fiber. Note
that the Rayleigh scattering has frequency components close to the forward-propagating
light. However, both Raman and Brillouin scattering effects are associated with different
dynamic non-homogeneities in the silica and therefore have completely different spectral
characteristics.
16 Leung and Wan et al
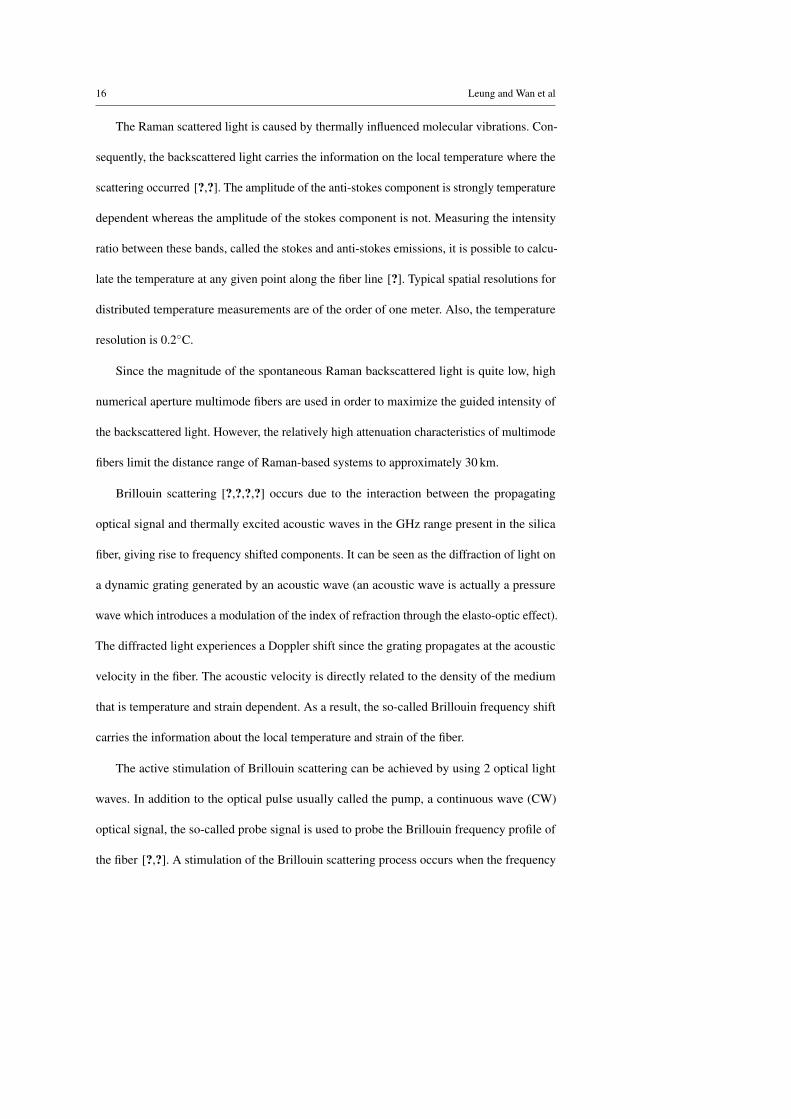
The Raman scattered light is caused by thermally influenced molecular vibrations. Con-
sequently, the backscattered light carries the information on the local temperature where the
scattering occurred [?,?]. The amplitude of the anti-stokes component is strongly temperature
dependent whereas the amplitude of the stokes component is not. Measuring the intensity
ratio between these bands, called the stokes and anti-stokes emissions, it is possible to calcu-
late the temperature at any given point along the fiber line [?]. Typical spatial resolutions for
distributed temperature measurements are of the order of one meter. Also, the temperature
resolution is 0.2◦C.
Since the magnitude of the spontaneous Raman backscattered light is quite low, high
numerical aperture multimode fibers are used in order to maximize the guided intensity of
the backscattered light. However, the relatively high attenuation characteristics of multimode
fibers limit the distance range of Raman-based systems to approximately 30 km.
Brillouin scattering [?,?,?,?] occurs due to the interaction between the propagating
optical signal and thermally excited acoustic waves in the GHz range present in the silica
fiber, giving rise to frequency shifted components. It can be seen as the diffraction of light on
a dynamic grating generated by an acoustic wave (an acoustic wave is actually a pressure
wave which introduces a modulation of the index of refraction through the elasto-optic effect).
The diffracted light experiences a Doppler shift since the grating propagates at the acoustic
velocity in the fiber. The acoustic velocity is directly related to the density of the medium
that is temperature and strain dependent. As a result, the so-called Brillouin frequency shift
carries the information about the local temperature and strain of the fiber.
The active stimulation of Brillouin scattering can be achieved by using 2 optical light
waves. In addition to the optical pulse usually called the pump, a continuous wave (CW)
optical signal, the so-called probe signal is used to probe the Brillouin frequency profile of
the fiber [?,?]. A stimulation of the Brillouin scattering process occurs when the frequency
Review: Optical Fiber Sensors for Civil Engineering Applications 17
difference (or wavelength separation) of the pulse and the CW signal corresponds to the
Brillouin shift (resonance condition) and provided that both optical signals are counter-
propagating in the fiber. The interaction leads to a larger scattering efficiency resulting in an
energy transfer from the pulse to the probe signal, and an amplification of the probe signal.
The frequency difference between pulse and probe can be scanned for precise and global
mapping of the Brillouin shift along the sensing fiber. At every location, the maximum of the
Brillouin gain is computed and the information transformed to temperature or strain using the
appropriate calibration coefficients. The probe signal intensity can be adjusted to acceptable
levels for low-noise fast acquisition whatever the measurement conditions and fiber layout,
thus solving the main problem that is generally associated with distributed sensing based on
spontaneous light scattering.
For applications where the sensing area is located more than 25 km away from the
instrument, it is possible to boost the optical signal using light amplifiers: the so-called
range extender modules. The module performs active signal regeneration by using optical
amplification techniques similar to those extensively used in optical telecommunications. The
modules can be cascaded leading to remote distances in excess of hundreds of kilometers.
For distributed temperature measurements, both the Brillouin and Raman OTDR can be
employed. For distributed strain sensing, the Brillouin OTDR is the most powerful. Since
the Brillouin frequency shift depends on both the local strain and temperature of the fiber,
the sensor configuration will determine the actual sensitivity of the system. For measuring
temperature, it is sufficient to use a standard telecommunication cable that shields the optical
fibers from mechanical strain. The fiber will therefore remain in its unstrained state and
the frequency shifts can be unambiguously assigned to temperature variations. For strain
measurement, the sensor configuration should be designed to ensure proper mechanical
coupling between the sensor and the host structure along the whole length of the fiber. To
18 Leung and Wan et al
resolve the cross-sensitivity to temperature variations, it is also necessary to install a reference
fiber along the strain sensor. Knowing the frequency shift of the unstrained fiber allows an
absolute strain measurement.
2.6 Frequency domain reflectometry
When the spatial resolution of OTDR systems is reduced to millimeters scale, it requires a
data acquisition device with a bandwidth of 10 GHz and a sampling rate of tens of G Sample/s.
At the same time, the pulse generator should output sufficiently high energy in a very short
duration and the light detection device should be sensitive enough to measure the scattered
signal with sufficient signal-to-noise ratio. All these factors make the high spatial resolution
OTDR-based distributed sensor very expensive. A cost effective distributed sensor with
millimeter scale spatial resolution has been developed based on the optical frequency domain
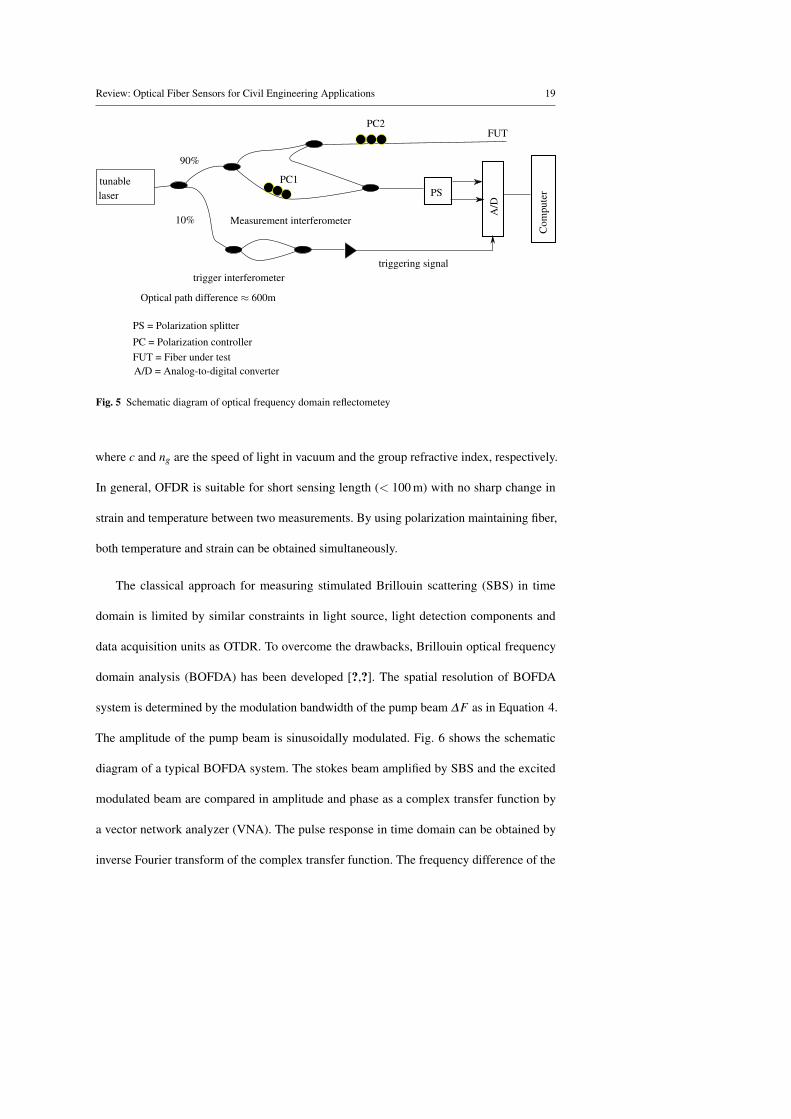
reflectometry (OFDR) of Rayleigh scattering [?,?,?,?]. Instead of measuring the intensity
of Rayleigh backscattered signal, OFDR measures the interference fringes of the Rayleigh
scattered light from a tunable laser source and a static reference fiber in frequency domain.
The amplitude and phase in frequency domain is converted into time/spatial domain by
inverse Fourier transform. Although Rayleigh scattering itself is independent of temperature
and strain, a change of path difference between the sensing fiber and the reference fiber with
fixed length of local oscillator in the interferometer provides temperature and strain variation
induced phase differences through index variation, which can be measured at each fiber
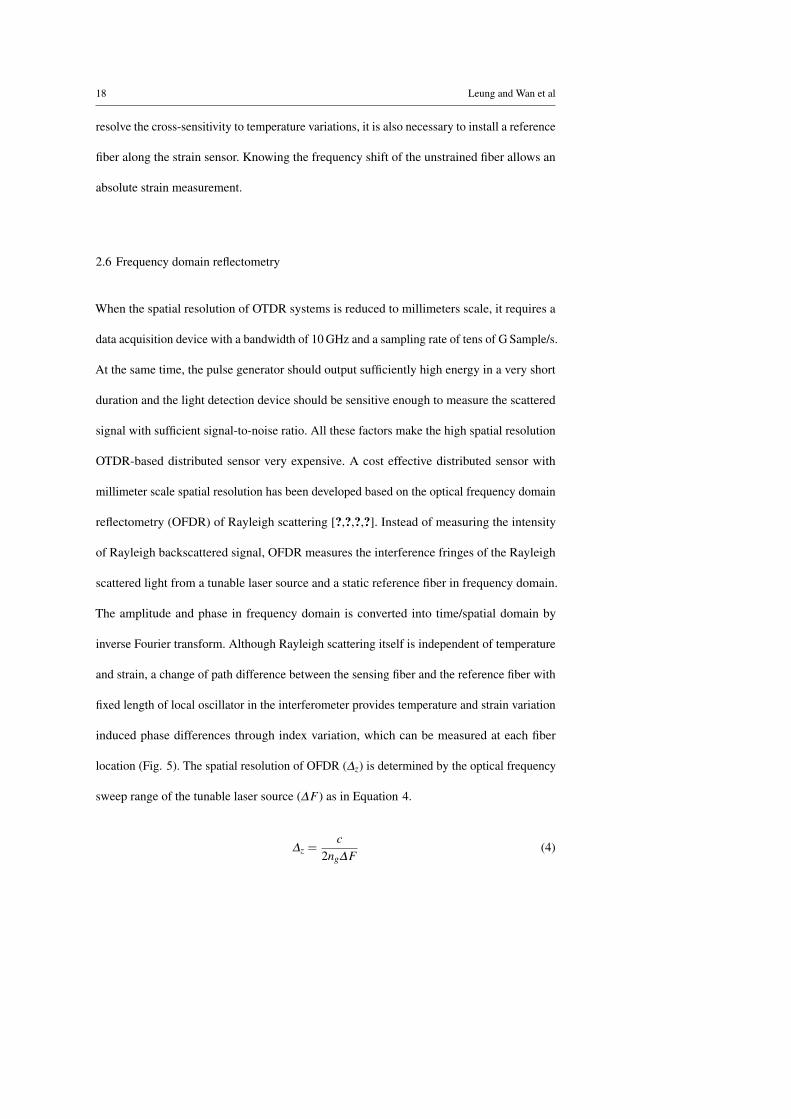
location (Fig. 5). The spatial resolution of OFDR (∆z) is determined by the optical frequency
sweep range of the tunable laser source (∆F) as in Equation 4.
∆z =c
2ng∆F(4)
Review: Optical Fiber Sensors for Civil Engineering Applications 19
tunablelaser
trigger interferometertriggering signal
10%
90%
Measurement interferometer
A/D
Com
pute
rPS
Optical path difference ≈ 600m
PC1
PS = Polarization splitter
PC = Polarization controllerFUT = Fiber under test
PC2FUT
A/D = Analog-to-digital converter
Fig. 5 Schematic diagram of optical frequency domain reflectometey
where c and ng are the speed of light in vacuum and the group refractive index, respectively.
In general, OFDR is suitable for short sensing length (< 100 m) with no sharp change in
strain and temperature between two measurements. By using polarization maintaining fiber,
both temperature and strain can be obtained simultaneously.
The classical approach for measuring stimulated Brillouin scattering (SBS) in time
domain is limited by similar constraints in light source, light detection components and
data acquisition units as OTDR. To overcome the drawbacks, Brillouin optical frequency
domain analysis (BOFDA) has been developed [?,?]. The spatial resolution of BOFDA
system is determined by the modulation bandwidth of the pump beam ∆F as in Equation 4.
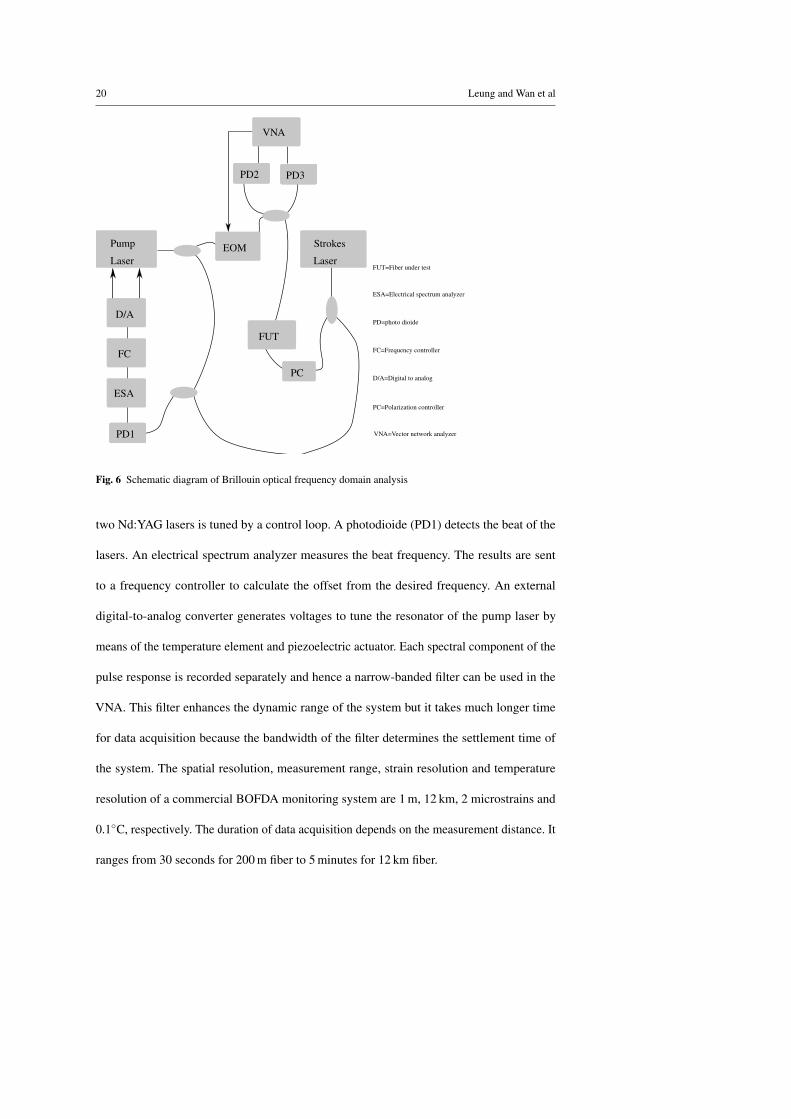
The amplitude of the pump beam is sinusoidally modulated. Fig. 6 shows the schematic
diagram of a typical BOFDA system. The stokes beam amplified by SBS and the excited
modulated beam are compared in amplitude and phase as a complex transfer function by
a vector network analyzer (VNA). The pulse response in time domain can be obtained by
inverse Fourier transform of the complex transfer function. The frequency difference of the
20 Leung and Wan et al
Pump
Laser
Strokes
LaserEOM
PC
VNA
PD1
PD3PD2
D/A
ESA
FC
FUT
FUT=Fiber under test
ESA=Electrical spectrum analyzer
PD=photo dioide
FC=Frequency controller
D/A=Digital to analog
PC=Polarization controller
VNA=Vector network analyzer
Fig. 6 Schematic diagram of Brillouin optical frequency domain analysis
two Nd:YAG lasers is tuned by a control loop. A photodioide (PD1) detects the beat of the
lasers. An electrical spectrum analyzer measures the beat frequency. The results are sent
to a frequency controller to calculate the offset from the desired frequency. An external
digital-to-analog converter generates voltages to tune the resonator of the pump laser by
means of the temperature element and piezoelectric actuator. Each spectral component of the
pulse response is recorded separately and hence a narrow-banded filter can be used in the
VNA. This filter enhances the dynamic range of the system but it takes much longer time
for data acquisition because the bandwidth of the filter determines the settlement time of
the system. The spatial resolution, measurement range, strain resolution and temperature
resolution of a commercial BOFDA monitoring system are 1 m, 12 km, 2 microstrains and
0.1◦C, respectively. The duration of data acquisition depends on the measurement distance. It
ranges from 30 seconds for 200 m fiber to 5 minutes for 12 km fiber.
Review: Optical Fiber Sensors for Civil Engineering Applications 21
3 Civil Engineering Applications of the Optical Fiber Sensors
3.1 Highway Structures
Bridges and highways are important infrastructures. Any closure may lead to heavy traffic
congestion and enormous economic and social costs. Many optical fiber sensors have been
installed on bridges and highways around the world. They monitor the global and local
mechanical behaviors of bridges as well as environmental parameters such as temperature,
pH level, humidity and chloride content. Point sensors are applied at critical components of
the bridge such as bridge cables, anchorages, bridge decks, piers and pavements. Integral
sensors are installed to measure the curvature and deflection of the bridge, as well as the
onset of cracking. Distributed sensors are applied on the pavement to monitor the impact
stress wave generated by high speed vehicles.
3.1.1 Bridges
When a bridge designed many years ago cannot satisfy the current traffic capacity, an
economic solution is to retrofit the existing structure instead of building a new one. The North
and South Versoix bridges in Switzerland were typical examples of bridge upgrade. They
were two parallel twin bridges, each one supporting two lanes of the Swiss National Highway
A9 between Geneva and Lausanne. The bridges were classical parallel prestressed concrete
beams structures supporting a concrete deck and two overhangs. In order to support a third
traffic lane and a new emergency lane, the exterior beams were widened and the overhangs
extended. The construction progressed in two phases: the interior and the exterior overhang
extension. The first phase began by demolishing the existing interior overhang followed by
the reconstruction of a larger one. The second phase consisted of demolishing the old exterior
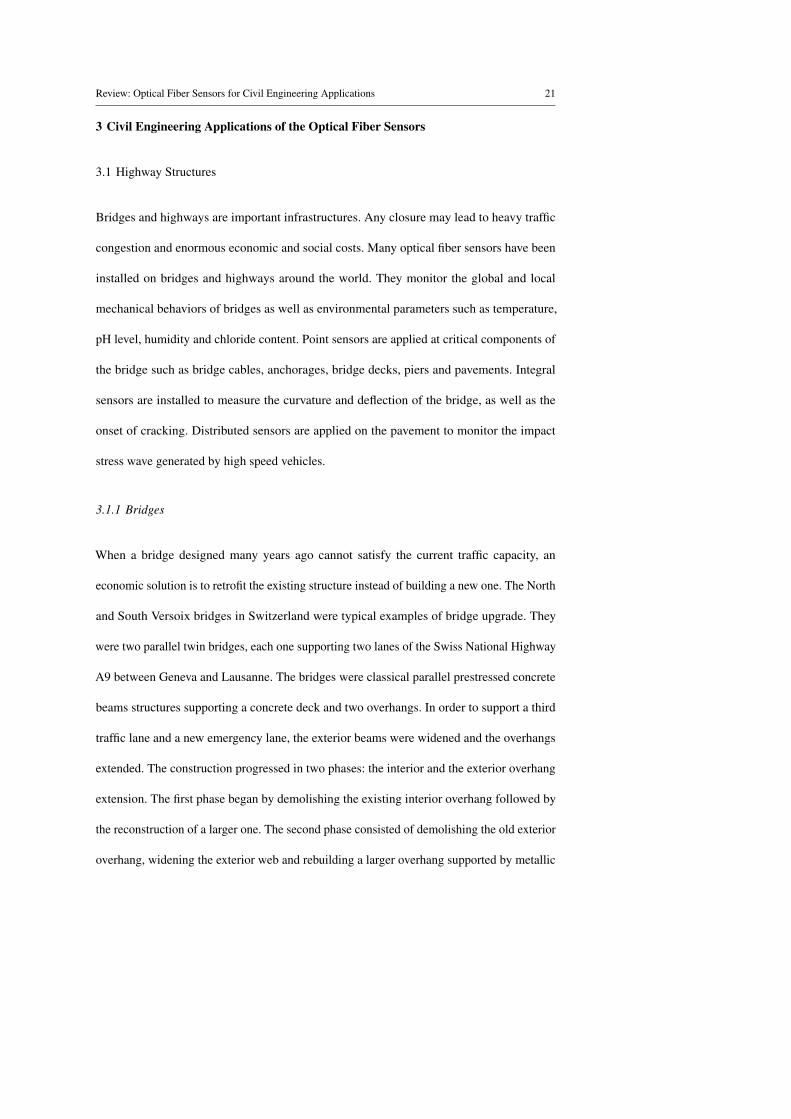
overhang, widening the exterior web and rebuilding a larger overhang supported by metallic
22 Leung and Wan et al
Old bridge
New concrete
Steel truss
Fig. 7 The Versoix Bridge
beams (Fig. 7). More than a hundred long-gauge SOFO interferometers were installed on the
Versoix bridges in order to monitor the deformation due to differential shrinkage between
the old and new concrete. Also, the monitoring demonstrated how the deformation along
the longitudinal direction of the bridge can be used to estimate the vertical deflection of the
beam [?,?,?]. With a pair of SOFO interferometers installed on the compression side and
tension side at the same location (Fig. 8), the local averaged curvature can be computed. The
vertical deflection of the beam can be estimated by integration based on appropriate boundary
conditions.
In 1997, the Waterbury bridge in Vermont, USA was rehabilitated and fiber Bragg grating
(FBG) strain sensors, speckle pattern based vibration sensors [?] and chloride sensors [?,?]
were embedded in the bridge deck [?]. There were three different approaches for the in-
stallation of FBG strain sensors. The first approach was to cast the bare FBG sensors in a
relatively malleable plastic compound (Castolite) and metal pin was placed to locate the
central position of the FBG sensor. The completed Castolite FBG sensor was mounted on the
steel reinforcement before concrete casting. The second approach was to glue the FBG strain

Review: Optical Fiber Sensors for Civil Engineering Applications 23
SOFO sensors
Beam
Fig. 8 The schematic diagram of the position SOFO interferometers on Versoix Bridge
sensor to a 1 m long epoxy-coated steel reinforcement by the same glue used for electrical
strain gauges. The epoxy coating of the steel reinforcement is to protect the steel from
corrosion. The instrumented 1 m long rebar was physically attached to the steel reinforcing
system of the bridge deck. The third approach was to attach the FBG strain sensors directly
on the bridge deck reinforcements by epoxy. The advantage of the second approach over the
third approach is that the second approach can be performed in well controlled environment
while the quality of the third approach depends on weather conditions. The sensing principle
of the 36 installed chloride sensors relies on the color change (from milky white to pink)
when chemical reaction occurs between the water transported chloride ion and the sol-gel
film of the sensor. By varying the chemistry of the sol-gel, the range of the chloride threshold
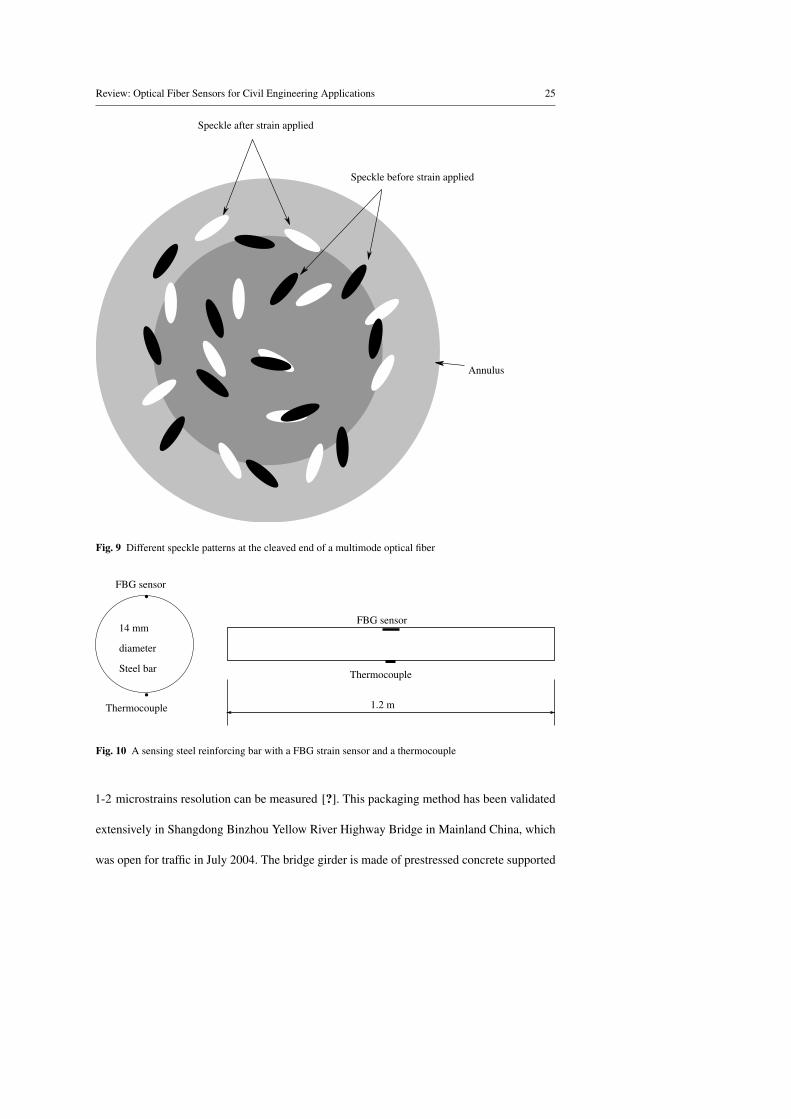
can vary from 20 mg/L to over 2300 mg/L. The vibration sensor consists of a coherent laser
light source, a multimode optical fiber and a photo detector. While the total intensity traveling
through the optical fiber remains the same, the intensity of individual mode varies with the
24 Leung and Wan et al
variation of phase change and it shows different speckle patterns at the cleaved fiber end
due to interference among different modes (Fig. 9). By inserting an opaque annulus in front
of the photo detector, the light intensity detected by the photo detector changes with the
variation of the phase difference induced by the mechanical strain in the sensing region.
When the intensity of the laser source varies sinusoidally, it is possible to shift the frequency
of the vibrating signal into a less noisy region at low frequency range as in civil engineering
infrastructures. In this project, all the lead cables and the access boxes were embedded in
concrete. The access boxes were filled with paper to absorb moisture and keep the cables out
of concrete. They were excavated after removing the wooden formwork. All sensors survived
and showed reasonable values after concrete pouring and excavation of the access boxes.
FBG sensors have also been employed to monitor the internal strain of (i) the box
girder of a prestressed concrete bridge across the Ring Canal in Ghent, Belgium and (ii) the
trough girder of a railway bridge along the rail track Gent-Moeskroen, Belgium during
post-tensioning, proof load tests and in service load. However, as bare FBG sensor is too
fragile to be embedded directly into the structure, different kinds of packaging techniques
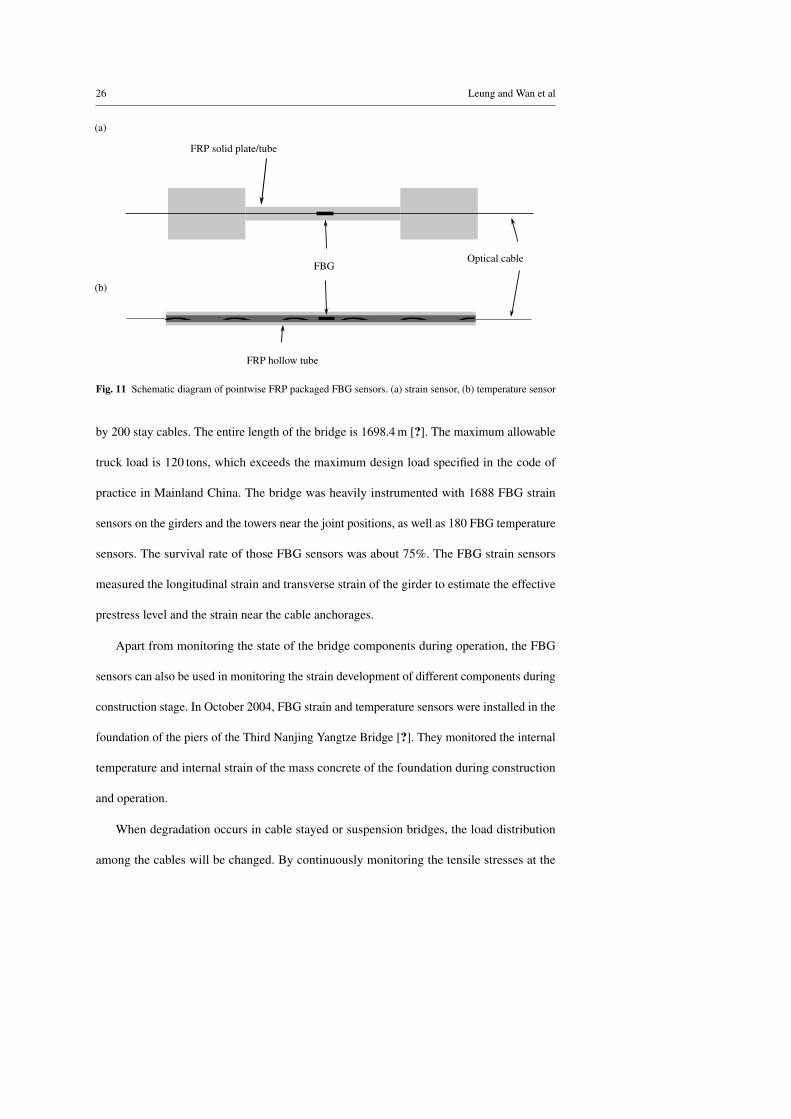
were developed. One approach was to attach FBG sensors on a steel reinforcing bars to be
embedded inside the structure [?]. The sensing bar consisted of a FBG strain sensor and a
thermocouple for temperature compensation. A narrow groove was notched on the bar and
the FBG sensor was attached into the groove with adhesive at the middle of the bar while the
thermocouple was bonded on the opposite side (Fig. 10). The test results showed that the
strain measured by the sensing bars agreed with the results from the mechanical deformeter
(demec).
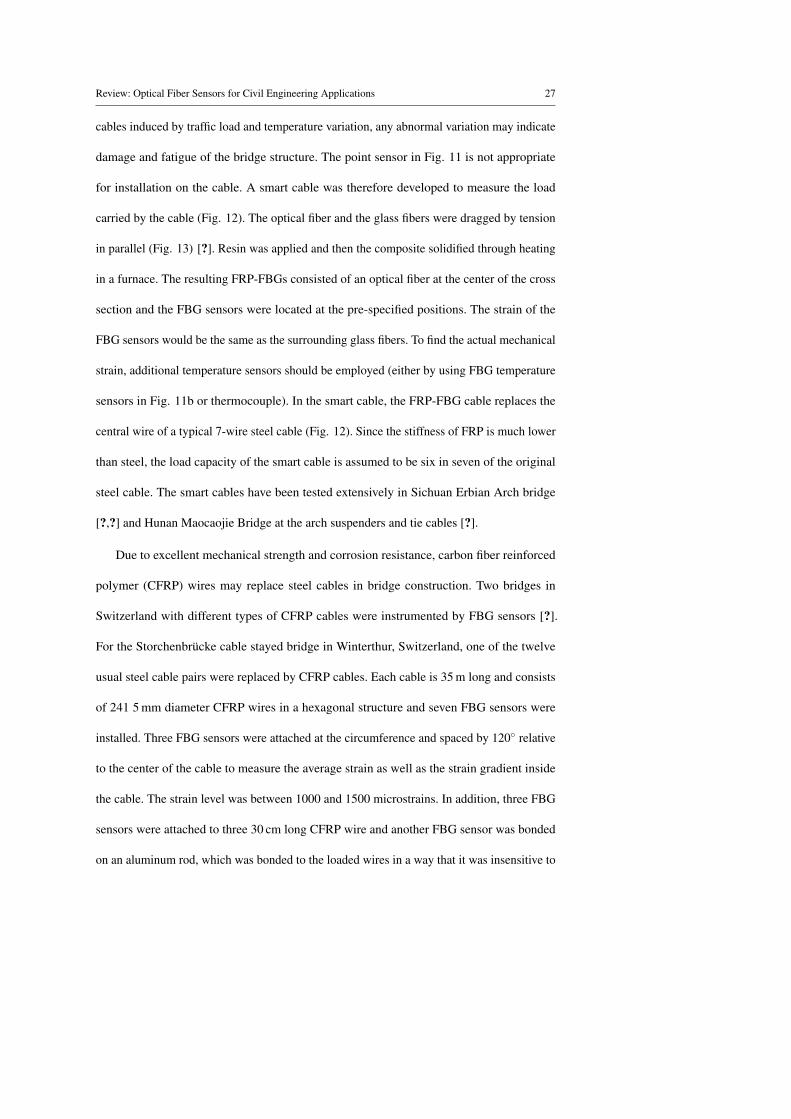
Another approach to package FBG strain and temperature sensors is to embed the sensors
into fiber reinforced polymer (FRP) (Fig. 11). The strain sensors can measure both tensile
and compressive strain with high signal-to-noise ratio. Strain up to 5000 microstrains with
Review: Optical Fiber Sensors for Civil Engineering Applications 25
Annulus
Speckle before strain applied
Speckle after strain applied
Fig. 9 Different speckle patterns at the cleaved end of a multimode optical fiber
FBG sensor
Thermocouple
14 mm
Thermocouple
FBG sensor
1.2 m
Steel bar
diameter
Fig. 10 A sensing steel reinforcing bar with a FBG strain sensor and a thermocouple
1-2 microstrains resolution can be measured [?]. This packaging method has been validated
extensively in Shangdong Binzhou Yellow River Highway Bridge in Mainland China, which
was open for traffic in July 2004. The bridge girder is made of prestressed concrete supported
26 Leung and Wan et al
FRP solid plate/tube
Optical cableFBG
FRP hollow tube
(a)
(b)
Fig. 11 Schematic diagram of pointwise FRP packaged FBG sensors. (a) strain sensor, (b) temperature sensor
by 200 stay cables. The entire length of the bridge is 1698.4 m [?]. The maximum allowable
truck load is 120 tons, which exceeds the maximum design load specified in the code of
practice in Mainland China. The bridge was heavily instrumented with 1688 FBG strain
sensors on the girders and the towers near the joint positions, as well as 180 FBG temperature
sensors. The survival rate of those FBG sensors was about 75%. The FBG strain sensors
measured the longitudinal strain and transverse strain of the girder to estimate the effective
prestress level and the strain near the cable anchorages.
Apart from monitoring the state of the bridge components during operation, the FBG
sensors can also be used in monitoring the strain development of different components during
construction stage. In October 2004, FBG strain and temperature sensors were installed in the
foundation of the piers of the Third Nanjing Yangtze Bridge [?]. They monitored the internal
temperature and internal strain of the mass concrete of the foundation during construction
and operation.
When degradation occurs in cable stayed or suspension bridges, the load distribution
among the cables will be changed. By continuously monitoring the tensile stresses at the
Review: Optical Fiber Sensors for Civil Engineering Applications 27
cables induced by traffic load and temperature variation, any abnormal variation may indicate
damage and fatigue of the bridge structure. The point sensor in Fig. 11 is not appropriate
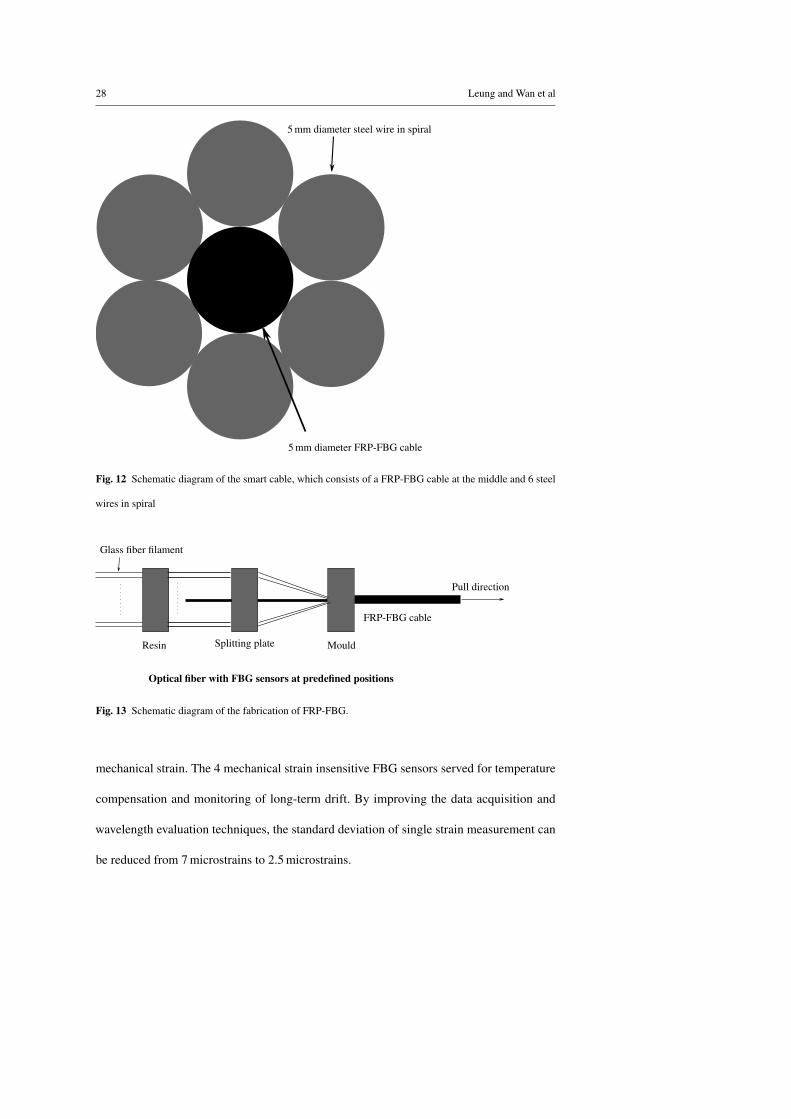
for installation on the cable. A smart cable was therefore developed to measure the load
carried by the cable (Fig. 12). The optical fiber and the glass fibers were dragged by tension
in parallel (Fig. 13) [?]. Resin was applied and then the composite solidified through heating
in a furnace. The resulting FRP-FBGs consisted of an optical fiber at the center of the cross
section and the FBG sensors were located at the pre-specified positions. The strain of the
FBG sensors would be the same as the surrounding glass fibers. To find the actual mechanical
strain, additional temperature sensors should be employed (either by using FBG temperature
sensors in Fig. 11b or thermocouple). In the smart cable, the FRP-FBG cable replaces the
central wire of a typical 7-wire steel cable (Fig. 12). Since the stiffness of FRP is much lower
than steel, the load capacity of the smart cable is assumed to be six in seven of the original
steel cable. The smart cables have been tested extensively in Sichuan Erbian Arch bridge
[?,?] and Hunan Maocaojie Bridge at the arch suspenders and tie cables [?].
Due to excellent mechanical strength and corrosion resistance, carbon fiber reinforced
polymer (CFRP) wires may replace steel cables in bridge construction. Two bridges in
Switzerland with different types of CFRP cables were instrumented by FBG sensors [?].
For the Storchenbrücke cable stayed bridge in Winterthur, Switzerland, one of the twelve
usual steel cable pairs were replaced by CFRP cables. Each cable is 35 m long and consists
of 241 5 mm diameter CFRP wires in a hexagonal structure and seven FBG sensors were
installed. Three FBG sensors were attached at the circumference and spaced by 120◦ relative
to the center of the cable to measure the average strain as well as the strain gradient inside
the cable. The strain level was between 1000 and 1500 microstrains. In addition, three FBG
sensors were attached to three 30 cm long CFRP wire and another FBG sensor was bonded
on an aluminum rod, which was bonded to the loaded wires in a way that it was insensitive to
28 Leung and Wan et al
5 mm diameter steel wire in spiral
5 mm diameter FRP-FBG cable
Fig. 12 Schematic diagram of the smart cable, which consists of a FRP-FBG cable at the middle and 6 steel
wires in spiral
Glass fiber filament
Mould
FRP-FBG cable
Resin
Optical fiber with FBG sensors at predefined positions
Splitting plate
Pull direction
Fig. 13 Schematic diagram of the fabrication of FRP-FBG.
mechanical strain. The 4 mechanical strain insensitive FBG sensors served for temperature
compensation and monitoring of long-term drift. By improving the data acquisition and
wavelength evaluation techniques, the standard deviation of single strain measurement can
be reduced from 7 microstrains to 2.5 microstrains.
Review: Optical Fiber Sensors for Civil Engineering Applications 29
A new steel-concrete-composite footbridge near Luzern, Switzerland was constructed
in 1998. Under the bridge deck, there are two 47 m long, 5 mm diameter CFRP prestressing
cables consisting of 91 wires in hexagonal structure. About 1% to 1.5% prestress strain is
expected. FBG sensors were embedded in the CFRP cables during fabrication to monitor
the strains at the different cross sections of the 4 anchorage heads as well as the prestressed
cables. Each CFRP wire consists of 30 rovings with each containing 12000 7 µm diameter
carbon filaments. The optical fiber was placed at the center of the filaments. Then, the CFRP
wires with the sensing fiber were pulled through a pultrusion machine and two ovens at
temperatures between 170◦C and 190◦C. To fabricate a mechanical strain insensitive FBG
sensor for temperature compensation, the uncoated optical fiber was embedded in a Teflon
tube with inner and outer diameters of 0.3 mm and 0.5 mm, respectively. The reason of
removing the fiber coating inside the Teflon tube is to improve the reproducibility, since
the coating may have different thermal expansion coefficient with the silica fiber, degrades
under high humidity and exhibits stick-slip effect. To connect the embedded optical fiber to
an external measurement system, it was located by elevating the temperature up to 650◦C,
at which the CFRP wire oxidizes while the optical fiber survive. The optical fiber was then
spliced with a lead cable. The splice point was protected by a protective tube filled with epoxy
and reinforced by Kevlar at the fiber exit point for better anchorage. All strained sensors
showed reliable values and only one strained sensor debonded during the half year on-site
measurement.
The major drawback of FBG sensor is the sensitivity to both mechanical and tempera-
ture induced strain. In conventional design, temperature sensors were placed alongside the
mechanical strain sensor. A special packaging technique for FBG strain sensor with self
temperature compensation by using two FBG sensors has also been developed [?]. Two FBG
sensors were connected in series (about 30 mm separation) and sandwiched between two
30 Leung and Wan et al
Polypropylene sandwiches
in metal casing
Optical fiber
FBG strain sensor
Slightly curved FBG temperature sensor
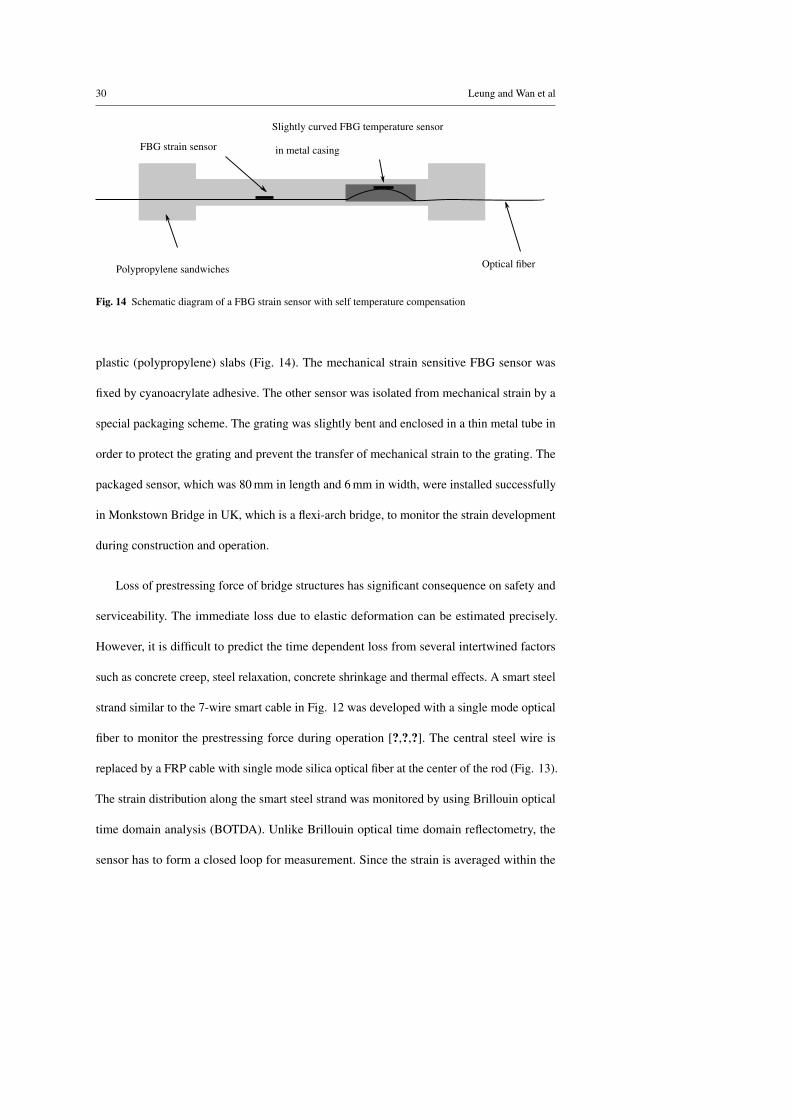
Fig. 14 Schematic diagram of a FBG strain sensor with self temperature compensation
plastic (polypropylene) slabs (Fig. 14). The mechanical strain sensitive FBG sensor was
fixed by cyanoacrylate adhesive. The other sensor was isolated from mechanical strain by a
special packaging scheme. The grating was slightly bent and enclosed in a thin metal tube in
order to protect the grating and prevent the transfer of mechanical strain to the grating. The
packaged sensor, which was 80 mm in length and 6 mm in width, were installed successfully
in Monkstown Bridge in UK, which is a flexi-arch bridge, to monitor the strain development
during construction and operation.
Loss of prestressing force of bridge structures has significant consequence on safety and
serviceability. The immediate loss due to elastic deformation can be estimated precisely.
However, it is difficult to predict the time dependent loss from several intertwined factors
such as concrete creep, steel relaxation, concrete shrinkage and thermal effects. A smart steel
strand similar to the 7-wire smart cable in Fig. 12 was developed with a single mode optical
fiber to monitor the prestressing force during operation [?,?,?]. The central steel wire is
replaced by a FRP cable with single mode silica optical fiber at the center of the rod (Fig. 13).
The strain distribution along the smart steel strand was monitored by using Brillouin optical
time domain analysis (BOTDA). Unlike Brillouin optical time domain reflectometry, the
sensor has to form a closed loop for measurement. Since the strain is averaged within the
Review: Optical Fiber Sensors for Civil Engineering Applications 31
BOTDR
Switch
Coupler
Fiber 1 Fiber 2
Length L1 Length L2
Measuring points of Fiber 2
Measuring points of Fiber 1
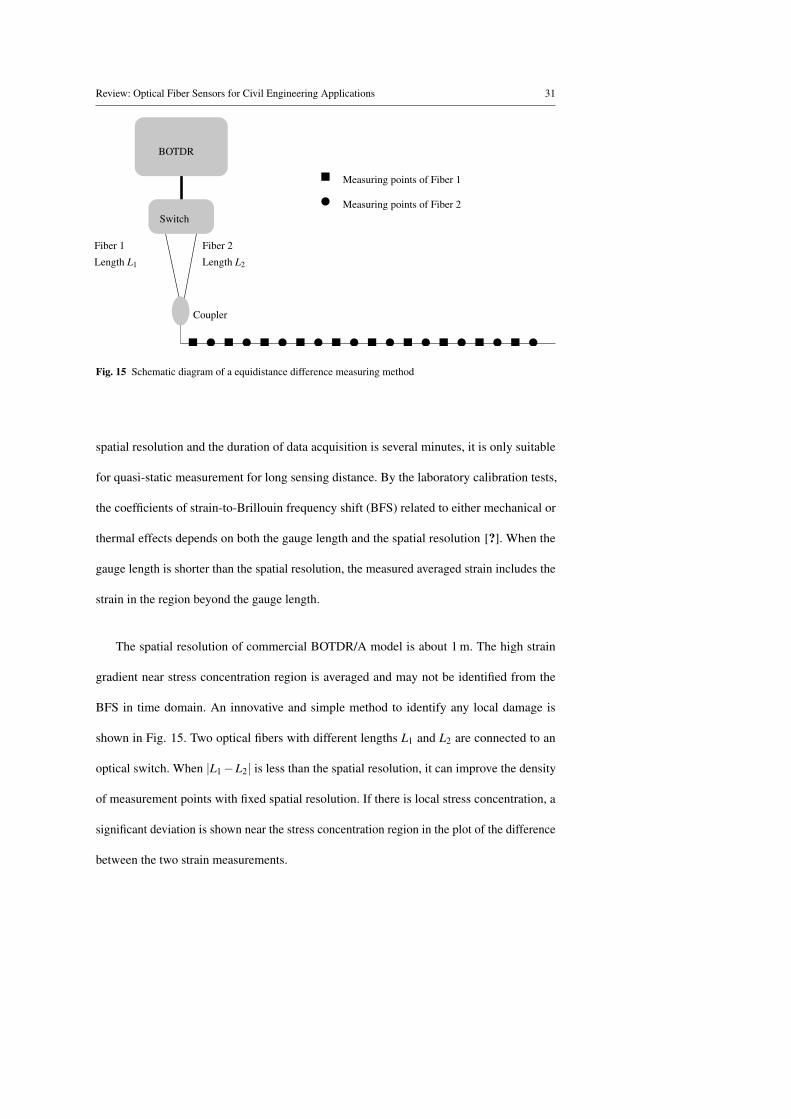
Fig. 15 Schematic diagram of a equidistance difference measuring method
spatial resolution and the duration of data acquisition is several minutes, it is only suitable
for quasi-static measurement for long sensing distance. By the laboratory calibration tests,
the coefficients of strain-to-Brillouin frequency shift (BFS) related to either mechanical or
thermal effects depends on both the gauge length and the spatial resolution [?]. When the
gauge length is shorter than the spatial resolution, the measured averaged strain includes the
strain in the region beyond the gauge length.
The spatial resolution of commercial BOTDR/A model is about 1 m. The high strain
gradient near stress concentration region is averaged and may not be identified from the
BFS in time domain. An innovative and simple method to identify any local damage is
shown in Fig. 15. Two optical fibers with different lengths L1 and L2 are connected to an
optical switch. When |L1−L2| is less than the spatial resolution, it can improve the density
of measurement points with fixed spatial resolution. If there is local stress concentration, a
significant deviation is shown near the stress concentration region in the plot of the difference
between the two strain measurements.
32 Leung and Wan et al
Strain induced by temperature change can be compensated by two optical fibers embedded
in the same matrix. With one of them sensitive to both mechanical and thermal strain (B1)
while the other sensitive only to thermal strain (B2), the mechanical induced strain can be
deduced from Equation 5 with a single calibration coefficient (Kε ) [?].
∆ε =∆νB1−∆νB2
Kε
(5)
where ∆ε , ∆νB1, ∆νB2 and Kε are the mechanical induced strain, BFS of sensor B1, BFS of
sensor B2 and the coefficient of strain-to-BFS, respectively.
The sensing capability can be enhanced by incorporating FBG strain sensors to provide
precise strain measurement at critical positions such as the anchorage points and perform
dynamic strain measurement with sampling rate in range of kilo-hertz. In practical measure-
ment, the FBG interrogator and BOTDA can be coupled as shown in Fig. 16. From the tests
in [?], when the Bragg wavelength does not overlap with the wavelength of the laser of the
distributed sensor, there is no noticeable interaction between FBG sensors and BOTDA. By
incorporating FBG sensors with BOTDA measurement, the mechanical and temperature
induced strain can be decoupled [?]. Assume there is no coupling effect between the me-
chanical and thermal induced strain of both sensors, the change in the Bragg wavelength
(∆λB) and the Brillouin frequency shift (∆νB) are related to the change in mechanical strain
(∆ε) and temperature (∆T ) through the sensitivity coefficients Cελ , CT λ , Cεν and CT ν . The
mechanical induced strain and change in temperature can be obtained uniquely by solving
Equation 6.
∆ε
∆T
=
Cελ CT λ
Cεν CT ν
−1∆λB
∆νB
(6)
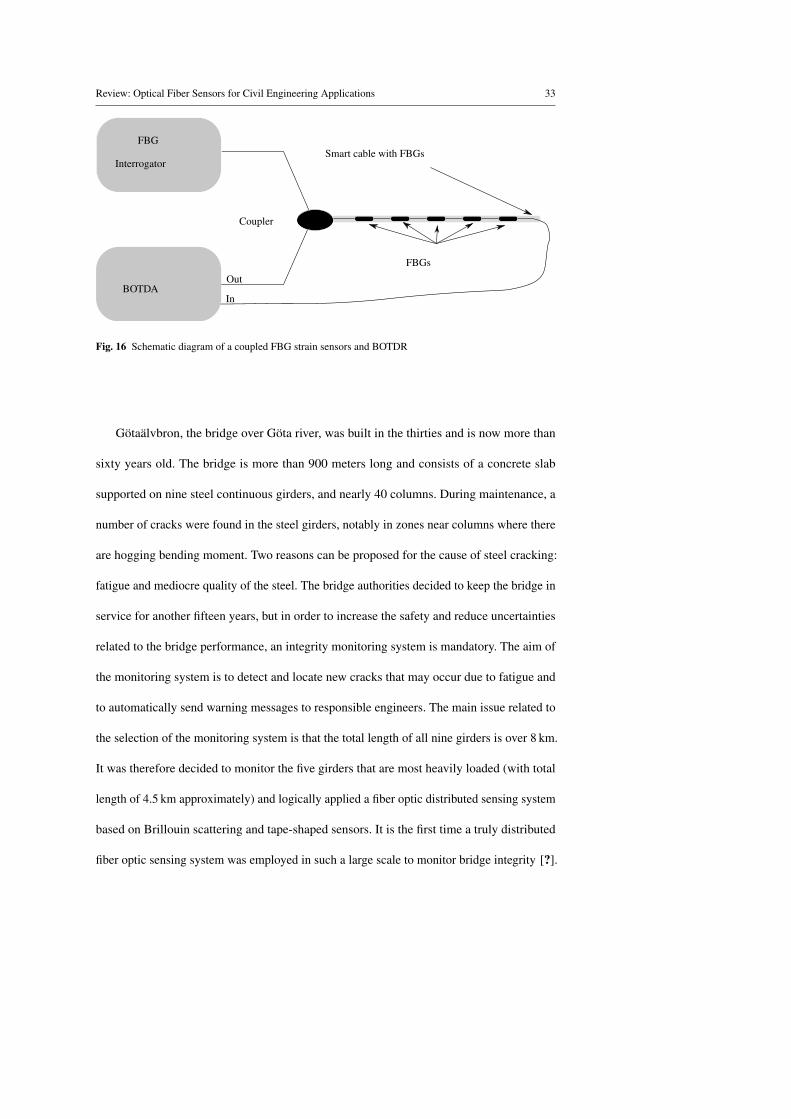
Review: Optical Fiber Sensors for Civil Engineering Applications 33
FBG
Interrogator
BOTDA
Coupler
FBGs
Smart cable with FBGs
Out
In
Fig. 16 Schematic diagram of a coupled FBG strain sensors and BOTDR
Götaälvbron, the bridge over Göta river, was built in the thirties and is now more than
sixty years old. The bridge is more than 900 meters long and consists of a concrete slab
supported on nine steel continuous girders, and nearly 40 columns. During maintenance, a
number of cracks were found in the steel girders, notably in zones near columns where there
are hogging bending moment. Two reasons can be proposed for the cause of steel cracking:
fatigue and mediocre quality of the steel. The bridge authorities decided to keep the bridge in
service for another fifteen years, but in order to increase the safety and reduce uncertainties
related to the bridge performance, an integrity monitoring system is mandatory. The aim of
the monitoring system is to detect and locate new cracks that may occur due to fatigue and
to automatically send warning messages to responsible engineers. The main issue related to
the selection of the monitoring system is that the total length of all nine girders is over 8 km.
It was therefore decided to monitor the five girders that are most heavily loaded (with total
length of 4.5 km approximately) and logically applied a fiber optic distributed sensing system
based on Brillouin scattering and tape-shaped sensors. It is the first time a truly distributed
fiber optic sensing system was employed in such a large scale to monitor bridge integrity [?].
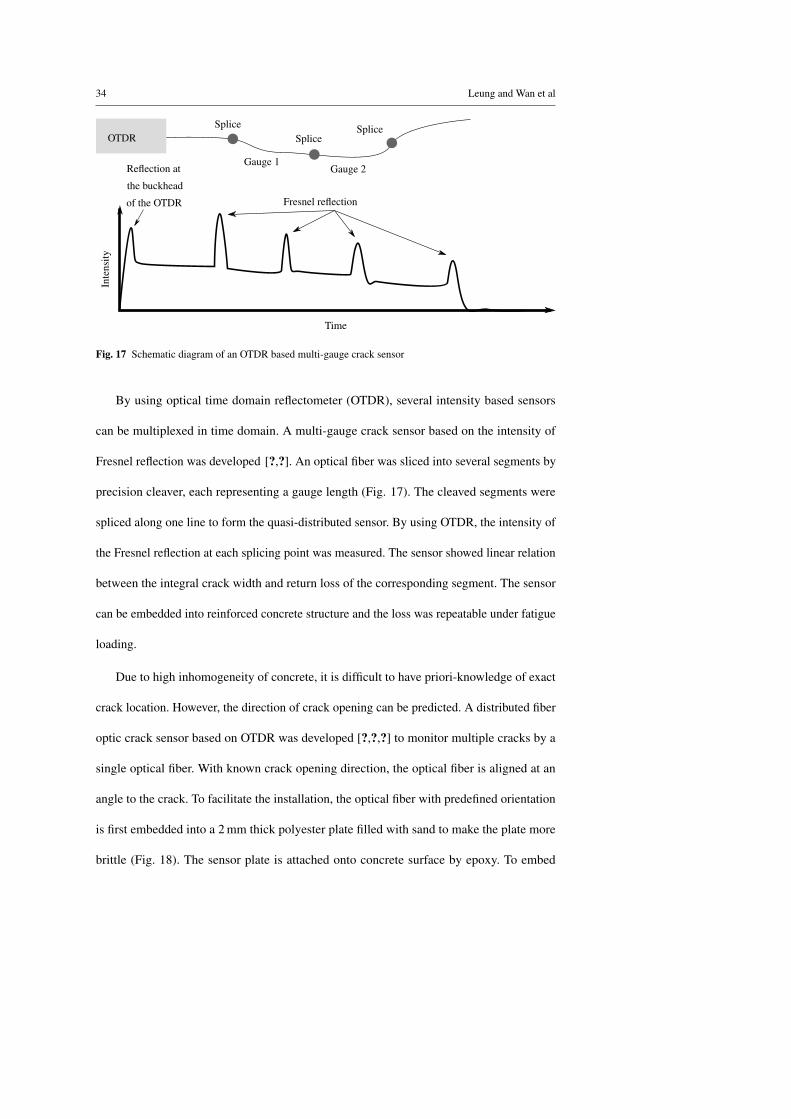
34 Leung and Wan et al
OTDRSplice
SpliceSplice
Gauge 1Gauge 2Reflection at
Fresnel reflection
Time
Inte
nsity
of the OTDR
the buckhead
Fig. 17 Schematic diagram of an OTDR based multi-gauge crack sensor
By using optical time domain reflectometer (OTDR), several intensity based sensors
can be multiplexed in time domain. A multi-gauge crack sensor based on the intensity of
Fresnel reflection was developed [?,?]. An optical fiber was sliced into several segments by
precision cleaver, each representing a gauge length (Fig. 17). The cleaved segments were
spliced along one line to form the quasi-distributed sensor. By using OTDR, the intensity of
the Fresnel reflection at each splicing point was measured. The sensor showed linear relation
between the integral crack width and return loss of the corresponding segment. The sensor
can be embedded into reinforced concrete structure and the loss was repeatable under fatigue
loading.
Due to high inhomogeneity of concrete, it is difficult to have priori-knowledge of exact
crack location. However, the direction of crack opening can be predicted. A distributed fiber
optic crack sensor based on OTDR was developed [?,?,?] to monitor multiple cracks by a
single optical fiber. With known crack opening direction, the optical fiber is aligned at an
angle to the crack. To facilitate the installation, the optical fiber with predefined orientation
is first embedded into a 2 mm thick polyester plate filled with sand to make the plate more
brittle (Fig. 18). The sensor plate is attached onto concrete surface by epoxy. To embed
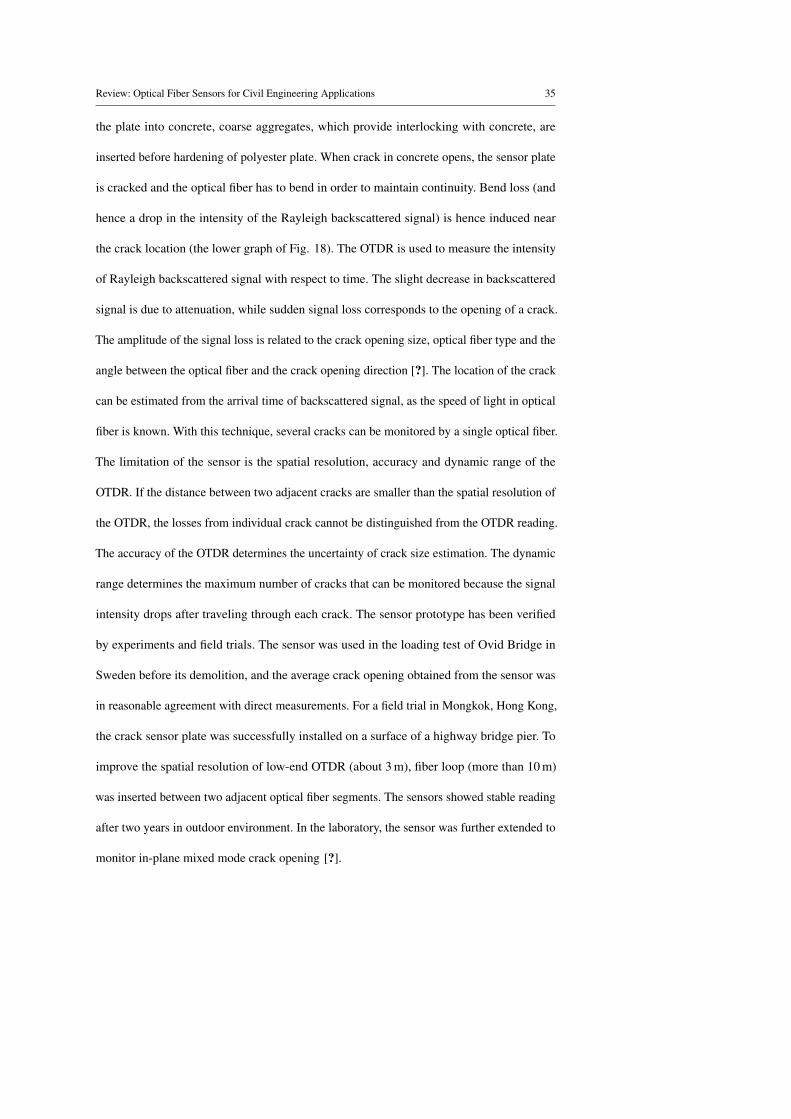
Review: Optical Fiber Sensors for Civil Engineering Applications 35
the plate into concrete, coarse aggregates, which provide interlocking with concrete, are
inserted before hardening of polyester plate. When crack in concrete opens, the sensor plate
is cracked and the optical fiber has to bend in order to maintain continuity. Bend loss (and
hence a drop in the intensity of the Rayleigh backscattered signal) is hence induced near
the crack location (the lower graph of Fig. 18). The OTDR is used to measure the intensity
of Rayleigh backscattered signal with respect to time. The slight decrease in backscattered
signal is due to attenuation, while sudden signal loss corresponds to the opening of a crack.
The amplitude of the signal loss is related to the crack opening size, optical fiber type and the
angle between the optical fiber and the crack opening direction [?]. The location of the crack
can be estimated from the arrival time of backscattered signal, as the speed of light in optical
fiber is known. With this technique, several cracks can be monitored by a single optical fiber.
The limitation of the sensor is the spatial resolution, accuracy and dynamic range of the
OTDR. If the distance between two adjacent cracks are smaller than the spatial resolution of
the OTDR, the losses from individual crack cannot be distinguished from the OTDR reading.
The accuracy of the OTDR determines the uncertainty of crack size estimation. The dynamic
range determines the maximum number of cracks that can be monitored because the signal
intensity drops after traveling through each crack. The sensor prototype has been verified
by experiments and field trials. The sensor was used in the loading test of Ovid Bridge in
Sweden before its demolition, and the average crack opening obtained from the sensor was
in reasonable agreement with direct measurements. For a field trial in Mongkok, Hong Kong,
the crack sensor plate was successfully installed on a surface of a highway bridge pier. To
improve the spatial resolution of low-end OTDR (about 3 m), fiber loop (more than 10 m)
was inserted between two adjacent optical fiber segments. The sensors showed stable reading
after two years in outdoor environment. In the laboratory, the sensor was further extended to
monitor in-plane mixed mode crack opening [?].
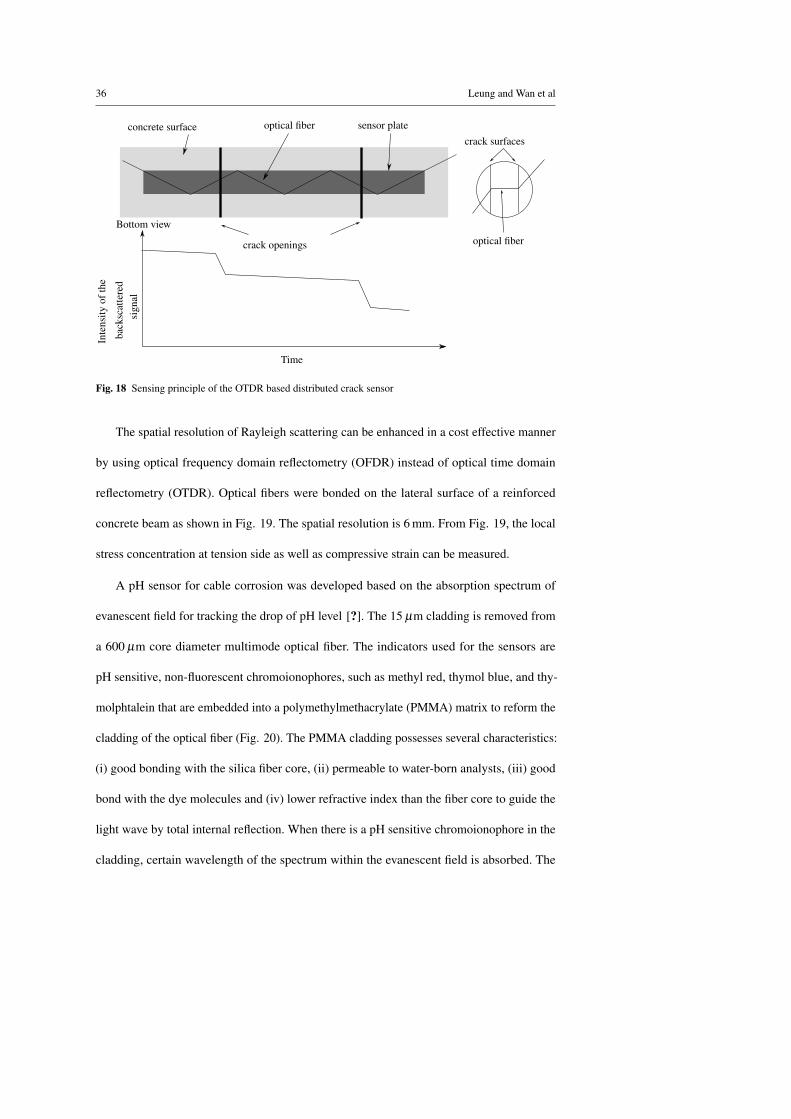
36 Leung and Wan et al
concrete surfacecrack surfaces
sensor plate
optical fiber
Time
optical fiber
Inte
nsity
ofth
e
crack openings
back
scat
tere
dsi
gnal
Bottom view
Fig. 18 Sensing principle of the OTDR based distributed crack sensor
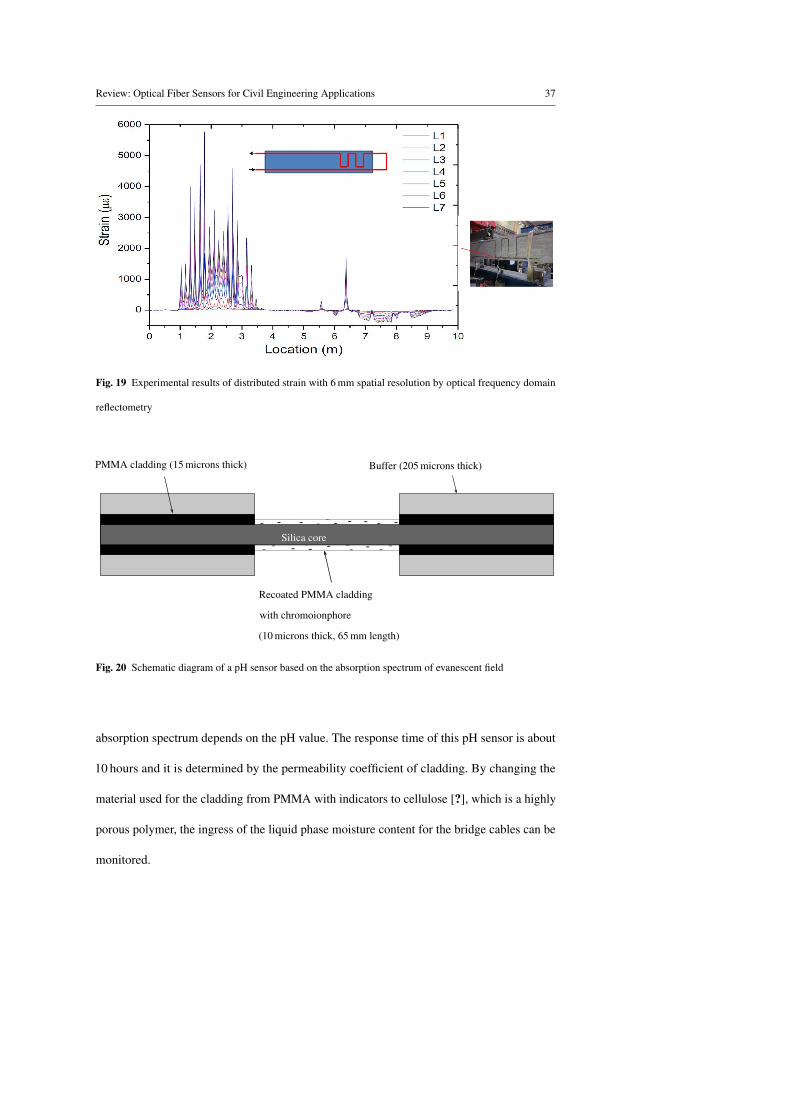
The spatial resolution of Rayleigh scattering can be enhanced in a cost effective manner
by using optical frequency domain reflectometry (OFDR) instead of optical time domain
reflectometry (OTDR). Optical fibers were bonded on the lateral surface of a reinforced
concrete beam as shown in Fig. 19. The spatial resolution is 6 mm. From Fig. 19, the local
stress concentration at tension side as well as compressive strain can be measured.
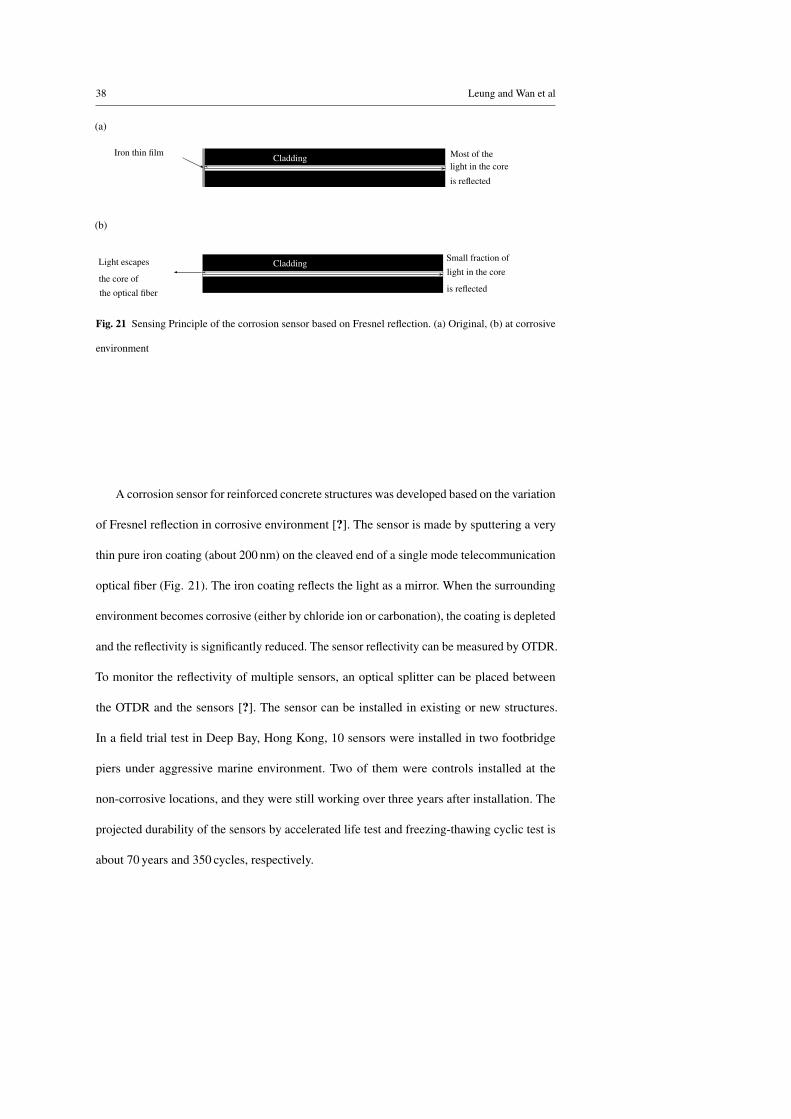
A pH sensor for cable corrosion was developed based on the absorption spectrum of
evanescent field for tracking the drop of pH level [?]. The 15 µm cladding is removed from
a 600 µm core diameter multimode optical fiber. The indicators used for the sensors are
pH sensitive, non-fluorescent chromoionophores, such as methyl red, thymol blue, and thy-
molphtalein that are embedded into a polymethylmethacrylate (PMMA) matrix to reform the
cladding of the optical fiber (Fig. 20). The PMMA cladding possesses several characteristics:
(i) good bonding with the silica fiber core, (ii) permeable to water-born analysts, (iii) good
bond with the dye molecules and (iv) lower refractive index than the fiber core to guide the
light wave by total internal reflection. When there is a pH sensitive chromoionophore in the
cladding, certain wavelength of the spectrum within the evanescent field is absorbed. The
Review: Optical Fiber Sensors for Civil Engineering Applications 37
Fig. 19 Experimental results of distributed strain with 6 mm spatial resolution by optical frequency domain
reflectometry
Recoated PMMA cladding
Buffer (205 microns thick)
Silica core
PMMA cladding (15 microns thick)
(10 microns thick, 65 mm length)
with chromoionphore
Fig. 20 Schematic diagram of a pH sensor based on the absorption spectrum of evanescent field
absorption spectrum depends on the pH value. The response time of this pH sensor is about
10 hours and it is determined by the permeability coefficient of cladding. By changing the
material used for the cladding from PMMA with indicators to cellulose [?], which is a highly
porous polymer, the ingress of the liquid phase moisture content for the bridge cables can be
monitored.
38 Leung and Wan et al
Iron thin film Cladding Most of the
(a)
(b)
Cladding Small fraction ofLight escapes
the core of
the optical fiber
is reflected
light in the core
light in the core
is reflected
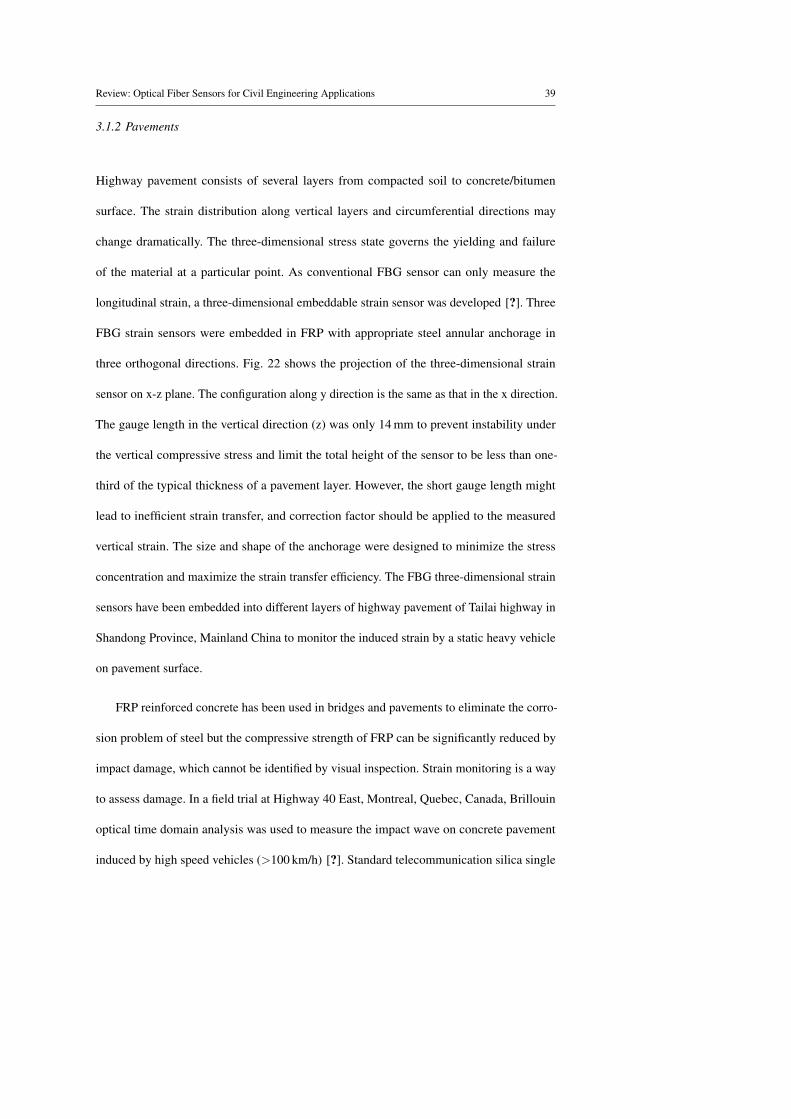
Fig. 21 Sensing Principle of the corrosion sensor based on Fresnel reflection. (a) Original, (b) at corrosive
environment
A corrosion sensor for reinforced concrete structures was developed based on the variation
of Fresnel reflection in corrosive environment [?]. The sensor is made by sputtering a very
thin pure iron coating (about 200 nm) on the cleaved end of a single mode telecommunication
optical fiber (Fig. 21). The iron coating reflects the light as a mirror. When the surrounding
environment becomes corrosive (either by chloride ion or carbonation), the coating is depleted
and the reflectivity is significantly reduced. The sensor reflectivity can be measured by OTDR.
To monitor the reflectivity of multiple sensors, an optical splitter can be placed between
the OTDR and the sensors [?]. The sensor can be installed in existing or new structures.
In a field trial test in Deep Bay, Hong Kong, 10 sensors were installed in two footbridge
piers under aggressive marine environment. Two of them were controls installed at the
non-corrosive locations, and they were still working over three years after installation. The
projected durability of the sensors by accelerated life test and freezing-thawing cyclic test is
about 70 years and 350 cycles, respectively.
Review: Optical Fiber Sensors for Civil Engineering Applications 39
3.1.2 Pavements
Highway pavement consists of several layers from compacted soil to concrete/bitumen
surface. The strain distribution along vertical layers and circumferential directions may
change dramatically. The three-dimensional stress state governs the yielding and failure
of the material at a particular point. As conventional FBG sensor can only measure the
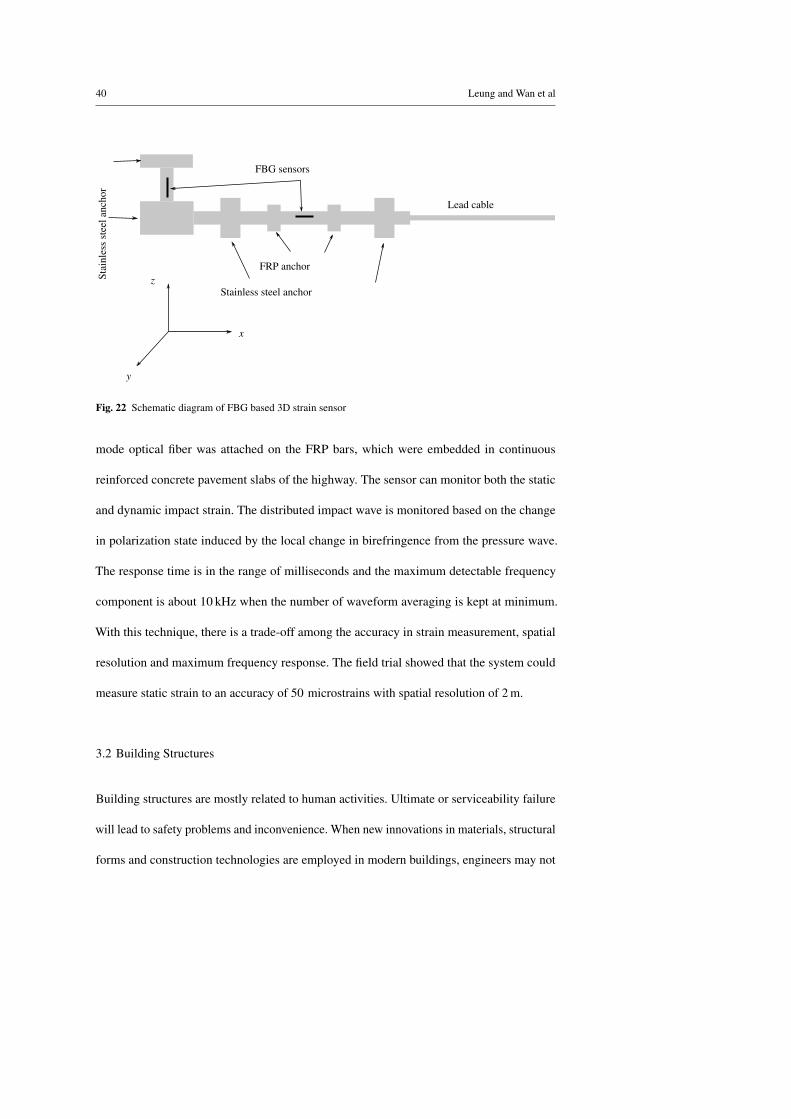
longitudinal strain, a three-dimensional embeddable strain sensor was developed [?]. Three
FBG strain sensors were embedded in FRP with appropriate steel annular anchorage in
three orthogonal directions. Fig. 22 shows the projection of the three-dimensional strain
sensor on x-z plane. The configuration along y direction is the same as that in the x direction.
The gauge length in the vertical direction (z) was only 14 mm to prevent instability under
the vertical compressive stress and limit the total height of the sensor to be less than one-
third of the typical thickness of a pavement layer. However, the short gauge length might
lead to inefficient strain transfer, and correction factor should be applied to the measured
vertical strain. The size and shape of the anchorage were designed to minimize the stress
concentration and maximize the strain transfer efficiency. The FBG three-dimensional strain
sensors have been embedded into different layers of highway pavement of Tailai highway in
Shandong Province, Mainland China to monitor the induced strain by a static heavy vehicle
on pavement surface.
FRP reinforced concrete has been used in bridges and pavements to eliminate the corro-
sion problem of steel but the compressive strength of FRP can be significantly reduced by
impact damage, which cannot be identified by visual inspection. Strain monitoring is a way
to assess damage. In a field trial at Highway 40 East, Montreal, Quebec, Canada, Brillouin
optical time domain analysis was used to measure the impact wave on concrete pavement
induced by high speed vehicles (>100 km/h) [?]. Standard telecommunication silica single
40 Leung and Wan et al
Lead cable
FBG sensors
Stainless steel anchorz
x
y
FRP anchor
Stai
nles
sst
eela
ncho
r
Fig. 22 Schematic diagram of FBG based 3D strain sensor
mode optical fiber was attached on the FRP bars, which were embedded in continuous
reinforced concrete pavement slabs of the highway. The sensor can monitor both the static
and dynamic impact strain. The distributed impact wave is monitored based on the change
in polarization state induced by the local change in birefringence from the pressure wave.
The response time is in the range of milliseconds and the maximum detectable frequency
component is about 10 kHz when the number of waveform averaging is kept at minimum.
With this technique, there is a trade-off among the accuracy in strain measurement, spatial
resolution and maximum frequency response. The field trial showed that the system could
measure static strain to an accuracy of 50 microstrains with spatial resolution of 2 m.
3.2 Building Structures
Building structures are mostly related to human activities. Ultimate or serviceability failure
will lead to safety problems and inconvenience. When new innovations in materials, structural
forms and construction technologies are employed in modern buildings, engineers may not
Review: Optical Fiber Sensors for Civil Engineering Applications 41
be able to understand and anticipate the exact behavior of the structures during construction
and operation. It is then desirable to have a continuous monitoring system to evaluate
the symptoms of operational incidents, anomalies, deterioration that may affect operation,
serviceability, safety and reliability of the structure. For historical buildings, the technical
details of the structures are usually not available and the degree of deterioration is often not
known. Structural monitoring can then be employed to facilitate the planning of appropriate
management and maintenance scheme.
3.2.1 Modern Buildings
Singapore is a cosmopolitan city-state with many tall buildings. The Housing and Develop-
ment Board (HDB), which is the public housing authority of Singapore, has been providing
public housing for Singaporeans through a comprehensive building program. As part of
the quality assurance of new HDB tall buildings, long-term structural monitoring of a new
building project at Punggol East Contract 26 was started in 2001. This monitoring project
was considered as a pilot project with two objectives: (i) to develop a monitoring strategy for
column-supported building structures, and (ii) to collect data and provide information related
to the behaviors and health conditions of this particular building type from construction to
in-service operation. The project consisted of six nineteen-storey building blocks founded on
piles and each block consisted of 6 units supported by more than 50 columns at ground level.
The specific aims of monitoring are to (i) increase the knowledge of the real structural
behaviors, (ii) have better control of construction process, (iii) increase the safety during
the service life, (iv) enhance the efficiency of maintenance activities and (v) evaluate the
structural conditions after extreme events such as earthquake, typhoon or terrorist attack. The
monitoring is performed at (i) local, column level and (ii) global, structural level. The ground
columns, which are the most critical elements in the building, were selected for monitoring.
42 Leung and Wan et al
Ten SOFO long gauge sensors with 2 m gauge length were embedded in each block to
measure the vertical deformation of the columns and the readings were taken manually
during construction [?].
After the pilot project, about 600 other similar buildings were instrumented in the same
way in Sinpagopre with approximated 10 sensors for each building block. They probably
constituted the world’s largest deployment of fiber optic sensors to a fleet of similar structures.
It was the first time in Singapore to deploy optical fiber sensors on such a large scale
structural monitoring on residential high-rise buildings and the results are beneficial to
building designers by providing better understanding to the behaviors of building structures
from construction to in-service operation. From the analysis of the collected data, it showed
unexpected behaviors of columns during construction and these facilitate future research
on the modeling of complex structures. In addition, with appropriate modeling and analysis
software, it is possible to separate the measured total strain to time-independent component
(elastic strain) and time dependent components (creep and shrinkage strain).
To understand the complex behaviors of modern buildings and structures, computational
methods such as finite element modeling is often employed in the design stage. However, even
sophisticated computer model involves many assumptions and uncertainties. As an example,
Guangzhou New TV Tower (GNTVT) is a tube-in-tube structure with height of 610 m. The
structure consists of a reinforced concrete inner tube and a structural steel outer tube with
concrete filled tube columns. The hyperbolic shape makes the structure aesthetically attractive
but extremely complex in structural behaviors, especially the wind-structure interaction. Even
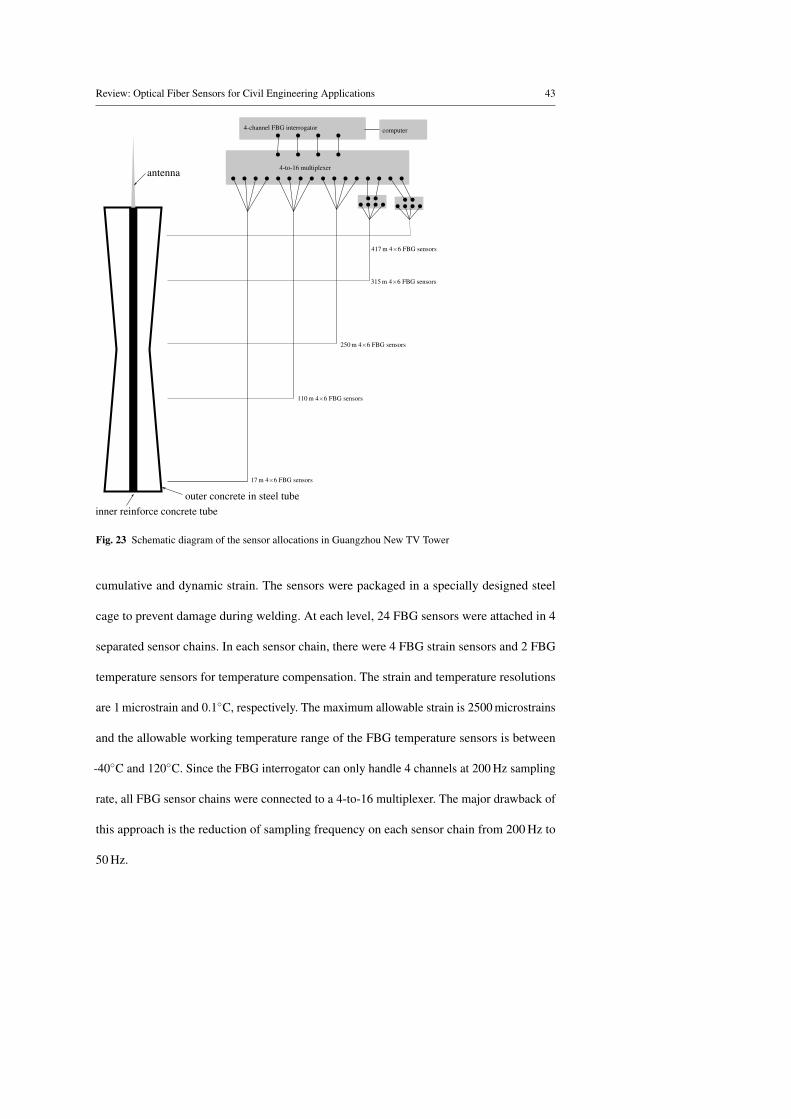
the wind characteristic at the top level of the building cannot be reliably obtained. 120 FBG
strain and temperature sensors were installed in GNTVT at 5 different levels for in-service
monitoring as shown in Fig. 23 [?]. Specially packaged FBG strain sensors were welded
on the surface of the structural steel of the outer tube columns in factory to measure both
Review: Optical Fiber Sensors for Civil Engineering Applications 43
4-to-16 multiplexer
4-channel FBG interrogator computer
inner reinforce concrete tubeouter concrete in steel tube
17 m 4×6 FBG sensors
250 m 4×6 FBG sensors
315 m 4×6 FBG sensors
110 m 4×6 FBG sensors
417 m 4×6 FBG sensors
antenna
Fig. 23 Schematic diagram of the sensor allocations in Guangzhou New TV Tower
cumulative and dynamic strain. The sensors were packaged in a specially designed steel
cage to prevent damage during welding. At each level, 24 FBG sensors were attached in 4
separated sensor chains. In each sensor chain, there were 4 FBG strain sensors and 2 FBG
temperature sensors for temperature compensation. The strain and temperature resolutions
are 1 microstrain and 0.1◦C, respectively. The maximum allowable strain is 2500 microstrains
and the allowable working temperature range of the FBG temperature sensors is between
-40◦C and 120◦C. Since the FBG interrogator can only handle 4 channels at 200 Hz sampling
rate, all FBG sensor chains were connected to a 4-to-16 multiplexer. The major drawback of
this approach is the reduction of sampling frequency on each sensor chain from 200 Hz to
50 Hz.
44 Leung and Wan et al
Other examples of FBG based structural health monitoring systems for modern buildings
can be found in Shenzhen Civic Center, Vanke Center and Nation Aquatic Center in China
[?]. The Shenzhen Civic Center consists of a space truss structure supporting a giant roof
that is 486 m long, 154 m wide and 9 m in maximum thickness. 12 FBG strain sensors were
installed in the brackets and other key members to monitor the stress of the space truss and
roof during service and under extreme loading condition such as typhoon. In Vanke Center,
the floor area is more than 130000 m2 supported by 8 giant tubes and thick walls to provide
maximum open space for a garden underneath. The main structure consists of a mixed
frame-cable system. The steel cables transfer the vertical load from the steel truss girders to
the concrete-in-steel columns. In order to monitor the stress of the key components during
the construction and operation phases, 70 FBG strain sensors were installed on the steel truss
girders, steel beams, concrete-in-steel columns and the giant columns. 16 FRP-FBG smart
cables as shown in Fig. 12 were installed to monitor the tensile stress carried by the steel
cables. In addition, 35 FBG temperature sensors were installed for temperature compensation
of the strain sensors. The National Aquatic Center is a complex structural steel-membrane
structures. Due to high redundancy of the steel structure, thermal induced stress may be
significant. 240 FBG strain sensors were installed on the membrane roof and steel structures
to monitor the fluid-solid interaction of the membrane, thermal induced stress on the steel
members, as well as vibration under wind and other human activities. 40 FBG temperature
sensors were installed for temperature compensation.
Comprehensive structural health monitoring was performed in the Berlin Central Railway
Station, Germany [?]. The station is a complex structure made of concrete, steel and glass.
At the station, the railway platform is supported by curved girders that need to be partially
prestressed. Long guage SOFO interferometers were installed to measure the strain of the
structure. The readout unit contains only single channel. For multichannel operation, the
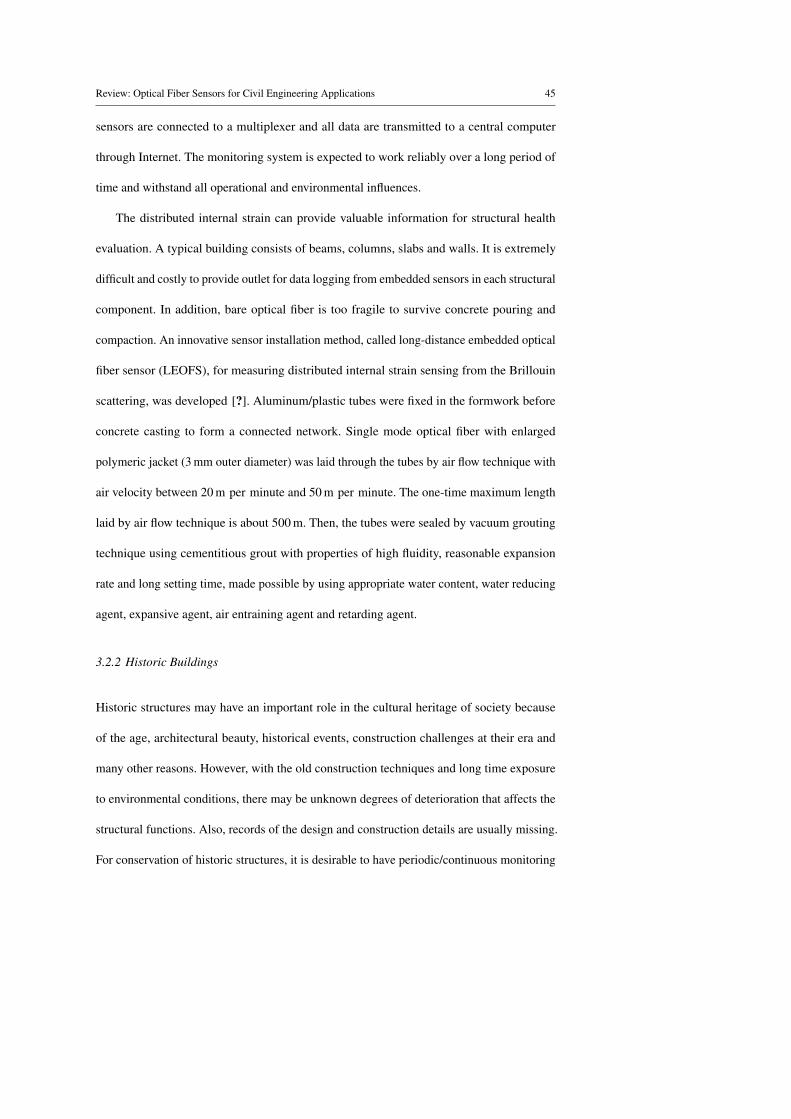
Review: Optical Fiber Sensors for Civil Engineering Applications 45
sensors are connected to a multiplexer and all data are transmitted to a central computer
through Internet. The monitoring system is expected to work reliably over a long period of
time and withstand all operational and environmental influences.
The distributed internal strain can provide valuable information for structural health
evaluation. A typical building consists of beams, columns, slabs and walls. It is extremely
difficult and costly to provide outlet for data logging from embedded sensors in each structural
component. In addition, bare optical fiber is too fragile to survive concrete pouring and
compaction. An innovative sensor installation method, called long-distance embedded optical
fiber sensor (LEOFS), for measuring distributed internal strain sensing from the Brillouin
scattering, was developed [?]. Aluminum/plastic tubes were fixed in the formwork before
concrete casting to form a connected network. Single mode optical fiber with enlarged
polymeric jacket (3 mm outer diameter) was laid through the tubes by air flow technique with
air velocity between 20 m per minute and 50 m per minute. The one-time maximum length
laid by air flow technique is about 500 m. Then, the tubes were sealed by vacuum grouting
technique using cementitious grout with properties of high fluidity, reasonable expansion
rate and long setting time, made possible by using appropriate water content, water reducing
agent, expansive agent, air entraining agent and retarding agent.
3.2.2 Historic Buildings
Historic structures may have an important role in the cultural heritage of society because
of the age, architectural beauty, historical events, construction challenges at their era and
many other reasons. However, with the old construction techniques and long time exposure
to environmental conditions, there may be unknown degrees of deterioration that affects the
structural functions. Also, records of the design and construction details are usually missing.
For conservation of historic structures, it is desirable to have periodic/continuous monitoring
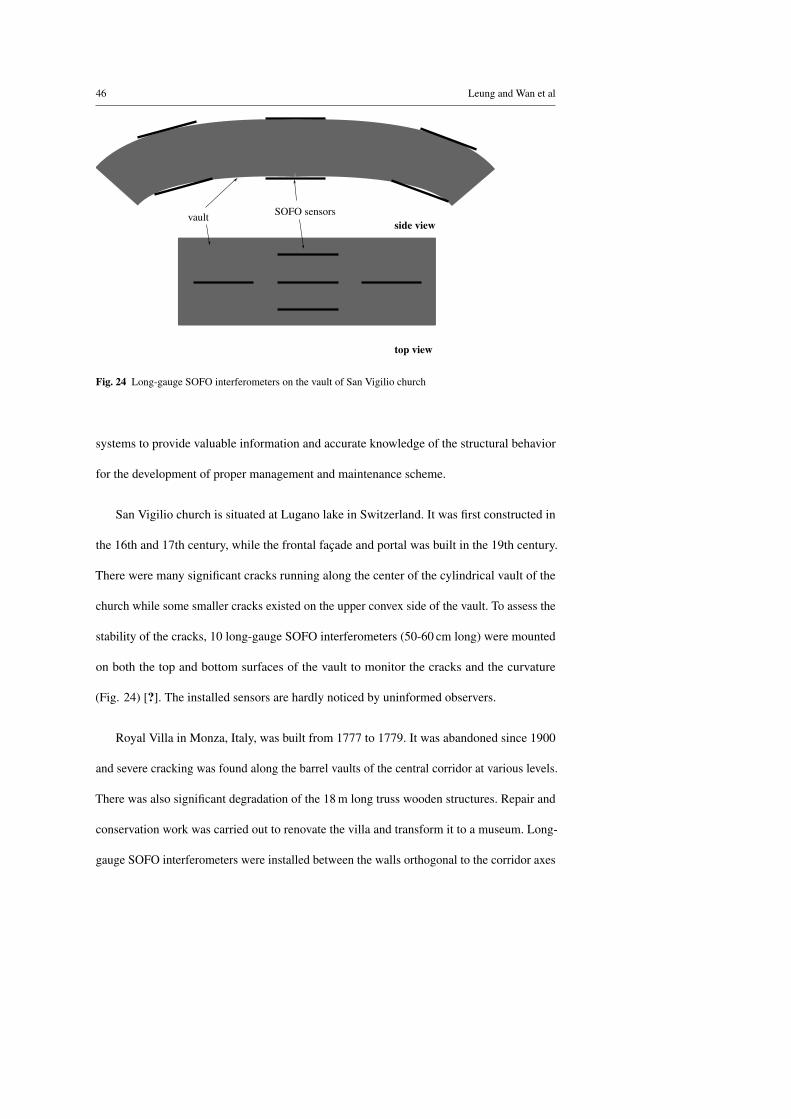
46 Leung and Wan et al
top view
SOFO sensorsvaultside view
Fig. 24 Long-gauge SOFO interferometers on the vault of San Vigilio church
systems to provide valuable information and accurate knowledge of the structural behavior
for the development of proper management and maintenance scheme.
San Vigilio church is situated at Lugano lake in Switzerland. It was first constructed in
the 16th and 17th century, while the frontal façade and portal was built in the 19th century.
There were many significant cracks running along the center of the cylindrical vault of the
church while some smaller cracks existed on the upper convex side of the vault. To assess the
stability of the cracks, 10 long-gauge SOFO interferometers (50-60 cm long) were mounted
on both the top and bottom surfaces of the vault to monitor the cracks and the curvature
(Fig. 24) [?]. The installed sensors are hardly noticed by uninformed observers.
Royal Villa in Monza, Italy, was built from 1777 to 1779. It was abandoned since 1900
and severe cracking was found along the barrel vaults of the central corridor at various levels.
There was also significant degradation of the 18 m long truss wooden structures. Repair and
conservation work was carried out to renovate the villa and transform it to a museum. Long-
gauge SOFO interferometers were installed between the walls orthogonal to the corridor axes
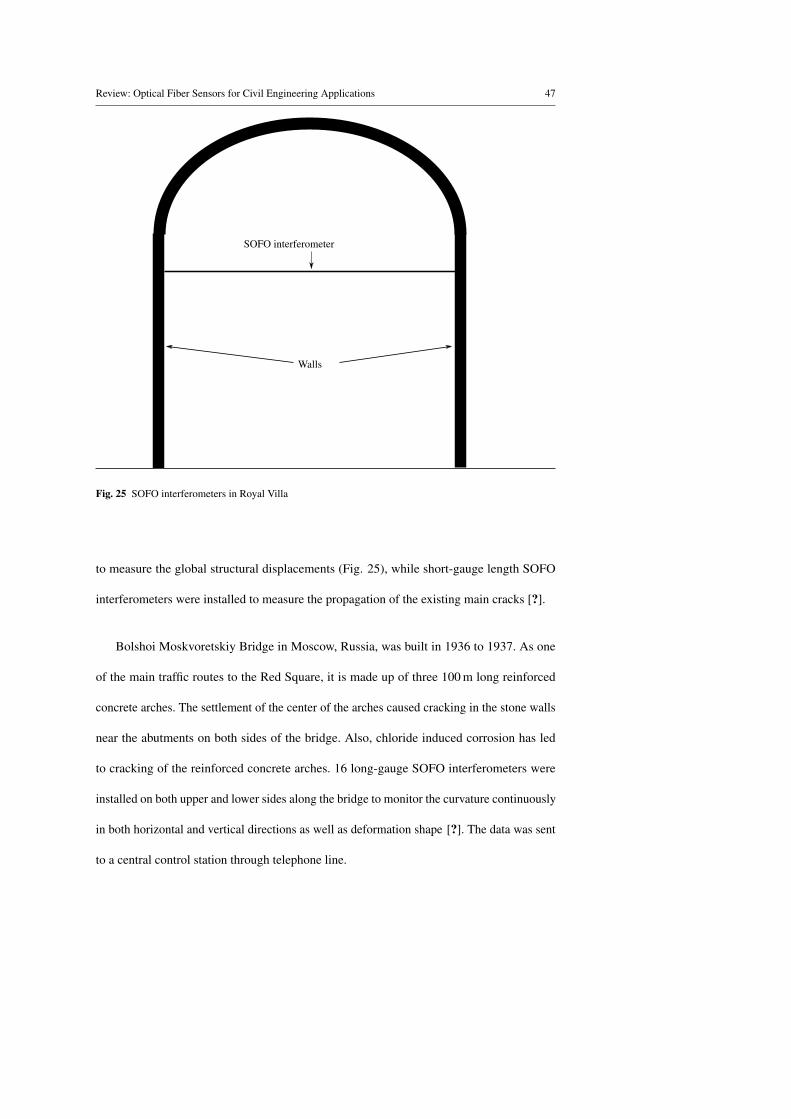
Review: Optical Fiber Sensors for Civil Engineering Applications 47
SOFO interferometer
Walls
Fig. 25 SOFO interferometers in Royal Villa
to measure the global structural displacements (Fig. 25), while short-gauge length SOFO
interferometers were installed to measure the propagation of the existing main cracks [?].
Bolshoi Moskvoretskiy Bridge in Moscow, Russia, was built in 1936 to 1937. As one
of the main traffic routes to the Red Square, it is made up of three 100 m long reinforced
concrete arches. The settlement of the center of the arches caused cracking in the stone walls
near the abutments on both sides of the bridge. Also, chloride induced corrosion has led
to cracking of the reinforced concrete arches. 16 long-gauge SOFO interferometers were
installed on both upper and lower sides along the bridge to monitor the curvature continuously
in both horizontal and vertical directions as well as deformation shape [?]. The data was sent
to a central control station through telephone line.
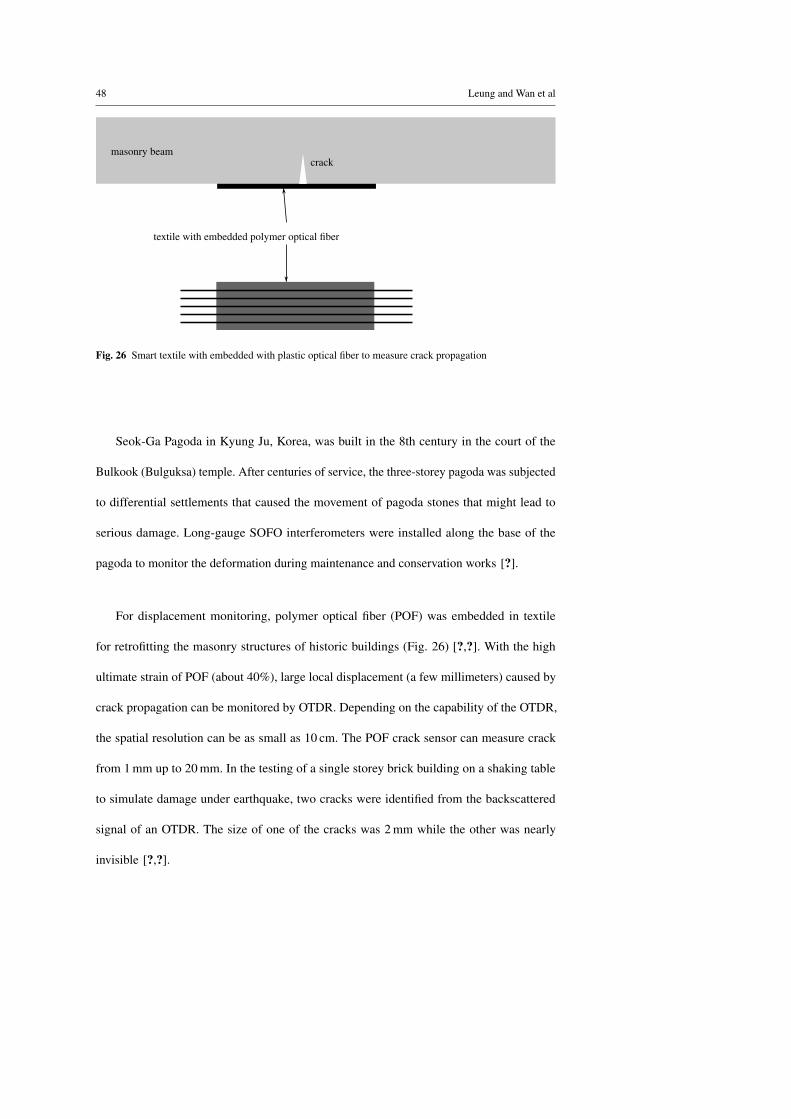
48 Leung and Wan et al
textile with embedded polymer optical fiber
crackmasonry beam
Fig. 26 Smart textile with embedded with plastic optical fiber to measure crack propagation
Seok-Ga Pagoda in Kyung Ju, Korea, was built in the 8th century in the court of the
Bulkook (Bulguksa) temple. After centuries of service, the three-storey pagoda was subjected
to differential settlements that caused the movement of pagoda stones that might lead to
serious damage. Long-gauge SOFO interferometers were installed along the base of the
pagoda to monitor the deformation during maintenance and conservation works [?].
For displacement monitoring, polymer optical fiber (POF) was embedded in textile
for retrofitting the masonry structures of historic buildings (Fig. 26) [?,?]. With the high
ultimate strain of POF (about 40%), large local displacement (a few millimeters) caused by
crack propagation can be monitored by OTDR. Depending on the capability of the OTDR,
the spatial resolution can be as small as 10 cm. The POF crack sensor can measure crack
from 1 mm up to 20 mm. In the testing of a single storey brick building on a shaking table
to simulate damage under earthquake, two cracks were identified from the backscattered
signal of an OTDR. The size of one of the cracks was 2 mm while the other was nearly
invisible [?,?].
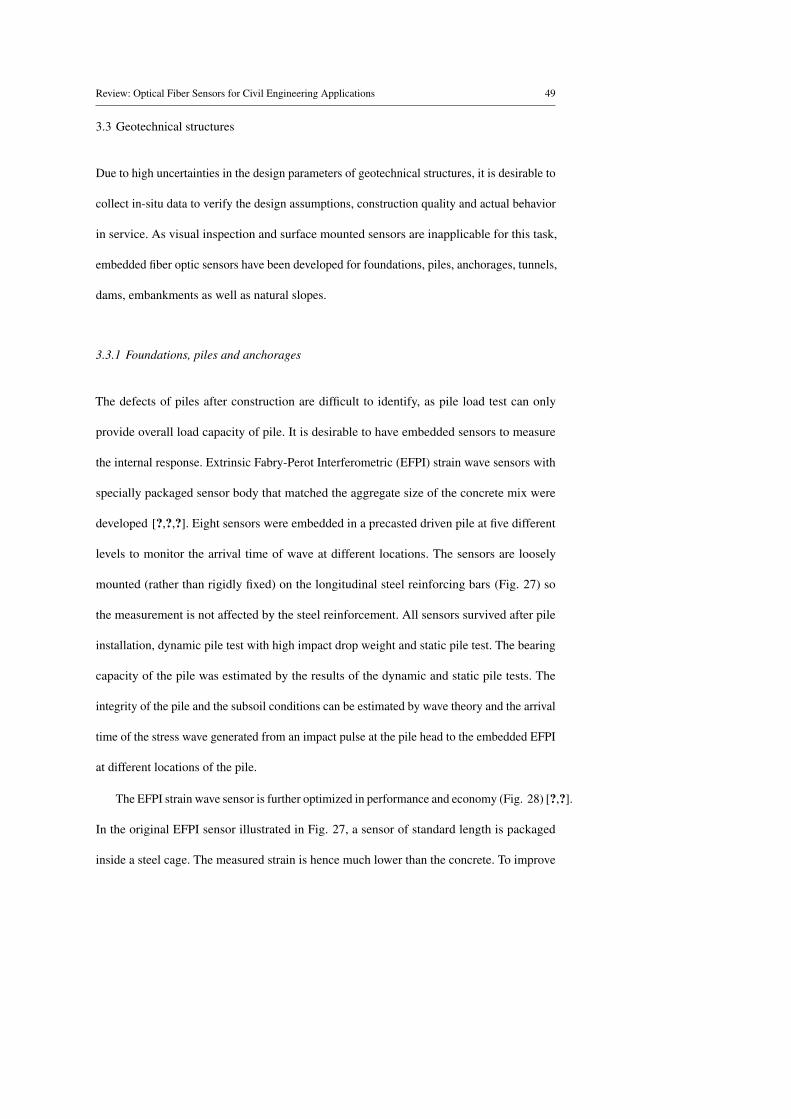
Review: Optical Fiber Sensors for Civil Engineering Applications 49
3.3 Geotechnical structures
Due to high uncertainties in the design parameters of geotechnical structures, it is desirable to
collect in-situ data to verify the design assumptions, construction quality and actual behavior
in service. As visual inspection and surface mounted sensors are inapplicable for this task,
embedded fiber optic sensors have been developed for foundations, piles, anchorages, tunnels,
dams, embankments as well as natural slopes.
3.3.1 Foundations, piles and anchorages
The defects of piles after construction are difficult to identify, as pile load test can only
provide overall load capacity of pile. It is desirable to have embedded sensors to measure
the internal response. Extrinsic Fabry-Perot Interferometric (EFPI) strain wave sensors with
specially packaged sensor body that matched the aggregate size of the concrete mix were
developed [?,?,?]. Eight sensors were embedded in a precasted driven pile at five different
levels to monitor the arrival time of wave at different locations. The sensors are loosely
mounted (rather than rigidly fixed) on the longitudinal steel reinforcing bars (Fig. 27) so
the measurement is not affected by the steel reinforcement. All sensors survived after pile
installation, dynamic pile test with high impact drop weight and static pile test. The bearing
capacity of the pile was estimated by the results of the dynamic and static pile tests. The
integrity of the pile and the subsoil conditions can be estimated by wave theory and the arrival
time of the stress wave generated from an impact pulse at the pile head to the embedded EFPI
at different locations of the pile.
The EFPI strain wave sensor is further optimized in performance and economy (Fig. 28) [?,?].
In the original EFPI sensor illustrated in Fig. 27, a sensor of standard length is packaged
inside a steel cage. The measured strain is hence much lower than the concrete. To improve
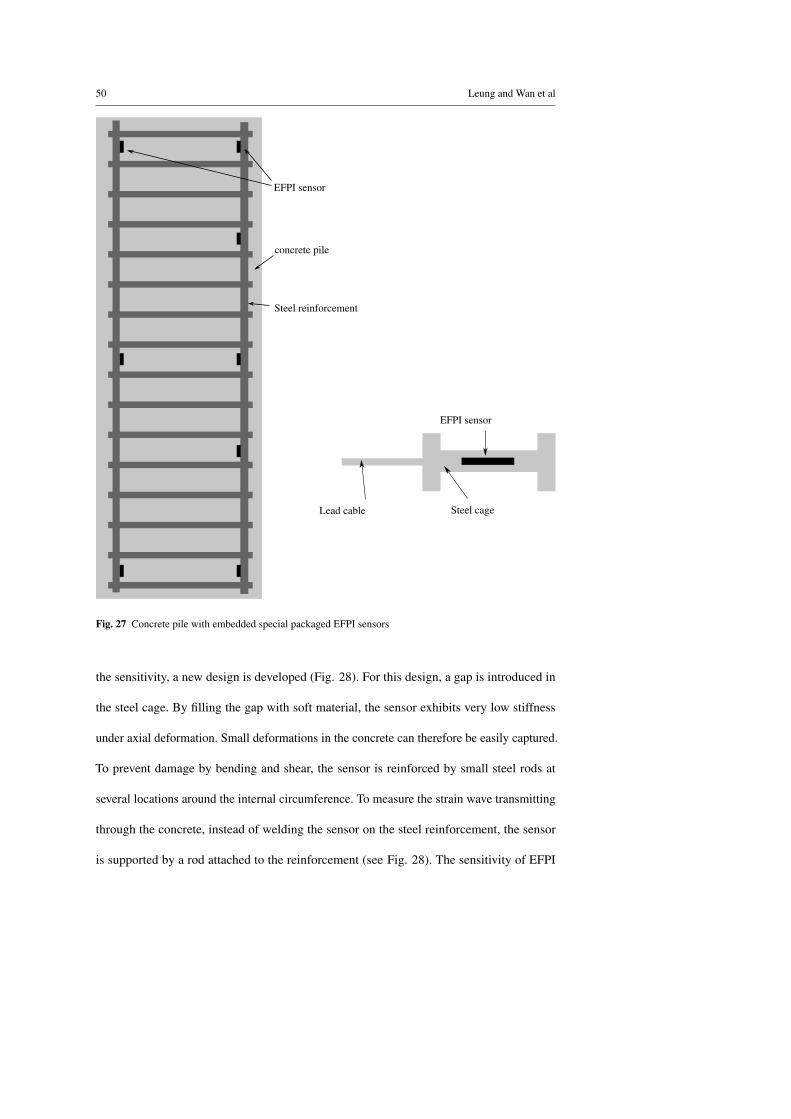
50 Leung and Wan et al
Lead cable Steel cage
EFPI sensor
concrete pile
Steel reinforcement
EFPI sensor
Fig. 27 Concrete pile with embedded special packaged EFPI sensors
the sensitivity, a new design is developed (Fig. 28). For this design, a gap is introduced in
the steel cage. By filling the gap with soft material, the sensor exhibits very low stiffness
under axial deformation. Small deformations in the concrete can therefore be easily captured.
To prevent damage by bending and shear, the sensor is reinforced by small steel rods at
several locations around the internal circumference. To measure the strain wave transmitting
through the concrete, instead of welding the sensor on the steel reinforcement, the sensor
is supported by a rod attached to the reinforcement (see Fig. 28). The sensitivity of EFPI
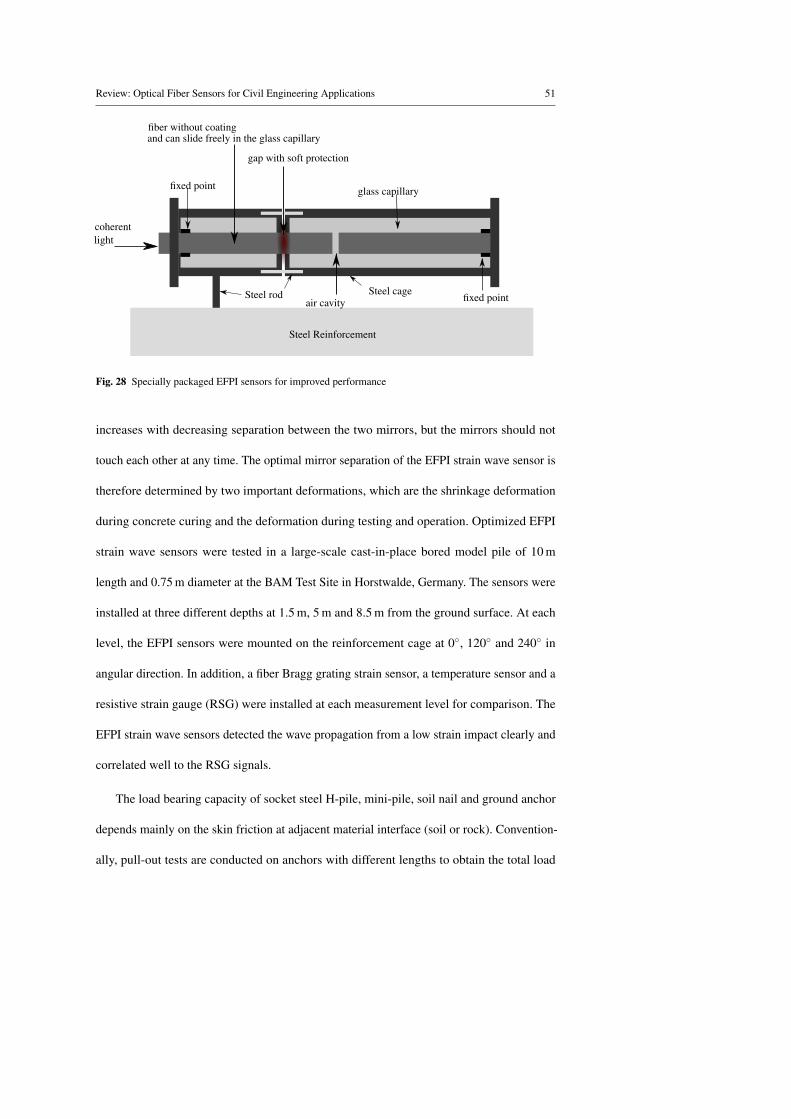
Review: Optical Fiber Sensors for Civil Engineering Applications 51
coherentlight
gap with soft protection
fixed point
fiber without coatingand can slide freely in the glass capillary
glass capillary
fixed pointSteel cage
Steel Reinforcement
Steel rodair cavity
Fig. 28 Specially packaged EFPI sensors for improved performance
increases with decreasing separation between the two mirrors, but the mirrors should not
touch each other at any time. The optimal mirror separation of the EFPI strain wave sensor is
therefore determined by two important deformations, which are the shrinkage deformation
during concrete curing and the deformation during testing and operation. Optimized EFPI
strain wave sensors were tested in a large-scale cast-in-place bored model pile of 10 m
length and 0.75 m diameter at the BAM Test Site in Horstwalde, Germany. The sensors were
installed at three different depths at 1.5 m, 5 m and 8.5 m from the ground surface. At each
level, the EFPI sensors were mounted on the reinforcement cage at 0◦, 120◦ and 240◦ in
angular direction. In addition, a fiber Bragg grating strain sensor, a temperature sensor and a
resistive strain gauge (RSG) were installed at each measurement level for comparison. The
EFPI strain wave sensors detected the wave propagation from a low strain impact clearly and
correlated well to the RSG signals.
The load bearing capacity of socket steel H-pile, mini-pile, soil nail and ground anchor
depends mainly on the skin friction at adjacent material interface (soil or rock). Convention-
ally, pull-out tests are conducted on anchors with different lengths to obtain the total load
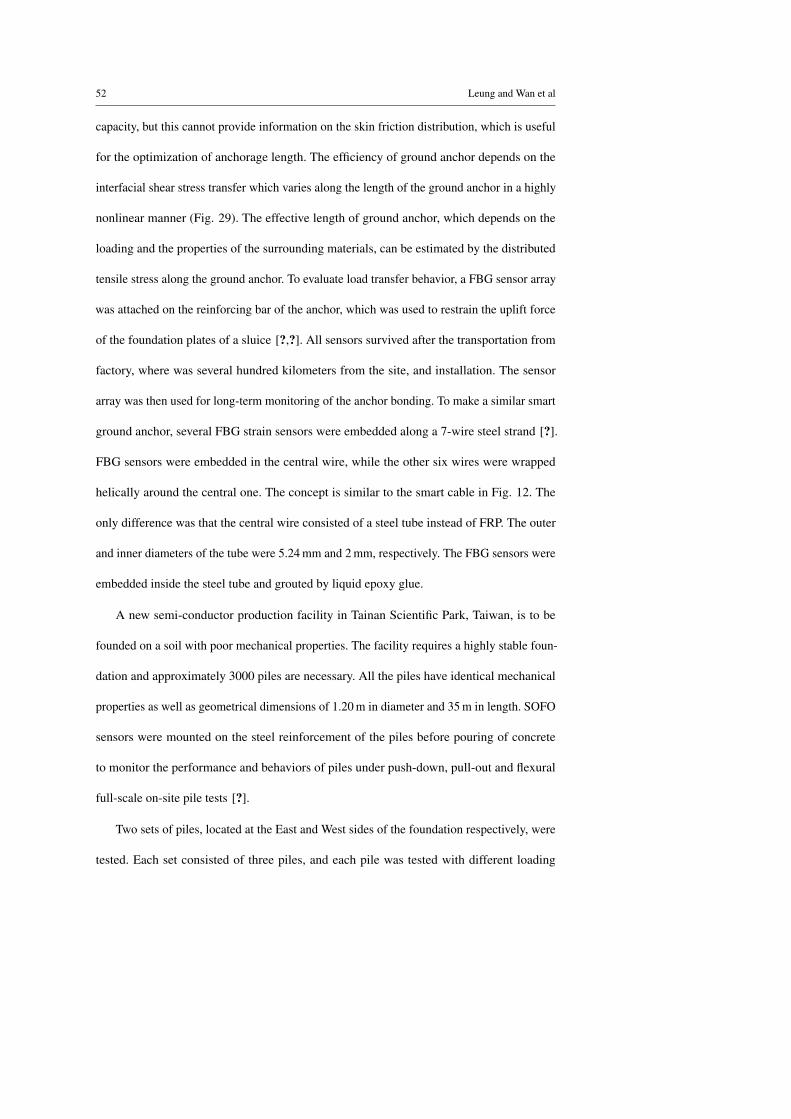
52 Leung and Wan et al
capacity, but this cannot provide information on the skin friction distribution, which is useful
for the optimization of anchorage length. The efficiency of ground anchor depends on the
interfacial shear stress transfer which varies along the length of the ground anchor in a highly
nonlinear manner (Fig. 29). The effective length of ground anchor, which depends on the
loading and the properties of the surrounding materials, can be estimated by the distributed
tensile stress along the ground anchor. To evaluate load transfer behavior, a FBG sensor array
was attached on the reinforcing bar of the anchor, which was used to restrain the uplift force
of the foundation plates of a sluice [?,?]. All sensors survived after the transportation from
factory, where was several hundred kilometers from the site, and installation. The sensor
array was then used for long-term monitoring of the anchor bonding. To make a similar smart
ground anchor, several FBG strain sensors were embedded along a 7-wire steel strand [?].
FBG sensors were embedded in the central wire, while the other six wires were wrapped
helically around the central one. The concept is similar to the smart cable in Fig. 12. The
only difference was that the central wire consisted of a steel tube instead of FRP. The outer
and inner diameters of the tube were 5.24 mm and 2 mm, respectively. The FBG sensors were
embedded inside the steel tube and grouted by liquid epoxy glue.
A new semi-conductor production facility in Tainan Scientific Park, Taiwan, is to be
founded on a soil with poor mechanical properties. The facility requires a highly stable foun-
dation and approximately 3000 piles are necessary. All the piles have identical mechanical
properties as well as geometrical dimensions of 1.20 m in diameter and 35 m in length. SOFO
sensors were mounted on the steel reinforcement of the piles before pouring of concrete
to monitor the performance and behaviors of piles under push-down, pull-out and flexural
full-scale on-site pile tests [?].
Two sets of piles, located at the East and West sides of the foundation respectively, were
tested. Each set consisted of three piles, and each pile was tested with different loading
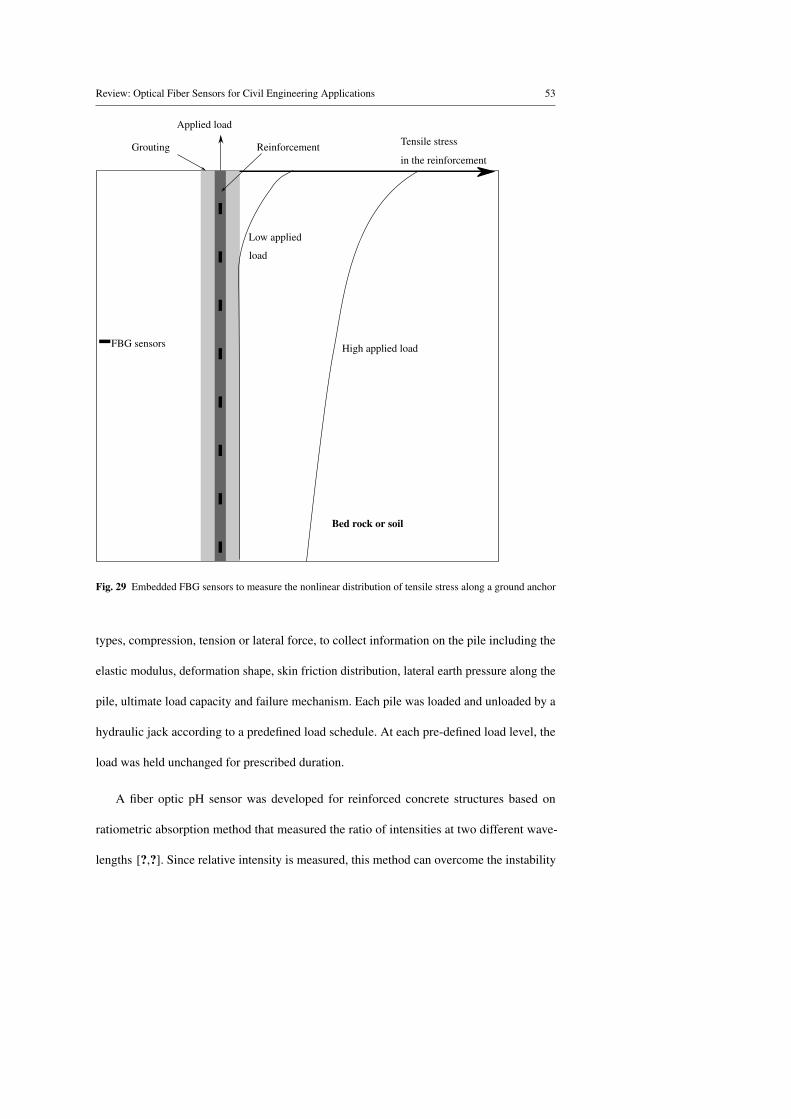
Review: Optical Fiber Sensors for Civil Engineering Applications 53
Applied load
Reinforcement
Bed rock or soil
Low applied
High applied load
Grouting
FBG sensors
Tensile stress
in the reinforcement
load
Fig. 29 Embedded FBG sensors to measure the nonlinear distribution of tensile stress along a ground anchor
types, compression, tension or lateral force, to collect information on the pile including the
elastic modulus, deformation shape, skin friction distribution, lateral earth pressure along the
pile, ultimate load capacity and failure mechanism. Each pile was loaded and unloaded by a
hydraulic jack according to a predefined load schedule. At each pre-defined load level, the
load was held unchanged for prescribed duration.
A fiber optic pH sensor was developed for reinforced concrete structures based on
ratiometric absorption method that measured the ratio of intensities at two different wave-
lengths [?,?]. Since relative intensity is measured, this method can overcome the instability
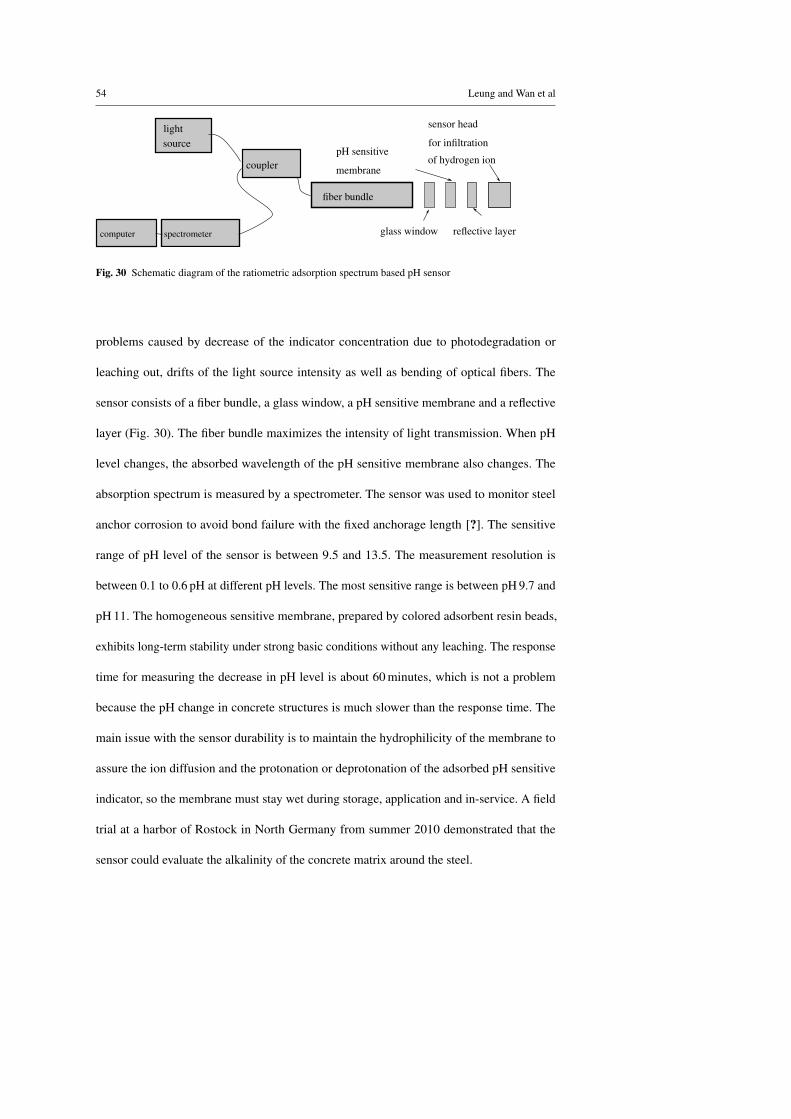
54 Leung and Wan et al
light
computer spectrometer
coupler
fiber bundle
glass window
pH sensitive
reflective layer
sensor head
of hydrogen ion
for infiltration
membrane
source
Fig. 30 Schematic diagram of the ratiometric adsorption spectrum based pH sensor
problems caused by decrease of the indicator concentration due to photodegradation or
leaching out, drifts of the light source intensity as well as bending of optical fibers. The
sensor consists of a fiber bundle, a glass window, a pH sensitive membrane and a reflective
layer (Fig. 30). The fiber bundle maximizes the intensity of light transmission. When pH
level changes, the absorbed wavelength of the pH sensitive membrane also changes. The
absorption spectrum is measured by a spectrometer. The sensor was used to monitor steel
anchor corrosion to avoid bond failure with the fixed anchorage length [?]. The sensitive
range of pH level of the sensor is between 9.5 and 13.5. The measurement resolution is
between 0.1 to 0.6 pH at different pH levels. The most sensitive range is between pH 9.7 and
pH 11. The homogeneous sensitive membrane, prepared by colored adsorbent resin beads,
exhibits long-term stability under strong basic conditions without any leaching. The response
time for measuring the decrease in pH level is about 60 minutes, which is not a problem
because the pH change in concrete structures is much slower than the response time. The
main issue with the sensor durability is to maintain the hydrophilicity of the membrane to
assure the ion diffusion and the protonation or deprotonation of the adsorbed pH sensitive
indicator, so the membrane must stay wet during storage, application and in-service. A field
trial at a harbor of Rostock in North Germany from summer 2010 demonstrated that the
sensor could evaluate the alkalinity of the concrete matrix around the steel.
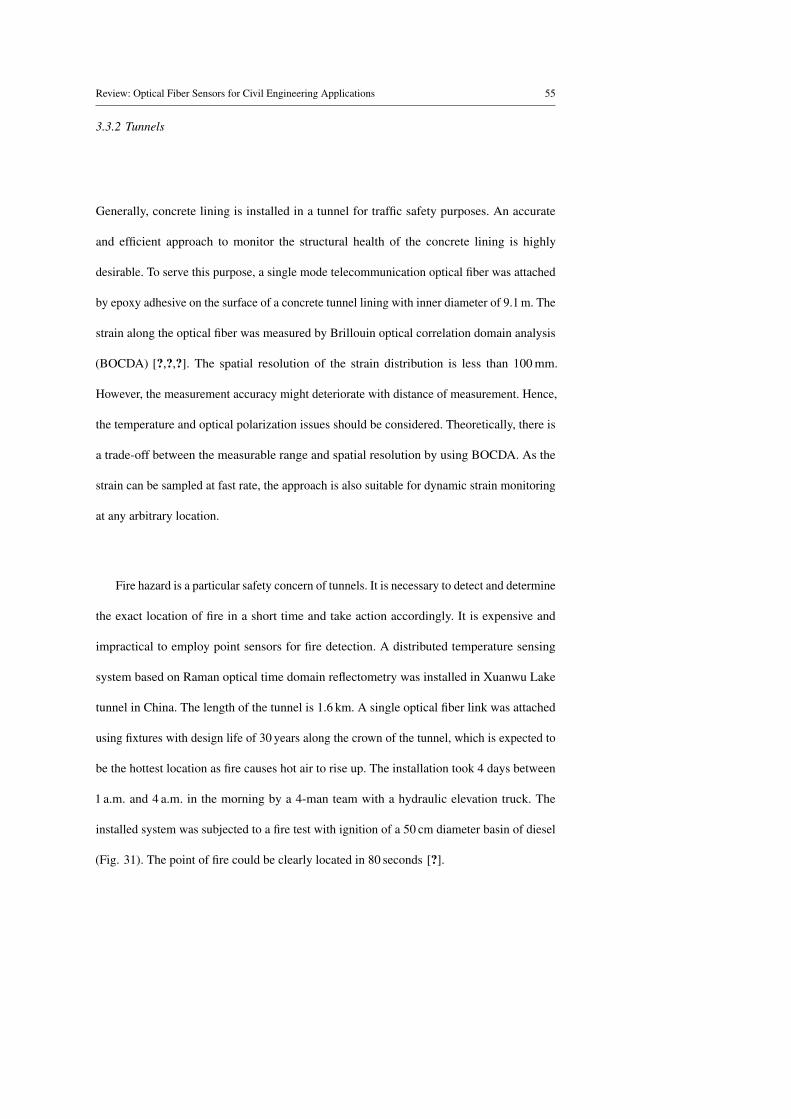
Review: Optical Fiber Sensors for Civil Engineering Applications 55
3.3.2 Tunnels
Generally, concrete lining is installed in a tunnel for traffic safety purposes. An accurate
and efficient approach to monitor the structural health of the concrete lining is highly
desirable. To serve this purpose, a single mode telecommunication optical fiber was attached
by epoxy adhesive on the surface of a concrete tunnel lining with inner diameter of 9.1 m. The
strain along the optical fiber was measured by Brillouin optical correlation domain analysis
(BOCDA) [?,?,?]. The spatial resolution of the strain distribution is less than 100 mm.
However, the measurement accuracy might deteriorate with distance of measurement. Hence,
the temperature and optical polarization issues should be considered. Theoretically, there is
a trade-off between the measurable range and spatial resolution by using BOCDA. As the
strain can be sampled at fast rate, the approach is also suitable for dynamic strain monitoring
at any arbitrary location.
Fire hazard is a particular safety concern of tunnels. It is necessary to detect and determine
the exact location of fire in a short time and take action accordingly. It is expensive and
impractical to employ point sensors for fire detection. A distributed temperature sensing
system based on Raman optical time domain reflectometry was installed in Xuanwu Lake
tunnel in China. The length of the tunnel is 1.6 km. A single optical fiber link was attached
using fixtures with design life of 30 years along the crown of the tunnel, which is expected to
be the hottest location as fire causes hot air to rise up. The installation took 4 days between
1 a.m. and 4 a.m. in the morning by a 4-man team with a hydraulic elevation truck. The
installed system was subjected to a fire test with ignition of a 50 cm diameter basin of diesel
(Fig. 31). The point of fire could be clearly located in 80 seconds [?].
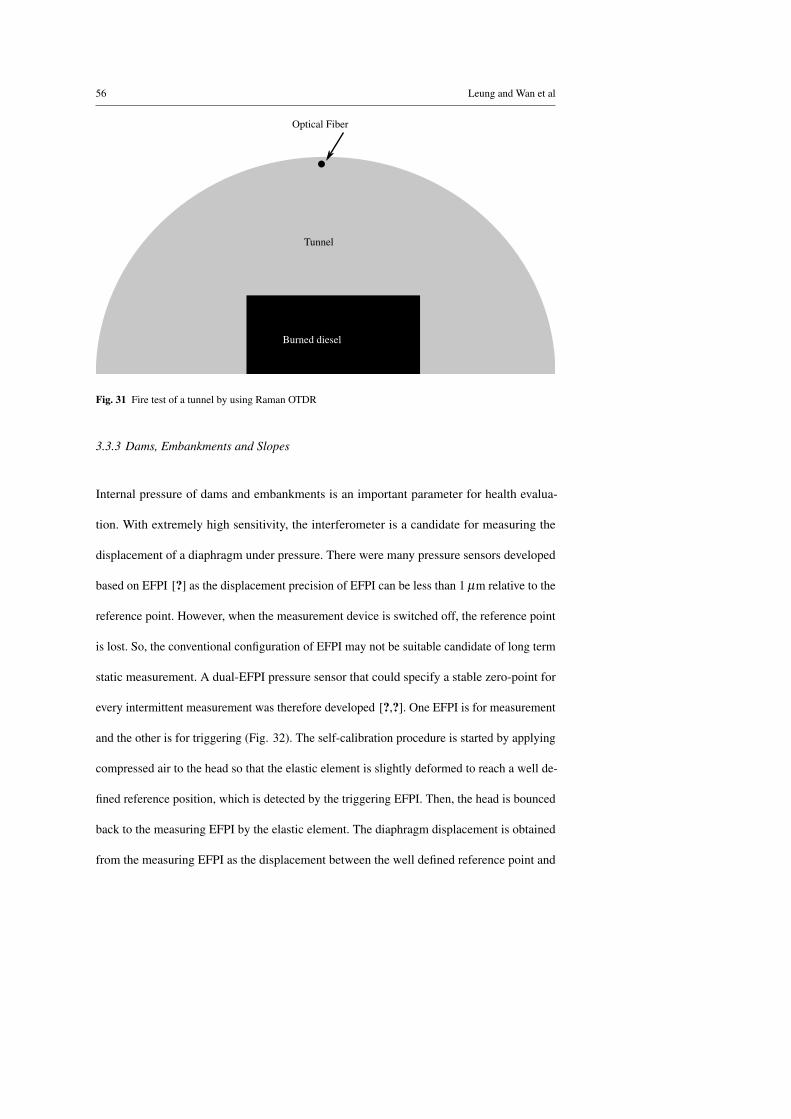
56 Leung and Wan et al
Tunnel
Burned diesel
Optical Fiber
Fig. 31 Fire test of a tunnel by using Raman OTDR
3.3.3 Dams, Embankments and Slopes
Internal pressure of dams and embankments is an important parameter for health evalua-
tion. With extremely high sensitivity, the interferometer is a candidate for measuring the
displacement of a diaphragm under pressure. There were many pressure sensors developed
based on EFPI [?] as the displacement precision of EFPI can be less than 1 µm relative to the
reference point. However, when the measurement device is switched off, the reference point
is lost. So, the conventional configuration of EFPI may not be suitable candidate of long term
static measurement. A dual-EFPI pressure sensor that could specify a stable zero-point for
every intermittent measurement was therefore developed [?,?]. One EFPI is for measurement
and the other is for triggering (Fig. 32). The self-calibration procedure is started by applying
compressed air to the head so that the elastic element is slightly deformed to reach a well de-
fined reference position, which is detected by the triggering EFPI. Then, the head is bounced
back to the measuring EFPI by the elastic element. The diaphragm displacement is obtained
from the measuring EFPI as the displacement between the well defined reference point and
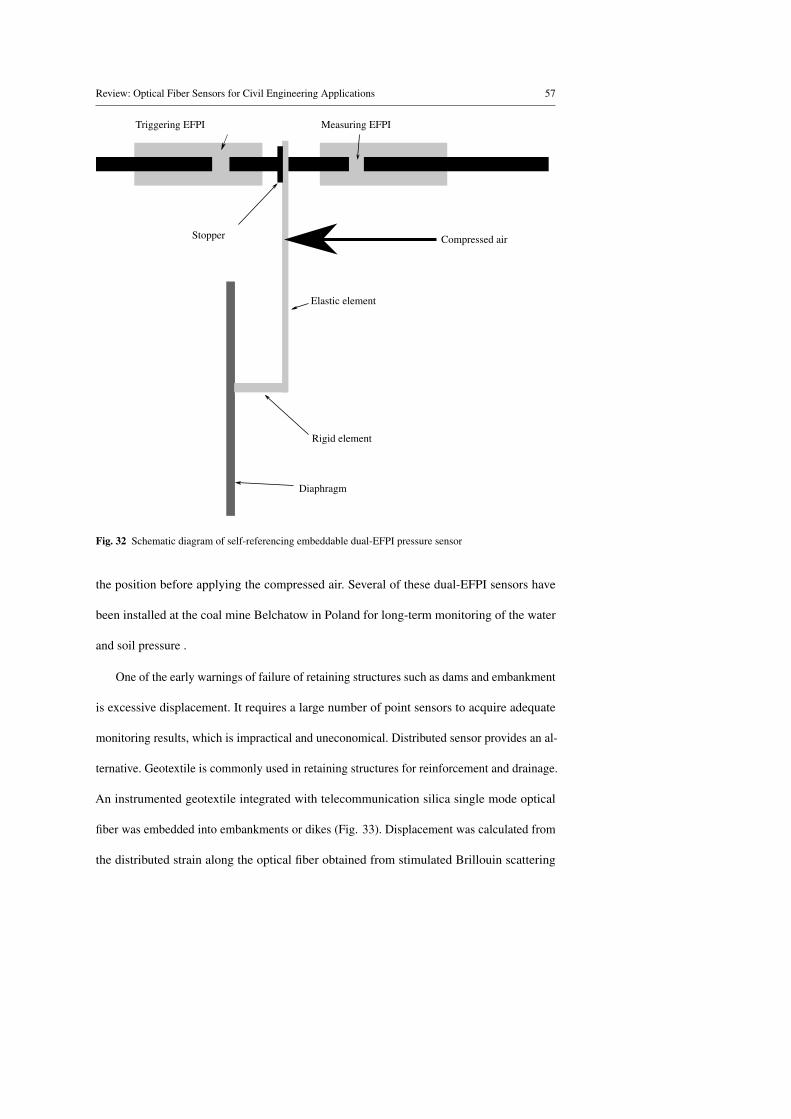
Review: Optical Fiber Sensors for Civil Engineering Applications 57
Diaphragm
Triggering EFPI Measuring EFPI
Elastic element
Rigid element
Compressed airStopper
Fig. 32 Schematic diagram of self-referencing embeddable dual-EFPI pressure sensor
the position before applying the compressed air. Several of these dual-EFPI sensors have
been installed at the coal mine Belchatow in Poland for long-term monitoring of the water
and soil pressure .
One of the early warnings of failure of retaining structures such as dams and embankment
is excessive displacement. It requires a large number of point sensors to acquire adequate
monitoring results, which is impractical and uneconomical. Distributed sensor provides an al-
ternative. Geotextile is commonly used in retaining structures for reinforcement and drainage.
An instrumented geotextile integrated with telecommunication silica single mode optical
fiber was embedded into embankments or dikes (Fig. 33). Displacement was calculated from
the distributed strain along the optical fiber obtained from stimulated Brillouin scattering
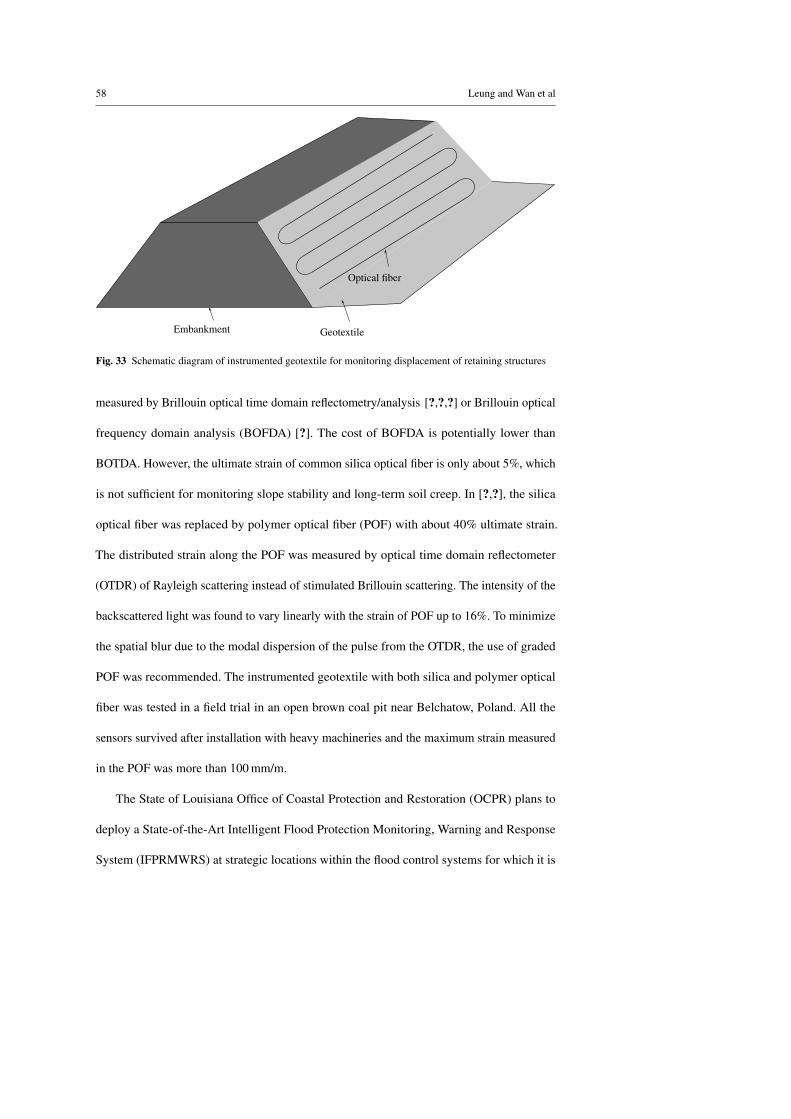
58 Leung and Wan et al
Embankment Geotextile
Optical fiber
Fig. 33 Schematic diagram of instrumented geotextile for monitoring displacement of retaining structures
measured by Brillouin optical time domain reflectometry/analysis [?,?,?] or Brillouin optical
frequency domain analysis (BOFDA) [?]. The cost of BOFDA is potentially lower than
BOTDA. However, the ultimate strain of common silica optical fiber is only about 5%, which
is not sufficient for monitoring slope stability and long-term soil creep. In [?,?], the silica
optical fiber was replaced by polymer optical fiber (POF) with about 40% ultimate strain.
The distributed strain along the POF was measured by optical time domain reflectometer
(OTDR) of Rayleigh scattering instead of stimulated Brillouin scattering. The intensity of the
backscattered light was found to vary linearly with the strain of POF up to 16%. To minimize
the spatial blur due to the modal dispersion of the pulse from the OTDR, the use of graded
POF was recommended. The instrumented geotextile with both silica and polymer optical
fiber was tested in a field trial in an open brown coal pit near Belchatow, Poland. All the
sensors survived after installation with heavy machineries and the maximum strain measured
in the POF was more than 100 mm/m.
The State of Louisiana Office of Coastal Protection and Restoration (OCPR) plans to
deploy a State-of-the-Art Intelligent Flood Protection Monitoring, Warning and Response
System (IFPRMWRS) at strategic locations within the flood control systems for which it is
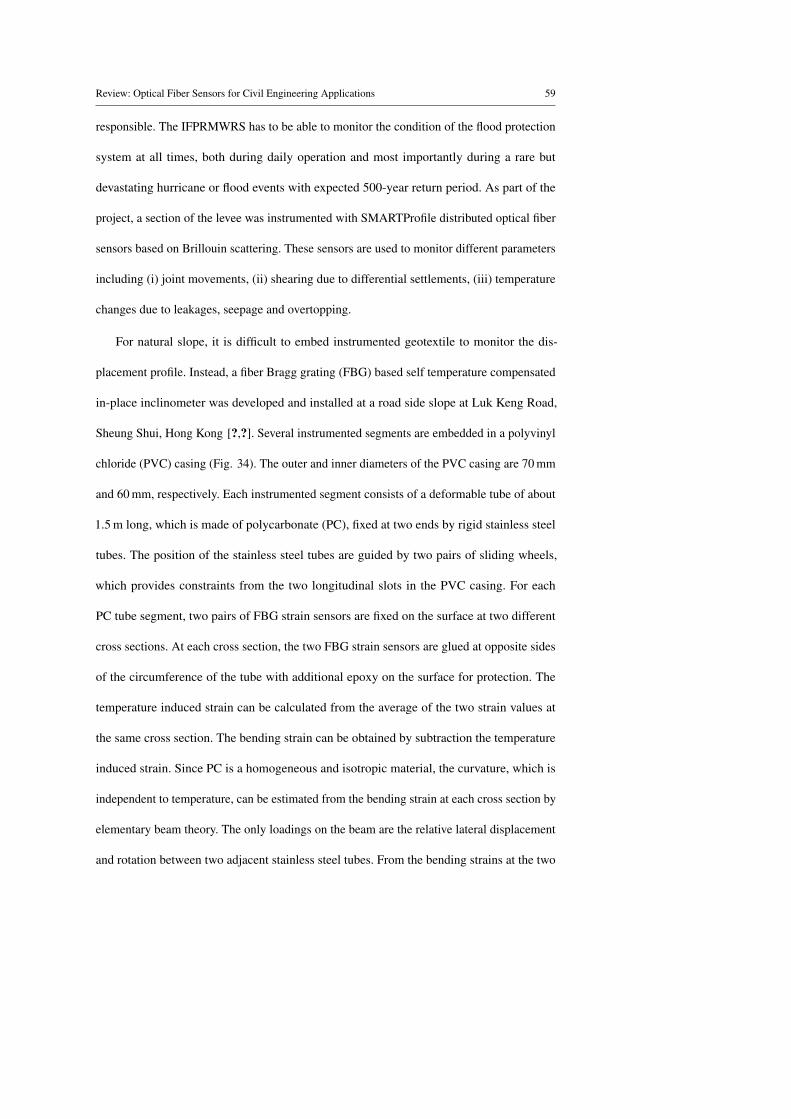
Review: Optical Fiber Sensors for Civil Engineering Applications 59
responsible. The IFPRMWRS has to be able to monitor the condition of the flood protection
system at all times, both during daily operation and most importantly during a rare but
devastating hurricane or flood events with expected 500-year return period. As part of the
project, a section of the levee was instrumented with SMARTProfile distributed optical fiber
sensors based on Brillouin scattering. These sensors are used to monitor different parameters
including (i) joint movements, (ii) shearing due to differential settlements, (iii) temperature
changes due to leakages, seepage and overtopping.
For natural slope, it is difficult to embed instrumented geotextile to monitor the dis-
placement profile. Instead, a fiber Bragg grating (FBG) based self temperature compensated
in-place inclinometer was developed and installed at a road side slope at Luk Keng Road,
Sheung Shui, Hong Kong [?,?]. Several instrumented segments are embedded in a polyvinyl
chloride (PVC) casing (Fig. 34). The outer and inner diameters of the PVC casing are 70 mm
and 60 mm, respectively. Each instrumented segment consists of a deformable tube of about
1.5 m long, which is made of polycarbonate (PC), fixed at two ends by rigid stainless steel
tubes. The position of the stainless steel tubes are guided by two pairs of sliding wheels,
which provides constraints from the two longitudinal slots in the PVC casing. For each
PC tube segment, two pairs of FBG strain sensors are fixed on the surface at two different
cross sections. At each cross section, the two FBG strain sensors are glued at opposite sides
of the circumference of the tube with additional epoxy on the surface for protection. The
temperature induced strain can be calculated from the average of the two strain values at
the same cross section. The bending strain can be obtained by subtraction the temperature
induced strain. Since PC is a homogeneous and isotropic material, the curvature, which is
independent to temperature, can be estimated from the bending strain at each cross section by
elementary beam theory. The only loadings on the beam are the relative lateral displacement
and rotation between two adjacent stainless steel tubes. From the bending strains at the two
60 Leung and Wan et al
Slope surface
Bore hole with PVC casing
Stainless steel tube
Instrumented PC tube
FBG
WheelsStainless
PC tube
A segment of
steel tube
the inclinometer
longitudinalguide slots
on two
Fig. 34 Schematic diagram of a FBG based inclinometer
cross sections, the two unknown loadings can be solved and the displacement profile along
the inclinometer can be computed segment by segment. The displacement profile obtained
from the installed inclinometers showed that the slope movement accumulated gradually in
wet season and enabled the main sliding surface in the slope to be identified. If two orthogonal
lateral displacement profiles are required, four additional FBG sensors should be attached at
each segment on two orthogonal planes.
The Luzzone Dam, an arch dam in Switzerland, was raised by 17 m in height to increase
its capacity. Mass concrete was poured in-situ. Both long-gauge SOFO interferometers and
Brillouin distributed temperature sensors were installed. Long-gauge SOFO interferometers
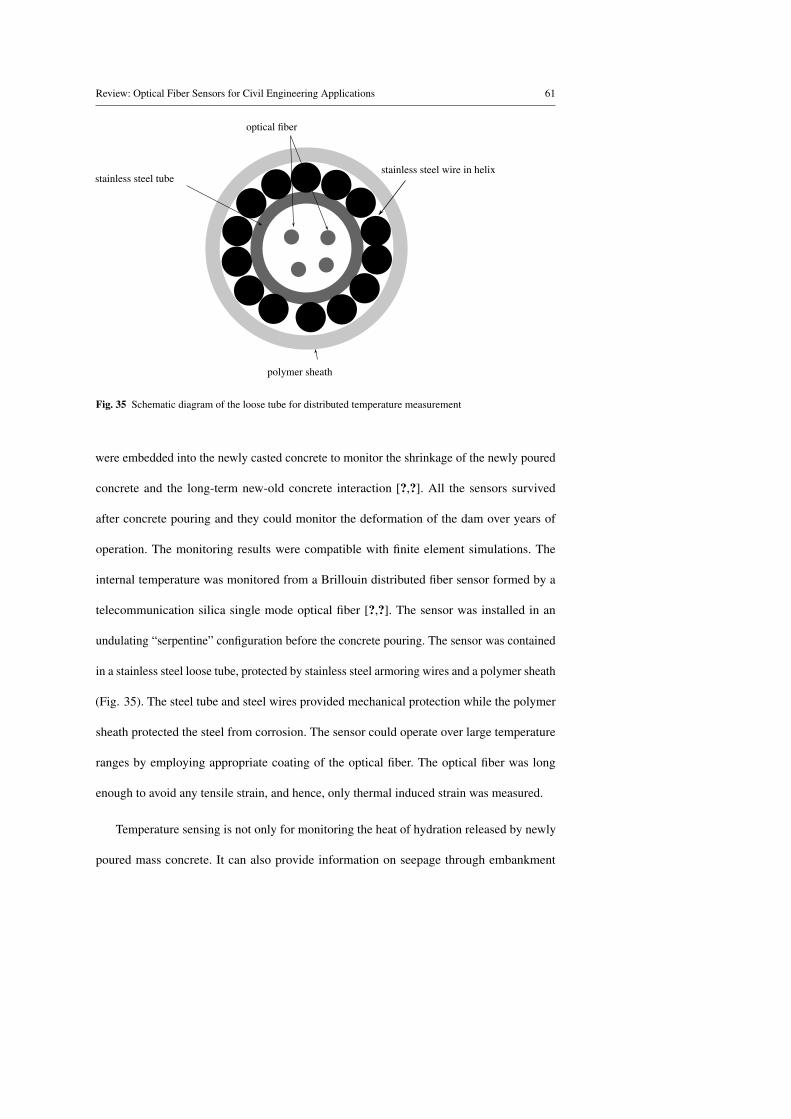
Review: Optical Fiber Sensors for Civil Engineering Applications 61
optical fiber
stainless steel tubestainless steel wire in helix
polymer sheath
Fig. 35 Schematic diagram of the loose tube for distributed temperature measurement
were embedded into the newly casted concrete to monitor the shrinkage of the newly poured
concrete and the long-term new-old concrete interaction [?,?]. All the sensors survived
after concrete pouring and they could monitor the deformation of the dam over years of
operation. The monitoring results were compatible with finite element simulations. The
internal temperature was monitored from a Brillouin distributed fiber sensor formed by a
telecommunication silica single mode optical fiber [?,?]. The sensor was installed in an
undulating “serpentine” configuration before the concrete pouring. The sensor was contained
in a stainless steel loose tube, protected by stainless steel armoring wires and a polymer sheath
(Fig. 35). The steel tube and steel wires provided mechanical protection while the polymer
sheath protected the steel from corrosion. The sensor could operate over large temperature
ranges by employing appropriate coating of the optical fiber. The optical fiber was long
enough to avoid any tensile strain, and hence, only thermal induced strain was measured.
Temperature sensing is not only for monitoring the heat of hydration released by newly
poured mass concrete. It can also provide information on seepage through embankment
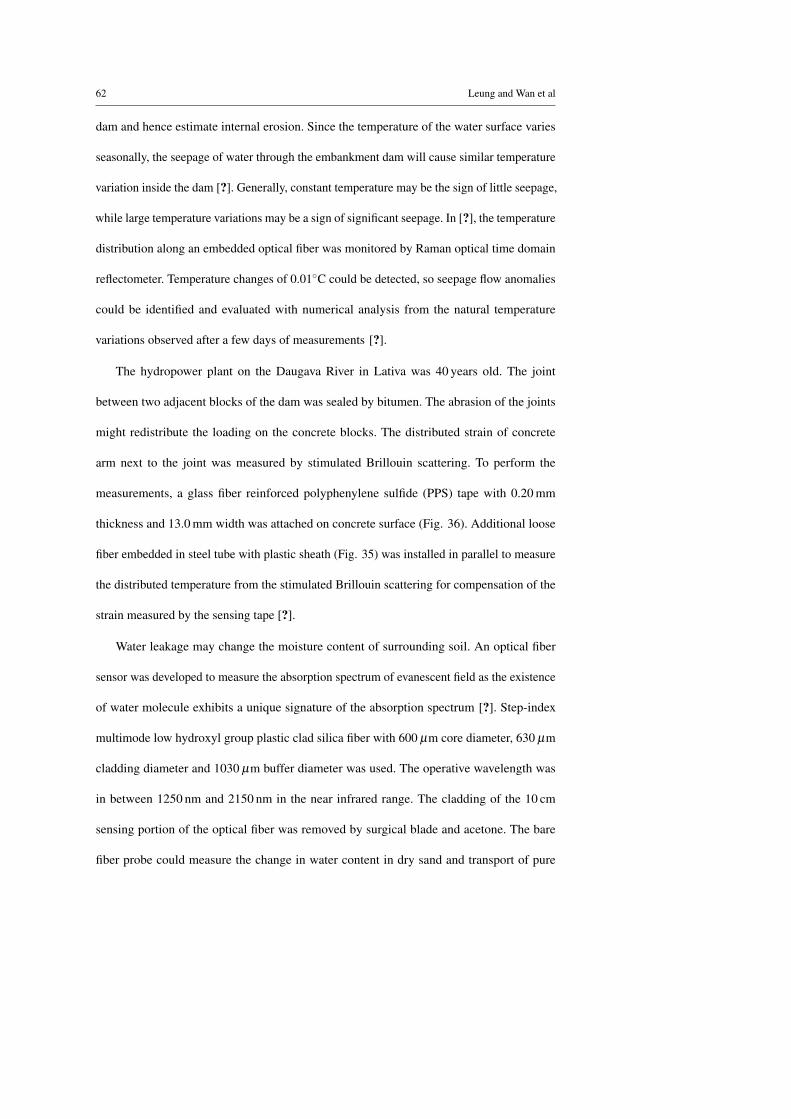
62 Leung and Wan et al
dam and hence estimate internal erosion. Since the temperature of the water surface varies
seasonally, the seepage of water through the embankment dam will cause similar temperature
variation inside the dam [?]. Generally, constant temperature may be the sign of little seepage,
while large temperature variations may be a sign of significant seepage. In [?], the temperature
distribution along an embedded optical fiber was monitored by Raman optical time domain
reflectometer. Temperature changes of 0.01◦C could be detected, so seepage flow anomalies
could be identified and evaluated with numerical analysis from the natural temperature
variations observed after a few days of measurements [?].
The hydropower plant on the Daugava River in Lativa was 40 years old. The joint
between two adjacent blocks of the dam was sealed by bitumen. The abrasion of the joints
might redistribute the loading on the concrete blocks. The distributed strain of concrete
arm next to the joint was measured by stimulated Brillouin scattering. To perform the
measurements, a glass fiber reinforced polyphenylene sulfide (PPS) tape with 0.20 mm
thickness and 13.0 mm width was attached on concrete surface (Fig. 36). Additional loose
fiber embedded in steel tube with plastic sheath (Fig. 35) was installed in parallel to measure
the distributed temperature from the stimulated Brillouin scattering for compensation of the
strain measured by the sensing tape [?].
Water leakage may change the moisture content of surrounding soil. An optical fiber
sensor was developed to measure the absorption spectrum of evanescent field as the existence
of water molecule exhibits a unique signature of the absorption spectrum [?]. Step-index
multimode low hydroxyl group plastic clad silica fiber with 600 µm core diameter, 630 µm
cladding diameter and 1030 µm buffer diameter was used. The operative wavelength was
in between 1250 nm and 2150 nm in the near infrared range. The cladding of the 10 cm
sensing portion of the optical fiber was removed by surgical blade and acetone. The bare
fiber probe could measure the change in water content in dry sand and transport of pure
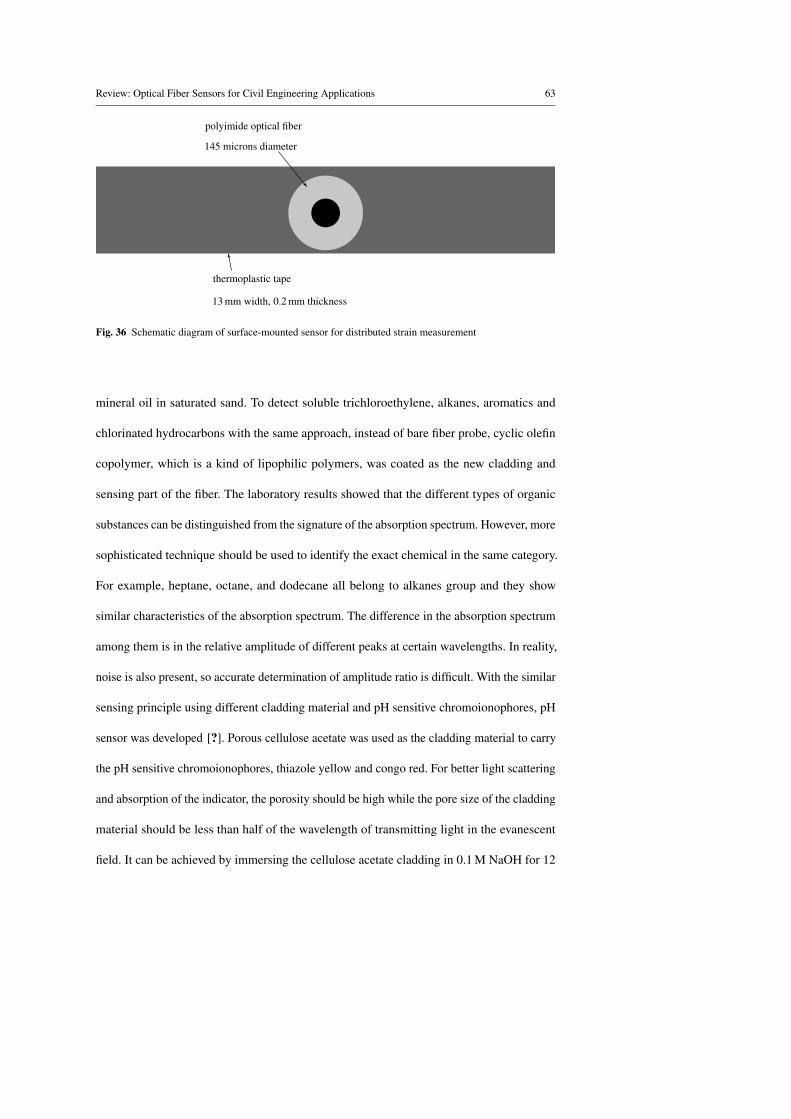
Review: Optical Fiber Sensors for Civil Engineering Applications 63
thermoplastic tape
polyimide optical fiber
145 microns diameter
13 mm width, 0.2 mm thickness
Fig. 36 Schematic diagram of surface-mounted sensor for distributed strain measurement
mineral oil in saturated sand. To detect soluble trichloroethylene, alkanes, aromatics and
chlorinated hydrocarbons with the same approach, instead of bare fiber probe, cyclic olefin
copolymer, which is a kind of lipophilic polymers, was coated as the new cladding and
sensing part of the fiber. The laboratory results showed that the different types of organic
substances can be distinguished from the signature of the absorption spectrum. However, more
sophisticated technique should be used to identify the exact chemical in the same category.
For example, heptane, octane, and dodecane all belong to alkanes group and they show
similar characteristics of the absorption spectrum. The difference in the absorption spectrum
among them is in the relative amplitude of different peaks at certain wavelengths. In reality,
noise is also present, so accurate determination of amplitude ratio is difficult. With the similar
sensing principle using different cladding material and pH sensitive chromoionophores, pH
sensor was developed [?]. Porous cellulose acetate was used as the cladding material to carry
the pH sensitive chromoionophores, thiazole yellow and congo red. For better light scattering
and absorption of the indicator, the porosity should be high while the pore size of the cladding
material should be less than half of the wavelength of transmitting light in the evanescent
field. It can be achieved by immersing the cellulose acetate cladding in 0.1 M NaOH for 12
64 Leung and Wan et al
hours. The resulting pore size is then in the range between 50 nm and 200 nm. Experiments
showed that the sensitive ranges of thiazole yellow and congo red were pH 10-12 and pH 2-4,
respectively, and the sensor signal was reversible.
3.4 Pipelines and Cables
The main characteristic of pipelines and cables is the very long longitudinal length. The
conventional leak detection method is based on the measurement of mass flow rate at
certain points. With this approach, it is not possible to pinpoint the exact leak location,
so slow and expensive visual inspection needs to be undertaken. It is impractical to apply
point sensors for monitoring these kinds of structures. Several distributed sensors based
on Brillouin optical time domain reflectometry (BOTDR) have therefore been developed.
To measure the deflection of the pipeline, the tapes shown in Fig. 36 were glued along the
whole length of a pipeline in Rimini of Italy at 0◦, 30◦ and 150◦ from the longitudinal
direction [?,?]. An additional optical fiber was placed inside a stainless steel loose tube (as in
Fig. 35) and it was mounted along the longitudinal direction of the pipeline for temperature
measurement. The strain resolution was about 20 microstrains with spatial resolution of 1.5 m.
The temperature resolution was about 1◦C with similar spatial resolution. The distributed
strain after temperature compensation can be used to monitor the deflection of the pipeline
and the temperature distribution measurement can provide the temperature compensation of
the total strain measured and pinpoint the location of gas leakage.
The leakage in pipeline induces local drop in temperature. For example, the leakage
of ethylene may cool the pipeline locally to -110◦C when it is depressurized to its natural
gaseous state. By using Raman optical time domain reflectometer, the exact location of sharp
temperature drop can be located within meters in real time. Single mode telecommunication
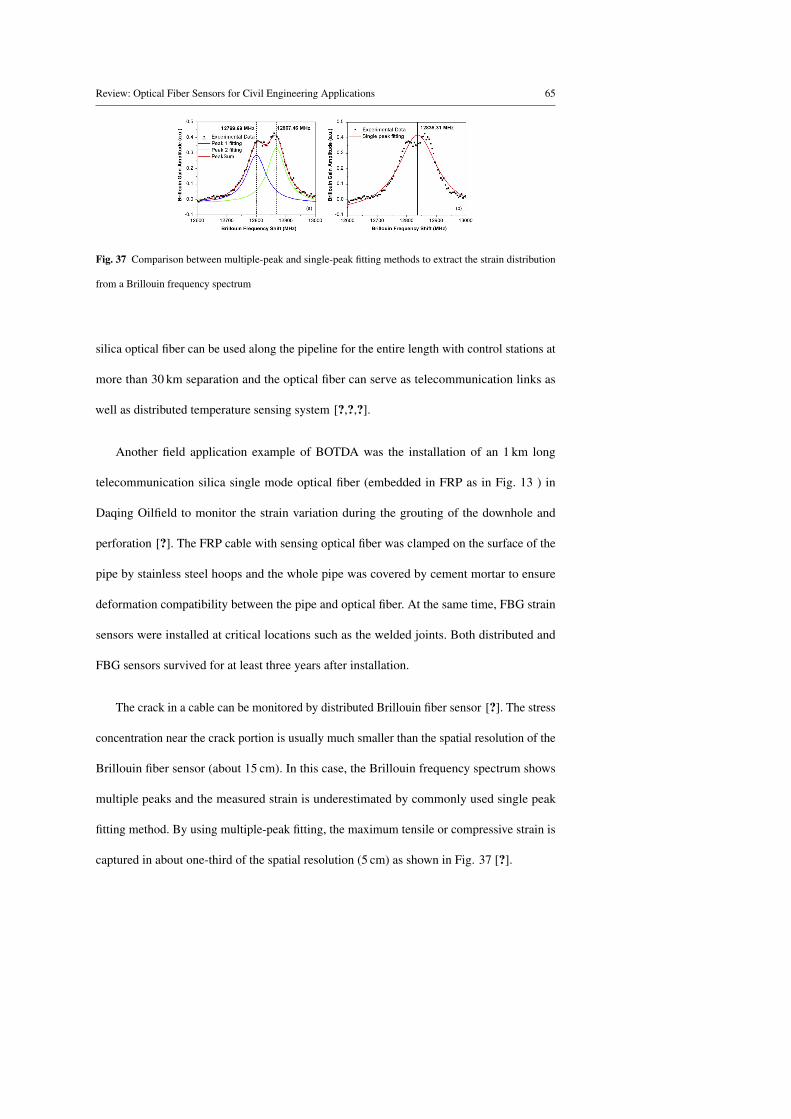
Review: Optical Fiber Sensors for Civil Engineering Applications 65
Fig. 37 Comparison between multiple-peak and single-peak fitting methods to extract the strain distribution
from a Brillouin frequency spectrum
silica optical fiber can be used along the pipeline for the entire length with control stations at
more than 30 km separation and the optical fiber can serve as telecommunication links as
well as distributed temperature sensing system [?,?,?].
Another field application example of BOTDA was the installation of an 1 km long
telecommunication silica single mode optical fiber (embedded in FRP as in Fig. 13 ) in
Daqing Oilfield to monitor the strain variation during the grouting of the downhole and
perforation [?]. The FRP cable with sensing optical fiber was clamped on the surface of the
pipe by stainless steel hoops and the whole pipe was covered by cement mortar to ensure
deformation compatibility between the pipe and optical fiber. At the same time, FBG strain
sensors were installed at critical locations such as the welded joints. Both distributed and
FBG sensors survived for at least three years after installation.
The crack in a cable can be monitored by distributed Brillouin fiber sensor [?]. The stress
concentration near the crack portion is usually much smaller than the spatial resolution of the
Brillouin fiber sensor (about 15 cm). In this case, the Brillouin frequency spectrum shows
multiple peaks and the measured strain is underestimated by commonly used single peak
fitting method. By using multiple-peak fitting, the maximum tensile or compressive strain is
captured in about one-third of the spatial resolution (5 cm) as shown in Fig. 37 [?].
66 Leung and Wan et al
When pipelines are subjected to significant temperature change, the large thermal induced
compressive stress may cause buckling. It is difficult to have prior knowledge of exact
buckling location, so it is impractical to apply point sensor for monitoring. It is also impossible
to identify buckling through visual inspection as the pipeline is buried underground. For
this case, distributed Brillouin fiber sensor to monitor the buckling of the pipeline was
demonstrated in [?,?,?]. Several telecommunication silica optical fibers were attached on the
circumference of pipeline along the longitudinal direction (Fig. 38). By using the coherent
probe-pump based Brillouin sensor [?], centimeter spatial resolution and 15 microstrains
accuracy can be achieved over tens of kilometers. The buckling locations could be identified
by the ripples of the strain distribution before the pipeline rupture. It is impractical to directly
measure the hoop strain along a pipeline for several hundred kilometers. However, the
distributed hoop strain can be deduced from the measured strain along the longitudinal
direction of the pipeline at different angular positions at the circumference.
For ultra long submarine optical fiber cable, the exact damage location cannot be identified
easily by using OTDR because the optical fibers are usually protected by external tubes and
there may be certain excess length of optical fiber cable. It is a tedious task to pinpoint the
cable fault location from the project documentations and then calculate based on the scale
of the maps of the cable route. The accuracy of this conventional method is only around
40-50 m. By using the BOTDR, approximate fault location can be identified. Then, the cable
was lifted (about 100 m in length) and heated up by 5◦C locally, the distance between the
heating and fault locations can be measured [?]. As shown in Fig. 39, by comparing the
BOTDR reading between the preheated and heated strain distribution, the distance between
the heated up point and the fault location can be estimated precisely. By using this technique,
the accuracy of fault location can reach the spatial resolution of the BOTDR.
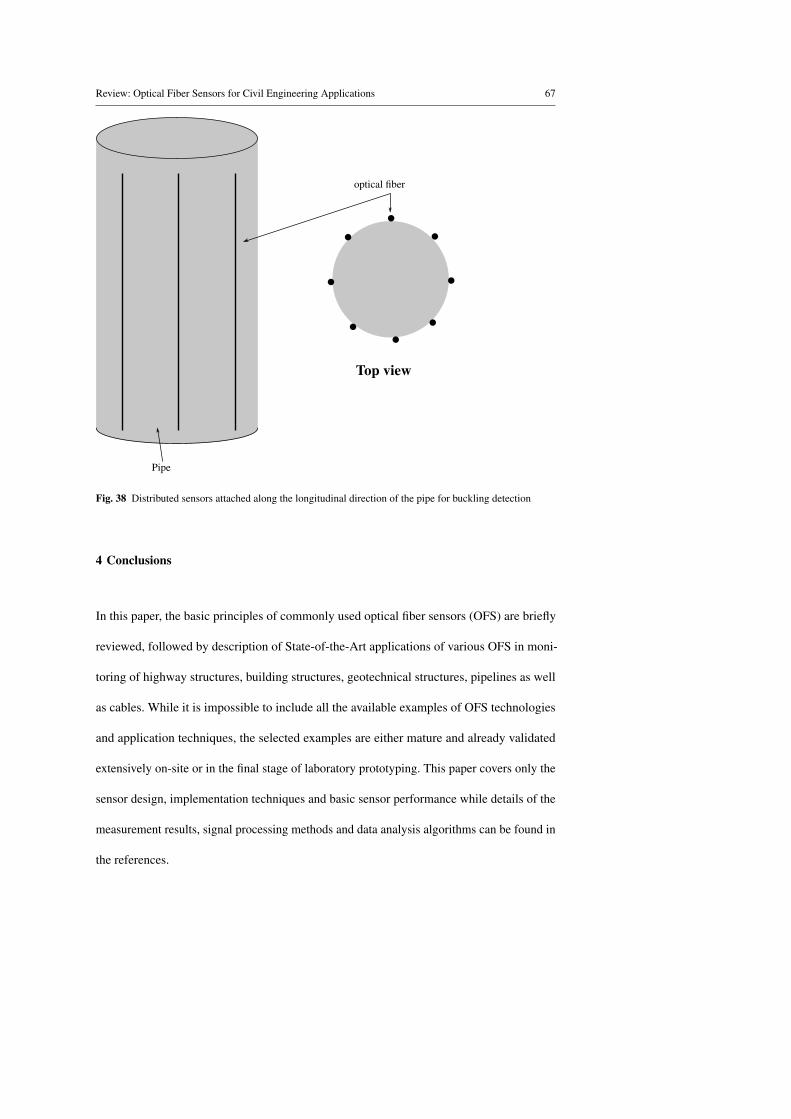
Review: Optical Fiber Sensors for Civil Engineering Applications 67
Pipe
Top view
optical fiber
Fig. 38 Distributed sensors attached along the longitudinal direction of the pipe for buckling detection
4 Conclusions
In this paper, the basic principles of commonly used optical fiber sensors (OFS) are briefly
reviewed, followed by description of State-of-the-Art applications of various OFS in moni-
toring of highway structures, building structures, geotechnical structures, pipelines as well
as cables. While it is impossible to include all the available examples of OFS technologies
and application techniques, the selected examples are either mature and already validated
extensively on-site or in the final stage of laboratory prototyping. This paper covers only the
sensor design, implementation techniques and basic sensor performance while details of the
measurement results, signal processing methods and data analysis algorithms can be found in
the references.
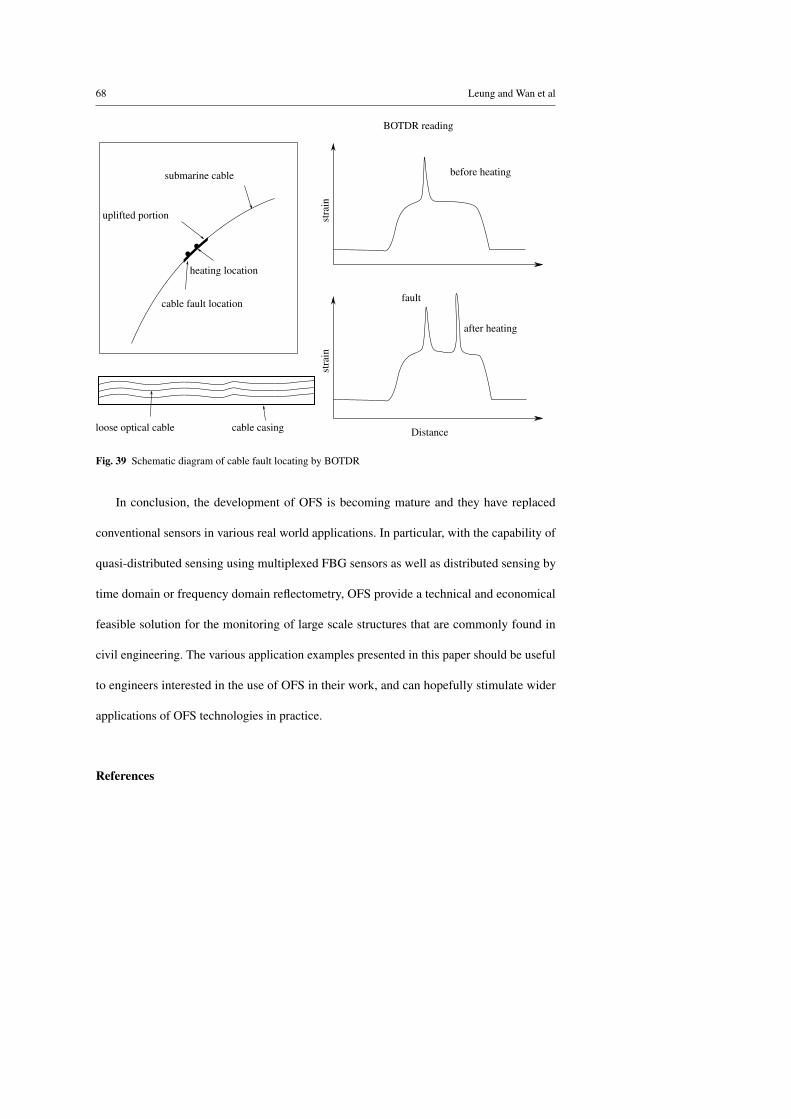
68 Leung and Wan et al
cable casingloose optical cable
cable fault location
heating location
Distance
uplifted portion
submarine cable
stra
inst
rain
BOTDR reading
fault
before heating
after heating
Fig. 39 Schematic diagram of cable fault locating by BOTDR
In conclusion, the development of OFS is becoming mature and they have replaced
conventional sensors in various real world applications. In particular, with the capability of
quasi-distributed sensing using multiplexed FBG sensors as well as distributed sensing by
time domain or frequency domain reflectometry, OFS provide a technical and economical
feasible solution for the monitoring of large scale structures that are commonly found in
civil engineering. The various application examples presented in this paper should be useful
to engineers interested in the use of OFS in their work, and can hopefully stimulate wider
applications of OFS technologies in practice.
References