Embed Size (px)
Citation preview
Review study on household tumble driers
Final report
June 2019
The information and views set out in this study are
those of the author(s) and do not necessarily reflect
the official opinion of the European Commission
2
Prepared by
Study team:
Larisa Maya-Drysdale, Nicklas Høgh Iversen, Annette Gydesen and Peter Martin Skov
Hansen (Viegand Maagøe A/S)
Quality assurance:
Annette Gydesen (Viegand Maagøe A/S)
Contract managers:
Viegand Maagøe A/S
Project website: https://www.review-tumbledriers.eu/
Implements Framework Contract: № ENER/C3/2015-619 LOT 2
Specific contract no.: ENER/C3/SER/FV 2017-438/02/FWC 2015-619 LOT2/04/SI2.757437
This study was ordered and paid for by the European Commission, Directorate-General for
Energy.
The information and views set out in this study are those of the author(s) and do not
necessarily reflect the official opinion of the Commission. The Commission does not
guarantee the accuracy of the data included in this study. Neither the Commission nor
any person acting on the Commission’s behalf may be held responsible for the use which
may be made of the information contained therein.
This report has been prepared by the authors to the best of their ability and knowledge.
The authors do not assume liability for any damage, material or immaterial, that may arise
from the use of the report or the information contained therein.
© European Union, June 2019.
Reproduction is authorised provided the source is acknowledged.
More information on the European Union is available on the internet (http://europa.eu).
I. Preface
This is the draft final report for the review of Ecodesign Regulation (EU) No 932/20121 and
Energy Labelling Regulation (EU) No 392/20122 for household tumble driers. The final
report includes all tasks of the MEErP methodology, including recommendations for revision
of the regulations.
Task 1 outlines the scope of the regulations and of the review study, including product
categorisation, as well as the relevant standards and legislation, including those under
development, related to tumble drier energy consumption and resource efficiency.
Task 2 gives an overview of the tumble drier market including sales, stock and base data
on consumer costs, including stock back casting and forecasting covered by available data.
Furthermore task 2 presents an overview of market trends concerning product design and
features and how they are affecting tumble driers performance considering the parameters
shown in the energy label, energy class distribution and the energy efficiency of all products
in scope of this review study.
Task 3 presents latest trends in consumer behaviour, lifetime and an overview of the
current end-of-life practices for tumble driers. Consumer behaviour aspects presented are
those affecting energy consumption and efficiency, such as loading habits. Furthermore,
here it is discussed whether these aspects are properly reflected in test standards and
measurements conditions. Tumble driers lifetime is also investigated, and whether there
are differences in lifetime between different heating technologies, in particular for heat
pump tumble driers. A preliminary conclusion has been drawn on the appropriateness of
the current verification tolerances, as defined in Annex III and Annex V of the Ecodesign
and Energy Labelling Regulations respectively. This is based on expert judgment and in
line with conclusions from the household washing machines’ preparatory study.
Task 4 reviews the technical aspects of tumble driers and outlines the current technology
levels in terms of average and best available technologies (BAT), as well as which
technologies are expected to enter the market (best not yet available technology, BNAT).
Besides the effect on energy consumption, the technologies are also reviewed in terms of
resource efficiency. This analysis is the basis to define the base case technology, which will
be presented and used in subsequent tasks to define the base cases.
Task 5 presents the proposed base cases and the environmental and economic impacts of
each of them. The environmental impacts include those from the whole life cycle of the
1 https://eur-lex.europa.eu/legal-content/EN/TXT/PDF/?uri=CELEX:32012R0932&from=EN 2 https://eur-lex.europa.eu/legal-content/EN/TXT/PDF/?uri=CELEX:32012R0392&from=EN
4
base cases, including the production, distribution, use (incl. repair and maintenance) and
end-of-life. They are reported by the impact categories given in the EcoReport tool. The
economic impacts are reported as the life cycle costs of the base cases for the end-users,
according to the methodology used in the EcoReport tool.
Task 6 outlines the design options for improving the environmental performance of the
base cases, based on input from technology assessment reported in task 4. It also reports
the effect of these design options on the consumer’s life cycle costs and selects those that
don’t entail excessive costs. Design options are outlined for both energy and resource
efficiency improvements.
Task 7 presents first the evaluation of the existing regulations in the context of the Better
Regulation framework, focusing specifically on the regulations’ effectiveness, efficiency and
relevance. Afterwards it outlines the proposed policy options for each base case, using the
selected design options in task 6 as starting point, and presents the opportunities and
barriers from each of them. It also presents the impacts of these policy options in the
scenario analyses and concludes with potential recommendations for the revision of the
regulations
II. Table of Contents
I. Preface .......................................................................................................... 3
II. Table of Contents ......................................................................................... 5
III. List of tables ............................................................................................... 11
IV. List of figures .............................................................................................. 16
V. General background ........................................................................................ 22
VI. Executive summary ..................................................................................... 25
Scope and review of relevant legislation and standards ..........................................25
Market analysis .................................................................................................25
User behaviour ..................................................................................................29
Technology overview .........................................................................................32
Definition of base cases, Environment and Economics ............................................37
Design options ..................................................................................................40
Scenarios .........................................................................................................43
Recommendations .............................................................................................48
1. Scope ........................................................................................................... 49
1.1 Product scope ..........................................................................................49
1.1.1 Definitions from the Regulations ..........................................................49
1.1.2 Definitions from preparatory study .......................................................51
1.1.3 Definitions in EN 61121:2013 standard – Tumble driers for household use –
Methods for measuring the performance ...........................................................52
1.1.4 PRODCOM categories ..........................................................................53
1.1.5 Description of products .......................................................................54
1.1.6 Summary of scope .............................................................................57
1.2 Review of relevant legislation .....................................................................58
1.2.1 EU Directive 2009/125/EC – Ecodesign for Energy-Related Products .........58
1.2.2 EU Regulation 2017/1369 setting a framework for energy labelling and
replacing Directive 2010/30/EU ........................................................................63
1.2.3 EU Directive 2014/35/EU – Low Voltage Directive ..................................71
1.2.4 EU Directive 2012/19/EU – The WEEE Directive .....................................71
6
1.2.5 EU Regulation 1907/2006/EC – REACH Regulation .................................71
1.2.6 EU Directive 2011/65/EU – RoHS Directive ............................................72
1.2.7 Third country national legislation - Switzerland ......................................72
1.2.8 Voluntary agreements ........................................................................72
1.2.9 Summary of relevant legislations .........................................................74
1.3 Review of relevant standards .....................................................................75
1.3.1 European and international standards ...................................................75
1.3.2 Mandates issued by the EC to the European Standardization Organizations82
1.3.3 Summary of relevant standards ...........................................................83
1.4 Review of relevant legislation, standards and voluntary agreements on resource
efficiency ..........................................................................................................84
2. Market and stock ............................................................................................ 91
2.1 Sales ......................................................................................................91
2.1.1 Sales split and market shares ..............................................................92
2.1.2 Sales values ......................................................................................94
2.2 Stock ......................................................................................................95
2.2.1 Lifetime ............................................................................................95
2.2.2 Tumble drier stock .............................................................................95
2.3 Market trends ..........................................................................................97
2.3.1 Sales trends ......................................................................................97
2.3.2 Product trends ...................................................................................97
2.3.3 Future impact of ecodesign requirements on air-vented driers ............... 114
2.3.4 Market channels and production structure ........................................... 115
2.4 Consumer expenditure base data ............................................................. 115
2.4.1 Interest and inflation rates (MEErP method for LCC calculation) ............. 116
2.4.2 Consumer purchase price .................................................................. 116
2.4.3 Installation costs .............................................................................. 117
2.4.4 Electricity and gas prices ................................................................... 118
2.4.5 Repair and maintenance costs ........................................................... 119
2.4.6 End-of-life costs ............................................................................... 120
7
3. Review of user behaviour .............................................................................. 121
3.1 Consumer behaviour related to use .......................................................... 121
3.1.1 Parameters influencing the energy consumption of the drier .................. 121
3.1.2 User Behaviour ................................................................................ 125
3.1.3 Impacts of tumble driers on secondary energy systems ........................ 135
3.2 Consumer behaviour related to product durability and end of life ................. 140
3.2.1 Durability and lifetime ...................................................................... 141
3.2.2 Repairability and maintenance ........................................................... 143
3.2.3 Best practice in sustainable use ......................................................... 152
3.2.4 Collection rates at households/other users .......................................... 152
3.2.5 Conclusion on consumer behaviour related to product durability and end-of-
life 154
3.3 Local infrastructure................................................................................. 154
3.3.1 Electricity ........................................................................................ 154
3.3.2 Gas ................................................................................................ 158
3.4 Verification tolerances ............................................................................. 160
4. Technologies ................................................................................................ 161
4.1 Products with standard improvement design options ................................... 163
4.1.1 Motors for all drier types ................................................................... 163
4.1.2 Variable Speed Drives for all drier types .............................................. 164
4.1.3 Controller for all drier types ............................................................... 164
4.1.4 Heat exchangers for condensing driers ................................................ 164
4.1.5 Compressor for heat pump condensing driers ...................................... 165
4.1.6 Refrigerants for heat pump condensing driers ...................................... 166
4.1.7 Drum, bearings, and sealing for all drier types ..................................... 166
4.1.8 Filters for all drier types .................................................................... 166
4.1.9 Additional features ........................................................................... 167
4.2 Best Available Technology BAT ................................................................. 167
4.3 Best Not Yet Available Technology BNAT ................................................... 168
4.4 Production and distribution ...................................................................... 169
8
4.4.1 Bill-of-Materials (BOM) ...................................................................... 169
4.4.2 Primary scrap production during manufacturing ................................... 170
4.4.3 Packaging materials ......................................................................... 170
4.4.4 Volume and weight of the packaged product ........................................ 170
4.4.5 Means of transport ........................................................................... 171
4.5 End-of-Life ............................................................................................ 171
4.5.1 Recyclability of tumble driers ............................................................. 171
4.5.2 Design options regarding resource efficiency ....................................... 174
5. Environment and Economics .......................................................................... 180
5.1 Product specific inputs ............................................................................ 180
5.1.1 Base cases for household tumble driers .............................................. 180
5.1.1 Raw material use and manufacturing .................................................. 183
5.1.2 Distribution of base cases .................................................................. 186
5.1.3 Use phase of base cases ................................................................... 186
5.1.4 End-of-Life phase of base cases ......................................................... 191
5.1.5 Life Cycle Cost (LCC) inputs for base cases .......................................... 192
5.1.6 Environmental Impact of base cases ................................................... 195
5.1.7 Market Economics and LCC for base cases ........................................... 198
5.2 EU-28 totals .......................................................................................... 199
6. Design options ............................................................................................. 202
6.1 Design options ....................................................................................... 202
6.1.1 Improved drum and fan motor efficiency by replacing asynchronous induction
motor with permanent magnet synchronous motors (PMAC/BLDC) ..................... 208
6.1.2 Improved compressor motor efficiency by replacing asynchronous induction
motor with permanent magnet synchronous motors (PMAC/BLDC) ..................... 208
6.1.3 Multi motor setup to have a better on/off control of the different subsystems
(e.g. drum motor, process-air fan motor, condenser fan motor) ......................... 209
6.1.4 Longer cycle time with lower drying temperatures ................................ 209
6.1.5 Improved condensation rate/cycle time/condensation efficiency by improving
heat exchangers (air to air) with copper fins instead of aluminium ...................... 210
9
6.1.6 Improving the heat pump circuit characteristics by reducing
condensation/evaporation pressure difference and by using more effective heat
exchanger ................................................................................................... 211
6.1.7 Improved energy efficiency of condenser driers by changing heating
technology to heat pump for condenser driers .................................................. 212
6.1.8 Reduced GWP (Global Warming Potential) by using natural refrigerants
instead of F-gasses ....................................................................................... 212
6.1.9 Reduced use of virgin materials and environmental impacts by displaying
content of recycled plastics of drier to the consumers ....................................... 213
6.1.10 Increased durability and reparability of tumble driers by easy access of critical
parts by professionals and ensuring availability of spare parts after 2 years ......... 213
6.1.11 Increased dismantling and recyclability at End-of-Life by a modular design
which enhances recovery of critical materials, plastics and metals ...................... 214
6.2 Potential environmental improvements and consumer costs......................... 214
6.2.1 Base case 1 (BC1) – Condenser heating element tumble driers .............. 215
6.2.1 Base case 2 (BC2) – Condenser heat pump driers ................................ 216
6.2.2 Base case 3 (BC3) - Heating element air-vented driers ......................... 217
6.2.3 Base Case 4 (BC4) - Gas-fired air-vented driers ................................... 218
6.3 Least Life Cycle Cost (LLCC) analysis ........................................................ 219
6.3.1 Design options that can be implemented simultaneously (i.e. clustered design
options) 219
6.3.2 Ranking of design options ................................................................. 220
6.4 Long-term potentials based on identified BNAT .......................................... 223
7. Scenarios .................................................................................................... 225
7.1 Evaluation of existing regulation............................................................... 225
7.1.1 Introduction .................................................................................... 225
7.1.2 Effectiveness of the regulations .......................................................... 229
7.1.3 Efficiency ........................................................................................ 238
7.1.4 Relevance ....................................................................................... 243
7.2 Policy analysis ....................................................................................... 246
7.2.1 Stakeholders consultation ................................................................. 247
7.2.2 Policy measures ............................................................................... 247
10
7.2.3 Proposed policy options incl. barriers and opportunities ......................... 250
7.3 Scenario analysis ................................................................................... 261
7.3.1 Indicators ........................................................................................ 261
7.3.2 Description of BAU ........................................................................... 264
7.3.3 Description of policy options for energy and performance ...................... 265
7.3.4 Description of policy options for resource efficiency .............................. 272
7.3.5 Results ........................................................................................... 273
7.4 Sensitivity analysis ................................................................................. 287
7.5 Conclusions and recommendations ........................................................... 292
7.5.1 Policy options .................................................................................. 292
7.5.2 Base cases ...................................................................................... 295
7.5.3 Recommendations ............................................................................ 295
I. Annex I: Coverage of market data .................................................................. 297
II. Annex II: Guidelines supporting the WEEE Directive ...................................... 300
III. Annex III; Resources recovered by different types of smelters ........................ 302
IV. Annex IV: Method to calculate refrigerant’s Global Warming Potential in EcoReport
tool 304
V. Annex V: Detailed environmental impacts reported by EcoReport tool ................. 305
VI. Annex VI: Aggregated environmental impacts reported by EcoReport tool ........ 308
VII. Annex VII: Stakeholders comments after first stakeholders meeting on draft interim
report 310
VIII. Annex VIII: Energy label distributions used for scenario analyses in task 7 .... 344
IX. Annex IX: Sensitivity analysis detailed results ............................................... 346
X. Annex X: Stakeholders comments after second stakeholders meeting on draft final
report ............................................................................................................... 356
11
III. List of tables
Table i: Derived tumble drier sales from 1990 to 2030 ..............................................25
Table ii: Stock of tumble driers from 2000 to 2030 ...................................................26
Table iii: Unit retail prices in EUR for household tumble driers ....................................29
Table iv: List of components for the average tumble drier. HP-C = Condensing heat pump
drier, HE-C = Condensing heating element drier, HE-V = air-vented heating element drier,
GA-V = air-vented gas fired drier. ..........................................................................34
Table v: List of components for the BAT-tumble drier. HP-C = Condensing heat pump
drier, HE-C = Condensing heating element drier, HE-V = air-vented heating element drier,
GA-V = air-vented gas fired drier. ..........................................................................35
Table vi: Key performance parameters for the four selected base cases ......................37
Table vii: Selected design options and their application for base cases ........................40
Table viii: Proposed POs for review of Ecodesign and Energy Labelling Regulations of
household tumble driers ........................................................................................44
Table ix: Results of each policy option, evaluated by the differences compared to BAU
values in 2030 (a negative number means a reduction of the parameter compared to BAU)
..........................................................................................................................47
Table x: Results of each policy option, evaluated by the differences compared to BAU values
in 2040 (a negative number means a reduction of the parameter compared to BAU) ....47
Table 1: Product categories used in the PRODCOM database ......................................54
Table 2: Energy efficiency classes in Regulation 392/2012 .........................................64
Table 3: Condensation efficiency classes in Regulation 392/2012 ................................65
Table 4: US ENERGY STAR requirements for tumble driers .........................................72
Table 5: Summary of relevant legislations other than ecodesign and energy labelling
Regulations of tumble driers and of relevant voluntary agreements ............................74
Table 6: Summary of relevant standards for ecodesign and energy labelling Regulations
..........................................................................................................................84
Table 7: Comparison of tumble drier sales data from GfK and PRODCOM, shown as million
units ...................................................................................................................92
Table 8: Household tumble drier sales in Europe 2013-2016, source: GfK (adjusted to
EU28) .................................................................................................................93
Table 9: Market shares of the four main tumble drier technologies .............................93
Table 10: Derived tumble drier sales from 1990 to 2030 ...........................................94
Table 11: Tumble drier market values .....................................................................94
Table 12: Average unit price of tumble driers in EU ..................................................95
Table 13: Average expected lifetime and assumed variations used in the stock model ...96
Table 14: Stock of tumble driers in EU from 2000 to 2030, penetration rate from 2010 to
2030. ..................................................................................................................96
12
Table 15: Unit retail prices in EUR for household tumble driers ................................. 116
Table 16: Installation costs for gas driers .............................................................. 118
Table 17: Electricity and gas prices with 2016 as base year will be used .................... 118
Table 18: Average total labour costs for repair services in EUR per hour .................... 119
Table 19: Ecodesign requirements for tumble driers ................................................ 123
Table 20: Distribution of energy efficiency classes based on EEI values ..................... 123
Table 21: Ecodesign requirements for condensation efficiency of condenser driers ...... 124
Table 22: Key findings for drying behaviour studies ................................................ 126
Table 23. Available studies on washing behaviours ................................................. 127
Table 24: Increase in specific energy consumption between full and half load operations114
........................................................................................................................ 130
Table 25: Different definitions of lifetime ............................................................... 141
Table 26: The reason for purchasing a new tumble drier .......................................... 142
Table 27: Maintenance practice for different tumble driers ....................................... 145
Table 28: Real life maintenance practice................................................................ 146
Table 29: Impact of different measures to increase the reparability .......................... 148
Table 30: Impact of different measures to increase the reparability – availability of spare
parts ................................................................................................................. 149
Table 31: Critical components and assessment of the ease of replacement ................ 150
Table 32: Frequency and price range of replaced parts ............................................ 151
Table 33: Calculated collection rate of large household equipment in Europe, 2014 .... 153
Table 34: Top spots of the global Energy Architecture Performance Index report ........ 156
Table 35: Monthly electricity consumption ............................................................. 157
Table 36: Verification tolerances set out in the Regulations ...................................... 160
Table 37: List of components for the average tumble drier. HP-C = Condensing heat pump
drier, HE-C = Condensing heating element drier, HE-V = air-vented heating element drier,
GA-V = air-vented gas fired drier. ........................................................................ 162
Table 38: List of components for the BAT-tumble drier. HP-C = Condensing heat pump
drier, HE-C = Condensing heating element drier, HE-V = air-vented heating element drier,
GA-V = air-vented gas fired drier. ........................................................................ 168
Table 39: Assumed average material composition of tumble driers in the preparatory study
........................................................................................................................ 170
Table 40: End of life rates to different reuse, recycling, recovery and disposal routes from
EcoReport Tool adopted in the current study .......................................................... 173
Table 41: List of critical raw materials ................................................................... 176
Table 42: Alignment with proposals from other Regulations ..................................... 178
Table 43: Key performance parameters for the four selected base cases (2018 values)
........................................................................................................................ 181
13
Table 44: Standard and real key user behaviour parameters for the four base cases (2018
values) .............................................................................................................. 182
Table 45: Material composition of base cases ......................................................... 184
Table 46: Electric consumption and hours in different operation modes based on “real
values” from the APPLiA consumer study. Source: GfK, APPLiA, Viegand Maagøe. ...... 191
Table 47: EU 28 annual sales and estimated stock of tumble driers .......................... 193
Table 48: Input economic data for EcoReport tool (2016) ........................................ 194
Table 49: Life cycle cost (LCC) of the four base cases ............................................. 199
Table 50: The combined impact and value of gold and copper in all tumble driers (stock -
2017) ............................................................................................................... 201
Table 51: Energy consumption used by drum/fan motor. Based on cycle time data from
GfK (2013-2016). ............................................................................................... 204
Table 52: List of design options with descriptions and input parameters. Descriptions on
specific calculation methods are found in subsequent sections 6.1.1 - 6.1.11. ............ 205
Table 53: Potential environmental improvements and life cycle costs at product level for
the different design options - Relevant for base case 1 (BC1) – Condenser heating element
driers ................................................................................................................ 215
Table 54: Potential environmental improvements and life cycle costs at product level for
the different design options - Relevant for base case 2 (BC2) – Condenser heat pump driers
........................................................................................................................ 216
Table 55: Potential environmental improvements and life cycle costs at product level for
the different design options - Relevant for base case 3 (BC3) – Heating element air-vented
driers ................................................................................................................ 217
Table 56: Potential environmental improvements and life cycle costs at product level for
the different design options - Relevant for base case 4 (BC4) – Gas-fired air-vented driers.
........................................................................................................................ 218
Table 57: Applicability of clustered design options to base cases .............................. 220
Table 58: Unit retail prices in EUR for household tumble driers. Source: Data from GfK
........................................................................................................................ 230
Table 59: Weighted energy consumption per cycle (Etc) per rated capacity and type and
the estimated sales distribution in 2018. Gas driers omitted due to lack of data. HP-C and
HE-C at 6kg based on linear extrapolation due to insufficient data points. Sources. APPLiA,
GfK HP-C = Condensing heat pump drier, HE-C = Condensing heating element drier, HE-
V = air-vented heating element drier. ................................................................... 253
Table 60: Overview of Policy Options for energy and resource efficiency .................... 259
Table 61: The new proposed energy label classes ................................................... 268
Table 62: Current and proposed classes, and the current new distributions of the classes
........................................................................................................................ 269
14
Table 63: Current and proposed energy label intervals (based on proposed EEI calculation
method), and the conversion between classes ........................................................ 269
Table 64: New proposed condensation efficiency class intervals................................ 270
Table 65: New and old distribution of condensation label intervals ............................ 270
Table 66: Total energy consumption and cumulative savings from using the tumble driers
........................................................................................................................ 277
Table 67: Change of energy consumption during use by tumble type. ....................... 278
Table 68: Embedded energy consumption from materials ........................................ 279
Table 69: Savings of embedded energy by tumble drier type ................................... 279
Table 70: Greenhouse gas emissions and cumulative savings for all policy options ..... 280
Table 71: Savings of GHG emissions by tumble drier type ....................................... 281
Table 72: Material consumption, and cumulative savings, for all policy options. .......... 282
Table 73: Savings of total materials consumption by tumble drier type ..................... 282
Table 74: Total user expenditures and cumulative savings for all policy options .......... 284
Table 75: Savings of total user expenditure by tumble drier type ............................. 284
Table 76: Total retail turnover, and cumulative savings, for all policy options ............. 285
Table 77: Total manufacturers turnover, and cumulative savings, for all policy options.
........................................................................................................................ 286
Table 78: Total employment for all policy options ................................................... 286
Table 79: The effect on relevant indicators by the BAU/PO1b market distribution of A+++
heat pump driers in 2030 .................................................................................... 288
Table 80: The effect on relevant indicators by the PO1a/PO2 market distribution of A heat
pump driers in 2030 ........................................................................................... 288
Table 81: The effect on total user expenditure by the escalation rate in 2030 ............ 289
Table 82: The effect on relevant indicators by the penetration rate in 2030 ............... 289
Table 83: The effect on the total user expenditure by the added repair and maintenance
cost of PO4 in 2030 ............................................................................................ 289
Table 84: The effect on total user expenditure and total energy consumption during use by
the change in energy consumption due to using programmes other than the standard
cotton cycle in 2030 ............................................................................................ 290
Table 85: Differences of policy options compared to BAU values in 2030 (a negative number
means a reduction of the parameter compared to BAU) ........................................... 293
Table 86: Differences of policy options compared to BAU values in 2040 (a negative number
means a reduction of the parameter compared to BAU) ........................................... 294
Table 87: Recycling compatibility of different types of plastic. 1= Compatible, 2 =
Compatible with limitations, 3 = Compatible only in small amounts, 4 = Not compatible
........................................................................................................................ 303
Table 88: Calculated leakage of refrigerants per year .............................................. 304
15
Table 89: All impact categories for BC 1- Condensing drier with heating element. The life
cycle phase with the highest impact for each of the categories is highlighted with red text
........................................................................................................................ 305
Table 90: All impact categories for BC 2- Condenser drier with heat pump. The life cycle
phase with the highest impact for each of the categories is highlighted with red text .. 305
Table 91: All impact categories for BC 3 Air-vented with heating element. The life cycle
phase with the highest impact for each of the categories is highlighted with red text .. 306
Table 92: All impact categories for BC 4 Air-vented gas fired. The life cycle phase with the
highest impact for each of the categories is highlighted with red text ........................ 306
Table 93: Environmental impacts during the entire lifetime of tumble driers sold in 2017
........................................................................................................................ 308
Table 94: Environmental impacts of tumble driers (EU-28 stock - 2016) .................... 308
Table 95: Environmental impact share of EU total impacts (EU-27 stock) .................. 309
16
IV. List of figures
Figure 1: Energy class distribution and development for heat pump tumble driers ........27
Figure 2: Energy class distribution and development for heating element condenser tumble
driers ..................................................................................................................27
Figure 3: Energy class distribution and development for heat element air-vented tumble
driers ..................................................................................................................28
Figure 4: Sales-averaged rated capacity for all non-gas drier types (values in the red box
are linearly projected). ..........................................................................................28
Figure 5: Specific energy consumption of three types of driers, at full and half (partial)
load: Condensing with heating element (HE-C), Air-vented with heating element (HE-V)
and condensing with heat pump (HP-C) ...................................................................30
Figure 6: Aggregated potential environmental benefits and life cycle costs of design options
for BC1 (negative numbers are net savings compared to baseline) - TE=Total Energy,
GWP=Global Warming Potential ..............................................................................41
Figure 7: Aggregated potential environmental benefits and life cycle costs of design options
for BC2 (negative numbers are net savings) - TE=Total Energy, GWP=Global Warming
Potential ..............................................................................................................41
Figure 8: Aggregated potential environmental benefits and life cycle costs of design options
for BC3 (negative numbers are net savings) - TE=Total Energy, GWP=Global Warming
Potential ..............................................................................................................42
Figure 9: Aggregated potential environmental benefits and life cycle costs of design options
for BC4 (negative numbers are net savings) - TE=Total Energy, GWP=Global Warming
Potential ..............................................................................................................42
Figure 10: Energy consumption during use from 2020 to 2040 ...................................46
Figure 11: Air-vented tumble drier. Source: Adapted by PWC (2009) from (Essaoui, 2001)
..........................................................................................................................55
Figure 12: Condenser tumble drier. Adapted by PWC (2009) from (Essaoui, 2001) .......56
Figure 13: Example of a plate heating element .........................................................56
Figure 14: Heat pump drier. Source: ResearchGate (2012) ........................................57
Figure 15: Overview of tumble driers classification ...................................................58
Figure 16: From left to right: the design of the energy labels for air-vented, condenser and
gas-fired tumble driers as specified in Commission delegated Regulation (EU) No 392/2012
..........................................................................................................................66
Figure 17: Annual sales and stock of tumble driers (total of all types) .........................97
Figure 18: Energy class distribution and development for all tumble driers, 2013-2016 .98
Figure 19: Energy class distribution and development for heat pump tumble driers, 2013-
2016 ...................................................................................................................98
17
Figure 20: Energy class distribution and development for heating element condenser
tumble driers, 2013-2016 ......................................................................................99
Figure 21: Energy class distribution and development for heating element air-vented
tumble driers, 2013-2016 .................................................................................... 100
Figure 22: Distribution of annual energy consumption for the heat pump tumble driers from
2013 to 2016 ..................................................................................................... 101
Figure 23: Distribution of annual energy consumption for heat element condenser tumble
driers from 2013 to 2016 .................................................................................... 102
Figure 24: Distribution of annual energy consumption for heat element air-vented tumble
driers from 2013 to 2016 .................................................................................... 102
Figure 25: Condensing efficiency label class distribution for heat pump tumble driers, 2013-
2016 ................................................................................................................. 104
Figure 26: Condensing efficiency label class distribution for heat element condenser tumble
driers, 2013-2016 .............................................................................................. 104
Figure 27: Power consumption in off-mode and left-mode ....................................... 105
Figure 28: Left-on mode duration82 ....................................................................... 106
Figure 29: Market distribution of rated capacity for heat pump condenser tumble driers,
2013-2016 ........................................................................................................ 106
Figure 30: Market distribution of rated capacity for condenser tumble driers, 2013-2016
........................................................................................................................ 108
Figure 31: Market distribution of rated capacity for air-vented tumble driers, 2013-2016
........................................................................................................................ 109
Figure 32: Market distribution of rated capacity for gas tumble driers, 2013-2016 ...... 109
Figure 33: Sales-averaged rated capacity for all non-gas tumble driers (values in the red
box are linearly projected) ................................................................................... 110
Figure 34: Cycle times in minutes of heat pump driers, 2013-2016 ........................... 110
Figure 35: Cycle times of air-vented driers, 2013-2016 ........................................... 111
Figure 36: Cycle times of heat element condenser driers, 2013-2016 ........................ 111
Figure 37: Cycle times of gas driers, 2013-2016..................................................... 112
Figure 38: Heat pump driers noise distribution, 2013-2016 ...................................... 113
Figure 39: Air-vented driers noise distribution, 2013-2016 ...................................... 113
Figure 40: Condenser heating element driers noise distribution, 2013-2016 ............... 113
Figure 41: Gas driers noise distribution, 2013-2016 ................................................ 114
Figure 42: Effects on total energy consumption of air-vented driers, with a 10% reduction
of new units sold after 2020. All baseline AEc assumed constant at 460 kWh/year. ..... 115
Figure 43: Hourly labour cost in EUR, 2016 for European countries................. 120
18
Figure 44: Specific energy consumption of three types of driers, at full and half (partial)
load: Condensing with heating element (HE-C), Air-vented with heating element (HE-V)
and condensing with heat pump (HP-C) ................................................................. 129
Figure 45: Cleaning behaviour of lint filter, condenser units, and “other filters” .......... 132
Figure 46: Nominal washing machine rated capacity compared to real use. Loading factor
defined as Real amount of laundry pr. cycleRecommend maximum load 𝐱 𝟏𝟎𝟎%. Data source: P&G
........................................................................................................................ 134
Figure 47: Secondary system impact for air-vented tumble driers............................. 136
Figure 48: Additional energy consumption for air-vented driers ................................ 137
Figure 49: Increase in energy consumption compared to air-vented tumble drier with an
electric load of 3.4 kWh/cycle .............................................................................. 138
Figure 50: Secondary system impact for condensing driers ...................................... 139
Figure 51: Secondary system impact for driers with heat pump technology ............... 140
Figure 52: Age of tumble drier ............................................................................. 143
Figure 53: Survey results from the preparatory study on the consumers’ willingness to
repair their tumble drier. ..................................................................................... 144
Figure 54: Experienced technical issues ................................................................. 145
Figure 55: Impact of all options towards increased reparability ................................ 150
Figure 56: Net electricity generation, EU-28, 2015 (% of total, based on GWh) .......... 155
Figure 57: Hourly load values a random day in March ............................................. 158
Figure 58: Rough drawing of the transport of gas in Europe ..................................... 159
Figure 59: The waste process flow for commercial refrigerants appliances ................. 172
Figure 60: Residual moisture content as a function of the spin speed in the washing
machine for cotton and synthetics. The black dotted lines visualise the change in average
spin speeds. Source: Desktop study 2019 .............................................................. 188
Figure 61: Frequency of use per drying programme. Source: APPLiA ......................... 190
Figure 62: Change in energy consumption per programme. Positive values indicate an
increase in energy consumption, negative values indicate a reduction. Source: Desktop
study, APPLiA ..................................................................................................... 190
Figure 63: Total energy consumption BC 1 Heating element condenser ..................... 195
Figure 64: Global warming potential BC 1 Heating element condenser....................... 196
Figure 65: Total energy consumption – BC 2 Heat pump condenser .......................... 196
Figure 66: Global warming potential – BC 2 Heat pump condenser ........................... 196
Figure 67: Total energy consumption – BC 3 Heating element Air-vented .................. 197
Figure 68: Global warming potential – BC 3 Heating element air vented .................... 197
Figure 69: Total energy consumption – BC 4 Gas fired air-vented ............................. 197
Figure 70: Global warming potential – BC 4 Gas fired air vented .............................. 197
19
Figure 71: Aggregated potential environmental benefits and life cycle costs of design
options for BC1 (negative numbers are net savings compared to baseline) - TE=Total
Energy, GWP=Global Warming Potential ................................................................ 221
Figure 72: Aggregated potential environmental benefits and life cycle costs of design
options for BC2 (negative numbers are net savings) - TE=Total Energy, GWP=Global
Warming Potential .............................................................................................. 222
Figure 73: Aggregated potential environmental benefits and life cycle costs of design
options for BC3 (negative numbers are net savings) - TE=Total Energy, GWP=Global
Warming Potential .............................................................................................. 222
Figure 74: Aggregated potential environmental benefits and life cycle costs of design
options for BC4 (negative numbers are net savings) - TE=Total Energy, GWP=Global
Warming Potential .............................................................................................. 223
Figure 75: Comparison of size of stock used in the 2012 Impact Assessment and stock
calculated based on new data from this study ........................................................ 228
Figure 76: Development in market share of heat pump driers .................................. 230
Figure 77: Energy savings by 2016. Comparison of total energy consumption in BAU0 and
BAU scenarios .................................................................................................... 232
Figure 78: Energy savings by 2030. Comparison of total energy consumption in BAU0 and
BAU scenario ..................................................................................................... 232
Figure 79: Development in specific energy consumption .......................................... 233
Figure 80: Development in average rated capacity for tumble driers since 2013 (GfK market
data from this study) .......................................................................................... 234
Figure 81: Share of consumers who find information on the energy label unclear. The
percentage relates to consumers that did not understand all information on the label . 237
Figure 82: Estimated energy consumption in the 2012 Impact Assessment compared to
new estimates based on updated market data ........................................................ 238
Figure 83: Total cost of ownership (only purchase and use) for heat pump driers per unit,
based on 160 cycles/year and the loading as the defined in the current regulation. .... 239
Figure 84: Development in total user expenditure from 2010 to 2030. ...................... 240
Figure 85: Development in turnover for retailers based on sale prices from GfK ......... 240
Figure 86: Development in turnover for manufacturers based on sale prices from GfK 241
Figure 87: Share of consumers that see the energy label as a consideration, when they
purchase their next tumble driers ......................................................................... 245
Figure 88: Weighted energy consumption per cycle vs. rated capacity. Source: APPLiA
Model Database .................................................................................................. 252
Figure 89: The available data points for the weighted energy consumption per cycle for
each drier type, including the new Standard Energy consumption per cycle indicated by the
turquoise line. .................................................................................................... 253
20
Figure 90: Annual energy consumption vs unit prices. HE-C = Heating element condenser
(BC1), HP-C = Heat pump condenser (BC2), HE-V = Heating element air vented (BC3),
GAS = Gas-fired air-vented driers (BC4). Source: GfK, APPLiA model database 2017 .. 264
Figure 91: EEI for available models on the market using the EEI calculation method from
the current regulation, and the current energy class intervals. HP-C = Heat pump
condenser, HE-C = Heating element condenser, HE-V = Heating element air vented, GAS
= Gas-fired air-vented. Source: APPLiA 2017 model database .................................. 266
Figure 92: EEI for available models on the market, with the proposed EEI calculation
method and the current (recalculated) energy class intervals. HP-C = Heat pump
condenser, HE-C = Heating element condenser, HE-V = Heating element air vented, GAS
= Gas-fired air-vented driers. Source: APPLiA 2017 model database ......................... 267
Figure 93: EEI for available models on the market, with the current EEI calculation method
and the proposed energy class intervals. HP-C = Heat pump condenser, HE-C = Heating
element condenser, HE-V = Heating element air vented. Source: APPLiA 2017 model
database ........................................................................................................... 268
Figure 94: Sales of tumble driers for BAU and PO2. Note that the PO1a sales is equal to
BAU, and the PO1b sales is equal to PO2. HP-C = Heat pump condenser, HE-C = Heating
element condenser, HE-V = Heating element air vented. ......................................... 275
Figure 95: Sales of tumble driers for BAU and PO4. HP-C = Heat pump condenser, HE-C
= Heating element condenser, HE-V = Heating element air vented. .......................... 275
Figure 96: Stock of tumble driers for BAU and PO2. Note that the PO1a stock is equal to
BAU, and the PO1b stock is equal to PO2. HP-C = Heat pump condenser, HE-C = Heating
element condenser, HE-V = Heating element air vented. ......................................... 276
Figure 97: Total energy consumption per year in EU 28 from using the tumble driers for all
scenarios from 2020 to 2040 ............................................................................... 277
Figure 98: Embedded energy consumption from materials ....................................... 278
Figure 99: Greenhouse gas emissions for all policy options from 2020 to 2040 in EU28
........................................................................................................................ 280
Figure 100: Material consumption for all policy options from 2020 to 2040. ............... 281
Figure 101: Total user expenditures in EU28 for all policy options from 2020 to 2040 . 283
Figure 102: Total retail turnover for all policy options from 2020 to 2040. ................. 285
Figure 103: Total manufacturers turnover for all policy options from 2020 to 2040. .... 285
Figure 104: Employment for all policy options from 2020 to 2040. ............................ 286
Figure 105: Metal wheel. The metal wheel shows which resources can be recovered by the
different types of smelters. .................................................................................. 302
Figure 106: Sensitivity of the six parameters evaluated by the change in total user
expenditure in 2030 ............................................................................................ 346
21
Figure 107: Sensitivity of four parameters evaluated by the change in energy consumption
during use in 2030.............................................................................................. 347
Figure 108: Total user expenditure in 2030 as a function of the A+++ heat pump market
share in the BAU scenario .................................................................................... 347
Figure 109: Energy consumption during use in 2030 as a function of the A+++ heat pump
market share in the BAU scenario ......................................................................... 348
Figure 110: GHG emissions in 2030 as a function of the A+++ heat pump market share in
the BAU scenario ................................................................................................ 348
Figure 111: Total user expenditure in 2030 as a function of the A-label drier market share
in PO1/PO2 ........................................................................................................ 349
Figure 112: Energy consumption during use in 2030 as a function of the A-label drier
market share in PO1/PO2 .................................................................................... 349
Figure 113: Total GHG emissions in 2030 as a function of the A-label drier market share in
PO1/PO2 ........................................................................................................... 350
Figure 114: Total user expenditures in 2030 as a function of the tumble drier penetration
rate .................................................................................................................. 350
Figure 115: Energy consumption during use in 2030 as a function of the tumble drier
penetration rate ................................................................................................. 351
Figure 116: Total GHG emissions in 2030 as a function of the tumble drier penetration rate
........................................................................................................................ 351
Figure 117: Total material consumption in 2030 as a function of the tumble drier
penetration rate ................................................................................................. 352
Figure 118: Total user expenditures in 2030 as a function of the escalation rate of electricity
........................................................................................................................ 352
Figure 119: Total user expenditures in 2030 as a function of added repair and maintenance
cost for PO4 ....................................................................................................... 353
Figure 120: Total user expenditures in 2040 as a function of added repair and maintenance
cost for PO4 ....................................................................................................... 353
Figure 121: Total user expenditures in 2030 as a function of change in energy consumption
due to using different programmes than the standard cotton cycle. .......................... 354
Figure 122: Energy consumption during use in 2030 as a function of change in energy
consumption due to using different programmes than the standard cotton cycle. ........ 354
Figure 123: GHG emissions in 2030 as a function of change in energy consumption due to
using different programmes than the standard cotton cycle. .................................... 355
22
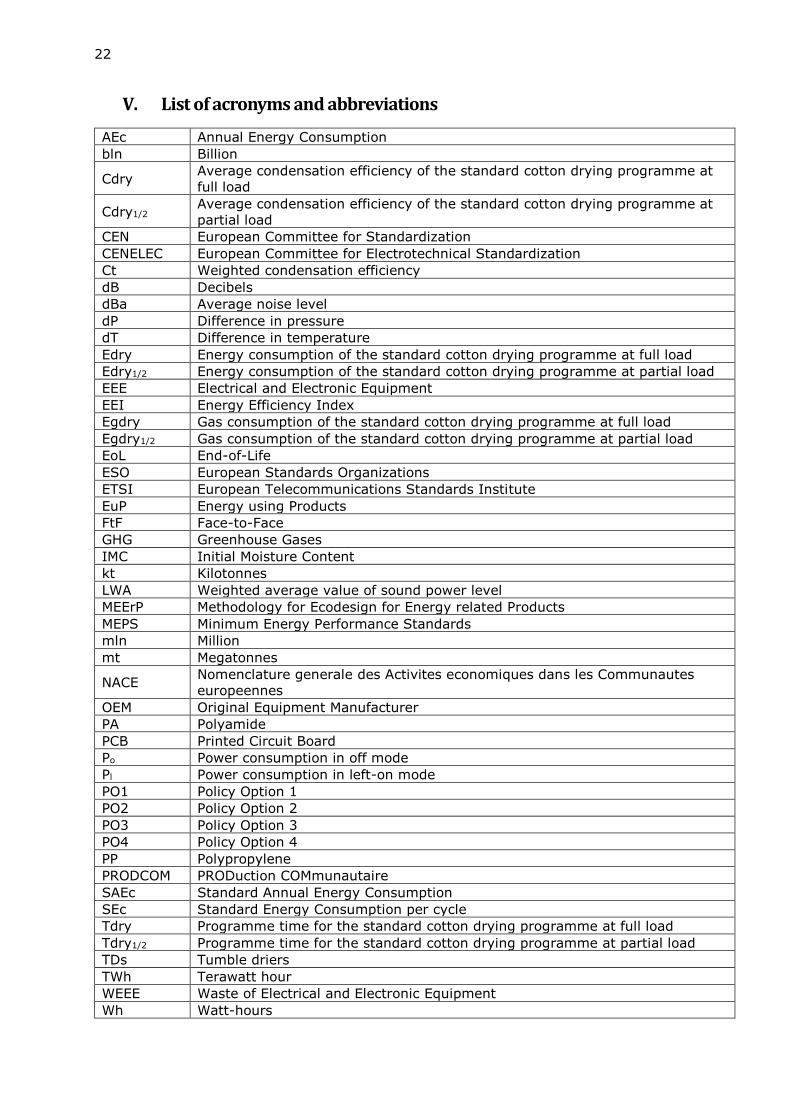
V. List of acronyms and abbreviations
AEc Annual Energy Consumption
bln Billion
Cdry Average condensation efficiency of the standard cotton drying programme at
full load
Cdry1/2 Average condensation efficiency of the standard cotton drying programme at
partial load
CEN European Committee for Standardization
CENELEC European Committee for Electrotechnical Standardization
Ct Weighted condensation efficiency
dB Decibels
dBa Average noise level
dP Difference in pressure
dT Difference in temperature
Edry Energy consumption of the standard cotton drying programme at full load
Edry1/2 Energy consumption of the standard cotton drying programme at partial load
EEE Electrical and Electronic Equipment
EEI Energy Efficiency Index
Egdry Gas consumption of the standard cotton drying programme at full load
Egdry1/2 Gas consumption of the standard cotton drying programme at partial load
EoL End-of-Life
ESO European Standards Organizations
ETSI European Telecommunications Standards Institute
EuP Energy using Products
FtF Face-to-Face
GHG Greenhouse Gases
IMC Initial Moisture Content
kt Kilotonnes
LWA Weighted average value of sound power level
MEErP Methodology for Ecodesign for Energy related Products
MEPS Minimum Energy Performance Standards
mln Million
mt Megatonnes
NACE Nomenclature generale des Activites economiques dans les Communautes
europeennes
OEM Original Equipment Manufacturer
PA Polyamide
PCB Printed Circuit Board
Po Power consumption in off mode
Pl Power consumption in left-on mode
PO1 Policy Option 1
PO2 Policy Option 2
PO3 Policy Option 3
PO4 Policy Option 4
PP Polypropylene
PRODCOM PRODuction COMmunautaire
SAEc Standard Annual Energy Consumption
SEc Standard Energy Consumption per cycle
Tdry Programme time for the standard cotton drying programme at full load
Tdry1/2 Programme time for the standard cotton drying programme at partial load
TDs Tumble driers
TWh Terawatt hour
WEEE Waste of Electrical and Electronic Equipment
Wh Watt-hours
VI. General background
The Commission Regulation (EU) No 932/2012 with regard to ecodesign requirements for
household tumble driers entered into force in November 2012 (with requirements
applicable from November 2013) with the following timeline:
• From November 2013, specific ecodesign requirements on the Energy Efficiency
Index (EEI) for all household tumble driers and on the condensation efficiency for
condenser household tumble driers applied.
• From November 2014, generic ecodesign requirements on calculation of energy
consumption and information provided in booklet applied for all household tumble
driers.
• From November 2015, more stringent EEI and condensation efficiency requirements
applied.
The Commission’s Regulation No 392/2012 with regard to Energy Labelling of household
tumble driers entered into force in May 2012 and applied from May 2013.
The objective of the Regulations is to ensure the placing on the market of technologies that
reduce the life-cycle environmental impact of tumble driers, leading to estimated electricity
savings of up to 9.5 TWh per year in 2030, corresponding to 4.2 Mt CO2-eq per year,
according to the Commission Staff Working Document derived from the Impact Assessment
(2012)3.
The Regulations cover electric mains-operated and gas-fired household tumble driers and
built-in household tumble driers, including those sold for non-household use. Household
combined washer-driers and household spin-extractors are exempted.
The Ecodesign Regulation was amended by the horizontal Regulation (EU) 2016/2282 with
regard to the use of tolerances in verification procedures, while the energy labelling
Regulation was amended by two horizontal Regulations: Regulation (EU) 518/2014
regarding labelling of energy-related products on the internet and Regulation (EU)
2017/254 with regard to the use of tolerances in verification procedures.
Both the ecodesign and the energy labelling Regulations are scheduled for review, and this
review study therefore aims to do so by updating the existing preparatory study on
3 https://ec.europa.eu/energy/sites/ener/files/documents/td_impact_assessment.pdf
24
household tumble driers published in March 20094. This is done following the principles of
the MEErP method. Additionally, this study should:
• Assess the verification tolerances set out in the Regulations
• Assess the efficiency of air-vented appliances
• Assess resource efficiency aspects (most likely disassembly, recyclability,
reparability and durability) following the adoption of the Circular Economy Package
in December 20155 and the last Ecodesign Working Plan 2016-20196
• Evaluate the impact of the existing Regulations, including an analysis of the relevant
questions, answers, evidences based related to the basic criteria (efficiency,
effectiveness and relevancy) which are specific to evaluations in the context of the
‘Better Regulation’ framework.
4 https://www.eceee.org/static/media/uploads/site-2/ecodesign/products/laundry-driers/finalreport-lot16-laundry-driers.pdf 5 https://ec.europa.eu/commission/publications/european-commission-proposals-circular-economy_en 6 https://ec.europa.eu/energy/sites/ener/files/documents/com_2016_773.en_.pdf
25
VII. Executive summary
Scope and review of relevant legislation and standards
The overall scope of this review study is proposed to remain the same as the scope of the
ecodesign and energy labelling Regulations7 for household tumble driers.
Gas-fired technologies represent a niche part of the market. There is no indication this will
change in the future, according to the limited input from stakeholders on this drier type.
Excluding gas-fired technologies from the scope would prevent them from being regulated
which may affect negatively their energy efficiency and the way they are perceived by
consumers.
The review of relevant legislation provided insight of all the links between different product
legislations and of relevant standards for measuring energy and resource efficiency of these
type of appliances. This review showed that there continues to be legal basis for reviewing
the current regulations and identified synergies with other product measures.
Market analysis
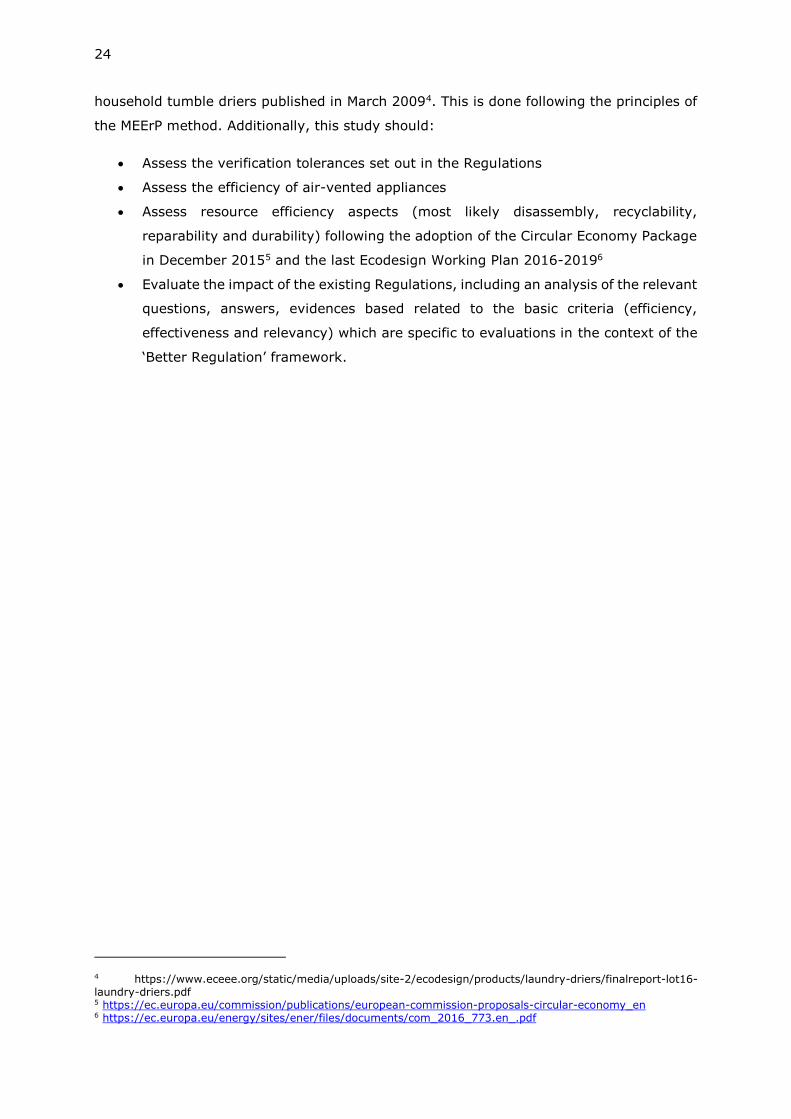
Sales and stock analyses show an overall increase in sales after 2010 (see Table i), which
has been dominated by heat pump tumble driers, while the other technologies have
decreased in sales numbers. The total sales increased on average 1.6% per year from
2007 to 2016 according to purchased data8, but it is predicted that the market will stabilise
with a slower decrease towards 0% per year in 20309.
Table i: Derived tumble drier sales from 1990 to 2030
Sales, million units 1990 1995 2000 2005 2010 2015 2020 2025 2030
Condenser Heat pump - - - - 0.34 2.22 3.05 3.60 4.46
Heat element 3.55 3.55 3.44 2.38 2.54 1.78 1.68 1.55 1.11
Air
-
vent
ed Heat element 0.14 0.14 1.06 1.66 1.11 0.75 0.59 0.39 -
7 Commission Regulation (EU) No 932/2012, available at: http://eur-lex.europa.eu/legal-content/EN/TXT/PDF/?uri=CELEX:32012R0932&from=EN and Commission Delegated Regulation (EU) No 392/2012, available at: http://eur-lex.europa.eu/legal-content/EN/TXT/PDF/?uri=CELEX:32012R0392&from=EN 8 Provided by GfK in 2018 9 Assumption presented to APPLiA in Brussels, 21st of December 2017. No comments were provided to this assumption.
26
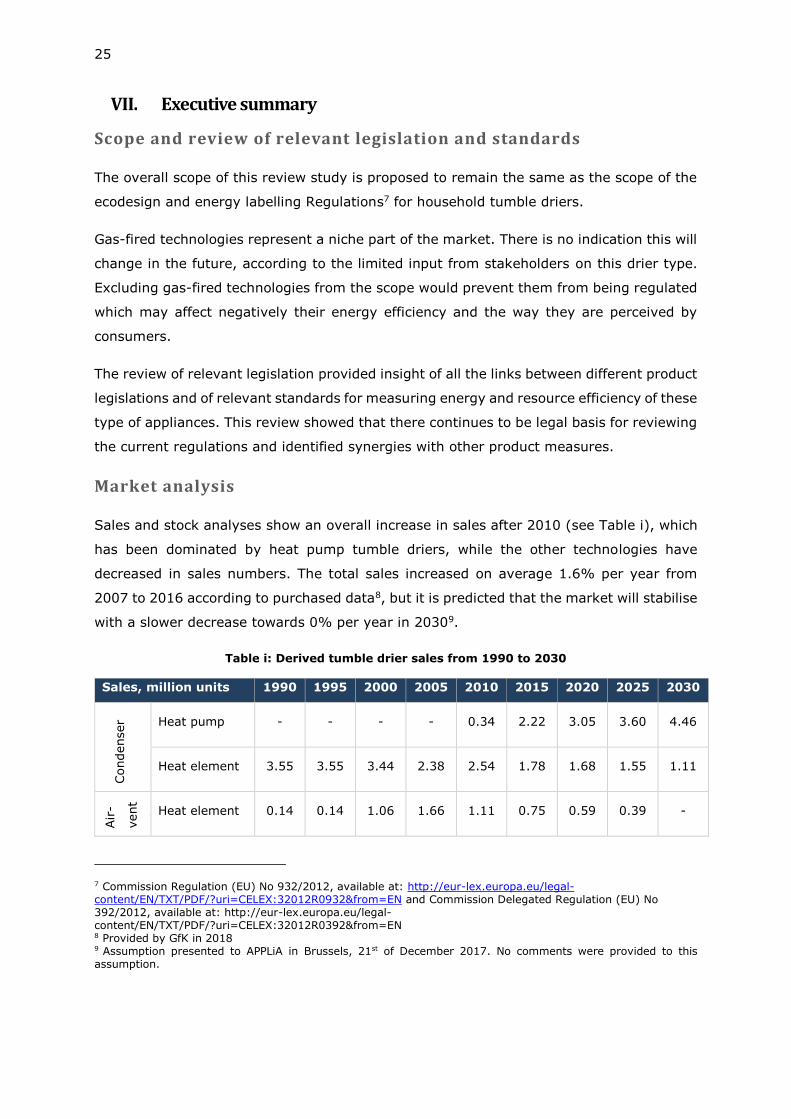
Sales, million units 1990 1995 2000 2005 2010 2015 2020 2025 2030
Gas-fired 0.001 0.001 0.001 0.001 0.001 0.000 0.001 - -
Total 3.70 3.70 4.50 4.04 3.99 4.74 5.32 5.53 5.57
The assessment has shown that there is no difference in lifetime between the different
drier types, which has been slightly adjusted to 12 years (from 13 years in the preparatory
study), according to more recent sources10. Considering sales trends and lifetime, the stock
of tumble driers from 2000 to 2030 is shown in Table ii. This shows that the condenser
driers will remain dominant in the market, and that heat pump driers will nearly triple the
heating element driers by 2030 concerning condenser driers.
Table ii: Stock of tumble driers from 2000 to 2030
Stock, million units 2000 2005 2010 2015 2020 2025 2030
Condenser
Heat pump 0.00 0.00 0.44 7.27 21.18 34.89 44.61
Heat element 24.82 29.38 31.26 29.09 25.17 21.45 18.73
Air-vented
Heat element 17.31 20.71 19.61 15.16 10.67 7.63 4.70
Gas-fired 0.01 0.01 0.01 0.01 0.01 0.01 0.00
Total 42.15 50.10 51.32 51.53 57.03 63.98 68.18
Penetration rate NA NA 25.0% 24.2% 25.8% 27.7% 28.3%
The 2018 penetration rate of household tumble driers in the EU is 24.7%, counting on a
total number of households in the EU of about 217 million. Considering market trends and
expected number of households in the EU, the expected penetration rate in 2030 is
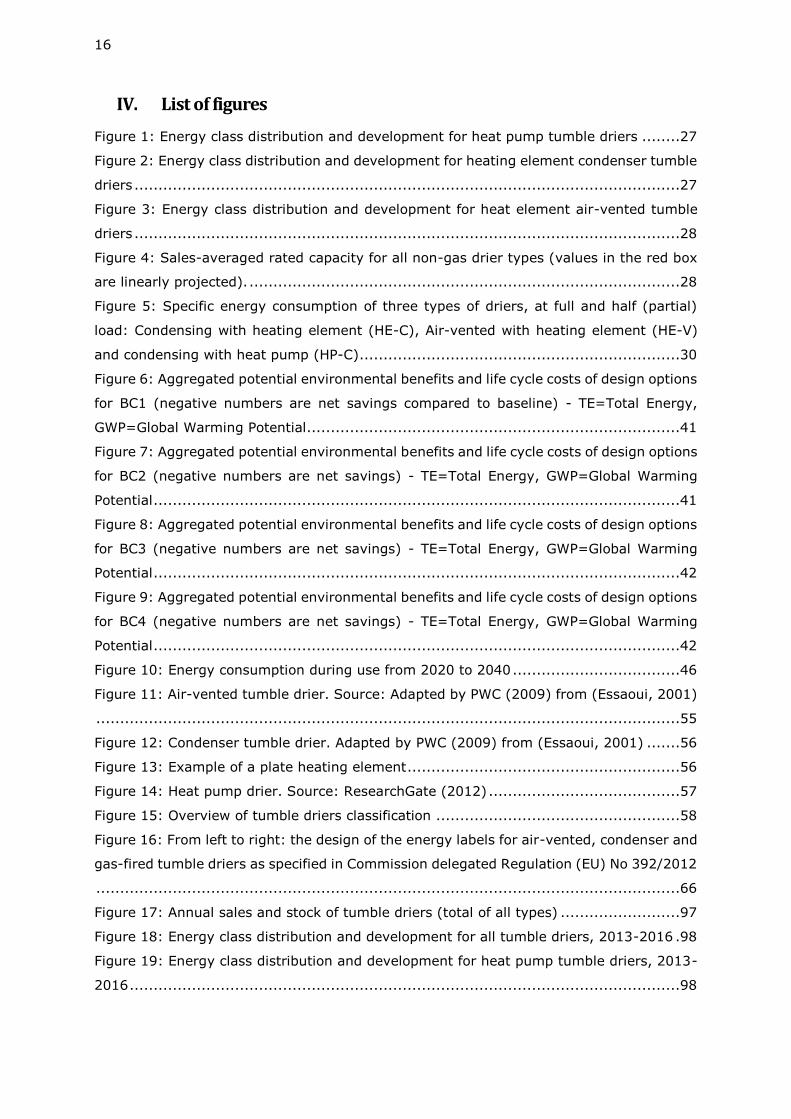
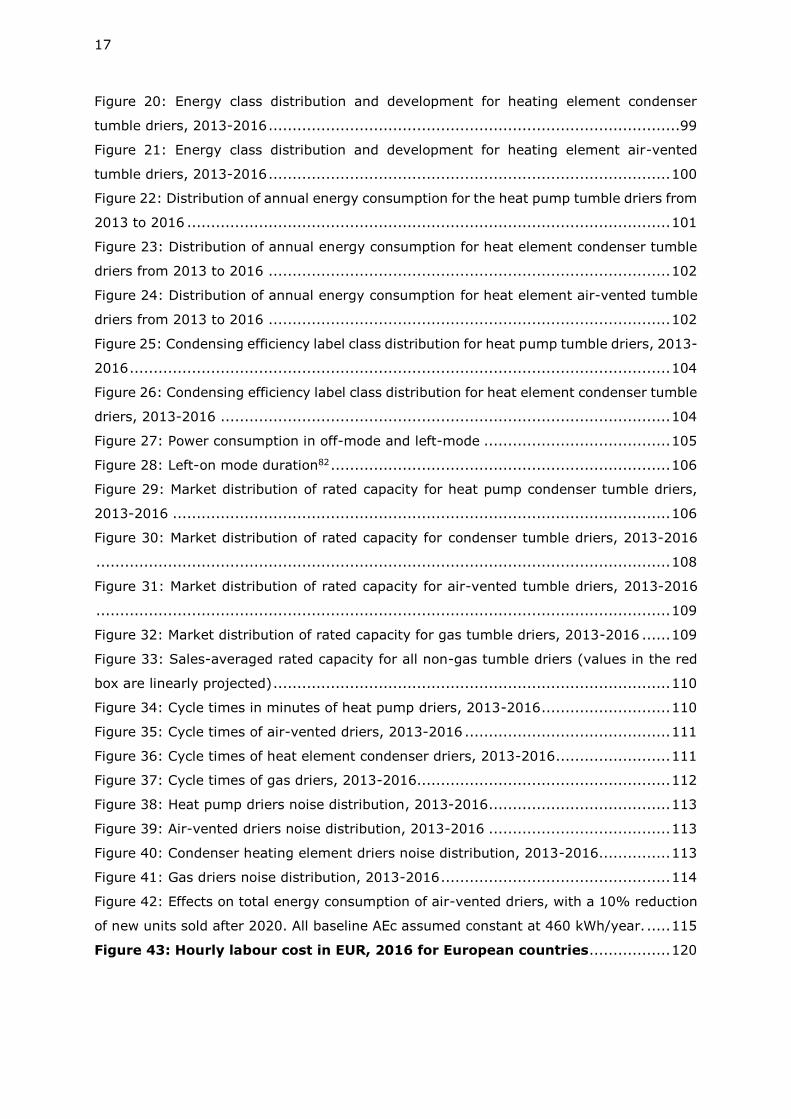
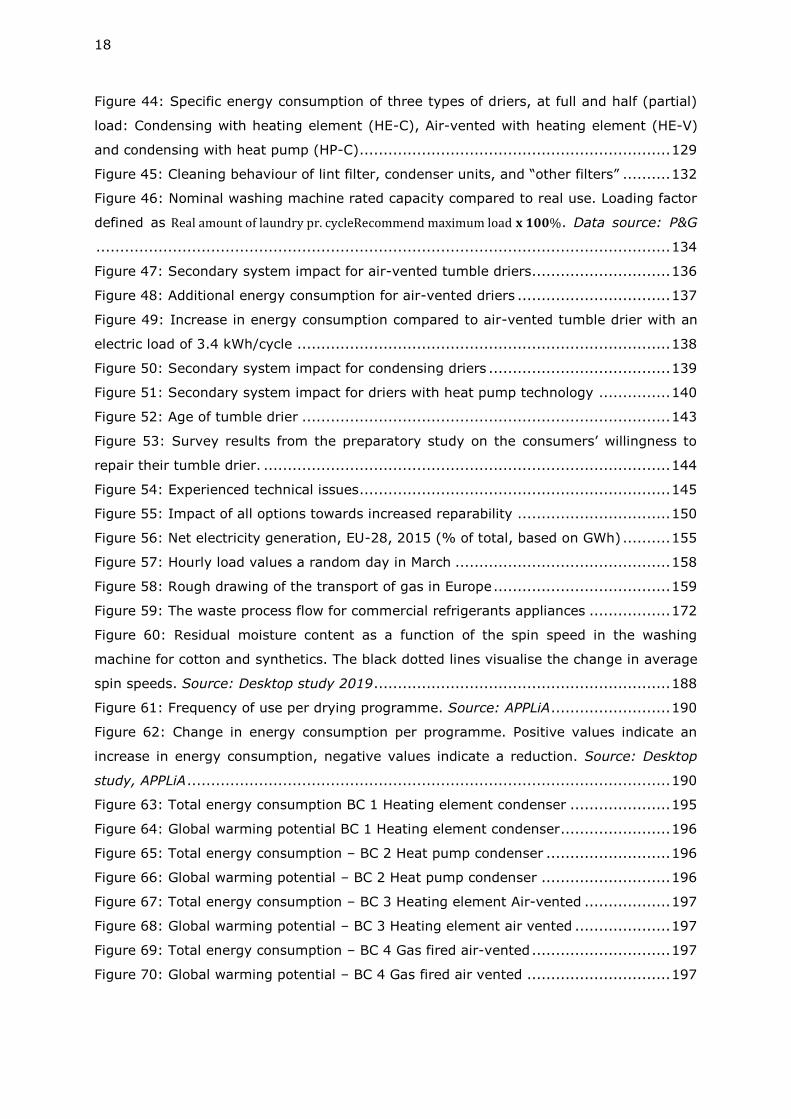
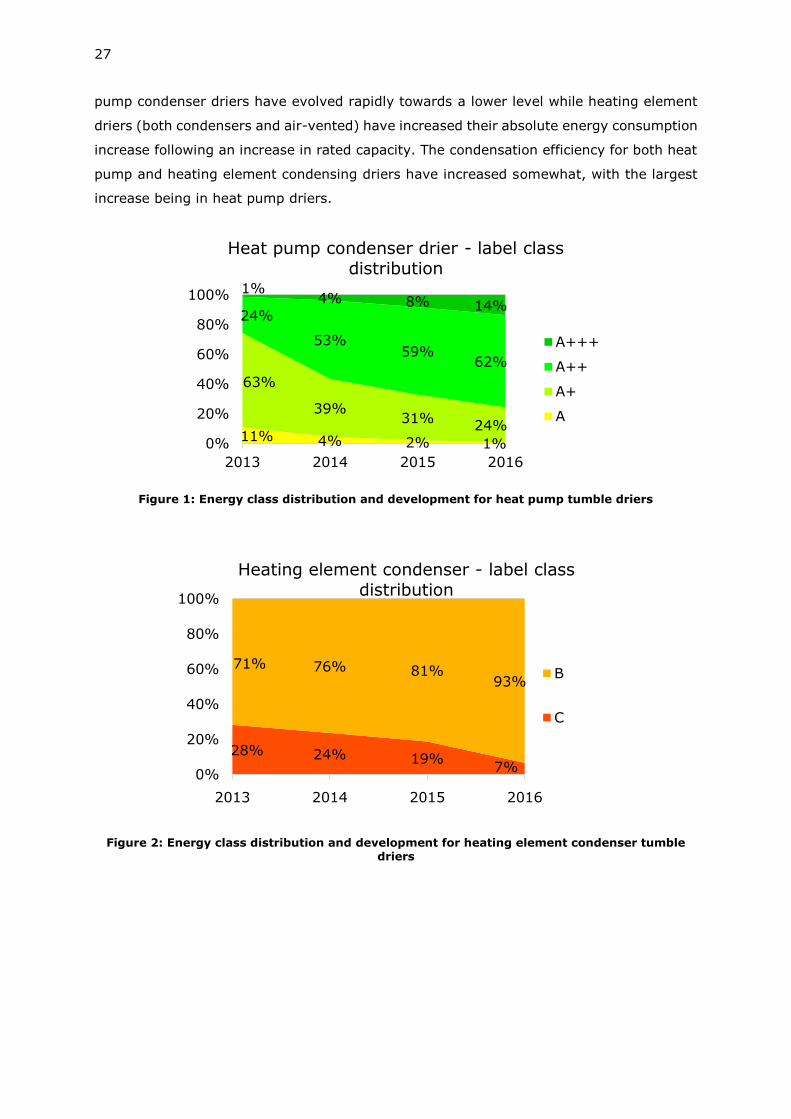
28.3%.EThe energy class distribution of tumble driers on the market has evolved since
2013 (see Figure 1, Figure 2, Figure 3), where the Energy Labelling Regulation was
applicable. Heat pump condenser driers present the largest shift and the most efficient
driers. The energy class distribution for has remained more constant, although air-vented
are more stagnant than condenser driers.
Data were not available for gas-fired tumble driers, but based on information from GfK, it
was possible to track from a desktop research three of the models on the EU market which
have a market share of 63%. Two of these three models (covering 61% of the market)
feature an A+ energy class and the other features a C energy class. Gas-fired air-vented
driers on the market are thus able to reach a higher energy class than the heating element
air-vented drier. Similar trends are observed with annual energy consumption where heat
10 CECED and Umwelt Bundesamt
27
pump condenser driers have evolved rapidly towards a lower level while heating element
driers (both condensers and air-vented) have increased their absolute energy consumption
increase following an increase in rated capacity. The condensation efficiency for both heat
pump and heating element condensing driers have increased somewhat, with the largest
increase being in heat pump driers.
Figure 1: Energy class distribution and development for heat pump tumble driers
Figure 2: Energy class distribution and development for heating element condenser tumble driers
11% 4% 2% 1%
63%
39%31%
24%
24%
53%59%
62%
1%4% 8% 14%
0%
20%
40%
60%
80%
100%
2013 2014 2015 2016
Heat pump condenser drier - label class distribution
A+++
A++
A+
A
28% 24% 19%7%
71% 76% 81%93%
0%
20%
40%
60%
80%
100%
2013 2014 2015 2016
Heating element condenser - label class distribution
B
C
28
Figure 3: Energy class distribution and development for heat element air-vented tumble driers
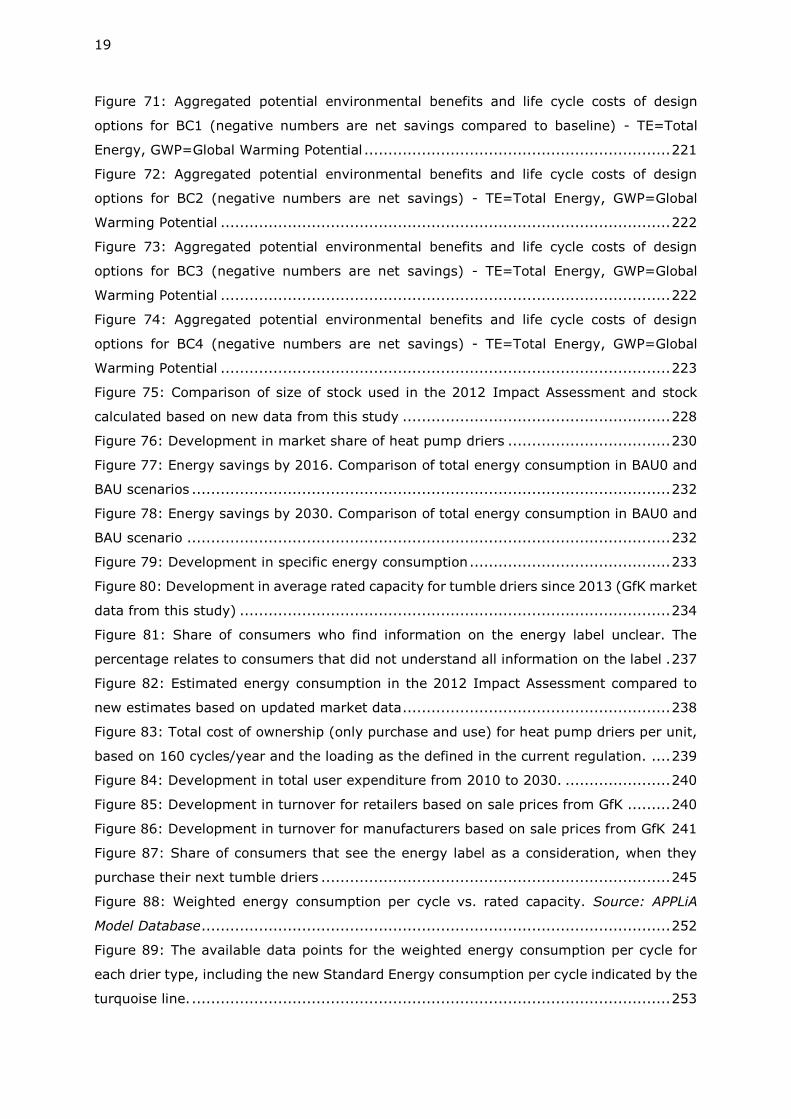
The current and projected sales-weighted average rated capacity is increasing as it can be
seen in Figure 4. Gas-fired air-vented driers average rated capacity remains largely the
same thus it is not shown in the figure. The rest are steadily increasing.
Figure 4: Sales-averaged rated capacity for all non-gas drier types (values in the red box are linearly projected).
The consumer price including VAT was calculated from the data on unit sales and total
market value collected by GfK, and it is observed that heat pump condenser driers have
become slightly cheaper while the price of heating element condenser driers have gone in
the opposite direction (see Table iii). Heat pump driers’ price has decreased despite the
increase of driers in energy classes A++ and A+++ (24% and 1% in 2013 compared to
62% and 14% in 2016).
1% 2% 2% 2%11% 8% 5% 7%
77% 77% 78% 75%
11% 13% 15% 16%
0%
20%
40%
60%
80%
100%
2013 2014 2015 2016
Heating element air-vented - Label distribution
B
C
D
Undeclared
6.5
7.0
7.5
8.0
8.5
9.0
2013 2015 2017 2019 2021 2023 2025 2027 2029
Projected nominal capacities
Heat pump - condenser Heating element - condenser
Heating element - air vented Sales weighted average
Extrapolation
29
Table iii: Unit retail prices in EUR for household tumble driers
Unit prices, EUR 2013 2014 2015 2016
Condenser
Heat pump 734 681 648 615
Heating
element 234 232 357 340
Air-vented
Heating
element 225 310 244 228
Gas-fired 225 310 326 343
User behaviour
The two most important parameters affected by user behaviour that have an influence on
the energy and/or condensation efficiencies of a tumble drier are:
• The average number of drying cycles per week
• The loading of the drier per cycle, i.e. how much is the machine filled in average
with respect to its rated capacity
The number of cycles per week has decreased from the preparatory study (2008) to the
APPLiA survey (2018). This is consistent with the increase in rated capacity but might also
be due to the very different scopes of the surveys. An APPLiA survey is used as a reference
and concludes that each tumble drier is running an average 2.05 cycles/week equivalent
to 107 cycles per year. This indicates that the yearly cycles have decreased from 160 in
current Regulation, to 107, but differences were found between different studies indicating
a certain degree of uncertainty. However, generally the trend observed from newer
studies/surveys indicate a lower number of cycles.
The loading of the drier is important as it affects the specific energy consumption of the
drier in terms of the energy used per kg of dried laundry as well as the total assumed
energy consumption per year per drier. Comparing the average nominal (rated) capacity
and the average load, the real energy consumption is dependent on part load efficiencies
of the driers (see Figure 5). According to the test standard tumble driers are tested for
energy consumption at full and at half capacity which gives an average loading testing
factor of 71%11.
11 (3*1+4*0.5)/7*100%
30
Figure 5: Specific energy consumption of three types of driers, at full and half (partial) load: Condensing with heating element (HE-C), Air-vented with heating element (HE-V) and
condensing with heat pump (HP-C)12
Multiple studies have investigated average washing machine loads, but few new studies
are directly targeting drying behaviour. The newest study targeting drying behaviour is an
APPLiA consumer survey which concluded an average load of 4.4kg used as a reference
throughout this study.
Conclusions from the washing machine studies13 indicated that the loading of the washing
machine was independent of the rated capacity. This conclusion is assumed to be applicable
to tumble drying user behaviour as well meaning that the load per cycle is 4.4kg and
independent on the rated capacity of the machine.
If the average load of 4.4 kg of laundry is used, then driers with a capacity of 7kg or more
(which is >98% of all sold condensing driers and >70% of air-vented driers in 2016) is on
average running below even the average loading testing factor of 71%. The driers are
hence labelled at running conditions which they seldom, if ever, operate in.
The current testing procedures at full and half load conditions can hence be used as a
comparative tool between products but is unlikely to represent the real annual energy
consumption for the average user, and less so in the future with foreseen increasingly large
capacity driers on the market. Changing the calculation method in the regulations that
define the average loading to reflect the real use could potentially reverse the trend of
manufacturers producing unnecessary large units, and emphasize the importance of having
driers which can efficiently operate both while being fully loaded and being almost empty.
12 Source: APPLIA Model database 2016, n=177. 13 See section 3.1.2 for references
0.2
0.3
0.4
0.5
0.6
0.7
6 7 8 9 10
Sp
ecif
ic e
nerg
y
co
nsu
mp
tio
n [
kW
h/
kg
]
Rated capacity [kg]
Specific Energy Consumption
HE-C Full
HE-C Partial
HE-V Full
HE-V Partial
HP-C Full
HP-C Partial
31
Data in task 3 to 5 indicates that a tumble drier loaded at 50% of the rated capacity will
use more energy per kg of laundry than the same drier loaded at 100%. This is to some
extend due to the loss associated with heating up the tumble drier itself which does not
depend on the amount of laundry loaded in the machine. This loss is directly dependent on
the thermal capacity of the drier, which (according to stakeholders) does not vary much
between the same type of drier (e.g. heat pump condenser) at different rated capacities.
This means that two machines at e.g. 7kg and 9kg can behave almost identical at 4.4kg
of load as they have very small physical differences. The energy consumption per cycle is
hence dependable on the load (in kg) but not so much on the rated capacity. As the load
is assumed fixed, the rated capacity has little significance when assessing the total yearly
energy consumption of the drier.
Concerning resource efficiency and product durability, the average lifetime of
household tumble driers is falling. Overall the lifetime for large household appliances
has declined from 14.1 years to 13.0 years between 2004 and 2012.. This highest reduction
in lifetime was observed for freezers and tumble driers where the lifetime decreased from
18.2 to 15.5 years and 13.6 to 11.9 years, respectively. So, the average lifetime of tumble
driers is in the current study reduced to 12 years from 13 years used in the preparatory
study. Regarding heat pump condenser driers, the lifetime seemed to have been reduced
for the first models available on the market but today the manufacturers have no indication
to suggest the that heat pump condenser driers should have a shorter lifetime than other
types of tumble driers. Based on a consumer study performed by APPLiA the durability of
heat pump condenser driers is not expected to present particular issues and the consumers
rarely experience any technical failures.
A way to improve the lifetime of household appliances is to design products that are easier
and less costly to repair so it is more affordable for the consumers to repair than replace
appliances. Currently repair and maintenance are expected to be done by professionals
and in some cases by the end-user. Whether measures that can facilitate repair have a
positive effect on the environment can be difficult to quantify, but based on a Deloitte14
study it seems like the following options have a positive effect:
• Measures to ensure provision of information to consumers on possibilities to repair
the product
• Measures to ensure provision of technical information to facilitate repair to
professionals
• Measures to enable an easier dismantling of products
14 Deloitte (2016) Study on Socioeconomic impacts of increased reparability – Final Report. Prepared for the
European Commission, DG ENV.
32
• Measures to ensure availability of spare parts for at least a certain amount of years
from the time that production ceases of the specific models
• Different combination of the above-mentioned options
Critical spare parts are the parts that are important for the function of the tumble driers
and that are more subject to failure within the lifetime of a product. Based on a survey and
inputs from manufacturers15, the critical spare parts have been identified based on:
• Their functional importance for the functioning of the drier
• Their ease of replacement and any potential improvement in this regard
• Their frequency of replacement within the lifetime of the drier
From this assessment, it was concluded that critical spare parts to be considered for further
reparability and durability requirements are:
• Pumps
• Motors
• Fans
• Heating elements
Technology overview
No major technical improvements at product level have emerged on the market for tumble
driers since the preparatory study. The four main types of tumble driers still exist.
However, very few models of gas-fired tumble driers have been available for sale on the
EU market without any major technological developments in the past 10 years16. The focus
in this task was thus to look at any technological developments at component level.
The tumble drier unit consists of multiple components which can be of different types and
qualities. Some are found in all tumble driers types and from these, the following
components and their configurations have a major influence on the energy consumption:
o The motor type and setup
o The presence of variable speed drives for fans and drum motors
o The controller, including humidity sensor components
o The drum design and sealing method
o The cleaning of lint filters and heat exchangers
Additionally, for condensing driers:
15 Stakeholder consultation 16 According to input from industry
33
o Air to air heat exchanger type, material, and size
And furthermore, for heat pump condensing driers
o Compressor size, type and motor
Based on input from industry17, Table iv shows a list of the major components and
technologies having an impact on the energy efficiency of the drier. Each
component/technology and relevant improvement options are described in more details in
section 4.1.
17 Questionnaire sent to APPLiA members on technologies during months February-March 2018
34
Table iv: List of components for the average tumble drier. HP-C = Condensing heat pump drier, HE-C = Condensing heating element drier, HE-V = air-vented
heating element drier, GA-V = air-vented gas fired drier.
Tumble drier technology/Component
Average drier on the market
Relevant for
HP-C HE-C HE-V GA-V
MOTORs
Motor type setup (one or multiple) One x x x x
Motor type (drum) AC-Induction x x x x
Motor type (compressor) AC-Induction x
⤷ If permanent magnet, has REM No x x x x
VSD on motor drum drive No x x x x
VSD on motor fans No x x x x
VSD on compressor motor No x
CONTROLLER
Type of automatic controller
Automatic moisture sensor controller (direct
way)
x x x x
HEAT EXCHANGER (Air to air)
Heat exchanger material Aluminium x
Heat exchanger type Plate-fin x
Self-cleaning heat exchangers No x
HEAT EXCHANGER (Refrigerant - air)
Heat exchanger material Aluminium fins +
copper tubes x
Heat exchanger type Fin-and-tube x
Self-cleaning heat exchangers No x
COMPRESSOR
Compressor size 400-600 W x
DRUM
Drum material Steel x x x x
Direct Drive No x x x x
Drum leakage High/Medium x x
FILTERS18
Anti-clogging design No x x x x
Table v shows the BAT for each component. Note that heat pump driers always outperform
the other types and should hence still be classified as the BAT tumble drier.
18 Both the primary lint filter, and for the condenser lint filter for HP-C driers without self-cleaning heat exchangers.
35
Table v: List of components for the BAT-tumble drier. HP-C = Condensing heat pump drier, HE-C = Condensing heating element drier, HE-V = air-vented
heating element drier, GA-V = air-vented gas fired drier.
Tumble drier
technology/Component
BAT-Tumble
drier
Relevant for
HP-C HE-C HE-V GA-V
MOTOR
Motor type setup (One or multiple) One / Multiple x x x x
Motor type (Drum) BLDC19 x x x x
Motor type (Compressor) BLDC179 x
⤷ If permanent magnet, has REM No x x x x
VSD on motor drum drive Yes x x x x
VSD on compressor motor Yes x
CONTROLLER
Type of automatic controller
Automatic moisture sensor controller (direct
way)
x x x x
HEAT EXCHANGER (Air to air)
Heat exchanger material Aluminium x
Heat exchanger type Plate-fin x
Self-cleaning heat exchangers No x
HEAT EXCHANGER (Refrigerant - air)
Heat exchanger material Aluminium fins +
cobber tubes x
Heat exchanger type Fin-and-tube x
Self-cleaning heat exchangers No / Yes x
COMPRESSOR
Compressor size 400-600 W x
DRUM
Drum material Stainless Steel x x x x
Direct Drive No x x x x
Drum leakage Low (<10%) x x
FILTERS169
Anti-clogging design Yes x x x x
Regarding improved resource efficiency at End-of-Life different options are available for
design improvements and covers both more holistic guidelines and product specific
suggestion.
Regarding critical raw materials, household tumble driers may contain several categorised
as critical. Raw materials like vanadium and phosphorous are designations of steel used as
alloying elements. These alloying elements are not included in this assessment as they are
19 A synchronous permanent magnet motor, i.e. brushless permanent magnet motor (BLDC). Can also be referred to as ECM/PMSM
36
very difficult to quantify, and more obvious choices (due to larger quantities) are present
such as:
• Printed circuit boards which may contain several critical materials such as gold,
silver, palladium, antimony, bismuth, tantalum etc 20 . For tumble driers, it is
assumed they are low grade, but higher grades could be available in the future due
to the implementation of more functions (network functions).
• Compressor and heat exchangers which may contain copper (but according to
manufacturers it is possible also to produce heat exchangers with aluminium fins
and tubes)
• Wires which may contain copper
• Motors which may contain copper and rare earth elements (magnets)
Material efficiency requirements can be very difficult to model, as the material efficiency is
dependent on the waste handling system which again are dependent on the commodity
prices. The current preferred waste processing is shredding but within the next 20 years it
may change significantly, and it is therefore difficult in later tasks to quantify any measure
towards improved material efficiency. Also, when products are shredded with other types
of products the impact of any requirements toward a specific product may be reduced.
Material requirements may therefore have greater effect if they are aligned across all
product groups.
Dishwashers and washing machines may in the future have the most ambitious
requirements regarding resource efficiency21 according to proposed amendments to the
current Ecodesign Regulations for these products22. Previously there have been different
requirements regarding information relevant for the disassembly but one of the greatest
barriers towards increased repair and refurbishment is the lack of available spare parts23.
The low collection rate of tumble driers24 can challenge the improvement potential of any
suggestions regarding resource efficiency since many products do not reach the desired
recycling facility. The collection rate is expected to increase and reach the targets set out
20 http://www.wrap.org.uk/sites/files/wrap/Techniques%20for%20recovering%20printed%20circuit%20boards%2C%20final.pdf 21 Note that vacuum cleaners also have ambitious requirements with regard to durability and lifetime. 22 Proposals have been voted positively and will be publicly available later this year (2019) 23 Deloitte (2016) Study on Socioeconomic impacts of increased reparability – Final Report. Prepared for the European Commission, DG ENV. 24 http://appsso.eurostat.ec.europa.eu/nui/show.do?dataset=env_waselee&lang=en
37
in the WEEE Directive 25 in 2019. The current low collection rates cannot be directly
addressed in the Ecodesign Regulation since this is not related to the design of the product.
Based on the list of critical raw materials and the WEEE Directive the following components
and materials are of special interest:
• Printed circuit boards which may contain several critical materials such as gold,
silver, palladium, antimony, bismuth, tantalum etc.26
• Compressor and heat exchangers which may contain copper (but according to
manufacturers it is possible also to produce heat exchangers with aluminium fins
and tubes)
• Wires which may contain copper
• Motors which may contain copper and rare earth elements (magnets)
Definition of base cases, Environment and Economics
Even though heat pump driers account for almost half of the EU tumble drier market,
heating element driers still persist and may continue to be sold. Sales figures however
indicate a steady reduction of heating element air-vented sales, and these types are
assumed to be discontinued around 2029. This is not the case for gas-fired air-vented
driers, as they continue to be sold and the current available data does not present evidence
for a discontinuance of these models before 203027.
Considering this, the base cases have been split into the four main tumble driers heat
source technologies in the market, in order to differentiate life cycle costs and
environmental impacts and investigate improved design options at this segregated level:
1. Base case 1: Condenser tumble driers (heating element)
2. Base case 2: Condenser tumble driers (heat pump)
3. Base case 3: Heating element air-vented
4. Base case 4: Gas-fired air-vented
Table vi shows the key performance parameters concerning use of the four selected base
cases, which have been averaged according to sales based on available data from previous
tasks.
Table vi: Key performance parameters for the four selected base cases
25 http://ec.europa.eu/environment/waste/weee/index_en.htm 26 http://www.wrap.org.uk/sites/files/wrap/Techniques%20for%20recovering%20printed%20circuit%20boards%2C%20final.pdf 27 Gas-fired manufacturers did not provide input on the future sales trends of this product type
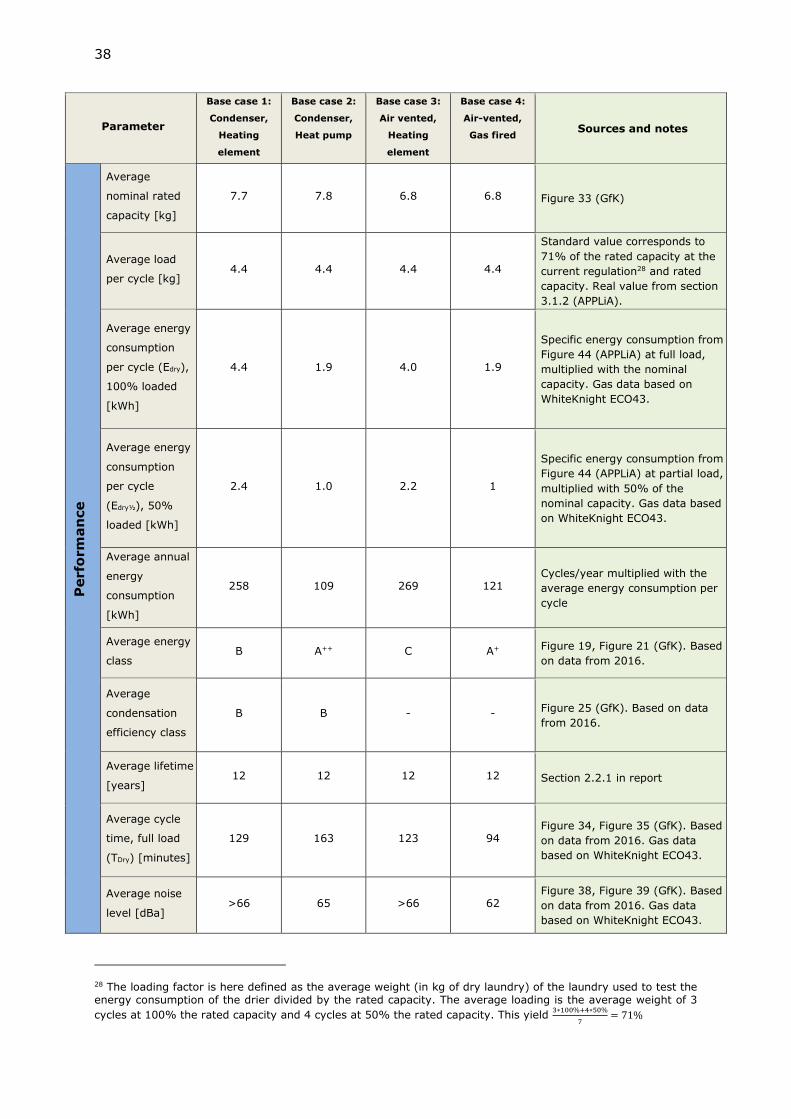
38
Parameter
Base case 1:
Condenser,
Heating
element
Base case 2:
Condenser,
Heat pump
Base case 3:
Air vented,
Heating
element
Base case 4:
Air-vented,
Gas fired Sources and notes
Perfo
rm
an
ce
Average
nominal rated
capacity [kg]
7.7 7.8 6.8 6.8 Figure 33 (GfK)
Average load
per cycle [kg] 4.4 4.4 4.4 4.4
Standard value corresponds to
71% of the rated capacity at the
current regulation28 and rated
capacity. Real value from section
3.1.2 (APPLiA).
Average energy
consumption
per cycle (Edry),
100% loaded
[kWh]
4.4 1.9 4.0 1.9
Specific energy consumption from
Figure 44 (APPLiA) at full load,
multiplied with the nominal
capacity. Gas data based on
WhiteKnight ECO43.
Average energy
consumption
per cycle
(Edry½), 50%
loaded [kWh]
2.4 1.0 2.2 1
Specific energy consumption from
Figure 44 (APPLiA) at partial load,
multiplied with 50% of the
nominal capacity. Gas data based
on WhiteKnight ECO43.
Average annual
energy
consumption
[kWh]
258 109 269 121 Cycles/year multiplied with the
average energy consumption per
cycle
Average energy
class B A++ C A+ Figure 19, Figure 21 (GfK). Based
on data from 2016.
Average
condensation
efficiency class
B B - - Figure 25 (GfK). Based on data
from 2016.
Average lifetime
[years] 12 12 12 12 Section 2.2.1 in report
Average cycle
time, full load
(TDry) [minutes]
129 163 123 94 Figure 34, Figure 35 (GfK). Based
on data from 2016. Gas data
based on WhiteKnight ECO43.
Average noise
level [dBa] >66 65 >66 62
Figure 38, Figure 39 (GfK). Based
on data from 2016. Gas data
based on WhiteKnight ECO43.
28 The loading factor is here defined as the average weight (in kg of dry laundry) of the laundry used to test the energy consumption of the drier divided by the rated capacity. The average loading is the average weight of 3
cycles at 100% the rated capacity and 4 cycles at 50% the rated capacity. This yield 3∗100%+4∗50%
7= 71%
39
For all types of driers, the rated capacity has increased from 5.4kg up to 7.8kg. The load
has increased as well, from 3.4kg to 4.4kg. Cycle time has increased for all drier types.
This can partly be explained by the increase in capacity, but also due to the fact that the
general drying temperature seems to be lower for heat pump driers, as the cycle time
has increased more (in percentages) than the rated capacity.
Concerning the environmental assessment, the use phase continues to have the highest
environmental impacts of household tumble driers, in particular regarding total energy and
global warming potential. The total energy and emission of greenhouse gases during the
life cycle for the different base cases (i.e. BC) are:
• BC 1: Total energy – 31,348 MJ, Global Warming Potential – 1,369 kg CO2-eq
• BC 2: Total energy – 16,230 MJ, Global Warming Potential – 781 kg CO2-eq
• BC 3: Total energy – 32,068 MJ, Global Warming Potential – 1,399 kg CO2-eq
• BC 4: Total energy – 10,108 MJ, Global Warming Potential - 532 kg CO2-eq
The lifecycle impacts of the base cases have served as reference values for the
improvement options and policy scenarios assessment in Tasks 6 and 7.
The consumption of materials of high importance has also been determined for the base
cases, in particular gold and copper, as it follows:
• BC 1: 0.121 grams of gold and 2170 grams of copper corresponding to a market
value of 4.2 EUR and 12.8 EUR respectively
• BC 2: 0.157 grams of gold and 5100 grams of copper corresponding to a market
value of 5.5 EUR and 30.1 EUR respectively
• BC 3: 0.12 grams of gold and 0.755 grams of copper corresponding to a market
value of 4.3 EUR and 4.5 EUR respectively
• BC 4: 0.12 grams of gold and 0.755 grams of copper corresponding to a market
value of 4.3 EUR and 4.5 EUR respectively
Both copper and gold have limited impacts compared with the impacts from energy
consumption in the use phase. Copper is responsible for less than 0.5 % of the emission
of CO2-eq over the lifetime and gold has an even lower impact.
The lifecycle costs of household tumble driers indicate that the highest consumer expenses
are different for the four base cases:
• BC 1: the highest cost is for the use of the drier (407 EUR) and the lowest is the
installation (25 EUR). The total LCC is 911 EUR.
• BC 2: the highest cost is for the purchase of the drier (615 EUR) and the lowest is
the installation (25 EUR). The total LCC is 900 EUR.
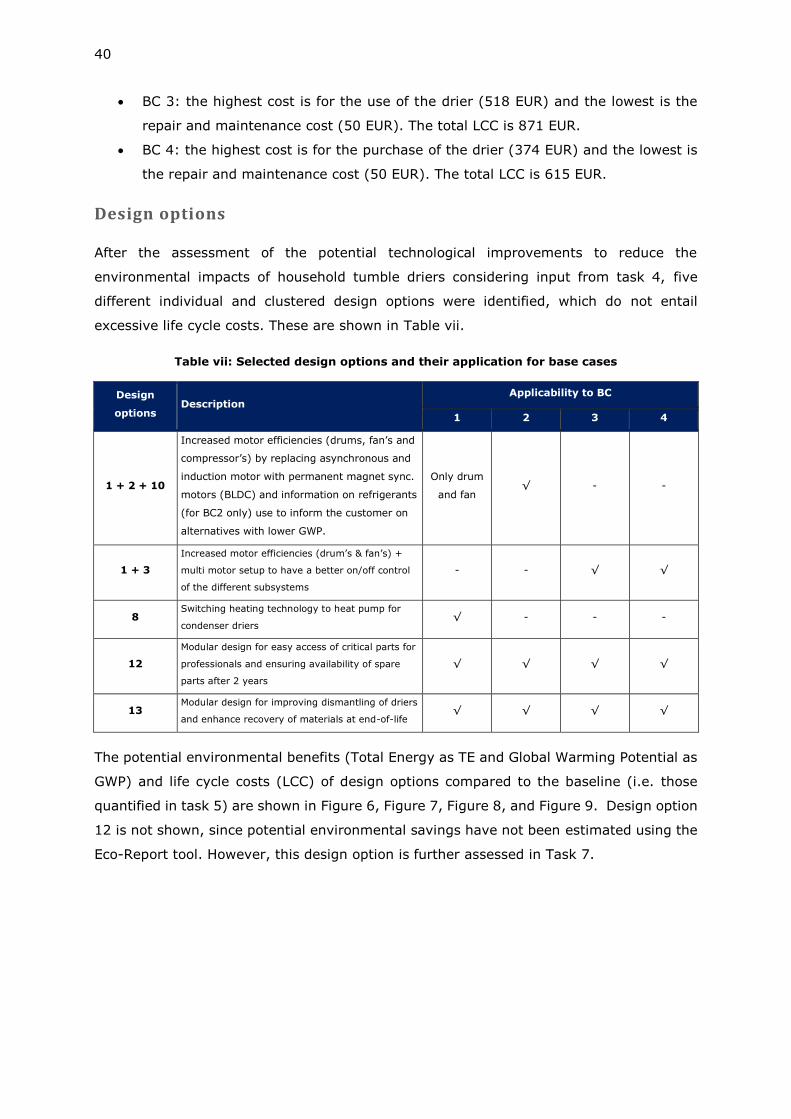
40
• BC 3: the highest cost is for the use of the drier (518 EUR) and the lowest is the
repair and maintenance cost (50 EUR). The total LCC is 871 EUR.
• BC 4: the highest cost is for the purchase of the drier (374 EUR) and the lowest is
the repair and maintenance cost (50 EUR). The total LCC is 615 EUR.
Design options
After the assessment of the potential technological improvements to reduce the
environmental impacts of household tumble driers considering input from task 4, five
different individual and clustered design options were identified, which do not entail
excessive life cycle costs. These are shown in Table vii.
Table vii: Selected design options and their application for base cases
Design
options Description
Applicability to BC
1 2 3 4
1 + 2 + 10
Increased motor efficiencies (drums, fan’s and
compressor’s) by replacing asynchronous and
induction motor with permanent magnet sync.
motors (BLDC) and information on refrigerants
(for BC2 only) use to inform the customer on
alternatives with lower GWP.
Only drum
and fan √ - -
1 + 3
Increased motor efficiencies (drum’s & fan’s) +
multi motor setup to have a better on/off control
of the different subsystems
- - √ √
8 Switching heating technology to heat pump for
condenser driers √ - - -
12
Modular design for easy access of critical parts for
professionals and ensuring availability of spare
parts after 2 years
√ √ √ √
13 Modular design for improving dismantling of driers
and enhance recovery of materials at end-of-life √ √ √ √
The potential environmental benefits (Total Energy as TE and Global Warming Potential as
GWP) and life cycle costs (LCC) of design options compared to the baseline (i.e. those
quantified in task 5) are shown in Figure 6, Figure 7, Figure 8, and Figure 9. Design option
12 is not shown, since potential environmental savings have not been estimated using the
Eco-Report tool. However, this design option is further assessed in Task 7.
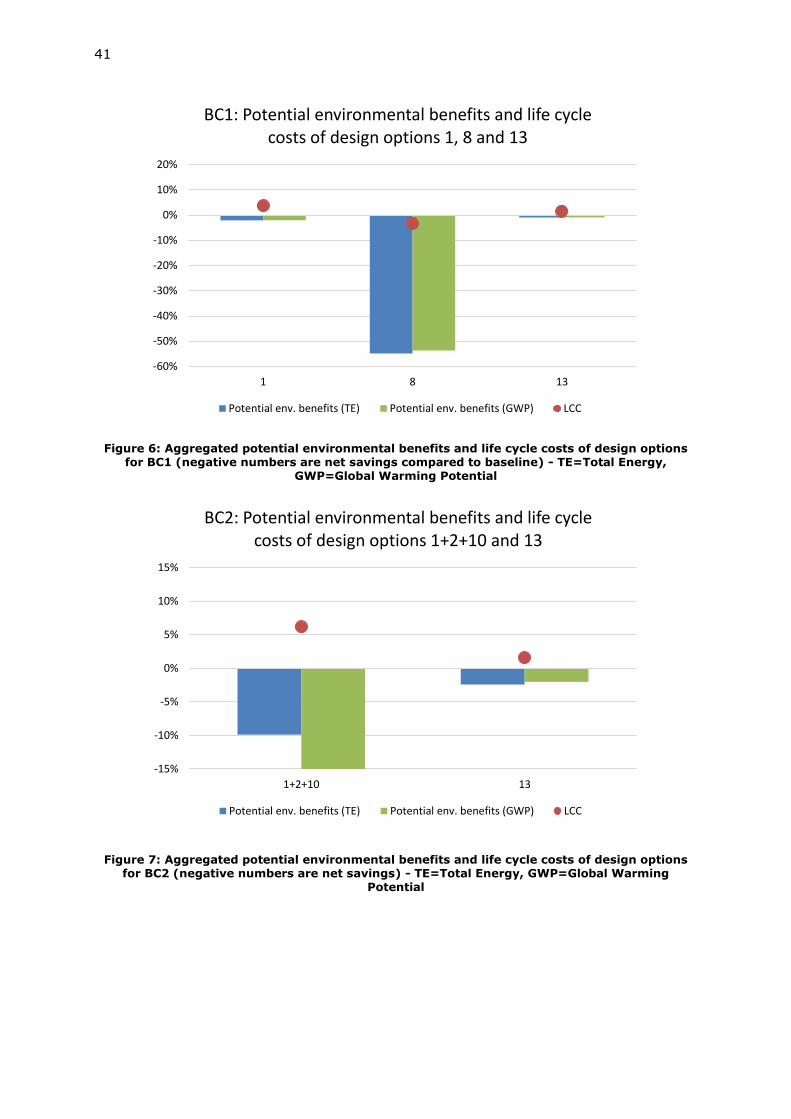
41
Figure 6: Aggregated potential environmental benefits and life cycle costs of design options for BC1 (negative numbers are net savings compared to baseline) - TE=Total Energy,
GWP=Global Warming Potential
Figure 7: Aggregated potential environmental benefits and life cycle costs of design options for BC2 (negative numbers are net savings) - TE=Total Energy, GWP=Global Warming
Potential
-60%
-50%
-40%
-30%
-20%
-10%
0%
10%
20%
1 8 13
BC1: Potential environmental benefits and life cycle costs of design options 1, 8 and 13
Potential env. benefits (TE) Potential env. benefits (GWP) LCC
-15%
-10%
-5%
0%
5%
10%
15%
1+2+10 13
BC2: Potential environmental benefits and life cycle costs of design options 1+2+10 and 13
Potential env. benefits (TE) Potential env. benefits (GWP) LCC
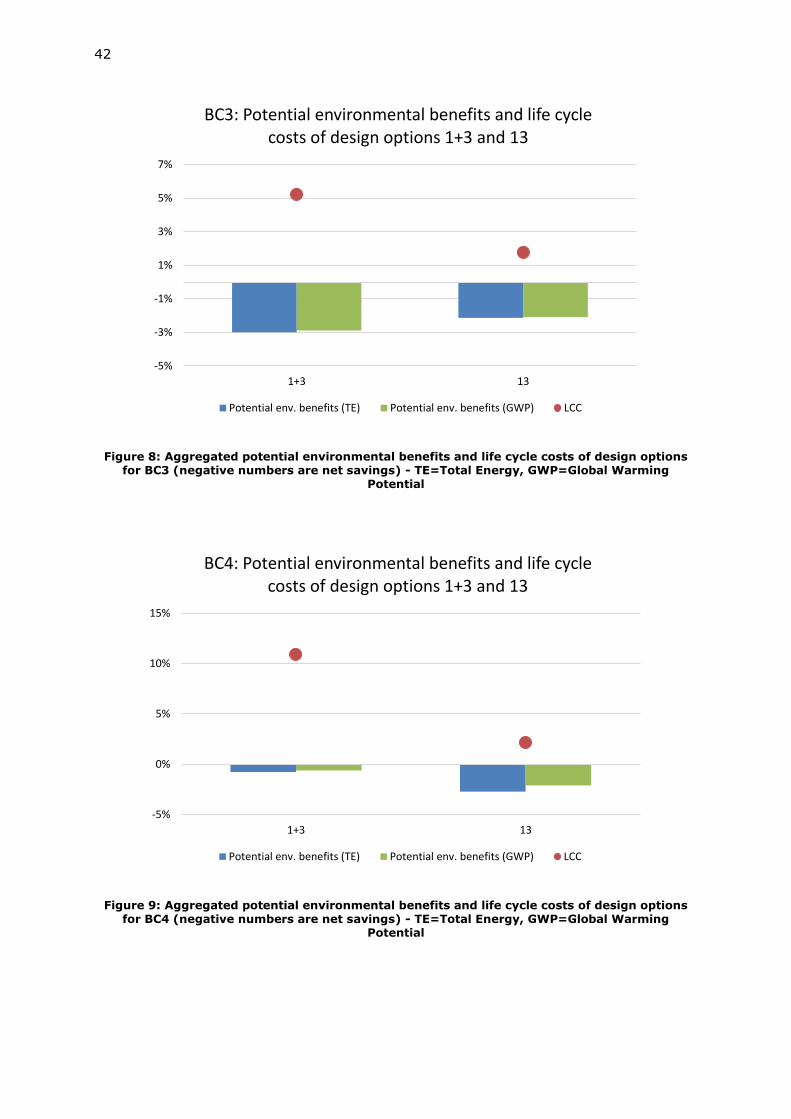
42
Figure 8: Aggregated potential environmental benefits and life cycle costs of design options for BC3 (negative numbers are net savings) - TE=Total Energy, GWP=Global Warming
Potential
Figure 9: Aggregated potential environmental benefits and life cycle costs of design options for BC4 (negative numbers are net savings) - TE=Total Energy, GWP=Global Warming
Potential
-5%
-3%
-1%
1%
3%
5%
7%
1+3 13
BC3: Potential environmental benefits and life cycle costs of design options 1+3 and 13
Potential env. benefits (TE) Potential env. benefits (GWP) LCC
-5%
0%
5%
10%
15%
1+3 13
BC4: Potential environmental benefits and life cycle costs of design options 1+3 and 13
Potential env. benefits (TE) Potential env. benefits (GWP) LCC
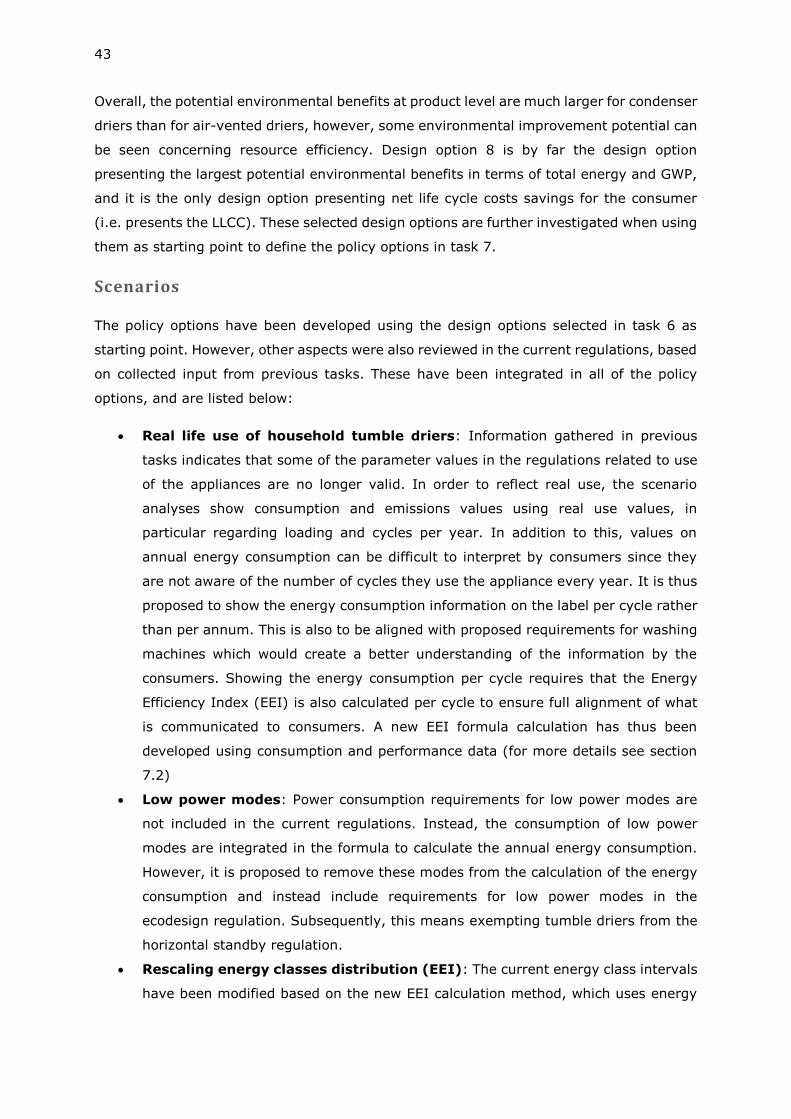
43
Overall, the potential environmental benefits at product level are much larger for condenser
driers than for air-vented driers, however, some environmental improvement potential can
be seen concerning resource efficiency. Design option 8 is by far the design option
presenting the largest potential environmental benefits in terms of total energy and GWP,
and it is the only design option presenting net life cycle costs savings for the consumer
(i.e. presents the LLCC). These selected design options are further investigated when using
them as starting point to define the policy options in task 7.
Scenarios
The policy options have been developed using the design options selected in task 6 as
starting point. However, other aspects were also reviewed in the current regulations, based
on collected input from previous tasks. These have been integrated in all of the policy
options, and are listed below:
• Real life use of household tumble driers: Information gathered in previous
tasks indicates that some of the parameter values in the regulations related to use
of the appliances are no longer valid. In order to reflect real use, the scenario
analyses show consumption and emissions values using real use values, in
particular regarding loading and cycles per year. In addition to this, values on
annual energy consumption can be difficult to interpret by consumers since they
are not aware of the number of cycles they use the appliance every year. It is thus
proposed to show the energy consumption information on the label per cycle rather
than per annum. This is also to be aligned with proposed requirements for washing
machines which would create a better understanding of the information by the
consumers. Showing the energy consumption per cycle requires that the Energy
Efficiency Index (EEI) is also calculated per cycle to ensure full alignment of what
is communicated to consumers. A new EEI formula calculation has thus been
developed using consumption and performance data (for more details see section
7.2)
• Low power modes: Power consumption requirements for low power modes are
not included in the current regulations. Instead, the consumption of low power
modes are integrated in the formula to calculate the annual energy consumption.
However, it is proposed to remove these modes from the calculation of the energy
consumption and instead include requirements for low power modes in the
ecodesign regulation. Subsequently, this means exempting tumble driers from the
horizontal standby regulation.
• Rescaling energy classes distribution (EEI): The current energy class intervals
have been modified based on the new EEI calculation method, which uses energy
44
consumption per cycle rather than per year. The new rescaling has also considered
the current distribution of energy classes on the EU market, and proposes to
eliminate all classes over A, and reallocating the below classes according to the
conditions in the Energy Labelling Framework Regulation from 2017. This was also
done considering intervals spread so the verification tolerances are not
compromised (for more details see section 7.3.3).
• Rescaling condensation efficiency: In line with the re-scaling of the energy
classes also the condensation efficiency classes were re-scaled. Currently, 96% of
the available models are in the top 2 classes (A or B), and the full range of classes
is thus not utilised. The current ecodesign requirement corresponds to a
condensation efficiency of 70 %. Considering most of the driers have efficiencies of
80-100% (i.e. 95%), it is proposed to review requirement to 80%. Due to the
smaller interval, it wouldn’t be appropriate to use all 7 performance classes, as the
intervals would be too narrow. Instead, splitting into four classes above the current
ecodesign requirements (A to D) would make class intervals more evenly
distributed.
Five Policy Options (PO) are proposed which are presented in Table viii. They reflect the
progress in technical innovation since the adoption of the current regulation, but also
existing and future technical innovations that can provide energy savings as presented in
task 6. In addition, the proposed policy options are to give consumers access to better
information in order to increase potential energy savings.
Table viii: Proposed POs for review of Ecodesign and Energy Labelling Regulations of household tumble driers
Policy Option Proposed requirements Implementation
date
PO1a – Energy
average of market
ECODESIGN
• Condenser driers (BC1 & BC2): Revised EEI levels &
condensation efficiency requirements reflecting current
market + Information requirement on refrigerant used in
product manual (only BC2)
• Air-vented driers (BC3 & BC4): Revised EEI levels
requirements reflecting current market
ENERGY LABELLNG
• Condenser driers (BC1 & BC2): Revision and rescaling of EEI
& condensation efficiency levels from A to G reflecting
current market+ Information requirement on refrigerant
used in product manual (only BC2)
• Air-vented driers (BC3 & BC4): Revision and rescaling of EEI
from A to G reflecting current market
2021
(Energy
Labelling)
2023
(Ecodesign)
PO1b – Energy BAT
(Ecodesign only)
ECODESIGN
• Condenser driers (BC1 & BC2): Revised EEI levels and
condensation efficiency requirements reflecting BAT +
2023
(Ecodesign)
45
Policy Option Proposed requirements Implementation
date
Information requirement on refrigerant used in product
manual (only BC2)
• Air-vented driers (BC3 & BC4): Revised EEI levels
requirements reflecting BAT
PO2 – Energy BAT
ECODESIGN
• Condenser driers (BC1 & BC2): Revised EEI levels and
condensation efficiency requirements reflecting BAT +
Information requirement on refrigerant used in product
manual (only BC2)
• Air-vented driers (BC3 & BC4): Revised EEI levels
requirements reflecting BAT
ENERGY LABELLNG
• Condenser driers (BC1 & BC2): Revision and rescaling of EEI
and condensation efficiency levels from A to G reflecting
BAT+ Information requirement on refrigerant used in
product manual (only BC2)
• Air-vented driers (BC3 & BC4): Revision and rescaling of EEI
from A to G reflecting BAT
2021
(Energy
Labelling)
2023
(Ecodesign)
PO3 – Dismantling and
Recycling
ECODESIGN
• All Base Cases/Drier types: Dismantlability features29 for
materials and components referred to in Annex VII to
Directive 2012/19/EU
2021
PO4 – Reparability and
durability
ECODESIGN
• All Base Cases/Drier types: Critical spare parts30 shall be
available for at least 10 years after placing the last unit of the
model on the market, and manufacturers should ensure a
maximum delivery time of 15 working days after having
received the order + Provision of disassembly and repair
information to all professionals of critical components (in
product manual) 31
2021
The potential impacts of the proposed policy options were estimated using six indicators
including energy consumption during use. Figure 10 shows the total energy consumption
in the use phase for tumble driers when implemented by the different policy options.
29 For example: “Manufacturers shall ensure that joining or sealing techniques do not prevent the dismantling of materials and components referred to in Annex VII to Directive 2012/19/EU.” 30 As defined in section 3.2.2, the critical parts of tumble driers are pumps, motors, fans and heating elements. 31 For example: “Dismantling of these components shall be ensured by making an exploded diagram of the tumble drier with the location of the materials and components available in technical documentation, and the sequence of dismantling operations needed to access and remove the materials and components, including: type of operation, type and number of fastening technique(s) to be unlocked, tool(s) required, safety requirements and risks (if any) related to the disassembly operations.” A caution warning should be included in product manual advising consumers to not disassembly without the help of a professional and an indication made about this preventing any warranty claim. The list of critical parts and the procedure for ordering them shall be publicly available on the free access website of the manufacturer, importer or authorised representative, at the latest two years after the placing on the market of the first unit of a model and until the end of the period of availability of these spare parts.
46
Figure 10: Energy consumption during use from 2020 to 2040
PO1a can potentially save 1.2 TWh/year in 2040, which is a reduction of ~14% of the total
energy consumption compared to BAU. PO2 is estimated to save 4.0 TWh/year in 2040,
which corresponds to a reduction of 42% of the total energy consumption compared to
BAU. PO2 results in higher energy savings than PO1a due to the more stringent ecodesign
requirement. PO1b shows the effect of a stringent ecodesign requirement only. In 2030,
this corresponds to energy savings of 2.4 TWh/year. The effect of removing all heating
element driers is thus larger than just imposing new energy label intervals.
In order to properly evaluate the effect of the policy options, the year 2040 is more relevant
as a reference year than 2030. This is due to the long lifetime of household tumble driers
and their replenishment before an effect can be observed in the EU market. Nevertheless,
both 2030 and 2040 are shown in Table ix and Table x.
The largest savings in 2040 on energy, GHG and user expenditure, and the largest increase
on retail turnover and jobs, are achieved with PO2, even at the initial high cost of
consumers’ average expenditure, which starts getting counterbalanced by the energy
savings at year 2029. This is because it is cheaper using a heat pump drier with the usage
patterns identified in Task 3 than using a heating element drier when evaluated over the
whole lifetime. This holds true, even though the heat pump driers are significantly more
expensive than the heating element driers.
4
6
8
10
12
14
2020 2022 2024 2026 2028 2030 2032 2034 2036 2038 2040
TW
h/y
ear
Energy consumption during use
PO4
PO3
PO2
PO1b
PO1a
BAU
47
Table ix: Results of each policy option, evaluated by the differences compared to BAU values in 2030 (a negative number means a reduction of the parameter compared to BAU)
Differences compared to BAU, 2030
Energy consumption [TWh/year]
GHG [mt. CO2 eq./year]
User expenditure
[bln. EUR/year]
Retail turnover [bln.
EUR/year]
Embedded Energy
[PJ/year] Jobs
PO1a -0.61 -0.21 0.05 0.18 - 35
PO1b -2.14 -0.67 -0.13 0.32 0.09 62
PO2 -2.93 -0.94 -0.08 0.54 0.09 104
PO3 - -0.07 - - -0.18 -
PO4 0.07 -0.11 0.03 -0.04 -0.02 23
Table x: Results of each policy option, evaluated by the differences compared to BAU values in 2040 (a negative number means a reduction of the parameter compared to BAU)
Differences compared to BAU, 2040
Energy consumption [TWh/year]
GHG [mt. CO2 eq./year]
User expenditure
[bln. EUR/year]
Retail turnover [bln.
EUR/year]
Embedded Energy
[PJ/year] Jobs
PO1a -1.24 -0.37 -0.09 0.18 - 35
PO1b -2.38 -0.66 -0.19 0.32 0.09 62
PO2 -3.93 -1.12 -0.30 0.54 0.09 104
PO3 - -0.09 - - -0.18 -
PO4 0.70 0.03 -0.09 -0.56 -0.32 63
Condenser driers (BC1 and BC2) present the largest contributions with these savings, as
it can be seen in Table 69, Table 71, Table 73 and Table 75. This is obvious because
condenser driers represent the current and future dominant technologies in the market,
but also because there is more room for design improvements as it was explained in
previous section.
It is estimated that air-vented tumble driers will continue to decrease in sales, and that
gas-fired products will continue to be a niche product responsible for a very low percentage
of the total market. That being said, it is not recommended to exclude them from the
current scope as there is no indication they will disappear from the market.
As the gas driers are able to reach the EEI levels of heat pump driers due to the current
conversation factor between gas and electricity, they are currently considered quite
efficient, and the current models will be able to stay on the market even after imposing
the most stringent proposed ecodesign requirements. Excluding them from the scope
would not be recommended – even considering the low sales – as they are still
considered a good option when replacing a heating element air-vented drier. Excluding
them would mean removing the energy label from them, and thus making it harder for
consumers to identify the real efficiency of a gas fired drier.
48
Recommendations
Based on the discussion and analysis throughout the report, the following concrete
recommendation are given:
- Change the EEI calculation method from using energy consumption per year, to
using energy consumption per cycle.
o Scale the reference energy consumption per cycle (SEc) according to the
available data based on the current technological progress and market share
of each tumble drier type. This will ensure a lower dependency between the
rated capacity and the energy consumption per cycle.
- Rescale the energy class intervals from A to G, making sure that:
o The A class is empty
o The energy class intervals are placed, as much as possible, evenly so
consumers get a better understanding of the differences between classes.
- Rescale the condensation efficiency classes, distributing tumble driers in 4 classes
instead of 3, and revise the condensation efficiency requirement to 80% (up from
70%), which would exclude 5% of driers on the market.
- Do not exclude gas fired driers from the scope.
- Change the weighting between full and half-loaded cycles when calculating Ec and
Tc to 62% of the rated capacity, instead of the current 71% by changing the
calculation formula
- Remove tumble driers from the horizontal standby regulation and add specific
standby requirements to the new tumble drier ecodesign regulation. Set proposed
maximum consumption levels for low power modes.
- Set ambitious ecodesign limits that ensures that cost effective savings potentials
are utilized by removing all heating element driers from the market as they present
the largest potential savings.
- Ensure that critical spare parts are available for at least 10 years after the
production of a model ceases, to promote a longer average lifetime of the product.
- Technical information on how to disassembly critical components (for repair) and
dismantle materials and components (for end-of-life) should be available in
booklet/technical documentation.
1. Scope
Task 1 follows the MEErP methodology and the specific items requested by the European
Commission. It includes the following:
1. Product scope: Identification and description of relevant product categories and
definition of the product scope and categorisation based on Regulations, previous
studies and market terms.
2. Legislation: Update of relevant legislation on EU, Member State and third country
level.
3. Test standards: Update and description of relevant test and measurement
standards on EU, Member State and third country level, including those on resource
efficiency aspects.
The review of legislation and test standards include those relevant to the Ecodesign and
Energy Labelling Regulations on tumble driers32.
1.1 Product scope
The current scopes of both the Commission Regulation (EU) No 932/2012 and the
Commission Delegated Regulation (EU) No 392/2012 cover electric mains-operated and
gas-fired household tumble driers and built-in household tumble driers, including those
sold for non-household use.
The definition of tumble driers is presented and discussed in the next sub-section.
1.1.1 Definitions from the Regulations
The tumble drier Ecodesign Regulation (EU) No 932/2012 and Energy Labelling Regulation
(EU) 392/2012 employ identical definitions for household tumble driers, which are listed
below.
Products within the scope of the Regulations are defined as:
Household tumble drier means an appliance in which textiles are dried by tumbling in a
rotating drum through which heated air is passed and which is designed to be used
principally for non-professional purposes.
32 Commission Regulation (EU) No 932/2012, available at: http://eur-lex.europa.eu/legal-content/EN/TXT/PDF/?uri=CELEX:32012R0932&from=EN and Commission Delegated Regulation (EU) No 392/2012, available at: http://eur-lex.europa.eu/legal-content/EN/TXT/PDF/?uri=CELEX:32012R0392&from=EN
50
Built-in household tumble drier means a household tumble drier intended to be
installed in a cabinet, a prepared recess in a wall or a similar location, requiring furniture
finishing.
Air-vented tumble drier means a tumble drier that draws in fresh air, heats it up, and
passes it over the textiles and vents the resulting moist air into the room or outside.
Condenser tumble drier means a tumble drier which includes a device (either using
condensation or any other means) for removing moisture from the air used for the drying
process.
Automatic tumble drier means a tumble drier which switches off the drying process
when a certain moisture content of the load is detected, for example through conductivity
or temperature sensing.
Non-automatic tumble drier means a tumble drier which switches off the drying process
after a predefined period, usually controlled by a timer, but which may also be manually
switched off.
Defined products not within the scope of the Regulations:
Household combined washer-drier means a household washing machine which
includes both a spin extraction function and also a means for drying the textiles, usually
by heating and tumbling.
Household spin-extractor, also known commercially as ‘spin-drier’, means an appliance
in which water is removed from the textiles by centrifugal action in a rotating drum and
drained through an automatic pump and which is designed to be used principally for non-
professional purposes.
Other important definitions are:
Programme means a series of operations that are predefined, and which are declared by
the manufacturer as suitable for drying certain types of textiles
Cycle means a complete drying process, as defined for the selected programme.
Programme time means the time that elapses from the initiation of the programme until
the completion of the programme, excluding any end-user programmed delay
Rated capacity means the maximum mass in kilograms, indicated by the manufacturer
in 0,5 kilograms increments of dry textiles of a particular type, which can be treated in a
household tumble drier with the selected programme, when loaded in accordance with the
manufacturer’s instructions.
51
Partial load means half of the rated capacity of a household tumble drier for a given
programme.
Condensation efficiency means the ratio between the mass of moisture condensed by a
condenser tumble drier and the mass of moisture removed from the load at the end of a
cycle.
Off-mode means a condition where the household tumble drier is switched off using
appliance controls or switches accessible to and intended for operation by the end-user
during normal use to attain the lowest power consumption that may persist for an indefinite
time while the household tumble drier is connected to a power source and used in
accordance with the manufacturer’s instructions; where there is no control or switch
accessible to the end-user, ‘off-mode’ means the condition reached after the household
tumble drier reverts to a steady-state power consumption on its own.
Left-on mode means the lowest power consumption mode that may persist for an
indefinite time after completion of the programme without any further intervention by the
end-user besides unloading of the household tumble drier. Starts after the completion of
any options that has been selected by the consumer.
Equivalent household tumble drier means a model of household tumble drier placed
on the market with the same rated capacity, technical and performance characteristics,
energy consumption, condensation efficiency where relevant, standard cotton programme
time and airborne acoustical noise emissions during drying as another model of household
tumble drier placed on the market under a different commercial code number by the same
manufacturer.
Standard cotton programme means the cycle which dries cotton laundry with an initial
moisture content of the load of 60 % up to a remaining moisture content of the load of 0
%.
1.1.2 Definitions from preparatory study
Besides the above definitions from the Regulations, the preparatory study sets out a
number of relevant definitions, which defines tumble driers across the above categories:
Electric tumble drier: the drier generally uses a coiled wire heated with electric current.
The amount of electric current is varied to adjust the temperature.
Gas tumble drier: a gas burner is used to heat the air. The air temperature can be altered
by adjusting the size of the gas flame or, more commonly, by merely extinguishing and
relighting it.
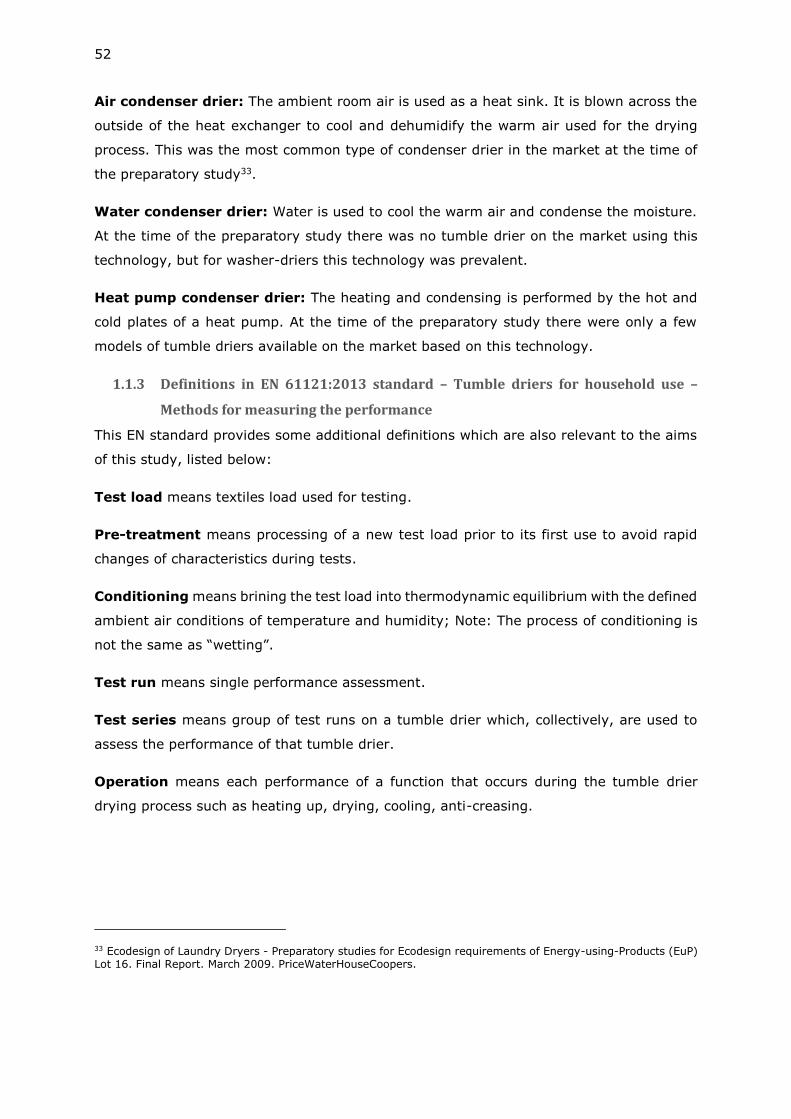
52
Air condenser drier: The ambient room air is used as a heat sink. It is blown across the
outside of the heat exchanger to cool and dehumidify the warm air used for the drying
process. This was the most common type of condenser drier in the market at the time of
the preparatory study33.
Water condenser drier: Water is used to cool the warm air and condense the moisture.
At the time of the preparatory study there was no tumble drier on the market using this
technology, but for washer-driers this technology was prevalent.
Heat pump condenser drier: The heating and condensing is performed by the hot and
cold plates of a heat pump. At the time of the preparatory study there were only a few
models of tumble driers available on the market based on this technology.
1.1.3 Definitions in EN 61121:2013 standard – Tumble driers for household use –
Methods for measuring the performance
This EN standard provides some additional definitions which are also relevant to the aims
of this study, listed below:
Test load means textiles load used for testing.
Pre-treatment means processing of a new test load prior to its first use to avoid rapid
changes of characteristics during tests.
Conditioning means brining the test load into thermodynamic equilibrium with the defined
ambient air conditions of temperature and humidity; Note: The process of conditioning is
not the same as “wetting”.
Test run means single performance assessment.
Test series means group of test runs on a tumble drier which, collectively, are used to
assess the performance of that tumble drier.
Operation means each performance of a function that occurs during the tumble drier
drying process such as heating up, drying, cooling, anti-creasing.
33 Ecodesign of Laundry Dryers - Preparatory studies for Ecodesign requirements of Energy-using-Products (EuP) Lot 16. Final Report. March 2009. PriceWaterHouseCoopers.
53
End of the programme means moment in time when the tumble drier indicates the
programme is complete and the load is accessible to the user34.
Cycle time means period of time from the initiation of the programme (excluding any user
programmed delay) until all activity ceases. Activity is considered to have ceased when the
power consumption reverts to a steady state condition that persists indefinitely without
user intervention. If there is no activity after the end of the programme, the cycle time is
equal to the programme time35.
Normalization means processing of a test load after a pre-determined number of cycles
to bring the test load to a normal state prior to testing.
Test load mass means actual mass of the test load.
Nominal test load mass means mass of dry textiles of a particular type for which the
performance of the tumble drier will be tested (rated capacity or part load). Target value
toward which the conditioned test load mass will be adjusted.
Moisture content means ratio of the difference between test load mass and the
conditioned test load mass to the conditioned test load mass expressed in percent.
Initial moisture content means moisture content of a test load prior to a test run.
Final moisture content means moisture content of a test load at the end of a test run.
Rated voltage means voltage assigned to the appliance by the manufacturer.
1.1.4 PRODCOM categories
The PRODCOM database is the official source of data regarding production and sales of
products in the EU according to the MEErP methodology. For tumble driers, the first data
entry in the database was in 1995 and the latest in 2016. From 2008 the PRODCOM
database switched from the NACE Rev. 1.1 (Statistical Classification of Economic Activities
in the European Community, Revision 1.1) nomenclature to the NACE Rev. 2.036, which
34 Note 1: Where there is no such indicator and the door is locked during operation, the programme is deemed to be completed when the load is accessible to the user. Where there is no indicator and the door is not locked during operation, the programme is deemed to be completed when the power consumption of the appliance drops to a steady state condition and it is not performing any function. For non-automatic tumble dryers, the programme is deemed to be completed when it is stopped by the operator. Note 2: An indication of the end of the programme may be in the form of a light (on or off), a sound, an indicator shown on a display or the release of a door or latch. In some tumble dryers there may be a short delay from an end of the programme indicator until the load is accessible by the user. 35 Note: Cycle time includes any activity that may occur for a limited period after the end of the programme. Any cyclic event that occurs indefinitely is considered to be steady state. 36 http://ec.europa.eu/eurostat/web/nace-rev2/transition
54
meant that most product categories were rearranged. The Product categories relevant for
this review from both versions of the database are shown in Table 1.
Table 1: Product categories used in the PRODCOM database
NACE Rev 1.1 (1995-2007)
29.71 Manufacture of electric domestic
appliances
└29.71.13 Cloth washing and drying machines, of
the household type
└29.71.13.70 Drying machines of a dry linen capacity
≤ 10 kg
NACE Rev 2.0 (2008-2016)
27.51.13.00 Cloth washing and drying machines, of
the household type
As seen from Table 1, the NACE rev. 1.1 clearly differentiates between washing machines
and drying machines, which has a specific category. Machines that both wash and dry are
grouped with washing machines. From 1995 to 2002 the data was only collected for the
EU-15 countries, and hence for other countries who joined the EU afterwards, data is
available from 2003 and forward.
In the NACE rec. 2.0 there is only one category for household washing and drying
machines, and collection of separate data in the specific categories has been discontinued.
It is therefore not possible to single out the tumble driers from this aggregated category
in the NACE Rev 2.0 dataset, which therefore cannot be used for market analysis in this
review study.
In both versions of the database there are also categories for washing and drying machines
intended for manufacturing or industrial purposes, which are not mentioned here as they
are not relevant for this study. Neither of the classifications allow to differentiate between
all relevant product groups such as the different tumble drier technologies defined in the
Regulations.
1.1.5 Description of products
The primary distinction between tumble driers is the technology that they use, which is
also reflected by the categorisation used in the Regulations. In the below sections, the two
main types of tumble driers, as well as the heating technology they typically use, are
described in more detail to provide explanation of the terms used in the report.
55
Air-vented tumble driers
Air-vented tumble driers, as shown in Figure 11 are the traditional type of drier, which
draws in air from its surrounding room and then heats it and blow it through the clothes
to remove moisture from it. The humid air is then exhausted through a ventilation duct in
the wall to the outdoors. Hence the vented driers have to be fitted with a hose connected
to a wall or window through which the humid air from the drum can be exhausted.
Figure 11: Air-vented tumble drier. Source: Adapted by PWC (2009)37 from (Essaoui, 2001)38
Condenser tumble driers
Condenser tumble driers work through a condensation process where air is recirculated
rather than released to the outdoors. The water is condensed out of the moist air coming
from the drum by cooling it down in a heat exchanger (using ambient air as heat sink) and
the air is reheated and recirculated back to the drum, as shown in Figure 12. The water is
either deposited in a container, which should then be emptied by the user, or the drier is
connected to a drain to which the water is released. The condenser tumble drier does
therefore not have to be placed near a wall, but it is convenient to place them near a drain.
37 PWC: Ecodesign of Laundry Driers, Preparatory studies for Ecodesign requirements of Energy-using-Products (EuP) – Lot 16, Final Report, March 2009 38 Essaoui: Présentation du sèche-linge, Fagor-Brandt internal documentation, 2001
Heated air
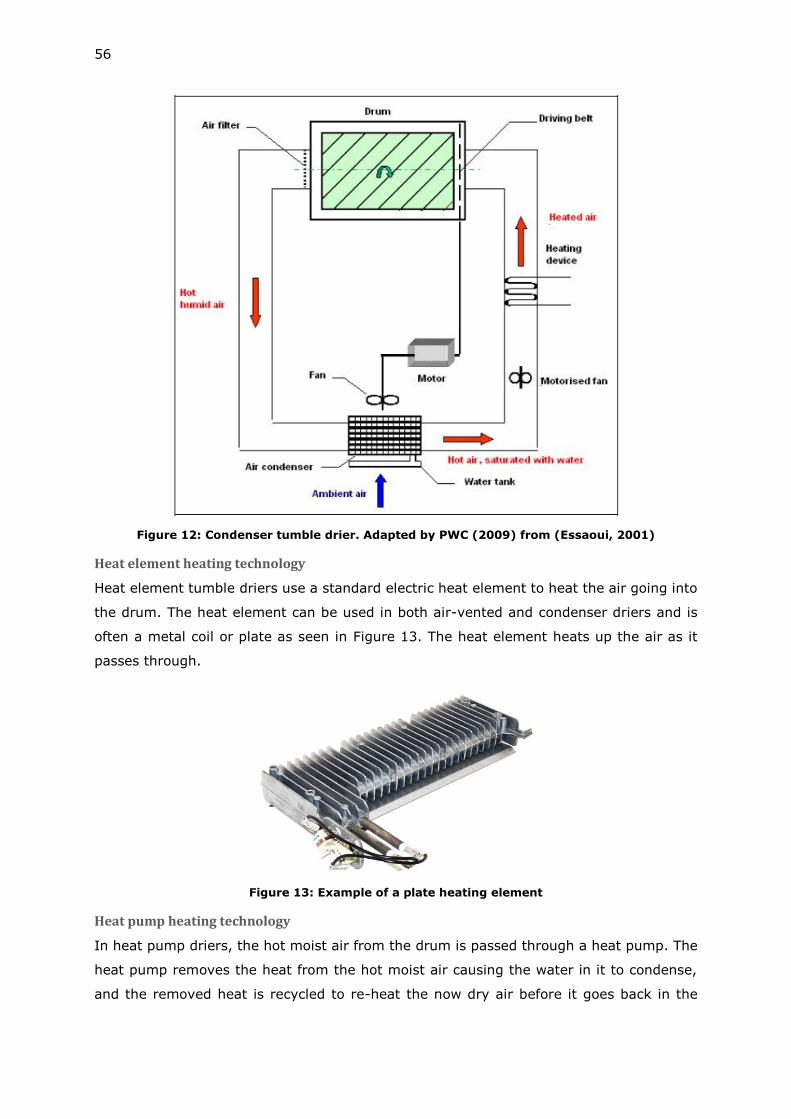
56
Figure 12: Condenser tumble drier. Adapted by PWC (2009) from (Essaoui, 2001)
Heat element heating technology
Heat element tumble driers use a standard electric heat element to heat the air going into
the drum. The heat element can be used in both air-vented and condenser driers and is
often a metal coil or plate as seen in Figure 13. The heat element heats up the air as it
passes through.
Figure 13: Example of a plate heating element
Heat pump heating technology
In heat pump driers, the hot moist air from the drum is passed through a heat pump. The
heat pump removes the heat from the hot moist air causing the water in it to condense,
and the removed heat is recycled to re-heat the now dry air before it goes back in the
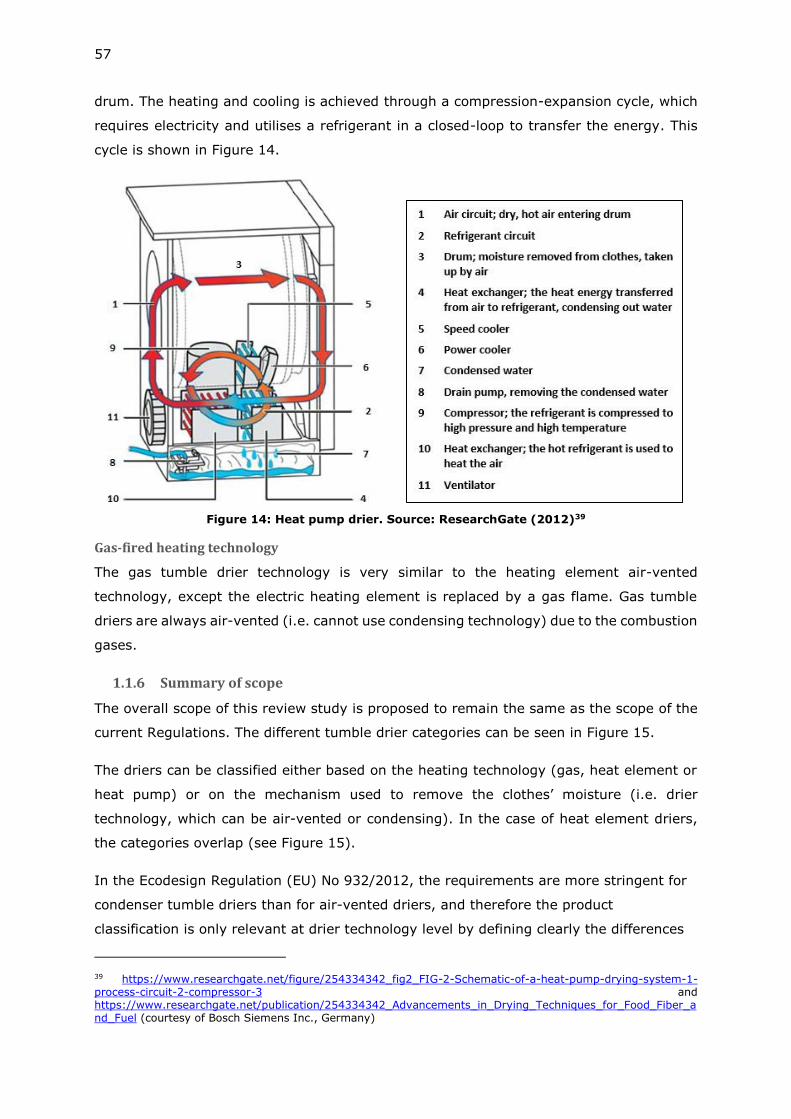
57
drum. The heating and cooling is achieved through a compression-expansion cycle, which
requires electricity and utilises a refrigerant in a closed-loop to transfer the energy. This
cycle is shown in Figure 14.
Figure 14: Heat pump drier. Source: ResearchGate (2012)39
Gas-fired heating technology
The gas tumble drier technology is very similar to the heating element air-vented
technology, except the electric heating element is replaced by a gas flame. Gas tumble
driers are always air-vented (i.e. cannot use condensing technology) due to the combustion
gases.
1.1.6 Summary of scope
The overall scope of this review study is proposed to remain the same as the scope of the
current Regulations. The different tumble drier categories can be seen in Figure 15.
The driers can be classified either based on the heating technology (gas, heat element or
heat pump) or on the mechanism used to remove the clothes’ moisture (i.e. drier
technology, which can be air-vented or condensing). In the case of heat element driers,
the categories overlap (see Figure 15).
In the Ecodesign Regulation (EU) No 932/2012, the requirements are more stringent for
condenser tumble driers than for air-vented driers, and therefore the product
classification is only relevant at drier technology level by defining clearly the differences
39 https://www.researchgate.net/figure/254334342_fig2_FIG-2-Schematic-of-a-heat-pump-drying-system-1-process-circuit-2-compressor-3 and https://www.researchgate.net/publication/254334342_Advancements_in_Drying_Techniques_for_Food_Fiber_and_Fuel (courtesy of Bosch Siemens Inc., Germany)
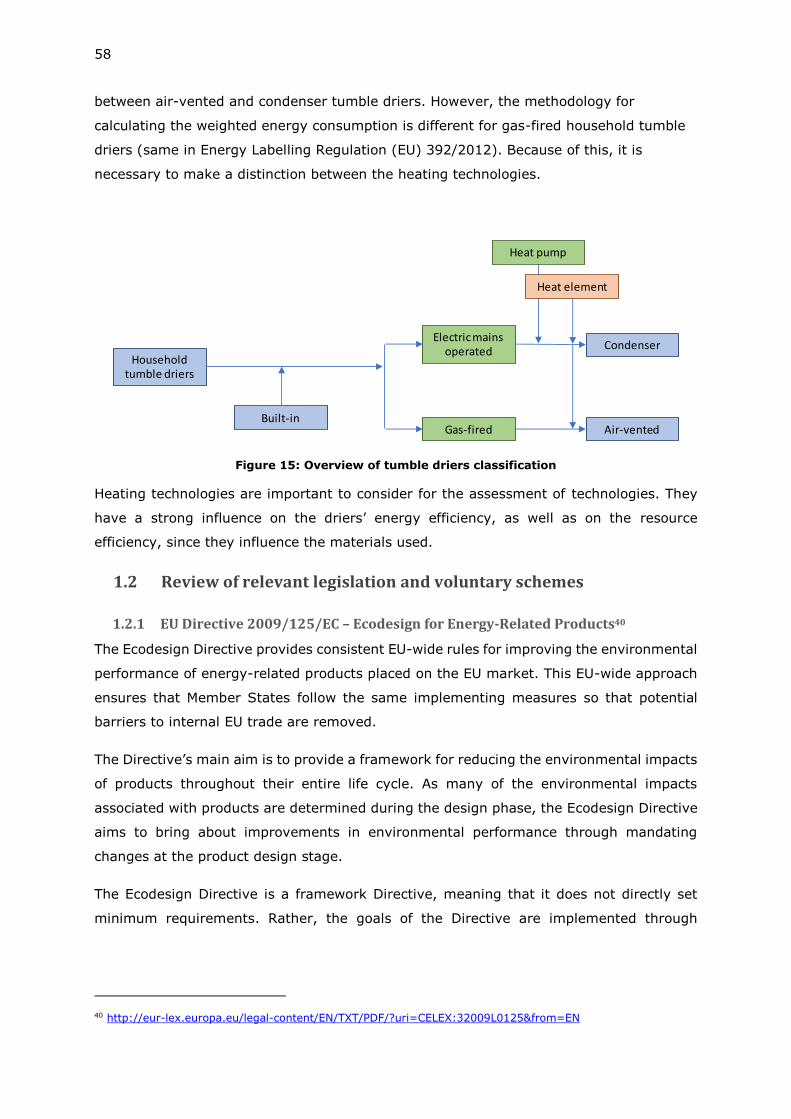
58
between air-vented and condenser tumble driers. However, the methodology for
calculating the weighted energy consumption is different for gas-fired household tumble
driers (same in Energy Labelling Regulation (EU) 392/2012). Because of this, it is
necessary to make a distinction between the heating technologies.
Figure 15: Overview of tumble driers classification
Heating technologies are important to consider for the assessment of technologies. They
have a strong influence on the driers’ energy efficiency, as well as on the resource
efficiency, since they influence the materials used.
1.2 Review of relevant legislation and voluntary schemes
1.2.1 EU Directive 2009/125/EC – Ecodesign for Energy-Related Products40
The Ecodesign Directive provides consistent EU-wide rules for improving the environmental
performance of energy-related products placed on the EU market. This EU-wide approach
ensures that Member States follow the same implementing measures so that potential
barriers to internal EU trade are removed.
The Directive’s main aim is to provide a framework for reducing the environmental impacts
of products throughout their entire life cycle. As many of the environmental impacts
associated with products are determined during the design phase, the Ecodesign Directive
aims to bring about improvements in environmental performance through mandating
changes at the product design stage.
The Ecodesign Directive is a framework Directive, meaning that it does not directly set
minimum requirements. Rather, the goals of the Directive are implemented through
40 http://eur-lex.europa.eu/legal-content/EN/TXT/PDF/?uri=CELEX:32009L0125&from=EN
Household tumble driers
Built-in
Electric mains operated
Gas-fired Air-vented
Condenser
Heat element
Heat pump
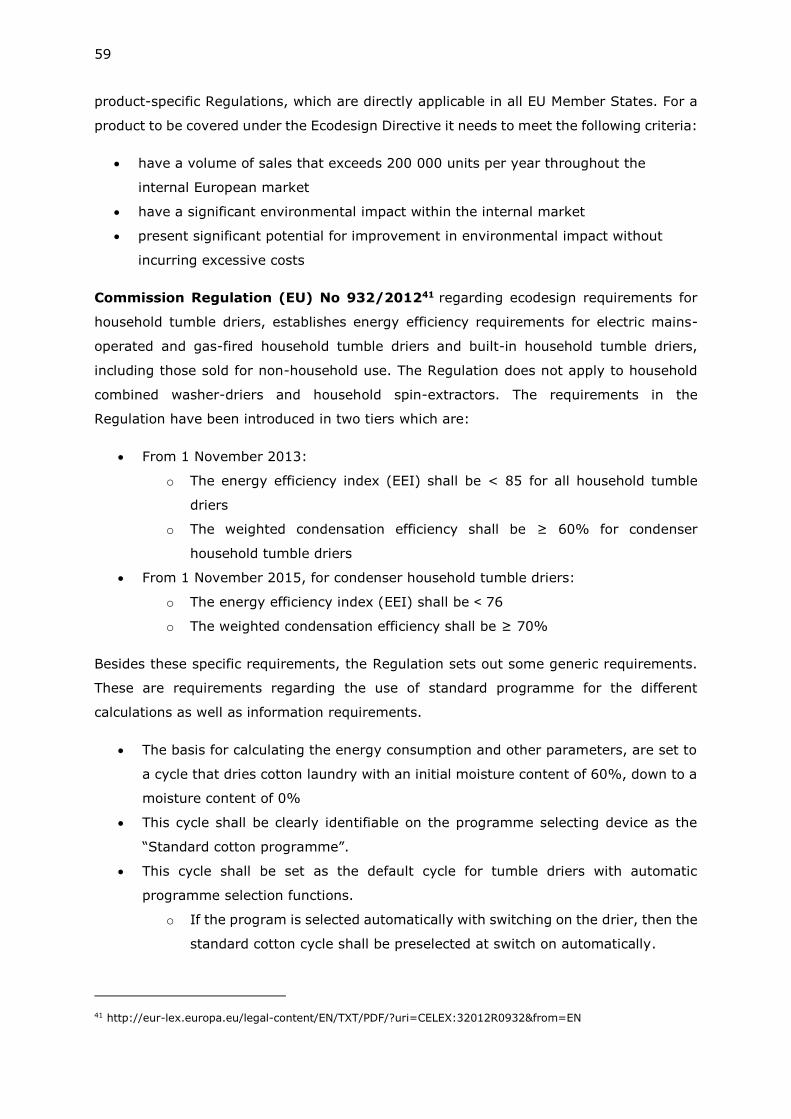
59
product-specific Regulations, which are directly applicable in all EU Member States. For a
product to be covered under the Ecodesign Directive it needs to meet the following criteria:
• have a volume of sales that exceeds 200 000 units per year throughout the
internal European market
• have a significant environmental impact within the internal market
• present significant potential for improvement in environmental impact without
incurring excessive costs
Commission Regulation (EU) No 932/201241 regarding ecodesign requirements for
household tumble driers, establishes energy efficiency requirements for electric mains-
operated and gas-fired household tumble driers and built-in household tumble driers,
including those sold for non-household use. The Regulation does not apply to household
combined washer-driers and household spin-extractors. The requirements in the
Regulation have been introduced in two tiers which are:
• From 1 November 2013:
o The energy efficiency index (EEI) shall be < 85 for all household tumble
driers
o The weighted condensation efficiency shall be ≥ 60% for condenser
household tumble driers
• From 1 November 2015, for condenser household tumble driers:
o The energy efficiency index (EEI) shall be ˂ 76
o The weighted condensation efficiency shall be ≥ 70%
Besides these specific requirements, the Regulation sets out some generic requirements.
These are requirements regarding the use of standard programme for the different
calculations as well as information requirements.
• The basis for calculating the energy consumption and other parameters, are set to
a cycle that dries cotton laundry with an initial moisture content of 60%, down to a
moisture content of 0%
• This cycle shall be clearly identifiable on the programme selecting device as the
“Standard cotton programme”.
• This cycle shall be set as the default cycle for tumble driers with automatic
programme selection functions.
o If the program is selected automatically with switching on the drier, then the
standard cotton cycle shall be preselected at switch on automatically.
41 http://eur-lex.europa.eu/legal-content/EN/TXT/PDF/?uri=CELEX:32012R0932&from=EN
60
Furthermore, requirements for the booklet of instructions provided by manufacturers shall
include:
• Information about the “standard cotton programme”, and that it is the most efficient
programme for drying wet cotton laundry
• The power consumption of the off-mode and left-on mode
• Indicative information on the programme time and energy consumption for the
main drying programmes at full, and, if applicable, partial load.
The tolerance-levels determined in Regulation 932/2012 for the purpose of verification of
compliance, are set to 6% for all parameters listed in the Regulation, except for power off
and power left-on modes with a power consumption of less than or equal to 1,00W where
it shall not be more than 0.1W of the rated value. These are:
• weighted annual energy consumption
• weighted energy consumption
• weighted condensation efficiency
• weighted programme time
• power consumption in off-mode and left-on mode
• duration of the left-on mode
Commission Regulation (EU) No 2016/228242 with regard to the use of tolerances in
verification procedures specifies that the tolerance-levels determined for the purpose of
verification of compliance, are only allowed to be used by market surveillance authorities
in the context of reading measurement results, rather than by producers or suppliers for
the purpose of establishing values for the technical documentation or in interpreting these
values with a view to achieving compliance.
Commission Regulation (EC) No 640/200943 incl. amendment (EU) No 4/2014
with regard to ecodesign requirements for electric motors and its amendment Commission
Regulation (EU) No 4/201444. The current scope includes electric one- or three-phase AC
motors with output in the range 0.75-375 kW. This means that motors in tumble driers are
currently not covered by the electric motor regulation45 (specifically, the motors for driving
42 http://eur-lex.europa.eu/legal-content/EN/TXT/PDF/?uri=CELEX:32016R2282&from=EN 43 http://eur-lex.europa.eu/legal-content/EN/TXT/PDF/?uri=CELEX:32009R0640&from=EN and http://eur-lex.europa.eu/legal-content/EN/TXT/PDF/?uri=CELEX:32014R0004&from=EN 44 http://eur-lex.europa.eu/legal-content/EN/TXT/PDF/?uri=CELEX:32014R0004&from=EN 45 A motor size of around 200W is assumed to be the typical used in tumble driers considering stakeholders input and the information available at preparatory study for the fan/drum motor.
61
the drum and the fans for the hot and cooling air). Electric motors in the compressors for
heat pump driers are not covered by the electric motor regulation, cf. article 1 (point 2(b)).
The most recent results from Lot 11 and Lot 30 study46 show that the scope of the foreseen
revised electric motor regulation will probably include single speed motors with rated
outputs from 0.12kW to 1000kW, as well as including motors equipped with variable speed
drives. This would include some motors used in drum drives and fans in tumble driers in
the foreseen new Motor Regulation. In this case the motors used in tumble driers would
have to comply with the IE3 efficiency levels, shown in Annex 1 in the current Motor
Regulation.
Commission Regulation (EU) No 1275/200847 regarding ecodesign requirements for
standby and off mode, and networked standby, electric power consumption of electrical
and electronic household and office equipment.
EU ecodesign requirements are mandatory for all manufacturers and suppliers wishing to
place on the market products consuming electric power in standby and off mode in the EU.
A wide range of products, e.g. computers, TVs, audio and video equipment, white goods
and electric toys can have standby modes, so the Regulation is horizontal and covers many
products. The complete list of products is presented in Annex I of the Regulation, where
clothes driers are explicitly mentioned. The Regulation is entering into force in stages, and
all but the last stage (in 2019) is currently active. The requirements for products listed in
Annex I is:
• Standby and off mode ≤ 0.5 Watts
• Standby with display ≤ 1 Watts
• Networked standby ≤ 3 Watts
Standby is here defined as a condition where the equipment is connected to the mains
power source, depending on energy input from the mains power source to work as intended
and provides only the following functions, which may persist for an indefinite time:
1. Reactivation function, or reactivation function and only an indication of enabled
reactivation function, and/or:
2. Information or status display.
46 https://www.eceee.org/ecodesign/products/electricmotors/ and https://www.eceee.org/ecodesign/products/special-motors-not-covered-in-lot-11/ 47 http://eur-lex.europa.eu/legal-content/EN/TXT/PDF/?uri=CELEX:02008R1275-20170109&from=EN
62
Off mode is here defined as a condition in which the equipment is connected to the mains
power source and is not providing any function; the following shall also be considers as off
mode:
1. Conditions providing only an indication of off-mode condition
2. Conditions providing only functionalities intended to ensure electromagnetic
compatibility pursuant to Electromagnetic Compatibility Directive 2004/108/EC of
the European Parliament and of the Council.
From 2017, all covered appliances are required to have a power management system which
turns the equipment into standby or off-modes after the shortest possible period of time,
when the equipment is not providing the main function.
For appliances connected to the internet, an option for deactivating the wireless network
connection shall be included. Furthermore, a power management system for the network
capabilities of the appliance, should be included as well. This system should switch the
appliance into networked standby before 20 minutes after use. This is relevant for some
of the newer tumble drier models, which are equipped with network capabilities for remote
start operation.
Tumble driers do in some models offer “delayed start” options. These modes are not
covered in the standby Regulation, as this mode does not last for an indefinite time.
Similarly, tumble driers have a left-on mode, after operation. This mode is also not covered
in the Regulation, as the mandatory power management system turns the appliance off
after a set amount of time. Furthermore, the definition of left-on mode says there should
not be further user intervention by the end-user, which happens when appliances are on
standby, due to reactivation.
Left-on mode and off mode are indirectly regulated in the ecodesign and energy labelling
Regulations of tumble driers as they are included in the EEI calculation.
The Standby Regulation is currently under revision where the scope and some of the
requirements may be amended48.
Commission Regulation (EU) No 206/201249 regarding air conditioners and comfort
fans. The energy requirements set here are not applicable to heat pump tumble driers, as
48 https://www.eceee.org/ecodesign/products/standby/ 49 https://eur-lex.europa.eu/legal-content/EN/TXT/PDF/?uri=CELEX:32012R0206&from=EN
63
the temperature levels and system designs of an air conditioning system are very different
from a drying process and should hence not be compared.
F-gas Regulation - (EU) No 517/201450, which was adopted in 2006 and succeeded in
stabilising EU F-gas emissions at 2010 levels. A new regulation, which replaces the first
and applied from 1 January 2015, strengthened the existing measures and introduced a
number of far-reaching changes. By 2030 it will cut the EU’s F-gas emissions by two-thirds
compared with 2014 levels. However, the F-Gas Regulation does not apply to tumble driers
because heat pumps used in tumble driers do not fit the definition of ‘stationary heat
pumps’51, and the tumble driers are hermetically sealed and do not contain more than, or
equal to 10 tonnes of CO2-equivalent in fluorinated greenhouse gases.
1.2.2 EU Regulation 2017/1369 52 setting a framework for energy labelling and
replacing Directive 2010/30/EU
Regulation 2017/1369 sets a framework for energy labelling of energy-related products
and replaces Directive 2010/30/EU. The Directive required producers to label their products
in terms of energy consumption on a scale of A – G, as well as inform of a number of other
parameters, so that consumers could compare the efficiency of one product with that of
another. The current energy labelling requirements for household tumble driers
(Regulation 392/2012) are set in relation to Directive 2010/30/EU. The revised rules for
energy labelling of household tumble driers will be issued under the new framework
Regulation.
In the future, all products will be labelled on a new, updated and clearer scale from A (most
efficient) to G (least efficient). This system will gradually replace the current system of
A+++ to G labels, which as a result of the technological development towards more energy
efficient products in recent years no longer enables consumers to distinguish clearly
between the most energy efficient items.
The new A – G scales for the different product categories will be issued through new,
product-specific delegated Regulations, and these new scales shall be adopted by 2 August
2023 according to Article 11(4) of the framework Regulation (EU) 2017/136953. For the
present study, this means that a rescaling must be performed for the products in scope,
transferring them from the current A+++ – G scale to an A – G scale. As Regulation
2017/1369 stipulates, in order to encourage technological progress, the top class should
be left empty at the moment of rescaling. In exceptional cases, where technology is
50 http://eur-lex.europa.eu/legal-content/EN/TXT/PDF/?uri=CELEX:32014R0517&from=EN 51 52 http://eur-lex.europa.eu/legal-content/EN/TXT/PDF/?uri=CELEX:32017R1369&from=EN 53 https://eur-lex.europa.eu/legal-content/EN/TXT/PDF/?uri=CELEX:32017R1369&from=EN
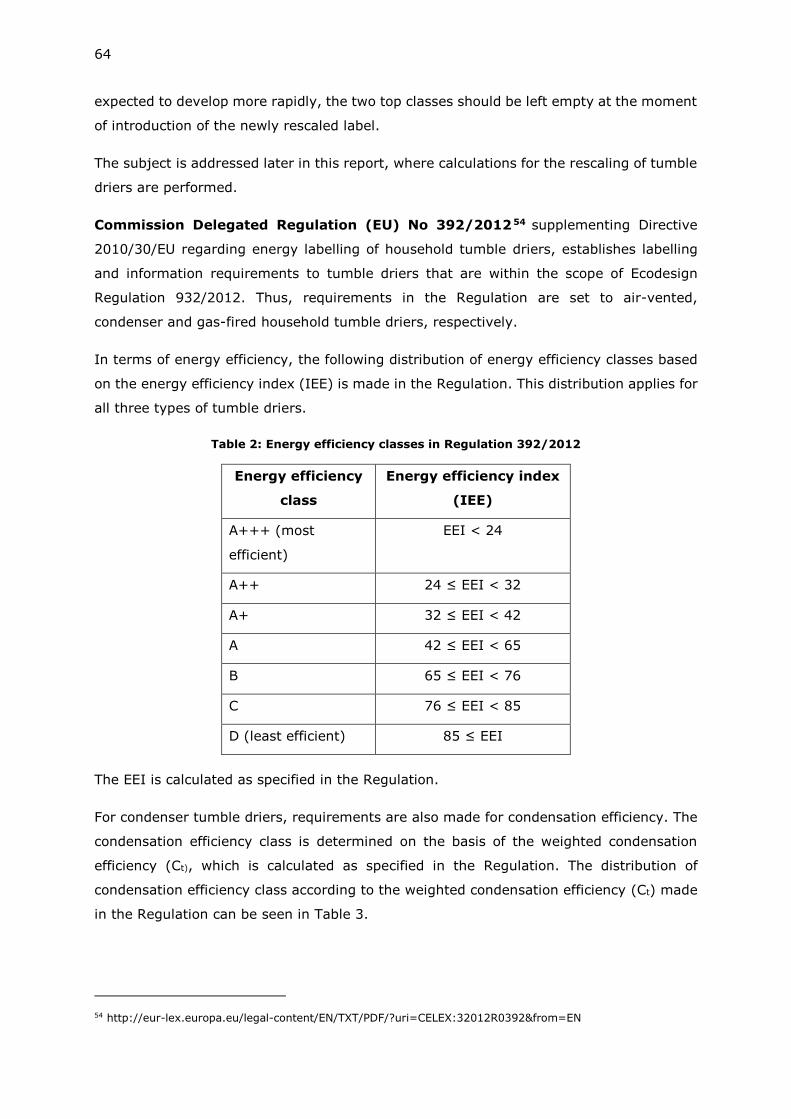
64
expected to develop more rapidly, the two top classes should be left empty at the moment
of introduction of the newly rescaled label.
The subject is addressed later in this report, where calculations for the rescaling of tumble
driers are performed.
Commission Delegated Regulation (EU) No 392/201254 supplementing Directive
2010/30/EU regarding energy labelling of household tumble driers, establishes labelling
and information requirements to tumble driers that are within the scope of Ecodesign
Regulation 932/2012. Thus, requirements in the Regulation are set to air-vented,
condenser and gas-fired household tumble driers, respectively.
In terms of energy efficiency, the following distribution of energy efficiency classes based
on the energy efficiency index (IEE) is made in the Regulation. This distribution applies for
all three types of tumble driers.
Table 2: Energy efficiency classes in Regulation 392/2012
Energy efficiency
class
Energy efficiency index
(IEE)
A+++ (most
efficient)
EEI < 24
A++ 24 ≤ EEI < 32
A+ 32 ≤ EEI < 42
A 42 ≤ EEI < 65
B 65 ≤ EEI < 76
C 76 ≤ EEI < 85
D (least efficient) 85 ≤ EEI
The EEI is calculated as specified in the Regulation.
For condenser tumble driers, requirements are also made for condensation efficiency. The
condensation efficiency class is determined on the basis of the weighted condensation
efficiency (Ct), which is calculated as specified in the Regulation. The distribution of
condensation efficiency class according to the weighted condensation efficiency (Ct) made
in the Regulation can be seen in Table 3.
54 http://eur-lex.europa.eu/legal-content/EN/TXT/PDF/?uri=CELEX:32012R0392&from=EN
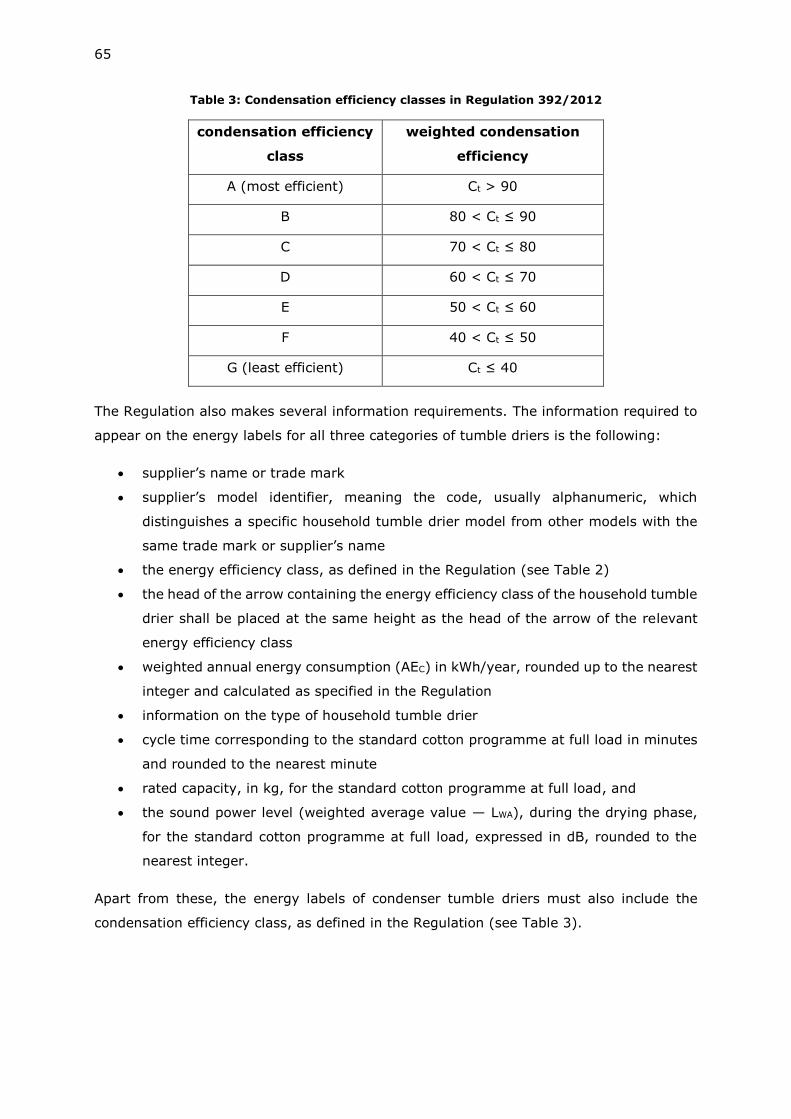
65
Table 3: Condensation efficiency classes in Regulation 392/2012
condensation efficiency
class
weighted condensation
efficiency
A (most efficient) Ct > 90
B 80 < Ct ≤ 90
C 70 < Ct ≤ 80
D 60 < Ct ≤ 70
E 50 < Ct ≤ 60
F 40 < Ct ≤ 50
G (least efficient) Ct ≤ 40
The Regulation also makes several information requirements. The information required to
appear on the energy labels for all three categories of tumble driers is the following:
• supplier’s name or trade mark
• supplier’s model identifier, meaning the code, usually alphanumeric, which
distinguishes a specific household tumble drier model from other models with the
same trade mark or supplier’s name
• the energy efficiency class, as defined in the Regulation (see Table 2)
• the head of the arrow containing the energy efficiency class of the household tumble
drier shall be placed at the same height as the head of the arrow of the relevant
energy efficiency class
• weighted annual energy consumption (AEC) in kWh/year, rounded up to the nearest
integer and calculated as specified in the Regulation
• information on the type of household tumble drier
• cycle time corresponding to the standard cotton programme at full load in minutes
and rounded to the nearest minute
• rated capacity, in kg, for the standard cotton programme at full load, and
• the sound power level (weighted average value — LWA), during the drying phase,
for the standard cotton programme at full load, expressed in dB, rounded to the
nearest integer.
Apart from these, the energy labels of condenser tumble driers must also include the
condensation efficiency class, as defined in the Regulation (see Table 3).
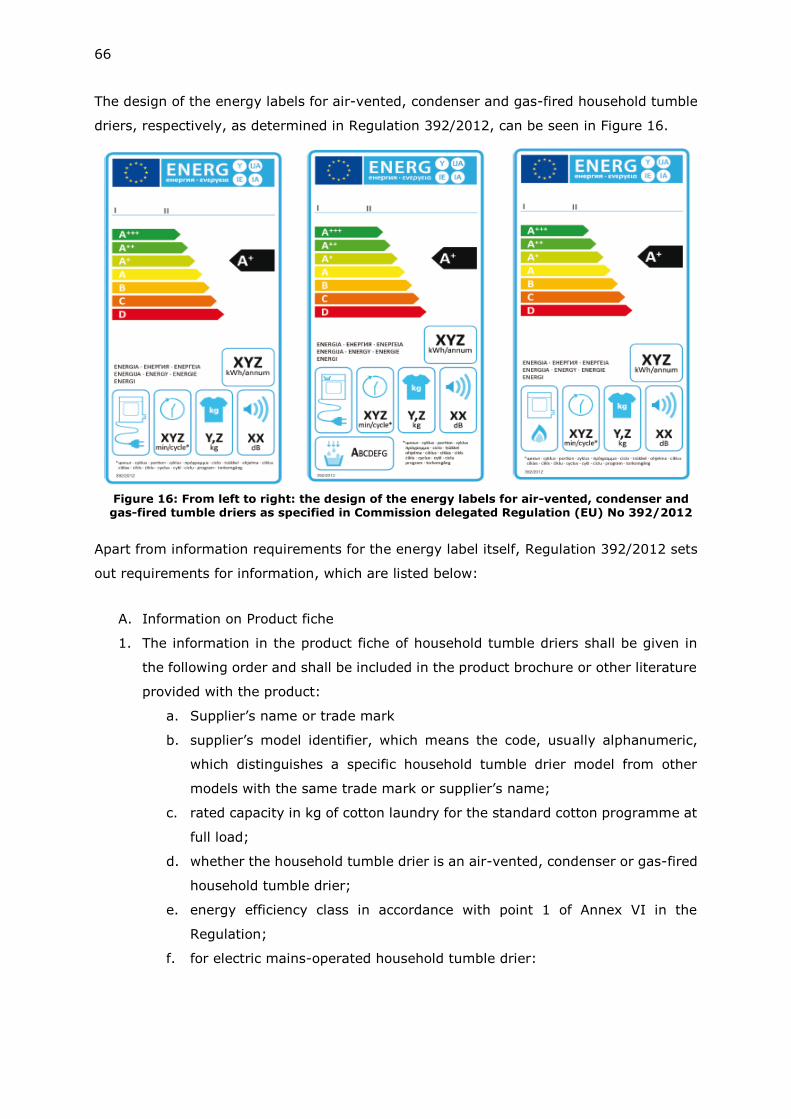
66
The design of the energy labels for air-vented, condenser and gas-fired household tumble
driers, respectively, as determined in Regulation 392/2012, can be seen in Figure 16.
Apart from information requirements for the energy label itself, Regulation 392/2012 sets
out requirements for information, which are listed below:
A. Information on Product fiche
1. The information in the product fiche of household tumble driers shall be given in
the following order and shall be included in the product brochure or other literature
provided with the product:
a. Supplier’s name or trade mark
b. supplier’s model identifier, which means the code, usually alphanumeric,
which distinguishes a specific household tumble drier model from other
models with the same trade mark or supplier’s name;
c. rated capacity in kg of cotton laundry for the standard cotton programme at
full load;
d. whether the household tumble drier is an air-vented, condenser or gas-fired
household tumble drier;
e. energy efficiency class in accordance with point 1 of Annex VI in the
Regulation;
f. for electric mains-operated household tumble drier:
Figure 16: From left to right: the design of the energy labels for air-vented, condenser and gas-fired tumble driers as specified in Commission delegated Regulation (EU) No 392/2012
67
the weighted Annual Energy Consumption (AEc) rounded up to one decimal
place; it shall be described as: ‘Energy consumption “X” kWh per year, based
on 160 drying cycles of the standard cotton programme at full and partial
load, and the consumption of the low-power modes. Actual energy
consumption per cycle will depend on how the appliance is used.’;
for household gas-fired tumble drier: the weighted Annual Energy
Consumption (AEC(Gas)) rounded up to one decimal place; it shall be
described as: ‘Energy consumption “X” kWh-Gas per year, based on 160
drying cycles of the standard cotton programme at full and partial load.
Actual energy consumption per cycle will depend on how the appliance is
used’; and the weighted Annual Energy Consumption (AEC(Gas)el) rounded
up to one decimal place; it shall be described as: ‘Energy consumption “X”
kWh per year, based on 160 drying cycles of the standard cotton programme
at full and partial load, and the consumption of the low-power modes. Actual
energy consumption per cycle will depend on how the appliance is used.
g. whether the household tumble drier is an ‘automatic tumble drier’ or ‘non-
automatic tumble drier
h. where the household tumble drier has been awarded an ‘EU Ecolabel award’
under Regulation (EC) No 66/2010, this information may be included;
i. the energy consumption (Edry, Edry½, Egdry, Egdrya½, Egdry, a, Egdry½,
a) of the standard cotton programme at full and partial load;
j. the power consumption of the off-mode (Po) and of the left-on mode (Pl) for
the standard cotton programme at full load;
k. if the household tumble drier is equipped with a power management system,
the duration of the ‘left-on mode’;
l. indication that the ‘standard cotton programme’ used at full and partial load
is the standard drying programme to which the information in the label and
the fiche relates, that this programme is suitable for drying normal wet
cotton laundry and that it is the most efficient programme in terms of energy
consumption for cotton;
m. the weighted programme time (Tt) of the ‘standard cotton programme at
full and partial load’ in minutes and rounded to the nearest minute as well
as the programme time of the ‘standard cotton programme at full load’
(Tdry) and the programme time of the ‘standard cotton programme at partial
load’ (Tdry½) in minutes and rounded to the nearest minute;
68
n. if the household tumble drier is a condenser tumble drier, the condensation
efficiency class in accordance with point 2 of Annex VI, expressed as
‘condensation efficiency class ‘X’ on a scale from G (least efficient) to A (most
efficient)’; this may be expressed by other means provided it is clear that
the scale is from G (least efficient) to A (most efficient);
o. if the household tumble drier is a condenser tumble drier, the average
condensation efficiency Cdry and Cdry½ of the standard cotton programme
at full load and partial load and the weighted condensation efficiency (Ct)
for the ‘standard cotton programme at full and partial load’, as a percentage
and rounded to the nearest whole percent;
p. the sound power level (weighted average value — LWA) expressed in dB and
rounded to the nearest integer for the standard cotton programme at full
load;
q. if the household tumble drier is intended to be built-in, an indication to this
effect.
2) One product fiche may cover a number of household tumble drier models
supplied by the same supplier. The information contained in the fiche may be
given in the form of a copy of the label, either in colour or in black and white.
Where this is the case, the information listed in point 1 not already displayed on
the label shall also be provided.
B. Information to be provided in cases where end-users cannot be expected to see
the tumble drier displayed:
1. The information referred to in Article 4(b) shall be provided in the following order:
a. the rated capacity in kg of cotton, for the standard cotton programme at
full load;
b. whether the household tumble drier is an air-vented, condenser or gas-
fired household tumble drier;
c. the energy efficiency class as defined in point 1 of Annex VI;
d. for electric mains-operated household tumble drier:
the weighted Annual Energy Consumption (AEc) rounded up to the nearest
integer, to be described as: ‘Energy consumption “X” kWh per year, based
on 160 drying cycles of the standard cotton programmes at full and partial
load, and the consumption of the low-power modes. Actual energy
consumption per cycle will depend on how the appliance is used.’;
for household gas-fired tumble drier: the weighted Annual Energy
Consumption (AEC(Gas)) rounded up to one decimal place; it shall be
69
described as: ‘Energy consumption “X” kWh-Gas per year, based on 160
drying cycles of the standard cotton programme at full and partial load.
Actual energy consumption per cycle will depend on how the appliance is
used’; and the weighted Annual Energy Consumption (AEC(Gas)el)
rounded up to one decimal place; it shall be described as: ‘Energy
consumption “X” kWh per year, based on 160 drying cycles of the standard
cotton programme at full and partial load, and the consumption of the low-
power modes. Actual energy consumption per cycle will depend on how the
appliance is used’
e. whether the household tumble drier is an ‘automatic tumble drier’ or ‘non-
automatic tumble drier’
f. the energy consumption (Edry, Edry½, Egdry, Egdry½, Egdry, a, Egdry½,
a) of the standard cotton programme at full and partial load, rounded up to
two decimal places and calculated in accordance with Annex VII;
g. g) the power consumption of the off-mode (Po) and the left-on mode (Pl)
for the standard cotton programme at full load;
h. (h) the programme time of the ‘standard cotton programme at full load’
(Tdry) and the programme time of the ‘standard cotton programme at
partial load’ (Tdry½), in minutes and rounded to the nearest minute,
calculated in accordance with Annex VII;
i. (i) if the household tumble drier is a condenser tumble drier, the
condensation efficiency class in accordance with point 2 of Annex VI;
j. (j) the sound power level (weighted average value — LWA) for the
standard cotton programme at full load, expressed in dB and rounded to
the nearest integer; (k) if the household tumble drier is intended to be
built-in, an indication to this effect.
2. Where other information contained in the product fiche is also provided, it shall be
in the form and order specified in Annex II.
3. The size and font in which all the information referred in this Annex is printed or
shown shall be legible.
Commission Delegated Regulation (EU) No 2017/25455 with regard to the use of
tolerances in verification procedures, replaces Annex V of Regulation 392/2012. The new
Annex V specifies, that the tolerance-levels determined for the purpose of verification of
compliance, are only allowed to be used by market surveillance authorities in the context
of reading measurement results, rather than by producers or suppliers for the purpose of
55 http://eur-lex.europa.eu/legal-content/EN/TXT/PDF/?uri=CELEX:32017R0254&from=EN
70
establishing values for the technical documentation or in interpreting these values with a
view to achieving compliance.
Commission Regulation (EU) No 518/201456 with regard to labelling of energy-related
products on the internet, adds a number of information requirements to Regulation
392/2012 regarding an electronic label and an electronic product fiche in cases where
tumble driers are offered for sale on the internet. These include changes to Article 3 where
following points are added:
• An electronic label an electronic label in the format and containing the information
set out in Annex I of Regulation No 392/2012 is made available to dealers for each
household tumble drier model placed on the market from 1 January 2015 with a
new model identifier. It may also be made available to dealers for other household
tumble drier models
• An electronic product fiche as set out in Annex II of Regulation No 392/2012 is
made available to dealers for each household tumble drier model placed on the
market from 1 January 2015 with a new model identifier. It may also be made
available to dealers for other household tumble drier models
Article 4, point (b) of Regulation No 392/2012 is replaced by
• Household tumble driers offered for sale, hire or hire-purchase where the end-user
cannot be expected to see the product displayed, as specified in Article 7 of Directive
2010/30/EU, are marketed with the information provided by suppliers in accordance
with Annex IV to this Regulation. Where the offer is made through the internet and
an electronic label and an electronic product fiche have been made available in
accordance with Article 3(f) and 3(g) the provisions of Annex VIII shall apply
instead.
Annex VIII is added with information to be provided in the case of sale, hire or hire-
purchase through the internet.
On May 9th, 2012, a Corrigendum to Commission Delegated Regulation (EU) No
392/201257 has been published. The corrigendum revises a number of dates indicated in
Regulation 392/2012, but makes no substantive changes in the Regulation otherwise.
56 http://eur-lex.europa.eu/legal-content/EN/TXT/PDF/?uri=CELEX:32014R0518&from=EN 57 http://eur-lex.europa.eu/legal-content/EN/TXT/PDF/?uri=CELEX:32012R0392R(01)&from=EN
71
1.2.3 EU Directive 2014/35/EU – Low Voltage Directive58
The new Low Voltage Directive (LVD) has come into force on the 20th of April 2016. The
LVD ensures that electrical equipment that operates within certain voltage limits, provides
a high level of protection. The LVD Directive covers all health and safety risks of electrical
equipment operating with a voltage of between 50 and 1000 volts for alternating current
and between 75 and 1500 volts for direct current. Consumer goods with a voltage below
50 for alternating current or 75 for direct current are covered by the General Product Safety
Directive (GPSD) (2001/95/EC).
Household appliances, hereunder tumble driers, fall under the scope of the LVD Directive.
1.2.4 EU Directive 2012/19/EU – The WEEE Directive59
The Waste Electrical and Electronic Equipment (WEEE) Directive implements the principle
of "extended producer responsibility” where producers of EEE are expected to take
responsibility for the environmental impact of their products at the end of life. As such, the
WEEE Directive aims to reduce environmental impacts through setting targets for the
separate collection, reuse, recovery, recycling and environmentally sound disposal of
WEEE.
As EEE, tumble driers fall under the scope of the WEEE Directive. Ecodesign requirements
for tumble driers could therefore be used to assist the WEEE Directive aims via the
introduction of product design requirements that enhance reuse, material recovery and
effective recycling.
1.2.5 EU Regulation 1907/2006/EC – REACH Regulation60
The Regulation on the Registration, Evaluation, Authorisation and Restriction of Chemicals
(REACH) addresses chemicals, and their safe use, and aims to improve the protection of
human health and the environment through a system of Registration, Evaluation,
Authorisation and Restriction of Chemicals. The REACH Regulation places greater
responsibility on industry to manage the risks from the chemicals they manufacture, import
and market in the EU. Companies are required to demonstrate how substances can be used
safely and risk management measures must be reported to users. The REACH Regulation
also establishes procedures for collecting and assessing information on the properties and
hazards of substances and requires that companies register their substances in a central
database. The entries in the database are then assessed to determine whether the risks of
the substances can be managed. The REACH Regulation allows for some chemicals to be
determined “substances of very high concern (SVHC)” due to their large potential negative
58 http://eur-lex.europa.eu/legal-content/EN/TXT/PDF/?uri=CELEX:32014L0035&from=EN 59 http://eur-lex.europa.eu/legal-content/EN/TXT/PDF/?uri=CELEX:32012L0019&from=DA 60 http://eur-lex.europa.eu/legal-content/EN/TXT/PDF/?uri=CELEX:02006R1907-20140410&from=EN
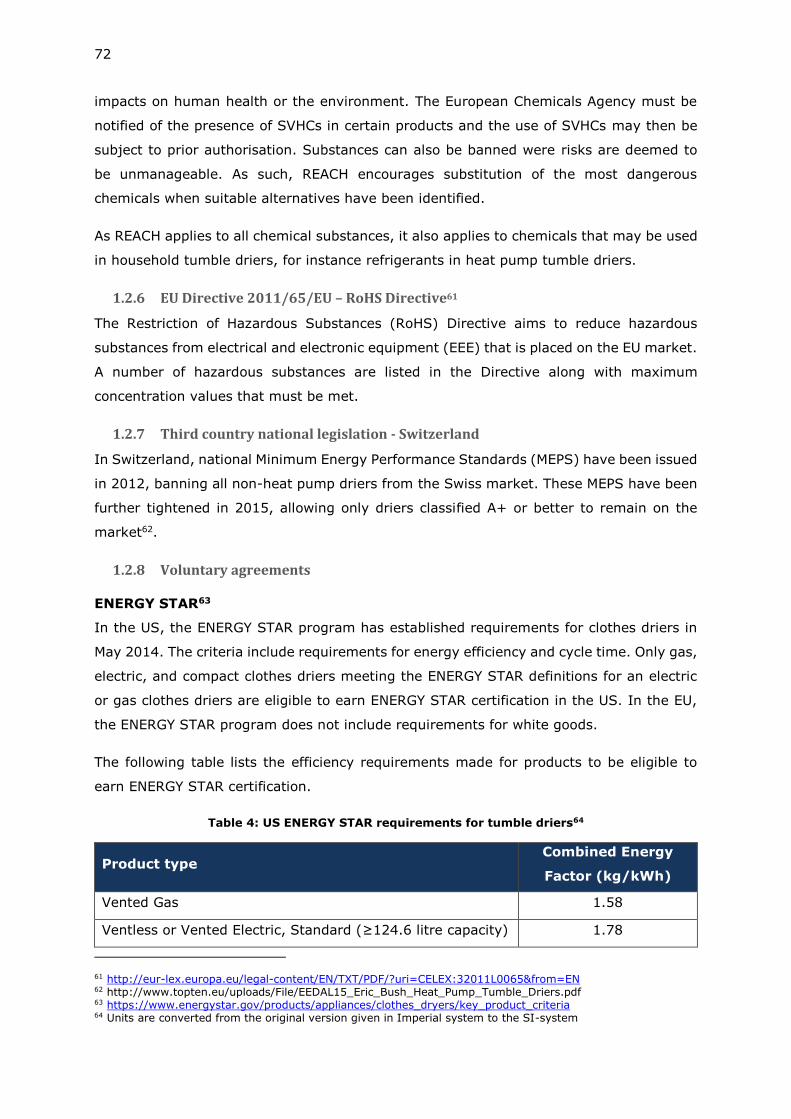
72
impacts on human health or the environment. The European Chemicals Agency must be
notified of the presence of SVHCs in certain products and the use of SVHCs may then be
subject to prior authorisation. Substances can also be banned were risks are deemed to
be unmanageable. As such, REACH encourages substitution of the most dangerous
chemicals when suitable alternatives have been identified.
As REACH applies to all chemical substances, it also applies to chemicals that may be used
in household tumble driers, for instance refrigerants in heat pump tumble driers.
1.2.6 EU Directive 2011/65/EU – RoHS Directive61
The Restriction of Hazardous Substances (RoHS) Directive aims to reduce hazardous
substances from electrical and electronic equipment (EEE) that is placed on the EU market.
A number of hazardous substances are listed in the Directive along with maximum
concentration values that must be met.
1.2.7 Third country national legislation - Switzerland
In Switzerland, national Minimum Energy Performance Standards (MEPS) have been issued
in 2012, banning all non-heat pump driers from the Swiss market. These MEPS have been
further tightened in 2015, allowing only driers classified A+ or better to remain on the
market62.
1.2.8 Voluntary agreements
ENERGY STAR63
In the US, the ENERGY STAR program has established requirements for clothes driers in
May 2014. The criteria include requirements for energy efficiency and cycle time. Only gas,
electric, and compact clothes driers meeting the ENERGY STAR definitions for an electric
or gas clothes driers are eligible to earn ENERGY STAR certification in the US. In the EU,
the ENERGY STAR program does not include requirements for white goods.
The following table lists the efficiency requirements made for products to be eligible to
earn ENERGY STAR certification.
Table 4: US ENERGY STAR requirements for tumble driers64
Product type Combined Energy
Factor (kg/kWh)
Vented Gas 1.58
Ventless or Vented Electric, Standard (≥124.6 litre capacity) 1.78
61 http://eur-lex.europa.eu/legal-content/EN/TXT/PDF/?uri=CELEX:32011L0065&from=EN 62 http://www.topten.eu/uploads/File/EEDAL15_Eric_Bush_Heat_Pump_Tumble_Driers.pdf 63 https://www.energystar.gov/products/appliances/clothes_dryers/key_product_criteria 64 Units are converted from the original version given in Imperial system to the SI-system
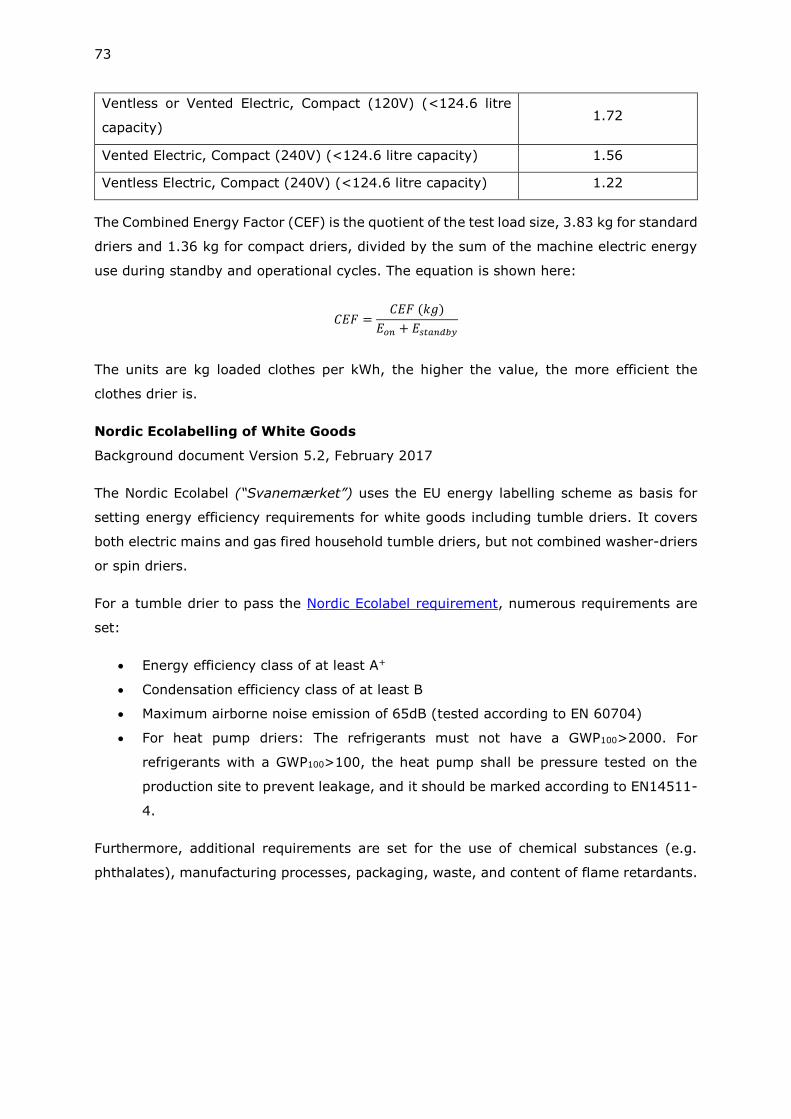
73
Ventless or Vented Electric, Compact (120V) (<124.6 litre
capacity) 1.72
Vented Electric, Compact (240V) (<124.6 litre capacity) 1.56
Ventless Electric, Compact (240V) (<124.6 litre capacity) 1.22
The Combined Energy Factor (CEF) is the quotient of the test load size, 3.83 kg for standard
driers and 1.36 kg for compact driers, divided by the sum of the machine electric energy
use during standby and operational cycles. The equation is shown here:
𝐶𝐸𝐹 =𝐶𝐸𝐹 (𝑘𝑔)
𝐸𝑜𝑛 + 𝐸𝑠𝑡𝑎𝑛𝑑𝑏𝑦
The units are kg loaded clothes per kWh, the higher the value, the more efficient the
clothes drier is.
Nordic Ecolabelling of White Goods
Background document Version 5.2, February 2017
The Nordic Ecolabel (“Svanemærket”) uses the EU energy labelling scheme as basis for
setting energy efficiency requirements for white goods including tumble driers. It covers
both electric mains and gas fired household tumble driers, but not combined washer-driers
or spin driers.
For a tumble drier to pass the Nordic Ecolabel requirement, numerous requirements are
set:
• Energy efficiency class of at least A+
• Condensation efficiency class of at least B
• Maximum airborne noise emission of 65dB (tested according to EN 60704)
• For heat pump driers: The refrigerants must not have a GWP100>2000. For
refrigerants with a GWP100>100, the heat pump shall be pressure tested on the
production site to prevent leakage, and it should be marked according to EN14511-
4.
Furthermore, additional requirements are set for the use of chemical substances (e.g.
phthalates), manufacturing processes, packaging, waste, and content of flame retardants.
74
1.2.9 Summary of relevant65 legislations and voluntary agreements
A summary of the relevant legislation and voluntary agreements to the revision of the
ecodesign and energy labelling Regulations is presented in Table 5.
Table 5: Summary of relevant legislations other than ecodesign and energy labelling Regulations of tumble driers and of relevant voluntary agreements
Relevant
for
Name Relevance to current
review study
Aim of
Regulation/Agreement
Applicab
le from
Specific relevant
requirements
Ecodesign
Commission
Regulation (EU)
No 2016/2282
Tolerances for
verification procedures
in ecodesign Regulation
Amend numerous
ecodesign Regulations
(incl. tumble driers) with
regard to the use of
verification tolerances.
2016 The verification procedure in
Annex III of Regulation
932/2012 is replaced by
procedure in Annex XIII of
Regulation 2016/2282
Commission
Regulation (EC)
No 640/2009
Ecodesign efficiency
requirements that may
be applicable for the
electric motors driving
the fans and the drum in
tumble driers
Set ecodesign
requirements for electric
motors (under revision,
incl. scope of the
requirements)
2009 Minimum efficiencies for electric
motors related to rated power
consumption
Commission
Regulation (EU)
No 1275/2008
(including four
amendments)
Ecodesign energy
requirements for off
mode and networked
standby as well as
power management
function
Set ecodesign
requirements for standby,
networked standby and
off modes including
power management
2013 Power consumption
requirements:
Off mode ≤0.5W and
Networked standby ≤3W
Equipment shall offer a power
management function switching
equipment after the shortest
period of time into off-mode
Energy
labelling
Commission
Delegated
Regulation (EU)
No 2017/254
Tolerances for
verification procedures
in energy labelling
Regulation
Amend numerous energy
labelling Regulations
(incl. tumble driers) with
regard to the use of
verification tolerances
2017 The verification procedure in
Annex V of Regulation
392/2012 is replaced by
procedure in Annex VI of
Regulation 2017/254
Commission
Regulation (EU)
No 518/2014
Availability of tumble
driers energy label and
fiche online
Amend numerous energy
labelling Regulations
(incl. tumble driers) with
regard to labelling on the
internet
2014 Articles 3 and 4 of Regulation
392/2012 are amended
according to article 6 of
Regulation 518/2014
EU Regulation
2017/1369
Setting a new
framework for energy
classes
Replace Energy labelling
Directive 2010/30/EU
2017 New rules for rescaling energy
classes
Voluntary
agreement
s
ENERGY STAR
for electric and
gas clothes
driers
Setting combined
energy factor
requirements (kg
load/kWh) requirements
for electric and gas-fired
vented and compact
driers
Set energy efficiency
requirements for these
drier types in the US
2014
Combined energy factor
requirements specific for
Vented Gas, Ventless Gas,
Vented Electric and Ventless
Electric both Standard and
Compact sizes typically used in
the US
65 Only those legislations having a direct impact to tumble driers have been reviewed, i.e. those which set requirements on products, services, materials and/or substances that are used in tumble driers. No Ecolabel nor Green Public Procurement criteria exist for tumble driers.
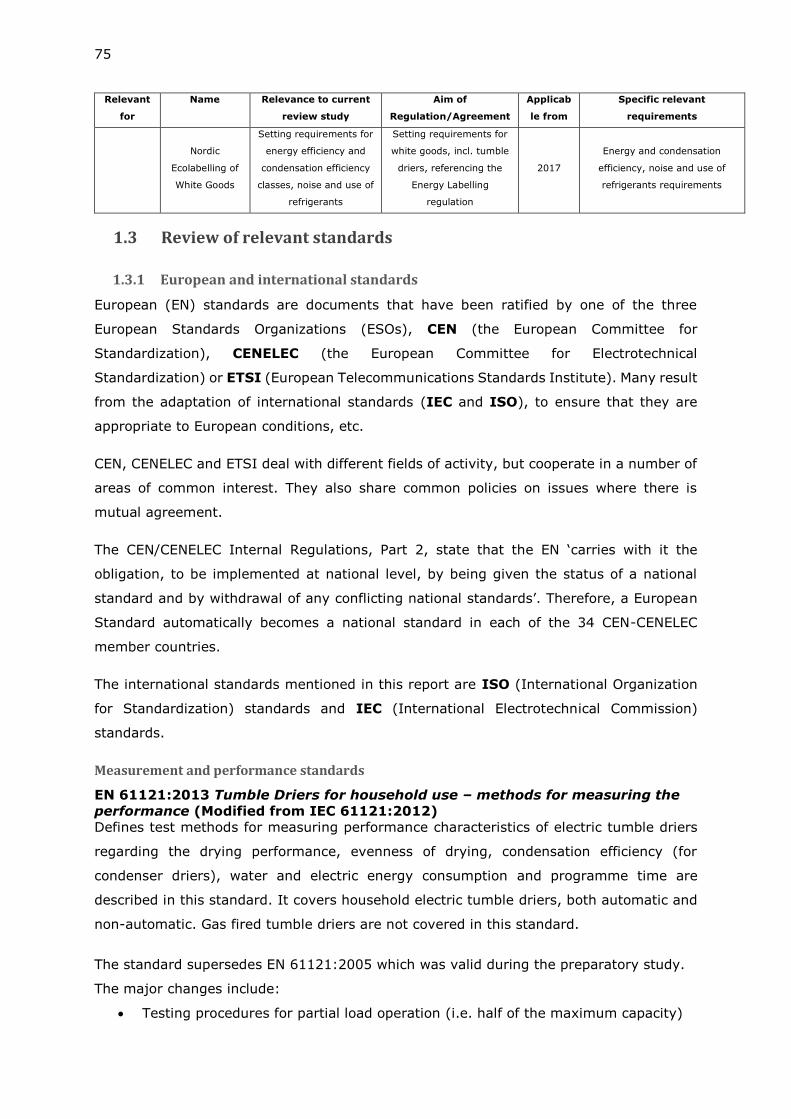
75
Relevant
for
Name Relevance to current
review study
Aim of
Regulation/Agreement
Applicab
le from
Specific relevant
requirements
Nordic
Ecolabelling of
White Goods
Setting requirements for
energy efficiency and
condensation efficiency
classes, noise and use of
refrigerants
Setting requirements for
white goods, incl. tumble
driers, referencing the
Energy Labelling
regulation
2017
Energy and condensation
efficiency, noise and use of
refrigerants requirements
1.3 Review of relevant standards
1.3.1 European and international standards
European (EN) standards are documents that have been ratified by one of the three
European Standards Organizations (ESOs), CEN (the European Committee for
Standardization), CENELEC (the European Committee for Electrotechnical
Standardization) or ETSI (European Telecommunications Standards Institute). Many result
from the adaptation of international standards (IEC and ISO), to ensure that they are
appropriate to European conditions, etc.
CEN, CENELEC and ETSI deal with different fields of activity, but cooperate in a number of
areas of common interest. They also share common policies on issues where there is
mutual agreement.
The CEN/CENELEC Internal Regulations, Part 2, state that the EN ‘carries with it the
obligation, to be implemented at national level, by being given the status of a national
standard and by withdrawal of any conflicting national standards’. Therefore, a European
Standard automatically becomes a national standard in each of the 34 CEN-CENELEC
member countries.
The international standards mentioned in this report are ISO (International Organization
for Standardization) standards and IEC (International Electrotechnical Commission)
standards.
Measurement and performance standards
EN 61121:2013 Tumble Driers for household use – methods for measuring the
performance (Modified from IEC 61121:2012)
Defines test methods for measuring performance characteristics of electric tumble driers
regarding the drying performance, evenness of drying, condensation efficiency (for
condenser driers), water and electric energy consumption and programme time are
described in this standard. It covers household electric tumble driers, both automatic and
non-automatic. Gas fired tumble driers are not covered in this standard.
The standard supersedes EN 61121:2005 which was valid during the preparatory study.
The major changes include:
• Testing procedures for partial load operation (i.e. half of the maximum capacity)
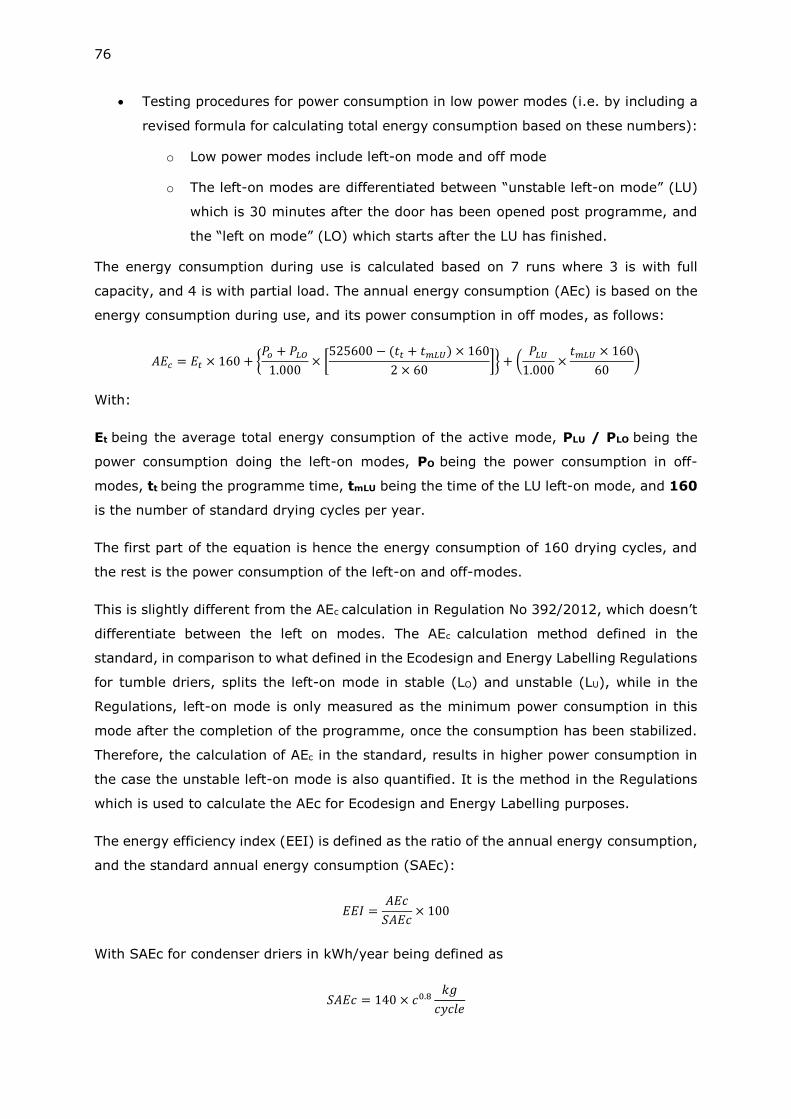
76
• Testing procedures for power consumption in low power modes (i.e. by including a
revised formula for calculating total energy consumption based on these numbers):
o Low power modes include left-on mode and off mode
o The left-on modes are differentiated between “unstable left-on mode” (LU)
which is 30 minutes after the door has been opened post programme, and
the “left on mode” (LO) which starts after the LU has finished.
The energy consumption during use is calculated based on 7 runs where 3 is with full
capacity, and 4 is with partial load. The annual energy consumption (AEc) is based on the
energy consumption during use, and its power consumption in off modes, as follows:
𝐴𝐸𝑐 = 𝐸𝑡 × 160 + {𝑃𝑜 + 𝑃𝐿𝑂
1.000× [
525600 − (𝑡𝑡 + 𝑡𝑚𝐿𝑈) × 160
2 × 60]} + (
𝑃𝐿𝑈
1.000×
𝑡𝑚𝐿𝑈 × 160
60)
With:
Et being the average total energy consumption of the active mode, PLU / PLO being the
power consumption doing the left-on modes, PO being the power consumption in off-
modes, tt being the programme time, tmLU being the time of the LU left-on mode, and 160
is the number of standard drying cycles per year.
The first part of the equation is hence the energy consumption of 160 drying cycles, and
the rest is the power consumption of the left-on and off-modes.
This is slightly different from the AEc calculation in Regulation No 392/2012, which doesn’t
differentiate between the left on modes. The AEc calculation method defined in the
standard, in comparison to what defined in the Ecodesign and Energy Labelling Regulations
for tumble driers, splits the left-on mode in stable (LO) and unstable (LU), while in the
Regulations, left-on mode is only measured as the minimum power consumption in this
mode after the completion of the programme, once the consumption has been stabilized.
Therefore, the calculation of AEc in the standard, results in higher power consumption in
the case the unstable left-on mode is also quantified. It is the method in the Regulations
which is used to calculate the AEc for Ecodesign and Energy Labelling purposes.
The energy efficiency index (EEI) is defined as the ratio of the annual energy consumption,
and the standard annual energy consumption (SAEc):
𝐸𝐸𝐼 =𝐴𝐸𝑐
𝑆𝐴𝐸𝑐× 100
With SAEc for condenser driers in kWh/year being defined as
𝑆𝐴𝐸𝑐 = 140 × 𝑐0.8𝑘𝑔
𝑐𝑦𝑐𝑙𝑒
77
With c being the rated capacity for the cotton drying program. 140 is an arbitrary scaling
factor, and the exponent “0.8” is to correct the non-linear relationship between total energy
consumption and drying load.
For vented driers, a correction factor for the lost energy in the vented air, is added as
𝑆𝐴𝐸𝑐 = 140 × 𝑐0.8 − 30 ×𝑡𝑡
60
With tt being the cycle time in minutes.
The testing sequence EN 61121:2013 is based on that one given in the standard IEC
61121:2012 but modified with respect to reflecting the requirements of the European
regulations 392/2012 on energy labelling of household tumble driers and 932/2012 on
ecodesign requirements of household tumble driers.
The testing sequence according IEC 61121:2012 is generally very thorough, and the overall
procedure is to run a drying sequence until 5 valid runs are achieved. The mean value of
these runs is then used as the final figure. The validity of the sequence is based on the
final moisture content in laundry. The laundry used is cotton with 60% initial humidity or
synthetics with 50% initial moisture, and the final moisture level is either 0% (cupboard
dry), 12% (iron ready), or 2% (Synthetic/blends textiles). The programme used is
determined before the test series. The selected programme is used for all 5 testing runs.
The modifications of EN61121:2013 in comparison to IEC 61121:2012 are as follows:
The program defined for the energy label testing procedure is selected to cotton cupboard
dry, a program that must be able to dry a standard cotton load from an initial moisture
content of 60% to a final moisture content of 0%. This program is used with the treatments
‘full’, which is run 3 times with rated cotton capacity, and the treatment ‘half’, which is run
4 times with half the rated cotton capacity. In addition, the power consumption is measured
in the ‘left-on-mode’ as well as in the ‘off-mode’.
There are no restraints on time consumption or the amount of wear on the laundry during
the drying cycle.
One major item to note, is the water quality used for wetting the laundry. Automatic tumble
driers, which are units that stop after a certain amount of moisture content in the load is
reached, are very dependent on the water quality used for testing. This is because the
sensors used to measure the moisture content in the laundry are dependent on the
conductivity of the fabric, which can be influenced by the water hardness, alkalinity, and
pH level. The water is treated according to IEC 60734:2012, which makes sure that the
water used in all household appliances are of equal standard, but it may not reflect the
78
everyday user setup. If the automatic tumble driers are used where water properties differ
by a large extent from the reference values, the driers may not be able to stop drying even
though the desired moisture content is reached. This can lead to increased energy
consumption or undesired drying results. In this way the reported values on the energy
label might differ when used with water having properties varying from these values.
Recent developments of standardisation work by TC59X/SWG1.9 on EN
61121:2013
The ongoing standardisation work proposes numerous changes to the standard with
varying extend. The major changes proposed by the working group as of November 2017
includes:
• A need for a more precise verification procedure than given in the Regulation.
• Definition of “combined test series” to be added.
• A revised calculation method for condensation efficiency
o Currently measurement overrepresents partial load, and underrepresents
full loads → From weighted average, to a summation of whole test series.
EN 1458-2:2012 Domestic gas fired tumble driers of types B22D and B23D, of
nominal heat input not exceeding 6 kW – Part 2: rational use of energy
Part 2 of this standard specifies the requirements and test methods for rational use of
energy for domestic gas fired tumble driers of types B22D and B23D of nominal heat
input not exceeding 6 kW.
The tumble drier shall have a gas energy consumption not exceeding 1.11 kWh/kg of
standard load.
The electrical energy consumption is measured in accordance with EN 61121. The gas
energy consumption 𝐸𝑔 is determined in kWh as
𝐸𝑔 = 0.278𝑉𝑐 × 𝐻𝑠
With 𝑉𝑐 being the volume of dry gas consumed, and 𝐻𝑠 being the gross calorific value of
the dry gas under reference conditions (15°C and 1013.25 mbar). The volume of gas is
measured with a gas meter.
In Regulation No 392/2012, this energy consumption is then divided by a factor of 2.5 (in
order to convert between the value of primary and electric energy) and added the
auxiliary electric consumption, in order to give the weighted energy consumption 𝐸𝑡, used
in the calculation of the EEI.
EN 60704-2-6:2012 (IEC 60704-2-6:2012) Household and similar electrical
appliances – Test code for the determination of airborne acoustical noise – Part
2-6: Particular requirements for tumble driers
79
Defines methods of determination of airborne acoustical noise. Part 1 states general
requirements, Part 2-6 specifies particular requirements for tumble driers, Part 3 defines
the procedure for determining and verifying declared noise emission values. This
harmonised standard constitutes the method for measuring sound power level in
Regulation 392/201266.
EN 50564:2011 (IEC 62301-1:2011) Electrical and electronic household and
office equipment. Measurement of low power consumption
Defines methods for measuring the electrical power consumption in standby mode.
Applicable to mains powered electrical household appliances and to the mains powered
parts of appliances that use other fuels such as gas or oil.
Safety standards
EN 1458-1: 2012 Domestic gas fired tumble driers of types B22D and B23D, of
nominal heat input not exceeding 6 kW
Part 1 of this standard specifies safety requirements for domestic gas fired tumble driers
of types B22D and B23D of nominal heat input not exceeding 6 kW.
EN 60335-1:2012+A11:2014 (IEC 60335-1:2010+A1:2013+A2:2016) Household
and similar electrical appliances – Safety.
Part 1 of this standard states general safety requirements. Parts 2-11 specify requirements
for tumble driers intended for household and similar purposes. Parts 2-43 deal with the
safety of electric clothes driers for drying textiles on racks located in a warm airflow and
to electric towel rails, for household and similar purposes, with rated voltage not exceeding
250V. Parts 2-102 specify requirements for gas, oil and solid-fuel burning appliances
having electrical connections.
Substances, materials and end-of-life standards
ISO 11469:2016 Plastics - Generic identification and marking of plastics products
Specifies a system of uniform plastic material marking. The standard does not cover every
aspect of marking (e.g. the marking process, the minimum size of the item to be marked,
the size of the lettering or the appropriate location of the marking), but the marking system
described is intended to help identify plastics products for subsequent decisions concerning
handling, waste recovery or disposal. The standard refers to ISO 1043-1 for generic
identification of the plastics.
EN ISO 1043-2:2011 Plastics - Symbols and abbreviated terms. Fillers and
reinforcing materials
66 http://eur-lex.europa.eu/legal-content/EN/TXT/PDF/?uri=CELEX:52014XC0516(03)&from=EN
80
Defines abbreviated terms for the basic polymers used in plastics, symbols for components
of these terms, and symbols for special characteristics of plastics.
IEC TR 62635:2012 Guidelines for end-of-life information provided by
manufacturers and recyclers and for recyclability rate calculation of electrical and
electronic equipment
IEC/TR 62635:2012(E) provides a methodology for information exchange involving
electronic and electrical equipment manufacturers and recyclers. The standard also
provides a methodology enabling calculation of the recyclability and recoverability rates of
to facilitate optimized end of life treatment operations.
EN 50419:2006 Marking of electrical and electronic equipment in accordance with
Article 11(2) of Directive 2002/96/EC (WEEE)
Product marking requirements needed to ensure compliance with the WEEE Directive and
additional information relating to the marking requirements, including positioning,
visibility, dimensions, location and referenced documents. The marking requirements are
applicable to all manufacturers and producers of electrical and electronic equipment placing
products on the EU market.
EN 50625-1:2014 Collection, logistics & treatment requirements for WEEE - Part
1: General treatment requirements
Part of a series of standards requested in Commission Mandate M/518 which aim to support
implementation and effectiveness of Directive 2012/19/EU (WEEE). The standard contains
requirements applicable to the treatment of all types of WEEE and addresses all operators
involved in the treatment (including related handling, sorting, and storage) of WEEE. In
particular, the standard addresses the following issue areas:
• Management principles
o Technical and infrastructural pre-conditions
o Training
o Monitoring
o Shipments
• Technical requirements
o General
o Receiving of WEEE at treatment facility
o Handling of WEEE
o Storage of WEEE prior to treatment
o De-pollution (including Annex A normative requirements)
o De-pollution monitoring (including Annex B normative requirements)
o Treatment of non-depolluted WEEE and fractions
81
o Storage of fractions
o Recycling and recovery targets (including Annex C & D normative
requirements)
o Recovery and disposal of fractions
• Documentation
The standard applies to the treatment of WEEE until end-of-waste status is fulfilled, or until
the WEEE is prepared for re-use, recycled, recovered, or final disposal.
EN 62321 series Determination of certain substances in electrotechnical products
The purpose of the harmonized EN 62321/IEC 62321 series of standards is to provide test
methods that will allow determination of the levels of certain substances of concern in
electrotechnical products on a consistent global basis.
EN 50581:2012 Technical documentation for the evaluation of electrical and
electronic products with respect to restriction of hazardous substances
The EN 50581 standard specifies the technical documentation a producer of EEE has to
collect for applicable substance restrictions in order to demonstrate compliance with
Directive 2011/65/EU (RoHS). The technical documentation required to meet the standard
includes:
• A general product description
• Documentation of materials, parts and/or sub-assemblies
• Information showing the relationship between the technical documents and respective
materials, parts and/or sub-assemblies
• A list of harmonized standards and/or technical specifications used to prepare the
technical documents.
Other standards
EN 61000 (IEC 61000) Electro Magnetic Compatibility (EMC) standards
Deals with different aspects regarding electro-magnetic compatibility and sets the basis for
the European EMC legislation. Part 1 states general considerations, part 2 describes and
classifies the environment and specifies compatibility levels, part 3 specifies emission and
immunity limits, part 4 defines testing and measurement techniques, part 5 defines
installation and mitigation guidelines and part 6 defines generic standards.
EN 62233:2008 Measurement methods for electromagnetic fields of household
appliances and similar apparatus with regard to human exposure
Seeks to limit the electro-magnetic fields (EMF) produced by electrical household
appliances in order to protect human beings.
82
IEC 62430:2009 Environmentally conscious design (ECD) for electrical and
electronic products and systems
Specifies requirements and procedures to specify generic procedures to integrate
environmental aspects into design and development processes of electrical and electronic
products including combination of products, and the materials and components of which
they are composed.
1.3.2 Mandates issued by the EC to the European Standardization Organizations
M/495 - Standardisation mandate to CEN, CENELEC and ETSI under Directive
2009/125/EC relating to harmonised standards in the field of Ecodesign
Mandate/495 is of generic and horizontal nature. The objective of the mandate is to provide
European standards to enable the implementation of the Ecodesign Directive 2009/125/EC
and its implementing measures. When Energy labelling requirements are introduced
together with Ecodesign requirements, the mandate also aims at providing European
standards to enable the implementation of the Energy Labelling Directive 2010/30/EU and
its supplementing measures.
Standardisation needs for relevant products are included in annex B to the mandate. Annex
B is updated regularly, when the ecodesign work progress on a product group allows the
Commission to precisely specify the standardisation needs.
For the time being there is no standardisation requests under Mandate M/495 for tumble
driers and no needs are foreseen to arise from the ongoing revision of the ecodesign and
energy labelling regulations for household tumble driers.
M/544 – Standardisation mandate to the European standardisation organisations
as regards ecodesign requirements for networked standby in support of
Regulation (EC) No 1275/2008 and Regulation (EC) No 642/2009
This mandate allows the introduction of network standby in a future revision of the
standard EN50564:2011 – Electrical and electronic household and office equipment -
Measurement of low power consumption.
If networked standby is to be taken into account then tumble driers fit the definition of
edge equipment in the draft version prEN 50643, which is: “networked equipment that can
be connected to a network and interact with that network or other equipment and that
does not have, as its primary function, the passing of network traffic to provide a network.”
83
Regarding networked standby there are some useful definitions in Regulation (EC) No
1275/200867:
Network means a communication infrastructure with a topology of links, an architecture,
including the physical components, organisational principles, communication procedures
and formats (protocols).
Networked equipment means equipment that can connect to a network and has one or
more network ports.
Networked standby means a condition in which the equipment is able to resume a
function by way of a remotely initiated trigger from a network connection.
M/543 – Material Efficiency
In December 2015, the EC published a standardisation request to the ESOs covering
ecodesign requirements on material efficiency aspects for energy-related products in
support of the implementation of Directive 2009/125/EC.68 It was noted in the mandate,
that the absence of adequate metrics is one of the reasons for the relative lack of ecodesign
requirements related to material efficiency in previous ecodesign implementing measures.
The mandate therefore requests that the ESOs draft new European standards and
European standardisation deliverables on material efficiency aspects for energy-related
products in support of the ecodesign Directive 2009/125/EC. This standardisation request
clarifies that the following material efficiency aspects should be covered:
• Extending product lifetime.
• Ability to re-use components or recycle materials from products at end-of-life.
• Use of re-used components and/or recycled materials in products
Several prEN standards have been developed in light of this mandate. They are described
in section 1.4.
1.3.3 Summary of relevant standards
A summary of the relevant standards to the reviewed ecodesign and energy labelling
Regulations is presented in Table 6.
67 http://eur-lex.europa.eu/legal-content/EN/TXT/PDF/?uri=CELEX:02008R1275-20170109&from=EN 68 http://ec.europa.eu/growth/tools-databases/mandates/index.cfm?fuseaction=search.detail&id=564
84
Table 6: Summary of relevant standards for ecodesign and energy labelling Regulations
Name
Relevance to
current review
study
Aim of standard Valid from Replacing /
Expanding standard
EN 61121:2013 Yes Methods for measuring the
performance of electric mains TDs 2013
Supersedes EN
61121:2005
EN 1458-2:2012 Yes Methods for measuring
performance for gas-fired TDs 2012
Supersedes EN 1458-
2:2001
EN 60704-2-6:2012
(IEC 60704-2-6:2012) Yes
Methods for determining airborne
acoustical noises for TDs 2012 No
EN 50564:2011 (IEC
62301-1:2011) Yes
Methods for measuring energy
consumption in standby modes
(Both electric and gas fired)
2011 No
EN 1458-1: 2012 Yes Safety requirements for gas fired
tumble driers 2012 No
EN 60335-
1:2012+A11:2014
(IEC 60335-
1:2010+A1:2013+A2:
2016)
No General safety requirements for
electric connections in appliances. 2012 /2014 No
ISO 11469:2016 No General identification and marking
of plastic products 2016 No
EN ISO 1043-2:2011 No
Defines abbreviated terms and
symbols for basic polymers used in
components
2011 No
IEC TR 62635:2012 Yes
Guidelines for end-of-life
information provided by
manufacturer/recyclers.
2012 No
EN 50419:2006 No Marking of electrical and electronic
equipment 2006 No
EN 50625-1:2014 Yes Implementation and effectiveness
of WEEE 2014 No
EN 62321 No
Test methods for determining
levels of certain substances in
electrotechnical products
No
EN 50581:2012 No
Evaluation of electrical and
electronic products regarding
hazardous substances.
2012 No
EN 61000 (IEC
61000) No
Electromagnetic compatibility
standards No
EN 62233:2008 No Measurement methods for EMF
produced by household appliances 2008 No
IEC 62430:2009 No ECD for electrical systems 2009 No
1.4 Review of relevant legislation, standards and voluntary agreements on
resource efficiency Within the past 10 years the awareness of resource depletion has increased, and the ideas
of circular economy have been widely accepted as a solution that can improve the resource
efficiency. The European Commission published in 2015 a circular economy package that
85
included an action plan to promote circular economy69. The areas of actions that are most
relevant in connection with ecodesign is the general measures on product design.
Product design is key to facilitating recycling, repair and refurbishment, but also more
durable products. All measures hold the potential to reduce the consumption of virgin
materials (including critical raw materials) and reduce the environmental burden of
products.
To reach better design of products the Commission will:
• “Support reparability, durability, and recyclability of products in product
requirements under the Ecodesign Directive, taking into account specific
requirements of different products. The Ecodesign working plan 2015–2017 will
identify product groups that will be examined to propose possible eco-design and/or
energy labelling requirements. It will set out how ecodesign can contribute to the
objectives of the circular economy. As a first step, the Commission will propose
requirements for electronic displays, including requirements related to material
efficiency.”
• “Propose the differentiation of financial contributions paid by producers under the
Extended Producer Responsibility scheme on the basis of the end-of-life
management costs of their products. This provision under the revised legislative
proposal on waste creates economic incentives for the design of products that can
be more easily recycled or reused.”
• “Examine options and actions for a more coherent policy framework for the different
strands of work on EU product policy in their contribution to the circular economy.”
The Ecodesign Working Plan 2016-2019 70 contributes to the Commissions Circular
Economy agenda. The Working plan states that Ecodesign should make a much more
significant contribution to the circular economy, and that the Commission in Regulations
due for review in the Working Plan period will examine how aspects relevant to circular
economy, such as resource efficiency, reparability, recyclability and durability can be taken
into account in revised measures. Subsequently the above-mentioned aspects are analysed
in all new review studies including for household tumble driers.
The possibilities for establishing requirements supporting the circular economy are also
explored in preparatory studies for new product groups.
69 https://ec.europa.eu/growth/industry/sustainability/circular-economy_en 70 Ecodesign Working Plan 2016-2019. COM(2016 773 final
86
Besides the circular economy work package there is also a number of relevant legislations,
standards and voluntary agreements on resource efficiency, which are briefly described
below.
M/543 – Material Efficiency
• Resulting from the standardisation mandate M/543 on Material efficiency, several
prEN standards have been developed. They are explained in next sections.
prEN 45558
This European Standard is currently under development. The aim of the standard is to
develop a method so information on critical raw materials can be exchanged up and
down in the supply chain of energy related products. Though, it does not provide any
specific method to capture this information. How organisations will capture the data is
individually which allow more flexibility.
The standard e.g. allows organisations to
• to assess the use of critical raw materials in energy related products
• to support collection and recycling processes, so the critical raw materials can be
extracted End-of-Life
• to use information on critical raw materials in life-cycle management
Furthermore, this standard can support policy makers regarding policy around the import
of critical raw materials. It can also prove to be valuable in connection with Ecodesign
studies as more information about the materials are available. This can lead to more
precise estimations of both the value and impact of critical raw materials in energy
related products, but also measures that can improve the recycling of critical raw
materials.
prEN 45553
This European Standard is currently under development and deals with the assessment
regarding the ability to remanufacture energy related products. The aim is to ensure a
general method for assessing the ability to remanufacture energy related products. The
aspects considered are among others:
• Assessment of accessibility (Including a formula that can evaluate the
accessibility)
• Assessment of the ability to re-/disassemble (Including disassembly sequence,
disassembly index, time for disassembly and different formulas)
This standard may allow requirements regarding disassembly in ecodesign as this
standard creates a common framework for documenting the disassembly. Without any
standard it is difficult for the market surveillance authorities to control such measures.
prEN 45556
87
This European Standard is currently under development. The aim is to ensure a general
method for assessing the proportion of reused components in energy related products.
The aspects considered are among others:
• Calculation of reused component index
• Quality assurance (maintain records of previous quality control)
• Marking and Instructions (e.g. ensure traceability of the reused component)
prEN 45557
This European Standard is currently under development. The aim is to ensure a general
method for assessing the proportion of recycled material content in energy related
products. This standard relates to the physical characteristic of the materials and
manufacturing history of all the parts in the product. The standard includes:
• Methods for calculating the recycled material content
• Specific guidelines per material type
• Traceability
• Reporting
Guidelines for accounting and reporting recycled content will contribute to avoid potentially
unsubstantiated and misleading claims on recycled content for which it is not clear how
they are determined. This standard enables requirements of recycled content in products
as these claims can be controlled by market surveillance authorities
prEN 45554
This European Standard is currently under development and deals with methods for
assessing the recyclability and recoverability of energy-related products. This standard
suggests a horizontal approach for all energy related products. However, the standard
also states that a correct assessment can only be done in a product-specific way, taking
into account specific parameters of a specific product group. This standard defines a
series of parameters which may be considered to calculate product specific recycling and
recoverability rates.
The standard provides a general methodology for:
• Assessing the recyclability of energy related products
• Assessing the recoverability of energy related products
• Assessing the ability to access or remove certain components of interest to
facilitate better recycling and recovery operations.
• Assessing the recyclability of critical raw materials from energy related
prEN 45555
This European Standard is currently under development and deals with methods for the
assessment of the ability to repair, reuse and upgrade energy related products. This
88
standard suggests a horizontal approach for all energy related products. The standard is
described as generic and general in nature which means that it is not intended to be
applied directly but may be cited in relation with product specific or product group
harmonised standards.
The standard provides a general methodology for:
• the ability to repair products
• the ability to reuse products, or parts thereof,
• the ability to upgrade products, excluding remanufacturing.
Furthermore, this standard provides a common framework for future vertical/product
specific standards.
prEN 50614
This European Standard is currently under development (within the standardisation
mandate M/518). The purpose of the standard is to facilitate the preparation for re-use of
equipment and support the WEEE Directive. The standards include measures on how to
check, clean or perform repair recovery operations, so components of discarded products
(waste) are prepared so they can be reused without any other pre-processing. The
standard also provides relevant description of quality, safety and environmental
requirements that a reuse operator should adopt to ensure safe products for the consumer
and also to protect the brand of the product (avoid faulty and dangerous remanufactured
products) as consumers still may connect a remanufactured product with the brand of the
appliances which not necessarily is the case.
Standard BS 8887-211
This standard focus on design for manufacture, assembly, disassembly
and end-of-life processing (MADE) of computing hardware. So, this standard is not related
to household appliances but some of the requirements could be used across all electronic
products. The standard describes the different types of products that potentially could re-
enter the production. Examples of products that can re-enters the production are:
• Non-working products (out-of-the-box)
• Products that needs repair within the warranty period (returned to the OEM)
• Unsold products (factory overstock, demonstration models, “try before buy – offer”
• Return of used products (e.g. lease or “trade-in-offers” – relevant in connection
with circular economy)
Standard VDI 2343
This standard is providing a common framework for the different definitions on reuse which
is crucial to reach a common understanding on the different definitions. Definitions are also
crucial in connection with interpretation of Regulation and without any clear definitions any
89
requirements towards reuse/remanufacturing/refurbishment will be invalidated. In
general, refurbishment is not clearly defined in most EU Regulation (e.g. fully
refurbishment is defined in the Regulation on medical devices71). The standard defines
different levels of reuse such as:
• Repair – restores defective product
• Refurbishing – restores used product to a certain quality
• Remanufacturing – restores used product to ‘as good as new’ through new and
reconditioned components and parts;
• Upgrading – improving the functions/properties of the original product
Definitions are very important in connection with the liability of the product. At which level
of repair/reuse is the original manufacturer (brand on the appliance) responsible for the
product.
Standard ONR 192102
Standard ONR 192102 is an Austrian standard that establishes a label for electronic
products designed for easy repair.
The standard/label established both obligatory requirements that should be followed by
anyone claiming the label, but also a set of voluntary requirements. If the also follow the
voluntary criteria they are awarded with a score. The score is dependent on the number of
criteria the product complies with and an overall reparability score is awarded which are
either ‘good’, ‘very good’ or ‘excellent’.
• Examples of the requirements and criteria are:
• Information relevant for disassembly (e.g. instructions, break down plan)
• Requirements on information for repair (e.g. instructions and exploded views)
• Easiness of disassemble (e.g. possibility of breaking down the product and
accessibility to inner parts (cable lengths, space for mounting, welding, screw
orientation and size, scale of design)
71 http://eur-lex.europa.eu/legal-content/EN/TXT/PDF/?uri=OJ:L:2017:117:FULL&from=EN

90
Such standards and labels are very important for both manufacturer designing products
for the circular economy, but also regarding requirements. European standard can be
developed in line with ONR 192102, which makes any requirements towards
improvement resource efficiency (design for easy disassemble etc.) more robust and
makes it possible for the market surveillance authorities to control such requirements.
2. Market and stock
2.1 Sales
The MEErP recommends using Eurostat data on production (PRODCOM) and calculate the
EU sales and trade as “EU Production + EU import – EU export”. However, experience from
other studies and also the MEErP guidance document itself, finds the PRODCOM data not
very reliable for the analysis of individual products. This also applies to tumble driers,
especially for the NACE rev. 2.0, since the PRODCOM categories have a broader scope than
the Regulations and the data therefore cannot be used directly to represent the market of
products in scope of the Regulations or the study. As the PRODCOM data is still the official
source for EU policies, the sales and trade data were collected from the database and
shown in this task, but the GfK data will be used for all further calculations and analyses.
The sales volumes of tumble driers within the EU is therefore based on purchased market
data from the large international market research institute GfK, who provided point of sales
tracking data on tumble driers for 21 countries (see Annex I). The sales and trade data for
tumble driers was not available for seven of the EU-28 countries (Czech Republic, Romania,
Slovenia, Slovakia, Bulgaria, Cyprus and Malta), representing a total of 9% of the EU
population and 3.6% of the gross domestic product (GDP)72. Based on the population of
these countries and GfKs coverage of each country (see Annex I), an overall EU market
coverage of the GfK tumble drier data has been calculated resulting in 78.8%.
The GfK data were scaled to 100% for each of the 21 countries covered by GfK’s data
collection programme. To achieve a representation of 100% of the EU market, GfK’s data
were scaled up to cover the total EU market.
GfK collects point-of-sales data on different types of tumble driers, very much in line with
the definitions in the Regulation. Data is available on each product type specifically,
including data on all label parameters and nominal annual energy consumption for each
product type. This level of detail is much higher than the data available from PRODCOM,
and therefore only the overall sales are compared between GfK data and PRODCOM data
in Table 7.
72 https://europa.eu/european-union/about-eu/countries_en
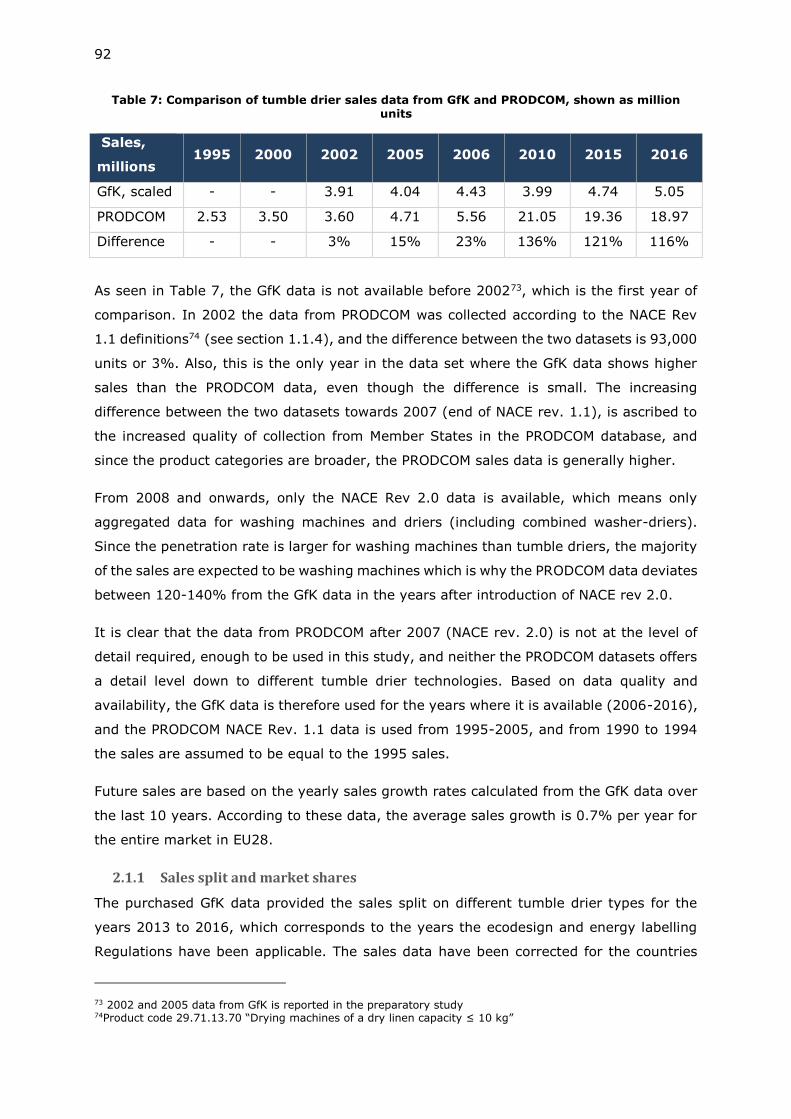
92
Table 7: Comparison of tumble drier sales data from GfK and PRODCOM, shown as million units
Sales,
millions 1995 2000 2002 2005 2006 2010 2015 2016
GfK, scaled - - 3.91 4.04 4.43 3.99 4.74 5.05
PRODCOM 2.53 3.50 3.60 4.71 5.56 21.05 19.36 18.97
Difference - - 3% 15% 23% 136% 121% 116%
As seen in Table 7, the GfK data is not available before 200273, which is the first year of
comparison. In 2002 the data from PRODCOM was collected according to the NACE Rev
1.1 definitions74 (see section 1.1.4), and the difference between the two datasets is 93,000
units or 3%. Also, this is the only year in the data set where the GfK data shows higher
sales than the PRODCOM data, even though the difference is small. The increasing
difference between the two datasets towards 2007 (end of NACE rev. 1.1), is ascribed to
the increased quality of collection from Member States in the PRODCOM database, and
since the product categories are broader, the PRODCOM sales data is generally higher.
From 2008 and onwards, only the NACE Rev 2.0 data is available, which means only
aggregated data for washing machines and driers (including combined washer-driers).
Since the penetration rate is larger for washing machines than tumble driers, the majority
of the sales are expected to be washing machines which is why the PRODCOM data deviates
between 120-140% from the GfK data in the years after introduction of NACE rev 2.0.
It is clear that the data from PRODCOM after 2007 (NACE rev. 2.0) is not at the level of
detail required, enough to be used in this study, and neither the PRODCOM datasets offers
a detail level down to different tumble drier technologies. Based on data quality and
availability, the GfK data is therefore used for the years where it is available (2006-2016),
and the PRODCOM NACE Rev. 1.1 data is used from 1995-2005, and from 1990 to 1994
the sales are assumed to be equal to the 1995 sales.
Future sales are based on the yearly sales growth rates calculated from the GfK data over
the last 10 years. According to these data, the average sales growth is 0.7% per year for
the entire market in EU28.
2.1.1 Sales split and market shares
The purchased GfK data provided the sales split on different tumble drier types for the
years 2013 to 2016, which corresponds to the years the ecodesign and energy labelling
Regulations have been applicable. The sales data have been corrected for the countries
73 2002 and 2005 data from GfK is reported in the preparatory study 74Product code 29.71.13.70 “Drying machines of a dry linen capacity ≤ 10 kg”
93
not included in the dataset (Czech Republic, Romania, Slovenia, Slovakia, Bulgaria, Latvia,
Malta) using a weighted average based on population and GfK coverage per country and
are shown in Table 8.
Table 8: Household tumble drier sales in Europe 2013-2016, source: GfK (adjusted to EU28)
Sales, million units 2013 2014 2015 2016
Condenser Heat pump 1.23 1.78 2.22 2.58
Heat element 1.93 1.79 1.78 1.75
Air-vented Heat element 0.78 0.73 0.75 0.72
Gas-fired 0.001 0.001 0.001 0.001
Total 3.94 4.29 4.74 5.05
The data shows that the heat pump technology during the four years has become the
prevalent in the EU with the market share increasing from 31% in 2013 to 51% 2016. This
has been at the expense of the electric heat element tumble driers, both the condenser
and the air-vented type. In 2016 the market share of heat element condenser driers was
34%, down from 49% in 2013, whereas the air-vented market share decreased from 20%
to 14% in that same period. The gas tumble drier market share is in the range of 0. 1-0.
2% per year, corresponding to less than a thousand units per year.
The total sales increased on average 1.6% per year from 2007 to 2016, but given the
otherwise quite stable sales over the years, it is assumed that this sales growth rate will
decrease towards 0% per year in 2030. Assumptions were made for the continued
development of the market shares for 2025 and 2030 based on the trends seen in the
market until now, with linear interpolation of market shares in the years between. This
yielded the shares shown in Table 9. The 2005 market split was calculated from the
preparatory study data and is assumed unchanged for all years from 1990-2005.
Table 9: Market shares of the four main tumble drier technologies
Sales, % 2005 2010 2015 2020 2025 2030
Condenser
Heat pump 0% 9% 47% 57% 65% 80%
Heat
element 59% 64% 37% 32% 28% 20%
Air-vented Heat
element 41% 28% 16% 11% 7% 0%
Gas-fired 0% 0% 0% 0% 0% 0%
Total 100% 100% 100% 100% 100% 100%
94
As the preparatory study stated a very low market share of heat pump driers in 2009, the
market share was assumed to be 0% in 2005, however the GfK data showed a share of
31% in 2013, and the linear interpolation for the eight years in between is therefore quite
steep.
The market split shown in Table 9 together with the total market size result in the sales
figures (shown as million units) in Table 10. As seen from the table, the sales of air-vented
driers are expected to decrease and be very close to zero by 2030. This is based on the
very rapid decrease of the market share of air-vented driers from 2013 to 2016 as well as
the large difficulties associated with installing these driers in homes not already equipped
with ventilation holes for the exhaust air compared to condensing driers.
Table 10: Derived tumble drier sales from 1990 to 2030
Sales
million units 1990 1995 2000 2005 2010 2015 2020 2025 2030
Condenser Heat pump - - - - 0.34 2.22 3.05 3.60 4.46
Heat element 3.55 3.55 3.44 2.38 2.54 1.78 1.68 1.55 1.11
Air
vente
d
Heat element 0.14 0.14 1.06 1.66 1.11 0.75 0.59 0.39 -
Gas-fired 0.001 0.001 0.001 0.001 0.001 0.000 0.001 - -
Total 3.70 3.70 4.50 4.04 3.99 4.74 5.32 5.53 5.57
2.1.2 Sales values
Both the PRODCOM database and the GfK database provides data on value of the EU
tumble drier market, however while GfK shows the retail prices, PRODCOM shows the
wholesale prices. The comparison can therefore only be made on the trends, and not on
the absolute values. As PRODCOM data does not differentiate between drier types, the
comparison between the data sets will be made on the entire EU tumble drier market. The
market value comparison is shown in Table 11.
Table 11: Tumble drier market values
Market values,
million EUR 1995 2000 2005 2006 2010 2015 2016
GfK market value - - - 1,659 1,704 2,260 2,354
PRODCOM market value 518 795 851 995 4,889 4,883 4,897
The market value according to PRODCOM has a significant increase of almost a factor 5
from 2006 to 2010, which is however not true, but is caused by the changing categorisation
95
(from NACE V1.1 to V2.0) and the fact that the market data for washing machines and
tumble driers is aggregated in one category from 2008 (see chapter 1.1.4).
Based on the sales and market values in Table 10 and Table 11, the average unit prices of
tumble driers can be derived as shown in Table 12. The GfK prices are again retail prices,
whereas the prices derived from PRODCOM are wholesale. There is only one year of overlap
between the GfK dataset and the PRODCOM NACE 1.1 database, which is year 2006. In
this specific year the mark-up factor can be estimated by dividing retail (GfK) price with
the wholesale (PRODCOM) price, yielding a mark-up of 2.1.
Table 12: Average unit price of tumble driers in EU
Unit prices, EUR 1995 2000 2005 2006 2010 2015 2016
GfK unit price - - - 375 427 475 464
PRODCOM unit price 205 227 181 179 232 252 258
2.2 Stock
The stock of tumble driers in Europe is determined based on the sale and a normal
distribution of the expected lifetime of tumble driers.
2.2.1 Lifetime
In the preparatory study, it was determined that the lifetime of tumble driers was 13 years
on average, with a deviation of 1.7875. Other sources generally confirm this number;
however, 13 years is in the high end of the reported lifetime, which ranged from 8 to 14
years76. According to CECED and Umwelt Bundesamt77, the lifetime is around 12 years and
it is therefore suggested to adjust the average lifetime from the preparatory value of 13
years, to 12 years with a standard variation of 2 years. This will be used for all types of
tumble driers.
2.2.2 Tumble drier stock
The stock of tumble driers in the EU is calculated based on the sales figures described in
chapter 2.1, and the expected lifetimes described previously, shown in Table 13.
75 Preparatory study of Ecodesign for Laundry Dryers, PriceWaterhouseCoopers, 2009. 76 http://homeguides.sfgate.com/average-life-frontloading-drier-102084.html and https://www.mrappliance.com/expert-tips/appliance-life-guide/ and https://www.hunker.com/13410811/lifetime-of-driers and https://www.hrblock.com/tax-center/lifestyle/how-long-do-appliances-last/ and http://www.wisebread.com/this-is-how-long-these-6-appliances-should-last 77 https://www.umweltbundesamt.de/en/publikationen/einfluss-der-nutzungsdauer-von-produkten-auf-ihre-1
96
Table 13: Average expected lifetime and assumed variations used in the stock model
Tumble drier type Average
lifetime
Standard
variation
Condenser Heat pump
12 2 Heat element
Air-vented Heat element
Gas-fired
A normal distribution of the lifetime was applied based on the lifetime (as the mean) and
standard variation from Table 13 (as the variation) and multiplied with the sales volume
for each tumble drier type each year, which yielded the total EU stock shown in Table 14.
This calculated stock can be used to estimate be penetration rate of household tumble
driers by dividing with the total amount of household in EU28 from EUROSTAT78
Table 14: Stock of tumble driers in EU from 2000 to 2030, penetration rate from 2010 to 2030.
Stock, million units 2000 2005 2010 2015 2020 2025 2030
Condenser Heat pump 0.00 0.00 0.44 7.27 21.18 34.89 44.66
Heat element 24.82 29.38 31.26 29.09 25.17 21.45 18.78
Air-vented Heat element 17.31 20.71 19.61 15.16 10.67 7.63 4.73
Gas-fired 0.01 0.01 0.01 0.01 0.01 0.01 0.00
Total 42.15 50.10 51.32 51.53 57.03 63.98 68.18
Penetration rate NA NA 25.0% 24.2% 25.8% 27.7% 28.3%
When looking at the sales and the stock in a compiled graph (Figure 17), it is seen that
the sales (and thus stock) increase over time, resulting in a total stock of around 68 million
by 2030 compared to 50 million in 2016. With a total number of households in the EU-28
of 214 million in 201679, this gives a penetration rate of 24.5%, which is lower than the
assumed penetration rate of 36% from the preparatory study80. The sales and stock will
be used in subsequent tasks to estimate annual energy consumption.
78 http://ec.europa.eu/eurostat/statistics-explained/index.php/Household_composition_statistics Available data from 2009 to 2017. Data from 2018 to 2030 have been projected linearly. 79 http://ec.europa.eu/eurostat/statistics-explained/index.php/Household_composition_statistics 80 Prep study page 405
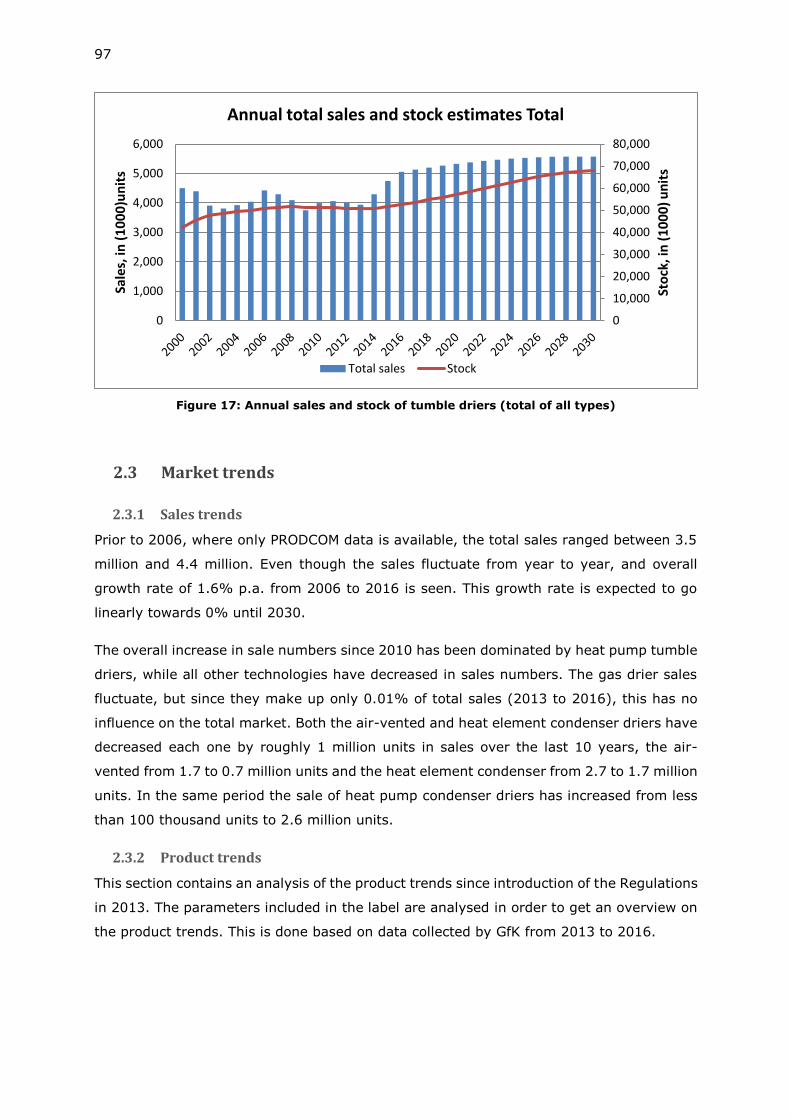
97
Figure 17: Annual sales and stock of tumble driers (total of all types)
2.3 Market trends
2.3.1 Sales trends
Prior to 2006, where only PRODCOM data is available, the total sales ranged between 3.5
million and 4.4 million. Even though the sales fluctuate from year to year, and overall
growth rate of 1.6% p.a. from 2006 to 2016 is seen. This growth rate is expected to go
linearly towards 0% until 2030.
The overall increase in sale numbers since 2010 has been dominated by heat pump tumble
driers, while all other technologies have decreased in sales numbers. The gas drier sales
fluctuate, but since they make up only 0.01% of total sales (2013 to 2016), this has no
influence on the total market. Both the air-vented and heat element condenser driers have
decreased each one by roughly 1 million units in sales over the last 10 years, the air-
vented from 1.7 to 0.7 million units and the heat element condenser from 2.7 to 1.7 million
units. In the same period the sale of heat pump condenser driers has increased from less
than 100 thousand units to 2.6 million units.
2.3.2 Product trends
This section contains an analysis of the product trends since introduction of the Regulations
in 2013. The parameters included in the label are analysed in order to get an overview on
the product trends. This is done based on data collected by GfK from 2013 to 2016.
0
10,000
20,000
30,000
40,000
50,000
60,000
70,000
80,000
0
1,000
2,000
3,000
4,000
5,000
6,000
Sto
ck, i
n (
10
00
) u
nit
s
Sale
s, in
(1
00
0)u
nit
sAnnual total sales and stock estimates Total
Total sales Stock
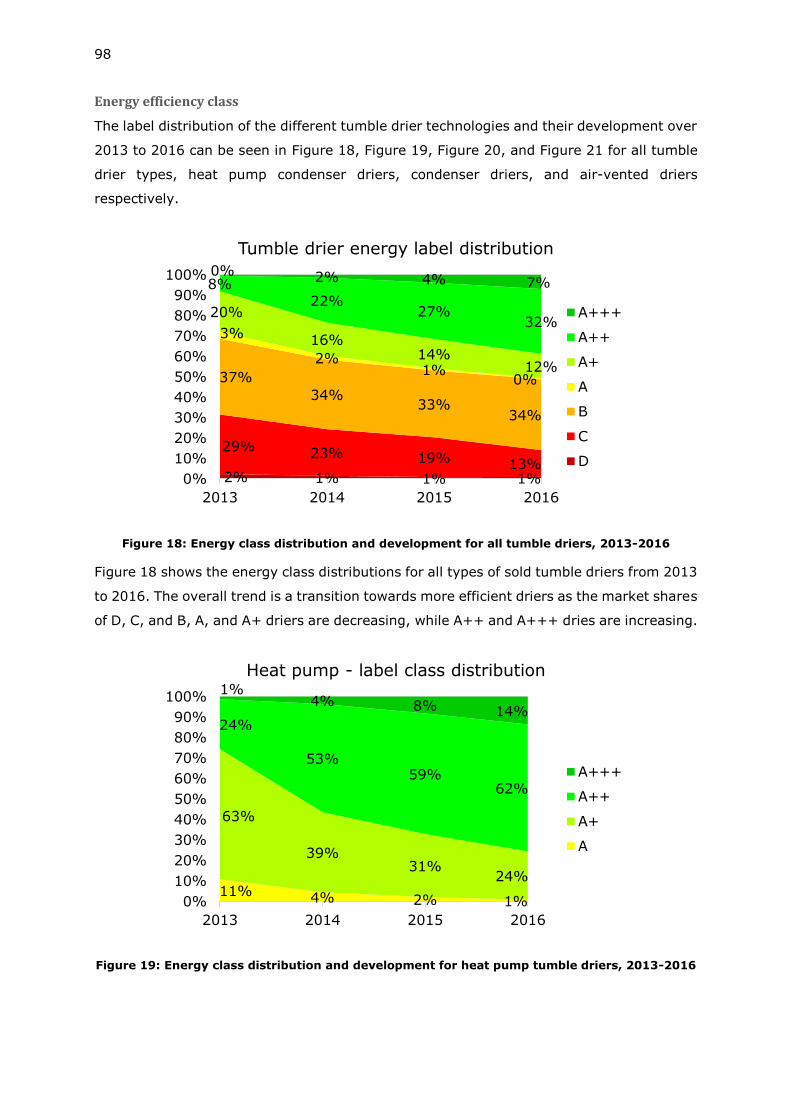
98
Energy efficiency class
The label distribution of the different tumble drier technologies and their development over
2013 to 2016 can be seen in Figure 18, Figure 19, Figure 20, and Figure 21 for all tumble
drier types, heat pump condenser driers, condenser driers, and air-vented driers
respectively.
Figure 18: Energy class distribution and development for all tumble driers, 2013-2016
Figure 18 shows the energy class distributions for all types of sold tumble driers from 2013
to 2016. The overall trend is a transition towards more efficient driers as the market shares
of D, C, and B, A, and A+ driers are decreasing, while A++ and A+++ dries are increasing.
Figure 19: Energy class distribution and development for heat pump tumble driers, 2013-2016
2% 1% 1% 1%
29%23% 19% 13%
37%
34%33%
34%
3%
2%1%
0%
20%
16%14%
12%
8%22%
27%32%
0% 2% 4% 7%
0%
10%
20%
30%
40%
50%
60%
70%
80%
90%
100%
2013 2014 2015 2016
Tumble drier energy label distribution
A+++
A++
A+
A
B
C
D
11% 4% 2% 1%
63%
39%31%
24%
24%
53%59%
62%
1%4% 8% 14%
0%
10%
20%
30%
40%
50%
60%
70%
80%
90%
100%
2013 2014 2015 2016
Heat pump - label class distribution
A+++
A++
A+
A
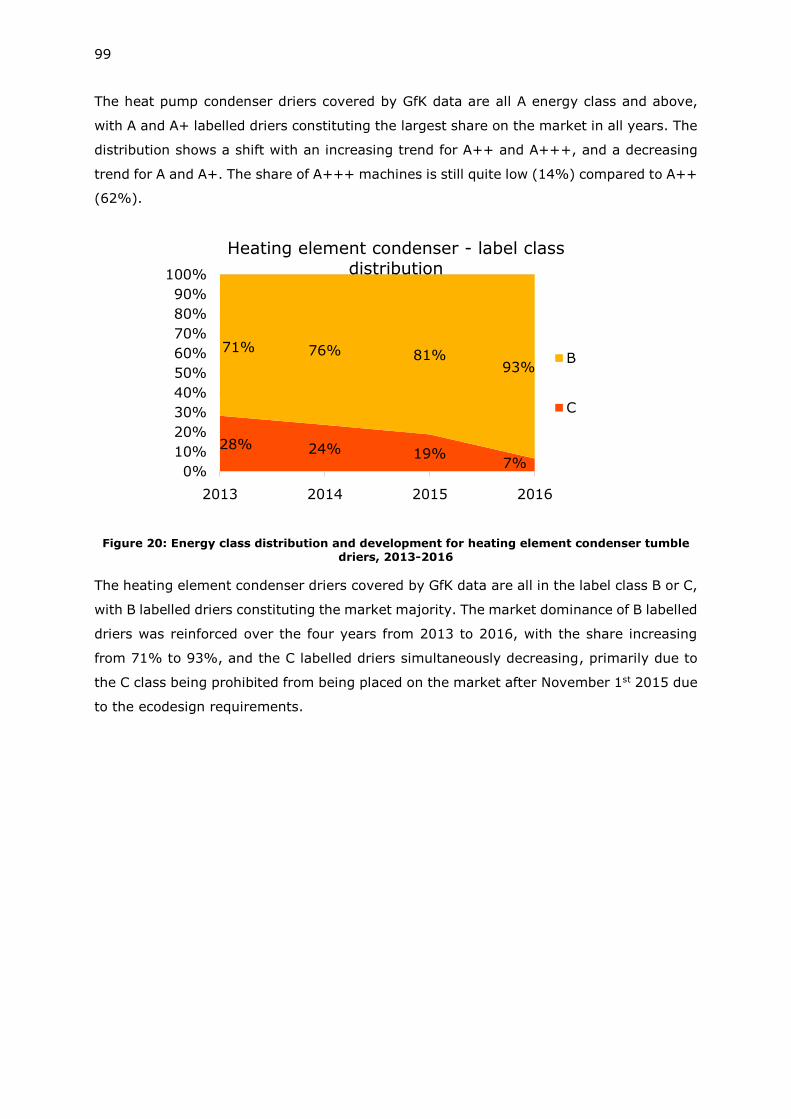
99
The heat pump condenser driers covered by GfK data are all A energy class and above,
with A and A+ labelled driers constituting the largest share on the market in all years. The
distribution shows a shift with an increasing trend for A++ and A+++, and a decreasing
trend for A and A+. The share of A+++ machines is still quite low (14%) compared to A++
(62%).
Figure 20: Energy class distribution and development for heating element condenser tumble driers, 2013-2016
The heating element condenser driers covered by GfK data are all in the label class B or C,
with B labelled driers constituting the market majority. The market dominance of B labelled
driers was reinforced over the four years from 2013 to 2016, with the share increasing
from 71% to 93%, and the C labelled driers simultaneously decreasing, primarily due to
the C class being prohibited from being placed on the market after November 1st 2015 due
to the ecodesign requirements.
28% 24% 19%7%
71% 76% 81%93%
0%
10%
20%
30%
40%
50%
60%
70%
80%
90%
100%
2013 2014 2015 2016
Heating element condenser - label class distribution
B
C
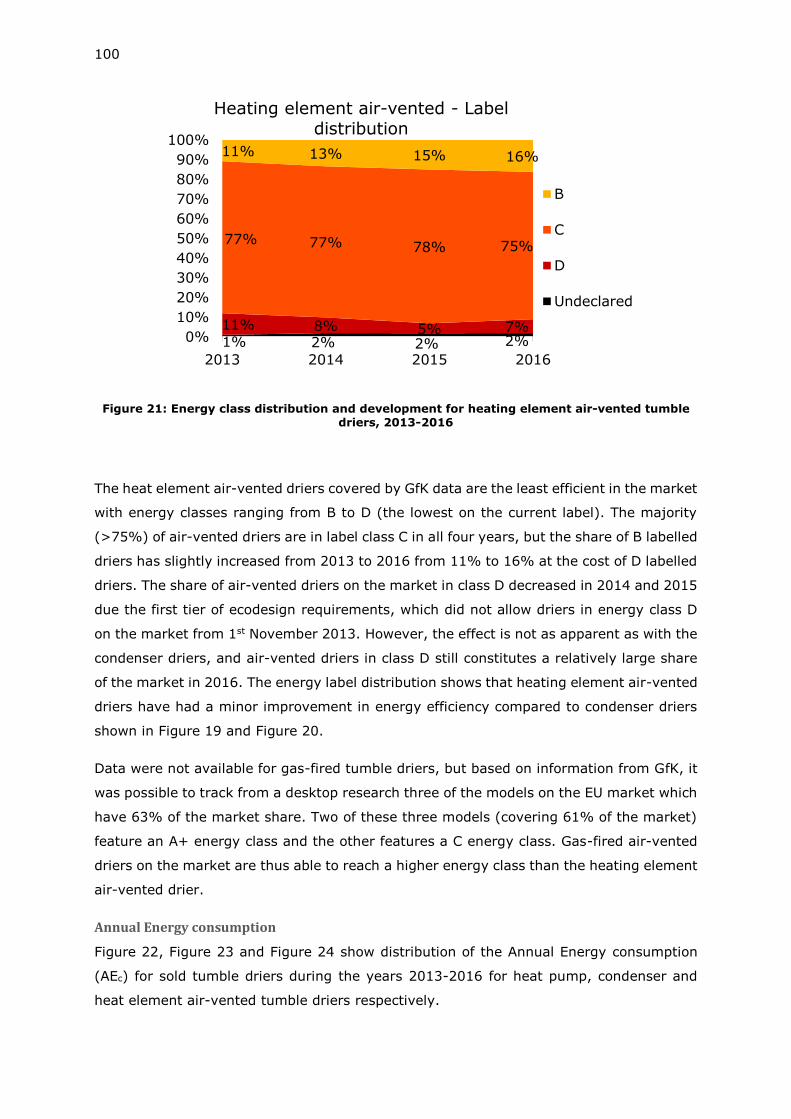
100
Figure 21: Energy class distribution and development for heating element air-vented tumble driers, 2013-2016
The heat element air-vented driers covered by GfK data are the least efficient in the market
with energy classes ranging from B to D (the lowest on the current label). The majority
(>75%) of air-vented driers are in label class C in all four years, but the share of B labelled
driers has slightly increased from 2013 to 2016 from 11% to 16% at the cost of D labelled
driers. The share of air-vented driers on the market in class D decreased in 2014 and 2015
due the first tier of ecodesign requirements, which did not allow driers in energy class D
on the market from 1st November 2013. However, the effect is not as apparent as with the
condenser driers, and air-vented driers in class D still constitutes a relatively large share
of the market in 2016. The energy label distribution shows that heating element air-vented
driers have had a minor improvement in energy efficiency compared to condenser driers
shown in Figure 19 and Figure 20.
Data were not available for gas-fired tumble driers, but based on information from GfK, it
was possible to track from a desktop research three of the models on the EU market which
have 63% of the market share. Two of these three models (covering 61% of the market)
feature an A+ energy class and the other features a C energy class. Gas-fired air-vented
driers on the market are thus able to reach a higher energy class than the heating element
air-vented drier.
Annual Energy consumption
Figure 22, Figure 23 and Figure 24 show distribution of the Annual Energy consumption
(AEc) for sold tumble driers during the years 2013-2016 for heat pump, condenser and
heat element air-vented tumble driers respectively.
1% 2% 2% 2%11% 8% 5% 7%
77% 77% 78% 75%
11% 13% 15% 16%
0%
10%
20%
30%
40%
50%
60%
70%
80%
90%
100%
2013 2014 2015 2016
Heating element air-vented - Label distribution
B
C
D
Undeclared
101
Figure 22: Distribution of annual energy consumption for the heat pump tumble driers from 2013 to 2016
The heat pump tumble drier AEc distribution shows a slow trend with a declining weighted
average AEc in the four-year period, where the top highest energy consumption brackets
are getting smaller and the one in the middle is getting bigger, resulting in AEc of 246
kWh/year in 2013 and 233 kWh/year in 2016.
The three lowest intervals, ‘<200’ and ‘220-225’, and ‘225-250’ kWh/year, have all made
an overall increase in market share from 2013 to 2016. Oppositely, the driers in the
>250 kWh/year intervals steadily decreased. The >275 kWh/year interval showed no
consistent trend, but the highest consuming machines above 400 kWh/year decreased
and those over 500 kWh/year vanished entirely from the market (not shown here due to
very low market shares).
Overall the market share of the three lowest AEC intervals (<250 kWh/year) increased
from 44% to 73%, and the sales-weighted average AEC of heat pump tumble driers
decreased from approximately 246 kWh/year in 2013 to 233 kWh/year in 2016.
11% 5% 5% 5%
13%11% 10% 15%
14% 26% 23%21%
17%21% 29%
37%
35% 27%22%
15%
10% 11% 10% 8%
0%
10%
20%
30%
40%
50%
60%
70%
80%
90%
100%
2013 2014 2015 2016
Heat pump – condenser, AEc
>275
250 < 275
225 < 250
200 < 225
< 200
Undeclared
102
Figure 23: Distribution of annual energy consumption for heat element condenser tumble driers from 2013 to 2016
For tumble driers with heating element and condensing technology, the opposite
development than for heat pumps is seen. The share of low AEC tumble driers decreased
from 2013 to 2016, whereas the share of 500+ kWh/year increased.
Regarding the sales-weighted energy consumption, the data show a steady increase from
461 kWh/year in 2013 to 506 kWh/year in 2016.
Figure 24: Distribution of annual energy consumption for heat element air-vented tumble driers from 2013 to 2016
Only very low shares of heat element air-vented driers are in the intervals <250 kWh/year.
The majority is in fact in the highest consumption intervals >400 kWh/year. The share of
28%14% 12% 10%
8%
7% 5% 4%
6%
7%7% 4%
7%
7% 7%3%
10%
10% 9%8%
41%55% 59%
70%
0%
10%
20%
30%
40%
50%
60%
70%
80%
90%
100%
2013 2014 2015 2016
Heat element - condenser, AEc
>= 500
400 < 500
300 < 400
275 < 300
250 < 275
Undeclared
32%19% 17% 17%
2%
1% 0%
10%
11% 13% 9%
10%
8% 5% 7%
6%
11%7% 3%
28%35%
41%37%
12% 15% 18% 26%
0%
10%
20%
30%
40%
50%
60%
70%
80%
90%
100%
2013 2014 2015 2016
Heat element - air vented, AEc
>= 500
400 < 500
300 < 400
275 < 300
250 < 275
<250
Undeclared
103
heat element air-vented driers with AEc >500 kWh/year increased in market share. The
average AEc increased from 402 kWh/year in 2013 to 436 kWh/year in 2016.
The same three gas-fired air-vented tumble driers models previously investigated in terms
of the energy efficiency class were tracked in a desktop research, where the model covering
54% of the EU market81 consumes 256 kWh/year (in gas) by the time of the data gathering
(March 2018), the other model covering 7% of the market consumes 261 kWh/year and
the last consumes 459 kWh/year. The first two models have a rated capacity of 7 kg, and
the last one of 6 kg.
Even though both tumble drier types equipped with heating elements showed an increase
in annual energy consumption, it might not be because of a general reduction in energy
efficiencies. The annual energy efficiency is calculated based on the rated capacity (see
section 3.1 for details on calculating the AEc), which on average is increasing (cf. Figure
33) and is thus influencing the depicted AEc distributions. Figure 19, Figure 20, and Figure
21 show that all drier types have improved in energy efficiency from 2013 to 2016, so the
increase in AEc thus originates from the increase in capacity, which is larger than the
increase in energy efficiency.
Condensation efficiency
The graphs below show the market distribution of condensation efficiency classes from
2013 to 2016. Both heat pump and heat element condenser driers all have condensation
efficiencies in from class C or above, showing all a minimum efficiency of 70% which is the
lower limit for class C (and which is Tier 2 ecodesign requirement).
Both technologies have a high market share of products for which the condensation
efficiency is not declared according to GfK data, even though this share is decreasing. This
amounts to 36%/8% and 67%/45% for years 2013/2016, for heat pump driers and heating
element condensing driers respectively. This is especially a problem for heat element
condenser driers where the not declared market share is dominating the market. A small
portion of this could be due to wrong declaration from the retailers who the data is collected
from, however since such large shares is only seen for this parameter, it seems unlikely.
81 WhiteKnight ECO43
104
Figure 25: Condensing efficiency label class distribution for heat pump tumble driers, 2013-2016
The heat pump tumble driers are primarily class B and A. The share of A labelled products
increased from 9% in 2013 to 38% in 2016, while the B labelled products declined from
53% in 2013 to 47% in 2015 but increased to 53% again in 2016. This is most likely
because of the share of products that did not declare the condensation efficiency in the
earlier years (decreased from 36% in 2013 to 8% in 2016), which affects the percentages.
The heat pump driers with label C condensation efficiency stayed at 1% from 2013 to 2014.
Figure 26: Condensing efficiency label class distribution for heat element condenser tumble driers, 2013-2016
For condenser driers with heat element, those with “not declared” condensation efficiency
makes up the majority of the market: 67% in 2013 and 45% in 2016. When looking at the
products that are in fact labelled, the largest share of the condenser drier market is class
1% 1% 1% 1%
53% 52%47%
53%
9%
25% 39%38%
36%
21%14% 8%
0%
10%
20%
30%
40%
50%
60%
70%
80%
90%
100%
2013 2014 2015 2016
Heat pump - condenser
Undeclared
A
B
C
4% 5% 4% 8%
25%32% 32%
35%5%
6% 11%
12%
67%57% 54%
45%
0%
10%
20%
30%
40%
50%
60%
70%
80%
90%
100%
2013 2014 2015 2016
Heating element - condenser
Undeclared
A
B
C
105
B. The share of products in class A, B and C are all increasing, but it is not certain whether
this is due to a market change or the share of not declared declining.
Low power modes
Two different low power modes exist: off mode, in which the drier is effectively turned off
without any kinds of displays being active, and left-on mode, which is activated when the
drying cycle is complete. The power consumption is shown in
Figure 27. The majority of available driers have 0W off-mode consumption, while the
majority of driers have left-on mode consumption higher than 0.5W
The left-on mode duration is shown in Figure 28. Some tumble driers have no left-on mode
at all, and for the majority of tumble driers the duration is below 10 minutes.
Note that
Figure 27 and Figure 28 are based on the APPLiA model database82, and not on sales data.
The figures are thus showing the distributions for the models available for sale on the
market, and not real sales weighted values. They are thus not representative for the EU28
market and can only be used as an indicative figure.
Figure 27: Power consumption in off-mode and left-mode82
82 Source: APPLIA 2016 model database
0%10%20%30%40%50%60%70%
Market
sh
are
Off-mode consumption [W]
Low power mode consumption
Off-mode Left-on mode
106
Figure 28: Left-on mode duration82
Rated capacity
The rated capacity is stated on the energy label and used in the EEI calculations, but there
is no ecodesign requirement for this parameter. The rated capacity is the stated maximum
mass in kilograms that can be dried in the tumble drier in the standard cotton programme
at full load. The heat pump tumble driers which now constitute the largest share of the
market, have a tendency for increasing capacity as seen in Figure 29.
Figure 29: Market distribution of rated capacity for heat pump condenser tumble driers, 2013-
2016
The heat pump tumble driers mostly have a rated capacity of 7 or 8 kg, with and increasing
trend of 8 and 9 kg machines while 6 and 7 kg machines are decreasing in the market.
A small increase in rated capacity is seen for heat element driers, both condensing and
air-vented (see Figure 30 and Figure 31). For air-vented driers there are less 8 kg
0%
10%
20%
30%
40%
50%
0 1-10 15 30
Market
sh
are
Left-on duration [min]
Left-on mode duration
55% 52%45%
39%
39%42%
46%51%
4% 6% 9% 9%
10 kg: 0% 10 kg: 0% 10 kg: 0% 10 kg: 1%
0%
10%
20%
30%
40%
50%
60%
70%
80%
90%
100%
2013 2014 2015 2016
Heat pump - condenser
10 KG
9 KG
8 KG
7 KG
107
appliances on the market in 2016, but still the average capacity showed a small increase
from 6,4 kg in 2013 to 6,6 kg in 2016.
The heat element condenser driers are, to a large extent, similar to heat pump driers,
except that the 7 kg machines are predominant. For heat element air-vented driers, the
6 kg machines also have a large market share, but are declining in favour of 7 kg
machines.
The gas drier market is the only one for which the rated capacity shows a declining trend,
and even though the 7 kg machines are dominant, the share of <5 kg machines is
increasing, while gas driers with all other rated capacities are not present on the market.
108
Figure 30: Market distribution of rated capacity for condenser tumble driers, 2013-2016
8% 6% 5% 2%
50% 49% 48%47%
35% 36% 37%37%
7% 8% 9%13%
10 KG, 0% 10 KG, 0% 10 KG, 1% 10 KG, 2%
0%
10%
20%
30%
40%
50%
60%
70%
80%
90%
100%
2013 2014 2015 2016
Heating element – condenser
10 KG
9 KG
8 KG
7 KG
6 KG
13% 10% 9% 11%
42% 43%39% 30%
37% 41%46%
53%
8% 5% 6% 5%
9 KG, 1% 9 KG, 0% 9 KG, 0% 9 KG, 2%
0%
10%
20%
30%
40%
50%
60%
70%
80%
90%
100%
2013 2014 2015 2016
Ventilated - Load capacity distribution
9 KG
8 KG
7 KG
6 KG
<= 5 KG
13% 10% 9% 11%
42% 43%39% 30%
37% 41%46%
53%
8% 5% 6% 5%
9 KG, 1% 9 KG, 0% 9 KG, 0% 9 KG, 2%
0%
10%
20%
30%
40%
50%
60%
70%
80%
90%
100%
2013 2014 2015 2016
Heating element - air vented
9 KG
8 KG
7 KG
6 KG
<= 5 KG
109
Figure 31: Market distribution of rated capacity for air-vented tumble driers, 2013-2016
Figure 32: Market distribution of rated capacity for gas tumble driers, 2013-2016
Summarizing the figures above with sales-weighted averages of non-gas tumble drier
types and using them to establish a linear projection towards 2030, a general trend can be
seen in Figure 33. It shows that these are increasing in size and if this trend continues, the
average size of condenser driers and air vented driers will be 8.9 kg and 7.5 kg
respectively, based on this correlation. For reference, the average nominal capacities
reported in the preparatory study were 4.9 kg in 2002 and 5.4 kg in 2005 respectively.
The increasing average nominal capacity of tumble driers follows the same trend as the
washing machines’, where models with capacities up towards 13 kg have entered the EU
market. The average nominal washing machine capacity was 7.0 kg in 2013 and 7.2 kg in
2014. This is thus lower than the tumble driers.83
83 Ecodesign and Energy Label for Household Washing machines and washer dryers – Preparatory study, final report, JRC, 2017, Table 2.15
1%
20% 17%26%
99%
80% 82%73%
0%
10%
20%
30%
40%
50%
60%
70%
80%
90%
100%
2013 2014 2015 2016
Gas-fired - air-vented
7 KG
<= 5 KG
110
Figure 33: Sales-averaged rated capacity for all non-gas tumble driers (values in the red box are linearly projected)
Cycle time
The cycle time declared on the energy label is the duration of the standard cotton
programme at full load, excluding any delay (timer) set by the end user. There is no specific
ecodesign requirement for the cycle time.
The market distribution for all technologies is largely unchanged, except for those where
the “not declared” share is decreasing, which causes other categories to increase.
Figure 34: Cycle times in minutes of heat pump driers, 2013-2016
For heat pump driers (Figure 34), the majority of the market in 2016 had cycle times above
180 minutes, while in 2013 the majority (of declared machines) had cycle times between
6.5
7.0
7.5
8.0
8.5
9.0
2013 2015 2017 2019 2021 2023 2025 2027 2029
Projected nominal capacities
Heat pump - condenser Heating element - condenser
Heating element - air vented Sales weighted average
Extrapolation
39%
25%19%
14%
1%
3%3%
3%
27%
21%
13%14%
16%
20%
26%23%
10%
21%
19%
15%
7% 10%20%
31%
0%
10%
20%
30%
40%
50%
60%
70%
80%
90%
100%
2013 2014 2015 2016
Heat pump - condenser
>= 180
160 < 180
140 < 160
120 < 140
0 < 120
Undeclared
111
120 and 140 minutes. However, since the 140-160 minutes market share has increased
and the 160-180 has simultaneously decreased, there is no overall trend to the cycle time.
Figure 35: Cycle times of air-vented driers, 2013-2016
For the air-vented driers (Figure 35) there is almost no change in the market from 2013
to 2016, and the “not declared” share continues to be more than 50%.
Figure 36: Cycle times of heat element condenser driers, 2013-2016
For the condenser driers (Figure 36), the not-declared share is very high, but declining
from 2013 to 2016. It seems that the share of machines in all of the cycle time intervals
increase, as “not declared” decreases, hence it is not possible to see a market development
from the data.
62% 52% 53% 54%
25%
27% 26% 25%
8%13% 14% 13%
5% 7% 6% 6%
0%
10%
20%
30%
40%
50%
60%
70%
80%
90%
100%
2013 2014 2015 2016
Heating element – air-vented
140 < 160
120 < 140
0 < 120
Undeclared
59%52% 49%
41%
16%18% 20%
20%
19%22% 23%
28%
4% 5% 5% 7%
0%
10%
20%
30%
40%
50%
60%
70%
80%
90%
100%
2013 2014 2015 2016
Heating element - condenser
>= 180
160 < 180
140 < 160
120 < 140
0 < 120
Undeclared
112
This is not the case for gas-fired air-vented driers, where the majority of the driers covered
by GfK data do not declare cycle time thus no trend is possible to identify (Figure 39).
Figure 37: Cycle times of gas driers, 2013-2016
Noise
The Ecodesign Regulation does not set any specific requirements for the sound power level,
but it is required to be shown on the label as a value in dB. The sound power level is based
on the standard cotton programme at full load. There seems to be no general trend in
sound power level for any of the drier technologies.
For heat pump tumble driers (Figure 38), the largest market share has a noise level of 65
dB, even though it is decreasing, while the market share of driers with noise level 66 dB is
increasing. The least noisy heat pump driers (<63 and 64 dB) increased from 2013 to
2016, but the market share is still low, and the trend is not unambiguous.
The air-vented driers (Figure 39) mostly have a sound power level >66 dB, or it is nor
declared. The market share of machines with noise level 66 dB or below, is roughly
unchanged from 2013 to 2016.
100%
85%76%
89%
15%24%
11%
0%
10%
20%
30%
40%
50%
60%
70%
80%
90%
100%
2013 2014 2015 2016
Gas fired - air vented
120 - 140
Undeclared
113
Figure 38: Heat pump driers noise distribution, 2013-2016
Figure 39: Air-vented driers noise distribution, 2013-2016
Figure 40: Condenser heating element driers noise distribution, 2013-2016
0%
10%
20%
30%
40%
50%
60%
2013 2014 2015 2016
Heat pump - Noise distribution
<= 63 db
64 db
65 db
66 db
0%
10%
20%
30%
40%
50%
60%
2013 2014 2015 2016
Air-vented - Noise distribution
<= 63 db
64 db
65 db
66 db
> 66 db
Not declared
0%
5%
10%
15%
20%
25%
30%
35%
40%
2013 2014 2015 2016
Condenser heating element - noise distribution
<= 63 db
64 db
65 db
66 db
> 66 db
Not declared
114
For the condenser driers (Figure 40) the majority of the market is also driers with >66 dB
sound power level, and it has continuously increased, while the not declared share
decreased from 2013 to 2016. The share of driers with sound power levels 65 and 66 dB
also increased, while the <63 and 64 dB driers decreased.
Figure 41: Gas driers noise distribution, 2013-2016
The data for the gas driers (Figure 41) is very limited due to the very low market share of
this technology and the only sound power levels with data points is the <63 dB category.
The rest was labelled as “not declared” in the data provided by GfK, which increased
significantly from 7% to 89% from 2013 to 2016. The share of gas driers for which the
sound power level is known is thus only 11% for 2016.
2.3.3 Future impact of ecodesign requirements on air-vented driers
Looking at the predicted sales figures and stock values for air-vented driers in Table 9 and
Table 14 respectively, it is clear that existing market forces are regulating the market
towards using condenser driers instead of air-vented. This might nullify the effects of new
ecodesign Regulations on these types of driers, as they are gradually being removed from
the market on a voluntary basis.
Using the GfK data and stock calculations done in sections 2.2.2, and assuming a 10%84
reduction of annual energy consumption (AEc) can be achieved in all air-vented driers sold
after 2020, the total energy consumption reduction of air-vented driers can be seen in
Figure 42.
84 10% was used as an indicative figure
0%
10%
20%
30%
40%
50%
60%
70%
80%
90%
100%
2013 2014 2015 2016
Gas - Noise distribution
<= 63 db
Not declared
115
Figure 42: Effects on total energy consumption of air-vented driers, with a 10% reduction of new units sold after 2020. All baseline AEc assumed constant at 460 kWh/year.
The combined effects results in cumulative energy savings of 1.3 TWh of electricity
between years 2020 and 2030. In percentage, this corresponds to 3.4% of the total energy
consumption for air-vented driers in the same time period.
2.3.4 Market channels and production structure
The market for household tumble driers is characterised by a large number of
manufacturers. Major players include, but is not limited to, BSH, Miele, LG Electronics,
Samsung, Whirlpool, Arçelik, Electrolux, Candy, Gorenje, Vestel, and Whiteknight. Most
manufacturers produce both heating element (air-vented and condensing) and heat pump
driers, but only the last manufacturer produces gas fired driers. The market is thus
dominated by large players, with very few SME’s currently on the market.
2.4 Consumer expenditure base data
The average consumer prices and costs experienced by the end-user throughout the
product lifetime are determined by unit prices in the following categories:
• Purchase price
• Installation costs
• Repair and maintenance costs
• Electricity and gas prices
• End of life cost
Each of the other costs are explained in the following sub-sections. The costs are shown
as unit prices for each product, maintenance event, kWh electricity and so on. The total
0
2
4
6
8
10
1990 1995 2000 2005 2010 2015 2020 2025 2030
Yearl
y e
nerg
y c
onsum
ption
[TW
h]
Potential energy savings for ecodesign requirements for vented TDs
10% Reduction in AEc Baseline
116
life cycle costs, which also depend on use patterns and frequency of events, is discussed
in task 5.
2.4.1 Interest and inflation rates (MEErP method for LCC calculation)
All economic calculations will be made with 2016 as base year, as this is the latest whole
year for which data is available. Inflation rates from Eurostat 85 will be used to scale
purchase price, electricity prices etc. to 2016-prices. Furthermore, a discount rate of 4%
will be used in accordance with the MEErP methodology.
2.4.2 Consumer purchase price
The consumer purchase price including VAT was calculated from the data on unit sales and
total market value collected by GfK. The data was available for the years 2013-2016, and
the average unit price for each tumble drier type is shown in Table 15.
Table 15: Unit retail prices in EUR for household tumble driers
Unit prices, EUR 2013 2014 2015 2016
Condenser
Heat pump 734 681 648 615
Heating
element 234 232 357 340
Air-vented
Heating
element 225 310 244 228
Gas-fired 225 310 326 343
As seen from the table, the price of heat pump tumble driers has decreased steadily from
2013 to 2016, as the technology matured and took over a larger share of the market. This
price decrease happened despite the increase of heat pump driers in category A++ and
A+++ (24% and 1% in 2013 compared to 62% and 14% in 2016).
The air-vented heat element technology driers stayed more or less on the same price level
despite some fluctuations, and the energy efficiency class distribution also stayed more or
less constant over the four reported years with the majority in energy class C (75-78%).
The heat element with condensing technology driers increased in price over the four years,
which is consistent with approximately 20% of the market shifting from energy class C to
B for in the same period (Class B share increasing from 71% in 2013 to 93% in 2016).
Based on the actual price data shown in Table 15, the purchase prices in the entire period
from 2000 to 2030 were extrapolated, using the calculated growth rates.
85 http://ec.europa.eu/eurostat/statistics-explained/index.php/File:HICP_all-items,_annual_average_inflation_rates,_2006-2016_(%25)_YB17.png
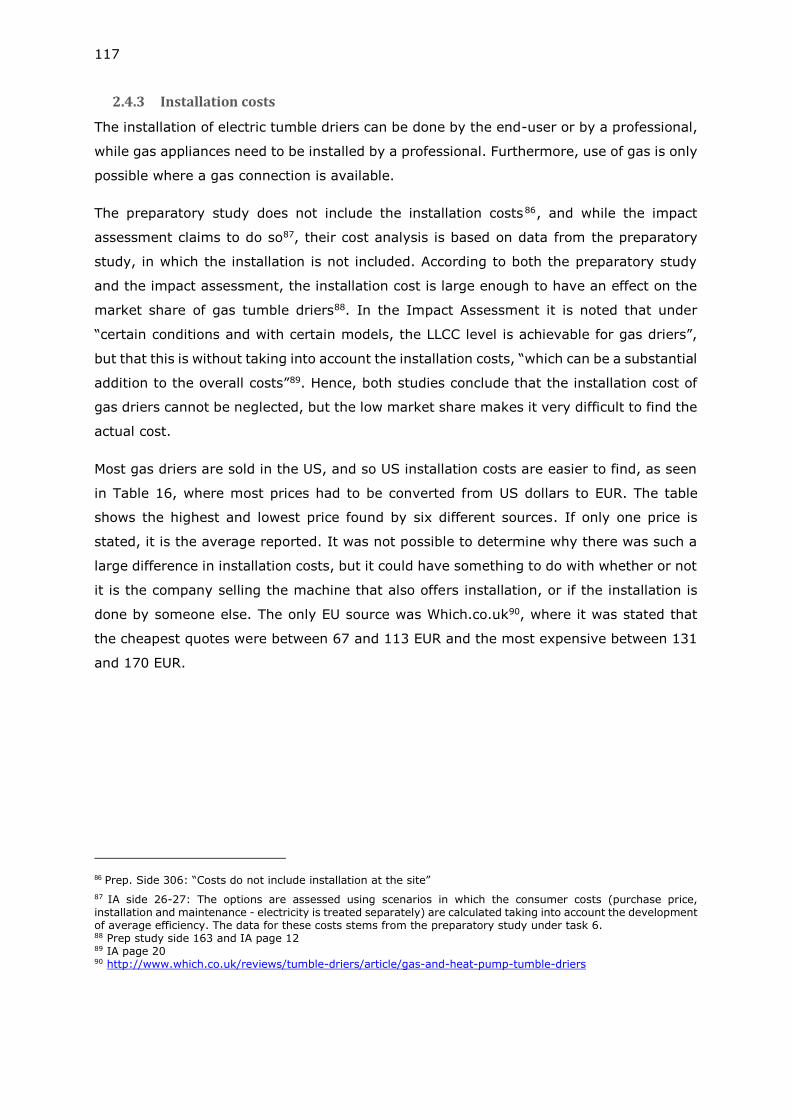
117
2.4.3 Installation costs
The installation of electric tumble driers can be done by the end-user or by a professional,
while gas appliances need to be installed by a professional. Furthermore, use of gas is only
possible where a gas connection is available.
The preparatory study does not include the installation costs86, and while the impact
assessment claims to do so87, their cost analysis is based on data from the preparatory
study, in which the installation is not included. According to both the preparatory study
and the impact assessment, the installation cost is large enough to have an effect on the
market share of gas tumble driers88. In the Impact Assessment it is noted that under
“certain conditions and with certain models, the LLCC level is achievable for gas driers”,
but that this is without taking into account the installation costs, “which can be a substantial
addition to the overall costs”89. Hence, both studies conclude that the installation cost of
gas driers cannot be neglected, but the low market share makes it very difficult to find the
actual cost.
Most gas driers are sold in the US, and so US installation costs are easier to find, as seen
in Table 16, where most prices had to be converted from US dollars to EUR. The table
shows the highest and lowest price found by six different sources. If only one price is
stated, it is the average reported. It was not possible to determine why there was such a
large difference in installation costs, but it could have something to do with whether or not
it is the company selling the machine that also offers installation, or if the installation is
done by someone else. The only EU source was Which.co.uk90, where it was stated that
the cheapest quotes were between 67 and 113 EUR and the most expensive between 131
and 170 EUR.
86 Prep. Side 306: “Costs do not include installation at the site”
87 IA side 26-27: The options are assessed using scenarios in which the consumer costs (purchase price, installation and maintenance - electricity is treated separately) are calculated taking into account the development of average efficiency. The data for these costs stems from the preparatory study under task 6. 88 Prep study side 163 and IA page 12 89 IA page 20 90 http://www.which.co.uk/reviews/tumble-driers/article/gas-and-heat-pump-tumble-driers
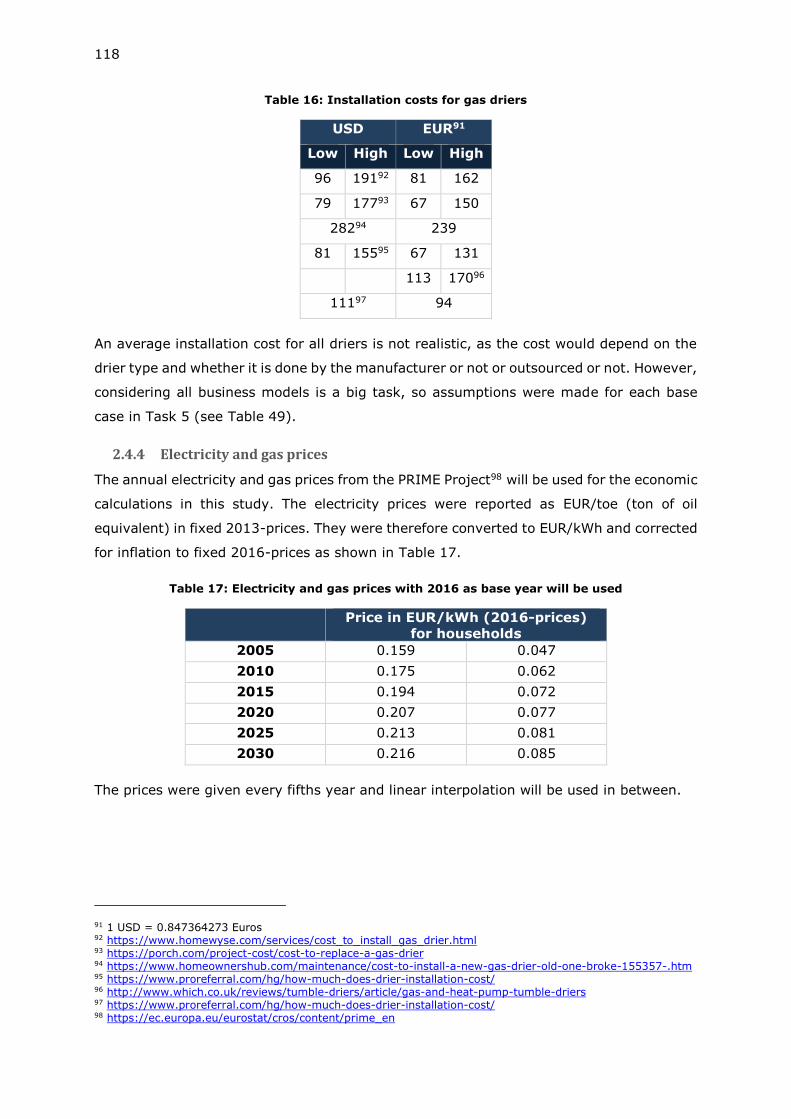
118
Table 16: Installation costs for gas driers
USD EUR91
Low High Low High
96 19192 81 162
79 17793 67 150
28294 239
81 15595 67 131
113 17096
11197 94
An average installation cost for all driers is not realistic, as the cost would depend on the
drier type and whether it is done by the manufacturer or not or outsourced or not. However,
considering all business models is a big task, so assumptions were made for each base
case in Task 5 (see Table 49).
2.4.4 Electricity and gas prices
The annual electricity and gas prices from the PRIME Project98 will be used for the economic
calculations in this study. The electricity prices were reported as EUR/toe (ton of oil
equivalent) in fixed 2013-prices. They were therefore converted to EUR/kWh and corrected
for inflation to fixed 2016-prices as shown in Table 17.
Table 17: Electricity and gas prices with 2016 as base year will be used
Price in EUR/kWh (2016-prices)
for households
2005 0.159 0.047
2010 0.175 0.062
2015 0.194 0.072
2020 0.207 0.077
2025 0.213 0.081
2030 0.216 0.085
The prices were given every fifths year and linear interpolation will be used in between.
91 1 USD = 0.847364273 Euros 92 https://www.homewyse.com/services/cost_to_install_gas_drier.html 93 https://porch.com/project-cost/cost-to-replace-a-gas-drier 94 https://www.homeownershub.com/maintenance/cost-to-install-a-new-gas-drier-old-one-broke-155357-.htm 95 https://www.proreferral.com/hg/how-much-does-drier-installation-cost/ 96 http://www.which.co.uk/reviews/tumble-driers/article/gas-and-heat-pump-tumble-driers 97 https://www.proreferral.com/hg/how-much-does-drier-installation-cost/ 98 https://ec.europa.eu/eurostat/cros/content/prime_en
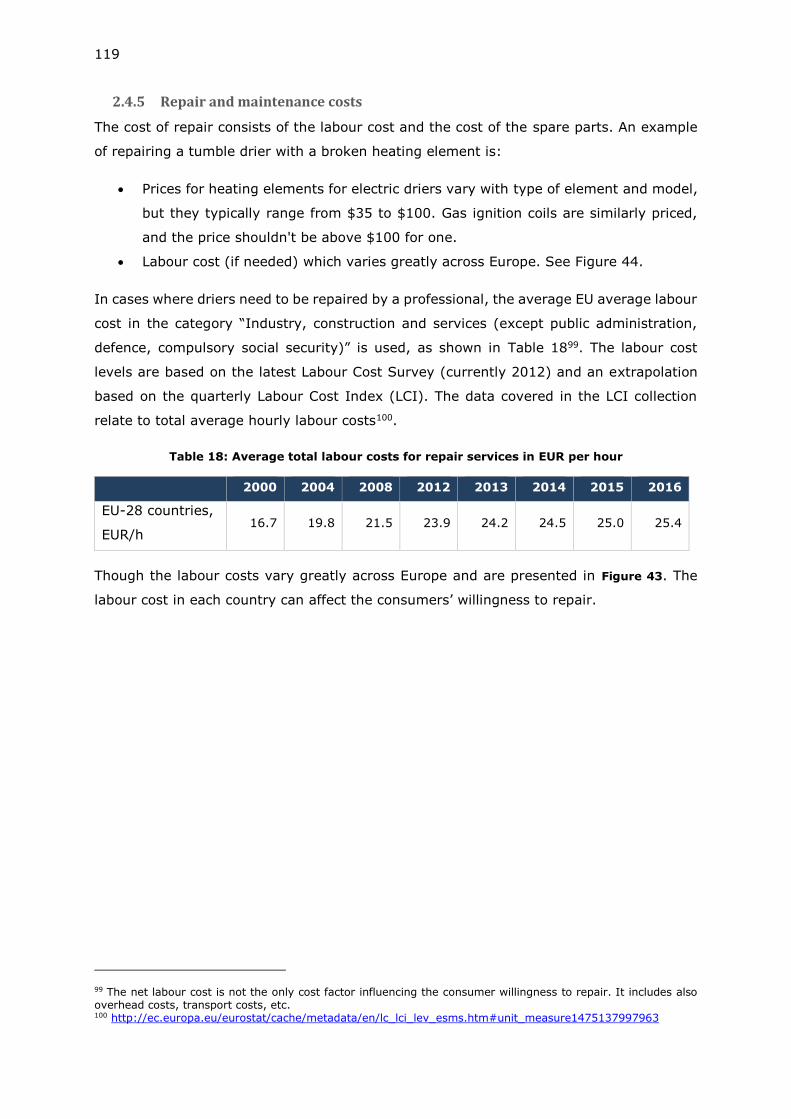
119
2.4.5 Repair and maintenance costs
The cost of repair consists of the labour cost and the cost of the spare parts. An example
of repairing a tumble drier with a broken heating element is:
• Prices for heating elements for electric driers vary with type of element and model,
but they typically range from $35 to $100. Gas ignition coils are similarly priced,
and the price shouldn't be above $100 for one.
• Labour cost (if needed) which varies greatly across Europe. See Figure 44.
In cases where driers need to be repaired by a professional, the average EU average labour
cost in the category “Industry, construction and services (except public administration,
defence, compulsory social security)” is used, as shown in Table 1899. The labour cost
levels are based on the latest Labour Cost Survey (currently 2012) and an extrapolation
based on the quarterly Labour Cost Index (LCI). The data covered in the LCI collection
relate to total average hourly labour costs100.
Table 18: Average total labour costs for repair services in EUR per hour
2000 2004 2008 2012 2013 2014 2015 2016
EU-28 countries,
EUR/h 16.7 19.8 21.5 23.9 24.2 24.5 25.0 25.4
Though the labour costs vary greatly across Europe and are presented in Figure 43. The
labour cost in each country can affect the consumers’ willingness to repair.
99 The net labour cost is not the only cost factor influencing the consumer willingness to repair. It includes also overhead costs, transport costs, etc. 100 http://ec.europa.eu/eurostat/cache/metadata/en/lc_lci_lev_esms.htm#unit_measure1475137997963
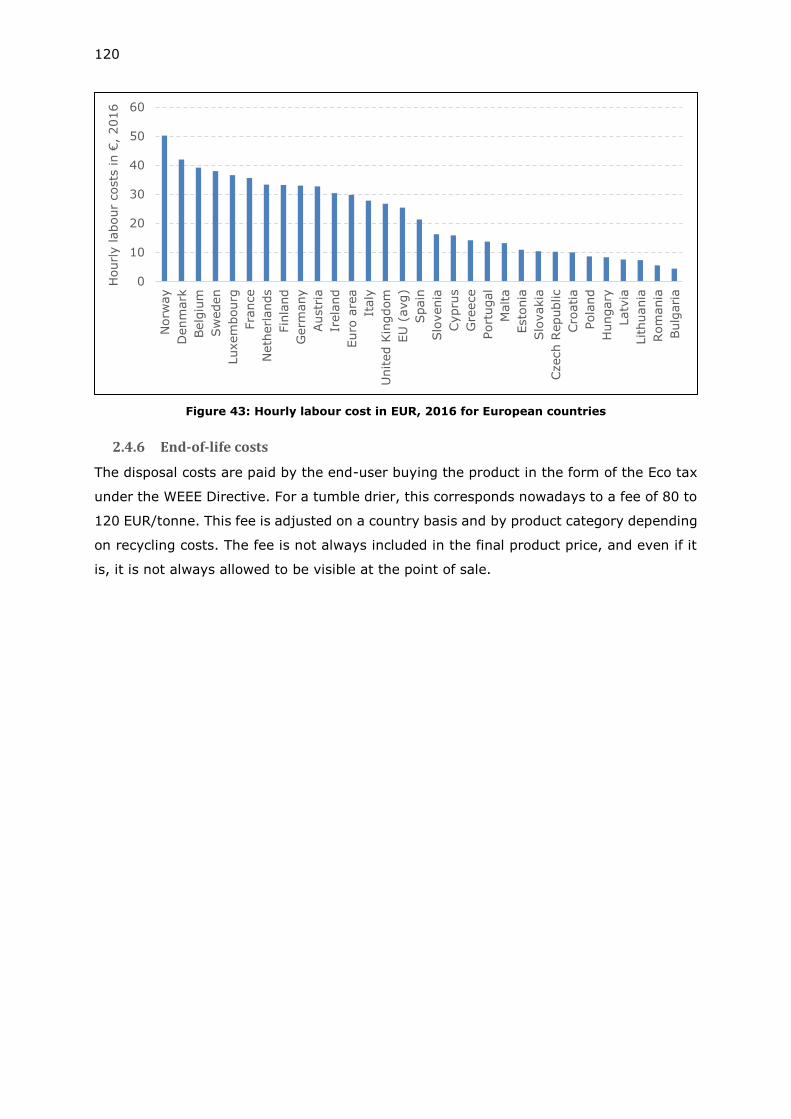
120
Figure 43: Hourly labour cost in EUR, 2016 for European countries
2.4.6 End-of-life costs
The disposal costs are paid by the end-user buying the product in the form of the Eco tax
under the WEEE Directive. For a tumble drier, this corresponds nowadays to a fee of 80 to
120 EUR/tonne. This fee is adjusted on a country basis and by product category depending
on recycling costs. The fee is not always included in the final product price, and even if it
is, it is not always allowed to be visible at the point of sale.
0
10
20
30
40
50
60
Norw
ay
Denm
ark
Belg
ium
Sw
eden
Luxem
bourg
Fra
nce
Neth
erl
ands
Fin
land
Germ
any
Austr
ia
Irela
nd
Euro
are
a
Italy
United K
ingdom
EU
(avg)
Spain
Slo
venia
Cypru
s
Gre
ece
Port
ugal
Malta
Esto
nia
Slo
vakia
Czech R
epublic
Cro
atia
Pola
nd
Hungary
Latv
ia
Lithuania
Rom
ania
Bulg
ari
a
Hourl
y labour
costs
in €
, 2016
121
3. Review of user behaviour
3.1 Consumer behaviour related to use
3.1.1 Parameters influencing the energy consumption of the drier
The performance of the driers is based on two parameters:
• the annual energy consumption (AEc)
• the condensation efficiency (C)
The calculation method of the two parameters are defined in Commission Regulation (EU)
No 932/2012 and Commission delegated Regulation (EU) No 392/2012 and reflects the
consumer behaviour related to the use of tumble drier. They are presented here because
of their utmost importance to the review of the driers’ user behaviour.
Annual Energy Consumption (AEC)
The Annual Energy consumption is based on measurements of energy consumption and
the cycle time. The measurements are conducted with the standard cotton program
reducing the moisture content of the test fabric from 60% to 0%. The measurements are
made with both full load and partial load and the Regulation includes an inherent
assumption that for every 7 drying cycles, the machine is full loaded 3 times and part
loaded 4 times. Thus, the weighted energy consumption and time consumption are
calculated as:
𝐸𝑡 = (3 ∗ 𝐸𝑑𝑟𝑦 + 4 ∗ 𝐸𝑑𝑟𝑦½)/7
𝑇𝑡 = (3 ∗ 𝑇𝑑𝑟𝑦 + 4 ∗ 𝑇𝑑𝑟𝑦½)/7
The identifiers “dry” and “dry½” indicate the values measured at full and half load
respectively. The weighted energy, Et, and time, Tt, are then used to calculate the annual
energy consumption, AEC:
𝐴𝐸𝐶 = 𝐸𝑡 ∗ 160 +𝑃𝑜 ∗
525 600 − (𝑇𝑡 ∗ 160)2
+ 𝑃𝑙 ∗525 600 − (𝑇𝑡 ∗ 160)
260 ∗ 1000
The first part of the equation is simply the weighted energy consumption per cycle
multiplied with 160 cycles per year. The last part of the equation is the energy consumption
in off and left-on mode. With the equation it is assumed that the drier is in off mode half
of the time it is not in use, and in left-on mode the other half. Thus, the power consumption
(in watts) in off mode, Po, and left-on mode, Pl, are each multiplied with the number of
minutes in one year (525 600) minus the time the machine is in use (i.e. 160 times Tt
minutes) and divided by two. Hence the numerator of the fraction constituting the second
122
part of the equation equals the total power consumption in off and left-on mode of the
drier in one year, in the unit Watt-minutes. The denominator of the fraction is simply unit
conversion to kWh. The AEC is thus the energy consumption in both active and non-active
modes in a whole year.
For tumble driers with power management an alternative formula exists, where the drier
automatically goes to off-mode (from left-on) a specific time, Tl, after a program is finished.
For these driers the AEc is calculated instead as:
𝐴𝐸𝐶 = 𝐸𝑡 ∗ 160 +{(𝑃𝑙 ∗ 𝑇𝑙 ∗ 160) + 𝑃𝑜 ∗ [525600 − (𝑇𝑡 ∗ 160) − (𝑇𝑙 ∗ 160)]}
60 ∗ 1000
In this equation the time in left-on mode is known, and therefore the energy consumption
in left-on is simply the left-on power, Pl, multiplied with the left-on time, Tl, and 160 cycles
per year. The drier is then assumed to be in off-mode the remainder of the year, and the
off power, Po, is therefore multiplied with the total minutes in one year (525 600) minus
the time in use and in left-on.
For gas-fired tumble driers, the energy consumption is primary energy in the form of gas,
compared to electricity which is a secondary type of energy. Therefore, the Edry and Edry½
have to be scaled with the primary energy factor fg=2.5:
𝐸𝑑𝑟𝑦 =𝐸𝑔𝑑𝑟𝑦
𝑓𝑔
+ 𝐸𝑔𝑑𝑟𝑦,𝑎
The energy efficiency scale is based on the EEI value, which is derived from the AEC and
the SAEC (Standard Annual Energy Consumption) values of the drier, and calculated as a
percentage:
𝐸𝐸𝐼 = 𝐴𝐸𝐶
𝑆𝐴𝐸𝐶
∗ 100
The SAEc is based on the rated capacity, c, of the drier in kg and calculated as:
𝑆𝐴𝐸𝐶 = 140 ∗ 𝑐0.8
Where 140 is a scaling factor correlating energy consumption and capacity, and the
exponent “0.8” is to correct the non-linear relationship between total energy consumption
and drying load.
For air-vented appliances the SAEC is calculated as:
𝑆𝐴𝐸𝐶 = 140 ∗ 𝑐0,8 − (30 ∗𝑇𝑡
60)
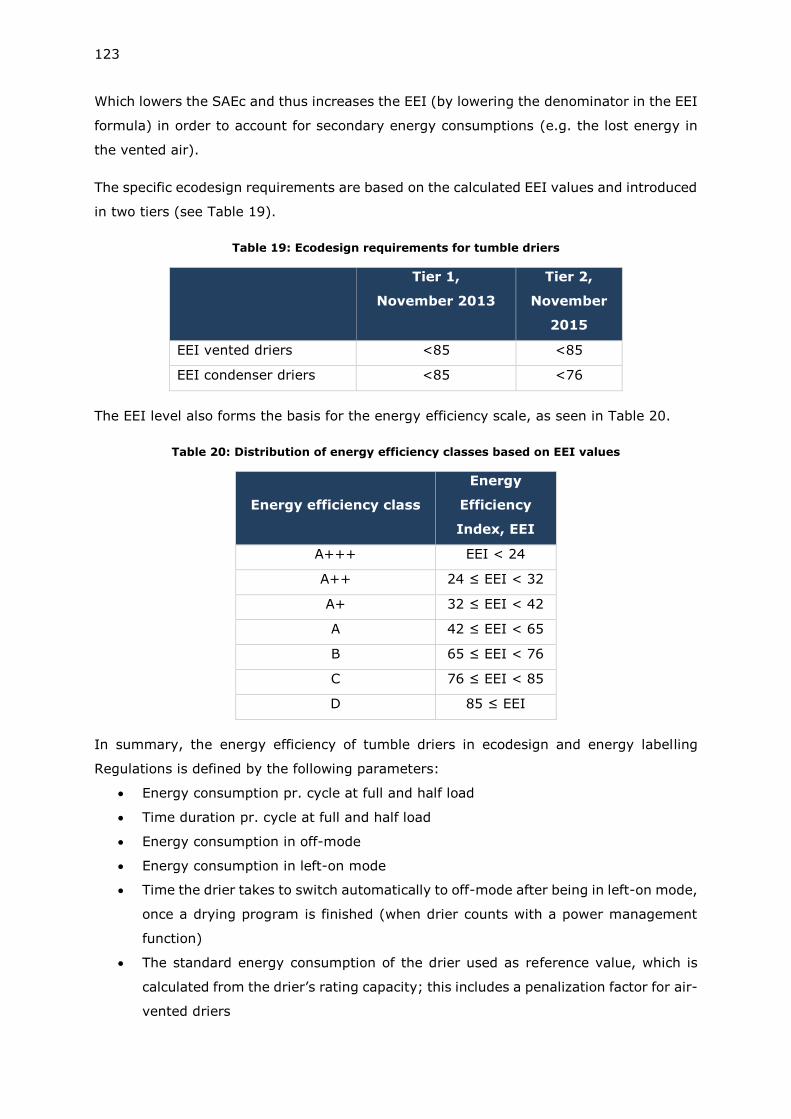
123
Which lowers the SAEc and thus increases the EEI (by lowering the denominator in the EEI
formula) in order to account for secondary energy consumptions (e.g. the lost energy in
the vented air).
The specific ecodesign requirements are based on the calculated EEI values and introduced
in two tiers (see Table 19).
Table 19: Ecodesign requirements for tumble driers
Tier 1,
November 2013
Tier 2,
November
2015
EEI vented driers <85 <85
EEI condenser driers <85 <76
The EEI level also forms the basis for the energy efficiency scale, as seen in Table 20.
Table 20: Distribution of energy efficiency classes based on EEI values
Energy efficiency class
Energy
Efficiency
Index, EEI
A+++ EEI < 24
A++ 24 ≤ EEI < 32
A+ 32 ≤ EEI < 42
A 42 ≤ EEI < 65
B 65 ≤ EEI < 76
C 76 ≤ EEI < 85
D 85 ≤ EEI
In summary, the energy efficiency of tumble driers in ecodesign and energy labelling
Regulations is defined by the following parameters:
• Energy consumption pr. cycle at full and half load
• Time duration pr. cycle at full and half load
• Energy consumption in off-mode
• Energy consumption in left-on mode
• Time the drier takes to switch automatically to off-mode after being in left-on mode,
once a drying program is finished (when drier counts with a power management
function)
• The standard energy consumption of the drier used as reference value, which is
calculated from the drier’s rating capacity; this includes a penalization factor for air-
vented driers
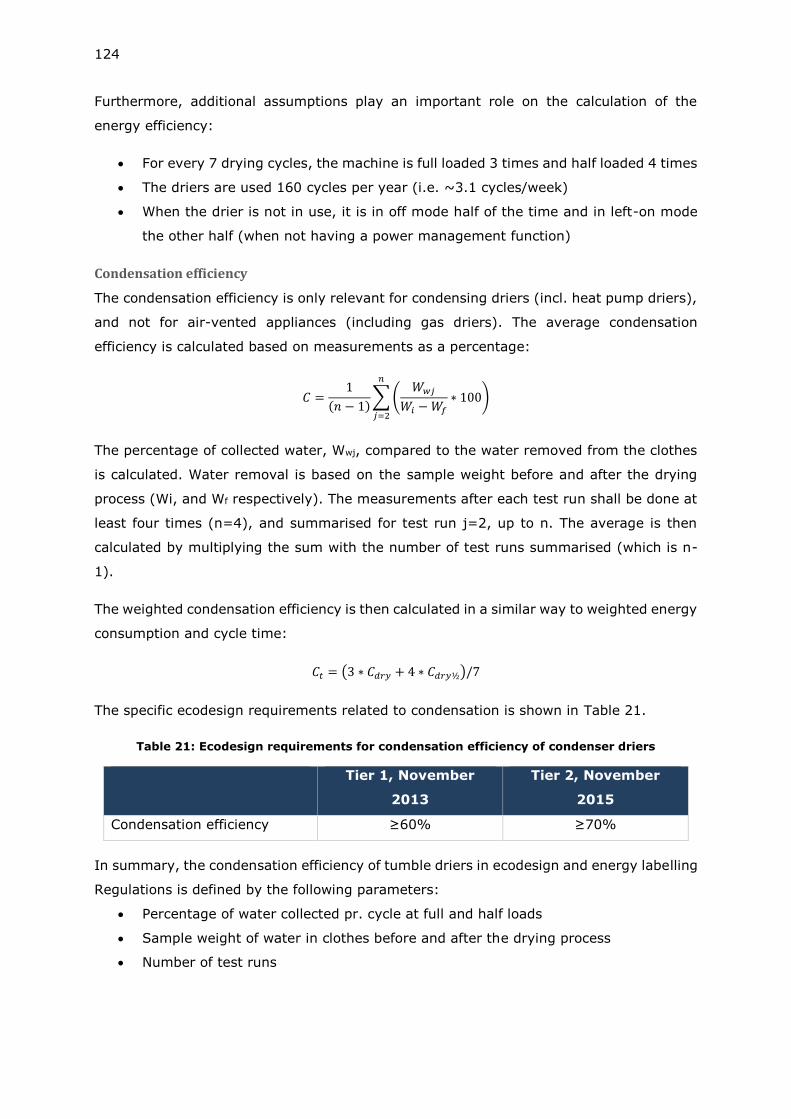
124
Furthermore, additional assumptions play an important role on the calculation of the
energy efficiency:
• For every 7 drying cycles, the machine is full loaded 3 times and half loaded 4 times
• The driers are used 160 cycles per year (i.e. ~3.1 cycles/week)
• When the drier is not in use, it is in off mode half of the time and in left-on mode
the other half (when not having a power management function)
Condensation efficiency
The condensation efficiency is only relevant for condensing driers (incl. heat pump driers),
and not for air-vented appliances (including gas driers). The average condensation
efficiency is calculated based on measurements as a percentage:
𝐶 =1
(𝑛 − 1)∑ (
𝑊𝑤𝑗
𝑊𝑖 − 𝑊𝑓
∗ 100)
𝑛
𝑗=2
The percentage of collected water, Wwj, compared to the water removed from the clothes
is calculated. Water removal is based on the sample weight before and after the drying
process (Wi, and Wf respectively). The measurements after each test run shall be done at
least four times (n=4), and summarised for test run j=2, up to n. The average is then
calculated by multiplying the sum with the number of test runs summarised (which is n-
1).
The weighted condensation efficiency is then calculated in a similar way to weighted energy
consumption and cycle time:
𝐶𝑡 = (3 ∗ 𝐶𝑑𝑟𝑦 + 4 ∗ 𝐶𝑑𝑟𝑦½)/7
The specific ecodesign requirements related to condensation is shown in Table 21.
Table 21: Ecodesign requirements for condensation efficiency of condenser driers
Tier 1, November
2013
Tier 2, November
2015
Condensation efficiency ≥60% ≥70%
In summary, the condensation efficiency of tumble driers in ecodesign and energy labelling
Regulations is defined by the following parameters:
• Percentage of water collected pr. cycle at full and half loads
• Sample weight of water in clothes before and after the drying process
• Number of test runs
125
Furthermore, the assumption concerning the distribution between full and half load play
also an important role on the calculation of the energy efficiency:
For every 7 drying cycles, the machine is full loaded 3 times and half loaded 4 times
3.1.2 User Behaviour
Data sources and main parameters
Summarising, the main parameters affected by user behaviour that are important to the
energy and condensation efficiency of a tumble drier are:
• The average number of cycles per week
• The loading of the drier per cycle, i.e. how much is the machine filled in average
with respect to its rated capacity
• The time the machine is left on left-on mode by the user before it is switched off
• Additionally, the cleaning frequency of lint filter and heat exchanger is important to
ensure consistent performance of the machine, as failing to regularly do so will
increase the energy consumption per cycle101 102
Two online surveys are available that cover a wide range of aspects concerning the user
behaviour of tumble driers in the EU market by consumers: the 2009 preparatory study
and the study conducted for APPLiA by InSite Consulting103. Other studies on washing
behaviour are also available. Due to the interlink between washing and drying loads, these
studies can be used to assess the general laundry behaviour and/or to validate the drying
behaviour studies.
Results from the drying studies are summarised in Table 22. Results from the washing
studies are summarised in Table 23.
Note that the APPLiA study only covered people who owned a tumble drier. Similarly, the
preparatory study consumer survey covered a sample of people with 86% owning a tumble
drier. This is consequently far from the penetration rate of 23% found in task 2. Values in
Table 22 and Table 23 represent mostly people owning a tumble drier and not the whole
of EU28. This can also explain the large difference in drying amounts between the APPLiA
and the Alborzi study.
There are generally two different ways the studies are conducted, by online surveys or by
measuring the actual load used in each cycle (“Metering studies”). The online surveys from
101 According to input from stakeholders 102 “EXPENSIVE MEASURES FOR THE ENVIRONMENT”, Berge et al., RÅD & RÖN No. 7, 2012 103 APPLiA and InSites Consulting. (2018). Tumble dryer usage and attitudes: A survey in 12 European countries (not publicly available). Draft version.
126
the preparatory study, APPLiA, and Alborzi have by far the largest statistical population
and geographical scope, but also introduce subjectivity as these are not ‘metering studies’
and thus answers are being subject to personal bias and subjectivity.
Table 22: Key findings for drying behaviour studies
Data source Preparatory study104 APPLiA consumer
questionnaire92
Author PWC InSites Consulting
Data source, age Online survey, 648
valid surveys, 2008.
Online survey, 2426 valid
surveys, 2018.
Countries UK, FR, PL NL, UK, FR, GE, ES, IT, PL,
CZ, HU, FI, SE, TR
Scope Drying behaviour Drying and washing
behaviour
Average load/cycle 4.5kg / 3.4kg105 4.4106kg
Average nominal capacity 5.7 kg 7.1 kg
Frequency of use [Cycles/Person/Week] 0.7 (Summer)
1.1 (Winter)
0.6 (Summer)
0.8 (Winter)
Frequency of use [Cycles/Household/Week] 2.3 (Summer)
3.6 (Winter)
1.7 (Summer)
2.4 (Winter)
% of washing load that is dried in tumble
drier during winter 50% 72%
% of washing load that is dried in tumble
drier during summer 24% 51%
104 Preparatory studies for Ecodesign requirements of Energy-using-Products (EuP) – Lot 16, Ecodesign of Laundry Dryers, PriceWaterhouseCoopers, 2009. 105 The conducted online survey during the preparatory study resulted in 4.5kg. However, the preparatory study team chose 3.4kg after stakeholder consultation, to keep consistency with washing machine studies. 106 Based on average loading %, and average machine capacity.
127
Table 23. Available studies on washing behaviours
Data source Study 1 107 Study 2108 Study 3109 Study 4110
Author Berkholz et al. Krushwitz et al. Alborzi et al. P&G
Data source, age
30-day
metering study,
100 households,
2007
28-day metering
study, 236
households, 2009.
Online survey,
4843 valid
surveys, 2015.
Metering study,
276 households,
2015
Countries DE DE
CZ, DE, FI, FR,
HU, IT, PL, RO,
SE, ES, UK
FR
Scope Washing
machines
Washing
behaviour
Washing
machines,
drying
behaviour
Washing
machines
Average washing
load/cycle 3.4kg 3.3kg 5.7kg111 3.24kg
Average capacity (Washing
machine) 5kg 5kg 6.5kg 6.24kg
Frequency of use
[Cycles/Person/Week] 1.7 1.7 1.5 -
% washing load that is
dried in tumble drier
during winter
- - 19% -
% washing load that is
dried in tumble drier
during summer
- - 11% -
Cycles per week
The number of drying cycles per week is affected by the washing cycles per week, as all
the dried laundry is wetted through the washer.
The amount of cycles per week has decreased from the preparatory study (2008) to the
APPLiA survey (2018). This is consistent with the increase in rated capacity but might also
be due to the very different scopes of the surveys.
107 Berkholz P., et al: Verbraucherverhalten und verhaltensabhängige Einsparpotenziale beim Betrieb von Waschmaschine, Shaker-Verlag, 2007 108 Kruschwitz, A.; Karle, A.; Schmitz, A. & Stamminger, R. (2014). Consumer laundry practices in Germany. International Journal of Consumer Studies, 38(3), pp. 265–277. 109 A Alborzi, F.; Schmitz, A. & Stamminger, R. (2017). Washing behaviour of European consumers 2017, Shaker Verlag 110 Proctor & Gamle: Load Weight Study - France 2015, Workshop on how to improve testing methods for washing machines and washer-dryers, Annex 6, 2016. 111 Calculated as a weighted average, based on consumer loading behaviour on physical loading capacity, fig. 87.
128
The APPLiA survey shows that especially the northern countries (I.e. Sweden, Finland) use
their tumble driers significantly more during the winter. This might also express the large
difference in the percentage of laundry being dried at summer/winter times between the
two studies. As the preparatory survey did not include any of these, the comparison might
not be justified. The APPLiA study is used as reference, at 1.7 & 2.4 cycles per week per
household during the summer and winter respectively, equal to an average of 2.05 cycles
per week or 107 cycles per year.
The Alborzi study also investigated the percentage of drying done in tumble driers. These
figures significantly differ from the other studies. No explanation on why is however
available.
Loading of the drier
As the market trend is favouring driers with larger capacities (see Figure 33) two things
can happen to consumer loading behaviour:
a. The loading behaviour can remain constant, meaning that the amount of laundry
loaded per cycle is unchanged compared to 2008112, or
b. the loaded laundry can increase, which could mean fewer but longer cycles.
The loading of the drier is important as it affects the specific energy consumption of the
drier in terms of the energy used per kg of dried laundry. According to input from industry,
a fixed energy is required to heat up the drier itself, regardless of the amount of loaded
laundry. This increases the specific energy consumption at partial loads113. Furthermore,
as the drum volume is less full at lower loads, the drying air comes into less laundry-
surface area, which reduces the effectiveness of the drying and hence increases the energy
consumption.
Some manufacturers use the same drum volume independently of the nominal capacity.
The change in capacity is thus based on motor sizes and heating capabilities instead. Other
manufacturer differentiate between drum volumes between models at different rated
capacities. For manufacturer using the same drum volume for driers at capacities of i.e.
7kg and 9kg, the increase in specific energy consumption at partial loads will be smaller,
compared to manufacturer using different drum volumes.
The effect is visualised in Figure 44 where specific energy consumption at full and half load
operations are shown for 177 drier models on the market. Differences up to 14% in energy
112 Year of survey used in the preparatory study. 113 “Partial” here meaning a drier not loaded at 100% nominal capacity.
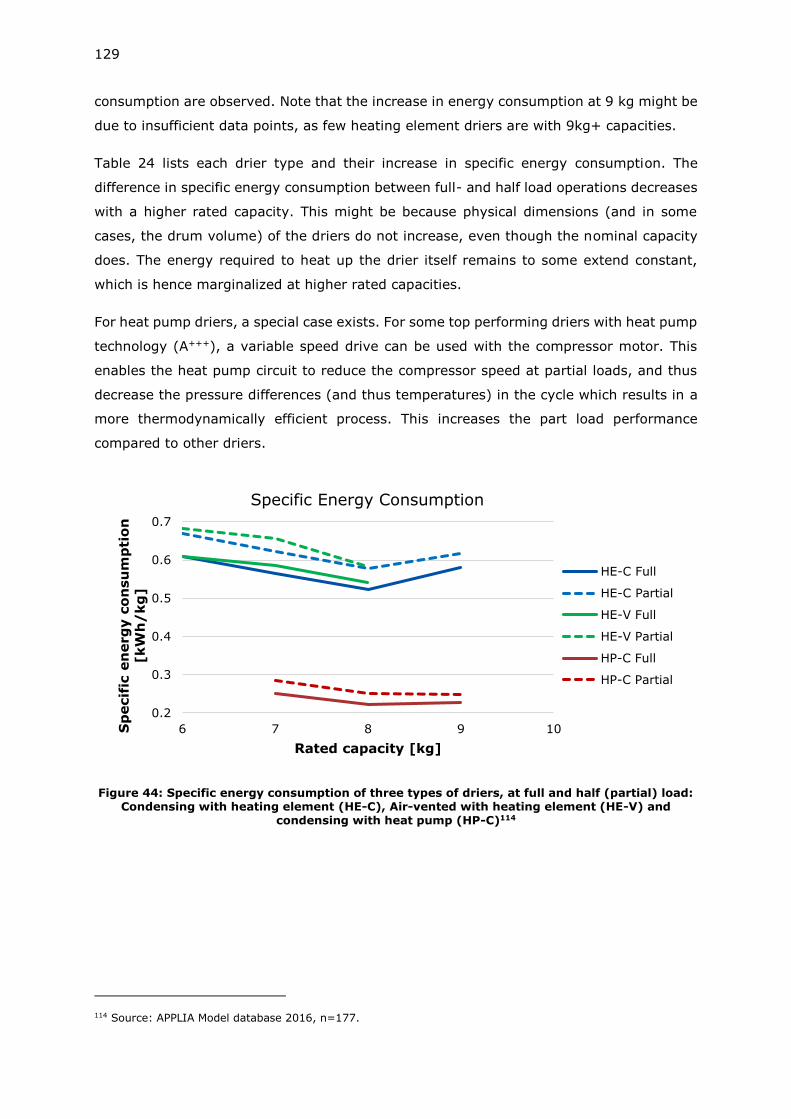
129
consumption are observed. Note that the increase in energy consumption at 9 kg might be
due to insufficient data points, as few heating element driers are with 9kg+ capacities.
Table 24 lists each drier type and their increase in specific energy consumption. The
difference in specific energy consumption between full- and half load operations decreases
with a higher rated capacity. This might be because physical dimensions (and in some
cases, the drum volume) of the driers do not increase, even though the nominal capacity
does. The energy required to heat up the drier itself remains to some extend constant,
which is hence marginalized at higher rated capacities.
For heat pump driers, a special case exists. For some top performing driers with heat pump
technology (A+++), a variable speed drive can be used with the compressor motor. This
enables the heat pump circuit to reduce the compressor speed at partial loads, and thus
decrease the pressure differences (and thus temperatures) in the cycle which results in a
more thermodynamically efficient process. This increases the part load performance
compared to other driers.
Figure 44: Specific energy consumption of three types of driers, at full and half (partial) load: Condensing with heating element (HE-C), Air-vented with heating element (HE-V) and
condensing with heat pump (HP-C)114
114 Source: APPLIA Model database 2016, n=177.
0.2
0.3
0.4
0.5
0.6
0.7
6 7 8 9 10Sp
ecif
ic e
nerg
y c
on
su
mp
tio
n
[kW
h/
kg
]
Rated capacity [kg]
Specific Energy Consumption
HE-C Full
HE-C Partial
HE-V Full
HE-V Partial
HP-C Full
HP-C Partial
130
Table 24: Increase in specific energy consumption between full and half load operations114
Capacity [kg] / Type HP-C HE-C HE-V
6 - 10% 12%
7 14% 10% 12%
8 13% 11% 8%
9 9% 6% -
10 - - -
The washing machine preparatory study from 2017 shows that washing machines are
increasing in average nominal capacity but not in average load. This study shows an
increase in specific energy consumption for washing machines at up to 50% at part load
operations115.
In terms of investigating the average load in the online surveys, different approaches
where used. The 2009 tumble drier preparatory study asked the consumers what their
average load per cycle was, with ranges (e.g. 4-5kg) as options. Asking the consumers to
specify the amount of kilos of laundry they wash per cycle can be especially difficult, as no
reference point exists and thus consumers will likely not know the amount of load per
cycle.
Alborzi addresses this by asking the consumers how they usually load their machine, in
terms of the maximum physical capacity (“How do you usually load your machine?”) of the
machine (i.e. nominal load). This might also suffer from the same bias as the preparatory
study, as consumers might have different ideas of what a “full” machine looks like.
The APPLiA study tries to remedy this by supplying pictures of a machine being loaded
25%-100%.
Three of the washing studies116 were made by measuring the processed laundry, hence
removing the consumer bias uncertainties. The average washing load measured from these
(3.4kg, 3.3kg, and 3.24kg) differs greatly from the Alborzi online survey study at 5.7kg.
Even though the studies are only related to German and France households, Alborzi F. et
al117 shows that at least from a consumer’s point of view, German and French washing
behaviour is close to the EU-28 average, meaning these studies could be used as a
reference for determining the laundry behaviour of the EU-28 average.
Furthermore, comparing the loads from the 2015 P&G study on washing machines and
2018 APPLiA consumer survey on tumble drying load at 3.2kg and 4.4kg respectively, it is
115 Ecodesign and Energy Label for Household Washing machines and washer dryers – preparatory study, JRC, 2017, p.326 116 Berkholz et al., Krushwitz et al., P&G. 117 Alborzi, F.; Schmitz, A. & Stamminger, R. (2017). Washing behaviour of European consumers, fig. 87, 2017, Shaker Verlag
131
clear that the major difference between the different studies origins in the way they are
fundamentally conducted. Even though the metering studies might prove to be more
precise per data point, they are aimed at washing behaviour and with a significantly smaller
statistical population and country coverage. The real drying average load is hence assumed
to be somewhere between 3.2kg – 4.4kg, based on the P&G and APPLiA study respectively,
as they consist of the newest available data.
The preparatory study estimated that about 160 kg of laundry per person are dried by
every tumble drier in the EU every year, based on an average use of 0.9
cycles/week/person and an average load of 3.4 kg/cycle. Assuming the 160 kg dried
laundry per person per machine per year is still valid and using the new cycles/week from
the APPLiA study (see Table 22), this results in an average load of 4.37kg118. 4.4kg is
hence used as a baseline load for the rest of the study. From this study an average loading
percentage of 62% was established as well, based on an average drier size for the people
surveyed at 7.1 kg.
Cleaning frequency of filters
The APPLiA study investigated the cleaning frequency of the lint filter and condenser unit,
shown in Figure 45. It shows that 45% of users clean the lint filter before every cycle as
suggested by the manufacturers, and that 29% of consumers with heat element
condensing driers clean the condenser after every drying cycle. Overall, this means that
on average it can be estimated that the EU consumers clean their lint filters every 1.7
cycles and their condenser filters every 2.3 cycles119. Based on stakeholders’ input, these
estimated frequencies are too high. APPLiA suggested that the values for “Cleaning of other
filters” was used instead. This had a lower cleaning frequency of 4.1 cycles between each
cleaning.
118 (
0.7+1.1
2)×3.4×365/7
(0.6+0.8
2)×365/7
= 4.37kg
119 Calculated using a weighted average of the time between each filter cleaning from Figure 45 and the associated percentages, and the previously found cycles per week. For instance, 18% of answered households clean the filter every month. Using an average cycle of 2.05 cycles/week, this means that the filter is cleaned 0.11 times
per cycle equal to 8.9 cycles between each clean (1
𝑐𝑙𝑒𝑎𝑛
𝑚𝑜𝑛𝑡ℎ
2.05 𝑐𝑦𝑐𝑙𝑒𝑠
𝑤𝑒𝑒𝑘×4.3
𝑤𝑒𝑒𝑘
𝑚𝑜𝑛𝑡ℎ
= 0.11𝑐𝑙𝑒𝑎𝑛
𝑐𝑦𝑐𝑙𝑒= 8.9
𝑐𝑦𝑐𝑙𝑒
𝑐𝑙𝑒𝑎𝑛).
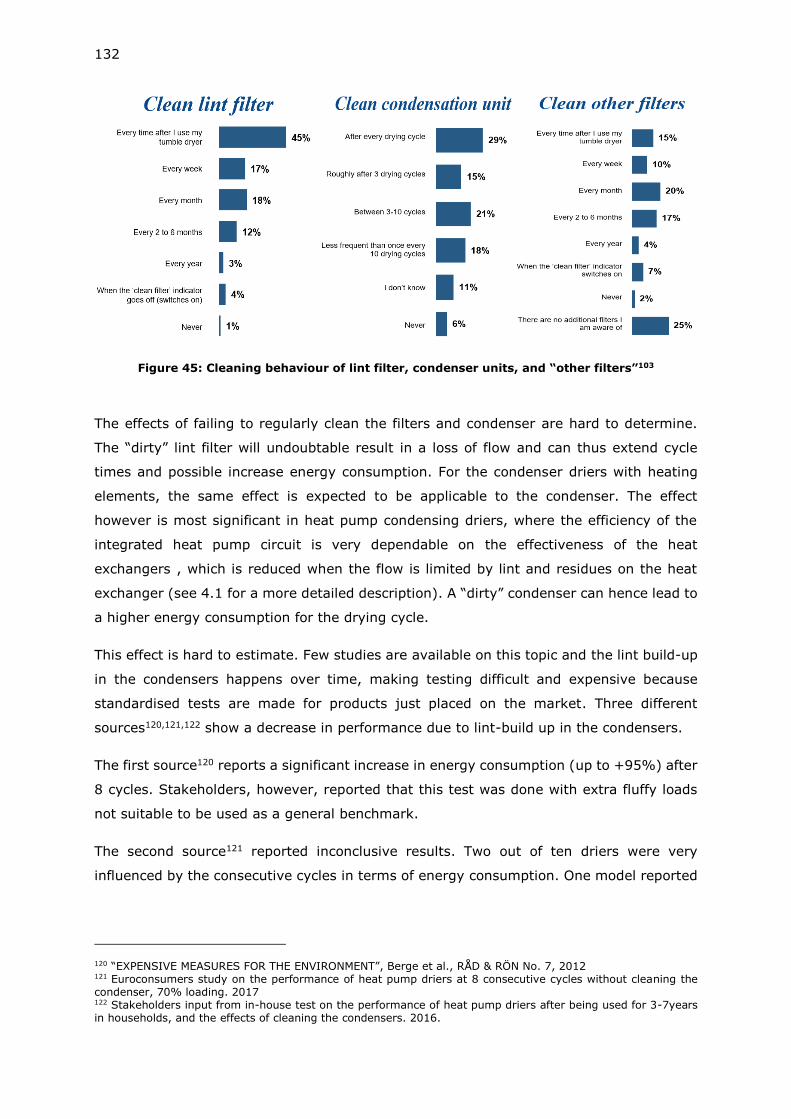
132
Figure 45: Cleaning behaviour of lint filter, condenser units, and “other filters”103
The effects of failing to regularly clean the filters and condenser are hard to determine.
The “dirty” lint filter will undoubtable result in a loss of flow and can thus extend cycle
times and possible increase energy consumption. For the condenser driers with heating
elements, the same effect is expected to be applicable to the condenser. The effect
however is most significant in heat pump condensing driers, where the efficiency of the
integrated heat pump circuit is very dependable on the effectiveness of the heat
exchangers , which is reduced when the flow is limited by lint and residues on the heat
exchanger (see 4.1 for a more detailed description). A “dirty” condenser can hence lead to
a higher energy consumption for the drying cycle.
This effect is hard to estimate. Few studies are available on this topic and the lint build-up
in the condensers happens over time, making testing difficult and expensive because
standardised tests are made for products just placed on the market. Three different
sources120,121,122 show a decrease in performance due to lint-build up in the condensers.
The first source120 reports a significant increase in energy consumption (up to +95%) after
8 cycles. Stakeholders, however, reported that this test was done with extra fluffy loads
not suitable to be used as a general benchmark.
The second source121 reported inconclusive results. Two out of ten driers were very
influenced by the consecutive cycles in terms of energy consumption. One model reported
120 “EXPENSIVE MEASURES FOR THE ENVIRONMENT”, Berge et al., RÅD & RÖN No. 7, 2012 121 Euroconsumers study on the performance of heat pump driers at 8 consecutive cycles without cleaning the condenser, 70% loading. 2017 122 Stakeholders input from in-house test on the performance of heat pump driers after being used for 3-7years in households, and the effects of cleaning the condensers. 2016.
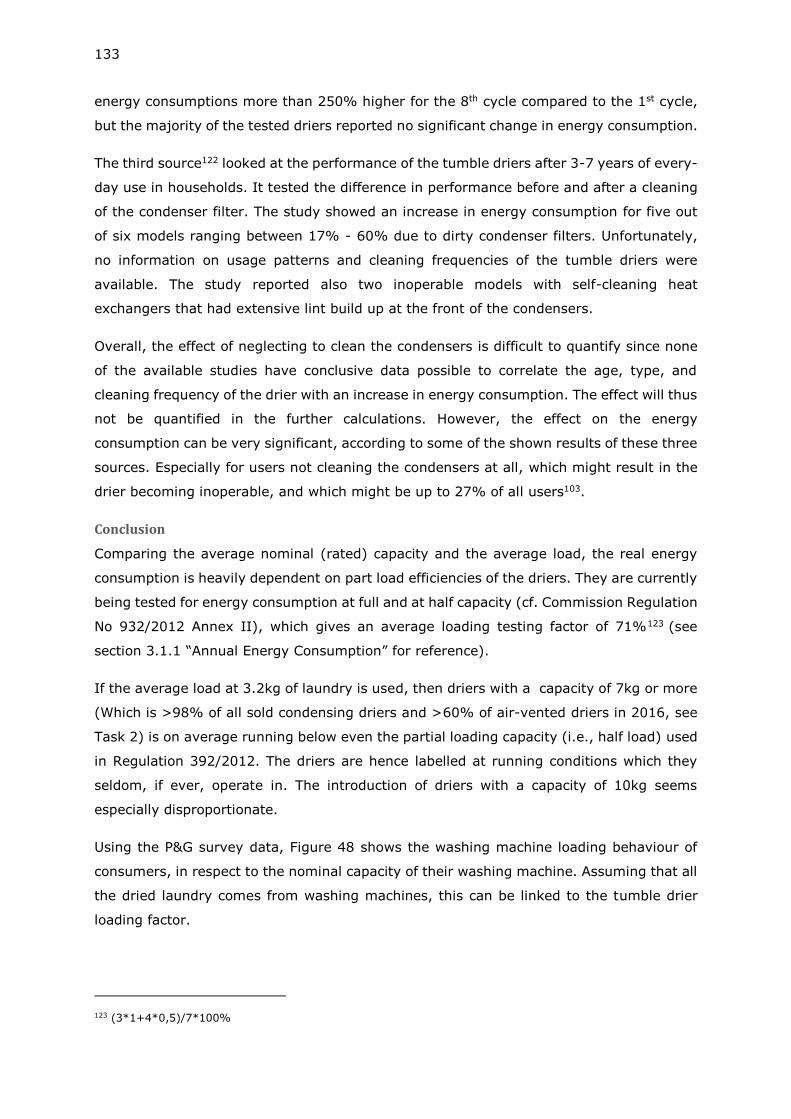
133
energy consumptions more than 250% higher for the 8th cycle compared to the 1st cycle,
but the majority of the tested driers reported no significant change in energy consumption.
The third source122 looked at the performance of the tumble driers after 3-7 years of every-
day use in households. It tested the difference in performance before and after a cleaning
of the condenser filter. The study showed an increase in energy consumption for five out
of six models ranging between 17% - 60% due to dirty condenser filters. Unfortunately,
no information on usage patterns and cleaning frequencies of the tumble driers were
available. The study reported also two inoperable models with self-cleaning heat
exchangers that had extensive lint build up at the front of the condensers.
Overall, the effect of neglecting to clean the condensers is difficult to quantify since none
of the available studies have conclusive data possible to correlate the age, type, and
cleaning frequency of the drier with an increase in energy consumption. The effect will thus
not be quantified in the further calculations. However, the effect on the energy
consumption can be very significant, according to some of the shown results of these three
sources. Especially for users not cleaning the condensers at all, which might result in the
drier becoming inoperable, and which might be up to 27% of all users103.
Conclusion
Comparing the average nominal (rated) capacity and the average load, the real energy
consumption is heavily dependent on part load efficiencies of the driers. They are currently
being tested for energy consumption at full and at half capacity (cf. Commission Regulation
No 932/2012 Annex II), which gives an average loading testing factor of 71%123 (see
section 3.1.1 “Annual Energy Consumption” for reference).
If the average load at 3.2kg of laundry is used, then driers with a capacity of 7kg or more
(Which is >98% of all sold condensing driers and >60% of air-vented driers in 2016, see
Task 2) is on average running below even the partial loading capacity (i.e., half load) used
in Regulation 392/2012. The driers are hence labelled at running conditions which they
seldom, if ever, operate in. The introduction of driers with a capacity of 10kg seems
especially disproportionate.
Using the P&G survey data, Figure 48 shows the washing machine loading behaviour of
consumers, in respect to the nominal capacity of their washing machine. Assuming that all
the dried laundry comes from washing machines, this can be linked to the tumble drier
loading factor.
123 (3*1+4*0,5)/7*100%
134
Figure 46: Nominal washing machine rated capacity compared to real use. Loading factor
defined as Real amount of laundry pr. cycle
Recommend maximum load 𝐱 𝟏𝟎𝟎%. Data source: P&G110
Using the washing machine rated capacity as reference, Figure 46 shows that even the
smallest machines with a capacity of 5-6kg, are on average running below the average
load of the energy consumption testing procedure. This difference is only increasing with
machines with higher rated capacities. As the figure shows the amount of washed
laundry per cycle is not directly proportional to the capacity of the machine.
Users are heavily influenced by the energy efficiency when buying new tumble driers124,
but as the efficiency of the driers are generally higher at larger capacities (especially heat
pump driers due to compressor efficiencies in general), users could be biased towards
buying driers with higher capacities which are labelled as more energy efficient, although
they in real life conditions – due to part load operations – may not be.
The current testing procedures at full and half load conditions can hence be used as a
comparative tool between products but is unlikely to represent the real annual energy
consumption for the average user, and less so in the future with foreseen increasingly large
capacity driers on the market. Changing the testing procedure to reflect the real use, could
potentially reverse the trend of manufacturers producing unnecessary large units, and
emphasize the importance of having driers which can differentiate between being fully
loaded and being almost empty.
The annual energy consumption is currently based on 160 cycles/year. As stated in section
3.2, this might not be representative, as the amount of drying done in tumble driers has
124 PWC: Ecodesign of Laundry Dryers, Preparatory studies for Ecodesign requirements of Energy-using-Products (EuP) – Lot 16, Final Report, March 2009, fig. 68.
40%
50%
60%
70%
80%
5 6 7 8 9 10
Load
ing
fact
or
Nominal washing mashine capacity [kg]
Real use vs. EEI testing average load
P&G Consumer data EEI testing average load
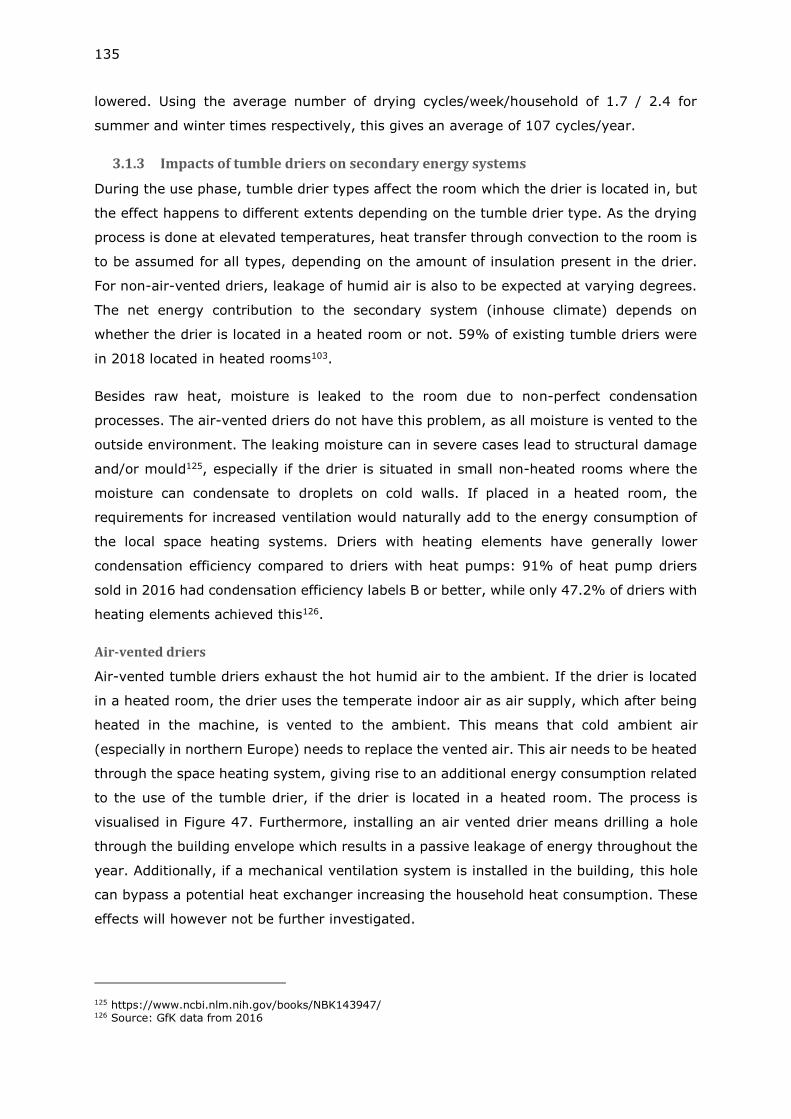
135
lowered. Using the average number of drying cycles/week/household of 1.7 / 2.4 for
summer and winter times respectively, this gives an average of 107 cycles/year.
3.1.3 Impacts of tumble driers on secondary energy systems
During the use phase, tumble drier types affect the room which the drier is located in, but
the effect happens to different extents depending on the tumble drier type. As the drying
process is done at elevated temperatures, heat transfer through convection to the room is
to be assumed for all types, depending on the amount of insulation present in the drier.
For non-air-vented driers, leakage of humid air is also to be expected at varying degrees.
The net energy contribution to the secondary system (inhouse climate) depends on
whether the drier is located in a heated room or not. 59% of existing tumble driers were
in 2018 located in heated rooms103.
Besides raw heat, moisture is leaked to the room due to non-perfect condensation
processes. The air-vented driers do not have this problem, as all moisture is vented to the
outside environment. The leaking moisture can in severe cases lead to structural damage
and/or mould125, especially if the drier is situated in small non-heated rooms where the
moisture can condensate to droplets on cold walls. If placed in a heated room, the
requirements for increased ventilation would naturally add to the energy consumption of
the local space heating systems. Driers with heating elements have generally lower
condensation efficiency compared to driers with heat pumps: 91% of heat pump driers
sold in 2016 had condensation efficiency labels B or better, while only 47.2% of driers with
heating elements achieved this126.
Air-vented driers
Air-vented tumble driers exhaust the hot humid air to the ambient. If the drier is located
in a heated room, the drier uses the temperate indoor air as air supply, which after being
heated in the machine, is vented to the ambient. This means that cold ambient air
(especially in northern Europe) needs to replace the vented air. This air needs to be heated
through the space heating system, giving rise to an additional energy consumption related
to the use of the tumble drier, if the drier is located in a heated room. The process is
visualised in Figure 47. Furthermore, installing an air vented drier means drilling a hole
through the building envelope which results in a passive leakage of energy throughout the
year. Additionally, if a mechanical ventilation system is installed in the building, this hole
can bypass a potential heat exchanger increasing the household heat consumption. These
effects will however not be further investigated.
125 https://www.ncbi.nlm.nih.gov/books/NBK143947/ 126 Source: GfK data from 2016
136
Figure 47: Secondary system impact for air-vented tumble driers
Assuming an average air flow of 120 [m3/h]127, and a cycle time of 123 minutes128 the
additional energy consumption based on ambient/atmospheric temperatures can be
calculated as:
𝑄 = 𝑐𝑝 ∗ �̇� ∗ (𝑇𝑟𝑜𝑜𝑚 − 𝑇𝑎𝑡𝑚𝑜𝑠𝑝ℎ𝑒𝑟𝑖𝑐)
With cp being the specific heat capacity of air, and �̇� being the air mass flow. The
additional energy consumption (in heat) can be seen on Figure 48 in both instantaneous
consumption in kW (Left Y-axis), and total consumption for an 123 min cycle in kWh
(Right Y-axis)
127 Preparatory study, p.194 128 Based on the average value of a weighted cycle time (for full and half loads) for air-vented driers, from GfK, 2016 data
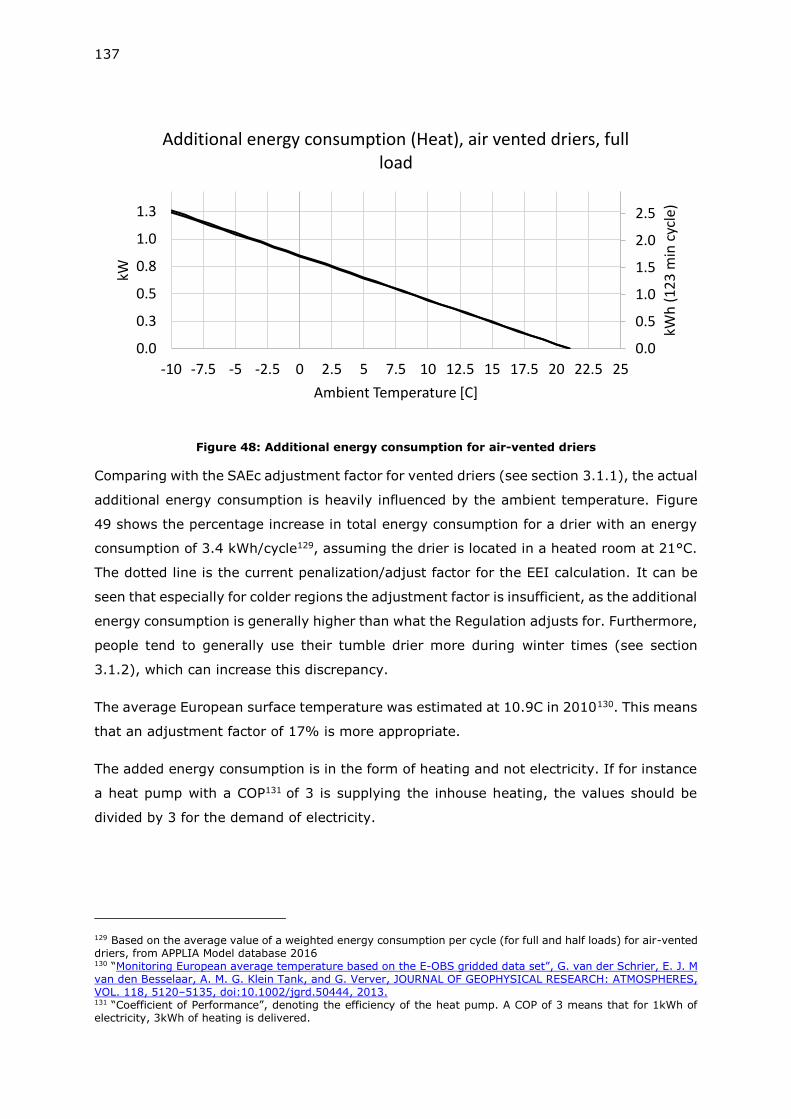
137
Figure 48: Additional energy consumption for air-vented driers
Comparing with the SAEc adjustment factor for vented driers (see section 3.1.1), the actual
additional energy consumption is heavily influenced by the ambient temperature. Figure
49 shows the percentage increase in total energy consumption for a drier with an energy
consumption of 3.4 kWh/cycle129, assuming the drier is located in a heated room at 21°C.
The dotted line is the current penalization/adjust factor for the EEI calculation. It can be
seen that especially for colder regions the adjustment factor is insufficient, as the additional
energy consumption is generally higher than what the Regulation adjusts for. Furthermore,
people tend to generally use their tumble drier more during winter times (see section
3.1.2), which can increase this discrepancy.
The average European surface temperature was estimated at 10.9C in 2010130. This means
that an adjustment factor of 17% is more appropriate.
The added energy consumption is in the form of heating and not electricity. If for instance
a heat pump with a COP131 of 3 is supplying the inhouse heating, the values should be
divided by 3 for the demand of electricity.
129 Based on the average value of a weighted energy consumption per cycle (for full and half loads) for air-vented driers, from APPLIA Model database 2016 130 “Monitoring European average temperature based on the E-OBS gridded data set”, G. van der Schrier, E. J. M van den Besselaar, A. M. G. Klein Tank, and G. Verver, JOURNAL OF GEOPHYSICAL RESEARCH: ATMOSPHERES, VOL. 118, 5120–5135, doi:10.1002/jgrd.50444, 2013. 131 “Coefficient of Performance”, denoting the efficiency of the heat pump. A COP of 3 means that for 1kWh of electricity, 3kWh of heating is delivered.
0.0
0.5
1.0
1.5
2.0
2.5
0.0
0.3
0.5
0.8
1.0
1.3
-10 -7.5 -5 -2.5 0 2.5 5 7.5 10 12.5 15 17.5 20 22.5 25
kWh
(1
23
min
cyc
le)
kW
Ambient Temperature [C]
Additional energy consumption (Heat), air vented driers, full load
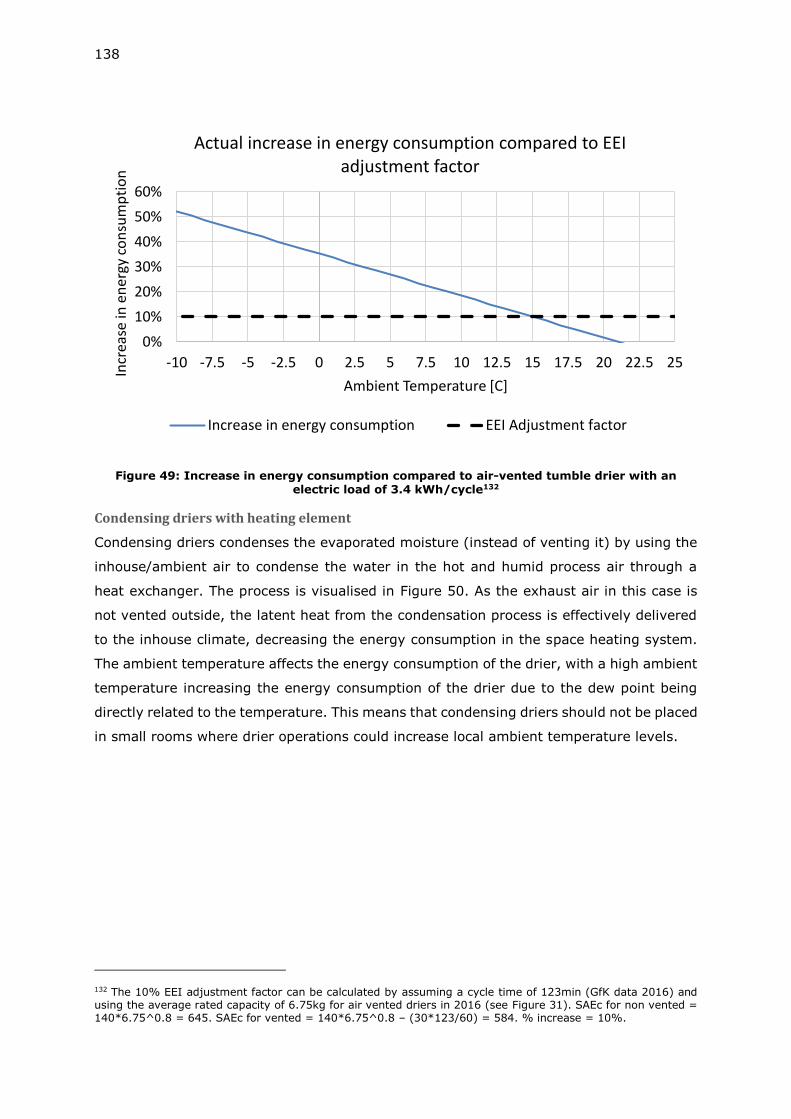
138
Figure 49: Increase in energy consumption compared to air-vented tumble drier with an electric load of 3.4 kWh/cycle132
Condensing driers with heating element
Condensing driers condenses the evaporated moisture (instead of venting it) by using the
inhouse/ambient air to condense the water in the hot and humid process air through a
heat exchanger. The process is visualised in Figure 50. As the exhaust air in this case is
not vented outside, the latent heat from the condensation process is effectively delivered
to the inhouse climate, decreasing the energy consumption in the space heating system.
The ambient temperature affects the energy consumption of the drier, with a high ambient
temperature increasing the energy consumption of the drier due to the dew point being
directly related to the temperature. This means that condensing driers should not be placed
in small rooms where drier operations could increase local ambient temperature levels.
132 The 10% EEI adjustment factor can be calculated by assuming a cycle time of 123min (GfK data 2016) and using the average rated capacity of 6.75kg for air vented driers in 2016 (see Figure 31). SAEc for non vented = 140*6.75^0.8 = 645. SAEc for vented = 140*6.75^0.8 – (30*123/60) = 584. % increase = 10%.
0%
10%
20%
30%
40%
50%
60%
-10 -7.5 -5 -2.5 0 2.5 5 7.5 10 12.5 15 17.5 20 22.5 25
Incr
ease
in e
ner
gy c
on
sum
pti
on
Ambient Temperature [C]
Actual increase in energy consumption compared to EEI adjustment factor
Increase in energy consumption EEI Adjustment factor
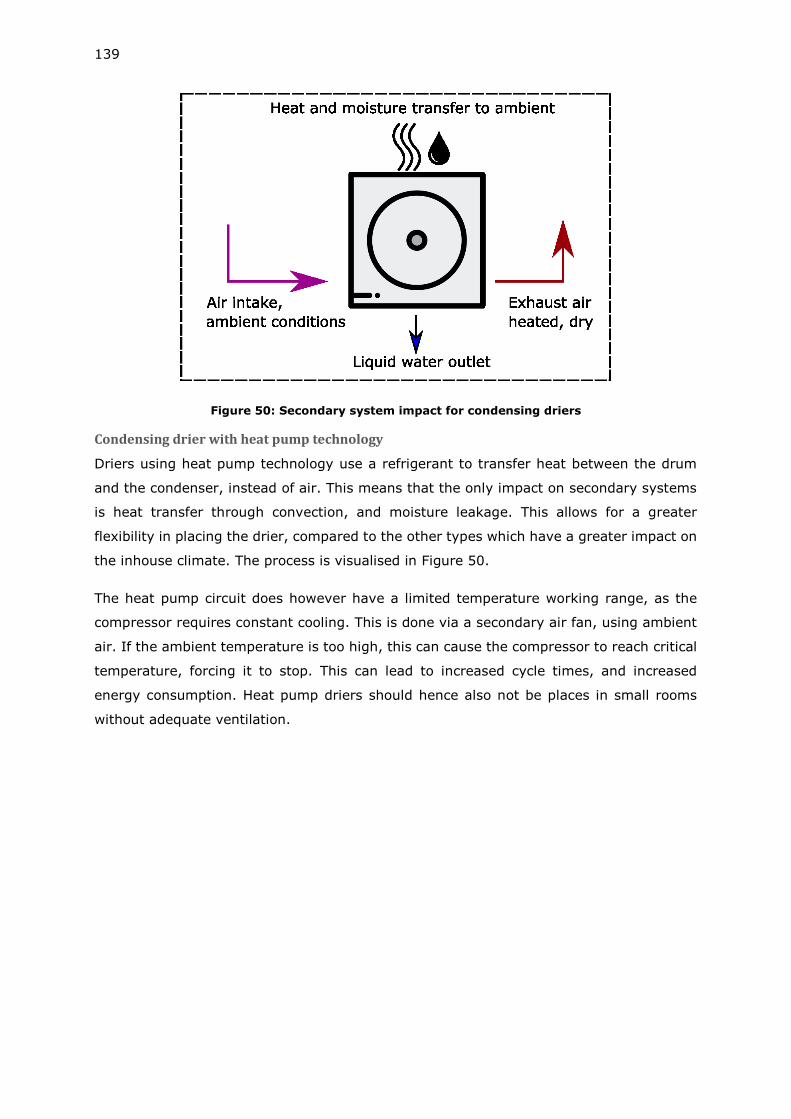
139
Figure 50: Secondary system impact for condensing driers
Condensing drier with heat pump technology
Driers using heat pump technology use a refrigerant to transfer heat between the drum
and the condenser, instead of air. This means that the only impact on secondary systems
is heat transfer through convection, and moisture leakage. This allows for a greater
flexibility in placing the drier, compared to the other types which have a greater impact on
the inhouse climate. The process is visualised in Figure 50.
The heat pump circuit does however have a limited temperature working range, as the
compressor requires constant cooling. This is done via a secondary air fan, using ambient
air. If the ambient temperature is too high, this can cause the compressor to reach critical
temperature, forcing it to stop. This can lead to increased cycle times, and increased
energy consumption. Heat pump driers should hence also not be places in small rooms
without adequate ventilation.
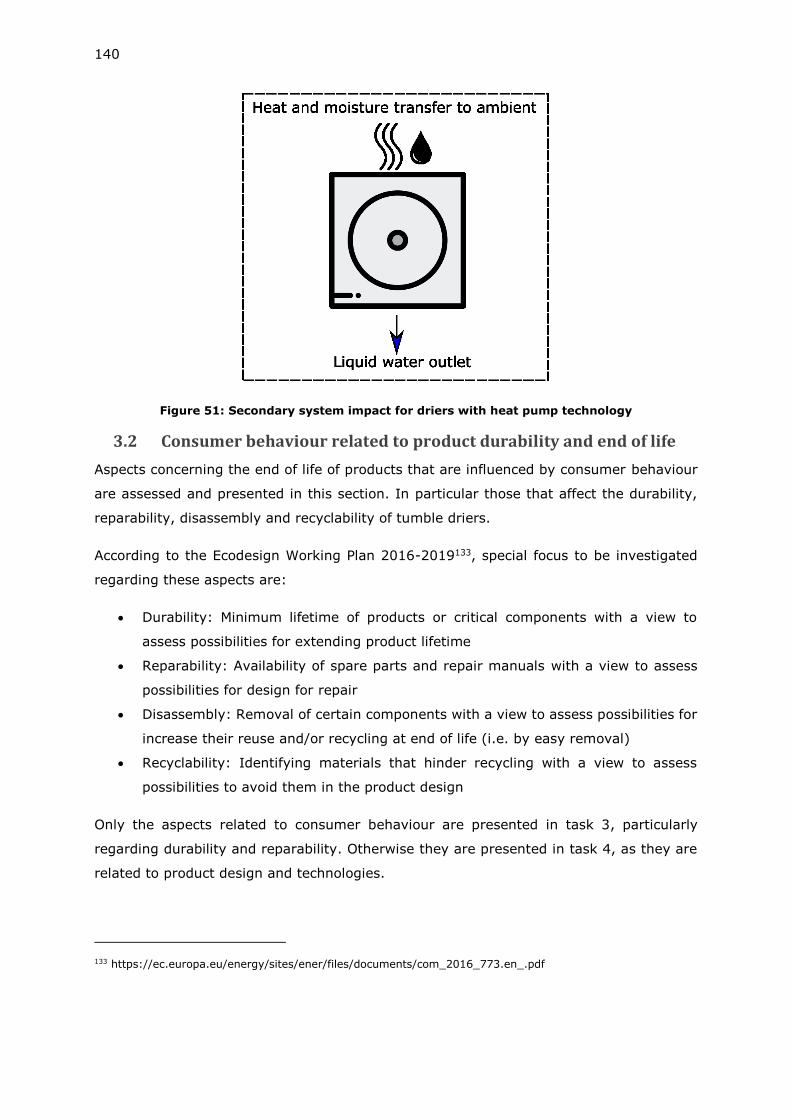
140
Figure 51: Secondary system impact for driers with heat pump technology
3.2 Consumer behaviour related to product durability and end of life
Aspects concerning the end of life of products that are influenced by consumer behaviour
are assessed and presented in this section. In particular those that affect the durability,
reparability, disassembly and recyclability of tumble driers.
According to the Ecodesign Working Plan 2016-2019133, special focus to be investigated
regarding these aspects are:
• Durability: Minimum lifetime of products or critical components with a view to
assess possibilities for extending product lifetime
• Reparability: Availability of spare parts and repair manuals with a view to assess
possibilities for design for repair
• Disassembly: Removal of certain components with a view to assess possibilities for
increase their reuse and/or recycling at end of life (i.e. by easy removal)
• Recyclability: Identifying materials that hinder recycling with a view to assess
possibilities to avoid them in the product design
Only the aspects related to consumer behaviour are presented in task 3, particularly
regarding durability and reparability. Otherwise they are presented in task 4, as they are
related to product design and technologies.
133 https://ec.europa.eu/energy/sites/ener/files/documents/com_2016_773.en_.pdf
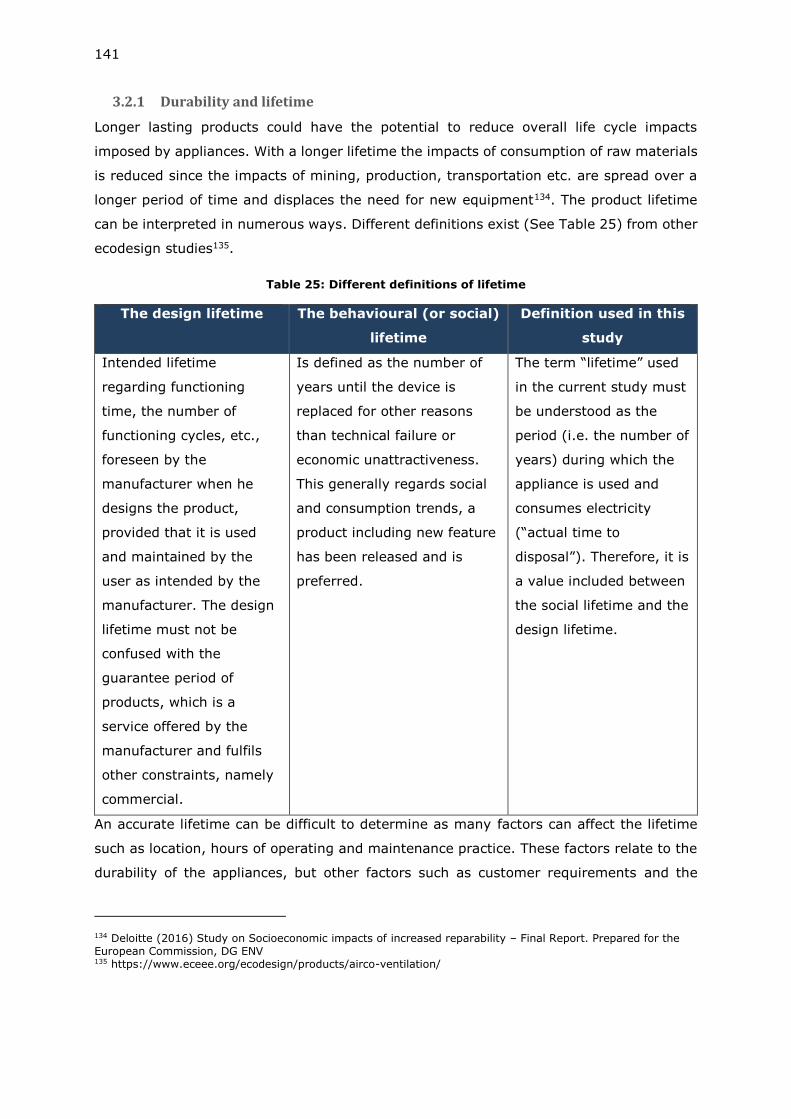
141
3.2.1 Durability and lifetime
Longer lasting products could have the potential to reduce overall life cycle impacts
imposed by appliances. With a longer lifetime the impacts of consumption of raw materials
is reduced since the impacts of mining, production, transportation etc. are spread over a
longer period of time and displaces the need for new equipment134. The product lifetime
can be interpreted in numerous ways. Different definitions exist (See Table 25) from other
ecodesign studies135.
Table 25: Different definitions of lifetime
The design lifetime The behavioural (or social)
lifetime
Definition used in this
study
Intended lifetime
regarding functioning
time, the number of
functioning cycles, etc.,
foreseen by the
manufacturer when he
designs the product,
provided that it is used
and maintained by the
user as intended by the
manufacturer. The design
lifetime must not be
confused with the
guarantee period of
products, which is a
service offered by the
manufacturer and fulfils
other constraints, namely
commercial.
Is defined as the number of
years until the device is
replaced for other reasons
than technical failure or
economic unattractiveness.
This generally regards social
and consumption trends, a
product including new feature
has been released and is
preferred.
The term “lifetime” used
in the current study must
be understood as the
period (i.e. the number of
years) during which the
appliance is used and
consumes electricity
(“actual time to
disposal”). Therefore, it is
a value included between
the social lifetime and the
design lifetime.
An accurate lifetime can be difficult to determine as many factors can affect the lifetime
such as location, hours of operating and maintenance practice. These factors relate to the
durability of the appliances, but other factors such as customer requirements and the
134 Deloitte (2016) Study on Socioeconomic impacts of increased reparability – Final Report. Prepared for the European Commission, DG ENV 135 https://www.eceee.org/ecodesign/products/airco-ventilation/
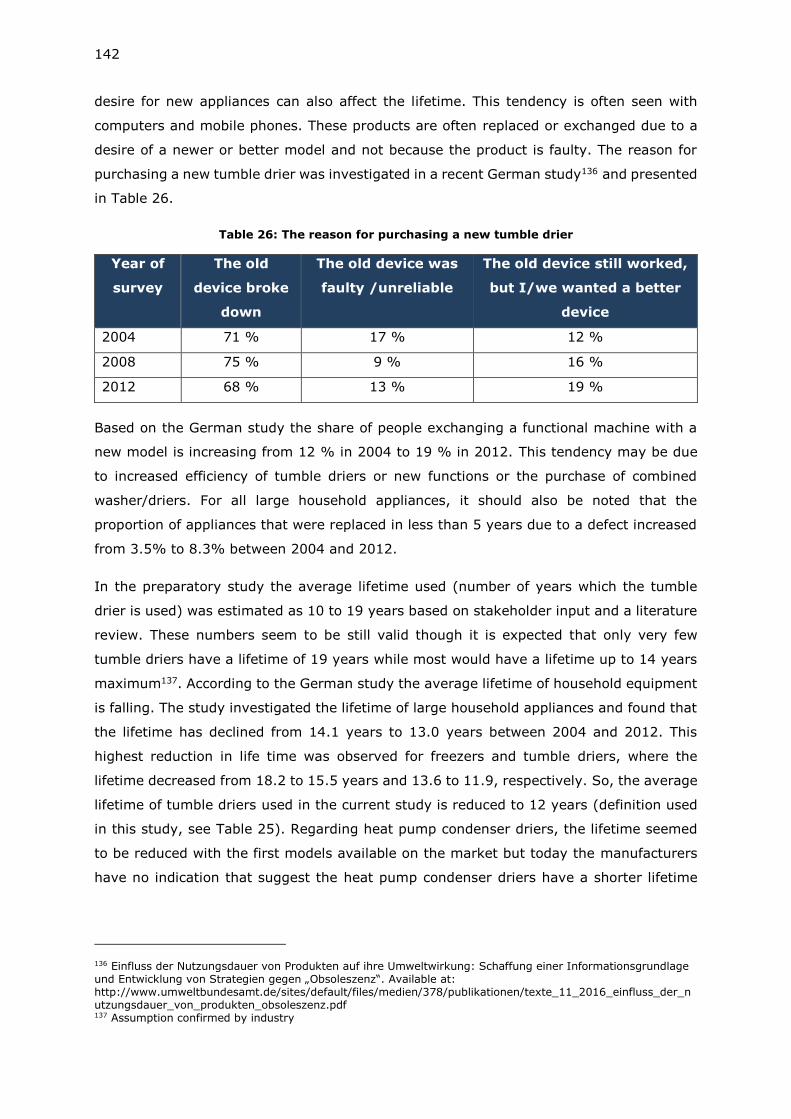
142
desire for new appliances can also affect the lifetime. This tendency is often seen with
computers and mobile phones. These products are often replaced or exchanged due to a
desire of a newer or better model and not because the product is faulty. The reason for
purchasing a new tumble drier was investigated in a recent German study136 and presented
in Table 26.
Table 26: The reason for purchasing a new tumble drier
Year of
survey
The old
device broke
down
The old device was
faulty /unreliable
The old device still worked,
but I/we wanted a better
device
2004 71 % 17 % 12 %
2008 75 % 9 % 16 %
2012 68 % 13 % 19 %
Based on the German study the share of people exchanging a functional machine with a
new model is increasing from 12 % in 2004 to 19 % in 2012. This tendency may be due
to increased efficiency of tumble driers or new functions or the purchase of combined
washer/driers. For all large household appliances, it should also be noted that the
proportion of appliances that were replaced in less than 5 years due to a defect increased
from 3.5% to 8.3% between 2004 and 2012.
In the preparatory study the average lifetime used (number of years which the tumble
drier is used) was estimated as 10 to 19 years based on stakeholder input and a literature
review. These numbers seem to be still valid though it is expected that only very few
tumble driers have a lifetime of 19 years while most would have a lifetime up to 14 years
maximum137. According to the German study the average lifetime of household equipment
is falling. The study investigated the lifetime of large household appliances and found that
the lifetime has declined from 14.1 years to 13.0 years between 2004 and 2012. This
highest reduction in life time was observed for freezers and tumble driers, where the
lifetime decreased from 18.2 to 15.5 years and 13.6 to 11.9, respectively. So, the average
lifetime of tumble driers used in the current study is reduced to 12 years (definition used
in this study, see Table 25). Regarding heat pump condenser driers, the lifetime seemed
to be reduced with the first models available on the market but today the manufacturers
have no indication that suggest the heat pump condenser driers have a shorter lifetime
136 Einfluss der Nutzungsdauer von Produkten auf ihre Umweltwirkung: Schaffung einer Informationsgrundlage und Entwicklung von Strategien gegen „Obsoleszenz“. Available at: http://www.umweltbundesamt.de/sites/default/files/medien/378/publikationen/texte_11_2016_einfluss_der_nutzungsdauer_von_produkten_obsoleszenz.pdf 137 Assumption confirmed by industry
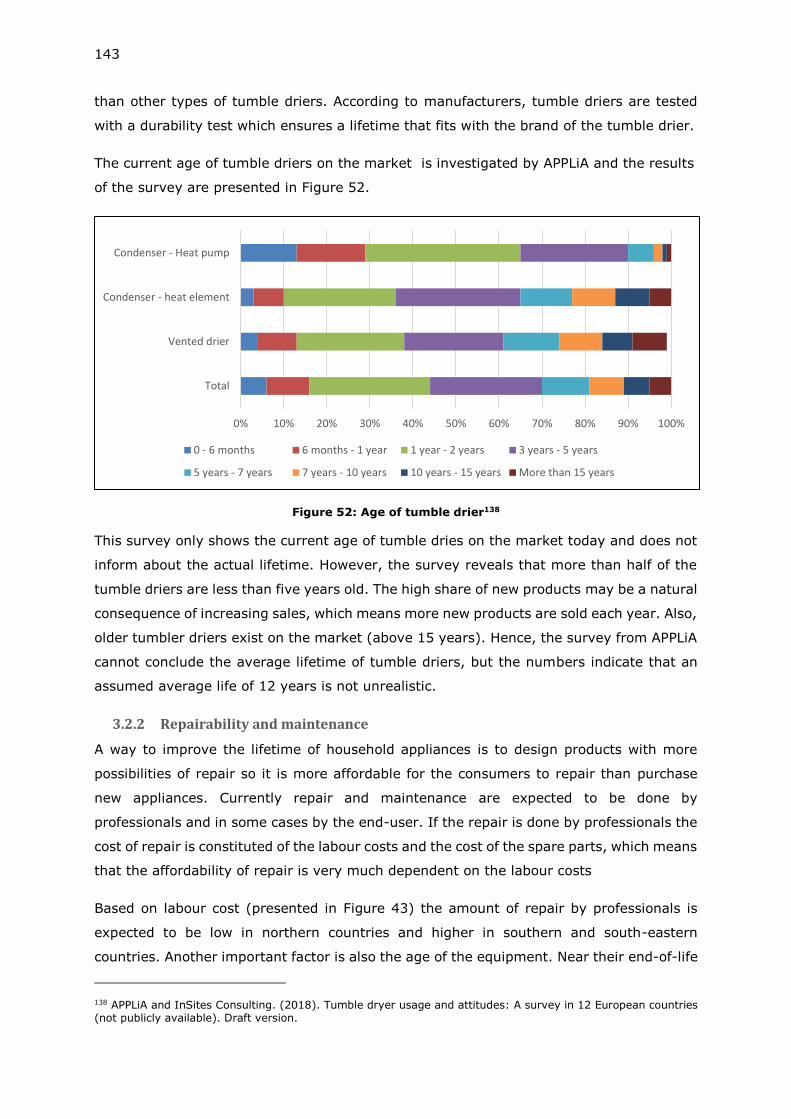
143
than other types of tumble driers. According to manufacturers, tumble driers are tested
with a durability test which ensures a lifetime that fits with the brand of the tumble drier.
The current age of tumble driers on the market is investigated by APPLiA and the results
of the survey are presented in Figure 52.
Figure 52: Age of tumble drier138
This survey only shows the current age of tumble dries on the market today and does not
inform about the actual lifetime. However, the survey reveals that more than half of the
tumble driers are less than five years old. The high share of new products may be a natural
consequence of increasing sales, which means more new products are sold each year. Also,
older tumbler driers exist on the market (above 15 years). Hence, the survey from APPLiA
cannot conclude the average lifetime of tumble driers, but the numbers indicate that an
assumed average life of 12 years is not unrealistic.
3.2.2 Repairability and maintenance
A way to improve the lifetime of household appliances is to design products with more
possibilities of repair so it is more affordable for the consumers to repair than purchase
new appliances. Currently repair and maintenance are expected to be done by
professionals and in some cases by the end-user. If the repair is done by professionals the
cost of repair is constituted of the labour costs and the cost of the spare parts, which means
that the affordability of repair is very much dependent on the labour costs
Based on labour cost (presented in Figure 43) the amount of repair by professionals is
expected to be low in northern countries and higher in southern and south-eastern
countries. Another important factor is also the age of the equipment. Near their end-of-life
138 APPLiA and InSites Consulting. (2018). Tumble dryer usage and attitudes: A survey in 12 European countries (not publicly available). Draft version.
0% 10% 20% 30% 40% 50% 60% 70% 80% 90% 100%
Total
Vented drier
Condenser - heat element
Condenser - Heat pump
0 - 6 months 6 months - 1 year 1 year - 2 years 3 years - 5 years
5 years - 7 years 7 years - 10 years 10 years - 15 years More than 15 years
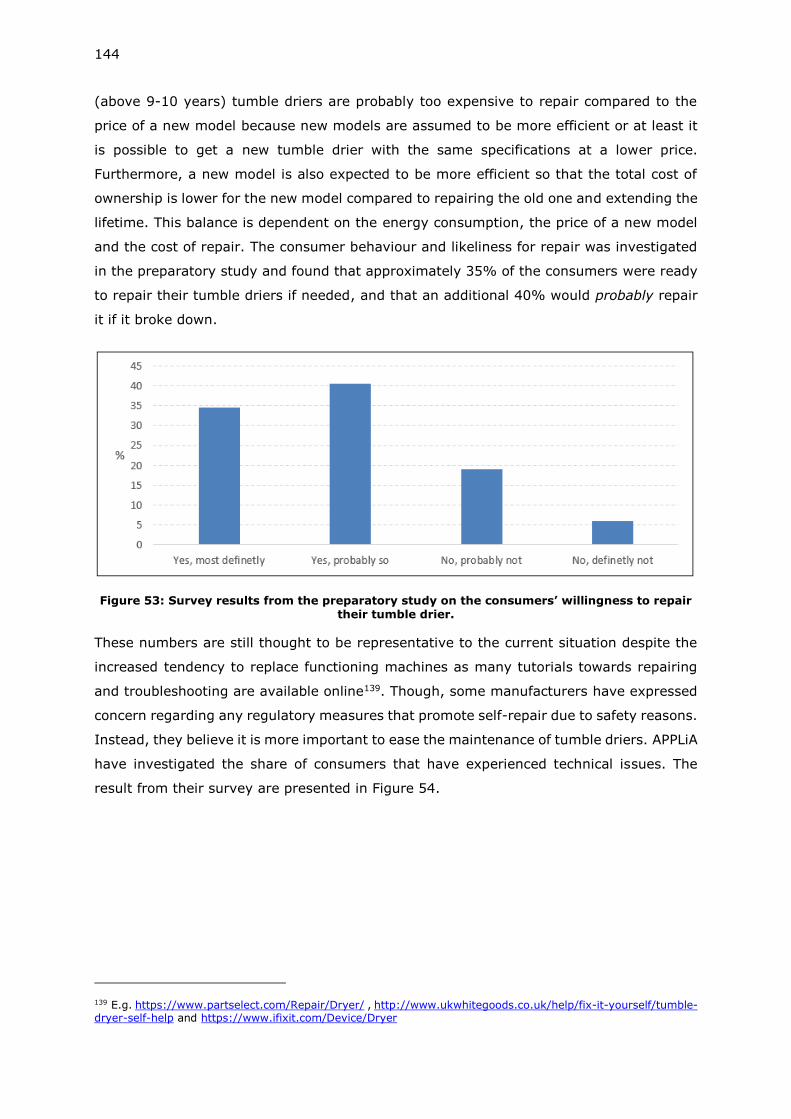
144
(above 9-10 years) tumble driers are probably too expensive to repair compared to the
price of a new model because new models are assumed to be more efficient or at least it
is possible to get a new tumble drier with the same specifications at a lower price.
Furthermore, a new model is also expected to be more efficient so that the total cost of
ownership is lower for the new model compared to repairing the old one and extending the
lifetime. This balance is dependent on the energy consumption, the price of a new model
and the cost of repair. The consumer behaviour and likeliness for repair was investigated
in the preparatory study and found that approximately 35% of the consumers were ready
to repair their tumble driers if needed, and that an additional 40% would probably repair
it if it broke down.
Figure 53: Survey results from the preparatory study on the consumers’ willingness to repair their tumble drier.
These numbers are still thought to be representative to the current situation despite the
increased tendency to replace functioning machines as many tutorials towards repairing
and troubleshooting are available online139. Though, some manufacturers have expressed
concern regarding any regulatory measures that promote self-repair due to safety reasons.
Instead, they believe it is more important to ease the maintenance of tumble driers. APPLiA
have investigated the share of consumers that have experienced technical issues. The
result from their survey are presented in Figure 54.
139 E.g. https://www.partselect.com/Repair/Dryer/ , http://www.ukwhitegoods.co.uk/help/fix-it-yourself/tumble-dryer-self-help and https://www.ifixit.com/Device/Dryer
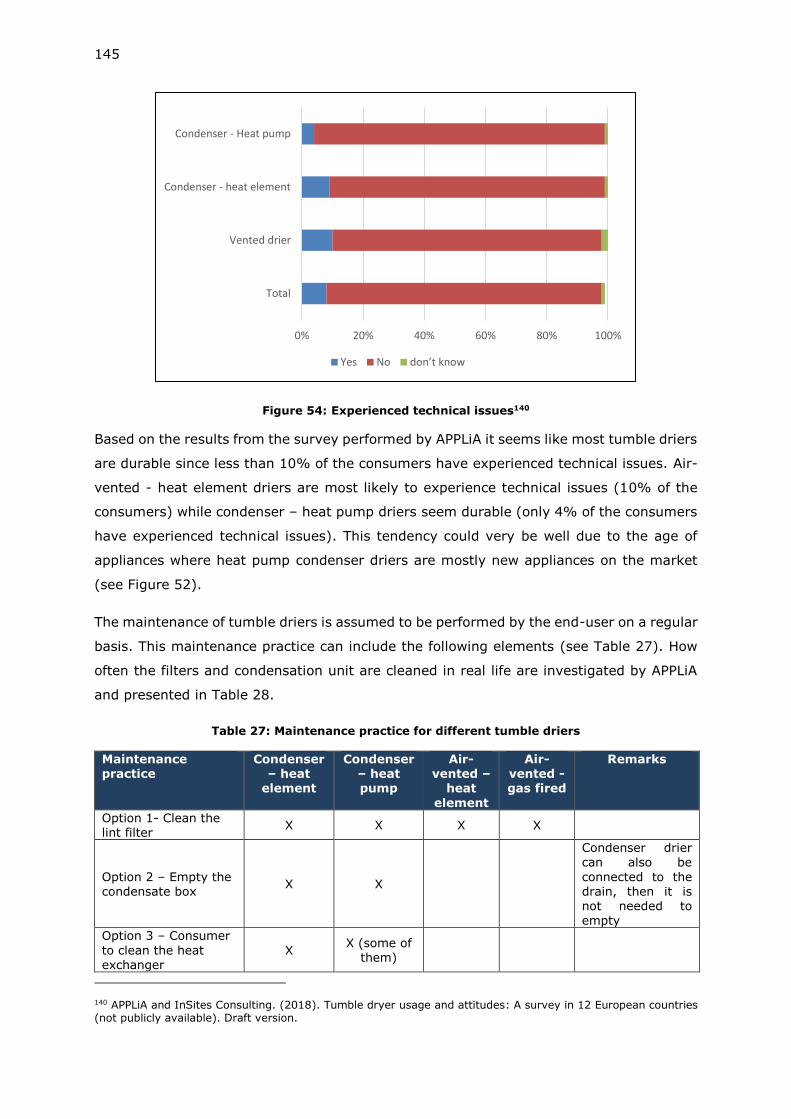
145
Figure 54: Experienced technical issues140
Based on the results from the survey performed by APPLiA it seems like most tumble driers
are durable since less than 10% of the consumers have experienced technical issues. Air-
vented - heat element driers are most likely to experience technical issues (10% of the
consumers) while condenser – heat pump driers seem durable (only 4% of the consumers
have experienced technical issues). This tendency could very be well due to the age of
appliances where heat pump condenser driers are mostly new appliances on the market
(see Figure 52).
The maintenance of tumble driers is assumed to be performed by the end-user on a regular
basis. This maintenance practice can include the following elements (see Table 27). How
often the filters and condensation unit are cleaned in real life are investigated by APPLiA
and presented in Table 28.
Table 27: Maintenance practice for different tumble driers
Maintenance practice
Condenser – heat
element
Condenser – heat pump
Air-vented –
heat
element
Air-vented - gas fired
Remarks
Option 1- Clean the lint filter
X X X X
Option 2 – Empty the condensate box
X X
Condenser drier can also be
connected to the drain, then it is not needed to empty
Option 3 – Consumer
to clean the heat exchanger
X X (some of
them)
140 APPLiA and InSites Consulting. (2018). Tumble dryer usage and attitudes: A survey in 12 European countries (not publicly available). Draft version.
0% 20% 40% 60% 80% 100%
Total
Vented drier
Condenser - heat element
Condenser - Heat pump
Yes No don’t know
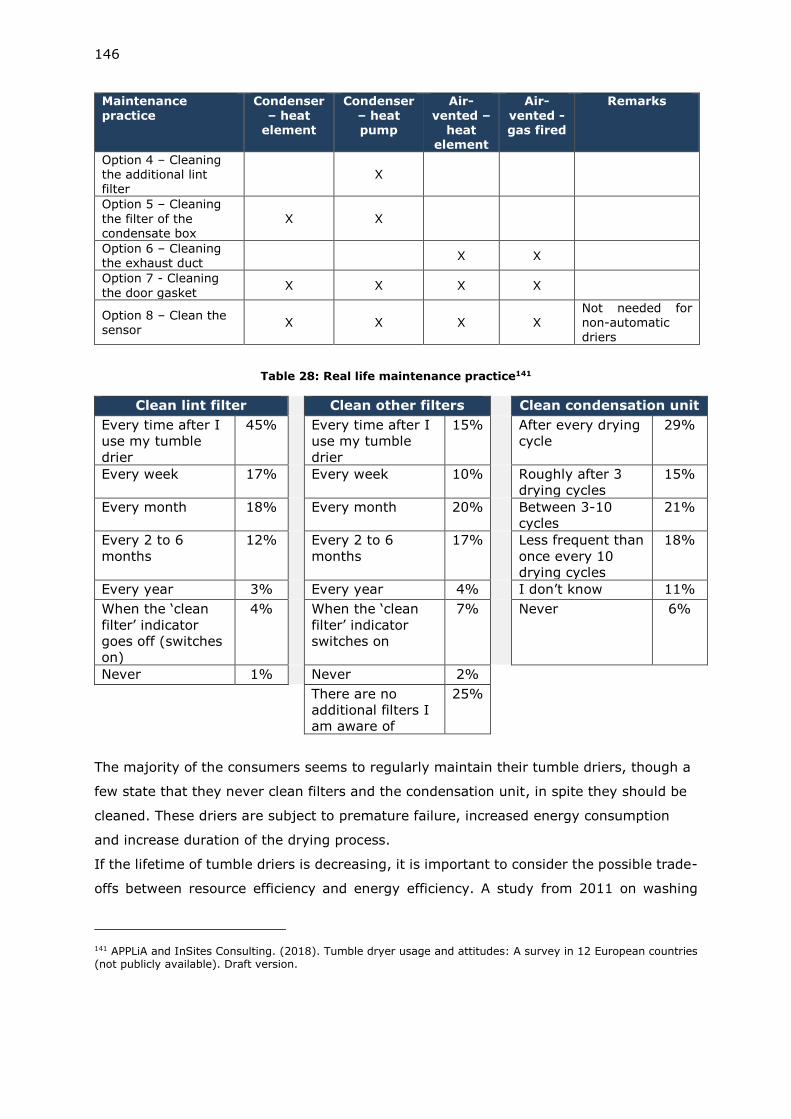
146
Maintenance
practice
Condenser
– heat element
Condenser
– heat pump
Air-
vented – heat
element
Air-
vented - gas fired
Remarks
Option 4 – Cleaning the additional lint filter
X
Option 5 – Cleaning
the filter of the condensate box
X X
Option 6 – Cleaning the exhaust duct
X X
Option 7 - Cleaning
the door gasket X X X X
Option 8 – Clean the sensor
X X X X Not needed for non-automatic driers
Table 28: Real life maintenance practice141
Clean lint filter
Clean other filters
Clean condensation unit
Every time after I
use my tumble
drier
45%
Every time after I
use my tumble
drier
15%
After every drying
cycle
29%
Every week 17%
Every week 10%
Roughly after 3
drying cycles
15%
Every month 18%
Every month 20%
Between 3-10
cycles
21%
Every 2 to 6
months
12%
Every 2 to 6
months
17%
Less frequent than
once every 10
drying cycles
18%
Every year 3%
Every year 4%
I don’t know 11%
When the ‘clean
filter’ indicator
goes off (switches
on)
4%
When the ‘clean
filter’ indicator
switches on
7%
Never 6%
Never 1%
Never 2%
There are no
additional filters I
am aware of
25%
The majority of the consumers seems to regularly maintain their tumble driers, though a
few state that they never clean filters and the condensation unit, in spite they should be
cleaned. These driers are subject to premature failure, increased energy consumption
and increase duration of the drying process.
If the lifetime of tumble driers is decreasing, it is important to consider the possible trade-
offs between resource efficiency and energy efficiency. A study from 2011 on washing
141 APPLiA and InSites Consulting. (2018). Tumble dryer usage and attitudes: A survey in 12 European countries (not publicly available). Draft version.
147
machines142 indicated that it was beneficial to replace at the time of the study a C-labelled
washing machine with an A+ or A++ immediately after purchasing the product with regard
to most environmental impact categories (including energy consumption and CO2-
emissions), despite the impacts of producing a new machine143. Tumble driers have many
similarities with washing machines and it is also assumed that it is beneficial to replace
poorly labelled tumble driers with new and efficient models. With time it is assumed that
tumble driers will reach a level of energy efficiency that limits further improvements which
means that an improved (longer) lifetime could be beneficial.
A study on the impacts of increased reparability144 concluded that simple measures could
have neutral to positive impact on the environment, but with some clear gains of resources.
The study assessed the environmental impacts on four different measures related to
reparability. These four measures are briefly described below:
• Option 1 – Measures to ensure provision of information to consumers on possibilities
to repair the product
• Option 2 – Measures to ensure provision of technical information to facilitate repair
to professionals
• Option 3 – Measures for the provision of technical information to consumers to
facilitate simple self-repairs
• Option 4 - Measures to enable an easier dismantling of products
These options are connected with a range of assumptions but common for all is their ability
in some degree to support the ideas of the circular economy and stimulate more repair of
products and prolong the lifetime. The impacts on the energy consumption, emission of
CO2-eq and consumption of resources (used for the production of appliances and spare
parts) of the four measures are presented in Table 29. Note that the baseline is described
as:
“The baseline corresponds to the business as usual scenario where a new product is bought
when the previous fails unless it is repaired according to the current repair rates. Products
are replaced by new more efficient ones at the end-of-life. A certain share of the products
at the end-of-life is repaired and changes ownership. Disposed products are treated as
waste with some materials being recycled and other materials landfilled or incinerated.”
142 Environmental Life Cycle Assessment (LCA) Study of Replacement and Refurbishment options for household washing machines (2011). Final report. WRAP. Available at: http://www.wrap.org.uk/sites/files/wrap/Technical%20report%20Washing%20machine%20LCA_2011.pdf 143 http://www.wrap.org.uk/sites/files/wrap/Technical%20report%20Washing%20machine%20LCA_2011.pdf 144 Deloitte (2016) Study on Socioeconomic impacts of increased reparability – Final Report. Prepared for the European Commission, DG ENV.
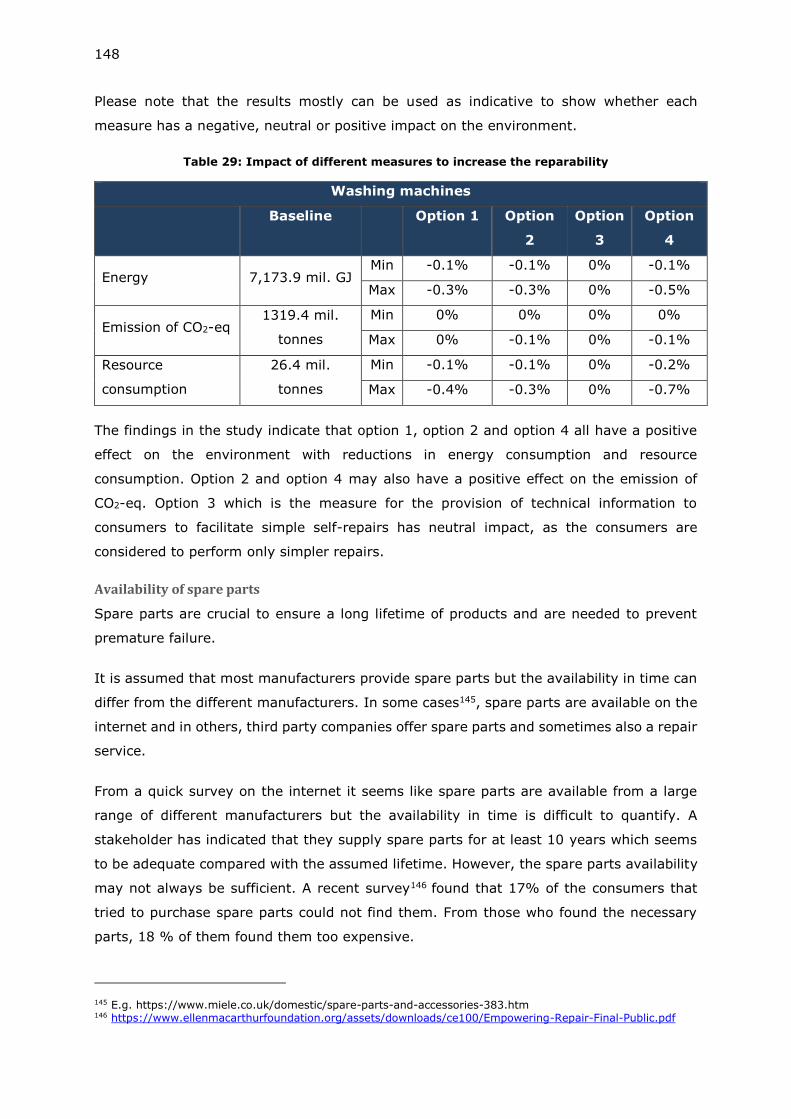
148
Please note that the results mostly can be used as indicative to show whether each
measure has a negative, neutral or positive impact on the environment.
Table 29: Impact of different measures to increase the reparability
Washing machines
Baseline Option 1 Option
2
Option
3
Option
4
Energy 7,173.9 mil. GJ Min -0.1% -0.1% 0% -0.1%
Max -0.3% -0.3% 0% -0.5%
Emission of CO2-eq 1319.4 mil.
tonnes
Min 0% 0% 0% 0%
Max 0% -0.1% 0% -0.1%
Resource
consumption
26.4 mil.
tonnes
Min -0.1% -0.1% 0% -0.2%
Max -0.4% -0.3% 0% -0.7%
The findings in the study indicate that option 1, option 2 and option 4 all have a positive
effect on the environment with reductions in energy consumption and resource
consumption. Option 2 and option 4 may also have a positive effect on the emission of
CO2-eq. Option 3 which is the measure for the provision of technical information to
consumers to facilitate simple self-repairs has neutral impact, as the consumers are
considered to perform only simpler repairs.
Availability of spare parts
Spare parts are crucial to ensure a long lifetime of products and are needed to prevent
premature failure.
It is assumed that most manufacturers provide spare parts but the availability in time can
differ from the different manufacturers. In some cases145, spare parts are available on the
internet and in others, third party companies offer spare parts and sometimes also a repair
service.
From a quick survey on the internet it seems like spare parts are available from a large
range of different manufacturers but the availability in time is difficult to quantify. A
stakeholder has indicated that they supply spare parts for at least 10 years which seems
to be adequate compared with the assumed lifetime. However, the spare parts availability
may not always be sufficient. A recent survey146 found that 17% of the consumers that
tried to purchase spare parts could not find them. From those who found the necessary
parts, 18 % of them found them too expensive.
145 E.g. https://www.miele.co.uk/domestic/spare-parts-and-accessories-383.htm 146 https://www.ellenmacarthurfoundation.org/assets/downloads/ce100/Empowering-Repair-Final-Public.pdf
149
The study on the impacts of increased reparability147 also investigated the impact of
measures to ensure supply of spare parts for at least a certain amount of years and the
combination of different options, which are:
• Option 5 – Measures to ensure availability of spare parts for at least a certain
amount of years from the time that production ceases of the specific models
• Option 6 – Combination of option 5 and option 2 presented in the above section
about repair and maintenance (measures to ensure provision of technical
information to facilitate repair to professionals)
• Option 7 – Combination of scenarios 5 & 4 presented in the above section about
repair and maintenance (measures to enable an easier dismantling of products)
The results of these assessments is shown on Table 30. Please note that the results mostly
can be used as indicative to show whether each measure have a negative, neutral or
positive impact on the environment.
Table 30: Impact of different measures to increase the reparability – availability of spare parts
Washing machines
Baseline Option 5 Option O6 Option O7
Energy 7,173.9 mil. GJ Min -0.2% -0.2% -0.2%
Max -0.7% -0.8% -1%
Emission of
CO2-eq 1319.4 mil. tonnes
Min 0% 0% 0%
Max -0.1% -0.2% -0.2%
Resource
consumption 26.4 mil. tonnes
Min -0.2% -0.3% -0.3%
Max -0.9% -1% -1.2%
In Figure 55 all options are compared with each other and it seems like that the most
beneficial single option is the measure to ensure spare parts for a certain amount and
years (Option 5). However, both of the combined options (option 6 and option 7) may have
even greater impact (positive impact) on the environment. It should be noted that both of
these combined options also include option 5.
147 Deloitte (2016) Study on Socioeconomic impacts of increased reparability – Final Report. Prepared for the European Commission, DG ENV.
150
Figure 55: Impact of all options towards increased reparability
Different approaches can be implemented towards improved reparability, reusability,
recyclability, dismantlability and a prolonged lifetime as discussed above. The lifetime is
not solely dependent on break downs or malfunctioning components as more consumers
are replacing functioning appliances due to a desire for an improved model with e.g.
improved efficiency.
Critical parts
Critical spare parts are the parts that are important for the function of the tumble driers.
Based on a survey and inputs from manufacturers148 the critical spare parts are presented
in Table 31.
Table 31: Critical components and assessment of the ease of replacement
Component Is the component easy to replace?
Pumps Depending on brand and location of the pump
Fans Depending on brand as some states it is difficult to replace while other states it is easy for a professional
Motor(s) Depending on brand as some states it is difficult to replace while other states it is easy for a professional
Electronics Depending on brand as some states it is difficult to replace while other states it is easy for a professional
Compressor Difficult to replace or no access
Heat exchanger No access
148 Stakeholder consultation
-1.40%
-1.20%
-1.00%
-0.80%
-0.60%
-0.40%
-0.20%
0.00%
Option 1 Option 2 Option 3 Option 4 Option 5 Option 6 Option 7
Energy Emission of CO2-eq Resource consumption
151
According to input from stakeholders149, the most replaced parts in tumble driers that are
repaired are pumps, belts (moving the drum) and resistance (heating element). The
frequency of these replaced parts and their price range are presented in Table 32.
Table 32: Frequency and price range of replaced parts149
Component Frequency of
replacement Price range
Resistance 42.19% 40-80 EUR
Pump 18.75% 25-50 EUR
Strap/belt 14.06% 10-15 EUR
Turbine 13.28% 15-40 EUR
Drum 9.38% 100-180 EUR
Tension idler 2.34% 10-30 EUR
According to preliminary results from an ongoing study on the development of a scoring
system for repair and upgrade150, the most important aspects that define some parts as
‘priority parts’ are (listed in order of importance):
1. Their frequency of failure
2. Their functional importance
3. The steps needed for their disassembly
4. Their economic value and related repair operations
5. Their environmental impacts
Pumps appear as important in both Table 31 and Table 32, and are critical parts because
they are likely to fail and the price would not be a barrier for replacement. Heating elements
are also important because of their frequency of failure, in spite they are not listed as
critical components. Fans and motors are essential for the functioning of the driers, same
as compressors and heat exchangers although there is limited information on the ease of
disassembly for the latter.
In summary, it can be concluded the critical parts of tumble driers are:
• Pumps
• Motors
• Fans
149 Stakeholder consultation, inputs based on NGO network working on repair in France. The presented values are for the most sold model (tumble drier) 150 Analysis and development of a scoring system for repair and upgrade of products – draft version 1. Published 20th June 2018 by Joint Research Centre, Directorate B, Growth and Innovation (Sevilla). Unit 5, Circular Economy and Industrial Leadership.
152
• Heating elements
Potential resource efficiency requirements could focus on the availability of these critical
parts.
3.2.3 Best practice in sustainable use
Sustainable product use can minimize the energy consumption of tumble driers and a few
best practices are listed in this section.
As discussed previously, it is important to purchase a properly sized tumble drier and not
buying it oversized. This may result in operation at part load, which increases the specific
energy consumption (see section 3.1.1). According to presented data in this section,
consumers load the machines similarly regardless of the capacity. Consumers may buy
large appliances for the convenience if they want to dry large blankets resulting in
operation with a low load most of the year. It is also important to spin the clothes properly
in the washing machine as it is less energy intensive to spin the clothes in the washing
machine than to dry it in the tumble drier.
Other important aspects may be:
• Proper maintenance of the appliance and specially to clean the lint filter between
uses. This will allow the correct air flow through the appliance.
• Use a lower dryness level than, e.g. cupboard dry, if the clothes have anyway to be
ironed afterwards.
• Use the moisture sensor if it is available to avoid over drying.
3.2.4 Collection rates at households/other users
Following the framework of the WEEE Directive, tumble dries must be collected at end-of-
life and sent to suited facilities for reprocessing. Illegal trade and sales of scrap challenge
the collection rate for some product categories. The statistics from Eurostat present
products placed on the market and waste collected for large household equipment151. No
statistics are available specifically for tumble dries collected so the actual collection rate is
difficult to quantify.
From 2019 onwards, the minimum collection rate to be achieved annually shall be 65% of
the average weight of Electrical and Electronic Equipment (EEE) placed on the market in
the three preceding years in each Member State, or alternatively 85% of Waste Electrical
and Electronic Equipment (WEEE) generated on the territory of that Member State152. Table
33 shows the collection rate for large household appliances calculated based on the WEEE
151 http://appsso.eurostat.ec.europa.eu/nui/show.do?dataset=env_waselee&lang=en 152 http://eur-lex.europa.eu/legal-content/EN/TXT/PDF/?uri=CELEX:32012L0019&from=EN
153
collected in 2014 and the average weight of EEE placed on the market in the three
preceding years.
Table 33: Calculated collection rate of large household equipment in Europe, 2014
Average EEE put on the
market 2011-2013
WEEE collected
2014
Collection rate
Austria 77,662 31,199 40%
Belgium 107,115 50,781 47%
Bulgaria 38,664 30,286 78%
Croatia 23,445 5,275 22%
Cyprus 8,350 1,222 15%
Czech
Republic 72,575 27,828 38%
Denmark 65,210 32,890 50%
Estonia 8,223 1,854 23%
Finland 71,690 33,917 47%
France 918,570 292,730 32%
Germany 748,121 239,662 32%
Greece 86,162 27,317 32%
Hungary 45,004 28,682 64%
Iceland 3,305 1,696 51%
Ireland 38,306 23,797 62%
Italy 501,190 142,666 28%
Latvia 8,728 2,490 29%
Liechtenstein 36 75 208%
Lithuania 15,352 12,429 81%
Luxembourg 4,690 2,586 55%
Malta 6,206 971 16%
Netherlands 112,119 64,496 58%
Norway 70,451 49,402 70%
Poland 244,980 81,082 33%
Portugal 73,738 33,154 45%
Romania 75,341 20,465 27%
Slovakia 25,087 11,590 46%
Slovenia 17,030 4,535 27%
Spain 355,992 101,827 29%
Sweden 107,447 71,306 66%
United
Kingdom 708,172 296,520 42%
Total 4,638,962 1,724,730 37%
The average collection rate for large household equipment at EU level was just below 40
% in 2014. This value should be improved to 65 % in 2019 according to EU targets. The
low collection rate of products cannot be directly addressed in the Ecodesign Regulation
but should be addressed by each Member State regarding their obligations with regard to
the WEEE Directive.
154
3.2.5 Conclusion on consumer behaviour related to product durability and end-of-life
In general, the average lifetime of household equipment is falling, and the initial service
life has declined from 14.1 years to 13.0 years between 2004 and 2012 of large household
appliances. This highest reduction in life time was observed for freezers and tumble driers
which decreased from 18.2 to 15.5 years and 13.6 to 11.9, respectively. So the average
lifetime of tumble driers in the current study is reduced to 12 years. Regarding heat pump
condenser driers, the lifetime seemed to be reduced for the first models available on the
market but today the manufacturers have no indication to suggest that heat pump
condenser driers have a shorter life time than other types of tumble driers. Based on a
consumer study performed by APPLiA the durability of heat pump condenser driers is not
expected to present particular issues and the consumers rarely experience any technical
failures.
A way to improve the lifetime of household appliances is to design products with more
possibilities of repair so it is more affordable for the consumers to repair than exchange
appliances. Currently the repair and maintenance practices are expected to be done by
professionals and in some cases by the end user. Based on the Deloitte study it seems like
the following options have a positive effect on the environment:
• Measures to ensure provision of information to consumers on possibilities to repair
the product
• Measures to ensure provision of technical information to facilitate repair to
professionals
• Measures to enable an easier dismantling of products
• Measures to ensure availability of spare parts for at least a certain amount of years
from the time that production ceases of the specific models
• Different combination of the above-mentioned options
The option with measures to facilitate simple self-repairs was considered to have a neutral
effect because of the limitation in repair procedures that can be performed by the
consumers.
3.3 Local infrastructure
3.3.1 Electricity
The power sector is in a transition state moving from fossil fuels to renewable energy. The
origin of the electricity is a very important factor to consider both regarding the
environmental impact by using a tumble drier and how it may affect the consumer
behaviour (smart grid functionalities). Within the EU there are a number of renewable
155
energy targets for 2020 set out in the EU's Renewable Energy Directive153. The overall
target within the EU is 20% of final energy consumption from renewable sources. The final
energy consumption is the total energy consumed by end-users, such as households,
industry and agriculture. It is the energy which reaches the final consumer's door and
excludes that which is used by the energy sector itself154. To achieve this goal of 20 %
from renewable sources the different EU countries have committed to set their own
individual goal ranging from 10 % in Malta to 49% in Sweden. In 2015 the share of
renewable energy was almost 17% (gross final energy consumption )155.
The electricity consumption is a major part of the final energy consumption and the
electricity mix is highly relevant for quantifying the environmental impacts of tumble driers
at EU-level. The electricity mix in 2015 is presented in Figure 56.
Figure 56: Net electricity generation, EU-28, 2015 (% of total, based on GWh)156
Almost half of the electricity generation still originates from combustible fuels (such as
natural gas, coal and oil) and renewable energy sources only constitutes about 25 % of
the electricity generation in 2015.
The reliability of the electricity grid could be in some degree affected by the transition to
a renewable energy system. With more renewable energy in the system new challenges
occur e.g. with excess production of wind energy and the two-directional transfer of energy
153 https://ec.europa.eu/energy/en/topics/renewable-energy 154 http://ec.europa.eu/eurostat/statistics-explained/index.php/Glossary:Final_energy_consumption 155 http://ec.europa.eu/eurostat/documents/2995521/7905983/8-14032017-BP-EN.pdf/af8b4671-fb2a-477b-b7cf-d9a28cb8beea 156 http://ec.europa.eu/eurostat/statistics-explained/index.php/File:Net_electricity_generation,_EU-28,_2015_(%25_of_total,_based_on_GWh)_YB17.png
156
(e.g. electric cars that can supply electricity to the grid when it is not in use). Due to
technological development, the reliability of the electricity supply in many EU countries is
ensured via the expansion of the electricity grid to distribute renewable energy. The quality
of the electricity grid in Europe is considered to be high and among the best in the world.
Every year the World Economic Forum releases a Global Energy Architecture Performance
Index report. The report is ranking the different countries on their ability to deliver secure,
affordable, sustainable energy. In recent years European countries have dominated the
top spots (see Table 34)157.
Table 34: Top spots of the global Energy Architecture Performance Index report
Country 2017
score
Economic growth
and development
Environmental
sustainability
Energy access
and security
Switzerland 0.8 0.74 0.77 0.88
Norway 0.79 0.67 0.75 0.95
Sweden 0.78 0.63 0.8 0.9
Denmark 0.77 0.69 0.71 0.91
France 0.77 0.62 0.81 0.88
Austria 0.76 0.67 0.74 0.88
Spain 0.75 0.65 0.73 0.87
Colombia 0.75 0.73 0.68 0.83
New Zealand 0.75 0.59 0.75 0.9
Uruguay 0.74 0.69 0.71 0.82
The consumer behaviour might affect the electricity system in some countries since the
use of tumble driers are assumed to be more common in the winter period where the
monthly energy consumption is higher for most countries. In Table 35 are the monthly
electricity consumption presented for most of the EU countries158. Note that the peak
consumption is marked with red and the lowest consumption marked with blue.
157 https://www.weforum.org/reports/global-energy-architecture-performance-index-report-2017 158 Data provided by ENTSO-E
157
Table 35: Monthly electricity consumption
MONTHLY CONSUMPTION (IN GWh)
Country Jan. Feb. Mar. Apr. May Jun. Jul. Aug. Sep. Oct. Nov. Dec. Total
Austria 6498 5984 6203 5542 5468 5376 5588 5436 5271 5900 6005 6234 69505
Belgium 8057 7312 7653 6940 6795 6657 6548 6609 6731 7221 7202 7284 85009
Bulgaria 3455 3068 3111 2639 2404 2363 2611 2537 2416 2703 2766 3171 33244
Cyprus 368 364 338 283 314 343 452 495 441 351 298 358 4405
Czech Republic 6019 5584 5774 5200 4972 4818 4859 4641 4865 5509 5553 5624 63418
Germany 48952 45608 46179 40889 39607 39875 41470 39824 40911 45723 46280 45289 520607
Denmark 3188 2909 2916 2306 2648 2907 2556 2692 2697 1943 2555 3113 32430
Estonia 816 719 743 679 634 573 574 593 624 719 714 751 8139
Spain 23883 22048 22279 19837 21016 21614 24972 22341 20897 20964 20985 22069 262905
Finland 8437 7336 7645 6756 6268 5838 5941 6008 6118 7138 7279 7730 82494
France 52475 48579 45707 36847 33873 33225 34887 31582 33483 39167 40985 44593 475403
United Kingdom 32243 29083 31380 26097 26044 24327 24569 24361 25082 28320 30380 30768 332654
Greece 4829 4299 4504 3772 3823 3965 4855 4687 4086 3835 3895 4610 51160
Croatia 1538 1429 1461 1314 1292 1288 1573 1494 1336 1351 1369 1539 16984
Hungary 3629 3316 3507 3218 3209 3249 3484 3342 3313 3507 3490 3491 40755
Ireland 2498 2279 2397 2154 2192 2055 2100 2087 2120 2276 2353 2445 26956
Italy 26786 24948 26793 24169 25027 26328 31970 24458 26449 25907 25675 25818 314328
Lithuania 1005 891 920 873 862 825 846 863 866 955 958 995 10859
Luxembourg 574 538 579 516 497 503 542 512 492 554 547 514 6368
Latvia 692 616 635 589 571 522 549 568 562 625 626 654 7209
Netherlands 10343 9183 9588 8741 8881 8823 9191 9049 9149 9685 9763 10119 112515
Poland 13546 12327 13116 12060 12011 11716 12333 12295 12099 13257 13066 13254 151080
Portugal 4713 4232 4167 3727 3939 3964 4280 3907 3883 3987 3977 4189 48965
Romania 5023 4598 4791 4435 4258 4202 4636 4398 4266 4665 4634 4877 54783
Sweden 14100 12610 12851 10967 10494 9602 8907 9561 9888 11578 12242 13130 135930
Slovenia 1233 1130 1178 1067 1092 1088 1149 1073 1099 1175 1164 1199 13647
Slovakia 2470 2277 2393 2194 2157 2115 2191 2136 2128 2360 2350 2405 27176
Only a few southern countries have their peak consumption in July and August and the
majority of the countries have their peak consumption in January. The lowest monthly
electricity consumption levels are, for most countries within EU, in June. The hourly load
values for a random Wednesday in March 2015 for selected countries are presented in
Figure 57.
158
Figure 57: Hourly load values a random day in March
All presented countries have similar hourly load values with two peaks, one in the morning
and one in the evening. It is barely visible for Denmark, but this is due to scale of the
graph. However, there are small shifts in the peaks. In Denmark, the peaks occur a little
earlier than in Spain. The first peak fits well with the start of the workday and the second
peak fits with the end of the workday. Between the two peaks there is a falling trend in
the energy consumption. The lowest electricity consumption across the different countries
is at 5 AM. For most countries, this hourly load curve fits this description of the majority
of the days. For months and days with a higher or lower consumption tendency the profile
is very similar with more pronounced shifts up or down.
Renewable energy production can vary greatly from hour to hour and day to day. In the
future, products that can respond to an external stimulus (e.g. smart appliances), can
provide balance and flexibility to the energy system. Though, tumble dries are dependent
on washing machines and they need to be operated within a certain time period after the
end of the washing cycle to avoid bad odour from the clothes. It is possible to postpone
the start of tumble driers a little, but the flexibility of combined washers and driers are
assumed to be higher.
3.3.2 Gas
The reliability of the energy system as a whole is high. The values presented consider the
entire energy system including the gas system. Nevertheless, the gas supply may be less
reliable than the electricity supply due to the high imports of gas from non-EU28 countries.
Norway and Russia are major suppliers of gas, and Russia’s supply often goes through
0
10,000
20,000
30,000
40,000
50,000
60,000
70,000
80,000
0 5 10 15 20
MW
Hour
DE
FR
ES - March
DK
159
transit countries such as Ukraine and Belarus. The gas supply in Europe is roughly
described in Figure 58159 and presents possible shortage in the supply chain.
Figure 58: Rough drawing of the transport of gas in Europe
Roughly a quarter of all the energy used in the EU is natural gas, and many EU countries
import nearly all their gas and some of these countries are heavily reliant on a single source
or a single transport route for the majority of their gas. These countries are more
vulnerable to disruptions in their gas supply. Disruptions can be caused by infrastructure
failure or political disputes.
To prevent supply disruptions and quickly respond to them if they happen, EU created
common standards and indicators to measure serious threats and define how much gas EU
countries need to be able to supply to households and other vulnerable consumers. In
2017, a new Regulation regarding the security of the gas supply160 was introduced. The
new Regulation has a number of requirements which e.g. requires the European Network
for Transmission System Operators for Gas (ENTSOG) to perform EU-wide gas supply and
infrastructure disruption simulation in order to provide a high level overview of the major
supply risks for the EU and introduces a solidarity principle (EU countries must help each
other to always guarantee gas supply to the most vulnerable consumers even in severe
159 https://corporate.vattenfall.com/about-energy/energy-distribution/gas-distribution/ 160 http://eur-lex.europa.eu/legal-content/EN/TXT/PDF/?uri=CELEX:32017R1938&from=EN
160
gas crisis situations). Such precautions increase the reliability of the gas supply and
therefore is the supply of gas assumed to be reliable.
3.4 Verification tolerances
The verification tolerances stated in the Regulations are to be used by market surveillance
authorities when testing products to account for uncertainties in the tests and variations
in production. The verification tolerances in Table 36 are given in the Regulations.
Table 36: Verification tolerances set out in the Regulations
Test parameter Unit Tolerance
Weighted annual energy
consumption (AEc) kWh/year 6%
Weighted energy
consumption (Et) kWh 6%
Weighted condensation
efficiency (Ct) % 6%
Weighted programme time
(Tt) Minutes 6%
Power consumption in off
mode and left-on mode (Po
and Pl)
W
6% for consumption more
than 1.00W. 0.1W for
consumption below 1.00W
Duration of the left-on mode
(Tl) Minutes 6%
The verification tolerances are closely related to the tests and their uncertainties. It is
proposed to keep the current tolerances for verification purposes, until the results of the
Round Robin Test performed by APPLiA are disclosed161. This is also aligned with what
recommended by JRC in their preparatory study for washing machines and washer driers
(2017) for their energy consumption (Et) value.
161 According to latest input from industry, the results of the RRT are expected to be shared with the Commission in May 2019.
4. Technologies
Technical improvements at product level have emerged on the market for tumble driers
since the preparatory study, but mostly for heat pump condenser tumble driers. As seen
in task 2, the four main types of tumble driers, air-vented with heating element, air-vented
with gas combustion, condensing with heating element and condensing with heat pump
still exist. However, very few models of gas-fired tumble driers have been available for
sale on the EU market and no major developments in this type of drier has been made in
the past 10 years162. Gas fired tumble driers represented 0.01% of the total sales from
2013-2016163.
Concerning technologies, some technologies and/or addons mentioned as available during
the preparatory study have been discontinued164 (see below):
• Air-vented driers:
o Exhaust air recovery.
o Air-vented drier with heat pump technology.
• Condensing driers:
o External heat source driers.
The Best Available Technology (BAT) from the preparatory study was condensing heat
pump driers. Nowadays, these are still presenting the highest energy efficiency. The
increase of efficiency of the BAT has been obtained by improving the integrated heat pump
and adding more efficient components, instead of introducing a new type of heating
technology. Heat pump driers have progressed from having a market penetration rate
below 5% during the preparatory study (in 2009), to being the most commonly sold type
of tumble drier accounting for 52% of sold units in 2016163. The heat pump drier can hence
be considered as the most common tumble drier technology on the current market.
As the working principle of the current available technologies have had no major alterations
since the preparatory study, the focus in this task is to look at the different components in
the tumble drier, to identify the major developments that have been made.
The tumble drier unit consists of multiple components which can be of different types and
qualities. Some are found in all tumble driers types and from these, the following
components and their configurations have a major influence on the energy consumption:
o The motor type and setup
162 According to input from industry 163 Source: GfK data 164 According to desktop research
162
o The presence of variable speed drives for fans and drum motors
o The controller, including humidity sensor components
o The drum design and sealing method
o The cleanliness of lint filters and heat exchangers
Additionally, for condensing driers:
o Air to air heat exchanger type, material, and size
And furthermore, for heat pump condensing driers
o Compressor size, type and motor
Based on input from industry165, Table 37 shows a list of the major components and
technologies having an impact on the energy efficiency of the drier. Each
component/technology and relevant improvement options are described in more details in
section 4.1.
Table 37: List of components for the average tumble drier. HP-C = Condensing heat pump drier, HE-C = Condensing heating element drier, HE-V = air-vented
heating element drier, GA-V = air-vented gas fired drier.
Tumble drier
technology/Component
Average drier on
the market
Relevant for
HP-C HE-C HE-V GA-V
MOTORs
Motor type setup (one or multiple) One x x x x
Motor type (drum) AC-Induction x x x x
Motor type (compressor) AC-Induction x
⤷ If permanent magnet, has REM166 No x x x x
VSD on motor drum drive No x x x x
VSD on motor fans No x x x x
VSD on compressor motor No x
CONTROLLER
Type of automatic controller
Automatic moisture sensor controller (direct
way)
x x x x
HEAT EXCHANGER (Air to air)
Heat exchanger material Aluminium x
Heat exchanger type Plate-fin167 x
Self-cleaning heat exchangers No x
165 Questionnaire sent to APPLiA members on technologies during months February-March 2018 166 Rare earth materials 167 https://en.wikipedia.org/wiki/Plate_fin_heat_exchanger
163
Tumble drier technology/Component
Average drier on the market
Relevant for
HP-C HE-C HE-V GA-V
HEAT EXCHANGER (Refrigerant - air)
Heat exchanger material Aluminium fins +
copper tubes x
Heat exchanger type Fin-and-tube168 x
Self-cleaning heat exchangers No x
COMPRESSOR
Compressor size 400-600 W x
DRUM
Drum material Steel x x x x
Direct Drive No x x x x
Drum leakage High/Medium x x
FILTERS169
Anti-clogging design No x x x x
4.1 Products with standard improvement design options
The following subsections give general descriptions of key components and how
improvements for each component can lead to energy efficiency improvements.
4.1.1 Motors for all drier types
The motors used for driving the drum and fans are of different types, from single-phase
capacitor run induction motors to synchronous motors, such as brushless DC motors
(BLDC). Furthermore, variable speed drives can be used for motors running the drum drive,
the fans and/or the compressor (the latter only for heat pump driers).
Synchronous motors, such as BLDC motors, are generally more efficient than traditional
asynchronous AC induction motors (both single and three phased)170. This is partly because
induction motors use current to create electromagnets, where synchronous motors utilize
permanent magnets. Synchronous motors are however typically more expensive, and they
require a controller (frequency inverter) to be present in the unit.
With the introduction of BLDC motors, the overall motor configuration has changed as well.
Whereas in the preparatory study almost every drier used one single motor to drive the
drum and the fan for process air and to drive the fan for the condensing air (in condensing
driers only) or compressor cooling air (heat pump driers only), some top-class driers
nowadays use a smaller BLDC for each of these systems. This can improve the overall
efficiency, as it enables the machine to switch individual systems on/off as they are needed.
168 https://www.enggcyclopedia.com/2012/03/finned-tube-heat-exchangers/ 169 Both the primary lint filter, and for the condenser lint filter for HP-C driers without self-cleaning heat exchangers. 170 http://www.orientalmotor.com/brushless-dc-motors-gear-motors/technology/AC-brushless-brushed-motors.html
164
4.1.2 Variable Speed Drives for all drier types
The introduction of variable speed drives introduces a range of benefits. They can be placed
on each of the before mentioned systems, as well as on the compressor for heat pump
driers.
Using a variable speed drive on the heat pump compressor can give major improvements
to the efficiency171, especially with regard to part load operation or when reduced drying
temperatures are wanted (for long cycles or delicate fabrics).
A heat pump efficiency is fundamentally linked to the temperature levels in the evaporator
and condenser. A large temperature difference results in low efficiency and vice versa.
These temperatures, represented as the evaporation and condensation temperature, are
the results of multiple parameters, such as pressure ratios, heat exchanger effectivities,
and refrigerant flow rate. Larger heat exchangers can sustain a lower temperature
difference between the refrigerant and the process air, which improves performance by
reducing the difference between the evaporation and condensation temperatures.
When lowering the flow rate by reducing the speed of the compressor, the heat flux from
the condenser to the process air is lowered. As the size of the heat exchangers however
remain constant, the temperature difference can be lowered and thus – as mentioned
before – increase the performance. Another major benefit is the reduction of the energy
consumption associated with start-up of the heat pump unit, which can be substantial at
part load operations, as the heat pump unit can run continuously instead of start-stop
operation.
4.1.3 Controller for all drier types
99% of all commercially available driers are equipped with a controller that automatically
turns off the drier when a specific moisture content is reached in the laundry172. This is
done either by directly measuring the moisture level through a conductivity sensor in
contact with the laundry, or indirectly by measuring the humidity level in the process air.
Accurately monitoring the moisture content is key to an efficient drying process, as an
inaccurate measurement can lead to either under- or over drying the laundry, either
resulting in poor drying performance, or an increased energy consumption.
4.1.4 Heat exchangers for condensing driers
Two different types of heat exchangers exist. For heating element condensing driers, a
condenser exists which condenses the water vapor in the process air, by parsing it through
171 http://www.rehva.eu/publications-and-resources/rehva-journal/2012/052012/capacity-control-of-heat-pumps-full-version.html 172 APPLIA Model database 2016
165
a heat exchanger cooled by the outside air via a fan. This is hence an air-to-air heat
exchanger.
For heat pump condensing driers, an additional heat exchanger exists between the process
air and the refrigerant, which is used to deliver the heat from the heat pump cycle to the
process-air. It acts as a condensing unit for the refrigerant and is thus a liquid/air-to-air
heat exchanger.
Furthermore, the process-air condensing heat exchanger uses the heat pump cycle instead
of outside air to condense the water. It acts as an evaporator unit for the heat pump cycle
and is thus also a liquid/air-to-air heat exchanger.
The efficiency of the heat exchangers plays an important role with regard to the energy
consumption of the driers – especially the heat pump unit, as more efficient heat
exchangers can reduce the pressure levels in the heat pump cycle. For the heating element
condensing driers, a more efficient heat exchanger increases the condensation rate.
Common for both types, is that the thermal conductivity in the material used is directly
linked to the efficiency. Copper is a commonly used material for heat exchangers but is
also expensive. Other options are aluminium, nickel alloys, or even stainless steel – all of
which are cheaper, but also have a lower thermal conductivity and thus comparably lower
effectiveness.
4.1.5 Compressor for heat pump condensing driers
In heat pump driers, the size of the compressor (i.e. pressure ratio and volume flow) is
directly linked to the maximum achievable temperature of the process air. Larger
compressors can hence reduce drying times but are also more expensive. Larger
compressors are thus seen in some top models, which add shorter cycle times as a feature.
As the compressor is the component using the largest amount of energy, it is vital that the
compressor itself is efficient. The whole heat pump circuit (compressor, heat exchangers,
refrigerant) can however only run efficient if all components are optimised with respects
to each other and the goal of which the optimisation process is revolved around, whether
it is to run efficient, fast, or a combination hereof. For instance, if replacing a compressor
in a circuit with a larger more efficient, the heat pump cycle might experience bottle-
necking in the heat exchangers, resulting in frequent start/stop of the compressor. This
could lead to the whole system being less efficient, even though the new potential
compressor has a higher efficiency than the original.
166
4.1.6 Refrigerants for heat pump condensing driers
Different types of refrigerants currently exist in tumble driers on the market. These range
from F-gasses (Like R134a) to organics (Like R290/Propane). The type of refrigerant is
chosen based on the sought temperature levels and specific compressor and its
corresponding pressure ratios. Organic refrigerants are preferred from a global warming
potential perspective, and more recent desktop research shows they do not have an effect
on the energy efficiency of the whole heat pump circuit. A report from the Energy Efficiency
Task Force of the Montreal Protocol173 states that using organic refrigerants instead of F-
gasses can change energy consumptions by +/- 5% - 10%. The potential added energy
consumption and thus CO2-eq. emissions are however ~35% lower174, when taking the
GWP of the F-gasses used into consideration. This is assuming that no recycling of the
refrigerants takes place.
Stakeholders however have reported that driers with R290 is not negatively affected
regarding energy efficiency compared to driers with R134a. Models with R290 is currently
on the market and able to achieve an A+++ energy label175. The thermodynamic properties
of R290 supports this, requiring a lower pressure difference in order to sustain the same
heat flux compared to R134a176.
4.1.7 Drum, bearings, and sealing for all drier types
The drum itself can be of different kinds of material (e.g. stainless steel, steel, zinc). This
have however no impact on energy efficiency, and only on the look and feel of the model.
The sealings are crucial to the condensation efficiency of the drier, but also to the energy
consumption of the drum motor. A better seal causes more friction when turning the drum,
and thus requires more torque from the drum motor. The energy and condensation
efficiency of the drier are thus to some extent inversely proportional. If the drier however
is places in a heated room, a low condensation efficiency requires additional ventilation
and thus reduces the overall system energy efficiency.
4.1.8 Filters for all drier types
The lint filters act as a protective screen against lint-build up in the machine. Clogged filters
reduce the process air flow, which reduces the drying efficiency. This effect is present as
173http://conf.montreal-protocol.org/meeting/oewg/oewg-40/presession/Background-Documents/TEAP_DecisionXXIX-10_Task_Force_EE_May2018.pdf 174 Assuming a 12-year lifetime, 240 AEc, and 380g of R134a refrigerant. 175 According to stakeholders, and according to a desktop study. 176 For instance, the difference in condensation and evaporation temperatures are higher for R290 than it is for R134a for equal pressure differences. Source: CoolProp
167
soon as the cycle starts, and thus marginally increases energy consumption during the
cycle177. Designing filters less prone to clogging, or simply with better flow characteristics,
reduces this effect and is thus advantageous to the energy efficiency.
4.1.9 Additional features
Network connectivity: Some high-end tumble driers from major manufacturers are
beginning to be equipped with modules for internet connectivity over LAN or Wi-Fi. This
enables control of the unit with a dedicated smartphone application, for remote start
operations and for notifications when the cycle is completed.
Self-cleaning heat exchangers for condensing driers: Top model heat pump driers
can be equipped with self-cleaning condenser heat exchangers178, by flushing the heat
exchanger during the drying cycle. This removes the need for regularly maintaining the
heat exchanger. This is an extra feature, which might reduce efficiency losses through
wear and lint build up, which otherwise could lead to significantly higher energy
consumption and cycle times177.
Some manufacturers claim that the self-cleaning heat exchanger technology reduces the
lifetime of the drier, as the water-and-lint slurry eventually accumulates (if not cleaned
every 20 cycles as recommended by some manufacturers), in the unit and leads to clogging
in inaccessible parts of the machine which can then only be remedied by a repair.
4.2 Best Available Technology BAT
The list of improvement-capable components can be summarized similarly to the average
tumble drier in Table 37. Table 38 shows the BAT for each component. Note that the heat
pump driers always outperform the other types and should hence still be classified as the
BAT tumble drier.
During the preparatory study, air vented driers with heat pumps as heat source were
presented as a BAT technology and a design option. No air vented models with heat pumps
are currently available on the market. According to stakeholders, no models of this type
are currently in the pipeline.
Combining an air vented drier with a heat pump circuit would increase the unit cost
substantially and would induce problems with condensation in the evaporator. In short, an
air vented heat pump drier would properly cost the same as current heat pump driers, but
with a higher energy consumption and with the added draw backs associated with air
177 “EXPENSIVE MEASURES FOR THE ENVIRONMENT”, Berge et al., RÅD & RÖN No. 7, 2012 178 Condenser here being the water condenser, and the heat-pump cycle evaporator
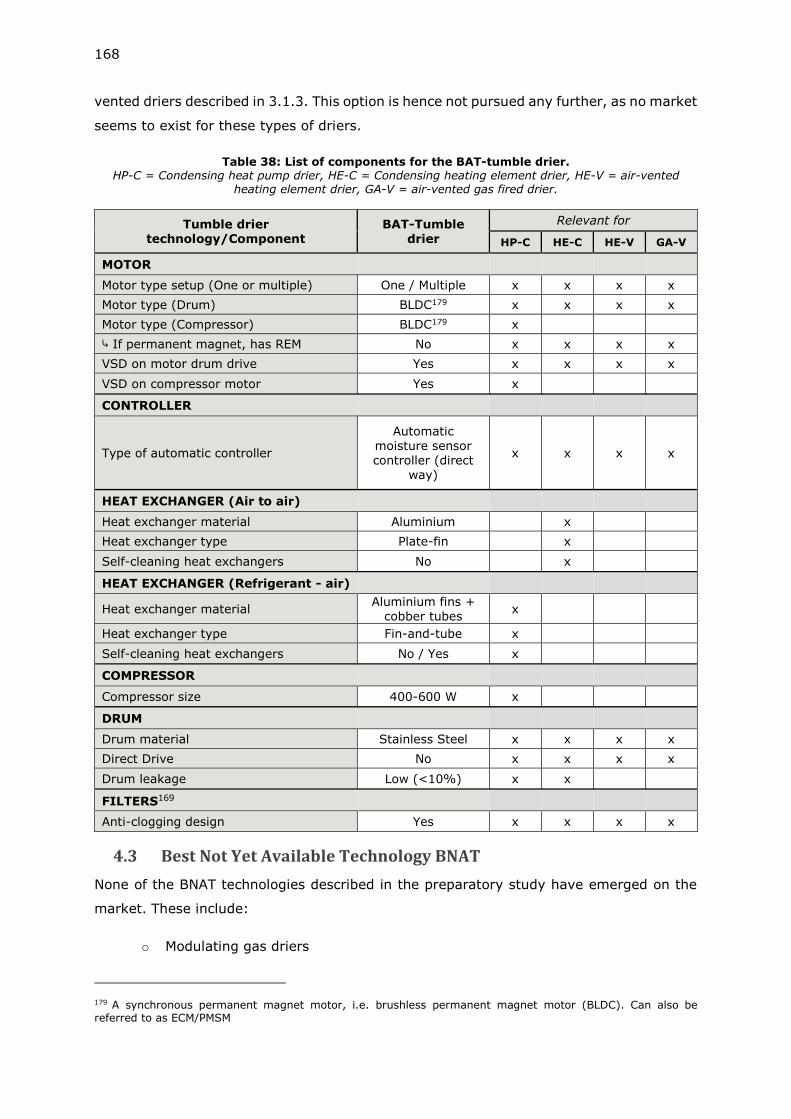
168
vented driers described in 3.1.3. This option is hence not pursued any further, as no market
seems to exist for these types of driers.
Table 38: List of components for the BAT-tumble drier. HP-C = Condensing heat pump drier, HE-C = Condensing heating element drier, HE-V = air-vented
heating element drier, GA-V = air-vented gas fired drier.
Tumble drier technology/Component
BAT-Tumble drier
Relevant for
HP-C HE-C HE-V GA-V
MOTOR
Motor type setup (One or multiple) One / Multiple x x x x
Motor type (Drum) BLDC179 x x x x
Motor type (Compressor) BLDC179 x
⤷ If permanent magnet, has REM No x x x x
VSD on motor drum drive Yes x x x x
VSD on compressor motor Yes x
CONTROLLER
Type of automatic controller
Automatic moisture sensor controller (direct
way)
x x x x
HEAT EXCHANGER (Air to air)
Heat exchanger material Aluminium x
Heat exchanger type Plate-fin x
Self-cleaning heat exchangers No x
HEAT EXCHANGER (Refrigerant - air)
Heat exchanger material Aluminium fins +
cobber tubes x
Heat exchanger type Fin-and-tube x
Self-cleaning heat exchangers No / Yes x
COMPRESSOR
Compressor size 400-600 W x
DRUM
Drum material Stainless Steel x x x x
Direct Drive No x x x x
Drum leakage Low (<10%) x x
FILTERS169
Anti-clogging design Yes x x x x
4.3 Best Not Yet Available Technology BNAT
None of the BNAT technologies described in the preparatory study have emerged on the
market. These include:
o Modulating gas driers
179 A synchronous permanent magnet motor, i.e. brushless permanent magnet motor (BLDC). Can also be referred to as ECM/PMSM
169
o Vacuum driers
o Mechanical steam compression driers
o Microwave driers
They are hence still considered as BNAT technologies in this study. Additionally, a new
technology is being tested at the University of Florida, which uses piezoelectric oscillators
to mechanically dry the clothes by “vibrating” it at ultrasonic frequencies instead of using
heat180. This means that the water is physically removed instead of being evaporated,
which removes the need to overcome the latent heat of the water in the evaporation phase.
This could reduce drying times, as well as reduce the energy consumption by (reported)
up to 70%. No news about production timelines is available as of February 2018.
Furthermore, self-cleaning lint filters are under development. This could reduce the need
for cleaning the lint filter, and thus lead to energy efficiency improvements for end-users
not regularly cleaning the filter, as only 45% of users do this before every cycle (see Figure
45).
4.4 Production and distribution
The production and distribution provide a quick overview of the material composition and
distribution of tumble driers. The inputs will be used to model the environmental footprint
in later task. The material composition also gives valuable inputs to the discussion on
resource efficiency.
4.4.1 Bill-of-Materials (BOM)
This section presents the BOM of tumble driers. The presented values will be used as inputs
in the EcoReport Tool for Task 5.
Bill-of-Materials (BOM) of tumble driers
The material composition and weight of tumble driers are based on stakeholder input and
are somehow similar to the values presented in the preparatory study, but with the addition
of heat pump tumble driers. The material composition is of great importance to the
recyclability since some materials are easier to recycle than others which will have an effect
in later tasks. No data is available for gas tumble driers, so they are assumed to have a
material composition similar to a regular air-vented type.
The assumed material composition of tumble driers is presented in Table 39.
180 https://energy.gov/sites/prod/files/2016/04/f30/31297_Momen_040516-1205.pdf
170
Table 39: Assumed average material composition of tumble driers in the preparatory study
Material
Type
Materials
(examples)
Air-vented –
Heat element
(in g)
Condenser –
Heat element (in
g)
Condenser –
heat pump
(in g)
Bulk Plastics PP, PP GF,
ABS, PA
GF181
9300 12800 13900
TecPlastics Elastomer 900 679 1200
Ferrous Sheet metal
steel 18700 23473 18500
Non-ferrous Aluminium,
copper 150 1364 3500
Coating 0 0 0
Electronics Various 5600 6040 13350
Misc. 2800 2800 6800
Total 37450 47156 57550
It appears that air-vented tumble driers are approximately 10 kg lighter than condenser
heat element driers and 20 kg lighter than heat pump condenser driers. Heat pump
condenser driers have the highest use of materials and also the highest consumption of
electronics. The amount of ferrous are almost identical for these types of tumble driers,
but the amount of bulk plastic is considerable higher for the condenser types.
4.4.2 Primary scrap production during manufacturing
The primary scrap production is estimated to be negligible. It is assumed that cuttings and
residues are directly reused into new materials. So, the actual losses of materials are low.
4.4.3 Packaging materials
Cardboard, plastic and expanded polystyrene are used to protect the products during
transport. More packing materials are sorted by the end-user and recycled. Cardboard are
easily recyclable for the next purpose while the plastic likely is burned or recycled
otherwise. Regarding the expanded polystyrene it can be compressed and recycled into
polystyrene. The problem is the density and volume of the expanded polystyrene. It must
be compressed to make it both affordable and environmentally sound.
4.4.4 Volume and weight of the packaged product
The volume of the packaged product is assumed to be same as the standard dimensions182
of tumble driers including five additional centimetres due to packaging such as polystyrene.
This means that the volume of the packaged product (full size tumble drier) is:
181 Nomenclature used in the EcoReport tool. PP=Polypropylene, PP GF=Polypropylene Glass Reinforced, PA=Polyamide, PA GF=Polyamide Glass Reinforced. 182 Standard dimensions provided by stakeholders
171
𝑉𝑜𝑙𝑢𝑚𝑒𝑓𝑢𝑙𝑙 𝑠𝑖𝑧𝑒85 𝑐𝑚 × 65 𝑐𝑚 × 65𝑐𝑚 = 0.36 𝑚3
4.4.5 Means of transport
The means of transport are often negligible in life cycle assessments since the impact often
is small compared to the environmental impact of the rest of the product. Most tumble
driers are assumed to be shipped by freight ship or by truck. Both means of transport have
in general a low impact in the final assessment.
4.5 End-of-Life
Resource efficiency is a growing concern within Europe. More raw materials are categorised
as critical and the dependency of these materials are increasing. In addition, it seems that
more resource requirements are included in ecodesign Regulations. To improve the
resource and material efficiency the following elements are key parameters;
o Recyclability: Identifying materials that hinder recycling with a view to assess
possibilities to avoid them in the product design. The recyclability of tumble
driers is directly addressed in section 4.5.1.
o Reparability: Identification of spare parts (those which fail too early in driers
lifetime).
o Disassembly: Removal of certain components with a view to assess possibilities
for increase their reuse and/or recycling at end of life (i.e. by easy removal).
4.5.1 Recyclability of tumble driers
After collection, tumble driers are treated at suited facilities. Tumble driers with heat pump
technology are handled together with other appliances containing refrigerants such as
refrigerators. These appliances are treated at specialised facilities which can handle the
refrigerants. The waste process flow183 for refrigerants appliances (RA) are visualised in
Figure 59.
183 http://www.sciencedirect.com/science/article/pii/S0921344915300021
172
Figure 59: The waste process flow for commercial refrigerants appliances
The pre-processing184 is the first step in the recycling process of tumble driers containing
refrigerants. This first step often consists of manual removing of targeted components
and/or materials for further treatment. The pre-processing is very important in connection
with an effective recycling process by reducing the risk of contamination, quickly recover
selected valuable materials and allow compliance with current legislation on hazardous
substances and waste and prevent damage to the facility in the following steps. It is also
during the pre-processing the refrigerants and oils are removed by piercing the tubes
followed by suction to safely remove these substances. The heat exchangers of tumble
driers with heat pumps are likely to be removed since they may contain a lot of copper.
According to the WEEE Directive components such as electronic components (e.g. printed
circuit board, capacitors, switches, thermostat, liquid crystal displays) and lighting systems
(gas discharge lamps) are additionally dismantled when present. Equipment with large
dimensions might be cut to smaller pieces before shredding.
Next step185 is shredding, which reduces the tumble driers in smaller pieces. These facilities
also handle insulation foams which may contain different hydrocarbons (if present) so
these are removed in an initial shredding in closed atmosphere. These foams are usually
burned.
After the equipment has been shredded into smaller pieces (approximately 1 cm to 10 cm)
different technologies handle the sorting. These technologies are often:
• Magnetic separation removing ferrous metals
• Eddy current separators removing non-ferrous metals such as copper, aluminium,
and zinc
• Density separators for different types of plastic.
184 http://www.sciencedirect.com/science/article/pii/S0921344915300021 185 http://www.sciencedirect.com/science/article/pii/S0921344915300021
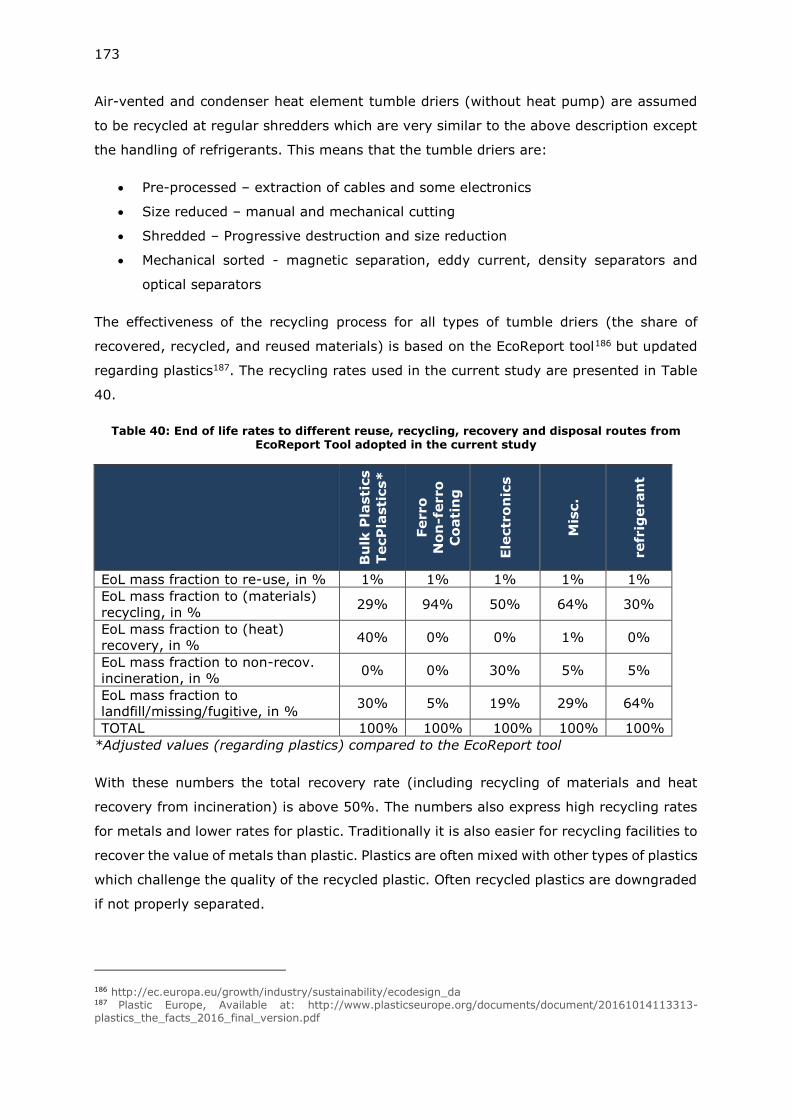
173
Air-vented and condenser heat element tumble driers (without heat pump) are assumed
to be recycled at regular shredders which are very similar to the above description except
the handling of refrigerants. This means that the tumble driers are:
• Pre-processed – extraction of cables and some electronics
• Size reduced – manual and mechanical cutting
• Shredded – Progressive destruction and size reduction
• Mechanical sorted - magnetic separation, eddy current, density separators and
optical separators
The effectiveness of the recycling process for all types of tumble driers (the share of
recovered, recycled, and reused materials) is based on the EcoReport tool186 but updated
regarding plastics187. The recycling rates used in the current study are presented in Table
40.
Table 40: End of life rates to different reuse, recycling, recovery and disposal routes from EcoReport Tool adopted in the current study
Bu
lk P
lasti
cs
TecP
lasti
cs*
Ferro
No
n-f
erro
Co
ati
ng
Ele
ctr
on
ics
Mis
c.
refr
igeran
t
EoL mass fraction to re-use, in % 1% 1% 1% 1% 1%
EoL mass fraction to (materials)
recycling, in % 29% 94% 50% 64% 30%
EoL mass fraction to (heat)
recovery, in % 40% 0% 0% 1% 0%
EoL mass fraction to non-recov.
incineration, in % 0% 0% 30% 5% 5%
EoL mass fraction to
landfill/missing/fugitive, in % 30% 5% 19% 29% 64%
TOTAL 100% 100% 100% 100% 100%
*Adjusted values (regarding plastics) compared to the EcoReport tool
With these numbers the total recovery rate (including recycling of materials and heat
recovery from incineration) is above 50%. The numbers also express high recycling rates
for metals and lower rates for plastic. Traditionally it is also easier for recycling facilities to
recover the value of metals than plastic. Plastics are often mixed with other types of plastics
which challenge the quality of the recycled plastic. Often recycled plastics are downgraded
if not properly separated.
186 http://ec.europa.eu/growth/industry/sustainability/ecodesign_da 187 Plastic Europe, Available at: http://www.plasticseurope.org/documents/document/20161014113313-plastics_the_facts_2016_final_version.pdf
174
4.5.2 Design options regarding resource efficiency
Different approaches can be implemented towards improved resource efficiency at End-of-
Life. Several options are available for design improvements and covers both more holistic
guidelines and product specific suggestion.
Common “design for X” practices which cover all types of EEE products could be188:
• Minimise the number and type of fasteners, so fewer tools are needed during
disassembly and repair.
• The fasteners should be easily accessible and removable.
• Easy to locate disassembly points.
• If snap fits are used, they should be obviously located and possible to open with
standard tools to avoid damaging the product during repair.
• It is beneficial if fasteners and materials are either identical or are compatible with
each other in the recycling process.
• The use of adhesive should be minimised.
• Minimise the length of cables to reduce the risk of copper contamination, or
connection points could be designed so they can break off.
• Simple product design is preferable.
These suggestions are not specifically targeting tumble driers, they are suggestions for all
EEE products, which need to be evaluated on a case by case basis. Overall, if the above
measures would be implemented for tumble driers, they would become easier to
disassemble and thus more people might consider repairing the product.
Design for recycling mainly focuses on the recycling compatibility of different materials
avoiding losses at End-of-Life. This can be done by respecting a few common guidelines
such as minimising the use of non-reversible adhesives. Even the suggestions seem simple,
design for recycling is quite complicated due to the mix of products at End-of-Life. Different
products are discarded together which increases the complexity and risk of contamination.
Even within the same product group contaminant can appear. To prevent contamination at
End-of-Life and to improve the quality of the recycled material it is important to consider
the material mix and how the different materials are liberated at End-of-Life. In design for
recycling, it is important to consider189:
188 Chiodo, J., 2005. Design for Disassembly Guidelines. Available at: http://www.activedisassembly.com/strategy/design-for-disassembly/. 189 Reuter, M.A. & Schaik, A.V.A.N., 2013. 10 Design for Recycling Rules, Product Centric Recycling & Urban / Landfill Mining. , pp.1–15.
175
• To reduce the use of materials, and especially the use of materials that will cause
loss or contamination in the recycling process. It should be considered how the
materials would behave in the sorting and processing at End-of-Life.
• To identify materials in assemblies combined in an inappropriate causing loss of
resources during recycling, e.g. the connection between a metal screws and plastic,
where one of them may be lost due to incomplete liberation. Also, some mixes of
metal are problematic, and some types of metal require further processing than
what the typical smelters technologies offer (see Figure 105). Figure 105 shows a
metal wheel which explains which metal resources can be recovered by different
smelters and other processing technologies. Table 87 shows the compatibility of
different types of plastics when being recycled.
• Proper labelling both on plastic, but also general futures such as marking of tapping
points of generators.
• Minimise the use non-reversible adhesives and avoid the use of bolt/rivets to obtain
maximum liberation at End-Of-Life.
Other relevant measures for improved resource efficiency are discussed in section 3.2
where availability of spare parts, repair instructions and prolonged lifetime is discussed.
Guidelines based on valuable or critical resources
The awareness of resources and resource criticality is increasing, and the Commission
carries out a criticality assessment at EU level on a wide range of non-energy and non-
agricultural raw materials. In 2017, the criticality assessment was carried out for 61
candidate materials (58 individual materials and 3 material groups: heavy rare earth
elements, light rare earth elements and platinum group metals)
The following main parameters are used to determine the criticality of materials190:
• Economic importance - the importance of a material for the EU economy in terms
of end-use applications and the value added of corresponding EU manufacturing
sector.
• Supply risk - reflects the risk of a disruption in the EU supply of the material. It is
based on the concentration of primary supply from raw materials producing
countries, considering their governance performance and trade aspects.
The updated list of critical raw materials is presented in Table 41.
190 https://ec.europa.eu/growth/sectors/raw-materials/specific-interest/critical_da
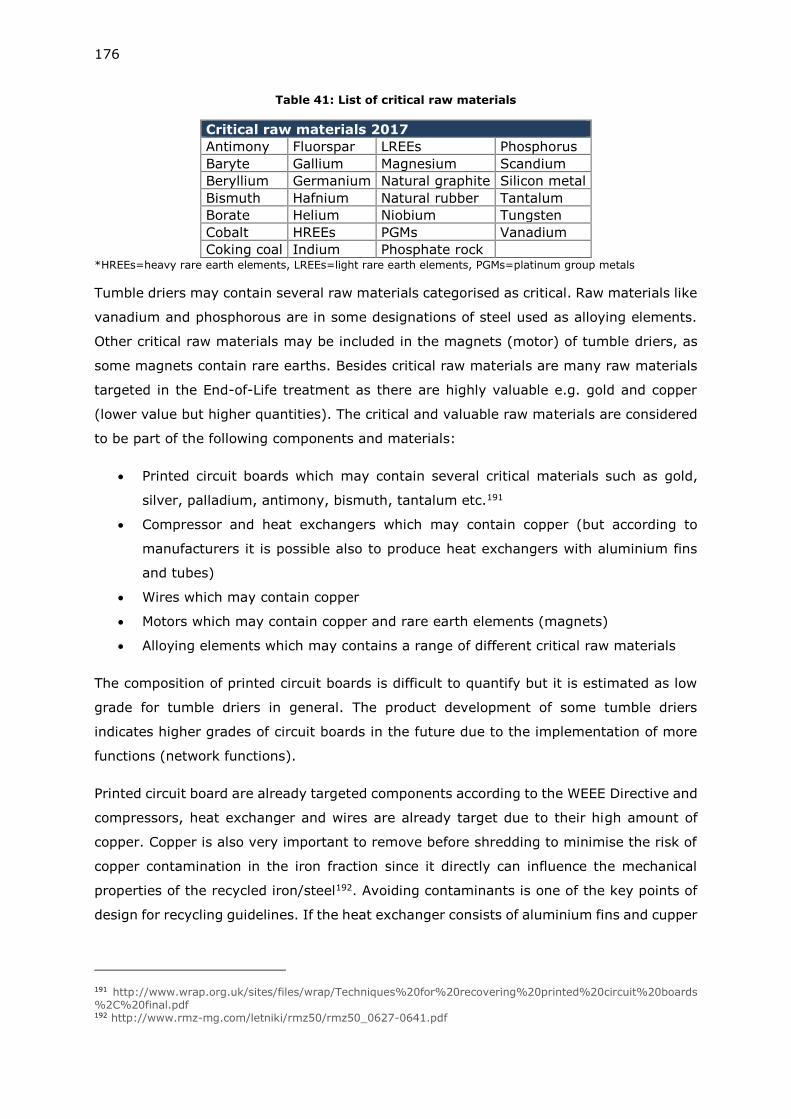
176
Table 41: List of critical raw materials
Critical raw materials 2017
Antimony Fluorspar LREEs Phosphorus
Baryte Gallium Magnesium Scandium
Beryllium Germanium Natural graphite Silicon metal
Bismuth Hafnium Natural rubber Tantalum
Borate Helium Niobium Tungsten
Cobalt HREEs PGMs Vanadium
Coking coal Indium Phosphate rock *HREEs=heavy rare earth elements, LREEs=light rare earth elements, PGMs=platinum group metals
Tumble driers may contain several raw materials categorised as critical. Raw materials like
vanadium and phosphorous are in some designations of steel used as alloying elements.
Other critical raw materials may be included in the magnets (motor) of tumble driers, as
some magnets contain rare earths. Besides critical raw materials are many raw materials
targeted in the End-of-Life treatment as there are highly valuable e.g. gold and copper
(lower value but higher quantities). The critical and valuable raw materials are considered
to be part of the following components and materials:
• Printed circuit boards which may contain several critical materials such as gold,
silver, palladium, antimony, bismuth, tantalum etc.191
• Compressor and heat exchangers which may contain copper (but according to
manufacturers it is possible also to produce heat exchangers with aluminium fins
and tubes)
• Wires which may contain copper
• Motors which may contain copper and rare earth elements (magnets)
• Alloying elements which may contains a range of different critical raw materials
The composition of printed circuit boards is difficult to quantify but it is estimated as low
grade for tumble driers in general. The product development of some tumble driers
indicates higher grades of circuit boards in the future due to the implementation of more
functions (network functions).
Printed circuit board are already targeted components according to the WEEE Directive and
compressors, heat exchanger and wires are already target due to their high amount of
copper. Copper is also very important to remove before shredding to minimise the risk of
copper contamination in the iron fraction since it directly can influence the mechanical
properties of the recycled iron/steel192. Avoiding contaminants is one of the key points of
design for recycling guidelines. If the heat exchanger consists of aluminium fins and cupper
191 http://www.wrap.org.uk/sites/files/wrap/Techniques%20for%20recovering%20printed%20circuit%20boards%2C%20final.pdf 192 http://www.rmz-mg.com/letniki/rmz50/rmz50_0627-0641.pdf
177
tubes the aluminium is likely to be lost in the recycling process, so it could be beneficial if
the heat exchangers are made of the same material.
Furthermore, manufacturers have indicated that the drum often is made of stainless steel
(which may contain rare earths elements as alloying elements) only for the feel and look
of the drier. In principle it could be beneficial to use regular steel as long as the lifetime
not are affected.
Regulatory measures
Material efficiency requirements can be very difficult to model, as the material efficiency is
dependent on the waste handling system which again are dependent on the commodity
prices. The current preferred waste processing is shredding but within the next 20 years it
may change significantly, and it is therefore difficult in later task to quantify any measure
towards improved material efficiency. Also, when products are shredded with other types
of products the impact of any requirements toward a specific product may be reduced.
Material requirements may therefore have greater effect if they are aligned across all
product groups. A summary of the different requirements related to material efficiency in
other regulations (adopted and not yet adopted) are presented in Table 42.
178
Table 42: Alignment with proposals from other Regulations
Information requirements
for
refrigeration
gases
Requirements
for
dismantling
for the
purpose of
avoiding
pollution, and
for material recovery and
recycling
Spare part
availability
Spare part
maximum
delivery time
Access to
Repair and
Maintenance
Information
Lifetime and
durability
requirements
Dishwashers
(Suggestion)
x x x x x
Washing
machines
(Suggestion)
x x x x x
Water Heaters x
Domestic and
commercial
ovens, hobs and
grills
x
Residential
Ventilation
x
Circulators and
pumps
x
Ventilation Fans x
Electric motors x
Vacuum cleaners x x x
Local room
heating
products
x
Domestic and
commercial
ovens, hobs and
grills
x
TVs x
Personal
computers and
portable computers
x
Dishwashers and washing machines may in the future have the most ambitious
requirements regarding resource efficiency193according to proposed amendments to the
current Ecodesign Regulations for these products194.These Regulations are not yet adopted
but it seems to be the general trend. Previously there have been different requirements
regarding information relevant for the disassembly but one of the greatest barriers towards
increased repair and refurbishment is the lack of available spare parts195. By alignment
with other Regulation it will be insured that all product groups constitute to transition from
a linear economy to a more circular economy.
Recommendations regarding resource efficiency
The low collection rate of tumble driers can challenge the improvement potential of any
suggestions regarding resource efficiency since many products do not reach the desired
recycling facility. The collection rate is expected to increase and fulfil the WEEE Directive
193 Note that vacuum cleaners also have ambitious requirements with durability and lifetime, which are not reflected in Table 42. 194 Proposals was discussed at meetings in Consultation Forum on 18 and 19 December 2017. The working document where these suggestions are presented are available on: https://www.eceee.org/ecodesign/ 195 Deloitte (2016) Study on Socioeconomic impacts of increased reparability – Final Report. Prepared for the
European Commission, DG ENV.
179
in 2019. The current low collection rates cannot be directly addressed in the Ecodesign
Regulation for tumble driers since this is not related to the design of the product.
Based on the list of critical raw materials and the WEEE Directive the following components
and materials are of special interest:
• Printed circuit boards which may contain several critical materials such as gold,
silver, palladium, antimony, bismuth, tantalum etc.196
• Compressor and heat exchangers which may contain copper (but according to
manufacturer it is possible also to produce heat exchangers with aluminium fins
and tubes).
• Wires which may contain copper.
• Motors which may contain copper and rare earth elements (magnets).
By alignment with other Regulations (especially with the suggested dishwasher and
washing machine Regulation), printed circuit boards are easily removed when they are
larger than 10 cm2 which also seems very beneficial from a critical resource perspective
and supporting the WEEE Directive (see Annex II). Some requirements may be difficult to
address from a market surveillance perspective because the requirements are difficult to
control such as requirements of ease of dismantling. However, the current work on a
scoring system on reparability may ease any resources needed for the verification of
resource efficiency requirements. Requirements on e.g. ease of disassembly and repair are
proposed in amendments to the washing machine ecodesign.
196 http://www.wrap.org.uk/sites/files/wrap/Techniques%20for%20recovering%20printed%20circuit%20boards%2C%20final.pdf
5. Environment and Economics
The aims of this task are:
• Define the base cases taking into account the scope proposed in task 1, the market
analysis in task 2, the user behaviour analysis in task 3 and the technologies
identified in task 4. The base cases will be used in the next tasks of the report to
identify design improvement options, draw policy options and evaluate their effects
per base case.
• Assess the life cycle environmental impacts and the life cycle costs (LCC) of these
base cases
5.1 Product specific inputs
According to MEErP methodology197, the base cases (BC) should reflect representative
products on the market in terms of energy efficiency, resource efficiency, emissions and
functional performance. Different products with similar functionalities, Bill of Materials
(BoM), technologies and efficiency can be compiled into a single BC. Therefore, although
it may not refer to a specific product on the EU market, it does represent the range of
typical products. The base cases are used for modelling the environmental and economic
impacts of the products and is representing the reference line (baseline) in the scenario
analysis in task 7.
5.1.1 Base cases for household tumble driers
Section 2.1.1 shows that even though heat pump driers account for almost half of the EU
tumble drier market, heating element driers still persist and may continue to be sold. Sales
figures however indicate a steady reduction of heating element air-vented sales, and these
types are assumed to be discontinued around 2030. This is not the case for gas-fired air-
vented driers, as they continue to be sold and the current available data does not present
evidence for a discontinuance of these models before 2030198. After 2030, the estimated
sales are too low to accurately estimate in stock models199 which might or might not result
in these models being removed from the market.
The base cases have been split into the four main tumble driers heat source technology
types in the market, in order to differentiate life cycle costs and environmental impacts
and investigate improved design options at this segregated level. This will give more details
on the costs and environmental hotspots as well as improvement potentials.
197 Section 4.1 – Technical product description. Page 76. 198 Gas-fired manufacturers did not provide input on the future sales trends of this product type 199 For the stock model developed and used in this study, gas-fired driers represented 0.002% of the total sales in 2030 and are therefore almost completely neglible for any results whatsoever.
181
The four selected base cases are:
• Base case 1: Condenser tumble driers (heating element)
• Base case 2: Condenser tumble driers (heat pump)
• Base case 3: Heating element air-vented
• Base case 4: Gas-fired air-vented
Table 43 shows the main differences in performance parameters between the base cases.
The average values are based on data collected in previous tasks and from preparatory
study.
Table 43: Key performance parameters for the four selected base cases (2018 values)
Parameter
Base case 1:
Condenser,
Heating
element
Base case 2:
Condenser,
Heat pump
Base case 3:
Air vented,
Heating
element
Base case 4:
Air-vented,
Gas fired Sources and notes
Perfo
rm
an
ce
Average
nominal rated
capacity [kg]
7.7 7.8 6.8 6.8 Figure 33 (GfK)200
Average
energy
consumption
per cycle
(Edry), 100%
loaded [kWh]
4.4 1.9 4.0 1.9
Specific energy consumption from
Figure 44 (APPLiA) at full load,
multiplied with the nominal
capacity. Gas data based on
WhiteKnight ECO43.
Average
energy
consumption
per cycle
(Edry½), 50%
loaded [kWh]
2.4 1.0 2.2 1
Specific energy consumption from
Figure 44 (APPLiA) at partial load,
multiplied with 50% of the
nominal capacity. Gas data based
on WhiteKnight ECO43.
Average
energy class B A++ C A+
Figure 19 , Figure 20, Figure 21
(GfK). Based on data from 2016.
Gas data based on a desktop
study and data from GfK.
Average
condensation
efficiency
class
B B - - Figure 25, Figure 25 (GfK). Based
on data from 2016.
Average
lifetime
[years]
12 12 12 12 Section 2.2.1
200 Gas fired are assumed to follow the size of air vented heating element driers due to lack of data.
182
Parameter
Base case 1:
Condenser,
Heating
element
Base case 2:
Condenser,
Heat pump
Base case 3:
Air vented,
Heating
element
Base case 4:
Air-vented,
Gas fired Sources and notes
Average cycle
time, full load
(TDry)
[minutes]
129 163 123 94
Figure 34, Figure 35, Figure 35
(GfK). Based on data from 2016.
Gas data based on WhiteKnight
ECO43.
Average noise
level [dBa] >66 65 >66 62
Figure 38, Figure 39 (GfK). Based
on data from 2016. Gas data
based on WhiteKnight ECO43.
Table 44 shows parameters related to use, which are divided into “standard values” and
“real values”. The standard values represent standard conditions defined in the current
legislation, and the real values represent real user behaviour based on data collected in
Task 3.
Table 44: Standard and real key user behaviour parameters for the four base cases (2018 values)
Parameter
Base case 1:
Condenser,
Heating element
Base case 2:
Condenser,
Heat pump
Base case 3:
Air vented,
Heating element
Base case 4:
Air-vented,
Gas fired
Sources and notes
Standard
value
Real
value
Standard
value
Real
value
Standard
value
Real
value
Standard
value
Real
value
User b
eh
avio
ur
Number of cycles
per year 160 107 160 107 160 107 160 107
160 from current
regulation, 107 from
Table 22 (APPLiA) based
on 2.05 cycles/week on
average. Real value
from section 3.1.2
(APPLiA).
Average load per
cycle [kg] 5.5 4.4 5.7 4.4 5.0 4.4 5.0 4.4
Standard value
corresponds to 71% of
the rated capacity at the
current regulation201.
Real value from section
3.1.2 (APPLiA).
Average energy
consumption per
cycle, average
load [kWh]
2.9 2.4 1.4 1.1 2.7 2.3 1.5 1.3
AEc from Figure 22,
Figure 22, Figure 24
(GfK) divided by rated
capacities (Figure 33)
weighted by the
regulation loading factor
(71%201) (this yields
AEc/kg), multiplied with
the average load per
cycle from row above.
201 The loading factor is here defined as the average weight (in kg of dry laundry) of the laundry used to test the energy consumption of the drier divided by the rated capacity. The average loading is the average weight of 3
cycles at 100% the rated capacity and 4 cycles at 50% the rated capacity. This yield 3∗100%+4∗50%
7= 71%
183
Parameter
Base case 1:
Condenser,
Heating element
Base case 2:
Condenser,
Heat pump
Base case 3:
Air vented,
Heating element
Base case 4:
Air-vented,
Gas fired
Sources and notes
Standard
value
Real
value
Standard
value
Real
value
Standard
value
Real
value
Standard
value
Real
value
This value is multiplied
with (100% + Initial
Moisture Content (IMC)
correction factor202) Gas
data based on
WhiteKnight ECO43.
Average annual
energy
consumption
[kWh]
483 258 212 109 457 269 207 121
The number of cycles
per year multiplied with
the average energy
consumption per cycle
Comparing these values to values reported in the preparatory study, a few things stand
out in particular. For all types of driers, the rated capacity has increased from 5.4kg up to
7.8kg. The load has increased as well, from 3.4kg to 4.4kg203. Cycle time has increased for
all drier types. This can partly be explained by the increase in capacity, but also due to the
fact that the general drying temperature seems to be lower for heat pump driers, as the
cycle time has increased more (in percentages) than the rated capacity (see Figure 33 and
Figure 34).
Comparing to standard values used in current legislation, the ‘real’ number of cycles per
year and the average load per cycle are lower, so the average energy consumption per
cycle and per year are also lower.
5.1.2 Raw material use and manufacturing
Besides the energy consumption during the use phase, the materials in the product contain
a considerable amount of embedded energy e.g. calorific value and the energy used to
mine the raw materials and produce the finished materials. Furthermore, materials create
interactions with the environment by using resources, some scarce or critical, and emitting
substances that create a range of environmental impacts. The EcoReport Tool (2013)
contains a detailed list of materials and processes for which defined environmental
indicators are provided as default values. These values are used to calculate the
environmental impacts imposed by the materials.
The material composition and weight of tumble driers are expected to be very similar
to those presented in the preparatory study. However, the values have been updated based
on inputs from stakeholders provided during this review study. In particular, the weight
202 See section 5.1.4. 203 See section 3.1.2 “Loading of the drier” for detailed discussions.
184
for printed circuit boards are updated. Also, condenser tumble driers with heat pump
technology are well established on the EU market, which was not the case at the time of
the preparatory study.
The final material composition204 used in EcoReport Tool is presented in Table 45.
Table 45: Material composition of base cases
Material
Type Materials205
Base cases 1:
Condenser,
Heating
element –
(kg)
Base case 2:
Condenser,
Heat pump
(kg)
Base cases 2
and 3: Air-
vented heating
element and
gas-fired (kg)
Bulk
Plastics 4 -PP 12.8 13.9 9.30
TecPlastics 12 -PA 6 0.68 1.2 0.9
Ferrous 24 -Cast iron 26.29 24.9 21.3
Non-ferrous 27 -Al
sheet/extrusion 2.01 4.8 0.76
Non-ferrous 31 -Cu tube/sheet 2.17 5.1 2.0
Coating 0 0 0
Electronics 98 -controller
board (PCB) 0.405 0.525 0.405
Misc. various other
materials 2.8 6.8 2.8
Misc.
various other
materials
(Refrigerant)
not relevant 0.30 not relevant
Total 47.16 57.55 37.45
It should be noted that the weight of the refrigerant in the condenser heat pump base case
is included in the category “various other materials”. EcoReport Tool cannot properly
calculate the impacts of refrigerants (or the impacts of leakage), therefore these impacts
are calculated separately and incorporated back in to the EcoReport result in this review
study206. See more details about the method in Annex IV: Method to calculate refrigerant’s
Global Warming Potential in EcoReport tool
204 The weight of electronics shown in Task 4 BOMs was assessed too high (i.e. above 5, 6 and 13 kilos respectively of electronics for air-vented heating element, condenser heating element and condenser heat pump driers). Therefore, the electronic fraction has been corrected so it only consists of the printed circuit boards. Half of the remaining fraction is assumed to be part of the ferrous fraction which is the casing of the motor, and the other half of non-ferrous – e.g. copper and aluminium in motors. The non-ferrous fraction distribution between copper and aluminium is based on the preparatory study: Condenser – 48 % aluminium and 52 % copper; Air-vented - 27 % aluminium and 73 % copper. 205 In EcoReport tool format as indicated in MEErP. PP=Polypropylene, PA 6=Polyamide 6, Numbers are material identification numbers in EcoReport tool format. 206 (the impacts imposed by refrigerants are simply added to the results).
185
Regarding gas-fired tumble driers, no data have been available, so the material
composition is assumed to be identical for all air-vented driers regardless the energy
source207.
The estimation of consumption of critical raw materials and other materials of
high importance are mainly focusing on copper in the motor, wires and heat exchanger
(for some condenser drier) and the gold in the printed circuit boards. The copper is included
in the calculated material composition in Table 45. The amount of e.g. gold in the printed
circuit boards is included in the “electronics” fraction. Based on stakeholder inputs208 there
are two printed circuits boards in an average tumble drier which have a combined weight
of 525 grams for condenser driers and 405 grams for air-vented driers.
The average composition of a printed circuit board is assumed being as follows209:
• 70% - non-metallic e.g. glass-reinforced polymer
• 16% - Copper
• 4% - Solder (containing tin)
• 3% - iron, ferrite (from transformer cores)
• 2% - Nickel
• 0.05% - Silver
• 0.03% - Gold
• 0.01% - Palladium
• <0.01% - other (bismuth, antimony, tantalum etc.)
This means that tumble driers contain gold in the range of 0.12 grams to 0.16 grams
originating from the printed circuit boards. The grade210 of printed circuit boards in tumble
driers can be discussed, but the complexity of tumble drier is increasing which imposes
use of higher grades of printed circuit boards (which will increase the content of gold). In
general, there are many different grades for printed circuit boards for different electronic
or electrical products depending on the level of complexity of the purposes and tasks.
The environmental impacts and commodity prices of gold and copper are:
• Gold – 250 GJ/kg, 22500 CO2-eq/kg211 and 35150 EUR/kg212
• Copper – 50.9 MJ/kg, 2.7 CO2-eq/kg213 and 5.9 EUR/kg214
207 Current best guess 208 Data collection questionnaire on resource efficiency from stakeholders to this study, November 2017 209 http://www.wrap.org.uk/sites/files/wrap/Techniques%20for%20recovering%20printed%20circuit%20boards%2C%20final.pdf 210 The grade of PCBs is dependent on the amount of precious metals (e.g. gold and silver), which can vary between the category of WEEE and its age. 211 http://ec.europa.eu/environment/integration/research/newsalert/pdf/302na5_en.pdf 212 Price assessed in November 2017 at: http://www.infomine.com/investment/metal-prices/gold/1-day-spot/ 213 EcoReport tool 214Price assessed in November 2017 at: http://www.infomine.com/investment/metal-prices/copper/1-year/
186
Manufacturing
The impact of the manufacturing process is assumed to be negligible or at least small
compared to other impacts. Furthermore, it is not possible to add or adjust values for the
manufacturing process itself in the EcoReport Tool. The only adjustable input regarding
manufacturing is the percentage of sheet metal scrap. The default value is 25%, which is
kept in this study. Changing this value will only have a very limited impact on the life cycle
environmental impacts.
5.1.3 Distribution of base cases
The distribution phase is included in the calculations of the environmental impacts but have
a very limited impact on the results of the overall analysis. This phase includes the
distribution of the packaged product and covers all activities from OEM (Original Equipment
Manufacturer) components to the final delivery to consumer 215 . However, the only
parameter that can be changed in the EcoReport Tool is the volume of the final package.
The transport volume is previously discussed in Task 4, and the volume of the package for
all base cases is assumed to be216:
𝑉𝑜𝑙𝑢𝑚𝑒𝑓𝑢𝑙𝑙 𝑠𝑖𝑧𝑒85 𝑐𝑚 × 65 𝑐𝑚 × 65𝑐𝑚 = 0.36 𝑚3
These values have been used for EcoReport Tool.
5.1.4 Use phase of base cases
Conditions of use
The most important parameters identified in Task 3 were the usage frequency in terms of
cycles/week and loading in terms of kg of laundry dried per cycle.
Different studies were assessed, including the preparatory study of household washing
machines and washer driers. The conclusions from this study were that the nominal
capacity of the washing machines and the loading in kg were not strongly correlated. This
means that users did not differ in their washing behaviour according to the nominal
capacity of the washing machine.
The most recent available study – and the only one focusing only on drying behaviour – is
the APPLiA consumer study from 2018. This is chosen as the primary source for user
behaviour parameters in this study.
The APPLiA study did however report a larger average load (4.4kg), compared to the
washing machine study average load (3.3kg). This could be due to the differences in what
215 Excluding packaging 216 The volume of the packaged product is assumed to be same as the standard dimensions of tumble driers including five additional centimetres due to packaging such as polystyrene.
187
was covered by the different studies and the fact that households owning a tumble drier
are on average 0.1 person larger than households without, but it could also be because of
the differences in the study methodologies (consumer questionnaires compared to
measurement studies where the actual loads where measured).
As the previous tumble drier preparatory study has used the load from the previous
washing machines study, the differences in the real life tumble drier load (from 3.4kg to
4.4kg) could be attributed to the differences in the data sources used. The assumption that
the load is independent of the nominal capacity is thus still valid.
In summary, the loading input used in this study is 4.4kg, and the cycles per year are 107.
This is very different compared to the values used in the current regulation which uses a
~71% loading parameter, and 160 cycles/year. The EEI calculation method in the current
regulation assumes the tumble drier load in kg of laundry to be directly dependent on the
nominal capacity, and thus that the amount of laundry increases at the same rate as the
nominal capacity does.
The initial moisture content of the laundry to be dried is set to 60% in the current
regulation. This is based on an average spin speed of 1000 RPM. The APPLiA consumer
study from 2018 found an increase in applied washing machine spin speeds from 1000
RPM (assumed to be the average in the current regulation) to 1130 RPM equivalent to a
13% increase. Furthermore, the 2017 washing machine and washer-drier preparatory
study217 concluded that the spin speed and the residual moisture content of the laundry is
correlated and showed a steady increase in average spin speeds from 1997 to 2010. The
study furthermore showed distributions of the spin-drying efficiency classes and showed
that the majority of the washing machines sold in 2013 were B class spin-drying efficiency,
corresponding to a residual moisture content between 45% and 54%. This is however the
maximum spin speed (based on the standard cotton washing cycle), and not the average.
Widespread data on the residual moisture content on laundry to be dried in tumble driers
are not available, thus a desktop study was made to evaluate this effect. Based on the
product datasheets of five different tumble drier models, a correlation between the
washing’s residual moisture content of the laundry and the applied spin speed218, was
established. This can be seen on Figure 60. The increase in spin speeds thus reduces the
initial moisture content for the normal cotton cycle from 60% to 56%, and for the
synthetics from 45% to 42%.
217 Ecodesign and Energy Label for Household Washing machines and washer dryers – Preparatory study, final report, JRC, 2017 218 Based on tumble driers’ product fiches.
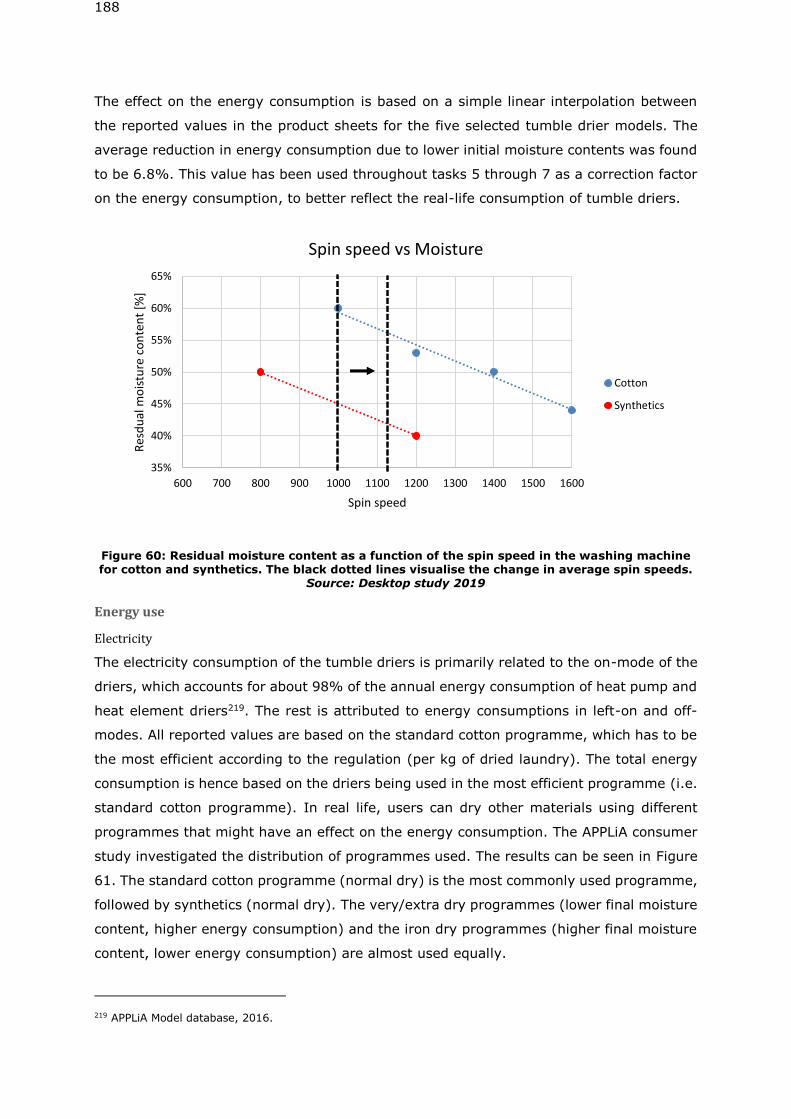
188
The effect on the energy consumption is based on a simple linear interpolation between
the reported values in the product sheets for the five selected tumble drier models. The
average reduction in energy consumption due to lower initial moisture contents was found
to be 6.8%. This value has been used throughout tasks 5 through 7 as a correction factor
on the energy consumption, to better reflect the real-life consumption of tumble driers.
Figure 60: Residual moisture content as a function of the spin speed in the washing machine for cotton and synthetics. The black dotted lines visualise the change in average spin speeds.
Source: Desktop study 2019
Energy use
Electricity
The electricity consumption of the tumble driers is primarily related to the on-mode of the
driers, which accounts for about 98% of the annual energy consumption of heat pump and
heat element driers219. The rest is attributed to energy consumptions in left-on and off-
modes. All reported values are based on the standard cotton programme, which has to be
the most efficient according to the regulation (per kg of dried laundry). The total energy
consumption is hence based on the driers being used in the most efficient programme (i.e.
standard cotton programme). In real life, users can dry other materials using different
programmes that might have an effect on the energy consumption. The APPLiA consumer
study investigated the distribution of programmes used. The results can be seen in Figure
61. The standard cotton programme (normal dry) is the most commonly used programme,
followed by synthetics (normal dry). The very/extra dry programmes (lower final moisture
content, higher energy consumption) and the iron dry programmes (higher final moisture
content, lower energy consumption) are almost used equally.
219 APPLiA Model database, 2016.
35%
40%
45%
50%
55%
60%
65%
600 700 800 900 1000 1100 1200 1300 1400 1500 1600
Res
du
al m
ois
ture
co
nte
nt
[%]
Spin speed
Spin speed vs Moisture
Cotton
Synthetics
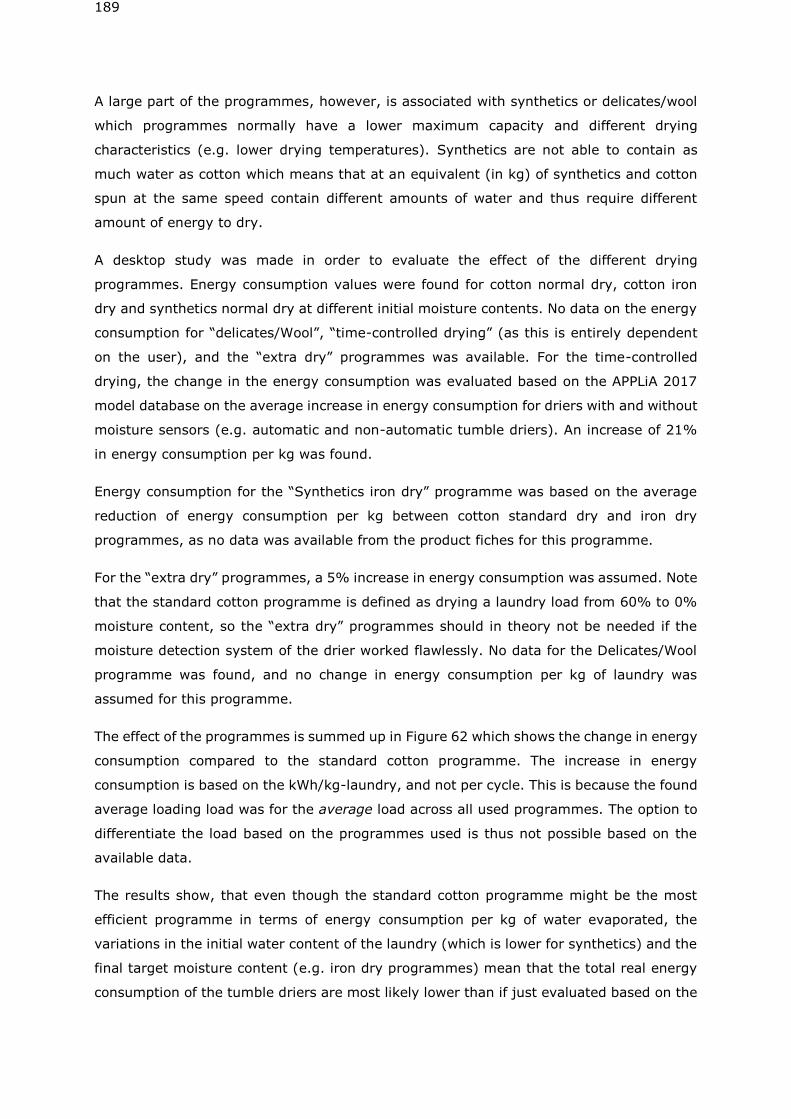
189
A large part of the programmes, however, is associated with synthetics or delicates/wool
which programmes normally have a lower maximum capacity and different drying
characteristics (e.g. lower drying temperatures). Synthetics are not able to contain as
much water as cotton which means that at an equivalent (in kg) of synthetics and cotton
spun at the same speed contain different amounts of water and thus require different
amount of energy to dry.
A desktop study was made in order to evaluate the effect of the different drying
programmes. Energy consumption values were found for cotton normal dry, cotton iron
dry and synthetics normal dry at different initial moisture contents. No data on the energy
consumption for “delicates/Wool”, “time-controlled drying” (as this is entirely dependent
on the user), and the “extra dry” programmes was available. For the time-controlled
drying, the change in the energy consumption was evaluated based on the APPLiA 2017
model database on the average increase in energy consumption for driers with and without
moisture sensors (e.g. automatic and non-automatic tumble driers). An increase of 21%
in energy consumption per kg was found.
Energy consumption for the “Synthetics iron dry” programme was based on the average
reduction of energy consumption per kg between cotton standard dry and iron dry
programmes, as no data was available from the product fiches for this programme.
For the “extra dry” programmes, a 5% increase in energy consumption was assumed. Note
that the standard cotton programme is defined as drying a laundry load from 60% to 0%
moisture content, so the “extra dry” programmes should in theory not be needed if the
moisture detection system of the drier worked flawlessly. No data for the Delicates/Wool
programme was found, and no change in energy consumption per kg of laundry was
assumed for this programme.
The effect of the programmes is summed up in Figure 62 which shows the change in energy
consumption compared to the standard cotton programme. The increase in energy
consumption is based on the kWh/kg-laundry, and not per cycle. This is because the found
average loading load was for the average load across all used programmes. The option to
differentiate the load based on the programmes used is thus not possible based on the
available data.
The results show, that even though the standard cotton programme might be the most
efficient programme in terms of energy consumption per kg of water evaporated, the
variations in the initial water content of the laundry (which is lower for synthetics) and the
final target moisture content (e.g. iron dry programmes) mean that the total real energy
consumption of the tumble driers are most likely lower than if just evaluated based on the
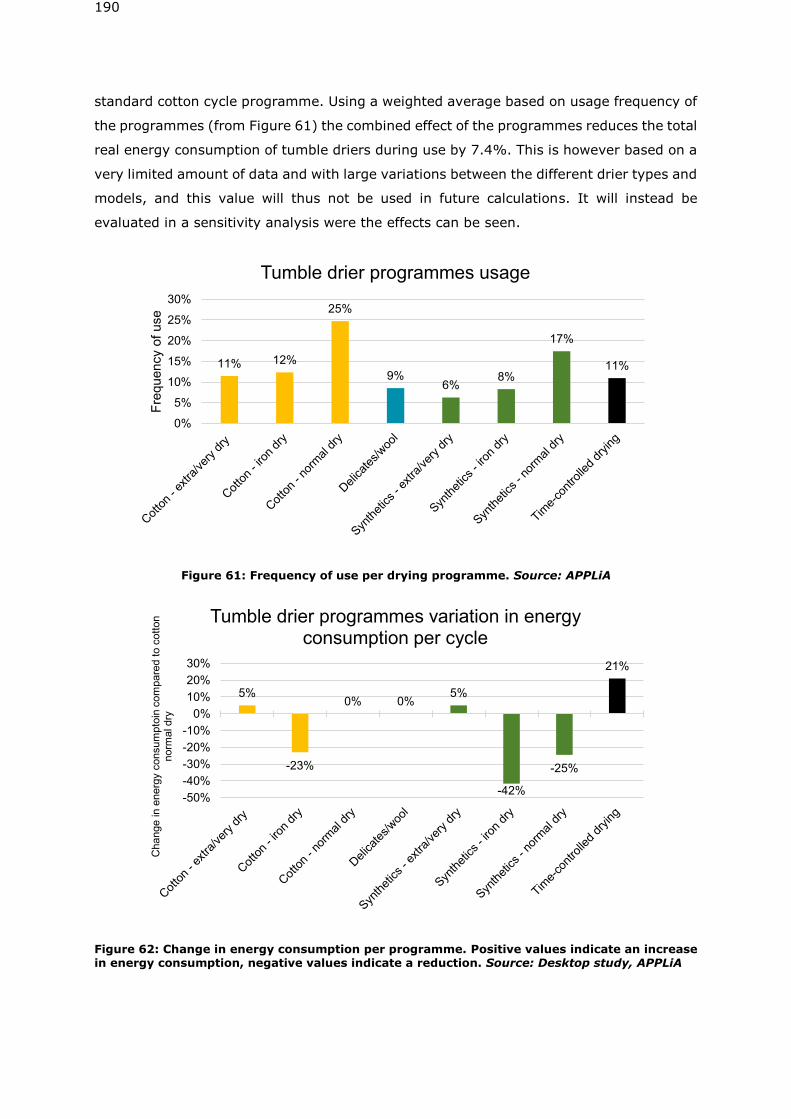
190
standard cotton cycle programme. Using a weighted average based on usage frequency of
the programmes (from Figure 61) the combined effect of the programmes reduces the total
real energy consumption of tumble driers during use by 7.4%. This is however based on a
very limited amount of data and with large variations between the different drier types and
models, and this value will thus not be used in future calculations. It will instead be
evaluated in a sensitivity analysis were the effects can be seen.
Figure 61: Frequency of use per drying programme. Source: APPLiA
Figure 62: Change in energy consumption per programme. Positive values indicate an increase in energy consumption, negative values indicate a reduction. Source: Desktop study, APPLiA
11% 12%
25%
9%6%
8%
17%
11%
0%
5%
10%
15%
20%
25%
30%
Fre
quency o
f use
Tumble drier programmes usage
5%
-23%
0% 0%5%
-42%
-25%
21%
-50%
-40%
-30%
-20%
-10%
0%
10%
20%
30%
Change in
energ
y c
onsum
pto
in c
om
pare
d to c
ott
on
norm
al dry
Tumble drier programmes variation in energy consumption per cycle
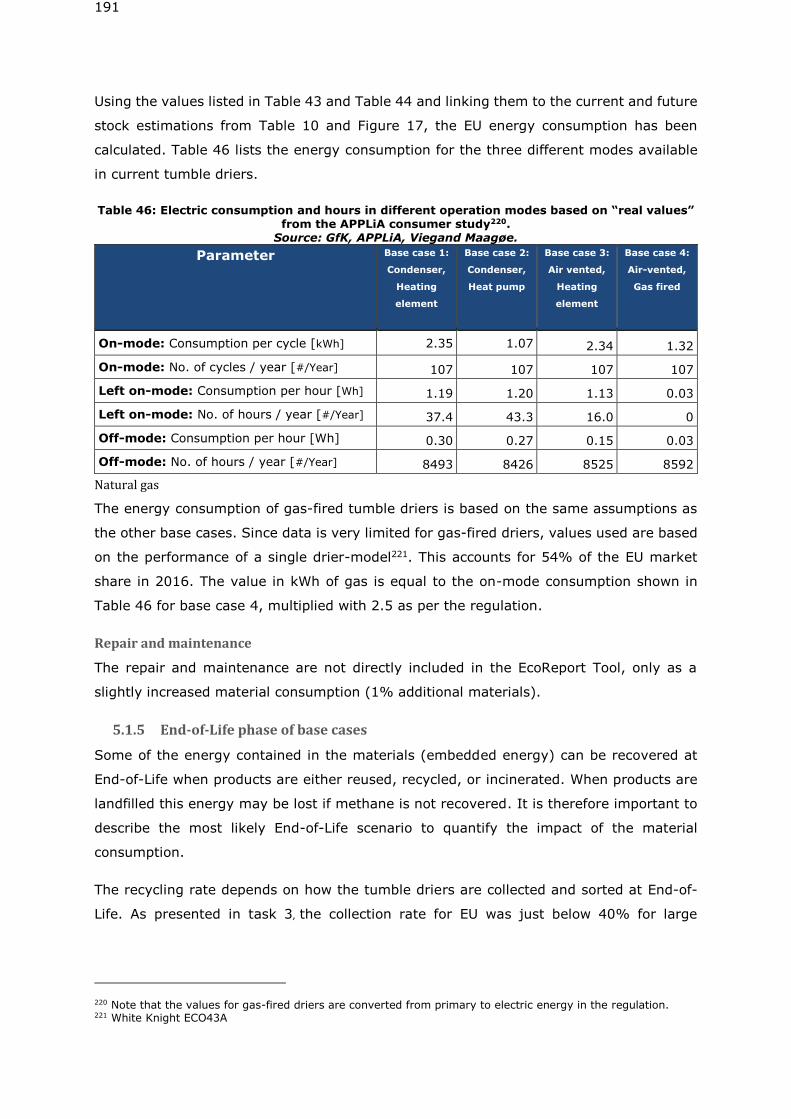
191
Using the values listed in Table 43 and Table 44 and linking them to the current and future
stock estimations from Table 10 and Figure 17, the EU energy consumption has been
calculated. Table 46 lists the energy consumption for the three different modes available
in current tumble driers.
Table 46: Electric consumption and hours in different operation modes based on “real values” from the APPLiA consumer study220.
Source: GfK, APPLiA, Viegand Maagøe.
Parameter Base case 1:
Condenser,
Heating
element
Base case 2:
Condenser,
Heat pump
Base case 3:
Air vented,
Heating
element
Base case 4:
Air-vented,
Gas fired
On-mode: Consumption per cycle [kWh] 2.35 1.07 2.34 1.32
On-mode: No. of cycles / year [#/Year] 107 107 107 107
Left on-mode: Consumption per hour [Wh] 1.19 1.20 1.13 0.03
Left on-mode: No. of hours / year [#/Year] 37.4 43.3 16.0 0
Off-mode: Consumption per hour [Wh] 0.30 0.27 0.15 0.03
Off-mode: No. of hours / year [#/Year] 8493 8426 8525 8592
Natural gas
The energy consumption of gas-fired tumble driers is based on the same assumptions as
the other base cases. Since data is very limited for gas-fired driers, values used are based
on the performance of a single drier-model221. This accounts for 54% of the EU market
share in 2016. The value in kWh of gas is equal to the on-mode consumption shown in
Table 46 for base case 4, multiplied with 2.5 as per the regulation.
Repair and maintenance
The repair and maintenance are not directly included in the EcoReport Tool, only as a
slightly increased material consumption (1% additional materials).
5.1.5 End-of-Life phase of base cases
Some of the energy contained in the materials (embedded energy) can be recovered at
End-of-Life when products are either reused, recycled, or incinerated. When products are
landfilled this energy may be lost if methane is not recovered. It is therefore important to
describe the most likely End-of-Life scenario to quantify the impact of the material
consumption.
The recycling rate depends on how the tumble driers are collected and sorted at End-of-
Life. As presented in task 3, the collection rate for EU was just below 40% for large
220 Note that the values for gas-fired driers are converted from primary to electric energy in the regulation. 221 White Knight ECO43A
192
household appliances in 2014 which could pose a challenge for resource efficiency. The
collection rate should be improved to 65 % in 2019 according to EU targets.
After collection, the tumble driers are handled together with other electronic appliances as
described in task 4 (section 4.5.1). Tumble driers containing refrigerants (heat pump
driers) are handled separately with other appliances containing refrigerants such as
refrigerators and air conditioners. These appliances are treated at specialised shredders
which can handle the refrigerants.
The end-of-life routes have been presented in Table 40 including recycling rates of critical
materials. The recycling rate of copper and electronics are estimated to be 94 % for non-
ferrous (copper) and 50 % for electronics (including the gold in printed circuit boards).
However, if printed circuit boards are removed before shredding and treated separately
the recycling rate of gold is assumed to be above 90 %. According to stakeholders the
printed circuit boards are placed behind the control panel, so the printed circuit boards are
assumed to be easy to replace during repair, but not removed at End-of-Life, since the
product is shredded222.
5.1.6 Life Cycle Cost (LCC) inputs for base cases
This section presents the annual sales, stock, purchase price, installation costs, repair and
maintenance costs, unitary rates for energy, discount, inflation, interest and escalation
rates, as well as product service life. These values have been derived and presented in
task 2 and task 3.
Data on the annual sales and the stock are used for the calculation of the EU totals in the
EcoReport Tool. EU 28 annual sales and total estimated stock for all tumble driers are
presented in Table 47.
222 Printed circuit boards
193
Table 47: EU 28 annual sales and estimated stock of tumble driers223
2010 2015 2020 2025 2030
EU28 annual sales, (1000) units
Base Case 1 2539 1778 1685 1549 1115
Base Case 2 341 2222 3052 3597 4459
Base Case 3 1110 745 587 387 0
Base Case 4 0.6 0.4 0.6 0 0
Total 3991 4756 5339 5534 5574
EU28 estimated stock, (1000) units
Base Case 1 31258 29095 25174 21453 18783
Base Case 2 442 7268 21183 34891 44662
Base Case 3 19610 15160 10666 7627 4727
Base Case 4 11 8 8 7 3
Total 51321 51531 57032 63978 68175
The annual sales and stock are used to calculate the aggregated impacts of tumble driers
in the scenario analysis. To calculate the Life Cycle Cost (LCC) of a product, the following
formula is used in the EcoReport tool:
𝐿𝐶𝐶 = 𝑃𝑃 + 𝑃𝑊𝐹 × 𝑂𝐸 + 𝐸𝑜𝐿
Where:
• LCC is Life Cycle Costs
• PP is the consumer purchase price and the installation costs
• OE is the operating expense
• PWF224 (Present Worth Factor)
• EoL is End-of-life costs (disposal costs, recycling charge or benefit (resale)).
Below, the different parameters used to calculate the LCC are presented.
The average consumer purchase price including VAT is calculated from the data on unit
sales and total market value collected by GfK which is listed below for each base case:
• BC 1: 340 EUR
• BC 2: 615 EUR
• BC 3: 228 EUR
• BC 4: 343 EUR
As seen in task 2, repair and maintenance costs can be difficult to quantify as some repairs
are expensive and some products are never repaired. In the previous preparatory study,
the repair and maintenance costs are assumed to be 5 EUR annually. This value is used
223 Most of numbers are rounded up 224 The Present Worth Factor (PWF) is described in the MEErP methodology when making Life Cycle Costs and is meant to be used in all the preparatory and review studies that follow MEErP for Ecodesign Regulations when calculating the LCC of the base cases. PWF is used to calculate the operational expenses of the future in today’s value. That is why the discount rate and the escalation rate of electricity prices are used in the formula 𝑃𝑊𝐹 = {1 – 1/(1 + 𝑟)𝑁 }/𝑟 from MEErP.
194
and corresponds approximately to a value between 1 % and 2 % of the purchase price
depending on the base case. The lifetime of all base cases is assumed to be 12 years.
Regarding electricity and gas prices, the EU Commission have decided that data from
PRIMES225 should be used. Prices and projection are presented in task 2. The energy prices
used are:
• Electricity: 0.194 EUR/kWh
• Gas: 0.072 EUR/kWh
The present worth factor (PWF) is automatically calculated in the EcoReport tool. The
formula to calculate the present worth factor is:
𝑃𝑊𝐹 = {1 – 1/(1 + 𝑟)𝑁 }/𝑟
Where:
• N is the product life-time
• r is the discount rate minus the growth rate of running cost components (e.g.
energy and water)
The discount rate is assumed to be 4 % and the escalation rate (annual growth rate of
running costs) are assumed to be approximately 1% (based on the electricity and gas
prices226). The calculated PWF for all base cases are 9.97 years.
Table 48: Input economic data for EcoReport tool (2016)
Description Unit BC 1 BC 2 BC 3 BC 4
Product Life years 12 12 12 12
Annual sales mln. Units/year 1.75 2.58 0.7 0.001
EU Stock mln. Units 27.7 12.5 13.2 0.009
Product price EUR/unit 340 615 228 343
Installation/acquisition costs
(if any)
EUR/unit 25 25 75 100
Electricity rate EUR/kWh 0.193 0.193 0.193 0.193
Repair & maintenance costs EUR/unit/year 5 5 5 5
Discount rate (interest minus
inflation)
% 4 4 4 4
Escalation rate (project
annual growth of running
costs)
% 1 1 1 1
225 PRIMES 2016 226 Recent years and projections
195
5.1.7 Environmental Impact of base cases
The environmental impacts of the four base cases are presented and discussed in this
section.
• The following impacts are generated by the EcoReport tool:
o Other Resources & Waste
o Total Energy (MJ)
o of which, electricity (MJ)
o Water – process (litre)
o Water – cooling (litre)
o Waste, non-hazardous/ landfill (g)
o Waste, hazardous/ incinerated (g)
• Emissions (air)
o GWP100 (kg CO2-eq.)
o Acidification (g SO2-eq.)
o Volatile Organic Compounds (VOC) (g)
o Persistent Organic Pollutants (ng i-Teq)
o Heavy Metals (mg Ni eq.)
o PAHs (mg Ni eq.)
o Particulate Matter (g)
• Emissions (Water)
o Heavy Metals (mg Hg/20)
o Eutrophication (g PO4)
All impacts are further divided in the different life phases of the tumble driers (materials,
manufacturing, distribution, use, disposal and recycling).
The total energy consumption and Global Warming Potential (CO2-eq) are presented below
in Figure 63 to Figure 70 for the different base cases. Only these two environmental
impacts are presented as these are possible to interpret without data uncertainties and
interpretation. The rest of the environmental impact categories are presented in Annex V.
Figure 63: Total energy consumption BC 1 Heating element condenser
0
5,000
10,000
15,000
20,000
25,000
30,000
Material Manufacturing Distribution Use Disposal Recycling
Tota
l en
ergy
(M
J)
196
Figure 64: Global warming potential BC 1 Heating element condenser
Figure 65: Total energy consumption – BC 2 Heat pump condenser
Figure 66: Global warming potential – BC 2 Heat pump condenser
0
500
1,000
1,500
Material Manufacturing Distribution Use Disposal Recycling
GW
P1
00
(kg
CO
2 e
q)
0
5,000
10,000
15,000
20,000
25,000
30,000
Material Manufacturing Distribution Use Disposal Recycling
Tota
l en
ergy
(M
J)
0
500
1,000
1,500
Material Manufacturing Distribution Use Disposal Recycling
GW
P1
00
(kg
CO
2 e
q)
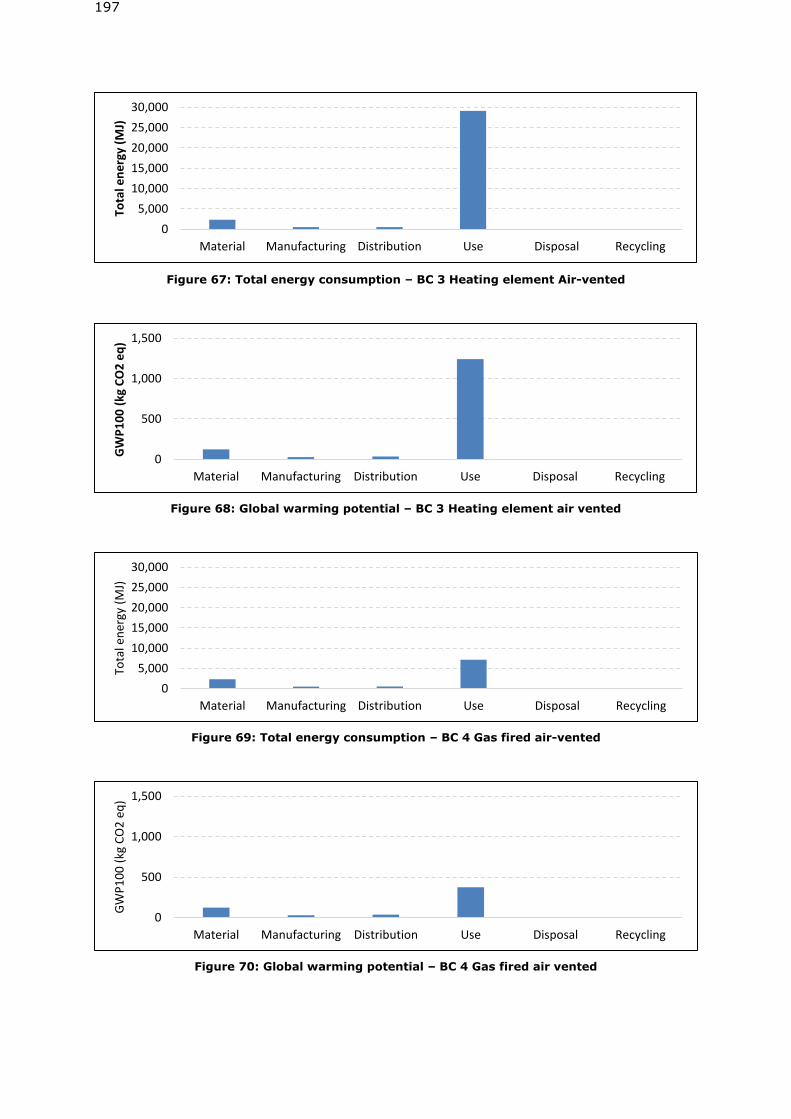
197
Figure 67: Total energy consumption – BC 3 Heating element Air-vented
Figure 68: Global warming potential – BC 3 Heating element air vented
Figure 69: Total energy consumption – BC 4 Gas fired air-vented
Figure 70: Global warming potential – BC 4 Gas fired air vented
0
5,000
10,000
15,000
20,000
25,000
30,000
Material Manufacturing Distribution Use Disposal Recycling
Tota
l en
erg
y (M
J)
0
500
1,000
1,500
Material Manufacturing Distribution Use Disposal Recycling
GW
P1
00
(kg
CO
2 e
q)
0
5,000
10,000
15,000
20,000
25,000
30,000
Material Manufacturing Distribution Use Disposal Recycling
Tota
l en
ergy
(M
J)
0
500
1,000
1,500
Material Manufacturing Distribution Use Disposal Recycling
GW
P1
00
(kg
CO
2 e
q)
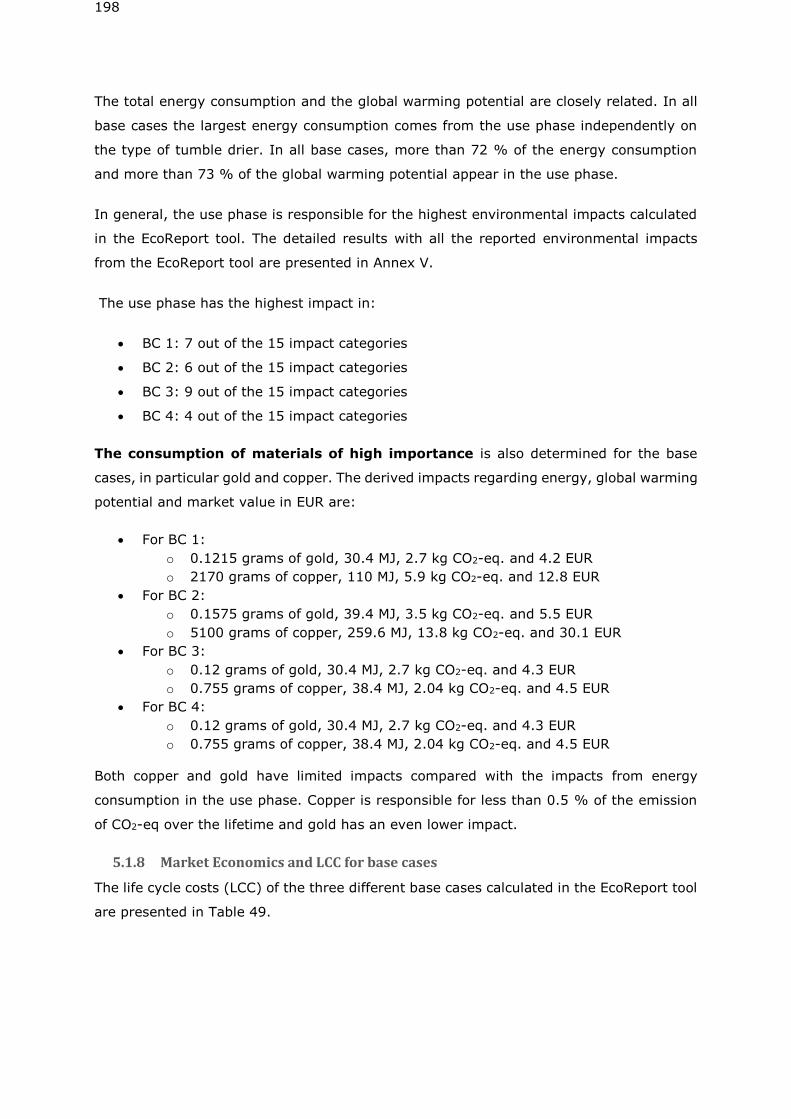
198
The total energy consumption and the global warming potential are closely related. In all
base cases the largest energy consumption comes from the use phase independently on
the type of tumble drier. In all base cases, more than 72 % of the energy consumption
and more than 73 % of the global warming potential appear in the use phase.
In general, the use phase is responsible for the highest environmental impacts calculated
in the EcoReport tool. The detailed results with all the reported environmental impacts
from the EcoReport tool are presented in Annex V.
The use phase has the highest impact in:
• BC 1: 7 out of the 15 impact categories
• BC 2: 6 out of the 15 impact categories
• BC 3: 9 out of the 15 impact categories
• BC 4: 4 out of the 15 impact categories
The consumption of materials of high importance is also determined for the base
cases, in particular gold and copper. The derived impacts regarding energy, global warming
potential and market value in EUR are:
• For BC 1:
o 0.1215 grams of gold, 30.4 MJ, 2.7 kg CO2-eq. and 4.2 EUR
o 2170 grams of copper, 110 MJ, 5.9 kg CO2-eq. and 12.8 EUR
• For BC 2:
o 0.1575 grams of gold, 39.4 MJ, 3.5 kg CO2-eq. and 5.5 EUR
o 5100 grams of copper, 259.6 MJ, 13.8 kg CO2-eq. and 30.1 EUR
• For BC 3:
o 0.12 grams of gold, 30.4 MJ, 2.7 kg CO2-eq. and 4.3 EUR
o 0.755 grams of copper, 38.4 MJ, 2.04 kg CO2-eq. and 4.5 EUR
• For BC 4:
o 0.12 grams of gold, 30.4 MJ, 2.7 kg CO2-eq. and 4.3 EUR
o 0.755 grams of copper, 38.4 MJ, 2.04 kg CO2-eq. and 4.5 EUR
Both copper and gold have limited impacts compared with the impacts from energy
consumption in the use phase. Copper is responsible for less than 0.5 % of the emission
of CO2-eq over the lifetime and gold has an even lower impact.
5.1.8 Market Economics and LCC for base cases
The life cycle costs (LCC) of the three different base cases calculated in the EcoReport tool
are presented in Table 49.
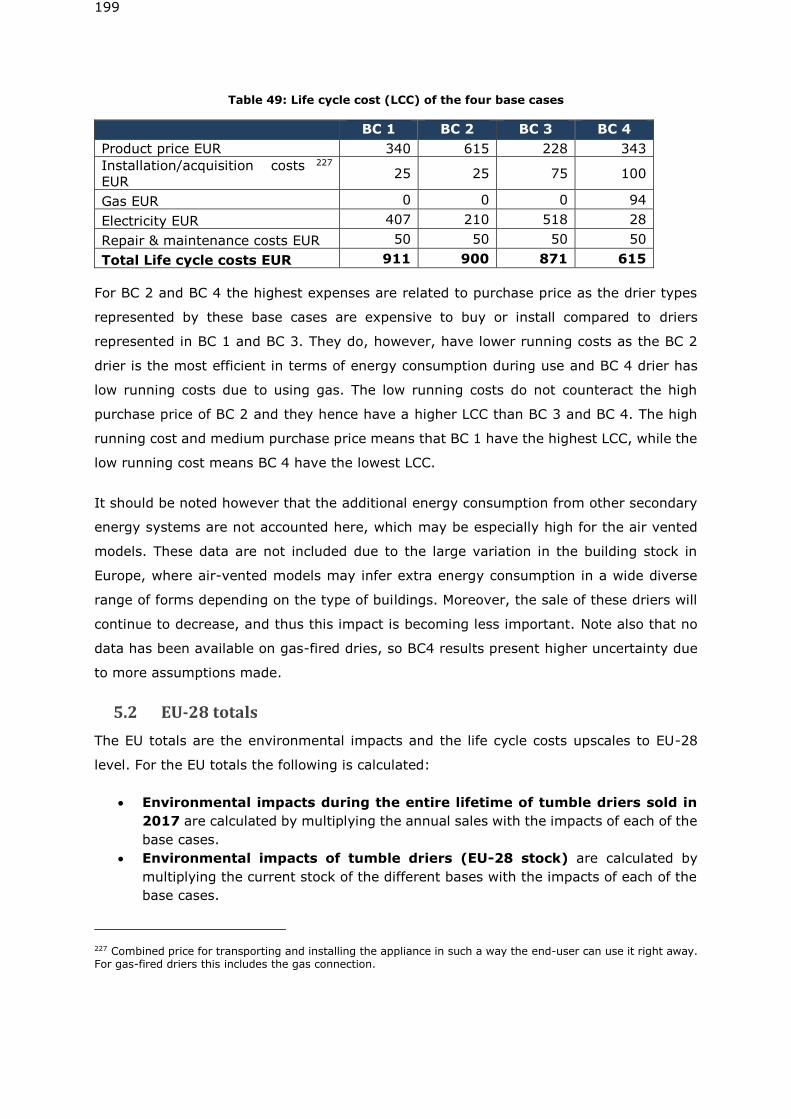
199
Table 49: Life cycle cost (LCC) of the four base cases
BC 1 BC 2 BC 3 BC 4
Product price EUR 340 615 228 343
Installation/acquisition costs 227
EUR 25 25 75 100
Gas EUR 0 0 0 94
Electricity EUR 407 210 518 28
Repair & maintenance costs EUR 50 50 50 50
Total Life cycle costs EUR 911 900 871 615
For BC 2 and BC 4 the highest expenses are related to purchase price as the drier types
represented by these base cases are expensive to buy or install compared to driers
represented in BC 1 and BC 3. They do, however, have lower running costs as the BC 2
drier is the most efficient in terms of energy consumption during use and BC 4 drier has
low running costs due to using gas. The low running costs do not counteract the high
purchase price of BC 2 and they hence have a higher LCC than BC 3 and BC 4. The high
running cost and medium purchase price means that BC 1 have the highest LCC, while the
low running cost means BC 4 have the lowest LCC.
It should be noted however that the additional energy consumption from other secondary
energy systems are not accounted here, which may be especially high for the air vented
models. These data are not included due to the large variation in the building stock in
Europe, where air-vented models may infer extra energy consumption in a wide diverse
range of forms depending on the type of buildings. Moreover, the sale of these driers will
continue to decrease, and thus this impact is becoming less important. Note also that no
data has been available on gas-fired dries, so BC4 results present higher uncertainty due
to more assumptions made.
5.2 EU-28 totals
The EU totals are the environmental impacts and the life cycle costs upscales to EU-28
level. For the EU totals the following is calculated:
• Environmental impacts during the entire lifetime of tumble driers sold in
2017 are calculated by multiplying the annual sales with the impacts of each of the
base cases.
• Environmental impacts of tumble driers (EU-28 stock) are calculated by
multiplying the current stock of the different bases with the impacts of each of the
base cases.
227 Combined price for transporting and installing the appliance in such a way the end-user can use it right away. For gas-fired driers this includes the gas connection.
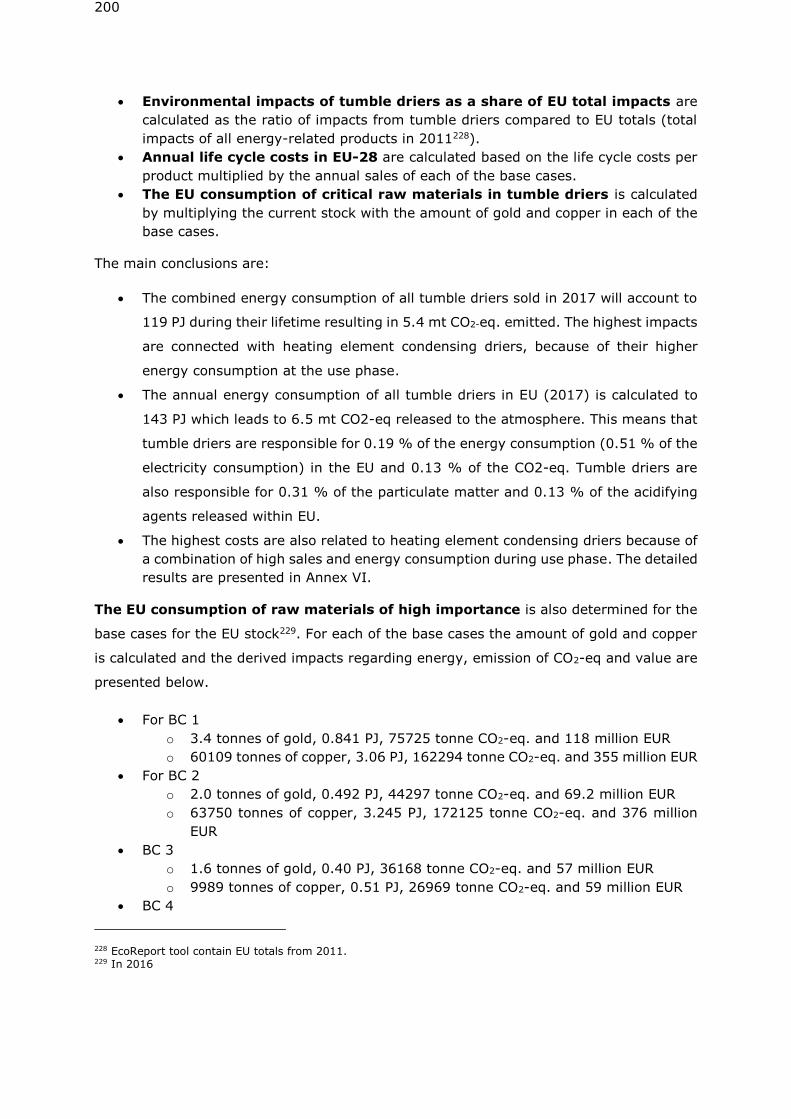
200
• Environmental impacts of tumble driers as a share of EU total impacts are
calculated as the ratio of impacts from tumble driers compared to EU totals (total
impacts of all energy-related products in 2011228).
• Annual life cycle costs in EU-28 are calculated based on the life cycle costs per
product multiplied by the annual sales of each of the base cases.
• The EU consumption of critical raw materials in tumble driers is calculated
by multiplying the current stock with the amount of gold and copper in each of the
base cases.
The main conclusions are:
• The combined energy consumption of all tumble driers sold in 2017 will account to
119 PJ during their lifetime resulting in 5.4 mt CO2-eq. emitted. The highest impacts
are connected with heating element condensing driers, because of their higher
energy consumption at the use phase.
• The annual energy consumption of all tumble driers in EU (2017) is calculated to
143 PJ which leads to 6.5 mt CO2-eq released to the atmosphere. This means that
tumble driers are responsible for 0.19 % of the energy consumption (0.51 % of the
electricity consumption) in the EU and 0.13 % of the CO2-eq. Tumble driers are
also responsible for 0.31 % of the particulate matter and 0.13 % of the acidifying
agents released within EU.
• The highest costs are also related to heating element condensing driers because of
a combination of high sales and energy consumption during use phase. The detailed
results are presented in Annex VI.
The EU consumption of raw materials of high importance is also determined for the
base cases for the EU stock229. For each of the base cases the amount of gold and copper
is calculated and the derived impacts regarding energy, emission of CO2-eq and value are
presented below.
• For BC 1
o 3.4 tonnes of gold, 0.841 PJ, 75725 tonne CO2-eq. and 118 million EUR
o 60109 tonnes of copper, 3.06 PJ, 162294 tonne CO2-eq. and 355 million EUR
• For BC 2
o 2.0 tonnes of gold, 0.492 PJ, 44297 tonne CO2-eq. and 69.2 million EUR
o 63750 tonnes of copper, 3.245 PJ, 172125 tonne CO2-eq. and 376 million
EUR
• BC 3
o 1.6 tonnes of gold, 0.40 PJ, 36168 tonne CO2-eq. and 57 million EUR
o 9989 tonnes of copper, 0.51 PJ, 26969 tonne CO2-eq. and 59 million EUR
• BC 4
228 EcoReport tool contain EU totals from 2011. 229 In 2016
201
o 0.001 tonnes of gold, 0.000026 PJ, 24 tonne CO2-eq. and 0.04 million EUR
o 6.5 tonnes of copper, 0.00033 PJ, 17.5 tonne CO2-eq. and 0.04 million EUR
The impacts of the critical raw materials are limited230 compared to the other impacts of
tumble driers in other life cycle stages. The value for the amount of gold and copper present
in the EU stock are significant. The combined impact and value of gold and copper in all
tumble driers (stock) are presented in Table 50.
Table 50: The combined impact and value of gold and copper in all tumble driers (stock -2017)
Total Energy
(PJ)
GWP100
(mt CO2-eq.)
Total
(mln. EUR)
Gold 1.89 0.17 265
Copper 4.36 0.23 505
Total 6.24 0.40 770
Gold and copper are accountable for an energy consumption of 6.24 PJ and an emission of
0.4 million tonne of CO2-eq. The combined value of copper and gold in the EU stock
amounts to 770 million EUR.
Based on stakeholder inputs the PCBs are located easily available for repair, but it is still
assumed that the printed circuit board is shredded at End-of-Life due to its small size. This
means that most of the copper are recycled and the value is recovered while only 50 % of
the gold is recovered. However, the estimation for gold is connected with high uncertainty
due to the unknown material composition.
230 Taking environmental impacts beyond energy and GWP into account, raw materials are connected to very severe environmental and health issues (gold: use of mercury; copper: acid mine drainage, water contamination in mining etc.) though these aspects are difficult to assess with MEErP methodology.
6. Design options
The aims of this task are to:
• Identify the design options that can deliver potential improvements concerning use
of energy and resources.
• Assess quantitatively, until the extent possible, the environmental improvements
and additional consumer costs per option.
• Identify the Least Life Cycle Cost (LLCC) point of the different design options and
aggregate in clusters, focusing on those with the best balance of environmental
benefits and costs.
• Identify any long-term technical potential based on BNAT described in task 4.
6.1 Design options
The design options for the four base cases presented in task 5 are shown in Table 52,
summarising their potential effect on energy consumption, improvement costs and other
potential effects. The potential effects shown have been calculated for the whole drier,
based on energy reductions per component and/or system which have then been calculated
for the whole machine.
Design options 7 and 9 have been removed based on input from stakeholders.
Design option 7 was based on the assumption that larger machines result in higher annual
energy consumptions, however, the calculated effect was only a maximum of a 1.5%
increase based on APPLiA’s model database and only for some tumble drier models. This
introduces uncertainty to the calculated effect and considering the small effect and the lack
of further evidence, this design option was removed after input from stakeholders.
Data from previous tasks indicates that a tumble drier loaded at 50% of the rated capacity
will use more energy per kg of laundry than the same drier loaded at 100% (see Figure
44). This is to some extend due to the loss associated with heating up the tumble drier
itself which does not depend on the amount of laundry loaded in the machine. This loss is
directly dependent on the thermal capacity of the drier, which (according to stakeholders)
does not vary much among driers of the same type (e.g. heat pump condenser) at different
rated capacities. This means that two machines at e.g. 7kg and 9kg can behave almost
identical at 4.4kg of load as they have very small physical differences. The difference
between the rated capacities is primarily due to different ways to control the cycle
(software based) and with varying heat throughputs of the heat pump circuit – the physical
dimensions and drum size are in most cases identical. Therefore, design option 7 was not
really about technological improvement but more about other factors which at the end did
203
not provide any significant improvement, as stated in previous paragraph. However, for
heating element condenser driers, increased specific energy consumption in rated
capacities over 8kg were observed (see Figure 44). Instead of tackling this as design
option, it is proposed to implement a new formula for calculating Standard Energy
Consumption per cycle based on a heat pump driers data fit. In this way, other drier types
will be penalised when establishing the Energy Efficiency Index (EEI). This is explained in
detail in section 7.2.3.
Design option 9 was based on the premise that consumers would fill the driers up to full
capacity if the drier was equipped with a consumer feedback system. This option was
considered unrealistic, since the consumer would probably not fill the drier with a higher
load than the load of the previous wash.
The presented options have been evaluated by three different parameters:
• The potential effect on energy consumption, which was estimated as described in
next the paragraphs
• Extra costs for consumers, which are primarily coming from costs of improving the
product design for manufacturers. The improvement costs for consumers have been
calculated as the observed retail price based on manufacturers cost231.
• The potential effect on resource consumption.
The potential effect on energy consumption has been estimated considering the effect
presented in Table 52 based on inputs from task 4 and coupled with the usage patterns
from task 3.
The effect on energy consumption has been quantified considering the part of the tumble
drier the design option is affecting, i.e. the heating system (heat pump circuit, heating
element, gas burner) or the drum/fan motor. The preparatory study states that a typical
induction motor for driving the drum and the fan(s) is between 150-250W. Input from
stakeholders indicated this is still valid. A 200W induction motor is thus used for future
references. Assuming that this motor is running constantly during the cycle, the cycle-time
data presented in task 2 (Figure 34 - Figure 37) can be used to establish the energy
consumption by the drum/fan motor (see Table 51)232.
231 Table 5.1 from Washing preparatory study (Page 377). Formula taken from EUROSTAT. 232 For instance, if a design options reduces the energy consumption of the drum/fan motor by 6%, the total energy consumption reduction is 36% x 6% = ~2% of the total energy consumption for the condenser driers.
204
Table 51: Energy consumption used by drum/fan motor. Based on cycle time data from GfK (2013-2016).
Condenser
heating element
Condenser
heat pump
Heating element
air-vented
Gas-fired air-
vented
% of energy consumption used by drum/fan motor
16% 50% 15% 29%
Both the effect on energy consumption, other potential effects and improvement costs are
based on input from stakeholders and information gathered during tasks 1 to 4. Design
options including their potential improvements as well as manufacturing costs have been
circulated to stakeholders, which have been asked to give input on the validity and size of
the values.
Table 52: List of design options with descriptions and input parameters. Descriptions on specific calculation methods are found in subsequent sections 6.1.1 - 6.1.11.
Design
option
#
Description
Effect on energy consumption during use
phase per base case233 Other potential effects per unit234
Cost of improvement for
manufacturers [EUR/unit] 235
1 2 3 4
1
Increased drum and fan motor efficiency by
replacing asynchronous induction motor with
permanent magnet synchronous motors (BLDC)
-2.3% -7.4% -2.3% -2.3%
No impact on the overall material consumption –
however a small increase in scarce resources
(assumption 0.01%-0.05% increase)236
16
2
Increased compressor motor efficiency by
replacing asynchronous induction motor with
permanent magnet sync. motors (BLDC)
Not
applicable -6.1%
Not
applicable
Not
applicable
No impact on the overall material consumption –
however a small increase in scarce resources
(assumption 0.01%-0.05% increase)
16
3
Multi motor setup to have a better on/off control
of the different subsystems (e.g. drum motor,
process-air fan motor, condenser fan motor) thus
decreasing electricity consumption
-0.8% -2.5% -2.3% -2.3%
No significant impact on materials consumption.
Two smaller motors might have larger material
consumption compared to one large, but this
would not always be the case. Therefore, this
increase considered negligible.
10
4 Longer cycle time with lower drying temperatures Negligible -5.0% Negligible Not
applicable No impact on the material consumption 0
5 Improved condensation rate/cycle
time/condensation efficiency by improving heat -0.3%
Not
applicable
Not
applicable
Not
applicable
0.05% - 0.1% increase in overall material
consumption due to the mixing of non-compatible
alloys regarding the recycling process – and a
3
233 Per unit of base case. Base case 1: Condenser tumble driers (heating element); Base case 2: Condenser tumble driers (heat pump); Base case 3: Heating element air-vented; Base case 4: Gas-fired air-vented. Potential effects have been established by input from stakeholders from tasks 1 to 4 and additional input during further consultation. 234 Based on assumptions considering input from stakeholders. 235 ibid
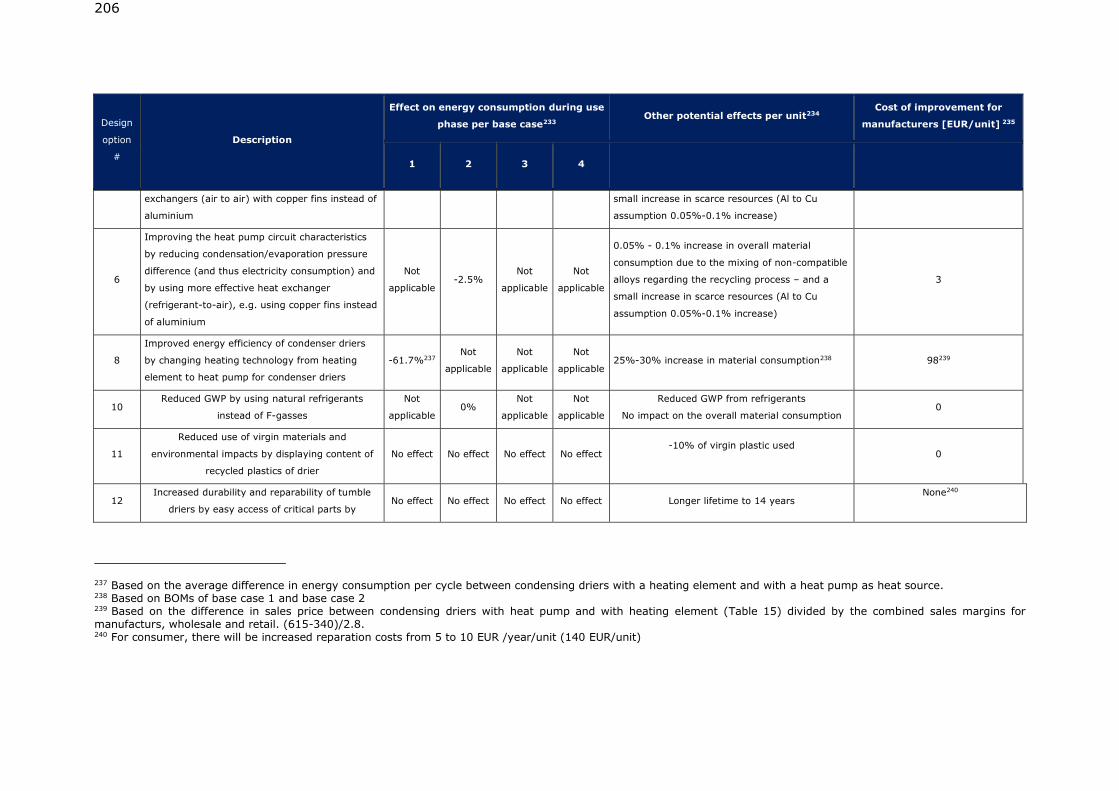
206
Design
option
#
Description
Effect on energy consumption during use
phase per base case233 Other potential effects per unit234
Cost of improvement for
manufacturers [EUR/unit] 235
1 2 3 4
exchangers (air to air) with copper fins instead of
aluminium
small increase in scarce resources (Al to Cu
assumption 0.05%-0.1% increase)
6
Improving the heat pump circuit characteristics
by reducing condensation/evaporation pressure
difference (and thus electricity consumption) and
by using more effective heat exchanger
(refrigerant-to-air), e.g. using copper fins instead
of aluminium
Not
applicable -2.5%
Not
applicable
Not
applicable
0.05% - 0.1% increase in overall material
consumption due to the mixing of non-compatible
alloys regarding the recycling process – and a
small increase in scarce resources (Al to Cu
assumption 0.05%-0.1% increase)
3
8
Improved energy efficiency of condenser driers
by changing heating technology from heating
element to heat pump for condenser driers
-61.7%237 Not
applicable
Not
applicable
Not
applicable 25%-30% increase in material consumption238 98239
10 Reduced GWP by using natural refrigerants
instead of F-gasses
Not
applicable 0%
Not
applicable
Not
applicable
Reduced GWP from refrigerants
No impact on the overall material consumption 0
11
Reduced use of virgin materials and
environmental impacts by displaying content of
recycled plastics of drier
No effect No effect No effect No effect -10% of virgin plastic used
0
12 Increased durability and reparability of tumble
driers by easy access of critical parts by No effect No effect No effect No effect Longer lifetime to 14 years
None240
237 Based on the average difference in energy consumption per cycle between condensing driers with a heating element and with a heat pump as heat source. 238 Based on BOMs of base case 1 and base case 2 239 Based on the difference in sales price between condensing driers with heat pump and with heating element (Table 15) divided by the combined sales margins for manufacturs, wholesale and retail. (615-340)/2.8. 240 For consumer, there will be increased reparation costs from 5 to 10 EUR /year/unit (140 EUR/unit)
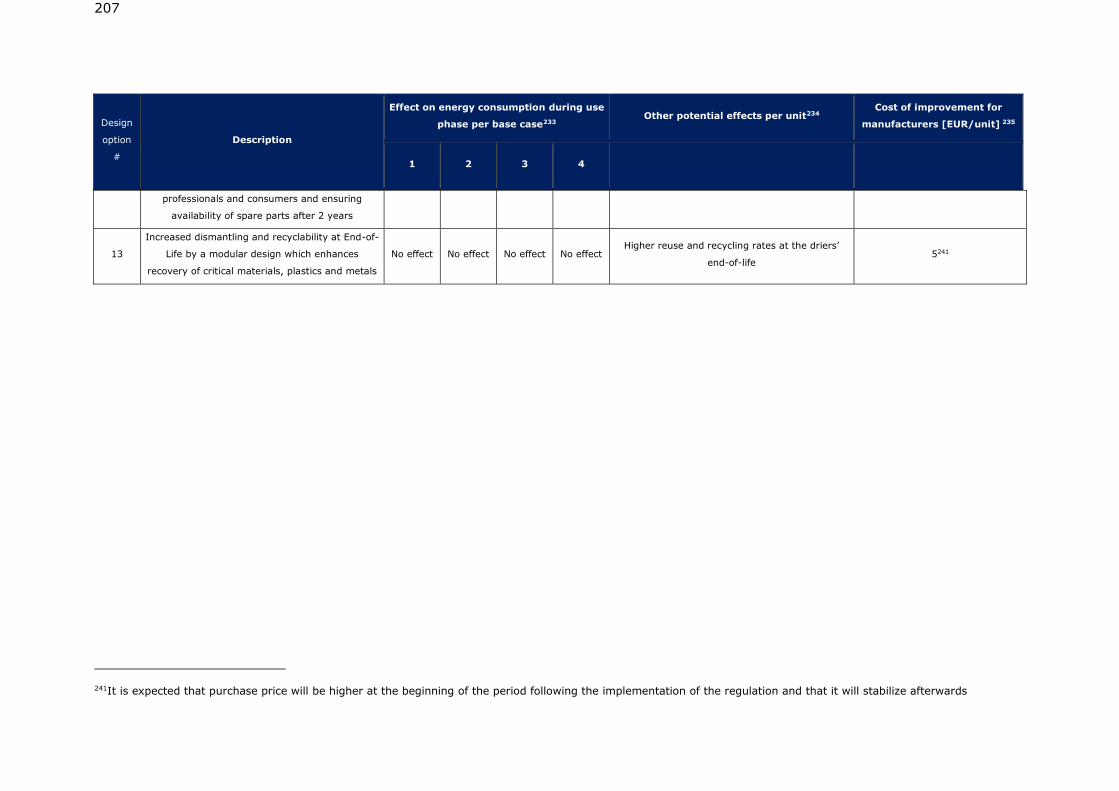
207
Design
option
#
Description
Effect on energy consumption during use
phase per base case233 Other potential effects per unit234
Cost of improvement for
manufacturers [EUR/unit] 235
1 2 3 4
professionals and consumers and ensuring
availability of spare parts after 2 years
13
Increased dismantling and recyclability at End-of-
Life by a modular design which enhances
recovery of critical materials, plastics and metals
No effect No effect No effect No effect Higher reuse and recycling rates at the driers’
end-of-life 5241
241It is expected that purchase price will be higher at the beginning of the period following the implementation of the regulation and that it will stabilize afterwards
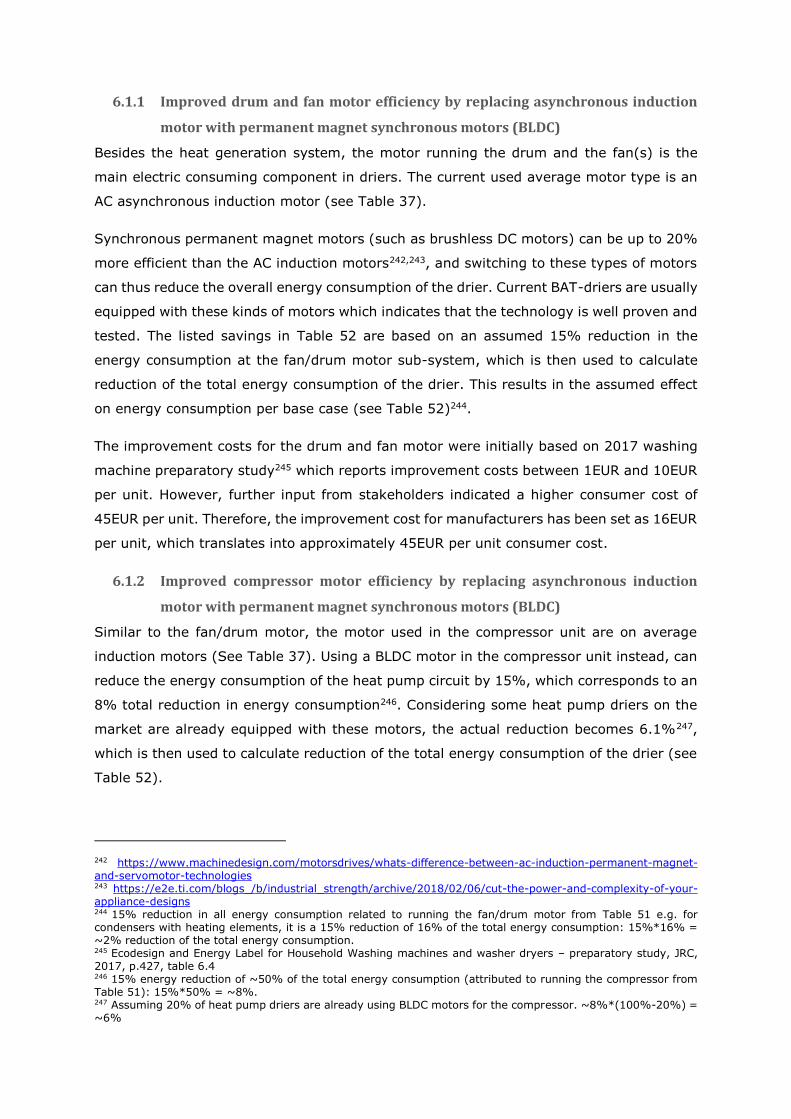
6.1.1 Improved drum and fan motor efficiency by replacing asynchronous induction
motor with permanent magnet synchronous motors (BLDC)
Besides the heat generation system, the motor running the drum and the fan(s) is the
main electric consuming component in driers. The current used average motor type is an
AC asynchronous induction motor (see Table 37).
Synchronous permanent magnet motors (such as brushless DC motors) can be up to 20%
more efficient than the AC induction motors242,243, and switching to these types of motors
can thus reduce the overall energy consumption of the drier. Current BAT-driers are usually
equipped with these kinds of motors which indicates that the technology is well proven and
tested. The listed savings in Table 52 are based on an assumed 15% reduction in the
energy consumption at the fan/drum motor sub-system, which is then used to calculate
reduction of the total energy consumption of the drier. This results in the assumed effect
on energy consumption per base case (see Table 52)244.
The improvement costs for the drum and fan motor were initially based on 2017 washing
machine preparatory study245 which reports improvement costs between 1EUR and 10EUR
per unit. However, further input from stakeholders indicated a higher consumer cost of
45EUR per unit. Therefore, the improvement cost for manufacturers has been set as 16EUR
per unit, which translates into approximately 45EUR per unit consumer cost.
6.1.2 Improved compressor motor efficiency by replacing asynchronous induction
motor with permanent magnet synchronous motors (BLDC)
Similar to the fan/drum motor, the motor used in the compressor unit are on average
induction motors (See Table 37). Using a BLDC motor in the compressor unit instead, can
reduce the energy consumption of the heat pump circuit by 15%, which corresponds to an
8% total reduction in energy consumption246. Considering some heat pump driers on the
market are already equipped with these motors, the actual reduction becomes 6.1%247,
which is then used to calculate reduction of the total energy consumption of the drier (see
Table 52).
242 https://www.machinedesign.com/motorsdrives/whats-difference-between-ac-induction-permanent-magnet-and-servomotor-technologies 243 https://e2e.ti.com/blogs_/b/industrial_strength/archive/2018/02/06/cut-the-power-and-complexity-of-your-appliance-designs 244 15% reduction in all energy consumption related to running the fan/drum motor from Table 51 e.g. for condensers with heating elements, it is a 15% reduction of 16% of the total energy consumption: 15%*16% = ~2% reduction of the total energy consumption. 245 Ecodesign and Energy Label for Household Washing machines and washer dryers – preparatory study, JRC, 2017, p.427, table 6.4 246 15% energy reduction of ~50% of the total energy consumption (attributed to running the compressor from Table 51): 15%*50% = ~8%. 247 Assuming 20% of heat pump driers are already using BLDC motors for the compressor. ~8%*(100%-20%) = ~6%
209
The improvement costs for the compressor motor are based on the same assumptions as
in the previous design option, using 16 EUR per unit as improvement costs for
manufacturers.
6.1.3 Multi motor setup to have a better on/off control of the different subsystems (e.g.
drum motor, process-air fan motor, condenser fan motor)
In some premium driers the fan/drums are powered by separate BLDC motors, instead of
using a common motor as found in most driers on the market. This could enable the motors
to be run independently of each other. The fan could for instance run at 100% capacity
even though the drum is changing spin directions or running at below 100% spin speed if
delicate items are tumbled. A 5% reduction in energy consumption is assumed which is
then scaled to the total energy savings at a drier level (see Table 52)248. This is only the
effect of the multi-motor setup, and not the effect of using more efficient motors.
The improvement cost is expected to be lower than of changing motor technology, thus it
has been assumed as 10EUR per unit.
6.1.4 Longer cycle time with lower drying temperatures
Current tumble driers are built and optimised based on a number of parameters, including
production cost, drying performance, ease of use, energy consumption, and cycle time.
According to the legislation, the energy consumption and cycle time of the most energy
efficient program (standard cotton cycle) is to be shown on the energy label, which 4 out
of 5 users consider when buying a new tumble drier249.
Currently, 89% think the energy efficiency of the drier is important when buying a new
drier, while 82% think the cycle time is important249. This means that manufacturers
optimise for both of these parameters, as they are both considered important by
consumers. In some cases, cycle time might not be important for users. For instance, if
they start the drying cycle at night time, or before leaving for work in the morning. If the
driers could be optimised for having the lowest possible energy consumption instead of a
mix between energy efficiency and cycle time, an overall reduction in energy consumption
could be reached.
For heat pump driers, the drying temperature could be lowered. This would reduce the
energy consumption of the heat pump circuit. This is because the efficiency/COP250 of a
heat pump circuit is proportional to the difference between the evaporation and
condensation temperature/pressure – a higher temperature or pressure means the
248 This is similar to the calculations in section 6.1.1 but with 5% instead of 15%. 249 APPLiA and InSites Consulting. (2018). Tumble dryer usage and attitudes: A survey in 12 European countries (not publicly available). 250 https://en.wikipedia.org/wiki/Coefficient_of_performance#Derivation
210
compressor needs to do more work, and thus lowers the COP. Assuming an evaporation
temperature of 10°C, and a condensation temperature of 65°C, a reduction of the
condensation temperature from 65°C to 45°C would increase the theoretical efficiency by
48%251.. This would increase the cycle time as the drying temperature would be lower,
which in turn increases the overall energy consumption of the fan/drum motor. An optimal
balance between the cycle time and the condensation temperature has been found to avoid
an increase of energy consumption. Assuming an average fan/drum motor size of 200W,
this would be below 6 hours252..
The drying temperature can also be reduced for driers equipped with heating elements,
and this will reduce the heat loss of the drier during the cycle. However, this will result in
only a small increase in the energy efficiency compared to the heat pump driers, as the
drying temperature is not correlated to the efficiency of the heating element. The effect of
reduction of the drying temperature is therefore considered negligible for heating elements
driers.
Gas driers are not considered for this design option, as the combustion is naturally linked
to a certain temperature and is assumed to be difficult to throttle.
A 5% reduction in overall energy consumption is assumed for base case 2253, which is
then used to calculate reduction of the total energy consumption of the drier (see Table
52).
No improvement costs are assumed, as no additional components are needed.
6.1.5 Improved condensation rate/cycle time/condensation efficiency by improving
heat exchangers (air to air) with copper fins instead of aluminium
Heating element condensing driers use an air-to-air heat exchanger to condense the moist
process air. Increasing the effectiveness of this heat exchanger increases the condensation
rate, and thus reduces the average humidity ratio of the process air. This in turn speeds
up the drying time, as the water absorptivity ratio of the process air is proportional to
humidity ratio of the air.
251 Based on an assumed evaporation temperature of 10C and that a heat pump circuit can reach 40% of the Carnot efficiency. The COP of the heat pump heating at 65C =2.46, at 45C = 3.64, = 48% difference. 252 200W at 6 hours = 1.2 kWh. The current average energy consumption per cycle for heat pump driers at 4.4kg is 1.1kWh, so the optimal point is thus less than 6 hours. 253 The decrease from 65C to 45C reduces the heating power by roughly 36% due to a lower temperature difference, and thus increases the cycle time equally. This increase the power consumption by the fan motor. Assuming 50% of the current energy consumption comes from the fan/drum motor (from Table 51) this gives a current consumption of 0.55 kWh of drum motor/cycle, and 0.55 kWh of compressor/cycle. With the reduced temperature this changes to 0.75 kWh of drum motor/cycle, and 0.29 kWh of compressor/cycle. In total = 1.04 equal to a 5.7% reduction. 5% is thus used as a conservative estimate.
211
Ways to increase the effectiveness of the heat exchanger can be by either increasing the
physical size of the heat exchanger, by increasing the air-flow across the heat exchanger,
or by using a more heat conductive material for the fins (e.g. copper instead of aluminium).
Reducing the cycle time means that less time is spent for the process air to escape the unit
during the cycle. This increases the condensation efficiency. Furthermore, a shorter cycle
means less time is spent running the fan/drum motor, thus reducing the overall energy
consumption. A 2% reduction of the energy consumption of the fan/drum motor is assumed
and resulting in an overall reduction of the total energy consumption of the drier by 0.3%.
(see Table 52).
An improvement cost of 3 EUR per unit is assumed due to the higher cost of copper and
aluminium.
Note that the design options described here, and the design option described in section
6.1.4 regarding longer cycle times, are two different ways to increase the efficiency. Using
longer cycle times in general, means to increase the efficiency of the heat source (e.g. the
heat pump circuit) by running it “slower”. The effect in this section refers to running the
tumble drier at the same load/rate, but at a higher condensation efficiency.
6.1.6 Improving the heat pump circuit characteristics by reducing
condensation/evaporation pressure difference and by using more effective heat
exchanger
For heat pump driers, the efficiency of the heat pump circuit is directly proportional to the
energy consumption of the drier. A heat pump circuit consists of three main components
(compressor, evaporator, condenser), and the total efficiency is dependent on all three
elements. As explained in 4.1, the heat pump circuit efficiency is inversely proportional to
the difference between evaporation and condensation pressures and temperatures. Having
more effective heat exchangers means improving either the heat transfer potential or
reducing pressure drop in the heat exchanger. Both effects allow the compressor to reduce
the pressure differential across the compressor, which results in a more efficient process
with a lower energy consumption.
The most commonly found heat exchanger in current models on the market is of the fin-
and-tube type, with copper tubes and aluminium fins. A simple improvement option is to
use copper fins instead of aluminium fins, which is commonly used by other industry
sectors. The heat exchanger could thus be made more effective, or the flow-through area
of the refrigerant could be made shorter, reducing the pressure loss in the heat exchanger.
212
It is assumed that an improvement of up to 5% can be achieved for the heat pump circuit.
This has been used to calculate reduction of the total energy consumption of the drier (see
Table 52).
An improvement cost of 3 EUR per unit is assumed due to the higher cost of copper.
6.1.7 Improved energy efficiency of condenser driers by changing heating technology
to heat pump for condenser driers
As presented in tasks 2 to 4, condensing driers with heat pump technology are far superior
in terms of energy efficiency, with heat pump driers on average using less than half of the
energy per kg-laundry compared to heating elements driers (see Figure 44).
Hence, using heat pump technology would result in significant reduction of energy
consumption. The effect on total energy consumption is based on the average difference
in specific energy consumption in percentage (i.e. -61.7% in 2021)
The improvement costs are based on the difference in unit price between condensing heat
pump driers and condensing heating element driers (i.e. 98 EUR for manufactures).
6.1.8 Reduced GWP (Global Warming Potential) by using natural refrigerants instead
of F-gasses
The most commonly used refrigerants for heat pump tumble driers are hydrofluorocarbons
such as R134a, R407C, and R410A. Recently, driers with R290 (propane) have emerged
on the market.
Using R290 have some general advantages:
• It has very low GWP (3) and 0 ODP254 (for reference, the GWP of R134a is 1430)
• The temperature per pressure difference (dT/dP) is higher than for R134a255, which
means that a lower pressure difference is needed and thus a more efficient heat
pump cycle is possible
• It is cheaper
Disadvantages include:
• The pressure needed to reach for instance a 70°C condensation temperature is
higher for R290 compared to R134a256
• It is flammable and potentially explosive
254 http://www.linde-gas.com 255 For instance, the difference in condensation and evaporation temperatures are higher for R290 than it is for R134a for equal pressure differences. Source: CoolProp 256 Saturation pressures for 70°C is 21.2bar for R134a, and 25.9bar for R290. Source: CoolProp
213
Overall, the disadvantages might result in added product costs, as the components in the
heat pump circle have to sustain higher pressures and added safety precautions have to
be taken. The advantages however might result in a more energy efficient cycle with a
significantly lower GWP.
Some sources report that using natural refrigerants can alter the efficiency of a vapor-
compression cycle by up +/-10%257. Models with R290 are found currently on the market
which are able to achieve an A+++ energy label258. Natural refrigerants are thus currently
being tested in heat pump tumble driers and are considered suitable as a replacement
option for HFC refrigerants. It is thus assumed that there will be no effect on the overall
energy consumption.
The majority of the improvement cost is assumed to be associated with testing and not as
much for research and development costs to develop new heat pump circuits. Propane is
considerably cheaper than R134a, which nullifies the increased cost of development.
6.1.9 Reduced use of virgin materials and environmental impacts by displaying
content of recycled plastics of drier to the consumers
As shown in task 5, plastics (in particular polypropylene) constitute about 25-30% of the
base cases’ bill of materials. Polypropylene is a rigid plastic which, if collected and sorted
properly, is recyclable259. The economic viability of recycling depends on how much of a
homogeneous fraction is available which is to a great extent related to the waste collection
system and not directly influenced by product policy measures as discussed previously.
The amount of virgin plastics and the associated environmental impacts of the driers can
be reduced if more recycled plastics are used in the product. It is assumed that about 10%
less virgin plastics can be used in the driers, and that the initial costs of incorporating
recycled plastics in the driers will be nullified by the savings from buying cheaper recycled
plastic. No expected effect on the driers’ energy consumption and efficiency is expected.
6.1.10 Increased durability and reparability of tumble driers by easy access of critical
parts by professionals and ensuring availability of spare parts after 2 years
Accessing critical parts by professional repairers can ensure tumble driers are kept well-
functioning during their lifetime, and even prolong it. As shown in section 3.2.2, 75% of
consumers answering APPLiA’s survey are ready to repair their tumble driers. However,
Table 31 shows that it is not always easy to access these components.
257 http://conf.montreal-protocol.org/meeting/oewg/oewg-40/presession/Background-Documents/TEAP_DecisionXXIX-10_Task_Force_EE_May2018.pdf 258 According to stakeholders, and according to a desktop study. 259 https://www.azocleantech.com/article.aspx?ArticleID=240
214
Figure 55 shows that ensuring availability of spare parts for a certain number of years,
ensuring an easier disassembly of products, and making disassembly information available
to professionals provide the largest environmental benefits of the products assessed.
Ensuring access to critical components in the drier for professionals and making sure that
spare parts are available will not only contribute to well-functioning of the drier during its
lifetime avoiding replacement of the product but it would also prolong the driers’ lifetime.
It is not possible to know with certainty for how long the lifetime will be extended, but it is
assumed that because tumble driers are long-lasting products, the effect from making
spare parts and repairability information available would be limited. It was assumed that
the life time extension would be 2 years (from 12 to 14 years). This information was
presented to stakeholders and no further changes were proposed. Improvement costs to
manufacturers for designing products easier to disassemble are estimated at 20 EUR per
unit, which may be counteracted in the long term by the fall of spare parts prices due to
higher market availability. However, this long-term effect has not been included in the
improvement costs.
No effect on the driers’ energy consumption and efficiency is expected.
6.1.11 Increased dismantling and recyclability at End-of-Life by a modular design which
enhances recovery of critical materials, plastics and metals
Designing driers for an easier dismantling at their End-of-Life increases the possibilities of
reuse of more components and recycling of more materials rather than shredding and
incinerating/landfilling (see below):
• For base case 1, reuse would increase from 1% of the product to 7% and recycling
from 71 to 74% (mainly more plastics being recycled)
• For base cases 2 and 3, reuse would increase in the same way as for base case 1
and recycling from 73 to 75% (mainly more plastics being recycled)
Improvement costs are assumed to be associated with designing the driers more modular
and the initial investment are estimated to be 5 EUR per unit.
No effect on the driers’ energy consumption and efficiency is expected.
6.2 Potential environmental improvements and consumer costs
Using the EcoReport tool, the design options presented in section 6.1 have been ranked
per base case in order to identify those with the largest life cycle environmental benefits260
and the lowest life cycle costs (LCC). Both have been calculated throughout the product’s
260 The environmental benefits presented are Total Energy Demand and Global Warming Potential, which are considered the most representative of a tumble drier’s life cycle environmental impacts.
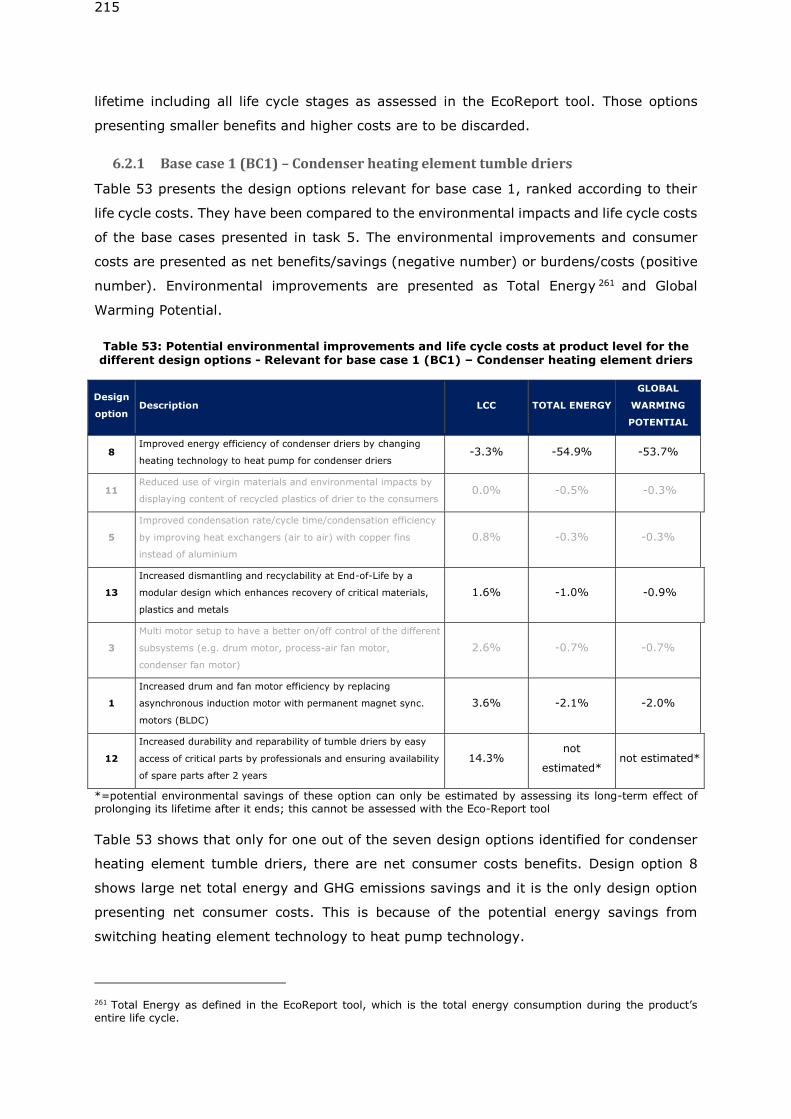
215
lifetime including all life cycle stages as assessed in the EcoReport tool. Those options
presenting smaller benefits and higher costs are to be discarded.
6.2.1 Base case 1 (BC1) – Condenser heating element tumble driers
Table 53 presents the design options relevant for base case 1, ranked according to their
life cycle costs. They have been compared to the environmental impacts and life cycle costs
of the base cases presented in task 5. The environmental improvements and consumer
costs are presented as net benefits/savings (negative number) or burdens/costs (positive
number). Environmental improvements are presented as Total Energy 261 and Global
Warming Potential.
Table 53: Potential environmental improvements and life cycle costs at product level for the different design options - Relevant for base case 1 (BC1) – Condenser heating element driers
Design
option Description LCC TOTAL ENERGY
GLOBAL
WARMING
POTENTIAL
8 Improved energy efficiency of condenser driers by changing
heating technology to heat pump for condenser driers -3.3% -54.9% -53.7%
11 Reduced use of virgin materials and environmental impacts by
displaying content of recycled plastics of drier to the consumers 0.0% -0.5% -0.3%
5
Improved condensation rate/cycle time/condensation efficiency
by improving heat exchangers (air to air) with copper fins
instead of aluminium
0.8% -0.3% -0.3%
13
Increased dismantling and recyclability at End-of-Life by a
modular design which enhances recovery of critical materials,
plastics and metals
1.6% -1.0% -0.9%
3
Multi motor setup to have a better on/off control of the different
subsystems (e.g. drum motor, process-air fan motor,
condenser fan motor)
2.6% -0.7% -0.7%
1
Increased drum and fan motor efficiency by replacing
asynchronous induction motor with permanent magnet sync.
motors (BLDC)
3.6% -2.1% -2.0%
12
Increased durability and reparability of tumble driers by easy
access of critical parts by professionals and ensuring availability
of spare parts after 2 years
14.3% not
estimated* not estimated*
*=potential environmental savings of these option can only be estimated by assessing its long-term effect of prolonging its lifetime after it ends; this cannot be assessed with the Eco-Report tool
Table 53 shows that only for one out of the seven design options identified for condenser
heating element tumble driers, there are net consumer costs benefits. Design option 8
shows large net total energy and GHG emissions savings and it is the only design option
presenting net consumer costs. This is because of the potential energy savings from
switching heating element technology to heat pump technology.
261 Total Energy as defined in the EcoReport tool, which is the total energy consumption during the product’s entire life cycle.
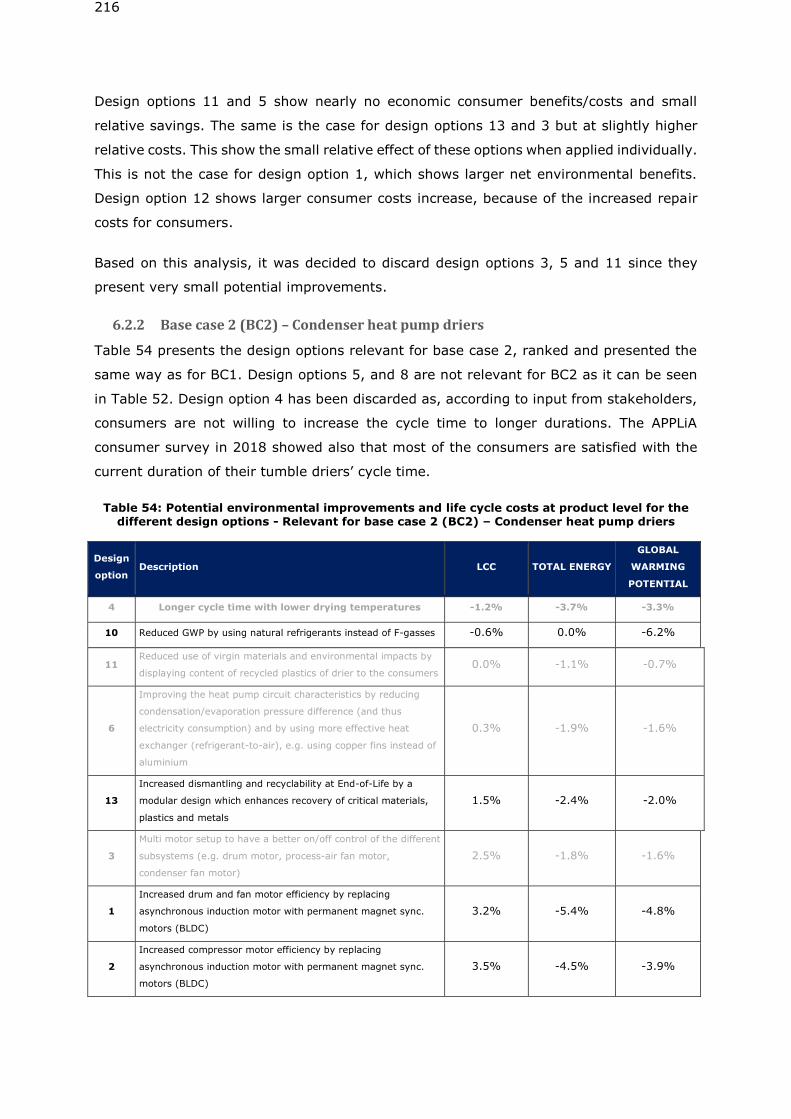
216
Design options 11 and 5 show nearly no economic consumer benefits/costs and small
relative savings. The same is the case for design options 13 and 3 but at slightly higher
relative costs. This show the small relative effect of these options when applied individually.
This is not the case for design option 1, which shows larger net environmental benefits.
Design option 12 shows larger consumer costs increase, because of the increased repair
costs for consumers.
Based on this analysis, it was decided to discard design options 3, 5 and 11 since they
present very small potential improvements.
6.2.2 Base case 2 (BC2) – Condenser heat pump driers
Table 54 presents the design options relevant for base case 2, ranked and presented the
same way as for BC1. Design options 5, and 8 are not relevant for BC2 as it can be seen
in Table 52. Design option 4 has been discarded as, according to input from stakeholders,
consumers are not willing to increase the cycle time to longer durations. The APPLiA
consumer survey in 2018 showed also that most of the consumers are satisfied with the
current duration of their tumble driers’ cycle time.
Table 54: Potential environmental improvements and life cycle costs at product level for the different design options - Relevant for base case 2 (BC2) – Condenser heat pump driers
Design
option Description LCC TOTAL ENERGY
GLOBAL
WARMING
POTENTIAL
4 Longer cycle time with lower drying temperatures -1.2% -3.7% -3.3%
10 Reduced GWP by using natural refrigerants instead of F-gasses -0.6% 0.0% -6.2%
11 Reduced use of virgin materials and environmental impacts by
displaying content of recycled plastics of drier to the consumers 0.0% -1.1% -0.7%
6
Improving the heat pump circuit characteristics by reducing
condensation/evaporation pressure difference (and thus
electricity consumption) and by using more effective heat
exchanger (refrigerant-to-air), e.g. using copper fins instead of
aluminium
0.3% -1.9% -1.6%
13
Increased dismantling and recyclability at End-of-Life by a
modular design which enhances recovery of critical materials,
plastics and metals
1.5% -2.4% -2.0%
3
Multi motor setup to have a better on/off control of the different
subsystems (e.g. drum motor, process-air fan motor,
condenser fan motor)
2.5% -1.8% -1.6%
1
Increased drum and fan motor efficiency by replacing
asynchronous induction motor with permanent magnet sync.
motors (BLDC)
3.2% -5.4% -4.8%
2
Increased compressor motor efficiency by replacing
asynchronous induction motor with permanent magnet sync.
motors (BLDC)
3.5% -4.5% -3.9%
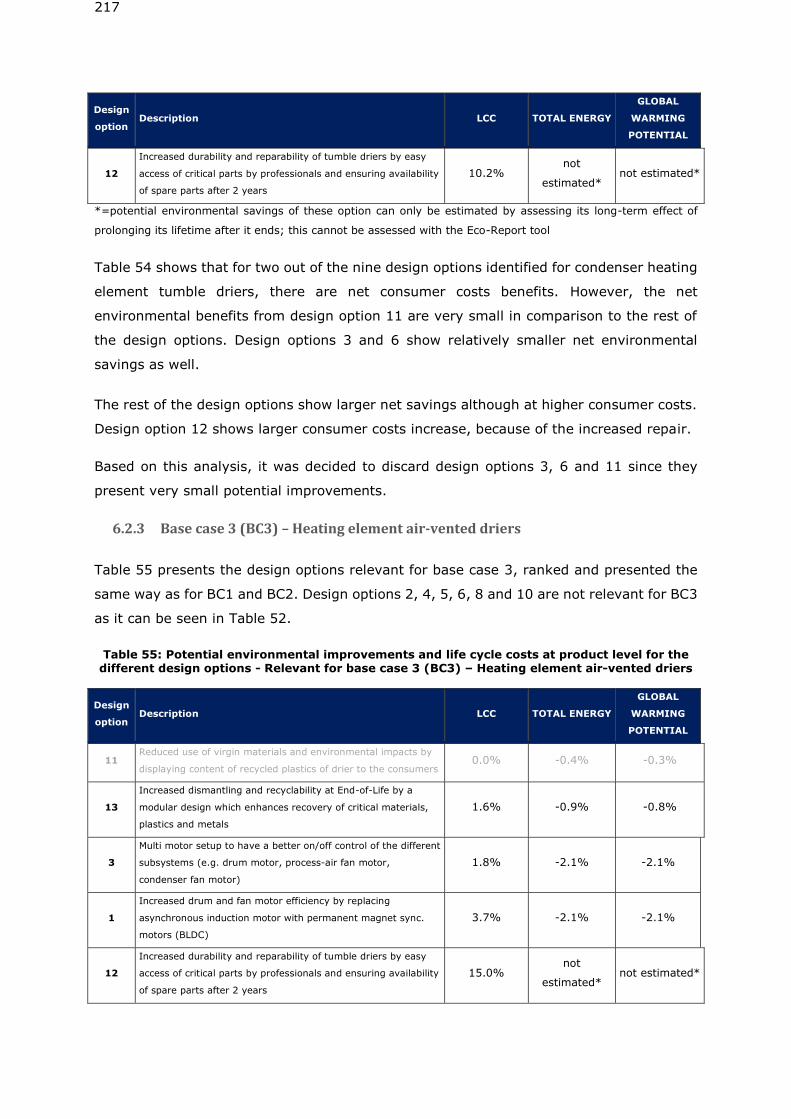
217
Design
option Description LCC TOTAL ENERGY
GLOBAL
WARMING
POTENTIAL
12
Increased durability and reparability of tumble driers by easy
access of critical parts by professionals and ensuring availability
of spare parts after 2 years
10.2% not
estimated* not estimated*
*=potential environmental savings of these option can only be estimated by assessing its long-term effect of
prolonging its lifetime after it ends; this cannot be assessed with the Eco-Report tool
Table 54 shows that for two out of the nine design options identified for condenser heating
element tumble driers, there are net consumer costs benefits. However, the net
environmental benefits from design option 11 are very small in comparison to the rest of
the design options. Design options 3 and 6 show relatively smaller net environmental
savings as well.
The rest of the design options show larger net savings although at higher consumer costs.
Design option 12 shows larger consumer costs increase, because of the increased repair.
Based on this analysis, it was decided to discard design options 3, 6 and 11 since they
present very small potential improvements.
6.2.3 Base case 3 (BC3) – Heating element air-vented driers
Table 55 presents the design options relevant for base case 3, ranked and presented the
same way as for BC1 and BC2. Design options 2, 4, 5, 6, 8 and 10 are not relevant for BC3
as it can be seen in Table 52.
Table 55: Potential environmental improvements and life cycle costs at product level for the different design options - Relevant for base case 3 (BC3) – Heating element air-vented driers
Design
option Description LCC TOTAL ENERGY
GLOBAL
WARMING
POTENTIAL
11 Reduced use of virgin materials and environmental impacts by
displaying content of recycled plastics of drier to the consumers 0.0% -0.4% -0.3%
13
Increased dismantling and recyclability at End-of-Life by a
modular design which enhances recovery of critical materials,
plastics and metals
1.6% -0.9% -0.8%
3
Multi motor setup to have a better on/off control of the different
subsystems (e.g. drum motor, process-air fan motor,
condenser fan motor)
1.8% -2.1% -2.1%
1
Increased drum and fan motor efficiency by replacing
asynchronous induction motor with permanent magnet sync.
motors (BLDC)
3.7% -2.1% -2.1%
12
Increased durability and reparability of tumble driers by easy
access of critical parts by professionals and ensuring availability
of spare parts after 2 years
15.0% not
estimated* not estimated*
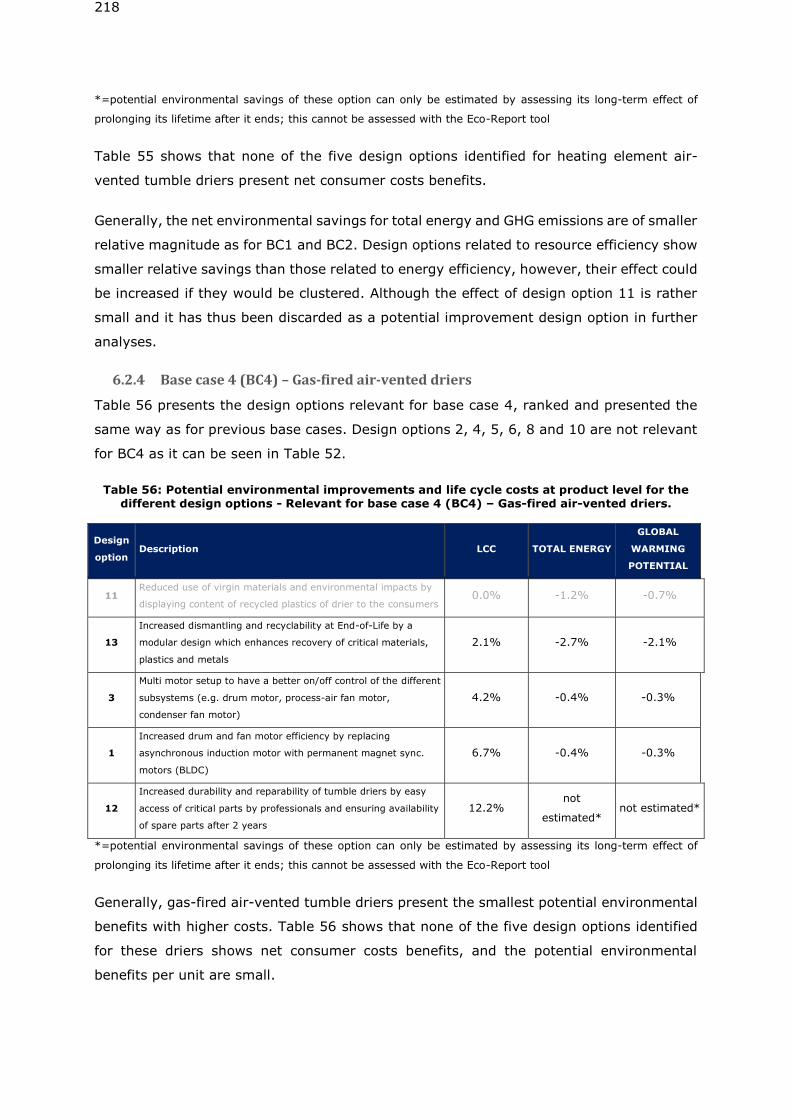
218
*=potential environmental savings of these option can only be estimated by assessing its long-term effect of
prolonging its lifetime after it ends; this cannot be assessed with the Eco-Report tool
Table 55 shows that none of the five design options identified for heating element air-
vented tumble driers present net consumer costs benefits.
Generally, the net environmental savings for total energy and GHG emissions are of smaller
relative magnitude as for BC1 and BC2. Design options related to resource efficiency show
smaller relative savings than those related to energy efficiency, however, their effect could
be increased if they would be clustered. Although the effect of design option 11 is rather
small and it has thus been discarded as a potential improvement design option in further
analyses.
6.2.4 Base case 4 (BC4) – Gas-fired air-vented driers
Table 56 presents the design options relevant for base case 4, ranked and presented the
same way as for previous base cases. Design options 2, 4, 5, 6, 8 and 10 are not relevant
for BC4 as it can be seen in Table 52.
Table 56: Potential environmental improvements and life cycle costs at product level for the different design options - Relevant for base case 4 (BC4) – Gas-fired air-vented driers.
Design
option Description LCC TOTAL ENERGY
GLOBAL
WARMING
POTENTIAL
11 Reduced use of virgin materials and environmental impacts by
displaying content of recycled plastics of drier to the consumers 0.0% -1.2% -0.7%
13
Increased dismantling and recyclability at End-of-Life by a
modular design which enhances recovery of critical materials,
plastics and metals
2.1% -2.7% -2.1%
3
Multi motor setup to have a better on/off control of the different
subsystems (e.g. drum motor, process-air fan motor,
condenser fan motor)
4.2% -0.4% -0.3%
1
Increased drum and fan motor efficiency by replacing
asynchronous induction motor with permanent magnet sync.
motors (BLDC)
6.7% -0.4% -0.3%
12
Increased durability and reparability of tumble driers by easy
access of critical parts by professionals and ensuring availability
of spare parts after 2 years
12.2% not
estimated* not estimated*
*=potential environmental savings of these option can only be estimated by assessing its long-term effect of
prolonging its lifetime after it ends; this cannot be assessed with the Eco-Report tool
Generally, gas-fired air-vented tumble driers present the smallest potential environmental
benefits with higher costs. Table 56 shows that none of the five design options identified
for these driers shows net consumer costs benefits, and the potential environmental
benefits per unit are small.
219
Four of the five design options involve net consumer costs, and design options 1 and 3
show very small potential benefits to the environment. However, these are the only design
opportunities that could improve the performance of gas-fired tumble driers concerning
energy efficiency, and they have thus not been removed.
Based on this analysis, it was decided to discard design option 11 since it presents very
small potential improvements. Design options 1 and 3 were kept for BC4 in spite of their
small effect, as they are currently the only observed potential technology improvements
to reduce energy consumption for gas-fired driers.
6.3 Least Life Cycle Cost (LLCC) analysis
6.3.1 Design options that can be implemented simultaneously (i.e. clustered design
options)
Design options can be clustered in order to aim larger potential environmental benefits at
lower costs. However, in the case of tumble driers, we observe that the clustering
possibilities are quite limited considering their applicability (see previous analysis
presented in section 6.1) and the technical possibilities for implementation:
• For Condenser heating element tumble driers (BC1):
o Design option 1: Energy-related design option to improve energy efficiency
of the driers based on improved motor efficiencies.
o Design option 8: Energy-related design option to improve energy efficiency
of the driers based on improved heating technology.
o Design option 12: Resource-related design options to promote the durability
of the drier.
o Design option 13: Resource-related design options to increase the reuse and
recycling of the drier.
• For Condenser heat pump tumble driers (BC2):
o Design options 1, 2 and 10: Energy-related design options to improve energy
efficiency of the driers based on improved motor efficiencies and to provide
consumers with more information about the type of refrigerant the drier they
purchase uses.
o Design option 12: Resource-related design option to promote the durability
of the drier.
o Design option 13: Resource-related design options to increase the reuse and
recycling of the drier.
• For Heating element air-vented tumble driers (BC3):
o Design options 1 and 3: Energy-related design option to improve energy
efficiency of the driers based on improved motors set-up and efficiencies.
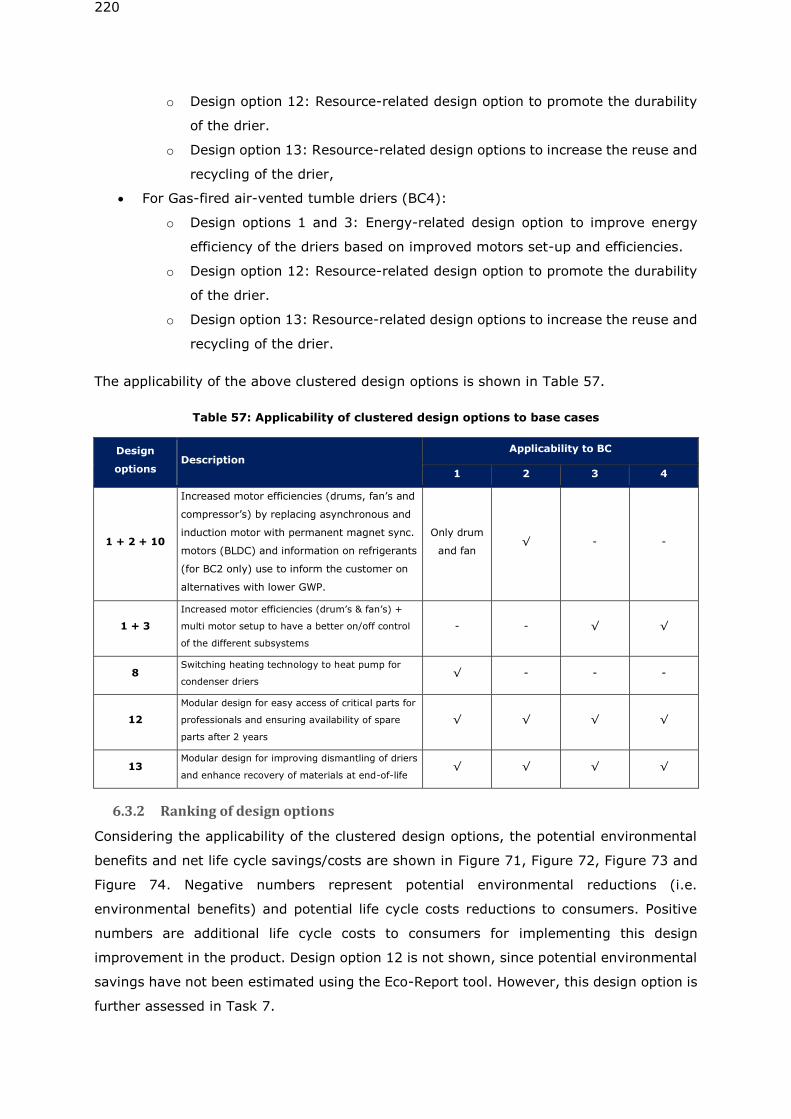
220
o Design option 12: Resource-related design option to promote the durability
of the drier.
o Design option 13: Resource-related design options to increase the reuse and
recycling of the drier,
• For Gas-fired air-vented tumble driers (BC4):
o Design options 1 and 3: Energy-related design option to improve energy
efficiency of the driers based on improved motors set-up and efficiencies.
o Design option 12: Resource-related design option to promote the durability
of the drier.
o Design option 13: Resource-related design options to increase the reuse and
recycling of the drier.
The applicability of the above clustered design options is shown in Table 57.
Table 57: Applicability of clustered design options to base cases
Design
options Description
Applicability to BC
1 2 3 4
1 + 2 + 10
Increased motor efficiencies (drums, fan’s and
compressor’s) by replacing asynchronous and
induction motor with permanent magnet sync.
motors (BLDC) and information on refrigerants
(for BC2 only) use to inform the customer on
alternatives with lower GWP.
Only drum
and fan √ - -
1 + 3
Increased motor efficiencies (drum’s & fan’s) +
multi motor setup to have a better on/off control
of the different subsystems
- - √ √
8 Switching heating technology to heat pump for
condenser driers √ - - -
12
Modular design for easy access of critical parts for
professionals and ensuring availability of spare
parts after 2 years
√ √ √ √
13 Modular design for improving dismantling of driers
and enhance recovery of materials at end-of-life √ √ √ √
6.3.2 Ranking of design options
Considering the applicability of the clustered design options, the potential environmental
benefits and net life cycle savings/costs are shown in Figure 71, Figure 72, Figure 73 and
Figure 74. Negative numbers represent potential environmental reductions (i.e.
environmental benefits) and potential life cycle costs reductions to consumers. Positive
numbers are additional life cycle costs to consumers for implementing this design
improvement in the product. Design option 12 is not shown, since potential environmental
savings have not been estimated using the Eco-Report tool. However, this design option is
further assessed in Task 7.
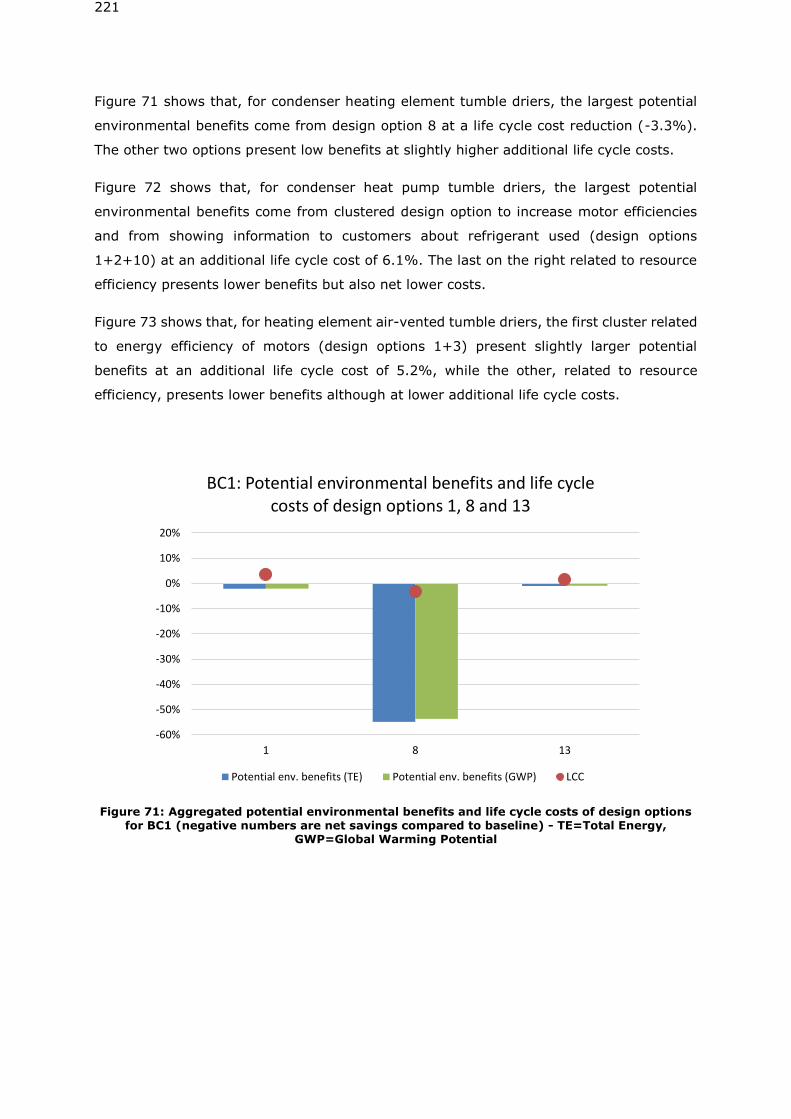
221
Figure 71 shows that, for condenser heating element tumble driers, the largest potential
environmental benefits come from design option 8 at a life cycle cost reduction (-3.3%).
The other two options present low benefits at slightly higher additional life cycle costs.
Figure 72 shows that, for condenser heat pump tumble driers, the largest potential
environmental benefits come from clustered design option to increase motor efficiencies
and from showing information to customers about refrigerant used (design options
1+2+10) at an additional life cycle cost of 6.1%. The last on the right related to resource
efficiency presents lower benefits but also net lower costs.
Figure 73 shows that, for heating element air-vented tumble driers, the first cluster related
to energy efficiency of motors (design options 1+3) present slightly larger potential
benefits at an additional life cycle cost of 5.2%, while the other, related to resource
efficiency, presents lower benefits although at lower additional life cycle costs.
Figure 71: Aggregated potential environmental benefits and life cycle costs of design options for BC1 (negative numbers are net savings compared to baseline) - TE=Total Energy,
GWP=Global Warming Potential
-60%
-50%
-40%
-30%
-20%
-10%
0%
10%
20%
1 8 13
BC1: Potential environmental benefits and life cycle costs of design options 1, 8 and 13
Potential env. benefits (TE) Potential env. benefits (GWP) LCC
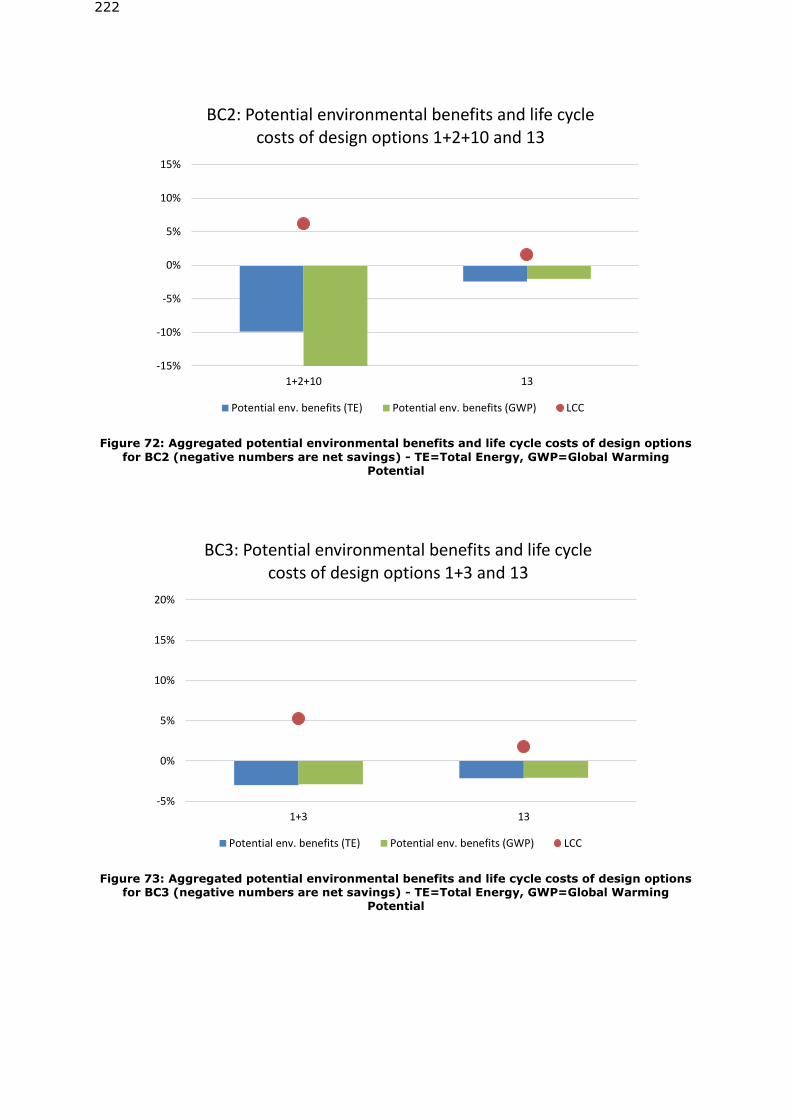
222
Figure 72: Aggregated potential environmental benefits and life cycle costs of design options
for BC2 (negative numbers are net savings) - TE=Total Energy, GWP=Global Warming Potential
Figure 73: Aggregated potential environmental benefits and life cycle costs of design options for BC3 (negative numbers are net savings) - TE=Total Energy, GWP=Global Warming
Potential
-15%
-10%
-5%
0%
5%
10%
15%
1+2+10 13
BC2: Potential environmental benefits and life cycle costs of design options 1+2+10 and 13
Potential env. benefits (TE) Potential env. benefits (GWP) LCC
-5%
0%
5%
10%
15%
20%
1+3 13
BC3: Potential environmental benefits and life cycle costs of design options 1+3 and 13
Potential env. benefits (TE) Potential env. benefits (GWP) LCC
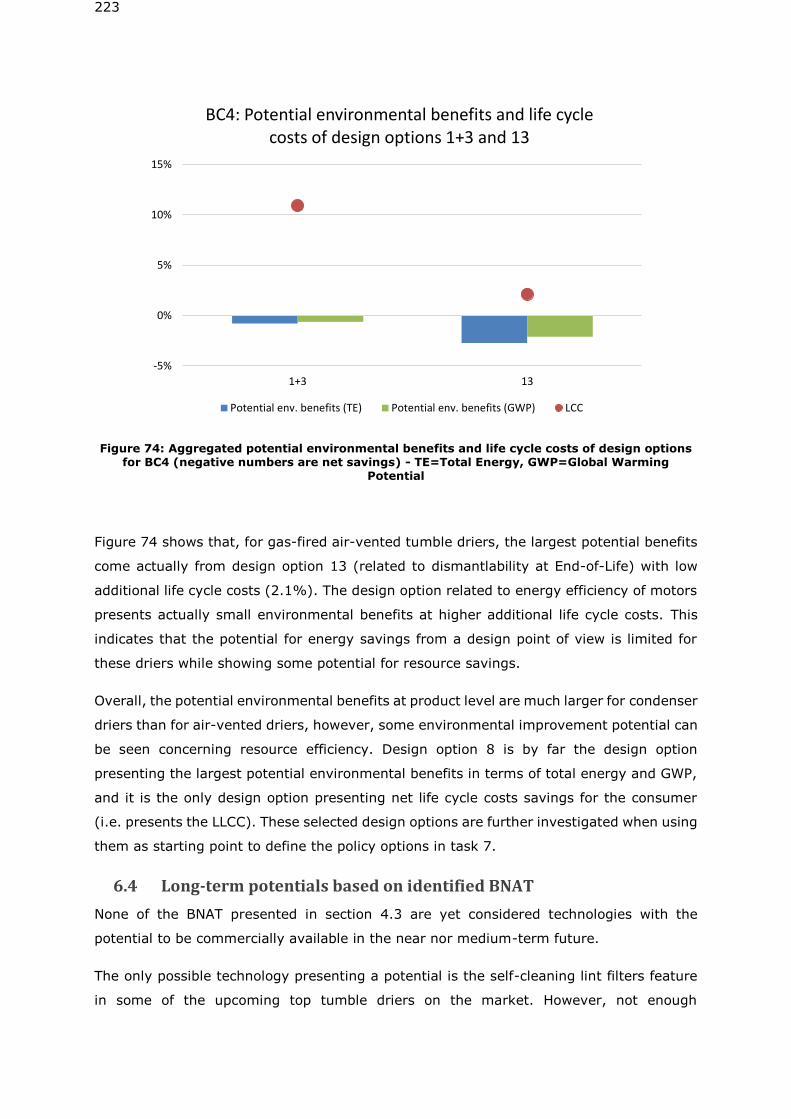
223
Figure 74: Aggregated potential environmental benefits and life cycle costs of design options for BC4 (negative numbers are net savings) - TE=Total Energy, GWP=Global Warming
Potential
Figure 74 shows that, for gas-fired air-vented tumble driers, the largest potential benefits
come actually from design option 13 (related to dismantlability at End-of-Life) with low
additional life cycle costs (2.1%). The design option related to energy efficiency of motors
presents actually small environmental benefits at higher additional life cycle costs. This
indicates that the potential for energy savings from a design point of view is limited for
these driers while showing some potential for resource savings.
Overall, the potential environmental benefits at product level are much larger for condenser
driers than for air-vented driers, however, some environmental improvement potential can
be seen concerning resource efficiency. Design option 8 is by far the design option
presenting the largest potential environmental benefits in terms of total energy and GWP,
and it is the only design option presenting net life cycle costs savings for the consumer
(i.e. presents the LLCC). These selected design options are further investigated when using
them as starting point to define the policy options in task 7.
6.4 Long-term potentials based on identified BNAT
None of the BNAT presented in section 4.3 are yet considered technologies with the
potential to be commercially available in the near nor medium-term future.
The only possible technology presenting a potential is the self-cleaning lint filters feature
in some of the upcoming top tumble driers on the market. However, not enough
-5%
0%
5%
10%
15%
1+3 13
BC4: Potential environmental benefits and life cycle costs of design options 1+3 and 13
Potential env. benefits (TE) Potential env. benefits (GWP) LCC
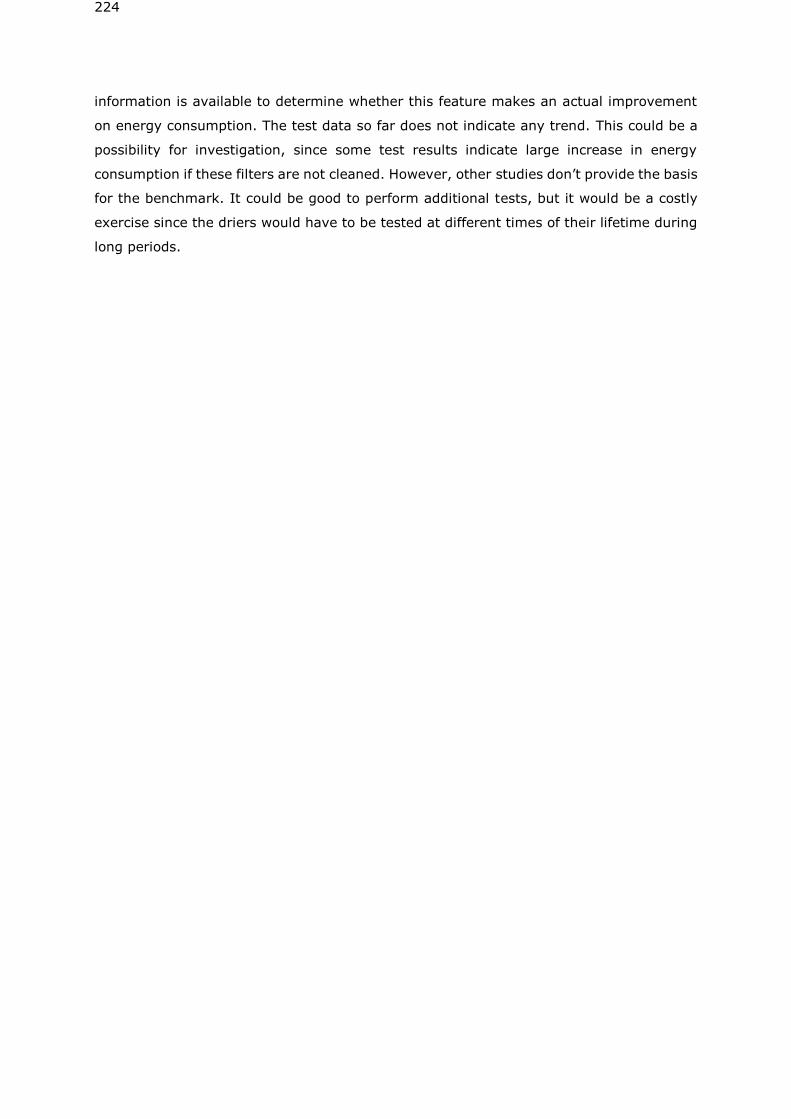
224
information is available to determine whether this feature makes an actual improvement
on energy consumption. The test data so far does not indicate any trend. This could be a
possibility for investigation, since some test results indicate large increase in energy
consumption if these filters are not cleaned. However, other studies don’t provide the basis
for the benchmark. It could be good to perform additional tests, but it would be a costly
exercise since the driers would have to be tested at different times of their lifetime during
long periods.
7. Scenarios
The aims of this task are:
• Evaluate the impact of the existing regulation in the context of the Better Regulation
framework, focusing specifically on the regulation’s effectiveness, efficiency and
relevance.
• Present the policy analysis including stakeholders consultation, policy measures
considered for regulating tumble driers and proposed policy options including
opportunities and barriers.
• Present the scenario analysis including the effects of no action (Business as Usual,
BAU) and of the proposed policy options; this analysis includes the impact to
consumer expenditure, business revenue and employment, including a sensitivity
analysis on key parameters.
• Present the main policy recommendations per product.
7.1 Evaluation of existing regulation
7.1.1 Introduction
The purpose of this section is to evaluate the effect of the current ecodesign and energy
labelling regulations for household tumble driers, and compare the results obtained so far
with the expectation in the impact assessment262. In addition, it is analysed how well the
regulations have been able to solve the market failures identified in the preparatory study
and the impact assessment.
The evaluation will focus on answering questions with regards to:
• Effectiveness of the regulations. What has been the impact of the regulations so far
and have the objectives of the policy measures been achieved?
• Efficiency of the regulations. Has the regulation been cost effective and are the
costs justified?
• Relevance of the regulations. Are the regulations still relevant and have the original
objectives been appropriate?
The existing regulations are the Ecodesign and Energy Labelling Regulations for household
tumble driers respectively Regulations (EU) No 932/2012 and No 392/2012. The aim of
the regulations, especially of the energy labelling regulation, was to provide dynamic
incentives for suppliers to further improve the energy efficiency of household tumble driers
262 https://ec.europa.eu/energy/sites/ener/files/documents/td_impact_assessment.pdf
226
and for end-users to take better informed purchase decisions in order to accelerate market
transformations towards energy-efficient technologies.
According to the current energy labelling regulation for tumble driers, energy used by
household tumble driers accounts for a significant part of total household energy demand
in the Union263, and the scope for further reducing the energy consumption of household
tumble driers was considered important. The Impact Assessment showed that without
implementation of the regulations the electricity consumption of tumble driers was
predicted to increase from 21 TWh/year in 2005 (or 24 TWh/year in 2010) to 31 TWh/year
in 2020 (a large increase in the stock was expected).
Description of the current regulations and their objectives
The ecodesign and energy labelling regulations have been prepared in a parallel process
with the aim to assess the possibilities and benefits of updating the already existing energy
labelling Directive for electric household tumble driers264 and implementation of additional
ecodesign requirements.
The two regulations are intended to work in synergy; the ecodesign regulation pushing the
market towards higher energy efficiency by removing the least efficient tumble driers from
the market, and the energy label pulling the market towards even higher energy efficiency
by providing consumers with the necessary information to identify the most energy efficient
tumble driers on the market.
The ecodesign regulation for household tumble entered into force in 2012 and set minimum
energy performance standards in two tiers from 1st November 2013 and 1st November
2015 respectively. The second tier only concerns condenser driers and makes the energy
efficiency requirement more stringent for condenser driers compared to air-vented driers.
Tier 1 removed all tumble driers from the market worse than energy efficiency class C and
tier 2 all condenser driers worse than energy class B (according to the categorization in
Regulation (EU) No 392/2012). The ecodesign regulation also set minimum levels for
condensation efficiency (for condenser driers) in the two tiers, at 60% and 70%
respectively.
The energy labelling regulation also entered into force in 2012. It included a new energy
label with a more ambitious categorisation than in the previous scheme and three new
energy classes on top of the A-class (A+, A++, and A+++). The new label was applicable
from 29 May 2013.
263263 0.7% of the total residential energy consumption, 3.6% of the total residential energy consumption exluding energy used for space and water heating. Based on EUROSTAT and Figure 77 (BAU0), 2016 data. 264 Commission Directive 95/13/EC with regard to Energy Labelling of household electric tumble driers
227
See a more detailed description of the current regulations in section 1.2
The objectives of the current regulations appear in the 2012 Impact Assessment for tumble
driers.
With regard to energy savings the objective was to achieve energy savings in 2030 of 8.6
TWh/year (3.3 TW/year in 2020) corresponding to a reduction of 25 % (10.6 % in 2020)
compared to the BAU scenario in the 2012 Impact Assessment265. For the related CO2-
emissions the objective was to reduce the emission with 3.8 million tons CO2 in 2030 (1.5
million tons CO2 in 2020) compared to the BAU.
Additional objectives were to:
• remove the least efficient products from market;
• promote market take-up of more energy efficient tumble driers for domestic use;
• address the current regulatory failure (market failure) thereby maintaining and
supporting the past market trend towards more energy efficient tumble driers;
• drive further investments in new technologies towards environmentally friendly
tumble driers.
The most important regulatory/market failure identified in the 2012 Impact Assessment
was the lack of a driver for increasing the market share of the most energy efficient
technologies on the market (i.e. heat pump driers).
Household tumble driers were at the time of the 2012 Impact Assessment addressed by
the Commission Directive 95/13/EC with regard to Energy Labelling of household electric
tumble driers. This Directive has improved the energy efficiency for tumble driers, but it
has not been able to achieve more than a small increase in the number of tumble driers in
energy class A placed on the market.
According to the 2012 Impact Assessment appliances in energy class A made up only 0.5
% of sales in 2005, the reference year for the preparatory study, increasing to
approximately 1.5 % in 2010. The reason for the limited growth in market share of energy
class A tumble driers is according to the 2012 Impact Assessment that the only driers able
to reach energy class A were heat-pump condenser driers, which were significantly more
expensive to produce.
Another aspect pointed out in the 2012 Impact Assessment was that the previous energy
labelling scheme was not able to make visible for the consumers the large annual savings
265 COMMISSION STAFF WORKING DOCUMENT IMPACT ASSESSMENT Accompanying the document Commission Regulation implementing Directive 2009/125/EC of the European Parliament and of the Council with regard to ecodesign requirements for household tumble driers. 2012
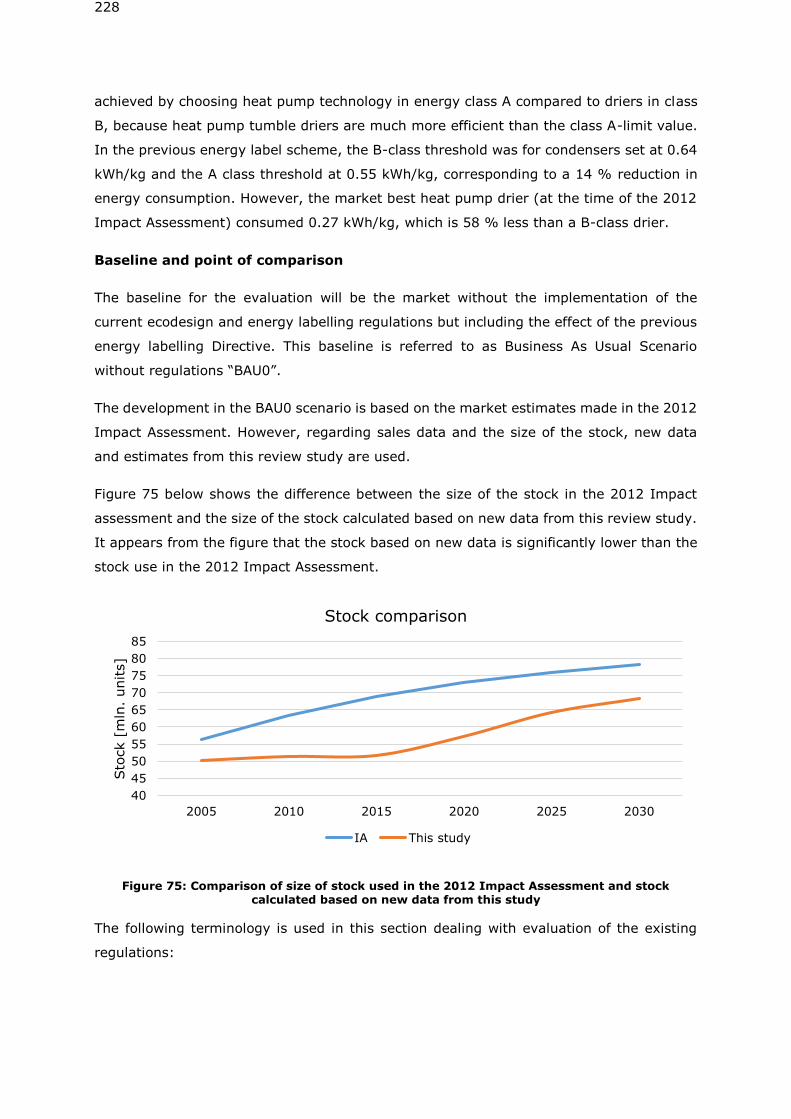
228
achieved by choosing heat pump technology in energy class A compared to driers in class
B, because heat pump tumble driers are much more efficient than the class A-limit value.
In the previous energy label scheme, the B-class threshold was for condensers set at 0.64
kWh/kg and the A class threshold at 0.55 kWh/kg, corresponding to a 14 % reduction in
energy consumption. However, the market best heat pump drier (at the time of the 2012
Impact Assessment) consumed 0.27 kWh/kg, which is 58 % less than a B-class drier.
Baseline and point of comparison
The baseline for the evaluation will be the market without the implementation of the
current ecodesign and energy labelling regulations but including the effect of the previous
energy labelling Directive. This baseline is referred to as Business As Usual Scenario
without regulations “BAU0”.
The development in the BAU0 scenario is based on the market estimates made in the 2012
Impact Assessment. However, regarding sales data and the size of the stock, new data
and estimates from this review study are used.
Figure 75 below shows the difference between the size of the stock in the 2012 Impact
assessment and the size of the stock calculated based on new data from this review study.
It appears from the figure that the stock based on new data is significantly lower than the
stock use in the 2012 Impact Assessment.
Figure 75: Comparison of size of stock used in the 2012 Impact Assessment and stock calculated based on new data from this study
The following terminology is used in this section dealing with evaluation of the existing
regulations:
40
45
50
55
60
65
70
75
80
85
2005 2010 2015 2020 2025 2030
Sto
ck [
mln
. units]
Stock comparison
IA This study
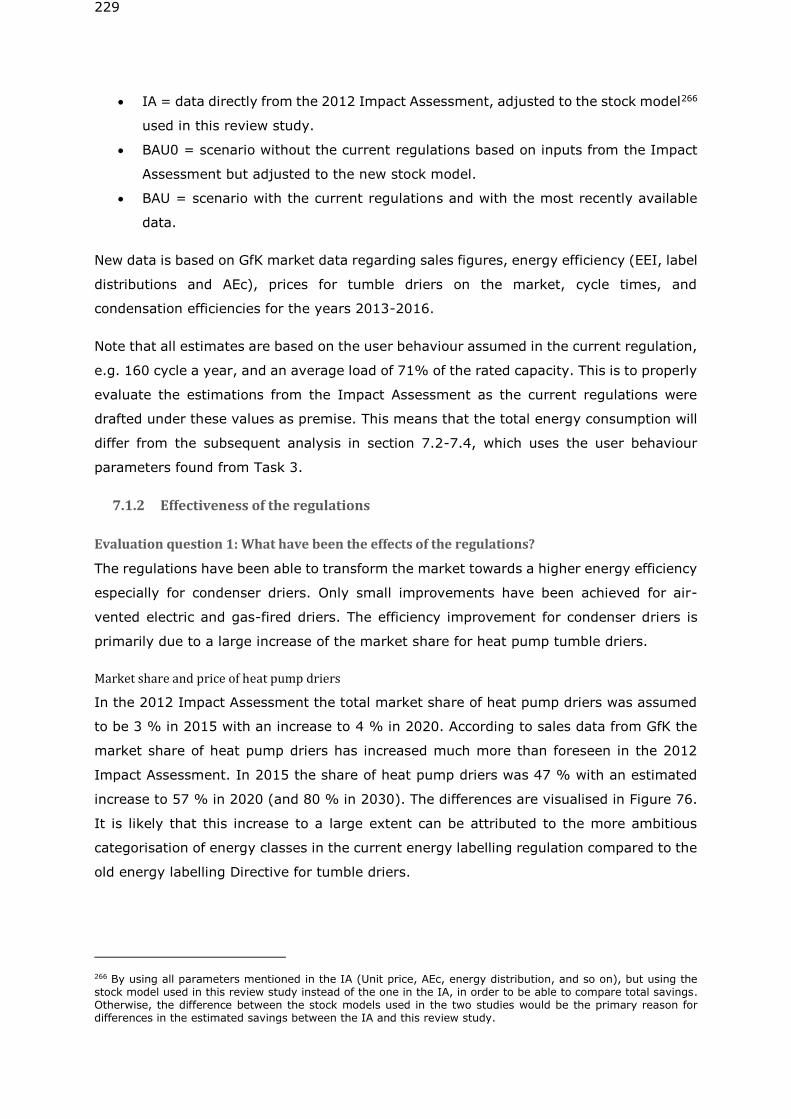
229
• IA = data directly from the 2012 Impact Assessment, adjusted to the stock model266
used in this review study.
• BAU0 = scenario without the current regulations based on inputs from the Impact
Assessment but adjusted to the new stock model.
• BAU = scenario with the current regulations and with the most recently available
data.
New data is based on GfK market data regarding sales figures, energy efficiency (EEI, label
distributions and AEc), prices for tumble driers on the market, cycle times, and
condensation efficiencies for the years 2013-2016.
Note that all estimates are based on the user behaviour assumed in the current regulation,
e.g. 160 cycle a year, and an average load of 71% of the rated capacity. This is to properly
evaluate the estimations from the Impact Assessment as the current regulations were
drafted under these values as premise. This means that the total energy consumption will
differ from the subsequent analysis in section 7.2-7.4, which uses the user behaviour
parameters found from Task 3.
7.1.2 Effectiveness of the regulations
Evaluation question 1: What have been the effects of the regulations?
The regulations have been able to transform the market towards a higher energy efficiency
especially for condenser driers. Only small improvements have been achieved for air-
vented electric and gas-fired driers. The efficiency improvement for condenser driers is
primarily due to a large increase of the market share for heat pump tumble driers.
Market share and price of heat pump driers
In the 2012 Impact Assessment the total market share of heat pump driers was assumed
to be 3 % in 2015 with an increase to 4 % in 2020. According to sales data from GfK the
market share of heat pump driers has increased much more than foreseen in the 2012
Impact Assessment. In 2015 the share of heat pump driers was 47 % with an estimated
increase to 57 % in 2020 (and 80 % in 2030). The differences are visualised in Figure 76.
It is likely that this increase to a large extent can be attributed to the more ambitious
categorisation of energy classes in the current energy labelling regulation compared to the
old energy labelling Directive for tumble driers.
266 By using all parameters mentioned in the IA (Unit price, AEc, energy distribution, and so on), but using the stock model used in this review study instead of the one in the IA, in order to be able to compare total savings. Otherwise, the difference between the stock models used in the two studies would be the primary reason for differences in the estimated savings between the IA and this review study.
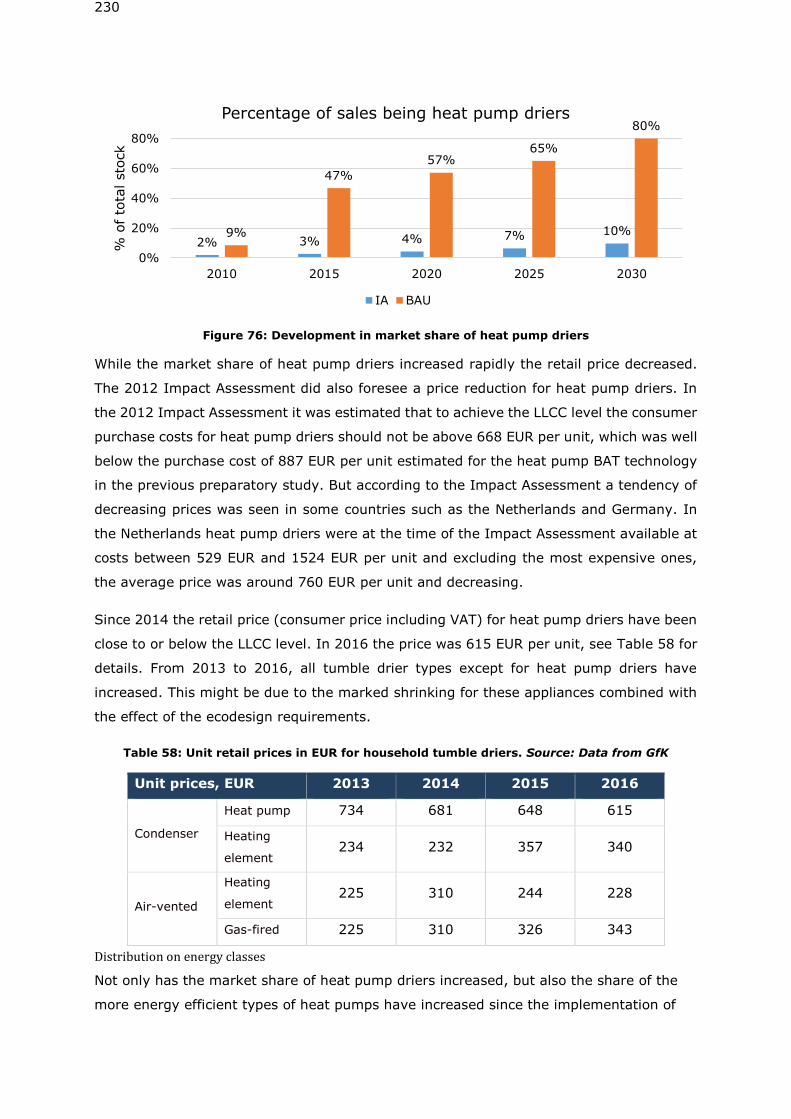
230
Figure 76: Development in market share of heat pump driers
While the market share of heat pump driers increased rapidly the retail price decreased.
The 2012 Impact Assessment did also foresee a price reduction for heat pump driers. In
the 2012 Impact Assessment it was estimated that to achieve the LLCC level the consumer
purchase costs for heat pump driers should not be above 668 EUR per unit, which was well
below the purchase cost of 887 EUR per unit estimated for the heat pump BAT technology
in the previous preparatory study. But according to the Impact Assessment a tendency of
decreasing prices was seen in some countries such as the Netherlands and Germany. In
the Netherlands heat pump driers were at the time of the Impact Assessment available at
costs between 529 EUR and 1524 EUR per unit and excluding the most expensive ones,
the average price was around 760 EUR per unit and decreasing.
Since 2014 the retail price (consumer price including VAT) for heat pump driers have been
close to or below the LLCC level. In 2016 the price was 615 EUR per unit, see Table 58 for
details. From 2013 to 2016, all tumble drier types except for heat pump driers have
increased. This might be due to the marked shrinking for these appliances combined with
the effect of the ecodesign requirements.
Table 58: Unit retail prices in EUR for household tumble driers. Source: Data from GfK
Unit prices, EUR 2013 2014 2015 2016
Condenser
Heat pump 734 681 648 615
Heating
element 234 232 357 340
Air-vented
Heating
element 225 310 244 228
Gas-fired 225 310 326 343
Distribution on energy classes
Not only has the market share of heat pump driers increased, but also the share of the
more energy efficient types of heat pumps have increased since the implementation of
2% 3% 4% 7% 10%9%
47%
57%65%
80%
0%
20%
40%
60%
80%
2010 2015 2020 2025 2030
% o
f to
tal sto
ck
Percentage of sales being heat pump driers
IA BAU
231
the energy labelling regulation. In 2016 the share of heat pump driers in energy class
A++ and A+++ was 76 % compared to only 25 % in 2013. See more details in task 2,
Figure 22.
The above-mentioned development in market share for heat pump tumble driers shows
that the current energy labelling regulation has been able to address the observed market
failure with regard to the lack of driver for promotion of the most energy efficient tumble
driers on the market. However, the share of the most energy efficient heat pump tumble
driers corresponding to energy class A+++ is still rather low but has increased from 4 %
in 2014 to 14 % in 2016 (See Figure 18) of the increasing overall market share of heat
pump condenser driers on the driers market (see Table 9). It could therefore be questioned
whether the current energy labelling regulation has enough incentive to drive the market
to an even higher level of energy efficiency.
For heating element condenser driers (see task 2, Figure 23), the regulations have been
able to increase the market share of this type of driers in energy class B from 71 % in
2013 to 93 % in 2016 of the decreasing overall market share of heating element condenser
driers on the driers market (see Table 9). The remaining part of the driers is in energy
class C. Since 1st November 2015 heating element condenser driers in energy classes C
are not allowed to be placed on the EU market. Probably according to this requirement,
the market data show a large decrease of condenser tumble driers in energy class C in
2016. But still no heating element condenser driers models in energy class A have been
brought on the market.
The most notable technical solution to increase the energy efficiency of condenser driers
is changing the heating technology to a heat pump circuit. The marketing of the more
efficient heat pump driers has led to a decreased sale of heat element condensing driers
because consumers have shifted their purchase to the more efficient types.
For air-vented driers (see task 2, Figure 21) the regulations have only caused minor
changes in distribution of the sale on energy classes. There has been a small decrease in
the share of products in energy class D, probably due to the implementation of the
ecodesign requirements applicable for 1st November 2013, and a small increase on the
share of products in energy class B within the decreasing overall market share of air-vented
driers market (see table 9). The majority of air-vented driers are however still in energy
class C. Air-vented tumble driers in energy class D have not been allowed on the market
in the EU since 1st November 2013. The market data therefore suggest that some
incompliance exists for this product type.
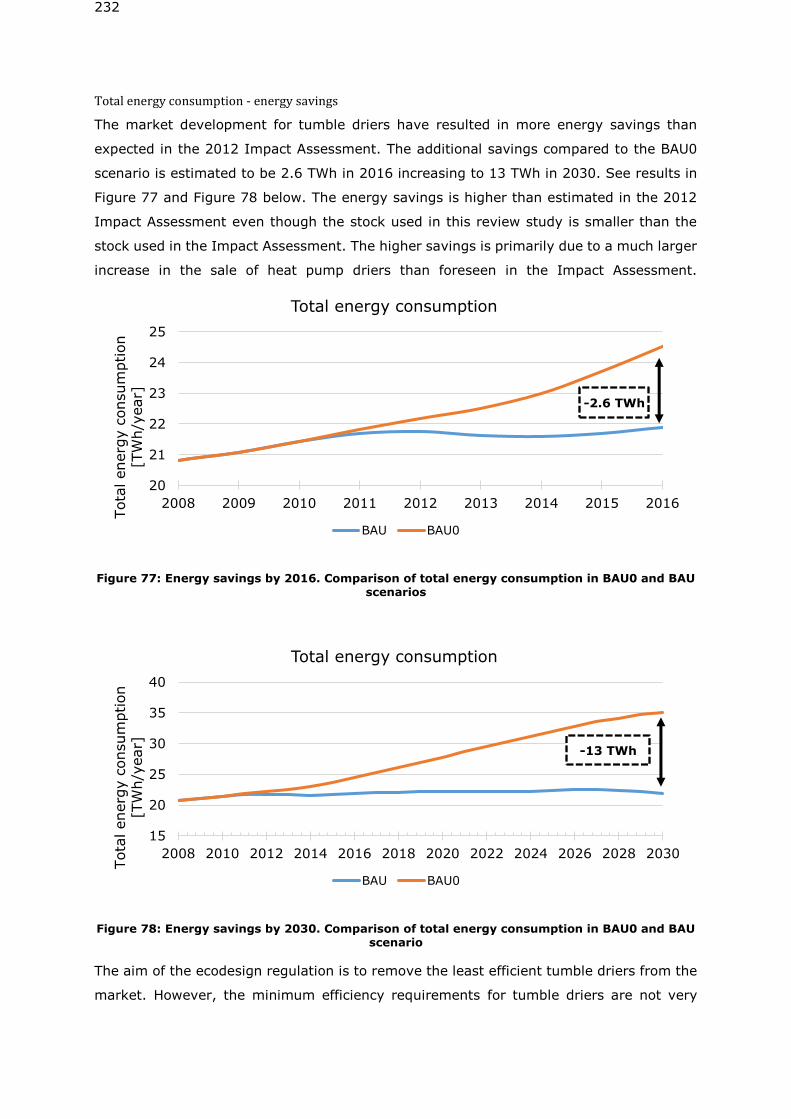
232
Total energy consumption - energy savings
The market development for tumble driers have resulted in more energy savings than
expected in the 2012 Impact Assessment. The additional savings compared to the BAU0
scenario is estimated to be 2.6 TWh in 2016 increasing to 13 TWh in 2030. See results in
Figure 77 and Figure 78 below. The energy savings is higher than estimated in the 2012
Impact Assessment even though the stock used in this review study is smaller than the
stock used in the Impact Assessment. The higher savings is primarily due to a much larger
increase in the sale of heat pump driers than foreseen in the Impact Assessment.
Figure 77: Energy savings by 2016. Comparison of total energy consumption in BAU0 and BAU scenarios
Figure 78: Energy savings by 2030. Comparison of total energy consumption in BAU0 and BAU scenario
The aim of the ecodesign regulation is to remove the least efficient tumble driers from the
market. However, the minimum efficiency requirements for tumble driers are not very
20
21
22
23
24
25
2008 2009 2010 2011 2012 2013 2014 2015 2016
Tota
l energ
y c
onsum
ption
[TW
h/y
ear]
Total energy consumption
BAU BAU0
-2.6 TWh
15
20
25
30
35
40
2008 2010 2012 2014 2016 2018 2020 2022 2024 2026 2028 2030
Tota
l energ
y c
onsum
ption
[TW
h/y
ear]
Total energy consumption
BAU BAU0
-13 TWh
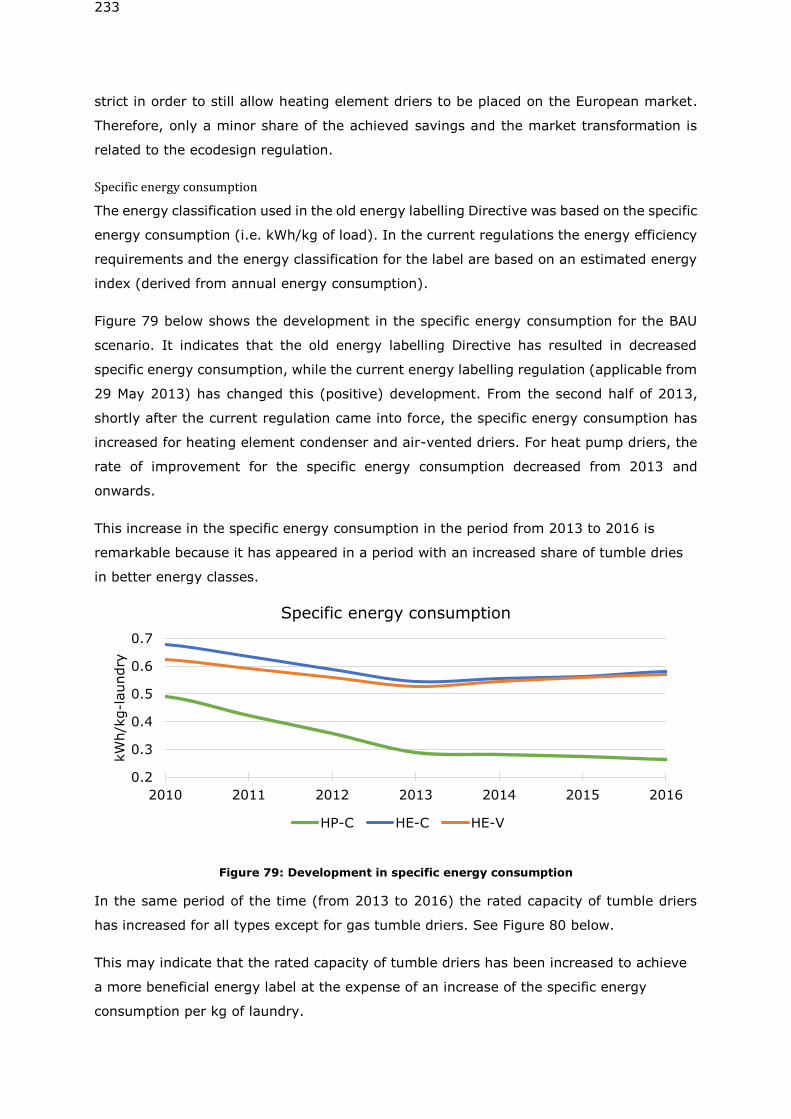
233
strict in order to still allow heating element driers to be placed on the European market.
Therefore, only a minor share of the achieved savings and the market transformation is
related to the ecodesign regulation.
Specific energy consumption
The energy classification used in the old energy labelling Directive was based on the specific
energy consumption (i.e. kWh/kg of load). In the current regulations the energy efficiency
requirements and the energy classification for the label are based on an estimated energy
index (derived from annual energy consumption).
Figure 79 below shows the development in the specific energy consumption for the BAU
scenario. It indicates that the old energy labelling Directive has resulted in decreased
specific energy consumption, while the current energy labelling regulation (applicable from
29 May 2013) has changed this (positive) development. From the second half of 2013,
shortly after the current regulation came into force, the specific energy consumption has
increased for heating element condenser and air-vented driers. For heat pump driers, the
rate of improvement for the specific energy consumption decreased from 2013 and
onwards.
This increase in the specific energy consumption in the period from 2013 to 2016 is
remarkable because it has appeared in a period with an increased share of tumble dries
in better energy classes.
Figure 79: Development in specific energy consumption
In the same period of the time (from 2013 to 2016) the rated capacity of tumble driers
has increased for all types except for gas tumble driers. See Figure 80 below.
This may indicate that the rated capacity of tumble driers has been increased to achieve
a more beneficial energy label at the expense of an increase of the specific energy
consumption per kg of laundry.
0.2
0.3
0.4
0.5
0.6
0.7
2010 2011 2012 2013 2014 2015 2016
kW
h/k
g-l
aundry
Specific energy consumption
HP-C HE-C HE-V
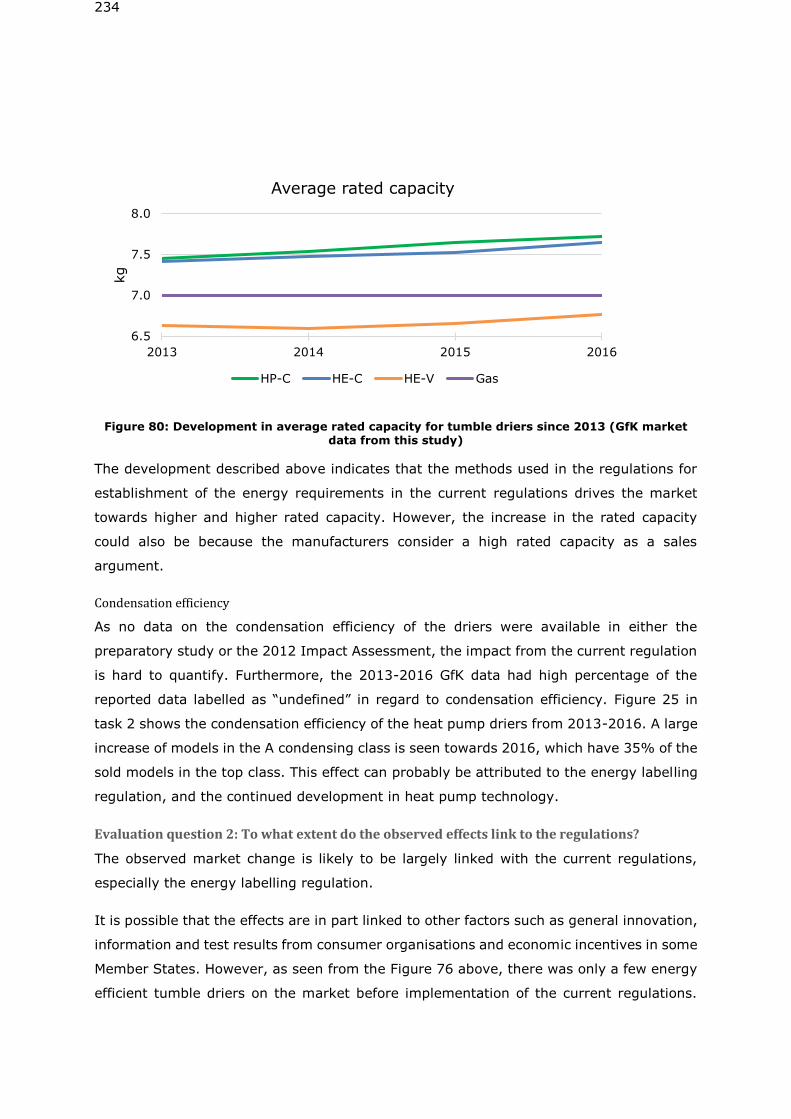
234
Figure 80: Development in average rated capacity for tumble driers since 2013 (GfK market data from this study)
The development described above indicates that the methods used in the regulations for
establishment of the energy requirements in the current regulations drives the market
towards higher and higher rated capacity. However, the increase in the rated capacity
could also be because the manufacturers consider a high rated capacity as a sales
argument.
Condensation efficiency
As no data on the condensation efficiency of the driers were available in either the
preparatory study or the 2012 Impact Assessment, the impact from the current regulation
is hard to quantify. Furthermore, the 2013-2016 GfK data had high percentage of the
reported data labelled as “undefined” in regard to condensation efficiency. Figure 25 in
task 2 shows the condensation efficiency of the heat pump driers from 2013-2016. A large
increase of models in the A condensing class is seen towards 2016, which have 35% of the
sold models in the top class. This effect can probably be attributed to the energy labelling
regulation, and the continued development in heat pump technology.
Evaluation question 2: To what extent do the observed effects link to the regulations?
The observed market change is likely to be largely linked with the current regulations,
especially the energy labelling regulation.
It is possible that the effects are in part linked to other factors such as general innovation,
information and test results from consumer organisations and economic incentives in some
Member States. However, as seen from the Figure 76 above, there was only a few energy
efficient tumble driers on the market before implementation of the current regulations.
6.5
7.0
7.5
8.0
2013 2014 2015 2016
kg
Average rated capacity
HP-C HE-C HE-V Gas
235
Even in the 2012 Impact Assessment, only a small increase in the market share of heat
pump driers was foreseen.
The effect is most significant for condenser driers where the energy labelling regulation
has resulted in a shift of technology to efficient heat pump driers for a large share of the
market.
For the remaining part of the condenser driers (with heating element technology) the
observed effect with regards to energy efficiency is linked to the ecodesign regulation,
which have removed tumble driers in energy class C from the market. This development
would not have occurred without the regulation.
For heating element air-vented driers the effect with regards to energy efficiency have
been very vague. But there is a small trend of an increased market share of air-vented
driers in energy class B and a lower share in energy class D, which is probably due to the
ecodesign regulation.
Data for gas-fired driers is too poor to identify any developments and is still considered a
niche market with below 0.1% of the total sales. No conclusions on the effect of the current
regulation on this type of drier can hence be made.
The increase in the market share of heat pump driers at the expense of heating element
condenser and air-vented driers is probably a consequence of the energy labelling
regulation.
There is probably a very close link between the increased market share of heat pump driers
and the reduction in the consumer purchase price. Before adoption of the regulations there
was in some countries already a trend towards lower prices, but the very fast reduction of
the prices observed is most likely linked to the current energy labelling regulation.
Evaluation question 3: To what extent can these changes/effects be credited to the
intervention?
Tumble driers have been covered by the old Energy Labelling Directive267 since 1995.
However, still in 2012 after 25 years the Directive had not been able to increase the share
of tumble driers in energy class A. Therefore, it is most likely that the effects seen since
2013 should mainly credited to the new regulations. It is unlikely that the very fast
transition to heat pump driers would have happened without the market pull effect of the
new energy labelling regulation. The overall picture is that the energy label has been the
tool needed for the manufacturer to differentiate the energy efficient heat pump driers and
267 Commission Directive 95/13/EC with regard to Energy Labelling of household electric tumble driers
236
made the manufacturers sufficiently confident in that their investments in the heat pump
technology could be returned.
However, the transition to heat pump technology have also been supported by information
and test results from consumer organisations and financial incentives in some Members
States.
Evaluation question 4: To what extent can factors influencing the observed achievements be
linked to the EU intervention?
Some factors have influenced the achievement. Without the price reduction for heat pump
driers the effects of the regulation would have been less significant. The price reduction
(see Figure 82) is probably linked to the energy labelling regulation because it has created
the market pull necessary for the manufacturers to start production of heat pump driers in
a larger scale and thereby being able to reduce the costs.
The increase of the specific energy consumption (as mentioned above) has reduced the
achievements of the regulations. This increase is probably due to the methodology used in
the regulations to set the energy efficiency requirements and make the energy
classification for the label.
For air-vented driers the regulations have only resulted in small improvement of the energy
efficiency. The small improvements are probably due to the ecodesign regulation. However,
they have probably remained small due to the fact that no obvious and cost-effective
improvement options exist for these types of drier.
Another factor that might have slowed down the achievements of the energy labelling
regulation is that a relatively large share of consumers according to the APPLiA consumer
study268 finds part of the information on the label unclear. According to the study 42 %
and 35 % of the consumers understand all information on the label for respectively vented
driers and condenser driers. Figure 81 below shows which parts of the information the
remaining part of the consumers did not understand. It appears that the consumers
especially find the information on annual energy consumption and condensation efficiency
unclear, but a large share also finds the information regarding type of household drier and
cycle time unclear.
268268268 Tumble dryer usage and attitudes. A survey in 12 European countries. APPLiA, Home Appliances Europe. March 2018.
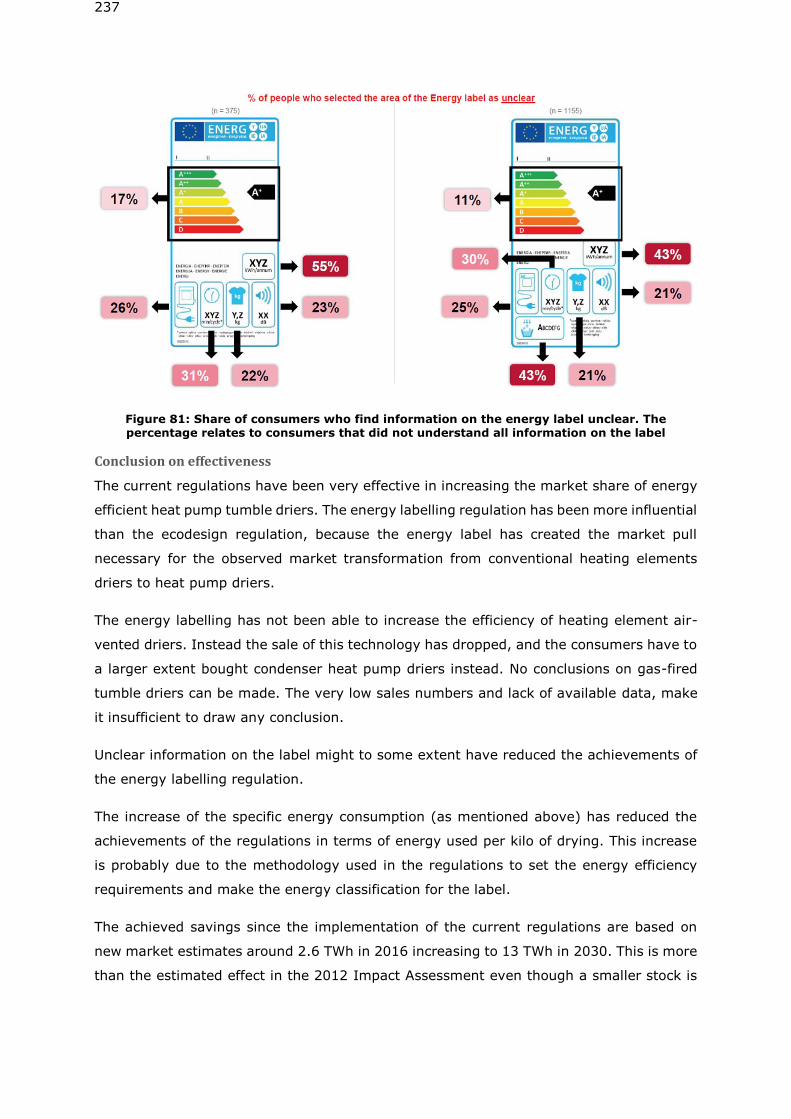
237
Figure 81: Share of consumers who find information on the energy label unclear. The percentage relates to consumers that did not understand all information on the label
Conclusion on effectiveness
The current regulations have been very effective in increasing the market share of energy
efficient heat pump tumble driers. The energy labelling regulation has been more influential
than the ecodesign regulation, because the energy label has created the market pull
necessary for the observed market transformation from conventional heating elements
driers to heat pump driers.
The energy labelling has not been able to increase the efficiency of heating element air-
vented driers. Instead the sale of this technology has dropped, and the consumers have to
a larger extent bought condenser heat pump driers instead. No conclusions on gas-fired
tumble driers can be made. The very low sales numbers and lack of available data, make
it insufficient to draw any conclusion.
Unclear information on the label might to some extent have reduced the achievements of
the energy labelling regulation.
The increase of the specific energy consumption (as mentioned above) has reduced the
achievements of the regulations in terms of energy used per kilo of drying. This increase
is probably due to the methodology used in the regulations to set the energy efficiency
requirements and make the energy classification for the label.
The achieved savings since the implementation of the current regulations are based on
new market estimates around 2.6 TWh in 2016 increasing to 13 TWh in 2030. This is more
than the estimated effect in the 2012 Impact Assessment even though a smaller stock is
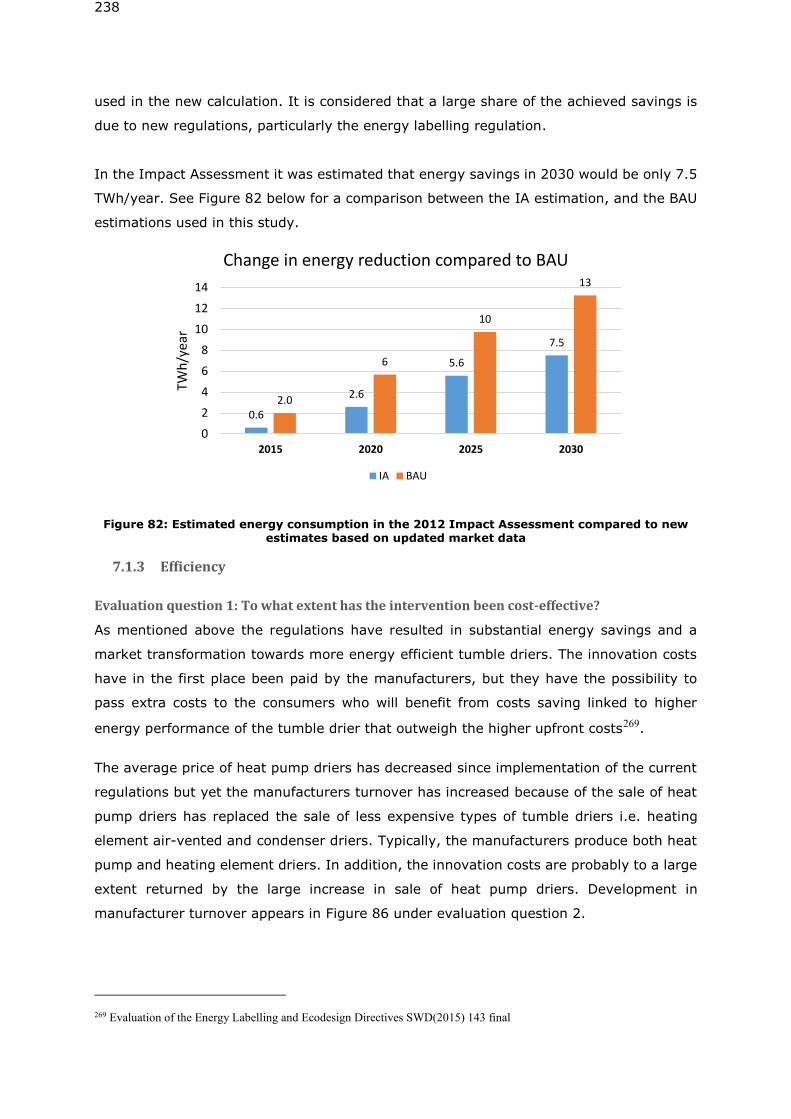
238
used in the new calculation. It is considered that a large share of the achieved savings is
due to new regulations, particularly the energy labelling regulation.
In the Impact Assessment it was estimated that energy savings in 2030 would be only 7.5
TWh/year. See Figure 82 below for a comparison between the IA estimation, and the BAU
estimations used in this study.
Figure 82: Estimated energy consumption in the 2012 Impact Assessment compared to new estimates based on updated market data
7.1.3 Efficiency
Evaluation question 1: To what extent has the intervention been cost-effective?
As mentioned above the regulations have resulted in substantial energy savings and a
market transformation towards more energy efficient tumble driers. The innovation costs
have in the first place been paid by the manufacturers, but they have the possibility to
pass extra costs to the consumers who will benefit from costs saving linked to higher
energy performance of the tumble drier that outweigh the higher upfront costs269.
The average price of heat pump driers has decreased since implementation of the current
regulations but yet the manufacturers turnover has increased because of the sale of heat
pump driers has replaced the sale of less expensive types of tumble driers i.e. heating
element air-vented and condenser driers. Typically, the manufacturers produce both heat
pump and heating element driers. In addition, the innovation costs are probably to a large
extent returned by the large increase in sale of heat pump driers. Development in
manufacturer turnover appears in Figure 86 under evaluation question 2.
269 Evaluation of the Energy Labelling and Ecodesign Directives SWD(2015) 143 final
0.6
2.6
5.6
7.5
2.0
6
10
13
0
2
4
6
8
10
12
14
2015 2020 2025 2030
TWh
/yea
r
Change in energy reduction compared to BAU
IA BAU
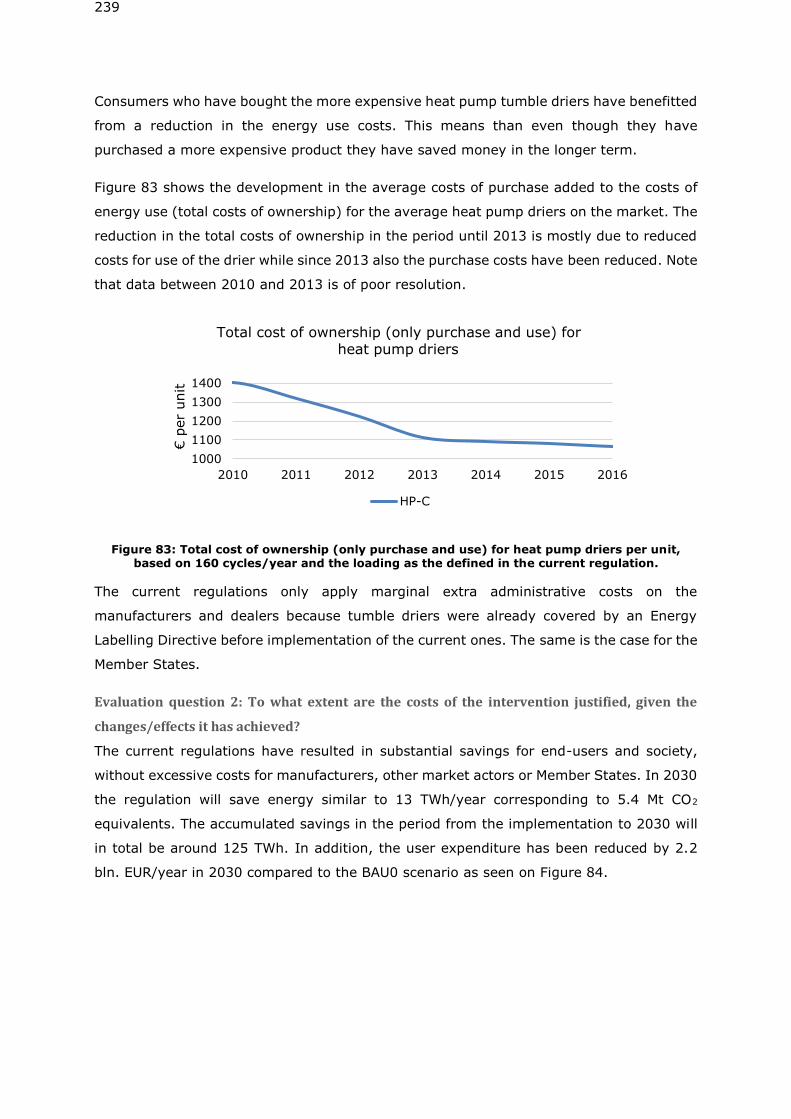
239
Consumers who have bought the more expensive heat pump tumble driers have benefitted
from a reduction in the energy use costs. This means than even though they have
purchased a more expensive product they have saved money in the longer term.
Figure 83 shows the development in the average costs of purchase added to the costs of
energy use (total costs of ownership) for the average heat pump driers on the market. The
reduction in the total costs of ownership in the period until 2013 is mostly due to reduced
costs for use of the drier while since 2013 also the purchase costs have been reduced. Note
that data between 2010 and 2013 is of poor resolution.
Figure 83: Total cost of ownership (only purchase and use) for heat pump driers per unit, based on 160 cycles/year and the loading as the defined in the current regulation.
The current regulations only apply marginal extra administrative costs on the
manufacturers and dealers because tumble driers were already covered by an Energy
Labelling Directive before implementation of the current ones. The same is the case for the
Member States.
Evaluation question 2: To what extent are the costs of the intervention justified, given the
changes/effects it has achieved?
The current regulations have resulted in substantial savings for end-users and society,
without excessive costs for manufacturers, other market actors or Member States. In 2030
the regulation will save energy similar to 13 TWh/year corresponding to 5.4 Mt CO2
equivalents. The accumulated savings in the period from the implementation to 2030 will
in total be around 125 TWh. In addition, the user expenditure has been reduced by 2.2
bln. EUR/year in 2030 compared to the BAU0 scenario as seen on Figure 84.
1000
1100
1200
1300
1400
2010 2011 2012 2013 2014 2015 2016
€ p
er
unit
Total cost of ownership (only purchase and use) for heat pump driers
HP-C
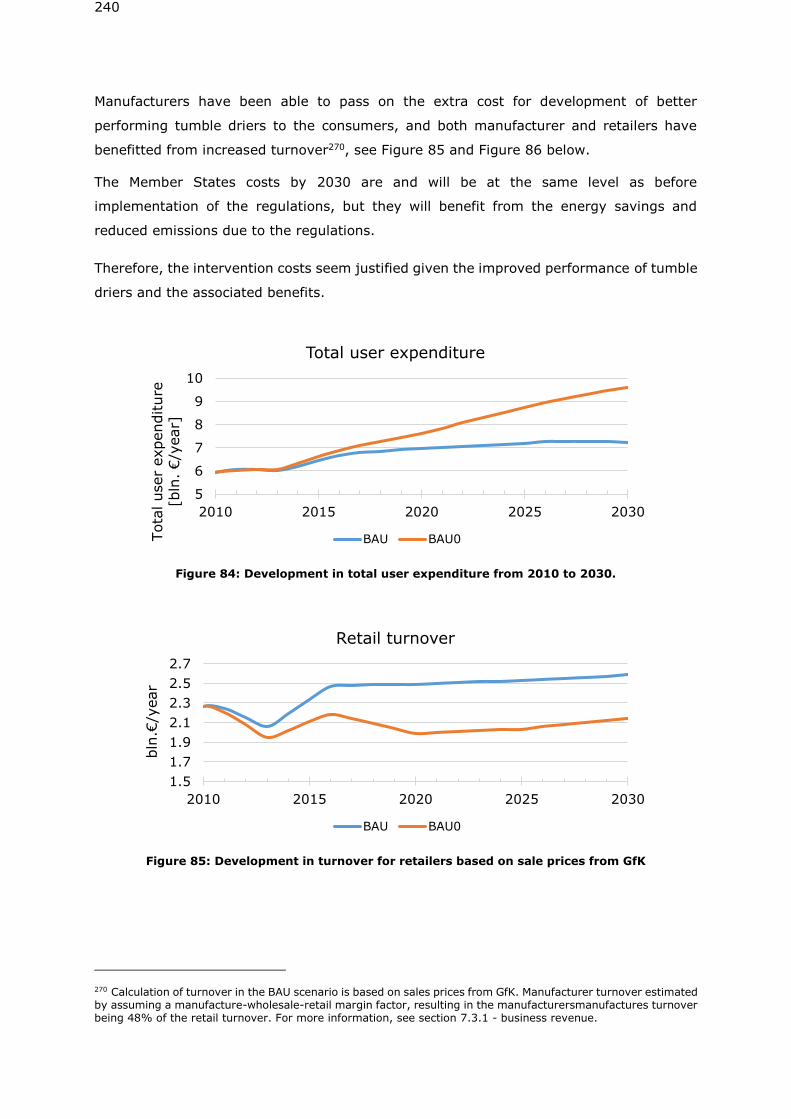
240
Manufacturers have been able to pass on the extra cost for development of better
performing tumble driers to the consumers, and both manufacturer and retailers have
benefitted from increased turnover270, see Figure 85 and Figure 86 below.
The Member States costs by 2030 are and will be at the same level as before
implementation of the regulations, but they will benefit from the energy savings and
reduced emissions due to the regulations.
Therefore, the intervention costs seem justified given the improved performance of tumble
driers and the associated benefits.
Figure 84: Development in total user expenditure from 2010 to 2030.
Figure 85: Development in turnover for retailers based on sale prices from GfK
270 Calculation of turnover in the BAU scenario is based on sales prices from GfK. Manufacturer turnover estimated by assuming a manufacture-wholesale-retail margin factor, resulting in the manufacturersmanufactures turnover being 48% of the retail turnover. For more information, see section 7.3.1 - business revenue.
5
6
7
8
9
10
2010 2015 2020 2025 2030
Tota
l user
expenditure
[b
ln. €/y
ear]
Total user expenditure
BAU BAU0
1.5
1.7
1.9
2.1
2.3
2.5
2.7
2010 2015 2020 2025 2030
bln
.€/y
ear
Retail turnover
BAU BAU0
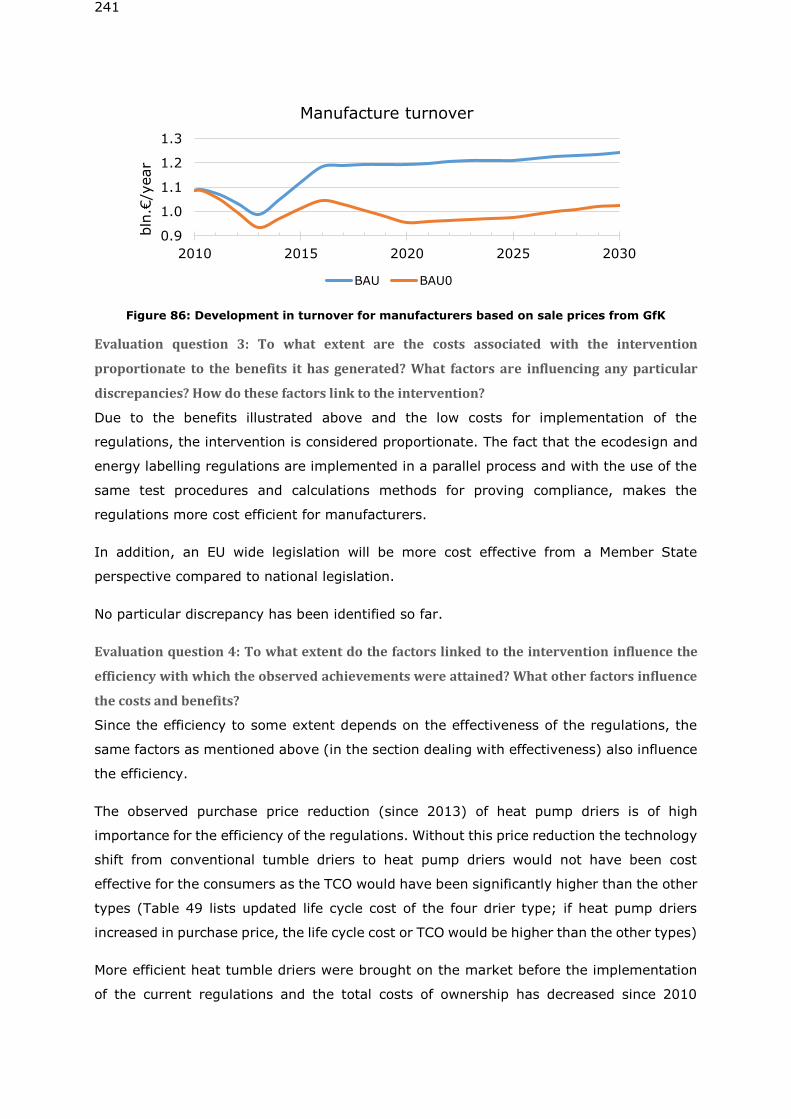
241
Figure 86: Development in turnover for manufacturers based on sale prices from GfK
Evaluation question 3: To what extent are the costs associated with the intervention
proportionate to the benefits it has generated? What factors are influencing any particular
discrepancies? How do these factors link to the intervention?
Due to the benefits illustrated above and the low costs for implementation of the
regulations, the intervention is considered proportionate. The fact that the ecodesign and
energy labelling regulations are implemented in a parallel process and with the use of the
same test procedures and calculations methods for proving compliance, makes the
regulations more cost efficient for manufacturers.
In addition, an EU wide legislation will be more cost effective from a Member State
perspective compared to national legislation.
No particular discrepancy has been identified so far.
Evaluation question 4: To what extent do the factors linked to the intervention influence the
efficiency with which the observed achievements were attained? What other factors influence
the costs and benefits?
Since the efficiency to some extent depends on the effectiveness of the regulations, the
same factors as mentioned above (in the section dealing with effectiveness) also influence
the efficiency.
The observed purchase price reduction (since 2013) of heat pump driers is of high
importance for the efficiency of the regulations. Without this price reduction the technology
shift from conventional tumble driers to heat pump driers would not have been cost
effective for the consumers as the TCO would have been significantly higher than the other
types (Table 49 lists updated life cycle cost of the four drier type; if heat pump driers
increased in purchase price, the life cycle cost or TCO would be higher than the other types)
More efficient heat tumble driers were brought on the market before the implementation
of the current regulations and the total costs of ownership has decreased since 2010
0.9
1.0
1.1
1.2
1.3
2010 2015 2020 2025 2030
bln
.€/y
ear
Manufacture turnover
BAU BAU0
242
because of decreased energy consumption in the use phase. But still the purchase price
was high and the sale low. The effect of the current label is that it has increased the sale
of heat pump driers and supported development of even more efficient heat pump driers.
In addition, the labelling regulation even before it was in force gave the manufacturers
confidence in an upcoming rising sale and was a driver for investments in innovation and
production capacity.
The reduction in the total costs of ownership before implementation of the current energy
label must also be assigned to the previous label even though it was not sufficient to make
a strong market pull for the most efficient tumble driers.
The consumer awareness is an important factor to ensure the efficiency of energy labelling
also in case of tumble driers. If the consumers were not aware of the energy label, tumble
driers with heat pump technology would not have had the necessary market advantage
compared to less efficient types of tumble driers on the market and the manufacturers
would not have been confident that it would be possible to increase the sale and return
their investments in the new technology.
The consumer awareness regarding the energy label is general high for white goods.
However, the consumer survey conducted by APPLiA has found that some consumers find
part of the label information unclear. This might to some extent reduce the efficiency of
the scheme.
Evaluation question 5: How proportionate were the costs of the intervention borne by different
stakeholder groups taking into account the distribution of the associated costs?
Manufacturers of tumble driers bear the largest share of the costs for development of more
efficient tumble driers (heat pump driers), but they have been able to pass the extra costs
on to the consumers, without increasing the total costs for end-users over the life time of
the products. As shown above the total costs of ownership for heat pump tumble driers
have decreased significantly due to the current regulation.
The end-users bear the costs for more expensive heat pump driers, but they are
compensated by saved electricity costs over the lifetime of the product.
In addition, it is important to bear in mind that it is voluntary for manufacturers to improve
the performance of tumble driers beyond the ecodesign requirements.
Evaluation question 6. Are there opportunities to simplify the legislation or reduce
unnecessary regulatory costs without undermining the intended objectives of the
intervention?
243
No possibilities for simplification have been identified so far.
Evaluation question 7. If there are significant differences in costs (or benefits) between
Member States, what is causing them? How do these differences link to the intervention?
Member State costs associated with the current regulations are primarily related to market
surveillance.
Even though all Member States have the same obligation to perform market surveillance
according to the regulations, the actual level of market surveillance varies between Member
States. The differences in market surveillance costs are not linked to the interventions but
rather to the priorities of Member States and limited budget for market surveillance.
Conclusions on efficiency
The evaluation assessment has shown that the benefits of the regulations outweigh their
costs, both for business, end-users and for society as a whole.
The manufacturers have invested in improvements of the products, but they have been
able to pass the costs on to the end-users. In addition, the manufacturers have benefitted
from an increased turnover compared to the situation without the regulations.
The increased performance for heat pump driers has resulted in increased purchase prices
for end-users, but this is offset by the energy savings, which result in larger savings over
the lifetime of the heat pump tumble driers i.e. lower total costs of ownership related to
purchase and use of the driers.
Member State costs associated with the regulation are primarily related to market
surveillance. In addition, the market surveillance costs will be reduced by establishing of
the product registration database for energy related products covered by energy labelling
regulations. However, the reduction of the market surveillance costs is not linked to the
current regulations but to the provisions in the new framework Regulation on labelling271.
7.1.4 Relevance
Evaluation question 1: To what extent is the intervention still relevant?
The objectives of the regulations were to reduce the energy consumption of tumble driers
and to increase the market share of energy efficient household tumble driers on the EU
market.
The objectives have to a large extent been fulfilled, but the regulations are still considered
relevant. There is still an untapped saving potential as the market share of the most energy
271 According the energy labelling framework regulation (EU) 2017/1369
244
efficient heat pump driers in 2016 were only 7%. In addition, some technology possibilities
to increase the efficiency of the top-class driers exist as described in task 4.
Without the energy labelling regulation, the consumers may not continue focusing on
buying more efficient tumble driers. That will reduce the manufacturers’ incentives to make
further improvements of tumble driers.
Evaluation question 2: To what extent have the (original) objectives proven to have been
appropriate for the intervention in question?
The original objectives have been appropriate and have resulted in a large increase of the
share of efficient/heat pump driers on the market and have additionally reduced the
purchase costs.
This means that the identified market failures have been corrected.
Evaluation question 3: How well do the (original) objectives of the intervention (still)
correspond to the needs within the EU?
The objectives regarding energy savings and increased energy efficiency are in line with
European policies such as the 2030 Climate and Energy Policy Framework, that sets targets
for greenhouse gas emissions and improvements of energy efficiency at European level for
the year 2030 (at least 40 % cuts in greenhouse gas emissions, and at least 27 %
improvement in energy efficiency)272. On 14 June 2018 the Commission, the Parliament
and the Council agreed on an even more ambitious energy efficiency target for the EU for
2030 of 32.5%, with a clause for an upwards revision by 2023273.
Evaluation question 4: How well adapted is the intervention to subsequent technological or
scientific advances?
In 2016, 14 % of heat pump driers on the market were in energy class A+++ and the
share has probably increased further. It could therefore be questioned how well the current
classification used for energy labelling scheme is able to take into account further
subsequent technological advances. There seems to be a need for a more ambitious
classification leaving the top-class empty. The review study will propose a rescaling of the
current A+++ to D scale to an A-G scale in order to align with the requirements of the
framework energy labelling regulation274.
272 2030 Climate and energy policy framework. Conclusion – 23/24 October 2014. EUCO 169/14. https://www.consilium.europa.eu/uedocs/cms_data/docs/pressdata/en/ec/145397.pdf 273 https://ec.europa.eu/energy/en/topics/energy-efficiency 274 https://eur-lex.europa.eu/legal-content/EN/TXT/PDF/?uri=CELEX:32017R1369&from=EN
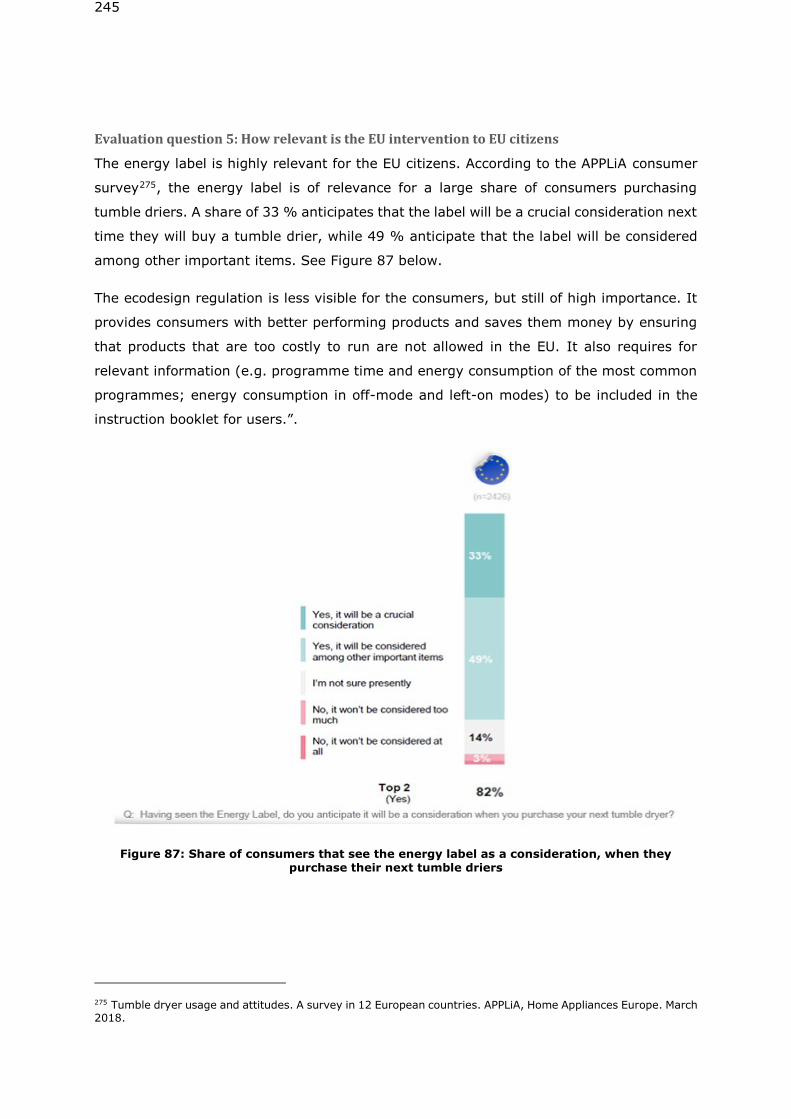
245
Evaluation question 5: How relevant is the EU intervention to EU citizens
The energy label is highly relevant for the EU citizens. According to the APPLiA consumer
survey275, the energy label is of relevance for a large share of consumers purchasing
tumble driers. A share of 33 % anticipates that the label will be a crucial consideration next
time they will buy a tumble drier, while 49 % anticipate that the label will be considered
among other important items. See Figure 87 below.
The ecodesign regulation is less visible for the consumers, but still of high importance. It
provides consumers with better performing products and saves them money by ensuring
that products that are too costly to run are not allowed in the EU. It also requires for
relevant information (e.g. programme time and energy consumption of the most common
programmes; energy consumption in off-mode and left-on modes) to be included in the
instruction booklet for users.”.
Figure 87: Share of consumers that see the energy label as a consideration, when they purchase their next tumble driers
275 Tumble dryer usage and attitudes. A survey in 12 European countries. APPLiA, Home Appliances Europe. March 2018.
246
Conclusion on relevance
The regulations continue to be relevant for reducing the energy consumption of tumble
driers and contribute to achieve the EU energy efficiency targets.
The energy labelling regulation has created an effective market pull and has increased the
market share of heat pump driers and at the same time reduced the price below the LLCC
level.
Furthermore, consumers find the label relevant and a large share anticipate that they will
consider the information on the label next time they would buy a tumble drier.
7.1.5 Conclusion Evaluation
The evaluation of the current regulations shows that they have contributed to substantial
energy saving and environmental benefits without extra costs for end-users,
manufacturers and the society as a whole. Especially the energy labelling regulation have
been able to create a market pull for increasing the market share of heat pump driers and
drive forward the market transformation from conventional heating element driers to heat
pump driers.
However, some aspects can still be improved:
• The sale of the tumble driers in energy class A+++ is still rather low, indicating that
the current label lack incentive for promotion of the most energy efficient tumble
driers
• There are still inefficient models on the market
• Consumers find some of the information on the current label unclear especially the
information regarding the annual energy consumption
In addition, rescaling of the labelling is required according to the new energy labelling
framework regulation276.
7.2 Policy analysis
The policy analysis is based on data obtained from three sources:
• Main conclusions from analyses performed in previous tasks (1 to 6).
• Independent research by the study team (using publicly available materials).
• Input from stakeholders, including manufacturers, non-governmental
organisations, standardisation committees and Member States.
276 According the energy labelling framework regulation (EU) 2017/1369
247
7.2.1 Stakeholders consultation
During the entire study, the study team has maintained a dialog with different
stakeholders.
Two stakeholders’ meetings were held, the first meeting on the 26th of June 2018 and the
second on the 4th of December 2018. Experts from Member States, testing facilities,
consumer and environmental organisations and manufacturers provided input to the draft
interim and final reports which included tasks 1 to 4 and 1 to 7 respectively. Input was
received from:
• APPLiA – Home Appliance Europe277
• CENELEC TC59X SWG1.9
• Join input from ECOS278, EEB279 and Coolproducts280
• BSH281
• Samsung282
• Test Aankoop283
Their comments and answers from the study team are found in Annexes VII and X, and
they have been incorporated in this final report.
Previous to these meetings, a dialogue was established with APPLiA where input to the first
four tasks was provided. A first telephone meeting was arranged in November 2017 to
introduce the aims of this review study and the study team, and a follow-up face-to-face
(FtF) meeting was held in Brussels where the study team presented data for the first two
tasks to collect APPLiA’s input and provided input to APPLiA’s consumer survey that was
used by the study team to carry out task 3 and the evaluation of the impact of existing
regulation.
Telephone and FtF meetings have taken place with some individual manufacturers who
have provided input to the first four tasks.
7.2.2 Policy measures
The following policy options have been considered for the policy scenarios:
• No action (‘Business-as-Usual’, BAU)
• Self-regulation
277 https://www.applia-europe.eu/ 278 http://ecostandard.org/ 279 http://eeb.org/tag/ecodesign/ 280 https://www.coolproducts.eu/ 281 https://www.bsh-group.com/ 282 https://www.samsung.com/us/home-appliances/ 283 https://www.test-aankoop.be/
248
• Ecodesign measures
• Energy labelling
No action (‘Business-as-Usual’, BAU)
If no new action is taken, the existing Ecodesign Regulation 932/2012 and Energy Labelling
Regulation 392/2012 for household tumble driers remain in force, leading to the previously
estimated 13.2 TWh energy savings in 2030284 in comparison to BAU0 scenario, due to the
combined implementation of ecodesign and energy labelling policy measures.
Tasks 1 to 6 of this review study show that the two regulations in force have worked on
pushing and pulling the EU market towards more efficient household tumble driers, in
particular the Energy Labelling Regulation. However, further improvement opportunities
exist offered by existing BAT. Moreover, this review study has shown that inefficient models
are still found on the EU market that could be beneficially addressed by reviewed ecodesign
requirements. Furthermore, according to the framework Energy Labelling Regulation
published last year, existing energy labels are to be rescaled.
‘No action’ is not an option. Overall, it is recommended to take action and review existing
regulations for tumble driers. BAU is used as a baseline to establish the potential savings,
costs and impacts to consumers, industry and employment.
Self-regulation
In Art. 15.3 b) of the Ecodesign Directive 2009/125/EC, self-regulation, including voluntary
agreements offered as unilateral commitments by industry, is indicated as a preferred
option. However, this is subject to certain conditions stipulated in Article 17 and Annex
VIII to the Directive (e.g. market coverage by signatories, ambition level, etc.).
These conditions are not fulfilled for household tumble driers: none of the relevant
stakeholders expressed interest in self-regulation and the minimum market coverage will
not be met because the risk of ‘free-riders’.
Consequently, self-regulation has not further been considered as policy option.
Ecodesign
The Ecodesign Regulation 932/2012 in force has made a positive impact as presented in
section 7.1. However, further improvement opportunities exist as presented in previous
tasks.
There is currently a big gap between heat pump condenser tumble driers and heating
element tumble driers (both condenser and air-vented) in terms of energy efficiency,
284 Based on the user behaviorbehaviour parameters in the current regulation.
249
annual and specific energy consumption and condensation efficiency, where heating
element driers are far more inefficient. More heat pump driers have appeared on the EU
market and the trends indicate that the market coverage of heat pump driers will continue
increasing until this technology becomes dominant. However, heating element driers will
most likely continue to exist. They also present improvement opportunities as presented
in task 6, especially condenser driers. Gas-fired air-vented driers do not show significant
improvement potentials concerning energy efficiency but there is no indication that shows
they will disappear from the EU market285.
It is therefore proposed to review the current ecodesign requirements to take out of the
market the least efficient models and to reflect the current and future technological
progress and market trends. This review takes the opportunity to introduce resource
efficiency requirements as discussed in previous tasks.
Details about proposed ecodesign policy options are presented in section 7.2.3.
Energy Labelling
As presented in section 7.1 the Energy Labelling Regulation 392/2012 has made a positive
impact.
The effect from the regulation on energy efficiency and annual energy consumption is clear,
as shown in section 2.3.2. This effect is seen primarily on condenser driers, and particularly
for heat pump driers. Condenser tumble driers had 85% of the EU market which is expected
to grow to 89% in 2020 (see Table 9).
99% of heat pump condenser driers on the EU market are above energy class A (in 2016),
while heating element driers (both condenser and air-vented) have remained in energy
class B and C. A small development is seen in heating element condenser driers, while
heating element air-vented driers have remained more or less in the same classes as it
has been shown in section 2.3.2 (see Figure 19 and Figure 20).
Using the opportunity of rescaling, energy classes could be adjusted to reflect the current
market which evidently has evolved since the Energy Labelling came into force. Moreover,
other aspects related to consumer use and understanding can be incorporated to make the
label easier to understand by consumer at the time of purchase.
It is therefore proposed to review the current energy label to grab the existing potential
for cost effective technological improvement and to reflect the current and future
285 Although input from relevant stakeholders on these driers has been quite limited so care should be taken on drawing final conclusions
250
technological progress and market trends. Details about proposed energy labelling policy
options are presented in section 7.2.3.
7.2.3 Proposed policy options incl. barriers and opportunities
Using information gathered in previous tasks, this section presents an overview of the
selected policy options to be investigated under the scenario analyses. The policy options
have been developed using the design options in task 6 as starting point, in particular
those presenting the Least Life Cycle Cost (LLCC) and the largest environmental benefits.
Moreover, other aspects to be reviewed in current regulations have been integrated in the
policy options. These are described in the next two sections.
Real life use of tumble driers
The information gathered in previous tasks indicates that some of the parameters in the
tumble drier regulations reflecting the consumer behaviour are no longer valid. In task 3
an overview was presented of the difference of the parameter values used in the
regulations and current real use values (see Table 44).
In order to reflect real use, the scenario analyses show consumption and emissions values
using real use values, in particular regarding loading and cycles per year.
The calculation of annual energy consumption in the regulation is no longer relevant as the
number of cycles per year used in the regulations is too high compared to new data, and
because the amount of laundry dried per cycle is not assumed to be correlated with the
rated capacity as currently assumed in the regulations. At the first stakeholder meeting it
was shown that the total annual energy consumption of household tumble driers by 2020
will be less than half of what was initially estimated using standard values from the current
regulations. In addition to this, values on annual energy consumption can be difficult to
interpret by consumers since they are not aware of the number of times they use the
appliance every year. It is thus proposed to show the energy consumption information in
the label per cycle rather than per annum. This is also in line with proposed requirements
for washing machines. Indication of energy consumption per cycle would require that the
Energy Efficiency Index (EEI) is also calculated per cycle.
In order to do this, a new standard energy consumption (SEc)286 value is needed as
reference to the EEI calculation. The APPLiA 2018 model database (provided by APPLiA to
the study team) is used as data reference, as it is the only source available with values
related to energy consumption, capacity, cycle time, and condensation efficiencies. Note
however that this data is model based, and not sales-weighted. The sales data from GfK
286 Currently used to determine the Energy Efficiency Index (EEI) as EEI = AEc/SAEc x 100
251
(presented in Task 2) is thus used to weight the different tumble drier types, in order
represent both marked forces and technological progress.
The current formula to estimate the weighted287 energy consumption per cycle (Etc), and
the weighted cycle time (Tt), calculates these values based on 3 cycles with full load, and
4 cycles with half-load cycles. It thus assumes that the average cycle is loaded with ~71%
of the rated capacity of the tumble drier.
In order to better reflect the average load found in the APPLiA consumer study found to be
62% of the rated capacity, subsequent figures, tables and chapters will use a loading factor
of 62% to estimate the weighted energy consumption. The proposed new formula for
calculating the weighted energy consumption per cycle is:
𝐸𝑡𝑐 = 0.24 × 𝐸𝑑𝑟𝑦 + 0.76 × 𝐸𝑑𝑟𝑦½ 288
With:
- Edry being the average energy consumption at full load for the standard cotton
program [kWh]
- Edry½ being the average energy consumption at partial (half) load for the standard
cotton program [kWh]
Currently, the differences in weighted energy consumption per cycle between driers with
and without heat pumps as heating technology is very significant, whereas the difference
between condensers and air-vented driers with heating elements is very small. This means
two distinct groups exists when looking at the EEI distribution and/or the weighted energy
consumption per cycle. Figure 88 lists the weighted energy consumption per cycle as a
function of the rated capacity per drier type, where the gap between the technologies can
be seen.
287 “Weighted” refers in this case to the weighing between the energy consumption at full load, and the energy consumption at half/partial load. 288 24% ∗ 1 + 76% ∗ 0.5 = 62%
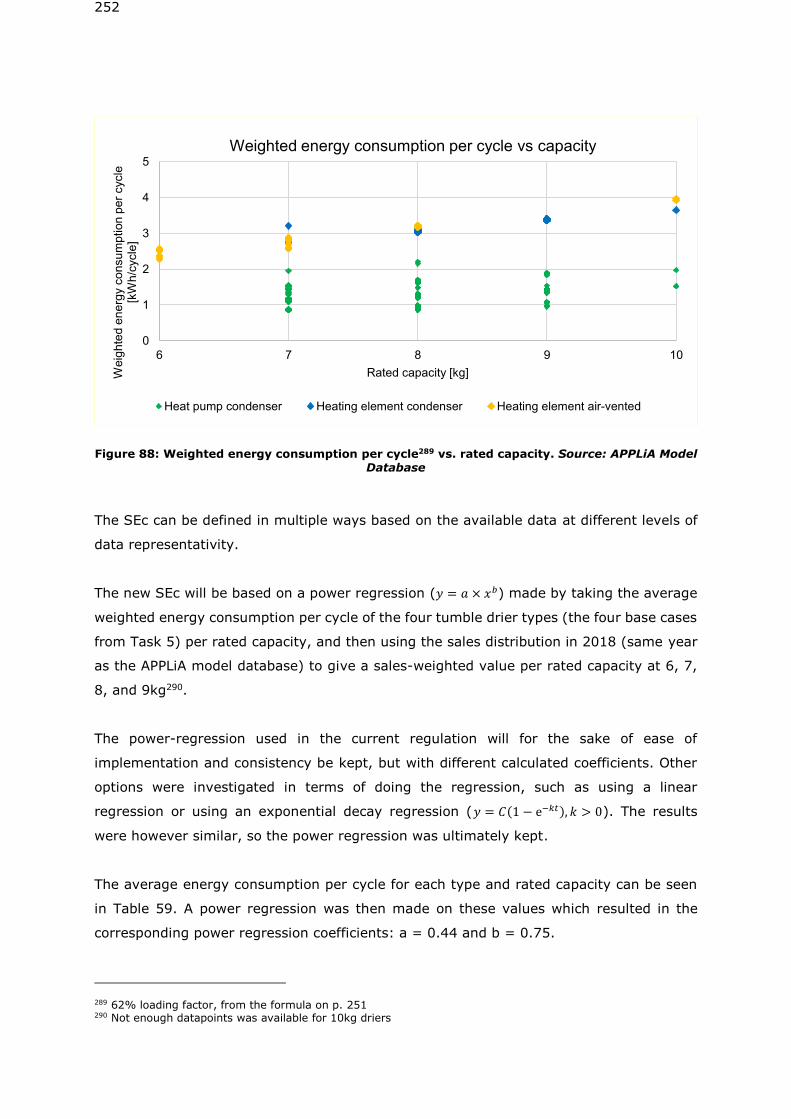
252
Figure 88: Weighted energy consumption per cycle289 vs. rated capacity. Source: APPLiA Model Database
The SEc can be defined in multiple ways based on the available data at different levels of
data representativity.
The new SEc will be based on a power regression (𝑦 = 𝑎 × 𝑥𝑏) made by taking the average
weighted energy consumption per cycle of the four tumble drier types (the four base cases
from Task 5) per rated capacity, and then using the sales distribution in 2018 (same year
as the APPLiA model database) to give a sales-weighted value per rated capacity at 6, 7,
8, and 9kg290.
The power-regression used in the current regulation will for the sake of ease of
implementation and consistency be kept, but with different calculated coefficients. Other
options were investigated in terms of doing the regression, such as using a linear
regression or using an exponential decay regression (𝑦 = 𝐶(1 − e−𝑘𝑡), 𝑘 > 0). The results
were however similar, so the power regression was ultimately kept.
The average energy consumption per cycle for each type and rated capacity can be seen
in Table 59. A power regression was then made on these values which resulted in the
corresponding power regression coefficients: a = 0.44 and b = 0.75.
289 62% loading factor, from the formula on p. 251 290 Not enough datapoints was available for 10kg driers
0
1
2
3
4
5
6 7 8 9 10
Weig
hte
d e
ne
rgy c
on
su
mp
tion
pe
r cycle
[k
Wh
/cycle
]
Rated capacity [kg]
Weighted energy consumption per cycle vs capacity
Heat pump condenser Heating element condenser Heating element air-vented
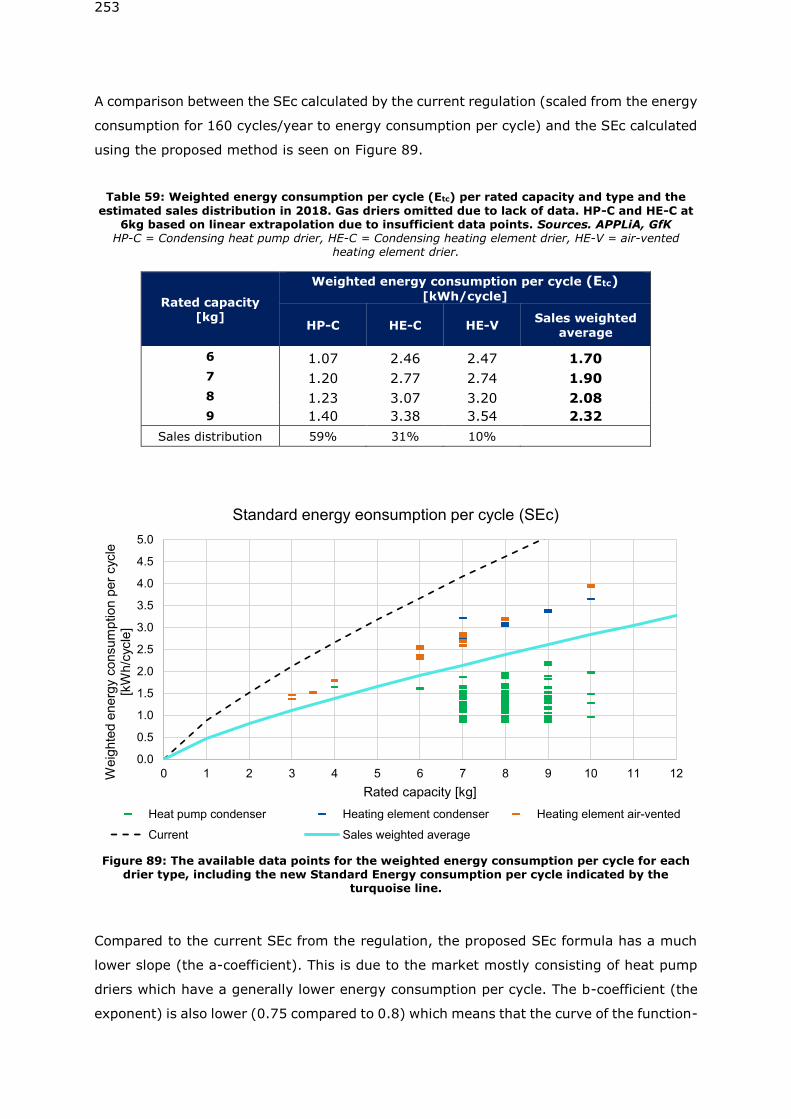
253
A comparison between the SEc calculated by the current regulation (scaled from the energy
consumption for 160 cycles/year to energy consumption per cycle) and the SEc calculated
using the proposed method is seen on Figure 89.
Table 59: Weighted energy consumption per cycle (Etc) per rated capacity and type and the
estimated sales distribution in 2018. Gas driers omitted due to lack of data. HP-C and HE-C at 6kg based on linear extrapolation due to insufficient data points. Sources. APPLiA, GfK
HP-C = Condensing heat pump drier, HE-C = Condensing heating element drier, HE-V = air-vented heating element drier.
Rated capacity [kg]
Weighted energy consumption per cycle (Etc)
[kWh/cycle]
HP-C HE-C HE-V Sales weighted
average
6 1.07 2.46 2.47 1.70
7 1.20 2.77 2.74 1.90
8 1.23 3.07 3.20 2.08
9 1.40 3.38 3.54 2.32
Sales distribution 59% 31% 10%
Figure 89: The available data points for the weighted energy consumption per cycle for each drier type, including the new Standard Energy consumption per cycle indicated by the
turquoise line.
Compared to the current SEc from the regulation, the proposed SEc formula has a much
lower slope (the a-coefficient). This is due to the market mostly consisting of heat pump
driers which have a generally lower energy consumption per cycle. The b-coefficient (the
exponent) is also lower (0.75 compared to 0.8) which means that the curve of the function-
0.0
0.5
1.0
1.5
2.0
2.5
3.0
3.5
4.0
4.5
5.0
0 1 2 3 4 5 6 7 8 9 10 11 12Weig
hte
d e
nerg
y c
onsum
ption p
er
cycle
[k
Wh/c
ycle
]
Rated capacity [kg]
Standard energy eonsumption per cycle (SEc)
Heat pump condenser Heating element condenser Heating element air-vented
Current Sales weighted average
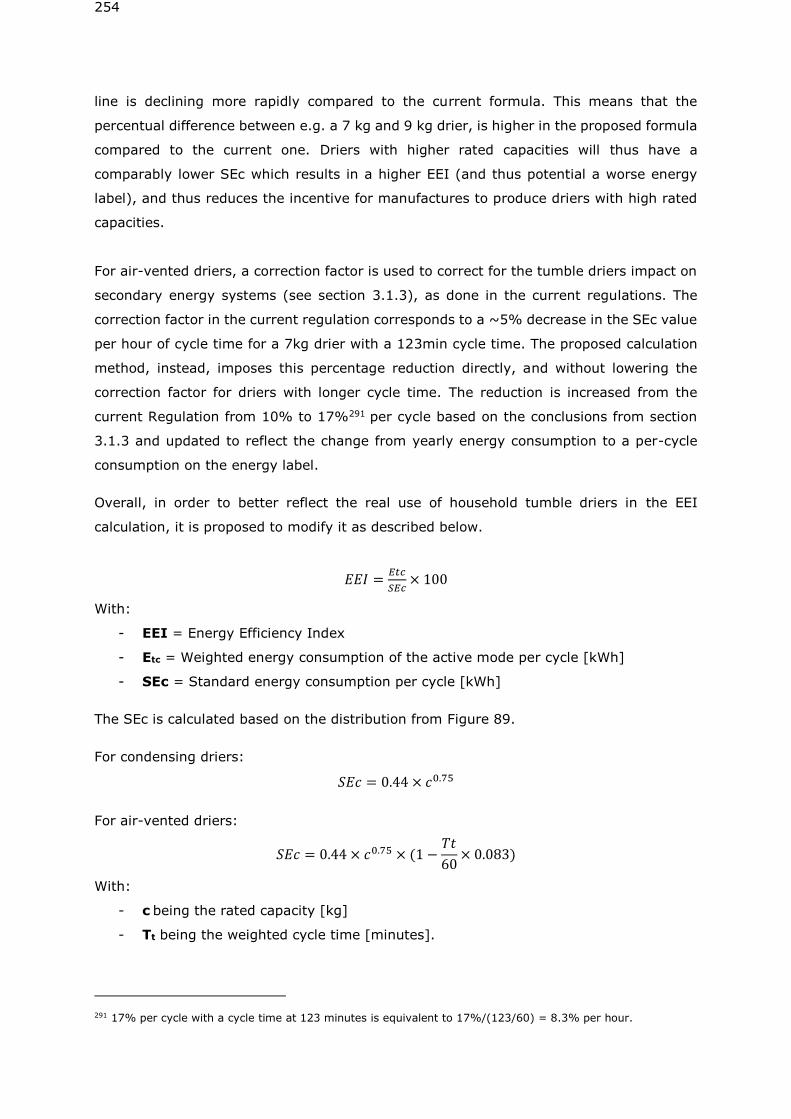
254
line is declining more rapidly compared to the current formula. This means that the
percentual difference between e.g. a 7 kg and 9 kg drier, is higher in the proposed formula
compared to the current one. Driers with higher rated capacities will thus have a
comparably lower SEc which results in a higher EEI (and thus potential a worse energy
label), and thus reduces the incentive for manufactures to produce driers with high rated
capacities.
For air-vented driers, a correction factor is used to correct for the tumble driers impact on
secondary energy systems (see section 3.1.3), as done in the current regulations. The
correction factor in the current regulation corresponds to a ~5% decrease in the SEc value
per hour of cycle time for a 7kg drier with a 123min cycle time. The proposed calculation
method, instead, imposes this percentage reduction directly, and without lowering the
correction factor for driers with longer cycle time. The reduction is increased from the
current Regulation from 10% to 17%291 per cycle based on the conclusions from section
3.1.3 and updated to reflect the change from yearly energy consumption to a per-cycle
consumption on the energy label.
Overall, in order to better reflect the real use of household tumble driers in the EEI
calculation, it is proposed to modify it as described below.
𝐸𝐸𝐼 =𝐸𝑡𝑐
𝑆𝐸𝑐× 100
With:
- EEI = Energy Efficiency Index
- Etc = Weighted energy consumption of the active mode per cycle [kWh]
- SEc = Standard energy consumption per cycle [kWh]
The SEc is calculated based on the distribution from Figure 89.
For condensing driers:
𝑆𝐸𝑐 = 0.44 × 𝑐0.75
For air-vented driers:
𝑆𝐸𝑐 = 0.44 × 𝑐0.75 × (1 −𝑇𝑡
60× 0.083)
With:
- c being the rated capacity [kg]
- Tt being the weighted cycle time [minutes].
291 17% per cycle with a cycle time at 123 minutes is equivalent to 17%/(123/60) = 8.3% per hour.
255
The weighted energy consumption per cycle will, as mentioned, be based on a 62% loading
factor. The proposed formula is:
𝐸𝑡𝑐 = 0.24 × 𝐸𝑑𝑟𝑦 + 0.76 × 𝐸𝑑𝑟𝑦½ 292
With:
- Edry being the average energy consumption at full load for the standard cotton
program [kWh]
- Edry½ being the average energy consumption at partial (half) load for the standard
cotton program [kWh]
Note that no change of the current test method is proposed, only the weighing of the
energy consumption per load.
The same is done for the formula to estimate the average cycle time:
𝑇𝑡 = 0.24 × 𝑇𝑑𝑟𝑦 + 0.76 × 𝑇𝑑𝑟𝑦½
With:
- Tdry being the average cycle time at full load for the standard cotton program
[kWh]
- Tdry½ being the average energy consumption at partial (half) load for the standard
cotton program [kWh]
Similarly, for the condensation efficiency:
𝐶𝑡 = 0.24 × 𝐶𝑑𝑟𝑦 + 0.76 × 𝑇𝐶𝑑𝑟𝑦½
With:
- Cdry being the average condensation efficiency at full load for the standard cotton
program [-]
- Cdry½ being the average condensation efficiency at partial load for the standard
cotton program [-]
These modifications are developed to ensure that calculation methods better reflect the
real use.
For gas-fired driers, the calculation of EEI follows the same methodology. The energy
consumption per cycle at full and half load (𝐸𝑑𝑟𝑦 , 𝐸𝑑𝑟𝑦½) is here defined as:
𝐸𝑑𝑟𝑦 =𝐸𝑔𝑑𝑟𝑦
𝑓𝑔+ 𝐸𝑔𝑑𝑟𝑦,𝑎
292 24% ∗ 1 + 76% ∗ 0.5 = 62%
256
𝐸𝑑𝑟𝑦½ =𝐸𝑔𝑑𝑟𝑦½
𝑓𝑔+ 𝐸𝑔𝑑𝑟𝑦½,𝑎
With
- Egdry being the gas consumption at full load for the standard cotton program [kWh]
- Egdry½ being the gas consumption at partial load for the standard cotton program
[kWh]
- Egdry,a being the auxiliary electricity consumption at full load of the standard cotton
program [kWh]
- Egdry,a being the auxiliary electricity consumption at partial load of the standard
cotton program [kWh]
- fg being a conversion factor between primary energy and electricity. Currently, this
factor is 2.5. This factor is changed to 2.1293 to better reflect the average EU
electricity generation efficiency.
The correction factor for air-vented driers when calculating the SEc also applies for gas
driers.
Low power modes
Power consumption requirements for low power modes are not included in the current
regulations. Instead, their consumption is integrated in the formula to calculate the annual
energy consumption. However, it is proposed to remove these modes from the calculation
of the energy consumption per cycle and instead include requirements for low power modes
in the ecodesign regulation. Subsequently, this means removing tumble driers from the
horizontal standby regulation.
Having requirements instead of integrating low power modes into the calculation of the
energy consumption per cycle is considered more relevant because their contribution to
the annual energy consumption is very low, and it will ensure that tumble driers remain
efficient even when not active.
The proposed requirements, which are very similar to those proposed for washing
machines, are as it follows:
(a) Household tumble driers shall have an off-mode or a stand-by mode or both. The
power consumption of these modes shall not exceed 0.50W.
293 Based on information from the Commission and “Evaluation of primary energy factor calculation options for electricity, Anke Esser (FhG-ISI), Frank Sensfuss (FhG-ISI), 2016”
257
(b) If the stand-by mode includes the display of information or status, the power
consumption of the stand-by mode shall not exceed 1.00W.
(c) If the stand-by mode provides for a connection to a network and provides networked
stand-by as defined in Commission Regulation (EU) No 801/2013 294 , the power
consumption of this mode shall not exceed 2.00W.
(d) At the latest 15 minutes after the household tumble drier has been switched on or
after the end of any programme and associated activities or after interruption of the wrinkle
guard function or after any other interaction with the household tumble drier, if no other
mode, including emergency measures, is triggered, the household tumble drier shall switch
automatically to off-mode or standby mode.
(h) If the household tumble drier provides for a delay start, the power consumption of
this condition, including any standby mode, shall not exceed 4.00 W. The delay start shall
not be programmable by the user for more than 24 h.
(i) Any household tumble drier that can be connected to a network shall provide the
possibility to activate and deactivate the network connection(s). The network connection(s)
shall be deactivated by default.
All definitions of the different power modes marked in red, are proposed to follow the same
definitions as in the washing machines working documents. They will be harmonised once
the latest versions of these working documents are available. Else they will be integrated
in the draft working documents for the Consultation Forum.
Proposed Policy Options (PO)
Four policy options have been developed to reflect the progress in technical innovation
since the adoption of the current regulation and that can provide potential environmental
savings as presented in task 6. In addition, the proposed policy options are to give
consumers access to better information in order to increase potential savings. An overview
of policy options is presented in Table 60, including implementation dates and a brief
overview of their opportunities and barriers.
A later implementation of the Ecodesign energy requirements than of the Energy Labelling
requirements is proposed. This is to ensure a transition period where manufacturers get
familiar with the new rescaling and energy efficiency calculations, which are different to
current ones. Also, this will facilitate the verification process, since the proposed Ecodesign
294 Commission Regulation (EU) No 801/2013 of 22 August 2013 amending Regulation (EC) No 1275/2008 with regard to ecodesign requirements for standby, off mode electric power consumption of electrical and electronic household and office equipment, and amending Regulation (EC) No 642/2009 with regard to ecodesign requirements for televisions
258
energy requirements will be linked to specific class interval limits (more details in section
7.3.3). This transition period is not deemed necessary for the proposed resource efficiency
requirements.
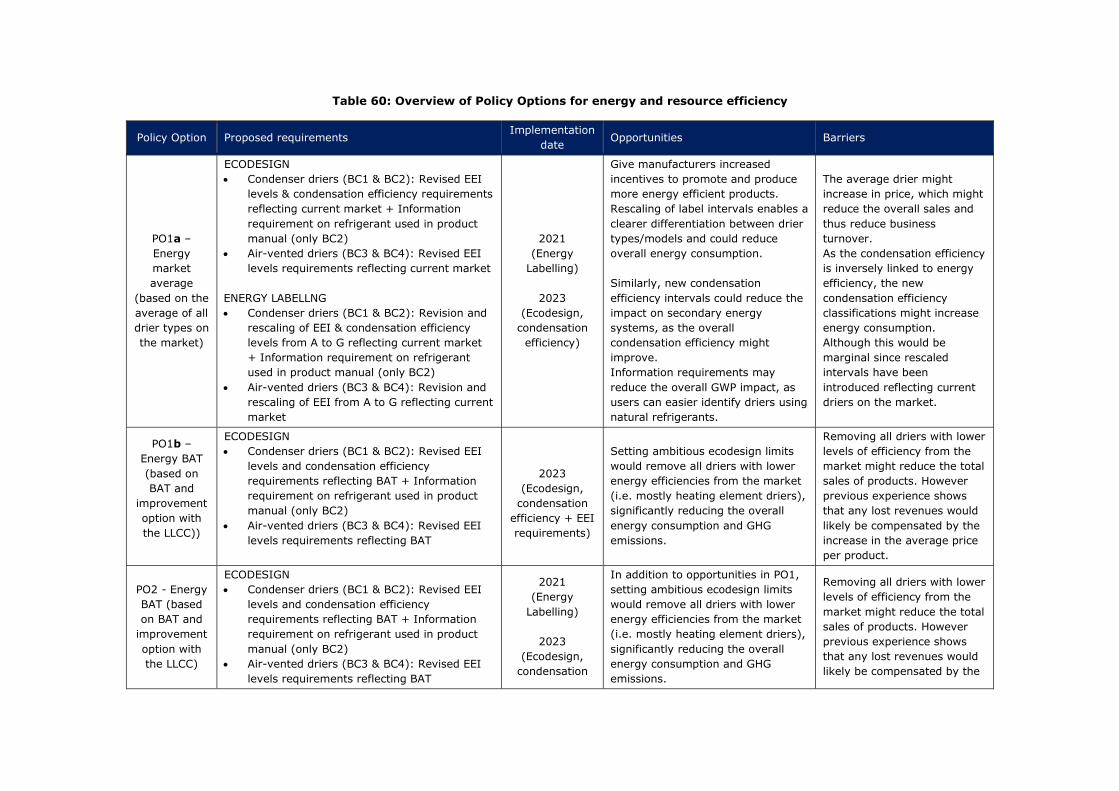
Table 60: Overview of Policy Options for energy and resource efficiency
Policy Option Proposed requirements Implementation
date Opportunities Barriers
PO1a –
Energy
market
average
(based on the
average of all
drier types on
the market)
ECODESIGN
• Condenser driers (BC1 & BC2): Revised EEI
levels & condensation efficiency requirements
reflecting current market + Information
requirement on refrigerant used in product
manual (only BC2)
• Air-vented driers (BC3 & BC4): Revised EEI
levels requirements reflecting current market
ENERGY LABELLNG
• Condenser driers (BC1 & BC2): Revision and
rescaling of EEI & condensation efficiency
levels from A to G reflecting current market
+ Information requirement on refrigerant
used in product manual (only BC2)
• Air-vented driers (BC3 & BC4): Revision and
rescaling of EEI from A to G reflecting current
market
2021
(Energy
Labelling)
2023
(Ecodesign,
condensation
efficiency)
Give manufacturers increased
incentives to promote and produce
more energy efficient products.
Rescaling of label intervals enables a
clearer differentiation between drier
types/models and could reduce
overall energy consumption.
Similarly, new condensation
efficiency intervals could reduce the
impact on secondary energy
systems, as the overall
condensation efficiency might
improve.
Information requirements may
reduce the overall GWP impact, as
users can easier identify driers using
natural refrigerants.
The average drier might
increase in price, which might
reduce the overall sales and
thus reduce business
turnover.
As the condensation efficiency
is inversely linked to energy
efficiency, the new
condensation efficiency
classifications might increase
energy consumption.
Although this would be
marginal since rescaled
intervals have been
introduced reflecting current
driers on the market.
PO1b –
Energy BAT
(based on
BAT and
improvement
option with
the LLCC))
ECODESIGN
• Condenser driers (BC1 & BC2): Revised EEI
levels and condensation efficiency
requirements reflecting BAT + Information
requirement on refrigerant used in product
manual (only BC2)
• Air-vented driers (BC3 & BC4): Revised EEI
levels requirements reflecting BAT
2023
(Ecodesign,
condensation
efficiency + EEI
requirements)
Setting ambitious ecodesign limits
would remove all driers with lower
energy efficiencies from the market
(i.e. mostly heating element driers),
significantly reducing the overall
energy consumption and GHG
emissions.
Removing all driers with lower
levels of efficiency from the
market might reduce the total
sales of products. However
previous experience shows
that any lost revenues would
likely be compensated by the
increase in the average price
per product.
PO2 - Energy
BAT (based
on BAT and
improvement
option with
the LLCC)
ECODESIGN
• Condenser driers (BC1 & BC2): Revised EEI
levels and condensation efficiency
requirements reflecting BAT + Information
requirement on refrigerant used in product
manual (only BC2)
• Air-vented driers (BC3 & BC4): Revised EEI
levels requirements reflecting BAT
2021
(Energy
Labelling)
2023
(Ecodesign,
condensation
In addition to opportunities in PO1,
setting ambitious ecodesign limits
would remove all driers with lower
energy efficiencies from the market
(i.e. mostly heating element driers),
significantly reducing the overall
energy consumption and GHG
emissions.
Removing all driers with lower
levels of efficiency from the
market might reduce the total
sales of products. However
previous experience shows
that any lost revenues would
likely be compensated by the
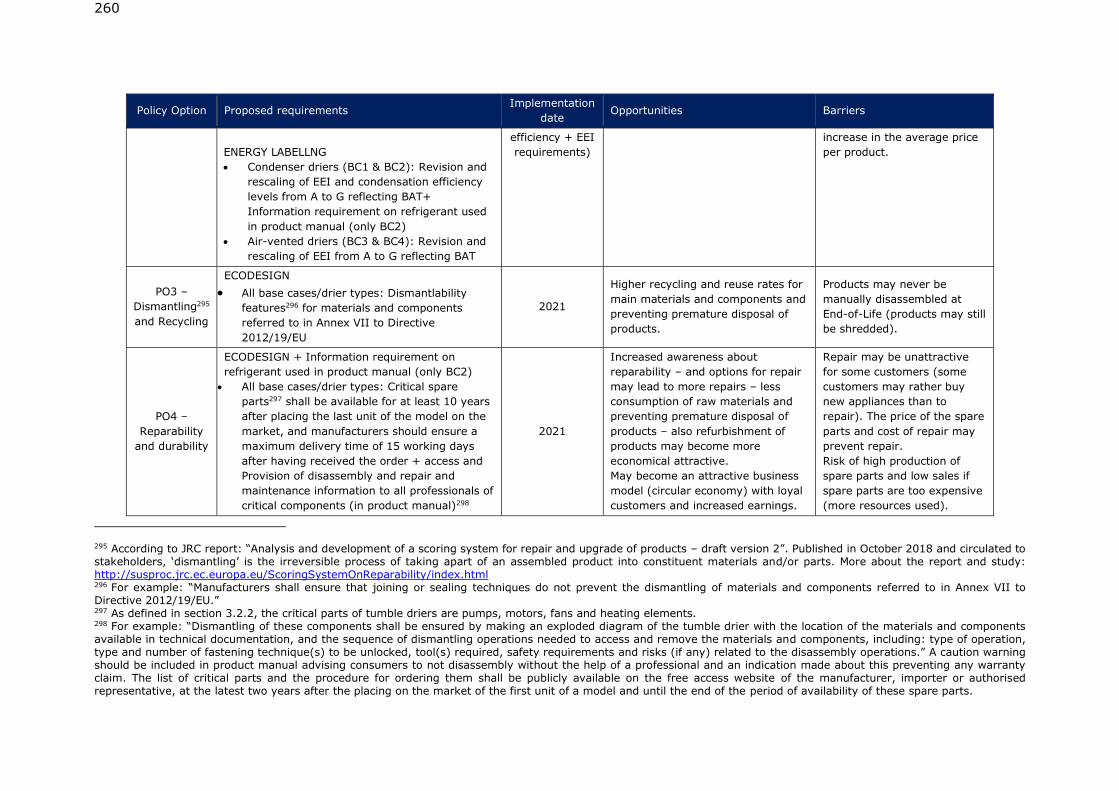
260
Policy Option Proposed requirements Implementation
date Opportunities Barriers
ENERGY LABELLNG
• Condenser driers (BC1 & BC2): Revision and
rescaling of EEI and condensation efficiency
levels from A to G reflecting BAT+
Information requirement on refrigerant used
in product manual (only BC2)
• Air-vented driers (BC3 & BC4): Revision and
rescaling of EEI from A to G reflecting BAT
efficiency + EEI
requirements)
increase in the average price
per product.
PO3 –
Dismantling295
and Recycling
ECODESIGN
• All base cases/drier types: Dismantlability
features296 for materials and components
referred to in Annex VII to Directive
2012/19/EU
2021
Higher recycling and reuse rates for
main materials and components and
preventing premature disposal of
products.
Products may never be
manually disassembled at
End-of-Life (products may still
be shredded).
PO4 –
Reparability
and durability
ECODESIGN + Information requirement on
refrigerant used in product manual (only BC2)
• All base cases/drier types: Critical spare
parts297 shall be available for at least 10 years
after placing the last unit of the model on the
market, and manufacturers should ensure a
maximum delivery time of 15 working days
after having received the order + access and
Provision of disassembly and repair and
maintenance information to all professionals of
critical components (in product manual)298
2021
Increased awareness about
reparability – and options for repair
may lead to more repairs – less
consumption of raw materials and
preventing premature disposal of
products – also refurbishment of
products may become more
economical attractive.
May become an attractive business
model (circular economy) with loyal
customers and increased earnings.
Repair may be unattractive
for some customers (some
customers may rather buy
new appliances than to
repair). The price of the spare
parts and cost of repair may
prevent repair.
Risk of high production of
spare parts and low sales if
spare parts are too expensive
(more resources used).
295 According to JRC report: “Analysis and development of a scoring system for repair and upgrade of products – draft version 2”. Published in October 2018 and circulated to stakeholders, ‘dismantling’ is the irreversible process of taking apart of an assembled product into constituent materials and/or parts. More about the report and study: http://susproc.jrc.ec.europa.eu/ScoringSystemOnReparability/index.html 296 For example: “Manufacturers shall ensure that joining or sealing techniques do not prevent the dismantling of materials and components referred to in Annex VII to Directive 2012/19/EU.” 297 As defined in section 3.2.2, the critical parts of tumble driers are pumps, motors, fans and heating elements. 298 For example: “Dismantling of these components shall be ensured by making an exploded diagram of the tumble drier with the location of the materials and components available in technical documentation, and the sequence of dismantling operations needed to access and remove the materials and components, including: type of operation, type and number of fastening technique(s) to be unlocked, tool(s) required, safety requirements and risks (if any) related to the disassembly operations.” A caution warning should be included in product manual advising consumers to not disassembly without the help of a professional and an indication made about this preventing any warranty claim. The list of critical parts and the procedure for ordering them shall be publicly available on the free access website of the manufacturer, importer or authorised representative, at the latest two years after the placing on the market of the first unit of a model and until the end of the period of availability of these spare parts.
7.3 Scenario analysis
A scenario analysis is made to evaluate the effect of the policy options at an EU level,
based on the best available data sources, assumptions and key parameters gathered from
tasks 2 through 6, and from input from stakeholders.
7.3.1 Indicators
All policy options will be evaluated and compared, based on a number of key parameters.
Below is a short description of each parameter, the calculation method used for the
parameter and sources for used values. All parameters are presented annually for the years
2021, 2025, 2030, 2035, and 2040. Cumulative values are calculated for relevant
parameters from 2021 to 2030 and from 2021 to 2040.
All calculations are done up to year 2040. This is to evaluate the full effect of the
regulations, which does not appear before the whole stock is replaced, which takes ~15
years, when assuming an average product lifetime of 12 years with a standard deviation
of 2 years. Note that no values between 2030 and 2040 are modified (i.e. they are kept
constant), which includes the energy label distributions and average rated capacity of sold
units, the total sales, and the sales distribution between the four base cases.
The results are presented aggregated, e.g. not divided on the different tumbler types.
Instead, the savings potentials attributed to each tumbler type will for some parameters
be shown separately.
Energy consumption during use per year in EU 28 [TWh/year]
The calculation of energy consumption during use is based on the average annual energy
consumption for each type of drier, coupled to the relevant stock of the relevant year. For
instance, heat pump driers sold in 2016 will have an annual energy consumption of 114
kWh/year. These driers will keep consuming 114 kWh/year, until the stock from 2016 is
depleted. The energy consumption of new products on the market will either follow the
market trends (BAU), or it will follow the new requirements according to the policy options
and their date of implementation.
The current regulations use an EEI factor to determine an energy label class. As only
distribution data between the different energy label classes was available from this 2013 -
2016, the distribution between the energy classes is converted to an average EEI value.
This is done by assuming the average EEI value is only slightly lower than the high limit of
the energy class interval299.
299 This is for this model determined by the formula 𝐸𝐸𝐼𝑎𝑣𝑒𝑟𝑎𝑔𝑒 = 𝐸𝐸𝐼𝑐𝑙𝑎𝑠𝑠 𝑢𝑝𝑝𝑒𝑟 𝑙𝑖𝑚𝑖𝑡 −𝐸𝐸𝐼𝑐𝑙𝑎𝑠𝑠 𝑟𝑎𝑛𝑔𝑒
4. E.g. if an arbitrary
class interval was between an EEI of 10 and 20, the average EEI of the driers in this interval is assumed to be in 20-(20-10)/4 = 18.
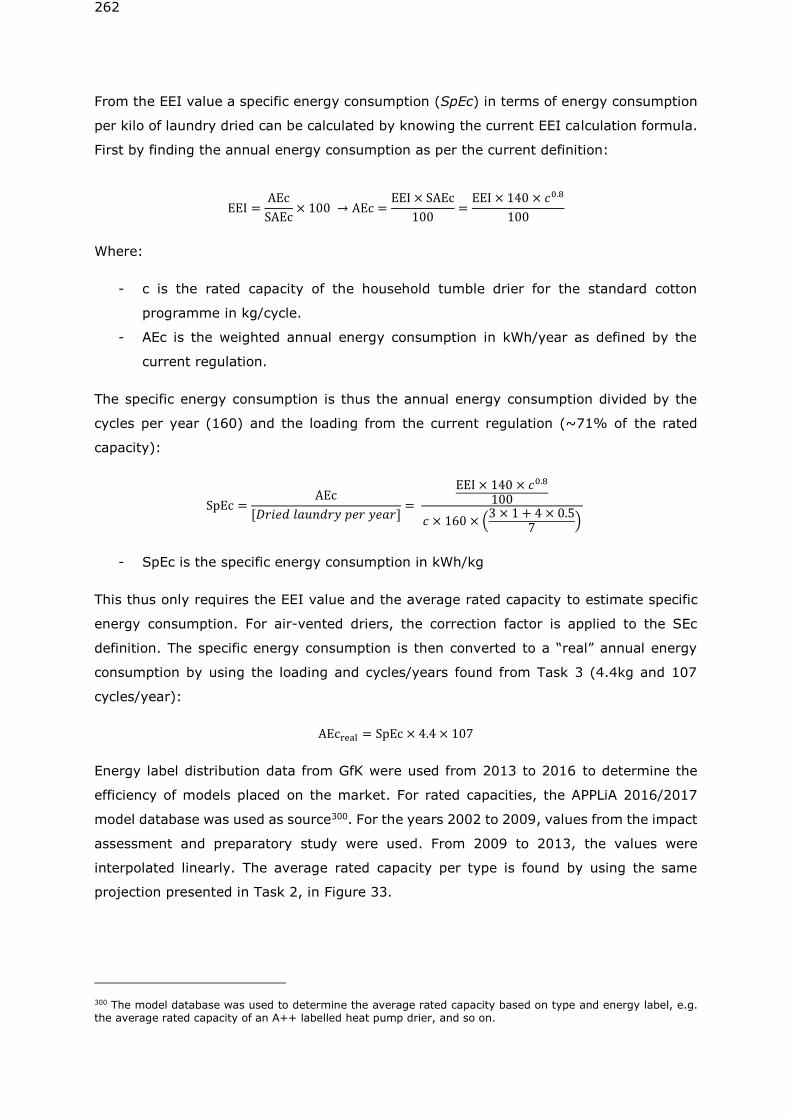
262
From the EEI value a specific energy consumption (SpEc) in terms of energy consumption
per kilo of laundry dried can be calculated by knowing the current EEI calculation formula.
First by finding the annual energy consumption as per the current definition:
EEI =AEc
SAEc× 100 → AEc =
EEI × SAEc
100=
EEI × 140 × 𝑐0.8
100
Where:
- c is the rated capacity of the household tumble drier for the standard cotton
programme in kg/cycle.
- AEc is the weighted annual energy consumption in kWh/year as defined by the
current regulation.
The specific energy consumption is thus the annual energy consumption divided by the
cycles per year (160) and the loading from the current regulation (~71% of the rated
capacity):
SpEc =AEc
[𝐷𝑟𝑖𝑒𝑑 𝑙𝑎𝑢𝑛𝑑𝑟𝑦 𝑝𝑒𝑟 𝑦𝑒𝑎𝑟]=
EEI × 140 × 𝑐0.8
100
𝑐 × 160 × (3 × 1 + 4 × 0.5
7)
- SpEc is the specific energy consumption in kWh/kg
This thus only requires the EEI value and the average rated capacity to estimate specific
energy consumption. For air-vented driers, the correction factor is applied to the SEc
definition. The specific energy consumption is then converted to a “real” annual energy
consumption by using the loading and cycles/years found from Task 3 (4.4kg and 107
cycles/year):
AEcreal = SpEc × 4.4 × 10⁷
Energy label distribution data from GfK were used from 2013 to 2016 to determine the
efficiency of models placed on the market. For rated capacities, the APPLiA 2016/2017
model database was used as source300. For the years 2002 to 2009, values from the impact
assessment and preparatory study were used. From 2009 to 2013, the values were
interpolated linearly. The average rated capacity per type is found by using the same
projection presented in Task 2, in Figure 33.
300 The model database was used to determine the average rated capacity based on type and energy label, e.g. the average rated capacity of an A++ labelled heat pump drier, and so on.
263
The energy label distribution from 2017 and onwards varies between the different policy
options. They can be seen in Annex VIII.
Global Warming Potential in EU 28[mt. CO2-eq/year]
The global warming potential is quantifying the life cycle greenhouse gas emissions of the
whole life cycle of tumble driers, expressed as CO2-eq. emissions per year. The emissions
are based on energy consumption during use, multiplied with emissions factors in CO2-
eq./kWh301, as well as the emissions related to production, distribution, disposal, and
recycling based on values from the Ecoreport tool.
Total Materials Consumption in EU 28 [mt/year]
The total materials consumption is based on the Bill of Materials and scaled up to the whole
stock. The reductions in material consumption are based on % reduction values shown in
Task 6.
Total user expenditures in EU 28 [bln. EUR/year]
Total user expenditure is a sum of the following parameters:
- Energy consumption costs
o Calculated as the total energy consumption for the whole stock in EU 28,
multiplied with energy costs from PRIMES302.
- Purchase costs
o Based on the sales estimations from Task 2, and derived unit prices. The
unit prices are based on GfK data from 2013 to 2016. See Figure 90 for the
relationship between unit price and energy consumption. No data was
available for gas driers. Data for the most common model on the market
was used instead303.
- Repair costs
o Based on the inputs from task 6 and calculated through the Ecoreport tool.
301 From Ecodesign Impact Accounting, VHK, 2016. 302 https://ec.europa.eu/clima/policies/strategies/analysis/models_en#PRIMES 303 Whiteknight ECO43, source: GfK
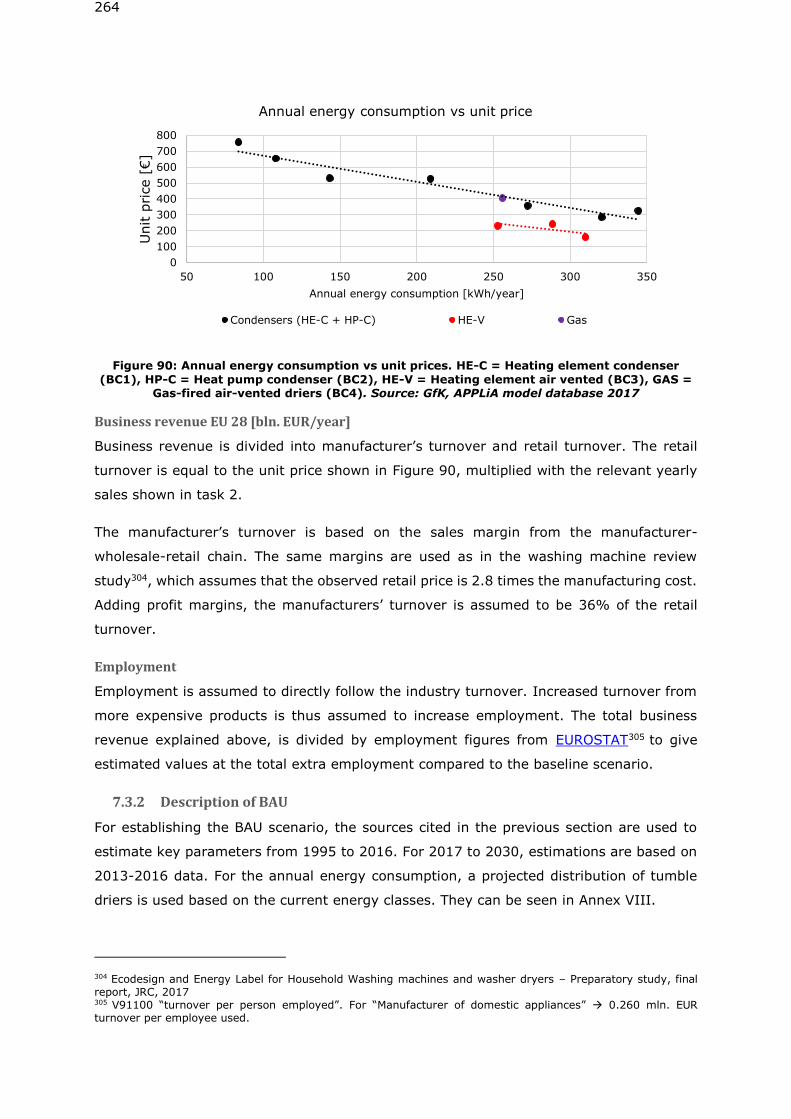
264
Figure 90: Annual energy consumption vs unit prices. HE-C = Heating element condenser
(BC1), HP-C = Heat pump condenser (BC2), HE-V = Heating element air vented (BC3), GAS = Gas-fired air-vented driers (BC4). Source: GfK, APPLiA model database 2017
Business revenue EU 28 [bln. EUR/year]
Business revenue is divided into manufacturer’s turnover and retail turnover. The retail
turnover is equal to the unit price shown in Figure 90, multiplied with the relevant yearly
sales shown in task 2.
The manufacturer’s turnover is based on the sales margin from the manufacturer-
wholesale-retail chain. The same margins are used as in the washing machine review
study304, which assumes that the observed retail price is 2.8 times the manufacturing cost.
Adding profit margins, the manufacturers’ turnover is assumed to be 36% of the retail
turnover.
Employment
Employment is assumed to directly follow the industry turnover. Increased turnover from
more expensive products is thus assumed to increase employment. The total business
revenue explained above, is divided by employment figures from EUROSTAT305 to give
estimated values at the total extra employment compared to the baseline scenario.
7.3.2 Description of BAU
For establishing the BAU scenario, the sources cited in the previous section are used to
estimate key parameters from 1995 to 2016. For 2017 to 2030, estimations are based on
2013-2016 data. For the annual energy consumption, a projected distribution of tumble
driers is used based on the current energy classes. They can be seen in Annex VIII.
304 Ecodesign and Energy Label for Household Washing machines and washer dryers – Preparatory study, final report, JRC, 2017 305 V91100 “turnover per person employed”. For “Manufacturer of domestic appliances” → 0.260 mln. EUR turnover per employee used.
0
100
200
300
400
500
600
700
800
50 100 150 200 250 300 350
Unit p
rice [
€]
Annual energy consumption [kWh/year]
Annual energy consumption vs unit price
Condensers (HE-C + HP-C) HE-V Gas
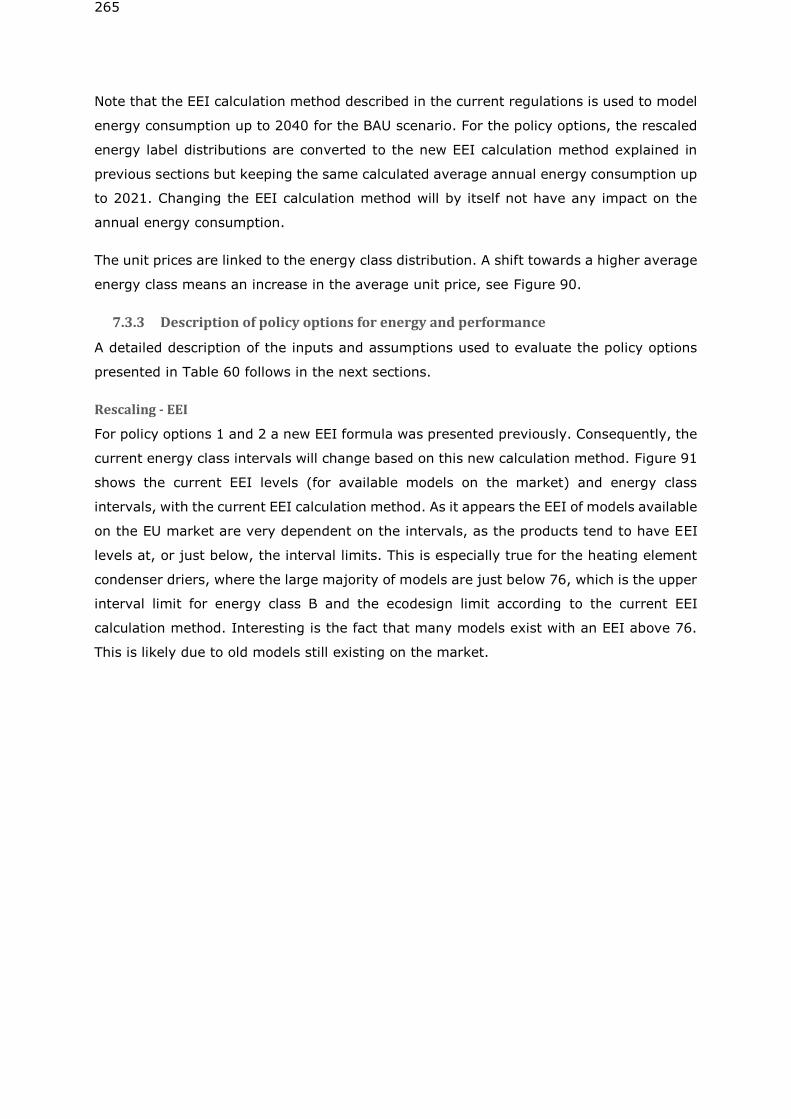
265
Note that the EEI calculation method described in the current regulations is used to model
energy consumption up to 2040 for the BAU scenario. For the policy options, the rescaled
energy label distributions are converted to the new EEI calculation method explained in
previous sections but keeping the same calculated average annual energy consumption up
to 2021. Changing the EEI calculation method will by itself not have any impact on the
annual energy consumption.
The unit prices are linked to the energy class distribution. A shift towards a higher average
energy class means an increase in the average unit price, see Figure 90.
7.3.3 Description of policy options for energy and performance
A detailed description of the inputs and assumptions used to evaluate the policy options
presented in Table 60 follows in the next sections.
Rescaling - EEI
For policy options 1 and 2 a new EEI formula was presented previously. Consequently, the
current energy class intervals will change based on this new calculation method. Figure 91
shows the current EEI levels (for available models on the market) and energy class
intervals, with the current EEI calculation method. As it appears the EEI of models available
on the EU market are very dependent on the intervals, as the products tend to have EEI
levels at, or just below, the interval limits. This is especially true for the heating element
condenser driers, where the large majority of models are just below 76, which is the upper
interval limit for energy class B and the ecodesign limit according to the current EEI
calculation method. Interesting is the fact that many models exist with an EEI above 76.
This is likely due to old models still existing on the market.
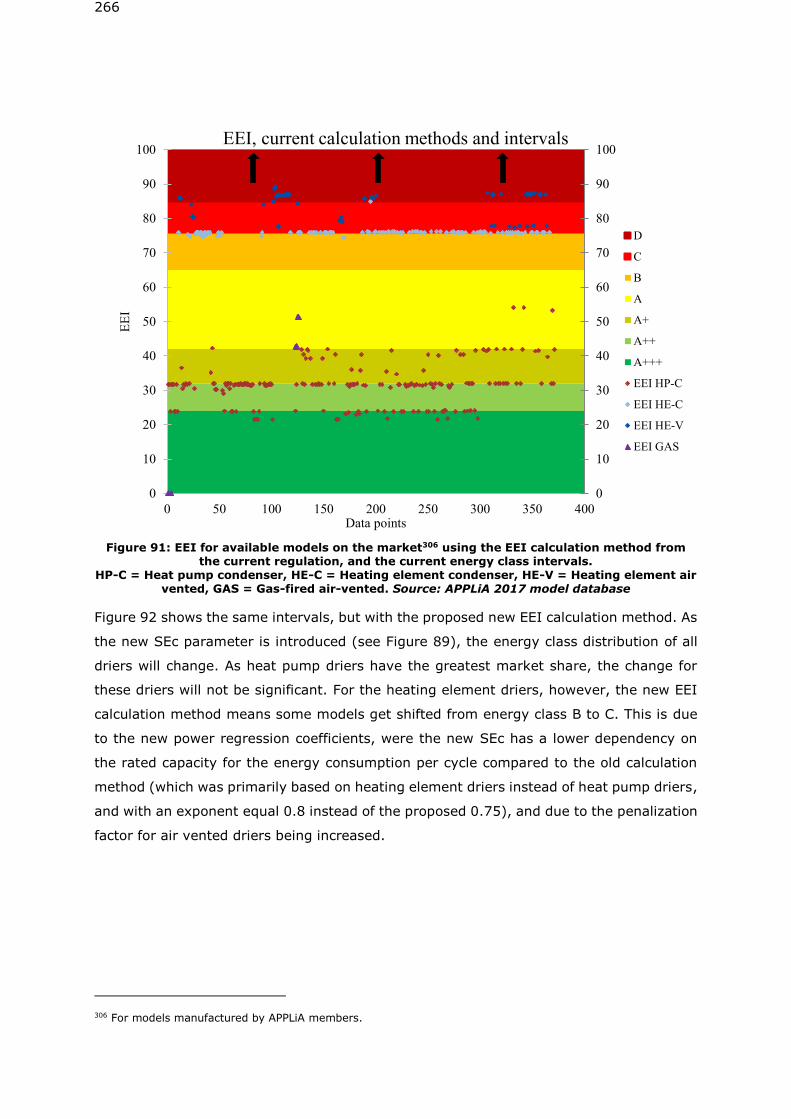
266
Figure 91: EEI for available models on the market306 using the EEI calculation method from the current regulation, and the current energy class intervals.
HP-C = Heat pump condenser, HE-C = Heating element condenser, HE-V = Heating element air vented, GAS = Gas-fired air-vented. Source: APPLiA 2017 model database
Figure 92 shows the same intervals, but with the proposed new EEI calculation method. As
the new SEc parameter is introduced (see Figure 89), the energy class distribution of all
driers will change. As heat pump driers have the greatest market share, the change for
these driers will not be significant. For the heating element driers, however, the new EEI
calculation method means some models get shifted from energy class B to C. This is due
to the new power regression coefficients, were the new SEc has a lower dependency on
the rated capacity for the energy consumption per cycle compared to the old calculation
method (which was primarily based on heating element driers instead of heat pump driers,
and with an exponent equal 0.8 instead of the proposed 0.75), and due to the penalization
factor for air vented driers being increased.
306 For models manufactured by APPLiA members.
0 50 100 150 200 250 300 350 400
0
10
20
30
40
50
60
70
80
90
100
0
10
20
30
40
50
60
70
80
90
100
EE
I
Data points
EEI, current calculation methods and intervals
D
C
B
A
A+
A++
A+++
EEI HP-C
EEI HE-C
EEI HE-V
EEI GAS
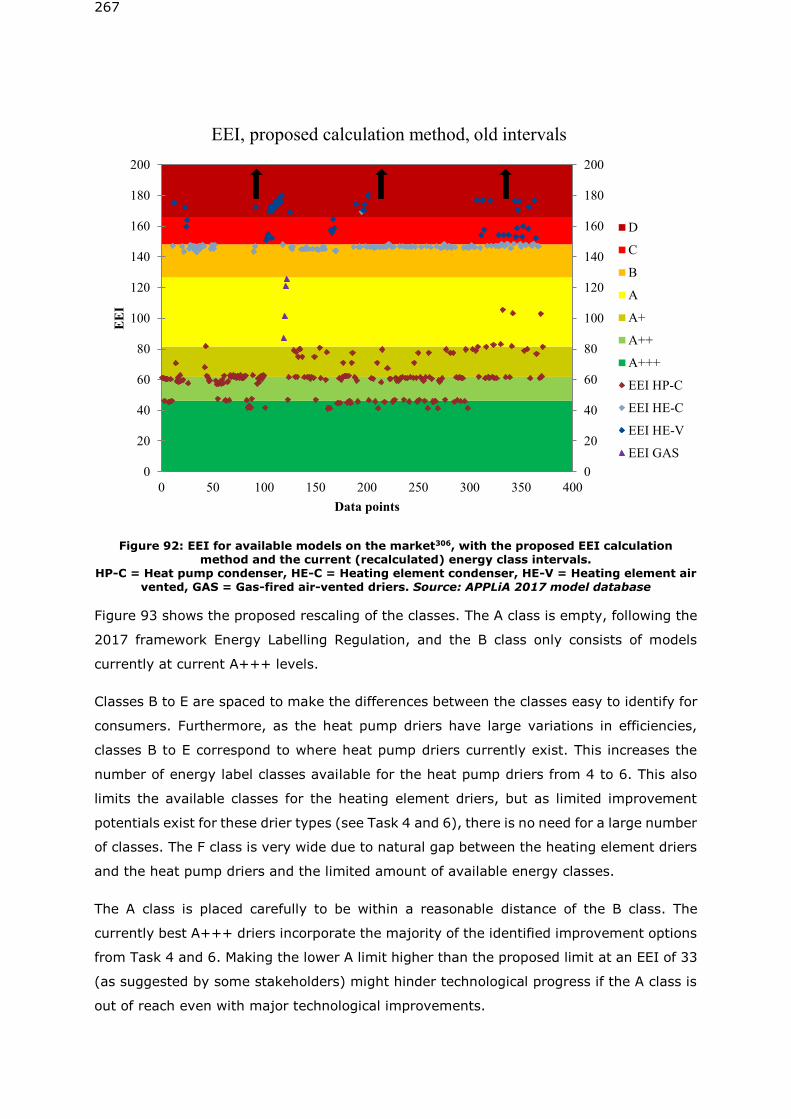
267
Figure 92: EEI for available models on the market306, with the proposed EEI calculation method and the current (recalculated) energy class intervals.
HP-C = Heat pump condenser, HE-C = Heating element condenser, HE-V = Heating element air vented, GAS = Gas-fired air-vented driers. Source: APPLiA 2017 model database
Figure 93 shows the proposed rescaling of the classes. The A class is empty, following the
2017 framework Energy Labelling Regulation, and the B class only consists of models
currently at current A+++ levels.
Classes B to E are spaced to make the differences between the classes easy to identify for
consumers. Furthermore, as the heat pump driers have large variations in efficiencies,
classes B to E correspond to where heat pump driers currently exist. This increases the
number of energy label classes available for the heat pump driers from 4 to 6. This also
limits the available classes for the heating element driers, but as limited improvement
potentials exist for these drier types (see Task 4 and 6), there is no need for a large number
of classes. The F class is very wide due to natural gap between the heating element driers
and the heat pump driers and the limited amount of available energy classes.
The A class is placed carefully to be within a reasonable distance of the B class. The
currently best A+++ driers incorporate the majority of the identified improvement options
from Task 4 and 6. Making the lower A limit higher than the proposed limit at an EEI of 33
(as suggested by some stakeholders) might hinder technological progress if the A class is
out of reach even with major technological improvements.
0 50 100 150 200 250 300 350 400
0
20
40
60
80
100
120
140
160
180
200
0
20
40
60
80
100
120
140
160
180
200
EE
I
Data points
EEI, proposed calculation method, old intervals
D
C
B
A
A+
A++
A+++
EEI HP-C
EEI HE-C
EEI HE-V
EEI GAS
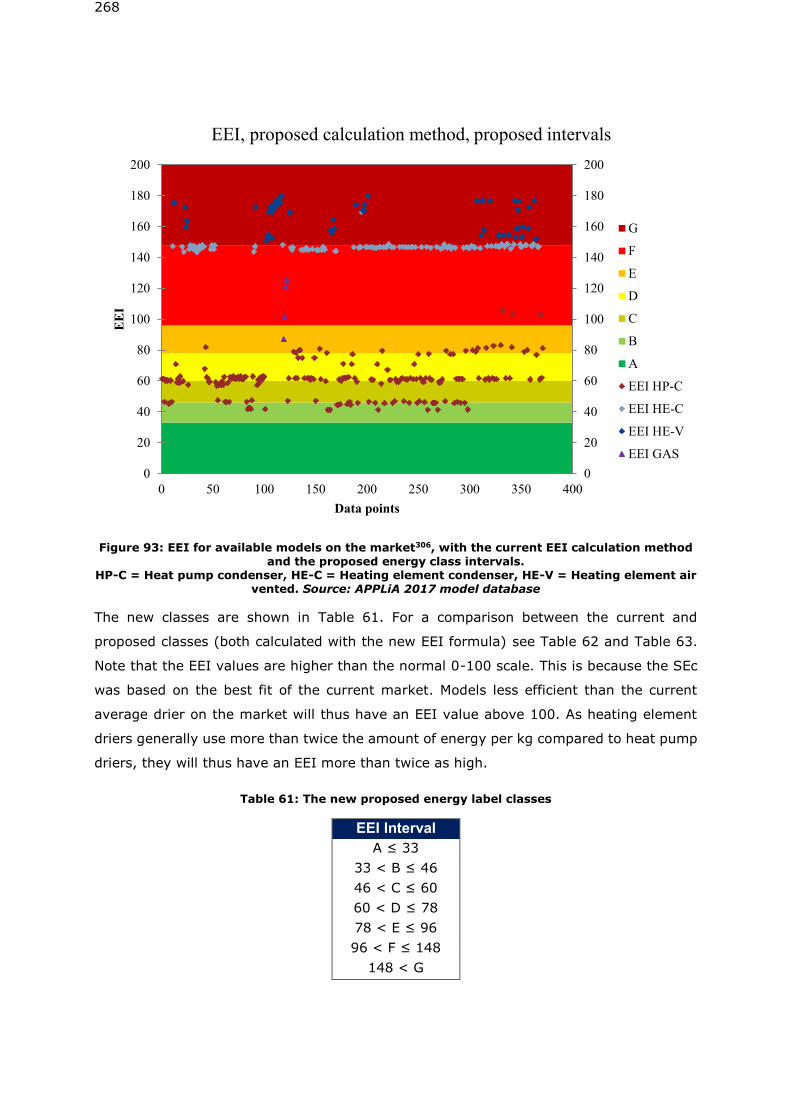
268
Figure 93: EEI for available models on the market306, with the current EEI calculation method
and the proposed energy class intervals. HP-C = Heat pump condenser, HE-C = Heating element condenser, HE-V = Heating element air
vented. Source: APPLiA 2017 model database
The new classes are shown in Table 61. For a comparison between the current and
proposed classes (both calculated with the new EEI formula) see Table 62 and Table 63.
Note that the EEI values are higher than the normal 0-100 scale. This is because the SEc
was based on the best fit of the current market. Models less efficient than the current
average drier on the market will thus have an EEI value above 100. As heating element
driers generally use more than twice the amount of energy per kg compared to heat pump
driers, they will thus have an EEI more than twice as high.
Table 61: The new proposed energy label classes
EEI Interval
A ≤ 33
33 < B ≤ 46
46 < C ≤ 60
60 < D ≤ 78
78 < E ≤ 96
96 < F ≤ 148
148 < G
0 50 100 150 200 250 300 350 400
0
20
40
60
80
100
120
140
160
180
200
0
20
40
60
80
100
120
140
160
180
200
EE
I
Data points
EEI, proposed calculation method, proposed intervals
G
F
E
D
C
B
A
EEI HP-C
EEI HE-C
EEI HE-V
EEI GAS
269
Table 62: Current and proposed classes, and the current new distributions of the classes
Current class Proposed class Current classes,
distribution Proposed classes,
distribution
A - 0%
A+++ → B 13% 11%
A++ (Top) → C 27%
11%
A++ (Bottom) → D 27%
A+ (Top) → D 14%
A+ (Bottom) → E 5%
A → E 2%
A → F 31%
B → F 30%
C → G 7% 15%
D → G 8%
Table 63: Current and proposed energy label intervals (based on proposed EEI calculation method), and the conversion between classes
Current ≤46 47-62 63-81 82-127 128-148 149-166 ≥167
A+++ A++ A+ A B C D
New A B C D E F G
≤33 34-46 47-60 61-79 80-97 98-148 ≥149
Rescaling – Condensation efficiency
In line with the re-scaling of the energy classes also the condensation efficiency classes
should be re-scaled. Currently, 96% of the available models are in the top 2 classes (A or
B)307, and the full range of classes are thus not utilised.
The current ecodesign requirement corresponds to a condensation efficiency of 70%. This
means that the energy labelling is only relevant for tumble driers with condensation
efficiencies between 70 – 100%. Rescaling the current classes will result in 4 classes (A
through D) were the A class would be almost empty, and with the majority of the models
(93%) distributed evenly between classes B and C. The new classes are shown in Table
64. The old and new distributions are shown in Table 65.
307 APPLiA model database 2017.
270
Table 64: New proposed condensation efficiency class intervals
Condensation efficiency interval
A ≥ 94
94 > B ≥ 87
87 > C ≥ 80
80 > D
Table 65: New and old distribution of condensation label intervals
Old classes New class Old classes,
percentage of total New classes,
percentage of total
A → A 32%
4%
A → B 47%
B → B 63%
B → C 44%
C → D 5% 5%
D → D 0%
PO1a – Market average
The PO1a policy options “average EEI” level is equal to the BAU scenario from 1995 to
2020. In 2021, the proposed EEI calculation method is introduced, together with the
proposed energy class intervals (Table 61). As previously explained, they are based on the
observed current market distribution of energy classes in the last years. It is also proposed
to have more classes (7 instead of 5), as the current C and D classes are respectively
partially or fully phased out due to current ecodesign limits.
At the time the new Energy Labelling Regulation comes into force (2021), the current
ecodesign limit (EEI of 76 in the current calculation method) will not be made more
stringent, but merely converted to the proposed EEI calculation method, which corresponds
to a new EEI of 148. This will continue once the new Ecodesign Regulation comes into force
(2023). No ecodesign limit is thus directly imposed, but as the EEI calculation method will
be changed to reflect heat pump driers, the heating element driers will be applied a minor
more stringent adjustment which would effectively remove more of these drier types from
the market.
This moderate change in this policy option ensures a small decrease in annual energy
consumption for new driers sold, but without significantly increasing the consumers
purchase costs. Furthermore, it ensures that heating element driers (condensing and air-
vented driers) will continue to exist on the market.
A new ecodesign limit for the condensation efficiency at 80% is proposed. This will remove
5% of the driers (85% of these being heating element condensing driers) from the market.
271
The ecodesign limit at 80% is proposed as a large majority of the driers reach condensation
efficiencies higher than 80% which shows that the market is able to reach these efficiency
levels. The ecodesign limit could potentially be increased to above 80%, but as the
condensation efficiency and energy consumption are correlated this could potentially
increase the total energy consumption of tumble driers, see section 4.1.7.
PO1b – BAT
PO1b will investigate the effects of a more stringent ecodesign requirement but without
imposing the new EEI calculation method and without rescaling the current energy label
classes. The policy option is thus used as an indicator to show the potential of setting a
stringent ecodesign requirements without changing the EEI calculation method and
subsequent rescaling of the energy label classes.
The PO1b average EEI levels is thus equal to the BAU scenario throughout the time period.
From 2023, all heating element driers will be excluded from the market as energy label
class B (from the current energy label classes) will be removed. It will thus force consumers
to exclusively purchase either heat pump driers or gas fired driers.
PO2 – BAT
PO2 combines PO1a and PO1b. Like the PO1a, the PO2 policy options average EEI levels
are equal to the BAU scenario from 1995 to 2020. In 2021, the new EEI calculation method
will be introduced, together with the new energy class intervals (Table 61).
At the time the new Energy Labelling Regulation comes into force (2021), the current
ecodesign limit (EEI of 76 in the current calculation method) will be merely converted to
the new EEI calculation method, which corresponds to an EEI of 148.
However, once the new Ecodesign Regulation comes into force (2023), classes G and F will
be removed, by setting the ecodesign limit of EEI at 96. The effect is visualized in Figure
93, where the E/F border indicates the new ecodesign limit. The proposed limit is low
enough (on the EEI scale) to ensure that no driers with lower efficiencies than the heat
pump driers and gas-fired driers will remain on the market. It will thus force consumers to
exclusively purchase either heat pump driers or gas fired driers.
In order to separate the effects of the ecodesign limits, the future energy label distributions
are assumed similar to PO1a, with the only change being the ecodesign requirements.
Setting strict ecodesign limits could result in a net reduction of sales of all tumble driers in
the EU market due to higher product prices, but this effect is not quantified, since there is
no evidence so far that this will happen.
272
Similar to PO1a and following the same reasoning, an ecodesign limit for the condensation
efficiency at 80% is proposed. This will remove ~1% of the heat pump driers from the
current market308.
7.3.4 Description of policy options for resource efficiency
In order to only look at resource efficiency aspects, PO3 and PO4 will follow the BAU
scenario regarding energy label distribution and unit prices. This means the effect of these
scenarios are independent of PO1 and PO2, and thus can be added to those of PO1 and
PO2.
PO3 - Dismantling and Recycling
In order to estimate the effects of easier dismantling and higher recycling rates, the
Ecoreport tool is used, where environmental impact of the End-of-Life phase is changed by
increasing the mass fractions of recycled materials from 29% to 49%309, reducing the total
amount of materials being sent to incineration and placed on landfills. The impacts on
Global Warming Potential and Total energy are evaluated through the Ecoreport tool. There
is no impact on material consumption.
PO4 – Reparability and durability
For the effect of increased reparability and durability, the average lifetime is changed from
12 years to 14 years. The current stock model calculates the stock based on sales numbers
and an average lifetime. Changing the lifetime would thus significantly increase the total
stock, which is not likely to happen. Households seldom have more than one tumble drier,
which will likely not change just because the tumble drier lasts longer.
In order to quantify the effect properly, the sales figures are scaled instead, meaning that
the total stock is unchanged, but the sales figures are scaled down to match the current
stock numbers. As the stock model follows a normal distribution (see Task 2), the sales
numbers are varied similarly. As the lifetime of tumble driers would be prolonged from
already a long lifetime, the full reduction in sales is first seen when the models sold in 2021
are beginning to be replaced, which is around ~2031.
The economic effect of prolonged lifetime from more repair activities is quantified by
doubling the annual average repair/maintenance cost of the driers to 10 EUR/unit/year.
The increased in repair costs increases the user expenditure but also the business revenue
and employment by assuming that manufacturers take all increased repair turnovers. This
is because there is no data providing the share of OEM (Original Equipment Manufacturer)
308 Based on GfK data. Heat pump driers have a generally higher condensation efficiency compared to heating element condenser driers. 309 The 20% increase is based on assumptions and a Deloitte study [(Deloitte (2016) Study on Socioeconomic
impacts of increased reparability – Final Report. Prepared for the European Commission, DG ENV]
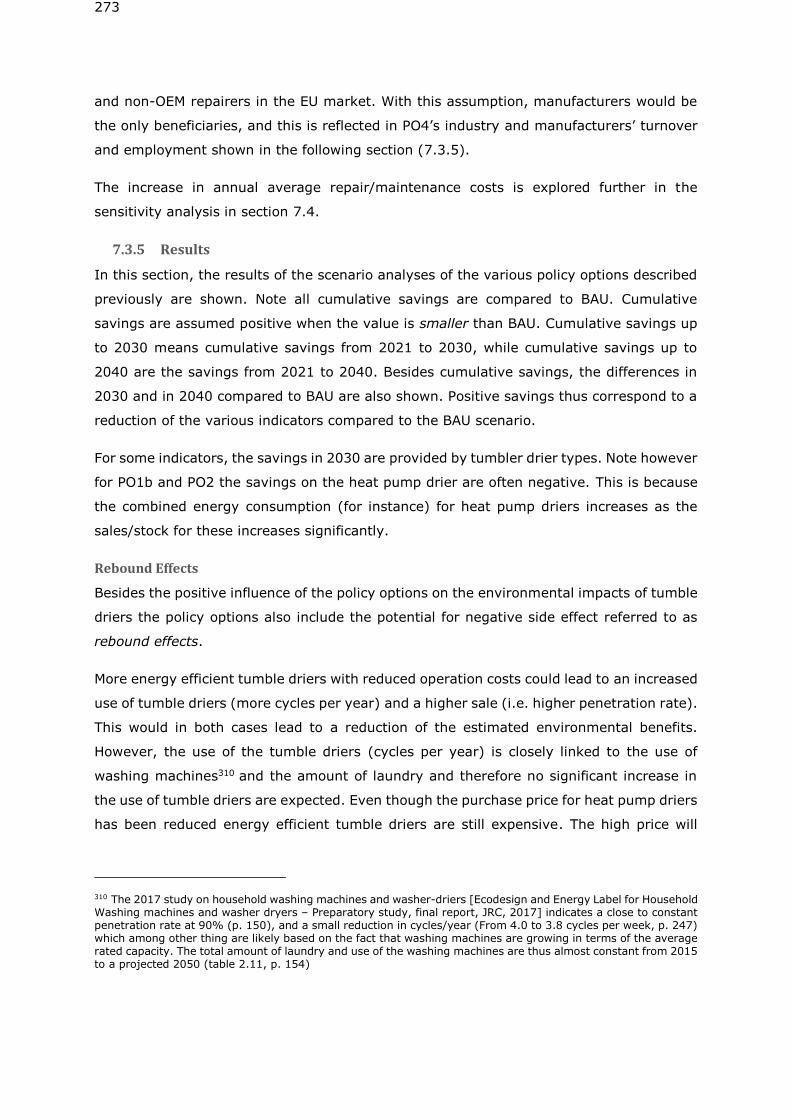
273
and non-OEM repairers in the EU market. With this assumption, manufacturers would be
the only beneficiaries, and this is reflected in PO4’s industry and manufacturers’ turnover
and employment shown in the following section (7.3.5).
The increase in annual average repair/maintenance costs is explored further in the
sensitivity analysis in section 7.4.
7.3.5 Results
In this section, the results of the scenario analyses of the various policy options described
previously are shown. Note all cumulative savings are compared to BAU. Cumulative
savings are assumed positive when the value is smaller than BAU. Cumulative savings up
to 2030 means cumulative savings from 2021 to 2030, while cumulative savings up to
2040 are the savings from 2021 to 2040. Besides cumulative savings, the differences in
2030 and in 2040 compared to BAU are also shown. Positive savings thus correspond to a
reduction of the various indicators compared to the BAU scenario.
For some indicators, the savings in 2030 are provided by tumbler drier types. Note however
for PO1b and PO2 the savings on the heat pump drier are often negative. This is because
the combined energy consumption (for instance) for heat pump driers increases as the
sales/stock for these increases significantly.
Rebound Effects
Besides the positive influence of the policy options on the environmental impacts of tumble
driers the policy options also include the potential for negative side effect referred to as
rebound effects.
More energy efficient tumble driers with reduced operation costs could lead to an increased
use of tumble driers (more cycles per year) and a higher sale (i.e. higher penetration rate).
This would in both cases lead to a reduction of the estimated environmental benefits.
However, the use of the tumble driers (cycles per year) is closely linked to the use of
washing machines310 and the amount of laundry and therefore no significant increase in
the use of tumble driers are expected. Even though the purchase price for heat pump driers
has been reduced energy efficient tumble driers are still expensive. The high price will
310 The 2017 study on household washing machines and washer-driers [Ecodesign and Energy Label for Household Washing machines and washer dryers – Preparatory study, final report, JRC, 2017] indicates a close to constant penetration rate at 90% (p. 150), and a small reduction in cycles/year (From 4.0 to 3.8 cycles per week, p. 247) which among other thing are likely based on the fact that washing machines are growing in terms of the average rated capacity. The total amount of laundry and use of the washing machines are thus almost constant from 2015 to a projected 2050 (table 2.11, p. 154)
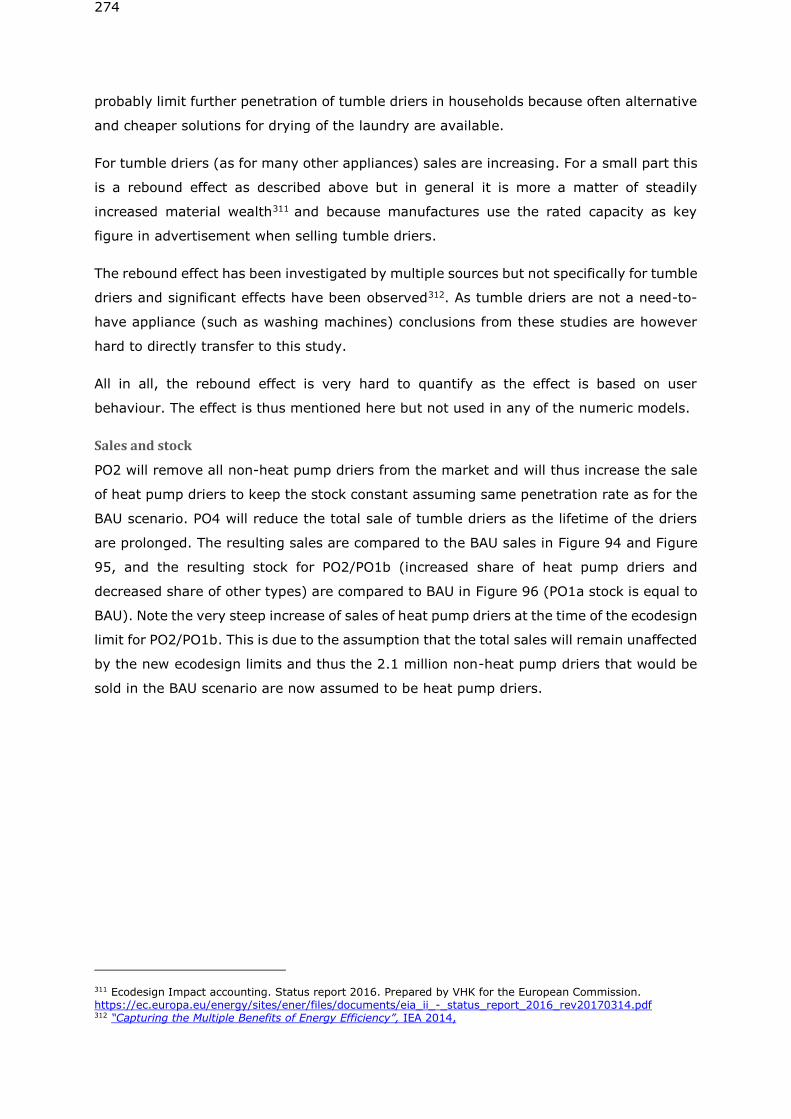
274
probably limit further penetration of tumble driers in households because often alternative
and cheaper solutions for drying of the laundry are available.
For tumble driers (as for many other appliances) sales are increasing. For a small part this
is a rebound effect as described above but in general it is more a matter of steadily
increased material wealth311 and because manufactures use the rated capacity as key
figure in advertisement when selling tumble driers.
The rebound effect has been investigated by multiple sources but not specifically for tumble
driers and significant effects have been observed312. As tumble driers are not a need-to-
have appliance (such as washing machines) conclusions from these studies are however
hard to directly transfer to this study.
All in all, the rebound effect is very hard to quantify as the effect is based on user
behaviour. The effect is thus mentioned here but not used in any of the numeric models.
Sales and stock
PO2 will remove all non-heat pump driers from the market and will thus increase the sale
of heat pump driers to keep the stock constant assuming same penetration rate as for the
BAU scenario. PO4 will reduce the total sale of tumble driers as the lifetime of the driers
are prolonged. The resulting sales are compared to the BAU sales in Figure 94 and Figure
95, and the resulting stock for PO2/PO1b (increased share of heat pump driers and
decreased share of other types) are compared to BAU in Figure 96 (PO1a stock is equal to
BAU). Note the very steep increase of sales of heat pump driers at the time of the ecodesign
limit for PO2/PO1b. This is due to the assumption that the total sales will remain unaffected
by the new ecodesign limits and thus the 2.1 million non-heat pump driers that would be
sold in the BAU scenario are now assumed to be heat pump driers.
311 Ecodesign Impact accounting. Status report 2016. Prepared by VHK for the European Commission. https://ec.europa.eu/energy/sites/ener/files/documents/eia_ii_-_status_report_2016_rev20170314.pdf 312 “Capturing the Multiple Benefits of Energy Efficiency”, IEA 2014,
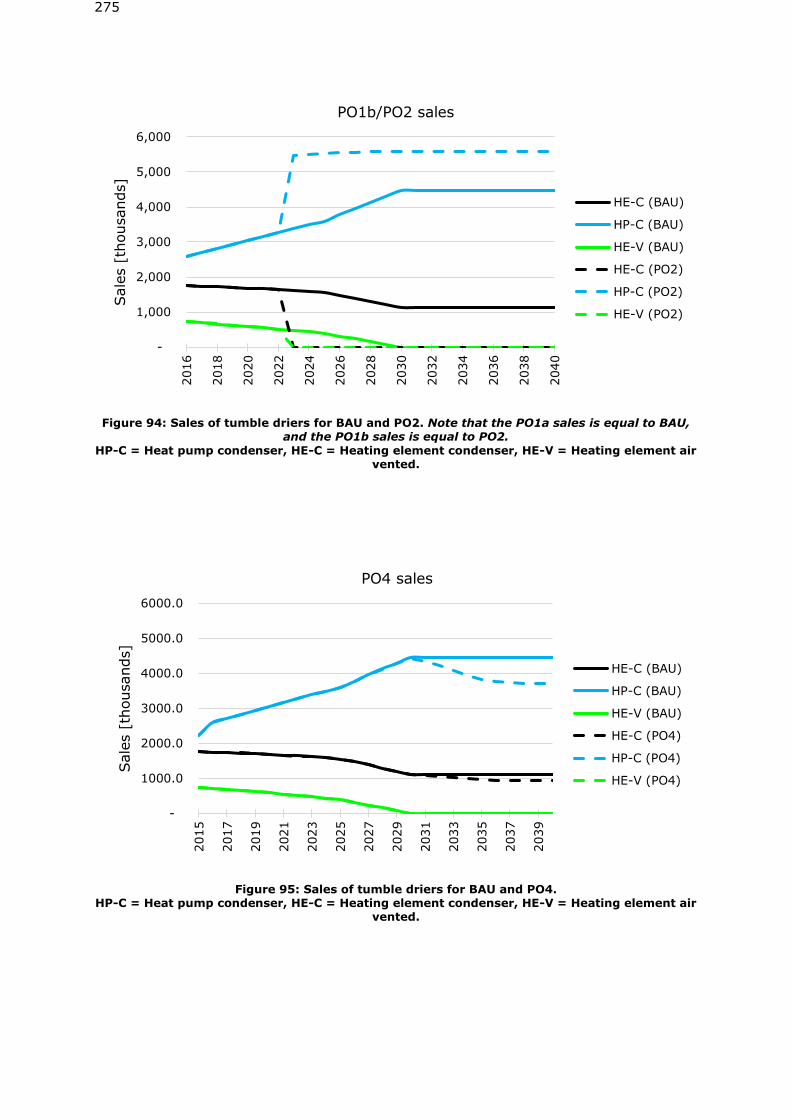
275
Figure 94: Sales of tumble driers for BAU and PO2. Note that the PO1a sales is equal to BAU, and the PO1b sales is equal to PO2.
HP-C = Heat pump condenser, HE-C = Heating element condenser, HE-V = Heating element air vented.
Figure 95: Sales of tumble driers for BAU and PO4. HP-C = Heat pump condenser, HE-C = Heating element condenser, HE-V = Heating element air
vented.
-
1,000
2,000
3,000
4,000
5,000
6,000
2016
2018
2020
2022
2024
2026
2028
2030
2032
2034
2036
2038
2040
Sale
s [
thousands]
PO1b/PO2 sales
HE-C (BAU)
HP-C (BAU)
HE-V (BAU)
HE-C (PO2)
HP-C (PO2)
HE-V (PO2)
-
1000.0
2000.0
3000.0
4000.0
5000.0
6000.0
2015
2017
2019
2021
2023
2025
2027
2029
2031
2033
2035
2037
2039
Sale
s [
thousands]
PO4 sales
HE-C (BAU)
HP-C (BAU)
HE-V (BAU)
HE-C (PO4)
HP-C (PO4)
HE-V (PO4)
276
Figure 96: Stock of tumble driers for BAU and PO2. Note that the PO1a stock is equal to BAU, and the PO1b stock is equal to PO2.
HP-C = Heat pump condenser, HE-C = Heating element condenser, HE-V = Heating element air
vented.
Energy consumption during use
Figure 97 and Table 66 show the total energy consumption in the use phase for tumble
driers with the different policy options. Table 67 shows the energy savings distributed per
tumbler type.
When evaluating the policy options in 2040 (were the full stock prior to 2021 is replaced),
the effects of the ecodesign and energy label can be seen based on the results from PO1a
and PO1b.
PO1a (energy label only) can potentially save 1.2 TWh/year in 2040, which is a reduction
of ~14% of the total energy consumption compared to BAU. PO1b (ecodesign only) can
potentially save 2.4 TWh/year in 2040, which is a reduction of ~26% of the total energy
consumption compared to BAU.
PO2 (energy label + ecodesign) is estimated to save 3.9 TWh/year in 2040, which
corresponds to a reduction of 43% of the total energy consumption compared to BAU. The
savings from PO2 are higher than the combined effect of PO1a and PO1b as the effects are
somewhat multiplicative (PO1a estimates the effect on the energy label on all the tumble
drier types of which the impact on heating element driers are not large, were PO2 only
acts on heat pump (and gas driers) which have a large effect).
-
10,000
20,000
30,000
40,000
50,000
60,000
70,000
2016
2018
2020
2022
2024
2026
2028
2030
2032
2034
2036
2038
2040
Sto
ck [
thousands]
PO1b/PO2 stock
HE-C (BAU)
HP-C (BAU)
HE-V (BAU)
HE-C (PO2)
HP-C (PO2)
HE-V (PO2)
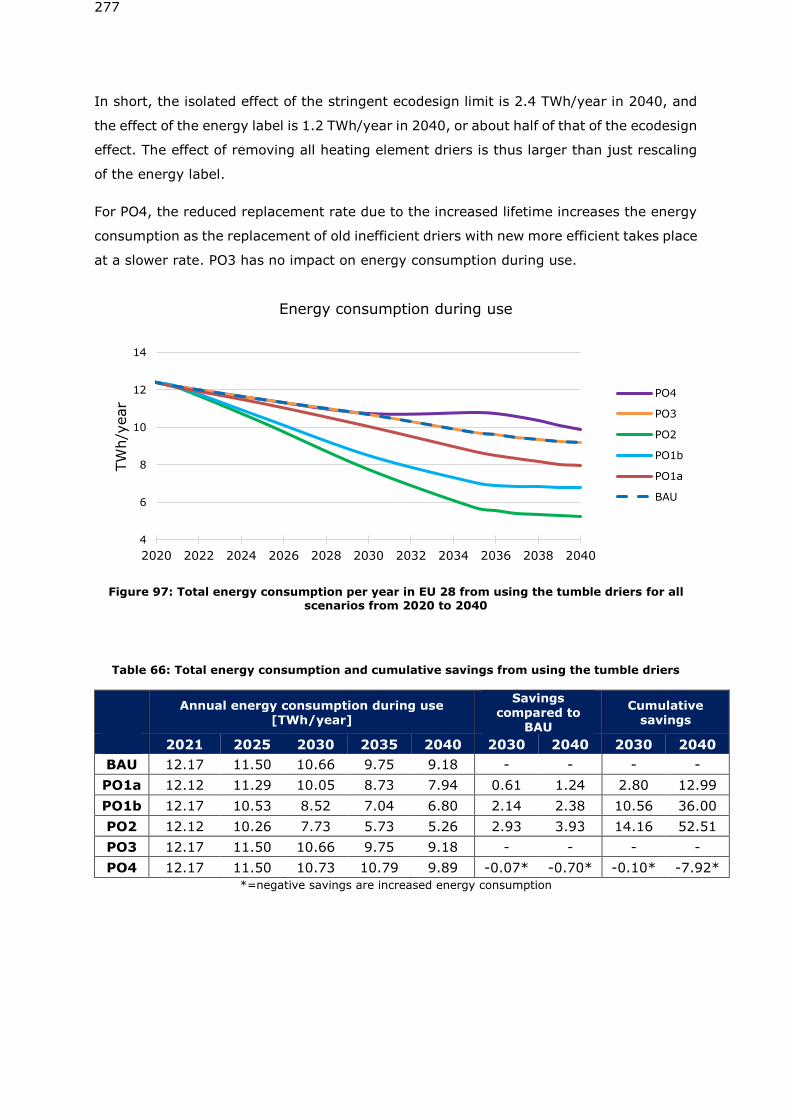
277
In short, the isolated effect of the stringent ecodesign limit is 2.4 TWh/year in 2040, and
the effect of the energy label is 1.2 TWh/year in 2040, or about half of that of the ecodesign
effect. The effect of removing all heating element driers is thus larger than just rescaling
of the energy label.
For PO4, the reduced replacement rate due to the increased lifetime increases the energy
consumption as the replacement of old inefficient driers with new more efficient takes place
at a slower rate. PO3 has no impact on energy consumption during use.
Figure 97: Total energy consumption per year in EU 28 from using the tumble driers for all scenarios from 2020 to 2040
Table 66: Total energy consumption and cumulative savings from using the tumble driers
Annual energy consumption during use [TWh/year]
Savings compared to
BAU
Cumulative savings
2021 2025 2030 2035 2040 2030 2040 2030 2040
BAU 12.17 11.50 10.66 9.75 9.18 - - - -
PO1a 12.12 11.29 10.05 8.73 7.94 0.61 1.24 2.80 12.99
PO1b 12.17 10.53 8.52 7.04 6.80 2.14 2.38 10.56 36.00
PO2 12.12 10.26 7.73 5.73 5.26 2.93 3.93 14.16 52.51
PO3 12.17 11.50 10.66 9.75 9.18 - - - -
PO4 12.17 11.50 10.73 10.79 9.89 -0.07* -0.70* -0.10* -7.92*
*=negative savings are increased energy consumption
4
6
8
10
12
14
2020 2022 2024 2026 2028 2030 2032 2034 2036 2038 2040
TW
h/y
ear
Energy consumption during use
PO4
PO3
PO2
PO1b
PO1a
BAU
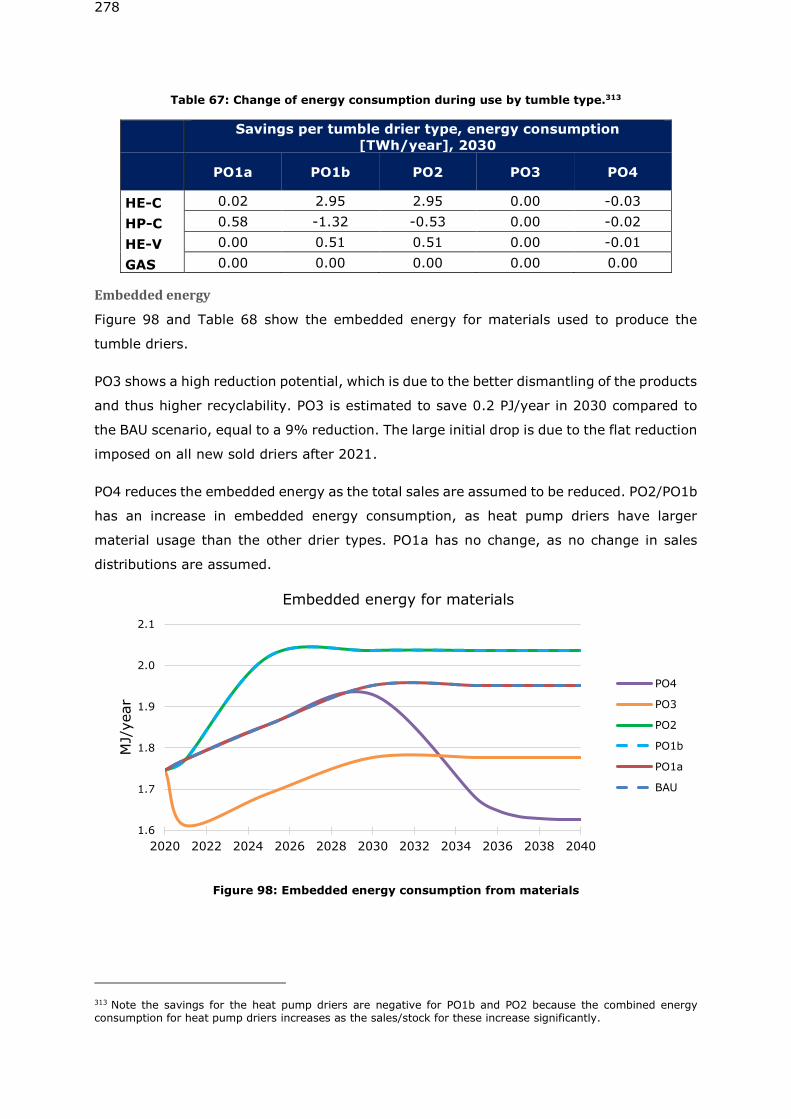
278
Table 67: Change of energy consumption during use by tumble type.313
Savings per tumble drier type, energy consumption
[TWh/year], 2030
PO1a PO1b PO2 PO3 PO4
HE-C 0.02 2.95 2.95 0.00 -0.03
HP-C 0.58 -1.32 -0.53 0.00 -0.02
HE-V 0.00 0.51 0.51 0.00 -0.01
GAS 0.00 0.00 0.00 0.00 0.00
Embedded energy
Figure 98 and Table 68 show the embedded energy for materials used to produce the
tumble driers.
PO3 shows a high reduction potential, which is due to the better dismantling of the products
and thus higher recyclability. PO3 is estimated to save 0.2 PJ/year in 2030 compared to
the BAU scenario, equal to a 9% reduction. The large initial drop is due to the flat reduction
imposed on all new sold driers after 2021.
PO4 reduces the embedded energy as the total sales are assumed to be reduced. PO2/PO1b
has an increase in embedded energy consumption, as heat pump driers have larger
material usage than the other drier types. PO1a has no change, as no change in sales
distributions are assumed.
Figure 98: Embedded energy consumption from materials
313 Note the savings for the heat pump driers are negative for PO1b and PO2 because the combined energy consumption for heat pump driers increases as the sales/stock for these increase significantly.
1.6
1.7
1.8
1.9
2.0
2.1
2020 2022 2024 2026 2028 2030 2032 2034 2036 2038 2040
MJ/
year
Embedded energy for materials
PO4
PO3
PO2
PO1b
PO1a
BAU
279
Table 68: Embedded energy consumption from materials
Embedded Energy [PJ/year]
Difference
compared to BAU
Cumulative savings
2021 2025 2030 2035 2040 2030 2040 2030 2040
BAU 1.77 1.86 1.95 1.95 1.95 - - - -
PO1a 1.77 1.86 1.95 1.95 1.95 - - - -
PO1b 1.77 2.02 2.04 2.04 2.04 -0.09* -0.09* -1.11* -1.98*
PO2 1.77 2.02 2.04 2.04 2.04 -0.09* -0.09* -1.11* -1.98*
PO3 1.61 1.69 1.78 1.78 1.78 0.18 0.18 1.68 3.43
PO4 1.77 1.86 1.93 1.68 1.63 0.02 0.32 0.03 2.44
*=negative savings are increased embedded energy
Table 69: Savings of embedded energy by tumble drier type
Savings per base case, embedded energy [PJ/year], 2030
PO1a PO1b PO2 PO3 PO4
HE-C 0.00 0.32 0.32 0.03 0.00
HP-C 0.00 -0.41 -0.41 0.15 0.02
HE-V 0.00 0.00 0.00 0.00 0.00
GAS 0.00 0.00 0.00 0.00 0.00
Global warming potential
Figure 99 and Table 70 show the estimated greenhouse gas emissions for the different
policy options in mt. CO2 eq. emissions per year. Table 71 shows the savings distributed
on each tumbler type.
The results can be divided into the results for policy options for energy and performance
(PO1-PO2), and policy options for resource efficiency (PO3-PO4).
For policy options 1a/b and 2, the greenhouse gas emissions are closely linked to the
energy consumption during use, and conclusions from that section can thus also be applied
here. Savings of 0.2, 0.7 and 0.9 mt. CO2 eq./year for PO1a, PO1b and PO2 respectively
have been estimated for 2030.
PO3 is estimated to save 0.1 mt. CO2 eq./year for 2030. This is due to the higher
recyclability, reducing the emissions at the End-of-Life phase and overall emissions for the
whole life cycle of the products.
The reduction of GHG emission from PO4 is due to the longer lifetime of tumble driers
resulting in lower sales and thus material use. The higher energy consumption due to the
less efficient stock however counteracts this leading to a moderate increase after ~2029.
PO3 and PO4 show smaller reductions in GHG emissions than PO1a/b and PO2, because
they target different aspects of the products (PO3 and PO4 target reductions at the
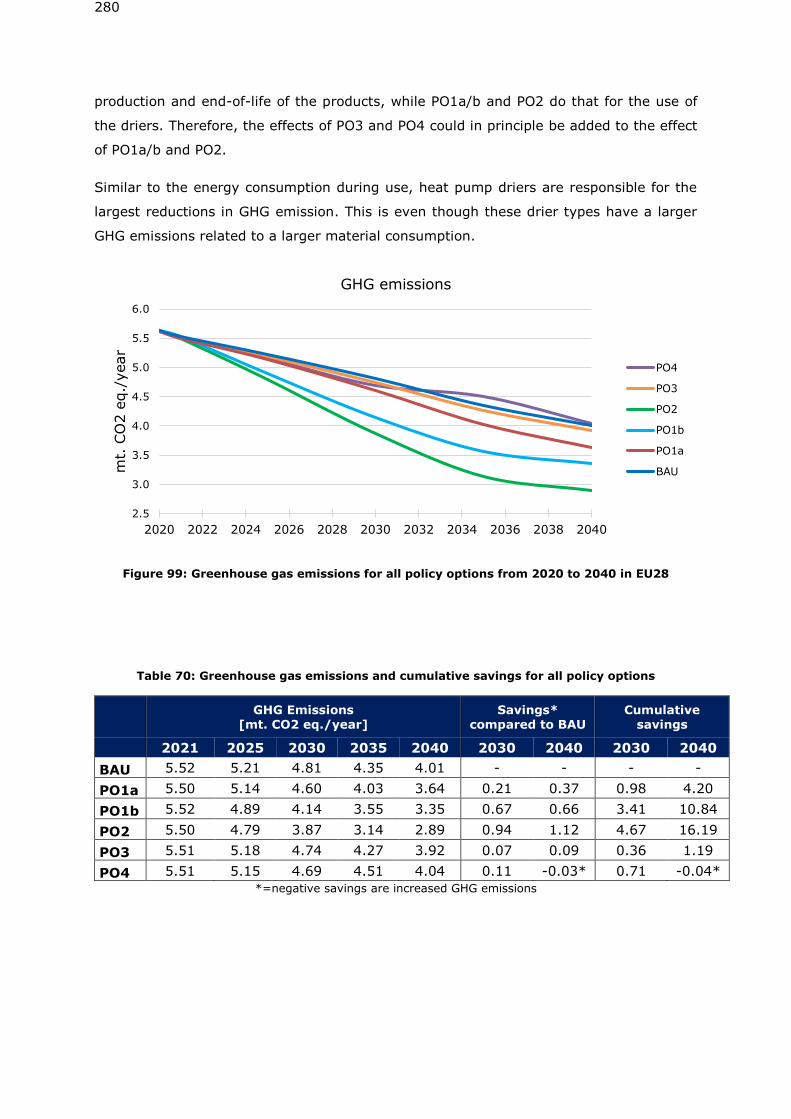
280
production and end-of-life of the products, while PO1a/b and PO2 do that for the use of
the driers. Therefore, the effects of PO3 and PO4 could in principle be added to the effect
of PO1a/b and PO2.
Similar to the energy consumption during use, heat pump driers are responsible for the
largest reductions in GHG emission. This is even though these drier types have a larger
GHG emissions related to a larger material consumption.
Figure 99: Greenhouse gas emissions for all policy options from 2020 to 2040 in EU28
Table 70: Greenhouse gas emissions and cumulative savings for all policy options
GHG Emissions [mt. CO2 eq./year]
Savings* compared to BAU
Cumulative savings
2021 2025 2030 2035 2040 2030 2040 2030 2040
BAU 5.52 5.21 4.81 4.35 4.01 - - - -
PO1a 5.50 5.14 4.60 4.03 3.64 0.21 0.37 0.98 4.20
PO1b 5.52 4.89 4.14 3.55 3.35 0.67 0.66 3.41 10.84
PO2 5.50 4.79 3.87 3.14 2.89 0.94 1.12 4.67 16.19
PO3 5.51 5.18 4.74 4.27 3.92 0.07 0.09 0.36 1.19
PO4 5.51 5.15 4.69 4.51 4.04 0.11 -0.03* 0.71 -0.04*
*=negative savings are increased GHG emissions
2.5
3.0
3.5
4.0
4.5
5.0
5.5
6.0
2020 2022 2024 2026 2028 2030 2032 2034 2036 2038 2040
mt.
CO
2 e
q./
year
GHG emissions
PO4
PO3
PO2
PO1b
PO1a
BAU
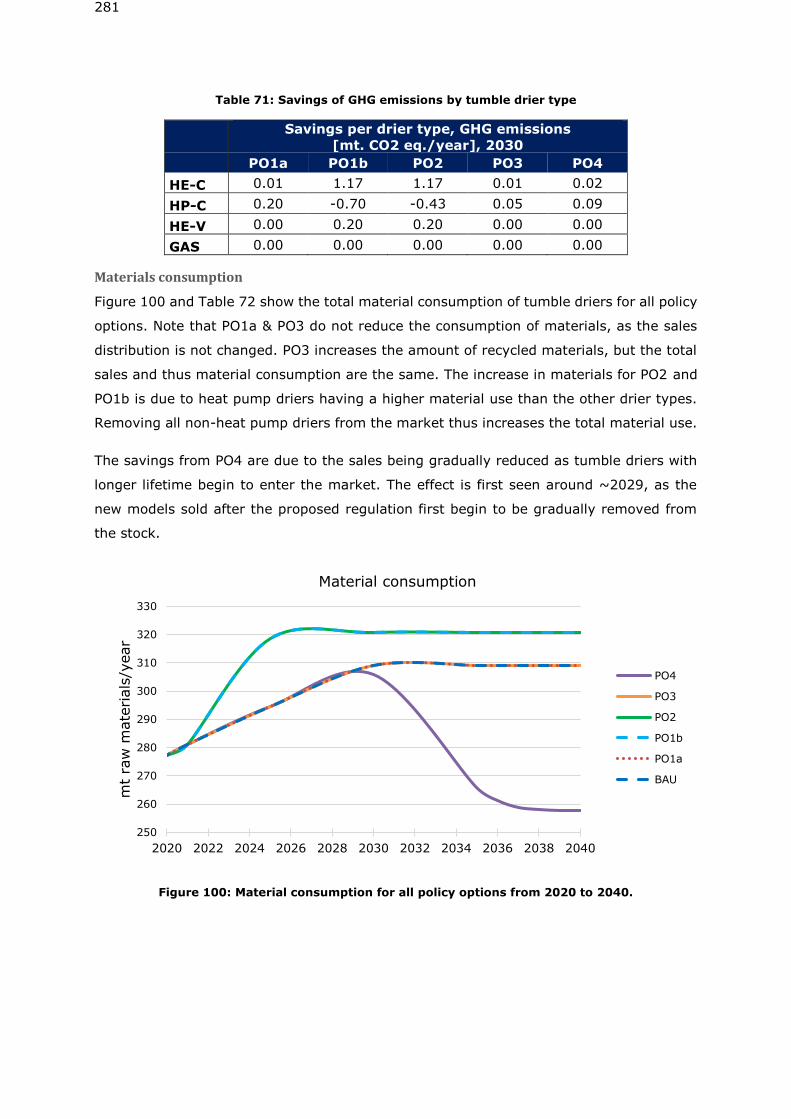
281
Table 71: Savings of GHG emissions by tumble drier type
Savings per drier type, GHG emissions
[mt. CO2 eq./year], 2030
PO1a PO1b PO2 PO3 PO4
HE-C 0.01 1.17 1.17 0.01 0.02
HP-C 0.20 -0.70 -0.43 0.05 0.09
HE-V 0.00 0.20 0.20 0.00 0.00
GAS 0.00 0.00 0.00 0.00 0.00
Materials consumption
Figure 100 and Table 72 show the total material consumption of tumble driers for all policy
options. Note that PO1a & PO3 do not reduce the consumption of materials, as the sales
distribution is not changed. PO3 increases the amount of recycled materials, but the total
sales and thus material consumption are the same. The increase in materials for PO2 and
PO1b is due to heat pump driers having a higher material use than the other drier types.
Removing all non-heat pump driers from the market thus increases the total material use.
The savings from PO4 are due to the sales being gradually reduced as tumble driers with
longer lifetime begin to enter the market. The effect is first seen around ~2029, as the
new models sold after the proposed regulation first begin to be gradually removed from
the stock.
Figure 100: Material consumption for all policy options from 2020 to 2040.
250
260
270
280
290
300
310
320
330
2020 2022 2024 2026 2028 2030 2032 2034 2036 2038 2040
mt
raw
mate
rials
/year
Material consumption
PO4
PO3
PO2
PO1b
PO1a
BAU
282
Table 72: Material consumption, and cumulative savings, for all policy options.
Material consumption [mt./year]
Savings* compared to BAU
Cumulative savings
2021 2025 2030 2035 2040 2030 2040 2030 2040
BAU 281 295 309 309 309 - - - -
PO1a 281 295 309 309 309 - - - -
PO1b 281 318 321 321 321 -11.6* -11.6* -158* -274*
PO2 281 318 321 321 321 -11.6* -11.6* -158* -274*
PO3 281 295 309 309 309 - - - -
PO4 281 295 306 266 258 3.4 51.5 5 386
*=negative savings are increased material consumption
Table 73: Savings of total materials consumption by tumble drier type
Savings per base case, material
consumption [mt./year], 2030
PO1a PO1b PO2 PO3 PO4
HE-C 0.00 0.00 52.6 0.00 0.59
HP-C 0.00 0.00 -64.2 0.00 2.86
HE-V 0.00 0.00 0.00 0.00 0.00
GAS 0.00 0.00 0.00 0.00 0.00
Total user expenditure
Figure 101 and Table 74 show total user expenditures in EU28 for all policy options (total
stock). Table 75 shows the savings distributed for each type of tumble driers. Looking at
the figures, two major effects are apparent: (1) An increase in the product price appears
instantaneous, which is more evident for PO1b and PO2 due to higher average price of
heat pump driers, and, (2) the effect from an increase in efficiency (saved costs during
use) appears only gradually. In other words, all added expenses associated with buying a
more efficient product appear at the year of purchase, whereas the savings from switching
stock gradually to more efficient driers are spread out over the whole lifetime of the
products.
The first effect is the major increase in user expenditure in 2023 for PO1b and PO2. This
is due to the increase in unit price, as sales of heating element driers disappear and are
replaced with more expensive types. See Figure 94 above which illustrates the difference
in the sales distribution between PO1b/PO2 and BAU.
The initial cost is thus high, but as the market gradually changes to heat pump driers, the
lower energy consumption (lower energy costs) counteracts the effects of the higher unit
price, and thus lowers total consumer expenditure to a level below BAU in 2029 for PO2.
The lifetime of 12 years314 means that the whole stock is replaced around 2035 where the
314 And a standard diviation of +/-2 years.
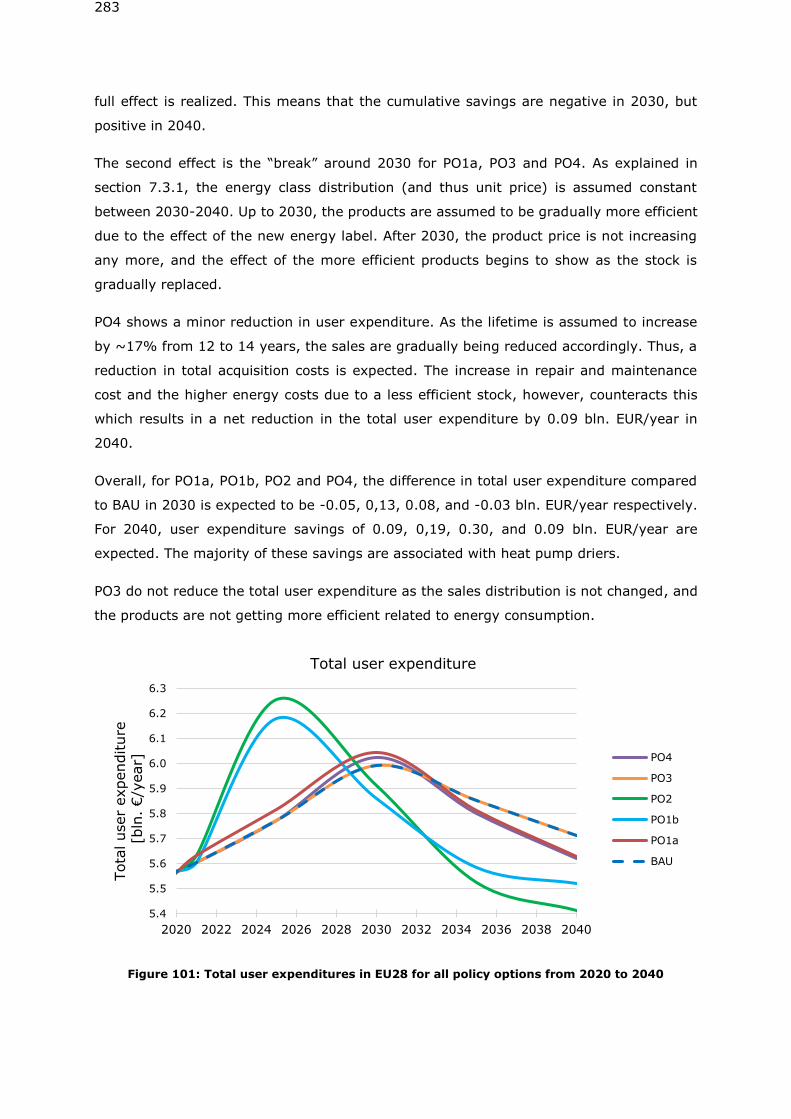
283
full effect is realized. This means that the cumulative savings are negative in 2030, but
positive in 2040.
The second effect is the “break” around 2030 for PO1a, PO3 and PO4. As explained in
section 7.3.1, the energy class distribution (and thus unit price) is assumed constant
between 2030-2040. Up to 2030, the products are assumed to be gradually more efficient
due to the effect of the new energy label. After 2030, the product price is not increasing
any more, and the effect of the more efficient products begins to show as the stock is
gradually replaced.
PO4 shows a minor reduction in user expenditure. As the lifetime is assumed to increase
by ~17% from 12 to 14 years, the sales are gradually being reduced accordingly. Thus, a
reduction in total acquisition costs is expected. The increase in repair and maintenance
cost and the higher energy costs due to a less efficient stock, however, counteracts this
which results in a net reduction in the total user expenditure by 0.09 bln. EUR/year in
2040.
Overall, for PO1a, PO1b, PO2 and PO4, the difference in total user expenditure compared
to BAU in 2030 is expected to be -0.05, 0,13, 0.08, and -0.03 bln. EUR/year respectively.
For 2040, user expenditure savings of 0.09, 0,19, 0.30, and 0.09 bln. EUR/year are
expected. The majority of these savings are associated with heat pump driers.
PO3 do not reduce the total user expenditure as the sales distribution is not changed, and
the products are not getting more efficient related to energy consumption.
Figure 101: Total user expenditures in EU28 for all policy options from 2020 to 2040
5.4
5.5
5.6
5.7
5.8
5.9
6.0
6.1
6.2
6.3
2020 2022 2024 2026 2028 2030 2032 2034 2036 2038 2040
Tota
l user
expenditure
[bln
. €/y
ear]
Total user expenditure
PO4
PO3
PO2
PO1b
PO1a
BAU
284
Table 74: Total user expenditures and cumulative savings for all policy options
Total user expenditure [bln. EUR/year]
Savings*
compared to BAU
Cumulative savings
2021 2025 2030 2035 2040 2030 2040 2030 2040
BAU 5.60 5.77 5.99 5.85 5.71 - - - -
PO1a 5.63 5.82 6.04 5.81 5.63 -0.05* 0.09 -0.44* -0.04*
PO1b 5.60 6.18 5.86 5.58 5.52 0.13 0.19 -1.88* 0.39
PO2 5.63 6.26 5.91 5.52 5.41 0.08 0.30 -2.48* 0.36
PO3 5.60 5.77 5.99 5.85 5.71 - - - -
PO4 5.60 5.77 6.03 5.80 5.62 -0.03* 0.09 -0.05* 0.38
*=negative savings are increased user expenditure
Table 75: Savings of total user expenditure by tumble drier type
Savings per tumble drier type, Total user Expenditure [bln.
EUR/year], 2030
PO1a PO1b PO2 PO3 PO4
HE-C 0.00 1.10 1.10 0.00 -0.01
HP-C -0.05 -1.09 -1.14 0.00 -0.02
HE-V 0.00 0.12 0.12 0.00 0.00
GAS 0.00 0.00 0.00 0.00 0.00
Industry and manufacturers turnover
Figure 102 and Table 76 show the total retail turnover for all policy options. Similarly,
Figure 103 and Table 77 show the total manufacturers’ turnover for all policy options.
PO1a/b and PO2 result in an increase in retail turnover due to the products getting more
efficient but more expensive. The large increase in turnover for PO1b and PO2 is due to
the more stringent ecodesign limits.
PO3 do not reduce the total user expenditure as the sales distribution is not changed.
PO4 reduces the retail turnover as fewer models are sold. For the manufacturers, however,
the increase in repair services and sale of spare parts counteracts this and actually
increases the turnover. This is however very dependent on the added repair costs, which
are investigated in the sensitivity analysis (section 7.4).
Overall, PO1a, PO1b, and PO2 are expected to increase retail turnover by 0.18, 0.32, and
0.52 bln. EUR/year in 2030, equivalent to an increase of 5%, 9%, and 16% respectively.
PO4 is expected to reduce the retail turnover by 0.04 and 0.56 bln. EUR/year in 2030 and
2040 respectively.
For manufacturers’ turnover, PO1a, PO1b, PO2, and PO4 are expected to increase the
turnover by 0.06, 0.11, 0.19, and 0.04 bln. EUR/year respectively in 2030.
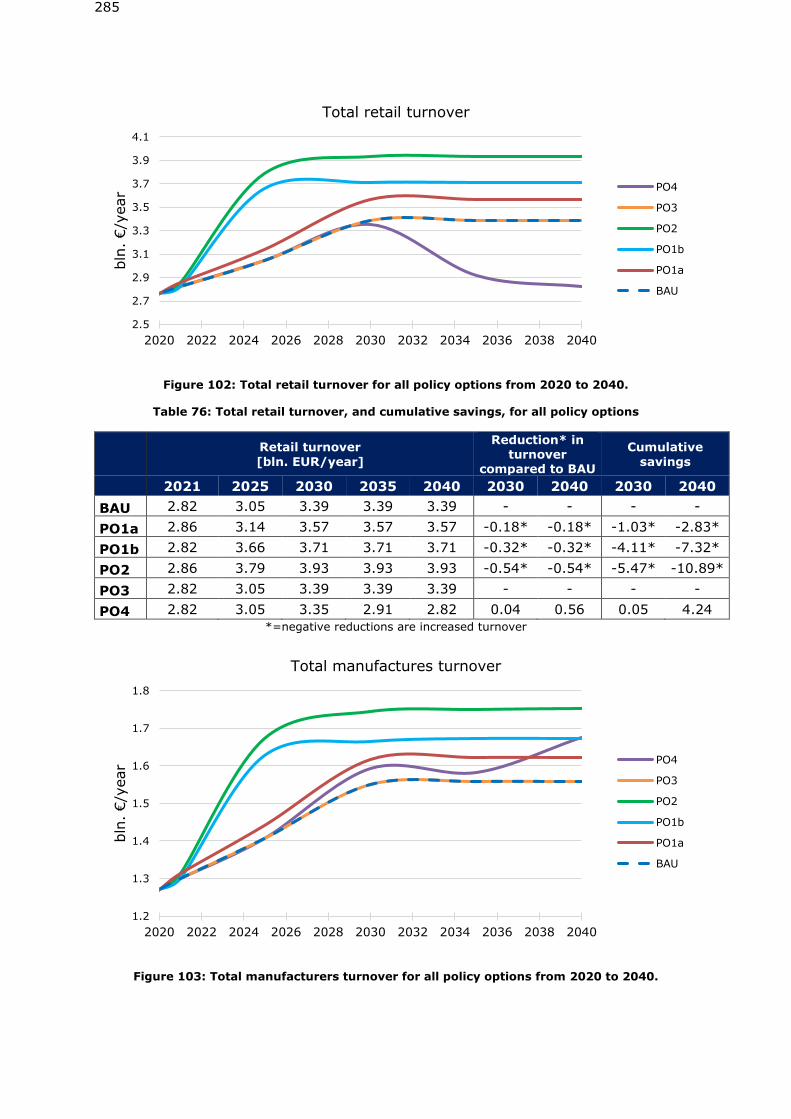
285
Figure 102: Total retail turnover for all policy options from 2020 to 2040.
Table 76: Total retail turnover, and cumulative savings, for all policy options
Retail turnover
[bln. EUR/year]
Reduction* in turnover
compared to BAU
Cumulative
savings
2021 2025 2030 2035 2040 2030 2040 2030 2040
BAU 2.82 3.05 3.39 3.39 3.39 - - - -
PO1a 2.86 3.14 3.57 3.57 3.57 -0.18* -0.18* -1.03* -2.83*
PO1b 2.82 3.66 3.71 3.71 3.71 -0.32* -0.32* -4.11* -7.32*
PO2 2.86 3.79 3.93 3.93 3.93 -0.54* -0.54* -5.47* -10.89*
PO3 2.82 3.05 3.39 3.39 3.39 - - - -
PO4 2.82 3.05 3.35 2.91 2.82 0.04 0.56 0.05 4.24
*=negative reductions are increased turnover
Figure 103: Total manufacturers turnover for all policy options from 2020 to 2040.
2.5
2.7
2.9
3.1
3.3
3.5
3.7
3.9
4.1
2020 2022 2024 2026 2028 2030 2032 2034 2036 2038 2040
bln
. €/y
ear
Total retail turnover
PO4
PO3
PO2
PO1b
PO1a
BAU
1.2
1.3
1.4
1.5
1.6
1.7
1.8
2020 2022 2024 2026 2028 2030 2032 2034 2036 2038 2040
bln
. €/y
ear
Total manufactures turnover
PO4
PO3
PO2
PO1b
PO1a
BAU
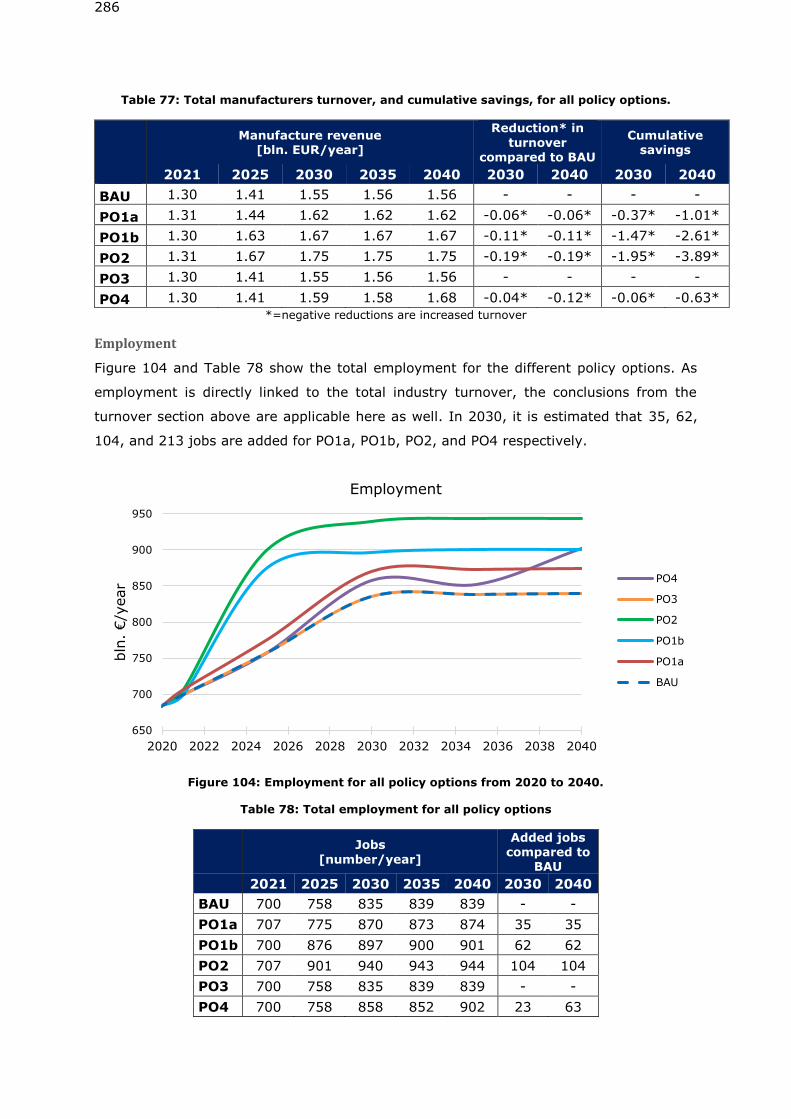
286
Table 77: Total manufacturers turnover, and cumulative savings, for all policy options.
Manufacture revenue [bln. EUR/year]
Reduction* in
turnover compared to BAU
Cumulative savings
2021 2025 2030 2035 2040 2030 2040 2030 2040
BAU 1.30 1.41 1.55 1.56 1.56 - - - -
PO1a 1.31 1.44 1.62 1.62 1.62 -0.06* -0.06* -0.37* -1.01*
PO1b 1.30 1.63 1.67 1.67 1.67 -0.11* -0.11* -1.47* -2.61*
PO2 1.31 1.67 1.75 1.75 1.75 -0.19* -0.19* -1.95* -3.89*
PO3 1.30 1.41 1.55 1.56 1.56 - - - -
PO4 1.30 1.41 1.59 1.58 1.68 -0.04* -0.12* -0.06* -0.63*
*=negative reductions are increased turnover
Employment
Figure 104 and Table 78 show the total employment for the different policy options. As
employment is directly linked to the total industry turnover, the conclusions from the
turnover section above are applicable here as well. In 2030, it is estimated that 35, 62,
104, and 213 jobs are added for PO1a, PO1b, PO2, and PO4 respectively.
Figure 104: Employment for all policy options from 2020 to 2040.
Table 78: Total employment for all policy options
Jobs
[number/year]
Added jobs compared to
BAU
2021 2025 2030 2035 2040 2030 2040
BAU 700 758 835 839 839 - -
PO1a 707 775 870 873 874 35 35
PO1b 700 876 897 900 901 62 62
PO2 707 901 940 943 944 104 104
PO3 700 758 835 839 839 - -
PO4 700 758 858 852 902 23 63
650
700
750
800
850
900
950
2020 2022 2024 2026 2028 2030 2032 2034 2036 2038 2040
bln
. €/y
ear
Employment
PO4
PO3
PO2
PO1b
PO1a
BAU
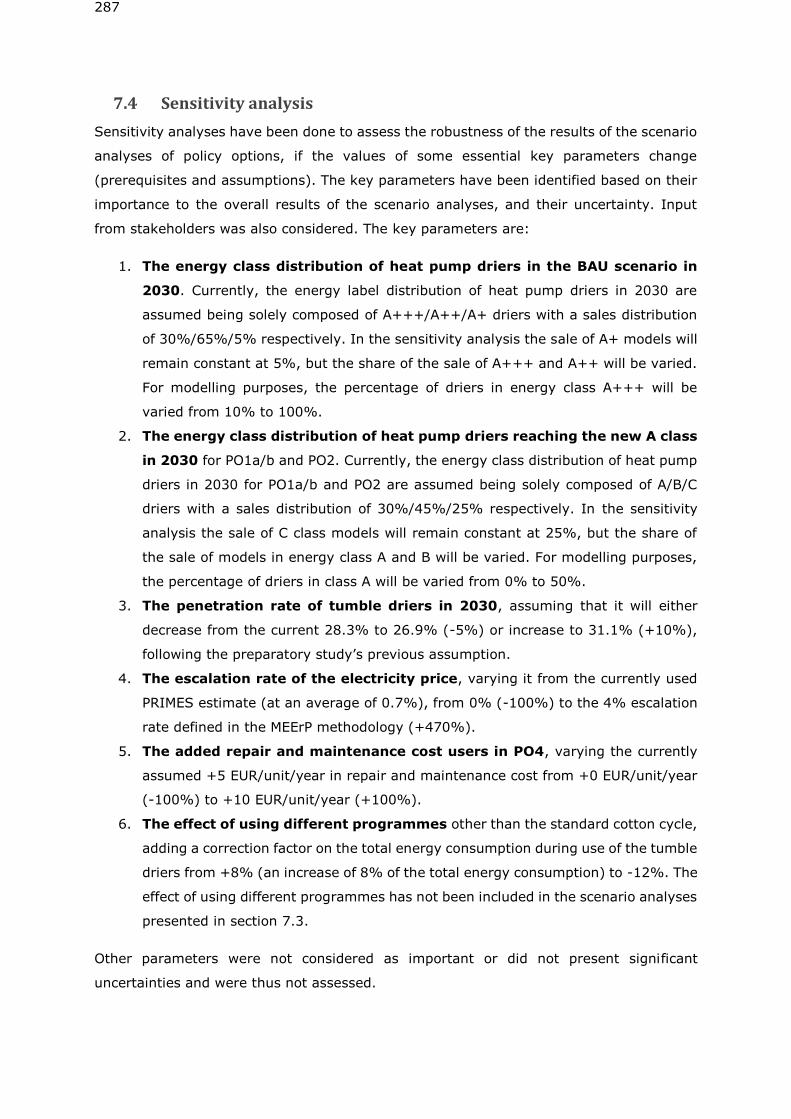
287
7.4 Sensitivity analysis
Sensitivity analyses have been done to assess the robustness of the results of the scenario
analyses of policy options, if the values of some essential key parameters change
(prerequisites and assumptions). The key parameters have been identified based on their
importance to the overall results of the scenario analyses, and their uncertainty. Input
from stakeholders was also considered. The key parameters are:
1. The energy class distribution of heat pump driers in the BAU scenario in
2030. Currently, the energy label distribution of heat pump driers in 2030 are
assumed being solely composed of A+++/A++/A+ driers with a sales distribution
of 30%/65%/5% respectively. In the sensitivity analysis the sale of A+ models will
remain constant at 5%, but the share of the sale of A+++ and A++ will be varied.
For modelling purposes, the percentage of driers in energy class A+++ will be
varied from 10% to 100%.
2. The energy class distribution of heat pump driers reaching the new A class
in 2030 for PO1a/b and PO2. Currently, the energy class distribution of heat pump
driers in 2030 for PO1a/b and PO2 are assumed being solely composed of A/B/C
driers with a sales distribution of 30%/45%/25% respectively. In the sensitivity
analysis the sale of C class models will remain constant at 25%, but the share of
the sale of models in energy class A and B will be varied. For modelling purposes,
the percentage of driers in class A will be varied from 0% to 50%.
3. The penetration rate of tumble driers in 2030, assuming that it will either
decrease from the current 28.3% to 26.9% (-5%) or increase to 31.1% (+10%),
following the preparatory study’s previous assumption.
4. The escalation rate of the electricity price, varying it from the currently used
PRIMES estimate (at an average of 0.7%), from 0% (-100%) to the 4% escalation
rate defined in the MEErP methodology (+470%).
5. The added repair and maintenance cost users in PO4, varying the currently
assumed +5 EUR/unit/year in repair and maintenance cost from +0 EUR/unit/year
(-100%) to +10 EUR/unit/year (+100%).
6. The effect of using different programmes other than the standard cotton cycle,
adding a correction factor on the total energy consumption during use of the tumble
driers from +8% (an increase of 8% of the total energy consumption) to -12%. The
effect of using different programmes has not been included in the scenario analyses
presented in section 7.3.
Other parameters were not considered as important or did not present significant
uncertainties and were thus not assessed.
288
The effects are evaluated by assessing the results according to the following indicators:
• Energy consumption during use
• Total GHG emissions
• Total material consumption
• Total user expenditure
The results are presented in absolute numbers in Table 79 to Table 84 for the 6 parameters
described above. Columns in bold font correspond to the values used in the scenario
analyses and the rest of the columns show the variations during this analysis. The total
GHG emissions are not shown as they closely follow the total energy consumption.
Furthermore, the total material consumption is only impacted by the penetration rate.
For a graphical representation of the variation of all the parameters and their effect on the
chosen indicators, see Annex IX.
Table 79: The effect on relevant indicators by the BAU/PO1b market distribution of A+++ heat pump driers in 2030
BAU percentage of A+++ driers sold in 2030
0% 20% 30% 50% 80% 100%
Total user expenditure [bln. €/year]
BAU 5.97 5.98 5.99 6.01 6.04 6.05
PO1a 6.04 6.04 6.04 6.04 6.04 6.04
PO1b 5.83 5.85 5.86 5.88 5.91 5.93
PO2 5.91 5.91 5.91 5.91 5.91 5.91
PO3 5.97 5.98 5.99 6.01 6.04 6.05
PO4 6.00 6.02 6.03 6.04 6.07 6.09
Energy consumption during use [TWh/year]
BAU 10.8 10.7 10.7 10.5 10.4 10.2
PO1a 10.1 10.1 10.1 10.1 10.1 10.1
PO1b 8.8 8.6 8.5 8.4 8.1 7.9
PO2 7.7 7.7 7.7 7.7 7.7 7.7
PO3 10.8 10.7 10.7 10.5 10.4 10.2
PO4 10.9 10.8 10.7 10.6 10.4 10.3
Table 80: The effect on relevant indicators by the PO1a/PO2 market distribution of A heat pump driers in 2030
PO1/PO2 percentage of A-class driers sold in 2030
0% 20% 30% 50%
Total user expenditure [bln. €/year]
PO1a 6.02 6.04 6.04 6.06
PO1b 5.86 5.86 5.86 5.86
PO2 5.88 5.90 5.91 5.93
Energy consumption during use [TWh/year]
PO1a 10.2 10.1 10.1 9.9
PO1b 8.5 8.5 8.5 8.5
PO2 8.0 7.8 7.7 7.6
289
Table 81: The effect on total user expenditure by the escalation rate in 2030
Escalation rate 0.0% PRIMES 2.5% 4.0%
To
tal u
ser
exp
end
itu
re
[bln
. E
UR
/ye
ar]
BAU 5.78 5.99 6.63 7.29
PO1a 5.85 6.04 6.65 7.26
PO1b 5.69 5.86 6.37 6.89
PO2 5.76 5.91 6.38 6.85
PO3 5.78 5.99 6.63 7.29
PO4 5.81 6.03 6.67 7.33
Table 82: The effect on relevant indicators by the penetration rate in 2030
Penetration rate 26.9% 28.3% 30.3% 31.1%
Total user expenditure [bln. €/year]
BAU 5.69 5.99 6.41 6.59
PO1a 5.74 6.04 6.47 6.65
PO1b 5.57 5.86 6.27 6.45
PO2 5.62 5.91 6.33 6.50
PO3 5.69 5.99 6.41 6.59
PO4 5.72 6.03 6.45 6.63
Energy consumption during use [TWh/year]
BAU 10.1 10.7 11.4 11.7
PO1a 9.6 10.1 10.8 11.1
PO1b 8.1 8.5 9.1 9.4
PO2 7.3 7.7 8.3 8.5
PO3 10.1 10.7 11.4 11.7
PO4 10.2 10.7 11.5 11.8
Total raw material consumption
[mt. Raw materials/year]
BAU 294 309 331 340
PO1a 294 309 331 340
PO1b 305 321 343 353
PO2 305 321 343 353
PO3 294 309 331 340
PO4 290 306 327 336
Table 83: The effect on the total user expenditure by the added repair and maintenance cost of PO4 in 2030
Added repair cost for PO4 [+€/unit/year]
0 2 4 5 6 8 10
Total user expenditure [bln. €/year]
PO4 5.97 5.99 6.01 6.03 6.04 6.06 6.08
290
Table 84: The effect on total user expenditure and total energy consumption during use by the change in energy consumption due to using programmes other than the standard cotton cycle
in 2030
Change in energy consumption due to
programmes +8.0% +4.0% +0.0% -4.0% -8.0% -12.0%
Tota
l user
expend
iture
[bln
. €/y
ear]
BAU 6.17 6.08 5.99 5.90 5.81 5.72
PO1a 6.22 6.13 6.04 5.96 5.87 5.79
PO1b 6.00 5.93 5.86 5.79 5.72 5.64
PO2 6.04 5.98 5.91 5.85 5.78 5.72
PO4 6.21 6.12 6.03 5.93 5.84 5.75
Energ
y
consum
ptio
n
durin
g u
se
[TW
h/y
ear]
BAU 11.5 11.3 11.1 10.9 10.7 10.4
PO1a 10.9 10.7 10.5 10.3 10.1 9.9
PO1b 9.2 9.0 8.9 8.7 8.5 8.4
PO2 8.3 8.2 8.0 7.9 7.7 7.6
PO4 11.6 11.4 11.2 10.9 10.7 10.5
The results show that the penetration rate of tumble driers in household is by far the
parameter that to the largest extent influence and chance the results of the analyses. It
directly affects the sales and stock figures which subsequently affect the same way all the
parameters. A 10% (e.g. 28.3% → 31.1%) increase in penetration rate of driers in the
households roughly corresponds to a 10% increase in the total user expenditure, energy
consumption (due to the stock being 10% larger), GHG emissions, and material
consumption.
The escalation rate of electricity price is the second most important parameter affecting
the total user expenditure. The rate used in the latest studies, PRIMES, corresponds to an
average increase in electric price for households at about 0.7% per year. Increasing this
rate to 4% (e.g. an almost 470% increase) increases the total user expenditure by an
average (across the POs) of 7.3%. The variation between the POs are small (see Table
81), with PO2 being less affected by the escalation rate compared to the other POs as the
energy consumption for this policy option is lower.
The market distribution of A+++ heat pump driers in BAU scenario is important for the
estimated effect of the proposed energy labelling scheme. Currently it is assumed that
30% of heat pump driers sold in 2030 will be in energy class A+++. Increasing this number
effectively increases the assumed progression of the current market and thus reduces the
effect the difference between the BAU scenario and PO1a/PO1b/PO2. Increasing the
assumed number from 30% to e.g. 80% would reduce the gap in electricity consumption
between BAU and PO2 by 0.3 TWh in 2030 (see Table 79). Worth noticing is, that the total
291
user expenditures for BAU exceeds that of PO1a at 80% of higher. This is because a higher
market share of A+++ driers would result in higher average acquisition costs and as the
energy savings are spread out during the driers lifetime, this means the natural progression
of the BAU scenario is thus assumed higher than that of the PO1a scenario.
The share of tumble driers in energy class A in 2030 in the PO1a/PO2 is equally important
for total user expenditure and energy consumption during use as it describes the assumed
technological progress. Even if the assumed A-label drier distribution is assumed to be 0%
the energy consumption during use in 2030 is still lower for PO2 than BAU. This ensures
that the currently assumed 30% market share of A driers is not determining any major
conclusions, but only the size of the estimated savings potentials.
The added repair and maintenance cost associated with increased lifetime of the driers in
PO4 shows that the total user expenditure in 2030 will be less than BAU only if the added
repair and maintenance cost per year is less than 2 EUR/unit/year (for the scenario
analyses, this was set as 5 EUR/year for PO4). With an increased value at ~7EUR/unit/year,
the user expenditure is expected to be equal to PO1a, and with no changes, it is slightly
higher than BAU.
In 2040, where the effect of all the policy options and the increased repair cost are easier
to fully evaluate, the total user expenditure for PO4 is equal to that of BAU at an added
repair cost of ~6.5EUR/unit/year. At 5EUR/unit/year it is equal to PO1a, and at lower than
2EUR/unit/year PO4 shows lower user expenditures than PO2.
The effect of this policy option is thus extremely dependable on the cost of repair and the
availability of spare parts, once assessed in a longer timeframe, and these are very
important parameters when determining the efficacy of this policy option.
The programmes correction factor is 100% correlated to the energy consumption during
use, as this correction factor is a flat percentage applied across all policy options, tumble
drier types and years. Imposing a 1% reduction in total energy consumption during use
consequently reduces the total user expenditures by ~0.4%. This value varies across the
policy options as a reduction in the total energy consumption reduces the incentives to buy
more efficient driers up to a point where PO2 is no longer the policy option with the lowest
user expenditures in 2030 because the additional cost of the more efficient driers is not
countered by the reduction in energy consumption. For the investigated range (+8% to -
12% change in the total energy consumption), PO2 still remains the best option regarding
user expenditures. For reference, the very limited desktop study conducted in Task 5
concluded that a correction factor of -7.4% annually would be the most reasonable. Using
this factor would not change any of the major conclusions.
292
7.5 Conclusions and recommendations
7.5.1 Policy options
Five policy options have been evaluated based on a number of indicators, three for energy
efficiency and two for resource efficiency.
In order to properly evaluate the effect of the policy options, the year 2040 is more relevant
as a reference year than 2030. This is due to the long lifetime of household tumble driers
(i.e. it takes several years before an effect can be observed in the market). Nevertheless,
both 2030 and 2040 are shown and compared as both years are important to consider in
this assessment, especially regarding the timeframe of the projected savings.
Table 85 and
293
Table 86 list the results for some of the indicators discussed in section 7.3.5 and compares
the different policy options for 2030 and 2040 respectively. Differences are calculated as
the differences between the policy options and BAU. A negative difference thus means a
reduction of e.g. energy consumption. Note that all of the savings in 2040 are attributed
to base cases 1 and 2, as it is assumed that no air-vented driers will be sold after 2029.
Table 85: Differences of policy options compared to BAU values in 2030 (a negative number means a reduction of the parameter compared to BAU)
Differences compared to BAU, 2030
Energy consumption during use
[TWh/year]
GHG [mt. CO2 eq./year]
User expenditure
[bln. EUR/year]
Retail turnover [bln.
EUR/year]
Embedded energy
materials [PJ/year]
Jobs
PO1a -0.61 -0.21 0.05 0.18 - 35
PO1b -2.14 -0.67 -0.13 0.32 0.09 62
PO2 -2.93 -0.94 -0.08 0.54 0.09 104
PO3 - -0.07 - - -0.18 -
PO4 0.07 -0.11 0.03 -0.04 -0.02 23
294
Table 86: Differences of policy options compared to BAU values in 2040 (a negative number means a reduction of the parameter compared to BAU)
Differences compared to BAU, 2040
Energy consumption during use
[TWh/year]
GHG [mt. CO2 eq./year]
User expenditure
[bln. EUR/year]
Retail turnover [bln.
EUR/year]
Embedded energy
materials [PJ/year]
Jobs
PO1a -1.24 -0.37 -0.09 0.18 - 35
PO1b -2.38 -0.66 -0.19 0.32 0.09 62
PO2 -3.93 -1.12 -0.30 0.54 0.09 104
PO3 - -0.09 - - -0.18 -
PO4 0.70 0.03 -0.09 -0.56 -0.32 63
The largest savings in energy use, GHG and user expenditure, and the largest increase in
retail turnover and jobs, are achieved with PO2. In spite of the initial high cost of
consumers’ average expenditure (see Figure 101), it is cheaper in the long run because
the running costs of heat pump driers are lower than those of element driers, when
evaluated over the whole lifetime. This is in spite the heat pump driers are significantly
more expensive than the heating element driers. In the contrary, the embedded energy
for materials increases for PO2, since heat pump driers use more materials thus more
embedded energy than the other driers. In terms of energy efficiency, PO2 shows therefore
the most potential savings and increase in turnover and jobs at the lowest costs for
consumers.
Regarding resource efficiency, the effect of the two policy options is quite different. PO3,
concerning dismantling and recycling presents only GHG emissions and embedded energy
savings due to the increased amount of materials sent for reuse and recycling at end-of-
life. There is no effect on the other indicators because there is no change in the economic
parameters by implementing this policy option. PO4, concerning reparability and durability,
presents changes in all parameters. Also, PO4 takes effect differently in 2030 than in 2040
because of the long timeframe evaluated from prolonging the lifetime of the driers and
thus using less materials but more energy due to the prolonged presence of older driers
on the market. In 2040, consumer expenditure reach net savings and more jobs are
generated because of the increased repair activities. Both policy options could be added
up and compliment the energy efficiency preferred policy option.
The results from the sensitivity analyses show mostly no significant differences on the
effect the evaluated parameters have on each policy option. The evaluated parameters
affect all relevant policy options in a similar way and thus they present a good level of
robustness. Although the effect of PO4 on user expenditure was found quite dependant on
the cost of repair. The penetration and escalation rates create the most significant changes
on some of the indicators. However, the observed effects are no more than +/-5%,
295
considering the evaluated parameters intervals. It is thus assessed that the values
modelled in the scenario analyses are good representatives of the conditions of the market
and are not subject to significant changes on the results. However, the repair costs could
be further investigated because of its higher uncertainty and the effect it has on the efficacy
of PO4.
7.5.2 Base cases
When looking at the contributions per base case, base cases 1 and 2 (condenser driers)
contribute to the largest savings since condenser driers represent the majority on the
market of both sales and stock. A trend that will not change in the future. Their relative
contributions show that for energy during use and GHG emissions, BC2 is the main source
of savings. In some cases, it is BC1 because these products are removed from the market
and this creates net reductions. This is the same for total user expenditure.
The contributions from BC3 and BC4 are relatively low since air-vented tumble driers will
continue to decrease in sales, and gas-fired products will continue to be a niche product
responsible for a very low percentage of the total market. That being said, it is not
recommended to exclude them from the current scope as there is no indication they will
disappear from the market.
As the gas driers are able to reach the EEI levels of heat pump driers due to the current
conversation factor between gas and electricity, they are currently considered quite
efficient, and the current models will be able to stay on the market even after imposing
the most stringent proposed ecodesign requirements. Excluding them from the scope
would not be recommended – even considering the low sales – as they are still considered
a good option when replacing a heating element drier. Excluding them would mean
removing the energy label from them, and thus making it harder for consumers to identify
the real efficiency of a gas-fired drier.
7.5.3 Recommendations
Based on the discussion and analysis throughout the report, the following concrete
recommendation are given:
- Change the EEI calculation method from using energy consumption per year, to
using energy consumption per cycle.
o Scale the reference energy consumption per cycle (SEc) according to the
available data based on the current technological progress and market share
296
of each tumble drier type. This will ensure a lower dependency between the
rated capacity and the energy consumption per cycle.
- Rescale the energy class intervals from A to G, making sure that:
o The A class is empty
o The energy class intervals are placed, as much as possible, evenly so
consumers get a better understanding of the differences between classes.
- Rescale the condensation efficiency classes, distributing tumble driers in 4 classes
instead of 3, and revise the condensation efficiency requirement to 80% (up from
70%), which would exclude 5% of driers on the market.
- Do not exclude gas fired driers from the scope.
- Change the weighting between full and half-loaded cycles when calculating Ec and
Tc to 62% of the rated capacity, instead of the current 71% by changing the
calculation formula
- Remove tumble driers from the horizontal standby regulation and add specific
standby requirements to the new tumble drier ecodesign regulation. Set proposed
maximum consumption levels for low power modes.
- Set ambitious ecodesign limits that ensures that cost effective savings potentials
are utilized by removing all heating element driers from the market as they present
the largest potential savings.
- Ensure that critical spare parts are available for at least 10 years after the
production of a model ceases, to promote a longer average lifetime of the product.
- Technical information on how to disassembly critical components (for repair) and
dismantle materials and components (for end-of-life) should be available in
booklet/technical documentation.
297
I. Annex I: Coverage of market data, sales and stock
Coverage
Country Coverage of GfK
data Population BNP (bill. EUR)
Austria 90% 8 690 076 349.5
Belgium 88% 11 311 117 421.6
Czech Republic 0% 10 538 275 163.9
Germany 74% 82 175 684 3134.0
Denmark 83% 5 659 715 266.2
Spain 83% 46 445 828 1114.0
Finland 82% 5 487 308 214.1
France 90% 66 759 950 2225.0
Great Britain 95% 65 382 556 2367.0
Greece 95% 10 783 748 175.9
Croatia 75% 4 190 669 45.8
Hungary 94% 9 830 485 112.4
Ireland 90% 4 724 720 265.8
Italy 89% 60 665 551 1672.0
Luxembourg 70% 576 249 54.2
Netherland 81% 1 697 9120 697.2
Poland 93% 37 967 209 424.3
Portugal 94% 10 341 330 184.9
Romania 0% 19 760 314 169.6
Sweden 85% 9 851 017 462.4
Slovenia 0% 2 064 188 39.8
Slovakia 0% 5 426 252 81.0
Bulgaria 0% 7 153 784 47.4
Cyprus 0% 848 319 17.9
Latvia 85% 1 968 957 25.0
Lithuania 85% 2 888 558 38.6
Estonia 85% 1 315 944 20.9
Malta 0% 434 403 9.9
Total 510 221 326 14800
Total coverage 78.8% 402.209.861 12247
298
Sales data
Tumble drier sales in each category, 1995 to 2030, in thousand units.
Year HE-C HP-C HE-V GAS-V Total
1995 2,179 - 1,520 0.9 3699
1996 2,273 - 1,586 0.9 3859
1997 2,367 - 1,651 1.0 4019
1998 2,461 - 1,717 1.0 4179
1999 2,556 - 1,783 1.1 4339
2000 2,650 - 1,848 1.1 4499
2001 2,591 - 1,807 1.1 4399
2002 2,175 - 1,734 0.9 3910
2003 2,243 - 1,565 0.9 3809
2004 2,312 - 1,613 1.0 3926
2005 2,380 - 1,661 1.0 4042
2006 2,714 11 1,701 1.1 4427
2007 2,737 21 1,537 0.6 4297
2008 2,707 31 1,356 0.6 4094
2009 2,571 38 1,144 0.5 3753
2010 2,539 341 1,110 0.6 3990
2011 2,385 653 1,022 0.6 4061
2012 2,156 947 902 0.7 4006
2013 1,927 1,227 782 0.7 3937
2014 1,788 1,779 726 0.3 4293
2015 1,778 2,222 745 0.4 4745
2016 1,747 2,584 720 1.1 5053
2017 1,736 2,702 690 1.0 5129
2018 1,721 2,820 657 0.9 5199
2019 1,704 2,937 623 0.7 5264
2020 1,685 3,052 587 0.6 5324
2021 1,663 3,166 549 0.5 5378
2022 1,638 3,277 511 0.4 5426
2023 1,611 3,387 471 0.3 5469
2024 1,581 3,493 429 0.1 5504
2025 1,549 3,597 387 - 5534
2026 1,466 3,777 311 - 5554
2027 1,381 3,953 234 - 5567
2028 1,293 4,125 156 - 5574
2029 1,204 4,292 78 - 5574
2030 1,115 4,459 - - 5574
299
Stock
Calculated stock for all categories, 1995 to 2030, in thousand units.
Year HE-C HP-C HE-V GAS-V Total
1995 13,072 - 9,118 5 22196
1996 15,342 - 10,702 6 26050
1997 17,696 - 12,344 7 30047
1998 20,108 - 14,026 8 34142
1999 22,518 - 15,707 9 38234
2000 24,822 - 17,314 10 42146
2001 26,741 - 18,653 11 45404
2002 27,826 - 19,627 11 47464
2003 28,562 - 20,141 12 48714
2004 29,038 - 20,473 12 49522
2005 29,376 - 20,709 12 50097
2006 29,936 11 20,908 12 50867
2007 30,456 33 20,898 12 51398
2008 30,885 63 20,665 12 51625
2009 31,121 101 20,179 11 51412
2010 31,258 442 19,610 11 51321
2011 31,191 1,095 18,912 10 51209
2012 30,874 2,042 18,070 10 50996
2013 30,343 3,269 17,106 10 50728
2014 29,710 5,047 16,107 9 50873
2015 29,095 7,268 15,160 8 51531
2016 28,444 9,849 14,223 9 52524
2017 27,736 12,543 13,289 9 53577
2018 26,946 15,343 12,369 9 54667
2019 26,081 18,233 11,487 9 55809
2020 25,174 21,183 10,666 8 57032
2021 24,272 24,147 9,923 8 58350
2022 23,420 27,062 9,258 8 59749
2023 22,655 29,863 8,663 8 61189
2024 21,998 32,489 8,124 7 62619
2025 21,453 34,891 7,627 7 63978
2026 20,952 37,120 7,121 6 65199
2027 20,464 39,174 6,588 5 66231
2028 19,956 41,081 6,015 5 67056
2029 19,400 42,891 5,395 4 67690
2030 18,783 44,662 4,727 3 68175
300
II. Annex II: Guidelines supporting the WEEE Directive
The WEEE Directive contains several parts supporting resource efficiency and selective
requirements. How the Directive is interpreted and adopted to the member states can vary
greatly. Based on WEEE-Directive special articles and annexes are highlighted below to
pinpoint which design improvements which could comply with the Directive:
• Article 4, Product design: “Member States shall, without prejudice to the
requirements of Union legislation on the proper functioning of the internal market
and on product design, including Directive 2009/125/EC, encourage cooperation
between producers and recyclers and measures to promote the design and
production of EEE, notably in view of facilitating re-use, dismantling and recovery
of WEEE, its components and materials.”
• Article 8, Proper treatment:
o Member States shall ensure that all separately collected WEEE undergoes
proper treatment including the removal of the following components
following substances, mixtures and components:
▪ Mercury containing components, such as switches or backlighting
lamps
▪ Batteries
▪ Printed circuit boards of mobile phones generally, and of other
devices if the surface of the printed circuit board is greater than 10
square centimetres,
▪ Plastic containing brominated flame retardants,
▪ Chlorofluorocarbons (CFC), hydrochlorofluorocarbons (HCFC) or
hydrofluorocarbons (HFC), hydrocarbons (HC),
▪ External electric cables,
o The following components of WEEE that is separately collected have to be
treated as indicated:
▪ Equipment containing gases that are ozone depleting or have a global
warming potential (GWP) above 15, such as those contained in foams
and refrigeration circuits: the gases must be properly extracted and
properly treated. Ozone-depleting gases must be treated in
accordance with Regulation
• Article 15 Information for treatment facilities: “In order to facilitate the preparation
for re-use and the correct and environmentally sound treatment of WEEE, including
maintenance, upgrade, refurbishment and recycling, Member States shall take the
necessary measures to ensure that producers provide information free of charge

301
about preparation for re-use and treatment in respect of each type of new EEE
placed for the first time on the Union market within one year after the equipment
is placed on the market.”
Design for re-use, dismantling and recovery of WEEE all fits in the category of design for
repair described in Task 3. The overall purpose of design for repair is to ease the repair
process by allowing easy access to critical components. These parts should ideally be easily
located and changed if possible. If printed circuit boards are located and removed easily it
also fits with the proper treatment definition if this information also are available for the
recycling facilities.
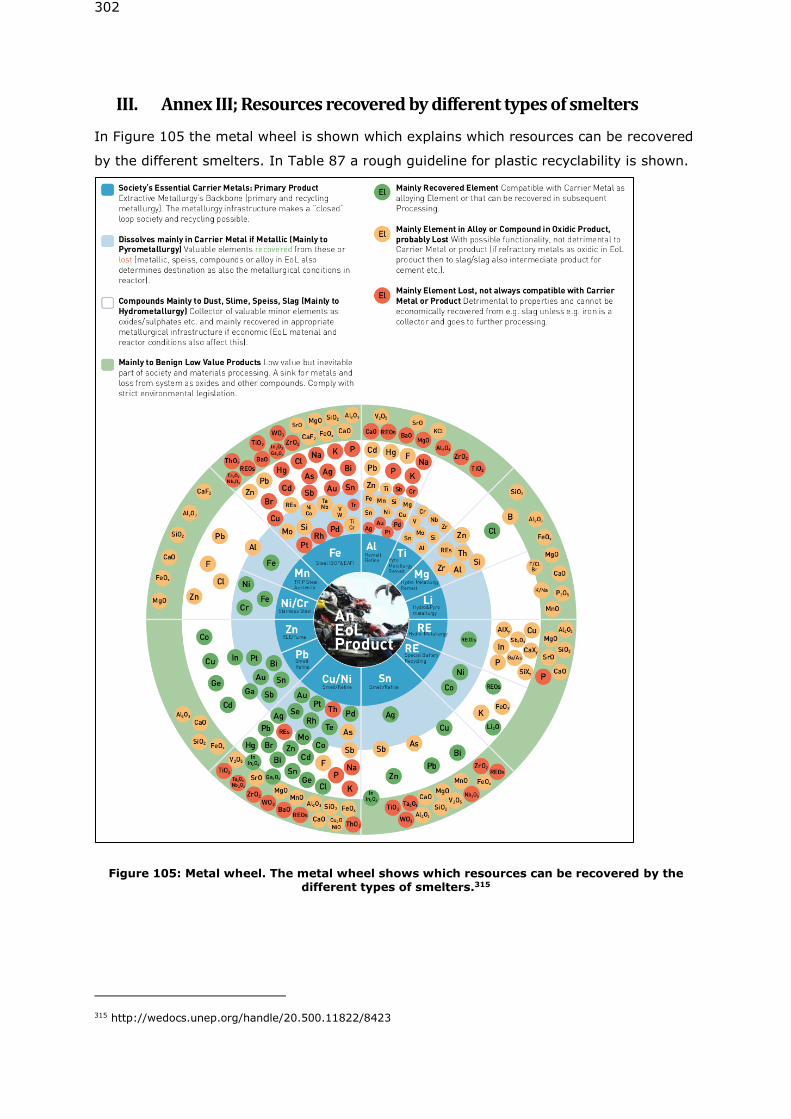
302
III. Annex III; Resources recovered by different types of smelters
In Figure 105 the metal wheel is shown which explains which resources can be recovered
by the different smelters. In Table 87 a rough guideline for plastic recyclability is shown.
Figure 105: Metal wheel. The metal wheel shows which resources can be recovered by the different types of smelters.315
315 http://wedocs.unep.org/handle/20.500.11822/8423
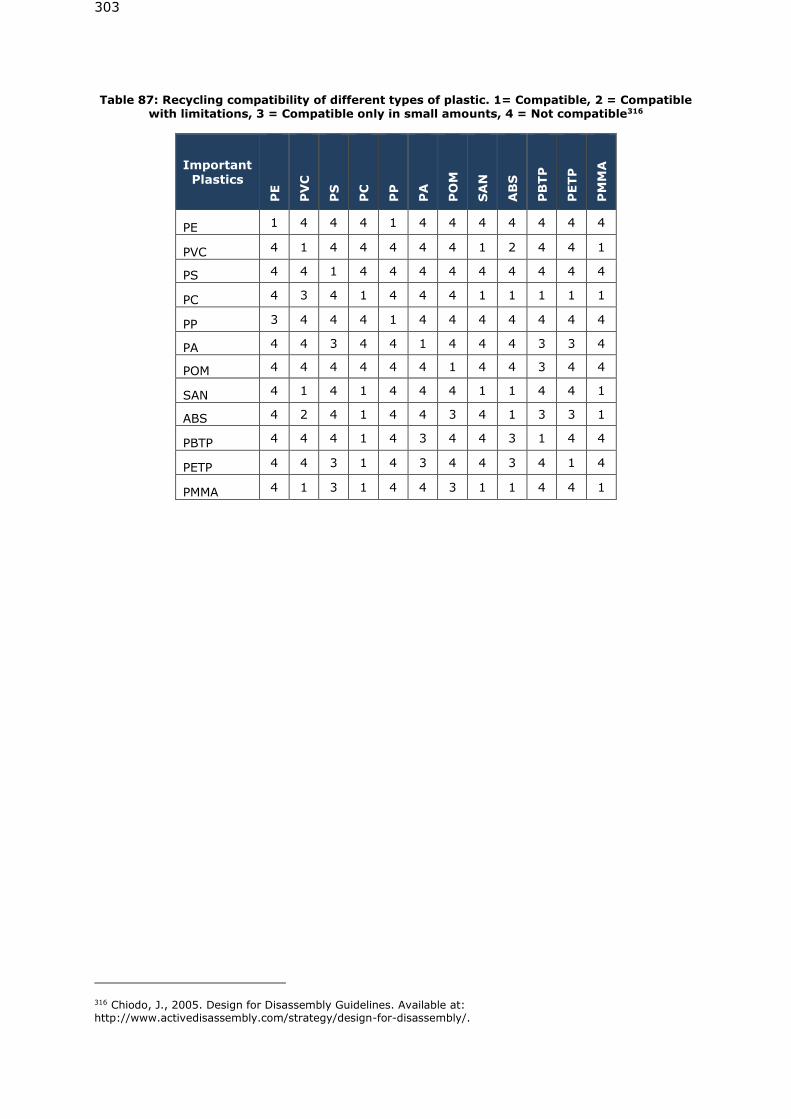
303
Table 87: Recycling compatibility of different types of plastic. 1= Compatible, 2 = Compatible with limitations, 3 = Compatible only in small amounts, 4 = Not compatible316
Important Plastics
PE
PV
C
PS
PC
PP
PA
PO
M
SA
N
AB
S
PB
TP
PETP
PM
MA
PE 1 4 4 4 1 4 4 4 4 4 4 4
PVC 4 1 4 4 4 4 4 1 2 4 4 1
PS 4 4 1 4 4 4 4 4 4 4 4 4
PC 4 3 4 1 4 4 4 1 1 1 1 1
PP 3 4 4 4 1 4 4 4 4 4 4 4
PA 4 4 3 4 4 1 4 4 4 3 3 4
POM 4 4 4 4 4 4 1 4 4 3 4 4
SAN 4 1 4 1 4 4 4 1 1 4 4 1
ABS 4 2 4 1 4 4 3 4 1 3 3 1
PBTP 4 4 4 1 4 3 4 4 3 1 4 4
PETP 4 4 3 1 4 3 4 4 3 4 1 4
PMMA 4 1 3 1 4 4 3 1 1 4 4 1
316 Chiodo, J., 2005. Design for Disassembly Guidelines. Available at: http://www.activedisassembly.com/strategy/design-for-disassembly/.
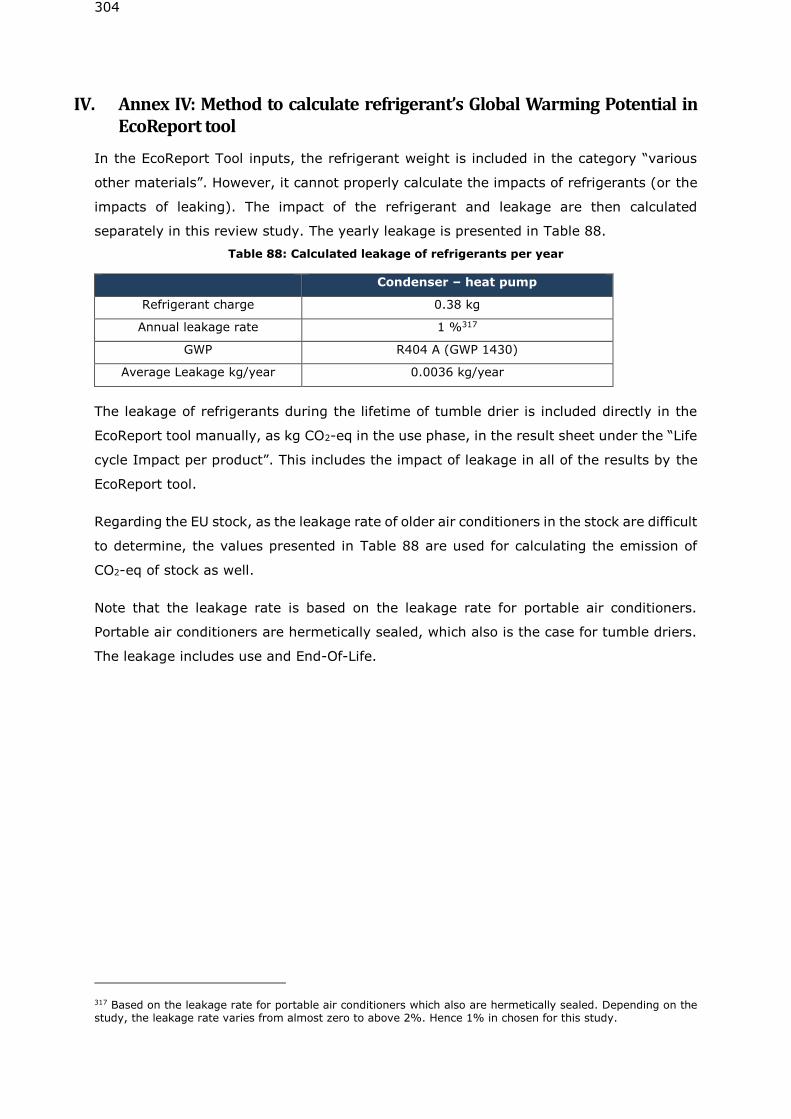
304
IV. Annex IV: Method to calculate refrigerant’s Global Warming Potential in EcoReport tool
In the EcoReport Tool inputs, the refrigerant weight is included in the category “various
other materials”. However, it cannot properly calculate the impacts of refrigerants (or the
impacts of leaking). The impact of the refrigerant and leakage are then calculated
separately in this review study. The yearly leakage is presented in Table 88.
Table 88: Calculated leakage of refrigerants per year
Condenser – heat pump
Refrigerant charge 0.38 kg
Annual leakage rate 1 %317
GWP R404 A (GWP 1430)
Average Leakage kg/year 0.0036 kg/year
The leakage of refrigerants during the lifetime of tumble drier is included directly in the
EcoReport tool manually, as kg CO2-eq in the use phase, in the result sheet under the “Life
cycle Impact per product”. This includes the impact of leakage in all of the results by the
EcoReport tool.
Regarding the EU stock, as the leakage rate of older air conditioners in the stock are difficult
to determine, the values presented in Table 88 are used for calculating the emission of
CO2-eq of stock as well.
Note that the leakage rate is based on the leakage rate for portable air conditioners.
Portable air conditioners are hermetically sealed, which also is the case for tumble driers.
The leakage includes use and End-Of-Life.
317 Based on the leakage rate for portable air conditioners which also are hermetically sealed. Depending on the study, the leakage rate varies from almost zero to above 2%. Hence 1% in chosen for this study.
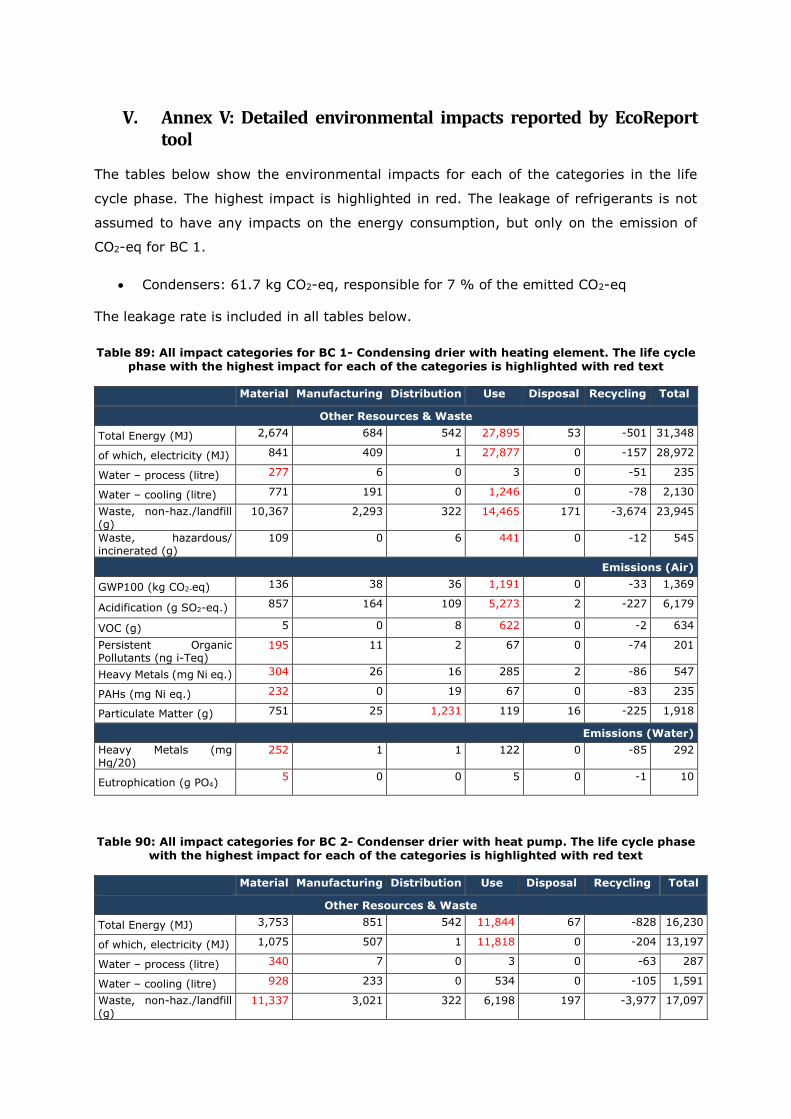
V. Annex V: Detailed environmental impacts reported by EcoReport tool
The tables below show the environmental impacts for each of the categories in the life
cycle phase. The highest impact is highlighted in red. The leakage of refrigerants is not
assumed to have any impacts on the energy consumption, but only on the emission of
CO2-eq for BC 1.
• Condensers: 61.7 kg CO2-eq, responsible for 7 % of the emitted CO2-eq
The leakage rate is included in all tables below.
Table 89: All impact categories for BC 1- Condensing drier with heating element. The life cycle phase with the highest impact for each of the categories is highlighted with red text
Material Manufacturing Distribution Use Disposal Recycling Total
Other Resources & Waste
Total Energy (MJ) 2,674 684 542 27,895 53 -501 31,348
of which, electricity (MJ) 841 409 1 27,877 0 -157 28,972
Water – process (litre) 277 6 0 3 0 -51 235
Water – cooling (litre) 771 191 0 1,246 0 -78 2,130
Waste, non-haz./landfill (g)
10,367 2,293 322 14,465 171 -3,674 23,945
Waste, hazardous/ incinerated (g)
109 0 6 441 0 -12 545
Emissions (Air)
GWP100 (kg CO2-eq) 136 38 36 1,191 0 -33 1,369
Acidification (g SO2-eq.) 857 164 109 5,273 2 -227 6,179
VOC (g) 5 0 8 622 0 -2 634
Persistent Organic Pollutants (ng i-Teq)
195 11 2 67 0 -74 201
Heavy Metals (mg Ni eq.) 304 26 16 285 2 -86 547
PAHs (mg Ni eq.) 232 0 19 67 0 -83 235
Particulate Matter (g) 751 25 1,231 119 16 -225 1,918
Emissions (Water)
Heavy Metals (mg Hg/20)
252 1 1 122 0 -85 292
Eutrophication (g PO4) 5 0 0 5 0 -1 10
Table 90: All impact categories for BC 2- Condenser drier with heat pump. The life cycle phase with the highest impact for each of the categories is highlighted with red text
Material Manufacturing Distribution Use Disposal Recycling Total
Other Resources & Waste
Total Energy (MJ) 3,753 851 542 11,844 67 -828 16,230
of which, electricity (MJ) 1,075 507 1 11,818 0 -204 13,197
Water – process (litre) 340 7 0 3 0 -63 287
Water – cooling (litre) 928 233 0 534 0 -105 1,591
Waste, non-haz./landfill (g)
11,337 3,021 322 6,198 197 -3,977 17,097
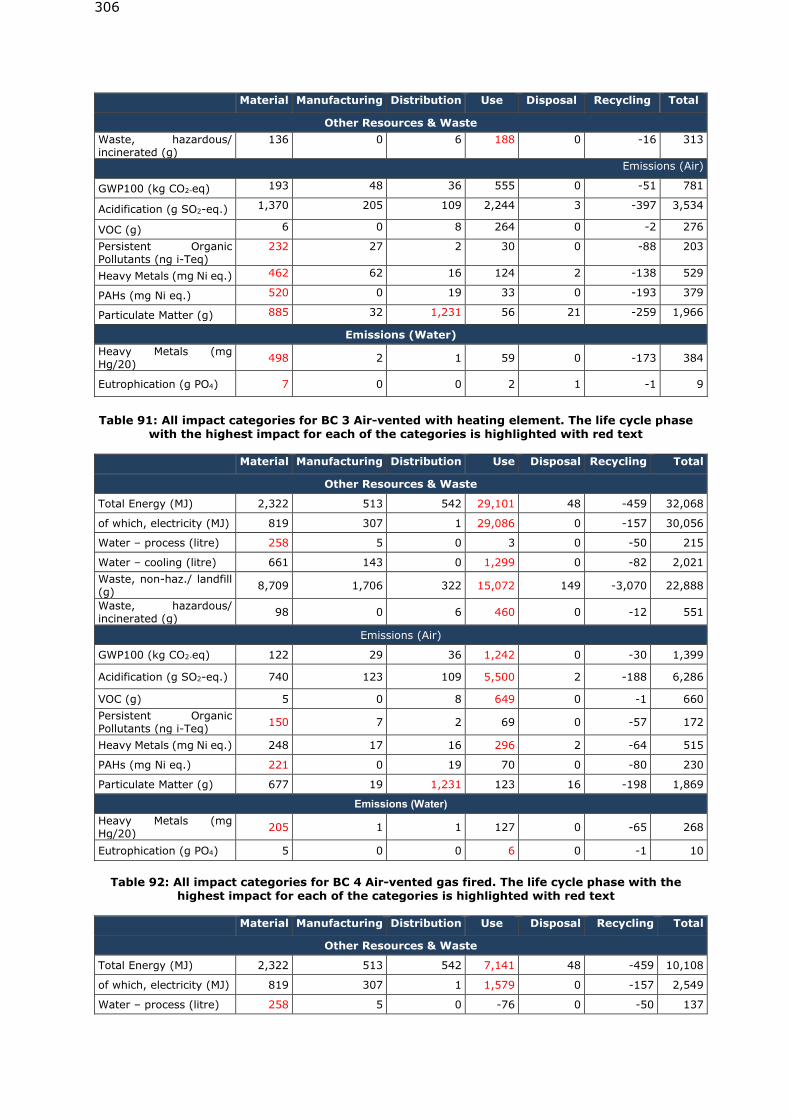
306
Material Manufacturing Distribution Use Disposal Recycling Total
Other Resources & Waste
Waste, hazardous/ incinerated (g)
136 0 6 188 0 -16 313
Emissions (Air)
GWP100 (kg CO2-eq) 193 48 36 555 0 -51 781
Acidification (g SO2-eq.) 1,370 205 109 2,244 3 -397 3,534
VOC (g) 6 0 8 264 0 -2 276
Persistent Organic Pollutants (ng i-Teq)
232 27 2 30 0 -88 203
Heavy Metals (mg Ni eq.) 462 62 16 124 2 -138 529
PAHs (mg Ni eq.) 520 0 19 33 0 -193 379
Particulate Matter (g) 885 32 1,231 56 21 -259 1,966
Emissions (Water)
Heavy Metals (mg Hg/20)
498 2 1 59 0 -173 384
Eutrophication (g PO4) 7 0 0 2 1 -1 9
Table 91: All impact categories for BC 3 Air-vented with heating element. The life cycle phase with the highest impact for each of the categories is highlighted with red text
Material Manufacturing Distribution Use Disposal Recycling Total
Other Resources & Waste
Total Energy (MJ) 2,322 513 542 29,101 48 -459 32,068
of which, electricity (MJ) 819 307 1 29,086 0 -157 30,056
Water – process (litre) 258 5 0 3 0 -50 215
Water – cooling (litre) 661 143 0 1,299 0 -82 2,021
Waste, non-haz./ landfill (g)
8,709 1,706 322 15,072 149 -3,070 22,888
Waste, hazardous/ incinerated (g)
98 0 6 460 0 -12 551
Emissions (Air)
GWP100 (kg CO2-eq) 122 29 36 1,242 0 -30 1,399
Acidification (g SO2-eq.) 740 123 109 5,500 2 -188 6,286
VOC (g) 5 0 8 649 0 -1 660
Persistent Organic Pollutants (ng i-Teq)
150 7 2 69 0 -57 172
Heavy Metals (mg Ni eq.) 248 17 16 296 2 -64 515
PAHs (mg Ni eq.) 221 0 19 70 0 -80 230
Particulate Matter (g) 677 19 1,231 123 16 -198 1,869
Emissions (Water)
Heavy Metals (mg Hg/20)
205 1 1 127 0 -65 268
Eutrophication (g PO4) 5 0 0 6 0 -1 10
Table 92: All impact categories for BC 4 Air-vented gas fired. The life cycle phase with the
highest impact for each of the categories is highlighted with red text
Material Manufacturing Distribution Use Disposal Recycling Total
Other Resources & Waste
Total Energy (MJ) 2,322 513 542 7,141 48 -459 10,108
of which, electricity (MJ) 819 307 1 1,579 0 -157 2,549
Water – process (litre) 258 5 0 -76 0 -50 137
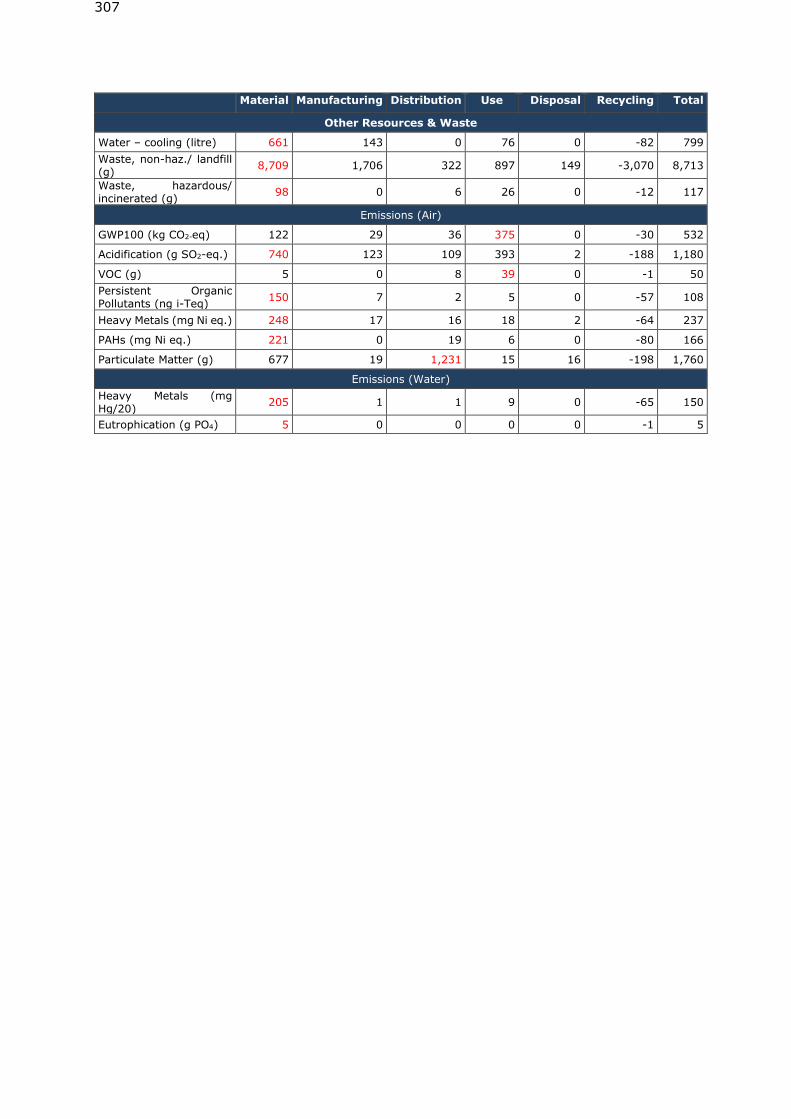
307
Material Manufacturing Distribution Use Disposal Recycling Total
Other Resources & Waste
Water – cooling (litre) 661 143 0 76 0 -82 799
Waste, non-haz./ landfill (g)
8,709 1,706 322 897 149 -3,070 8,713
Waste, hazardous/ incinerated (g)
98 0 6 26 0 -12 117
Emissions (Air)
GWP100 (kg CO2-eq) 122 29 36 375 0 -30 532
Acidification (g SO2-eq.) 740 123 109 393 2 -188 1,180
VOC (g) 5 0 8 39 0 -1 50
Persistent Organic Pollutants (ng i-Teq)
150 7 2 5 0 -57 108
Heavy Metals (mg Ni eq.) 248 17 16 18 2 -64 237
PAHs (mg Ni eq.) 221 0 19 6 0 -80 166
Particulate Matter (g) 677 19 1,231 15 16 -198 1,760
Emissions (Water)
Heavy Metals (mg Hg/20)
205 1 1 9 0 -65 150
Eutrophication (g PO4) 5 0 0 0 0 -1 5
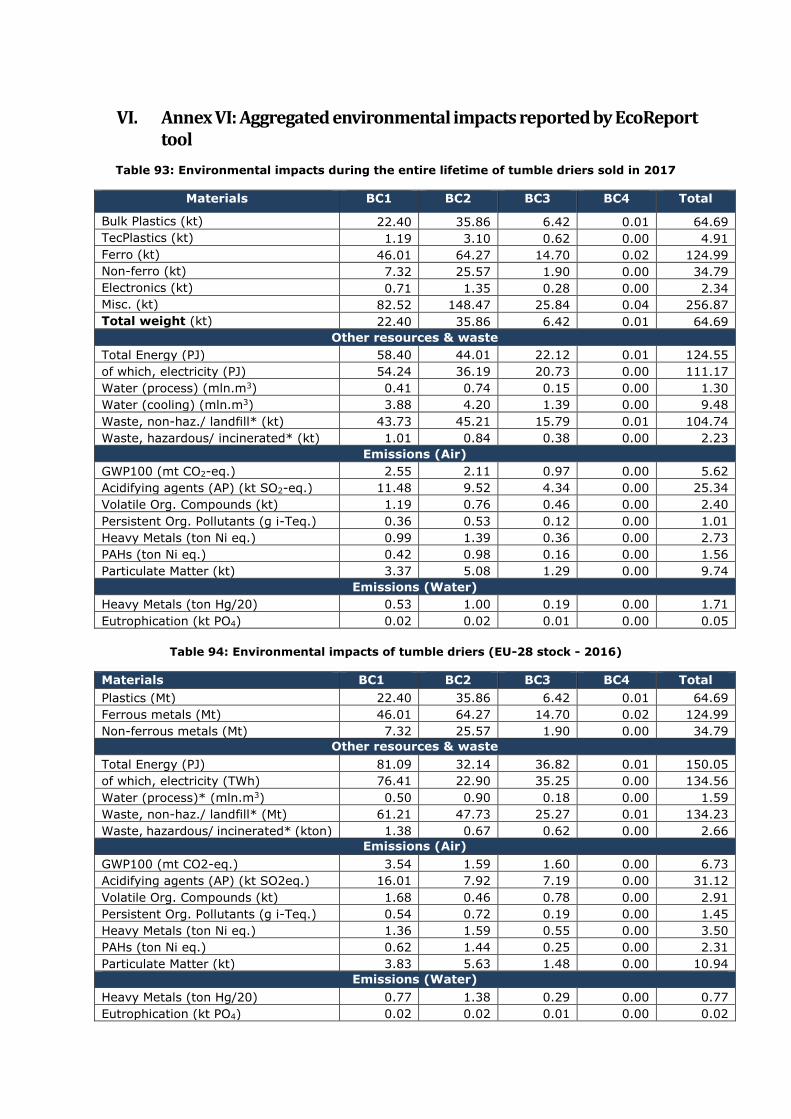
VI. Annex VI: Aggregated environmental impacts reported by EcoReport tool
Table 93: Environmental impacts during the entire lifetime of tumble driers sold in 2017
Materials BC1 BC2 BC3 BC4 Total
Bulk Plastics (kt) 22.40 35.86 6.42 0.01 64.69
TecPlastics (kt) 1.19 3.10 0.62 0.00 4.91
Ferro (kt) 46.01 64.27 14.70 0.02 124.99
Non-ferro (kt) 7.32 25.57 1.90 0.00 34.79
Electronics (kt) 0.71 1.35 0.28 0.00 2.34
Misc. (kt) 82.52 148.47 25.84 0.04 256.87
Total weight (kt) 22.40 35.86 6.42 0.01 64.69
Other resources & waste
Total Energy (PJ) 58.40 44.01 22.12 0.01 124.55
of which, electricity (PJ) 54.24 36.19 20.73 0.00 111.17
Water (process) (mln.m3) 0.41 0.74 0.15 0.00 1.30
Water (cooling) (mln.m3) 3.88 4.20 1.39 0.00 9.48
Waste, non-haz./ landfill* (kt) 43.73 45.21 15.79 0.01 104.74
Waste, hazardous/ incinerated* (kt) 1.01 0.84 0.38 0.00 2.23
Emissions (Air)
GWP100 (mt CO2-eq.) 2.55 2.11 0.97 0.00 5.62
Acidifying agents (AP) (kt SO2-eq.) 11.48 9.52 4.34 0.00 25.34
Volatile Org. Compounds (kt) 1.19 0.76 0.46 0.00 2.40
Persistent Org. Pollutants (g i-Teq.) 0.36 0.53 0.12 0.00 1.01
Heavy Metals (ton Ni eq.) 0.99 1.39 0.36 0.00 2.73
PAHs (ton Ni eq.) 0.42 0.98 0.16 0.00 1.56
Particulate Matter (kt) 3.37 5.08 1.29 0.00 9.74
Emissions (Water)
Heavy Metals (ton Hg/20) 0.53 1.00 0.19 0.00 1.71
Eutrophication (kt PO4) 0.02 0.02 0.01 0.00 0.05
Table 94: Environmental impacts of tumble driers (EU-28 stock - 2016)
Materials BC1 BC2 BC3 BC4 Total
Plastics (Mt) 22.40 35.86 6.42 0.01 64.69
Ferrous metals (Mt) 46.01 64.27 14.70 0.02 124.99
Non-ferrous metals (Mt) 7.32 25.57 1.90 0.00 34.79
Other resources & waste
Total Energy (PJ) 81.09 32.14 36.82 0.01 150.05
of which, electricity (TWh) 76.41 22.90 35.25 0.00 134.56
Water (process)* (mln.m3) 0.50 0.90 0.18 0.00 1.59
Waste, non-haz./ landfill* (Mt) 61.21 47.73 25.27 0.01 134.23
Waste, hazardous/ incinerated* (kton) 1.38 0.67 0.62 0.00 2.66
Emissions (Air)
GWP100 (mt CO2-eq.) 3.54 1.59 1.60 0.00 6.73
Acidifying agents (AP) (kt SO2eq.) 16.01 7.92 7.19 0.00 31.12
Volatile Org. Compounds (kt) 1.68 0.46 0.78 0.00 2.91
Persistent Org. Pollutants (g i-Teq.) 0.54 0.72 0.19 0.00 1.45
Heavy Metals (ton Ni eq.) 1.36 1.59 0.55 0.00 3.50
PAHs (ton Ni eq.) 0.62 1.44 0.25 0.00 2.31
Particulate Matter (kt) 3.83 5.63 1.48 0.00 10.94
Emissions (Water)
Heavy Metals (ton Hg/20) 0.77 1.38 0.29 0.00 0.77
Eutrophication (kt PO4) 0.02 0.02 0.01 0.00 0.02
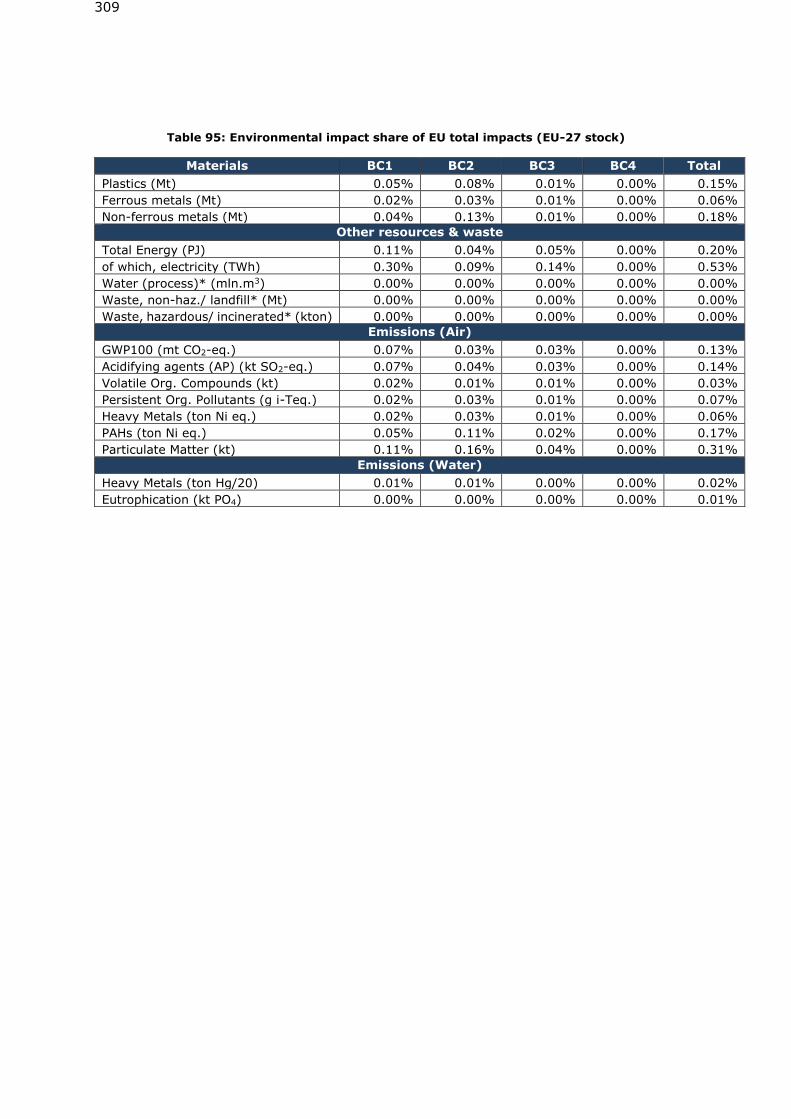
309
Table 95: Environmental impact share of EU total impacts (EU-27 stock)
Materials BC1 BC2 BC3 BC4 Total
Plastics (Mt) 0.05% 0.08% 0.01% 0.00% 0.15%
Ferrous metals (Mt) 0.02% 0.03% 0.01% 0.00% 0.06%
Non-ferrous metals (Mt) 0.04% 0.13% 0.01% 0.00% 0.18%
Other resources & waste
Total Energy (PJ) 0.11% 0.04% 0.05% 0.00% 0.20%
of which, electricity (TWh) 0.30% 0.09% 0.14% 0.00% 0.53%
Water (process)* (mln.m3) 0.00% 0.00% 0.00% 0.00% 0.00%
Waste, non-haz./ landfill* (Mt) 0.00% 0.00% 0.00% 0.00% 0.00%
Waste, hazardous/ incinerated* (kton) 0.00% 0.00% 0.00% 0.00% 0.00%
Emissions (Air)
GWP100 (mt CO2-eq.) 0.07% 0.03% 0.03% 0.00% 0.13%
Acidifying agents (AP) (kt SO2-eq.) 0.07% 0.04% 0.03% 0.00% 0.14%
Volatile Org. Compounds (kt) 0.02% 0.01% 0.01% 0.00% 0.03%
Persistent Org. Pollutants (g i-Teq.) 0.02% 0.03% 0.01% 0.00% 0.07%
Heavy Metals (ton Ni eq.) 0.02% 0.03% 0.01% 0.00% 0.06%
PAHs (ton Ni eq.) 0.05% 0.11% 0.02% 0.00% 0.17%
Particulate Matter (kt) 0.11% 0.16% 0.04% 0.00% 0.31%
Emissions (Water)
Heavy Metals (ton Hg/20) 0.01% 0.01% 0.00% 0.00% 0.02%
Eutrophication (kt PO4) 0.00% 0.00% 0.00% 0.00% 0.01%
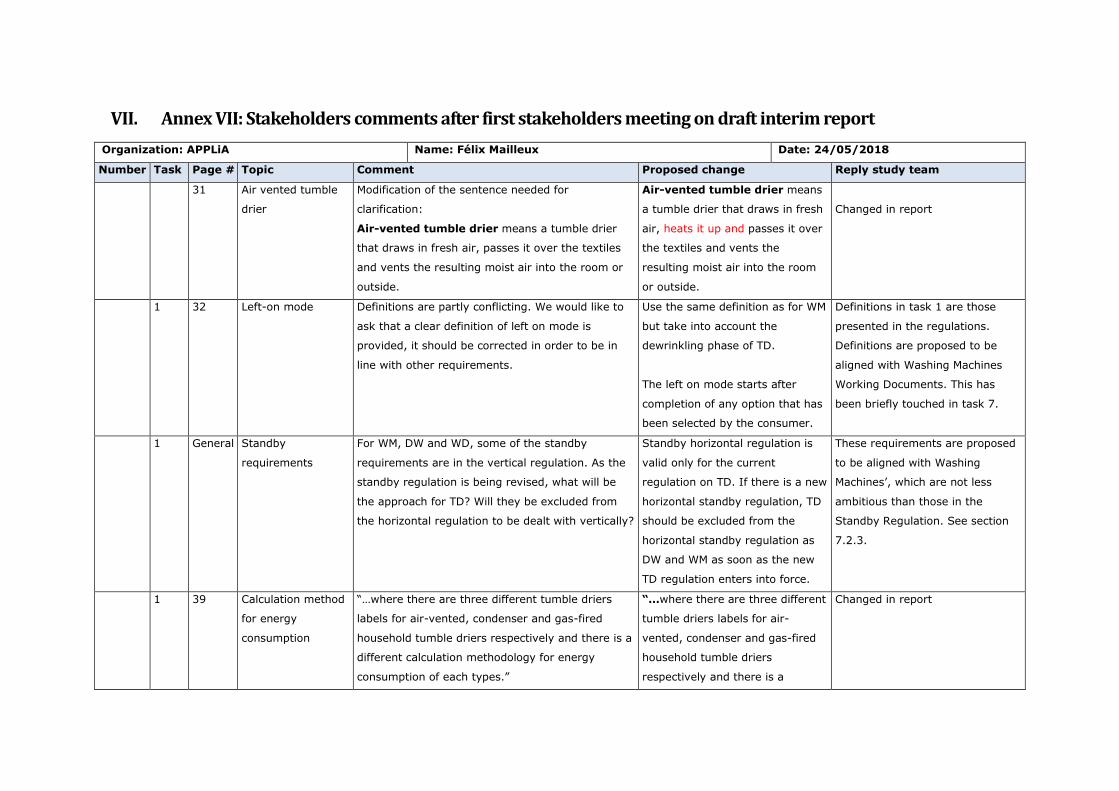
VII. Annex VII: Stakeholders comments after first stakeholders meeting on draft interim report
Organization: APPLiA Name: Félix Mailleux Date: 24/05/2018
Number Task Page # Topic Comment Proposed change Reply study team
31 Air vented tumble
drier
Modification of the sentence needed for
clarification:
Air-vented tumble drier means a tumble drier
that draws in fresh air, passes it over the textiles
and vents the resulting moist air into the room or
outside.
Air-vented tumble drier means
a tumble drier that draws in fresh
air, heats it up and passes it over
the textiles and vents the
resulting moist air into the room
or outside.
Changed in report
1 32 Left-on mode Definitions are partly conflicting. We would like to
ask that a clear definition of left on mode is
provided, it should be corrected in order to be in
line with other requirements.
Use the same definition as for WM
but take into account the
dewrinkling phase of TD.
The left on mode starts after
completion of any option that has
been selected by the consumer.
Definitions in task 1 are those
presented in the regulations.
Definitions are proposed to be
aligned with Washing Machines
Working Documents. This has
been briefly touched in task 7.
1 General Standby
requirements
For WM, DW and WD, some of the standby
requirements are in the vertical regulation. As the
standby regulation is being revised, what will be
the approach for TD? Will they be excluded from
the horizontal regulation to be dealt with vertically?
Standby horizontal regulation is
valid only for the current
regulation on TD. If there is a new
horizontal standby regulation, TD
should be excluded from the
horizontal standby regulation as
DW and WM as soon as the new
TD regulation enters into force.
These requirements are proposed
to be aligned with Washing
Machines’, which are not less
ambitious than those in the
Standby Regulation. See section
7.2.3.
1 39 Calculation method
for energy
consumption
“…where there are three different tumble driers
labels for air-vented, condenser and gas-fired
household tumble driers respectively and there is a
different calculation methodology for energy
consumption of each types.”
“…where there are three different
tumble driers labels for air-
vented, condenser and gas-fired
household tumble driers
respectively and there is a
Changed in report
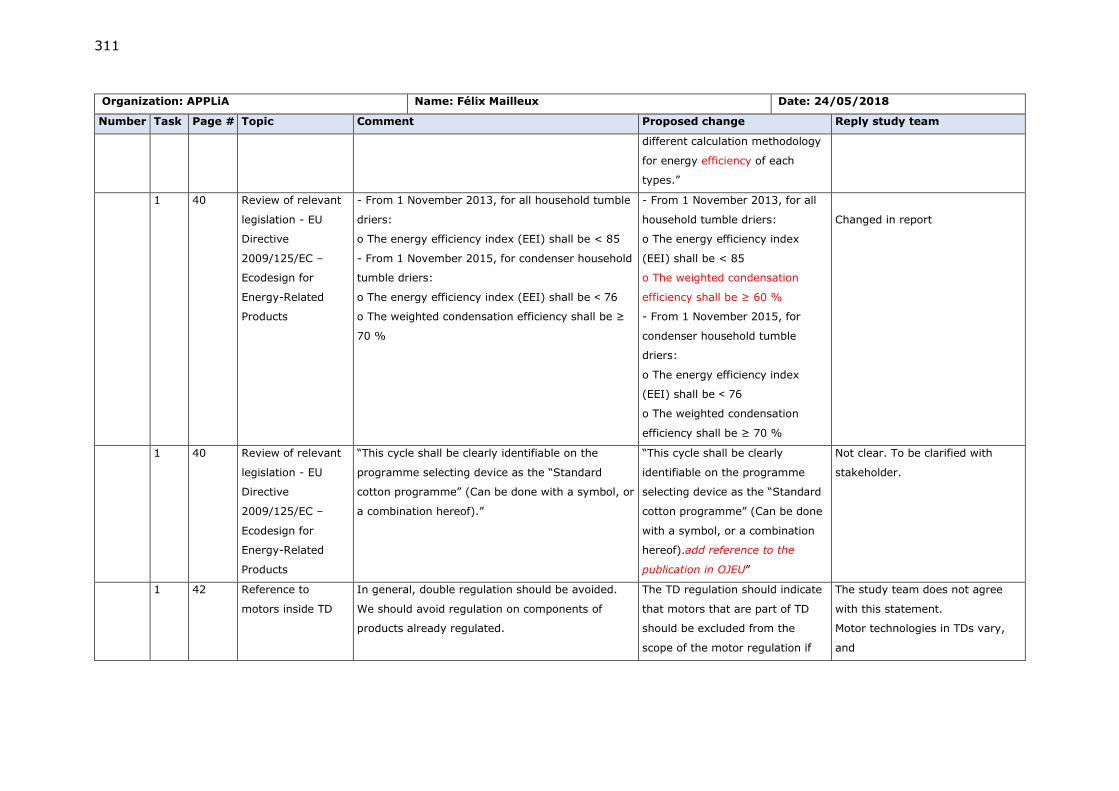
311
Organization: APPLiA Name: Félix Mailleux Date: 24/05/2018
Number Task Page # Topic Comment Proposed change Reply study team
different calculation methodology
for energy efficiency of each
types.”
1 40 Review of relevant
legislation - EU
Directive
2009/125/EC –
Ecodesign for
Energy-Related
Products
- From 1 November 2013, for all household tumble
driers:
o The energy efficiency index (EEI) shall be < 85
- From 1 November 2015, for condenser household
tumble driers:
o The energy efficiency index (EEI) shall be ˂ 76
o The weighted condensation efficiency shall be ≥
70 %
- From 1 November 2013, for all
household tumble driers:
o The energy efficiency index
(EEI) shall be < 85
o The weighted condensation
efficiency shall be ≥ 60 %
- From 1 November 2015, for
condenser household tumble
driers:
o The energy efficiency index
(EEI) shall be ˂ 76
o The weighted condensation
efficiency shall be ≥ 70 %
Changed in report
1 40 Review of relevant
legislation - EU
Directive
2009/125/EC –
Ecodesign for
Energy-Related
Products
“This cycle shall be clearly identifiable on the
programme selecting device as the “Standard
cotton programme” (Can be done with a symbol, or
a combination hereof).”
“This cycle shall be clearly
identifiable on the programme
selecting device as the “Standard
cotton programme” (Can be done
with a symbol, or a combination
hereof).add reference to the
publication in OJEU”
Not clear. To be clarified with
stakeholder.
1 42 Reference to
motors inside TD
In general, double regulation should be avoided.
We should avoid regulation on components of
products already regulated.
The TD regulation should indicate
that motors that are part of TD
should be excluded from the
scope of the motor regulation if
The study team does not agree
with this statement.
Motor technologies in TDs vary,
and
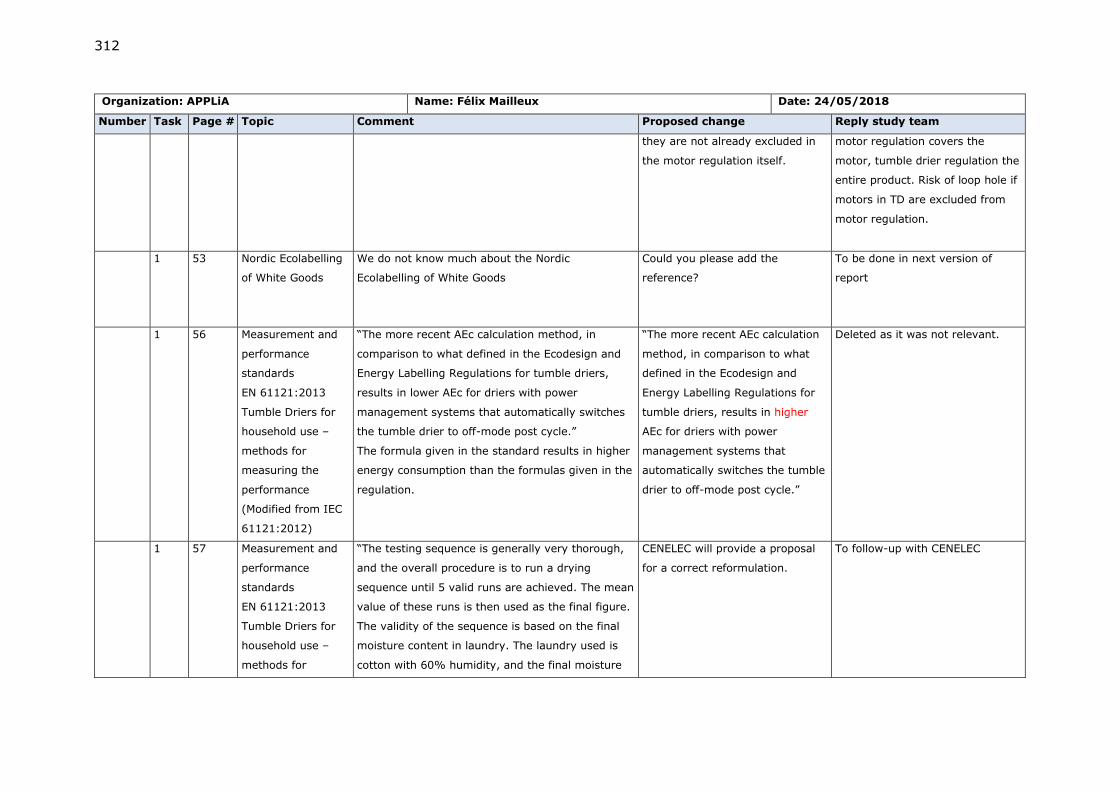
312
Organization: APPLiA Name: Félix Mailleux Date: 24/05/2018
Number Task Page # Topic Comment Proposed change Reply study team
they are not already excluded in
the motor regulation itself.
motor regulation covers the
motor, tumble drier regulation the
entire product. Risk of loop hole if
motors in TD are excluded from
motor regulation.
1 53 Nordic Ecolabelling
of White Goods
We do not know much about the Nordic
Ecolabelling of White Goods
Could you please add the
reference?
To be done in next version of
report
1 56 Measurement and
performance
standards
EN 61121:2013
Tumble Driers for
household use –
methods for
measuring the
performance
(Modified from IEC
61121:2012)
“The more recent AEc calculation method, in
comparison to what defined in the Ecodesign and
Energy Labelling Regulations for tumble driers,
results in lower AEc for driers with power
management systems that automatically switches
the tumble drier to off-mode post cycle.”
The formula given in the standard results in higher
energy consumption than the formulas given in the
regulation.
“The more recent AEc calculation
method, in comparison to what
defined in the Ecodesign and
Energy Labelling Regulations for
tumble driers, results in higher
AEc for driers with power
management systems that
automatically switches the tumble
drier to off-mode post cycle.”
Deleted as it was not relevant.
1 57 Measurement and
performance
standards
EN 61121:2013
Tumble Driers for
household use –
methods for
“The testing sequence is generally very thorough,
and the overall procedure is to run a drying
sequence until 5 valid runs are achieved. The mean
value of these runs is then used as the final figure.
The validity of the sequence is based on the final
moisture content in laundry. The laundry used is
cotton with 60% humidity, and the final moisture
CENELEC will provide a proposal
for a correct reformulation.
To follow-up with CENELEC
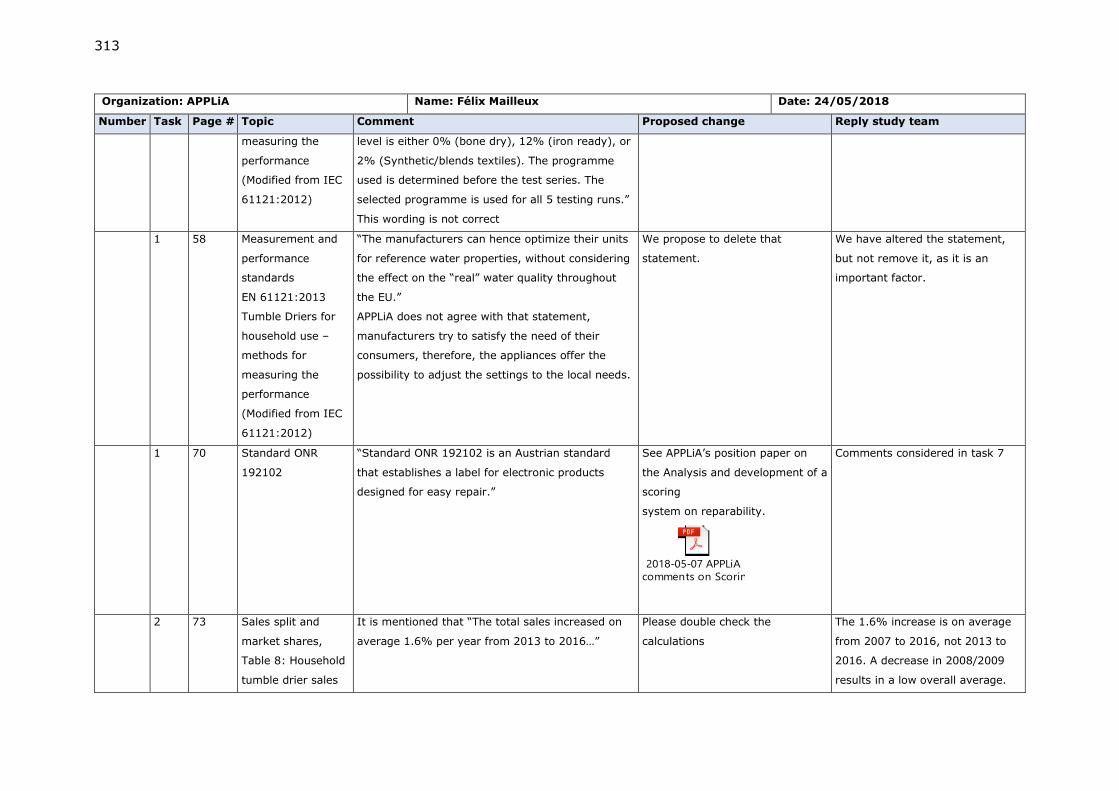
313
Organization: APPLiA Name: Félix Mailleux Date: 24/05/2018
Number Task Page # Topic Comment Proposed change Reply study team
measuring the
performance
(Modified from IEC
61121:2012)
level is either 0% (bone dry), 12% (iron ready), or
2% (Synthetic/blends textiles). The programme
used is determined before the test series. The
selected programme is used for all 5 testing runs.”
This wording is not correct
1 58 Measurement and
performance
standards
EN 61121:2013
Tumble Driers for
household use –
methods for
measuring the
performance
(Modified from IEC
61121:2012)
“The manufacturers can hence optimize their units
for reference water properties, without considering
the effect on the “real” water quality throughout
the EU.”
APPLiA does not agree with that statement,
manufacturers try to satisfy the need of their
consumers, therefore, the appliances offer the
possibility to adjust the settings to the local needs.
We propose to delete that
statement.
We have altered the statement,
but not remove it, as it is an
important factor.
1 70 Standard ONR
192102
“Standard ONR 192102 is an Austrian standard
that establishes a label for electronic products
designed for easy repair.”
See APPLiA’s position paper on
the Analysis and development of a
scoring
system on reparability.
2018-05-07 APPLiA
comments on Scoring System for Repair.pdf
Comments considered in task 7
2 73 Sales split and
market shares,
Table 8: Household
tumble drier sales
It is mentioned that “The total sales increased on
average 1.6% per year from 2013 to 2016…”
Please double check the
calculations
The 1.6% increase is on average
from 2007 to 2016, not 2013 to
2016. A decrease in 2008/2009
results in a low overall average.
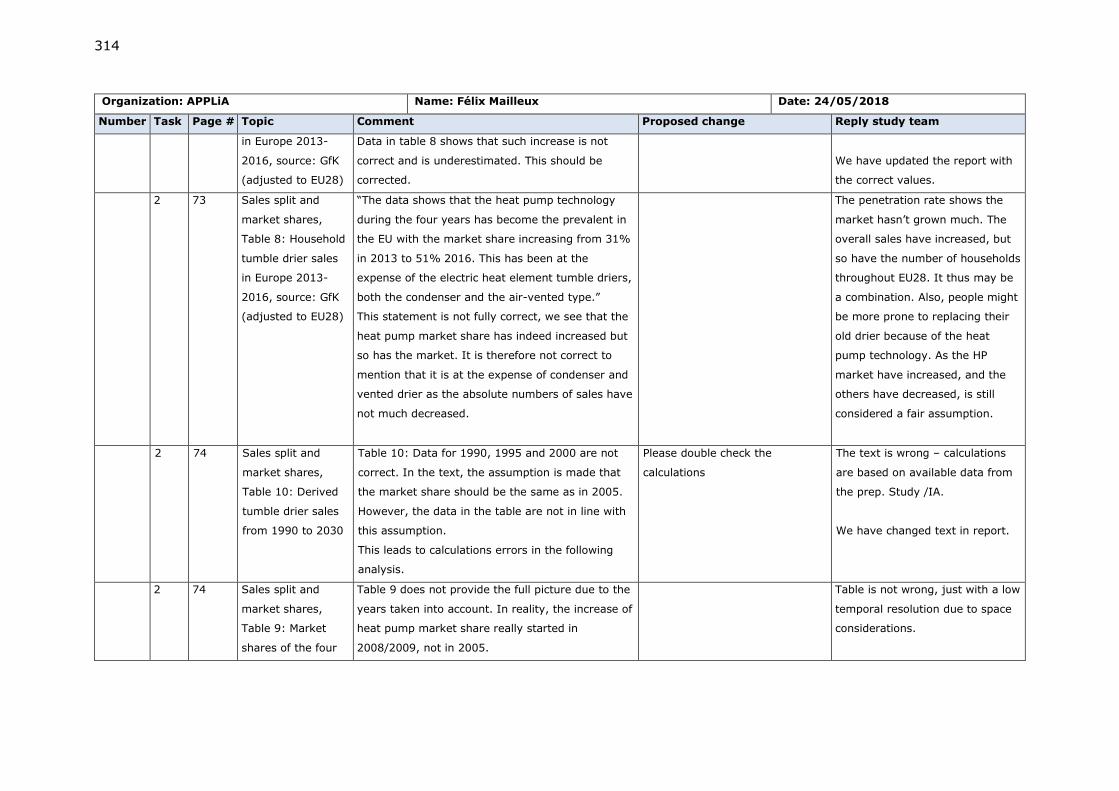
314
Organization: APPLiA Name: Félix Mailleux Date: 24/05/2018
Number Task Page # Topic Comment Proposed change Reply study team
in Europe 2013-
2016, source: GfK
(adjusted to EU28)
Data in table 8 shows that such increase is not
correct and is underestimated. This should be
corrected.
We have updated the report with
the correct values.
2 73 Sales split and
market shares,
Table 8: Household
tumble drier sales
in Europe 2013-
2016, source: GfK
(adjusted to EU28)
“The data shows that the heat pump technology
during the four years has become the prevalent in
the EU with the market share increasing from 31%
in 2013 to 51% 2016. This has been at the
expense of the electric heat element tumble driers,
both the condenser and the air-vented type.”
This statement is not fully correct, we see that the
heat pump market share has indeed increased but
so has the market. It is therefore not correct to
mention that it is at the expense of condenser and
vented drier as the absolute numbers of sales have
not much decreased.
The penetration rate shows the
market hasn’t grown much. The
overall sales have increased, but
so have the number of households
throughout EU28. It thus may be
a combination. Also, people might
be more prone to replacing their
old drier because of the heat
pump technology. As the HP
market have increased, and the
others have decreased, is still
considered a fair assumption.
2 74 Sales split and
market shares,
Table 10: Derived
tumble drier sales
from 1990 to 2030
Table 10: Data for 1990, 1995 and 2000 are not
correct. In the text, the assumption is made that
the market share should be the same as in 2005.
However, the data in the table are not in line with
this assumption.
This leads to calculations errors in the following
analysis.
Please double check the
calculations
The text is wrong – calculations
are based on available data from
the prep. Study /IA.
We have changed text in report.
2 74 Sales split and
market shares,
Table 9: Market
shares of the four
Table 9 does not provide the full picture due to the
years taken into account. In reality, the increase of
heat pump market share really started in
2008/2009, not in 2005.
Table is not wrong, just with a low
temporal resolution due to space
considerations.
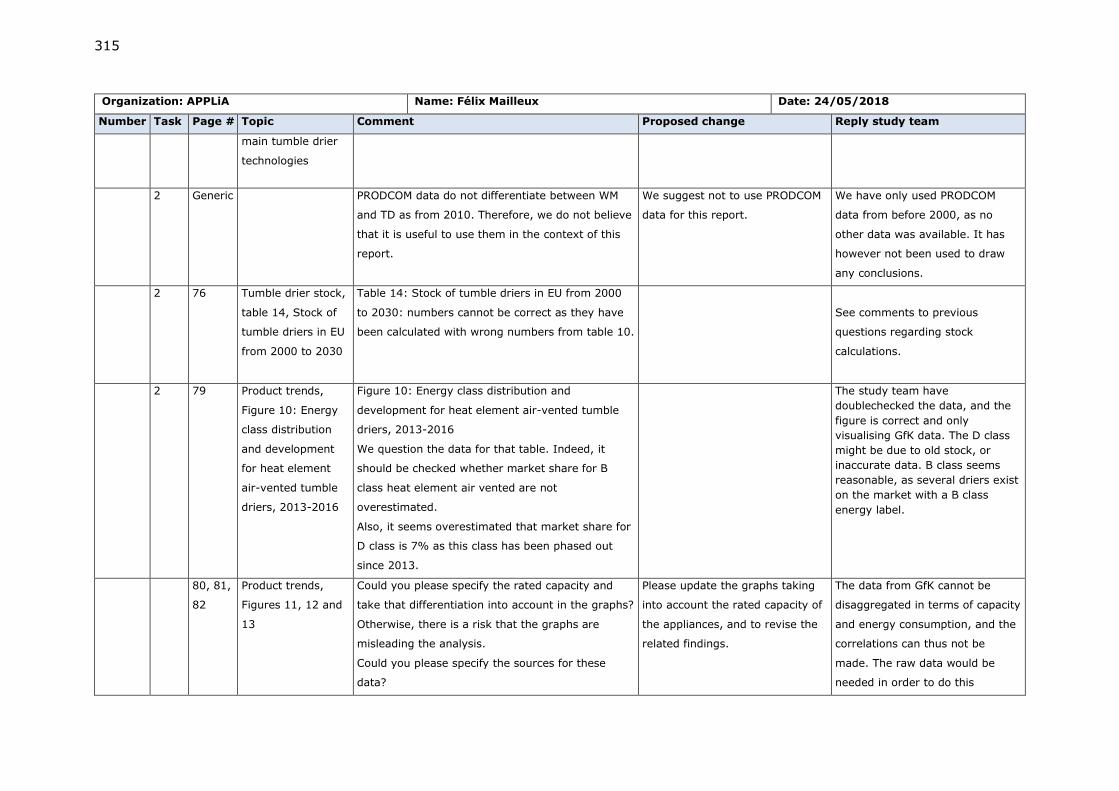
315
Organization: APPLiA Name: Félix Mailleux Date: 24/05/2018
Number Task Page # Topic Comment Proposed change Reply study team
main tumble drier
technologies
2 Generic PRODCOM data do not differentiate between WM
and TD as from 2010. Therefore, we do not believe
that it is useful to use them in the context of this
report.
We suggest not to use PRODCOM
data for this report.
We have only used PRODCOM
data from before 2000, as no
other data was available. It has
however not been used to draw
any conclusions.
2 76 Tumble drier stock,
table 14, Stock of
tumble driers in EU
from 2000 to 2030
Table 14: Stock of tumble driers in EU from 2000
to 2030: numbers cannot be correct as they have
been calculated with wrong numbers from table 10.
See comments to previous
questions regarding stock
calculations.
2 79 Product trends,
Figure 10: Energy
class distribution
and development
for heat element
air-vented tumble
driers, 2013-2016
Figure 10: Energy class distribution and
development for heat element air-vented tumble
driers, 2013-2016
We question the data for that table. Indeed, it
should be checked whether market share for B
class heat element air vented are not
overestimated.
Also, it seems overestimated that market share for
D class is 7% as this class has been phased out
since 2013.
The study team have
doublechecked the data, and the
figure is correct and only
visualising GfK data. The D class
might be due to old stock, or
inaccurate data. B class seems
reasonable, as several driers exist
on the market with a B class
energy label.
80, 81,
82
Product trends,
Figures 11, 12 and
13
Could you please specify the rated capacity and
take that differentiation into account in the graphs?
Otherwise, there is a risk that the graphs are
misleading the analysis.
Could you please specify the sources for these
data?
Please update the graphs taking
into account the rated capacity of
the appliances, and to revise the
related findings.
The data from GfK cannot be
disaggregated in terms of capacity
and energy consumption, and the
correlations can thus not be
made. The raw data would be
needed in order to do this
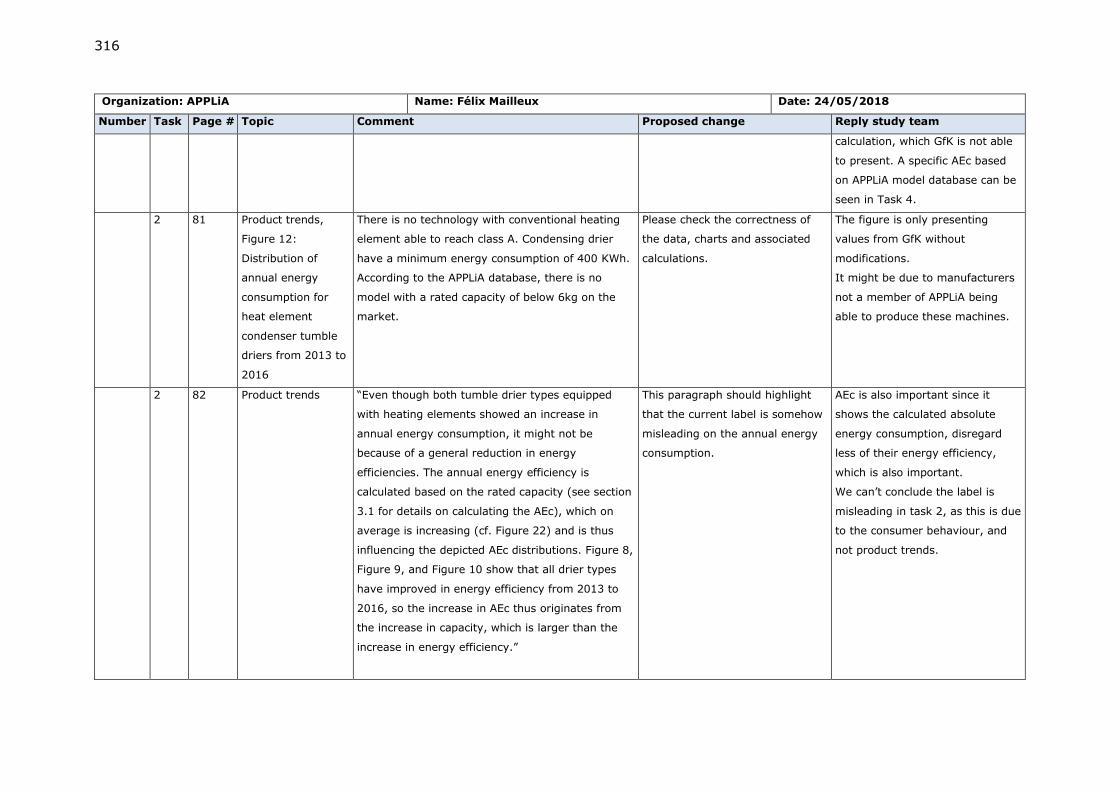
316
Organization: APPLiA Name: Félix Mailleux Date: 24/05/2018
Number Task Page # Topic Comment Proposed change Reply study team
calculation, which GfK is not able
to present. A specific AEc based
on APPLiA model database can be
seen in Task 4.
2 81 Product trends,
Figure 12:
Distribution of
annual energy
consumption for
heat element
condenser tumble
driers from 2013 to
2016
There is no technology with conventional heating
element able to reach class A. Condensing drier
have a minimum energy consumption of 400 KWh.
According to the APPLiA database, there is no
model with a rated capacity of below 6kg on the
market.
Please check the correctness of
the data, charts and associated
calculations.
The figure is only presenting
values from GfK without
modifications.
It might be due to manufacturers
not a member of APPLiA being
able to produce these machines.
2 82 Product trends “Even though both tumble drier types equipped
with heating elements showed an increase in
annual energy consumption, it might not be
because of a general reduction in energy
efficiencies. The annual energy efficiency is
calculated based on the rated capacity (see section
3.1 for details on calculating the AEc), which on
average is increasing (cf. Figure 22) and is thus
influencing the depicted AEc distributions. Figure 8,
Figure 9, and Figure 10 show that all drier types
have improved in energy efficiency from 2013 to
2016, so the increase in AEc thus originates from
the increase in capacity, which is larger than the
increase in energy efficiency.”
This paragraph should highlight
that the current label is somehow
misleading on the annual energy
consumption.
AEc is also important since it
shows the calculated absolute
energy consumption, disregard
less of their energy efficiency,
which is also important.
We can’t conclude the label is
misleading in task 2, as this is due
to the consumer behaviour, and
not product trends.
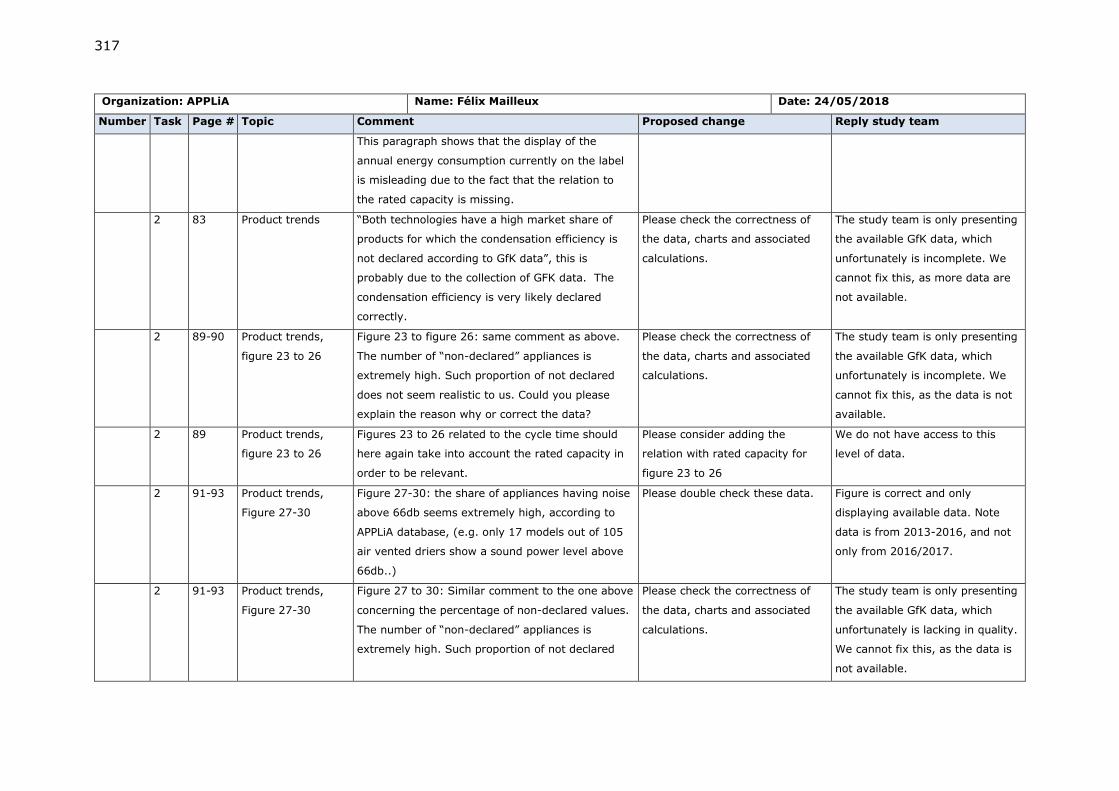
317
Organization: APPLiA Name: Félix Mailleux Date: 24/05/2018
Number Task Page # Topic Comment Proposed change Reply study team
This paragraph shows that the display of the
annual energy consumption currently on the label
is misleading due to the fact that the relation to
the rated capacity is missing.
2 83 Product trends “Both technologies have a high market share of
products for which the condensation efficiency is
not declared according to GfK data”, this is
probably due to the collection of GFK data. The
condensation efficiency is very likely declared
correctly.
Please check the correctness of
the data, charts and associated
calculations.
The study team is only presenting
the available GfK data, which
unfortunately is incomplete. We
cannot fix this, as more data are
not available.
2 89-90 Product trends,
figure 23 to 26
Figure 23 to figure 26: same comment as above.
The number of “non-declared” appliances is
extremely high. Such proportion of not declared
does not seem realistic to us. Could you please
explain the reason why or correct the data?
Please check the correctness of
the data, charts and associated
calculations.
The study team is only presenting
the available GfK data, which
unfortunately is incomplete. We
cannot fix this, as the data is not
available.
2 89 Product trends,
figure 23 to 26
Figures 23 to 26 related to the cycle time should
here again take into account the rated capacity in
order to be relevant.
Please consider adding the
relation with rated capacity for
figure 23 to 26
We do not have access to this
level of data.
2 91-93 Product trends,
Figure 27-30
Figure 27-30: the share of appliances having noise
above 66db seems extremely high, according to
APPLiA database, (e.g. only 17 models out of 105
air vented driers show a sound power level above
66db..)
Please double check these data. Figure is correct and only
displaying available data. Note
data is from 2013-2016, and not
only from 2016/2017.
2 91-93 Product trends,
Figure 27-30
Figure 27 to 30: Similar comment to the one above
concerning the percentage of non-declared values.
The number of “non-declared” appliances is
extremely high. Such proportion of not declared
Please check the correctness of
the data, charts and associated
calculations.
The study team is only presenting
the available GfK data, which
unfortunately is lacking in quality.
We cannot fix this, as the data is
not available.
318
Organization: APPLiA Name: Félix Mailleux Date: 24/05/2018
Number Task Page # Topic Comment Proposed change Reply study team
does not seem realistic to us. Could you please
explain the reason why or correct the data?
2 94 Product trends,
Figure 31
Figure 31 – the graph needs to be corrected since
it is based on wrong sales and stock numbers (cf.
comment above)
Please check the correctness of
the data, charts and associated
calculations.
Figure is correct. Stock from pre-
2002 is not used due to a 12-year
lifetime either way.
2 94 Market channels
and production
structure
“The market for household tumble driers is
characterised by a large number of manufacturers.
Major players include, but is not limited to, BSH,
Miele, LG Electronics, Samsung, Whirlpool, AEG,
Electrolux, Candy, Gorenje, Vestel, and
Whiteknight.”
Arçelik should also be mentioned as a major
market player. AEG should also be removed as it is
a brand part of Electrolux.
“The market for household tumble
driers is characterised by a large
number of manufacturers. Major
players include, but is not limited
to, Arçelik, BSH, Miele, LG
Electronics, Samsung, Whirlpool,
AEG, Electrolux, Candy, Gorenje,
Vestel, and Whiteknight.”
Changed in report
2 95 Consumer purchase
price, table 15
Table 15: Could you please verify the values of
that table? Could Gfk please also mention the
source of where these prices were taken from?
GfK provide total market value
(actual purchase price) across
Europe. The EU coverage is 85%.
2 97 Electricity and gas
prices, table 17
Could you please specify the geographical scope of
these average numbers?
Could you explain why do you not use the
weighted average based on country population?
Why do you not use the specific values per country
as part of the analysis?
We follow the MEErP and use
average values. Specific values
would be to comprehensive in
task 5, task 6 and task 7 and
different LLCC options may
appear.
319
Organization: APPLiA Name: Félix Mailleux Date: 24/05/2018
Number Task Page # Topic Comment Proposed change Reply study team
2 97 Electricity and gas
prices, table 17
Is the linear extrapolation to determine future
prices (and other future parameters) defined by
the Meerp methodology or does it come from a
motivated choice? If it is the latter, could you
please provide the rationale behind?
The commission have discussed
how to apply more realistic
projections of the electricity
prices. The commission have
decided to use data from PRIMES.
The PRIMES data has a lower
annual increase in electricity costs
and it includes future projections.
2 98 Repair and
maintenance costs,
Table 18: Average
total labour costs
for repair services
in EUR per hour
The net labour cost is not the only cost factor
influencing the consumer willingness to repair. It
includes also overhead costs, transport costs, etc.
The consumer is in fine charged with a much
higher value than what is presented in table 18.
Corrected in report
3 109 Loading of the drier “The real drying average load is hence assumed to
be somewhere between 3.2kg - 5.3kg, based on
the P&G and APPLiA study respectively, as they
consist of the newest available data.”
P&G study does not provide any data on the drying
average, as far as we are aware, this study was
only related to WM.
Concerning the APPLiA study, the average load
seems indeed quite high. Among the reasons that
could explain such high number is the fact that the
The difference in household size
between washing machines
studies318 and the APPLiA survey
is 0.1 persons/households and is
thus not considered significant.
The laundry behaviour is thus
considered to be somewhat alike.
4.4kg is used throughout the
other task of the study, as this is
the load one gets when using
cycles/week, total households,
318 Kruschwitz, A.; Karle, A.; Schmitz, A. & Stamminger, R. (2014). Consumer laundry practices in Germany. International Journal of Consumer Studies, 38(3), pp. 265–277.
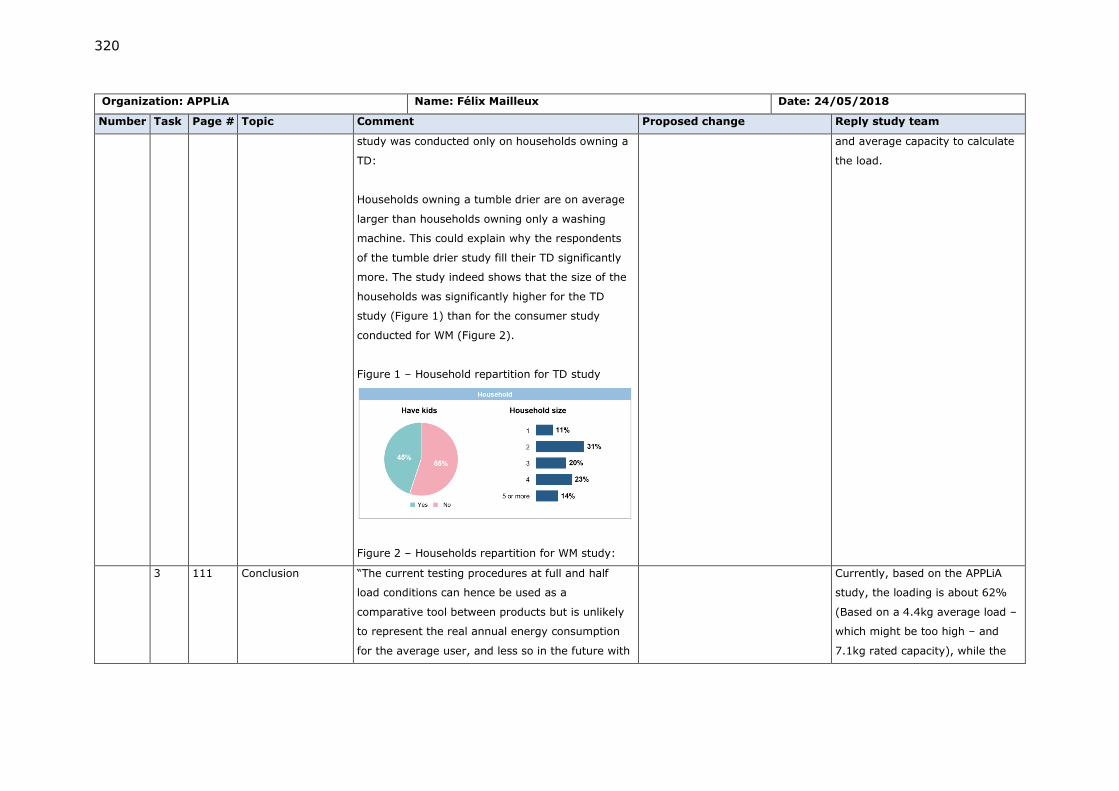
320
Organization: APPLiA Name: Félix Mailleux Date: 24/05/2018
Number Task Page # Topic Comment Proposed change Reply study team
study was conducted only on households owning a
TD:
Households owning a tumble drier are on average
larger than households owning only a washing
machine. This could explain why the respondents
of the tumble drier study fill their TD significantly
more. The study indeed shows that the size of the
households was significantly higher for the TD
study (Figure 1) than for the consumer study
conducted for WM (Figure 2).
Figure 1 – Household repartition for TD study
Figure 2 – Households repartition for WM study:
and average capacity to calculate
the load.
3 111 Conclusion “The current testing procedures at full and half
load conditions can hence be used as a
comparative tool between products but is unlikely
to represent the real annual energy consumption
for the average user, and less so in the future with
Currently, based on the APPLiA
study, the loading is about 62%
(Based on a 4.4kg average load –
which might be too high – and
7.1kg rated capacity), while the
321
Organization: APPLiA Name: Félix Mailleux Date: 24/05/2018
Number Task Page # Topic Comment Proposed change Reply study team
foreseen increasingly large capacity driers on the
market.”
The present test conditions very well represent the
consumer load. Indeed, the average rated capacity
found by Insites Consulting study is 7,1Kg. The
average consumer load found in this same study is
between 4.0Kg and 4.9Kg which is in line with the
weighted test load of 5Kg defined by the regulation
for a 7kg machine.
loading from the regulation is
about 71%.
The washing machine studies
showed no correlation between
the rated capacity and loading %.
As the machines is getting larger,
the loading % is thus expected to
fall and deviate more-and-more
from the current regulation
testing method.
3 112 Conclusion “Using the average number of drying
cycles/week/household of 1.7 / 2.4 for summer
and winter times respectively, this gives an
average of 107 cycles/year.”
Since the regulation requires to calculate the
annual energy consumption based on 160 cycles,
the results are overestimating the real annual
energy consumption by above 50%. The real
annual energy consumption will therefore likely be
lower on average than indicated on the label.
We agree – the calculation is
made exactly to prove this point.
3 112 Impacts of tumble
driers on secondary
energy systems
“Driers with heating elements have generally lower
condensation efficiency compared to driers with
heat pumps: 91% of heat pump driers sold in 2016
had condensation efficiency labels B or better,
while only 47.2% of driers with heating elements
achieved this.”
Please check again the data and
related calculations
Added note that the data might be
inaccurate. 47.2% is based on the
available data. Datapoints with
condensation efficiency listed as
“unreported” is thus not taken
into account here.
322
Organization: APPLiA Name: Félix Mailleux Date: 24/05/2018
Number Task Page # Topic Comment Proposed change Reply study team
This last number (47,2%) does not seem realistic.
This is due to the incomplete collection of market
data made by Gfk (cf. comment above).
3 115 Condensing driers
with heating
element
“The ambient temperature affects the energy
consumption of the drier, with a high ambient
temperature increasing the energy consumption of
the drier due to the dew point being directly
related to the temperature.”
This statement is not correct for condensing drier
with heating element; due to higher ambient
temperature, the heating element is switching on
and off and therefore does not affect the total
energy consumption. Only the drying duration is
increased.
Longer cycle times means more
energy is used in the fan/drum
motor (as this is on the whole
duration). Furthermore, longer
cycle times result in more heat
loss to the ambient, and lower
condensation efficiency as it
results in more time for the moist
air to escape.
The added energy consumption
this might be small, but it is not
zero.
3 118 Durability and
lifetime
Table 25: “The term “lifetime” used in the current
study must be understood as the period (i.e. the
number of years) during which the appliance is
used and consumes electricity (“actual time to
disposal”). Therefore, it is a value included
between the social lifetime and the design
lifetime.”
APPLiA disagrees with that approach. In our
opinion, the concept of social lifetime does not
apply to tumble driers as it is a rather stable
We are aiming at the actual life
time at consumers which are a
little longer than the design
lifetime.
No change
323
Organization: APPLiA Name: Félix Mailleux Date: 24/05/2018
Number Task Page # Topic Comment Proposed change Reply study team
product not that much subject to fashion.
Therefore, the concept of lifetime should be at
minimum referring to the design lifetime or longer.
3 119 Durability and
lifetime
“Based on the German study the share of people
exchanging a functional machine with a new model
is increasing from 12 % in 2004 to 19 % in 2012.
This tendency may be due to increased efficiency
of tumble driers or new functions such as network
capabilities (controlled by e.g. a smartphone) or
the purchase of combined washer/driers”
It is not possible that network capabilities
influenced the purchase of TD back in 2012 as this
function hardly existed at that time.
Corrected in report
3 119 Durability and
lifetime
“For all large household appliances, it should also
be noted that the proportion of appliances that
were replaced in less than 5 years due to a defect
increased from 3.5% to 8.3% between 2004 and
2012.”
Could you please indicate the source for this
statement?
Source added in the report -
Umwelt Bundesamt
3 120 Durability and
lifetime, figure 41
Figure 41: age of TD vs “The experienced lifetime
of tumble driers are investigated by APPLiA and the
results of the survey are presented in”
The figure shows the current age of TD. However,
it does not allow to draw conclusions on the
lifetime of the appliances, especially not for heat
Corrected in report
324
Organization: APPLiA Name: Félix Mailleux Date: 24/05/2018
Number Task Page # Topic Comment Proposed change Reply study team
pump tumble driers as this technology has been
introduced only over the last few years.
3 128 Best practice in
sustainable use
“As discussed previously, it is important to
purchase a properly sized tumble drier and not
buying it oversized. This may result in operation at
part load, which increases the specific energy
consumption (see section 3.1.1). According to
presented data in this section, consumers load the
machines similarly regardless of the capacity.
Consumers may buy large appliances for the
convenience if they want to dry large blankets
resulting in operation with a low load most of the
year. It is also important to spin the clothes
properly in the washing machine as it is less
energy intensive to spin the clothes in the washing
machine than to dry it in the tumble drier.”
This statement is not correct. Based on APPLiA
model database, the energy consumption for a
household load of 4.00Kg is rather stable
independently from the rated capacity of the
machine.
We can only estimate efficiency
based on partial loads (which is
always 50% of rated capacity in
this case), not specific loads. We
hence can’t compare machines at
different rated capacities at a
specific load (e.g. 4kg) from the
model database.
The APPLiA model database hence
can’t be used to evaluate this.
3 128 Best practice in
sustainable use
“Use a lower heat setting than, e.g. cupboard dry,
if the clothes have anyway to be ironed
afterwards.”
“Use a lower dryness level than,
e.g. cupboard dry, if the clothes
have anyway to be ironed
afterwards.”
Corrected in report
325
Organization: APPLiA Name: Félix Mailleux Date: 24/05/2018
Number Task Page # Topic Comment Proposed change Reply study team
3 128 Best practice in
sustainable use
“Use the moisture sensor if it is available to avoid
over drying.”
“Use the moisture sensor if it is
available to avoid over drying.”
Automatic sensor is available in
most cases.
It is available in most cases, but
not all. Driers exist on the market
without moisture sensors.
3 131 Local infrastructure
Electricity
“In 2015 the share of renewable energy was
almost 17%”
This does not seem correct compared to the figure
below that indicates “Almost half of the electricity
generation still originates from combustible fuels
(such as natural gas, coal and oil) and renewable
energy sources only constitutes about 25 % of the
electricity generation in 2015.”
This should be clarified.
In 2015 the share of renewable
energy was almost 17% regarding
gross final energy consumption.
The figure below presents the
electricity mix
3 136 Verification
tolerances
“The study team is waiting for a round-robin test to
be finished by March/April.”
Unfortunately, the results of the RRT is being
delayed due to unforeseen issues with the
transportation and test timing. The results will
likely be available in August 2018.
The study team has not yet
received the final report from
APPLiA on this matter.
4 137 Technologies “No major technical improvements at product level
have emerged on the market for tumble driers
since the preparatory study.”
Sentence modified
326
Organization: APPLiA Name: Félix Mailleux Date: 24/05/2018
Number Task Page # Topic Comment Proposed change Reply study team
We tend to disagree with that statement; indeed,
since the last preparatory study, heat pump driers’
energy efficiency has increased by 25%.
4 140 Controller for all
drier types
“Eco-mode programs are available on some driers,
where an increased cycle time can result in lower
energy consumptions. This is advantageous if the
cycle time is unimportant for the customer. The
increased cycle time is done by lowering the drying
temperature by throttling the heat pump unit or
the heating element.”
This statement is not correct, according to the
Ecodesign regulation 932/2012, the standard
cotton programme needs to be the most efficient
programme available on the machine. Having such
eco mode programme is not possible.
Deleted from report
4 142 Filters for all drier
types
“Filters for all drier types
The lint filters act as a protective screen against
lint-build up in the machine. Clogged filters reduce
the process air flow, which reduces the drying
efficiency. This effect is present as soon as the
cycle starts, and thus marginally increases energy
consumption during the cycle147. Designing filters
less prone to clogging, or simply with better flow
characteristics, reduces this effect and is thus
advantageous to the energy efficiency.”
This has been investigated further
based on input provided by
different stakeholders. See section
4.1.1 for conclusions.
327
Organization: APPLiA Name: Félix Mailleux Date: 24/05/2018
Number Task Page # Topic Comment Proposed change Reply study team
This statement is not correct for conventional
condenser drier where the efficiency is affected
only on a very low level.
Organization:
CENELEC TC59X SWG1.9
Name:
Ulrich Nehring
Date:
22.06.2018
Number Task Page # Topic Comment Proposed change Reply study team
16 BAT: Eco mode
program
Corresponding to the EC directive 932/2012
the standard cotton program shall be the most
efficient program to dry standard cotton load.
Thus an ‘eco mode program’ cannot be more
efficient and this BAT option is not given.
Delete ‘Eco mode program’ from BAT Deleted
33/34 Footnotes 33/34 The copies of the footnotes are not complete
as given in EN61121:2013.
They are part of the standard, thus should not
be implemented as footnote into the report but
as citation into the text.
Copy the notes of the standard as
complete text into the text body of
the report.
Section deleted
1 40 If the drier is
automatic, this
this cycle should
be used
automatic
“If the drier is automatic, this this cycle should
be used automatic “
That is not clear, as there are automatic
controlled driers that do not preselect the
cycle at switch on.
“If the program is selected
automatically with switching on the
drier, then the standard cotton cycle
shall be preselected at switch on
automatically.”
Changed
1 41 Tolerances
accepted
“The tolerance-levels determined in
Regulation 932/2012 for the purpose of
verification of compliance, are set to 6% for all
parameters listed in the Regulation.”
Corrected
328
Organization:
CENELEC TC59X SWG1.9
Name:
Ulrich Nehring
Date:
22.06.2018
Number Task Page # Topic Comment Proposed change Reply study team
For left-on-mode and off mode power
consumption below 1W the tolerances are set
to 0.1 W
1 57 Test runs “The testing sequence is generally very
thorough, and the overall procedure is to run
a drying sequence until 5 valid runs are
achieved. The mean value of these runs is then
used as the final figure. The validity of the
sequence is based on the final moisture
content in laundry. The laundry used is cotton
with 60% humidity, and the final moisture
level is either 0% (bone dry), 12% (iron
ready), or 2% (Synthetic/blends textiles). The
programme used is determined before the test
series. The selected programme is used for all
5 testing runs.”
The testing sequence for energy label
concentrates on the cotton regular dry (0%)
program with 7 test runs representing 5 times
the full load.
Rephrase the whole clause:
“The testing sequence EN
61121:2013 is based on that one
given in the standard IEC
61121:2012 but modified with
respect to reflecting the
requirements of the European
regulations EC 392/2012 on energy
labelling of household tumble driers
and EC 932/2012 on ecodesign
requirements of household tumble
driers.
The testing sequence according IEC
61121:2012 is generally very
thorough, and the overall procedure
is to run a drying sequence until 5
valid runs are achieved. The mean
value of these runs is then used as
the final figure. The validity of the
sequence is based on the final
moisture content in laundry. The
laundry used is cotton with 60%
initial humidity or synthetics with
Replaced
329
Organization:
CENELEC TC59X SWG1.9
Name:
Ulrich Nehring
Date:
22.06.2018
Number Task Page # Topic Comment Proposed change Reply study team
50% initial moisture, and the final
moisture level is either 0%
(cupboard dry), 12% (iron ready), or
2% (Synthetic/blends textiles). The
programme used is determined
before the test series. The selected
programme is used for all 5 testing
runs.
The modifications of EN61121:2013
in comparison to IEC 61121:2012
are as follows:
The program defined for the energy
label testing procedure is selected to
cotton cupboard dry, a program that
must be able to dry a standard cotton
load from an initial moisture content
of 60% to a final moisture content of
0%. This program is used with the
treatments ‘full’, which is run 3 times
with rated cotton capacity, and the
treatment ‘half’, which is run 4 times
with halt the rated cotton capacity.
In addition, the power consumption
is measured in the ‘left-on-mode’ as
well as in the ‘off-mode’.”
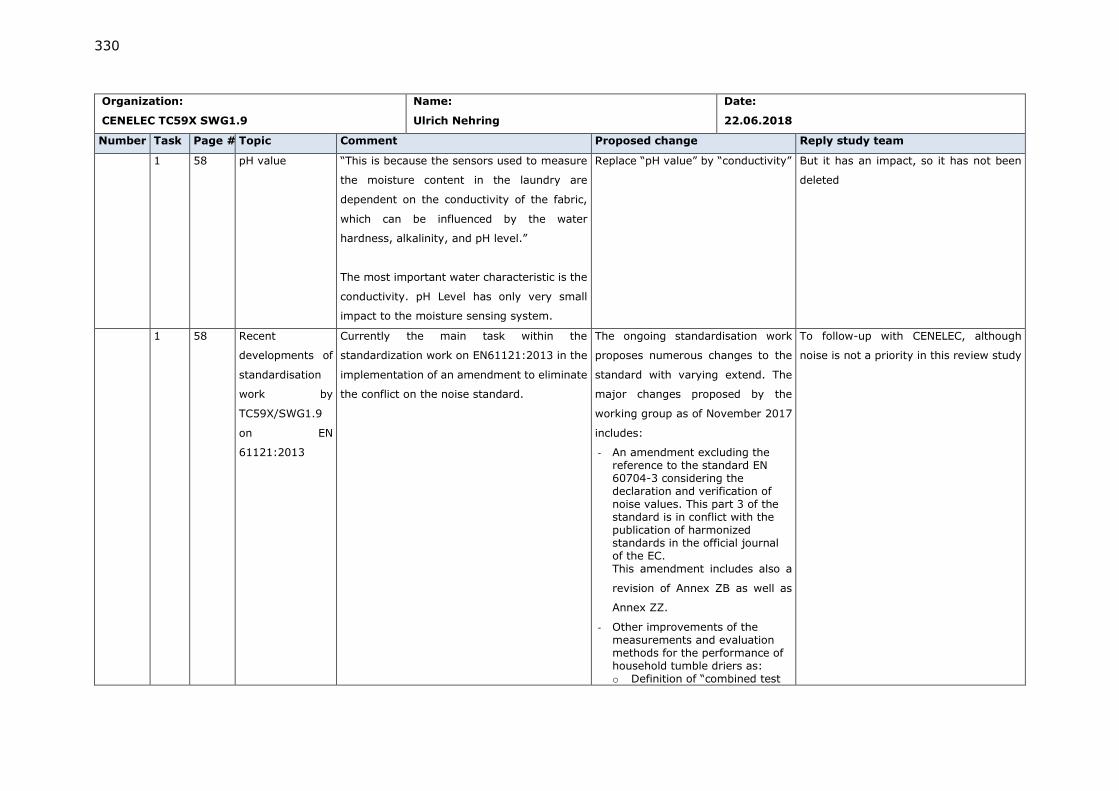
330
Organization:
CENELEC TC59X SWG1.9
Name:
Ulrich Nehring
Date:
22.06.2018
Number Task Page # Topic Comment Proposed change Reply study team
1 58 pH value “This is because the sensors used to measure
the moisture content in the laundry are
dependent on the conductivity of the fabric,
which can be influenced by the water
hardness, alkalinity, and pH level.”
The most important water characteristic is the
conductivity. pH Level has only very small
impact to the moisture sensing system.
Replace “pH value” by “conductivity” But it has an impact, so it has not been
deleted
1 58 Recent
developments of
standardisation
work by
TC59X/SWG1.9
on EN
61121:2013
Currently the main task within the
standardization work on EN61121:2013 in the
implementation of an amendment to eliminate
the conflict on the noise standard.
The ongoing standardisation work
proposes numerous changes to the
standard with varying extend. The
major changes proposed by the
working group as of November 2017
includes:
- An amendment excluding the reference to the standard EN 60704-3 considering the declaration and verification of noise values. This part 3 of the standard is in conflict with the publication of harmonized standards in the official journal of the EC. This amendment includes also a
revision of Annex ZB as well as
Annex ZZ.
- Other improvements of the measurements and evaluation methods for the performance of household tumble driers as: o Definition of “combined test
To follow-up with CENELEC, although
noise is not a priority in this review study
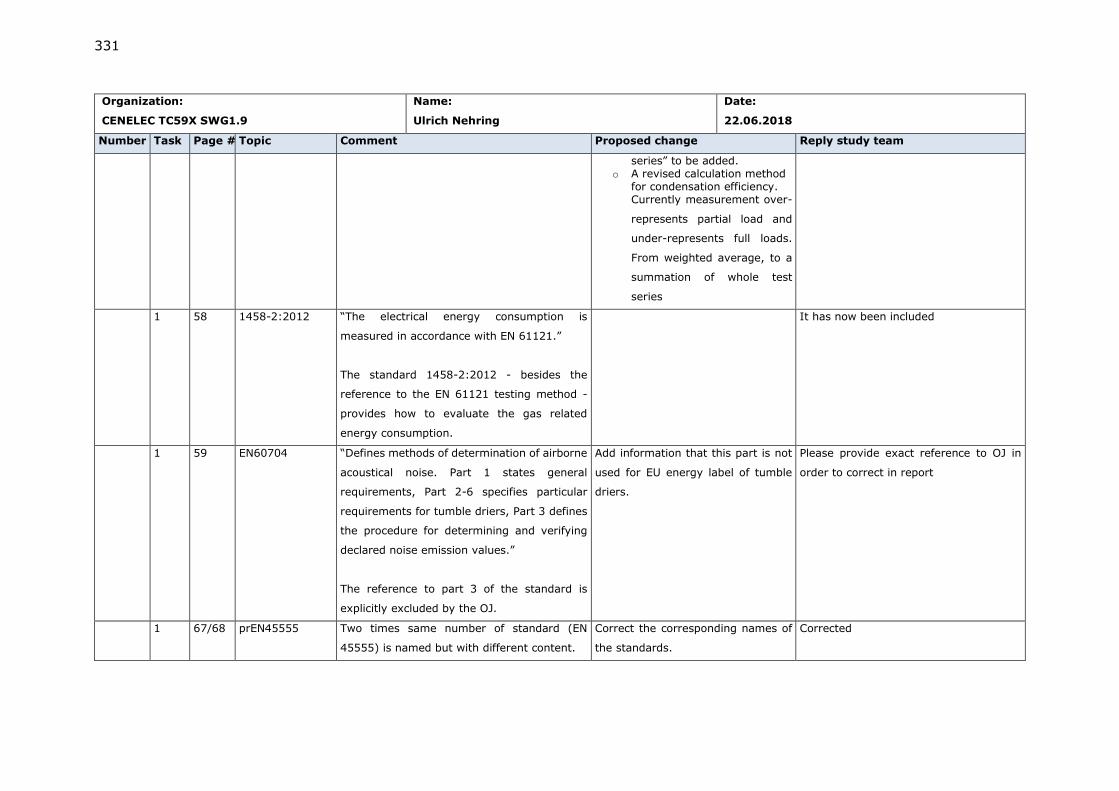
331
Organization:
CENELEC TC59X SWG1.9
Name:
Ulrich Nehring
Date:
22.06.2018
Number Task Page # Topic Comment Proposed change Reply study team
series” to be added. o A revised calculation method
for condensation efficiency. Currently measurement over-
represents partial load and
under-represents full loads.
From weighted average, to a
summation of whole test
series
1 58 1458-2:2012 “The electrical energy consumption is
measured in accordance with EN 61121.”
The standard 1458-2:2012 - besides the
reference to the EN 61121 testing method -
provides how to evaluate the gas related
energy consumption.
It has now been included
1 59 EN60704 “Defines methods of determination of airborne
acoustical noise. Part 1 states general
requirements, Part 2-6 specifies particular
requirements for tumble driers, Part 3 defines
the procedure for determining and verifying
declared noise emission values.”
The reference to part 3 of the standard is
explicitly excluded by the OJ.
Add information that this part is not
used for EU energy label of tumble
driers.
Please provide exact reference to OJ in
order to correct in report
1 67/68 prEN45555 Two times same number of standard (EN
45555) is named but with different content.
Correct the corresponding names of
the standards.
Corrected
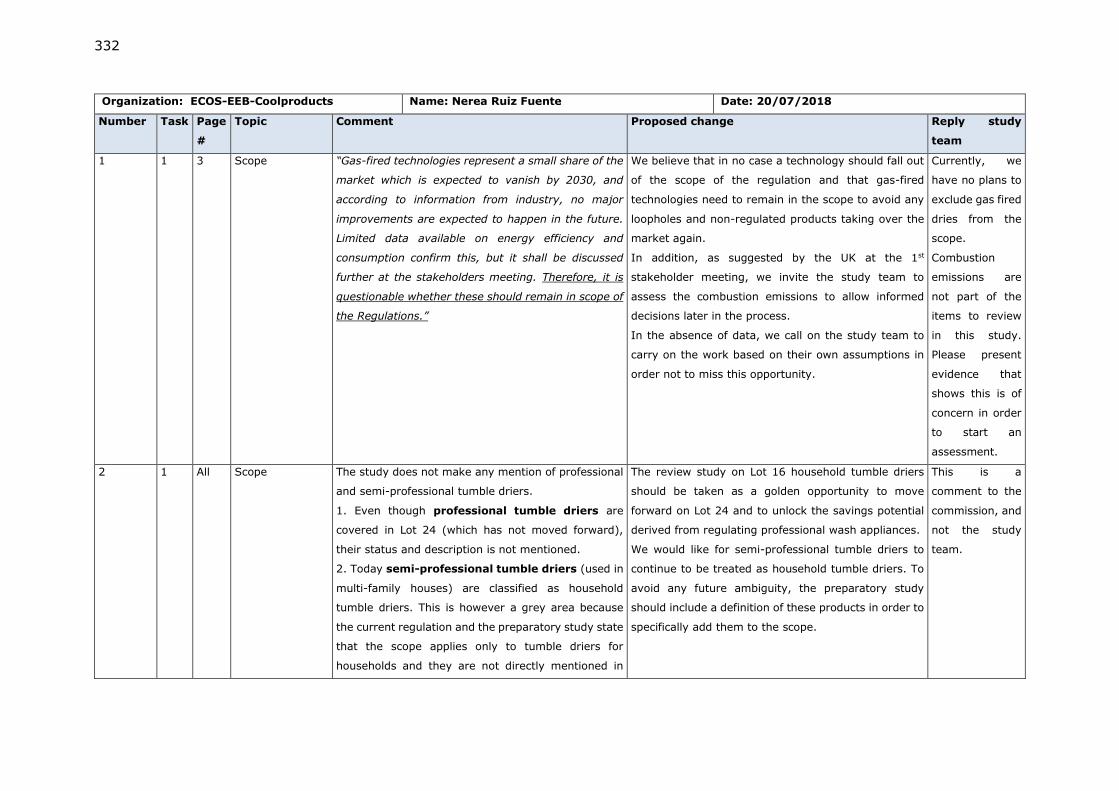
332
Organization: ECOS-EEB-Coolproducts Name: Nerea Ruiz Fuente Date: 20/07/2018
Number Task Page
#
Topic Comment Proposed change Reply study
team
1 1 3 Scope “Gas-fired technologies represent a small share of the
market which is expected to vanish by 2030, and
according to information from industry, no major
improvements are expected to happen in the future.
Limited data available on energy efficiency and
consumption confirm this, but it shall be discussed
further at the stakeholders meeting. Therefore, it is
questionable whether these should remain in scope of
the Regulations.”
We believe that in no case a technology should fall out
of the scope of the regulation and that gas-fired
technologies need to remain in the scope to avoid any
loopholes and non-regulated products taking over the
market again.
In addition, as suggested by the UK at the 1st
stakeholder meeting, we invite the study team to
assess the combustion emissions to allow informed
decisions later in the process.
In the absence of data, we call on the study team to
carry on the work based on their own assumptions in
order not to miss this opportunity.
Currently, we
have no plans to
exclude gas fired
dries from the
scope.
Combustion
emissions are
not part of the
items to review
in this study.
Please present
evidence that
shows this is of
concern in order
to start an
assessment.
2 1 All Scope The study does not make any mention of professional
and semi-professional tumble driers.
1. Even though professional tumble driers are
covered in Lot 24 (which has not moved forward),
their status and description is not mentioned.
2. Today semi-professional tumble driers (used in
multi-family houses) are classified as household
tumble driers. This is however a grey area because
the current regulation and the preparatory study state
that the scope applies only to tumble driers for
households and they are not directly mentioned in
The review study on Lot 16 household tumble driers
should be taken as a golden opportunity to move
forward on Lot 24 and to unlock the savings potential
derived from regulating professional wash appliances.
We would like for semi-professional tumble driers to
continue to be treated as household tumble driers. To
avoid any future ambiguity, the preparatory study
should include a definition of these products in order to
specifically add them to the scope.
This is a
comment to the
commission, and
not the study
team.
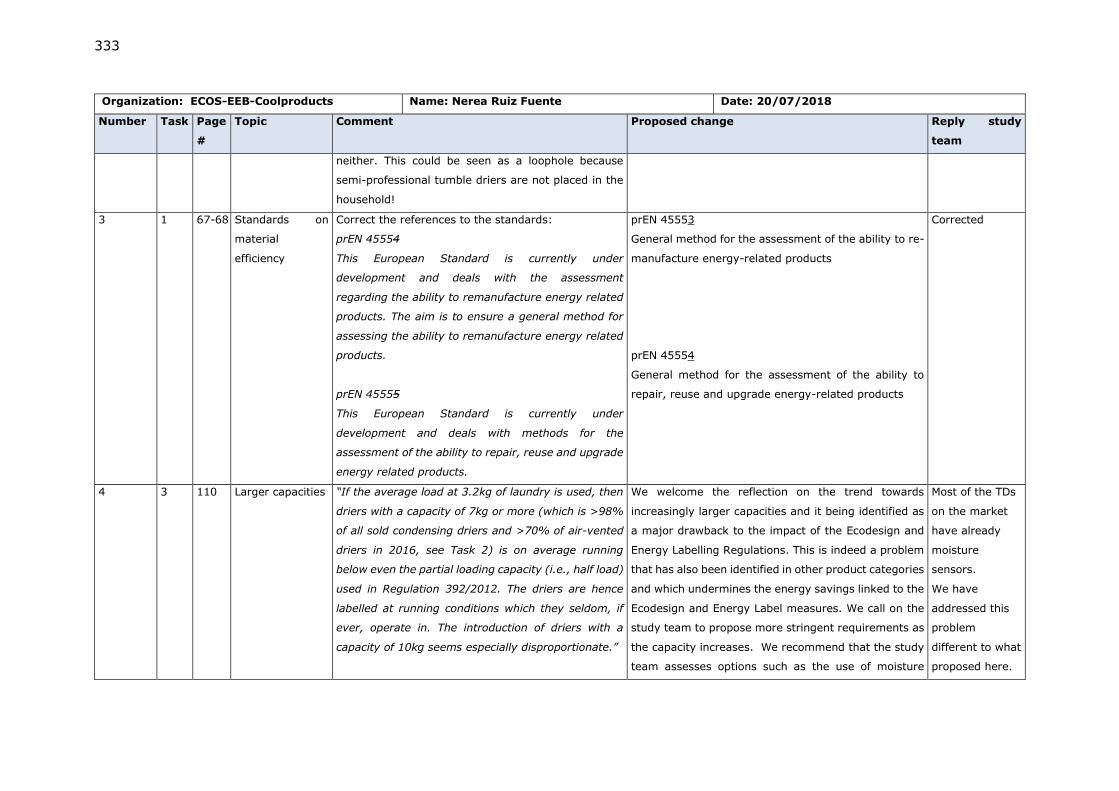
333
Organization: ECOS-EEB-Coolproducts Name: Nerea Ruiz Fuente Date: 20/07/2018
Number Task Page
#
Topic Comment Proposed change Reply study
team
neither. This could be seen as a loophole because
semi-professional tumble driers are not placed in the
household!
3 1 67-68 Standards on
material
efficiency
Correct the references to the standards:
prEN 45554
This European Standard is currently under
development and deals with the assessment
regarding the ability to remanufacture energy related
products. The aim is to ensure a general method for
assessing the ability to remanufacture energy related
products.
prEN 45555
This European Standard is currently under
development and deals with methods for the
assessment of the ability to repair, reuse and upgrade
energy related products.
prEN 45553
General method for the assessment of the ability to re-
manufacture energy-related products
prEN 45554
General method for the assessment of the ability to
repair, reuse and upgrade energy-related products
Corrected
4 3 110 Larger capacities “If the average load at 3.2kg of laundry is used, then
driers with a capacity of 7kg or more (which is >98%
of all sold condensing driers and >70% of air-vented
driers in 2016, see Task 2) is on average running
below even the partial loading capacity (i.e., half load)
used in Regulation 392/2012. The driers are hence
labelled at running conditions which they seldom, if
ever, operate in. The introduction of driers with a
capacity of 10kg seems especially disproportionate.”
We welcome the reflection on the trend towards
increasingly larger capacities and it being identified as
a major drawback to the impact of the Ecodesign and
Energy Labelling Regulations. This is indeed a problem
that has also been identified in other product categories
and which undermines the energy savings linked to the
Ecodesign and Energy Label measures. We call on the
study team to propose more stringent requirements as
the capacity increases. We recommend that the study
team assesses options such as the use of moisture
Most of the TDs
on the market
have already
moisture
sensors.
We have
addressed this
problem
different to what
proposed here.
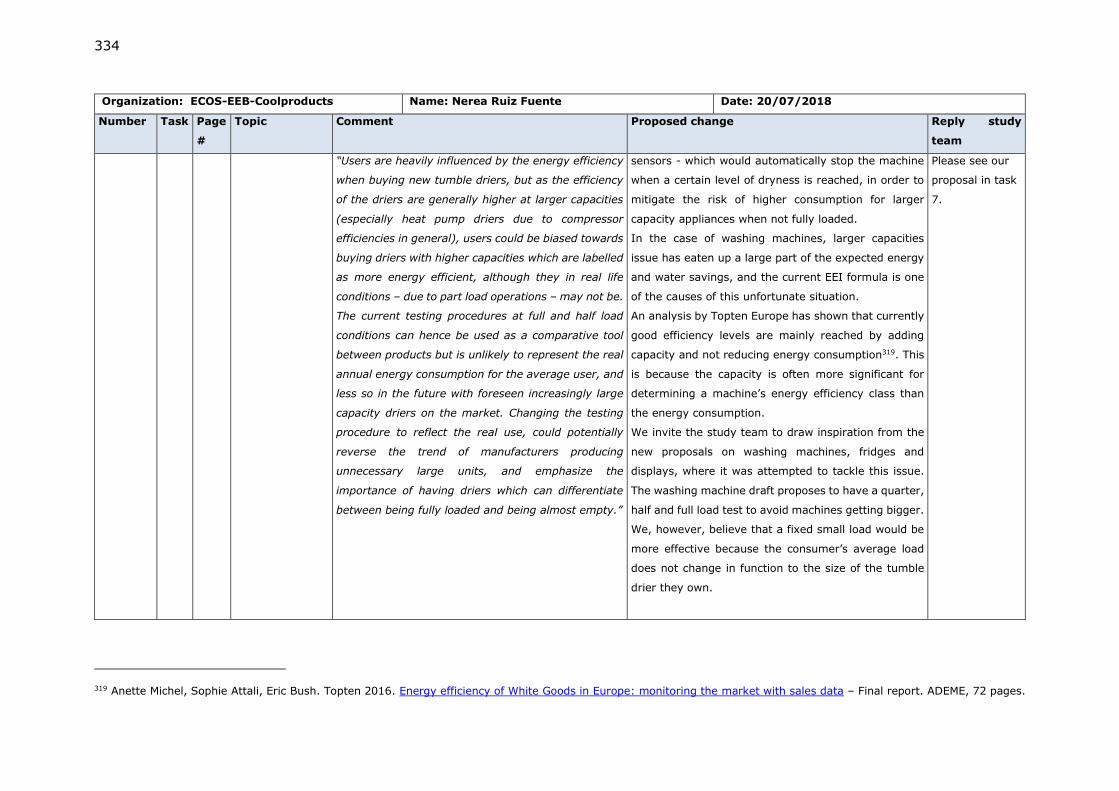
334
Organization: ECOS-EEB-Coolproducts Name: Nerea Ruiz Fuente Date: 20/07/2018
Number Task Page
#
Topic Comment Proposed change Reply study
team
“Users are heavily influenced by the energy efficiency
when buying new tumble driers, but as the efficiency
of the driers are generally higher at larger capacities
(especially heat pump driers due to compressor
efficiencies in general), users could be biased towards
buying driers with higher capacities which are labelled
as more energy efficient, although they in real life
conditions – due to part load operations – may not be.
The current testing procedures at full and half load
conditions can hence be used as a comparative tool
between products but is unlikely to represent the real
annual energy consumption for the average user, and
less so in the future with foreseen increasingly large
capacity driers on the market. Changing the testing
procedure to reflect the real use, could potentially
reverse the trend of manufacturers producing
unnecessary large units, and emphasize the
importance of having driers which can differentiate
between being fully loaded and being almost empty.”
sensors - which would automatically stop the machine
when a certain level of dryness is reached, in order to
mitigate the risk of higher consumption for larger
capacity appliances when not fully loaded.
In the case of washing machines, larger capacities
issue has eaten up a large part of the expected energy
and water savings, and the current EEI formula is one
of the causes of this unfortunate situation.
An analysis by Topten Europe has shown that currently
good efficiency levels are mainly reached by adding
capacity and not reducing energy consumption319. This
is because the capacity is often more significant for
determining a machine’s energy efficiency class than
the energy consumption.
We invite the study team to draw inspiration from the
new proposals on washing machines, fridges and
displays, where it was attempted to tackle this issue.
The washing machine draft proposes to have a quarter,
half and full load test to avoid machines getting bigger.
We, however, believe that a fixed small load would be
more effective because the consumer’s average load
does not change in function to the size of the tumble
drier they own.
Please see our
proposal in task
7.
319 Anette Michel, Sophie Attali, Eric Bush. Topten 2016. Energy efficiency of White Goods in Europe: monitoring the market with sales data – Final report. ADEME, 72 pages.
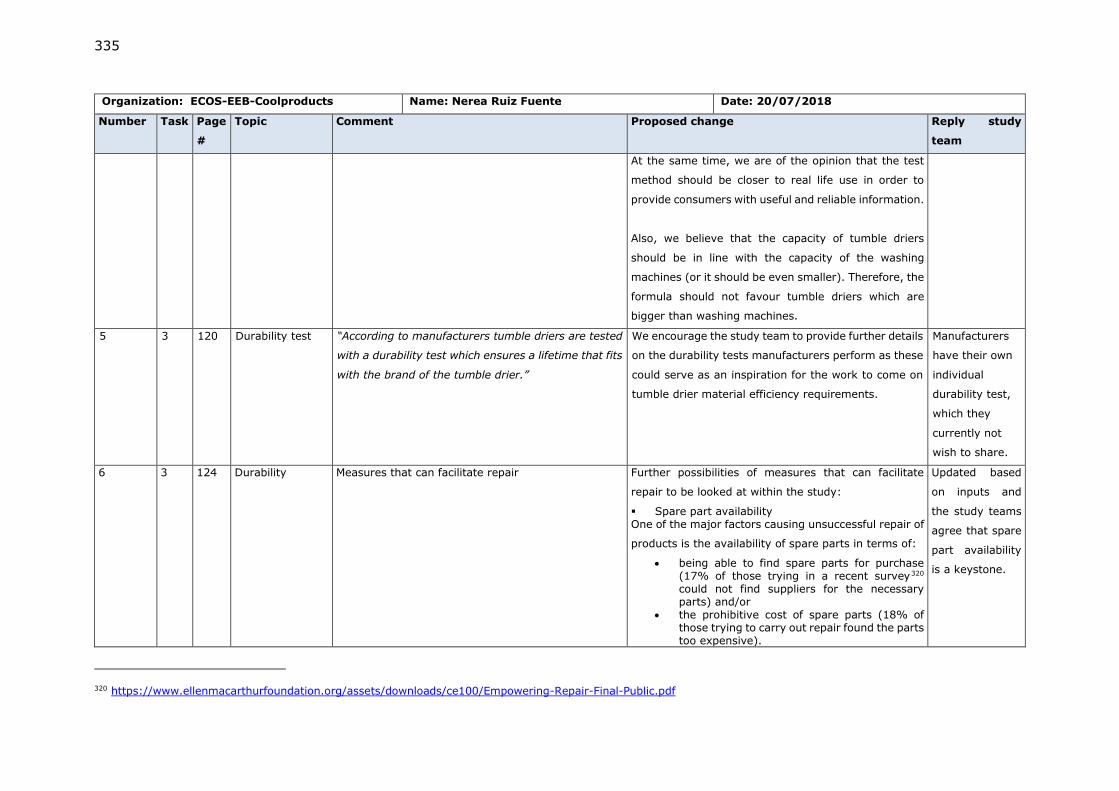
335
Organization: ECOS-EEB-Coolproducts Name: Nerea Ruiz Fuente Date: 20/07/2018
Number Task Page
#
Topic Comment Proposed change Reply study
team
At the same time, we are of the opinion that the test
method should be closer to real life use in order to
provide consumers with useful and reliable information.
Also, we believe that the capacity of tumble driers
should be in line with the capacity of the washing
machines (or it should be even smaller). Therefore, the
formula should not favour tumble driers which are
bigger than washing machines.
5 3 120 Durability test “According to manufacturers tumble driers are tested
with a durability test which ensures a lifetime that fits
with the brand of the tumble drier.”
We encourage the study team to provide further details
on the durability tests manufacturers perform as these
could serve as an inspiration for the work to come on
tumble drier material efficiency requirements.
Manufacturers
have their own
individual
durability test,
which they
currently not
wish to share.
6 3 124 Durability Measures that can facilitate repair Further possibilities of measures that can facilitate
repair to be looked at within the study:
▪ Spare part availability One of the major factors causing unsuccessful repair of
products is the availability of spare parts in terms of:
• being able to find spare parts for purchase (17% of those trying in a recent survey320 could not find suppliers for the necessary parts) and/or
• the prohibitive cost of spare parts (18% of those trying to carry out repair found the parts too expensive).
Updated based
on inputs and
the study teams
agree that spare
part availability
is a keystone.
320 https://www.ellenmacarthurfoundation.org/assets/downloads/ce100/Empowering-Repair-Final-Public.pdf
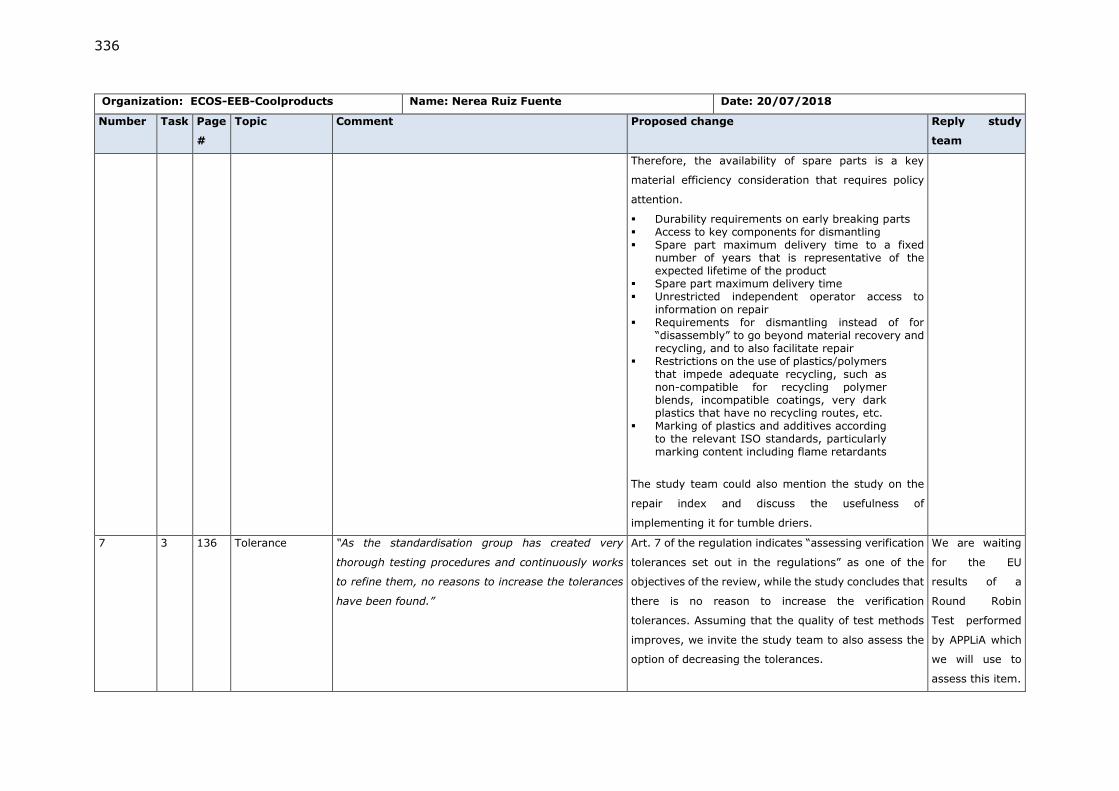
336
Organization: ECOS-EEB-Coolproducts Name: Nerea Ruiz Fuente Date: 20/07/2018
Number Task Page
#
Topic Comment Proposed change Reply study
team
Therefore, the availability of spare parts is a key
material efficiency consideration that requires policy
attention.
▪ Durability requirements on early breaking parts ▪ Access to key components for dismantling ▪ Spare part maximum delivery time to a fixed
number of years that is representative of the expected lifetime of the product
▪ Spare part maximum delivery time ▪ Unrestricted independent operator access to
information on repair ▪ Requirements for dismantling instead of for
“disassembly” to go beyond material recovery and recycling, and to also facilitate repair
▪ Restrictions on the use of plastics/polymers that impede adequate recycling, such as non-compatible for recycling polymer blends, incompatible coatings, very dark plastics that have no recycling routes, etc.
▪ Marking of plastics and additives according to the relevant ISO standards, particularly marking content including flame retardants
The study team could also mention the study on the
repair index and discuss the usefulness of
implementing it for tumble driers.
7 3 136
Tolerance “As the standardisation group has created very
thorough testing procedures and continuously works
to refine them, no reasons to increase the tolerances
have been found.”
Art. 7 of the regulation indicates “assessing verification
tolerances set out in the regulations” as one of the
objectives of the review, while the study concludes that
there is no reason to increase the verification
tolerances. Assuming that the quality of test methods
improves, we invite the study team to also assess the
option of decreasing the tolerances.
We are waiting
for the EU
results of a
Round Robin
Test performed
by APPLiA which
we will use to
assess this item.
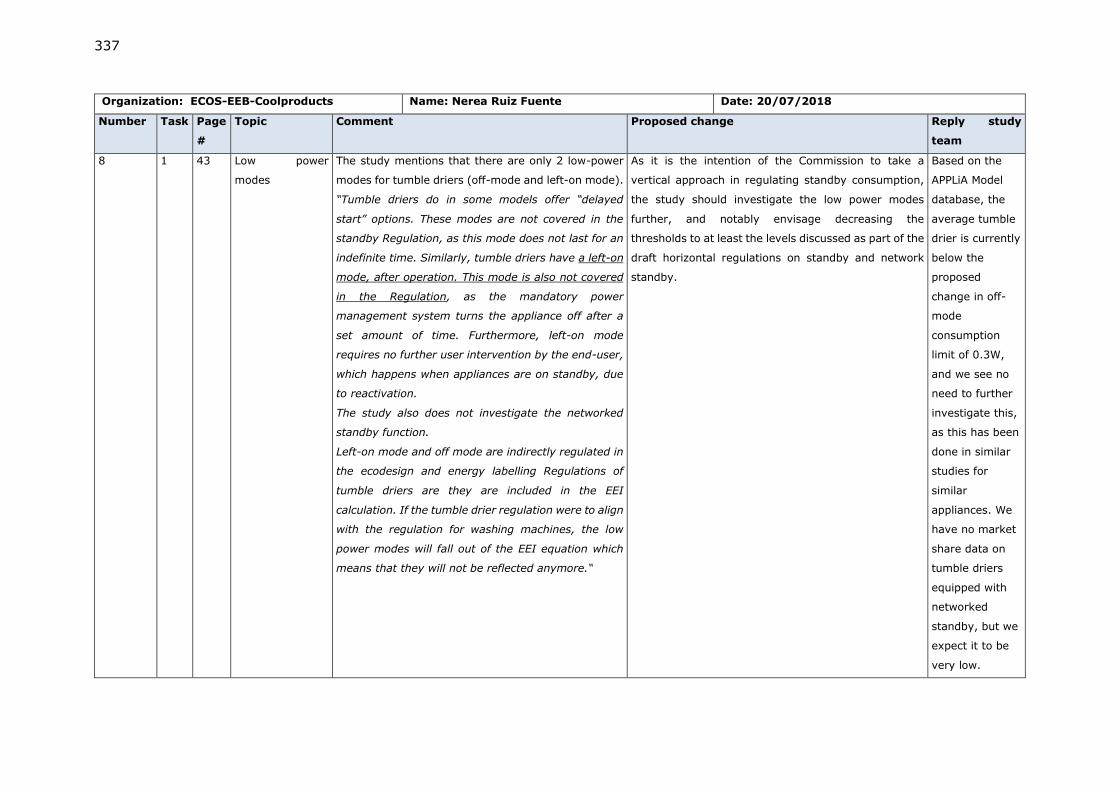
337
Organization: ECOS-EEB-Coolproducts Name: Nerea Ruiz Fuente Date: 20/07/2018
Number Task Page
#
Topic Comment Proposed change Reply study
team
8 1 43 Low power
modes
The study mentions that there are only 2 low-power
modes for tumble driers (off-mode and left-on mode).
“Tumble driers do in some models offer “delayed
start” options. These modes are not covered in the
standby Regulation, as this mode does not last for an
indefinite time. Similarly, tumble driers have a left-on
mode, after operation. This mode is also not covered
in the Regulation, as the mandatory power
management system turns the appliance off after a
set amount of time. Furthermore, left-on mode
requires no further user intervention by the end-user,
which happens when appliances are on standby, due
to reactivation.
The study also does not investigate the networked
standby function.
Left-on mode and off mode are indirectly regulated in
the ecodesign and energy labelling Regulations of
tumble driers are they are included in the EEI
calculation. If the tumble drier regulation were to align
with the regulation for washing machines, the low
power modes will fall out of the EEI equation which
means that they will not be reflected anymore.“
As it is the intention of the Commission to take a
vertical approach in regulating standby consumption,
the study should investigate the low power modes
further, and notably envisage decreasing the
thresholds to at least the levels discussed as part of the
draft horizontal regulations on standby and network
standby.
Based on the
APPLiA Model
database, the
average tumble
drier is currently
below the
proposed
change in off-
mode
consumption
limit of 0.3W,
and we see no
need to further
investigate this,
as this has been
done in similar
studies for
similar
appliances. We
have no market
share data on
tumble driers
equipped with
networked
standby, but we
expect it to be
very low.
338
Organization: ECOS-EEB-Coolproducts Name: Nerea Ruiz Fuente Date: 20/07/2018
Number Task Page
#
Topic Comment Proposed change Reply study
team
9 4 142 Refrigerants It has been established by the study that the heat
pump technology is taking over the market. This will
lead to a large quantity of refrigerants with high GWPs
to be put on the market. The study does not reflect
however on the impact of the refrigerants that are in
the heat pumps. A report from the Energy Efficiency
Task Force of the Montreal Protocol321 states that the
choice of the refrigerant only impacts the energy
efficiency of the product by maximum 5-10%. This is
considered to be insignificant and is compensated by
the CO2eq. avoided by a low GWP refrigerant.
The F-gas regulation does not explicitly mention
tumble driers in its scope. The refrigerant charge
being small, this does not represent a large security
issue if the product contains more flammable
refrigerants.
Based on the overall increase of heat pump technology
within the tumble driers market, we invite the study
team to further assess the existing options and low
GWP units, and even to explore a bonus system as it
was the case with AC units using low GWP refrigerants
– or a malus system for those appliances with high
GWP.
The study should include broken down data per type of
refrigerant to identify the best technology available in
terms of refrigerant use.
We have
received more
data indicating
no effect on
energy
consumption.
Thus, we
propose this as a
design option
and part of all
the policy
options.
10 1 45 Condensation
efficiency
The threshold for a Class A condensation efficiency is
90%. Classes D to G have already been removed from
the market. Technological improvement has also
taken place for this function which is important
because it puts less burden on the secondary energy
system of the room where the tumble drier is located.
Today there are already models that reach a 95%
condensation efficiency (e.g. Miele).
A re-scaling of the condensation efficiencies is most
likely needed since from the A-G scale only classes A,
B and C can be put on the market. This does not fully
exploit the A-G scale.
We recommend performing an assessment of what the
best condensation efficiencies are, and to gather some
data on this aspect.
This is
considered for
task 7. The
study team are
aware of the
problems
regarding a wide
A-C interval.
321 http://conf.montreal-protocol.org/meeting/oewg/oewg-40/presession/Background-Documents/TEAP_DecisionXXIX-10_Task_Force_EE_May2018.pdf
339
Organization: ECOS-EEB-Coolproducts Name: Nerea Ruiz Fuente Date: 20/07/2018
Number Task Page
#
Topic Comment Proposed change Reply study
team
11 3 100 Consumption
denominator
For washing machines and dishwashers there are
similar discussions to change the denominator from
an annual to a cycle-based consumption which
removes the assumption on the amount of cycles per
year.
Annual or cycle consumption. The denominators for
tumble driers should be adapted to the outcome of the
discussions on washing machines (and washer driers)
to allow for comparability and understanding from the
consumer.
We agree, but as
the drying
behaviour is not
identical to the
washing
behaviour, a
differentiation
might still be
required.
12 All We believe that the preparatory study should present
the technical basis to define future ecodesign and
energy labelling requirements based on the existing
Regulation (EU) 932/2012 and 392/2012 while avoid
taking strong position unless substantiated.
We encourage the study team to use a more balanced
approach throughout the assessment in order to avoid
making decisions at this stage of the process. Some
examples:
“it is clear that existing market forces are regulating
the market towards using condenser driers instead of
air-vented. This might nullify the effects of new
ecodesign Regulations on these types of driers, as they
are gradually being removed from the market on a
voluntary basis.”
“The low collection rate of tumble driers can challenge
the improvement potential of any suggestions
regarding resource efficiency since many products do
not reach the desired recycling facility.”
“Some requirements may be difficult to address from a
market surveillance perspective because the
requirements are difficult to control such as
requirements of ease of dismantling.”
No decisions are
made in task 1
to task 4. These
statements are
only
observations.
The report is
updated with the
work on the
Scoring System
on Reparability
340
Organization: ECOS-EEB-Coolproducts Name: Nerea Ruiz Fuente Date: 20/07/2018
Number Task Page
#
Topic Comment Proposed change Reply study
team
In this sense, several of the above-mentioned
statements can already be challenged. For instance,
note the proposed requirements on dismantling and
disassembly for washing machines and dishwashers.
While the verification of requirements for ease of
dismantling are already being implemented in IEEE
standards based on documentation, we could also
imagine establishing a simple test procedure to be
carried out by independent laboratories.
We therefore invite the study team to focus more on
the opportunities that resource efficiency parameters
may offer, rather than highlight the challenges,
responding to the clear political guidelines foreseen in
the Ecodesign Working Plan 2016-2019.
13 3 117 Resource
efficiency
The preparatory study concluded that the
technological improvement of tumble driers will take
place through an improvement of its main
components. Resource efficiency should be treated
similarly, and the resource efficiency potential should
be assessed on the basis of its components –
identifying the key components and the ones that are
the most subject to fail.
The durability of the machine is strongly correlated
with how the consumer uses the machine.
The study should investigate resource efficiency
aspects on the basis of the components. It should also
take into account the user’s behaviour that could
negatively affect the durability of the machine (benefits
of self-cleaning filter for users that do not properly
clean their device).
It is difficult to
obtain the
needed data to
assess the
resource
efficiency on a
component
level. Also, any
result will be
connected with a
high
uncertainty.
However, the
341
Organization: ECOS-EEB-Coolproducts Name: Nerea Ruiz Fuente Date: 20/07/2018
Number Task Page
#
Topic Comment Proposed change Reply study
team
report already
pinpoints critical
components.
14 3 126 Repairability &
Critical
components
Through the NGO network working on repair, we acquired the following information corresponding to the
largest retailer of EEE in France.
▪ Lifetime of a tumble drier: o median lifetime: 8 years
▪ Reasons for replacement of tumble driers and failure rate: o 87.5% of the tumble driers were replaced because of a failure, and o 12.5% while they were still working. o The failure rate before the legal warranty period (in France 2 years) is 3.6% (a stable
figure from 2015 to 2017) ▪ Ranking of replaced spare parts (very often the tension idler will be replaced alongside the
strap/belt) o For the least reliable product:
Pump 41,70%
Strap/belt 28,41%
Resistance 15,87%
Tension idler 6,27%
Drum 3,32%
Turbine 1,85%
Thermostat 1,48%
Bearing block 1,11%
o For the most sold model (with a failure-rate slightly better than the average):
Resistance 42,19%
Pump 18,75%
Strap/belt 14,06%
Turbine 13,28%
Drum 9,38%
Tension idler 2,34%
Report updated
based on falling
parts
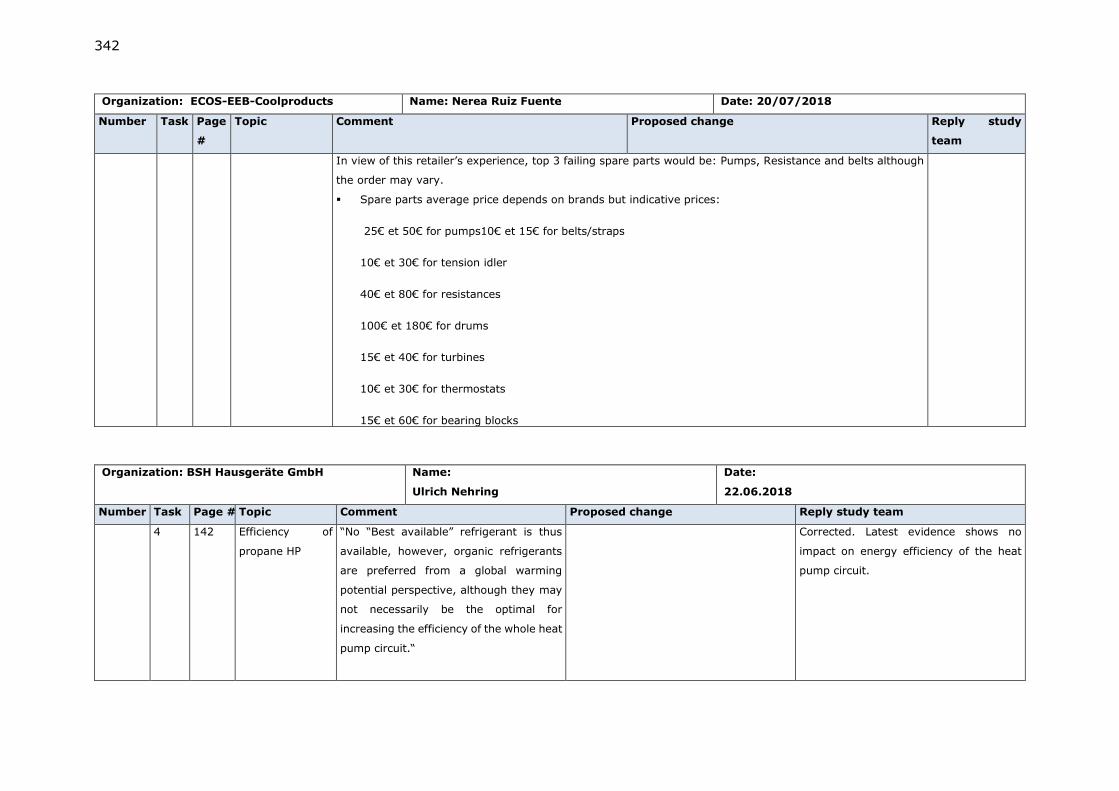
342
Organization: ECOS-EEB-Coolproducts Name: Nerea Ruiz Fuente Date: 20/07/2018
Number Task Page
#
Topic Comment Proposed change Reply study
team
In view of this retailer’s experience, top 3 failing spare parts would be: Pumps, Resistance and belts although
the order may vary.
▪ Spare parts average price depends on brands but indicative prices:
25€ et 50€ for pumps10€ et 15€ for belts/straps
10€ et 30€ for tension idler
40€ et 80€ for resistances
100€ et 180€ for drums
15€ et 40€ for turbines
10€ et 30€ for thermostats
15€ et 60€ for bearing blocks
Organization: BSH Hausgeräte GmbH
Name:
Ulrich Nehring
Date:
22.06.2018
Number Task Page # Topic Comment Proposed change Reply study team
4 142 Efficiency of
propane HP
“No “Best available” refrigerant is thus
available, however, organic refrigerants
are preferred from a global warming
potential perspective, although they may
not necessarily be the optimal for
increasing the efficiency of the whole heat
pump circuit.“
Corrected. Latest evidence shows no
impact on energy efficiency of the heat
pump circuit.
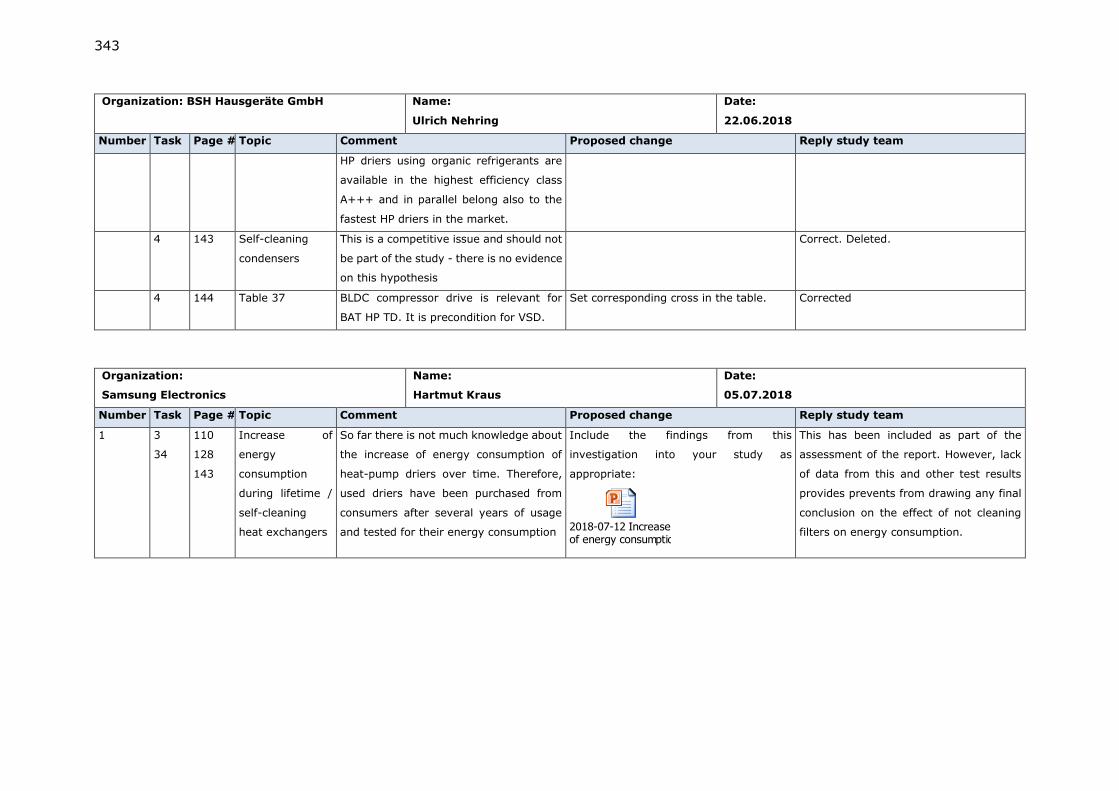
343
Organization: BSH Hausgeräte GmbH
Name:
Ulrich Nehring
Date:
22.06.2018
Number Task Page # Topic Comment Proposed change Reply study team
HP driers using organic refrigerants are
available in the highest efficiency class
A+++ and in parallel belong also to the
fastest HP driers in the market.
4 143 Self-cleaning
condensers
This is a competitive issue and should not
be part of the study - there is no evidence
on this hypothesis
Correct. Deleted.
4 144 Table 37 BLDC compressor drive is relevant for
BAT HP TD. It is precondition for VSD.
Set corresponding cross in the table. Corrected
Organization:
Samsung Electronics
Name:
Hartmut Kraus
Date:
05.07.2018
Number Task Page # Topic Comment Proposed change Reply study team
1 3
34
110
128
143
Increase of
energy
consumption
during lifetime /
self-cleaning
heat exchangers
So far there is not much knowledge about
the increase of energy consumption of
heat-pump driers over time. Therefore,
used driers have been purchased from
consumers after several years of usage
and tested for their energy consumption
Include the findings from this
investigation into your study as
appropriate:
2018-07-12 Increase of energy consumption of heatpump dryers during lifetime.pptx
This has been included as part of the
assessment of the report. However, lack
of data from this and other test results
provides prevents from drawing any final
conclusion on the effect of not cleaning
filters on energy consumption.
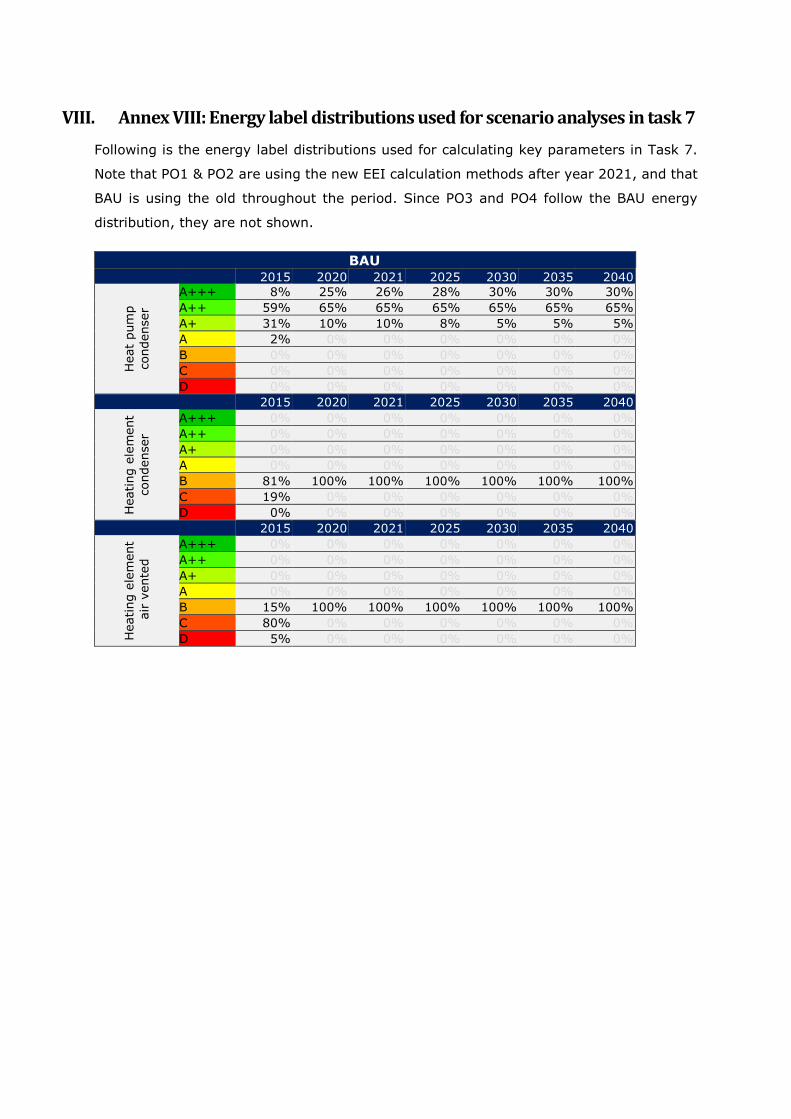
VIII. Annex VIII: Energy label distributions used for scenario analyses in task 7
Following is the energy label distributions used for calculating key parameters in Task 7.
Note that PO1 & PO2 are using the new EEI calculation methods after year 2021, and that
BAU is using the old throughout the period. Since PO3 and PO4 follow the BAU energy
distribution, they are not shown.
BAU 2015 2020 2021 2025 2030 2035 2040
Heat
pum
p
condenser
A+++ 8% 25% 26% 28% 30% 30% 30%
A++ 59% 65% 65% 65% 65% 65% 65%
A+ 31% 10% 10% 8% 5% 5% 5%
A 2% 0% 0% 0% 0% 0% 0%
B 0% 0% 0% 0% 0% 0% 0%
C 0% 0% 0% 0% 0% 0% 0%
D 0% 0% 0% 0% 0% 0% 0%
2015 2020 2021 2025 2030 2035 2040
Heating e
lem
ent
condenser
A+++ 0% 0% 0% 0% 0% 0% 0%
A++ 0% 0% 0% 0% 0% 0% 0%
A+ 0% 0% 0% 0% 0% 0% 0%
A 0% 0% 0% 0% 0% 0% 0%
B 81% 100% 100% 100% 100% 100% 100%
C 19% 0% 0% 0% 0% 0% 0%
D 0% 0% 0% 0% 0% 0% 0%
2015 2020 2021 2025 2030 2035 2040
Heating e
lem
ent
air
vente
d
A+++ 0% 0% 0% 0% 0% 0% 0%
A++ 0% 0% 0% 0% 0% 0% 0%
A+ 0% 0% 0% 0% 0% 0% 0%
A 0% 0% 0% 0% 0% 0% 0%
B 15% 100% 100% 100% 100% 100% 100%
C 80% 0% 0% 0% 0% 0% 0%
D 5% 0% 0% 0% 0% 0% 0%
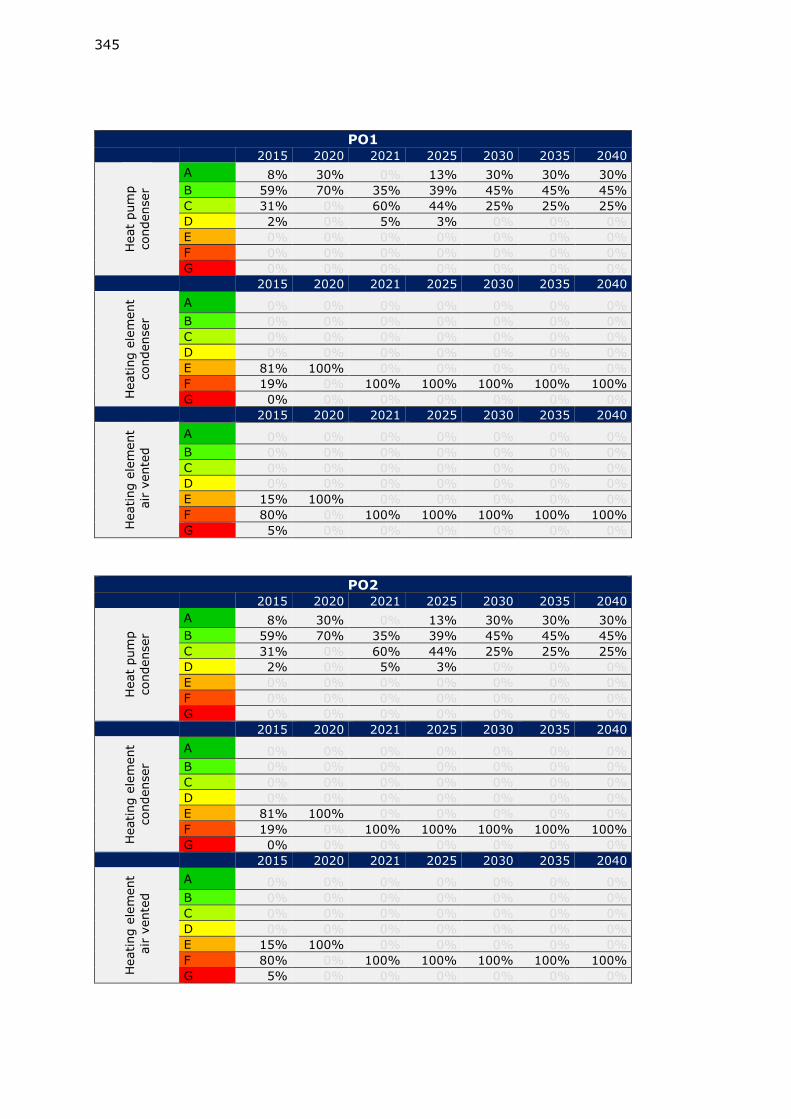
345
PO1 2015 2020 2021 2025 2030 2035 2040
Heat
pum
p
condenser
A 8% 30% 0% 13% 30% 30% 30%
B 59% 70% 35% 39% 45% 45% 45%
C 31% 0% 60% 44% 25% 25% 25%
D 2% 0% 5% 3% 0% 0% 0%
E 0% 0% 0% 0% 0% 0% 0%
F 0% 0% 0% 0% 0% 0% 0%
G 0% 0% 0% 0% 0% 0% 0%
2015 2020 2021 2025 2030 2035 2040
Heating e
lem
ent
condenser
A 0% 0% 0% 0% 0% 0% 0%
B 0% 0% 0% 0% 0% 0% 0%
C 0% 0% 0% 0% 0% 0% 0%
D 0% 0% 0% 0% 0% 0% 0%
E 81% 100% 0% 0% 0% 0% 0%
F 19% 0% 100% 100% 100% 100% 100%
G 0% 0% 0% 0% 0% 0% 0%
2015 2020 2021 2025 2030 2035 2040
Heating e
lem
ent
air
vente
d
A 0% 0% 0% 0% 0% 0% 0%
B 0% 0% 0% 0% 0% 0% 0%
C 0% 0% 0% 0% 0% 0% 0%
D 0% 0% 0% 0% 0% 0% 0%
E 15% 100% 0% 0% 0% 0% 0%
F 80% 0% 100% 100% 100% 100% 100%
G 5% 0% 0% 0% 0% 0% 0%
PO2 2015 2020 2021 2025 2030 2035 2040
Heat
pum
p
condenser
A 8% 30% 0% 13% 30% 30% 30%
B 59% 70% 35% 39% 45% 45% 45%
C 31% 0% 60% 44% 25% 25% 25%
D 2% 0% 5% 3% 0% 0% 0%
E 0% 0% 0% 0% 0% 0% 0%
F 0% 0% 0% 0% 0% 0% 0%
G 0% 0% 0% 0% 0% 0% 0%
2015 2020 2021 2025 2030 2035 2040
Heating e
lem
ent
condenser
A 0% 0% 0% 0% 0% 0% 0%
B 0% 0% 0% 0% 0% 0% 0%
C 0% 0% 0% 0% 0% 0% 0%
D 0% 0% 0% 0% 0% 0% 0%
E 81% 100% 0% 0% 0% 0% 0%
F 19% 0% 100% 100% 100% 100% 100%
G 0% 0% 0% 0% 0% 0% 0%
2015 2020 2021 2025 2030 2035 2040
Heating e
lem
ent
air
vente
d
A 0% 0% 0% 0% 0% 0% 0%
B 0% 0% 0% 0% 0% 0% 0%
C 0% 0% 0% 0% 0% 0% 0%
D 0% 0% 0% 0% 0% 0% 0%
E 15% 100% 0% 0% 0% 0% 0%
F 80% 0% 100% 100% 100% 100% 100%
G 5% 0% 0% 0% 0% 0% 0%
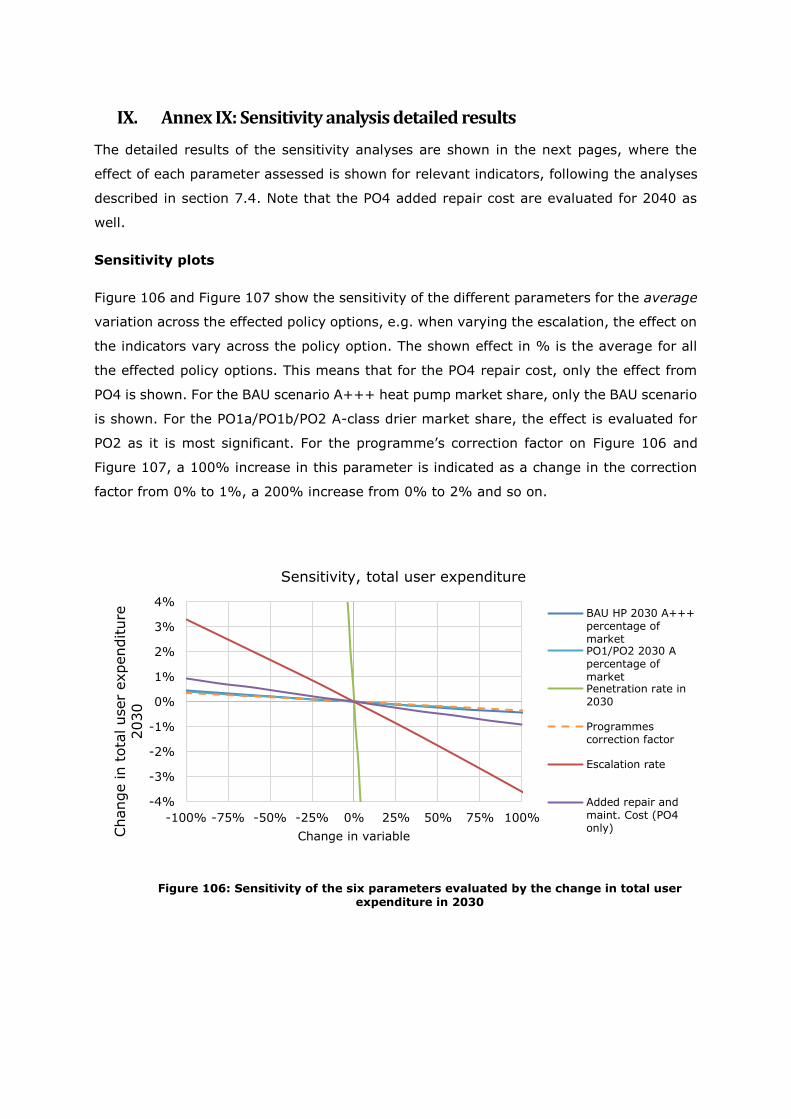
IX. Annex IX: Sensitivity analysis detailed results
The detailed results of the sensitivity analyses are shown in the next pages, where the
effect of each parameter assessed is shown for relevant indicators, following the analyses
described in section 7.4. Note that the PO4 added repair cost are evaluated for 2040 as
well.
Sensitivity plots
Figure 106 and Figure 107 show the sensitivity of the different parameters for the average
variation across the effected policy options, e.g. when varying the escalation, the effect on
the indicators vary across the policy option. The shown effect in % is the average for all
the effected policy options. This means that for the PO4 repair cost, only the effect from
PO4 is shown. For the BAU scenario A+++ heat pump market share, only the BAU scenario
is shown. For the PO1a/PO1b/PO2 A-class drier market share, the effect is evaluated for
PO2 as it is most significant. For the programme’s correction factor on Figure 106 and
Figure 107, a 100% increase in this parameter is indicated as a change in the correction
factor from 0% to 1%, a 200% increase from 0% to 2% and so on.
Figure 106: Sensitivity of the six parameters evaluated by the change in total user expenditure in 2030
-4%
-3%
-2%
-1%
0%
1%
2%
3%
4%
-100% -75% -50% -25% 0% 25% 50% 75% 100%
Change in t
ota
l user
expenditure
2030
Change in variable
Sensitivity, total user expenditure
BAU HP 2030 A+++percentage ofmarketPO1/PO2 2030 Apercentage ofmarketPenetration rate in2030
Programmescorrection factor
Escalation rate
Added repair andmaint. Cost (PO4only)
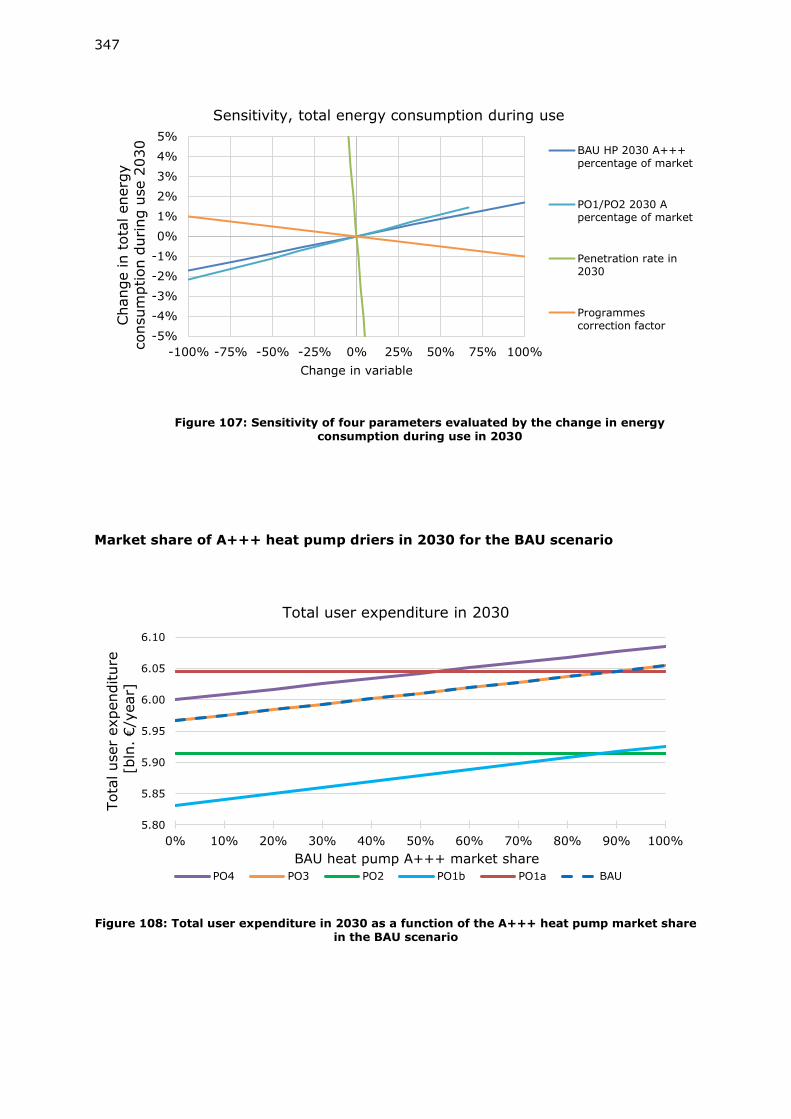
347
Figure 107: Sensitivity of four parameters evaluated by the change in energy consumption during use in 2030
Market share of A+++ heat pump driers in 2030 for the BAU scenario
Figure 108: Total user expenditure in 2030 as a function of the A+++ heat pump market share in the BAU scenario
-5%
-4%
-3%
-2%
-1%
0%
1%
2%
3%
4%
5%
-100% -75% -50% -25% 0% 25% 50% 75% 100%
Change in t
ota
l energ
y
consum
ption d
uring u
se 2
030
Change in variable
Sensitivity, total energy consumption during use
BAU HP 2030 A+++percentage of market
PO1/PO2 2030 Apercentage of market
Penetration rate in2030
Programmescorrection factor
5.80
5.85
5.90
5.95
6.00
6.05
6.10
0% 10% 20% 30% 40% 50% 60% 70% 80% 90% 100%
Tota
l user
expenditure
[bln
. €/y
ear]
BAU heat pump A+++ market share
Total user expenditure in 2030
PO4 PO3 PO2 PO1b PO1a BAU
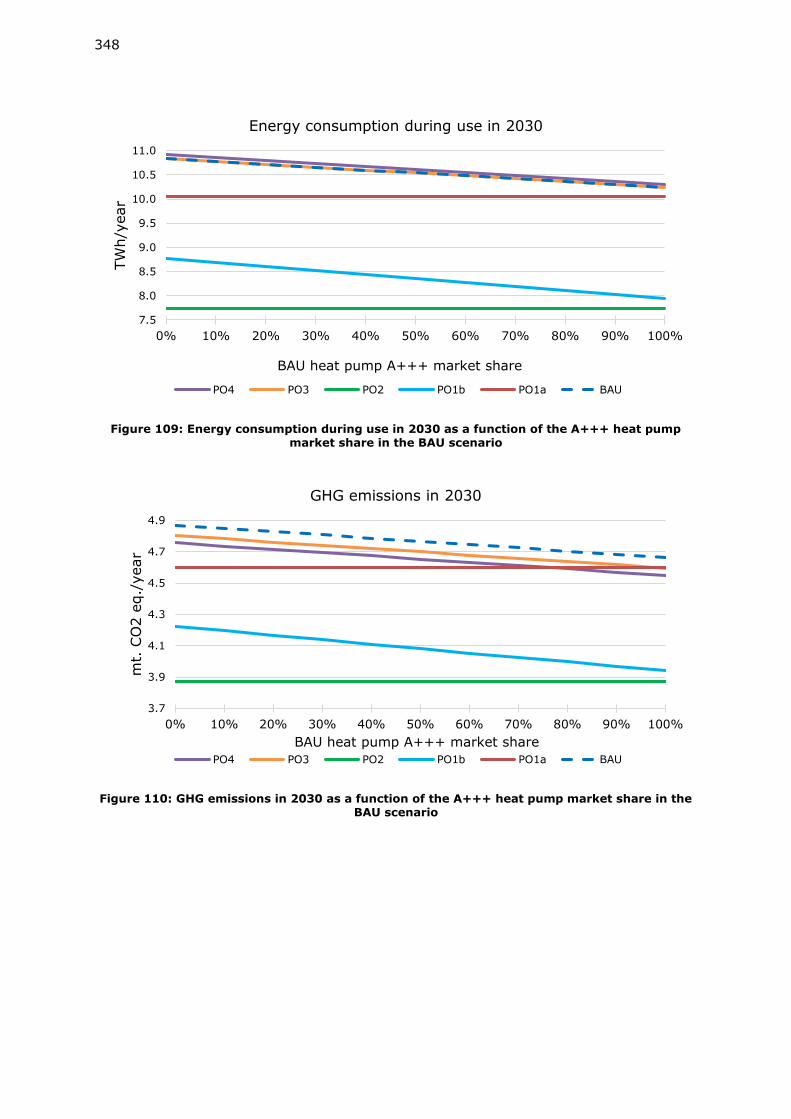
348
Figure 109: Energy consumption during use in 2030 as a function of the A+++ heat pump market share in the BAU scenario
Figure 110: GHG emissions in 2030 as a function of the A+++ heat pump market share in the BAU scenario
7.5
8.0
8.5
9.0
9.5
10.0
10.5
11.0
0% 10% 20% 30% 40% 50% 60% 70% 80% 90% 100%
TW
h/y
ear
BAU heat pump A+++ market share
Energy consumption during use in 2030
PO4 PO3 PO2 PO1b PO1a BAU
3.7
3.9
4.1
4.3
4.5
4.7
4.9
0% 10% 20% 30% 40% 50% 60% 70% 80% 90% 100%
mt.
CO
2 e
q./
year
BAU heat pump A+++ market share
GHG emissions in 2030
PO4 PO3 PO2 PO1b PO1a BAU
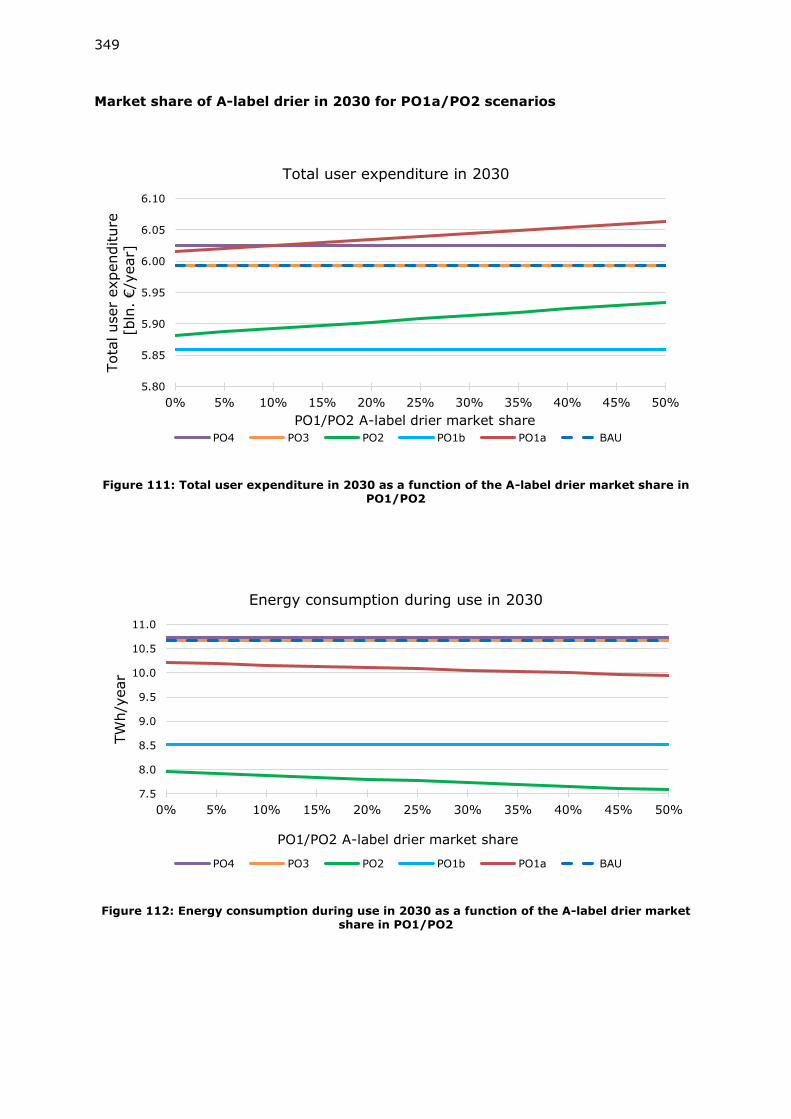
349
Market share of A-label drier in 2030 for PO1a/PO2 scenarios
Figure 111: Total user expenditure in 2030 as a function of the A-label drier market share in PO1/PO2
Figure 112: Energy consumption during use in 2030 as a function of the A-label drier market share in PO1/PO2
5.80
5.85
5.90
5.95
6.00
6.05
6.10
0% 5% 10% 15% 20% 25% 30% 35% 40% 45% 50%
Tota
l user
expenditure
[bln
. €/y
ear]
PO1/PO2 A-label drier market share
Total user expenditure in 2030
PO4 PO3 PO2 PO1b PO1a BAU
7.5
8.0
8.5
9.0
9.5
10.0
10.5
11.0
0% 5% 10% 15% 20% 25% 30% 35% 40% 45% 50%
TW
h/y
ear
PO1/PO2 A-label drier market share
Energy consumption during use in 2030
PO4 PO3 PO2 PO1b PO1a BAU
350
Figure 113: Total GHG emissions in 2030 as a function of the A-label drier market share in PO1/PO2
Penetration rate in 2030
Figure 114: Total user expenditures in 2030 as a function of the tumble drier penetration rate
3.7
3.9
4.1
4.3
4.5
4.7
4.9
0% 5% 10% 15% 20% 25% 30% 35% 40% 45% 50%
mt.
CO
2 e
q./
year
PO1/PO2 A-label drier market share
GHG emissions in 2030
PO4 PO3 PO2 PO1b PO1a BAU
5.4
5.6
5.8
6.0
6.2
6.4
6.6
6.8
27.0% 27.5% 28.0% 28.5% 29.0% 29.5% 30.0% 30.5% 31.0%
Tota
l user
expenditure
[bln
. €/y
ear]
Tumbledrier penetration rate in 2030
Total user expenditure in 2030
PO4 PO3 PO2 PO1b PO1a BAU
351
Figure 115: Energy consumption during use in 2030 as a function of the tumble drier penetration rate
Figure 116: Total GHG emissions in 2030 as a function of the tumble drier penetration rate
7
8
9
10
11
12
27.0% 27.5% 28.0% 28.5% 29.0% 29.5% 30.0% 30.5% 31.0%
TW
h/y
ear
Tumbledrier penetration rate in 2030
Energy consumption during use in 2030
PO4 PO3 PO2 PO1b PO1a BAU
3.5
3.7
3.9
4.1
4.3
4.5
4.7
4.9
5.1
5.3
5.5
27.0% 27.5% 28.0% 28.5% 29.0% 29.5% 30.0% 30.5% 31.0%
mt.
CO
2 e
q./
year
Tumbledrier penetration rate in 2030
GHG emissions in 2030
PO4 PO3 PO2 PO1b PO1a BAU
352
Figure 117: Total material consumption in 2030 as a function of the tumble drier penetration rate
Escalation rate
Figure 118: Total user expenditures in 2030 as a function of the escalation rate of electricity
275
295
315
335
355
27.0% 27.5% 28.0% 28.5% 29.0% 29.5% 30.0% 30.5% 31.0%
mt.
raw
mate
rials
/year
Tumbledrier penetration rate in 2030
Total material usage in 2030
PO4 PO3 PO2 PO1b PO1a BAU
5.60
5.85
6.10
6.35
6.60
6.85
7.10
7.35
7.60
0.0% 0.5% primes 1.0% 1.5% 2.0% 2.5% 3.0% 3.5% 4.0%
Tota
l user
expenditure
[bln
. €/y
ear]
Esclation rate
Total user expenditure in 2030
PO4 PO3 PO2 PO1b PO1a BAU
353
PO4 added repair and maintenance cost
Figure 119: Total user expenditures in 2030 as a function of added repair and maintenance cost for PO4
Figure 120: Total user expenditures in 2040 as a function of added repair and maintenance cost for PO4
5.85
5.90
5.95
6.00
6.05
6.10
0 1 2 3 4 5 6 7 8 9 10
Tota
l user
expenditure
[bln
. €/y
ear]
Added repair and maintanance cost (PO4 Only), €/unit/year
Total user expenditure in 2030
PO4 PO3 PO2 PO1b PO1a BAU
5.20
5.30
5.40
5.50
5.60
5.70
5.80
5.90
6.00
0 1 2 3 4 5 6 7 8 9 10
Tota
l user
expenditure
[bln
. €/y
ear]
Added repair and maintanance cost (PO4 Only), €/unit/year
Total user expenditure in 2040
PO4 PO3 PO2 PO1b PO1a BAU
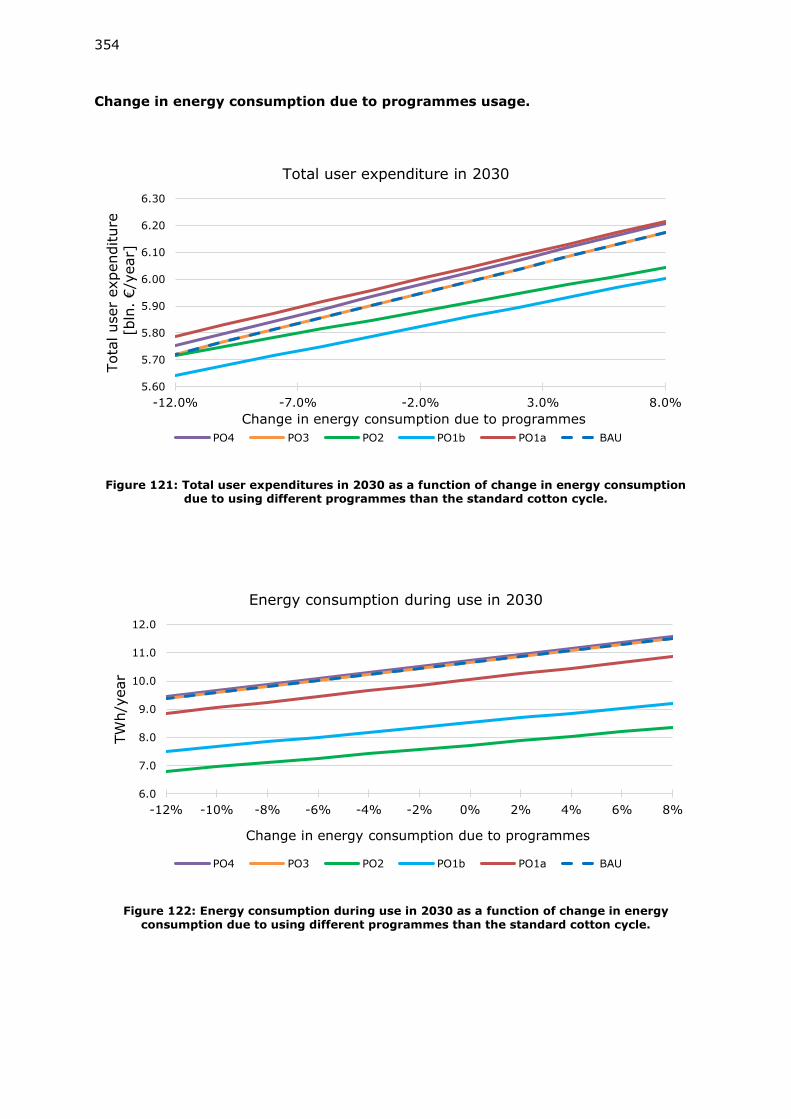
354
Change in energy consumption due to programmes usage.
Figure 121: Total user expenditures in 2030 as a function of change in energy consumption due to using different programmes than the standard cotton cycle.
Figure 122: Energy consumption during use in 2030 as a function of change in energy consumption due to using different programmes than the standard cotton cycle.
5.60
5.70
5.80
5.90
6.00
6.10
6.20
6.30
-12.0% -7.0% -2.0% 3.0% 8.0%
Tota
l user
expenditure
[bln
. €/y
ear]
Change in energy consumption due to programmes
Total user expenditure in 2030
PO4 PO3 PO2 PO1b PO1a BAU
6.0
7.0
8.0
9.0
10.0
11.0
12.0
-12% -10% -8% -6% -4% -2% 0% 2% 4% 6% 8%
TW
h/y
ear
Change in energy consumption due to programmes
Energy consumption during use in 2030
PO4 PO3 PO2 PO1b PO1a BAU
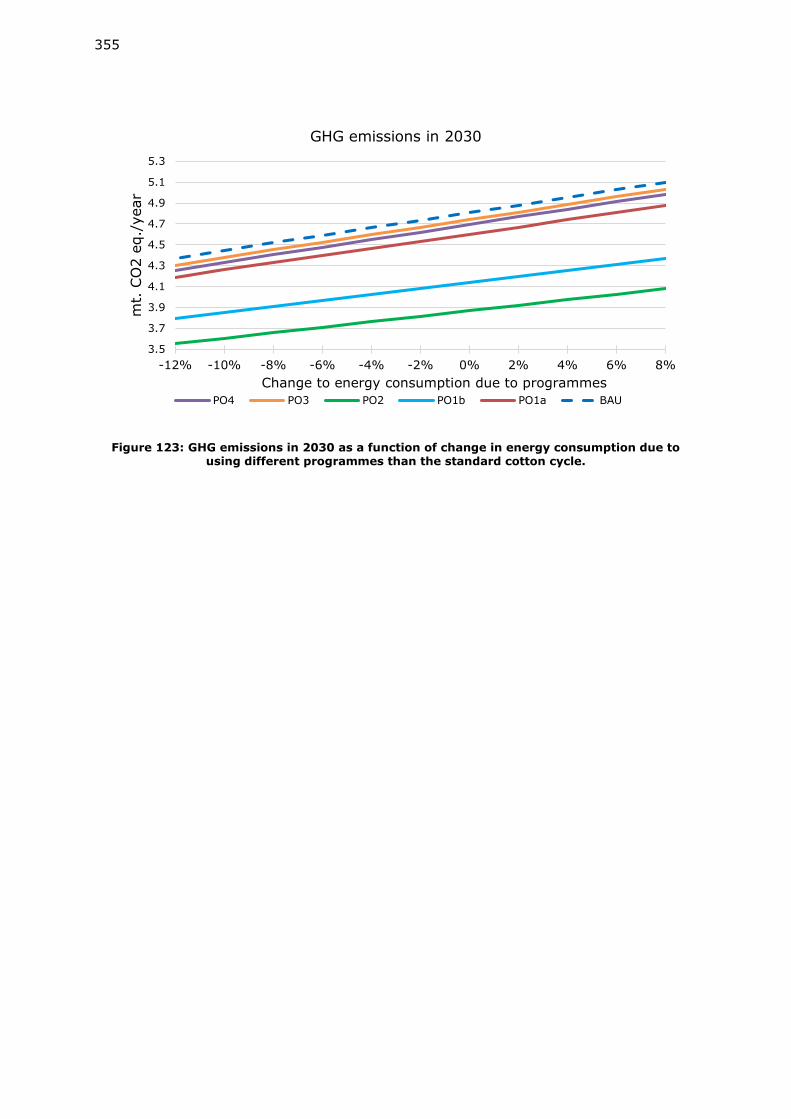
355
Figure 123: GHG emissions in 2030 as a function of change in energy consumption due to using different programmes than the standard cotton cycle.
3.5
3.7
3.9
4.1
4.3
4.5
4.7
4.9
5.1
5.3
-12% -10% -8% -6% -4% -2% 0% 2% 4% 6% 8%
mt.
CO
2 e
q./
year
Change to energy consumption due to programmes
GHG emissions in 2030
PO4 PO3 PO2 PO1b PO1a BAU
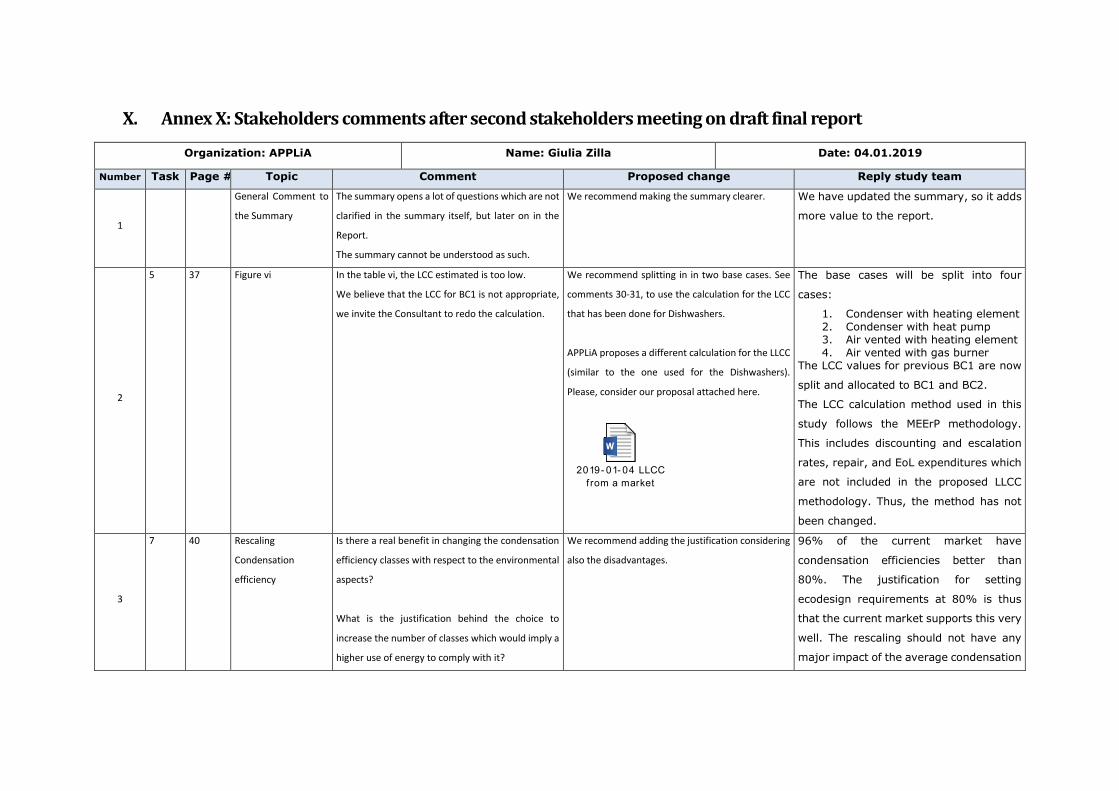
X. Annex X: Stakeholders comments after second stakeholders meeting on draft final report
Organization: APPLiA Name: Giulia Zilla Date: 04.01.2019
Number Task Page # Topic Comment Proposed change Reply study team
1
General Comment to
the Summary
The summary opens a lot of questions which are not
clarified in the summary itself, but later on in the
Report.
The summary cannot be understood as such.
We recommend making the summary clearer. We have updated the summary, so it adds
more value to the report.
2
5 37 Figure vi In the table vi, the LCC estimated is too low.
We believe that the LCC for BC1 is not appropriate,
we invite the Consultant to redo the calculation.
We recommend splitting in in two base cases. See
comments 30-31, to use the calculation for the LCC
that has been done for Dishwashers.
APPLiA proposes a different calculation for the LLCC
(similar to the one used for the Dishwashers).
Please, consider our proposal attached here.
2019- 01- 04 LLCC
f rom a market
The base cases will be split into four
cases:
1. Condenser with heating element 2. Condenser with heat pump 3. Air vented with heating element 4. Air vented with gas burner
The LCC values for previous BC1 are now
split and allocated to BC1 and BC2.
The LCC calculation method used in this
study follows the MEErP methodology.
This includes discounting and escalation
rates, repair, and EoL expenditures which
are not included in the proposed LLCC
methodology. Thus, the method has not
been changed.
3
7 40 Rescaling
Condensation
efficiency
Is there a real benefit in changing the condensation
efficiency classes with respect to the environmental
aspects?
What is the justification behind the choice to
increase the number of classes which would imply a
higher use of energy to comply with it?
We recommend adding the justification considering
also the disadvantages.
96% of the current market have
condensation efficiencies better than
80%. The justification for setting
ecodesign requirements at 80% is thus
that the current market supports this very
well. The rescaling should not have any
major impact of the average condensation
357
Organization: APPLiA Name: Giulia Zilla Date: 04.01.2019
Number Task Page # Topic Comment Proposed change Reply study team
efficiency but will enable users to better
differentiate between the different driers.
4
7 41 Figure xi - PO1b –
Energy and
load average of
market
Currently no technology available.
This causes extra effort for control panels: rises
costs of appliances, simple controls are not allowed
any more.
We recommend deleting this policy option (PO1b).
Four reasons:
1. Storage and accumulation of wet laundry is not
recommended.
2. There is no possibility to differentiate the amount
of dry load from the water load
3. There is no technology available to estimate the
weight of the dry load based on the weight of the
wet load.
4. Such ecodesign requirement would imply that all
the appliances should be equipped with a display as
control panel. This would increase the cost of the
appliance and would have a strong impact on the
resource efficiency.
The study team has chosen to remove the
PO1b and PO2b from Task 7 and Task 6.
The four reasons listed are true, but it
might be technological possible to
integrate such a system on a lower level.
For instance, instead of integrating a
status display, a LED could change colour
from Red/Yellow/Green depending on the
selected programme and weight of the
laundry (based on an average wetness).
5
7 41 Figure xi - PO2b –
Energy and
load BAT
Currently no technology available.
This causes extra effort for control panels: rises
costs of appliances, simple controls are not allowed
any more.
We recommend deleting this policy option (PO2b).
Four reasons:
1. Storage and accumulation of wet laundry is not
recommended.
2. There is no possibility to differentiate the amount
of dry load from the water load
3. There is no technology available to estimate the
weight of the dry load based on the weight of the
wet load.
Same comment as above.
358
Organization: APPLiA Name: Giulia Zilla Date: 04.01.2019
Number Task Page # Topic Comment Proposed change Reply study team
4. Such ecodesign requirement would imply that all
the appliances should be equipped with a display as
control panel. This would increase the cost of the
appliance and would have a strong impact on the
resource efficiency.
6
7 42 PO3 – Dismantling
and
Recycling
Such information not part of energy label – it
changes the intention of the label
We recommend to not include this information on
the energy label.
This would mislead the main intention of the energy
label. Moreover, this could lead to a large number
of obstacles and numerous difficulties for industries
that need to be taken in consideration.
Please find in the file attached below, valid
argumentations on why we ask to not include this
information on the energy label.
2019- 01- 04
Recycled plast ic
Label information requirement has been deleted due to small potential savings identified in Task 6
7
7 42 PO4 – Reparability
and
durability
Not in the manual of the product, this would cause
repairs by non-professionals, with the risk of serious
damage or injuries.
We recommend allowing information only on the
webpage for professional repairers.
It should be in a place where all
professionals can access to, not only
those accredited by OEMs. A possibility is
the manual, with a caution sign for
consumers in case of warranty claims.
359
Organization: APPLiA Name: Giulia Zilla Date: 04.01.2019
Number Task Page # Topic Comment Proposed change Reply study team
8
7 42 Figure ix - Energy
consumption during
use for the different
POs
PO1B value
The effect of 20% for the measure of displaying the
load size is much too high.
We recommend deleting this point which is in line
with our request to eliminate the PO1b and PO2b.
This is maximum potential based on
values from GfK and the APPLiA model
database. However, PO1b/2b will be
removed.
9
7 42 Figure ix – Energy
consumption during
use for the different
POs
BAU value
Why is there such a big difference between BAT and
current market (30%)? This seems unrealistic.
Current market is oriented to the BAT.
We recommend to re-calculate the BAU with the
assumption that percentage of heat pump driers
increases between 2020 and 2040.
We ask using the base case 1 that we recommended
to split in two, also in this calculation.
PO2 is not necessarily 100% BAT. There
are heat pump condenser driers that are
superior to average levels calculated for
PO2.
Sales and stock of BAU, PO1, PO2, and
PO3 are the same. Sales average growth
rate for BC2 (HP-C) over 2020-2030 is
4%. For 2030-2040, no change in sales
are assumed.
The reason for the differences between
BAU and the POs is that BAU assumes
there is no development in the energy
class distribution in tumble drier sales
from 2021 onwards (we have assessed
this in the sensitivity analysis).
10
7 43 “The difference
between PO1a and
PO1b, and PO2a and
PO2b, shows the
large increased
energy consumption
The effect is much smaller.
Consumers will continue to dry only partial load as
they cannot wait for two or the washing loads to be
collected for one drying load.
This behaviour is not realistic, but only theoretically
given.
We recommend deleting this policy option PO1b
and PO2b.
Three reasons:
1. Storage and accumulation of wet laundry is not
recommended.
Same reply as to question 4.
360
Organization: APPLiA Name: Giulia Zilla Date: 04.01.2019
Number Task Page # Topic Comment Proposed change Reply study team
due to part load
operations, which
further reduces the
energy consumption
with about 30%.”
2. There is no possibility to differentiate the amount
of dry load from the water load
3. There is no technology available to estimate the
weight of the dry load based on the weight of the
wet load.
4. Such ecodesign requirement would imply that all
the appliances should be equipped with a display as
control panel. This would increase the cost of the
appliance and would have a strong impact on the
resource efficiency.
11
45 Rescale the
condensation
efficiency
classifications
See comment above on rescaling condensation
efficiency:
Is there a real benefit in changing the condensation
efficiency classes with respect to the environmental
aspects?
What is the justification behind the choice to
increase the number of classes which would imply a
higher use of energy to comply with it?
We recommend adding the justification taking in
consideration also the disadvantages.
Same reply as to question 3
12
45 “If equipped with a
status display, the
limit shall be 0.8W”
Please align it with the Washing Machine and
Washers driers
APPLiA supports the alignment with the value
established in the current revision of Washing
Machine and Washers-driers Regulation.
Changed from 0.8W to 1W according to
the current standby regulation and
washing machines voted regulation.
361
Organization: APPLiA Name: Giulia Zilla Date: 04.01.2019
Number Task Page # Topic Comment Proposed change Reply study team
13
45 Include a pictogram
on the energy label,
showing the content
of recycled plastic in
the plastic parts of
the product
This information should not be part of the energy
label because it changes the mislead the intention
of the label.
We recommend to not include this information on
the energy label.
This would mislead the main intention of the energy
label. Moreover, this could lead to a large number
of obstacles and numerous difficulties for industries
that need to be taken in consideration.
Please find in the file attached below, valid
argumentations on why we ask to not include this
information on the energy label.
2019- 01- 04
Recycled plast ic
Same reply as to question 6
14
45 Technical information
on how to
disassembly (for
repair) and dismantle
(for endof-
life) for critical
components should
be available in
booklet/technical
documentation
This information should be made available only to
educated professionals.
It must not be part of the booklet / user manual due
to misuse by non-educated consumers.
We recommend allowing information only on the
webpage for professional repairers.
Same reply as to question 7. In the case
of dismantling, this requirement has been
changed since it doesn’t make sense to
make end-of-life information available on
the product manual. Critical parts are only
relevant for repairing activities.
362
Organization: APPLiA Name: Giulia Zilla Date: 04.01.2019
Number Task Page # Topic Comment Proposed change Reply study team
15
3 129 Cleaning frequency of
filters-
3 different sources depicted with 112, 113 and 114
reference number in this sequence. We need to see
details of these sources; how could we acquire these
sources?
Please provide the source/report with these data.
The sources are given in the report. More
details cannot be disclosed due to
confidentiality issues.
16
5 178 Base cases (first
paragraph)
Characteristics of heat pump and electrically heated
condenser dryer are too different to be combined in
one base case.
Please differentiate or make two base cases for
condenser dryer in order to appropriately
calculating benefits and costs for each policy
options.
The study team agrees. Base case 1 have
been split based on heat source.
17
5 178 Table 43: Key
performance
parameters for the
three selected – Base
case 1: Condenser A+
It is useless to say that the average EEC is A+ for
condensing dryers when HP dryers have in average
A++ and heater condensing dryers have B.
Please see comment above
Please differentiate or make two base cases for
condenser dryer in order to appropriately
calculating benefits and costs for each policy
options.
Same reply as above
18
5 179 The largest difference
is the fact that heat
pump condensing
driers are
now listed as a base
case.
This is not true, when HP and heater condensing
dryers are put together into BC1
Split in two base cases (see comment above) Same reply as above
19
5 180 Thus, the material
composition of Base
Case 1 (condensers)
will
be based on a
weighted average
186 of heat pump -
condenser and heat
element –
These are significantly different technologies -can
easily be seen in the mass of the dryers - about 40
kg for heater condensing but 55kg for HP. This
cannot been put into the same pot.
Split in two base cases (see comment above)
Same reply as above
363
Organization: APPLiA Name: Giulia Zilla Date: 04.01.2019
Number Task Page # Topic Comment Proposed change Reply study team
condenser
20
5 183 –
Paragrap
h 5
Definition of Loading
input is incomplete
What is about the initial moisture content of the
base load? Shouldn’t it be re-evaluated?
According to APPLiA survey the spin speed has
increased to 1150 rpm (compared to 1000 rpm
assumed for current regulation)
Please analyse APPLiA consumer survey to find the
correct IMC in households.
We have included an evaluation of the
IMC in the report, based on the APPLiA
consumer study. As we do not want to
change testing procedures and lack solid
data, we will not evaluate the IMC in our
calculations in Task 6 and 7.
21
5 184 Larger machines and
a constant load
means that the
loading percentage
will
decrease, and thus
the energy
consumption per kg
laundry will increase
Where is the evidence for this assumption?
Machines with larger capacities do not necessarily
be less efficient at average load. They may only be
even more efficient at the higher full load.
Please revise this statement.
Specific energy consumption to dry partial load (i.e.
3 or 3,5 Kg) is the same independently on the rated
capacity of the dryer (i.e. 7, 8 or 9 kg).
The correlation between rated capacity
and energy consumption at 4.4kg differs
based on the energy label of the drier. For
A+ driers, a higher rated capacity
increases the energy consumption at
4.4kg, where as a A+++ dryer reduces
the energy consumption compared to a
similar dryer with a lower rated capacity.
See figure based on the 2017 APPLiA
model database:
364
Organization: APPLiA Name: Giulia Zilla Date: 04.01.2019
Number Task Page # Topic Comment Proposed change Reply study team
Previously, a linear regression between
the specific energy consumption
(kWh/kg) at 100% load and 50% load was
made, and the rated capacity of each
dryer was divided with the average load
of 4.4kg to find the loading factor. This
regression was then used to find the
energy consumption at 4.4kg, and to
“penalize” machines at higher rated
capacity (as the loading % was lower).
The difference between the two
calculation methods are negligible, but
the study team has chosen to remove this
penalization factor (it was only 1.5% at
the maximum effect) to increase the
transparency of the calculations.
22
5 184 This effect is
quantified based on
the increase in energy
consumption for part
load operations
shown in
Figure 33, which
shows that at 50%
loading, the driers use
~12% more energy
compared
But partial load does not necessarily mean 50% of
the rated capacity.
As given in the base case a constant average load of
4.4 kg is considered.
The described effect of increasing energy
consumption of partial load with increasing rated
capacity is only related to the higher absolute load
at 50% capacity (e.g. at 7kg rated cap. The
50%partial load is 3.5 kg which has logically lower
energy consumption than 50% partial load of 9kg
rated capacity of 4.5 kg, but with both rated
Please re-do the calculations.
We recommend using APPLiA data to review this
calculation.
According to Ecodesign Regulation, the
partial load is 50% of the rated capacity.
However, 4.4 kg is also a partial load. We
will reformulate text.
For other comment, see answer to
question 21.
365
Organization: APPLiA Name: Giulia Zilla Date: 04.01.2019
Number Task Page # Topic Comment Proposed change Reply study team
to a cycle loaded
100%. A linear
correlation between
the energy
consumption for
100%
loading (“0% more
energy”), and 50%
loading is established
and then used to
calculate
the effect of the
increased nominal
capacity of driers.
capacities the energy consumption is the same at
4.4kg)
23
5 184 This above described
increase effect per kg
laundry is the only
thing that is assumed
to
change regarding the
efficiency of the
tumble driers after
year 2016. The
average EEI
levels of sold tumble
driers from 2016 is
thus assumed to be
constant.
To be honest this assumption seems to be wrong!
Evidence can be done by calculating the energy
consumption for a fixed load of 4.4 kg using a linear
interpolation between the declared values for full
and half load of all models given in the APPLiA model
data base.
Please re-do the calculations.
We recommend using APPLiA data to review this
calculation.
See answer to question 21.
366
Organization: APPLiA Name: Giulia Zilla Date: 04.01.2019
Number Task Page # Topic Comment Proposed change Reply study team
24
5 184 Table 46: Electric
consumption an
hours in different
operation modes
Why have air vented dryers less duration in left on-
mode than condenser dryers?
Cycle times for air vented dryers are shorter than for
condenser dryers. So, there should be more hours in
off-mode.
Recalculate with appropriate timings also for other
tables in the document.
We recommend reviewing all table 46.
Table have been updated with new base
cases, and updated values based on a
combination of GfK data and the APPLiA
2017 model database. Air vented driers
have more off-mode hours than
condenser driers.
25
5 184 Table 46
Row4
According to 392/2012 the left-on-mode duration in
cases of dryers without power management system
is the time of the year minus the operating time for
160 cycles divided by 2. An average duration of 41 h
per year would assume that all dryers have an
average left-on-mode duration of 15 min per cycle.
That is not true.
Please re-calculate the duration considering the
right assumptions
Same comment as above
26
5 184 Table 46 row 6 This would mean the dryer is only running for 4h per
year (total hours in a year = 365 * 24 = 8760h) This
cannot be true
Please recalculate it. Same comment as above
27
5 185 Conversion factor This factor has been established in about 2010. Is
this still true? It should have changed within the last
8 years significantly with the introduction of
renewable energy sources.
We recommend taking in consideration the current
factor in calculations.
The factor used is in correspondence to
factor used in other studies.
28 5 191 Content of copper for
BC1
This high amount is only valid for HP dryers. heater-
element dryers are much closer to vented dryers.
Please separate BC1 into two cases for each HP
dryers and heater condensing dryers.
Base cases will be split and values for
each updated.
29
5 191 Table 50 The missing differentiation between HP and Heat-
element condensation dryers give the wrong
figures.
Please separate BC1 into two cases. Same comment as above.
367
Organization: APPLiA Name: Giulia Zilla Date: 04.01.2019
Number Task Page # Topic Comment Proposed change Reply study team
30
5 188, 191 Table 49: Input
economic data for
Ecoreport tool;
Table 50: LCC of the
three base cases
Why are there no installation costs for gas-fired
dryers in table 49?
We recommend including installation costs for gas-
fired dryers in table 49 as in table 50
An installation cost has been added equal
to which was stated previously in the
report.
31 5 192 while BC 2 has the
lowest LCC.
According to Table 50 BC3 has the lowest LCC Please align table 50. Table and conclusions have been updated
following the new base cases
32
5 192 Main conclusions Why does lower energy consumption results in
higher CO2 emissions (compared to first bullet
point)?
Please, explain on which bases this assumption is
made.
33
5 192 2nd bullet point of
conclusions
How are the savings of TD versus drying the laundry
in heated rooms considered?
Please consider the benefit of drying in TD versus
drying on the line in heated rooms.
We are not comparing drying methods but
only establishing the life cycle
environmental impacts and costs of the
driers.
34
6 195 Table 52, point 3: List
of design options
with descriptions and
input parameters –
Multi-motor setup
A setup with additional motors will also consume
additional material.
We recommend including under “other potential
effects” material for additional motor.
No significant impact on materials
consumption. Two smaller motors might
have larger material consumption
compared to one large, but this would not
always be the case. Increase considered
negligible.
35
6 195 Table 52, point 4: List
of design options
with descriptions and
input parameters -
Longer cycle time
with lower drying
temperatures
-5.0% for base case 1 and 2 is a wrong assumption. We ask to provide physical and thermo-dynamic
argumentations for justification of this assumption.
The efficiency/COP of a heat pump circuit
is proportional to the difference between
the evaporation and condensation
temperature/pressure – a higher pressure
means the compressor needs to do more
work, and thus lowers the COP. It is also
described in section 6.1.4. See
368
Organization: APPLiA Name: Giulia Zilla Date: 04.01.2019
Number Task Page # Topic Comment Proposed change Reply study team
https://en.wikipedia.org/wiki/Coefficient
_of_performance#Derivation
Assuming a refrigerant evaporation
temperature of 10C, and a condensation
at 65C, reducing the drying temperature
to 50C will increase the efficiency of the
heat pump circuit by ~31%, but reduce
the heating power by ~23%. Assuming
this corresponds to a 23% longer cycle
time with 200Wmotor, the combined
effect is a savings of 4-5% electricity.
For non-heat pump driers, a lower drying
temperature would reduce the heat loss
(which is proportional to the temperature
difference between the ambient and the
drier). This effect is much lower and is
thus considered negligible compared to
the increase in electric consumption on
the fan/drum motor.
36
6 195 Table 52, point 9: List
of design options
with descriptions and
input parameters –
Load sensors
A new sensor and the related electronics will
consume additional material.
The load sensor cannot be considered as a design
option (please refer to our comment at row 4 and 5
of this table).
We recommend including under “other potential
effects” material for new sensor and related
electronics.
Design option removed.
369
Organization: APPLiA Name: Giulia Zilla Date: 04.01.2019
Number Task Page # Topic Comment Proposed change Reply study team
The assumption that the introduction of a display of
the actual load has no impact to the material is not
true. The sensors needed are not yet available, must
be added to the dryers in addition, dryers without
display would be eliminated. Costs of the dryers will
significantly rise with such a system
37
6 196 Table 52, point 7 Where is the evidence for this assumption? See also
comment on efficiency of dryers with different
capacities at partial load in clause 5.1.3
Re-evaluate the effect as mentioned in the
comment 23
Design option removed. By removing the
penalisation factor of 1.5% extra energy
consumption mostly for HP TDs, the effect
of this option is negligible.
38
6 196 Table 52, point 8 The effect of exchanging heater condensing by HP is
factor 50% minimum. The wrong estimation is due
to wrong assumptions of base case (HP and heater
condensing in one case)
Divide the base cases of HP and heater condensing
dryer and recalculate.
Base cases have been split and table
updated.
39
6 199 6.1.1 replacing
asynchronous
induction motor with
permanent magnet
synchronous motors
The additional cost is mainly due to the more
expensive electronics needed to control the motor.
This cannot be scaled down to the motor size
An improvement cost should be much higher than
10 € (depending on the technology).
This cost is based on available information
(Washing Machine’s preparatory study,
page 427, Table 6.4). Considering
APPLiA’s input to Design Option 2 (below),
and that we see larger price differences
between a++ and a+++ models on the
market (130 EUR), costs have been
modified to 16 EUR/unit, which gives and
increased observed retail price of ca.45
EUR/unit.
40 6 199 6.1.2 The costs difference of 5€ assumed are not correct
(too low).
An improvement cost closer to 45 € (depending on
the technology) is more representative.
Same reply as above. We have changed
improvement cost to 16 EUR/unit.
370
Organization: APPLiA Name: Giulia Zilla Date: 04.01.2019
Number Task Page # Topic Comment Proposed change Reply study team
41
6 200 6.1.4 Longer cycle
time with lower
drying temperatures
Changing the temperature in a heat-pump dryer is
quite complex (requiring to either use a variable
speed compressor or to change the complete heat-
pump setup). How did they calculate the optimum
cycle time for such a change
Please explain calculation in more detail.
We ask to provide physical and thermo-dynamic
argumentations as justification of this assumption.
Same reply as to question 35
42
6 205 6.1.12 Spare parts
availability
We see no reason why spare part prices will
decrease in medium/long term. On the contrary,
they will increase due to higher storage facility and
logistics costs
We recommend including higher spare part costs in
the assessment.
We have removed any assumption on
purchase price increase and have only
included increase of repair costs for
consumer in LLCC analysis, to avoid
subjective judgments. The study team
has requested APPLiA to provide specific
input, but only generic comments have
been provided.
43
7 224, 225 7.1.2 Effectiveness of
the regulations
We have the impression, that the effect of the
present energy labelling regulation on sales and
prices of heat-pump dryers is overestimated. Heat
pump technology was just not mature enough to be
manufactured on large scale before 2013.
On the other side, other comparison possibilities for
consumers (e.g. consumer organization test results)
are underestimated by the study.
In general, we recommend including in the analysis
all the factors which play a role in this field (such as
consumer organization test results, technology,
etc.)
We agree that consumer organization tests and
economic incentives in some MS also have
contributed to the development. However, these
factors have not been included in the analyses and
we consider the effect minor compared to the effect
of the energy labelling regulation.
We have mentioned other factors in the text.
44
7 228, 231 7.1.3 Efficiency
Evaluation question 1
Evaluation question 4
Manufacturer turnover should not be mixed with
manufacturer profit. The higher cost of heat pump
tumble dryers is not only due to R&D expenses, but
also due to a much higher cost of a heat pump
system as compared to a heating element.
We recommend reviewing this evaluation by
including also other factors (such as the higher cost
of heat pump system).
This section does not consider the profit of the
manufacturers but only the turnover. The content
about innovation costs is of more general nature.
Innovation costs could include both R&D and higher
costs for heat pump systems.
371
Organization: APPLiA Name: Giulia Zilla Date: 04.01.2019
Number Task Page # Topic Comment Proposed change Reply study team
The last section in 7.1.3 is dealing with
administrative costs. However, the word
administrative was missing. It has now been added.
Some minor changes of the text have been made to
reflect this comment.
45
7 232 7.1.3 Efficiency
Evaluation question 6
Why should the product database reduce regulatory
costs? It requires additional bureaucratic effort and
thus increases costs for manufacturers. Also, for
member states the costs are increasing, because
they have to check the correctness of the data in the
database in addition to the compliance testing
Point out in the report, that checking correctness of
the data in the database does not replace
compliance testing, on the contrary it has to be
done in addition.
We have deleted the section about the
product registration database, because
this measure will probably require a
revision of the Ecodesign Directive.
Therefore, it is not relevant in this
context.
46
7 233 7.1.4 Relevance We doubt, that without an energy label there is no
incentives for the manufacturers to make further
improvements. There will always be competition on
the energy efficiency, like "most efficient ...". This
does not require an energy label.
The energy label is a strong incentive, but it is not
only one. Please, take in consideration also other
factors (i.e. competitiveness, consumers
organisation testing etc.).
Agree. Text has been changed. The new text
mention that the incentives for the manufacturers
will be reduced without the energy label.
47
7 240 The new SEc will be
based on the heat
pump driers only
It is assumed that declared values represent the real
consumption well. This is not true as manufacturers
use various strategies for declaration based on the
measured values (within the rules of the elabel).
For the definition of the SEc consider that in the
declaration values given in the APPLiA model
database some uncertainties are included which are
not physically based.
The study team will take this into consideration –
but as it is currently the only data source available,
we still need to use it as a basis for estimating the
effect on a new SEc. The uncertainty linked to these
parameters have resulted in the SEc line being
modified from the first draft.
48
7 240 Figure 70 The slope of the trend-line in this graph is highly
dependent on the numbers of the models
considered (for 10 kg very low, for lower capacities
much higher).
Consider the uncertainty of the graph.
We recommend following the recommendation
given at the stakeholder meeting (keep it as it is with
the exponent 0.8).
A new slope is made based on the average value for
each capacity and energy label, which is assumed to
be a better fit for the current market compared to
the old 0.8 factor.
372
Organization: APPLiA Name: Giulia Zilla Date: 04.01.2019
Number Task Page # Topic Comment Proposed change Reply study team
7.2.3
49
7 240 Proposed policy
options incl. barriers
and opportunities-
New EEI calculation method contains Etc and SEc.
Further calculations show only weighted average
energy consumption (Et) and weighted average
cycle time (Tt) and Sec for both vented and
condenser dryers. Etc calculation is not explicitly
given.
Editorial remark: Et should be Etc.
Please correct the typo.
Corrected.
50
7 240 EEI Formula –
ΕΕΙ = 𝐸𝑡𝑐
𝑆𝐸𝑐
The multiplication (x 100) is missing. Please add it. Please re-write the formula as follow:
ΕΕΙ = 𝐸𝑡𝑐
𝑆𝐸𝑐 × 100
Corrected
51 7 241 EEI - Description The description of EEI has no unit [kWh]. Please remove the unit kWh. Corrected
52
7 241 SEc formula This approach means that versus the current
regulation the dryers with higher load will be
panelised even more. Considering the 7kg rated
capacity dryer as base case with new formula 9kg
dryer has a penalty by 8.4% where it has been 6.3%
before.
Please justify the additional penalty of large rated
capacity dryers.
The new standard energy consumption is
changed to reflect the current market as
good as possible, and not to penalize
dryers with higher rated capacity. The
adjustment is the result of the old SEc
being outdated and only valid for a market
that does not currently exist.
53
7 242 Calculation Ct What about Ct? The same structure of formulas as
for energy and time should be used.
A better approach would be: calculate the sum of
water evaporated and the sum of water collected
through all test runs and calculate quotient out of
this.
Please consider a modified calculation of the
weighted condensation efficiency.
Added.
54
7 244 7.2.3. Table 59
PO1a - Barriers
If tumble dryer sales are reduced this implies higher
rate of laundry drying in heated rooms, which would
increase overall energy consumption
This effect should be mentioned in barriers as well. There is no evidence showing this will
happen.
373
Organization: APPLiA Name: Giulia Zilla Date: 04.01.2019
Number Task Page # Topic Comment Proposed change Reply study team
7.2.2
55
7 244 Proposed policy
options incl. barriers
and opportunities -
all heating element
equipped
driers from the
market,
significantly reducing
the
overall energy
consumption
and GHG emissions.
APPLiA suggest to better rephrase as suggested on
the side.
Please rephrase this “all heating element equipped
driers from the market”, with:
(…) Dryers with electrical heating element as a main
source (…)
Corrected.
7.3.3
56
7 254 Description of policy
options for energy
and performance-
In order to see energy class distribution, Et value is
taken as Etc. A++ and A+ products are going to C
class when we take Et in EEI calculation.
Please replace A+++ (+10%) with A+++ (-10%)
The new scheme should reflect the different
technology used in the heat pump and in
conventional dryers.
Please check the calculation and the definition of
the class limits.
Corrected A+++ label. New class intervals
have been made.
57
7 255 Table 63: New
proposed
condensation
efficiency class
intervals
The calculation method on how they calculate the
condensation efficiency class intervals is missing.
Please clarify the calculation used. Added in section 7.2.3
Questions
presented during
the Stk meeting
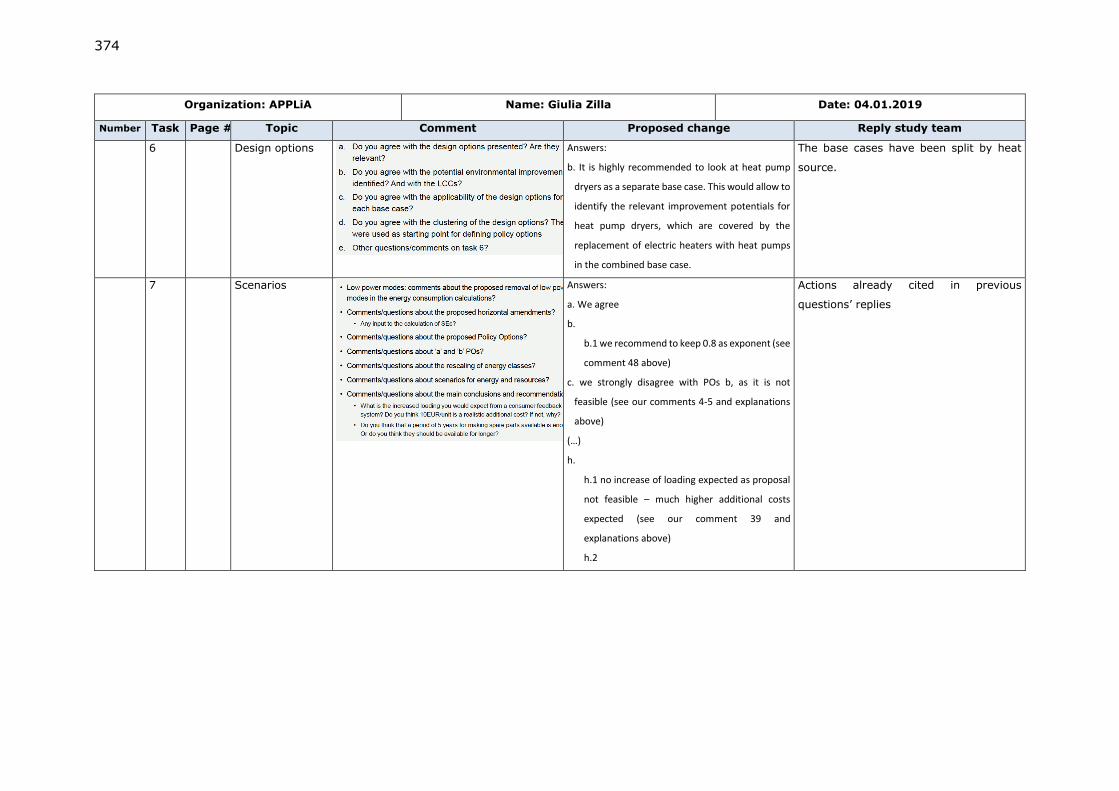
374
Organization: APPLiA Name: Giulia Zilla Date: 04.01.2019
Number Task Page # Topic Comment Proposed change Reply study team
6 Design options
Answers:
b. It is highly recommended to look at heat pump
dryers as a separate base case. This would allow to
identify the relevant improvement potentials for
heat pump dryers, which are covered by the
replacement of electric heaters with heat pumps
in the combined base case.
The base cases have been split by heat
source.
7 Scenarios
Answers:
a. We agree
b.
b.1 we recommend to keep 0.8 as exponent (see
comment 48 above)
c. we strongly disagree with POs b, as it is not
feasible (see our comments 4-5 and explanations
above)
(…)
h.
h.1 no increase of loading expected as proposal
not feasible – much higher additional costs
expected (see our comment 39 and
explanations above)
h.2
Actions already cited in previous
questions’ replies
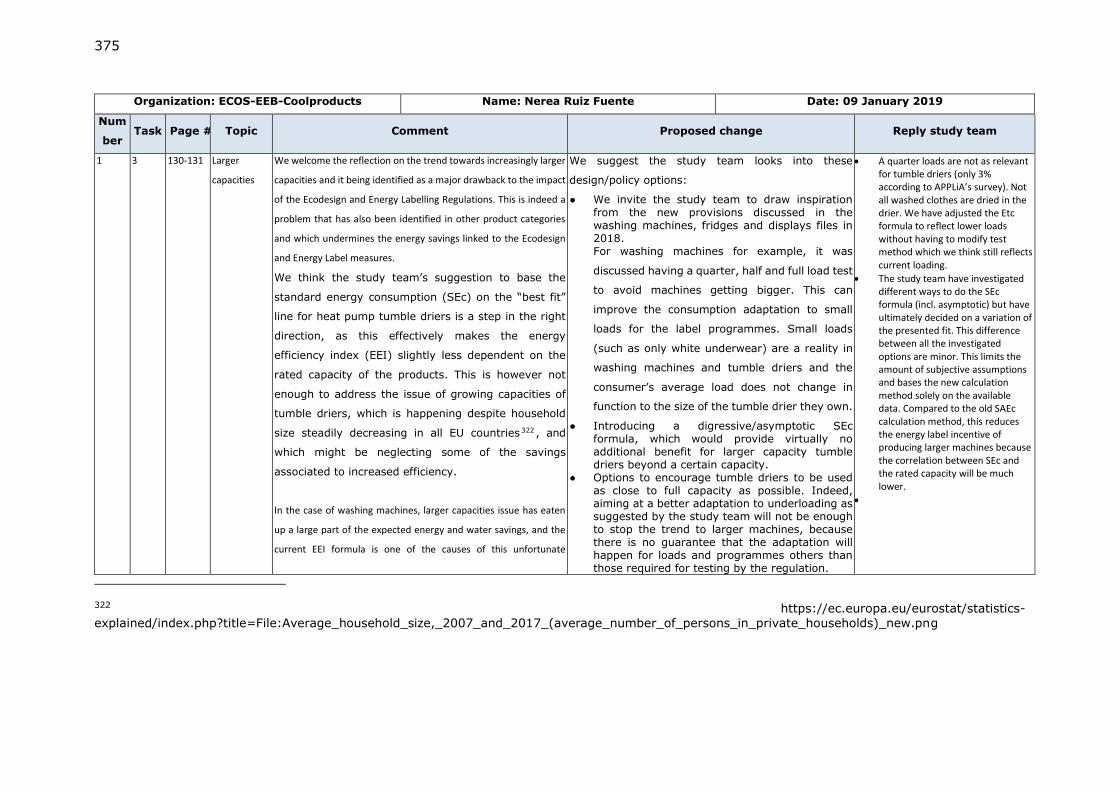
375
Organization: ECOS-EEB-Coolproducts Name: Nerea Ruiz Fuente Date: 09 January 2019
Num
ber Task Page # Topic Comment Proposed change Reply study team
1 3 130-131 Larger
capacities
We welcome the reflection on the trend towards increasingly larger
capacities and it being identified as a major drawback to the impact
of the Ecodesign and Energy Labelling Regulations. This is indeed a
problem that has also been identified in other product categories
and which undermines the energy savings linked to the Ecodesign
and Energy Label measures.
We think the study team’s suggestion to base the
standard energy consumption (SEc) on the “best fit”
line for heat pump tumble driers is a step in the right
direction, as this effectively makes the energy
efficiency index (EEI) slightly less dependent on the
rated capacity of the products. This is however not
enough to address the issue of growing capacities of
tumble driers, which is happening despite household
size steadily decreasing in all EU countries 322 , and
which might be neglecting some of the savings
associated to increased efficiency.
In the case of washing machines, larger capacities issue has eaten
up a large part of the expected energy and water savings, and the
current EEI formula is one of the causes of this unfortunate
We suggest the study team looks into these
design/policy options:
● We invite the study team to draw inspiration from the new provisions discussed in the washing machines, fridges and displays files in 2018. For washing machines for example, it was
discussed having a quarter, half and full load test
to avoid machines getting bigger. This can
improve the consumption adaptation to small
loads for the label programmes. Small loads
(such as only white underwear) are a reality in
washing machines and tumble driers and the
consumer’s average load does not change in
function to the size of the tumble drier they own.
● Introducing a digressive/asymptotic SEc formula, which would provide virtually no additional benefit for larger capacity tumble driers beyond a certain capacity.
● Options to encourage tumble driers to be used as close to full capacity as possible. Indeed, aiming at a better adaptation to underloading as suggested by the study team will not be enough to stop the trend to larger machines, because there is no guarantee that the adaptation will happen for loads and programmes others than those required for testing by the regulation.
• A quarter loads are not as relevant for tumble driers (only 3% according to APPLiA’s survey). Not all washed clothes are dried in the drier. We have adjusted the Etc formula to reflect lower loads without having to modify test method which we think still reflects current loading.
• The study team have investigated different ways to do the SEc formula (incl. asymptotic) but have ultimately decided on a variation of the presented fit. This difference between all the investigated options are minor. This limits the amount of subjective assumptions and bases the new calculation method solely on the available data. Compared to the old SAEc calculation method, this reduces the energy label incentive of producing larger machines because the correlation between SEc and the rated capacity will be much lower.
•
322 https://ec.europa.eu/eurostat/statistics-
explained/index.php?title=File:Average_household_size,_2007_and_2017_(average_number_of_persons_in_private_households)_new.png
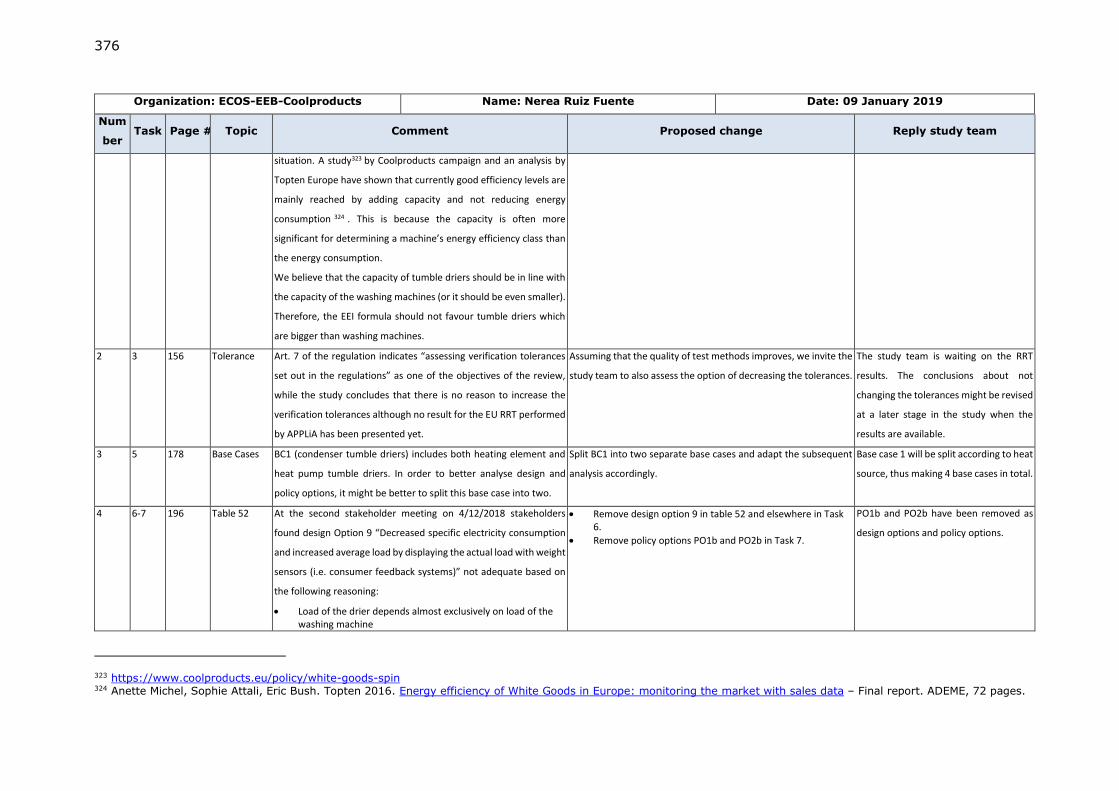
376
Organization: ECOS-EEB-Coolproducts Name: Nerea Ruiz Fuente Date: 09 January 2019
Num
ber Task Page # Topic Comment Proposed change Reply study team
situation. A study323 by Coolproducts campaign and an analysis by
Topten Europe have shown that currently good efficiency levels are
mainly reached by adding capacity and not reducing energy
consumption 324 . This is because the capacity is often more
significant for determining a machine’s energy efficiency class than
the energy consumption.
We believe that the capacity of tumble driers should be in line with
the capacity of the washing machines (or it should be even smaller).
Therefore, the EEI formula should not favour tumble driers which
are bigger than washing machines.
2 3 156
Tolerance Art. 7 of the regulation indicates “assessing verification tolerances
set out in the regulations” as one of the objectives of the review,
while the study concludes that there is no reason to increase the
verification tolerances although no result for the EU RRT performed
by APPLiA has been presented yet.
Assuming that the quality of test methods improves, we invite the
study team to also assess the option of decreasing the tolerances.
The study team is waiting on the RRT
results. The conclusions about not
changing the tolerances might be revised
at a later stage in the study when the
results are available.
3 5 178 Base Cases BC1 (condenser tumble driers) includes both heating element and
heat pump tumble driers. In order to better analyse design and
policy options, it might be better to split this base case into two.
Split BC1 into two separate base cases and adapt the subsequent
analysis accordingly.
Base case 1 will be split according to heat
source, thus making 4 base cases in total.
4 6-7 196 Table 52 At the second stakeholder meeting on 4/12/2018 stakeholders
found design Option 9 “Decreased specific electricity consumption
and increased average load by displaying the actual load with weight
sensors (i.e. consumer feedback systems)” not adequate based on
the following reasoning:
• Load of the drier depends almost exclusively on load of the washing machine
• Remove design option 9 in table 52 and elsewhere in Task 6.
• Remove policy options PO1b and PO2b in Task 7.
PO1b and PO2b have been removed as
design options and policy options.
323 https://www.coolproducts.eu/policy/white-goods-spin 324 Anette Michel, Sophie Attali, Eric Bush. Topten 2016. Energy efficiency of White Goods in Europe: monitoring the market with sales data – Final report. ADEME, 72 pages.
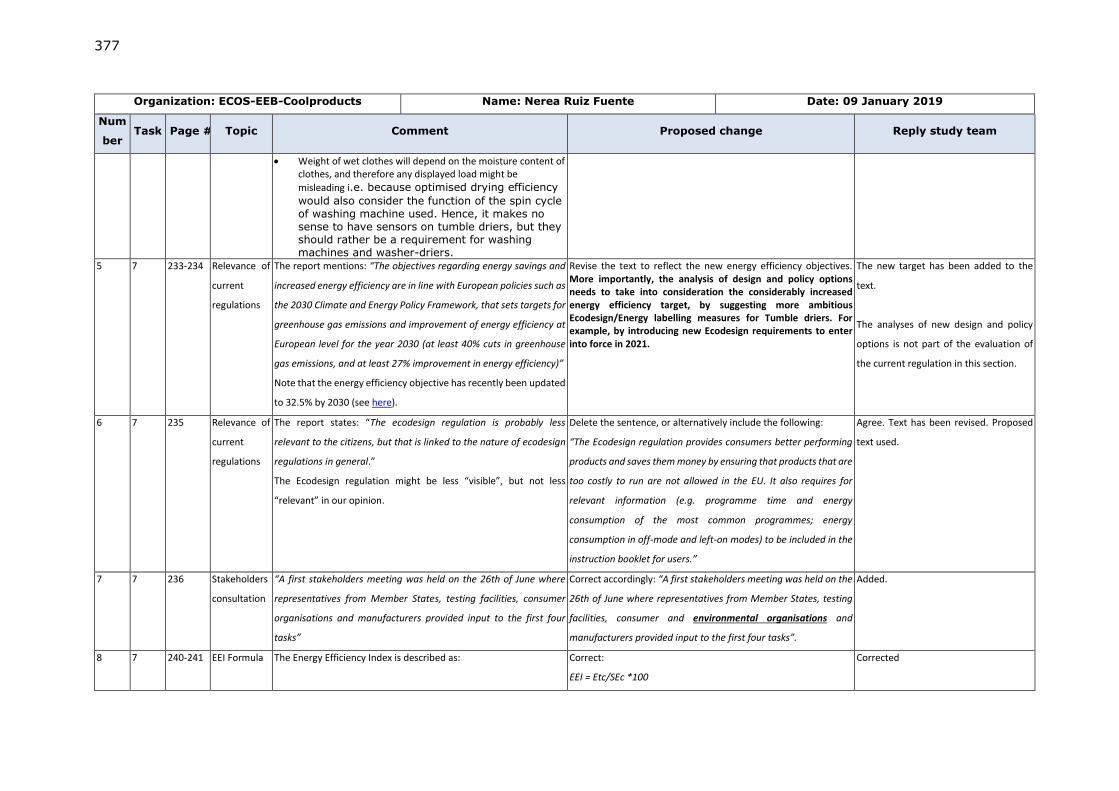
377
Organization: ECOS-EEB-Coolproducts Name: Nerea Ruiz Fuente Date: 09 January 2019
Num
ber Task Page # Topic Comment Proposed change Reply study team
• Weight of wet clothes will depend on the moisture content of clothes, and therefore any displayed load might be
misleading i.e. because optimised drying efficiency
would also consider the function of the spin cycle of washing machine used. Hence, it makes no sense to have sensors on tumble driers, but they should rather be a requirement for washing machines and washer-driers.
5 7 233-234 Relevance of
current
regulations
The report mentions: “The objectives regarding energy savings and
increased energy efficiency are in line with European policies such as
the 2030 Climate and Energy Policy Framework, that sets targets for
greenhouse gas emissions and improvement of energy efficiency at
European level for the year 2030 (at least 40% cuts in greenhouse
gas emissions, and at least 27% improvement in energy efficiency)”
Note that the energy efficiency objective has recently been updated
to 32.5% by 2030 (see here).
Revise the text to reflect the new energy efficiency objectives. More importantly, the analysis of design and policy options needs to take into consideration the considerably increased energy efficiency target, by suggesting more ambitious Ecodesign/Energy labelling measures for Tumble driers. For example, by introducing new Ecodesign requirements to enter into force in 2021.
The new target has been added to the
text.
The analyses of new design and policy
options is not part of the evaluation of
the current regulation in this section.
6 7 235 Relevance of
current
regulations
The report states: “The ecodesign regulation is probably less
relevant to the citizens, but that is linked to the nature of ecodesign
regulations in general.”
The Ecodesign regulation might be less “visible”, but not less
“relevant” in our opinion.
Delete the sentence, or alternatively include the following:
“The Ecodesign regulation provides consumers better performing
products and saves them money by ensuring that products that are
too costly to run are not allowed in the EU. It also requires for
relevant information (e.g. programme time and energy
consumption of the most common programmes; energy
consumption in off-mode and left-on modes) to be included in the
instruction booklet for users.”
Agree. Text has been revised. Proposed
text used.
7 7 236 Stakeholders
consultation
“A first stakeholders meeting was held on the 26th of June where
representatives from Member States, testing facilities, consumer
organisations and manufacturers provided input to the first four
tasks”
Correct accordingly: “A first stakeholders meeting was held on the
26th of June where representatives from Member States, testing
facilities, consumer and environmental organisations and
manufacturers provided input to the first four tasks”.
Added.
8 7 240-241 EEI Formula The Energy Efficiency Index is described as:
Correct:
EEI = Etc/SEc *100
Corrected
378
Organization: ECOS-EEB-Coolproducts Name: Nerea Ruiz Fuente Date: 09 January 2019
Num
ber Task Page # Topic Comment Proposed change Reply study team
EEI = Etc/SEc
Which means that a “standard” tumble drier would have an EEI of
1.
9 242 ‘Delay start” mode has not been included. The “delay start” mode has not been included in the report and
hence, proper justification for this should be provided or the
definition and proposed requirements for that mode should be
included.
It has been included and aligned with the
ED WMs requirements on low power
modes
10 7 244-245 Policy Option
2a
The study team mentions as a barrier that “Removing all heating
elements driers from the market might reduce the total sales and
thus industry turnover, as the average price per product would
increase.”
The experience from previous Ecodesign and Energy Labelling
measures from tumble driers, which the study team very well
describes in the earlier parts of chapter 7, shows that the fact of
selling more expensive products more than compensates any loss in
revenues from lower sales.
Rewrite the sentence:
“Removing all heating elements driers from the market might
reduce the total sales of products. However previous experience
shows that any lost revenues would likely be compensated by the
increase in the average price per product”
Corrected
11 7 244-246 There is discrepancy between the suggested dates of entry into
force of Ecodesign and Energy Labelling requirements. There is also
discrepancy between the resource efficiency options under
Ecodesign (PO3 and PO4) and the energy requirements.
We do not think there are reasons for delaying the entry into force
of Ecodesign requirements on energy efficiency to 2023, particularly
in view of the increased EU targets on EE (see our comment #7
Assess a policy option where all requirements (energy labelling
and resource and energy requirements for Ecodesign) enter into
force in 2021 - also aligning with the entry into force of
other white goods revised measures in 2021.
See answer to question 5.
This is to ensure a transition period
where manufacturers get familiar with
the new rescaling and energy efficiency
methods, which are quite different to
current scaling and methods. Also, this
will facilitate the verification process,
since Ecodesign proposed energy
requirements will be linked to specific
379
Organization: ECOS-EEB-Coolproducts Name: Nerea Ruiz Fuente Date: 09 January 2019
Num
ber Task Page # Topic Comment Proposed change Reply study team
above) and the urgency to act on climate change recently
highlighted by the Intergovernmental Panel on Climate Change325.
class interval limits. This transition period
is not deemed necessary for the
Ecodesign proposed resource efficiency
requirements
12 7 246 & 269 Availability of
critical spare
parts
“Ensure that critical spare parts are available for at least 5 years
after the production of a model ceases, to promote a longer average
lifetime of the product.”
All spare parts should be available during at least the
average product lifetime.
A differentiation should be made
between critical and other spare parts. It
is mostly critical parts that make a
difference in terms of availability. The
availability period has been harmonised
with the Washing Machines (10 years).
13 7 251 Figure 72 Graph is incomplete/wrong when compared to the energy label
classes thresholds in Annex 6, Table 1 of Regulation (EU) No 392/12
Please add a “C” line at EEI level 85 and remove the “D” line
currently at EEI level 100
Added
14 7 253-254 Figure 74,
Tables 60-62.
We welcome the suggested rescaling of the energy
label and the fact that class A is left empty as
requested by the Energy Labelling Framework
regulation.
We believe however that the classes should be aligned
with the proposed PO2 and adapted accordingly. Also,
the width of the proposed energy classes is too
heterogenous and may not help the consumer
differentiate based on energy efficiency. In addition,
the fact that classes E and F would be left empty does
not exploit the full potential of the rescaling.
Please revise the energy class thresholds so that they help the
consumer differentiate based on energy efficiency. We suggest
something along these lines:
A ≤ 55
55 < B ≤ 64
64 < C ≤ 74
74 < D ≤ 86
86 < E ≤ 100
100 < F ≤ 116
116 < F ≤ 134
The initially suggested classes will be
revised – the provided input will be
considered when updating the classes.
325 Https://www.ipcc.ch/sr15/chapter/summary-for-policy-makers/
380
Organization: ECOS-EEB-Coolproducts Name: Nerea Ruiz Fuente Date: 09 January 2019
Num
ber Task Page # Topic Comment Proposed change Reply study team
15 7 254-255 Condensatio
n efficiency
The study team suggests 4 condensation classes (A-D) evenly
distributed between 80 and 100. This has the problem of making the
colour-code on the scale difficult.
The study team also suggests no increase in condensation efficiency
under the proposed policy options. Given that under the proposed
energy efficiency requirements most heating elements driers will
not be allowed on the market, and that the condensation efficiency
of condensation driers is generally much higher, we believe an
increased condensation efficiency requirement is feasible and
necessary.
We recommend the study team to explore the benefits of this
alternative solution:
• Three condensation classes evenly distributed between 85 and 100.
• An Ecodesign requirement for condensation efficiency of 85 (as of 2021).
The condensation efficiency is
inversely linked to the energy
consumption of the driers. Thus,
setting a higher condensation
efficiency ecodesign limit might
increase the energy consumption
in general. A minor adjustment
from 70% to 80% is thus
proposed.
The added classes are made to
better differentiate the different
models, and not to majorly
increase the average
condensation efficiency due to
the points described above.
16 7 42 & 246 PO4 The study suggests some measures to facilitate repair and increase
durability. We welcome these but think these options can be
considered more comprehensively.
The study should look into the following design/policy options:
▪ Duration: all spare parts should be available during the average product lifetime, i.e. 12 years after the last unit is supplied.
▪ Delivery: A maximum delivery time of one week for spare parts should also be specified.
▪ Audience: spare parts access should not be restricted to professional repairers but should be open to all types of repairers. We firmly believe that no restrictions should be put to the availability of spare parts, to facilitate the involvement of as many actors as possible. Spare parts have a cost, which will serve as a deterrent to unexperienced consumers.
▪ Ensure unrestricted access to repair & maintenance information from date of placing on the market.
▪ Other factors to consider include disassembly requirements, disassembly sequence, the cost of spare parts, the use of
• See answer to question 12
• In the WMs this is fifteen days, we see no reason to have only one week
• Agree, should be available to all repairers but introduce a warning sign to consumers
• Added in Table 60
• JRC work is not yet finalized and not yet mature to uptake. Moreover, introducing economic parameters as requirements would add high uncertainty due to large variation between countries.
381
Organization: ECOS-EEB-Coolproducts Name: Nerea Ruiz Fuente Date: 09 January 2019
Num
ber Task Page # Topic Comment Proposed change Reply study team
commonly available tools, and software update availability. Reference to ongoing work by the JRC and the Benelux/KU Leuven326 study could be used to support this section.
17 7 42, 246,
256
PO3 The study suggests some measures for dismantling and recycling. In
principle, we welcome these but think these options can be
considered more comprehensively.
The study should look into the following design/policy options:
▪ We encourage to replace the term “dismantling” with “disassembly” to go beyond material recovery and recycling, and to also facilitate repair
▪ Restrictions on the use of materials or chemicals which represent a hazard to the environment, consumers or workers (in the context of multiple cycles of materials in the circular economy), i.e. for SVHCs and POPs which will limit recycling pathways.
▪ Restrictions on the use of materials or chemicals which represent a barrier to dismantling and recycling, i.e.:
o Additives or coatings which are difficult to manage in recycling systems (e.g. carbon black, or opacifiers)
o Non-modular, multi-layer or multi-material designs which are difficult to separate.
▪ Marking of plastics and additives according to the relevant ISO standards, particularly marking content including flame retardants.
▪ Dismantling is for EoL, a definition has been included and referenced in the report
▪ There is much uncertainty on their identification and REACH/RoHS already takes care of restricting these substances, not included
▪ The study team does not have evidence that shows these materials and chemicals prevent dismantling and recycling of tumble driers, not included
▪ This will pose great verification issues, not included
18 7 264-266 Turnover and
employment
Figures 80-82 and tables 73-75 fail to cover the increased revenues
and employment in independent repairers, which results in Policy
Options 3 and 4 looking less attractive than others.
In addition, as the study team also highlighted “product service models” could also generate additional retail turnover and employment opportunities for manufacturers – if well designed these could be linked with repair. In general, the modelling of revenues and employment poorly accounts for or supports circular business models and how these can be resource and energy efficient. As both retail turn over and employment are used to inform the recommendations this is quite a big omission and works against the ambition to use eco-design as a lever for the circular economy.
Estimate as possible the benefits from increased repairing
activities.
The repair and maintenance cost have
now been added to the manufacture’s
revenue in the task 7 model. This might
not be an accurate represented of a real
scenario as repair shops other than those
associated with OEM are also present. It
does however give a rough estimate on
the increase in jobs and revenue. The
difference between the manufacture’s
revenue, and the [retail revenue]/2.8
326 http://www.benelux.int/files/7915/2896/0920/FINAL_Report_Benelux.pdf
382
Organization: ECOS-EEB-Coolproducts Name: Nerea Ruiz Fuente Date: 09 January 2019
Num
ber Task Page # Topic Comment Proposed change Reply study team
Some studies are already showing very clearly how diversified business models can support sustained revenues in a given sectors. e.g. for the automotive industry McKinsey show this for falling direct sales, substituted by a growing after-market (repair) and recurring (sharing) revenues. See page 6 https://www.mckinsey.com/~/media/mckinsey/industries/high%20tech/our%20insights/disruptive%20trends%20that%20will%20transform%20the%20auto%20industry/auto%202030%20report%20jan%202016.ashx Some other general studies also highlight employment benefits from the circular economy: Green Alliance/WRAP 2015 http://www.wrap.org.uk/sites/files/wrap/Employment%20and%20the%20circular%20economy%20summary.pdf Circle Economy 2017 https://www.circle-economy.com/wp-content/uploads/2017/03/goldschmeding-jobs-report-20170322-lite.pdf WRAP/BITC 2018 https://www.bitc.org.uk/sites/default/files/smart_growth_economic_case_circular_economy_may_2018.pdf Club of Rome https://circulareconomy.europa.eu/platform/sites/default/files/the-circular-economy-czech-republic-and-poland.pdf IISD 2018 https://www.iisd.org/sites/default/files/publications/employment-effects-circular-economy.pdf Coolproducts, 2018 (p9) http://ecostandard.org/wp-content/uploads/Briefing-on-Ecodesign-and-Energy-Labelling-for-a-circular-economy.pdf
(due to retail margins) is thus the added
effect of the repair and maintenance
services.
19 7 266 Conclusions
and
The report states: “All the various policy options are evaluated based
on a number of indicators. PO2 seems the most ambitious in terms
Change to: “All the various policy options are evaluated based on
a number of indicators. PO2 seems the most ambitious in terms of
Added
383
Organization: ECOS-EEB-Coolproducts Name: Nerea Ruiz Fuente Date: 09 January 2019
Num
ber Task Page # Topic Comment Proposed change Reply study team
recommenda
tions
of energy savings, but at the initial high cost of consumers
expenditure.”
While the statement is generally correct, it is based on average
prices and fails to acknowledge the diversity of consumers and
products in the market. Consumers for which upfront cost is an
important criterion are able to find products whose cost is below
the average. For example, from a quick internet search in the UK,
we find:
• Condenser tumble driers at £189.99 (€210.12, compared to an average of €504)
• Air-vented tumble driers at £139.99 (€154,95, compared to an average of €248)
• Gas-fired tumble driers at £179.99 (€199,06, compared to an average of €374)
energy savings, but at the initial high cost of consumers’ average
expenditure.”
20 7 The report states: “All the various policy options are evaluated based
on a number of indicators. PO2 seems the most ambitious in terms
of energy savings, but at the initial high cost of consumers
expenditure.”
We recommend to include learning curves (mentioned in the
Ecodesign methodology for new preparatory studies) to predict
future cost benefits allowing to ‘account for price and efficiency
effects of technological learning in the period between data
recording and a regulation taking effect’ (Ecofys, 2014).
We invite the study team to apply this methodology and thereby
reach cost estimations that are closer to reality and allows for
more effective policy measures.
Added “initial” to the paragraph.
The high initial expenditure is due a high
amount of consumers being forced to
buy heat pump driers instead of heating
element driers. As an alternative,
ecodesign limits could be introduced in
tiers to even-out the initial high cost,
however, this would reduce the
effectiveness of the regulation.
21 6-7 Material
efficiency
Use of recycled plastic has not been considered in design and policy
options. This might be interesting as it could help bring the initial
consumer expenditure down due to the use of more economic,
recycled plastic.
Explore a design option which limits the amount of virgin plastic in
TDs in Task 6, as has been suggested by the consultants under the
preparatory study for vacuum cleaners.
All design options have been recalculated
based on updated base cases splitting
and the potential environmental savings
for this design option in particular came
too small for all base cases. Thus, it has
384
Organization: ECOS-EEB-Coolproducts Name: Nerea Ruiz Fuente Date: 09 January 2019
Num
ber Task Page # Topic Comment Proposed change Reply study team
been removed from LLCC and Task 7
analysis.
22 6-7 Moisture
sensors
As we understand it, moisture sensors have not been included in the
design or policy options.
We recommend that the study team assesses the benefits (in
terms of energy consumption) and drawbacks (in terms of
additional materials needed) of an Ecodesign requirement for
mandatory moisture sensors - which would automatically stop the
machine when a certain level of dryness is reached.
Without moisture sensors, the driers will
use considerably more energy during
testing procedures, which has made
manufacturers include them in all (>99%)
of all available models on the market. It
is thus assessed that there is no need for
an ecodesign requirement related to
moisture sensors, as the current
regulation is enough to ensure that all
driers are equipped with them.
23 6 197 Refrigerants It has been established by the study that the heat pump technology
is taking over the market and this will lead to a large quantity of
refrigerants with high GWPs to be put on the market.
The study should include broken down data per type of refrigerant
to identify the best technology available in terms of refrigerant
use.
Additionally, we invite the study team to take the
opportunity of this review to further assess
requirements to encourage a more widespread use of
low-GWP refrigerants. Here some suggestions:
1. Efficiency bonus for appliances using GWP ≤ 4 or preferably natural alternatives;
2. Malus scheme to penalize on the energy efficiency requirements those appliances using refrigerants with the highest GWP allowed in the market;
3. The Energy Label to include a pictogram indicating if a product contains a natural refrigerant and/or lower-GWP or a higher-GWP refrigerant;
4. Restriction of use of HFO.
It is too early to introduce such
requirements; the study team believes
information on refrigerant use is the first
step in order to get an overview about
refrigerant used. Also, due to its low
significance when quantifying GWP.
We have therefore only introduced an
information requirement in product
manual.
24 5 178 Energy
consumption
The study team states there is “no data for energy consumption in
other programs than the standard cotton program”, however, under
We invite the study team to further check the availability of energy
consumption in other programs as the real consumption might be
The study team do not have access to this
level of data. Even though that some
385
Organization: ECOS-EEB-Coolproducts Name: Nerea Ruiz Fuente Date: 09 January 2019
Num
ber Task Page # Topic Comment Proposed change Reply study team
the current Regulation it is mandatory for manufacturers to provide
indicative information on time and energy consumption of the main
drying programmes.
higher than indicated in the base cases within Task 5. Other
preparatory studies such as the ones for washing machines and
dishwashers may serve as inspiration on how this information has
been treated. In case of lack of information, we invite the team to
work based on assumptions.
manufacturers report the energy
consumption of multiple programmes in
the product fiche, this data is not
reported and collected on a widespread
basis.
A section has been added to discuss the
effects of the tumble drier programmes
used.
Organization: Test Aankoop Name: Bart Marrez Date: Xxx 2018
Numbe
r Task Page # Topic Comment Proposed change Reply study team
1 5 3,
meeting
minutes
Second meeting
minutes; "B";
base cases
"Current
base cases show that gas driers have the
lowest LCC due to mix of condensing
driers and the primal to
electric conversion factor. This should
not be the case,"
I don't know which would be most
economical; but the comparison should be
made in the report. (and with reducing the
number of cycles, Heat Pumps may not be
economical). 'this should not be the case'
imo should be altered.
Also note I proposed making Condenser &
Heat pump dryers into 'Base Case 1A' &
1B, with a time-variable ratio between
them defining the global Base Case 1. As
closing remark: some of the policy
options, or materials (refrigerant, copper)
only apply to 1 group.
Base cases have been split as BC1 and
BC2 for simplicity reasons.
386
Organization: Test Aankoop Name: Bart Marrez Date: Xxx 2018
Numbe
r Task Page # Topic Comment Proposed change Reply study team
2 6 na Policy options:
Making heat
pumps more
economically
advantageous?
in terms of policy options: if Heat Pump
dryers are the most expensive in LCC, but
best option for GWP/energy usage, and
best 'improvement path' perhaps policy
options could include measures purely
encouraging to lower the cost of HP
dryers; e.g. lower VAT tariff in most direct
example; although VAT is at national
level; lowering repair costs on heat pump
dryers (allowing other dryers to 'die off'
faster).
Assessment of impacts, including
monetary costs and not LCC, is part of a
review study in Task 7 (see page 139
MEErP methodology, part 2).
The other indicators proposed are outside
the scope of a preparatory study.
3 6 200 6.1.4 Longer
Cycle Time with
lower drying
temperatures
Cycle duration 'below 6 hours' will
absolutely be an issue for many
consumers. We actually tested once an 'A'
label dryer, without heat pump: it took 8
hours to dry. That this is an option or may
be an option in the future should be very
clear to consumers purchasing a dryer.
This is also relevant as for the Washing
Machines, the 'eco' program will be the
default. Including the energy label
program time (cycle duration) on the label
as information, would allow consumers to
make an informed choice (even if cycle
* Consider (proposing to) including cycle
duration on energy label.
(*If not, how to prevent 'cold air' dryers
from getting an incorrect label class, for a
program that will rarely if ever be used? a
max duration limit, some stipulation,..)
The cycle time is already shown on the
label.
Rest of the comment not clear.
387
Organization: Test Aankoop Name: Bart Marrez Date: Xxx 2018
Numbe
r Task Page # Topic Comment Proposed change Reply study team
time would have no effect on energy label
class).
4 7 Slide 42 New energy label I fear many consumers may see a listed
consumption per cycle on future energy
label and assume that is the consumption
value for a full load.
* Consider showing the separate values
on energy label: consumption (& cycle
duration) of full, and half load. (energy
label class still based on weighted
average; condensor efficiency imo doesn't
need to be shown per load)
This might confuse consumers more, as
the label will then include a lot of
information. Surveys shows consumers
already have a hard time understanding
the current label. More information will
make this worse.
5 7 Slide 51 RESCALING OF
ENERGY LABEL
CLASSES
General remark: the economical benefit of
the classes will be quite limited. Currently,
we estimate about 30-40€ annual
electricity cost (Belgium) for heat pump
dryers, with 3 cycles/week. With only 2
cycles, saving 10% electricity e.g., (by
going up 1 class), would save. 2-3€ per
year?
Should, for the consumer, selecting a
dryer of a higher energy class, not result
in higher savings, in energy cost? Should
this be somewhat taken into account,
probably resulting in energy classes with
a bigger range? Should resulting financial
savings be made more obvious?
The proposed classes will be modified to
better reflect the energy savings between
the different labels. Energy savings are
part of the calculations of monetary
savings.
6 6 Slide 29 Nr 8, Total
Energy, vs GWP
Different numbers seem listed for task 8
on the slides, vs in the report. I also think,
the GWP reduction is due to lower energy
consumption. So is it still correct to sum
these two on slide 33?
The stakeholders meeting presentation
have the most recent and correct
numbers, which will be subsequently
included in the final report. The
summation has been revised.