Embed Size (px)
Citation preview

a NORTHAM PLATINUM LIMITED
Report for the six months ended 31 December 2015
REVIEWED INTERIM RESULTS
b NORTHAM PLATINUM LIMITED
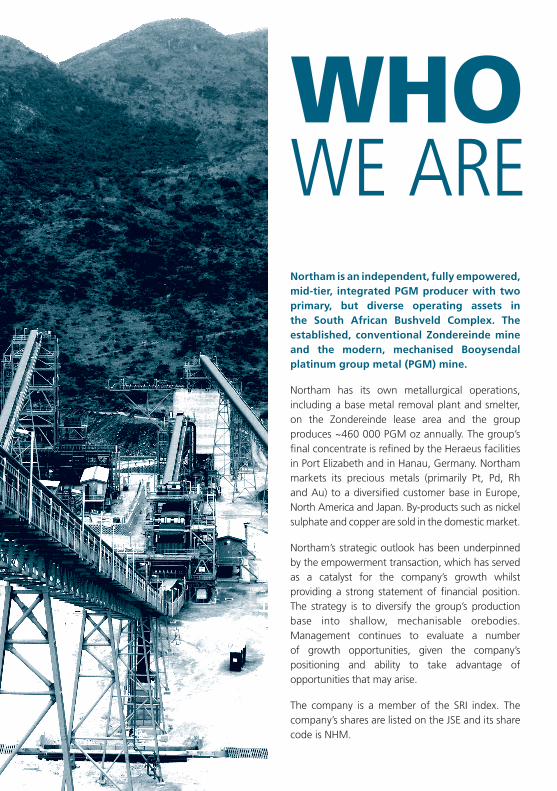
WHOWE ARENortham is an independent, fully empowered, mid-tier, integrated PGM producer with two primary, but diverse operating assets in the South African Bushveld Complex. The established, conventional Zondereinde mine and the modern, mechanised Booysendal platinum group metal (PGM) mine.
Northam has its own metallurgical operations, including a base metal removal plant and smelter, on the Zondereinde lease area and the group produces ~460 000 PGM oz annually. The group’s final concentrate is refined by the Heraeus facilities in Port Elizabeth and in Hanau, Germany. Northam markets its precious metals (primarily Pt, Pd, Rh and Au) to a diversified customer base in Europe, North America and Japan. By-products such as nickel sulphate and copper are sold in the domestic market.
Northam’s strategic outlook has been underpinned by the empowerment transaction, which has served as a catalyst for the company’s growth whilst providing a strong statement of financial position. The strategy is to diversify the group’s production base into shallow, mechanisable orebodies. Management continues to evaluate a number of growth opportunities, given the company’s positioning and ability to take advantage of opportunities that may arise.
The company is a member of the SRI index. The company’s shares are listed on the JSE and its share code is NHM.
CONTENTS
KEY FEATURES
P2 Strategic intent and delivery
P4 A word from the chief executive
P6 Operating, production and financial statistics
P18 Results commentary
INTERIM FINANCIAL RESULTS
P23 Interim consolidated statement of comprehensive income
P25 Interim consolidated statement of financial position
P27 Interim consolidated statement of changes in equity
P28 Interim consolidated statement of cash flows
P31 Notes to the interim financial statements
IBC Administration and contact informationScan the QR barcode with your smart device
to download the full PDF of the Northam
Platinum Interim Results. Alternatively go to
the Northam website at www.northam.co.za
Booysendal reaches steady
state production
Solid performance
from Zondereinde
Safety milestones recognised
Three-year wage agreement
signed
Difficult market conditions persist
Expansion strategy
crystallised
1INTERIM RESULTS
Directors
PL Zim (non-executive chairman)
R Havenstein (lead independent director)
PA Dunne (chief executive officer) (British)
AZ Khumalo (chief financial officer)
CK Chabedi (independent non-executive director)
HH Hickey (independent non-executive director)
TE Kgosi (independent non-executive director)
AR Martin (independent non-executive director)
KB Mosehla (non-executive director)
TI Mvusi (independent non-executive director)
2 NORTHAM PLATINUM LIMITED
STRATEGIC INTENT AND DELIVERY
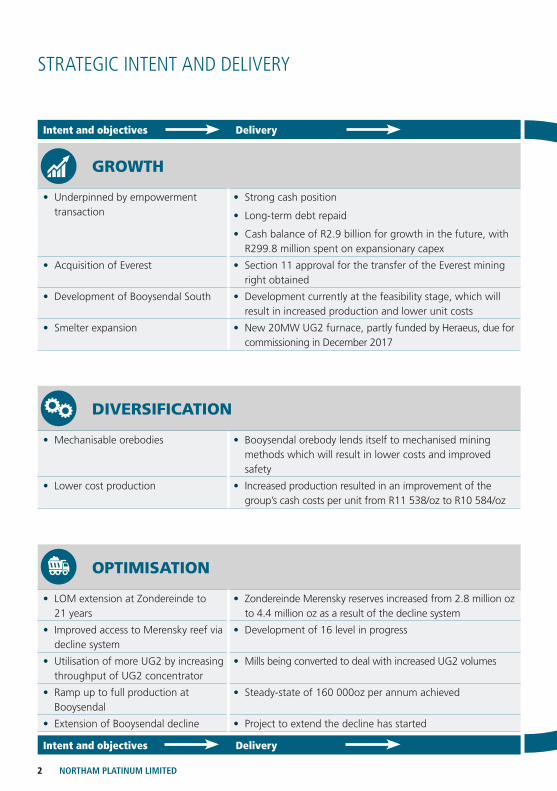
Intent and objectives Delivery
GROWTH
• Underpinned by empowerment transaction
• Strong cash position
• Long-term debt repaid
• Cash balance of R2.9 billion for growth in the future, with R299.8 million spent on expansionary capex
• Acquisition of Everest • Section 11 approval for the transfer of the Everest mining right obtained
• Development of Booysendal South • Development currently at the feasibility stage, which will result in increased production and lower unit costs
• Smelter expansion • New 20MW UG2 furnace, partly funded by Heraeus, due for commissioning in December 2017
DIVERSIFICATION
• Mechanisable orebodies • Booysendal orebody lends itself to mechanised mining methods which will result in lower costs and improved safety
• Lower cost production • Increased production resulted in an improvement of the group’s cash costs per unit from R11 538/oz to R10 584/oz
OPTIMISATION
• LOM extension at Zondereinde to 21 years
• Zondereinde Merensky reserves increased from 2.8 million oz to 4.4 million oz as a result of the decline system
• Improved access to Merensky reef via decline system
• Development of 16 level in progress
• Utilisation of more UG2 by increasing throughput of UG2 concentrator
• Mills being converted to deal with increased UG2 volumes
• Ramp up to full production at Booysendal
• Steady-state of 160 000oz per annum achieved
• Extension of Booysendal decline • Project to extend the decline has started
Intent and objectives Delivery
3INTERIM RESULTS
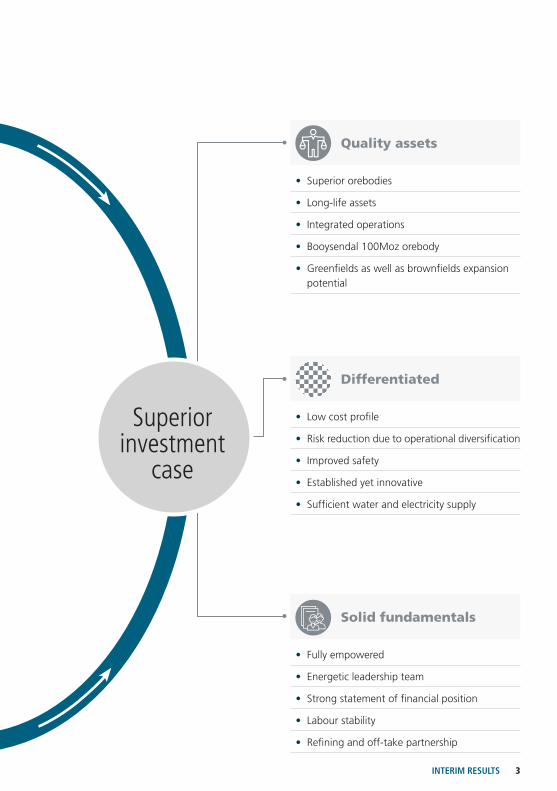
Quality assets
• Superior orebodies
• Long-life assets
• Integrated operations
• Booysendal 100Moz orebody
• Greenfields as well as brownfields expansion potential
Differentiated
• Low cost profile
• Risk reduction due to operational diversification
• Improved safety
• Established yet innovative
• Sufficient water and electricity supply
Solid fundamentals
• Fully empowered
• Energetic leadership team
• Strong statement of financial position
• Labour stability
• Refining and off-take partnership
Superiorinvestment
case
4 NORTHAM PLATINUM LIMITED
A WORD FROM THE CHIEF EXECUTIVE
The first half of the 2016 financial year has been challenging for the entire platinum sector. Prices of PGMs have, along with other commodity prices, moved lower, placing enormous stress on the industry and its stakeholders. Northam has not been immune from these effects. However, by sticking to our conservative overall strategy, we believe the company is well positioned to face the future, to develop further and in the shorter term, to work through the present trough in metals prices.
Our strategy is based on sound operating performances focused on safety and on containing the costs of producing each PGM ounce.
Our future focus is and will remain on developing shallow, mechanised operations. We will continue to exploit the Zondereinde mine, helped by a change in the mix of Merensky and UG2 ore, and our growth ounces will be shallow and mechanised. This was the fundamental consideration in our acquisition of the Everest property and crucially, of its processing plant located adjacent to our developing Booysendal South project. The plant will process Booysendal South’s ore and its acquisition contributes to the efficiency of the total capital spend on the mine. The fact is that we have a resource of 100Moz at Booysendal that offers superior risk-to-reward ratio.
As the half year under review progressed, we steadily ramped up production at the Booysendal North property, reaching the planned full production
5INTERIM RESULTS
run rate at the end of the period. The next stage
will be the start of the development of Booysendal
South, utilising the established infrastructure as a
base. This approach will result in a capital efficient
project while positioning the company to benefit
from an upturn in the PGM market.
Booysendal South is at the feasibility study stage,
which is expected to be completed by the end
of our financial year in June. This project will
contribute to the group’s advancement down the
cost curve, an essential element in our strategy for
the long-term sustainability of the business.
The company’s Black Economic Empowerment (BEE)
transaction with Zambezi Platinum (RF) Limited
(Zambezi Platinum), delivered a R4 billion cash
injection into Northam. At the end of the 10-year
lock-in period, Zambezi Platinum is required to
redeem the preference shares with cash or Northam
shares. All amounts payable to the holders of the
preference shares have been guaranteed by Northam.
PGM MARKETWe believe that we are entering the bottom of the
price cycle and that it is likely that we shall remain
in the trough for some time as the market adjusts to
an excess of metal supply and poor macroeconomic
conditions in the world’s key economies. Our capital
and operating strategies are, however, founded on
our understanding that we, as a company, must
invest prudently throughout the cycle if we are to
benefit over time.
OPERATIONSOur emphasis on safety has contributed to the fatality free record achieved to date. It is an achievement that comes from team work and perseverence.
The operational performance during the period under review was good. Zondereinde has adjusted well to a higher UG2 mining ratio which has resulted in a reduction in unit cash costs. Booysendal North mine has completed its production ramp up and the capital footprint is fully developed.
The increased level of disclosure this time around demonstrates the strong competitive cost position of both Zondereinde and Booysendal.
At the start of this financial year the three year wage agreement came into effect, promising a period of stable labour relations from which all can benefit.
We continue to progress our project pipeline, which positions Northam well in this difficult market environment for future growth.
Paul DunneChief executive
6 NORTHAM PLATINUM LIMITED
6 monthsending
31 December2015
6 monthsending
31 December2014
12 monthsending
30 June2015
R’000 R’000 R’000
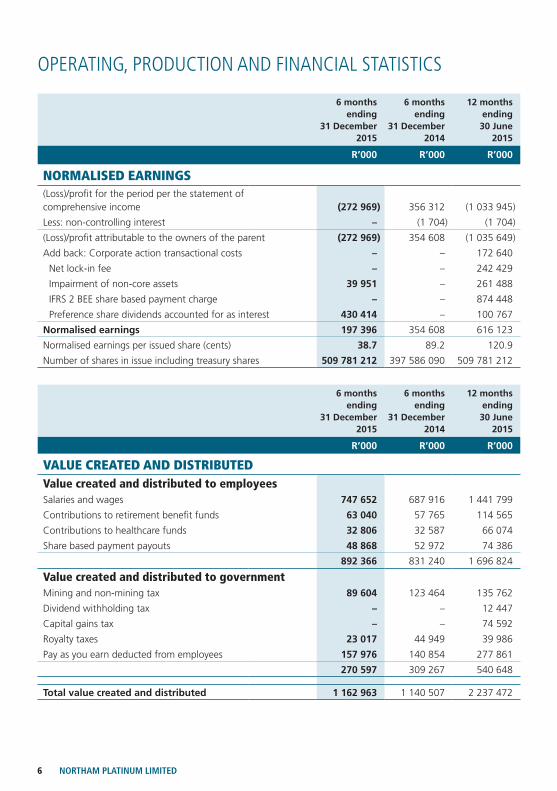
NORMALISED EARNINGS(Loss)/profit for the period per the statement of comprehensive income (272 969) 356 312 (1 033 945)
Less: non-controlling interest – (1 704) (1 704)
(Loss)/profit attributable to the owners of the parent (272 969) 354 608 (1 035 649)
Add back: Corporate action transactional costs – – 172 640
Net lock-in fee – – 242 429
Impairment of non-core assets 39 951 – 261 488
IFRS 2 BEE share based payment charge – – 874 448
Preference share dividends accounted for as interest 430 414 – 100 767
Normalised earnings 197 396 354 608 616 123
Normalised earnings per issued share (cents) 38.7 89.2 120.9
Number of shares in issue including treasury shares 509 781 212 397 586 090 509 781 212
6 monthsending
31 December2015
6 monthsending
31 December2014
12 monthsending
30 June2015
R’000 R’000 R’000
VALUE CREATED AND DISTRIBUTEDValue created and distributed to employeesSalaries and wages 747 652 687 916 1 441 799
Contributions to retirement benefit funds 63 040 57 765 114 565
Contributions to healthcare funds 32 806 32 587 66 074
Share based payment payouts 48 868 52 972 74 386
892 366 831 240 1 696 824
Value created and distributed to governmentMining and non-mining tax 89 604 123 464 135 762
Dividend withholding tax – – 12 447
Capital gains tax – – 74 592
Royalty taxes 23 017 44 949 39 986
Pay as you earn deducted from employees 157 976 140 854 277 861
270 597 309 267 540 648
Total value created and distributed 1 162 963 1 140 507 2 237 472
OPERATING, PRODUCTION AND FINANCIAL STATISTICS
7INTERIM RESULTS
6 monthsending
31 December2015
6 monthsending
31 December2014
12 monthsending
30 June2015
R’000 R’000 R’000
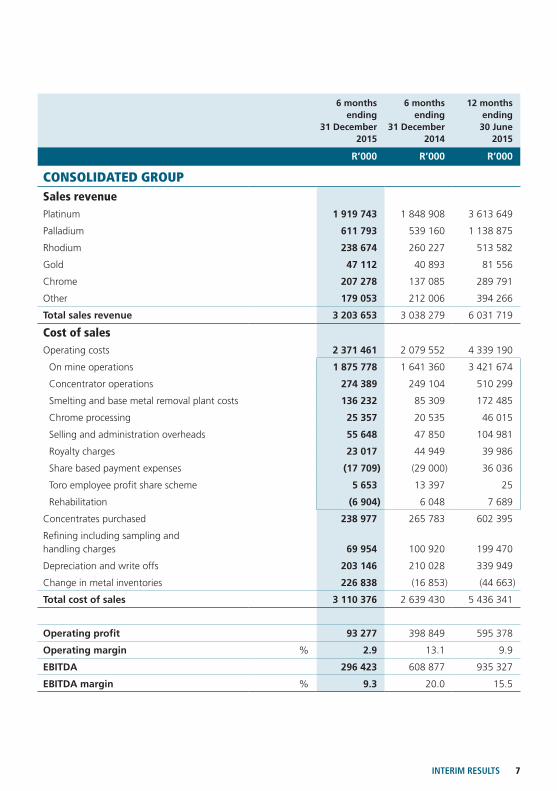
CONSOLIDATED GROUPSales revenuePlatinum 1 919 743 1 848 908 3 613 649
Palladium 611 793 539 160 1 138 875
Rhodium 238 674 260 227 513 582
Gold 47 112 40 893 81 556
Chrome 207 278 137 085 289 791
Other 179 053 212 006 394 266
Total sales revenue 3 203 653 3 038 279 6 031 719
Cost of salesOperating costs 2 371 461 2 079 552 4 339 190
On mine operations 1 875 778 1 641 360 3 421 674
Concentrator operations 274 389 249 104 510 299
Smelting and base metal removal plant costs 136 232 85 309 172 485
Chrome processing 25 357 20 535 46 015
Selling and administration overheads 55 648 47 850 104 981
Royalty charges 23 017 44 949 39 986
Share based payment expenses (17 709) (29 000) 36 036
Toro employee profit share scheme 5 653 13 397 25
Rehabilitation (6 904) 6 048 7 689
Concentrates purchased 238 977 265 783 602 395
Refining including sampling and handling charges 69 954 100 920 199 470
Depreciation and write offs 203 146 210 028 339 949
Change in metal inventories 226 838 (16 853) (44 663)
Total cost of sales 3 110 376 2 639 430 5 436 341
Operating profit 93 277 398 849 595 378
Operating margin % 2.9 13.1 9.9
EBITDA 296 423 608 877 935 327
EBITDA margin % 9.3 20.0 15.5
8 NORTHAM PLATINUM LIMITED
OPERATING, PRODUCTION AND FINANCIAL STATISTICS continued
6 monthsending
31 December2015
6 monthsending
31 December2014
12 monthsending
30 June2015
CONSOLIDATED GROUP continued
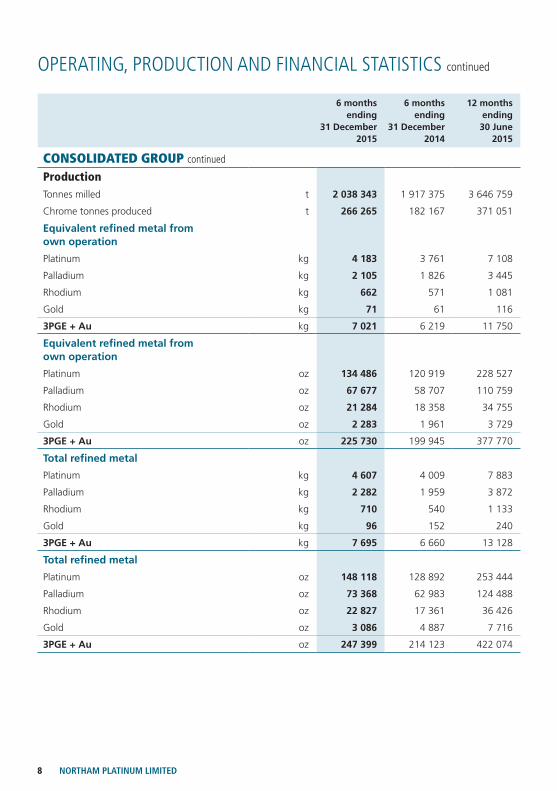
ProductionTonnes milled t 2 038 343 1 917 375 3 646 759
Chrome tonnes produced t 266 265 182 167 371 051
Equivalent refined metal from own operation
Platinum kg 4 183 3 761 7 108
Palladium kg 2 105 1 826 3 445
Rhodium kg 662 571 1 081
Gold kg 71 61 116
3PGE + Au kg 7 021 6 219 11 750
Equivalent refined metal from own operation
Platinum oz 134 486 120 919 228 527
Palladium oz 67 677 58 707 110 759
Rhodium oz 21 284 18 358 34 755
Gold oz 2 283 1 961 3 729
3PGE + Au oz 225 730 199 945 377 770
Total refined metal
Platinum kg 4 607 4 009 7 883
Palladium kg 2 282 1 959 3 872
Rhodium kg 710 540 1 133
Gold kg 96 152 240
3PGE + Au kg 7 695 6 660 13 128
Total refined metal
Platinum oz 148 118 128 892 253 444
Palladium oz 73 368 62 983 124 488
Rhodium oz 22 827 17 361 36 426
Gold oz 3 086 4 887 7 716
3PGE + Au oz 247 399 214 123 422 074
9INTERIM RESULTS
6 monthsending
31 December2015
6 monthsending
31 December2014
12 monthsending
30 June2015
CONSOLIDATED GROUP continued
Production continued
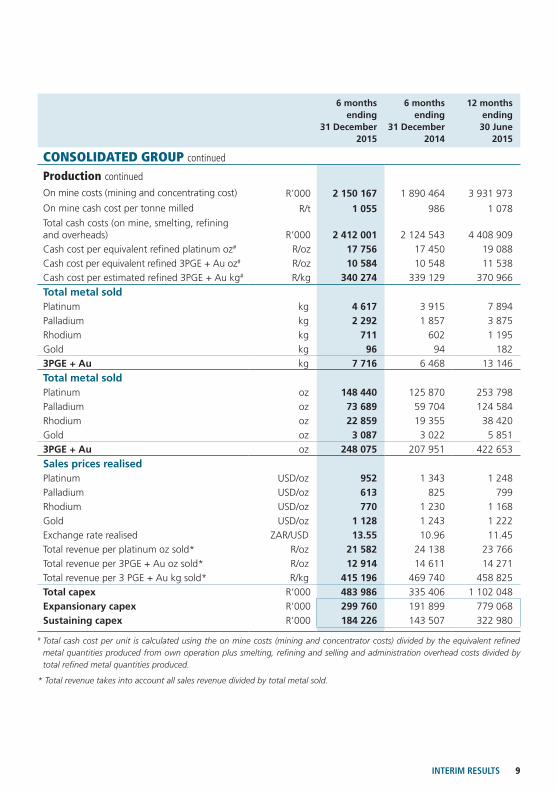
On mine costs (mining and concentrating cost) R’000 2 150 167 1 890 464 3 931 973
On mine cash cost per tonne milled R/t 1 055 986 1 078
Total cash costs (on mine, smelting, refining and overheads) R’000 2 412 001 2 124 543 4 408 909
Cash cost per equivalent refined platinum oz# R/oz 17 756 17 450 19 088
Cash cost per equivalent refined 3PGE + Au oz# R/oz 10 584 10 548 11 538
Cash cost per estimated refined 3PGE + Au kg# R/kg 340 274 339 129 370 966
Total metal sold Platinum kg 4 617 3 915 7 894
Palladium kg 2 292 1 857 3 875
Rhodium kg 711 602 1 195
Gold kg 96 94 182
3PGE + Au kg 7 716 6 468 13 146
Total metal sold Platinum oz 148 440 125 870 253 798
Palladium oz 73 689 59 704 124 584
Rhodium oz 22 859 19 355 38 420
Gold oz 3 087 3 022 5 851
3PGE + Au oz 248 075 207 951 422 653
Sales prices realisedPlatinum USD/oz 952 1 343 1 248
Palladium USD/oz 613 825 799
Rhodium USD/oz 770 1 230 1 168
Gold USD/oz 1 128 1 243 1 222
Exchange rate realised ZAR/USD 13.55 10.96 11.45
Total revenue per platinum oz sold* R/oz 21 582 24 138 23 766
Total revenue per 3PGE + Au oz sold* R/oz 12 914 14 611 14 271
Total revenue per 3 PGE + Au kg sold* R/kg 415 196 469 740 458 825
Total capex R’000 483 986 335 406 1 102 048
Expansionary capex R’000 299 760 191 899 779 068
Sustaining capex R’000 184 226 143 507 322 980
# Total cash cost per unit is calculated using the on mine costs (mining and concentrator costs) divided by the equivalent refined metal quantities produced from own operation plus smelting, refining and selling and administration overhead costs divided by total refined metal quantities produced.
* Total revenue takes into account all sales revenue divided by total metal sold.

10 NORTHAM PLATINUM LIMITED
OPERATING, PRODUCTION AND FINANCIAL STATISTICS continued
6 monthsending
31 December2015
6 monthsending
31 December2014
12 monthsending
30 June2015
ZONDEREINDESafetyLost time injury incident rate (LTIIR) per 200 000
hours worked 1.67 1.23 1.31
Reportable injury incident rate (RIIR) per 200 000 hours worked 1.02 0.84 0.94
LabourDirectly employed 6 224 6 527 6 365
Total employees 8 386 8 677 8 449
R’000 R’000 R’000
FinancialSales revenuePlatinum 1 919 743 1 317 995 2 621 288
Palladium 611 793 389 376 852 309
Rhodium 238 674 180 626 356 804
Gold 47 112 37 666 74 793
Chrome 139 865 88 248 184 133
Other 179 053 177 470 324 927
Total sales revenue 3 136 240 2 191 381 4 414 254
Cost of salesOperating costs 1 704 066 1 547 964 3 147 023
On mine operations 1 353 582 1 258 439 2 548 692
Concentrator operations 145 040 134 640 264 326
Smelting and base metal removal plant costs 136 232 85 309 172 485
Chrome processing 19 495 17 173 34 686
Selling and administration overheads 36 700 31 079 70 970
Royalty charges 18 577 40 715 29 912
Share based payment expenses (13 613) (31 611) 22 994
Toro employee profit share scheme 5 653 13 397 25
Rehabilitation 2 400 (1 177) 2 933
Concentrates purchased 1 059 637 265 783 963 011
Refining including sampling and handling charges 69 954 48 460 83 408
Depreciation and write offs 85 255 107 638 167 988
Change in metal inventories 167 311 (57 877) (345 590)
Total cost of sales 3 086 223 1 911 968 4 015 840
Operating profit 50 017 279 413 398 414
Operating profit margin % 1.6 12.8 9.0
EBITDA 135 272 387 051 566 402
EBITDA margin % 4.3 17.7 12.8
11INTERIM RESULTS
6 monthsending
31 December2015
6 monthsending
31 December2014
12 monthsending
30 June2015
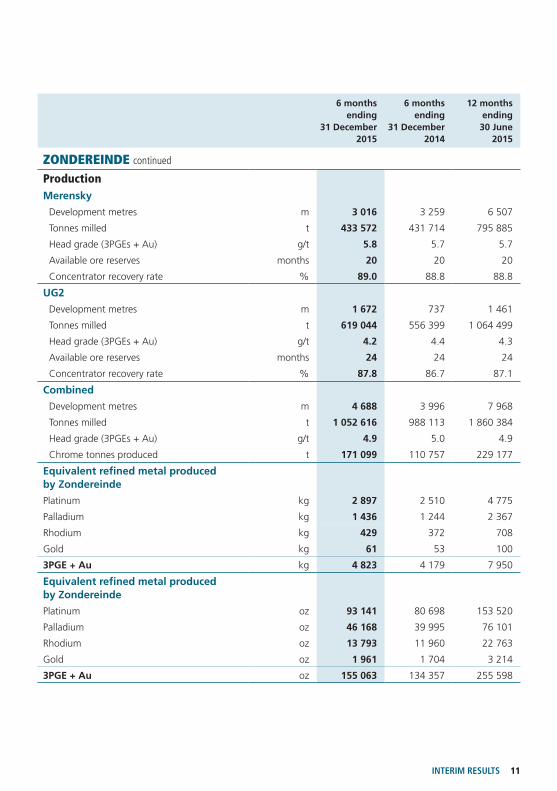
ZONDEREINDE continued
ProductionMerensky
Development metres m 3 016 3 259 6 507
Tonnes milled t 433 572 431 714 795 885
Head grade (3PGEs + Au) g/t 5.8 5.7 5.7
Available ore reserves months 20 20 20
Concentrator recovery rate % 89.0 88.8 88.8
UG2
Development metres m 1 672 737 1 461
Tonnes milled t 619 044 556 399 1 064 499
Head grade (3PGEs + Au) g/t 4.2 4.4 4.3
Available ore reserves months 24 24 24
Concentrator recovery rate % 87.8 86.7 87.1
Combined
Development metres m 4 688 3 996 7 968
Tonnes milled t 1 052 616 988 113 1 860 384
Head grade (3PGEs + Au) g/t 4.9 5.0 4.9
Chrome tonnes produced t 171 099 110 757 229 177
Equivalent refined metal produced by Zondereinde
Platinum kg 2 897 2 510 4 775
Palladium kg 1 436 1 244 2 367
Rhodium kg 429 372 708
Gold kg 61 53 100
3PGE + Au kg 4 823 4 179 7 950
Equivalent refined metal produced by Zondereinde
Platinum oz 93 141 80 698 153 520
Palladium oz 46 168 39 995 76 101
Rhodium oz 13 793 11 960 22 763
Gold oz 1 961 1 704 3 214
3PGE + Au oz 155 063 134 357 255 598
12 NORTHAM PLATINUM LIMITED
OPERATING, PRODUCTION AND FINANCIAL STATISTICS continued
6 monthsending
31 December2015
6 monthsending
31 December2014
12 monthsending
30 June2015
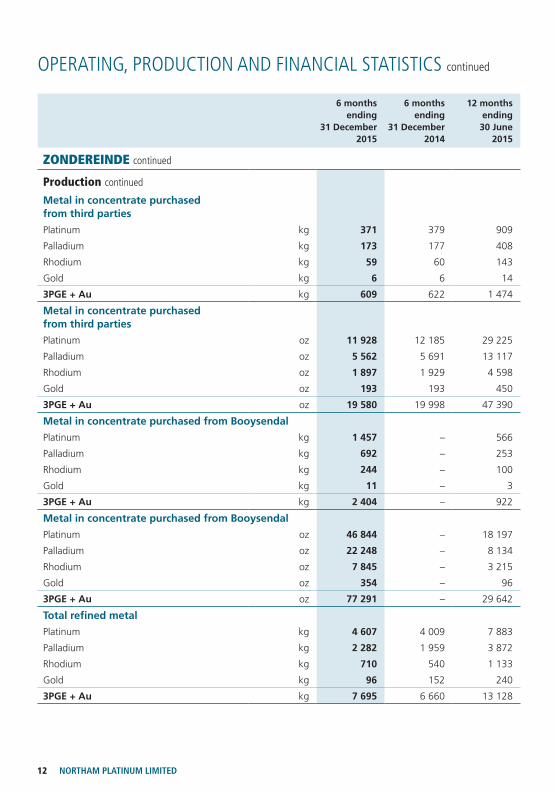
ZONDEREINDE continued
Production continued
Metal in concentrate purchased from third parties
Platinum kg 371 379 909
Palladium kg 173 177 408
Rhodium kg 59 60 143
Gold kg 6 6 14
3PGE + Au kg 609 622 1 474
Metal in concentrate purchased from third parties
Platinum oz 11 928 12 185 29 225
Palladium oz 5 562 5 691 13 117
Rhodium oz 1 897 1 929 4 598
Gold oz 193 193 450
3PGE + Au oz 19 580 19 998 47 390
Metal in concentrate purchased from Booysendal
Platinum kg 1 457 – 566
Palladium kg 692 – 253
Rhodium kg 244 – 100
Gold kg 11 – 3
3PGE + Au kg 2 404 – 922
Metal in concentrate purchased from Booysendal
Platinum oz 46 844 – 18 197
Palladium oz 22 248 – 8 134
Rhodium oz 7 845 – 3 215
Gold oz 354 – 96
3PGE + Au oz 77 291 – 29 642
Total refined metal
Platinum kg 4 607 4 009 7 883
Palladium kg 2 282 1 959 3 872
Rhodium kg 710 540 1 133
Gold kg 96 152 240
3PGE + Au kg 7 695 6 660 13 128

13INTERIM RESULTS
6 monthsending
31 December2015
6 monthsending
31 December2014
12 monthsending
30 June2015
ZONDEREINDE continued
Production continued
Total refined metal
Platinum oz 148 118 128 892 253 444
Palladium oz 73 368 62 983 124 488
Rhodium oz 22 827 17 361 36 426
Gold oz 3 086 4 887 7 716
3PGE + Au oz 247 399 214 123 422 074
On mine costs (mining and concentrating costs) R’000 1 498 622 1 393 079 2 813 018
On mine cash cost per tonne milled R/t 1 424 1 410 1 512
Total cash cost (on mine, smelting, refining and overheads) R’000 1 741 508 1 557 927 3 139 881
Cash cost per equivalent refined platinum oz # R/oz 17 730 18 542 19 613
Cash cost per equivalent refined 3PGE + Au oz # R/oz 10 646 11 138 11 780
Cash cost per equivalent refined 3PGE + Au kg # R/kg 342 288 358 104 378 737
Total metal sold Platinum kg 4 617 2 799 5 737
Palladium kg 2 292 1 343 2 900
Rhodium kg 711 419 832
Gold kg 96 86 167
3PGE + Au kg 7 716 4 647 9 636
Total metal sold Platinum oz 148 440 89 990 184 449
Palladium oz 73 689 43 178 93 237
Rhodium oz 22 859 13 471 26 749
Gold oz 3 086 2 765 5 369
3PGE + Au oz 248 074 149 404 309 804
# Total cash cost per unit is calculated using the on mine cost (mining and concentrator costs) divided by the equivalent refined Zondereinde metal quantities produced plus smelting, refining and selling and administration overhead costs divided by total refined metal quantities produced.
14 NORTHAM PLATINUM LIMITED
OPERATING, PRODUCTION AND FINANCIAL STATISTICS continued
6 monthsending
31 December2015
6 monthsending
31 December2014
12 monthsending
30 June2015
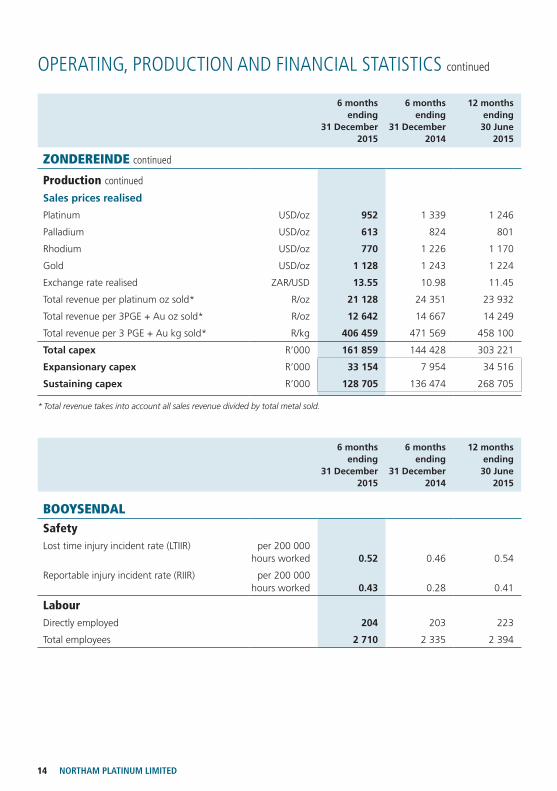
ZONDEREINDE continued
Production continued
Sales prices realised
Platinum USD/oz 952 1 339 1 246
Palladium USD/oz 613 824 801
Rhodium USD/oz 770 1 226 1 170
Gold USD/oz 1 128 1 243 1 224
Exchange rate realised ZAR/USD 13.55 10.98 11.45
Total revenue per platinum oz sold* R/oz 21 128 24 351 23 932
Total revenue per 3PGE + Au oz sold* R/oz 12 642 14 667 14 249
Total revenue per 3 PGE + Au kg sold* R/kg 406 459 471 569 458 100
Total capex R’000 161 859 144 428 303 221
Expansionary capex R’000 33 154 7 954 34 516
Sustaining capex R’000 128 705 136 474 268 705
* Total revenue takes into account all sales revenue divided by total metal sold.
6 monthsending
31 December2015
6 monthsending
31 December2014
12 monthsending
30 June2015
BOOYSENDALSafetyLost time injury incident rate (LTIIR) per 200 000
hours worked 0.52 0.46 0.54
Reportable injury incident rate (RIIR) per 200 000 hours worked 0.43 0.28 0.41
LabourDirectly employed 204 203 223
Total employees 2 710 2 335 2 394
15INTERIM RESULTS
6 monthsending
31 December2015
6 monthsending
31 December2014
12 monthsending
30 June2015
R’000 R’000 R’000
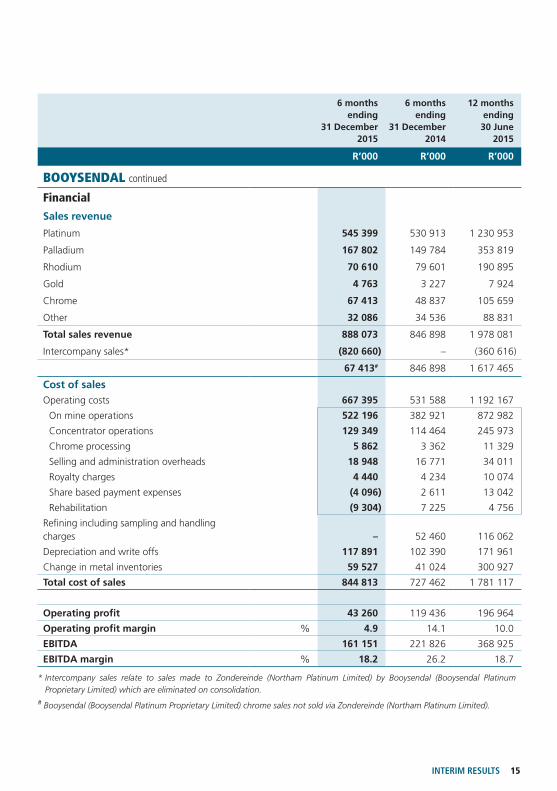
BOOYSENDAL continued
Financial
Sales revenue
Platinum 545 399 530 913 1 230 953
Palladium 167 802 149 784 353 819
Rhodium 70 610 79 601 190 895
Gold 4 763 3 227 7 924
Chrome 67 413 48 837 105 659
Other 32 086 34 536 88 831
Total sales revenue 888 073 846 898 1 978 081
Intercompany sales* (820 660) – (360 616)
67 413# 846 898 1 617 465
Cost of salesOperating costs 667 395 531 588 1 192 167
On mine operations 522 196 382 921 872 982
Concentrator operations 129 349 114 464 245 973
Chrome processing 5 862 3 362 11 329
Selling and administration overheads 18 948 16 771 34 011
Royalty charges 4 440 4 234 10 074
Share based payment expenses (4 096) 2 611 13 042
Rehabilitation (9 304) 7 225 4 756
Refining including sampling and handling charges – 52 460 116 062
Depreciation and write offs 117 891 102 390 171 961
Change in metal inventories 59 527 41 024 300 927
Total cost of sales 844 813 727 462 1 781 117
Operating profit 43 260 119 436 196 964
Operating profit margin % 4.9 14.1 10.0
EBITDA 161 151 221 826 368 925
EBITDA margin % 18.2 26.2 18.7
* Intercompany sales relate to sales made to Zondereinde (Northam Platinum Limited) by Booysendal (Booysendal Platinum Proprietary Limited) which are eliminated on consolidation.
# Booysendal (Booysendal Platinum Proprietary Limited) chrome sales not sold via Zondereinde (Northam Platinum Limited).
16 NORTHAM PLATINUM LIMITED
OPERATING, PRODUCTION AND FINANCIAL STATISTICS continued
6 monthsending
31 December2015
6 monthsending
31 December2014
12 monthsending
30 June2015
BOOYSENDAL continued
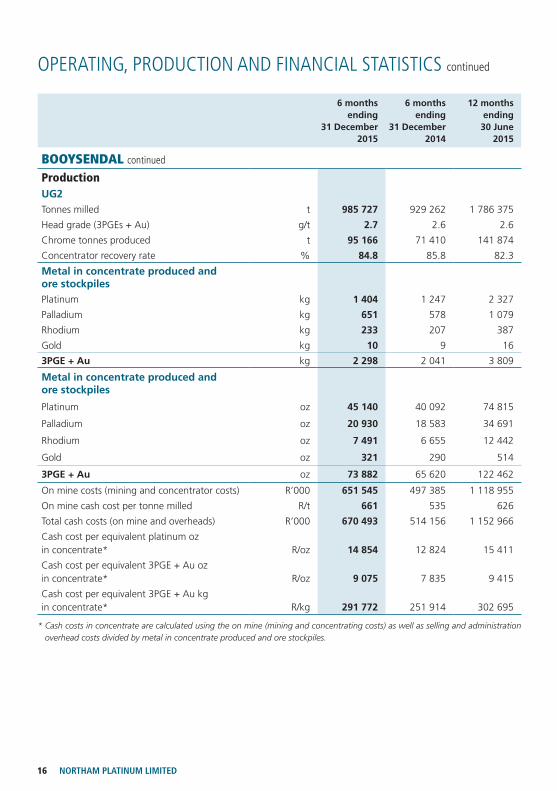
ProductionUG2Tonnes milled t 985 727 929 262 1 786 375
Head grade (3PGEs + Au) g/t 2.7 2.6 2.6
Chrome tonnes produced t 95 166 71 410 141 874
Concentrator recovery rate % 84.8 85.8 82.3
Metal in concentrate produced and ore stockpilesPlatinum kg 1 404 1 247 2 327
Palladium kg 651 578 1 079
Rhodium kg 233 207 387
Gold kg 10 9 16
3PGE + Au kg 2 298 2 041 3 809
Metal in concentrate produced and ore stockpiles
Platinum oz 45 140 40 092 74 815
Palladium oz 20 930 18 583 34 691
Rhodium oz 7 491 6 655 12 442
Gold oz 321 290 514
3PGE + Au oz 73 882 65 620 122 462
On mine costs (mining and concentrator costs) R’000 651 545 497 385 1 118 955
On mine cash cost per tonne milled R/t 661 535 626
Total cash costs (on mine and overheads) R’000 670 493 514 156 1 152 966
Cash cost per equivalent platinum oz in concentrate* R/oz 14 854 12 824 15 411
Cash cost per equivalent 3PGE + Au oz in concentrate* R/oz 9 075 7 835 9 415
Cash cost per equivalent 3PGE + Au kg in concentrate* R/kg 291 772 251 914 302 695
* Cash costs in concentrate are calculated using the on mine (mining and concentrating costs) as well as selling and administration overhead costs divided by metal in concentrate produced and ore stockpiles.
17INTERIM RESULTS
6 monthsending
31 December2015
6 monthsending
31 December2014
12 monthsending
30 June2015
BOOYSENDAL continued
Production continued
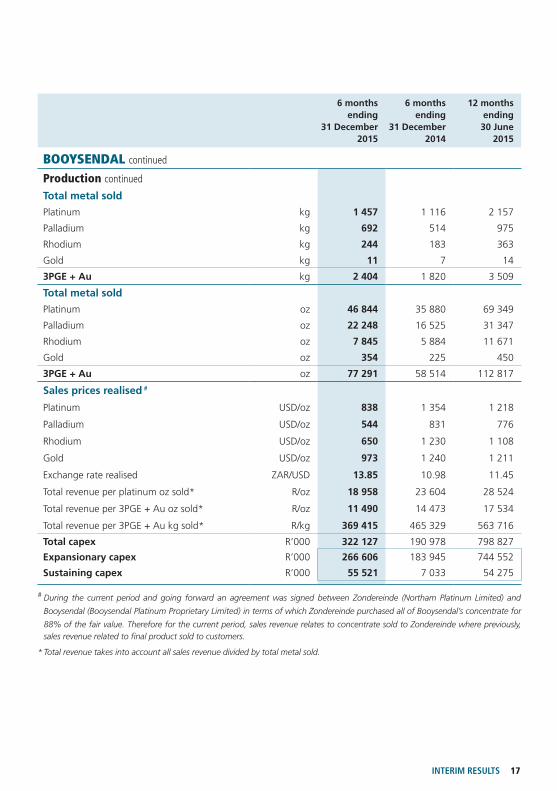
Total metal sold
Platinum kg 1 457 1 116 2 157
Palladium kg 692 514 975
Rhodium kg 244 183 363
Gold kg 11 7 14
3PGE + Au kg 2 404 1 820 3 509
Total metal sold
Platinum oz 46 844 35 880 69 349
Palladium oz 22 248 16 525 31 347
Rhodium oz 7 845 5 884 11 671
Gold oz 354 225 450
3PGE + Au oz 77 291 58 514 112 817
Sales prices realised #
Platinum USD/oz 838 1 354 1 218
Palladium USD/oz 544 831 776
Rhodium USD/oz 650 1 230 1 108
Gold USD/oz 973 1 240 1 211
Exchange rate realised ZAR/USD 13.85 10.98 11.45
Total revenue per platinum oz sold* R/oz 18 958 23 604 28 524
Total revenue per 3PGE + Au oz sold* R/oz 11 490 14 473 17 534
Total revenue per 3PGE + Au kg sold* R/kg 369 415 465 329 563 716
Total capex R’000 322 127 190 978 798 827
Expansionary capex R’000 266 606 183 945 744 552
Sustaining capex R’000 55 521 7 033 54 275
# During the current period and going forward an agreement was signed between Zondereinde (Northam Platinum Limited) and
Booysendal (Booysendal Platinum Proprietary Limited) in terms of which Zondereinde purchased all of Booysendal’s concentrate for
88% of the fair value. Therefore for the current period, sales revenue relates to concentrate sold to Zondereinde where previously, sales revenue related to final product sold to customers.
* Total revenue takes into account all sales revenue divided by total metal sold.
18 NORTHAM PLATINUM LIMITED
RESULTS COMMENTARY
FINANCIAL OVERVIEW – CONSOLIDATED GROUPRevenueRevenue generated from sales increased by 5.4% to R3.2 billion (H1 F2015: R3.0 billion), reflecting the group’s increasing sales volumes. Sales volumes were 19.3% higher, at 7 716kg or 248 075oz (H1 F2015: 6 468kg; 207 951oz).
The lower basket price received of R415 196/kg (H1 F2015: 469 740/kg) reflects the significant decline in the PGM US$ basket price realised which was offset to some extent by the 23.6% weakening of the ZAR against the dollar.
From 1 June 2015, concentrate production from Booysendal has been sold to Zondereinde at 88% of the market related price. On a group basis, revenue is generated by Northam as all sales between Booysendal and Zondereinde eliminate on consolidation. Previously, Booysendal sold its final product directly to customers.
Cost of sales and operating costsThe cost of sales increased by 17.8% to R3.1 billion (H1 F2015: R2.6 billion), in correlation with the increase of 19.3% in volumes sold. Group operating costs increased by 14.0% to R2.4 billion (H1 F2015: R2.1 billion). However, overall costs were well contained, with the rise in group unit cash costs increasing only 0.3% to R340 274/kg (H1 F2015: R339 129/kg). The significant contributors to cost increases were labour, electricity and general mining inflation. Included in the operating costs are smelting and base metal removal plant costs which, when combined with refining costs, recorded a marginal increase compared to H1 F2015. Royalty charges have decreased due to the lower profits earned in the current period compared to H1 F2015. Also included in the change in metal inventories are metals on hand that were written down by R186.5 million (H1 F2015: R63.3 million) to net realisable value as a result of depressed PGM prices during the period under review.
Operating profitAs a result of the above, the group operating margin decreased from 13.1% to 2.9% which resulted in the operating profit declining to R93.4 million (H1 F2015: R399.0 million). Zondereinde generated an operating profit of R50.0 million (H1 F2015 R279.4 million) whilst Booysendal made an operating profit of R43.3 million (H1 F2015: R119.4 million) with the balance relating to the operating profit made on the sale of houses in Norplats Properties Proprietary Limited.
Share of losses from associates, interest and finance costs as well as sundry income and expenditureThe share of losses from associates declined to a loss of R11.6 million (H1 F2015: profit of R13.5 million). Northam’s share of losses in the Pandora joint venture and in Trans Hex Group Limited amounted to R7.2 million (H1 F2015: R5.1 million) and R4.4 million (H1 F2015 profit of R18.6 million) respectively. Management continues to assess its options regarding Northam’s holdings in both these investments.
Investment revenue rose to R163.6 million (H1 F2015 R18.3 million). This is associated with interest earned on higher cash balances resulting from the BEE transaction concluded in May 2015, as well as interest received on an insurance contingency policy.
19INTERIM RESULTS
Finance costs of R459.7 million (H1 F2015: R77.7 million) were incurred owing to the non-cash finance
charge resulting from the structuring of the BEE transaction in terms of which dividends associated with
the Zambezi Platinum preference shares are consolidated into the group financial statements of Northam.
The Zambezi Platinum preference shares accrue a cumulative variable dividend at the South African
prime interest rate plus 3.5% per annum. The accrued dividends are recognised as a finance charge. The
finance costs associated with the preference shares for the six month period under review amounted to
R430.4 million (H1 F2015: Rnil). The domestic medium-term debt notes (DMTN) of R1.4 billion were repaid
on 3 September 2015.
Sundry income of R127.0 million (H1 F2015: R191.5 million) includes a cash amount of R59.6 million received
on the cancellation of the insurance contingency policy as mentioned above. Accounted for in the comparable
H1 F2015, was an insurance refund of R150.0 million relating to the No. 1 shaft incident. Sundry income
was also impacted by the ZAR currency translation which increased from R7.8 million during H1 F2015 to
R28.8 million.
Sundry expenditure increased by 74.9% from R44.5 million to R77.8 million. Included in sundry expenditure
was the impairment of the investment in the Pandora joint venture of R34.7 million as well as an impairment
of the investment in Trans Hex Group Limited amounting to R5.3 million.
In addition, care and maintenance costs of R12.9 million were incurred at the Everest plant acquired
from Aquarius Platinum (South Africa) Proprietary Limited (AQPSA). Sundry expenditure also includes the
amortisation of liquidity fees payable on the BEE transaction concluded in the prior year (a liquidity fee of
2.5% was paid to the Public Investment Corporation SOC Limited and Coronation Asset Management
Proprietary Limited) on the full value of the preference shares. The liquidity fee, which was classified as
a transaction cost in terms of IAS 39 and included in the initial measurement of the financial liability, is
amortised over the 10 year lock-in period of the preference shares. The amortisation of R8.5 million is
included in sundry expenditure and relates to the said liquidity fee.
TaxationTax payable is lower than the comparable period owing to the lower profits achieved. Taxation consists of
non-mining tax of R81.7 million accrued mainly on interest earned. Deferred tax was raised on all temporary
differences resulting in a tax charge of R18.2 million.
Cash flow movementsCash flow generated from operating activities rose to R684.4 million (H1 F2015: R55.5 million), largely as a
result of the movement in working capital. The working capital movement amounted to a positive inflow of
R236.5 million compared with the negative outflow of R530.0 million in the previous period. Contributing
to the positive movement in working capital was Value Added Tax (VAT) of R187.7 million, (part of which
had been outstanding since April 2014), refunded by the South African Revenue Service during the period
under review. Metal debtors also declined by some R52.1 million due to the lower metal prices achieved
during the current period.
20 NORTHAM PLATINUM LIMITED
Cash flows utilised in investing activities were up 46.2% from R352.2 million to R515.1 million. The increase relates primarily to the increase in expansionary capital on the following projects: R41.5 million spent on employee accommodation both at Zondereinde and Booysendal; R37.3 million on the Merensky feasibility project at Booysendal UG2 North mine; R65.2 million on the acquisition of the Everest mineral reserves and costs relating to the development of Booysendal South mine; and R150.6 million on the completion of the capital footprint at Booysendal UG2 North mine.
Cash flows utilised in financing expenditure increased significantly from R133.5 million in H1 F2015 to R1.4 billion owing to the repayment of the DMTN during September 2015. Excluding the repayment of the DMTN, the Northam group received net positive cash in-flows of R138.2 million for the six month period ending 31 December 2015.
OPERATIONSZondereindeHealth and safety Zondereinde recorded four million fatality-free shifts during the reporting period, a commendable performance at any operation, and particularly at a deep-level mine like Zondereinde. The lost time injury rate was higher at 1.67 injuries per 200 000 hours worked (30 June 2015: 1.31) and the reportable injury rate was 1.02 (30 June 2015: 0.94). Operational management is focused on reducing both the number and severity of injuries through interventions involving employees, their representatives and operational structures.
ProductionMerensky reef tonnes milled were 433 572 tonnes (H1 F2015: 431 714 tonnes) at a head grade of 5.8g/t, whilst the UG2 reef contributed 619 044 tonnes (H1 F2015: 556 399 tonnes) at a head grade of 4.2g/t. The combined head grade for the period was 4.9g/t (H1 F2015: 5.0g/t), illustrating the effect of the higher UG2 contribution.
Production of equivalent refined metal increased by 15.4% to 4 823kg (H1 F2015: 4 179kg). The quantities of purchased concentrates from third parties decreased slightly to 609kg (H1 F2015: 622kg).
Mining flexibility on the Merensky reef horizon remains constrained. Increased production from the UG2 horizon is expected to partially compensate for the Merensky constraints until the deepening section is completed. The rebalancing of the Merensky/UG2 mining mix to a 40:60 ratio has resulted in the life of Zondereinde increasing to 21 years.
Costs and capital expenditureThe total operating costs at Zondereinde for the period were R1.7 billion (H1 F2015: R1.5 billion) which represents a 10.1% rise in costs. The rise in aggregate operating costs reflects primarily increased production volumes which has resulted in lower unit cash costs of R342 288/kg (H1 F2015: R358 104/kg), an improvement of 4.4%.
Management has adopted a cautious approach to capital expenditure in order to preserve cash resources. This does not mean that essential and strategic development will not be done. The total capital expenditure for the period was R161.9 million, comprising R33.2 million and R128.7 million for expansionary and sustaining capital respectively. We anticipate spending a further R570.0 million for the remainder of the year.
RESULTS COMMENTARY continued
21INTERIM RESULTS
Processing and refiningIn line with our objective of adding smelter capacity and progressively reducing the group’s operating
risk, work has started on the building of a new furnace. The total cost of the project is expected to be
R750.0 million and it is expected to be commissioned by December 2017.
This expansion work follows on the extension of Northam’s strategic partnership with Heraeus
Deutschland GmbH & Co. KG (Heraeus) and Heraeus South Africa Proprietary Limited in terms of which
Heraeus has agreed to contribute E20.0 million to the construction of the furnace. The agreement
also provides for the renewal of the current toll refining agreements and guarantees supply of material
to Heraeus.
BooysendalHealth and safetyThe Booysendal mine recorded 2 million fatality free shifts on 17 September 2015.
The lost time injury rate (per 200 000 hours worked) improved to 0.52 (30 June 2015: 0.54) whilst the
reportable injury rate (per 200 000 hours worked) was marginally higher at 0.43 (30 June 2015: 0.41).
The mechanised mining method continues to be a significant safety differentiator.
ProductionProduction at Booysendal during the reporting period was affected by sporadic community protests during
the period.
A total of 985 727 tonnes were milled at a head grade of 2.7g/t compared to 929 262 tonnes at a head
grade of 2.6g/t during the comparable period.
Having been in ramp-up phase since July 2013, the Booysendal UG2 North achieved its steady-state run rate
of 160 000oz per annum within the reporting period.
The Merensky project at Booysendal North advanced satisfactorily with the development of the access
decline and the extraction of a bulk sample for metallurgical test work. This test work is expected to be
completed early in the second half of the financial year.
Costs and capital expenditureThe total operating costs at Booysendal for the period were R667.4 million (H1 F2015: R531.6 million).
This increase of 25.6% is attributed mainly to the higher production volumes and mining contract rates.
The rand per tonne milled for the period is in line with expectations at R661/t.
Total capital expenditure during this period has been R55.5 million and R266.6 million for sustaining and
expansionary capital respectively. Capital expenditure for the remainder of F2016 is likely to absorb a further
R205.6 million.
The unit cash cost of metal in concentrate at R291 772/kg (H1 F2015: R251 914/kg) is now a more
realistic reflection of the operating costs at Booysendal following the completion of the ramp-up to
steady state levels.
22 NORTHAM PLATINUM LIMITED
CORPORATE ACTIONR50.0 million was paid to AQPSA for the Everest mining right when the Section 11 consent was granted by the Minister of Mineral Resources during the period.
In September 2015, Northam signed a heads of agreement with Heraeus, in terms of which Heraeus will contribute E20.0 million to the construction of a 20MW furnace at the Zondereinde smelter complex. This amount will be payable in two equal tranches, the first in June 2016 and the other in June 2017. Northam will pay a research and development fee of R9.2 million per annum for 20 years beginning in the current financial year.
MINERAL RESOURCES AND RESERVESThe process of estimating the group’s mineral resource and reserve is conducted on an annual basis. The latest mineral resource and reserve estimation is included in the 2015 annual integrated report, which was published in September 2015 and is available on the company’s website.
CHANGES TO THE BOARD OF DIRECTORSMr R Havenstein took over from Mr A R Martin as lead independent director on 18 August 2015.
Mr BK Mosehla was appointed as a non-executive director on 19 August 2015.
Mr ME Beckett retired as a director on 11 November 2015.
Ms HH Hickey and Mr TI Mvusi’s appointments as independent non-executive directors, effective 1 January 2016, were announced on 11 December 2015. Ms Hickey is also a member of the audit and risk committee.
PROSPECTS*The outlook for the PGM industry remains challenging with persistent weak metal prices and poor economic fundamentals in developed economies. The group’s financial performance will depend on achieving higher metal prices and a stable operating performance. Despite the adverse market conditions, Northam’s strong balance sheet and prudent financial controls will enable the company to continue with strategic project development which will position the company to benefit from improving market conditions in the future.* Not audited or reviewed by the group’s auditors.
DIVIDENDGiven the continuing difficult conditions in the mining industry, and the cash requirements for the development of the group’s assets, the board has resolved not to declare an interim dividend for H1 F2016 (H1 F2015: Rnil cents per share).
On behalf of the board
PL Zim PA DunneChairman Chief executiveJohannesburg17 February 2016
RESULTS COMMENTARY continued
23INTERIM RESULTS
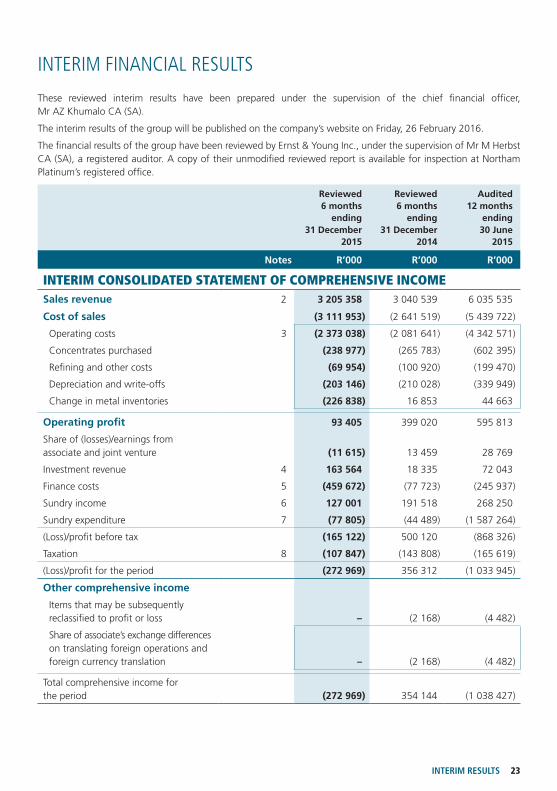
These reviewed interim results have been prepared under the supervision of the chief financial officer, Mr AZ Khumalo CA (SA).
The interim results of the group will be published on the company’s website on Friday, 26 February 2016.
The financial results of the group have been reviewed by Ernst & Young Inc., under the supervision of Mr M Herbst CA (SA), a registered auditor. A copy of their unmodified reviewed report is available for inspection at Northam Platinum’s registered office.
Reviewed6 months
ending31 December
2015
Reviewed 6 months
ending 31 December
2014
Audited12 months
ending 30 June
2015
Notes R’000 R’000 R’000
INTERIM CONSOLIDATED STATEMENT OF COMPREHENSIVE INCOMESales revenue 2 3 205 358 3 040 539 6 035 535
Cost of sales (3 111 953) (2 641 519) (5 439 722)
Operating costs 3 (2 373 038) (2 081 641) (4 342 571)
Concentrates purchased (238 977) (265 783) (602 395)
Refining and other costs (69 954) (100 920) (199 470)
Depreciation and write-offs (203 146) (210 028) (339 949)
Change in metal inventories (226 838) 16 853 44 663
Operating profit 93 405 399 020 595 813
Share of (losses)/earnings from associate and joint venture (11 615) 13 459 28 769
Investment revenue 4 163 564 18 335 72 043
Finance costs 5 (459 672) (77 723) (245 937)
Sundry income 6 127 001 191 518 268 250
Sundry expenditure 7 (77 805) (44 489) (1 587 264)
(Loss)/profit before tax (165 122) 500 120 (868 326)
Taxation 8 (107 847) (143 808) (165 619)
(Loss)/profit for the period (272 969) 356 312 (1 033 945)
Other comprehensive income
Items that may be subsequently reclassified to profit or loss – (2 168) (4 482)
Share of associate’s exchange differences on translating foreign operations and foreign currency translation – (2 168) (4 482)
Total comprehensive income for the period (272 969) 354 144 (1 038 427)
INTERIM FINANCIAL RESULTS
24 NORTHAM PLATINUM LIMITED
Reviewed6 months
ending31 December
2015
Reviewed 6 months
ending 31 December
2014
Audited12 months
ending 30 June
2015
Notes R’000 R’000 R’000
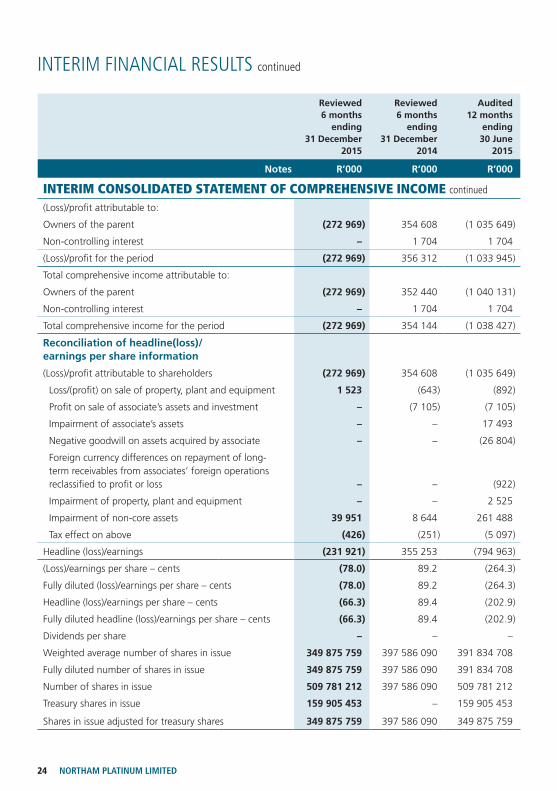
INTERIM CONSOLIDATED STATEMENT OF COMPREHENSIVE INCOME continued
(Loss)/profit attributable to:
Owners of the parent (272 969) 354 608 (1 035 649)
Non-controlling interest – 1 704 1 704
(Loss)/profit for the period (272 969) 356 312 (1 033 945)
Total comprehensive income attributable to:
Owners of the parent (272 969) 352 440 (1 040 131)
Non-controlling interest – 1 704 1 704
Total comprehensive income for the period (272 969) 354 144 (1 038 427)
Reconciliation of headline(loss)/earnings per share information
(Loss)/profit attributable to shareholders (272 969) 354 608 (1 035 649)
Loss/(profit) on sale of property, plant and equipment 1 523 (643) (892)
Profit on sale of associate’s assets and investment – (7 105) (7 105)
Impairment of associate’s assets – – 17 493
Negative goodwill on assets acquired by associate – – (26 804)
Foreign currency differences on repayment of long-term receivables from associates’ foreign operations reclassified to profit or loss – – (922)
Impairment of property, plant and equipment – – 2 525
Impairment of non-core assets 39 951 8 644 261 488
Tax effect on above (426) (251) (5 097)
Headline (loss)/earnings (231 921) 355 253 (794 963)
(Loss)/earnings per share – cents (78.0) 89.2 (264.3)
Fully diluted (loss)/earnings per share – cents (78.0) 89.2 (264.3)
Headline (loss)/earnings per share – cents (66.3) 89.4 (202.9)
Fully diluted headline (loss)/earnings per share – cents (66.3) 89.4 (202.9)
Dividends per share – – –
Weighted average number of shares in issue 349 875 759 397 586 090 391 834 708
Fully diluted number of shares in issue 349 875 759 397 586 090 391 834 708
Number of shares in issue 509 781 212 397 586 090 509 781 212
Treasury shares in issue 159 905 453 – 159 905 453
Shares in issue adjusted for treasury shares 349 875 759 397 586 090 349 875 759
INTERIM FINANCIAL RESULTS continued

25INTERIM RESULTS
Reviewed6 months
ending31 December
2015
Reviewed 6 months
ending 31 December
2014
Audited12 months
ending 30 June
2015
Notes R’000 R’000 R’000
INTERIM CONSOLIDATED STATEMENT OF FINANCIAL POSITIONAssetsNon-current assets 13 660 222 12 892 826 13 367 048
Property, plant and equipment 7 317 097 6 440 526 7 065 352
Mining properties and mineral resources 5 664 180 5 642 503 5 636 478
Interest in associates and joint ventures 9 231 138 495 275 275 847
Unlisted investment 6 6 6
Land and township development 18 400 9 522 10 000
Long-term receivables 92 557 91 692 94 503
Investments held by Northam Platinum Restoration Trust Fund 89 990 47 397 49 092
Environmental Guarantee Investment 59 522 52 884 52 122
Buttonshope Conservancy Trust 11 018 10 859 11 037
Deferred tax asset 176 314 102 162 172 611
Current assets 4 153 965 1 915 014 5 784 288
Inventories 10 905 379 1 107 533 1 126 550
Trade and other receivables 341 416 557 609 498 854
Cash and cash equivalents 2 906 354 241 991 4 138 189
Tax receivables 816 7 881 20 695
Total assets 17 814 187 14 807 840 19 151 336

26 NORTHAM PLATINUM LIMITED
Reviewed6 months
ending31 December
2015
Reviewed 6 months
ending 31 December
2014
Audited12 months
ending 30 June
2015
Notes R’000 R’000 R’000
INTERIM CONSOLIDATED STATEMENT OF FINANCIAL POSITION continued
Equity and liabilitiesTotal equity 8 943 456 11 692 108 9 216 425
Stated capital 13 778 114 9 178 688 13 778 114
Treasury shares (6 556 123) – (6 556 123)
Retained earnings 866 839 2 530 928 1 139 808
Equity settled share based payment reserve 874 448 – 874 448
Share of other comprehensive income from associate (19 822) (17 508) (19 822)
Non current liabilities 7 772 836 2 130 476 7 310 753
Deferred tax liability 543 398 528 529 521 452
Long-term provisions 215 920 148 747 187 217
Preference share liability 11 6 931 596 – 6 492 655
Long-term loans 38 063 41 867 39 963
Long-term share based payment liability 43 859 41 333 69 466
Domestic medium-term notes – 1 370 000 –
Current liabilities 1 097 895 985 256 2 624 158
Current portion of long-term loans 3 801 3 801 3 801
Short-term share based payment liability 20 049 45 607 61 019
Domestic medium-term notes – – 1 370 000
Bank overdraft – 6 207 –
Tax payable 117 497 110 488 102 072
Trade and other payables 817 886 691 010 959 996
Short-term provisions 138 662 128 143 127 270
Total equity and liabilities 17 814 187 14 807 840 19 151 336
INTERIM FINANCIAL RESULTS continued
27INTERIM RESULTS
Stated capital
Retained earnings
Equitysettled
share basedpayment
reserve
Compre-hensive
income fromassociate
Non-controlling
interest Total
R’000 R’000 R’000 R’000 R’000 R’000
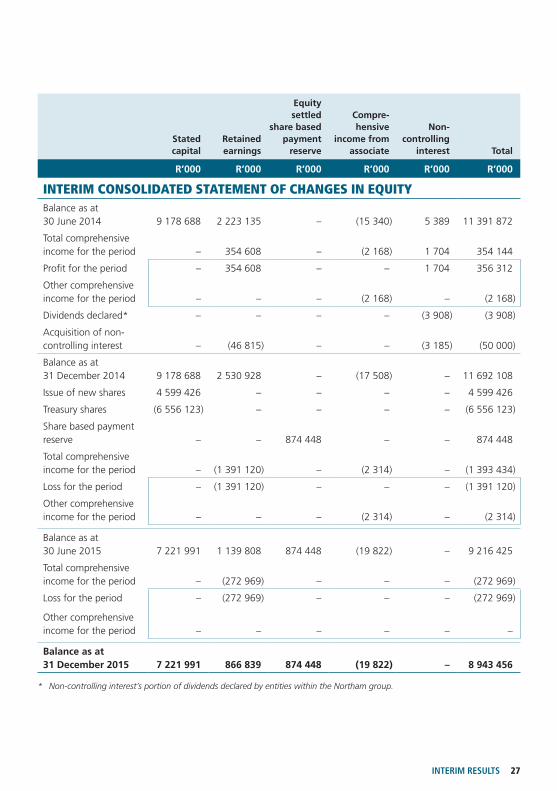
INTERIM CONSOLIDATED STATEMENT OF CHANGES IN EQUITYBalance as at 30 June 2014 9 178 688 2 223 135 – (15 340) 5 389 11 391 872
Total comprehensive income for the period – 354 608 – (2 168) 1 704 354 144
Profit for the period – 354 608 – – 1 704 356 312
Other comprehensive income for the period – – – (2 168) – (2 168)
Dividends declared* – – – – (3 908) (3 908)
Acquisition of non-controlling interest – (46 815) – – (3 185) (50 000)
Balance as at 31 December 2014 9 178 688 2 530 928 – (17 508) – 11 692 108
Issue of new shares 4 599 426 – – – – 4 599 426
Treasury shares (6 556 123) – – – – (6 556 123)
Share based payment reserve – – 874 448 – – 874 448
Total comprehensive income for the period – (1 391 120) – (2 314) – (1 393 434)
Loss for the period – (1 391 120) – – – (1 391 120)
Other comprehensive income for the period – – – (2 314) – (2 314)
Balance as at 30 June 2015 7 221 991 1 139 808 874 448 (19 822) – 9 216 425
Total comprehensive income for the period – (272 969) – – – (272 969)
Loss for the period – (272 969) – – – (272 969)
Other comprehensive income for the period – – – – – –
Balance as at 31 December 2015 7 221 991 866 839 874 448 (19 822) – 8 943 456
* Non-controlling interest’s portion of dividends declared by entities within the Northam group.
28 NORTHAM PLATINUM LIMITED
Reviewed6 months
ending31 December
2015
Reviewed6 months
ending31 December
2014
Audited12 months
ending30 June
2015
R’000 R’000 R’000
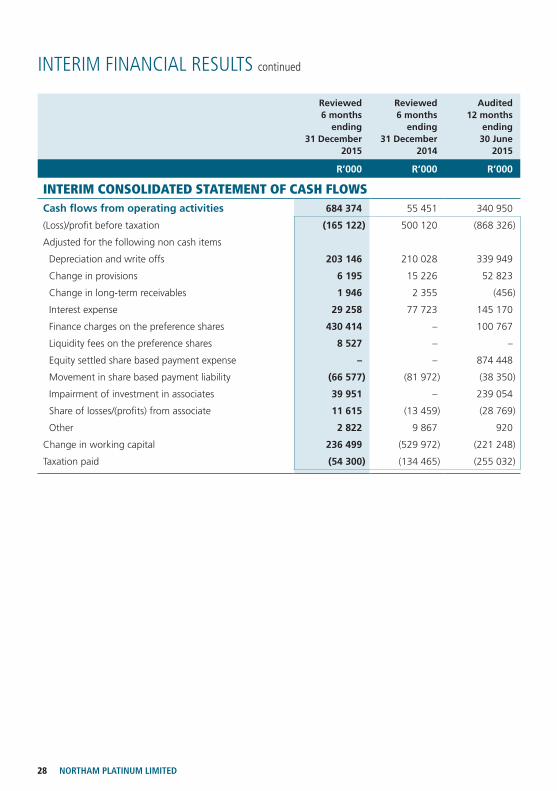
INTERIM CONSOLIDATED STATEMENT OF CASH FLOWSCash flows from operating activities 684 374 55 451 340 950
(Loss)/profit before taxation (165 122) 500 120 (868 326)
Adjusted for the following non cash items
Depreciation and write offs 203 146 210 028 339 949
Change in provisions 6 195 15 226 52 823
Change in long-term receivables 1 946 2 355 (456)
Interest expense 29 258 77 723 145 170
Finance charges on the preference shares 430 414 – 100 767
Liquidity fees on the preference shares 8 527 – –
Equity settled share based payment expense – – 874 448
Movement in share based payment liability (66 577) (81 972) (38 350)
Impairment of investment in associates 39 951 – 239 054
Share of losses/(profits) from associate 11 615 (13 459) (28 769)
Other 2 822 9 867 920
Change in working capital 236 499 (529 972) (221 248)
Taxation paid (54 300) (134 465) (255 032)
INTERIM FINANCIAL RESULTS continued
29INTERIM RESULTS
Reviewed6 months
ending31 December
2015
Reviewed6 months
ending31 December
2014
Audited12 months
ending30 June
2015
R’000 R’000 R’000
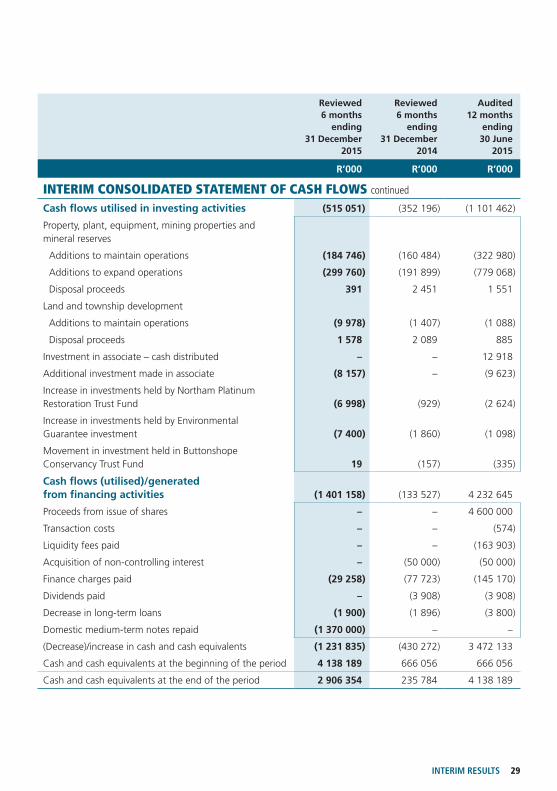
INTERIM CONSOLIDATED STATEMENT OF CASH FLOWS continued
Cash flows utilised in investing activities (515 051) (352 196) (1 101 462)
Property, plant, equipment, mining properties and mineral reserves
Additions to maintain operations (184 746) (160 484) (322 980)
Additions to expand operations (299 760) (191 899) (779 068)
Disposal proceeds 391 2 451 1 551
Land and township development
Additions to maintain operations (9 978) (1 407) (1 088)
Disposal proceeds 1 578 2 089 885
Investment in associate – cash distributed – – 12 918
Additional investment made in associate (8 157) – (9 623)
Increase in investments held by Northam Platinum Restoration Trust Fund (6 998) (929) (2 624)
Increase in investments held by Environmental Guarantee investment (7 400) (1 860) (1 098)
Movement in investment held in Buttonshope Conservancy Trust Fund 19 (157) (335)
Cash flows (utilised)/generated from financing activities (1 401 158) (133 527) 4 232 645
Proceeds from issue of shares – – 4 600 000
Transaction costs – – (574)
Liquidity fees paid – – (163 903)
Acquisition of non-controlling interest – (50 000) (50 000)
Finance charges paid (29 258) (77 723) (145 170)
Dividends paid – (3 908) (3 908)
Decrease in long-term loans (1 900) (1 896) (3 800)
Domestic medium-term notes repaid (1 370 000) – –
(Decrease)/increase in cash and cash equivalents (1 231 835) (430 272) 3 472 133
Cash and cash equivalents at the beginning of the period 4 138 189 666 056 666 056
Cash and cash equivalents at the end of the period 2 906 354 235 784 4 138 189
30 NORTHAM PLATINUM LIMITED
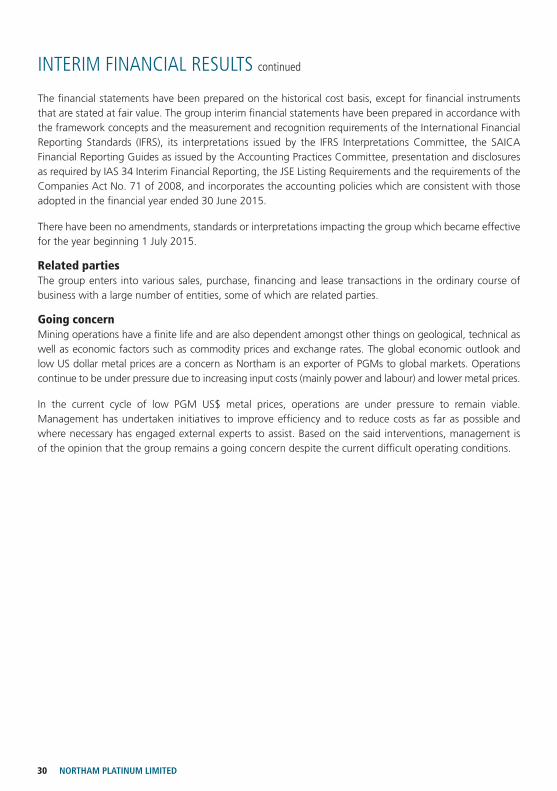
The financial statements have been prepared on the historical cost basis, except for financial instruments that are stated at fair value. The group interim financial statements have been prepared in accordance with the framework concepts and the measurement and recognition requirements of the International Financial Reporting Standards (IFRS), its interpretations issued by the IFRS Interpretations Committee, the SAICA Financial Reporting Guides as issued by the Accounting Practices Committee, presentation and disclosures as required by IAS 34 Interim Financial Reporting, the JSE Listing Requirements and the requirements of the Companies Act No. 71 of 2008, and incorporates the accounting policies which are consistent with those adopted in the financial year ended 30 June 2015.
There have been no amendments, standards or interpretations impacting the group which became effective for the year beginning 1 July 2015.
Related parties The group enters into various sales, purchase, financing and lease transactions in the ordinary course of business with a large number of entities, some of which are related parties.
Going concernMining operations have a finite life and are also dependent amongst other things on geological, technical as well as economic factors such as commodity prices and exchange rates. The global economic outlook and low US dollar metal prices are a concern as Northam is an exporter of PGMs to global markets. Operations continue to be under pressure due to increasing input costs (mainly power and labour) and lower metal prices.
In the current cycle of low PGM US$ metal prices, operations are under pressure to remain viable. Management has undertaken initiatives to improve efficiency and to reduce costs as far as possible and where necessary has engaged external experts to assist. Based on the said interventions, management is of the opinion that the group remains a going concern despite the current difficult operating conditions.
INTERIM FINANCIAL RESULTS continued
31INTERIM RESULTS
NOTES TO THE INTERIM FINANCIAL STATEMENTS
Zondereinde 6 months
ending31 December
2015
Booysendal 6 months
ending31 December
2015
Intercompany eliminations
6 months ending
31 December2015
Zambezi Platinum 6 months
ending31 December
2015
Other 6 months
ending 31 December
2015
Reviewed 6 months
ending31 December
2015
R’000 R’000 R’000 R’000 R’000 R’000
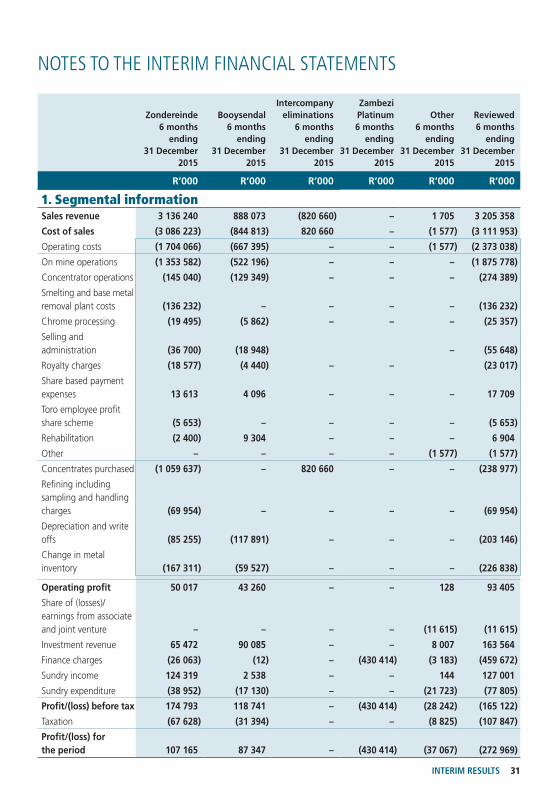
1. Segmental informationSales revenue 3 136 240 888 073 (820 660) – 1 705 3 205 358
Cost of sales (3 086 223) (844 813) 820 660 – (1 577) (3 111 953)
Operating costs (1 704 066) (667 395) – – (1 577) (2 373 038)
On mine operations (1 353 582) (522 196) – – – (1 875 778)
Concentrator operations (145 040) (129 349) – – – (274 389)
Smelting and base metal removal plant costs (136 232) – – – – (136 232)
Chrome processing (19 495) (5 862) – – – (25 357)
Selling and administration (36 700) (18 948) – (55 648)
Royalty charges (18 577) (4 440) – – (23 017)
Share based payment expenses 13 613 4 096 – – – 17 709
Toro employee profit share scheme (5 653) – – – – (5 653)
Rehabilitation (2 400) 9 304 – – – 6 904
Other – – – – (1 577) (1 577)
Concentrates purchased (1 059 637) – 820 660 – – (238 977)
Refining including sampling and handling charges (69 954) – – – – (69 954)
Depreciation and write offs (85 255) (117 891) – – – (203 146)
Change in metal inventory (167 311) (59 527) – – – (226 838)
Operating profit 50 017 43 260 – – 128 93 405
Share of (losses)/earnings from associate and joint venture – – – – (11 615) (11 615)
Investment revenue 65 472 90 085 – – 8 007 163 564
Finance charges (26 063) (12) – (430 414) (3 183) (459 672)
Sundry income 124 319 2 538 – – 144 127 001
Sundry expenditure (38 952) (17 130) – – (21 723) (77 805)
Profit/(loss) before tax 174 793 118 741 – (430 414) (28 242) (165 122)
Taxation (67 628) (31 394) – – (8 825) (107 847)
Profit/(loss) for the period 107 165 87 347 – (430 414) (37 067) (272 969)
32 NORTHAM PLATINUM LIMITED
NOTES TO THE INTERIM FINANCIAL STATEMENTS continued
Zondereinde 6 months
ending31 December
2014
Booysendal 6 months
ending31 December
2014
Intercompany eliminations
6 months ending
31 December2014
Zambezi Platinum 6 months
ending31 December
2014
Other 6 months
ending 31 December
2014
Reviewed 6 months
ending31 December
2014
R’000 R’000 R’000 R’000 R’000 R’000
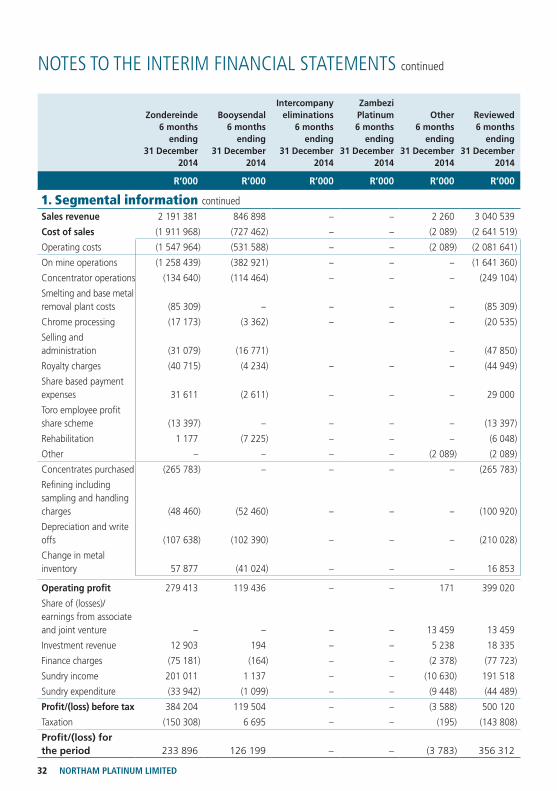
1. Segmental information continuedSales revenue 2 191 381 846 898 – – 2 260 3 040 539
Cost of sales (1 911 968) (727 462) – – (2 089) (2 641 519)
Operating costs (1 547 964) (531 588) – – (2 089) (2 081 641)
On mine operations (1 258 439) (382 921) – – – (1 641 360)
Concentrator operations (134 640) (114 464) – – – (249 104)
Smelting and base metal removal plant costs (85 309) – – – – (85 309)
Chrome processing (17 173) (3 362) – – – (20 535)
Selling and administration (31 079) (16 771) – (47 850)
Royalty charges (40 715) (4 234) – – – (44 949)
Share based payment expenses 31 611 (2 611) – – – 29 000
Toro employee profit share scheme (13 397) – – – – (13 397)
Rehabilitation 1 177 (7 225) – – – (6 048)
Other – – – – (2 089) (2 089)
Concentrates purchased (265 783) – – – – (265 783)
Refining including sampling and handling charges (48 460) (52 460) – – – (100 920)
Depreciation and write offs (107 638) (102 390) – – – (210 028)
Change in metal inventory 57 877 (41 024) – – – 16 853
Operating profit 279 413 119 436 – – 171 399 020
Share of (losses)/earnings from associate and joint venture – – – – 13 459 13 459
Investment revenue 12 903 194 – – 5 238 18 335
Finance charges (75 181) (164) – – (2 378) (77 723)
Sundry income 201 011 1 137 – – (10 630) 191 518
Sundry expenditure (33 942) (1 099) – – (9 448) (44 489)
Profit/(loss) before tax 384 204 119 504 – – (3 588) 500 120
Taxation (150 308) 6 695 – – (195) (143 808)
Profit/(loss) for the period 233 896 126 199 – – (3 783) 356 312
33INTERIM RESULTS
Zondereinde 12 months
ending30 June 2015
Booysendal 12 months
ending30 June 2015
Intercompanyeliminations 12 months
ending30 June 2015
Zambezi Platinum
and the BEE transaction 12 months
ending30 June 2015
Other 12 months
ending30 June 2015
Audited 12 months
ending30 June 2015
R’000 R’000 R’000 R’000 R’000 R’000
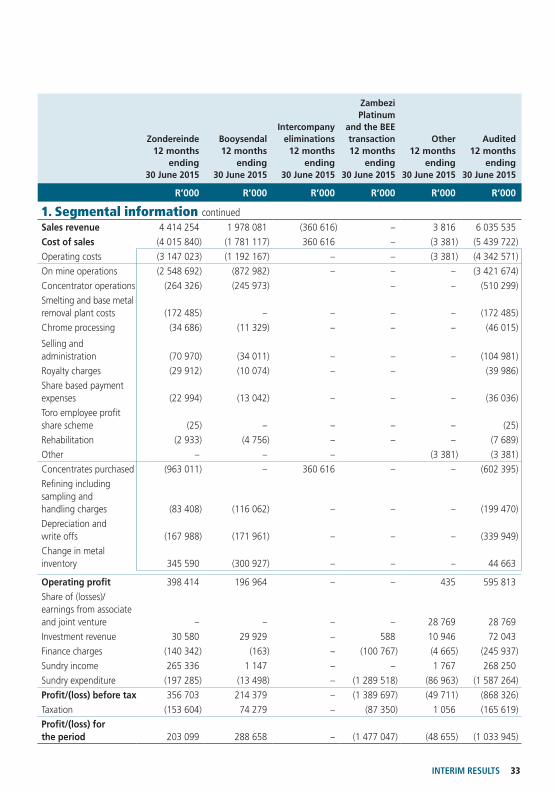
1. Segmental information continuedSales revenue 4 414 254 1 978 081 (360 616) – 3 816 6 035 535
Cost of sales (4 015 840) (1 781 117) 360 616 – (3 381) (5 439 722)
Operating costs (3 147 023) (1 192 167) – – (3 381) (4 342 571)
On mine operations (2 548 692) (872 982) – – – (3 421 674)
Concentrator operations (264 326) (245 973) – – (510 299)
Smelting and base metal removal plant costs (172 485) – – – – (172 485)
Chrome processing (34 686) (11 329) – – – (46 015)
Selling and administration (70 970) (34 011) – – – (104 981)
Royalty charges (29 912) (10 074) – – (39 986)
Share based payment expenses (22 994) (13 042) – – – (36 036)
Toro employee profit share scheme (25) – – – – (25)
Rehabilitation (2 933) (4 756) – – – (7 689)
Other – – – (3 381) (3 381)
Concentrates purchased (963 011) – 360 616 – – (602 395)
Refining including sampling and handling charges (83 408) (116 062) – – – (199 470)
Depreciation and write offs (167 988) (171 961) – – – (339 949)
Change in metal inventory 345 590 (300 927) – – – 44 663
Operating profit 398 414 196 964 – – 435 595 813
Share of (losses)/earnings from associate and joint venture – – – – 28 769 28 769
Investment revenue 30 580 29 929 – 588 10 946 72 043
Finance charges (140 342) (163) – (100 767) (4 665) (245 937)
Sundry income 265 336 1 147 – – 1 767 268 250
Sundry expenditure (197 285) (13 498) – (1 289 518) (86 963) (1 587 264)
Profit/(loss) before tax 356 703 214 379 – (1 389 697) (49 711) (868 326)
Taxation (153 604) 74 279 – (87 350) 1 056 (165 619)
Profit/(loss) for the period 203 099 288 658 – (1 477 047) (48 655) (1 033 945)
34 NORTHAM PLATINUM LIMITED
NOTES TO THE INTERIM FINANCIAL STATEMENTS continued
Reviewed6 months
ending 31 December
2015
Reviewed6 months
ending 31 December
2014
Reviewed12 months
ending30 June
2015
R’000 R’000 R’000
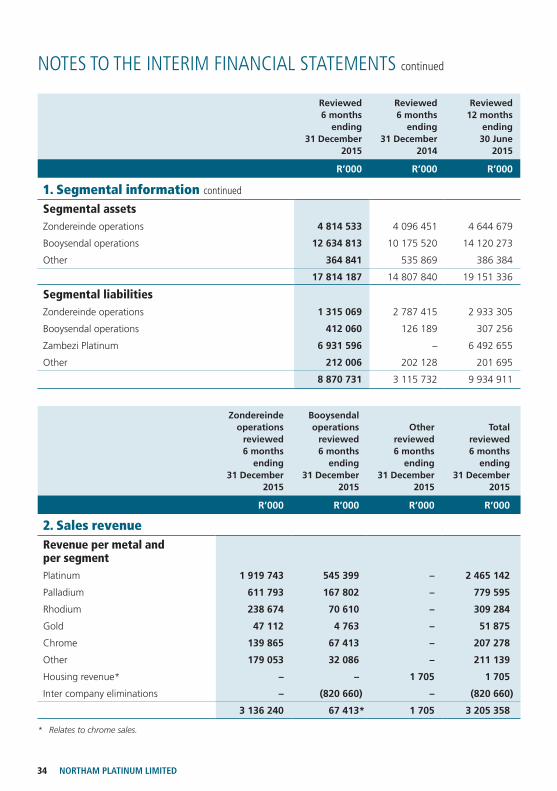
1. Segmental information continued
Segmental assetsZondereinde operations 4 814 533 4 096 451 4 644 679
Booysendal operations 12 634 813 10 175 520 14 120 273
Other 364 841 535 869 386 384
17 814 187 14 807 840 19 151 336
Segmental liabilitiesZondereinde operations 1 315 069 2 787 415 2 933 305
Booysendal operations 412 060 126 189 307 256
Zambezi Platinum 6 931 596 – 6 492 655
Other 212 006 202 128 201 695
8 870 731 3 115 732 9 934 911
Zondereindeoperations
reviewed 6 months
ending31 December
2015
Booysendaloperations
reviewed 6 months
ending 31 December
2015
Otherreviewed 6 months
ending31 December
2015
Totalreviewed 6 months
ending31 December
2015
R’000 R’000 R’000 R’000
2. Sales revenueRevenue per metal and per segmentPlatinum 1 919 743 545 399 – 2 465 142
Palladium 611 793 167 802 – 779 595
Rhodium 238 674 70 610 – 309 284
Gold 47 112 4 763 – 51 875
Chrome 139 865 67 413 – 207 278
Other 179 053 32 086 – 211 139
Housing revenue* – – 1 705 1 705
Inter company eliminations – (820 660) – (820 660)
3 136 240 67 413* 1 705 3 205 358
* Relates to chrome sales.
35INTERIM RESULTS
Zondereindeoperations
reviewed 6 months
ending31 December
2015
Booysendaloperations
reviewed 6 months
ending 31 December
2015
Totalreviewed 6 months
ending 31 December
2015
R’000 R’000 R’000
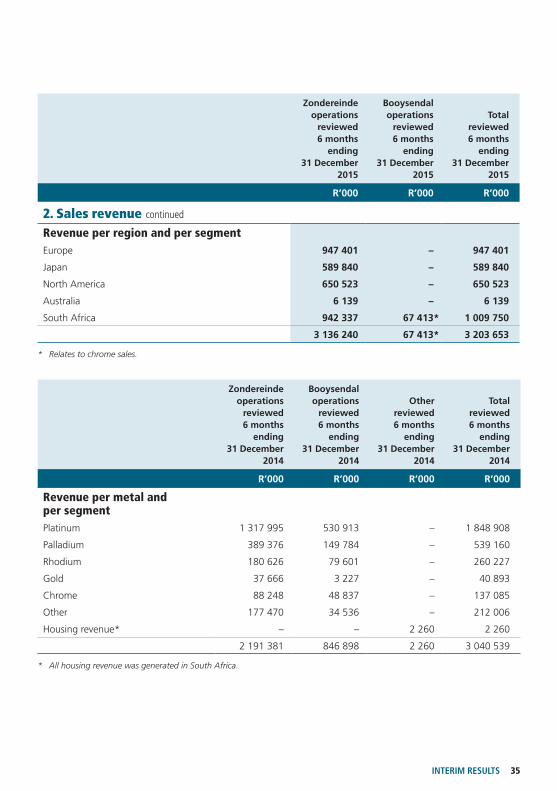
2. Sales revenue continued
Revenue per region and per segmentEurope 947 401 – 947 401
Japan 589 840 – 589 840
North America 650 523 – 650 523
Australia 6 139 – 6 139
South Africa 942 337 67 413* 1 009 750
3 136 240 67 413* 3 203 653
* Relates to chrome sales.
Zondereindeoperations
reviewed 6 months
ending31 December
2014
Booysendaloperations
reviewed 6 months
ending 31 December
2014
Otherreviewed 6 months
ending31 December
2014
Totalreviewed 6 months
ending31 December
2014
R’000 R’000 R’000 R’000
Revenue per metal and per segmentPlatinum 1 317 995 530 913 – 1 848 908
Palladium 389 376 149 784 – 539 160
Rhodium 180 626 79 601 – 260 227
Gold 37 666 3 227 – 40 893
Chrome 88 248 48 837 – 137 085
Other 177 470 34 536 – 212 006
Housing revenue* – – 2 260 2 260
2 191 381 846 898 2 260 3 040 539
* All housing revenue was generated in South Africa.
36 NORTHAM PLATINUM LIMITED
NOTES TO THE INTERIM FINANCIAL STATEMENTS continued
Zondereindeoperations
reviewed 6 months
ending31 December
2014
Booysendaloperations
reviewed 6 months
ending 31 December
2014
Totalreviewed 6 months
ending 31 December
2014
R’000 R’000 R’000
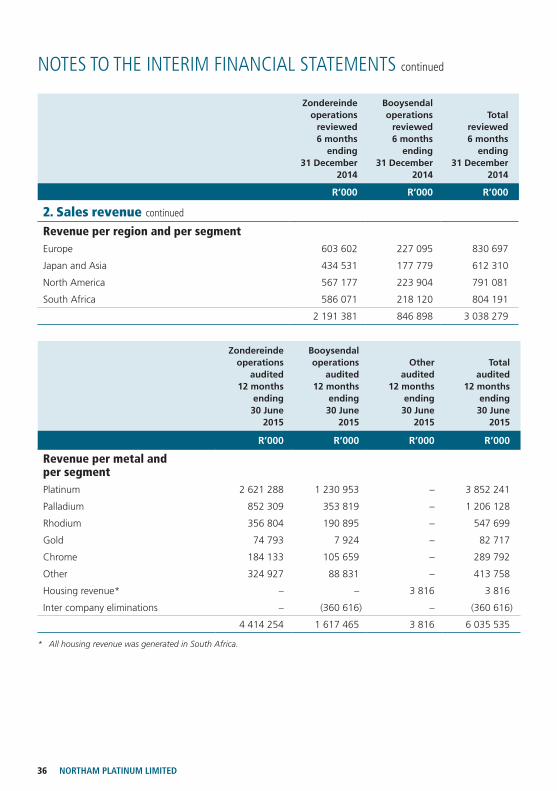
2. Sales revenue continued
Revenue per region and per segmentEurope 603 602 227 095 830 697
Japan and Asia 434 531 177 779 612 310
North America 567 177 223 904 791 081
South Africa 586 071 218 120 804 191
2 191 381 846 898 3 038 279
Zondereindeoperations
audited12 months
ending30 June
2015
Booysendaloperations
audited 12 months
ending 30 June
2015
Otheraudited
12 monthsending
30 June2015
Totalaudited
12 monthsending
30 June2015
R’000 R’000 R’000 R’000
Revenue per metal and per segmentPlatinum 2 621 288 1 230 953 – 3 852 241
Palladium 852 309 353 819 – 1 206 128
Rhodium 356 804 190 895 – 547 699
Gold 74 793 7 924 – 82 717
Chrome 184 133 105 659 – 289 792
Other 324 927 88 831 – 413 758
Housing revenue* – – 3 816 3 816
Inter company eliminations – (360 616) – (360 616)
4 414 254 1 617 465 3 816 6 035 535
* All housing revenue was generated in South Africa.
37INTERIM RESULTS
Zondereindeoperations
audited 12 months
ending30 June
2015
Booysendaloperations
audited12 months
ending 30 June
2015
Totalaudited
12 monthsending
30 June2015
R’000 R’000 R’000
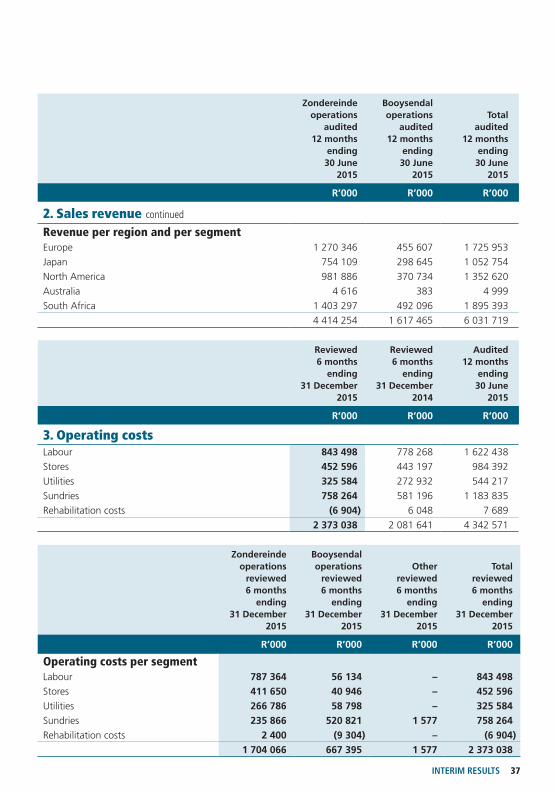
2. Sales revenue continued
Revenue per region and per segmentEurope 1 270 346 455 607 1 725 953
Japan 754 109 298 645 1 052 754
North America 981 886 370 734 1 352 620
Australia 4 616 383 4 999
South Africa 1 403 297 492 096 1 895 393
4 414 254 1 617 465 6 031 719
Reviewed6 months
ending 31 December
2015
Reviewed6 months
ending 31 December
2014
Audited12 months
ending 30 June
2015
R’000 R’000 R’000
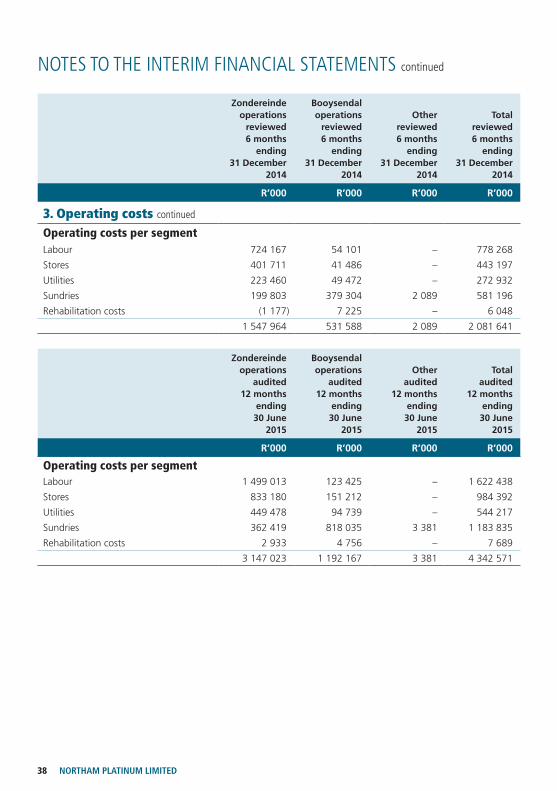
3. Operating costsLabour 843 498 778 268 1 622 438
Stores 452 596 443 197 984 392
Utilities 325 584 272 932 544 217
Sundries 758 264 581 196 1 183 835
Rehabilitation costs (6 904) 6 048 7 689
2 373 038 2 081 641 4 342 571
Zondereindeoperations
reviewed 6 months
ending31 December
2015
Booysendaloperations
reviewed 6 months
ending31 December
2015
Otherreviewed 6 months
ending 31 December
2015
Totalreviewed 6 months
ending 31 December
2015
R’000 R’000 R’000 R’000
Operating costs per segmentLabour 787 364 56 134 – 843 498
Stores 411 650 40 946 – 452 596
Utilities 266 786 58 798 – 325 584
Sundries 235 866 520 821 1 577 758 264
Rehabilitation costs 2 400 (9 304) – (6 904)
1 704 066 667 395 1 577 2 373 038
38 NORTHAM PLATINUM LIMITED
NOTES TO THE INTERIM FINANCIAL STATEMENTS continued
Zondereindeoperations
reviewed 6 months
ending 31 December
2014
Booysendaloperations
reviewed 6 months
ending 31 December
2014
Otherreviewed 6 months
ending 31 December
2014
Totalreviewed 6 months
ending 31 December
2014
R’000 R’000 R’000 R’000
3. Operating costs continued
Operating costs per segmentLabour 724 167 54 101 – 778 268
Stores 401 711 41 486 – 443 197
Utilities 223 460 49 472 – 272 932
Sundries 199 803 379 304 2 089 581 196
Rehabilitation costs (1 177) 7 225 – 6 048
1 547 964 531 588 2 089 2 081 641
Zondereindeoperations
audited 12 months
ending 30 June
2015
Booysendaloperations
audited 12 months
ending 30 June
2015
Otheraudited
12 monthsending
30 June2015
Totalaudited
12 monthsending
30 June2015
R’000 R’000 R’000 R’000
Operating costs per segmentLabour 1 499 013 123 425 – 1 622 438
Stores 833 180 151 212 – 984 392
Utilities 449 478 94 739 – 544 217
Sundries 362 419 818 035 3 381 1 183 835
Rehabilitation costs 2 933 4 756 – 7 689
3 147 023 1 192 167 3 381 4 342 571
39INTERIM RESULTS
Reviewed6 months
ending31 December
2015
Reviewed6 months
ending31 December
2014
Audited12 months
ending 30 June
2015
R’000 R’000 R’000
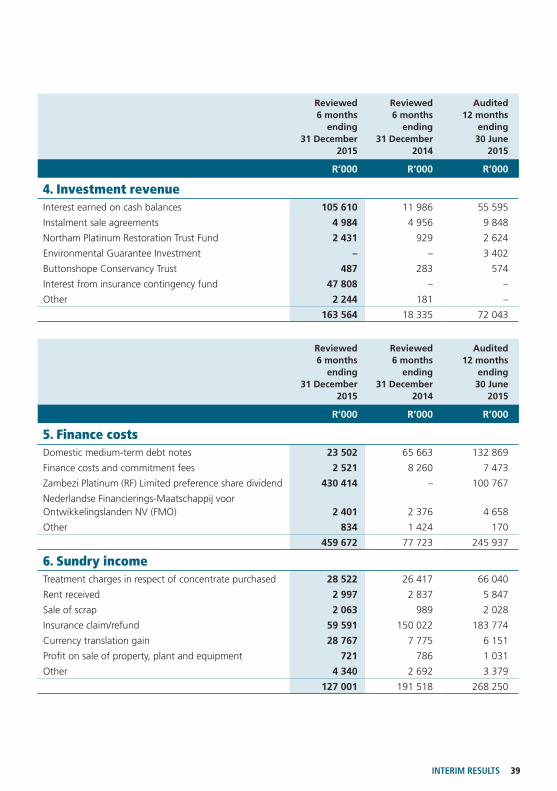
4. Investment revenueInterest earned on cash balances 105 610 11 986 55 595
Instalment sale agreements 4 984 4 956 9 848
Northam Platinum Restoration Trust Fund 2 431 929 2 624
Environmental Guarantee Investment – – 3 402
Buttonshope Conservancy Trust 487 283 574
Interest from insurance contingency fund 47 808 – –
Other 2 244 181 –
163 564 18 335 72 043
Reviewed 6 months
ending 31 December
2015
Reviewed 6 months
ending 31 December
2014
Audited12 months
ending 30 June
2015
R’000 R’000 R’000
5. Finance costsDomestic medium-term debt notes 23 502 65 663 132 869
Finance costs and commitment fees 2 521 8 260 7 473
Zambezi Platinum (RF) Limited preference share dividend 430 414 – 100 767
Nederlandse Financierings-Maatschappij voor Ontwikkelingslanden NV (FMO) 2 401 2 376 4 658
Other 834 1 424 170
459 672 77 723 245 937
6. Sundry incomeTreatment charges in respect of concentrate purchased 28 522 26 417 66 040
Rent received 2 997 2 837 5 847
Sale of scrap 2 063 989 2 028
Insurance claim/refund 59 591 150 022 183 774
Currency translation gain 28 767 7 775 6 151
Profit on sale of property, plant and equipment 721 786 1 031
Other 4 340 2 692 3 379
127 001 191 518 268 250

40 NORTHAM PLATINUM LIMITED
NOTES TO THE INTERIM FINANCIAL STATEMENTS continued
Reviewed 6 months
ending 31 December
2015
Reviewed 6 months
ending 31 December
2014
Audited6 months
ending30 June
2015
R’000 R’000 R’000
7. Sundry expenditureLoss on sale of property, plant and equipment (2 244) (143) (139)
Amortisation of participation interest in the Pandora joint venture (1 300) (1 300) (2 600)
Black Economic Empowerment lock in fee paid to the Zambezi Platinum (RF) Limited shareholders – – (242 429)
Write down of investments and accounts receivables (39 951) (9 764) (261 488)
IFRS 2 share based payment expense relating to Black Economic Empowerment transaction – – (874 448)
Corporate action costs (4 070) (29 244) (172 640)
Booysendal land management (1 907) (887) (2 647)
Booysendal South rent paid (1 500) – –
Booysendal South care and maintenance (12 946) – (9 659)
Amortisation of liquidity fees paid on the preference shares (8 527) – –
Other expenditure (5 360) (3 151) (21 214)
(77 805) (44 489) (1 587 264)
8. TaxationIncome tax
Current income tax charge (81 676) (123 464) (136 292)
Adjustments in respect of current income tax of previous years (7 928) – 530
Dividend withholding tax – – (12 447)
Capital gains tax – – (74 592)
Deferred tax (18 243) (20 344) 57 182
(107 847) (143 808) (165 619)
41INTERIM RESULTS
Reviewed6 months
ending 31 December
2015
Reviewed6 months
ending 31 December
2014
Audited12 months
ending30 June
2015
% % %
8. Taxation continued
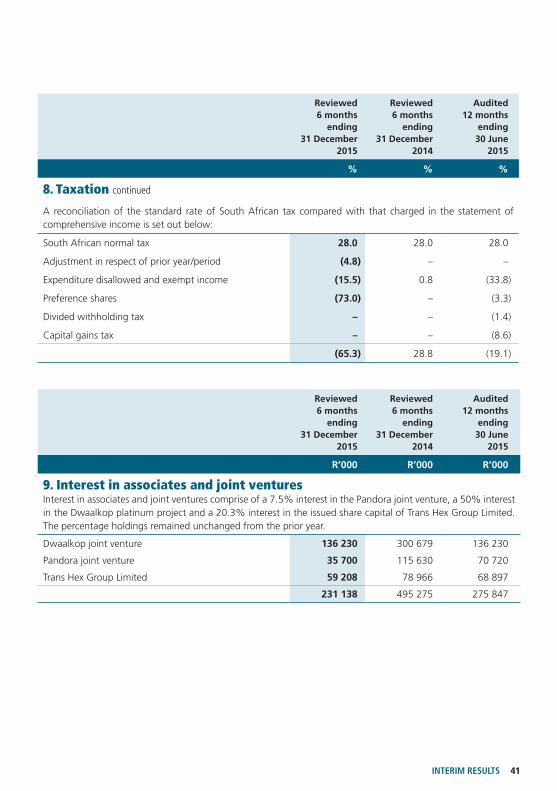
A reconciliation of the standard rate of South African tax compared with that charged in the statement of comprehensive income is set out below:
South African normal tax 28.0 28.0 28.0
Adjustment in respect of prior year/period (4.8) – –
Expenditure disallowed and exempt income (15.5) 0.8 (33.8)
Preference shares (73.0) – (3.3)
Divided withholding tax – – (1.4)
Capital gains tax – – (8.6)
(65.3) 28.8 (19.1)
Reviewed6 months
ending 31 December
2015
Reviewed6 months
ending 31 December
2014
Audited 12 months
ending 30 June
2015
R’000 R’000 R’000
9. Interest in associates and joint venturesInterest in associates and joint ventures comprise of a 7.5% interest in the Pandora joint venture, a 50% interest in the Dwaalkop platinum project and a 20.3% interest in the issued share capital of Trans Hex Group Limited. The percentage holdings remained unchanged from the prior year.
Dwaalkop joint venture 136 230 300 679 136 230
Pandora joint venture 35 700 115 630 70 720
Trans Hex Group Limited 59 208 78 966 68 897
231 138 495 275 275 847

42 NORTHAM PLATINUM LIMITED
NOTES TO THE INTERIM FINANCIAL STATEMENTS continued
Interestin Dwaalkopjoint venture
Interestin Pandora
joint venture
Interestin Trans Hex
Group Limited Total
R’000 R’000 R’000 R’000
9. Interest in associates and joint ventures continued
Opening balance as at 1 July 2014 300 679 114 927 80 903 496 509
Additional investment – 7 136 – 7 136
Share of (losses)/earnings from associate and joint venture – (5 133) 18 592 13 459
Current year amortisation – (1 300) – (1 300)
Cash distributions received – – (10 765) (10 765)
Impairment – – (9 764) (9 764)
Closing balance as at 31 December 2014 300 679 115 630 78 966 495 275
Additional investment – 2 487 – 2 487
Share of (losses)/earnings from associate and joint venture – (5 614) 20 924 15 310
Other comprehensive income – – (4 482) (4 482)
Current year amortisation – (1 300) – (1 300)
Cash distributions received – – (2 153) (2 153)
Impairment (164 449) (40 483) (24 358) (229 290)
Closing balance as at 30 June 2015 136 230 70 720 68 897 275 847
Additional investment – 8 157 – 8 157
Share of losses from associate and joint venture – (7 196) (4 419) (11 615)
Current year amortisation – (1 300) – (1 300)
Impairment – (34 681) (5 270) (39 951)
Closing balance as at 31 December 2015 136 230 35 700 59 208 231 138

43INTERIM RESULTS
Reviewed6 months
ending31 December
2015
Reviewed6 months
ending31 December
2014
Audited12 months
ending 30 June
2015
R’000 R’000 R’000
10. InventoriesMetals on hand and in transit at net realisable valuePlatinum 522 589 646 813 673 216
Palladium 167 108 215 342 220 905
Rhodium 122 806 150 174 142 401
Gold 13 332 12 536 16 252
Total metal inventories 825 835 1 024 865 1 052 774
Chrome finished product at costs 323 94 222
Consumables at costs 79 221 82 574 73 554
Total inventories at the lower of cost and net realisable value 905 379 1 107 533 1 126 550
Included in cost of sales are metals on hand that were written down by R186.5 million, (30 June 2015: R273.0 million and 31 December 2014: R63.3 million) to net realisable value.
Reviewed6 months
ending31 December
2015
Reviewed6 months
ending31 December
2014
Audited12 months
ending 30 June
2015
R’000 R’000 R’000
11. Preference share liabilityOpening balance 6 656 891 – –
Zambezi Platinum (RF) Limited preference shares issued – – 6 556 124
Accrued dividends 430 414 – 100 767
7 087 305 – 6 656 891
Liquidity fees relating to the Black Economic Empowerment transaction (155 709) (164 236)
6 931 596 – 6 492 655
In May 2015, 159.9 million cumulative redeemable preference shares were issued by Zambezi Platinum (RF) Limited at an issue price of R41 per share. The preference shares are redeemable in 10 years time at R41 plus the cumulative preference dividends. The preference shareholders are entitled to receive a dividend equal to the issue price multiplied by the dividend rate of prime plus 3.5% calculated on a daily basis based on a 365-day year compounded annually. The redeemable preference shares do not carry the right to vote.
The preference share liability will be settled by delivering cash through the sale of the Northam shares owned by Zambezi Platinum (RF) Limited, the issue of a variable number of Northam shares to the preference shareholders or a combination of the two.

44 NORTHAM PLATINUM LIMITED
NOTES TO THE INTERIM FINANCIAL STATEMENTS continued
A liquidity fee was paid to the Public Investment Corporation SOC Limited and Coronation Asset Management Proprietary Limited, who underwrote the Zambezi Platinum preference share issue.
The liquidity fee was equal to 2.5% of the value of the preference shares issued on the implementation date which was 18 May 2015 and will be amortised over the 10-year period of the preference shares.
Reviewed31 December
2015
Reviewed31 December
2014
Audited30 June
2015
R’000 R’000 R’000
12. Capital commitmentsBooysendal mineAuthorised but not contracted 26 291 135 935 367 584
Contracted 179 282 83 749 74 506
205 573 219 684 442 090
Zondereinde mineAuthorised but not contracted 220 790 90 822 795 628
Contracted 349 162 64 608 42 376
569 952 155 430 838 004
Other commitmentsInformation technology – outsource service provider
Due within one year 20 212 16 588 26 675
Due within two to five years 10 604 25 087 18 403
Operating lease rentals – office equipment
Due within one year 1 717 2 321 2 136
Due within two to five years 746 2 244 1 684
Operating lease rentals – premises
Due within one year 6 430 4 303 5 599
Due within two to five years 23 586 13 310 27 324
More than five years – 4 293 –
The lease rental for the corporate office contains an option to renew the lease for an additional five years.
Housing development 3 321 9 762 4 800
Bank guarantees issued 50 717 73 266 73 266
These commitments will be funded from a combination of internal retentions and debt.
13. Events after the reporting periodOn 5 February 2016 shareholders were advised by way of a SENS announcement that Northam had entered into a subscription agreement with the Industrial Development Corporation of South Africa Limited (IDC) in terms of which the IDC has agreed to subscribe for new domestic medium-term notes amounting to R250.0 million at a rate of the three month Jibar plus 390 basis points. Apart from this matter, there have been no other events subsequent to the period end which require additional disclosure or adjustment to these interim financial results.
ADMINISTRATION AND CONTACT INFORMATION
NORTHAM PLATINUM LIMITED(Incorporated in the Republic of South Africa)(Registration number 1977/003282/06)Share code: NHMISIN: ZAE000030912
REGISTERED OFFICEBuilding 4 1st FloorMaxwell Office ParkMagwa Crescent WestWaterfall CityJukskei View 2090South Africa
PO Box 412694Craighall 2024South Africa
Telephone: +27 11 759 6000Facsimile: +27 11 325 4795
WEBSITEwww.northam.co.za
AUDITORSErnst & Young Inc.102 Rivonia RoadSandton2146JohannesburgSouth Africa
TRANSFER SECRETARIESComputershare Investor Services Proprietary Limited70 Marshall Street 2001JohannesburgSouth Africa
PO Box 61051Marshalltown 2107South Africa
Telephone: +27 11 370 5000Facsimile: +27 11 688 5238
COMPANY SECRETARYPB BealeBuilding 41st FloorMaxwell Office ParkMagwa Crescent WestWaterfall CityJukskei View 2090South Africa
E-mail: [email protected]
SPONSOROne Capital17 Fricker RoadIllovo 2196JohannesburgSouth Africa
PO Box 784573Sandton 2146South Africa
INVESTOR RELATIONSR RautenbachTelephone: +27 11 759 6000E-mail: [email protected]
Russell & AssociatesPO Box 1457Parklands 2121South Africa
Telephone: +27 11 880 3924
WWW.NORTHAM.CO.ZA