Embed Size (px)
Citation preview

REVISED APPENDIX T NOISE IMPACT ANALYSIS

Updated Environmental Noise & Vibration Assessment
Crystal Geyser Bottling Plant EIR
Siskiyou County, California
BAC Job # 2017-071
Prepared For:
Analytical Environmental Services
Attn: Ryan Lee Sawyer 1801 7th Street, Suite 100 Sacramento, CA 95811
Prepared By:
Bollard Acoustical Consultants, Inc.
Paul Bollard, President
August 7, 2017
3551 Bankhead Road Loomis, CA 95650 Phone: (916) 663-0500 BACNOISE.COM

Bollard Acoustical Consultants, Inc. (BAC)
Noise & Vibration Impact Analysis Crystal Geyser Bottling Plant
Mt. Shasta (Siskiyou County), CA. Page 1
Introduction
The Crystal Geyser Bottling Plant (project) proposes to resume operations of a water-bottling facility, including implementations of modifications to the existing facility, on a heavy industrial zoned 29-acre parcel located at 210 Ski Village Drive, Mt. Shasta (Siskiyou County), California. In addition to resuming bottling activities, proposed modifications to existing facility include the installation of a residential structure for a caretaker, and wastewater discharge system improvements.
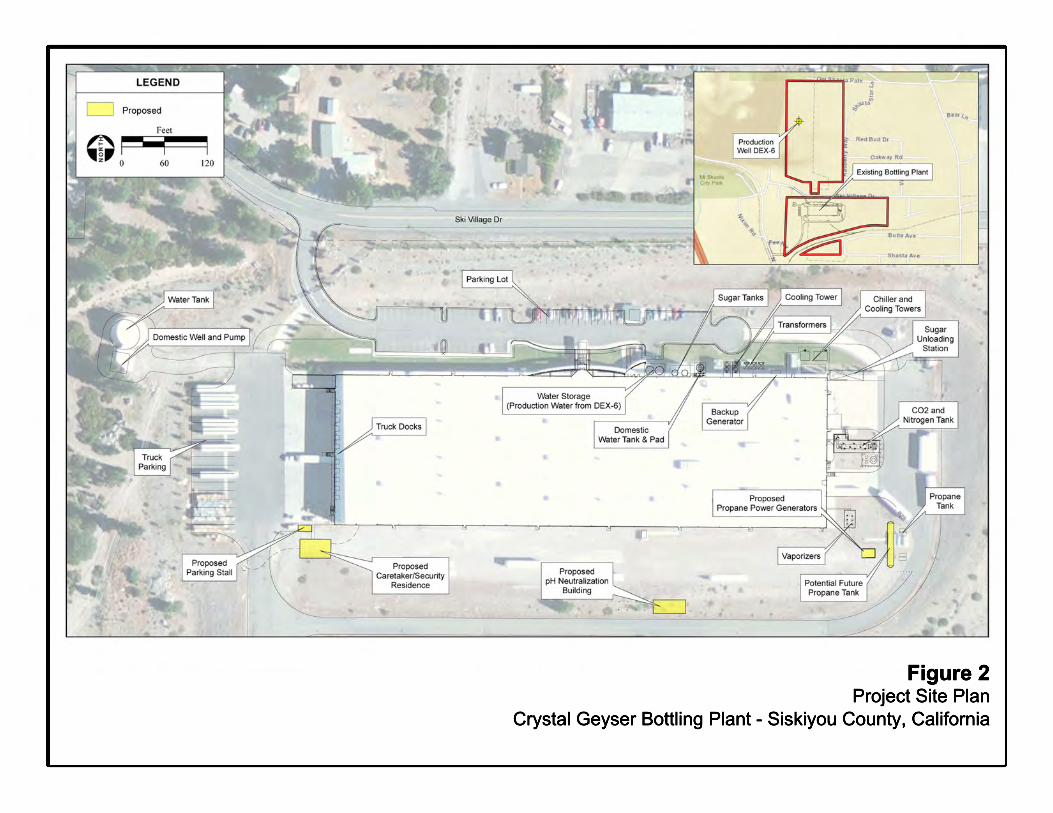
The existing bottling facility is located on the northern limits of the City of Mount Shasta, on the southwestern flank of Mt. Shasta. It is bordered by Ski Village Drive to the north, Mount Shasta Boulevard to the west, McCloud railroad tracks to the south, and low-density residential development to the east. Figures 1 and 2 show the project area and proposed site plan with on-site improvements, respectively. Although the project site is located within Siskiyou County, it is located adjacent to sensitive receptors located within the City of Mount Shasta.
The purpose of this analysis is to quantify the existing noise environment, identify potential noise impacts resulting from the project, identify appropriate noise mitigation measures, and provide a quantitative and qualitative analysis of noise impacts associated with the project. Specifically, noise impacts are identified if project-generated noise levels would cause a substantial increase in ambient noise levels at existing noise-sensitive land uses in the project vicinity, or if project related noise levels would cause noise levels to exceed applicable Siskiyou County and City of Mount Shasta noise standards at sensitive receptors located nearest the facility.
This report represents an update to the noise study report prepared for the DEIR. This update was warranted due to proposed revisions to the project description pertaining to restrictions on nighttime truck deliveries and relocation of the proposed propane generators. In addition, this updated noise assessment contains supplemental data and analysis where appropriate to fully respond to comments received on the DEIR.
It should be noted that the refinements to the project description resulted in a lessening of the severity of previously identified noise impacts, particularly as related to off-site traffic restrictions during nighttime hours.
To provide substantive responses to comments received on the DEIR requesting additional data and analysis, supplemental noise monitoring was conducted. This monitoring was conducted both to evaluate ambient conditions at additional locations and to quantify noise generated by mechanical equipment already installed at the project site. In addition to refinements of the previous analysis, this supplemental analysis also includes evaluation of potential impacts at four (4) additional representative receptor locations.
Following completion of this supplemental monitoring and analysis, the finding of significant and unavoidable noise impact related to off-site traffic was re-evaluated and determined to be less than significant without mitigation.
Bollard Acoustical Consultants, Inc. (BAC)
Noise & Vibration Impact Analysis Crystal Geyser Bottling Plant
Mt. Shasta (Siskiyou County), CA. Page 2
Following publication of the DEIR, the applicant’s noise consultant, j.c. brennan & associates provided a letter dated February 27, 2017 stating the applicants intention to relocate the proposed generators to the southeast corner of the CG building. The brennan letter also included information indicating that the reference sound level data for the propane generators was overstated in the DEIR.
This updated noise study includes evaluation of the revised generator location and current reference sound emissions for the generators. Although the quieter generator emissions reflected in the brennan letter indicate at the overall generator noise emissions would be lower, the relocation of the generators further east removes the shielding of the proposed generators to the residences northeast of the project site. As a result, the sound emissions of the proposed propane generators in their relocated position (see Appendix I), were found to exceed the project’s thresholds of significance at the nearest sensitive receptors. Therefore, noise impacts related to generator usage remain significant.
The supplemental monitoring and analysis of on-site noise sources revealed two sources where operational noise impacts were determined to have been under-estimated in the DEIR. These areas are related to rooftop exhaust fans and exhaust vents associated with chiller equipment located near the east side of the building. Additional noise mitigation measures were developed, and those measures would reduce potentially significant operational noise impacts to a less than significant level. No noise impacts were identified as a result of this supplemental evaluation which cannot be mitigated to a level of insignificance.
Environmental Setting
Noise Fundamentals and Terminology
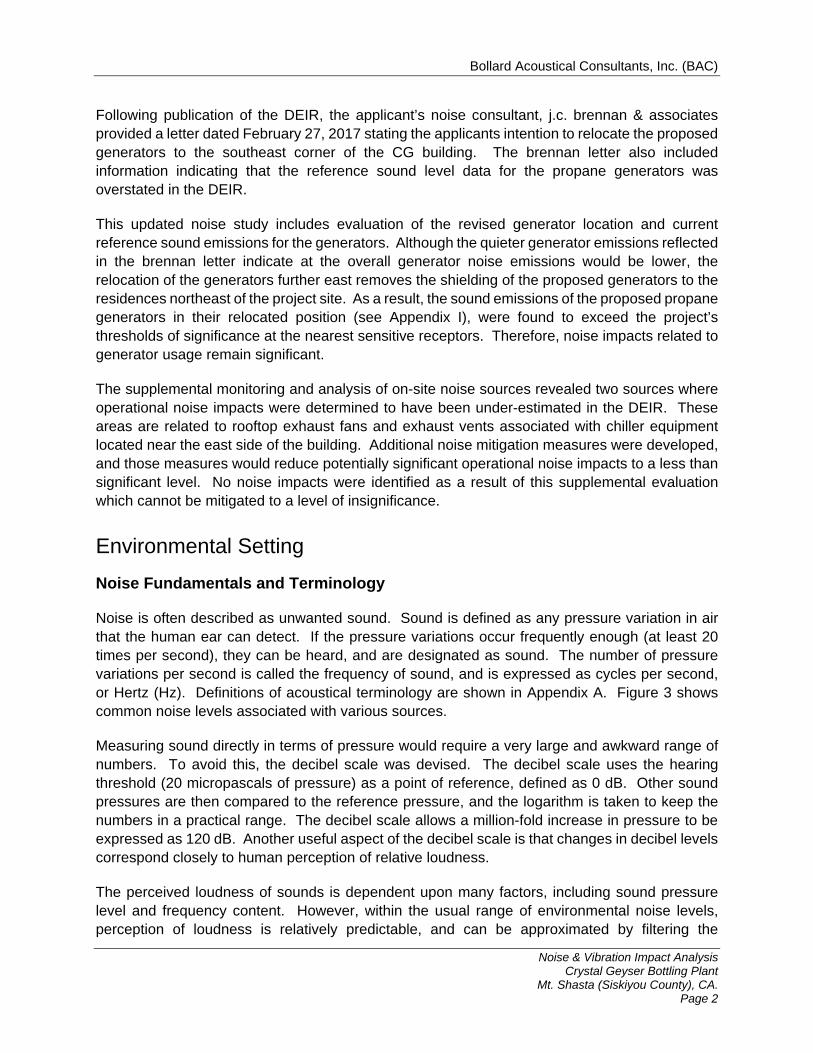
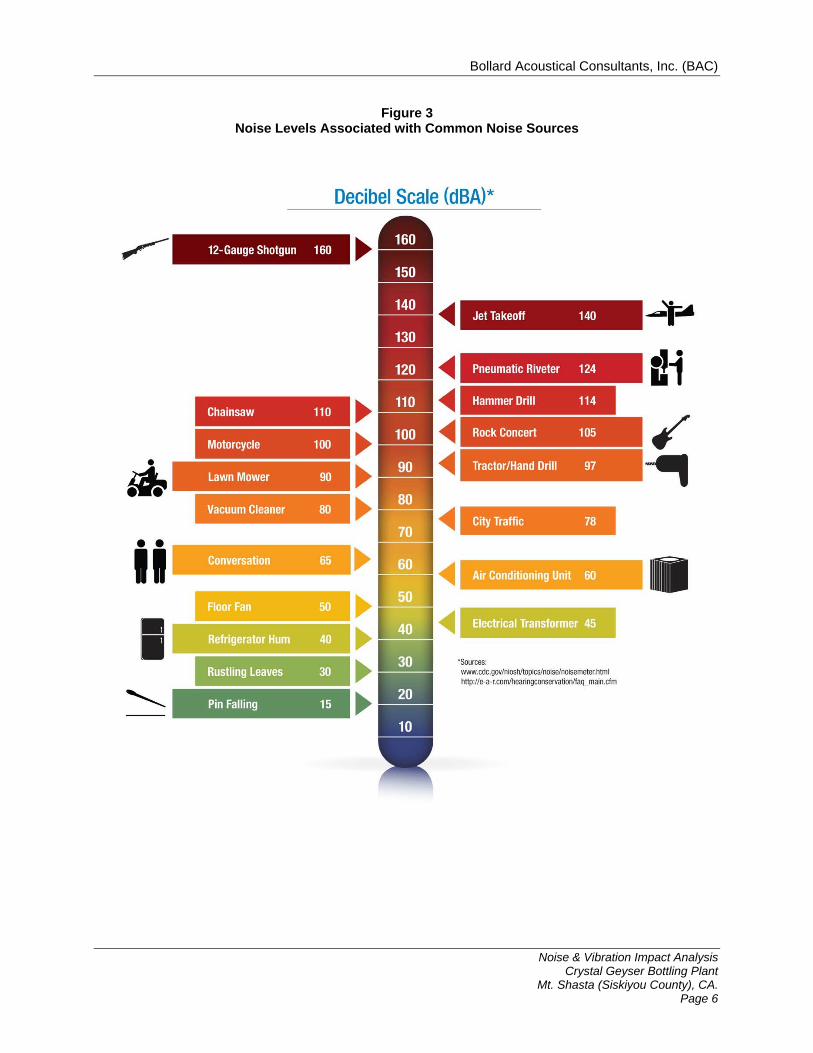
Noise is often described as unwanted sound. Sound is defined as any pressure variation in air that the human ear can detect. If the pressure variations occur frequently enough (at least 20 times per second), they can be heard, and are designated as sound. The number of pressure variations per second is called the frequency of sound, and is expressed as cycles per second, or Hertz (Hz). Definitions of acoustical terminology are shown in Appendix A. Figure 3 shows common noise levels associated with various sources.
Measuring sound directly in terms of pressure would require a very large and awkward range of numbers. To avoid this, the decibel scale was devised. The decibel scale uses the hearing threshold (20 micropascals of pressure) as a point of reference, defined as 0 dB. Other sound pressures are then compared to the reference pressure, and the logarithm is taken to keep the numbers in a practical range. The decibel scale allows a million-fold increase in pressure to be expressed as 120 dB. Another useful aspect of the decibel scale is that changes in decibel levels correspond closely to human perception of relative loudness.
The perceived loudness of sounds is dependent upon many factors, including sound pressure level and frequency content. However, within the usual range of environmental noise levels, perception of loudness is relatively predictable, and can be approximated by filtering the

Bollard Acoustical Consultants, Inc. (BAC)
Noise & Vibration Impact Analysis Crystal Geyser Bottling Plant
Mt. Shasta (Siskiyou County), CA. Page 3
frequency response of a sound level meter by means of the standardized A-weighting network. As a result, all sound levels reported in this study are in terms of A-weighted decibels.
Effects of Noise on People
The effects of noise on people can be divided into three categories:
1. Subjective effects of annoyance, nuisance, dissatisfaction;
2. Interference with activities such as speech, sleep, and learning; and
3. Physiological effects such as hearing loss or sudden startling.
Environmental noise typically produces effects in the first two categories. Workers in industrial plants can experience noise in the third category. There is no completely satisfactory way to measure the subjective effects of noise, or the corresponding reactions of annoyance and dissatisfaction. A wide variation in individual thresholds of annoyance exists, and different tolerances to noise tend to develop based on an individual’s past experiences with noise.
Generally, most noise is generated by transportation systems, primarily motor vehicles, aircraft, and railroads. Poor urban planning may also give rise to noise pollution, since juxtaposing industrial and residential land uses, for example, often adversely affects the residential acoustic environment. Prominent sources of indoor noise are office equipment, factory machinery, appliances, power tools, lighting hum, and audio entertainment systems. An important way of predicting a human reaction to a new noise environment is the way it compares to the existing environment (or ambient noise) to which one has adapted. In general, the more a new noise exceeds the previously existing ambient noise level, the less acceptable the new noise will be judged by those hearing it. With regard to increases in A-weighted noise level for similar sources, the following relationships occur (Caltrans, 2013):
Under controlled conditions in an acoustics laboratory, the trained healthy human ear is able to discern changes in sound levels of 1 dBA;
Outside such controlled conditions, the trained ear can detect changes of 2 dBA in normal environmental noise;
It is widely accepted that the average healthy ear, however, can barely perceive noise level changes of 3 dBA;
A change in level of 5 dBA is a readily perceptible increase in noise level; and
A 10-dBA change is recognized as twice as loud as the original source.

Bollard Acoustical Consultants, Inc. (BAC)
Noise & Vibration Impact Analysis Crystal Geyser Bottling Plant
Mt. Shasta (Siskiyou County), CA. Page 6
Figure 3 Noise Levels Associated with Common Noise Sources
Bollard Acoustical Consultants, Inc. (BAC)
Noise & Vibration Impact Analysis Crystal Geyser Bottling Plant
Mt. Shasta (Siskiyou County), CA. Page 7
These relationships occur in part because of the logarithmic nature of the decibel system. Specifically, the decibel scale represents ten times the logarithm (base 10) of the square of the ratio of a sound pressure to a reference pressure. Noise levels are measured on a logarithmic scale, instead of a linear scale, to keep the numbers in a practical range. On a logarithmic scale, the sum of two noise sources of equal loudness is 3 dBA greater than the noise generated by only one of the noise sources (e.g., a noise source of 60 dBA plus another noise source of 60 dBA generate a composite noise level of 63 dBA). To apply this formula to a specific noise source, in areas where existing levels are dominated by traffic, a doubling in traffic volume will increase ambient noise levels by 3 dBA. Similarly, a doubling in heavy equipment use, such as the use of two pieces of equipment where one formerly was used, would also increase ambient noise levels by 3 dBA. A 3 dBA increase in similar noise sources is considered to be the smallest change in noise level detectable to the average person. A change in ambient sound of 5 dBA in similar noise sources is subjectively considered to be a clearly noticeable change and can begin to create concern. A change in sound of 7 to 10 dBA typically elicits extreme concern and/or anger. Where two noise sources differ in frequency content, the thresholds for perception of the differing sources are reduced.
Noise Attenuation due to Distance
Stationary “point” sources of noise, including stationary mobile sources such as idling vehicles, attenuate (lessen) at a rate of approximately 6+ dBA per doubling of distance from the source, depending upon environmental conditions (i.e., atmospheric conditions and noise barriers, either vegetative or manufactured, etc.). Widely distributed noises, such as a large industrial facility, spread over many acres or a street with moving vehicles (a “line” or “moving point” source), would typically attenuate at a lower rate, approximately 4 to 6 dBA per doubling distance from the source (also dependent upon environmental conditions) (Caltrans, 2013). Noise from large construction sites (with heavy equipment moving dirt and trucks entering and exiting the site daily) would have characteristics of both “point” and “line” sources, so attenuation would generally range between 4.5 and 7.5 dBA per doubling of distance.
Effects of Temperature and Relative Humidity on Atmospheric Absorption of Sound
Air absorbs sound energy, referred to as atmospheric absorption. The amount of absorption depends on temperature and relative humidity, as well as the frequency content of the noise source. For “average/standard day” atmospheric conditions (59°F & 70 % relative humidity), sound in the 1,000 Hertz frequency band is absorbed at a rate of 1.5 dB per thousand feet of distance (SAE ARP 866A, 1975). For lower frequencies and higher frequencies, the absorption rates are lower and higher than at 1,000 Hertz, respectively.
The predominant frequencies for the ground level and rooftop mechanical equipment either existing or proposed as part of this project are centered around 1,000 Hertz, with minor low-frequency content. As a result, the 1,000 Hertz atmospheric absorption coefficients were used to analyze sound propagation with distance for this project.

Bollard Acoustical Consultants, Inc. (BAC)
Noise & Vibration Impact Analysis Crystal Geyser Bottling Plant
Mt. Shasta (Siskiyou County), CA. Page 8
In Mount Shasta, the summers are warm, dry, and mostly clear and the winters are cold, wet, and partly cloudy (weatherspark.com). Over the course of the year, the temperature typically varies from 28°F to 85°F and is rarely below 18°F or above 93°F. During summer months, average daily high temperatures typically range from 76°F to 85°F. The cold season lasts for approximately 4 months, from mid-November through early March, with an average daily high temperature below 51°F.
The atmospheric absorption coefficients for the 1,000 Hertz frequency band range from a low of 1.2 dB (14°F & 10% RH) to a high of 6.5 dB (50°F & 10% RH), per thousand feet. Within the range of typical average temperatures encountered in Mount Shasta (25 to 85°F), the average atmospheric absorption coefficient at 1,000 Hertz for 50% relative humidity is approximately 1.8 dB per thousand feet. As a result, the use of an atmospheric absorption rate of 1.5 dB per thousand feet in this study is considered to be conservative.
Because the nearest residences to the project site are located as close as 300 feet, with most within 1,000 feet, the net effect of normal seasonal changes in temperature and humidity conditions occurring in Mount Shasta on the assessment of atmospheric absorption effects for this project is considered to be negligible. Furthermore, the effects of changes in atmospheric conditions would not be limited to sound propagation from the project site, as sound generated by local railroad and traffic noise sources would similarly be affected.
Effects of Wind on Sound Propagation
During windy conditions over open level ground, wind gradients almost always exist. This is due to the friction between the moving air and the ground. Due to these gradients, the speed of sound varies with height above ground. This condition tends to refract, or bend, sound waves upward or downward, depending on whether the receiver is upwind or downwind from the source.
At locations upwind from the sound source, wind gradients bend sound rays upward, thereby reducing sound levels at the receiver. Conversely, downwind locations will experience higher sound levels due to wind gradients bending sound rays downward.
The average hourly wind speed in Mount Shasta does not vary significantly over the course of the year, remaining within 0.3 miles per hour of 2.3 miles per hour throughout (weatherspark.com). The wind is most often from the north the 6 month period from mid-April to late October. The wind is most often from the south from late October to mid-April, although it is recognized that normal variations occur.
The effects of wind on the propagation of sound can be substantial over very long distances, but at distances of less than 1,000 feet the effects are somewhat limited. Due to the generally low annual average wind speeds reported for Mount Shasta, the effects on wind are predicted to be limited. During moderate wind conditions, noise generated by traffic and railroad sources would be similarly affected as noise generated by the proposed project. During periodic high wind conditions, the sound generated by wind in the trees would dominate the ambient noise environment, tending to mask other local noise source. Due to the generally low annual average

Bollard Acoustical Consultants, Inc. (BAC)
Noise & Vibration Impact Analysis Crystal Geyser Bottling Plant
Mt. Shasta (Siskiyou County), CA. Page 9
wind speeds reported for Mount Shasta, and the factors described above, the net effects on wind on project-generated sound levels are predicted to be inconsequential.
Effects of Snow on Sound Propagation
The propagation of sound over distance is also affected by ground type. Soft surfaces, such as grass, shrubs and new snowfall are acoustically absorbent. Hard surfaces, such as asphalt and water, are acoustically reflective. During periods when snow is present in Mount Shasta, ambient conditions in the project vicinity may be incrementally lower due to the additional absorption provided snow versus that of the typical packed dirt or vegetative ground cover in the area. However, the presence of snow would similarly provide more absorption of project-generated sound levels. In addition, during periods of snowfall, colder temperatures tend to result in people keeping their windows closed during nighttime hours. As a result, the net effect of snowfall on the noise generation of the project relative to ambient conditions is expected to be negligible.
Single-Event Noise & Sleep Disturbance
The original noise study (2016) prepared for this project included a discussion of single-event noise as it related to sleep disturbance. However, since the 2016 version of this noise study was published, the project applicant has revised the project description to remove all nighttime trucking activities, including on-site truck circulation. It should be noted, however, that no adverse noise impacts related to sleep disturbance resulting from nighttime truck traffic were previously identified in the 2016 noise study. Although no noise impacts related to sleep disturbance were identified in the DEIR, and although nighttime truck activity has been eliminated for this project, the following background information pertaining to single-event noise and sleep disturbance is, nonetheless, provided.
A single event is an individual distinct loud activity, such as an aircraft overflight, a train or truck passage, or any other brief and discrete noise-generating activity. Because most noise policies applicable to transportation noise sources are typically specified in terms of 24-hour-averaged descriptors, such as Ldn or Community Noise Equivalent Level (CNEL), the potential for annoyance or sleep disturbance associated with individual loud events can be masked by representing the data as an average.
The analysis of single event noise effects under CEQA can be traced to a 2001 court case (Berkeley Keep Jets Over the Bay Committee v. Board of Port Commissioners of the City of Oakland (2001) 91 Cal.App.4th 1344), which concerned a challenge to the proposed expansion of the Oakland Airport because the project EIR noise analysis didn’t include an evaluation of the effects of single-event noise on sleep disturbance. The court required, in that context (i.e. an airport expansion), that the EIR address single-event noise and sleep disturbance effects on existing residents in the City of Berkeley. However, the court did not recommend an appropriate single event noise level standard to be employed.
Extensive studies have been conducted regarding the effects of single-event noise on sleep disturbance, with the Sound Exposure Level (SEL) metric being a common metric used for such assessments. SEL represents the entire sound energy of a given single-event normalized into a

Bollard Acoustical Consultants, Inc. (BAC)
Noise & Vibration Impact Analysis Crystal Geyser Bottling Plant
Mt. Shasta (Siskiyou County), CA. Page 10
one-second period regardless of event duration. As a result, the single-number SEL metric contains information pertaining to both event duration and intensity. Another descriptor utilized to assess single-event noise is the maximum, or Lmax, noise level associated with the event. A problem with utilizing Lmax to assess single events is that the duration of the event is not considered.
There are currently on-going discussions regarding the appropriateness of using the SEL metric as a supplement or replacement for cumulative noise level metrics such as Ldn and CNEL, 24-hour noise descriptors. Nonetheless, because SEL describes a receiver's total noise exposure from a single impulsive event, SEL is often used to characterize noise from individual brief loud events.
Industry Guidance on Single Event Noise and Sleep Disturbance
The Federal Interagency Committee on Aviation Noise (FICAN) has provided estimates of the percentage of people expected to be awakened when exposed to specific SELs inside a home (FICAN 1997). However, FICAN did not recommend a threshold of significance based on the percent of people awakened. According to the FICAN study, 10% of the population is estimated to be awakened when the SEL interior noise level reaches 81 dBA. An estimated 5 to 10 percent of the population is affected when the SEL interior noise level is between 65 and 81 dBA, and few sleep awakenings (less than 5 percent) are predicted if the interior SEL is less than 65 dBA. The FICAN results focused on individual single-event sound levels but did not take into consideration how exposure to multiple single events affected sleep disturbance.
ANSI and the Acoustical Society of America (ASA) released a voluntary methodology to predict sleep disturbance in terms of the probability of awakening. ANSI’s Quantities and Procedures for Description and Measurement of Environmental Sound -Part 6: Methods for Estimation of Awakenings Associated with Outdoor Noise Events Heard in Homes, July 2008, provides a method to predict sleep disturbance associated with noise levels in terms of indoor A-weighted sound exposure level (ASEL). The methodology was developed from about 10,000 subject-nights of observations primarily in homes near areas of routine jet aircraft takeoff and landings, railroads, roads, and highways. The methodology assumes that the individuals have no sleep disorders, normal hearing, and only applies to individuals over 18 years of age. The methodology also defines “disturbance” as being restricted to a behaviorally confirmed awakening.
While the FICAN has a recommended means of predicting awakenings from a single aircraft event, the ANSI methodology further refines this approach by taking into account the time since the person fell asleep and the ability to identify the probability of being awakened from multiple aircraft events over the course of the entire night. However, research performed by BAC questions the accuracy of the ANSI methodology.
Although the FICAN and ANSI methodologies provide a means by which the potential for awakenings due to single events can be predicted, neither methodology provides a recommended target level for acceptable single-event noise or percentage of awakening. Further, there is no industry consensus establishing recommended target levels for acceptable single-event noise or percentage of awakening.
Bollard Acoustical Consultants, Inc. (BAC)
Noise & Vibration Impact Analysis Crystal Geyser Bottling Plant
Mt. Shasta (Siskiyou County), CA. Page 11
Vibration Fundamentals
Vibration is like noise in that it involves a source, a transmission path, and a receiver. While vibration is related to noise, it differs in that noise is generally considered to be pressure waves transmitted through air, while vibration is usually associated with transmission through the ground or structures. As with noise, vibration consists of an amplitude and frequency. A person’s response to vibration will depend on their individual sensitivity as well as the amplitude and frequency of the source.
Vibration can be described in terms of acceleration, velocity, or displacement. A common practice is to monitor vibration measures in terms of peak particle velocities (inches/second). Standards pertaining to perception as well as damage to structures have been developed for vibration in terms of peak particle velocity.
As vibrations travel outward from the source, they excite the particles of rock and soil through which they pass and cause them to oscillate. Differences in subsurface geologic conditions and distance from the source of vibration will result in different vibration levels characterized by different frequencies and intensities. In all cases, vibration amplitudes will decrease with increasing distance. The maximum rate, or velocity of particle movement, is the commonly accepted descriptor of the vibration “strength”.
Human response to vibration is difficult to quantify. Vibration can be felt or heard well below the levels that produce any damage to structures. The duration of the event has an effect on human response, as does the frequency of the event. Generally, as the duration and vibration frequency increase, the potential for adverse human response increases.
According to the Transportation and Construction-Induced Vibration Guidance Manual (Caltrans, June 2004), operation of construction equipment and construction techniques generate ground vibration. Traffic traveling on roadways can also be a source of such vibration. At high enough amplitudes, ground vibration has the potential to damage structures and/or cause cosmetic damage (e.g., crack plaster). Ground vibration can also be a source of annoyance to individuals who live or work close to vibration-generating activities. However, traffic, including heavy trucks traveling on a highway, rarely generates vibration amplitudes high enough to cause structural or cosmetic damage.
Existing Noise Sources and Ambient Noise Levels
The existing noise environment within the overall project area is primarily defined by traffic noise emanating from the local roadway and Interstate 5 west of the project site. Railroad operations through Mount Shasta also result in periods of elevated ambient conditions. To generally quantify the existing ambient noise environment at locations representative of the noise environment at the nearest sensitive receptors to the project site, long-term (continuous) ambient noise level measurements were conducted at three (3) locations indicated on Figure 1 between July 21 and August 1, 2016. In response to comments made on the DEIR, additional noise monitoring was conducted at two locations from June 14-20, 2017. The supplemental noise monitoring locations are also identified on Figure 2 as monitoring sites 4 and 5.

Bollard Acoustical Consultants, Inc. (BAC)
Noise & Vibration Impact Analysis Crystal Geyser Bottling Plant
Mt. Shasta (Siskiyou County), CA. Page 12
Monitoring Sites 1-3 were selected to represent residences to the immediate northwest, east, and south of the project site. Supplemental monitoring Site 4 was selected to represent residences located adjacent to or near Mount Shasta Boulevard and the railroad tracks. Supplemental Monitoring Site 5 was selected to represent residences to the northeast of the site along Ski Village Drive.
It should be noted that it is not necessary to conduct ambient noise monitoring at each residence surrounding the project site. Rather, utilizing locations which are representative of ambient conditions at groups of sensitive receptors is common practice.
Both the 2016 and 2017 ambient noise surveys were conducted during summer months. Average temperatures present during the ambient surveys ranged from of 59 to 82°F, with a mean of 75°F for the 2016 survey and 70°F for the 2017 survey. Average daily relative humidity ranged from 37% to 62%, with a mean of 43% for the 2016 survey and 54% for the 2017 survey. Average daily wind speeds ranged from 1 to 5 mph, with a mean of 2 mph for the 2016 survey and 3 mph for the 2017 survey. Maximum wind speeds during both survey periods ranged from 4-12 mph with average maximum wind speeds of 7 mph during the 2016 survey and 9 mph during the 2017 survey.
Larson-Davis Laboratories (LDL) Model 820 precision integrating sound level meters were used to complete the noise level measurement surveys. The meters were calibrated before use with an LDL Model CAL200 acoustical calibrator to ensure the accuracy of the measurements. The equipment used meets all pertinent specifications of the American National Standards Institute for Type 1 sound level meters (ANSI S1.4). The ambient noise measurement results are summarized in Table 1 with the detailed results provided in tabular and graphical formats in Appendices B and C, respectively.

Bollard Acoustical Consultants, Inc. (BAC)
Noise & Vibration Impact Analysis Crystal Geyser Bottling Plant
Mt. Shasta (Siskiyou County), CA. Page 13
Table 1
General Ambient Noise Measurement Results Summary1
Crystal Geyser Bottling Plant – Mt. Shasta, CA
Site2 Date
Average Noise Level (dB Leq)
Maximum Noise Level (dB Lmax)
Day-Night Average
Daytime3 Nighttime4 Daytime3 Nighttime4 (dB Ldn)
1
7/22/2016 51 51 65 68 60 7/23/2016 51 46 69 61 56 7/24/2016 48 49 61 66 60 7/25/2016 48 52 64 68 62 7/26/2016 50 52 66 72 61 7/27/2016 49 50 67 63 60 7/28/2016 49 52 67 71 60 7/29/2016 49 54 68 73 63 7/30/2016 49 55 65 76 64 7/31/2016 48 52 64 71 60 Average 49 51 66 69 61
2
7/22/2016 47 47 63 65 55 7/23/2016 47 44 64 60 52 7/24/2016 42 44 56 61 54 7/25/2016 42 48 57 65 57 7/26/2016 44 47 59 67 55 7/27/2016 44 45 61 59 55 7/28/2016 43 48 60 67 56 7/29/2016 42 49 60 67 58 7/30/2016 43 49 60 69 57 7/31/2016 43 47 58 68 55 Average 44 47 60 65 55
3
7/22/2016 52 51 65 67 60 7/23/2016 51 47 68 62 57 7/24/2016 48 49 59 66 59 7/25/2016 46 50 61 65 58 7/26/2016 49 53 61 72 62 7/27/2016 49 50 66 62 59 7/28/2016 50 52 67 70 60 7/29/2016 49 54 70 70 61 7/30/2016 49 54 64 73 61 7/31/2016 48 50 64 68 58 Average 49 51 64 67 60
4
6/14/2017 72 73 80 92 79 6/15/2017 70 72 80 79 796/16/2017 71 73 82 84 80 6/17/2017 71 71 81 73 776/18/2017 68 71 76 86 77 6/19/2017 73 69 81 73 766/20/2017 70 73 78 85 79 Average 71 72 80 82 78
5
6/14/2017 53 52 68 71 596/15/2017 48 47 66 65 53 6/16/2017 50 49 68 67 566/17/2017 51 47 69 63 55 6/18/2017 53 42 67 63 536/19/2017 53 47 67 64 55 6/20/2017 51 48 68 66 556/21/2017 52 49 69 67 56 Average 51 48 68 66 55

Bollard Acoustical Consultants, Inc. (BAC)
Noise & Vibration Impact Analysis Crystal Geyser Bottling Plant
Mt. Shasta (Siskiyou County), CA. Page 14
Table 1
General Ambient Noise Measurement Results Summary1
Crystal Geyser Bottling Plant – Mt. Shasta, CA
Site2 Date
Average Noise Level (dB Leq)
Maximum Noise Level (dB Lmax)
Day-Night Average
Daytime3 Nighttime4 Daytime3 Nighttime4 (dB Ldn) Notes:
1 Detailed noise measurement results are provided in Appendices B and C. 2 Measurement site locations are shown on Figure 1. 3 Daytime hours are 7 AM – 10 PM. 4 Nighttime hours are 10 PM – 7 AM.
Source: Bollard Acoustical Consultants, Inc. (2016)
July 2016 Measurement Results:
For the 2016 survey, the Table 1 data indicate that typical daytime average (Leq) noise levels at Sites 1 & 3 were 49 dB Leq, and 44 dB Leq at Site 2. Measured maximum (Lmax) daytime noise levels were approximately 16 dB higher than measured daytime average noise levels at all three locations. As noted previously, the complete listing of ambient noise measurement results is provided in Appendices B and C. Existing ambient noise levels were higher at Sites 1 and 3 than at Site 2 due to their closer proximity to Interstate 5 and other local traffic noise sources. Interestingly, measured ambient noise levels at all 3 sites were slightly higher during nighttime hours than daytime hours. This is due to the fact that Interstate 5 is the major noise source in the region and atmospheric absorption of sound is considerably lower during nighttime conditions when temperatures are lower and relative humidity is higher than during warmer and dryer daytime conditions.
June 2017 Measurement Results:
For the supplemental 2017 survey, the Table 1 data indicate that typical daytime average (Leq) noise levels at Sites 4 and 5 were 71-72 Leq, respectively. Measured maximum (Lmax) daytime noise levels were approximately 9 dB higher than measured daytime average noise levels at Site 4 and 17 dB higher at Site 5. As noted previously, the complete listing of ambient noise measurement results is provided in Appendices B and C. Measured nighttime average and maximum noise levels were comparable to the measured daytime noise levels at both Sites 4 and 5. Existing ambient noise levels were much higher at Site 5 than all of the other sites due to the closer proximity of Site 4 to the railroad tracks, Mount Shasta Boulevard, and Interstate 5.
The 2017 Measurement Results for Site 5 were very consistent with the 2016 data collected at Sites 1-3. As expected, the 2017 survey results for Site 4 were considerably higher than the data collected elsewhere due to the closer proximity to the railroad tracks and Mount Shasta Boulevard.
Bollard Acoustical Consultants, Inc. (BAC)
Noise & Vibration Impact Analysis Crystal Geyser Bottling Plant
Mt. Shasta (Siskiyou County), CA. Page 15
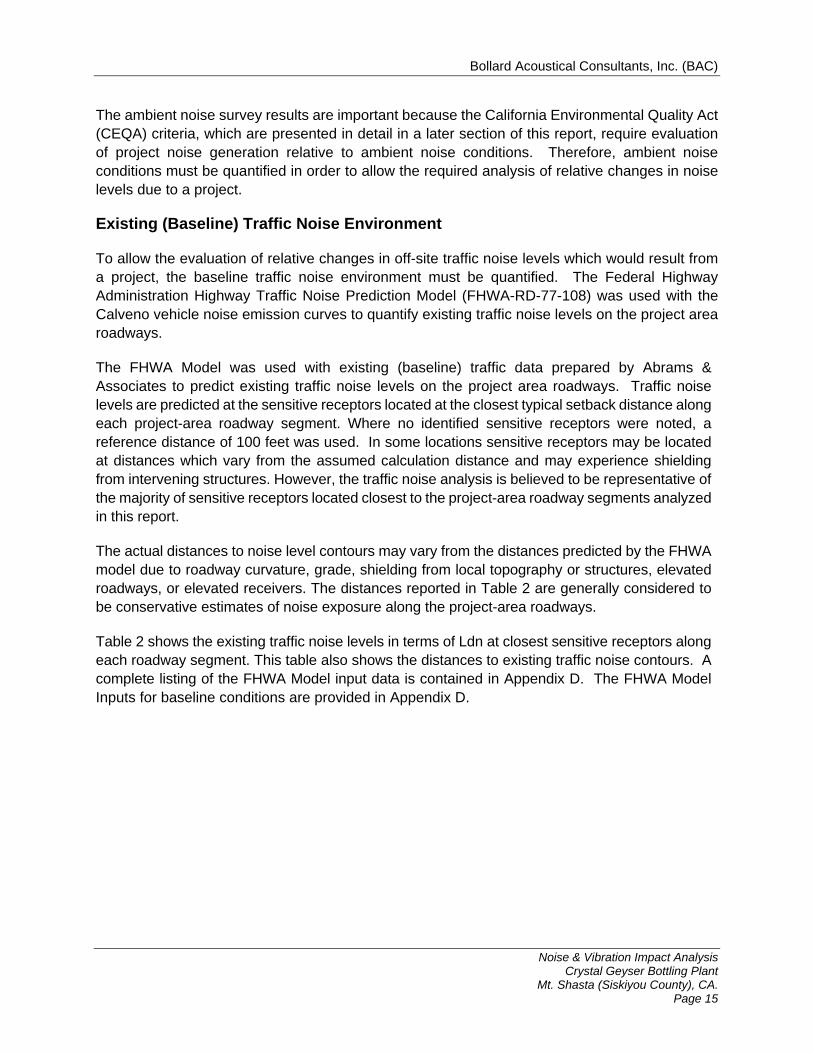
The ambient noise survey results are important because the California Environmental Quality Act (CEQA) criteria, which are presented in detail in a later section of this report, require evaluation of project noise generation relative to ambient noise conditions. Therefore, ambient noise conditions must be quantified in order to allow the required analysis of relative changes in noise levels due to a project.
Existing (Baseline) Traffic Noise Environment
To allow the evaluation of relative changes in off-site traffic noise levels which would result from a project, the baseline traffic noise environment must be quantified. The Federal Highway Administration Highway Traffic Noise Prediction Model (FHWA-RD-77-108) was used with the Calveno vehicle noise emission curves to quantify existing traffic noise levels on the project area roadways.
The FHWA Model was used with existing (baseline) traffic data prepared by Abrams & Associates to predict existing traffic noise levels on the project area roadways. Traffic noise levels are predicted at the sensitive receptors located at the closest typical setback distance along each project-area roadway segment. Where no identified sensitive receptors were noted, a reference distance of 100 feet was used. In some locations sensitive receptors may be located at distances which vary from the assumed calculation distance and may experience shielding from intervening structures. However, the traffic noise analysis is believed to be representative of the majority of sensitive receptors located closest to the project-area roadway segments analyzed in this report.
The actual distances to noise level contours may vary from the distances predicted by the FHWA model due to roadway curvature, grade, shielding from local topography or structures, elevated roadways, or elevated receivers. The distances reported in Table 2 are generally considered to be conservative estimates of noise exposure along the project-area roadways.
Table 2 shows the existing traffic noise levels in terms of Ldn at closest sensitive receptors along each roadway segment. This table also shows the distances to existing traffic noise contours. A complete listing of the FHWA Model input data is contained in Appendix D. The FHWA Model Inputs for baseline conditions are provided in Appendix D.

Bollard Acoustical Consultants, Inc. (BAC)
Noise & Vibration Impact Analysis Crystal Geyser Bottling Plant
Mt. Shasta (Siskiyou County), CA. Page 16
Existing (Baseline) Vibration Environment
The existing bottling plant located on the project site is not currently in operation. As a result, no mechanical equipment was in operation at the site which would affect ambient vibration levels. In addition, BAC field inspections revealed no sources of appreciable vibration in the immediate project vicinity or any perceptible vibration levels around the site perimeter. Therefore, the existing vibration environment in the immediate project vicinity is considered to be negligible.
Regulatory Setting - Criteria for Acceptable Noise Exposure
As noted previously, the project site where the bottling facility is located is within unincorporated Siskiyou County, as are some of the adjacent sensitive receptors. Because portions of the project site are located adjacent to City of Mount Shasta, some neighboring sensitive receptors are located within the City of Mount Shasta, and not within Siskiyou County. As a result, the noise standards for both the City and County are provided below.
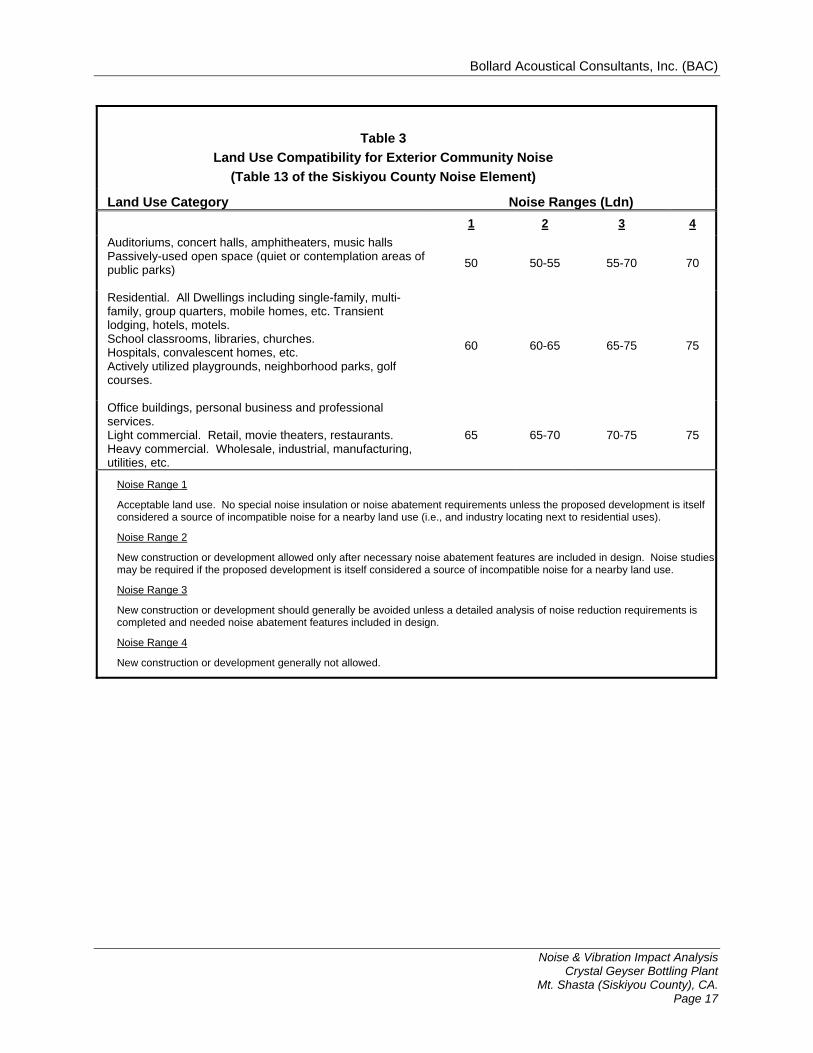
Siskiyou County General Plan
Table 13 of the Siskiyou County General Plan Noise Element contains ranges of acceptable noise levels for a variety of land use types. That table, which is reproduced below as Table 3, identifies acceptable noise environments of 60 dB Ldn for residential land uses (including transient lodging). In addition, the Noise Element also identifies that interior community noise levels (CNEL), with windows closed, attributable to exterior sources, shall not exceed a CNEL of 45 dB in any habitable room.
Table 2 Existing (Baseline) Traffic Noise Levels and Distances to Traffic Noise Contours
Crystal Geyser Bottling Plant – Mt. Shasta, CA
Ldn Contour (feet)
Roadway Segment Distance Ldn1 65 60 55
Mt Shasta Boulevard North of Spring Hill Drive 100 57.2 30 65 140
Mt Shasta Boulevard Spring Hill Drive to Ski Village Drive 160 55.8 39 84 181
Mt Shasta Boulevard Ski Village Drive to Nixon Drive (south) 60 62.2 39 84 180
Mt Shasta Boulevard Nixon Drive (south) to CGWC Drive 360 50.3 37 81 174
Mt Shasta Boulevard South of CGWC Drive 50 63.2 38 82 176
Spring Hill Drive East of Mt Shasta Boulevard 100 50.2 10 22 48
Nixon Road West of Mt Shasta Boulevard 30 55.8 7 16 34
Ski Village Drive Mt Shasta Blvd to Everitt Memorial Hwy 40 57.7 13 28 61
Everitt Memorial Hwy North of Ski Village Drive 85 49.1 7 16 34
Everitt Memorial Hwy South of Ski Village Drive 90 53.4 15 33 70
CGWC Drive East of Mt Shasta Boulevard 400 37.7 6 13 28
Notes: 1 Ldn is computed at the closest sensitive receptors.
Source: FHWA-RD-77-108 with inputs prepared by Abrams Associates.
Bollard Acoustical Consultants, Inc. (BAC)
Noise & Vibration Impact Analysis Crystal Geyser Bottling Plant
Mt. Shasta (Siskiyou County), CA. Page 17
Table 3
Land Use Compatibility for Exterior Community Noise
(Table 13 of the Siskiyou County Noise Element)
Land Use Category Noise Ranges (Ldn)
1 2 3 4
Auditoriums, concert halls, amphitheaters, music halls Passively-used open space (quiet or contemplation areas of public parks)
50 50-55 55-70
70
Residential. All Dwellings including single-family, multi-family, group quarters, mobile homes, etc. Transient lodging, hotels, motels. School classrooms, libraries, churches. Hospitals, convalescent homes, etc. Actively utilized playgrounds, neighborhood parks, golf courses.
60 60-65 65-75 75
Office buildings, personal business and professional services. Light commercial. Retail, movie theaters, restaurants. Heavy commercial. Wholesale, industrial, manufacturing, utilities, etc.
65 65-70 70-75 75
Noise Range 1
Acceptable land use. No special noise insulation or noise abatement requirements unless the proposed development is itself considered a source of incompatible noise for a nearby land use (i.e., and industry locating next to residential uses).
Noise Range 2
New construction or development allowed only after necessary noise abatement features are included in design. Noise studies may be required if the proposed development is itself considered a source of incompatible noise for a nearby land use.
Noise Range 3
New construction or development should generally be avoided unless a detailed analysis of noise reduction requirements is completed and needed noise abatement features included in design.
Noise Range 4
New construction or development generally not allowed.

Bollard Acoustical Consultants, Inc. (BAC)
Noise & Vibration Impact Analysis Crystal Geyser Bottling Plant
Mt. Shasta (Siskiyou County), CA. Page 18
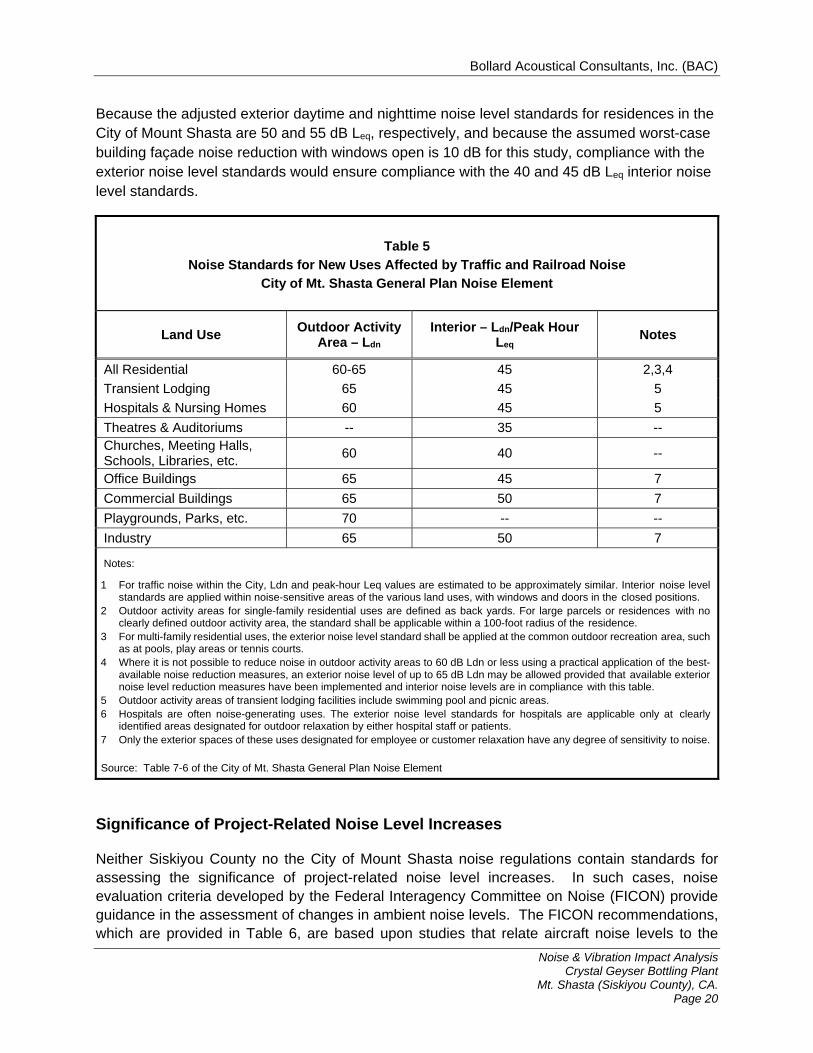
City of Mt. Shasta General Plan Tables 7-5 and 7-6 of the City of Mt. Shasta General Plan Noise Element contain performance standards for non-transportation (on-site noise sources in this case) and transportation (off-site traffic) noise sources, respectively. These tables have been reproduced below as Tables 4 and 5, respectively.
Table 4
Noise Standards for New Uses Affected by Non-Transportation Noise
City of Mt. Shasta General Plan Noise Element
Land Use Outdoor Activity Area - Leq Interior Leq
Day & Night Notes
Daytime Nighttime
All Residential 50 45 35 1,2,7
Transient Lodging 55 -- 40 3
Hospitals & Nursing Homes 50 45 35 4
Theatres & Auditoriums -- -- 35 -- Churches, Meeting Halls, Schools, Libraries, etc.
55 -- 40 --
Office Buildings 55 -- 45 5,6
Commercial Buildings 55 -- 45 5,6
Playgrounds, Parks, etc. 65 65 -- 6
Industry 65 65 50 5
Notes:
1 Outdoor activity areas for single-family residential uses are defined as back yards. For large parcels or residences with no clearly defined outdoor activity area, the standard shall be applicable within a 100 foot radius of the residence.
2 For multi-family residential uses, the exterior noise level standard shall be applied at the common outdoor recreation area, such as at pools, play areas or tennis courts.
3 Outdoor activity areas of transient lodging facilities include swimming pool and picnic areas, and are not commonly used during nighttime hours.
4 Hospitals are often noise-generating uses. The exterior noise level standards for hospitals are applicable only at clearly identified areas designated for outdoor relaxation by either hospital staff or patients.
5 Only the exterior spaces of these uses designated for employee or customer relaxation have any degree of sensitivity to noise.6 The outdoor activity areas of office, commercial and park uses are not typically utilized during nighttime hours. 7 It may not be possible to achieve compliance with this standard at residential uses located immediately adjacent to loading
dock areas of commercial uses while trucks are unloading. The daytime and nighttime noise level standards applicable to loading docks shall be 55 and 50 dB Leq, respectively.
General: The Table 4 standards shall be reduced by 5 dB for sounds consisting primarily of speech or music, and forrecurring impulsive sounds. If the existing ambient noise level exceeds the standards of Table 7-5, then the noise levelstandards shall be increased at 5 dB increments to encompass the ambient. Source: Table 7-5 of the City of Mt. Shasta General Plan Noise Element

Bollard Acoustical Consultants, Inc. (BAC)
Noise & Vibration Impact Analysis Crystal Geyser Bottling Plant
Mt. Shasta (Siskiyou County), CA. Page 19
The general footnote at the bottom of Table 4 states that the noise standards shall be increased in 5 dB increments to encompass the ambient in cases where existing ambient noise levels exceed the Table 4 standards. As noted in Table 1, measured average daytime noise levels ranged from 44 to 49 dB Leq at measurement Sites 1-3, which are below the City of Mount Shasta 50 dB Leq daytime noise level standard. As a result, no adjustment to the daytime noise standard is warranted for the residences represented by those measurement sites. However, the supplemental data collected at Site 4 indicates that daytime ambient noise levels averaged 71 dB. In the absence of railroad activity, the sound level data collected at supplemental noise measurement Site 4 indicates that existing ambient noise levels were approximately 55 dB at the nearest residences to Mount Shasta Boulevard during both daytime and nighttime periods. As a result, adjustment to both the daytime and nighttime noise standards to 55 dB Leq for the residences located immediately adjacent to Mount Shasta Boulevard is required pursuant to City of Mount Shasta Noise Policy. The Table 1 data also indicate that measured nighttime ambient noise levels averaged 51 dB Leq at Sites 1 and 3, which represent sensitive receptors within the City of Mount Shasta which are more removed from Mount Shasta Boulevard. As a result, the nighttime noise level standard is adjusted upwards in 5 dB increments until the ambient is encompassed at the residential receptors represented by those sites. The resulting nighttime noise level threshold is adjusted to 55 dB Leq at the sensitive receptors within the City of Mount Shasta represented by noise monitoring sites 1 and 3. With respect to existing ambient noise levels within the residences located in the immediate project vicinity, the degree of current interior noise exposure depends on the exterior noise exposure and the degree of noise attenuation provided by the existing residential building facades. Building façade noise reduction is dependent on several factors, including the construction materials (wood vs stucco siding, single vs. dual-pane windows, façade orientation relative to the noise source, quality of window and door weather-stripping, etc.). The degree of noise attenuation provided by the building façade will also vary depending on whether windows are in the open or closed positions. Typical building façade noise reduction for residences in fair to good condition is 25 dB (20 dB in poor condition), with windows in the closed position, and approximately 10-15 dB with windows open. The Table 1 data indicate that measured daytime and nighttime ambient noise levels averaged 49 and 51 dB Leq at Sites 1 and 3, which represent sensitive receptors within the City of Mount Shasta. If the building façade noise reduction is very conservatively assumed to be 20 dB with windows closed and 10 dB with windows open for this project, the resulting existing ambient noise levels within residences with windows in the open position would be approximately 39 dB Leq during daytime hour and 41 dB Leq during nighttime hours. Because both daytime and nighttime noise levels within residences would exceed the City’s 35 dB Leq noise standard (conservatively assuming windows open and 10 dB of noise reduction), that standard is adjusted upwards in 5 dB increments until the ambient is encompassed. Therefore, the interior noise level standard applicable to this project would be 40 and 45 dB Leq within residences during day and nighttime periods, respectively.
Bollard Acoustical Consultants, Inc. (BAC)
Noise & Vibration Impact Analysis Crystal Geyser Bottling Plant
Mt. Shasta (Siskiyou County), CA. Page 20
Because the adjusted exterior daytime and nighttime noise level standards for residences in the City of Mount Shasta are 50 and 55 dB Leq, respectively, and because the assumed worst-case building façade noise reduction with windows open is 10 dB for this study, compliance with the exterior noise level standards would ensure compliance with the 40 and 45 dB Leq interior noise level standards.
Table 5
Noise Standards for New Uses Affected by Traffic and Railroad Noise
City of Mt. Shasta General Plan Noise Element
Land Use Outdoor Activity
Area – Ldn Interior – Ldn/Peak Hour
Leq Notes
All Residential 60-65 45 2,3,4
Transient Lodging 65 45 5
Hospitals & Nursing Homes 60 45 5
Theatres & Auditoriums -- 35 -- Churches, Meeting Halls, Schools, Libraries, etc.
60 40 --
Office Buildings 65 45 7
Commercial Buildings 65 50 7
Playgrounds, Parks, etc. 70 -- --
Industry 65 50 7
Notes:
1 For traffic noise within the City, Ldn and peak-hour Leq values are estimated to be approximately similar. Interior noise level standards are applied within noise-sensitive areas of the various land uses, with windows and doors in the closed positions.
2 Outdoor activity areas for single-family residential uses are defined as back yards. For large parcels or residences with no clearly defined outdoor activity area, the standard shall be applicable within a 100-foot radius of the residence.
3 For multi-family residential uses, the exterior noise level standard shall be applied at the common outdoor recreation area, such as at pools, play areas or tennis courts.
4 Where it is not possible to reduce noise in outdoor activity areas to 60 dB Ldn or less using a practical application of the best-available noise reduction measures, an exterior noise level of up to 65 dB Ldn may be allowed provided that available exterior noise level reduction measures have been implemented and interior noise levels are in compliance with this table.
5 Outdoor activity areas of transient lodging facilities include swimming pool and picnic areas. 6 Hospitals are often noise-generating uses. The exterior noise level standards for hospitals are applicable only at clearly
identified areas designated for outdoor relaxation by either hospital staff or patients. 7 Only the exterior spaces of these uses designated for employee or customer relaxation have any degree of sensitivity to noise.
Source: Table 7-6 of the City of Mt. Shasta General Plan Noise Element
Significance of Project-Related Noise Level Increases
Neither Siskiyou County no the City of Mount Shasta noise regulations contain standards for assessing the significance of project-related noise level increases. In such cases, noise evaluation criteria developed by the Federal Interagency Committee on Noise (FICON) provide guidance in the assessment of changes in ambient noise levels. The FICON recommendations, which are provided in Table 6, are based upon studies that relate aircraft noise levels to the

Bollard Acoustical Consultants, Inc. (BAC)
Noise & Vibration Impact Analysis Crystal Geyser Bottling Plant
Mt. Shasta (Siskiyou County), CA. Page 21
percentage of persons highly annoyed by noise. Although the FICON recommendations were specifically developed to assess aircraft noise impacts, these criteria have been applied to other sources of noise similarly described in terms of cumulative noise exposure metrics such as the Ldn. For this project,
Table 6 Significance of Changes in Cumulative Noise Exposure
Ambient Noise Level Without Project (Ldn) Increase Required for Significant Impact
<60 dB +5.0 dB or more
60-65 dB +3.0 dB or more
>65 dB +1.5 dB or more
Source: Federal Interagency Committee on Noise (FICON )
According to Table 6, an increase in noise from similar sources of 5 dB or more would be noticeable where the ambient level without the project is less than 60 dB. Where the ambient level is between 60 and 65 dB, an increase in noise of 3 dB or more would be noticeable, and an increase of 1.5 dB or more would be noticeable where the ambient noise level exceeds 65 dB Ldn. The rationale for the Table 6 criteria is that, as ambient noise levels increase, a smaller increase in noise resulting from a project is sufficient to cause annoyance. Conversely, in lower ambient noise environments (i.e. below 60 dB Ldn), a greater increase in noise levels was found to be tolerated before persons became annoyed.
Vibration Criteria
Neither Siskiyou County nor the City of Mount Shasta have adopted vibration standards. As a result, Caltrans-recommended criteria are applied for this project, as described below. Human and structural response to different vibration levels is influenced by a number of factors, including ground type, distance between source and receptor, duration, and the number of perceived vibration events. The Caltrans publication, Transportation-and Construction-Induced Vibration Guidance Manual, written for Caltrans by Jones & Stokes in June 2004, provides guidelines for acceptable vibration limits for transportation and construction projects in terms of the induced peak particle velocity (PPV). Those standards are reproduced below in Table 7.

Bollard Acoustical Consultants, Inc. (BAC)
Noise & Vibration Impact Analysis Crystal Geyser Bottling Plant
Mt. Shasta (Siskiyou County), CA. Page 22
Table 7
Vibration Criteria for Structures
Structure and Condition
Maximum PPV (in/sec)
Transient Sources1 Continuous or Frequent
Intermittent Sources2 Extremely fragile historic buildings, ruins, ancient monuments 0.12 0.08 Fragile buildings 0.20 0.10 Historic and some old building 0.50 0.25 Older residential structures 0.50 0.30 New residential structures 1.00 0.50 Modern industrial/commercial building 2.00 0.50
Notes: 1. Transient sources create a single isolated vibration event. 2. Continuous/frequent intermittent sources include repetitive single events.
Current Caltrans research illustrates that there are different thresholds of perception for different types of vibration sources. Section XI(b) of Appendix G of the CEQA guidelines requires that a project result in exposure of persons to, or generation of, excessive groundborne vibration levels or groundborne noise levels, for the finding of a significant impact. The CEQA guidelines specifically mention “excessive” vibration, rather than just perceptible vibration. Because the general range at which vibration becomes distinctly to strongly perceptible ranges from 0.1 – 0.50 in/sec ppv (Caltrans 2004), project-generated vibration levels exceeding 0.1 inches/second PPV at the nearest residences are considered significant for this study.
Impacts and Mitigation Measures
Standards of Significance Applied to this Project
Appendix G of the State CEQA Guidelines provides that the proposed project would result in a significant noise impact if the following occur:
A. exposure of persons to or generation of noise levels in excess of standards established in the local general plan or noise ordinance, or applicable standards of other agencies; For residences located within Siskiyou County, exterior and interior noise level standards of 60 dB and 45 dB Ldn are applied for both transportation and non-transportation noise sources. For residences located within the City of Mount Shasta affected primarily by on-site operations (i.e. non-transportation noise sources), the noise level standards of Table 3 are applied after adjusting for ambient conditions. Specifically, the daytime and adjusted nighttime exterior noise level standards applicable to this project are 50 dB Leq and 55 dB Leq, respectively, at outdoor areas. In addition, the interior

Bollard Acoustical Consultants, Inc. (BAC)
Noise & Vibration Impact Analysis Crystal Geyser Bottling Plant
Mt. Shasta (Siskiyou County), CA. Page 23
noise level standard would be 40 and 45 dB Leq during daytime and nighttime hours, respectively, after adjusting for measured exterior ambient conditions and very conservatively assuming 10 dB of building façade noise reduction with windows in the open position. For transportation noise sources, the City’s 60 dB Ldn exterior noise level standard is applied to sensitive uses, as shown in Table 4.
B. a substantial permanent increase in ambient noise levels in the project vicinity
above levels existing without the project; As noted in Table 6, a substantial increase in noise levels is identified as being 5 dB Ldn for residences located in Siskiyou County based on the measured ambient noise level of 55 dB Ldn at measurement Sites 2 and 5. For residences within the City of Mount Shasta, a substantial increase in noise levels is identified as being 3 dB Ldn based on the measured ambient noise levels of 60 - 61 dB Ldn at measurement Sites 1 and 3. This test of significance would apply to increases in non-transportation noise due to on-site project activity. Off-Site increases in traffic noise levels due to project traffic on the local roadway network would be subject to the Table 6 thresholds.
C. a substantial temporary or periodic increase in ambient noise levels in the project
vicinity above levels existing without the project; As noted in Table 6, a substantial increase in noise levels is identified as being 5 dB Ldn for residences located in Siskiyou County based on the measured ambient noise level of 55 dB Ldn at measurement Site 2. For residences within the City of Mount Shasta, a substantial increase in noise levels is identified as being 3 dB Ldn based on the measured ambient noise levels of 60 - 61 dB Ldn at measurement Sites 1 and 3. This test of significance would apply to increases in non-transportation noise due to on-site project activity. Off-Site increases in traffic noise levels due to project traffic on the local roadway network would be subject to the Table 6 thresholds.
D. exposure of persons to or generation of excessive groundborne vibration or noise
levels; Vibration levels exceeding 0.1 inches/second, which is widely considered to be the threshold of perception, are considered significant in this analysis.
E. for a project located within an ALUP or, where such a plan has not been adopted,
within 2 miles of a public airport or public use airport, the project would expose people residing or working in the project area to excessive noise levels;
Because the project site is located in excess of 12 miles from the nearest airport (Weed Airport), this criteria would not apply.
Bollard Acoustical Consultants, Inc. (BAC)
Noise & Vibration Impact Analysis Crystal Geyser Bottling Plant
Mt. Shasta (Siskiyou County), CA. Page 24
F. or a project within the vicinity of a private airstrip, the project would expose people residing or working in the project area to excessive noise levels. Because the project site is located in excess of 12 miles from the nearest airport (Weed Airport), this criteria would not apply.
Identification of Sensitive Receptors
Existing land uses in the project vicinity include a mix of residential and industrial uses. The nearest noise-sensitive receptors to the project site are identified on Figure 1. Fifteen (15) of the nearest representative noise-sensitive receptors to the project site are identified on Figure 1. With the exception of Receptor 10, which is a church, the identified receptors are all residences. It is recognized that there are more than 15 sensitive receptors in the general project vicinity. However, because the receptors evaluated in this analysis represent the closest sensitive uses to the project site, (representative of a “worst-case scenario”), and because sound decreases with distance, analysis of noise impacts at more distant receptors was not warranted. In other words, satisfaction of the applicable noise criteria at the nearest receptors would ensure satisfaction of the noise criteria at the more distant receptors. The focus of this analysis is the identification of potential noise impacts at the nearest noise-sensitive receptors to the project site, as neighboring industrial land uses are not-considered noise-sensitive.
Major Noise and Vibration Sources Evaluated in this Study
As noted previously, the project proposes the implementation of utility modifications, the construction of a permanent on-site residence, and the operation of bottling facility. The major noise-producing components of this project which are evaluated below consist of the following:
1. Traffic noise increases at existing noise-sensitive receptors located in the general project vicinity caused by the additional off-site project traffic, including heavy truck traffic.
2. Noise generated from on-site noise sources associated with the project. Specific on-site noise sources evaluated in this assessment include ground level and rooftop mechanical equipment, including the wastewater treatment facility, and on-site truck circulation.
3. Noise and vibration generated by project construction activities.
4. Vibration generated by on-going operations.

Bollard Acoustical Consultants, Inc. (BAC)
Noise & Vibration Impact Analysis Crystal Geyser Bottling Plant
Mt. Shasta (Siskiyou County), CA. Page 25
Impact 1: Off-Site Traffic Noise Impacts
Increases in Off-Site Traffic Noise Levels Resulting from the Project
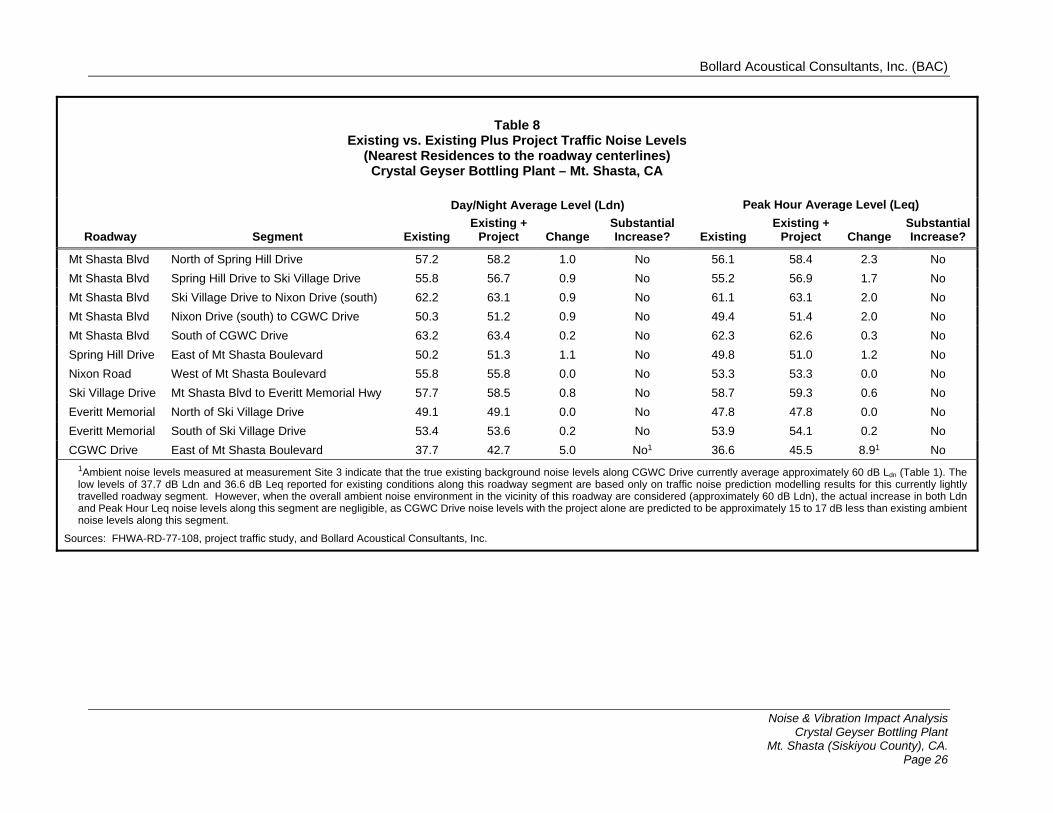
To assess noise impacts due to project-related traffic increases on the local roadway network, traffic noise levels were predicted at the closest sensitive receptors located along each roadway segment for the existing, existing plus project, cumulative, and cumulative plus project scenarios. The traffic noise levels were predicted using the same modeling methodology used for the existing scenario described in the Environmental Setting section above. Results of the traffic noise analyses are summarized in Tables 8 and 9 for baseline and future (cumulative) conditions, respectively. Appendix D contains the FHWA Model input data for all scenarios.
Some noise sensitive receptors located along the project-area roadways are currently exposed to exterior traffic noise levels exceeding the Siskiyou County and City of Mt. Shasta 60-65 dB Ldn exterior noise level standard for sensitive uses, as shown in Table 8 and Table 9. As shown by Table 8 and Table 9, these receptors will continue to experience elevated exterior noise levels with implementation of the proposed project. In no case is the proposed project predicted to cause new exceedances of the Siskiyou County or City of Mt. Shasta 60-65 dB Ldn noise level standard. Additionally, the proposed project’s contribution to traffic noise level increases is not predicted to exceed the FICON substantial increase criteria, as outlined in Table 6.
Bollard Acoustical Consultants, Inc. (BAC)
Noise & Vibration Impact Analysis Crystal Geyser Bottling Plant
Mt. Shasta (Siskiyou County), CA. Page 26
Table 8
Existing vs. Existing Plus Project Traffic Noise Levels
(Nearest Residences to the roadway centerlines) Crystal Geyser Bottling Plant – Mt. Shasta, CA
Day/Night Average Level (Ldn) Peak Hour Average Level (Leq)
Roadway Segment Existing Existing +
Project Change Substantial Increase? Existing
Existing + Project Change
Substantial Increase?
Mt Shasta Blvd North of Spring Hill Drive 57.2 58.2 1.0 No 56.1 58.4 2.3 No
Mt Shasta Blvd Spring Hill Drive to Ski Village Drive 55.8 56.7 0.9 No 55.2 56.9 1.7 No
Mt Shasta Blvd Ski Village Drive to Nixon Drive (south) 62.2 63.1 0.9 No 61.1 63.1 2.0 No
Mt Shasta Blvd Nixon Drive (south) to CGWC Drive 50.3 51.2 0.9 No 49.4 51.4 2.0 No
Mt Shasta Blvd South of CGWC Drive 63.2 63.4 0.2 No 62.3 62.6 0.3 No
Spring Hill Drive East of Mt Shasta Boulevard 50.2 51.3 1.1 No 49.8 51.0 1.2 No
Nixon Road West of Mt Shasta Boulevard 55.8 55.8 0.0 No 53.3 53.3 0.0 No
Ski Village Drive Mt Shasta Blvd to Everitt Memorial Hwy 57.7 58.5 0.8 No 58.7 59.3 0.6 No
Everitt Memorial North of Ski Village Drive 49.1 49.1 0.0 No 47.8 47.8 0.0 No
Everitt Memorial South of Ski Village Drive 53.4 53.6 0.2 No 53.9 54.1 0.2 No
CGWC Drive East of Mt Shasta Boulevard 37.7 42.7 5.0 No1 36.6 45.5 8.91 No
1Ambient noise levels measured at measurement Site 3 indicate that the true existing background noise levels along CGWC Drive currently average approximately 60 dB Ldn (Table 1). The low levels of 37.7 dB Ldn and 36.6 dB Leq reported for existing conditions along this roadway segment are based only on traffic noise prediction modelling results for this currently lightly travelled roadway segment. However, when the overall ambient noise environment in the vicinity of this roadway are considered (approximately 60 dB Ldn), the actual increase in both Ldn and Peak Hour Leq noise levels along this segment are negligible, as CGWC Drive noise levels with the project alone are predicted to be approximately 15 to 17 dB less than existing ambient noise levels along this segment.
Sources: FHWA-RD-77-108, project traffic study, and Bollard Acoustical Consultants, Inc.

Bollard Acoustical Consultants, Inc. (BAC)
Noise & Vibration Impact Analysis Crystal Geyser Bottling Plant
Mt. Shasta (Siskiyou County), CA. Page 27
Table 9
Cumulative vs. Cumulative Plus Project Traffic Noise Levels
(Nearest Residences to the roadway centerlines) Crystal Geyser Bottling Plant – Mt. Shasta, CA
Day/Night Average Level (Ldn) Peak Hour Average Level (Leq)
Roadway Segment Cumulative Cumulative
+ Project Change Substantial Increase? Cumulative
Cumulative + Project Change
Substantial Increase?
Mt Shasta Blvd North of Spring Hill Drive 57.7 58.6 0.9 No 56.6 58.7 2.1 No
Mt Shasta Blvd Spring Hill Drive to Ski Village Drive 56.3 57.1 0.8 No 55.7 57.3 1.6 No
Mt Shasta Blvd Ski Village Drive to Nixon Drive (south) 62.7 63.5 0.8 No 61.6 63.4 1.8 No
Mt Shasta Blvd Nixon Drive (south) to CGWC Drive 50.8 51.6 0.8 No 49.9 51.7 1.8 No
Mt Shasta Blvd South of CGWC Drive 63.7 63.9 0.2 No 62.9 63.1 0.2 No
Spring Hill Drive East of Mt Shasta Boulevard 50.8 51.8 1.0 No 50.4 51.5 1.1 No
Nixon Road West of Mt Shasta Boulevard 56.3 56.3 0.0 No 53.8 53.8 0.0 No
Ski Village Drive Mt Shasta Blvd to Everitt Memorial Hwy 58.2 58.9 0.7 No 59.2 59.7 0.5 No
Everitt Memorial North of Ski Village Drive 49.6 49.6 0.0 No 48.4 48.4 0.0 No
Everitt Memorial South of Ski Village Drive 53.9 54.1 0.2 No 54.4 54.6 0.2 No
CGWC Drive East of Mt Shasta Boulevard 38.2 42.8 4.6 No1 37.2 45.6 8.41 No
1Ambient noise levels measured at measurement Site 3 indicate that the true existing background noise levels along CGWC Drive currently average approximately 60 dB Ldn (Table 1), and cumulative no-project ambient noise conditions would be at or above these levels. The low levels of 38.2 dB Ldn and 37.2 dB Leq reported for cumulative no-project conditions along this roadway segment are based only on traffic noise prediction modelling results for this lightly travelled roadway segment. However, when the overall ambient noise environment in the vicinity of this roadway is considered (approximately 60 dB Ldn), the actual increases in both Ldn and Peak Hour Leq noise levels along this segment are negligible, as CGWC Drive noise levels with the project alone are predicted to be approximately 14 to 17 dB less than existing ambient noise levels along this segment.
Sources: FHWA-RD-77-108, project traffic study, and Bollard Acoustical Consultants, Inc.
Bollard Acoustical Consultants, Inc. (BAC)
Noise & Vibration Impact Analysis Crystal Geyser Bottling Plant
Mt. Shasta (Siskiyou County), CA. Page 28
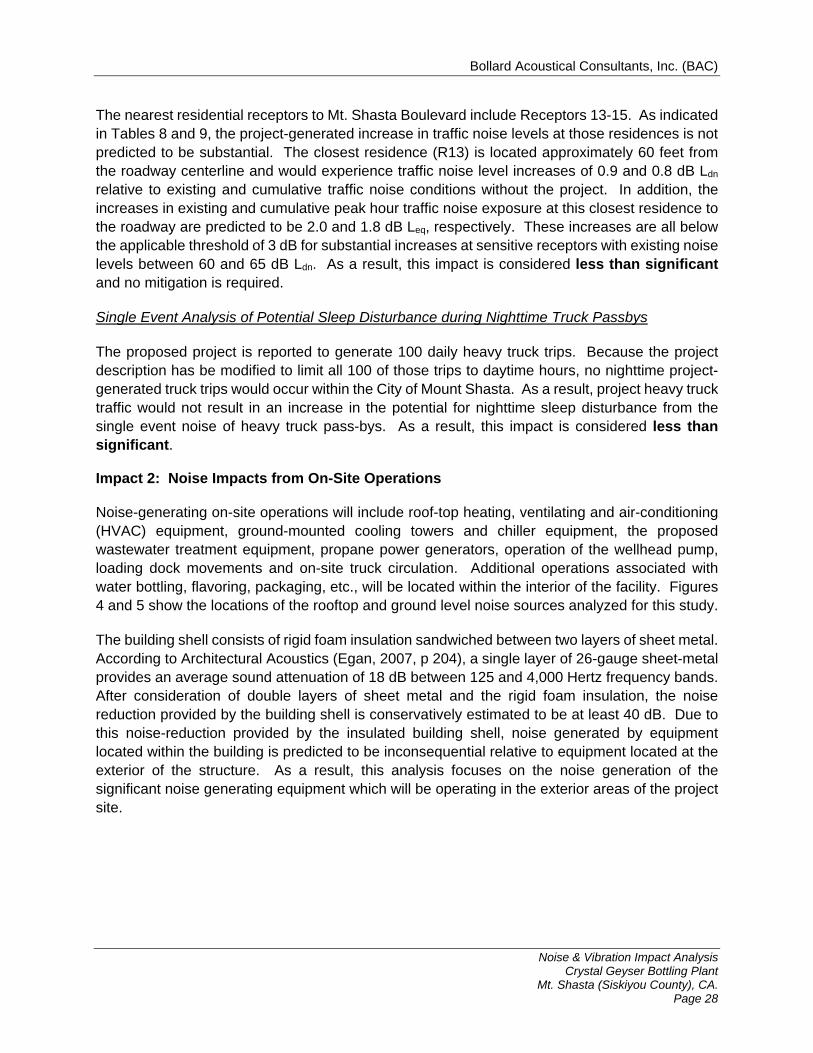
The nearest residential receptors to Mt. Shasta Boulevard include Receptors 13-15. As indicated in Tables 8 and 9, the project-generated increase in traffic noise levels at those residences is not predicted to be substantial. The closest residence (R13) is located approximately 60 feet from the roadway centerline and would experience traffic noise level increases of 0.9 and 0.8 dB Ldn relative to existing and cumulative traffic noise conditions without the project. In addition, the increases in existing and cumulative peak hour traffic noise exposure at this closest residence to the roadway are predicted to be 2.0 and 1.8 dB Leq, respectively. These increases are all below the applicable threshold of 3 dB for substantial increases at sensitive receptors with existing noise levels between 60 and 65 dB Ldn. As a result, this impact is considered less than significant and no mitigation is required.
Single Event Analysis of Potential Sleep Disturbance during Nighttime Truck Passbys
The proposed project is reported to generate 100 daily heavy truck trips. Because the project description has be modified to limit all 100 of those trips to daytime hours, no nighttime project-generated truck trips would occur within the City of Mount Shasta. As a result, project heavy truck traffic would not result in an increase in the potential for nighttime sleep disturbance from the single event noise of heavy truck pass-bys. As a result, this impact is considered less than significant.
Impact 2: Noise Impacts from On-Site Operations
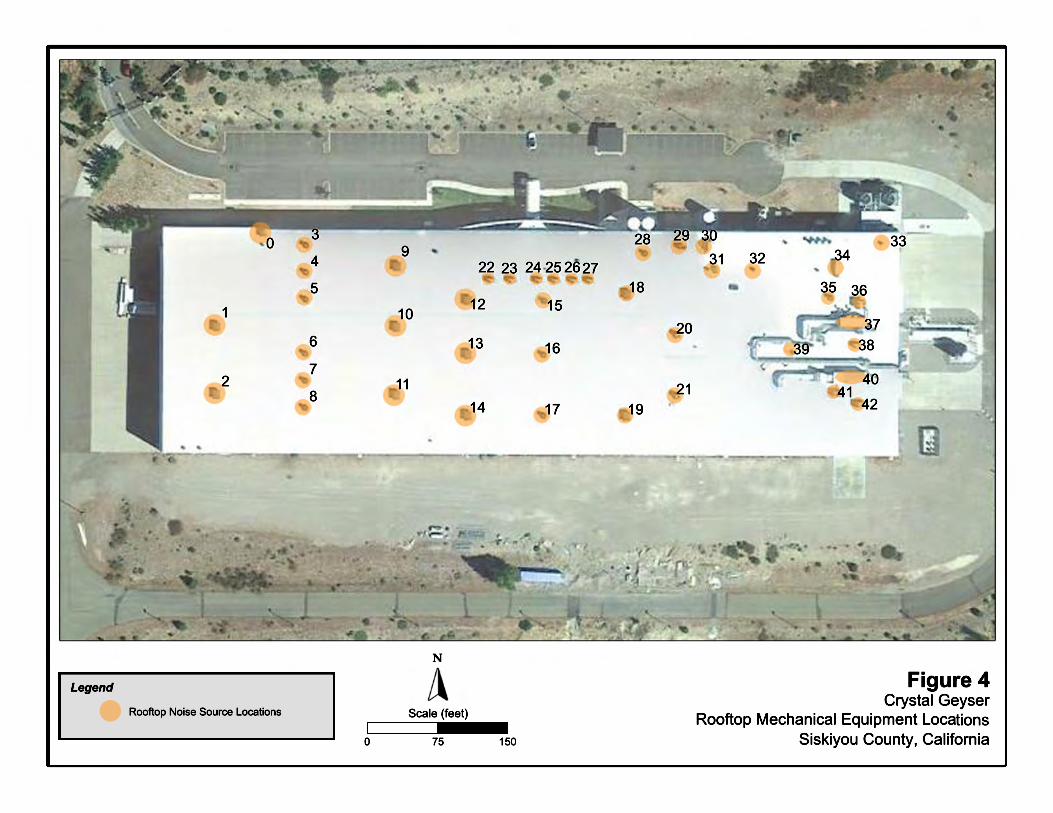
Noise-generating on-site operations will include roof-top heating, ventilating and air-conditioning (HVAC) equipment, ground-mounted cooling towers and chiller equipment, the proposed wastewater treatment equipment, propane power generators, operation of the wellhead pump, loading dock movements and on-site truck circulation. Additional operations associated with water bottling, flavoring, packaging, etc., will be located within the interior of the facility. Figures 4 and 5 show the locations of the rooftop and ground level noise sources analyzed for this study.
The building shell consists of rigid foam insulation sandwiched between two layers of sheet metal. According to Architectural Acoustics (Egan, 2007, p 204), a single layer of 26-gauge sheet-metal provides an average sound attenuation of 18 dB between 125 and 4,000 Hertz frequency bands. After consideration of double layers of sheet metal and the rigid foam insulation, the noise reduction provided by the building shell is conservatively estimated to be at least 40 dB. Due to this noise-reduction provided by the insulated building shell, noise generated by equipment located within the building is predicted to be inconsequential relative to equipment located at the exterior of the structure. As a result, this analysis focuses on the noise generation of the significant noise generating equipment which will be operating in the exterior areas of the project site.


Bollard Acoustical Consultants, Inc. (BAC)
Noise & Vibration Impact Analysis Crystal Geyser Bottling Plant
Mt. Shasta (Siskiyou County), CA. Page 31
Comments on the DEIR noted that louvered openings were observed in the bottling plant building which could present an acoustic leak resulting in higher noise levels in the community. A building inspection conducted on June 22, 2017 indicated that the louvered openings on the north and east sides of the building are acoustic louvers, designed to attenuate sound while permitting airflow. These acoustic louvers would not compromise the acoustic integrity of the building shell.
To quantify the noise generation of the on-site mechanical equipment for the DEIR analysis, BAC utilized reference sound power levels provided for the various equipment types and the locations of that equipment as illustrated on Figure 2. Based on DEIR comments pertaining to the adequacy of that reference noise source information, BAC staff returned to the project site on June 22, 2017 and completed an extensive noise survey of each of the most significant ground level and rooftop noise sources. The updated reference sound pressure levels collected during that testing is provided in Appendix E. The locations of the most significant ground-level and rooftop equipment are shown in Figures 4 and 5, respectively. The distances between each equipment noise source identified on Figures 4 and 5 are provided in Appendix F.
The existing building shell and intervening topography provides partial to complete shielding of some of the project noise sources in the direction of some of the nearby sensitive receptors analyzed in this evaluation. To account for this shielding, conservative offsets were developed using google earth elevation data and line-of-sight evaluation tools. In cases where intervening topography or structures would intercept line of sight between the noise source and receptor, a -5 dB shielding offset was applied to the propagation of sound from that source. Where the sensitive receptor would be located on the opposite side of the 30 foot tall bottling building, a -15 dB offset was applied to account for shielding. For cases in between these two conditions where substantial shielding would occur, a -10 dB offset was applied. The shielding offsets applied to each noise source and sensitive receptor are provided in Appendix G.
The sound pressure levels for all on-site equipment and processes were radiated to the 15 representative sensitive receptor locations identified on Figure 1 assuming a 6 dBA decrease in sound levels for each doubling of distance from the noise source, standard corrections for atmospheric absorption, and the shielding offsets provided in Appendix G.
Because the on-site mechanical equipment generates steady-state noise levels, noise impacts associated with this equipment are evaluated relative to day/night average (Ldn) criteria for receptors located in Siskiyou County, and relative to hourly average noise level (Leq) criteria for receptors located in the City of Mount Shasta. To compute Ldn values, it was conservatively assumed that all on-site mechanical equipment would be in operation for the entire 24-hour period of a day.
The primary noise sources associated with on-site circulation of heavy trucks, including loading dock area turning movement, are the slow moving semi-trailer trucks approaching, stopping (air brakes), backing into the loading docks (back-up alarms), and pulling out of the loading docks and departing the site once loaded. Once the trucks have backed into the loading dock, the engines will be shut off and they will be loaded/unloaded from the inside of the facility using a fork

Bollard Acoustical Consultants, Inc. (BAC)
Noise & Vibration Impact Analysis Crystal Geyser Bottling Plant
Mt. Shasta (Siskiyou County), CA. Page 32
lift or hand cart. As a result, the majority of the noise is contained within the building and truck trailer. To quantify the noise generation of individual passages of slower moving heavy trucks on the on-site access road, BAC utilized heavy truck single-event noise monitoring data collected for the Teichert Boca aggregate quarry in May of 2013. The measurements were conducted to specifically quantify single-event noise levels generated by individual truck passbys under very controlled circumstances.
Larson Davis Laboratories Model 820 and 824 sound level meters were used for the single-event truck passby noise surveys. The meters were calibrated before use to ensure the accuracy of the measurements, and fitted with manufacturer’s windscreens. The microphones were located on tripods at a height of 5 feet above ground. Weather conditions were typical for the period, consisting of cool morning temperatures, moderate relative humidity, light (<5mph) winds, and clear skies.
A 1990 Kenworth T800 with a Cummins 88NT350 Diesel engine with an 18-speed gear box was used for the heavy truck passby tests. The truck was fully loaded with aggregate materials at the beginning of the passby testing program. This condition is believed to be comparable to a fully loaded truck departing the Crystal Geyser site. After multiple uphill and downhill passbys of the fully loaded aggregate truck, the truck’s load was dumped and the testing program was repeated with the empty trailer (comparable to trucks arriving Crystal Geyser empty). The driver was instructed to operate the truck normally during the passby tests. According to the driver, 8th gear was used on the uphill sections at 1700 rpm. On the downhill passbys, gears 7-8 were used at engine rpm ranging from 1800-1900.
Each heavy truck passby was monitored for the duration of time the truck was audible, including approach, passby, and departure. During the truck passby tests, speed surveys were conducted using a Bushnell radar Velocity Speed gun (Model # CBV00 - See Figure 12). The speed surveys indicated that downhill speeds slowed from 30 mph on approach to 20 mph on the downhill (southbound) slope in front of the noise monitoring site for both loaded and empty truck passbys. Uphill speeds ranged from 15-20 mph in the uphill (northbound) direction.
A total of 10 uphill and 10 downhill passbys were monitored. Half of the passbys occurred with the trailer loaded and the other half empty. In addition, the driver was instructed to utilize engine brakes (Jake Brakes) for the first three downhill passbys.
During the single-event passby noise monitoring test, minimum (Lmin) noise levels at the test location were recorded to be 42 dB, and background (L90) values were recorded to be 45-46 dB. Because test results indicate that maximum noise levels generated during the aggregate truck passbys were in excess of 20 dB above background noise levels, there was no contamination of the heavy truck passby test results by other noise sources and measured single-event levels captured the entire passby.
The passby test results indicate that the passby noise levels were higher for the loaded truck than for the empty trucks. In addition, passby levels were only marginally louder when Jake brakes

Bollard Acoustical Consultants, Inc. (BAC)
Noise & Vibration Impact Analysis Crystal Geyser Bottling Plant
Mt. Shasta (Siskiyou County), CA. Page 33
were used to slow the truck. Because heavy truck passbys will consist of a combination of uphill and downhill, loaded and empty trucks with the potential for some Jake brake usage, the average measured sound exposure level of 74 dB SEL at the 85 foot measurement location is considered to be representative of typical passby noise levels for Crystal Geyser heavy trucks. This data is included with the reference sound pressure level data contained in Appendix E of this report.
For the assessment of loading dock noise generation, heavy truck noise level data collected at the West El Camino Truck Stop in Sacramento California and at various commercial loading docks in the Sacramento region were used. From that data, it was determined that the sound exposure level (SEL) due to a heavy semi-trailer truck operation similar to what will occur at the project site, (including arriving, backing into loading docks, backup beepers, etc.) is approximately 83 dB at a distance of 50 feet. The maximum noise level for the same truck passage is 75 dB Lmax. It should be noted that Lmax values for truck passbys will always be lower than SEL values because the SEL value is computed as the entire sound energy of the passby event compressed into a one-second duration (to allow normalization of the duration of the pass-by event), whereas the maximum value (Lmax) is the highest noise level at a discrete point in time. For on-site circulation on the project access road (passbys), the mean SEL of 83 dB at the measurement distance of 50 feet from the truck passby route was used to compute hourly average sound levels. These reference hourly Leq values computed from these SEL data are provided in Appendix E. Based on the project traffic study, the project is predicted to generate 50 heavy truck loads per day (100 trips). According to the revised project description, all on-site truck arrivals and departures will occur during daytime hours. The trucks would access the project site via the southwest entrance from Mount Shasta Boulevard and head north along the access road until arriving at loading dock area on the west side of the project building. Project heavy trucks would depart the site using the same roadways. For this analysis, it was conservatively assumed that busy operations could consist of up to 15 truck arrivals or departures in an hour. No nighttime deliveries at the loading dock would occur under the revised project description. Noise generated by the operations within the pH neutralization building (air compressors), is expected to be contained within the various project structures and inconsequential relative to the outside noise sources. In addition, because the DEX-6 wellhead pump is located within a concrete enclosure in excess of 1,000 feet from the nearest residence, no exceedance of the project standards of significance is anticipated for that source. Using the reference sound levels and formula provided in Appendix E, the predicted on-site noise source exposure at the nearest residences was computed assuming industry standard sound level decay rates and standard values for atmospheric absorption of sound in air. Shielding offsets were applied as identified in Appendix E. Table 10 shows the predicted noise levels from all on-site operations occurring concurrently at the nearest potentially affected noise sensitive receptors to the project site. Table 10 also shows existing ambient conditions, the applicable noise standards, and the increases in ambient noise levels which could result from the project.
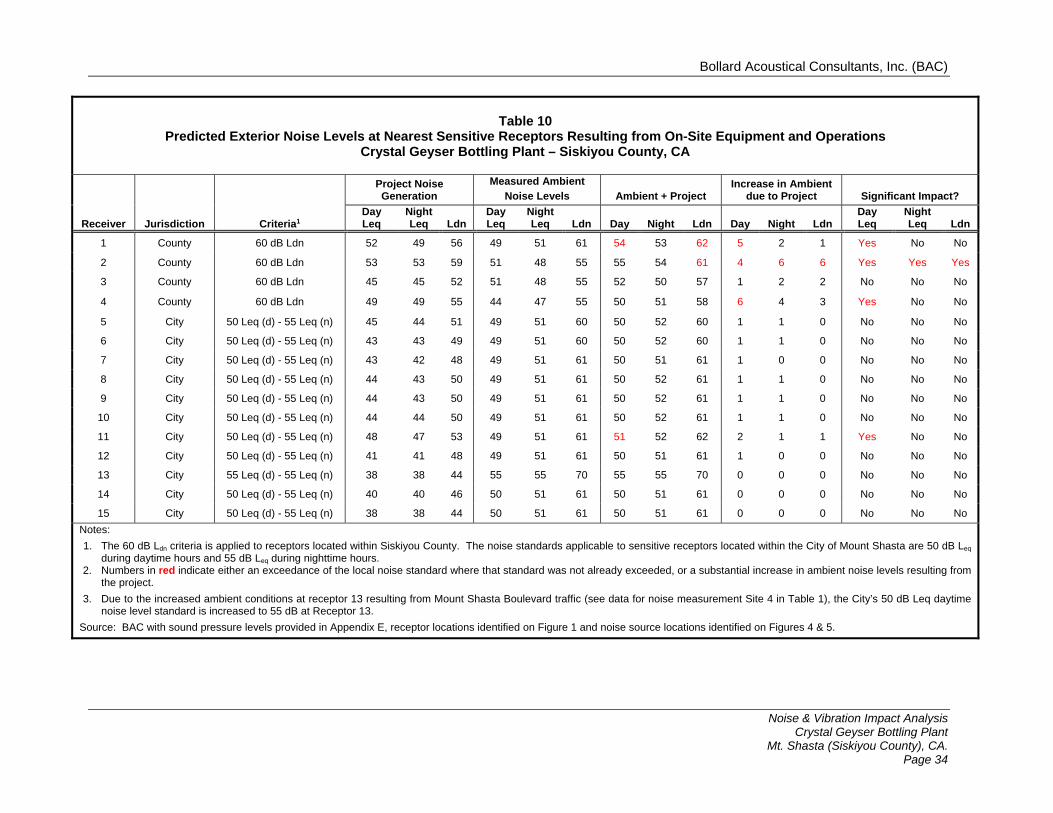
Bollard Acoustical Consultants, Inc. (BAC)
Noise & Vibration Impact Analysis Crystal Geyser Bottling Plant
Mt. Shasta (Siskiyou County), CA. Page 34
Table 10
Predicted Exterior Noise Levels at Nearest Sensitive Receptors Resulting from On-Site Equipment and Operations Crystal Geyser Bottling Plant – Siskiyou County, CA
Project Noise Generation
Measured Ambient
Noise Levels Ambient + Project Increase in Ambient
due to Project Significant Impact?
Receiver Jurisdiction Criteria1 Day Leq
Night Leq Ldn
Day Leq
Night Leq Ldn Day Night Ldn Day Night Ldn
Day Leq
Night Leq Ldn
1 County 60 dB Ldn 52 49 56 49 51 61 54 53 62 5 2 1 Yes No No
2 County 60 dB Ldn 53 53 59 51 48 55 55 54 61 4 6 6 Yes Yes Yes
3 County 60 dB Ldn 45 45 52 51 48 55 52 50 57 1 2 2 No No No
4 County 60 dB Ldn 49 49 55 44 47 55 50 51 58 6 4 3 Yes No No
5 City 50 Leq (d) - 55 Leq (n) 45 44 51 49 51 60 50 52 60 1 1 0 No No No
6 City 50 Leq (d) - 55 Leq (n) 43 43 49 49 51 60 50 52 60 1 1 0 No No No
7 City 50 Leq (d) - 55 Leq (n) 43 42 48 49 51 61 50 51 61 1 0 0 No No No
8 City 50 Leq (d) - 55 Leq (n) 44 43 50 49 51 61 50 52 61 1 1 0 No No No
9 City 50 Leq (d) - 55 Leq (n) 44 43 50 49 51 61 50 52 61 1 1 0 No No No
10 City 50 Leq (d) - 55 Leq (n) 44 44 50 49 51 61 50 52 61 1 1 0 No No No
11 City 50 Leq (d) - 55 Leq (n) 48 47 53 49 51 61 51 52 62 2 1 1 Yes No No
12 City 50 Leq (d) - 55 Leq (n) 41 41 48 49 51 61 50 51 61 1 0 0 No No No
13 City 55 Leq (d) - 55 Leq (n) 38 38 44 55 55 70 55 55 70 0 0 0 No No No
14 City 50 Leq (d) - 55 Leq (n) 40 40 46 50 51 61 50 51 61 0 0 0 No No No
15 City 50 Leq (d) - 55 Leq (n) 38 38 44 50 51 61 50 51 61 0 0 0 No No No
Notes:
1. The 60 dB Ldn criteria is applied to receptors located within Siskiyou County. The noise standards applicable to sensitive receptors located within the City of Mount Shasta are 50 dB Leq during daytime hours and 55 dB Leq during nighttime hours.
2. Numbers in red indicate either an exceedance of the local noise standard where that standard was not already exceeded, or a substantial increase in ambient noise levels resulting from the project.
3. Due to the increased ambient conditions at receptor 13 resulting from Mount Shasta Boulevard traffic (see data for noise measurement Site 4 in Table 1), the City’s 50 dB Leq daytime noise level standard is increased to 55 dB at Receptor 13.
Source: BAC with sound pressure levels provided in Appendix E, receptor locations identified on Figure 1 and noise source locations identified on Figures 4 & 5.

Bollard Acoustical Consultants, Inc. (BAC)
Noise Impact Analysis Crystal Geyser Bottling Plant
Mt. Shasta (Siskiyou County), CA. Page 35
The Table 10 data indicate that noise generated by the proposed project would either cause the applicable noise level standard to be exceeded (where it is not already exceeded), or cause a substantial increase in ambient noise levels, at four (4) of the fifteen (15) nearest noise-sensitive receptors. The specific receptors which would be impacted by the project are identified as Receptors R1, R2, R4, and R11. Those receptor locations are shown on Figure 1.
The potentially significant noise impacts identified at these four receptors are due to the noise generation of the rooftop exhaust vent fans being louder than anticipated, due to the unsilenced exhaust vent openings associated with the blow molder chiller on the east side of the building, and due to the decrease in shielding of the propane generators at their relocated position. No noise impacts were identified due to operation of other rooftop mechanical equipment, or other ground level mechanical equipment, or on-site truck circulation. Nonetheless, because combined noise levels from on-site sources could exceed the project standards of significance at four nearby sensitive receptors, this impact is considered significant.
As noted in the project standards of significance section, satisfaction with the project’s exterior noise level standards of significance would ensure satisfaction with the applicable interior noise level standards. As a result, exterior noise reduction provided by the following mitigation options would provide a similar benefit to interior spaces of the affected residences.
Mitigation for Impact 2:
Although the 1-4 dB exceedances of the project’s standards of significance are relatively minor, a 5 dB decrease in rooftop exhaust vent fan noise levels and a 10 dB decrease in sound output from the blow molder chiller exhaust vents would be required to ensure that project plus ambient conditions do not exceed the applicable noise standards of significance. The following noise mitigation options should be employed to reduce overall project noise generation to a state of compliance with the project standards of significance:
MM 2A: Replacement of Existing Rooftop Exhaust Vent Fans with Quieter Models. Noise level data collected by BAC staff on the roof of the CG facility indicate that the existing exhaust vent fans generate 53 dBA at a distance of 100 feet. Replacing the 15 existing rooftop exhaust vent fans with models generating a sound level of 48 dBA at a reference distance of 100 feet would reduce the noise impact associated with these fans to a level of insignificance.
OR
MM 2B: Construction of Localized Noise Barrier around Exhaust Vent Fans. The existing exhaust vent fans located on the rooftop of the bottling building could be screened from view of the nearest receptors through the use of localized noise barriers around each of the 15 exhaust vent fans. A noise barrier provides approximately 5 dB of attenuation once it intercepts line of sight between the noise source and receiver. Therefore, provided the exhaust vent fans are shielded from view of Receptors 1, 2, 4 and 11 by

Bollard Acoustical Consultants, Inc. (BAC)
Noise Impact Analysis Crystal Geyser Bottling Plant
Mt. Shasta (Siskiyou County), CA. Page 36
localized noise barriers, noise generated by these fans would be reduced to less than significant levels at those receivers. To provide access to the fans for routine maintenance or replacement, the barriers could be constructed of pre-fabricated galvanized metal panels which could be temporarily removed as needed. Aside from being removable, an advantage of such barriers is they can also provide sound absorption on the interior side of the barrier, while providing sound transmission loss on the exterior side. Appendix H provides an example of such barriers.
AND
MM 2C: Installation of In-Line Duct Silencers for Blow Molder Chiller Exhaust Vents. Although the air inlet openings for the blow molder chiller equipment located near the east side of the CG building has been acoustically treated through use of sound absorbing louvers, it does not appear that the exhaust vents have been acoustically treated. As a result, in-line silencers should be installed within the ductwork leading from the chiller equipment to the exhaust vents on the east side of the building. Silencers capable of reducing the sound output of these vents by 10 dB would reduce chiller sound levels to acceptable limits. A company specializing in the specification of duct silencers should be consulted to ensure the proper silencers are selected to achieve the desired sound reduction without adversely affecting system performance.
AND
MM 2D: Selection of Quieter Generators. Manufacturer-provided sound level test data for the proposed generators (3 x Caterpillar G3412C LE – See Appendix I), indicates that, even with the proposed sound attenuation package, the combined mechanical, exhaust and radiator noise levels would be approximately 63 dB Leq at a distance of 100 feet from the three operating generators. To mitigate this impact to a level of insignificance, additional sound controls could be applied to the proposed generators which result in levels 5 dB lower than the proposed generators, or 58 dB Leq at a distance of 100 feet from the operating generators.
OR
MM 2E: Construction of Localized Noise Barrier around Generators. The proposed propane generators to be located near the southeast corner of the bottling building could be screened from view of the Receptors 2 - 6 & 12 through the use of a localized noise barrier. A noise barrier provides approximately 5 dB of attenuation once it intercepts line of sight between the noise source and receiver. Therefore, provided the proposed generators are shielded from view of Receptors 2 - 6 by such barriers, noise generated by the generators would theoretically be reduced to less than
Bollard Acoustical Consultants, Inc. (BAC)
Noise Impact Analysis Crystal Geyser Bottling Plant
Mt. Shasta (Siskiyou County), CA. Page 37
significant levels at those receivers. Nonetheless, to provide an additional margin of safety, it is recommended that the noise barrier extend three (3) feet above the height of the generators. To provide access to the generators for routine maintenance or replacement, the barriers could be constructed of pre-fabricated galvanized metal panels which could be temporarily removed as needed. Aside from being removable, an advantage of such barriers is they can also provide sound absorption on the interior side of the barrier, while providing sound transmission loss on the exterior side. Appendix H provides an example of such barriers.
Significance after Mitigation: Less than Significant
Impact 3: Project Construction Noise Generation
During the utilities modification and construction phases of the proposed project, noise from project demolition and construction activities would add to the noise environment in the immediate project vicinity. Activities involved in typical construction would generate maximum noise levels, as indicated in Table 11, ranging from 70 to 90 dB at a distance of 50 feet. Not all of these construction activities would be required of this project.

Bollard Acoustical Consultants, Inc. (BAC)
Noise Impact Analysis Crystal Geyser Bottling Plant
Mt. Shasta (Siskiyou County), CA. Page 38
Table 11 Typical Construction Equipment Noise
Equipment Description Maximum Noise Level at 50 feet, dBA
Auger drill rig 85 Backhoe 80 Boring jack power unit 80 Chain saw 85 Compactor (ground) 80 Compressor (air) 80 Concrete batch plant 83 Concrete mixer truck 85 Concrete pump truck 82 Concrete saw 90 Crane (mobile or stationary) 85 Dozer 85 Dump truck 84 Excavator 85 Flatbed truck 84 Front end loader 80 Generator (25 kilovolt-amperes [kVA] or less) 70 Generator (more than 25 kVA) 82 Grader 85 Jackhammer 85 Pneumatic tools 85 Pumps 77 Rock drill 85 Scraper 85 Soil mix drill rig 80 Tractor 84 Vacuum street sweeper 80 Vibratory concrete mixer 80 Source: Federal Highway Administration 2006.
Because project construction activities would not include pile driving or other substantial sources of vibration, and because vibration levels dissipate rapidly from earthmoving equipment uses for site grading, no vibration-related impacts are identified at any of the nearest sensitive receptors to the project site during project construction.
Figure 2 shows the locations of the proposed structures and facilities to be constructed as part of this project. The nearest sensitive receptors to any of the proposed construction are the residences to the west of the project site located approximately 500 feet away from the proposed caretaker residence. The next closest receptors are in excess of 700 feet from any proposed construction.
Given standard spherical spreading of noise resulting in a 6 dB decrease for each doubling of distance from the reference position, the Table 11 reference levels would be reduced by 20 dB due to distance alone. Assuming no shielding of on-site construction activities by intervening topography, the resulting maximum noise levels at the nearest residences would range from 50 to 70 dB, Lmax. After consideration of such shielding, actual construction noise levels will be even lower. As indicated in Appendix C, measured existing maximum noise levels frequently exceeded
Bollard Acoustical Consultants, Inc. (BAC)
Noise Impact Analysis Crystal Geyser Bottling Plant
Mt. Shasta (Siskiyou County), CA. Page 39
70 dB Lmax at measurement Site 2, and frequently exceeded 80 dB Lmax at measurement sites 1 and 3. Still higher maximum sound levels were registered at measurement Site 4 due to the proximity of that site to the railroad tracks. As a result, maximum noise levels generated during the relatively brief period of project construction would be below measured existing ambient noise levels, and project construction would not result in a substantial increase in ambient noise levels at the nearest residences.
After consideration of the percentage of the hour each type of equipment would be operating, the location of the construction activities relative to the nearest residences, the fact that construction activities would be limited to daytime hours, and shielding of the nearest existing residences by intervening topography, average noise levels generated during construction activities are expected to be considerably lower than maximum noise levels, and satisfactory relative to City of Mount Shasta and Siskiyou County daytime noise standards. As a result, noise impacts associated with project construction are predicted to be less than significant.
Impact 4: Project-Generated Noise Impacts within Interior Areas of Sensitive Receptors
As indicated previously in this report, compliance with the exterior noise level standards of significance would ensure compliance with the interior noise level standards as well. Because noise levels generated by on-site activities are predicted to exceed the project standards of significance at the exterior spaces of Receptors R1, R2, R4 and R11, it is possible that noise levels within the interior spaces of these residences could also be excessive. As a result, this impact is considered significant.
Mitigation for Impact 4:
MM 4: Implement Mitigation Measure 2A or 2B, and Mitigation Measure 2C, and MM 2D or 2E.
Significance after Mitigation: Less than Significant
Impact 5: Vibration Impacts Associated with Project Construction and Operation
To quantify reference vibration levels commonly generated by construction equipment, the publication, Transportation and Construction Vibration Guidance Manual (Caltrans, September 2013), was utilized. Table 18 of that publication, which is reproduced below as Table 12, contains reference peak particle velocity data for such equipment.

Bollard Acoustical Consultants, Inc. (BAC)
Noise Impact Analysis Crystal Geyser Bottling Plant
Mt. Shasta (Siskiyou County), CA. Page 40
Table 12
Vibration Amplitudes for Construction Equipment
Vibration Source Measurement Distance, ft. Peak Particle Velocity
(in/sec)
Vibratory Roller 25 0.210
Large Bulldozers 25 0.089
Loaded Trucks 25 0.076
Jackhammer 25 0.035
Source: Bollard Acoustical Consultants, Inc. (BAC)
The vibration data shown in Table 12 indicate that, with the exception of the vibratory roller, heavy equipment-generated vibration levels are below the thresholds for annoyance and damage to structures even at the very close measurement locations of 25 feet from the operating equipment. As a result, at receptors located hundreds of feet from proposed construction operations, project construction-related vibration levels are expected to be well below the threshold of perception. This conclusion is reached regardless of the intervening strata between the sources of construction vibration and nearest sensitive receptor locations.
With respect to equipment which will operated on-site as part of the bottling process, project officials report that older air compressors which were previously utilized at the site, and which are believed to have been the cause of vibration-related concerns, are being replaced with new state of the art compressors. In addition, those compressors and other appreciable vibration-generating equipment will reportedly be installed on resilient mounts to isolate that equipment from the building slab and structure.
Comments on the DEIR noise section were received regarding the vibration generation of the Dex-6 Well Pump and the transmission of vibration through soil. The DEX-6 wellhead is located in excess of 1,000 feet from the nearest residences and is located within an approximately 100 square foot concrete building. In general, pump bearing lifetime decreases rapidly with even small increments of vibration. As a result, a critical design goal of pump operation is vibration minimization. For large pumps with rigid foundations, maximum vibration levels for satisfactory pump operations reportedly should not exceed 0.28 inches/second rms on the surface of the pump. (http://www.enggcyclopedia.com/2012/03/pumps-vibrations).
Using the vibration propagation formula contained in the Federal Transit Administration publication, Transit Noise and Vibration Impact Assessment, (FTA-VA-90-1003-06), Section 12.2.1, a source generating a vibration level of 0.28 inches/second at a distance of 1 foot from the source would reach a level of approximately 0.00001 inches/second at a distance of 1,000 feet. Even if the strata between the source and nearest sensitive receptor located over 1,000 feet away were highly conducive to the propagation of vibration, pump vibration levels at that distance would still be well below the threshold of perception. As a result, no adverse vibration impacts are identified from the operation of the wellhead pump.

Bollard Acoustical Consultants, Inc. (BAC)
Noise Impact Analysis Crystal Geyser Bottling Plant
Mt. Shasta (Siskiyou County), CA. Page 41
Vibration generated by on-site equipment is predicted to be imperceptible at off-site noise-sensitive receptors. As a result, this impact is considered less than significant.
Conclusions
Following implementation of the identified Noise Mitigation options, noise generated by construction activities, on-site circulation, and on-site mechanical equipment is not predicted to result in adverse noise impacts at off-site noise sensitive receptors in the proposed Crystal Geyser bottling facility project vicinity. As a result, no additional noise mitigation measures are warranted for these project noise sources.
In addition, noise generated by project-related heavy truck trips is not predicted to result in significant increases in traffic noise levels at residences located along Mount Shasta Boulevard. As a result, no off-site traffic noise impacts are identified for this project.
This concludes BAC’s updated environmental noise assessment for the Crystal Geyser Bottling Plant project in Mt. Shasta (Siskiyou County), California. Please contact Paul Bollard at (916) 663-0500 or [email protected] with questions or requests for additional information.

Appendix AAcoustical Terminology
Acoustics The science of sound.
Ambient The distinctive acoustical characteristics of a given space consisting of all noise sources Noise audible at that location. In many cases, the term ambient is used to describe an existing
or pre-project condition such as the setting in an environmental noise study.
Attenuation The reduction of an acoustic signal.
A-Weighting A frequency-response adjustment of a sound level meter that conditions the output signalto approximate human response.
Decibel or dB Fundamental unit of sound, A Bell is defined as the logarithm of the ratio of the soundpressure squared over the reference pressure squared. A Decibel is one-tenth of a Bell.
CNEL Community Noise Equivalent Level. Defined as the 24-hour average noise level withnoise occurring during evening hours (7 - 10 p.m.) weighted by a factor of three andnighttime hours weighted by a factor of 10 prior to averaging.
Frequency The measure of the rapidity of alterations of a periodic signal, expressed in cycles persecond or hertz.
Ldn Day/Night Average Sound Level. Similar to CNEL but with no evening weighting.
Leq Equivalent or energy-averaged sound level.
Lmax The highest root-mean-square (RMS) sound level measured over a given period of time.
Loudness A subjective term for the sensation of the magnitude of sound.
Masking The amount (or the process) by which the threshold of audibility is for one sound is raisedby the presence of another (masking) sound.
Noise Unwanted sound.
Peak Noise The level corresponding to the highest (not RMS) sound pressure measured over a givenperiod of time. This term is often confused with the Maximum level, which is the highestRMS level.
RT6060 The time it takes reverberant sound to decay by 60 dB once the source has beenremoved.
Sabin The unit of sound absorption. One square foot of material absorbing 100% of incidentsound has an absorption of 1 sabin.
SEL A rating, in decibels, of a discrete event, such as an aircraft flyover or train passby, that compresses the total sound energy of the event into a 1-s time period.
Threshold The lowest sound that can be perceived by the human auditory system, generally of Hearing considered to be 0 dB for persons with perfect hearing.
Threshold Approximately 120 dB above the threshold of hearing. of Pain

Hour Leq Lmax Lmin L02 L08 L25 L50 L90
12:00 AM 58 88 28 58 50 46 44 39
1:00 AM 44 51 27 49 48 46 43 36
2:00 AM 55 82 30 63 55 47 44 39
3:00 AM 46 61 28 52 49 47 45 38
4:00 AM 47 57 32 53 51 48 46 41
5:00 AM 55 78 35 60 54 51 49 45
6:00 AM 56 85 38 59 56 51 49 45
7:00 AM 53 78 39 55 51 49 47 44
8:00 AM 52 77 42 55 50 48 47 44
9:00 AM 50 63 42 53 52 51 49 47
10:00 AM 52 69 44 57 54 52 51 48
11:00 AM 51 57 45 54 53 52 51 48
12:00 PM 51 57 45 54 53 52 50 48
1:00 PM 51 65 42 55 53 51 50 46
2:00 PM 48 64 40 53 51 49 47 44
3:00 PM 49 57 40 53 52 50 48 43
4:00 PM 49 59 41 53 52 50 48 45
5:00 PM 48 57 36 53 51 49 47 44
6:00 PM 47 54 40 51 50 48 47 44
7:00 PM 48 54 41 51 50 49 47 44
8:00 PM 55 78 41 62 54 51 49 46
9:00 PM 60 84 38 70 60 52 50 45
10:00 PM 49 57 39 53 52 50 48 45
11:00 PM 47 56 37 52 50 48 47 43
Daytime Leq Lmax Lmin L02 L08 L25 L50 L90
Average 51 65 41 55 52 50 49 45
High 60 84 45 70 60 52 51 48
Low 47 54 27 51 50 48 47 43
Nighttime Leq Lmax Lmin L02 L08 L25 L50 L90
Average 51 68 33 56 52 48 46 41
High 58 88 39 63 56 51 49 45
Low 44 51 27 49 48 46 43 36
Ldn: 60 59% 41%
Appendix B‐1
Ambient Noise Monitoring Results ‐ Site 1
Crystal Geyser Bottling Plant
Friday, July 22, 2016
% Daytime Energy: % Nighttime Energy:

Hour Leq Lmax Lmin L02 L08 L25 L50 L90
12:00 AM 54 80 35 61 52 48 46 42
1:00 AM 43 53 31 48 46 44 42 37
2:00 AM 41 53 30 46 45 42 40 36
3:00 AM 40 49 31 45 43 41 39 35
4:00 AM 43 53 30 48 46 45 43 37
5:00 AM 43 51 32 47 46 44 42 38
6:00 AM 45 56 35 50 48 46 44 40
7:00 AM 53 80 38 56 51 49 47 43
8:00 AM 47 61 40 52 50 48 46 43
9:00 AM 52 75 43 57 52 50 48 46
10:00 AM 50 62 44 54 53 51 49 47
11:00 AM 48 57 41 53 51 49 47 44
12:00 PM 52 75 41 57 53 52 50 45
1:00 PM 50 65 42 54 53 51 49 46
2:00 PM 48 64 41 53 51 50 48 44
3:00 PM 49 58 42 54 52 51 49 45
4:00 PM 55 81 41 56 53 51 49 46
5:00 PM 49 57 40 53 52 50 49 46
6:00 PM 53 77 39 60 52 50 48 45
7:00 PM 53 81 41 53 51 49 48 45
8:00 PM 49 56 39 53 52 50 48 45
9:00 PM 53 80 39 56 52 50 48 45
10:00 PM 55 79 37 64 54 50 48 44
11:00 PM 47 72 34 54 49 46 44 39
Daytime Leq Lmax Lmin L02 L08 L25 L50 L90
Average 51 69 41 55 52 50 48 45
High 55 81 44 60 53 52 50 47
Low 47 56 30 52 50 48 46 43
Nighttime Leq Lmax Lmin L02 L08 L25 L50 L90
Average 46 61 33 52 48 45 43 39
High 55 80 37 64 54 50 48 44
Low 40 49 30 45 43 41 39 35
Ldn: 56 73% 27%% Daytime Energy: % Nighttime Energy:
Appendix B‐2
Ambient Noise Monitoring Results ‐ Site 1
Crystal Geyser Bottling Plant
Saturday, July 23, 2016

Hour Leq Lmax Lmin L02 L08 L25 L50 L90
12:00 AM 42 62 31 47 45 43 41 37
1:00 AM 42 56 29 47 45 43 41 35
2:00 AM 43 52 29 49 47 45 42 34
3:00 AM 55 80 29 57 46 43 40 33
4:00 AM 43 53 29 48 46 44 42 35
5:00 AM 47 71 27 50 46 44 41 34
6:00 AM 47 53 32 52 50 48 46 41
7:00 AM 51 77 33 53 50 48 46 42
8:00 AM 47 55 39 52 50 48 47 44
9:00 AM 49 57 40 53 52 50 48 45
10:00 AM 50 60 42 54 53 51 50 47
11:00 AM 49 56 42 53 52 50 49 47
12:00 PM 49 56 42 51 50 49 48 46
1:00 PM 45 60 38 49 47 46 44 41
2:00 PM 42 54 36 47 45 43 41 38
3:00 PM 45 54 38 49 47 45 44 42
4:00 PM 44 54 39 48 46 45 44 41
5:00 PM 46 60 41 51 48 46 45 43
6:00 PM 45 52 39 49 47 46 45 43
7:00 PM 44 53 39 48 47 45 44 42
8:00 PM 56 79 40 66 55 48 45 42
9:00 PM 58 87 38 56 52 49 46 41
10:00 PM 57 83 36 64 53 50 48 44
11:00 PM 61 87 37 69 57 52 48 43
Daytime Leq Lmax Lmin L02 L08 L25 L50 L90
Average 48 61 39 52 49 47 46 43
High 58 87 42 66 55 51 50 47
Low 42 52 27 47 45 43 41 38
Nighttime Leq Lmax Lmin L02 L08 L25 L50 L90
Average 49 66 31 54 48 46 43 37
High 61 87 37 69 57 52 48 44
Low 42 52 27 47 45 43 40 33
Ldn: 60 44% 56%% Daytime Energy: % Nighttime Energy:
Appendix B‐3
Ambient Noise Monitoring Results ‐ Site 1
Crystal Geyser Bottling Plant
Sunday, July 24, 2016

Hour Leq Lmax Lmin L02 L08 L25 L50 L90
12:00 AM 50 72 33 56 53 50 48 42
1:00 AM 46 56 33 52 50 48 45 40
2:00 AM 48 58 32 54 52 49 47 40
3:00 AM 60 84 34 69 59 53 49 43
4:00 AM 50 58 33 55 53 51 49 44
5:00 AM 60 87 37 64 57 54 51 45
6:00 AM 60 88 44 64 58 54 52 48
7:00 AM 58 83 42 62 57 54 51 46
8:00 AM 44 57 36 48 46 44 43 40
9:00 AM 44 64 37 49 45 43 42 39
10:00 AM 44 55 37 49 47 45 43 40
11:00 AM 46 59 40 51 47 46 44 42
12:00 PM 58 72 42 68 64 50 47 44
1:00 PM 48 68 41 53 48 46 45 43
2:00 PM 47 67 38 54 49 47 45 41
3:00 PM 48 60 41 53 50 49 48 44
4:00 PM 46 60 39 51 48 47 45 42
5:00 PM 47 55 42 51 49 48 46 44
6:00 PM 47 62 40 51 49 47 46 43
7:00 PM 54 81 38 60 50 47 45 41
8:00 PM 47 61 38 52 50 48 47 44
9:00 PM 47 55 38 51 50 48 46 43
10:00 PM 47 54 36 51 50 48 46 42
11:00 PM 45 55 33 51 49 46 44 39
Daytime Leq Lmax Lmin L02 L08 L25 L50 L90
Average 48 64 39 54 50 47 46 43
High 58 83 44 68 64 54 51 46
Low 44 55 32 48 45 43 42 39
Nighttime Leq Lmax Lmin L02 L08 L25 L50 L90
Average 52 68 35 57 53 50 48 43
High 60 88 44 69 59 54 52 48
Low 45 54 32 51 49 46 44 39
Ldn: 62 36% 64%% Daytime Energy: % Nighttime Energy:
Appendix B‐4
Ambient Noise Monitoring Results ‐ Site 1
Crystal Geyser Bottling Plant
Monday, July 25, 2016

Hour Leq Lmax Lmin L02 L08 L25 L50 L90
12:00 AM 43 52 31 48 47 44 42 36
1:00 AM 53 80 26 61 49 45 42 34
2:00 AM 59 86 26 58 49 45 43 37
3:00 AM 47 72 30 53 50 44 41 35
4:00 AM 46 62 32 52 50 47 44 38
5:00 AM 49 59 34 55 53 50 48 43
6:00 AM 52 73 38 57 55 52 50 45
7:00 AM 54 78 39 61 54 50 48 45
8:00 AM 49 63 42 54 52 50 49 46
9:00 AM 55 79 38 61 54 51 50 47
10:00 AM 50 61 44 54 52 51 50 47
11:00 AM 50 64 42 54 52 51 50 47
12:00 PM 52 79 43 54 52 50 49 46
1:00 PM 49 62 42 55 51 49 48 45
2:00 PM 47 59 39 53 48 47 46 41
3:00 PM 48 76 33 49 48 47 46 38
4:00 PM 46 58 38 53 50 46 44 41
5:00 PM 50 56 43 53 52 50 49 47
6:00 PM 50 61 43 54 53 51 50 47
7:00 PM 48 58 39 53 51 49 47 44
8:00 PM 53 80 39 58 52 50 49 45
9:00 PM 47 60 38 51 49 47 46 43
10:00 PM 59 86 34 67 55 48 46 42
11:00 PM 58 82 32 62 53 50 47 41
Daytime Leq Lmax Lmin L02 L08 L25 L50 L90
Average 50 66 40 54 51 49 48 45
High 55 80 44 61 54 51 50 47
Low 46 56 26 49 48 46 44 38
Nighttime Leq Lmax Lmin L02 L08 L25 L50 L90
Average 52 72 31 57 51 47 45 39
High 59 86 38 67 55 52 50 45
Low 43 52 26 48 47 44 41 34
Ldn: 61 37% 63%% Daytime Energy: % Nighttime Energy:
Appendix B‐5
Ambient Noise Monitoring Results ‐ Site 1
Crystal Geyser Bottling Plant
Tuesday, July 26, 2016

Hour Leq Lmax Lmin L02 L08 L25 L50 L90
12:00 AM 44 54 32 50 47 45 43 38
1:00 AM 52 78 30 57 50 47 44 37
2:00 AM 46 53 28 51 49 47 44 37
3:00 AM 50 64 35 56 53 51 48 44
4:00 AM 50 57 38 55 53 51 48 44
5:00 AM 62 85 41 70 59 56 53 48
6:00 AM 54 60 42 59 57 55 53 49
7:00 AM 52 72 41 58 54 51 49 45
8:00 AM 53 79 42 58 53 50 48 45
9:00 AM 45 59 38 51 48 46 44 41
10:00 AM 47 63 37 55 52 46 44 41
11:00 AM 47 55 42 51 49 47 46 44
12:00 PM 46 62 40 51 48 46 45 43
1:00 PM 49 67 41 56 51 48 46 44
2:00 PM 44 53 37 49 47 45 43 40
3:00 PM 45 68 38 49 47 45 43 40
4:00 PM 49 69 40 56 51 47 46 43
5:00 PM 48 57 42 52 50 48 47 45
6:00 PM 54 78 42 60 50 48 47 45
7:00 PM 45 58 39 49 48 46 45 42
8:00 PM 59 86 39 66 56 51 49 46
9:00 PM 56 81 37 65 57 50 47 43
10:00 PM 44 51 36 49 47 46 44 40
11:00 PM 44 65 34 49 46 44 43 38
Daytime Leq Lmax Lmin L02 L08 L25 L50 L90
Average 49 67 40 55 51 48 46 43
High 59 86 42 66 57 51 49 46
Low 44 53 28 49 47 45 43 40
Nighttime Leq Lmax Lmin L02 L08 L25 L50 L90
Average 50 63 35 55 51 49 47 42
High 62 85 42 70 59 56 53 49
Low 44 51 28 49 46 44 43 37
Ldn: 60 48% 52%
Appendix B‐6
Ambient Noise Monitoring Results ‐ Site 1
Crystal Geyser Bottling Plant
Wednesday, July 27, 2016
% Daytime Energy: % Nighttime Energy:

Hour Leq Lmax Lmin L02 L08 L25 L50 L90
12:00 AM 47 54 35 52 50 48 46 41
1:00 AM 57 81 32 63 53 50 48 42
2:00 AM 55 82 37 55 52 49 47 42
3:00 AM 48 64 31 54 51 49 47 43
4:00 AM 57 82 36 64 53 50 48 42
5:00 AM 56 81 38 58 55 52 49 45
6:00 AM 55 76 44 59 57 54 52 49
7:00 AM 53 78 40 57 54 50 48 44
8:00 AM 54 79 40 62 54 48 46 43
9:00 AM 48 67 38 56 52 45 44 41
10:00 AM 46 62 39 52 48 46 45 42
11:00 AM 45 57 39 51 48 45 44 41
12:00 PM 49 71 37 57 48 44 42 39
1:00 PM 46 61 39 53 49 46 45 42
2:00 PM 48 63 40 57 49 46 44 42
3:00 PM 46 53 42 50 49 47 46 44
4:00 PM 47 63 41 53 49 47 46 43
5:00 PM 46 63 42 51 48 47 46 44
6:00 PM 46 60 42 50 49 47 46 44
7:00 PM 49 67 39 56 51 48 47 43
8:00 PM 60 86 42 70 57 51 49 45
9:00 PM 55 81 40 56 52 49 47 44
10:00 PM 47 61 36 55 50 47 46 42
11:00 PM 45 55 36 50 48 46 44 40
Daytime Leq Lmax Lmin L02 L08 L25 L50 L90
Average 49 67 40 55 50 47 45 43
High 60 86 44 70 57 51 49 45
Low 45 53 31 50 48 44 42 39
Nighttime Leq Lmax Lmin L02 L08 L25 L50 L90
Average 52 71 36 57 52 50 47 43
High 57 82 44 64 57 54 52 49
Low 45 54 31 50 48 46 44 40
Ldn: 60 53% 47%
Appendix B‐7
Ambient Noise Monitoring Results ‐ Site 1
Crystal Geyser Bottling Plant
Thursday, July 28, 2016
% Daytime Energy: % Nighttime Energy:

Hour Leq Lmax Lmin L02 L08 L25 L50 L90
12:00 AM 50 76 38 54 51 48 46 42
1:00 AM 57 84 36 63 51 49 46 42
2:00 AM 63 90 35 63 52 49 47 42
3:00 AM 50 60 36 57 54 51 49 44
4:00 AM 60 84 36 65 53 51 48 43
5:00 AM 51 65 38 56 54 52 50 46
6:00 AM 51 62 39 56 54 52 51 46
7:00 AM 50 62 42 56 53 51 49 45
8:00 AM 48 72 37 55 49 46 44 40
9:00 AM 49 74 37 57 47 44 42 40
10:00 AM 42 58 36 47 45 43 41 39
11:00 AM 50 74 37 58 50 44 42 40
12:00 PM 46 61 39 55 49 45 44 41
1:00 PM 48 68 40 54 48 46 44 42
2:00 PM 46 56 41 50 48 46 45 43
3:00 PM 48 69 40 55 50 47 45 43
4:00 PM 50 74 41 55 49 46 45 43
5:00 PM 46 64 40 51 48 46 45 42
6:00 PM 51 78 40 56 49 46 44 42
7:00 PM 53 74 37 63 52 47 45 42
8:00 PM 47 58 33 55 53 48 43 37
9:00 PM 56 83 38 58 55 52 49 43
10:00 PM 50 59 40 56 54 52 50 46
11:00 PM 56 80 36 62 53 49 47 43
Daytime Leq Lmax Lmin L02 L08 L25 L50 L90
Average 49 68 39 55 50 47 45 42
High 56 83 42 63 55 52 49 45
Low 42 56 33 47 45 43 41 37
Nighttime Leq Lmax Lmin L02 L08 L25 L50 L90
Average 54 73 37 59 53 50 48 44
High 63 90 40 65 54 52 51 46
Low 50 59 35 54 51 48 46 42
Ldn: 63 25% 75%
Appendix B‐8
Ambient Noise Monitoring Results ‐ Site 1
Crystal Geyser Bottling Plant
Friday, July 29, 2016
% Daytime Energy: % Nighttime Energy:

Hour Leq Lmax Lmin L02 L08 L25 L50 L90
12:00 AM 57 87 33 59 52 49 47 43
1:00 AM 48 57 32 54 52 49 46 40
2:00 AM 49 59 31 55 53 50 46 39
3:00 AM 57 80 31 63 53 50 47 41
4:00 AM 63 88 33 66 57 52 49 42
5:00 AM 54 78 31 58 55 52 49 43
6:00 AM 59 85 35 63 54 51 49 44
7:00 AM 46 56 38 50 49 47 46 43
8:00 AM 47 55 39 51 49 47 46 43
9:00 AM 51 76 42 53 50 48 47 45
10:00 AM 46 63 39 52 48 46 45 42
11:00 AM 45 55 36 50 47 45 44 40
12:00 PM 47 60 41 52 49 47 46 44
1:00 PM 48 61 42 53 51 48 47 45
2:00 PM 48 62 43 53 51 48 47 45
3:00 PM 48 68 43 54 50 48 47 45
4:00 PM 51 73 43 59 50 48 47 45
5:00 PM 46 59 41 51 49 47 45 43
6:00 PM 51 74 40 58 48 46 45 43
7:00 PM 51 73 41 57 49 47 45 43
8:00 PM 45 55 40 49 47 46 44 42
9:00 PM 62 88 39 63 55 48 46 43
10:00 PM 62 88 41 62 52 49 47 44
11:00 PM 49 59 39 54 52 50 48 44
Daytime Leq Lmax Lmin L02 L08 L25 L50 L90
Average 49 65 40 54 50 47 46 43
High 62 88 43 63 55 48 47 45
Low 45 55 31 49 47 45 44 40
Nighttime Leq Lmax Lmin L02 L08 L25 L50 L90
Average 55 76 34 59 53 50 47 42
High 63 88 41 66 57 52 49 44
Low 48 57 31 54 52 49 46 39
Ldn: 64 31% 69%
Appendix B‐9
Ambient Noise Monitoring Results ‐ Site 1
Crystal Geyser Bottling Plant
Saturday, July 30, 2016
% Daytime Energy: % Nighttime Energy:

Hour Leq Lmax Lmin L02 L08 L25 L50 L90
12:00 AM 50 72 34 56 53 51 48 43
1:00 AM 48 59 33 53 51 49 47 40
2:00 AM 45 54 29 51 49 46 43 36
3:00 AM 56 79 29 63 50 46 43 36
4:00 AM 58 86 32 64 50 47 44 38
5:00 AM 50 75 33 54 51 48 46 41
6:00 AM 48 57 37 52 50 49 47 43
7:00 AM 48 70 33 55 51 48 46 43
8:00 AM 48 69 40 53 50 48 47 44
9:00 AM 49 60 40 52 51 49 48 46
10:00 AM 45 54 38 50 48 46 44 41
11:00 AM 46 54 40 49 48 47 46 44
12:00 PM 47 64 42 51 49 47 46 44
1:00 PM 47 55 42 50 49 47 46 44
2:00 PM 49 71 43 54 50 48 47 45
3:00 PM 51 75 43 56 50 48 47 45
4:00 PM 51 76 43 54 50 48 47 45
5:00 PM 47 56 42 50 49 47 46 45
6:00 PM 52 73 41 60 49 47 46 44
7:00 PM 52 76 40 59 52 47 45 43
8:00 PM 45 54 38 49 47 45 44 41
9:00 PM 47 57 39 53 51 49 46 42
10:00 PM 59 84 40 64 54 52 50 46
11:00 PM 51 72 38 57 54 51 49 45
Daytime Leq Lmax Lmin L02 L08 L25 L50 L90
Average 48 64 40 53 49 47 46 44
High 52 76 43 60 52 49 48 46
Low 45 54 29 49 47 45 44 41
Nighttime Leq Lmax Lmin L02 L08 L25 L50 L90
Average 52 71 34 57 51 49 46 41
High 59 86 40 64 54 52 50 46
Low 45 54 29 51 49 46 43 36
Ldn: 60 33% 67%
Appendix B‐10
Ambient Noise Monitoring Results ‐ Site 1
Crystal Geyser Bottling Plant
Sunday, July 31, 2016
% Daytime Energy: % Nighttime Energy:

Hour Leq Lmax Lmin L02 L08 L25 L50 L90
12:00 AM 50 77 29 56 47 43 41 36
1:00 AM 41 54 27 47 45 43 40 34
2:00 AM 53 81 31 59 50 45 42 36
3:00 AM 43 53 26 48 46 44 42 35
4:00 AM 43 54 32 48 47 44 42 38
5:00 AM 51 79 32 56 49 46 44 41
6:00 AM 49 72 35 56 52 48 45 41
7:00 AM 48 71 38 52 48 46 44 41
8:00 AM 46 68 36 53 48 45 43 40
9:00 AM 46 55 37 50 48 46 45 42
10:00 AM 48 67 39 54 49 47 45 43
11:00 AM 46 58 40 50 48 47 45 43
12:00 PM 46 61 39 50 48 46 45 42
1:00 PM 45 59 37 50 48 46 45 42
2:00 PM 45 56 34 51 49 46 44 39
3:00 PM 47 63 36 53 50 47 45 40
4:00 PM 46 59 36 51 49 47 45 41
5:00 PM 46 58 33 53 50 47 44 39
6:00 PM 45 58 35 50 47 45 43 40
7:00 PM 45 55 35 49 48 45 44 41
8:00 PM 51 74 40 57 51 48 46 43
9:00 PM 56 79 38 64 56 50 47 43
10:00 PM 48 63 40 53 51 48 46 43
11:00 PM 45 52 35 49 48 46 44 41
Daytime Leq Lmax Lmin L02 L08 L25 L50 L90
Average 47 63 37 52 49 47 45 41
High 56 79 40 64 56 50 47 43
Low 45 55 26 49 47 45 43 39
Nighttime Leq Lmax Lmin L02 L08 L25 L50 L90
Average 47 65 32 52 48 45 43 38
High 53 81 40 59 52 48 46 43
Low 41 52 26 47 45 43 40 34
Ldn: 55 61% 39%
Appendix B‐11
Ambient Noise Monitoring Results ‐ Site 2
Crystal Geyser Bottling Plant
Friday, July 22, 2016
% Daytime Energy: % Nighttime Energy:
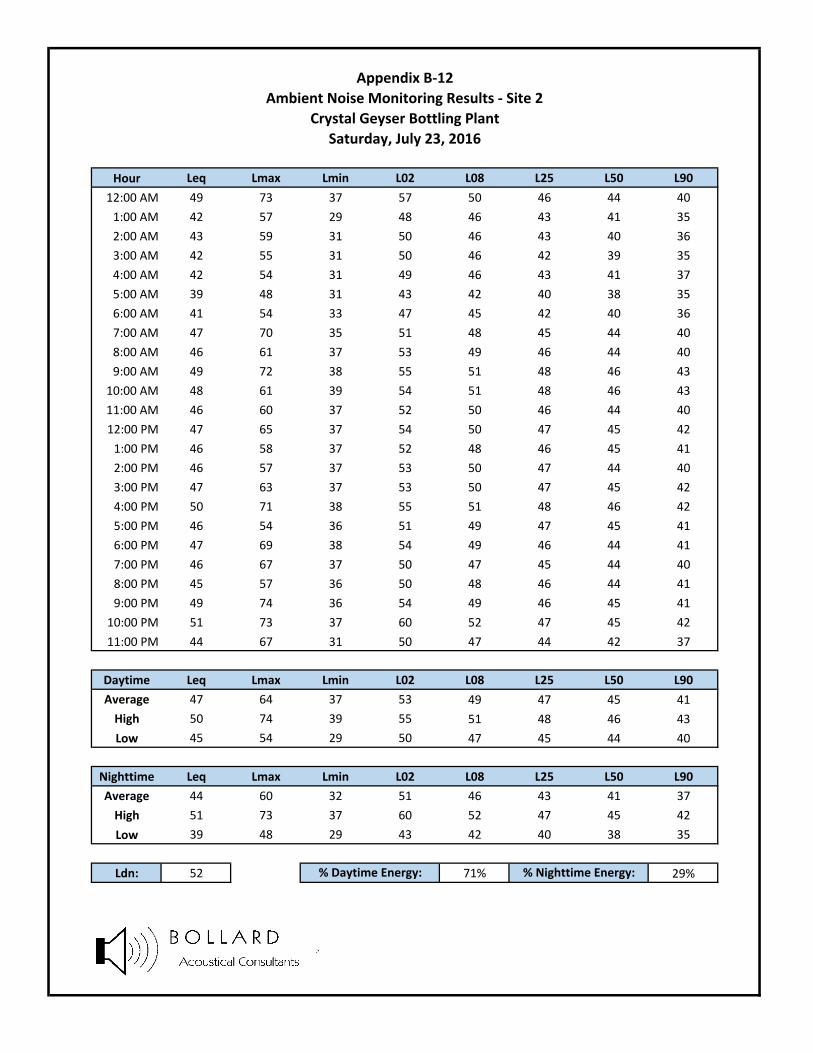
Hour Leq Lmax Lmin L02 L08 L25 L50 L90
12:00 AM 49 73 37 57 50 46 44 40
1:00 AM 42 57 29 48 46 43 41 35
2:00 AM 43 59 31 50 46 43 40 36
3:00 AM 42 55 31 50 46 42 39 35
4:00 AM 42 54 31 49 46 43 41 37
5:00 AM 39 48 31 43 42 40 38 35
6:00 AM 41 54 33 47 45 42 40 36
7:00 AM 47 70 35 51 48 45 44 40
8:00 AM 46 61 37 53 49 46 44 40
9:00 AM 49 72 38 55 51 48 46 43
10:00 AM 48 61 39 54 51 48 46 43
11:00 AM 46 60 37 52 50 46 44 40
12:00 PM 47 65 37 54 50 47 45 42
1:00 PM 46 58 37 52 48 46 45 41
2:00 PM 46 57 37 53 50 47 44 40
3:00 PM 47 63 37 53 50 47 45 42
4:00 PM 50 71 38 55 51 48 46 42
5:00 PM 46 54 36 51 49 47 45 41
6:00 PM 47 69 38 54 49 46 44 41
7:00 PM 46 67 37 50 47 45 44 40
8:00 PM 45 57 36 50 48 46 44 41
9:00 PM 49 74 36 54 49 46 45 41
10:00 PM 51 73 37 60 52 47 45 42
11:00 PM 44 67 31 50 47 44 42 37
Daytime Leq Lmax Lmin L02 L08 L25 L50 L90
Average 47 64 37 53 49 47 45 41
High 50 74 39 55 51 48 46 43
Low 45 54 29 50 47 45 44 40
Nighttime Leq Lmax Lmin L02 L08 L25 L50 L90
Average 44 60 32 51 46 43 41 37
High 51 73 37 60 52 47 45 42
Low 39 48 29 43 42 40 38 35
Ldn: 52 71% 29%% Daytime Energy: % Nighttime Energy:
Appendix B‐12
Ambient Noise Monitoring Results ‐ Site 2
Crystal Geyser Bottling Plant
Saturday, July 23, 2016

Hour Leq Lmax Lmin L02 L08 L25 L50 L90
12:00 AM 39 56 30 45 42 40 38 34
1:00 AM 38 49 28 44 41 39 36 32
2:00 AM 39 49 27 45 43 40 37 32
3:00 AM 51 79 27 52 42 39 36 31
4:00 AM 39 51 27 45 42 40 38 33
5:00 AM 42 66 28 47 43 40 37 32
6:00 AM 43 51 31 48 46 44 42 38
7:00 AM 46 70 34 50 46 44 42 38
8:00 AM 43 53 33 47 45 43 42 39
9:00 AM 44 54 35 48 46 45 43 40
10:00 AM 45 57 35 49 47 45 44 41
11:00 AM 44 54 36 48 46 45 44 41
12:00 PM 43 50 36 47 46 44 43 40
1:00 PM 40 59 32 46 43 40 38 35
2:00 PM 37 50 31 42 40 38 35 33
3:00 PM 39 46 33 43 42 40 39 36
4:00 PM 39 48 32 43 41 39 38 36
5:00 PM 41 54 34 45 43 41 40 38
6:00 PM 41 50 35 45 43 42 40 38
7:00 PM 39 49 35 44 42 40 39 37
8:00 PM 49 75 35 56 49 43 41 37
9:00 PM 46 70 32 49 47 43 41 36
10:00 PM 47 69 34 54 49 46 44 39
11:00 PM 55 82 29 62 53 47 45 40
Daytime Leq Lmax Lmin L02 L08 L25 L50 L90
Average 42 56 34 47 44 42 41 38
High 49 75 36 56 49 45 44 41
Low 37 46 27 42 40 38 35 33
Nighttime Leq Lmax Lmin L02 L08 L25 L50 L90
Average 44 61 29 49 45 42 39 35
High 55 82 34 62 53 47 45 40
Low 38 49 27 44 41 39 36 31
Ldn: 54 37% 63%% Daytime Energy: % Nighttime Energy:
Appendix B‐13
Ambient Noise Monitoring Results ‐ Site 2
Crystal Geyser Bottling Plant
Sunday, July 24, 2016

Hour Leq Lmax Lmin L02 L08 L25 L50 L90
12:00 AM 45 63 33 50 48 46 44 39
1:00 AM 45 53 28 50 48 46 44 39
2:00 AM 43 56 30 50 47 44 42 36
3:00 AM 56 84 31 63 53 47 44 38
4:00 AM 45 53 30 50 48 46 44 38
5:00 AM 55 83 35 58 54 50 47 41
6:00 AM 54 81 38 58 54 51 49 44
7:00 AM 51 76 36 56 52 50 47 41
8:00 AM 38 51 30 45 42 38 35 32
9:00 AM 39 59 30 46 42 38 35 33
10:00 AM 39 49 30 44 42 40 38 34
11:00 AM 41 54 35 48 43 41 39 37
12:00 PM 42 57 36 47 44 42 41 39
1:00 PM 42 63 35 47 43 41 40 37
2:00 PM 40 55 34 47 43 40 39 36
3:00 PM 40 51 34 46 42 40 39 36
4:00 PM 40 55 34 46 42 40 39 37
5:00 PM 42 51 37 46 45 43 42 40
6:00 PM 42 59 35 46 44 42 40 38
7:00 PM 44 67 34 51 44 41 39 36
8:00 PM 43 52 37 47 46 44 43 40
9:00 PM 44 53 35 49 47 45 43 40
10:00 PM 45 56 33 50 48 46 44 40
11:00 PM 43 53 32 49 46 44 41 37
Daytime Leq Lmax Lmin L02 L08 L25 L50 L90
Average 42 57 34 47 44 42 40 37
High 51 76 38 56 52 50 47 41
Low 38 49 28 44 42 38 35 32
Nighttime Leq Lmax Lmin L02 L08 L25 L50 L90
Average 48 65 32 53 50 47 44 39
High 56 84 38 63 54 51 49 44
Low 43 53 28 49 46 44 41 36
Ldn: 57 21% 79%% Daytime Energy: % Nighttime Energy:
Appendix B‐14
Ambient Noise Monitoring Results ‐ Site 2
Crystal Geyser Bottling Plant
Monday, July 25, 2016

Hour Leq Lmax Lmin L02 L08 L25 L50 L90
12:00 AM 40 47 28 45 43 41 39 34
1:00 AM 48 74 24 55 46 42 39 31
2:00 AM 48 73 26 51 45 41 38 32
3:00 AM 42 68 27 48 45 41 38 31
4:00 AM 43 53 31 48 46 44 42 36
5:00 AM 45 57 35 52 48 46 44 41
6:00 AM 49 71 36 53 50 48 46 41
7:00 AM 53 78 39 59 54 49 47 43
8:00 AM 45 56 37 51 48 46 44 41
9:00 AM 51 74 40 57 52 48 46 43
10:00 AM 45 55 38 50 47 45 44 42
11:00 AM 45 59 37 49 47 45 44 41
12:00 PM 43 54 37 48 46 44 43 40
1:00 PM 43 60 34 52 46 43 41 37
2:00 PM 40 55 31 48 42 39 37 33
3:00 PM 36 51 29 43 39 36 34 31
4:00 PM 40 53 32 48 43 40 38 35
5:00 PM 44 51 37 48 46 45 44 41
6:00 PM 45 57 37 49 47 45 44 41
7:00 PM 43 58 30 49 46 44 42 38
8:00 PM 49 75 36 54 49 47 45 42
9:00 PM 44 54 37 48 46 45 43 40
10:00 PM 54 79 32 60 49 44 42 38
11:00 PM 53 80 29 56 48 44 42 38
Daytime Leq Lmax Lmin L02 L08 L25 L50 L90
Average 44 59 35 50 47 44 42 39
High 53 78 40 59 54 49 47 43
Low 36 51 24 43 39 36 34 31
Nighttime Leq Lmax Lmin L02 L08 L25 L50 L90
Average 47 67 30 52 47 43 41 36
High 54 80 36 60 50 48 46 41
Low 40 47 24 45 43 41 38 31
Ldn: 55 46% 54%% Daytime Energy: % Nighttime Energy:
Appendix B‐15
Ambient Noise Monitoring Results ‐ Site 2
Crystal Geyser Bottling Plant
Tuesday, July 26, 2016

Hour Leq Lmax Lmin L02 L08 L25 L50 L90
12:00 AM 40 50 28 45 43 41 39 35
1:00 AM 45 68 27 53 46 42 40 34
2:00 AM 42 50 27 47 45 43 40 34
3:00 AM 46 59 30 51 49 47 45 39
4:00 AM 46 55 33 52 50 47 44 39
5:00 AM 57 83 37 62 55 51 49 45
6:00 AM 51 59 39 56 54 52 50 46
7:00 AM 50 76 38 56 52 49 47 42
8:00 AM 46 65 36 54 49 45 43 39
9:00 AM 40 56 31 47 43 40 37 33
10:00 AM 42 59 32 50 46 41 39 35
11:00 AM 42 52 36 46 44 42 41 39
12:00 PM 42 56 35 48 44 42 40 38
1:00 PM 43 62 35 48 45 43 41 39
2:00 PM 39 51 32 45 42 40 38 34
3:00 PM 40 52 32 48 42 40 38 35
4:00 PM 42 60 34 48 45 42 40 38
5:00 PM 43 50 37 46 45 44 43 40
6:00 PM 47 75 37 55 46 44 43 40
7:00 PM 41 50 36 45 43 42 41 38
8:00 PM 51 76 35 57 49 46 44 41
9:00 PM 51 76 35 59 52 45 43 40
10:00 PM 41 49 33 46 44 42 40 37
11:00 PM 41 56 33 46 44 41 40 36
Daytime Leq Lmax Lmin L02 L08 L25 L50 L90
Average 44 61 35 50 46 43 41 38
High 51 76 39 59 52 49 47 42
Low 39 50 27 45 42 40 37 33
Nighttime Leq Lmax Lmin L02 L08 L25 L50 L90
Average 45 59 32 51 48 45 43 38
High 57 83 39 62 55 52 50 46
Low 40 49 27 45 43 41 39 34
Ldn: 55 44% 56%
Appendix B‐16
Ambient Noise Monitoring Results ‐ Site 2
Crystal Geyser Bottling Plant
Wednesday, July 27, 2016
% Daytime Energy: % Nighttime Energy:
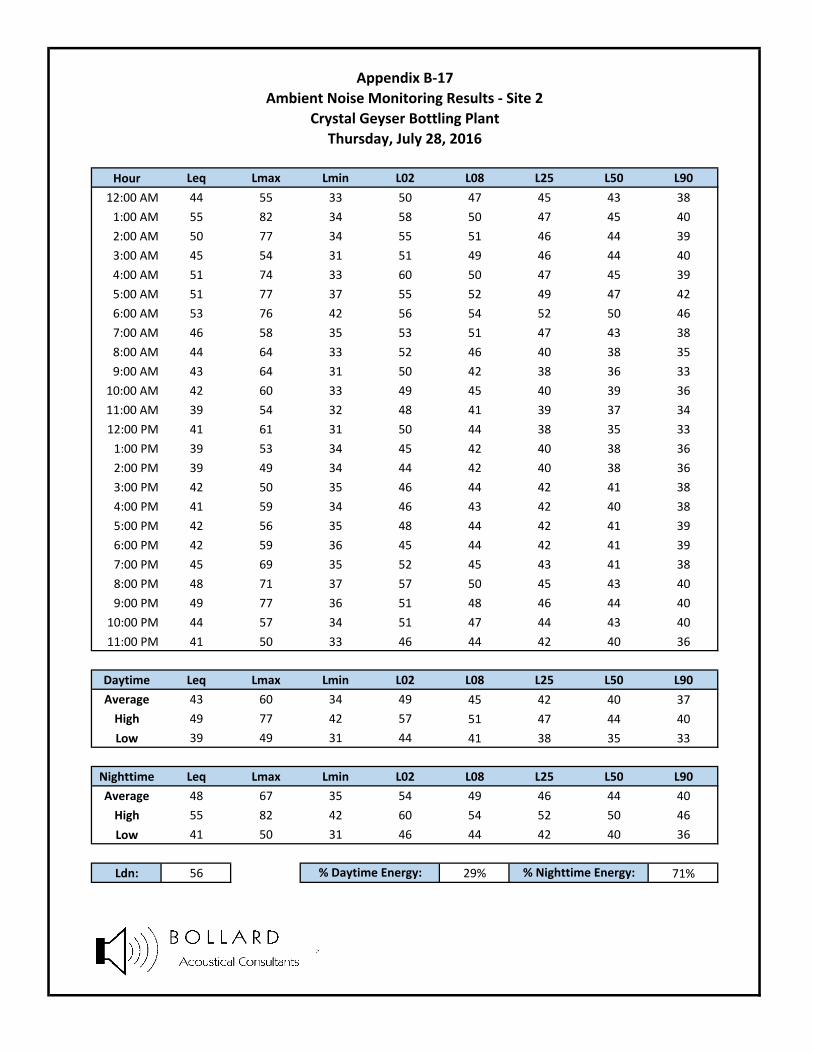
Hour Leq Lmax Lmin L02 L08 L25 L50 L90
12:00 AM 44 55 33 50 47 45 43 38
1:00 AM 55 82 34 58 50 47 45 40
2:00 AM 50 77 34 55 51 46 44 39
3:00 AM 45 54 31 51 49 46 44 40
4:00 AM 51 74 33 60 50 47 45 39
5:00 AM 51 77 37 55 52 49 47 42
6:00 AM 53 76 42 56 54 52 50 46
7:00 AM 46 58 35 53 51 47 43 38
8:00 AM 44 64 33 52 46 40 38 35
9:00 AM 43 64 31 50 42 38 36 33
10:00 AM 42 60 33 49 45 40 39 36
11:00 AM 39 54 32 48 41 39 37 34
12:00 PM 41 61 31 50 44 38 35 33
1:00 PM 39 53 34 45 42 40 38 36
2:00 PM 39 49 34 44 42 40 38 36
3:00 PM 42 50 35 46 44 42 41 38
4:00 PM 41 59 34 46 43 42 40 38
5:00 PM 42 56 35 48 44 42 41 39
6:00 PM 42 59 36 45 44 42 41 39
7:00 PM 45 69 35 52 45 43 41 38
8:00 PM 48 71 37 57 50 45 43 40
9:00 PM 49 77 36 51 48 46 44 40
10:00 PM 44 57 34 51 47 44 43 40
11:00 PM 41 50 33 46 44 42 40 36
Daytime Leq Lmax Lmin L02 L08 L25 L50 L90
Average 43 60 34 49 45 42 40 37
High 49 77 42 57 51 47 44 40
Low 39 49 31 44 41 38 35 33
Nighttime Leq Lmax Lmin L02 L08 L25 L50 L90
Average 48 67 35 54 49 46 44 40
High 55 82 42 60 54 52 50 46
Low 41 50 31 46 44 42 40 36
Ldn: 56 29% 71%
Appendix B‐17
Ambient Noise Monitoring Results ‐ Site 2
Crystal Geyser Bottling Plant
Thursday, July 28, 2016
% Daytime Energy: % Nighttime Energy:

Hour Leq Lmax Lmin L02 L08 L25 L50 L90
12:00 AM 44 61 33 50 47 44 42 38
1:00 AM 48 72 34 56 51 46 44 39
2:00 AM 57 86 34 60 52 46 44 39
3:00 AM 46 54 33 51 49 47 45 40
4:00 AM 57 82 33 60 51 48 45 40
5:00 AM 48 56 37 54 52 49 47 43
6:00 AM 49 59 40 54 52 50 48 44
7:00 AM 49 59 38 54 52 50 48 43
8:00 AM 42 63 31 50 45 41 37 33
9:00 AM 42 61 30 52 44 38 35 32
10:00 AM 37 55 30 45 40 36 34 32
11:00 AM 40 61 31 48 43 38 36 33
12:00 PM 39 57 33 46 41 39 37 35
1:00 PM 41 59 34 48 44 40 38 36
2:00 PM 41 55 35 46 43 40 39 37
3:00 PM 41 56 36 47 43 41 40 38
4:00 PM 42 62 36 48 44 42 41 39
5:00 PM 40 53 35 45 42 41 39 37
6:00 PM 43 63 35 50 44 41 39 37
7:00 PM 46 68 32 55 47 42 40 38
8:00 PM 43 53 28 51 48 43 38 31
9:00 PM 48 72 36 53 50 47 45 40
10:00 PM 47 57 36 52 50 48 46 42
11:00 PM 48 73 34 54 48 45 42 38
Daytime Leq Lmax Lmin L02 L08 L25 L50 L90
Average 42 60 33 49 45 41 39 36
High 49 72 40 55 52 50 48 43
Low 37 53 28 45 40 36 34 31
Nighttime Leq Lmax Lmin L02 L08 L25 L50 L90
Average 49 67 35 55 50 47 45 40
High 57 86 40 60 52 50 48 44
Low 44 54 33 50 47 44 42 38
Ldn: 58 19% 81%
Appendix B‐18
Ambient Noise Monitoring Results ‐ Site 2
Crystal Geyser Bottling Plant
Friday, July 29, 2016
% Daytime Energy: % Nighttime Energy:

Hour Leq Lmax Lmin L02 L08 L25 L50 L90
12:00 AM 46 68 31 55 47 44 42 38
1:00 AM 43 53 31 49 47 44 41 35
2:00 AM 43 53 30 50 48 45 41 36
3:00 AM 53 83 29 57 50 46 43 36
4:00 AM 57 85 34 61 51 48 45 39
5:00 AM 48 72 29 55 51 47 45 40
6:00 AM 51 76 34 57 50 47 45 41
7:00 AM 43 53 35 48 46 44 42 39
8:00 AM 41 54 34 47 44 42 40 37
9:00 AM 43 62 35 49 45 43 41 38
10:00 AM 40 55 33 45 43 41 39 35
11:00 AM 40 53 32 46 43 40 39 34
12:00 PM 41 53 38 46 43 42 41 39
1:00 PM 43 60 38 49 45 43 41 40
2:00 PM 42 55 38 48 44 43 42 40
3:00 PM 43 61 37 49 45 42 41 39
4:00 PM 45 66 38 52 46 43 42 40
5:00 PM 41 50 37 45 43 41 40 38
6:00 PM 45 67 35 53 44 42 41 38
7:00 PM 47 74 37 52 45 43 42 40
8:00 PM 40 50 34 44 43 41 40 37
9:00 PM 54 82 37 58 49 44 42 39
10:00 PM 52 78 35 57 48 44 42 39
11:00 PM 44 53 35 49 47 45 43 39
Daytime Leq Lmax Lmin L02 L08 L25 L50 L90
Average 43 60 36 49 45 42 41 38
High 54 82 38 58 49 44 42 40
Low 40 50 29 44 43 40 39 34
Nighttime Leq Lmax Lmin L02 L08 L25 L50 L90
Average 49 69 32 54 49 45 43 38
High 57 85 35 61 51 48 45 41
Low 43 53 29 49 47 44 41 35
Ldn: 57 31% 69%
Appendix B‐19
Ambient Noise Monitoring Results ‐ Site 2
Crystal Geyser Bottling Plant
Saturday, July 30, 2016
% Daytime Energy: % Nighttime Energy:

Hour Leq Lmax Lmin L02 L08 L25 L50 L90
12:00 AM 45 67 30 51 48 46 43 38
1:00 AM 44 55 30 49 47 45 42 37
2:00 AM 41 52 27 47 45 42 39 34
3:00 AM 54 83 27 59 46 42 39 34
4:00 AM 50 78 29 59 47 43 41 35
5:00 AM 47 72 27 51 48 45 43 37
6:00 AM 44 54 35 49 47 45 43 40
7:00 AM 46 59 33 52 49 47 45 41
8:00 AM 43 60 34 50 45 43 41 38
9:00 AM 43 58 34 47 45 44 42 40
10:00 AM 40 49 34 45 43 41 39 36
11:00 AM 41 50 35 45 43 42 41 38
12:00 PM 42 54 37 47 44 42 41 39
1:00 PM 42 51 36 46 44 42 41 39
2:00 PM 44 64 38 49 46 44 42 40
3:00 PM 45 65 39 51 46 44 43 41
4:00 PM 45 70 38 50 46 44 42 41
5:00 PM 43 55 38 47 45 43 42 40
6:00 PM 45 67 36 53 45 43 42 39
7:00 PM 46 71 37 55 47 43 41 39
8:00 PM 41 51 35 45 43 42 40 38
9:00 PM 44 52 38 48 46 44 43 41
10:00 PM 53 78 35 59 50 46 44 40
11:00 PM 46 70 36 51 48 46 44 39
Daytime Leq Lmax Lmin L02 L08 L25 L50 L90
Average 43 58 36 49 45 43 42 39
High 46 71 39 55 49 47 45 41
Low 40 49 27 45 43 41 39 36
Nighttime Leq Lmax Lmin L02 L08 L25 L50 L90
Average 47 68 31 53 47 44 42 37
High 54 83 36 59 50 46 44 40
Low 41 52 27 47 45 42 39 34
Ldn: 55 33% 67%
Appendix B‐20
Ambient Noise Monitoring Results ‐ Site 2
Crystal Geyser Bottling Plant
Sunday, July 31, 2016
% Daytime Energy: % Nighttime Energy:

Hour Leq Lmax Lmin L02 L08 L25 L50 L90
12:00 AM 54 80 28 62 51 47 45 40
1:00 AM 45 55 29 50 48 46 44 38
2:00 AM 60 85 31 67 58 47 45 40
3:00 AM 45 57 29 50 48 46 44 39
4:00 AM 48 56 36 53 52 50 47 43
5:00 AM 55 78 36 59 54 51 49 45
6:00 AM 55 74 41 63 57 53 51 46
7:00 AM 53 80 40 56 53 50 48 45
8:00 AM 54 82 42 53 50 48 47 45
9:00 AM 49 63 43 53 51 50 49 47
10:00 AM 51 62 43 55 53 51 50 48
11:00 AM 50 58 46 54 53 51 50 48
12:00 PM 50 58 45 54 53 51 50 48
1:00 PM 50 58 44 54 53 51 50 47
2:00 PM 49 64 43 53 52 50 48 46
3:00 PM 49 58 42 52 51 50 49 45
4:00 PM 49 60 41 53 52 50 49 46
5:00 PM 48 62 38 52 50 49 48 45
6:00 PM 48 54 42 51 50 49 47 45
7:00 PM 48 55 41 51 50 49 47 45
8:00 PM 60 82 44 68 56 52 50 47
9:00 PM 64 86 42 75 64 52 50 47
10:00 PM 49 58 40 53 52 50 49 46
11:00 PM 48 57 37 53 51 49 47 44
Daytime Leq Lmax Lmin L02 L08 L25 L50 L90
Average 52 65 42 56 53 50 49 46
High 64 86 46 75 64 52 50 48
Low 48 54 28 51 50 48 47 45
Nighttime Leq Lmax Lmin L02 L08 L25 L50 L90
Average 51 67 34 57 52 49 47 42
High 60 85 41 67 58 53 51 46
Low 45 55 28 50 48 46 44 38
Ldn: 60 69% 31%
Appendix B‐21
Ambient Noise Monitoring Results ‐ Site 3
Crystal Geyser Bottling Plant
Friday, July 22, 2016
% Daytime Energy: % Nighttime Energy:

Hour Leq Lmax Lmin L02 L08 L25 L50 L90
12:00 AM 54 78 37 64 55 49 47 43
1:00 AM 45 55 33 50 48 46 44 40
2:00 AM 44 56 34 50 47 45 43 39
3:00 AM 44 53 34 49 47 45 43 39
4:00 AM 45 56 33 50 49 47 45 40
5:00 AM 44 53 35 49 47 46 44 40
6:00 AM 46 52 37 50 49 47 45 42
7:00 AM 54 79 38 60 52 49 47 44
8:00 AM 48 63 42 52 50 49 47 44
9:00 AM 54 75 44 61 52 50 49 47
10:00 AM 50 60 43 53 52 51 49 47
11:00 AM 49 58 43 53 51 49 48 45
12:00 PM 54 80 43 59 53 51 50 47
1:00 PM 50 56 44 53 52 50 49 47
2:00 PM 49 57 43 53 51 50 48 46
3:00 PM 50 58 43 53 52 50 49 46
4:00 PM 52 72 44 56 52 51 49 47
5:00 PM 49 59 43 52 51 49 48 46
6:00 PM 56 81 42 61 55 50 48 46
7:00 PM 53 79 41 55 50 49 48 45
8:00 PM 49 56 42 53 52 51 49 46
9:00 PM 56 81 41 61 52 50 49 46
10:00 PM 57 80 39 67 56 50 48 45
11:00 PM 48 70 36 57 50 48 46 41
Daytime Leq Lmax Lmin L02 L08 L25 L50 L90
Average 51 68 42 56 52 50 49 46
High 56 81 44 61 55 51 50 47
Low 48 56 33 52 50 49 47 44
Nighttime Leq Lmax Lmin L02 L08 L25 L50 L90
Average 47 62 35 54 50 47 45 41
High 57 80 39 67 56 50 48 45
Low 44 52 33 49 47 45 43 39
Ldn: 57 72% 28%% Daytime Energy: % Nighttime Energy:
Appendix B‐22
Ambient Noise Monitoring Results ‐ Site 3
Crystal Geyser Bottling Plant
Saturday, July 23, 2016

Hour Leq Lmax Lmin L02 L08 L25 L50 L90
12:00 AM 44 63 35 50 47 45 43 40
1:00 AM 42 53 29 48 46 44 41 37
2:00 AM 43 50 27 48 46 44 42 36
3:00 AM 59 87 29 63 47 44 41 35
4:00 AM 45 58 29 50 48 46 44 38
5:00 AM 49 76 28 52 46 44 42 37
6:00 AM 48 55 34 52 51 49 47 42
7:00 AM 51 75 36 56 52 49 47 43
8:00 AM 47 53 39 51 50 48 47 45
9:00 AM 48 55 41 52 50 49 48 45
10:00 AM 49 55 43 53 52 50 49 47
11:00 AM 49 57 42 52 51 50 48 46
12:00 PM 48 54 43 50 49 48 47 45
1:00 PM 45 57 39 49 48 46 44 41
2:00 PM 44 52 35 50 48 44 41 39
3:00 PM 46 58 40 49 48 47 46 43
4:00 PM 45 53 38 49 48 46 45 42
5:00 PM 47 53 40 50 49 48 46 43
6:00 PM 45 51 40 49 47 46 45 43
7:00 PM 44 52 39 47 46 45 44 41
8:00 PM 58 85 39 66 54 47 45 42
9:00 PM 56 82 39 59 52 48 46 42
10:00 PM 54 77 39 62 53 49 47 43
11:00 PM 57 79 36 68 56 51 48 43
Daytime Leq Lmax Lmin L02 L08 L25 L50 L90
Average 48 59 40 52 50 47 46 43
High 58 85 43 66 54 50 49 47
Low 44 51 27 47 46 44 41 39
Nighttime Leq Lmax Lmin L02 L08 L25 L50 L90
Average 49 66 32 55 49 46 44 39
High 59 87 39 68 56 51 48 43
Low 42 50 27 48 46 44 41 35
Ldn: 59 49% 51%% Daytime Energy: % Nighttime Energy:
Appendix B‐23
Ambient Noise Monitoring Results ‐ Site 3
Crystal Geyser Bottling Plant
Sunday, July 24, 2016

Hour Leq Lmax Lmin L02 L08 L25 L50 L90
12:00 AM 50 75 34 54 52 49 47 42
1:00 AM 47 57 30 53 51 48 45 39
2:00 AM 45 55 30 51 49 46 44 38
3:00 AM 57 79 32 66 58 50 47 41
4:00 AM 47 54 34 52 50 48 46 42
5:00 AM 57 80 41 64 55 52 50 45
6:00 AM 55 76 43 61 57 55 52 48
7:00 AM 54 78 43 59 56 52 49 45
8:00 AM 45 62 38 49 47 45 43 41
9:00 AM 42 60 36 46 44 43 41 39
10:00 AM 44 54 37 47 46 45 43 40
11:00 AM 45 62 41 49 47 46 44 43
12:00 PM 46 57 41 49 48 46 45 44
1:00 PM 46 62 40 50 48 46 44 42
2:00 PM 44 62 39 48 47 45 43 41
3:00 PM 44 57 40 48 46 45 44 42
4:00 PM 45 57 39 49 47 45 44 42
5:00 PM 46 53 41 49 48 47 46 44
6:00 PM 45 53 40 49 48 46 45 43
7:00 PM 51 74 37 58 52 46 43 40
8:00 PM 48 64 42 51 50 49 47 45
9:00 PM 47 56 39 51 50 48 47 44
10:00 PM 47 54 38 52 50 49 47 43
11:00 PM 46 59 35 52 50 47 45 41
Daytime Leq Lmax Lmin L02 L08 L25 L50 L90
Average 46 61 39 50 48 46 45 42
High 54 78 43 59 56 52 49 45
Low 42 53 30 46 44 43 41 39
Nighttime Leq Lmax Lmin L02 L08 L25 L50 L90
Average 50 65 35 56 52 49 47 42
High 57 80 43 66 58 55 52 48
Low 45 54 30 51 49 46 44 38
Ldn: 58 34% 66%% Daytime Energy: % Nighttime Energy:
Appendix B‐24
Ambient Noise Monitoring Results ‐ Site 3
Crystal Geyser Bottling Plant
Monday, July 25, 2016

Hour Leq Lmax Lmin L02 L08 L25 L50 L90
12:00 AM 44 53 35 49 47 45 43 39
1:00 AM 55 77 26 65 50 45 43 37
2:00 AM 60 87 29 59 50 46 44 39
3:00 AM 48 72 30 56 48 44 41 37
4:00 AM 48 56 34 53 51 49 47 41
5:00 AM 50 58 40 55 53 51 49 46
6:00 AM 53 72 41 59 56 54 51 46
7:00 AM 54 74 43 62 57 52 50 47
8:00 AM 49 59 41 52 51 50 49 46
9:00 AM 56 79 42 64 53 50 49 47
10:00 AM 49 61 44 53 51 50 49 47
11:00 AM 49 57 42 53 51 50 49 47
12:00 PM 48 60 43 51 50 49 48 46
1:00 PM 47 59 40 51 49 47 46 43
2:00 PM 43 52 35 47 45 44 42 40
3:00 PM 39 49 34 43 42 40 39 37
4:00 PM 45 56 37 50 48 46 44 42
5:00 PM 49 55 44 52 51 50 49 46
6:00 PM 50 55 43 53 52 51 49 47
7:00 PM 48 61 40 51 50 49 48 45
8:00 PM 55 81 39 61 52 50 49 46
9:00 PM 47 61 41 52 49 48 47 44
10:00 PM 60 83 38 70 57 49 47 43
11:00 PM 59 85 32 61 54 51 49 44
Daytime Leq Lmax Lmin L02 L08 L25 L50 L90
Average 49 61 40 53 50 48 47 45
High 56 81 44 64 57 52 50 47
Low 39 49 26 43 42 40 39 37
Nighttime Leq Lmax Lmin L02 L08 L25 L50 L90
Average 53 72 34 58 52 48 46 41
High 60 87 41 70 57 54 51 46
Low 44 53 26 49 47 44 41 37
Ldn: 62 32% 68%% Daytime Energy: % Nighttime Energy:
Appendix B‐25
Ambient Noise Monitoring Results ‐ Site 3
Crystal Geyser Bottling Plant
Tuesday, July 26, 2016

Hour Leq Lmax Lmin L02 L08 L25 L50 L90
12:00 AM 45 53 32 50 48 46 44 40
1:00 AM 53 78 31 60 51 47 45 39
2:00 AM 46 54 28 52 50 48 45 38
3:00 AM 49 57 32 54 52 50 47 42
4:00 AM 47 57 34 53 51 48 46 42
5:00 AM 59 86 38 65 57 53 50 46
6:00 AM 53 60 42 58 56 54 52 48
7:00 AM 52 74 43 56 54 52 50 46
8:00 AM 52 74 43 59 51 49 48 45
9:00 AM 45 54 38 48 47 46 44 41
10:00 AM 45 57 38 49 47 46 44 41
11:00 AM 46 58 42 50 48 47 46 44
12:00 PM 46 60 40 50 48 46 45 42
1:00 PM 48 67 41 55 49 47 46 44
2:00 PM 44 58 38 49 47 45 43 40
3:00 PM 45 59 38 50 47 45 44 41
4:00 PM 50 66 41 59 54 48 47 44
5:00 PM 48 57 43 51 50 49 48 46
6:00 PM 55 83 42 60 52 49 48 46
7:00 PM 46 56 40 50 49 47 45 43
8:00 PM 58 85 41 67 56 52 50 47
9:00 PM 58 81 41 67 60 51 48 44
10:00 PM 47 55 40 50 49 48 46 43
11:00 PM 47 62 37 51 49 48 46 42
Daytime Leq Lmax Lmin L02 L08 L25 L50 L90
Average 49 66 41 55 51 48 46 44
High 58 85 43 67 60 52 50 47
Low 44 54 28 48 47 45 43 40
Nighttime Leq Lmax Lmin L02 L08 L25 L50 L90
Average 50 62 35 55 51 49 47 42
High 59 86 42 65 57 54 52 48
Low 45 53 28 50 48 46 44 38
Ldn: 59 62% 38%
Appendix B‐26
Ambient Noise Monitoring Results ‐ Site 3
Crystal Geyser Bottling Plant
Wednesday, July 27, 2016
% Daytime Energy: % Nighttime Energy:

Hour Leq Lmax Lmin L02 L08 L25 L50 L90
12:00 AM 49 57 39 54 52 50 48 44
1:00 AM 57 83 35 63 55 52 50 45
2:00 AM 53 79 39 57 54 52 49 43
3:00 AM 49 59 31 54 52 50 48 43
4:00 AM 58 81 39 66 55 52 50 45
5:00 AM 55 77 41 58 55 53 51 47
6:00 AM 55 74 45 58 56 55 53 50
7:00 AM 55 81 42 57 54 51 49 46
8:00 AM 54 80 41 62 53 48 46 44
9:00 AM 47 64 37 53 48 46 44 41
10:00 AM 47 62 39 51 49 47 46 43
11:00 AM 46 63 40 51 49 47 45 42
12:00 PM 52 80 38 55 48 46 43 40
1:00 PM 47 60 40 51 49 48 46 43
2:00 PM 47 60 41 52 49 47 46 43
3:00 PM 48 59 42 52 50 48 47 45
4:00 PM 47 61 41 51 49 48 46 44
5:00 PM 47 56 41 50 49 47 46 44
6:00 PM 47 52 41 50 49 48 47 45
7:00 PM 49 67 38 57 50 48 46 43
8:00 PM 60 84 43 70 57 51 48 45
9:00 PM 54 80 42 58 52 50 48 45
10:00 PM 49 62 40 57 51 49 48 44
11:00 PM 48 57 39 52 51 49 47 44
Daytime Leq Lmax Lmin L02 L08 L25 L50 L90
Average 50 67 40 55 50 48 46 44
High 60 84 45 70 57 51 49 46
Low 46 52 31 50 48 46 43 40
Nighttime Leq Lmax Lmin L02 L08 L25 L50 L90
Average 52 70 39 58 54 51 49 45
High 58 83 45 66 56 55 53 50
Low 48 57 31 52 51 49 47 43
Ldn: 60 53% 47%
Appendix B‐27
Ambient Noise Monitoring Results ‐ Site 3
Crystal Geyser Bottling Plant
Thursday, July 28, 2016
% Daytime Energy: % Nighttime Energy:

Hour Leq Lmax Lmin L02 L08 L25 L50 L90
12:00 AM 50 71 38 54 51 50 48 44
1:00 AM 56 86 38 61 54 51 49 44
2:00 AM 59 83 40 62 54 51 49 44
3:00 AM 50 58 37 56 54 52 49 44
4:00 AM 58 80 39 65 55 52 50 45
5:00 AM 51 58 42 56 54 53 51 47
6:00 AM 53 59 42 57 56 55 53 49
7:00 AM 52 65 44 57 55 53 51 47
8:00 AM 49 76 40 55 52 47 45 41
9:00 AM 49 71 38 54 49 46 44 41
10:00 AM 44 61 38 48 47 45 43 40
11:00 AM 51 78 39 57 49 46 44 41
12:00 PM 45 59 39 49 48 46 44 42
1:00 PM 48 66 39 55 49 47 45 42
2:00 PM 47 65 41 51 49 47 46 43
3:00 PM 48 66 40 55 51 48 46 43
4:00 PM 51 80 41 54 48 46 45 43
5:00 PM 45 58 40 48 47 46 45 43
6:00 PM 52 79 39 58 51 46 44 42
7:00 PM 57 85 38 64 54 47 45 43
8:00 PM 46 54 35 52 50 47 43 40
9:00 PM 55 81 39 56 54 51 48 43
10:00 PM 50 57 42 55 53 51 50 46
11:00 PM 55 78 37 63 54 49 47 44
Daytime Leq Lmax Lmin L02 L08 L25 L50 L90
Average 49 70 39 54 50 47 45 42
High 57 85 44 64 55 53 51 47
Low 44 54 35 48 47 45 43 40
Nighttime Leq Lmax Lmin L02 L08 L25 L50 L90
Average 54 70 39 59 54 52 50 45
High 59 86 42 65 56 55 53 49
Low 50 57 37 54 51 49 47 44
Ldn: 61 39% 61%
Appendix B‐28
Ambient Noise Monitoring Results ‐ Site 3
Crystal Geyser Bottling Plant
Friday, July 29, 2016
% Daytime Energy: % Nighttime Energy:

Hour Leq Lmax Lmin L02 L08 L25 L50 L90
12:00 AM 55 84 35 62 54 50 48 43
1:00 AM 48 57 34 53 51 49 47 42
2:00 AM 48 58 33 54 52 49 47 41
3:00 AM 54 79 33 62 54 50 48 41
4:00 AM 59 82 34 66 56 52 49 44
5:00 AM 53 73 31 58 56 53 50 44
6:00 AM 57 83 38 63 54 52 50 46
7:00 AM 48 56 41 52 50 48 47 44
8:00 AM 46 56 39 50 49 47 46 43
9:00 AM 50 73 42 57 50 48 47 45
10:00 AM 45 51 39 49 48 45 44 41
11:00 AM 45 56 36 50 47 46 44 40
12:00 PM 46 59 41 50 48 47 46 44
1:00 PM 47 59 42 52 50 48 46 45
2:00 PM 47 58 42 50 48 47 46 44
3:00 PM 46 57 43 51 48 47 46 44
4:00 PM 52 77 43 57 51 48 47 45
5:00 PM 45 57 41 50 47 46 45 43
6:00 PM 53 78 41 61 49 47 45 43
7:00 PM 54 82 42 59 50 47 46 44
8:00 PM 44 51 38 47 46 45 44 42
9:00 PM 59 85 38 64 55 47 46 43
10:00 PM 59 85 40 62 53 49 47 44
11:00 PM 49 57 39 54 52 51 49 45
Daytime Leq Lmax Lmin L02 L08 L25 L50 L90
Average 49 64 41 53 49 47 46 43
High 59 85 43 64 55 48 47 45
Low 44 51 31 47 46 45 44 40
Nighttime Leq Lmax Lmin L02 L08 L25 L50 L90
Average 54 73 35 59 53 51 48 43
High 59 85 40 66 56 53 50 46
Low 48 57 31 53 51 49 47 41
Ldn: 61 38% 62%
Appendix B‐29
Ambient Noise Monitoring Results ‐ Site 3
Crystal Geyser Bottling Plant
Saturday, July 30, 2016
% Daytime Energy: % Nighttime Energy:

Hour Leq Lmax Lmin L02 L08 L25 L50 L90
12:00 AM 49 68 33 54 52 49 47 42
1:00 AM 46 58 31 52 49 47 44 38
2:00 AM 44 55 29 50 48 45 43 36
3:00 AM 58 85 30 64 50 46 44 38
4:00 AM 53 77 32 61 51 48 45 38
5:00 AM 49 72 29 54 51 49 46 41
6:00 AM 49 56 38 53 52 50 48 45
7:00 AM 51 65 36 60 53 51 48 45
8:00 AM 48 63 37 52 50 49 47 45
9:00 AM 48 58 42 51 50 49 48 46
10:00 AM 45 52 38 49 48 46 44 41
11:00 AM 46 52 40 49 48 47 46 43
12:00 PM 46 55 42 50 48 47 46 44
1:00 PM 46 56 41 50 48 47 46 44
2:00 PM 49 67 43 56 50 48 47 45
3:00 PM 51 75 43 58 50 48 47 45
4:00 PM 51 80 44 56 50 48 47 45
5:00 PM 47 56 43 51 49 48 47 45
6:00 PM 55 84 41 60 50 47 46 44
7:00 PM 53 80 41 61 53 47 46 44
8:00 PM 44 53 39 48 46 45 44 42
9:00 PM 45 57 40 50 48 46 45 42
10:00 PM 55 80 39 63 51 48 46 43
11:00 PM 48 62 36 55 52 49 47 42
Daytime Leq Lmax Lmin L02 L08 L25 L50 L90
Average 48 64 41 53 49 47 46 44
High 55 84 44 61 53 51 48 46
Low 44 52 29 48 46 45 44 41
Nighttime Leq Lmax Lmin L02 L08 L25 L50 L90
Average 50 68 33 56 51 48 46 40
High 58 85 39 64 52 50 48 45
Low 44 55 29 50 48 45 43 36
Ldn: 58 48% 52%
Appendix B‐30
Ambient Noise Monitoring Results ‐ Site 3
Crystal Geyser Bottling Plant
Sunday, July 31, 2016
% Daytime Energy: % Nighttime Energy:

Hour Leq Lmax Lmin L02 L08 L25 L50 L90
12:00 AM 71 99 32 80 56 53 51 44
1:00 AM 74 99 31 84 58 53 50 43
2:00 AM 50 61 30 56 53 51 48 42
3:00 AM 51 67 35 57 54 52 49 43
4:00 AM 68 96 36 77 56 53 51 45
5:00 AM 75 102 39 81 60 56 53 48
6:00 AM 69 99 43 66 60 58 56 52
7:00 AM 75 103 46 81 59 57 55 52
8:00 AM 55 63 46 59 58 56 55 52
9:00 AM 80 108 47 89 60 57 55 52
10:00 AM 69 98 49 78 60 58 57 54
11:00 AM 58 66 50 61 60 58 57 55
12:00 PM 57 67 51 61 60 58 57 55
1:00 PM 56 62 50 59 58 57 56 53
2:00 PM 56 68 48 60 58 57 55 52
3:00 PM 75 104 47 82 59 56 55 51
4:00 PM 54 65 45 58 56 55 53 50
5:00 PM 54 66 45 59 57 55 54 50
6:00 PM 73 101 45 80 57 54 52 49
7:00 PM 54 65 44 58 57 55 53 48
8:00 PM 71 97 46 81 58 56 55 51
9:00 PM 55 65 43 59 58 56 55 51
10:00 PM 79 107 41 83 58 56 53 49
11:00 PM 71 96 36 83 58 55 52 47
Daytime Leq Lmax Lmin L02 L08 L25 L50 L90
Average 63 80 47 68 58 56 55 52
High 80 108 51 89 60 58 57 55
Low 54 62 30 58 56 54 52 48
Nighttime Leq Lmax Lmin L02 L08 L25 L50 L90
Average 67 92 36 74 57 54 52 46
High 79 107 43 84 60 58 56 52
Low 50 61 30 56 53 51 48 42
Ldn: 79 57% 43%% Daytime Energy: % Nighttime Energy:
Appendix B‐31
Ambient Noise Monitoring Results ‐ Site 4
Crystal Geyser Bottling Plant
Wednesday, June 14, 2017

Hour Leq Lmax Lmin L02 L08 L25 L50 L90
12:00 AM 63 92 34 58 55 53 50 42
1:00 AM 51 63 34 57 55 52 50 43
2:00 AM 51 60 32 56 55 52 50 41
3:00 AM 74 101 36 84 57 53 50 43
4:00 AM 52 61 34 57 55 53 50 45
5:00 AM 80 107 36 84 74 54 50 45
6:00 AM 50 62 38 57 54 51 49 44
7:00 AM 54 67 45 60 57 55 54 50
8:00 AM 65 92 47 61 58 55 53 51
9:00 AM 53 66 43 59 56 53 51 47
10:00 AM 52 64 44 59 56 53 51 47
11:00 AM 54 68 47 59 56 54 53 50
12:00 PM 73 102 46 77 60 55 53 49
1:00 PM 54 65 46 60 57 55 52 48
2:00 PM 69 98 44 76 58 54 52 49
3:00 PM 53 64 45 58 56 54 52 49
4:00 PM 73 99 48 81 61 56 54 50
5:00 PM 54 68 46 59 57 54 52 49
6:00 PM 53 67 44 58 56 54 51 48
7:00 PM 51 63 39 57 55 52 50 46
8:00 PM 75 102 42 85 57 54 52 49
9:00 PM 78 107 41 83 58 55 53 50
10:00 PM 54 61 39 58 57 55 53 49
11:00 PM 76 103 37 86 56 53 51 44
Daytime Leq Lmax Lmin L02 L08 L25 L50 L90
Average 61 80 44 66 57 54 52 49
High 78 107 48 85 61 56 54 51
Low 51 63 32 57 55 52 50 46
Nighttime Leq Lmax Lmin L02 L08 L25 L50 L90
Average 61 79 36 66 57 53 50 44
High 80 107 39 86 74 55 53 49
Low 50 60 32 56 54 51 49 41
Ldn: 79 48% 52%
Appendix B‐32
Ambient Noise Monitoring Results ‐ Site 4
Crystal Geyser Bottling Plant
Thursday, June 15, 2017
% Daytime Energy: % Nighttime Energy:

Hour Leq Lmax Lmin L02 L08 L25 L50 L90
12:00 AM 61 89 36 60 55 52 50 45
1:00 AM 51 60 33 57 54 52 50 44
2:00 AM 49 67 35 56 53 50 47 41
3:00 AM 77 106 34 62 55 52 49 42
4:00 AM 73 100 33 79 57 53 50 44
5:00 AM 78 106 37 83 58 55 52 46
6:00 AM 54 64 43 59 57 55 54 50
7:00 AM 75 104 47 85 59 57 55 51
8:00 AM 78 102 48 87 75 58 56 53
9:00 AM 75 104 50 83 60 57 56 53
10:00 AM 57 68 51 60 59 58 57 54
11:00 AM 58 78 51 61 59 58 57 55
12:00 PM 57 69 51 61 59 58 57 55
1:00 PM 73 98 49 80 59 57 56 54
2:00 PM 55 67 47 60 58 56 55 51
3:00 PM 58 81 51 61 59 57 56 54
4:00 PM 70 97 51 78 60 58 57 55
5:00 PM 57 67 51 60 59 58 57 55
6:00 PM 57 64 46 60 59 58 56 53
7:00 PM 74 101 46 84 59 57 56 52
8:00 PM 55 63 45 59 58 56 55 52
9:00 PM 55 62 44 59 58 56 55 51
10:00 PM 55 62 42 59 58 56 55 51
11:00 PM 78 103 39 87 81 57 54 50
Daytime Leq Lmax Lmin L02 L08 L25 L50 L90
Average 64 82 48 69 60 57 56 53
High 78 104 51 87 75 58 57 55
Low 55 62 33 59 58 56 55 51
Nighttime Leq Lmax Lmin L02 L08 L25 L50 L90
Average 64 84 37 67 59 54 51 46
High 78 106 43 87 81 57 55 51
Low 49 60 33 56 53 50 47 41
Ldn: 80 48% 52%
Appendix B‐33
Ambient Noise Monitoring Results ‐ Site 4
Crystal Geyser Bottling Plant
Friday, June 16, 2017
% Daytime Energy: % Nighttime Energy:

Hour Leq Lmax Lmin L02 L08 L25 L50 L90
12:00 AM 50 72 33 56 53 50 48 42
1:00 AM 46 56 33 52 50 48 45 40
2:00 AM 48 58 32 54 52 49 47 40
3:00 AM 60 84 34 69 59 53 49 43
4:00 AM 50 58 33 55 53 51 49 44
5:00 AM 60 87 37 64 57 54 51 45
6:00 AM 60 88 44 64 58 54 52 48
7:00 AM 58 83 42 62 57 54 51 46
8:00 AM 44 57 36 48 46 44 43 40
9:00 AM 44 64 37 49 45 43 42 39
10:00 AM 44 55 37 49 47 45 43 40
11:00 AM 46 59 40 51 47 46 44 42
12:00 PM 58 72 42 68 64 50 47 44
1:00 PM 48 68 41 53 48 46 45 43
2:00 PM 47 67 38 54 49 47 45 41
3:00 PM 48 60 41 53 50 49 48 44
4:00 PM 46 60 39 51 48 47 45 42
5:00 PM 47 55 42 51 49 48 46 44
6:00 PM 47 62 40 51 49 47 46 43
7:00 PM 54 81 38 60 50 47 45 41
8:00 PM 47 61 38 52 50 48 47 44
9:00 PM 47 55 38 51 50 48 46 43
10:00 PM 47 54 36 51 50 48 46 42
11:00 PM 45 55 33 51 49 46 44 39
Daytime Leq Lmax Lmin L02 L08 L25 L50 L90
Average 48 64 39 54 50 47 46 43
High 58 83 44 68 64 54 51 46
Low 44 55 32 48 45 43 42 39
Nighttime Leq Lmax Lmin L02 L08 L25 L50 L90
Average 52 68 35 57 53 50 48 43
High 60 88 44 69 59 54 52 48
Low 45 54 32 51 49 46 44 39
Ldn: 62 36% 64%
Appendix B‐34
Ambient Noise Monitoring Results ‐ Site 4
Crystal Geyser Bottling Plant
Saturday, June 17, 2017
% Daytime Energy: % Nighttime Energy:

Hour Leq Lmax Lmin L02 L08 L25 L50 L90
12:00 AM 61 87 37 56 53 50 47 42
1:00 AM 46 56 34 52 49 47 44 39
2:00 AM 75 102 34 83 53 50 46 39
3:00 AM 74 104 32 77 50 47 44 37
4:00 AM 74 102 34 84 53 45 43 38
5:00 AM 48 59 36 54 51 49 47 43
6:00 AM 63 90 40 59 57 55 53 48
7:00 AM 54 65 41 59 57 55 53 49
8:00 AM 54 66 44 60 57 55 53 49
9:00 AM 74 102 47 78 59 57 55 52
10:00 AM 57 64 50 60 59 58 57 55
11:00 AM 58 68 52 61 60 59 58 55
12:00 PM 73 101 50 80 60 58 57 55
1:00 PM 57 64 48 60 59 58 57 54
2:00 PM 57 69 51 60 59 57 56 54
3:00 PM 57 68 48 60 59 57 56 54
4:00 PM 56 75 49 60 58 57 55 53
5:00 PM 55 71 47 59 57 56 55 52
6:00 PM 70 96 45 82 58 56 54 51
7:00 PM 54 63 45 58 56 55 53 50
8:00 PM 76 100 43 85 74 56 54 50
9:00 PM 52 61 43 57 55 53 52 48
10:00 PM 52 71 40 57 55 53 51 46
11:00 PM 76 104 38 83 56 54 53 47
Daytime Leq Lmax Lmin L02 L08 L25 L50 L90
Average 60 76 47 65 59 56 55 52
High 76 102 52 85 74 59 58 55
Low 52 61 32 57 55 53 52 48
Nighttime Leq Lmax Lmin L02 L08 L25 L50 L90
Average 63 86 36 67 53 50 47 42
High 76 104 40 84 57 55 53 48
Low 46 56 32 52 49 45 43 37
Ldn: 77 44% 56%
Appendix B‐35
Ambient Noise Monitoring Results ‐ Site 4
Crystal Geyser Bottling Plant
Sunday, June 18, 2017
% Daytime Energy: % Nighttime Energy:

Hour Leq Lmax Lmin L02 L08 L25 L50 L90
12:00 AM 62 88 34 58 54 52 49 43
1:00 AM 50 60 35 56 54 51 48 40
2:00 AM 47 58 34 53 51 49 46 37
3:00 AM 50 63 35 56 54 51 48 39
4:00 AM 79 102 38 88 58 54 52 45
5:00 AM 54 66 38 60 58 56 53 47
6:00 AM 65 91 41 62 58 56 54 51
7:00 AM 77 103 45 87 75 56 55 51
8:00 AM 78 104 44 88 61 56 54 51
9:00 AM 55 65 47 59 58 56 54 50
10:00 AM 54 69 46 59 56 54 53 50
11:00 AM 51 63 42 56 54 52 50 47
12:00 PM 52 65 43 58 55 53 51 47
1:00 PM 52 62 43 58 55 53 51 47
2:00 PM 72 97 45 84 58 54 52 49
3:00 PM 78 108 42 84 57 53 50 45
4:00 PM 53 78 45 58 55 53 51 48
5:00 PM 52 62 43 57 55 53 51 47
6:00 PM 54 69 45 60 57 55 53 49
7:00 PM 55 65 44 59 58 56 55 51
8:00 PM 77 104 47 87 59 57 55 52
9:00 PM 73 101 42 84 58 56 54 49
10:00 PM 53 64 42 58 56 54 52 48
11:00 PM 51 61 42 56 54 52 50 47
Daytime Leq Lmax Lmin L02 L08 L25 L50 L90
Average 62 81 44 69 58 54 53 49
High 78 108 47 88 75 57 55 52
Low 51 62 34 56 54 52 50 45
Nighttime Leq Lmax Lmin L02 L08 L25 L50 L90
Average 57 73 38 61 55 53 50 44
High 79 102 42 88 58 56 54 51
Low 47 58 34 53 51 49 46 37
Ldn: 76 78% 22%% Daytime Energy: % Nighttime Energy:
Appendix B‐36
Ambient Noise Monitoring Results ‐ Site 4
Crystal Geyser Bottling Plant
Monday, June 19, 2017
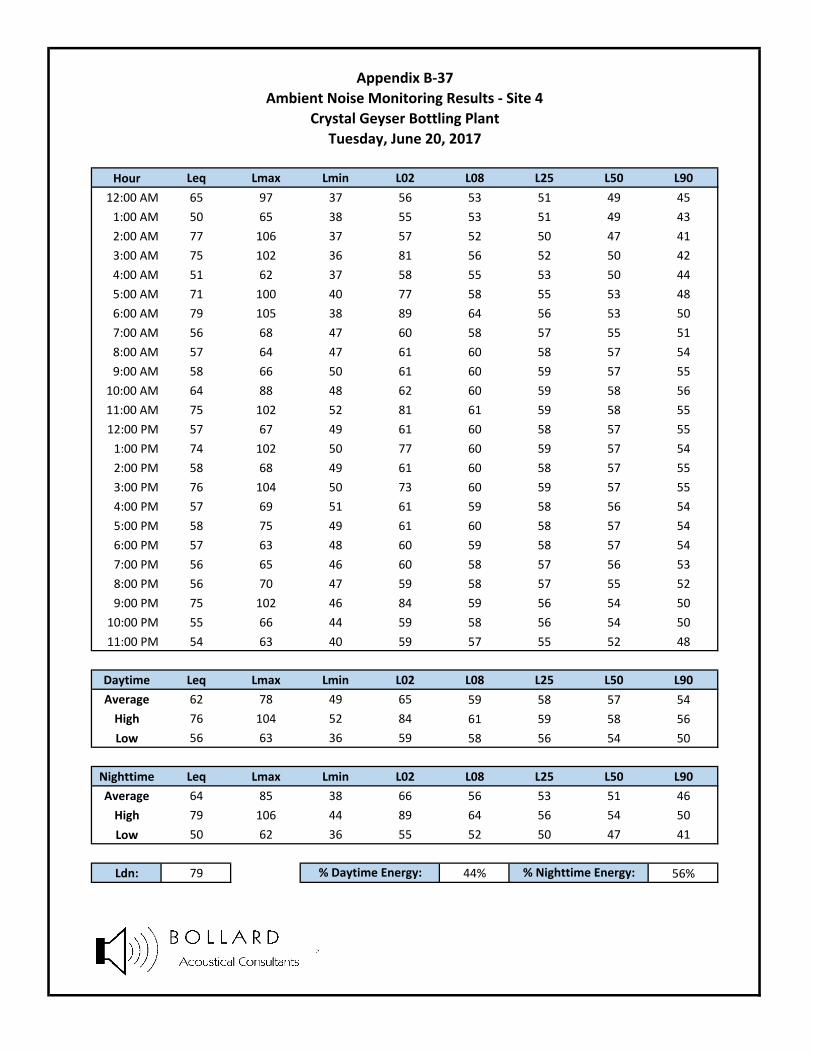
Hour Leq Lmax Lmin L02 L08 L25 L50 L90
12:00 AM 65 97 37 56 53 51 49 45
1:00 AM 50 65 38 55 53 51 49 43
2:00 AM 77 106 37 57 52 50 47 41
3:00 AM 75 102 36 81 56 52 50 42
4:00 AM 51 62 37 58 55 53 50 44
5:00 AM 71 100 40 77 58 55 53 48
6:00 AM 79 105 38 89 64 56 53 50
7:00 AM 56 68 47 60 58 57 55 51
8:00 AM 57 64 47 61 60 58 57 54
9:00 AM 58 66 50 61 60 59 57 55
10:00 AM 64 88 48 62 60 59 58 56
11:00 AM 75 102 52 81 61 59 58 55
12:00 PM 57 67 49 61 60 58 57 55
1:00 PM 74 102 50 77 60 59 57 54
2:00 PM 58 68 49 61 60 58 57 55
3:00 PM 76 104 50 73 60 59 57 55
4:00 PM 57 69 51 61 59 58 56 54
5:00 PM 58 75 49 61 60 58 57 54
6:00 PM 57 63 48 60 59 58 57 54
7:00 PM 56 65 46 60 58 57 56 53
8:00 PM 56 70 47 59 58 57 55 52
9:00 PM 75 102 46 84 59 56 54 50
10:00 PM 55 66 44 59 58 56 54 50
11:00 PM 54 63 40 59 57 55 52 48
Daytime Leq Lmax Lmin L02 L08 L25 L50 L90
Average 62 78 49 65 59 58 57 54
High 76 104 52 84 61 59 58 56
Low 56 63 36 59 58 56 54 50
Nighttime Leq Lmax Lmin L02 L08 L25 L50 L90
Average 64 85 38 66 56 53 51 46
High 79 106 44 89 64 56 54 50
Low 50 62 36 55 52 50 47 41
Ldn: 79 44% 56%% Daytime Energy: % Nighttime Energy:
Appendix B‐37
Ambient Noise Monitoring Results ‐ Site 4
Crystal Geyser Bottling Plant
Tuesday, June 20, 2017

Hour Leq Lmax Lmin L02 L08 L25 L50 L90
12:00 AM 46 70 27 55 45 42 39 34
1:00 AM 46 69 29 54 46 42 40 35
2:00 AM 41 63 28 46 43 40 38 33
3:00 AM 43 58 26 48 46 44 42 35
4:00 AM 48 70 31 55 50 47 43 36
5:00 AM 57 83 35 61 55 50 48 42
6:00 AM 53 76 40 61 53 49 48 45
7:00 AM 51 71 36 61 54 47 45 41
8:00 AM 48 68 33 58 52 44 42 38
9:00 AM 48 67 36 58 52 46 44 41
10:00 AM 49 67 39 57 53 48 46 43
11:00 AM 48 63 40 56 52 48 46 43
12:00 PM 49 65 41 57 52 48 46 44
1:00 PM 50 68 35 59 54 48 45 40
2:00 PM 51 71 35 61 53 47 44 39
3:00 PM 63 100 37 56 52 46 43 39
4:00 PM 46 62 35 55 50 45 42 38
5:00 PM 48 67 34 57 52 45 43 40
6:00 PM 47 67 36 56 51 45 42 39
7:00 PM 45 63 34 55 48 42 40 37
8:00 PM 47 63 35 56 50 45 43 39
9:00 PM 46 64 37 53 48 46 44 40
10:00 PM 56 80 34 66 54 46 44 40
11:00 PM 48 66 31 59 50 45 42 38
Daytime Leq Lmax Lmin L02 L08 L25 L50 L90
Average 49 68 36 57 52 46 44 40
High 63 100 41 61 54 48 46 44
Low 45 62 26 53 48 42 40 37
Nighttime Leq Lmax Lmin L02 L08 L25 L50 L90
Average 49 71 31 56 49 45 43 38
High 57 83 40 66 55 50 48 45
Low 41 58 26 46 43 40 38 33
Ldn: 59 67% 33%
Appendix B‐38
Ambient Noise Monitoring Results ‐ Site 5
Crystal Geyser Bottling Plant
Wednesday, June 14, 2017
% Daytime Energy: % Nighttime Energy:

Hour Leq Lmax Lmin L02 L08 L25 L50 L90
12:00 AM 44 67 28 49 45 43 41 35
1:00 AM 42 58 30 48 45 43 41 37
2:00 AM 43 64 28 49 45 43 41 35
3:00 AM 49 73 34 58 50 46 45 41
4:00 AM 46 62 33 55 49 45 43 39
5:00 AM 50 74 33 58 49 46 44 41
6:00 AM 46 63 32 54 50 46 42 36
7:00 AM 49 68 30 58 56 47 42 35
8:00 AM 47 64 30 56 51 45 41 36
9:00 AM 46 67 33 56 50 43 39 35
10:00 AM 46 62 35 55 50 43 40 37
11:00 AM 47 61 39 55 50 46 44 41
12:00 PM 48 67 37 57 53 45 43 40
1:00 PM 46 65 37 55 50 44 42 39
2:00 PM 47 64 39 57 51 45 43 41
3:00 PM 47 65 38 55 51 45 42 40
4:00 PM 50 66 39 57 54 49 46 42
5:00 PM 48 66 38 56 52 47 43 40
6:00 PM 46 63 35 56 50 42 40 38
7:00 PM 44 61 31 55 46 39 37 34
8:00 PM 47 67 32 56 49 44 41 37
9:00 PM 52 77 37 60 54 50 48 44
10:00 PM 46 60 37 52 49 46 44 41
11:00 PM 49 68 34 58 53 46 43 38
Daytime Leq Lmax Lmin L02 L08 L25 L50 L90
Average 47 66 35 56 51 45 42 39
High 52 77 39 60 56 50 48 44
Low 44 61 28 55 46 39 37 34
Nighttime Leq Lmax Lmin L02 L08 L25 L50 L90
Average 46 65 32 53 48 45 43 38
High 50 74 37 58 53 46 45 41
Low 42 58 28 48 45 43 41 35
Ldn: 53 67% 33%% Daytime Energy: % Nighttime Energy:
Appendix B‐39
Ambient Noise Monitoring Results ‐ Site 5
Crystal Geyser Bottling Plant
Thursday, June 15, 2017

Hour Leq Lmax Lmin L02 L08 L25 L50 L90
12:00 AM 43 62 28 49 46 43 41 36
1:00 AM 42 56 28 48 45 43 41 36
2:00 AM 40 59 30 46 43 41 38 34
3:00 AM 53 79 31 55 45 42 39 35
4:00 AM 43 61 29 50 46 43 41 34
5:00 AM 50 73 34 58 49 45 43 39
6:00 AM 48 70 37 54 49 47 46 42
7:00 AM 54 81 34 60 52 47 45 41
8:00 AM 52 78 39 60 53 48 45 42
9:00 AM 48 68 37 56 51 46 44 41
10:00 AM 49 65 40 57 52 47 45 43
11:00 AM 49 70 41 57 52 48 46 44
12:00 PM 48 62 40 56 51 47 46 43
1:00 PM 48 65 38 56 51 47 45 42
2:00 PM 47 66 36 56 51 45 43 39
3:00 PM 48 65 39 57 51 47 45 42
4:00 PM 51 71 40 58 54 49 46 43
5:00 PM 51 70 40 59 54 49 47 44
6:00 PM 48 73 35 55 51 47 45 42
7:00 PM 48 72 39 57 51 47 45 42
8:00 PM 45 59 36 54 47 45 43 40
9:00 PM 47 61 38 55 51 48 45 41
10:00 PM 49 63 36 57 52 48 46 44
11:00 PM 54 77 38 64 57 49 46 42
Daytime Leq Lmax Lmin L02 L08 L25 L50 L90
Average 49 68 38 57 52 47 45 42
High 54 81 41 60 54 49 47 44
Low 45 59 28 54 47 45 43 39
Nighttime Leq Lmax Lmin L02 L08 L25 L50 L90
Average 47 67 32 53 48 45 42 38
High 54 79 38 64 57 49 46 44
Low 40 56 28 46 43 41 38 34
Ldn: 56 65% 35%% Daytime Energy: % Nighttime Energy:
Appendix B‐40
Ambient Noise Monitoring Results ‐ Site 5
Crystal Geyser Bottling Plant
Friday, June 16, 2017

Hour Leq Lmax Lmin L02 L08 L25 L50 L90
12:00 AM 46 58 34 52 48 46 44 40
1:00 AM 48 62 36 56 52 49 46 42
2:00 AM 46 60 34 53 50 46 44 40
3:00 AM 43 62 33 48 45 43 41 37
4:00 AM 44 61 32 51 47 44 42 38
5:00 AM 52 75 37 60 53 47 45 42
6:00 AM 48 60 38 56 51 48 46 43
7:00 AM 49 64 38 56 52 49 47 43
8:00 AM 48 64 40 55 51 48 46 43
9:00 AM 51 75 42 58 54 50 47 45
10:00 AM 53 74 43 60 56 52 49 46
11:00 AM 53 67 43 60 57 53 50 46
12:00 PM 53 68 42 60 57 53 49 45
1:00 PM 53 71 42 61 58 53 50 45
2:00 PM 53 69 42 59 56 53 50 46
3:00 PM 50 67 41 57 54 50 47 44
4:00 PM 51 64 41 59 55 50 47 44
5:00 PM 50 68 39 58 54 50 46 43
6:00 PM 48 62 38 56 52 47 44 41
7:00 PM 51 77 38 58 54 49 46 42
8:00 PM 49 66 38 58 53 49 46 42
9:00 PM 51 71 40 59 54 49 46 43
10:00 PM 46 67 36 54 50 46 43 40
11:00 PM 45 65 34 52 47 44 42 37
Daytime Leq Lmax Lmin L02 L08 L25 L50 L90
Average 51 69 40 58 54 50 47 44
High 53 77 43 61 58 53 50 46
Low 48 62 32 55 51 47 44 41
Nighttime Leq Lmax Lmin L02 L08 L25 L50 L90
Average 47 63 35 53 49 46 44 40
High 52 75 38 60 53 49 46 43
Low 43 58 32 48 45 43 41 37
Ldn: 55 80% 20%% Daytime Energy: % Nighttime Energy:
Appendix B‐41
Ambient Noise Monitoring Results ‐ Site 5
Crystal Geyser Bottling Plant
Saturday, June 17, 2017

Hour Leq Lmax Lmin L02 L08 L25 L50 L90
12:00 AM 43 64 30 49 45 42 39 34
1:00 AM 38 59 28 44 37 34 32 30
2:00 AM 42 65 28 51 43 39 36 32
3:00 AM 42 65 27 45 41 38 34 30
4:00 AM 40 61 28 50 44 35 33 30
5:00 AM 38 59 28 44 40 37 35 32
6:00 AM 44 64 33 49 46 43 41 38
7:00 AM 47 63 37 54 51 47 45 41
8:00 AM 48 68 38 56 51 47 45 41
9:00 AM 50 67 39 58 54 49 46 43
10:00 AM 50 69 42 57 54 50 47 44
11:00 AM 51 67 42 58 55 51 48 45
12:00 PM 51 72 41 59 54 49 46 43
1:00 PM 48 67 37 56 51 47 45 42
2:00 PM 47 62 39 54 49 46 44 42
3:00 PM 54 67 40 60 59 56 47 43
4:00 PM 60 66 38 64 63 62 61 42
5:00 PM 57 66 36 62 61 59 56 40
6:00 PM 53 65 36 59 59 57 45 40
7:00 PM 47 61 36 58 50 44 42 39
8:00 PM 52 77 37 60 52 46 43 40
9:00 PM 46 63 33 55 49 46 43 38
10:00 PM 43 60 32 51 44 41 39 35
11:00 PM 46 68 30 55 46 39 36 33
Daytime Leq Lmax Lmin L02 L08 L25 L50 L90
Average 51 67 38 58 54 50 47 42
High 60 77 42 64 63 62 61 45
Low 46 61 27 54 49 44 42 38
Nighttime Leq Lmax Lmin L02 L08 L25 L50 L90
Average 42 63 30 49 43 39 36 33
High 46 68 33 55 46 43 41 38
Low 38 59 27 44 37 34 32 30
Ldn: 53 95% 5%% Daytime Energy: % Nighttime Energy:
Appendix B‐42
Ambient Noise Monitoring Results ‐ Site 5
Crystal Geyser Bottling Plant
Sunday, June 18, 2017

Hour Leq Lmax Lmin L02 L08 L25 L50 L90
12:00 AM 40 60 28 45 41 39 37 33
1:00 AM 38 54 29 42 41 38 37 32
2:00 AM 45 75 27 45 39 36 34 30
3:00 AM 42 55 28 48 45 43 40 35
4:00 AM 51 75 33 59 48 43 41 38
5:00 AM 46 63 38 54 48 45 44 41
6:00 AM 49 65 38 59 53 47 44 41
7:00 AM 50 67 36 60 55 49 46 41
8:00 AM 50 70 34 58 53 47 44 40
9:00 AM 49 69 34 59 52 44 41 36
10:00 AM 50 68 33 58 56 48 41 37
11:00 AM 56 67 33 63 62 60 42 35
12:00 PM 56 67 35 64 64 50 40 37
1:00 PM 61 66 33 65 64 64 62 37
2:00 PM 46 64 36 54 50 45 42 39
3:00 PM 50 70 34 58 55 48 41 37
4:00 PM 46 63 36 55 51 43 41 38
5:00 PM 47 67 33 57 52 43 39 36
6:00 PM 47 60 36 55 52 47 42 38
7:00 PM 48 66 39 56 51 47 45 42
8:00 PM 48 68 38 56 50 46 44 41
9:00 PM 51 71 39 58 55 51 47 43
10:00 PM 48 69 38 53 49 47 46 43
11:00 PM 47 63 38 54 50 47 45 42
Daytime Leq Lmax Lmin L02 L08 L25 L50 L90
Average 50 67 35 58 55 49 44 38
High 61 71 39 65 64 64 62 43
Low 46 60 27 54 50 43 39 35
Nighttime Leq Lmax Lmin L02 L08 L25 L50 L90
Average 45 64 33 51 46 43 41 37
High 51 75 38 59 53 47 46 43
Low 38 54 27 42 39 36 34 30
Ldn: 55 88% 12%
Appendix B‐43
Ambient Noise Monitoring Results ‐ Site 5
Crystal Geyser Bottling Plant
Monday, June 19, 2017
% Daytime Energy: % Nighttime Energy:
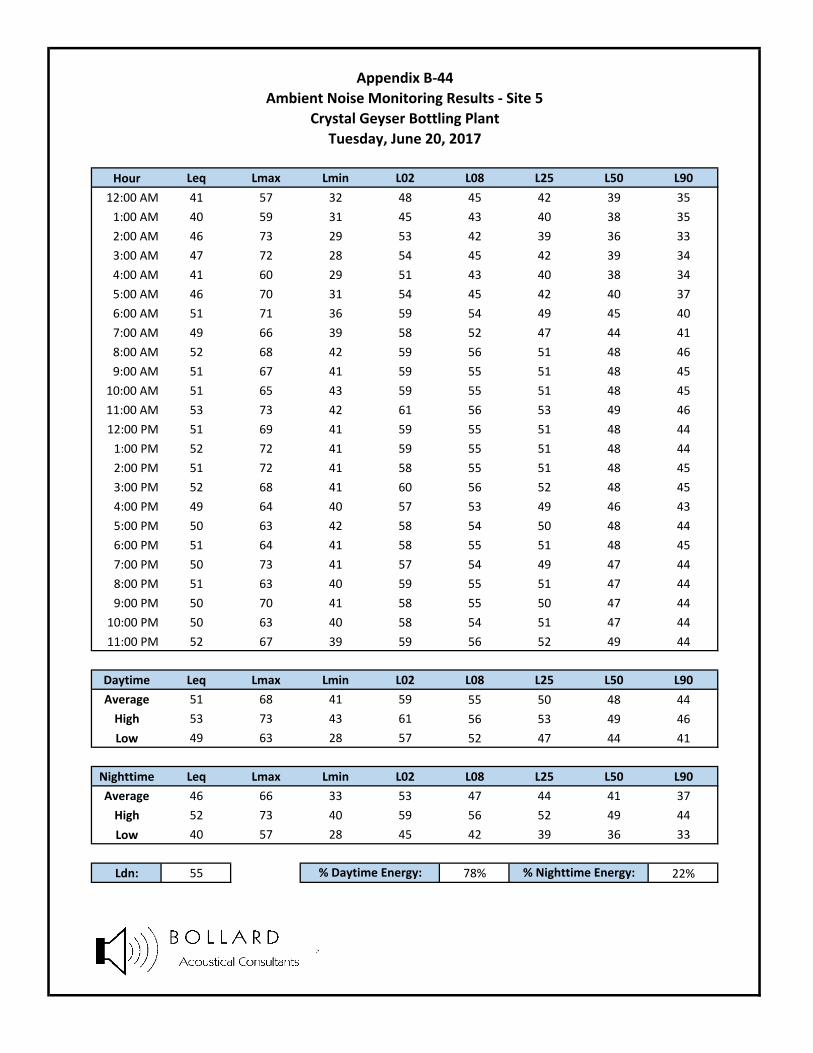
Hour Leq Lmax Lmin L02 L08 L25 L50 L90
12:00 AM 41 57 32 48 45 42 39 35
1:00 AM 40 59 31 45 43 40 38 35
2:00 AM 46 73 29 53 42 39 36 33
3:00 AM 47 72 28 54 45 42 39 34
4:00 AM 41 60 29 51 43 40 38 34
5:00 AM 46 70 31 54 45 42 40 37
6:00 AM 51 71 36 59 54 49 45 40
7:00 AM 49 66 39 58 52 47 44 41
8:00 AM 52 68 42 59 56 51 48 46
9:00 AM 51 67 41 59 55 51 48 45
10:00 AM 51 65 43 59 55 51 48 45
11:00 AM 53 73 42 61 56 53 49 46
12:00 PM 51 69 41 59 55 51 48 44
1:00 PM 52 72 41 59 55 51 48 44
2:00 PM 51 72 41 58 55 51 48 45
3:00 PM 52 68 41 60 56 52 48 45
4:00 PM 49 64 40 57 53 49 46 43
5:00 PM 50 63 42 58 54 50 48 44
6:00 PM 51 64 41 58 55 51 48 45
7:00 PM 50 73 41 57 54 49 47 44
8:00 PM 51 63 40 59 55 51 47 44
9:00 PM 50 70 41 58 55 50 47 44
10:00 PM 50 63 40 58 54 51 47 44
11:00 PM 52 67 39 59 56 52 49 44
Daytime Leq Lmax Lmin L02 L08 L25 L50 L90
Average 51 68 41 59 55 50 48 44
High 53 73 43 61 56 53 49 46
Low 49 63 28 57 52 47 44 41
Nighttime Leq Lmax Lmin L02 L08 L25 L50 L90
Average 46 66 33 53 47 44 41 37
High 52 73 40 59 56 52 49 44
Low 40 57 28 45 42 39 36 33
Ldn: 55 78% 22%
Appendix B‐44
Ambient Noise Monitoring Results ‐ Site 5
Crystal Geyser Bottling Plant
Tuesday, June 20, 2017
% Daytime Energy: % Nighttime Energy:

Hour Leq Lmax Lmin L02 L08 L25 L50 L90
12:00 AM 47 68 34 55 51 47 44 39
1:00 AM 48 72 35 54 50 46 43 39
2:00 AM 48 65 37 56 53 49 45 41
3:00 AM 50 64 39 56 53 50 48 44
4:00 AM 51 65 38 58 55 51 47 42
5:00 AM 50 66 39 57 54 51 48 44
6:00 AM 53 71 41 60 57 53 49 45
7:00 AM 54 70 44 62 58 54 50 47
8:00 AM 53 66 42 60 57 53 50 46
9:00 AM 53 74 42 60 57 52 50 46
10:00 AM 53 64 44 60 58 54 51 48
11:00 AM 54 70 44 60 57 54 51 47
12:00 PM 51 67 42 59 55 51 48 45
1:00 PM 53 73 44 60 56 53 50 46
2:00 PM 53 69 43 60 56 53 50 46
3:00 PM 53 75 43 60 56 52 49 46
4:00 PM 51 65 43 59 55 51 48 45
5:00 PM 51 66 42 58 55 51 48 45
6:00 PM 52 73 42 60 56 51 48 45
7:00 PM 50 65 41 59 54 50 47 44
8:00 PM 48 66 37 55 51 47 45 42
9:00 PM 49 71 37 57 53 49 46 42
10:00 PM 44 63 34 51 46 42 40 37
11:00 PM 46 64 33 54 48 45 42 38
Daytime Leq Lmax Lmin L02 L08 L25 L50 L90
Average 52 69 42 59 56 52 49 45
High 54 75 44 62 58 54 51 48
Low 48 64 33 55 51 47 45 42
Nighttime Leq Lmax Lmin L02 L08 L25 L50 L90
Average 48 66 37 56 52 48 45 41
High 53 72 41 60 57 53 49 45
Low 44 63 33 51 46 42 40 37
Ldn: 56 77% 23%
Appendix B‐45
Ambient Noise Monitoring Results ‐ Site 5
Crystal Geyser Bottling Plant
Wednesday, June 21, 2017
% Daytime Energy: % Nighttime Energy:

Ldn: 60
Appendix C-1Ambient Noise Monitoring Results - Site 1
Crystal Geyser Bottling PlantFriday, July 22, 2016
30
40
50
60
70
80
90
100
12:00AM
1:00AM
2:00AM
3:00AM
4:00AM
5:00AM
6:00AM
7:00AM
8:00AM
9:00AM
10:00AM
11:00AM
12:00PM
1:00PM
2:00PM
3:00PM
4:00PM
5:00PM
6:00PM
7:00PM
8:00PM
9:00PM
10:00PM
11:00PM
Soun
d Le
vel,
dBA
Hour of Day
Lmax Leq L50 L90

Ldn: 56
Appendix C-2Ambient Noise Monitoring Results - Site 1
Crystal Geyser Bottling PlantSaturday, July 23, 2016
30
40
50
60
70
80
90
100
12:00AM
1:00AM
2:00AM
3:00AM
4:00AM
5:00AM
6:00AM
7:00AM
8:00AM
9:00AM
10:00AM
11:00AM
12:00PM
1:00PM
2:00PM
3:00PM
4:00PM
5:00PM
6:00PM
7:00PM
8:00PM
9:00PM
10:00PM
11:00PM
Soun
d Le
vel,
dBA
Hour of Day
Lmax Leq L50 L90

Ldn: 60
Appendix C-3Ambient Noise Monitoring Results - Site 1
Crystal Geyser Bottling PlantSunday, July 24, 2016
30
40
50
60
70
80
90
100
12:00AM
1:00AM
2:00AM
3:00AM
4:00AM
5:00AM
6:00AM
7:00AM
8:00AM
9:00AM
10:00AM
11:00AM
12:00PM
1:00PM
2:00PM
3:00PM
4:00PM
5:00PM
6:00PM
7:00PM
8:00PM
9:00PM
10:00PM
11:00PM
Soun
d Le
vel,
dBA
Hour of Day
Lmax Leq L50 L90

Ldn: 62
Appendix C-4Ambient Noise Monitoring Results - Site 1
Crystal Geyser Bottling PlantMonday, July 25, 2016
30
40
50
60
70
80
90
100
12:00AM
1:00AM
2:00AM
3:00AM
4:00AM
5:00AM
6:00AM
7:00AM
8:00AM
9:00AM
10:00AM
11:00AM
12:00PM
1:00PM
2:00PM
3:00PM
4:00PM
5:00PM
6:00PM
7:00PM
8:00PM
9:00PM
10:00PM
11:00PM
Soun
d Le
vel,
dBA
Hour of Day
Lmax Leq L50 L90

Ldn: 61
Appendix C-5Ambient Noise Monitoring Results - Site 1
Crystal Geyser Bottling PlantTuesday, July 26, 2016
30
40
50
60
70
80
90
100
12:00AM
1:00AM
2:00AM
3:00AM
4:00AM
5:00AM
6:00AM
7:00AM
8:00AM
9:00AM
10:00AM
11:00AM
12:00PM
1:00PM
2:00PM
3:00PM
4:00PM
5:00PM
6:00PM
7:00PM
8:00PM
9:00PM
10:00PM
11:00PM
Soun
d Le
vel,
dBA
Hour of Day
Lmax Leq L50 L90

Ldn: 60
Appendix C-6Ambient Noise Monitoring Results - Site 1
Crystal Geyser Bottling PlantWednesday, July 27, 2016
30
40
50
60
70
80
90
100
12:00AM
1:00AM
2:00AM
3:00AM
4:00AM
5:00AM
6:00AM
7:00AM
8:00AM
9:00AM
10:00AM
11:00AM
12:00PM
1:00PM
2:00PM
3:00PM
4:00PM
5:00PM
6:00PM
7:00PM
8:00PM
9:00PM
10:00PM
11:00PM
Soun
d Le
vel,
dBA
Hour of Day
Lmax Leq L50 L90
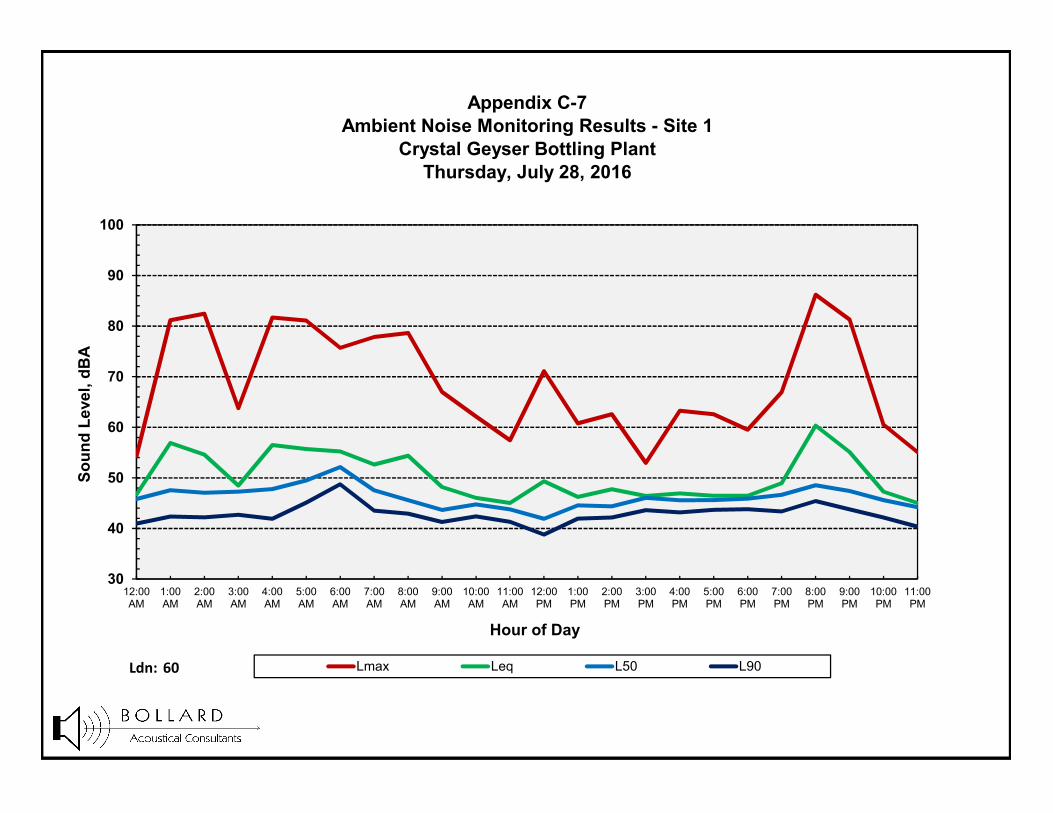
Ldn: 60
Appendix C-7Ambient Noise Monitoring Results - Site 1
Crystal Geyser Bottling PlantThursday, July 28, 2016
30
40
50
60
70
80
90
100
12:00AM
1:00AM
2:00AM
3:00AM
4:00AM
5:00AM
6:00AM
7:00AM
8:00AM
9:00AM
10:00AM
11:00AM
12:00PM
1:00PM
2:00PM
3:00PM
4:00PM
5:00PM
6:00PM
7:00PM
8:00PM
9:00PM
10:00PM
11:00PM
Soun
d Le
vel,
dBA
Hour of Day
Lmax Leq L50 L90

Ldn: 63
Appendix C-8Ambient Noise Monitoring Results - Site 1
Crystal Geyser Bottling PlantFriday, July 29, 2016
30
40
50
60
70
80
90
100
12:00AM
1:00AM
2:00AM
3:00AM
4:00AM
5:00AM
6:00AM
7:00AM
8:00AM
9:00AM
10:00AM
11:00AM
12:00PM
1:00PM
2:00PM
3:00PM
4:00PM
5:00PM
6:00PM
7:00PM
8:00PM
9:00PM
10:00PM
11:00PM
Soun
d Le
vel,
dBA
Hour of Day
Lmax Leq L50 L90

Ldn: 64
Appendix C-9Ambient Noise Monitoring Results - Site 1
Crystal Geyser Bottling PlantSaturday, July 30, 2016
30
40
50
60
70
80
90
100
12:00AM
1:00AM
2:00AM
3:00AM
4:00AM
5:00AM
6:00AM
7:00AM
8:00AM
9:00AM
10:00AM
11:00AM
12:00PM
1:00PM
2:00PM
3:00PM
4:00PM
5:00PM
6:00PM
7:00PM
8:00PM
9:00PM
10:00PM
11:00PM
Soun
d Le
vel,
dBA
Hour of Day
Lmax Leq L50 L90

Ldn: 60
Appendix C-10Ambient Noise Monitoring Results - Site 1
Crystal Geyser Bottling PlantSunday, July 31, 2016
30
40
50
60
70
80
90
100
12:00AM
1:00AM
2:00AM
3:00AM
4:00AM
5:00AM
6:00AM
7:00AM
8:00AM
9:00AM
10:00AM
11:00AM
12:00PM
1:00PM
2:00PM
3:00PM
4:00PM
5:00PM
6:00PM
7:00PM
8:00PM
9:00PM
10:00PM
11:00PM
Soun
d Le
vel,
dBA
Hour of Day
Lmax Leq L50 L90

Ldn: 55
Appendix C-11Ambient Noise Monitoring Results - Site 2
Crystal Geyser Bottling PlantFriday, July 22, 2016
30
40
50
60
70
80
90
12:00AM
1:00AM
2:00AM
3:00AM
4:00AM
5:00AM
6:00AM
7:00AM
8:00AM
9:00AM
10:00AM
11:00AM
12:00PM
1:00PM
2:00PM
3:00PM
4:00PM
5:00PM
6:00PM
7:00PM
8:00PM
9:00PM
10:00PM
11:00PM
Soun
d Le
vel,
dBA
Hour of Day
Lmax Leq L50 L90
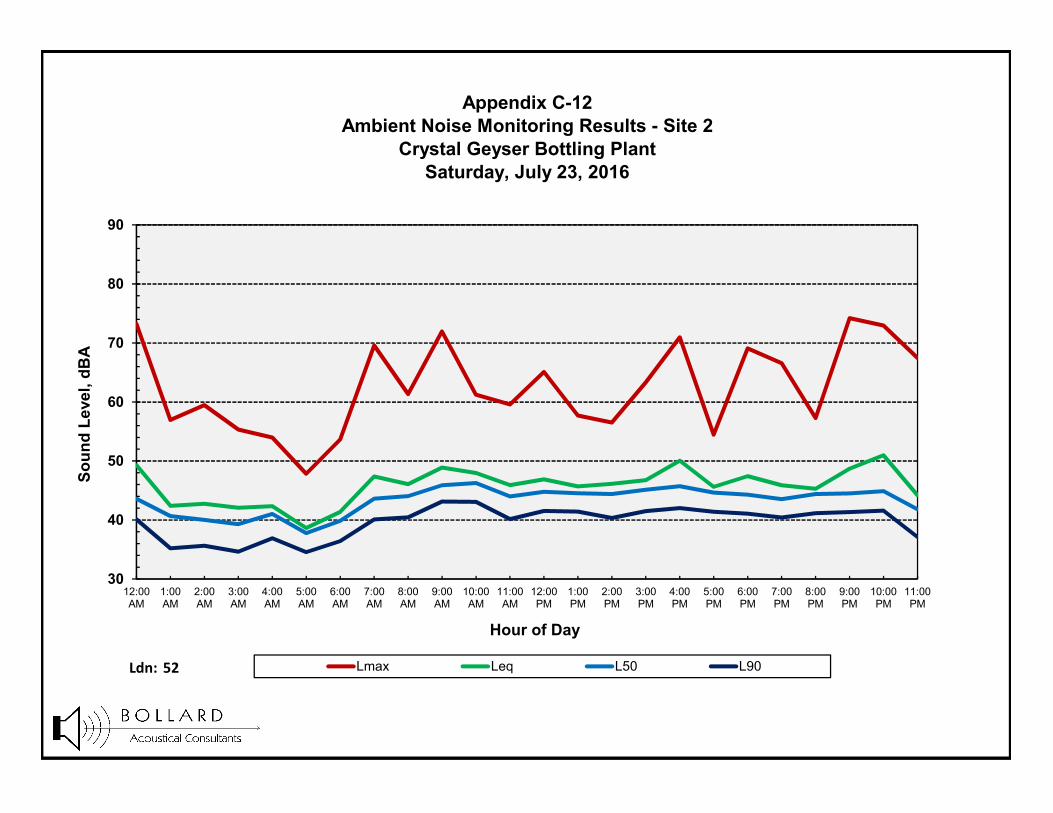
Ldn: 52
Appendix C-12Ambient Noise Monitoring Results - Site 2
Crystal Geyser Bottling PlantSaturday, July 23, 2016
30
40
50
60
70
80
90
12:00AM
1:00AM
2:00AM
3:00AM
4:00AM
5:00AM
6:00AM
7:00AM
8:00AM
9:00AM
10:00AM
11:00AM
12:00PM
1:00PM
2:00PM
3:00PM
4:00PM
5:00PM
6:00PM
7:00PM
8:00PM
9:00PM
10:00PM
11:00PM
Soun
d Le
vel,
dBA
Hour of Day
Lmax Leq L50 L90
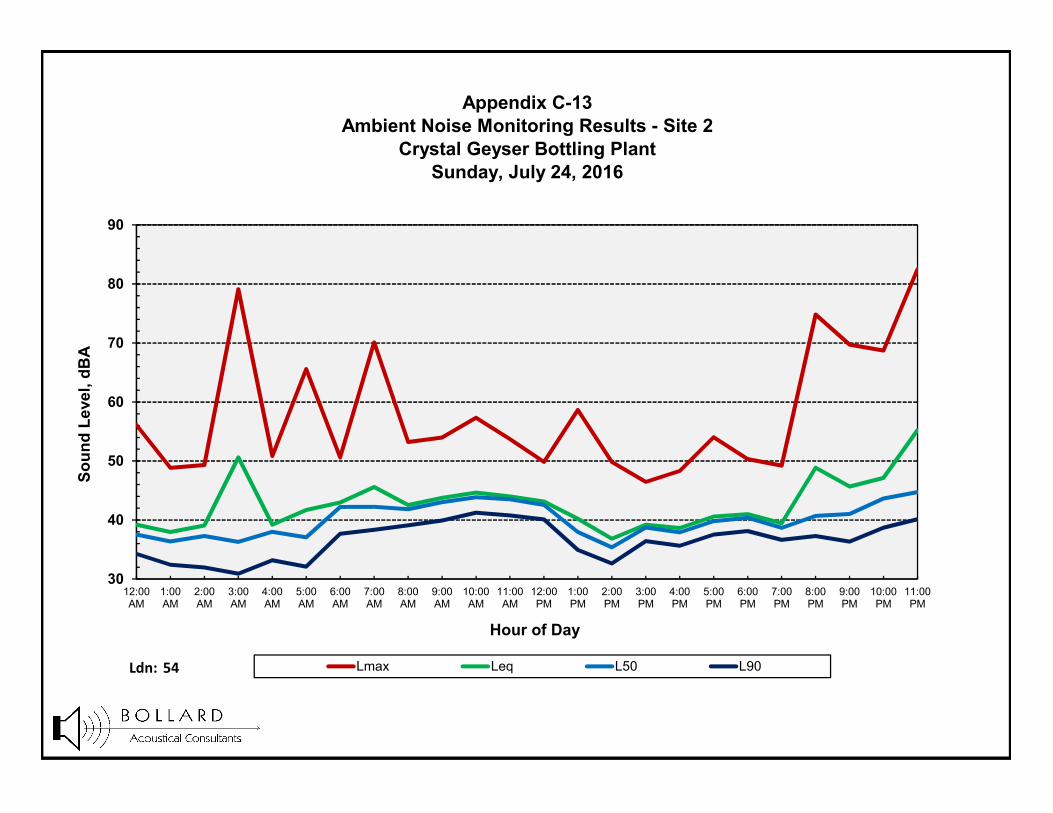
Ldn: 54
Appendix C-13Ambient Noise Monitoring Results - Site 2
Crystal Geyser Bottling PlantSunday, July 24, 2016
30
40
50
60
70
80
90
12:00AM
1:00AM
2:00AM
3:00AM
4:00AM
5:00AM
6:00AM
7:00AM
8:00AM
9:00AM
10:00AM
11:00AM
12:00PM
1:00PM
2:00PM
3:00PM
4:00PM
5:00PM
6:00PM
7:00PM
8:00PM
9:00PM
10:00PM
11:00PM
Soun
d Le
vel,
dBA
Hour of Day
Lmax Leq L50 L90
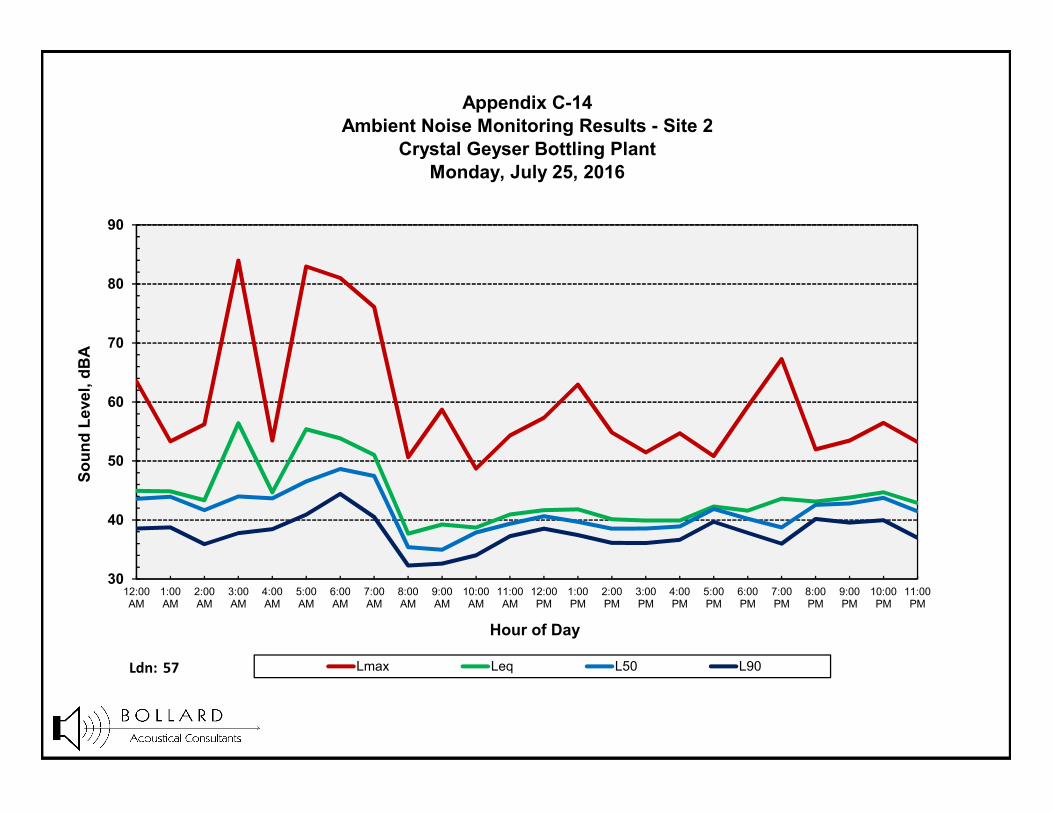
Ldn: 57
Appendix C-14Ambient Noise Monitoring Results - Site 2
Crystal Geyser Bottling PlantMonday, July 25, 2016
30
40
50
60
70
80
90
12:00AM
1:00AM
2:00AM
3:00AM
4:00AM
5:00AM
6:00AM
7:00AM
8:00AM
9:00AM
10:00AM
11:00AM
12:00PM
1:00PM
2:00PM
3:00PM
4:00PM
5:00PM
6:00PM
7:00PM
8:00PM
9:00PM
10:00PM
11:00PM
Soun
d Le
vel,
dBA
Hour of Day
Lmax Leq L50 L90

Ldn: 55
Appendix C-15Ambient Noise Monitoring Results - Site 2
Crystal Geyser Bottling PlantTuesday, July 26, 2016
30
40
50
60
70
80
90
12:00AM
1:00AM
2:00AM
3:00AM
4:00AM
5:00AM
6:00AM
7:00AM
8:00AM
9:00AM
10:00AM
11:00AM
12:00PM
1:00PM
2:00PM
3:00PM
4:00PM
5:00PM
6:00PM
7:00PM
8:00PM
9:00PM
10:00PM
11:00PM
Soun
d Le
vel,
dBA
Hour of Day
Lmax Leq L50 L90
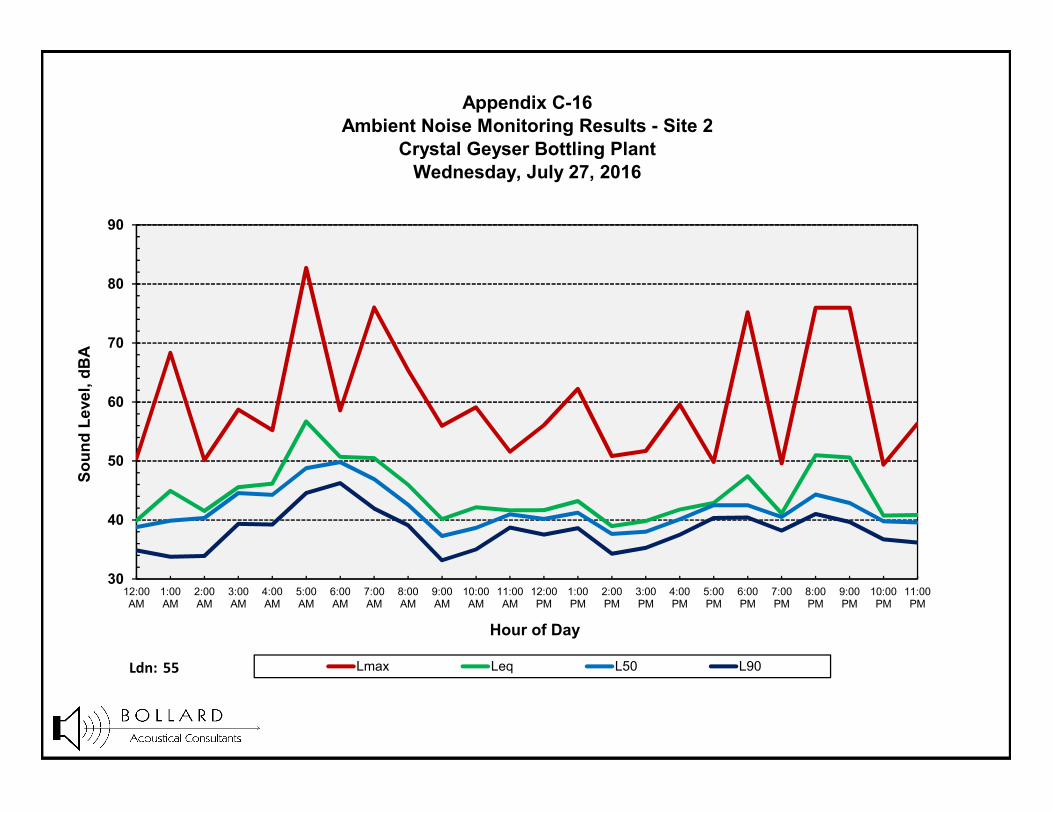
Ldn: 55
Appendix C-16Ambient Noise Monitoring Results - Site 2
Crystal Geyser Bottling PlantWednesday, July 27, 2016
30
40
50
60
70
80
90
12:00AM
1:00AM
2:00AM
3:00AM
4:00AM
5:00AM
6:00AM
7:00AM
8:00AM
9:00AM
10:00AM
11:00AM
12:00PM
1:00PM
2:00PM
3:00PM
4:00PM
5:00PM
6:00PM
7:00PM
8:00PM
9:00PM
10:00PM
11:00PM
Soun
d Le
vel,
dBA
Hour of Day
Lmax Leq L50 L90
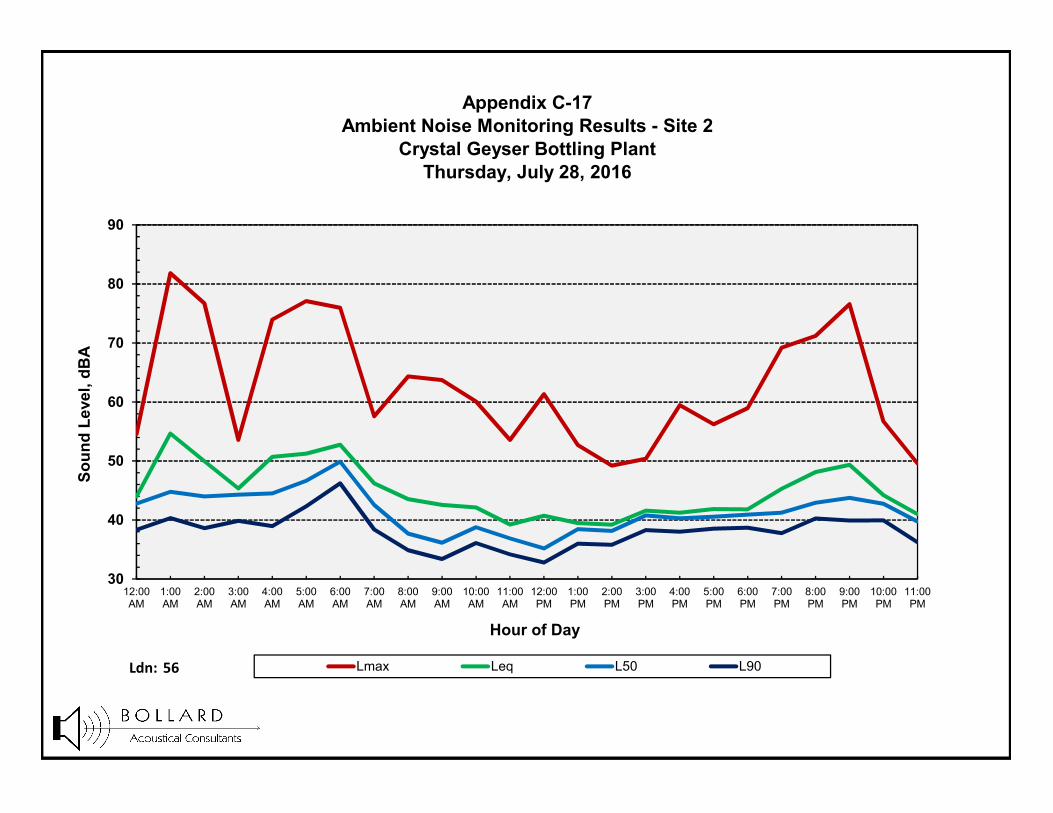
Ldn: 56
Appendix C-17Ambient Noise Monitoring Results - Site 2
Crystal Geyser Bottling PlantThursday, July 28, 2016
30
40
50
60
70
80
90
12:00AM
1:00AM
2:00AM
3:00AM
4:00AM
5:00AM
6:00AM
7:00AM
8:00AM
9:00AM
10:00AM
11:00AM
12:00PM
1:00PM
2:00PM
3:00PM
4:00PM
5:00PM
6:00PM
7:00PM
8:00PM
9:00PM
10:00PM
11:00PM
Soun
d Le
vel,
dBA
Hour of Day
Lmax Leq L50 L90

Ldn: 58
Appendix C-18Ambient Noise Monitoring Results - Site 2
Crystal Geyser Bottling PlantFriday, July 29, 2016
30
40
50
60
70
80
90
12:00AM
1:00AM
2:00AM
3:00AM
4:00AM
5:00AM
6:00AM
7:00AM
8:00AM
9:00AM
10:00AM
11:00AM
12:00PM
1:00PM
2:00PM
3:00PM
4:00PM
5:00PM
6:00PM
7:00PM
8:00PM
9:00PM
10:00PM
11:00PM
Soun
d Le
vel,
dBA
Hour of Day
Lmax Leq L50 L90
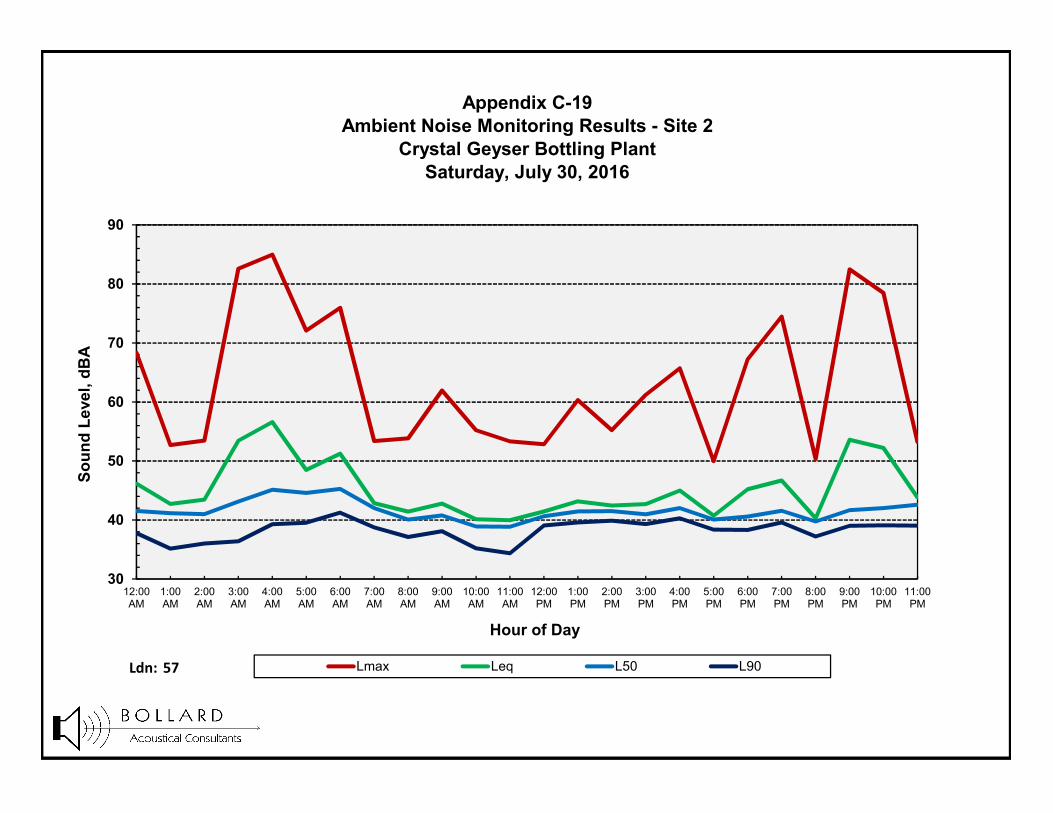
Ldn: 57
Appendix C-19Ambient Noise Monitoring Results - Site 2
Crystal Geyser Bottling PlantSaturday, July 30, 2016
30
40
50
60
70
80
90
12:00AM
1:00AM
2:00AM
3:00AM
4:00AM
5:00AM
6:00AM
7:00AM
8:00AM
9:00AM
10:00AM
11:00AM
12:00PM
1:00PM
2:00PM
3:00PM
4:00PM
5:00PM
6:00PM
7:00PM
8:00PM
9:00PM
10:00PM
11:00PM
Soun
d Le
vel,
dBA
Hour of Day
Lmax Leq L50 L90

Ldn: 55
Appendix C-20Ambient Noise Monitoring Results - Site 2
Crystal Geyser Bottling PlantSunday, July 31, 2016
30
40
50
60
70
80
90
12:00AM
1:00AM
2:00AM
3:00AM
4:00AM
5:00AM
6:00AM
7:00AM
8:00AM
9:00AM
10:00AM
11:00AM
12:00PM
1:00PM
2:00PM
3:00PM
4:00PM
5:00PM
6:00PM
7:00PM
8:00PM
9:00PM
10:00PM
11:00PM
Soun
d Le
vel,
dBA
Hour of Day
Lmax Leq L50 L90
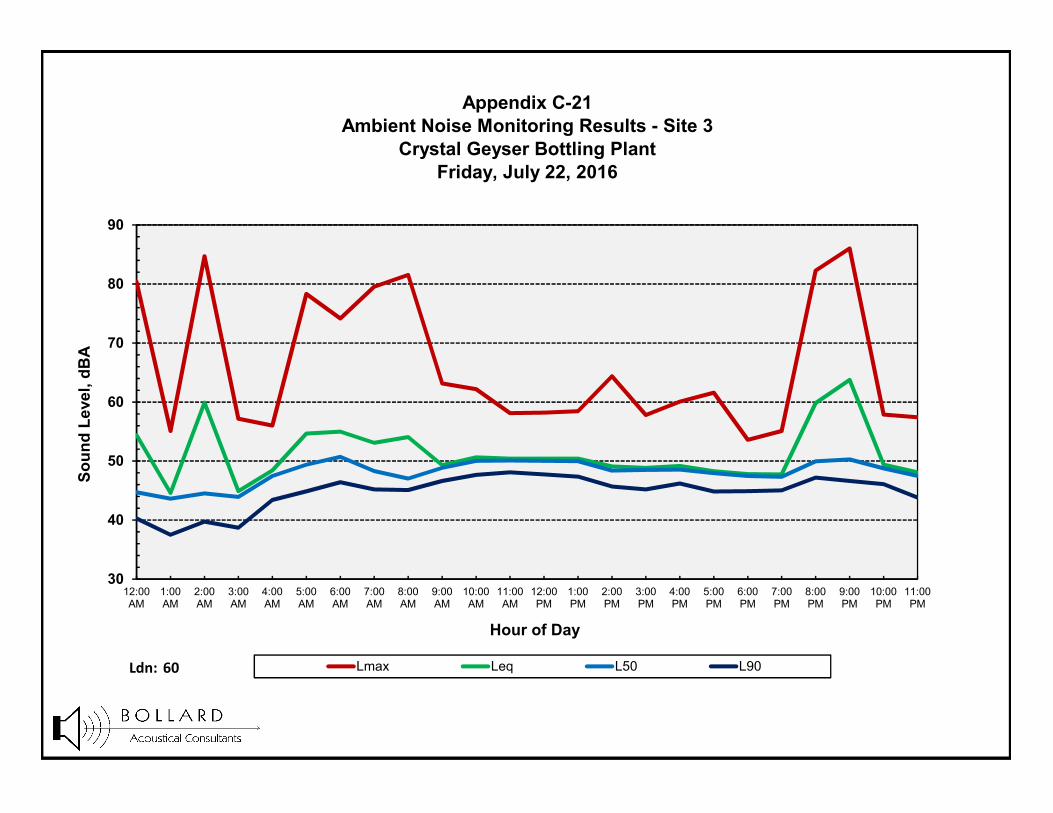
Ldn: 60
Appendix C-21Ambient Noise Monitoring Results - Site 3
Crystal Geyser Bottling PlantFriday, July 22, 2016
30
40
50
60
70
80
90
12:00AM
1:00AM
2:00AM
3:00AM
4:00AM
5:00AM
6:00AM
7:00AM
8:00AM
9:00AM
10:00AM
11:00AM
12:00PM
1:00PM
2:00PM
3:00PM
4:00PM
5:00PM
6:00PM
7:00PM
8:00PM
9:00PM
10:00PM
11:00PM
Soun
d Le
vel,
dBA
Hour of Day
Lmax Leq L50 L90
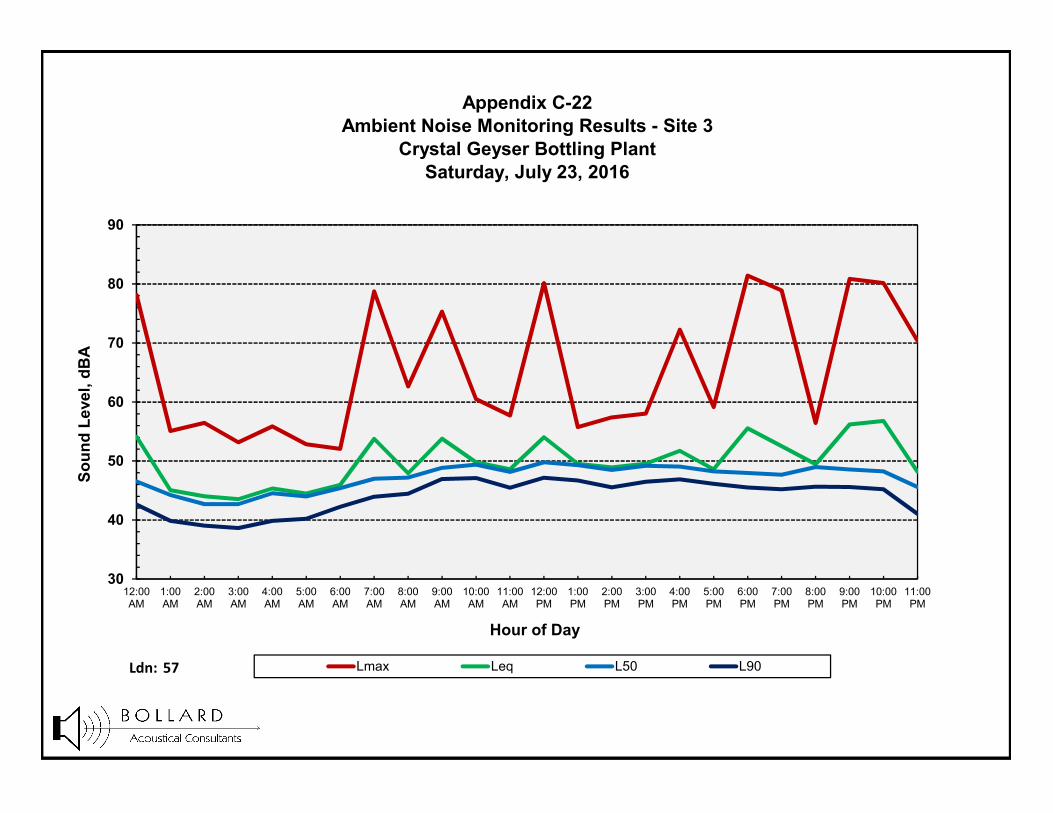
Ldn: 57
Appendix C-22Ambient Noise Monitoring Results - Site 3
Crystal Geyser Bottling PlantSaturday, July 23, 2016
30
40
50
60
70
80
90
12:00AM
1:00AM
2:00AM
3:00AM
4:00AM
5:00AM
6:00AM
7:00AM
8:00AM
9:00AM
10:00AM
11:00AM
12:00PM
1:00PM
2:00PM
3:00PM
4:00PM
5:00PM
6:00PM
7:00PM
8:00PM
9:00PM
10:00PM
11:00PM
Soun
d Le
vel,
dBA
Hour of Day
Lmax Leq L50 L90
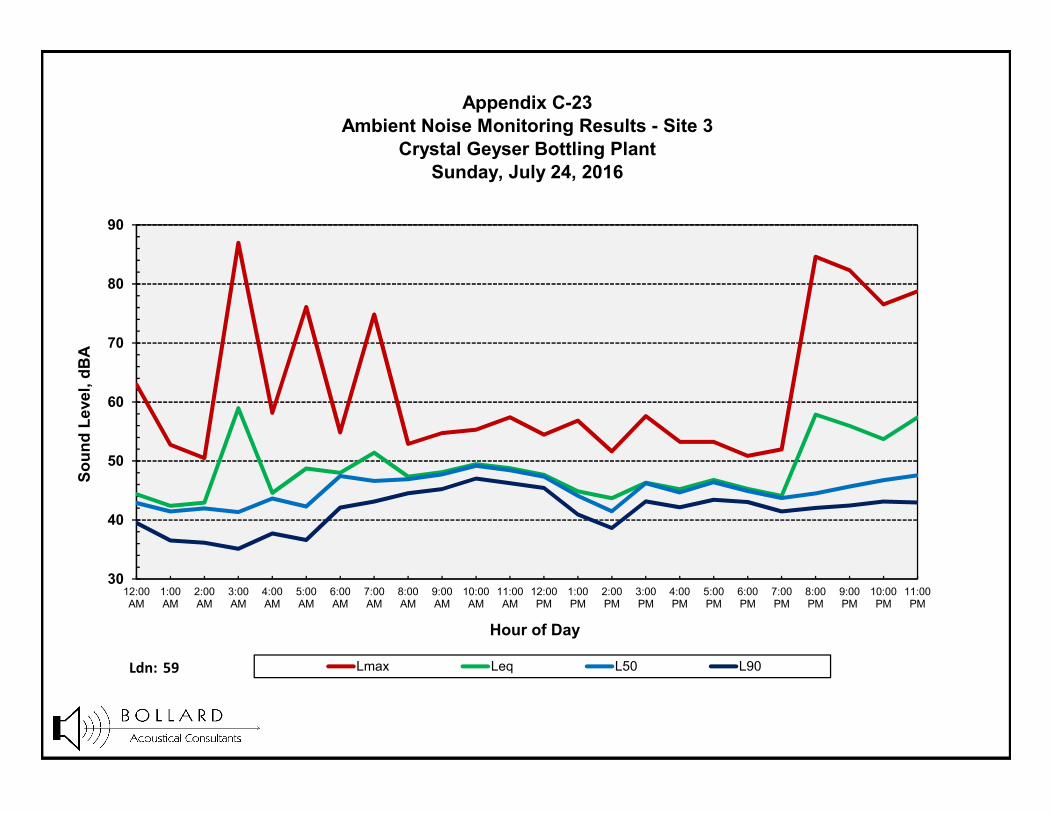
Ldn: 59
Appendix C-23Ambient Noise Monitoring Results - Site 3
Crystal Geyser Bottling PlantSunday, July 24, 2016
30
40
50
60
70
80
90
12:00AM
1:00AM
2:00AM
3:00AM
4:00AM
5:00AM
6:00AM
7:00AM
8:00AM
9:00AM
10:00AM
11:00AM
12:00PM
1:00PM
2:00PM
3:00PM
4:00PM
5:00PM
6:00PM
7:00PM
8:00PM
9:00PM
10:00PM
11:00PM
Soun
d Le
vel,
dBA
Hour of Day
Lmax Leq L50 L90

Ldn: 58
Appendix C-24Ambient Noise Monitoring Results - Site 3
Crystal Geyser Bottling PlantMonday, July 25, 2016
30
40
50
60
70
80
90
12:00AM
1:00AM
2:00AM
3:00AM
4:00AM
5:00AM
6:00AM
7:00AM
8:00AM
9:00AM
10:00AM
11:00AM
12:00PM
1:00PM
2:00PM
3:00PM
4:00PM
5:00PM
6:00PM
7:00PM
8:00PM
9:00PM
10:00PM
11:00PM
Soun
d Le
vel,
dBA
Hour of Day
Lmax Leq L50 L90
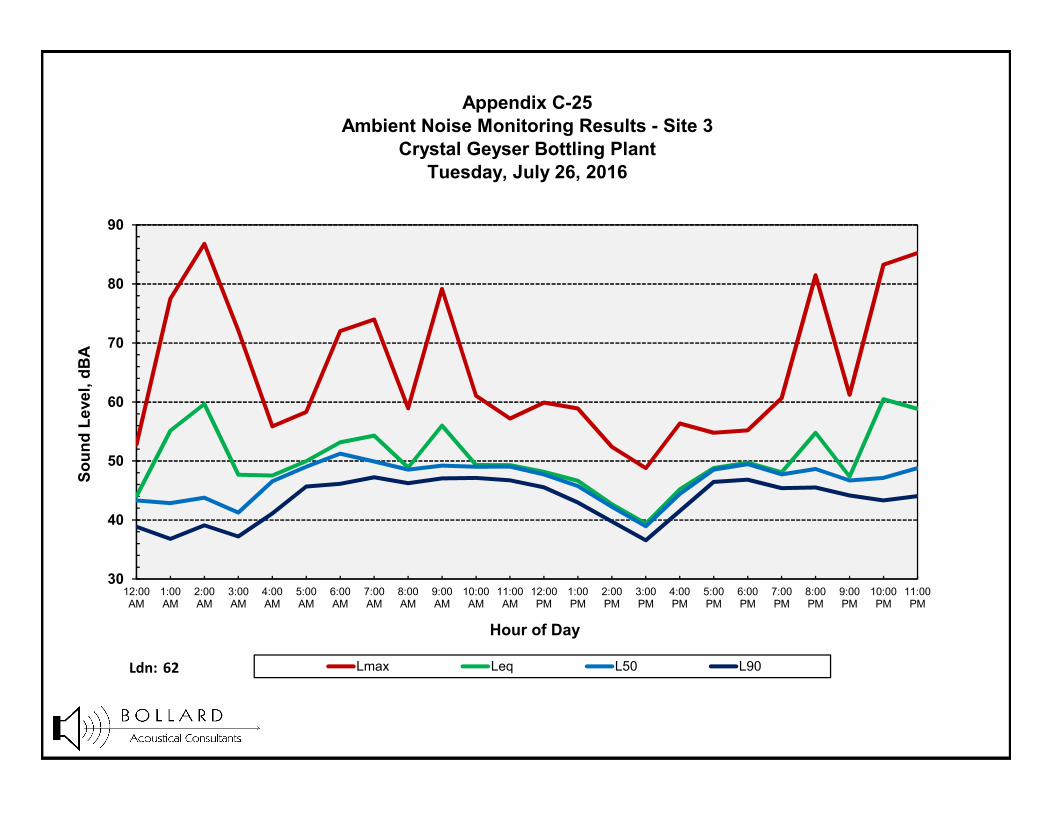
Ldn: 62
Appendix C-25Ambient Noise Monitoring Results - Site 3
Crystal Geyser Bottling PlantTuesday, July 26, 2016
30
40
50
60
70
80
90
12:00AM
1:00AM
2:00AM
3:00AM
4:00AM
5:00AM
6:00AM
7:00AM
8:00AM
9:00AM
10:00AM
11:00AM
12:00PM
1:00PM
2:00PM
3:00PM
4:00PM
5:00PM
6:00PM
7:00PM
8:00PM
9:00PM
10:00PM
11:00PM
Soun
d Le
vel,
dBA
Hour of Day
Lmax Leq L50 L90
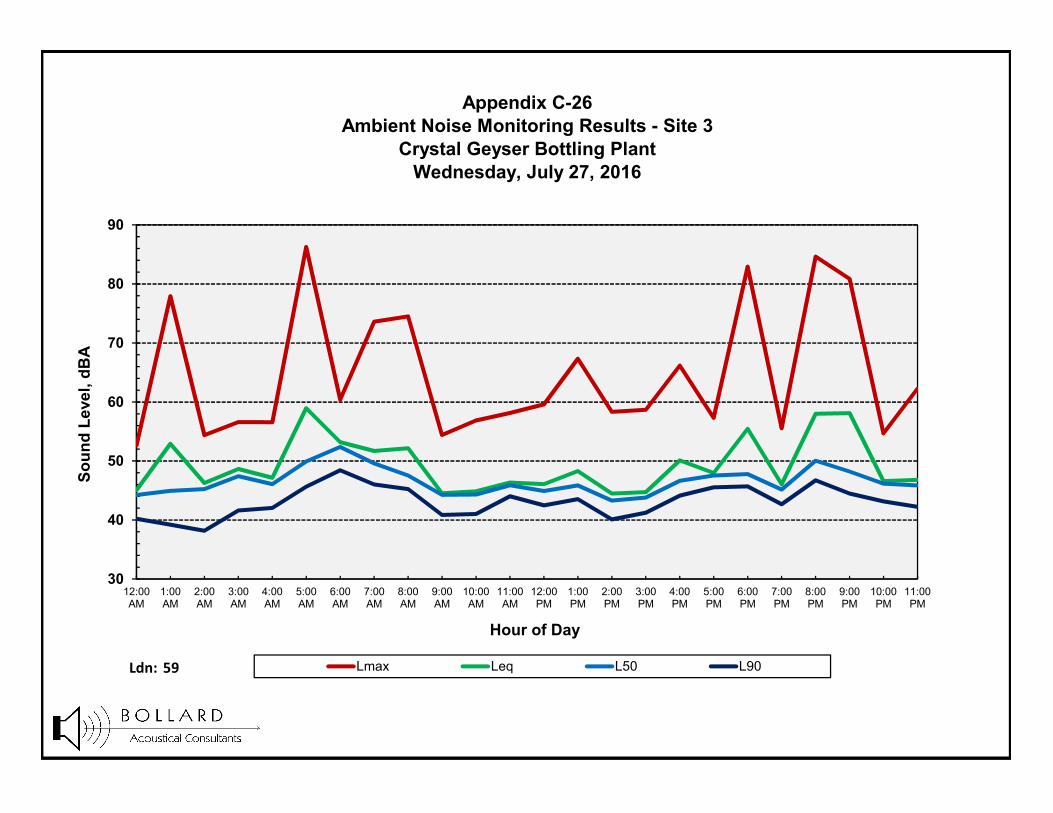
Ldn: 59
Appendix C-26Ambient Noise Monitoring Results - Site 3
Crystal Geyser Bottling PlantWednesday, July 27, 2016
30
40
50
60
70
80
90
12:00AM
1:00AM
2:00AM
3:00AM
4:00AM
5:00AM
6:00AM
7:00AM
8:00AM
9:00AM
10:00AM
11:00AM
12:00PM
1:00PM
2:00PM
3:00PM
4:00PM
5:00PM
6:00PM
7:00PM
8:00PM
9:00PM
10:00PM
11:00PM
Soun
d Le
vel,
dBA
Hour of Day
Lmax Leq L50 L90
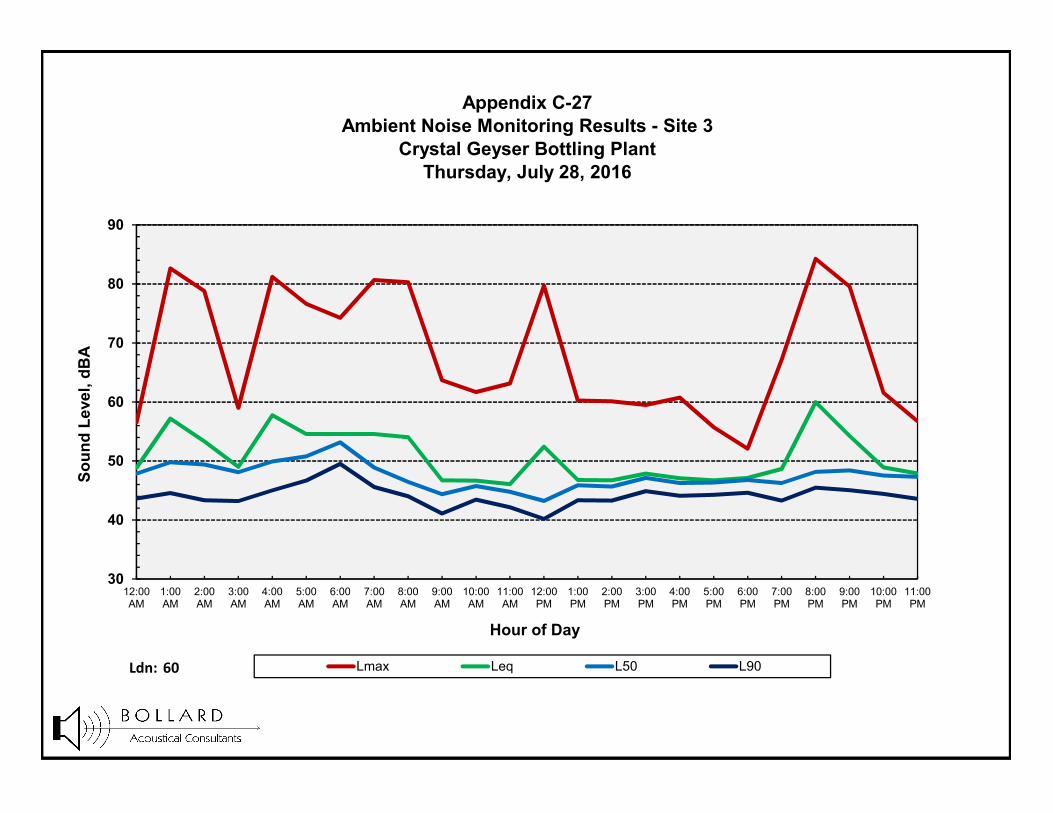
Ldn: 60
Appendix C-27Ambient Noise Monitoring Results - Site 3
Crystal Geyser Bottling PlantThursday, July 28, 2016
30
40
50
60
70
80
90
12:00AM
1:00AM
2:00AM
3:00AM
4:00AM
5:00AM
6:00AM
7:00AM
8:00AM
9:00AM
10:00AM
11:00AM
12:00PM
1:00PM
2:00PM
3:00PM
4:00PM
5:00PM
6:00PM
7:00PM
8:00PM
9:00PM
10:00PM
11:00PM
Soun
d Le
vel,
dBA
Hour of Day
Lmax Leq L50 L90
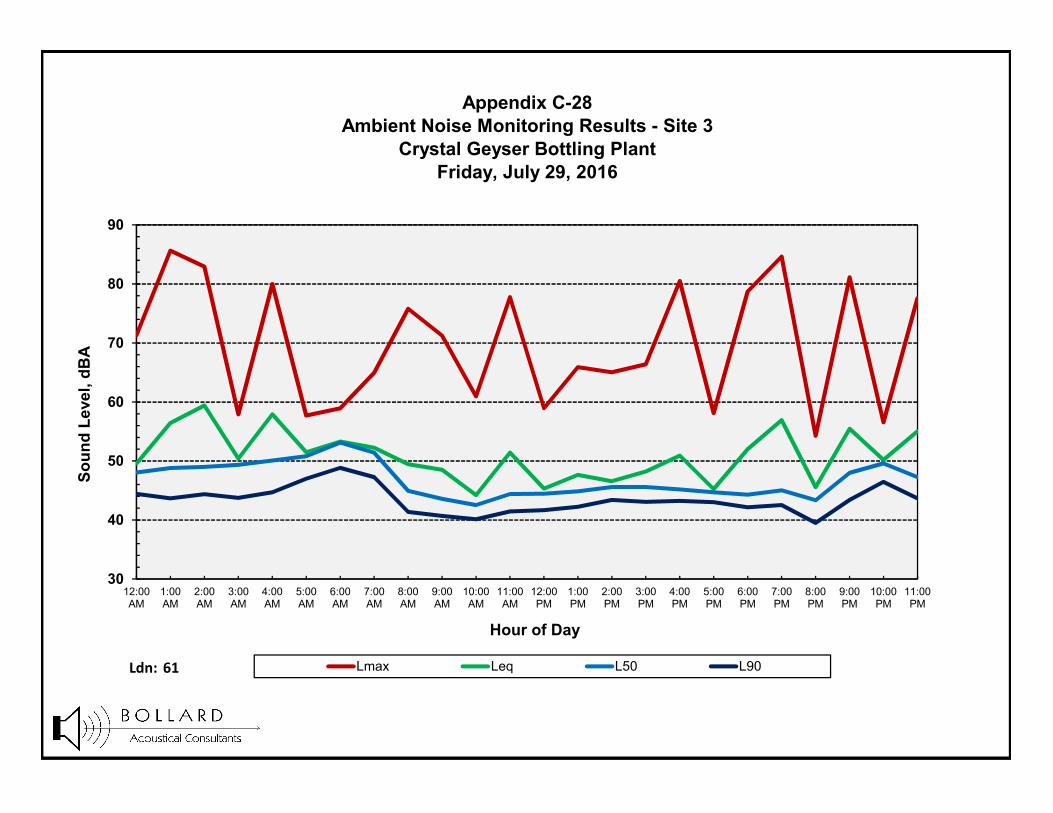
Ldn: 61
Appendix C-28Ambient Noise Monitoring Results - Site 3
Crystal Geyser Bottling PlantFriday, July 29, 2016
30
40
50
60
70
80
90
12:00AM
1:00AM
2:00AM
3:00AM
4:00AM
5:00AM
6:00AM
7:00AM
8:00AM
9:00AM
10:00AM
11:00AM
12:00PM
1:00PM
2:00PM
3:00PM
4:00PM
5:00PM
6:00PM
7:00PM
8:00PM
9:00PM
10:00PM
11:00PM
Soun
d Le
vel,
dBA
Hour of Day
Lmax Leq L50 L90
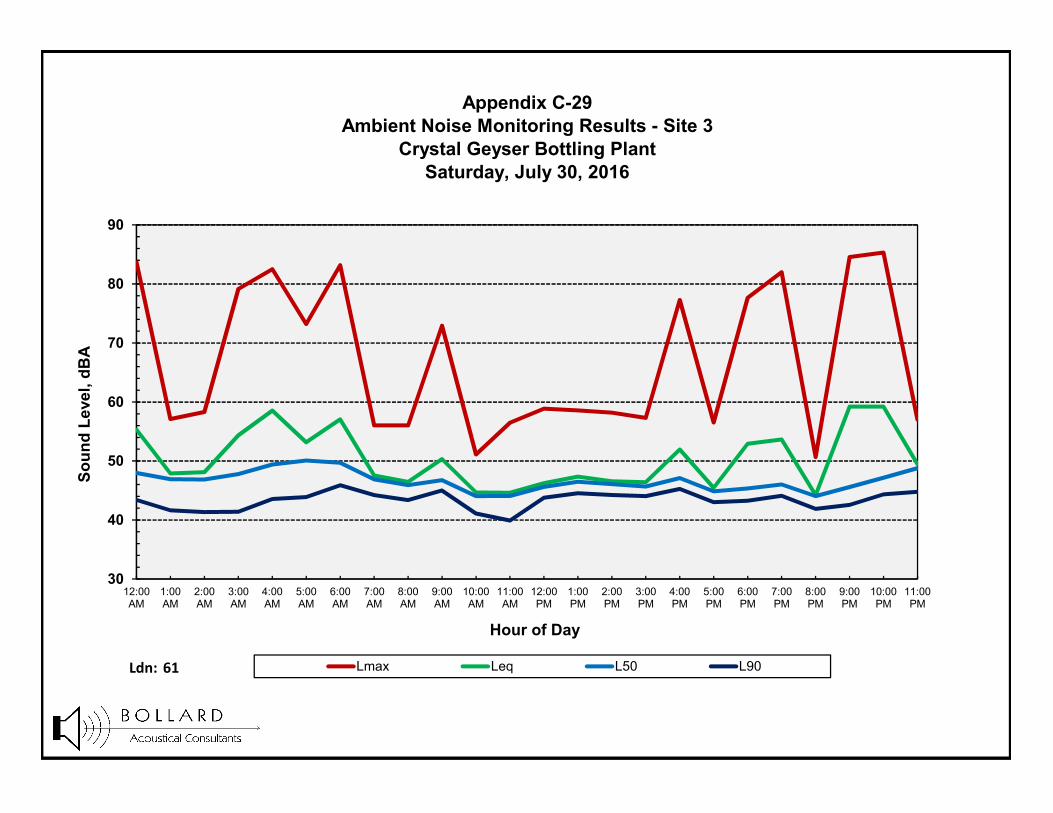
Ldn: 61
Appendix C-29Ambient Noise Monitoring Results - Site 3
Crystal Geyser Bottling PlantSaturday, July 30, 2016
30
40
50
60
70
80
90
12:00AM
1:00AM
2:00AM
3:00AM
4:00AM
5:00AM
6:00AM
7:00AM
8:00AM
9:00AM
10:00AM
11:00AM
12:00PM
1:00PM
2:00PM
3:00PM
4:00PM
5:00PM
6:00PM
7:00PM
8:00PM
9:00PM
10:00PM
11:00PM
Soun
d Le
vel,
dBA
Hour of Day
Lmax Leq L50 L90
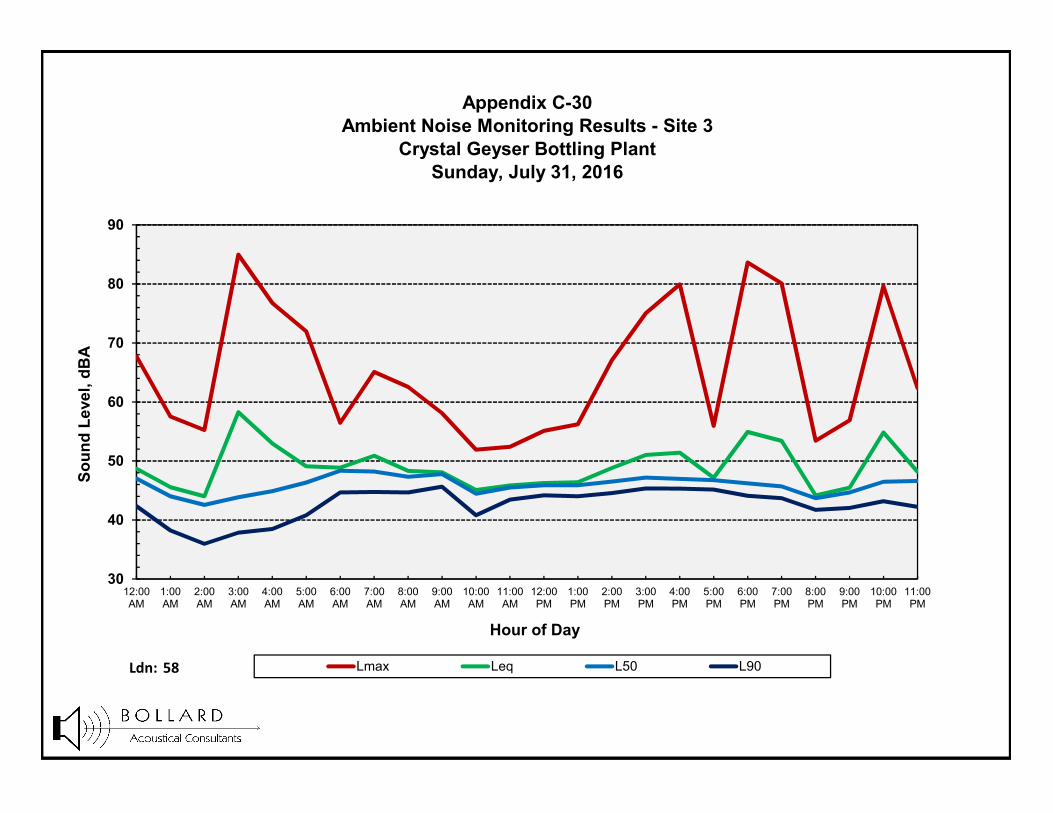
Ldn: 58
Appendix C-30Ambient Noise Monitoring Results - Site 3
Crystal Geyser Bottling PlantSunday, July 31, 2016
30
40
50
60
70
80
90
12:00AM
1:00AM
2:00AM
3:00AM
4:00AM
5:00AM
6:00AM
7:00AM
8:00AM
9:00AM
10:00AM
11:00AM
12:00PM
1:00PM
2:00PM
3:00PM
4:00PM
5:00PM
6:00PM
7:00PM
8:00PM
9:00PM
10:00PM
11:00PM
Soun
d Le
vel,
dBA
Hour of Day
Lmax Leq L50 L90
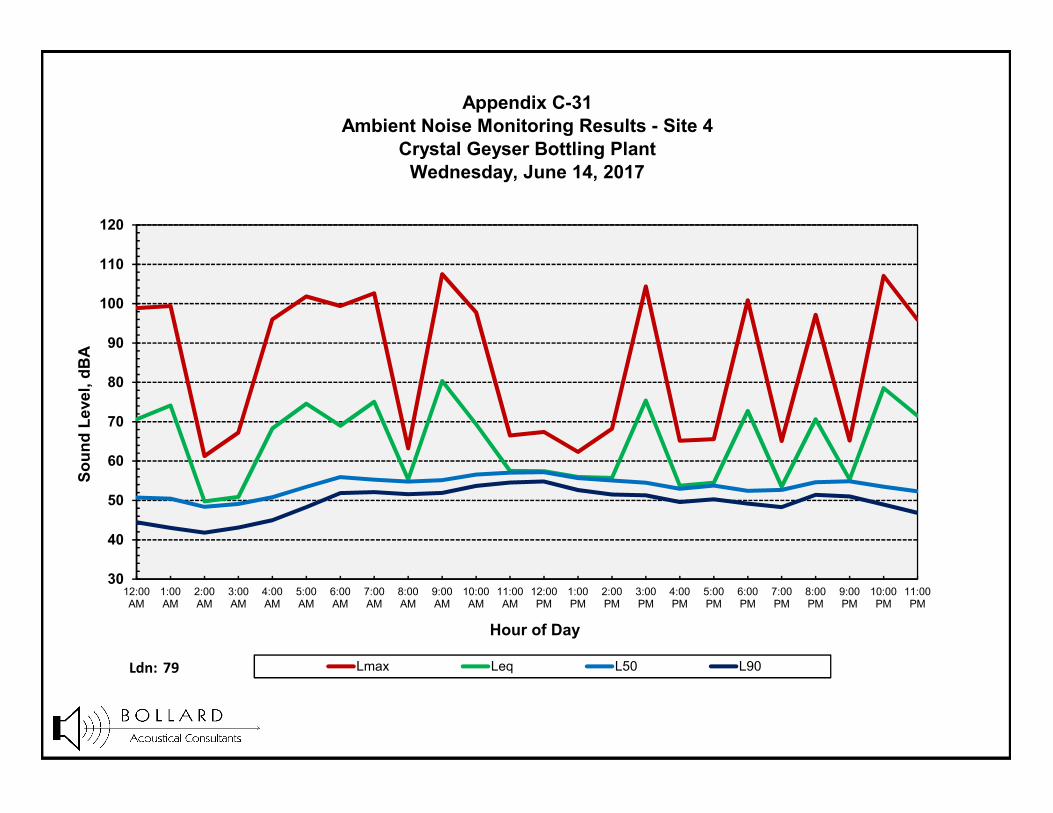
Ldn: 79
Appendix C-31Ambient Noise Monitoring Results - Site 4
Crystal Geyser Bottling PlantWednesday, June 14, 2017
30
40
50
60
70
80
90
100
110
120
12:00AM
1:00AM
2:00AM
3:00AM
4:00AM
5:00AM
6:00AM
7:00AM
8:00AM
9:00AM
10:00AM
11:00AM
12:00PM
1:00PM
2:00PM
3:00PM
4:00PM
5:00PM
6:00PM
7:00PM
8:00PM
9:00PM
10:00PM
11:00PM
Soun
d Le
vel,
dBA
Hour of Day
Lmax Leq L50 L90
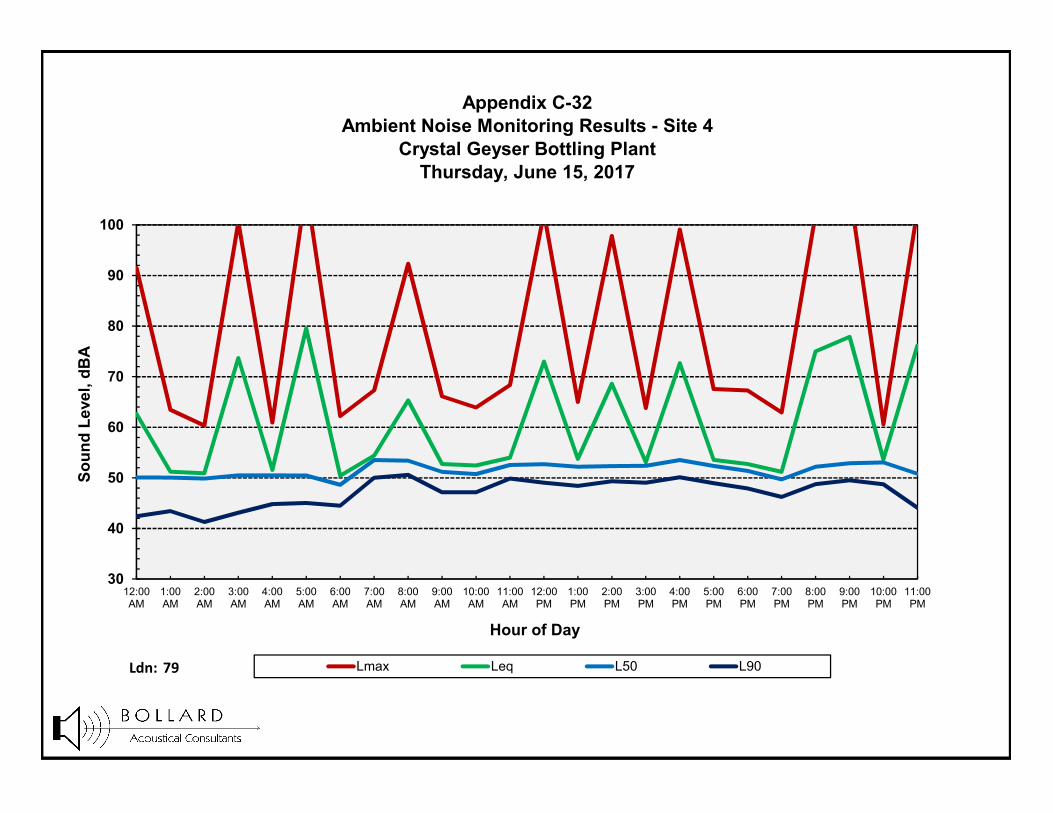
Ldn: 79
Appendix C-32Ambient Noise Monitoring Results - Site 4
Crystal Geyser Bottling PlantThursday, June 15, 2017
30
40
50
60
70
80
90
100
12:00AM
1:00AM
2:00AM
3:00AM
4:00AM
5:00AM
6:00AM
7:00AM
8:00AM
9:00AM
10:00AM
11:00AM
12:00PM
1:00PM
2:00PM
3:00PM
4:00PM
5:00PM
6:00PM
7:00PM
8:00PM
9:00PM
10:00PM
11:00PM
Soun
d Le
vel,
dBA
Hour of Day
Lmax Leq L50 L90
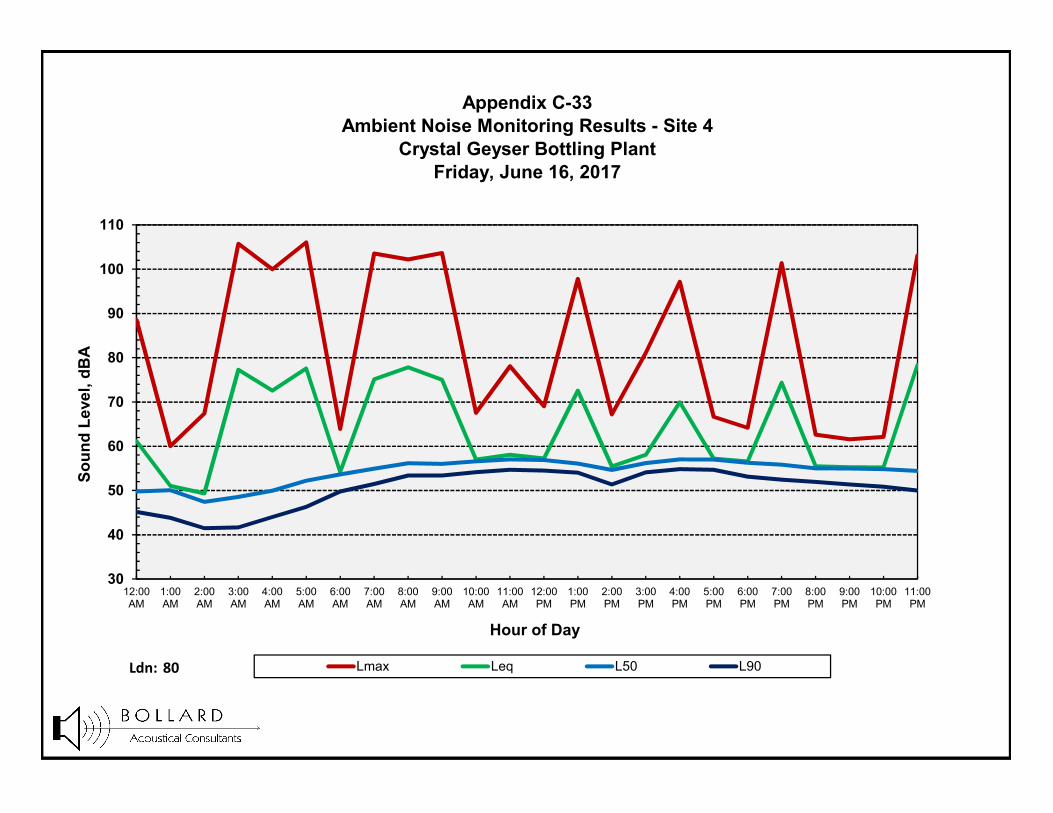
Ldn: 80
Appendix C-33Ambient Noise Monitoring Results - Site 4
Crystal Geyser Bottling PlantFriday, June 16, 2017
30
40
50
60
70
80
90
100
110
12:00AM
1:00AM
2:00AM
3:00AM
4:00AM
5:00AM
6:00AM
7:00AM
8:00AM
9:00AM
10:00AM
11:00AM
12:00PM
1:00PM
2:00PM
3:00PM
4:00PM
5:00PM
6:00PM
7:00PM
8:00PM
9:00PM
10:00PM
11:00PM
Soun
d Le
vel,
dBA
Hour of Day
Lmax Leq L50 L90

Ldn: 62
Appendix C-34Ambient Noise Monitoring Results - Site 4
Crystal Geyser Bottling PlantSaturday, June 17, 2017
30
40
50
60
70
80
90
100
12:00AM
1:00AM
2:00AM
3:00AM
4:00AM
5:00AM
6:00AM
7:00AM
8:00AM
9:00AM
10:00AM
11:00AM
12:00PM
1:00PM
2:00PM
3:00PM
4:00PM
5:00PM
6:00PM
7:00PM
8:00PM
9:00PM
10:00PM
11:00PM
Soun
d Le
vel,
dBA
Hour of Day
Lmax Leq L50 L90

Ldn: 77
Appendix C-35Ambient Noise Monitoring Results - Site 4
Crystal Geyser Bottling PlantSunday, June 18, 2017
30
40
50
60
70
80
90
100
12:00AM
1:00AM
2:00AM
3:00AM
4:00AM
5:00AM
6:00AM
7:00AM
8:00AM
9:00AM
10:00AM
11:00AM
12:00PM
1:00PM
2:00PM
3:00PM
4:00PM
5:00PM
6:00PM
7:00PM
8:00PM
9:00PM
10:00PM
11:00PM
Soun
d Le
vel,
dBA
Hour of Day
Lmax Leq L50 L90
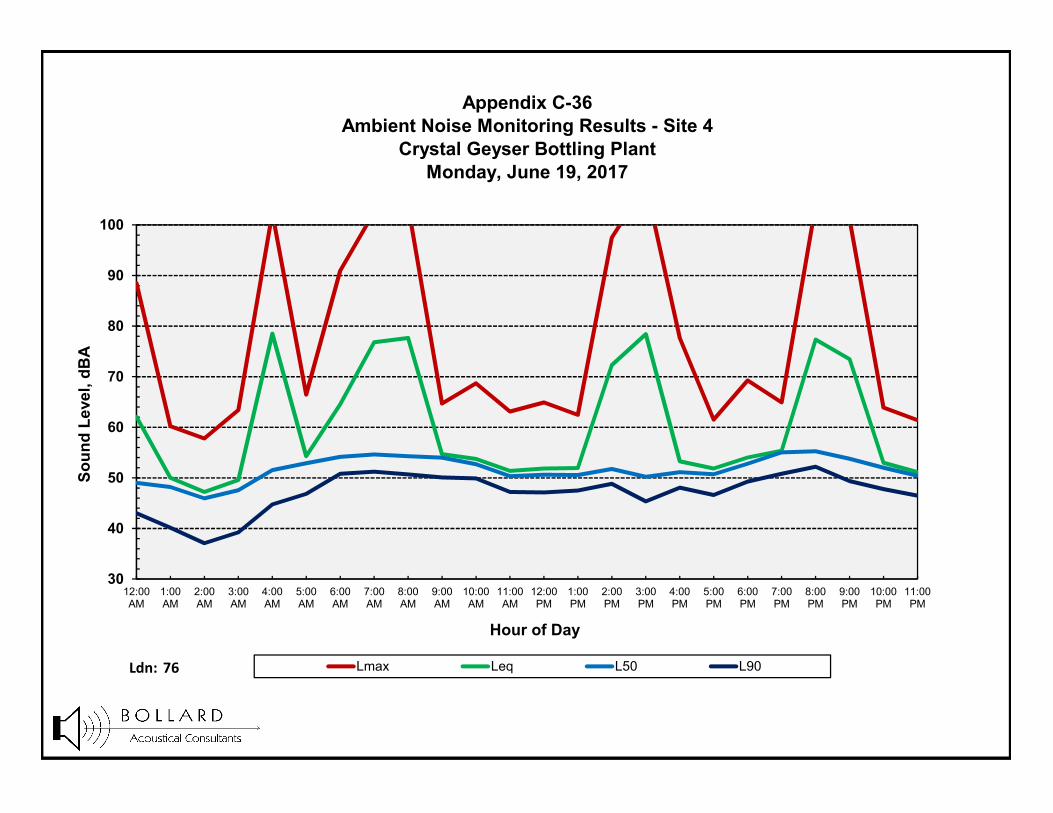
Ldn: 76
Appendix C-36Ambient Noise Monitoring Results - Site 4
Crystal Geyser Bottling PlantMonday, June 19, 2017
30
40
50
60
70
80
90
100
12:00AM
1:00AM
2:00AM
3:00AM
4:00AM
5:00AM
6:00AM
7:00AM
8:00AM
9:00AM
10:00AM
11:00AM
12:00PM
1:00PM
2:00PM
3:00PM
4:00PM
5:00PM
6:00PM
7:00PM
8:00PM
9:00PM
10:00PM
11:00PM
Soun
d Le
vel,
dBA
Hour of Day
Lmax Leq L50 L90

Ldn: 79
Appendix C-37Ambient Noise Monitoring Results - Site 4
Crystal Geyser Bottling PlantTuesday, June 20, 2017
30
40
50
60
70
80
90
100
12:00AM
1:00AM
2:00AM
3:00AM
4:00AM
5:00AM
6:00AM
7:00AM
8:00AM
9:00AM
10:00AM
11:00AM
12:00PM
1:00PM
2:00PM
3:00PM
4:00PM
5:00PM
6:00PM
7:00PM
8:00PM
9:00PM
10:00PM
11:00PM
Soun
d Le
vel,
dBA
Hour of Day
Lmax Leq L50 L90
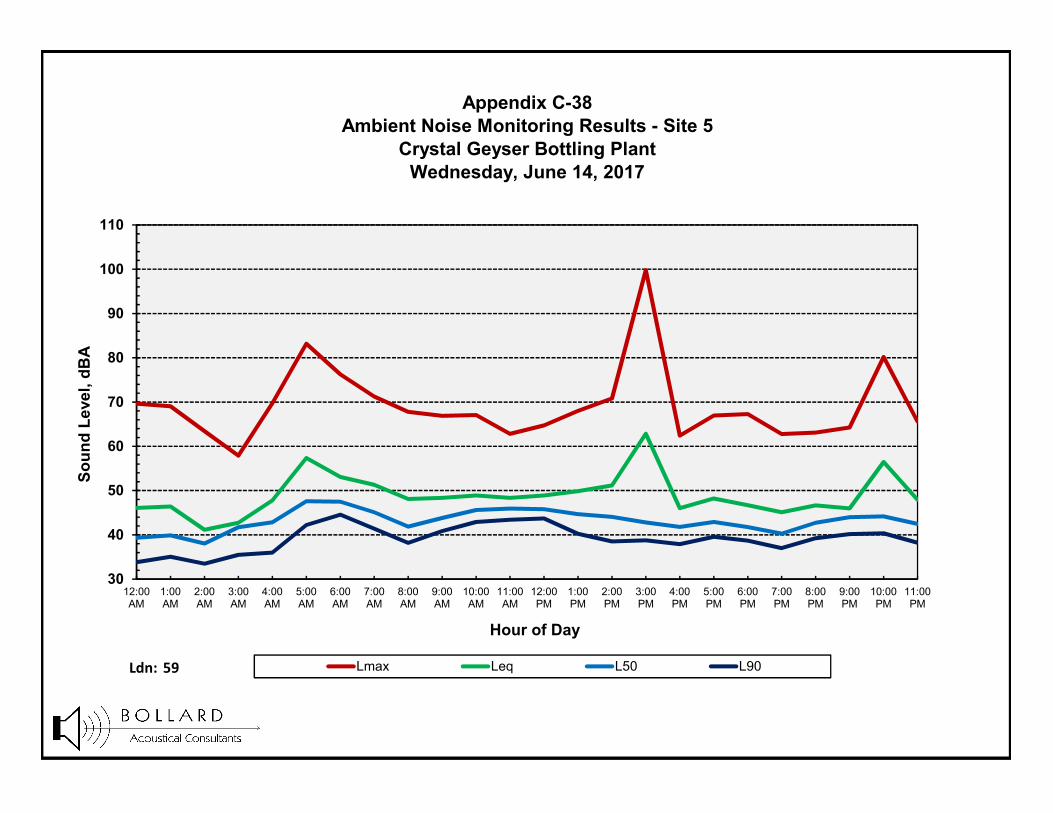
Ldn: 59
Appendix C-38Ambient Noise Monitoring Results - Site 5
Crystal Geyser Bottling PlantWednesday, June 14, 2017
30
40
50
60
70
80
90
100
110
12:00AM
1:00AM
2:00AM
3:00AM
4:00AM
5:00AM
6:00AM
7:00AM
8:00AM
9:00AM
10:00AM
11:00AM
12:00PM
1:00PM
2:00PM
3:00PM
4:00PM
5:00PM
6:00PM
7:00PM
8:00PM
9:00PM
10:00PM
11:00PM
Soun
d Le
vel,
dBA
Hour of Day
Lmax Leq L50 L90

Ldn: 53
Appendix C-39Ambient Noise Monitoring Results - Site 5
Crystal Geyser Bottling PlantThursday, June 15, 2017
30
40
50
60
70
80
90
12:00AM
1:00AM
2:00AM
3:00AM
4:00AM
5:00AM
6:00AM
7:00AM
8:00AM
9:00AM
10:00AM
11:00AM
12:00PM
1:00PM
2:00PM
3:00PM
4:00PM
5:00PM
6:00PM
7:00PM
8:00PM
9:00PM
10:00PM
11:00PM
Soun
d Le
vel,
dBA
Hour of Day
Lmax Leq L50 L90

Ldn: 56
Appendix C-40Ambient Noise Monitoring Results - Site 5
Crystal Geyser Bottling PlantFriday, June 16, 2017
30
40
50
60
70
80
90
12:00AM
1:00AM
2:00AM
3:00AM
4:00AM
5:00AM
6:00AM
7:00AM
8:00AM
9:00AM
10:00AM
11:00AM
12:00PM
1:00PM
2:00PM
3:00PM
4:00PM
5:00PM
6:00PM
7:00PM
8:00PM
9:00PM
10:00PM
11:00PM
Soun
d Le
vel,
dBA
Hour of Day
Lmax Leq L50 L90
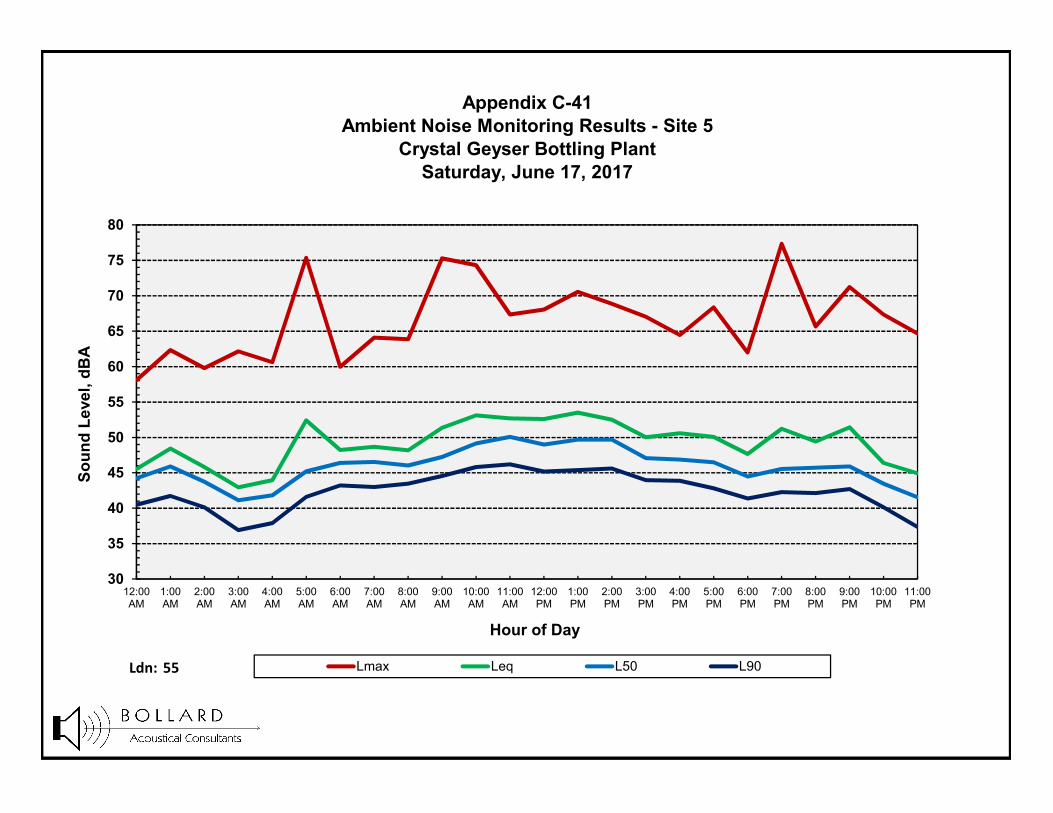
Ldn: 55
Appendix C-41Ambient Noise Monitoring Results - Site 5
Crystal Geyser Bottling PlantSaturday, June 17, 2017
30
35
40
45
50
55
60
65
70
75
80
12:00AM
1:00AM
2:00AM
3:00AM
4:00AM
5:00AM
6:00AM
7:00AM
8:00AM
9:00AM
10:00AM
11:00AM
12:00PM
1:00PM
2:00PM
3:00PM
4:00PM
5:00PM
6:00PM
7:00PM
8:00PM
9:00PM
10:00PM
11:00PM
Soun
d Le
vel,
dBA
Hour of Day
Lmax Leq L50 L90

Ldn: 53
Appendix C-42Ambient Noise Monitoring Results - Site 5
Crystal Geyser Bottling PlantSunday, June 18, 2017
30
35
40
45
50
55
60
65
70
75
80
12:00AM
1:00AM
2:00AM
3:00AM
4:00AM
5:00AM
6:00AM
7:00AM
8:00AM
9:00AM
10:00AM
11:00AM
12:00PM
1:00PM
2:00PM
3:00PM
4:00PM
5:00PM
6:00PM
7:00PM
8:00PM
9:00PM
10:00PM
11:00PM
Soun
d Le
vel,
dBA
Hour of Day
Lmax Leq L50 L90

Ldn: 55
Appendix C-43Ambient Noise Monitoring Results - Site 5
Crystal Geyser Bottling PlantMonday, June 19, 2017
30
35
40
45
50
55
60
65
70
75
80
12:00AM
1:00AM
2:00AM
3:00AM
4:00AM
5:00AM
6:00AM
7:00AM
8:00AM
9:00AM
10:00AM
11:00AM
12:00PM
1:00PM
2:00PM
3:00PM
4:00PM
5:00PM
6:00PM
7:00PM
8:00PM
9:00PM
10:00PM
11:00PM
Soun
d Le
vel,
dBA
Hour of Day
Lmax Leq L50 L90
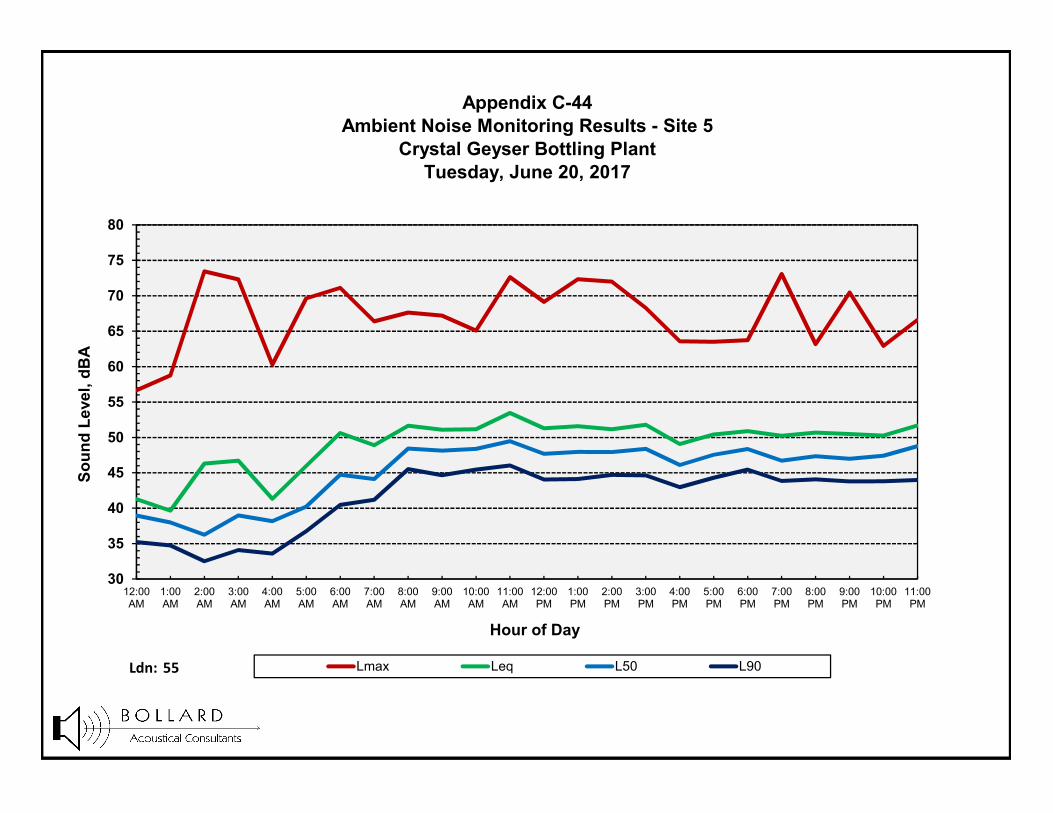
Ldn: 55
Appendix C-44Ambient Noise Monitoring Results - Site 5
Crystal Geyser Bottling PlantTuesday, June 20, 2017
30
35
40
45
50
55
60
65
70
75
80
12:00AM
1:00AM
2:00AM
3:00AM
4:00AM
5:00AM
6:00AM
7:00AM
8:00AM
9:00AM
10:00AM
11:00AM
12:00PM
1:00PM
2:00PM
3:00PM
4:00PM
5:00PM
6:00PM
7:00PM
8:00PM
9:00PM
10:00PM
11:00PM
Soun
d Le
vel,
dBA
Hour of Day
Lmax Leq L50 L90

Ldn: 56
Appendix C-45Ambient Noise Monitoring Results - Site 5
Crystal Geyser Bottling PlantWednesday, June 21, 2017
30
35
40
45
50
55
60
65
70
75
80
12:00AM
1:00AM
2:00AM
3:00AM
4:00AM
5:00AM
6:00AM
7:00AM
8:00AM
9:00AM
10:00AM
11:00AM
12:00PM
1:00PM
2:00PM
3:00PM
4:00PM
5:00PM
6:00PM
7:00PM
8:00PM
9:00PM
10:00PM
11:00PM
Soun
d Le
vel,
dBA
Hour of Day
Lmax Leq L50 L90
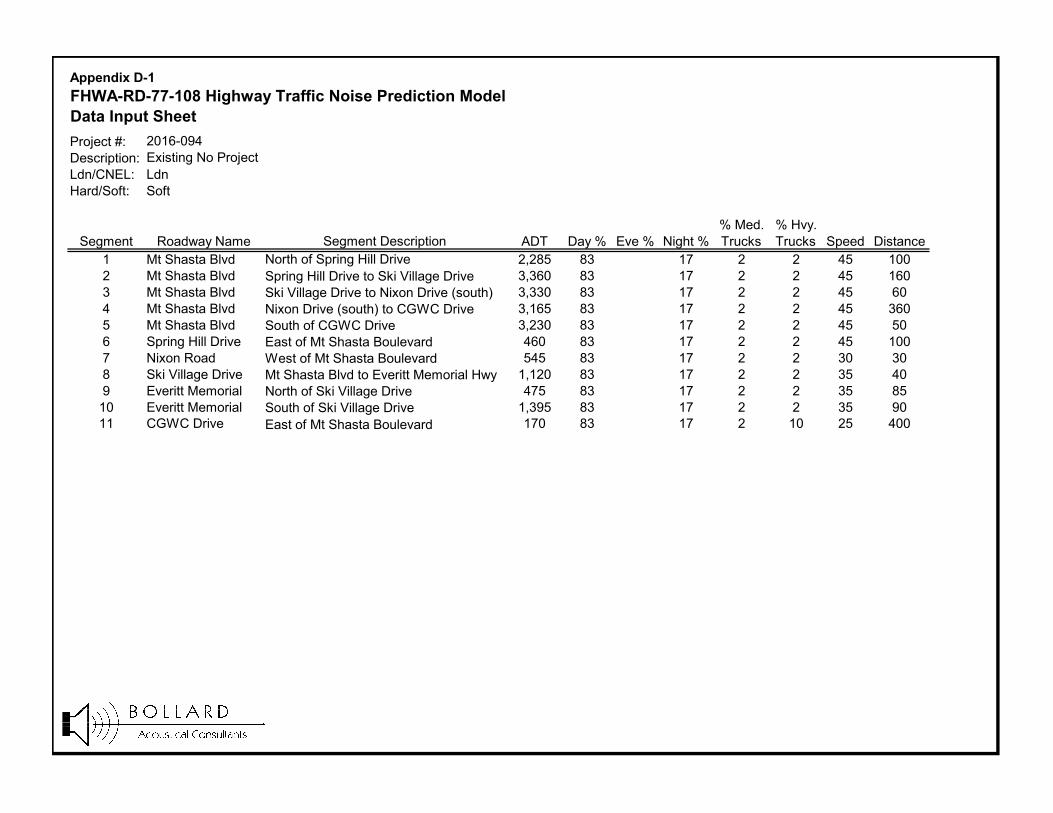
Project #:Description:Ldn/CNEL: LdnHard/Soft: Soft
% Med. % Hvy.Segment Roadway Name ADT Day % Eve % Night % Trucks Trucks Speed Distance
1 Mt Shasta Blvd North of Spring Hill Drive 2,285 83 17 2 2 45 1002 Mt Shasta Blvd Spring Hill Drive to Ski Village Drive 3,360 83 17 2 2 45 1603 Mt Shasta Blvd Ski Village Drive to Nixon Drive (south) 3,330 83 17 2 2 45 604 Mt Shasta Blvd Nixon Drive (south) to CGWC Drive 3,165 83 17 2 2 45 3605 Mt Shasta Blvd South of CGWC Drive 3,230 83 17 2 2 45 506 Spring Hill Drive East of Mt Shasta Boulevard 460 83 17 2 2 45 1007 Nixon Road West of Mt Shasta Boulevard 545 83 17 2 2 30 308 Ski Village Drive Mt Shasta Blvd to Everitt Memorial Hwy 1,120 83 17 2 2 35 409 Everitt Memorial North of Ski Village Drive 475 83 17 2 2 35 8510 Everitt Memorial South of Ski Village Drive 1,395 83 17 2 2 35 9011 CGWC Drive East of Mt Shasta Boulevard 170 83 17 2 10 25 400
Segment Description
Appendix D-1
2016-094
FHWA-RD-77-108 Highway Traffic Noise Prediction Model
Existing No Project
Data Input Sheet

Project #:Description:Ldn/CNEL: LdnHard/Soft: Soft
% Med. % Hvy.Segment Roadway Name ADT Day % Eve % Night % Trucks Trucks Speed Distance
1 Mt Shasta Blvd North of Spring Hill Drive 2,580 83 17 2 2 45 1002 Mt Shasta Blvd Spring Hill Drive to Ski Village Drive 3,785 83 17 2 2 45 1603 Mt Shasta Blvd Ski Village Drive to Nixon Drive (south) 3,755 83 17 2 2 45 604 Mt Shasta Blvd Nixon Drive (south) to CGWC Drive 3,570 83 17 2 2 45 3605 Mt Shasta Blvd South of CGWC Drive 3,645 83 17 2 2 45 506 Spring Hill Drive East of Mt Shasta Boulevard 520 83 17 2 2 45 1007 Nixon Road West of Mt Shasta Boulevard 610 83 17 2 2 30 308 Ski Village Drive Mt Shasta Blvd to Everitt Memorial Hwy 1,260 83 17 2 2 35 409 Everitt Memorial North of Ski Village Drive 540 83 17 2 2 35 8510 Everitt Memorial South of Ski Village Drive 1,570 83 17 2 2 35 9011 CGWC Drive East of Mt Shasta Boulevard 190 83 17 2 10 25 400
Segment Description
Appendix D-2
2016-094
FHWA-RD-77-108 Highway Traffic Noise Prediction Model
Cumulative - No Project
Data Input Sheet

Project #:Description:Ldn/CNEL: LdnHard/Soft: Soft
% Med. % Hvy.Segment Roadway Name ADT Day % Eve % Night % Trucks Trucks Speed Distance
1 Mt Shasta Blvd North of Spring Hill Drive 100 100 0 0 100 45 1002 Mt Shasta Blvd Spring Hill Drive to Ski Village Drive 100 100 0 0 100 45 1603 Mt Shasta Blvd Ski Village Drive to Nixon Drive (south) 100 100 0 0 100 45 604 Mt Shasta Blvd Nixon Drive (south) to CGWC Drive 100 100 0 0 100 45 3605 Mt Shasta Blvd South of CGWC Drive 0 100 0 0 0 45 506 Spring Hill Drive East of Mt Shasta Boulevard 0 100 0 0 0 45 1007 Nixon Road West of Mt Shasta Boulevard 0 100 0 0 0 30 308 Ski Village Drive Mt Shasta Blvd to Everitt Memorial Hwy 0 100 0 0 0 35 409 Everitt Memorial North of Ski Village Drive 0 100 0 0 0 35 8510 Everitt Memorial South of Ski Village Drive 0 100 0 0 0 35 9011 CGWC Drive East of Mt Shasta Boulevard 100 100 0 0 100 25 400
Segment Description
Appendix D-3
2016-094
FHWA-RD-77-108 Highway Traffic Noise Prediction Model
Project Trucks Only - All Daytime
Data Input Sheet

Project #:Description:Ldn/CNEL: LdnHard/Soft: Soft
% Med. % Hvy.Segment Roadway Name ADT Day % Eve % Night % Trucks Trucks Speed Distance
1 Mt Shasta Blvd North of Spring Hill Drive 135 83 17 0 0 45 1002 Mt Shasta Blvd Spring Hill Drive to Ski Village Drive 330 83 17 0 0 45 1603 Mt Shasta Blvd Ski Village Drive to Nixon Drive (south) 390 83 17 0 0 45 604 Mt Shasta Blvd Nixon Drive (south) to CGWC Drive 390 83 17 0 0 45 3605 Mt Shasta Blvd South of CGWC Drive 215 83 17 0 0 45 506 Spring Hill Drive East of Mt Shasta Boulevard 195 83 17 0 0 45 1007 Nixon Road West of Mt Shasta Boulevard 0 83 17 0 0 30 308 Ski Village Drive Mt Shasta Blvd to Everitt Memorial Hwy 370 83 17 0 0 35 409 Everitt Memorial North of Ski Village Drive 0 83 17 0 0 35 8510 Everitt Memorial South of Ski Village Drive 155 83 17 0 0 35 9011 CGWC Drive East of Mt Shasta Boulevard 175 83 17 0 0 25 400
Segment Description
Appendix D-4
2016-094
FHWA-RD-77-108 Highway Traffic Noise Prediction Model
Project
Data Input Sheet

Appendix EReference Sound Presure Levels @ 100 Feet from Source
Crystal Geyser Bottling Plant EIR
Source SPL100', dBA Data Source
Rooftop HVAC
Air Handling Unit 1 44 BAC 6‐22‐17 on‐site testing
Air Handling Unit 2 43 BAC 6‐22‐17 on‐site testing
Condenser Unit 1 54 BAC 6‐22‐17 on‐site testing
Condenser Unit 2 50 BAC 6‐22‐17 on‐site testing
Exhaust Fan 53 BAC 6‐22‐17 on‐site testing
AHU Fan 51 BAC 6‐22‐17 on‐site testing
Makeup Air Unit 27 BAC 6‐22‐17 on‐site testing
Packaged AC (3 Ton) 33 BAC 6‐22‐17 on‐site testing
Packaged AC (8 Ton) 28 BAC 6‐22‐17 on‐site testing
Supply Fan 45 BAC 6‐22‐17 on‐site testing
Ground Level Equipment
Chiller for Blow Molder 65 BAC 6‐22‐17 on‐site testing
Cooling Tower 1 58 BAC 6‐22‐17 on‐site testing
Cooling Tower 2 55 BAC 6‐22‐17 on‐site testing
Cooling Tower 3 58 BAC 6‐22‐17 on‐site testing
Kohler Generator 55 BAC 6‐22‐17 on‐site testing
Propane Generators 56 Peterson Power Systems 7/11/17
Loading Dock Operations (15 trucks/hr) 53 BAC file data & calcs below
On-Site Circulation (15 truck passbys/hr) 49 BAC file data & calcs below
Calculation of Sound Pressure Level at Sensitive Receptors:
SPLreceiver = SPLreference ‐ 20 * Log (dist to receiver / 100) ‐ 1.5 * (dist to receiver / 1000) ‐ Shielding offset
Calculation of Reference Sound Pressure Level for Loading Dock Activity and On‐Site Truck Passbys:
SPLref loading dock = 83SEL@50ft + 10 * Log (15hourly operations) ‐ 10 * LOG (3600# seconds per hour) ‐ 20 * Log (50feet/100feet)
SPLref truck passby = 74SEL@85ft + 10 * Log (15hourly operations) ‐ 10 * LOG (3600# seconds per hour) ‐ 20 * Log (85feet/100feet)
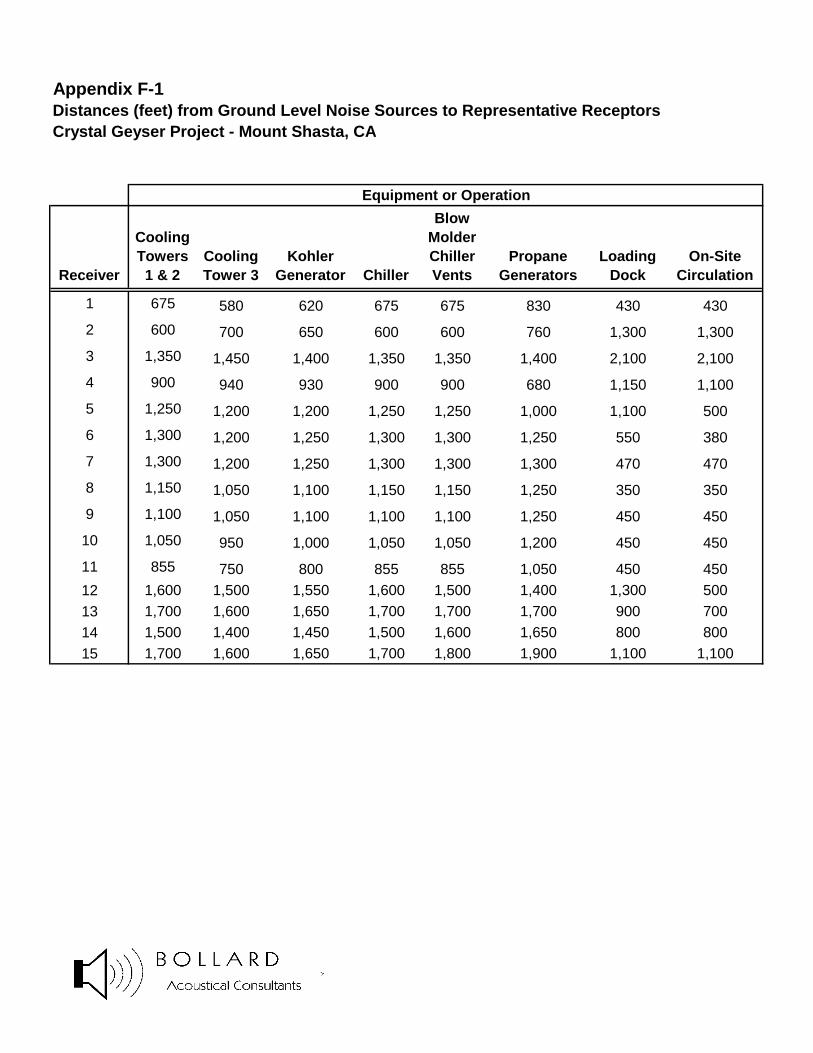
Appendix F-1Distances (feet) from Ground Level Noise Sources to Representative ReceptorsCrystal Geyser Project - Mount Shasta, CA
Receiver
Cooling Towers 1 & 2
Cooling Tower 3
Kohler Generator Chiller
Blow Molder Chiller Vents
Propane Generators
Loading Dock
On-Site Circulation
1 675 580 620 675 675 830 430 430
2 600 700 650 600 600 760 1,300 1,300
3 1,350 1,450 1,400 1,350 1,350 1,400 2,100 2,100
4 900 940 930 900 900 680 1,150 1,100
5 1,250 1,200 1,200 1,250 1,250 1,000 1,100 500
6 1,300 1,200 1,250 1,300 1,300 1,250 550 380
7 1,300 1,200 1,250 1,300 1,300 1,300 470 470
8 1,150 1,050 1,100 1,150 1,150 1,250 350 350
9 1,100 1,050 1,100 1,100 1,100 1,250 450 450
10 1,050 950 1,000 1,050 1,050 1,200 450 450
11 855 750 800 855 855 1,050 450 450
12 1,600 1,500 1,550 1,600 1,500 1,400 1,300 500
13 1,700 1,600 1,650 1,700 1,700 1,700 900 700
14 1,500 1,400 1,450 1,500 1,600 1,650 800 800
15 1,700 1,600 1,650 1,700 1,800 1,900 1,100 1,100
Equipment or Operation

Appendix F-2Distances (feet) from Rooftop Noise Sources to Representative ReceptorsCrystal Geyser Project - Mount Shasta, CA
Source Description 1 2 3 4 5 6 7 8 9 10 11 12 13 14 150 Supply Fan 280 1100 2000 1200 1125 800 730 580 590 540 400 1375 1200 890 11401 Supply Fan 360 1200 2000 1200 1070 710 630 540 590 560 470 1320 1110 890 11602 Supply Fan 430 1225 2000 1160 1010 670 620 560 630 610 530 1260 1070 930 12103 Exhaust Fan 310 1100 1900 1180 1135 820 730 610 640 590 450 1385 1220 940 11904 Exhaust Fan 330 1100 1900 1170 1110 810 730 620 640 600 460 1360 1210 940 12005 Exhaust Fan 360 1110 1900 1150 1080 790 720 620 650 615 490 1330 1190 950 12156 Exhaust Fan 400 1130 1900 1120 1035 760 710 630 680 650 530 1285 1160 980 12507 Exhaust Fan 430 1145 1900 1100 1010 740 700 640 690 660 550 1260 1140 990 12608 Exhaust Fan 450 1160 1900 1100 980 730 700 650 700 680 575 1230 1130 1000 12809 Supply Fan 360 1010 1800 1100 1110 880 800 700 720 670 510 1360 1280 1020 1270
10 Supply Fan 410 1040 1850 1075 1055 850 800 710 740 700 560 1305 1250 1040 130011 Supply Fan 470 1070 1850 1025 990 815 780 720 770 740 600 1240 1215 1070 1340
12 Supply Fan 420 970 1750 1040 1080 920 880 770 800 750 580 1330 1320 1100 1350
13 Supply Fan 465 1000 1750 1000 1030 890 860 780 820 770 615 1280 1290 1120 1370
14 Supply Fan 515 1025 1775 960 970 870 850 790 840 810 660 1220 1270 1140 1410
15 Exhaust Fan 470 910 1700 1000 1090 980 940 840 870 810 630 1340 1380 1170 1410
16 Exhaust Fan 505 940 1700 960 1035 960 930 850 880 830 660 1285 1360 1180 1430
17 Exhaust Fan 550 970 1700 915 975 930 920 860 900 860 700 1225 1330 1200 1460
18 Supply Fan 520 835 1600 955 1100 1050 1010 920 940 880 690 1350 1450 1240 1480
19 Supply Fan 600 905 1600 865 1000 1000 1000 940 980 930 760 1250 1400 1280 1530
20 Exhaust Fan 510 800 1600 975 1150 1080 1040 930 945 880 680 1400 1480 1245 1480
21 Exhaust Fan 580 820 1580 890 1080 1080 1060 970 990 930 750 1330 1480 1290 1530
22 Exhaust Fan 620 855 1580 850 1020 1050 1050 980 1010 960 790 1270 1450 1310 1560
23 Packaged 3 ton HVAC 420 945 1750 1045 1100 950 890 790 810 750 580 1350 1350 1110 1350
24 Packaged 3 ton HVAC 435 925 1730 1030 1100 960 920 810 830 770 590 1350 1360 1130 1370
25 Packaged 3 ton HVAC 450 905 1700 1015 1100 980 940 830 850 800 610 1350 1380 1150 1400
26 Packaged 3 ton HVAC 460 890 1690 1005 1100 1000 950 850 870 810 630 1350 1400 1170 1410
27 Packaged 3 ton HVAC 475 875 1670 995 1100 1020 970 870 890 825 640 1350 1420 1190 1425
28 Packaged 3 ton HVAC 485 864 1655 985 1100 1030 990 880 900 840 655 1350 1430 1200 1440
29 KRAK Condenser 540 772 1570 963 1160 1120 1080 970 970 910 700 1410 1520 1270 1510
30 Compressor Room Cooler 560 750 1540 950 1160 1140 1100 1000 1000 930 725 1410 1540 1300 1530
31 Supply Fan 570 760 1540 925 1145 1140 1100 1000 1010 940 750 1395 1540 1310 1540
32 Exhaust Fan 600 720 1500 915 1150 1170 1140 1040 1050 980 780 1400 1570 1350 1580
33 Exhaust Fan 700 615 1375 880 1200 1290 1260 1160 1160 1090 875 1450 1690 1460 1690
34 Cooler 670 660 1425 875 1180 1240 1220 1120 1120 1050 845 1430 1640 1420 1650
35 Condenser Unit 2 710 660 1400 835 1160 1250 1230 1140 1150 1050 880 1410 1650 1450 1650
36 Exhaust Fan 680 680 1430 850 1150 1225 1200 1110 1130 1090 855 1400 1625 1430 1690
37 Air Handling Unit 2 715 685 1410 820 1140 1235 1220 1140 1150 1090 880 1390 1635 1450 1690
38 Packaged 3 ton HVAC 725 700 1410 800 1120 1230 1220 1140 1160 1100 900 1370 1630 1460 1700
39 Fan 675 750 1475 823 1090 1170 1160 1080 1100 1040 850 1340 1570 1400 1640
40 Air Handling Unit 1 740 720 1425 780 1090 1215 1210 1140 1160 1100 910 1340 1615 1460 1700
41 Condenser Unit 1 735 740 1440 770 1070 1200 1200 1130 1160 1100 910 1320 1600 1460 1700
42 Packaged 7.5 ton HVAC 760 730 1420 750 1070 1215 1220 1150 1180 1120 930 1320 1615 1480 1720
Receiver
Note: Blue shaded cells represent the distance from the closest piece of rooftop equiment to each senstive receptor.

Appendix G-12016-071 Crystal Geyser Bottling PlantGround Level Noise Source Shielding Offsets
ReceiverCooling Towers
Kohler Generator Chiller
Blow Molder Chiller Vents
Propane Generators
Loading Dock
On-Site Circulation
1 -5 -5 -3 -10 -15 0 0
2 -5 -5 -3 0 0 -5 ‐5
3 0 0 0 0 0 -5 ‐5
4 -5 -10 -3 0 0 -5 ‐5
5 -10 -15 -10 -5 0 -5 ‐5
6 -15 -15 -15 -15 0 -5 ‐5
7 -15 -15 -15 -15 -5 -5 ‐5
8 -5 -5 -5 -15 -15 -5 ‐5
9 -5 -5 -3 -15 -15 -5 ‐5
10 -5 -5 -3 -15 -15 -5 ‐5
11 -5 -5 -3 -10 -15 0 0
12 ‐15 ‐15 ‐15 ‐5 0 ‐5 ‐5
13 ‐15 ‐15 ‐15 ‐15 ‐5 ‐5 ‐5
14 ‐5 ‐5 ‐5 ‐15 ‐15 ‐5 ‐5
15 ‐5 ‐5 ‐5 ‐15 ‐15 ‐5 ‐5
Equipment or Operation
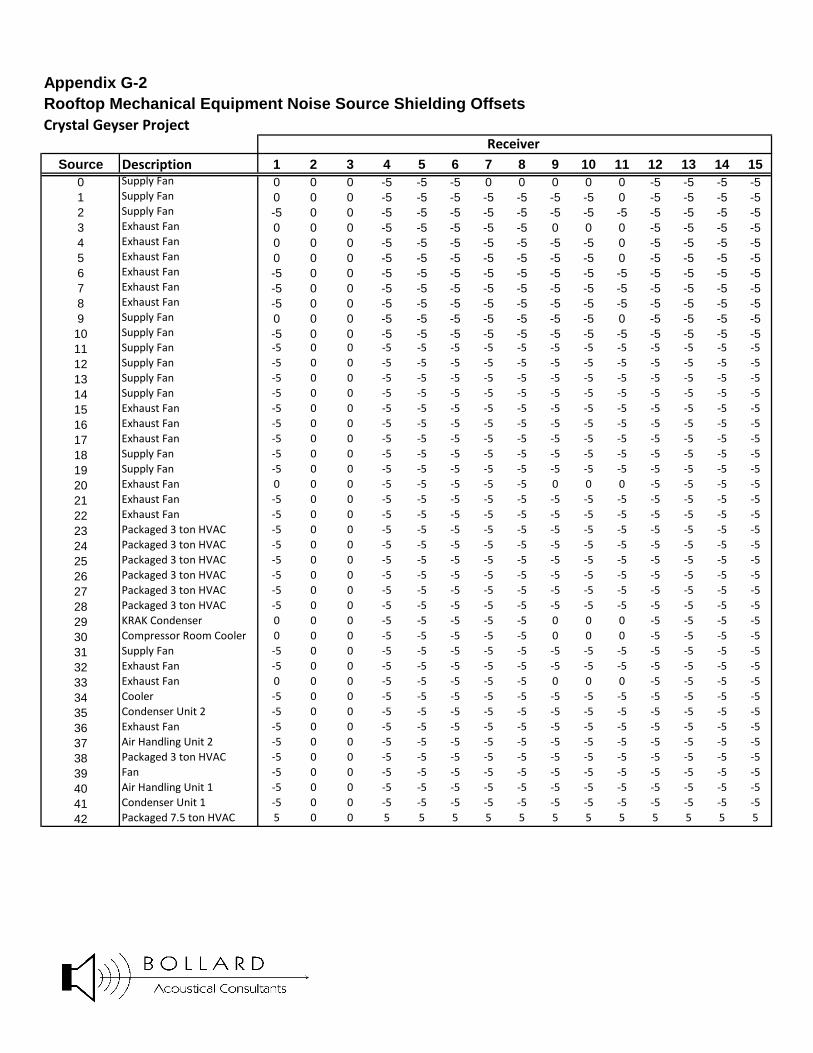
Appendix G-2Rooftop Mechanical Equipment Noise Source Shielding OffsetsCrystal Geyser Project
Source Description 1 2 3 4 5 6 7 8 9 10 11 12 13 14 150 Supply Fan 0 0 0 -5 -5 -5 0 0 0 0 0 -5 -5 -5 -51 Supply Fan 0 0 0 -5 -5 -5 -5 -5 -5 -5 0 -5 -5 -5 -52 Supply Fan -5 0 0 -5 -5 -5 -5 -5 -5 -5 -5 -5 -5 -5 -53 Exhaust Fan 0 0 0 -5 -5 -5 -5 -5 0 0 0 -5 -5 -5 -54 Exhaust Fan 0 0 0 -5 -5 -5 -5 -5 -5 -5 0 -5 -5 -5 -55 Exhaust Fan 0 0 0 -5 -5 -5 -5 -5 -5 -5 0 -5 -5 -5 -56 Exhaust Fan -5 0 0 -5 -5 -5 -5 -5 -5 -5 -5 -5 -5 -5 -57 Exhaust Fan -5 0 0 -5 -5 -5 -5 -5 -5 -5 -5 -5 -5 -5 -58 Exhaust Fan -5 0 0 -5 -5 -5 -5 -5 -5 -5 -5 -5 -5 -5 -59 Supply Fan 0 0 0 -5 -5 -5 -5 -5 -5 -5 0 -5 -5 -5 -5
10 Supply Fan -5 0 0 -5 -5 -5 -5 -5 -5 -5 -5 -5 -5 -5 -511 Supply Fan ‐5 0 0 ‐5 ‐5 ‐5 ‐5 ‐5 ‐5 ‐5 ‐5 ‐5 ‐5 ‐5 ‐5
12 Supply Fan ‐5 0 0 ‐5 ‐5 ‐5 ‐5 ‐5 ‐5 ‐5 ‐5 ‐5 ‐5 ‐5 ‐5
13 Supply Fan ‐5 0 0 ‐5 ‐5 ‐5 ‐5 ‐5 ‐5 ‐5 ‐5 ‐5 ‐5 ‐5 ‐5
14 Supply Fan ‐5 0 0 ‐5 ‐5 ‐5 ‐5 ‐5 ‐5 ‐5 ‐5 ‐5 ‐5 ‐5 ‐5
15 Exhaust Fan ‐5 0 0 ‐5 ‐5 ‐5 ‐5 ‐5 ‐5 ‐5 ‐5 ‐5 ‐5 ‐5 ‐5
16 Exhaust Fan ‐5 0 0 ‐5 ‐5 ‐5 ‐5 ‐5 ‐5 ‐5 ‐5 ‐5 ‐5 ‐5 ‐5
17 Exhaust Fan ‐5 0 0 ‐5 ‐5 ‐5 ‐5 ‐5 ‐5 ‐5 ‐5 ‐5 ‐5 ‐5 ‐5
18 Supply Fan ‐5 0 0 ‐5 ‐5 ‐5 ‐5 ‐5 ‐5 ‐5 ‐5 ‐5 ‐5 ‐5 ‐5
19 Supply Fan ‐5 0 0 ‐5 ‐5 ‐5 ‐5 ‐5 ‐5 ‐5 ‐5 ‐5 ‐5 ‐5 ‐5
20 Exhaust Fan 0 0 0 ‐5 ‐5 ‐5 ‐5 ‐5 0 0 0 ‐5 ‐5 ‐5 ‐5
21 Exhaust Fan ‐5 0 0 ‐5 ‐5 ‐5 ‐5 ‐5 ‐5 ‐5 ‐5 ‐5 ‐5 ‐5 ‐5
22 Exhaust Fan ‐5 0 0 ‐5 ‐5 ‐5 ‐5 ‐5 ‐5 ‐5 ‐5 ‐5 ‐5 ‐5 ‐5
23 Packaged 3 ton HVAC ‐5 0 0 ‐5 ‐5 ‐5 ‐5 ‐5 ‐5 ‐5 ‐5 ‐5 ‐5 ‐5 ‐5
24 Packaged 3 ton HVAC ‐5 0 0 ‐5 ‐5 ‐5 ‐5 ‐5 ‐5 ‐5 ‐5 ‐5 ‐5 ‐5 ‐5
25 Packaged 3 ton HVAC ‐5 0 0 ‐5 ‐5 ‐5 ‐5 ‐5 ‐5 ‐5 ‐5 ‐5 ‐5 ‐5 ‐5
26 Packaged 3 ton HVAC ‐5 0 0 ‐5 ‐5 ‐5 ‐5 ‐5 ‐5 ‐5 ‐5 ‐5 ‐5 ‐5 ‐5
27 Packaged 3 ton HVAC ‐5 0 0 ‐5 ‐5 ‐5 ‐5 ‐5 ‐5 ‐5 ‐5 ‐5 ‐5 ‐5 ‐5
28 Packaged 3 ton HVAC ‐5 0 0 ‐5 ‐5 ‐5 ‐5 ‐5 ‐5 ‐5 ‐5 ‐5 ‐5 ‐5 ‐5
29 KRAK Condenser 0 0 0 ‐5 ‐5 ‐5 ‐5 ‐5 0 0 0 ‐5 ‐5 ‐5 ‐5
30 Compressor Room Cooler 0 0 0 ‐5 ‐5 ‐5 ‐5 ‐5 0 0 0 ‐5 ‐5 ‐5 ‐5
31 Supply Fan ‐5 0 0 ‐5 ‐5 ‐5 ‐5 ‐5 ‐5 ‐5 ‐5 ‐5 ‐5 ‐5 ‐5
32 Exhaust Fan ‐5 0 0 ‐5 ‐5 ‐5 ‐5 ‐5 ‐5 ‐5 ‐5 ‐5 ‐5 ‐5 ‐5
33 Exhaust Fan 0 0 0 ‐5 ‐5 ‐5 ‐5 ‐5 0 0 0 ‐5 ‐5 ‐5 ‐5
34 Cooler ‐5 0 0 ‐5 ‐5 ‐5 ‐5 ‐5 ‐5 ‐5 ‐5 ‐5 ‐5 ‐5 ‐5
35 Condenser Unit 2 ‐5 0 0 ‐5 ‐5 ‐5 ‐5 ‐5 ‐5 ‐5 ‐5 ‐5 ‐5 ‐5 ‐5
36 Exhaust Fan ‐5 0 0 ‐5 ‐5 ‐5 ‐5 ‐5 ‐5 ‐5 ‐5 ‐5 ‐5 ‐5 ‐5
37 Air Handling Unit 2 ‐5 0 0 ‐5 ‐5 ‐5 ‐5 ‐5 ‐5 ‐5 ‐5 ‐5 ‐5 ‐5 ‐5
38 Packaged 3 ton HVAC ‐5 0 0 ‐5 ‐5 ‐5 ‐5 ‐5 ‐5 ‐5 ‐5 ‐5 ‐5 ‐5 ‐5
39 Fan ‐5 0 0 ‐5 ‐5 ‐5 ‐5 ‐5 ‐5 ‐5 ‐5 ‐5 ‐5 ‐5 ‐5
40 Air Handling Unit 1 ‐5 0 0 ‐5 ‐5 ‐5 ‐5 ‐5 ‐5 ‐5 ‐5 ‐5 ‐5 ‐5 ‐5
41 Condenser Unit 1 ‐5 0 0 ‐5 ‐5 ‐5 ‐5 ‐5 ‐5 ‐5 ‐5 ‐5 ‐5 ‐5 ‐5
42 Packaged 7.5 ton HVAC 5 0 0 5 5 5 5 5 5 5 5 5 5 5 5
Receiver
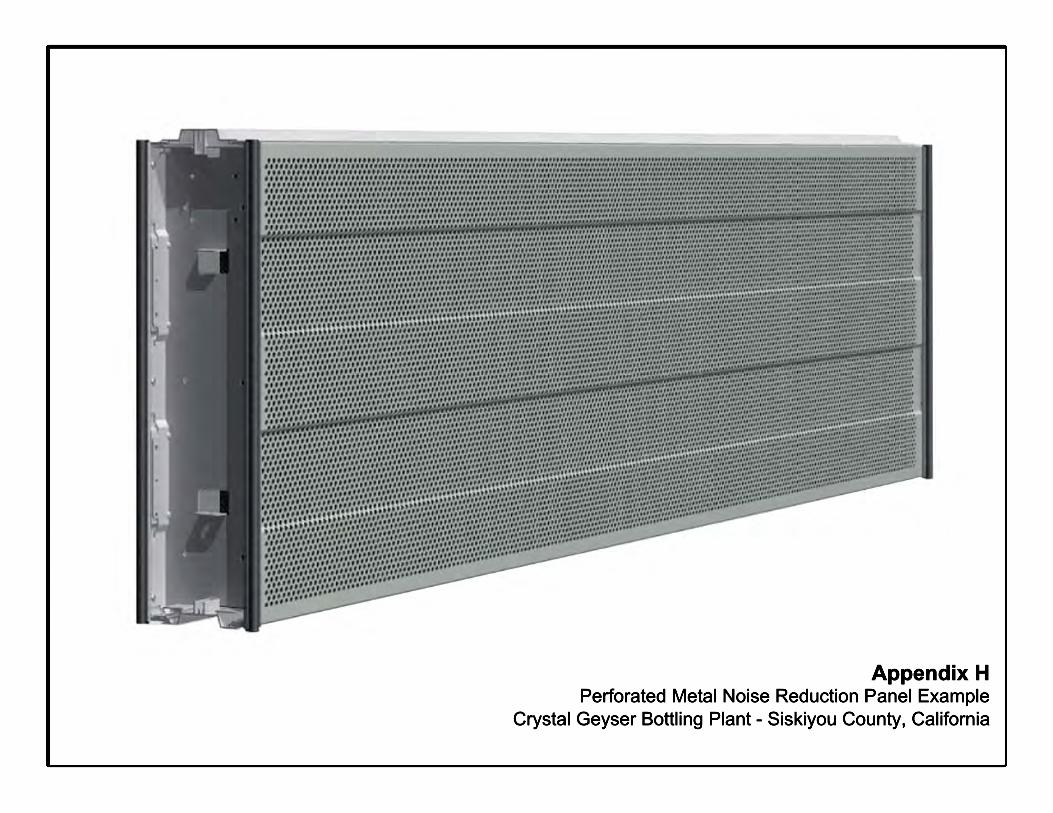

Crystal Geyser Project3 x Caterpillar G3412C LE Engine/Generator Sets
GENSETPOWER
PERCENTLOAD
ENGINEPOWER
OVERALLSOUND
63 Hz 125 HZ 250 HZ 500 HZ 1000 HZ 2000 HZ 4000 HZ 8000 HZ Feet 1 100
EKW % BHP dB(A) dB(A) dB(A) dB(A) dB(A) dB(A) dB(A) dB(A) dB(A) LOG(d/1) 0 1.48376.0 100 573 97.7 87.2 91.2 92.2 94.2 93.2 92.2 76.2 69.2 dB(A) 0.0 29.6
dB(A) 77.9 48.3dB(A) 16.2 30.7 23.7 19.4 28.3 23.7 22.6 19.6
GENSETPOWER
PERCENTLOAD
ENGINEPOWER
OVERALLSOUND
63 Hz 125 HZ 250 HZ 500 HZ 1000 HZ 2000 HZ 4000 HZ 8000 HZ
EKW % BHP dB(A) 63 Hz 125 HZ 250 HZ 500 HZ 1000 HZ 2000 HZ 4000 HZ 8000 HZ376.0 100 573 77.9 71.0 60.5 68.5 74.8 64.9 68.5 53.6 49.6
Note: 1) Estimate Sound Pressure Levels at a point 3.3 feet from exterior walls of the enclosure
GENSETPOWER
PERCENTLOAD
ENGINEPOWER
OVERALLSOUND
63 Hz 125 HZ 250 HZ 500 HZ 1000 HZ 2000 HZ 4000 HZ 8000 HZ Feet 1 100
EKW % BHP dB(A) dB(A) dB(A) dB(A) dB(A) dB(A) dB(A) dB(A) dB(A) LOG(d/1) 0 1.48376.0 100 573 113.0 102.5 112.5 113.2 112.5 105.5 103.2 101.9 92.1 dB(A) 0.0 29.6
dB(A) 84.1 54.4dB(A) 25 35 42 35 30 30 30 30
GENSETPOWER
PERCENTLOAD
ENGINEPOWER
OVERALLSOUND
63 Hz 125 HZ 250 HZ 500 HZ 1000 HZ 2000 HZ 4000 HZ 8000 HZ
EKW % BHP dB(A) 63 Hz 125 HZ 250 HZ 500 HZ 1000 HZ 2000 HZ 4000 HZ 8000 HZ376.0 100 573 84.1 77.5 77.5 71.2 77.5 75.5 73.2 71.9 62.1
Note: 2) Estimate Sound Pressure Levels at a point 3.3 feet from the exhaust outlet of the silencer
66 dB(A) @ 25
Feet 0 0.60LOG(d/1) 0.0 12.0dB(A) 66.0 54.0
100
Estimated Dispersion
Estimated Dispersion
Estimated Dispersion
Attenuation: DCL HGS Silencer
Estimated Sound PressureLevel2
Radiator Noise: Estimated SPL is feet from radiator with 524 rpm fan, 8° blade pitch, 80" diameter, 8 blade aluminumfeet from radiator with 524 rpm fan, 8° blade pitch, 80" diameter, 8 blade aluminum construction. Radiator discharge is vertical. Feet 1
Information based on manufacturers published data and calculations. Sound Data from Caterpillar has been measured in accordance with ISO 6798 in a Grade 3 test environment.Roxul data based on acoustical coefficients based on ASTM C423. DCL data is factory supplied. Radiator data is factory supplied. Uncertainty (variation) in data for a Grade 3 testenvironment is equal to 4 dB (A weighted).
Free Field Exhaust Noisemeasured 3.3 feet fromengine exhaust outletCat EM0835 02 001
Mechanical Noise
Free Field MechanicalNoise measured 3.3 feet
from engineCat EM0835 02 001
Attenuation: ROXUL Safe 4.6 lb/ft3 density & 4" thickness
Estimated Sound PressureLevel1
Exhaust Noise
Peterson Power Systems2828 Teagarden StreetSan Leandro, CA 94577
Estimated Sound Pressure LevelsCrystal Geyser Project 2/18/2017
Attachm
ent1:Generator
Noise
Spec.S
heet