Embed Size (px)
Citation preview

Revised Current Cost Financial Statements 2015 including Openreach Undertakings

Ofcom Statement on BT’s Current Cost Financial Statements 2015
Introduction
BT published the 2014/15 regulatory financial statements (RFS) on 31 July 2015. Our review
of the RFS identified a number of errors. To address these and other errors, BT has issued
revised 2014/15 RFS.
On 6 November we opened an investigation into BT’s apparent non-compliance with SMP
conditions 13A.8 and 8A.8, which require BT to publish reconciliation reports and
corresponding audit opinions (the “Reconciliation Report”) in relation to its RFS. On 30
November we confirmed our decision that BT had contravened, and was continuing to
contravene these conditions.
BT’s reporting obligations
BT’s reporting obligations arise out of market reviews conducted by Ofcom and SMP
Conditions and Directions related to regulatory reporting1 Under such SMP Conditions BT
is required to publish with the audited RFS any written statement made by Ofcom and
provided to BT commenting on the data in the notes to or the presentation of any or all of
the RFS, the Reconciliation Report and/or the Accounting Methodology Document.
While responsibility for the preparation of the RFS rests with BT, Ofcom believes that such
a statement can be helpful to users of the RFS by drawing attention to important aspects
of BT’s 2014/15 RFS and the outcomes of our review of BT’s regulatory reporting concluded
in May 2014 (the “Regulatory Reporting Review”) . We required BT to include a statement
with the RFS published on 31 July (our “July Statement”) and have required BT to include
this updated statement from Ofcom with the revised RFS.
Revised 2014/15 Regulatory Financial Statements
In our July Statement, we noted that as a result of issues that we and BT had identified, BT
issued a list of errata and corrections to its 2013/14 RFS. We said that we hoped this would
not be necessary for 2014/15.
However, we subsequently identified some errors in the 2014/15 RFS and BT discovered
some further issues during the preparation of its Reconciliation Report.
1 Some obligations also arise from the Undertakings given by BT under the Enterprise Act
2002. 2 Further information about our investigation is available at Further information about
our investigation is available at
In our July Statement, we explained that BT must now publish and notify Ofcom in advance
of any changes that it intends to make to its allocation methodologies (the “Change Control
Notification”). We noted that one of the changes in the Change Control Notification related
to BT’s proposed treatment of Excess Construction Charges (ECCs). We explained that we
had raised some concerns with BT regarding the appropriateness of this treatment, but
explained that BT considered that its proposed treatment was appropriate and had
adopted it in its 2014/15 RFS. This statement was based on information provided to us by
BT. However, it later became apparent that BT had not reflected the proposed treatment
in the 2014/15 RFS as £1.5m of costs had not been attributed to connection services. The
description in our July Statement was therefore incorrect.
We also identified several errors in the accounts as originally published. BT describes these
in Section 2.1.7 below. The largest error relates to the disclosure of eliminations of EOI
charges within residual markets.
Following discussions with Ofcom, BT decided to reissue the 2014/15 RFS to address these
errors.
The Reconciliation Report
Under SMP conditions 13A.8(vi) and 8A.8(vi), BT is required to publish the Reconciliation
Report setting out the changes it has made to its regulatory accounting methodology and
material errors it has corrected, and the impact of those changes and errors on the RFS.
The Reconciliation Report must be published within four months of the end of the financial
year to which it relates i.e. by 31 July. In our July Statement we noted that BT had said that
it would not meet this deadline for financial year 2014/15.
On 6 November we opened an investigation into BT’s apparent non-compliance with SMP
conditions 13A.8(vi) and 8A.8(vi). On 30 November we issued a ‘confirmation decision’ to
BT under section 96C of the Communications Act 2003, stating that we were satisfied that
BT had contravened and was continuing to contravene those SMP conditions and requiring
BT to publish the Reconciliation Report by 4 December 20152.
http://stakeholders.ofcom.org.uk/enforcement/competition-bulletins/open-cases/all-open-cases/cw_01171/

Ofcom Statement on BT’s Current Cost Financial Statements 2015
Update to our July Statement
The remainder of this statement contains the points raised in our July Statement which we
have updated where necessary.
The Regulatory Reporting Review
In the Regulatory Reporting Review, Ofcom made a number of changes to BT’s regulatory
reporting requirements. These were intended to give Ofcom a greater role in determining
the way that BT prepares its RFS, to improve the presentation of the RFS and supporting
documentation and to ensure that Ofcom and other stakeholders have the information
that they need.
Changes to the basis of preparation
Changes to the basis of preparation introduced for 2014/15 include new Regulatory
Accounting Principles (including the requirement for consistency with regulatory decisions)
and the requirement for BT to prepare its RFS on a regulatory asset value adjusted current
cost basis.
The RFS are produced by BT on the basis described in its new Accounting Methodology
Document3, which sets out amongst other things BT’s Attribution Methods and Accounting
Policies.
Additional Reporting Requirements in 2014/15
The 2014/15 RFS reflect the directions we made in our March 2015 Statement (Directions
for Regulatory Financial Reporting)4. These include revised formats for several of the
3 http://www.btplc.com/Thegroup/RegulatoryandPublicaffairs/Financialstatements/2015/AccountingMethodologyDocument201415.pdf 4 http://stakeholders.ofcom.org.uk/binaries/consultations/financial-
reporting/statement/statement.pdf 5 http://www.btplc.com/Thegroup/RegulatoryandPublicaffairs/Financialstatements/2015/ChangeControlNotification-31March2015.pdf
schedules and the requirement for BT to prepare its RFS on a regulatory asset value
adjusted current cost basis.
It is important that BT retains responsibility for its RFS and can respond to changes in
circumstances when deciding how best to prepare them. However, as noted above, for the
first time in 2014/15, BT must now publish a Change Control Notification. The Change
Control Notification must be accompanied by a description of each of the changes, the
reason for making the changes and their impact on the RFS (based on the prior year RFS).
Where in Ofcom’s opinion a proposed change does not comply with any SMP Conditions
or the Regulatory Accounting Principles, Ofcom can direct BT not to make such change.
BT published its 2014/15 Change Control Notification on 31 March 2015.5 This set out the
changes that BT considered to be necessary to reflect the new reporting requirements that
followed the Fixed Access Market Review6 and the Wholesale Broadband Access Market
Review7, and other changes to reflect changes in circumstances identified by BT.
We discussed the Change Control Notification with BT. Following these discussions, BT
decided not to implement one of its proposed changes (described in the Change Control
Notification as “BT TSO Electricity”) and amended some other changes. These changes
should be reflected in BT’s Reconciliation Report.
As explained above, one of the changes in the Change Control Notification related to BT’s
proposed treatment of ECCs. BT considers that its proposed treatment is appropriate and
has now adopted it in the revised 2014/15 RFS. We have made a proposal for reporting of
ECCs in the Leased Lines Charge Control consultation issued on 12 June 20158. Depending
on stakeholder comments we may direct BT to change the way that it reports ECCs in future
RFS.
6 http://stakeholders.ofcom.org.uk/telecoms/ga-scheme/specific-conditions-entitlement/market-power/fixed-access-market-reviews-2014/statement/ 7 http://stakeholders.ofcom.org.uk/binaries/consultations/review-wba-
markets/statement/WBA-Statement.pdf 8 http://stakeholders.ofcom.org.uk/binaries/consultations/llcc-dark-fibre/summary/llcc-
dark-fibre.pdf

Ofcom Statement on BT’s Current Cost Financial Statements 2015
Cost Attribution Review
In the Regulatory Reporting Review, we explained that we would review BT’s existing
attribution rules against the new Regulatory Accounting Principles and that we would
consult on the findings from this review alongside the Business Connectivity Market Review
consultation, with the intention that any proposed changes to the attribution rules would
be reflected in any consequent price control.
In June 2015, we published the initial findings from that review and invited stakeholders’
views on if and how BT’s existing attribution rules need to change (the “Cost Attribution
Review”). We explained that we had identified some errors in spreadsheets and supporting
calculations and costs that have been allocated incorrectly. BT has explained that it has
corrected these errors in the 2014/15 RFS.
We also identified some attribution methodologies used by BT to prepare the 2013/14 RFS
that we consider are inappropriate because we do not consider that they appropriately
reflect the activities that cause the costs to be incurred. Where we consider that current
rules are not appropriate, we proposed what we consider to be appropriate cost
attribution methodologies.
In November, we published a second consultation on the Cost Attribution Review updating
the proposals made in June and making proposals for further changes to BT’s attribution
methodologies. We included further proposals for changes to the way BT attributes some
of its costs in our update on the proposed Leased Lines Charge Controls.9
We expect to make our decision on if and how BT should change its attribution rules in spring 2016. BT has not reflected the proposed changes in the 2014/15 RFS.
9 http://stakeholders.ofcom.org.uk/binaries/consultations/bcmr-update-proposed-
leased-lines-charge-controls/summary/BCMR_LLCC_Consultation.pdf

Contents
Page 1
Revised Current Cost Financial Statements
1.1 Introduction: Regulation in the UK .............................................................................. 5
1.2 Regulatory Financial Reporting Obligations ................................................................ 7
1.3 Revisions to the Current Cost Financial Statements .................................................... 8
2.1 Basis of Preparation .................................................................................................. 11
2.1.1 Regulatory Accounting Framework ...................................................................... 11
2.1.2 Regulatory Accounting Principles ........................................................................ 11
2.1.3 Documentation and Application of the Regulatory Accounting Framework ....... 11
2.1.4 Changes to BT’s Financial Reporting Obligations ................................................. 12
2.1.5 Comparability of current and prior year results .................................................. 12
2.1.6 Change Control Notification – amendments and additional methodologies ....... 15
2.1.7 Revision of the 2014/15 RFS including comparative information ........................ 16
3.1 Statement of Responsibility ...................................................................................... 20
4.1 Report of Independent Auditors ............................................................................... 22
5.1 Performance Summary by Market 2015 ................................................................... 27
5.2 Performance Summary by Market 2014 ................................................................... 28
6.1 Wholesale sector costs .............................................................................................. 30
6.1.1 Attribution of Wholesale Current Costs 2015 ........................................................ 31
6.1.2 Attribution of Wholesale Current Costs 2014 ........................................................ 32
6.2 Wholesale MCE sector costs...................................................................................... 33
6.2.1 Attribution of Wholesale Current Cost Mean Capital Employed 2015 ................... 34
6.2.2 Attribution of Wholesale Current Cost Mean Capital Employed 2014 ................... 35
7.1 Fixed Access Markets Review .................................................................................... 37
7.2 Fixed Access Market - WFAEL .................................................................................... 38
7.2.1 WFAEL Summary 2015 ......................................................................................... 38
7.2.2 WFAEL calculation of FAC based on component costs and usage factors 2015 .. 39
7.2.3 WFAEL Summary 2014 ......................................................................................... 40
7.2.4 WFAEL calculation of FAC based on component costs and usage factors 2014 .. 41
7.3 Fixed Access Market - WLA ........................................................................................ 42
7.3.1 WLA Summary 2015 ............................................................................................. 42
7.3.2 WLA calculation of FAC based on component costs and usage factors 2015 ...... 43
7.3.3 WLA Summary 2014 ............................................................................................. 45
7.3.4 WLA calculation of FAC based on component costs and usage factors 2014 ...... 46
7.4 Fixed Access Market – ISDN2..................................................................................... 48
7.4.1 ISDN2 Summary 2015 .......................................................................................... 48
7.4.2 ISDN2 Summary 2014 .......................................................................................... 49
7.5 Fixed Access Market – ISDN30................................................................................... 50
7.5.1 ISDN30 Summary 2015 ........................................................................................ 50
7.5.2 ISDN30 Summary 2014 ........................................................................................ 51
8.1 Review of Business Connectivity Markets ................................................................. 53
8.2 Business Connectivity Market – Low Bandwidth TISBO ............................................ 55
8.2.1 Low Bandwidth TISBO Summary 2015 ................................................................. 55
8.2.2 Low Bandwidth TISBO calculation of FAC based on component costs and usage factors 2015 .................................................................................................................. 56
8.2.3 Low Bandwidth TISBO Summary 2014 ................................................................. 58
8.2.4 Low Bandwidth calculation of FAC based on component costs and usage factors 2014 .............................................................................................................................. 59
8.3 Business Connectivity Market – Medium Bandwidth TISBO ..................................... 61
8.3.1 Medium Bandwidth TISBO Summary 2015 .......................................................... 61
8.3.2 Medium Bandwidth TISBO calculation of FAC based on component costs and usage factors 2015 .................................................................................................................. 62
8.3.3 Medium Bandwidth TISBO Summary 2014 .......................................................... 63
8.3.4 Medium Bandwidth TISBO calculation of FAC based on component costs and usage factors 2014 .................................................................................................................. 64
8.4 Business Connectivity Market – High Bandwidth TISBO ............................................ 65
8.4.1 High Bandwidth TISBO Summary 2015 ................................................................ 65

Contents
Page 2
8.4.2 High Bandwidth TISBO calculation of FAC based on component costs and usage factors 2015 .................................................................................................................. 66
8.4.3 High Bandwidth TISBO Summary 2014 ................................................................ 67
8.4.4 High Bandwidth TISBO calculation of FAC based on component costs and usage factors 2014 .................................................................................................................. 68
8.5 Business Connectivity Market – TI Regional Trunk .................................................... 69
8.5.1 TI Regional Trunk Summary 2015 ........................................................................ 69
8.5.2 TI Regional Trunk calculation of FAC based on component costs and usage factors 2015 .............................................................................................................................. 70
8.5.3 TI Regional Trunk Summary 2014 ........................................................................ 71
8.5.4 TI Regional Trunk calculation of FAC based on component costs and usage factors 2014 .............................................................................................................................. 72
8.6 Business Connectivity Market – Technical Areas (Point of Handover) ...................... 73
8.6.1 Technical Areas (Point of Handover) Summary 2015........................................... 73
8.6.2 Technical Areas (Point of Handover) calculation of FAC based on component costs and usage factors 2015 ................................................................................................. 74
8.6.3 Technical Areas (Point of Handover) Summary 2014........................................... 75
8.6.4 Technical Areas (Point of Handover) calculation of FAC based on component costs and usage factors 2014 ................................................................................................. 76
8.7 Business Connectivity Market – AISBO Non WECLA .................................................. 77
8.7.1 AISBO Non WECLA Summary 2015 ...................................................................... 77
8.7.2 AISBO Non WECLA calculation of FAC based on component costs and usage factors 2015 .............................................................................................................................. 78
8.7.3 AISBO Non WECLA Summary 2014 ...................................................................... 80
8.7.4 AISBO Non WECLA calculation of FAC based on component costs and usage factors 2014 .............................................................................................................................. 81
8.8 Business Connectivity Market – AISBO WECLA ......................................................... 83
8.8.1 AISBO WECLA Summary 2015 .............................................................................. 83
8.8.2 AISBO WECLA calculation of FAC based on component costs and usage factors 2015 .............................................................................................................................. 84
8.8.3 AISBO WECLA Summary 2014 .............................................................................. 86
8.8.4 AISBO WECLA calculation of FAC based on component costs and usage factors 2014 .............................................................................................................................. 87
8.9 Business Connectivity Market – MISBO Non WECLA ................................................. 89
8.9.1 MISBO Non WECLA Summary 2015 ..................................................................... 89
8.9.2 MISBO Non WECLA calculation of FAC based on component costs and usage factors 2015 .................................................................................................................. 90
8.9.3 MISBO Non WECLA Summary 2014 ..................................................................... 91
8.9.4 MISBO Non WECLA calculation of FAC based on component costs and usage factors 2014 .................................................................................................................. 92
9.1 Review of Narrowband Markets ................................................................................ 94
9.2 Narrowband Market – Fixed Call Origination ............................................................ 95
9.2.1 Fixed Call Origination Summary 2015 .................................................................. 95
9.2.2 Fixed Call Origination Summary 2014 .................................................................. 95
9.3 Narrowband Market – Fixed Geographic Call Termination ....................................... 96
9.3.1 Fixed Geographic Call Termination Summary 2015 ............................................. 96
9.3.2 Fixed Geographic Call Termination Summary 2014 ............................................. 96
9.4 Narrowband Market – Technical areas (Interconnect Circuits) ................................. 97
9.4.1 Technical areas (Interconnect Circuits) Summary 2015 ....................................... 97
9.4.2 Technical areas (Interconnect Circuits) calculation of FAC based on component costs and usage factors 2015 ........................................................................................ 98
9.4.3 Technical areas (Interconnect Circuits) Summary 2014 ....................................... 99
9.4.4 Technical areas (Interconnect Circuits) calculation of FAC based on component costs and usage factors 2014 ...................................................................................... 100
10.1 Wholesale Broadband Access (“WBA”) Markets Review ....................................... 102
10.2 WBA - Market A ..................................................................................................... 103
10.2.1 WBA (Market A) Summary 2015 ...................................................................... 103
10.2.2 WBA (Market A) calculation of FAC based on component costs and usage factors 2015 ............................................................................................................................ 104
10.2.3 WBA (Market A) EOI 2015 ................................................................................ 106
10.2.4 WBA (Market A) Summary 2014 ...................................................................... 107

Contents
Page 3
10.2.5 WBA (Market A) calculation of FAC based on component costs and usage factors 2014 ............................................................................................................................ 108
10.2.6 WBA (Market A) EOI 2014 ................................................................................ 110
11.1 BT Reconciliation Statement 2015 ........................................................................ 112
11.2 BT Reconciliation Statement 2014 ........................................................................ 112
11.3 BT Reconciliation Statement MCE 2015 ................................................................ 113
12.1 Revised Openreach Information ............................................................................ 115
12.2 Revised Openreach Income Statement 2015 ........................................................ 116
12.3 Revised Openreach Income Statement 2014 ........................................................ 117
12.4 Revised Openreach MCE Statement 2015 ............................................................. 118
12.5 Revised Openreach MCE Statement 2014 ............................................................. 119
12.6 Reconciliation of Revised Openreach Income Statements .................................... 120
Appendix 1.1 Network Activity Statements Consolidated 2015 .................................... 122
Appendix 1.2 Network Activity Statements Consolidated 2014 .................................... 125
Appendix 2.1 Price Controls in Regulated Markets ....................................................... 129
Appendix 3.1 Adjusted Financial Performance Schedule .............................................. 131
Appendix 3.2 Adjusted Financial Performance Schedule 2015 ..................................... 132
Appendix 3.3 Adjusted Financial Performance Schedule 2014 ..................................... 133
Appendix 4 Revised Time Related Charges and Special Fault Investigation Costs ........ 135
Glossary ......................................................................................................................... 137
Footnotes ...................................................................................................................... 140
Additional Information .................................................................................................. 142

Section 1 – Introduction to the Current Cost Financial Statements
Page 4
Section 1 Introduction to the Current Cost Financial Statements

Section 1 – Introduction to the Current Cost Financial Statements
Page 5
1.1 Introduction: Regulation in the UK
European Union (“EU”) regulation
In EU countries, electronic communications networks and services are governed by directives and regulations set by the European Commission (“EC”). These create a Europe-wide framework covering services such as fixed and mobile voice, broadband, cable and satellite TV.
The directives include rules covering access and interconnection, universal service obligations and a requirement for national regulators to review markets for Significant Market Power (“SMP”) every three years.
Companies with SMP typically have a market share of 40% or more and are able to do things such as increase prices without losing business to competitors (as would happen in a fully competitive market).
The directives also cover how regulators set price controls which can have a major impact on the companies subject to them. The rules require national regulators to consult with the EC on any price control decisions before they are finalised to make sure they are consistent with European regulations.
The EC announced its strategy for the Digital Single Market on 6 May 2015 which included a plan to review the EU Telecommunications Framework. As part of this review, the EC aims to assess how to encourage investment in infrastructure and how to make current telecoms and media rules fit for new challenges and new providers. The EC will also consider a European approach to spectrum management.
UK regulation
The telecoms and broadcasting industries are regulated primarily by Ofcom (the UK’s independent regulator) within the framework set by the various European directives, the Communications Act and other UK and EU regulations and recommendations. The telecoms sector is subject to an extensive ex-ante regulatory framework set out under the European Common Regulatory Framework.
The Communications Act and Ofcom
The Communications Act gives Ofcom legal powers and sets out how electronic communication and broadcasting services should be regulated in the UK. It includes the conditions set by the European directives.
Ofcom’s main duties are:
to further the interests of citizens in relation to communications matters.
to further the interests of consumers in relevant markets, where appropriate by promoting competition.
Under the powers of the Communications Act, Ofcom sets conditions that Communication Providers (“CPs”) must comply with. Some conditions, known as General Conditions, apply to all CPs. These mainly deal with protecting consumers’ general access and interconnection, planning for emergencies, providing information to Ofcom and allocating and transferring phone numbers. Other conditions apply to certain companies that are universal service providers or that Ofcom has decided have SMP in a particular market.
We are the designated universal service provider for the UK (except for the Hull area where it is KCOM Group) and so we have certain obligations. The main one is to make sure that basic fixed-line services are available at an affordable price to all consumers in the UK. We are also obliged to provide public payphones.
We have SMP in a number of markets. Ofcom’s market reviews are therefore very important for us. Following a market review, if Ofcom decides that a CP has SMP, it can put controls in place, typically on the prices which the CP can charge. Ofcom will generally try to set charges that are reasonably based on costs and an appropriate return on the capital invested.
Anyone can appeal against Ofcom’s decisions through a number of routes, including to the Competition Appeal Tribunal (“CAT”) or to the High Court.
In March 2015, Ofcom announced a major review of the digital communications market. The Strategic Review of Digital Communications will examine competition, investment, innovation and the availability of products in the fixed-line, broadband and mobile markets. It will focus on three areas in particular:
ensuring the right incentives for private-sector investment, which can help deliver availability and quality of service.
maintaining strong competition and tackling obstacles or bottlenecks that might be holding the sector back.
identifying whether there is scope for deregulation in some areas.
The first phase of the review examined current and future market factors that may affect digital communications services, and current regulatory approaches. To inform this work, Ofcom engaged with a wide range of stakeholders - including industry, consumer groups, the UK Government and devolved administrations - through meetings and workshops. This phase of the review has concluded with a discussion document issued in July 2015.

Section 1 – Introduction to the Current Cost Financial Statements
Page 6
BT’s Undertakings
In response to Ofcom’s 2005 Strategic Review of Telecommunications, we gave some legally-binding undertakings under the Enterprise Act 2002. These Undertakings (which included the creation of Openreach) began in September 2005. They aim to give clarity and certainty to the UK telecoms industry about the way we provide ‘upstream’ regulated products. This in turn supports effective and fair competition in related ‘downstream’ markets.
Impact of Regulation
There were a number of regulatory decisions and outcomes of appeals that affected us during the year and will impact us in the future.
Fixed Access and Wholesale Broadband Access Market Reviews
In June 2014, Ofcom completed its reviews of both the Fixed Access market (covering WLR, LLU, GEA, ISDN2 and ISDN30 products) and the Wholesale Broadband Access (WBA) market (covering IPstream, Datastream and WBC).
Ofcom continued to impose charge controls on the markets where we have SMP. These controls cover the three years to March 2017.
During this period, the artificially low price of full LLU will be phased out to better reflect the actual costs of providing the service of CPs.
Ofcom did not impose price regulation of wholesale fibre broadband (GEA)
For WBA, Ofcom enlarged the size of the area where the competition is greater and where we are free to set prices as we wish.
Business Connectivity Market Review
During the year Ofcom began its pre-consultation process ahead of reviewing the business connectivity markets and the associated leased line charge control.
Consultation documents were issued in May and June 2015 with the new regulations applying from April 2016
Ofcom’s review will consider, amongst other things, the merits of introducing a new passive dark fibre remedy as well as scope for further deregulation, reflecting an increasingly competitive market.
Wholesale Narrowband
In April 2015, Ofcom issued a ‘call for inputs’, being the first stage in its review of the wholesale fixed call origination, termination and interconnection markets.
Market Review
The review will consider whether regulation of call origination is still appropriate and whether further charge controls are required when the current controls end in September 2016.
Cost accounting and Accounting Separation
Where a provider has SMP, the Communications Act enables Ofcom to impose one or more obligations in relation to each market, including the implementation of cost accounting and/or accounting separation.
The purpose of imposing an obligation to implement a cost accounting system is to ensure that fair, objective and transparent criteria are followed in allocating our costs to services in situations where we are subject to obligations for charge controls or cost-oriented prices.
The purpose of imposing an obligation regarding accounting separation is to provide a higher level of detail of information than that derived from statutory financial statements, to reflect as closely as possible the performance of parts of our business as if they had operated as separate businesses, to prevent discrimination in favour of our own activities and to prevent unfair cross-subsidy.
The Company’s cost accounting and accounting separation systems need to be capable of reporting regulatory financial information to demonstrate full compliance with our regulatory obligations.

Section 1 – Introduction to the Current Cost Financial Statements
Page 7
1.2 Regulatory Financial Reporting Obligations
The form and content of these Current Cost Financial Statements is based on the reporting obligations set out by Ofcom. We refer to these obligations as “the Final Statements and Notifications”.
(a) Fixed Access and WBA markets regulatory market obligations are:
“Regulatory Financial Reporting” Statement issued 20 May 2014.
“Directions for Regulatory Financial Reporting” issued on 30 March 2015.
(b) Narrowband/BCMR market regulatory obligations consists of:
“The Regulatory Financial Reporting Obligations on BT and Kingston Communications” issued 22 July 2004.
“Changes to BT’s Regulatory Financial Reporting Framework” issued 31 August 2005.
“Changes to BT’s Regulatory Financial Reporting and Audit Requirements” issued 16 August 2006.
“Changes to BT’s Regulatory Financial Reporting and Audit Requirements” issued 30 May 2007.
“Changes to BT’s 2007/08 Regulatory Financial Statements” issued 26 June 2008.
“Changes to BT and KCOM’s Regulatory Financial Reporting – 2008/09 update” issued 15 June 2009.
“Changes to BT and KCOM’s regulatory and financial reporting 2009/10 update” issued 4 June 2010.
“Changes to BT and KCOM’s regulatory and financial reporting 2010/11 update” issued 2 June 2011.
“Changes to BT and KCOM’s regulatory and financial reporting 2011/12 update” issued 17 April 2012.
“Changes to BT and KCOM’s regulatory and financial reporting 2012/13 update” issued 25 April 2013.
“Changes to BT and KCOM’s regulatory and financial reporting 2013/14 update” issued 3 April 2014.
“Regulatory Financial Reporting” Statement published 20 May 2014.
The Initial Statement and Notification on our regulatory financial reporting requirements imposed 34 SMP Services Conditions (OA1-OA34) to the relevant markets where we are deemed to have SMP and to the relevant technical areas associated with the identified markets. Full details of these conditions can be found in the Final Statement and Notification “The regulatory financial reporting obligations on BT and Kingston Communications”, which was issued on 22 July 2004.
Ofcom published six Directions under SMP Services Condition OA2 to impose further requirements on us in respect of our regulatory financial reporting obligations. The original Directions and amendments to these Directions can be found in the Final Statements and Notifications.
Direction 1 sets out a list of network components that we must report on under the regulatory financial reporting obligation and in its reference offers.
Direction 2 imposes a transparency principle on us in relation to the accounting documentation.
Direction 3 sets out the Regulatory Financial Statements that should be prepared, delivered to Ofcom and published, and the level of audit opinion that should be secured for each statement.
Direction 4 sets out the required form and content of the different types of Regulatory Financial Statements required under Direction 3.
Direction 5 sets out the detailed form of the Fairly Presents in Accordance with (FPIA) audit opinion required under Direction 3.
Direction 6 sets out the detailed form of the Properly Prepared in Accordance with (PPIA) audit opinion required under Direction 3.
We are also required by Ofcom to provide additional detailed information to enable Ofcom to regulate effectively and efficiently. This additional information is not subject to any independent examination.
In the Current Cost Financial Statements for 2015, we are obliged to report on the following SMP markets (in the UK excluding the Hull area, modified where stated below):
Fixed Access markets
Wholesale analogue exchange line services.
Wholesale local access services.
Wholesale ISDN2 exchange line services.
Wholesale business ISDN30 exchange line services.
Business Connectivity markets
Traditional interface symmetric broadband origination (TISBO) (up to and including 8Mbit/s).
TISBO excluding the WECLA (above 8Mbit/s up to and including 45Mbit/s).
TISBO excluding the WECLA (above 45Mbit/s up to and including 155Mbit/s).
Technical areas (Point of Handover).
Alternative interface symmetric broadband origination (AISBO) excluding the WECLA (up to and including 1Gbit/s).

Section 1 – Introduction to the Current Cost Financial Statements
Page 8
AISBO in the WECLA (up to and including 1Gbit/s).
Multiple interface symmetric broadband origination (MISBO) excluding the WECLA (above 1Gbit/s).
Wholesale regional trunk segments.
Narrowband markets
Call origination on fixed public narrowband networks.
Fixed geographic call termination.
Technical areas (Interconnect Circuits).
Broadband markets
Wholesale Broadband Access (Market A).
For the purpose of the Statements we have chosen to use abbreviated names to the markets which can be seen in Table 1. All the markets have Accounting Separation (AS) and Cost Accounting (CA) obligations. Other abbreviated names, acronyms and footnotes used through the document are defined in the Glossary and Footnotes on pages 137 and 140 respectively.
Openreach
We are also required by the Undertakings (section 5.31) to disclose the financial results of Openreach separately and to reconcile the financial results to the Openreach segmental information shown in BT Group plc’s Annual Report. We have included this information in section 12.
Regulatory Financial Review
To help a user of the Current Cost Financial Statements understand the changes in the performance of products and services in each market, we are required to prepare “Regulatory Financial Reviews”. These are included in section 7 to 10 at the grouped market level, as defined by Ofcom, to explain:
The main factors and influences that drive each market or groups of markets.
New products and services.
Further detail is provided in Section 2 as to methodology and other changes in comparatives affecting the prior year results, and changes in methodology for the current year.
New Reporting Obligations
In Ofcom’s Statement of 20 May 2014 on “Regulatory Financial Reporting”, Ofcom set out additional obligations for BT to produce a reconciliation report that:
Discloses the impact of the prior year methodologies upon the current year results.
Discloses the impact of material errors on the prior year results, where material error is one that exceeds the higher of 5% or £1 million on any figure in the prior year Current Cost Financial Statements.
BT is also required to obtain external assurance upon those reports. This reconciliation report “Reconciliation Report 2015” will be published during November 2015.
1.3 Revisions to the Current Cost Financial Statements
Subsequent to the original publication of the Current Cost Financial Statements on 31 July 2015 (the “31 July 2015 RFS”), certain errors in the 31 July 2015 RFS have been discovered. Following discussions with Ofcom we have corrected for these errors in this document, the “Revised Current Cost Financial Statements 2015” (the “Revised RFS”). A description of these errors is given in section 2.1.7 below.
In June 2015 and November 2015 Ofcom published consultation documents arising from its Cost Attribution Review. In these consultations Ofcom identified some attribution methodologies we have used to prepare the RFS that it considered are inappropriate and proposed what it considers to be appropriate alternatives. Ofcom included further proposals for changes to the way we attribute some of our costs in its update on the proposed leased lines charge controls issued in November 2015.
As these proposals are currently still under consultation, we have not reflected any of the proposed changes to attribution methodologies in the Revised RFS. This should not be construed as indicating either our agreement or our disagreement with them.
For example, although we have not adjusted the Revised RFS we do agree with Ofcom that transaction costs incurred in respect of our proposed acquisition of EE should be excluded from the costs of regulated products. None of the purchase price of EE (£12.5bn) or the related transaction costs will be allocated to our regulated products in 2016 or future years. These costs were less than 0.2% of the costs reported in the RFS in 2015.

Section 1 – Introduction to the Current Cost Financial Statements
Page 9
Table 1 – Market Review Name Abbreviations
Market Review Name Abbreviated Name
Wholesale fixed analogue exchange line services WFAEL
Wholesale local access services WLA
Wholesale ISDN2 exchange line services ISDN2
Wholesale business ISDN30 exchange line services ISDN30
Traditional interface symmetric broadband origination (TISBO) (up to and including 8Mbit/s)
Low Bandwidth TISBO
TISBO excluding the WECLA (above 8Mbit/s up to and including 45Mbit/s)
Medium Bandwidth TISBO
TISBO excluding the WECLA (above 45Mbit/s up to and including 155Mbit/s)
High Bandwidth TISBO
Technical areas (Point of Handover) Technical areas (Point of Handover)
Alternative interface symmetric broadband origination (AISBO) excluding the WECLA (up to and including 1Gbit/s)
AISBO Non WECLA
AISBO in the WECLA (up to and including 1Gbit/s) AISBO WECLA
Multiple interface symmetric broadband origination (MISBO) excluding the WECLA (above 1Gbit/s)
MISBO Non WECLA
Market Review Name Abbreviated Name
Wholesale regional trunk segments TI Regional Trunk
Call origination on fixed public narrowband networks
Fixed call origination
Fixed call termination Fixed geographic call termination
Technical areas (Interconnect Circuits) Technical areas (Interconnect Circuits)
Wholesale Broadband Access (Market A) WBA – Market A

Section 2 – Basis of Preparation
Page 10
Section 2 Basis of Preparation

Section 2 – Basis of Preparation
Page 11
2.1 Basis of Preparation
2.1.1 Regulatory Accounting Framework
The ultimate holding company of British Telecommunications plc (the “Company”) is BT Group plc (referred to together with its subsidiary and associated undertakings and joint ventures as the “Group” or “BT”). Substantially all the businesses and activities of the Group are carried out by British Telecommunications plc, its subsidiaries, associated undertakings and joint ventures.
BT Group plc’s Annual Report dated 6 May 2015 details the basis of preparation and explains the accounting policies adopted by the Group. BT’s Annual Report for 2014/15, on which the independent external auditors issued an unqualified report, did not contain a statement under Section 498(2) or 498(3) of the Companies Act 2006 and has been delivered to the Registrar of Companies.
The Company has, by agreement with BT Group plc, prepared the Current Cost Financial Statements in accordance with the Accounting Methodology Document (as described in Section 2.1.3 below) and the Regulatory Accounting Principles (as described in Section 2.1.2 below), by disaggregating balances recorded in the general ledgers and other accounting records of the Group.
The Accounting Methodology Document and the Regulatory Accounting Principles set out the framework under which the Current Cost Financial Statements are prepared.
2.1.2 Regulatory Accounting Principles
Regulatory Accounting Principles are the principles we apply or use in the preparation of the Current Cost Financial Statements, for example, that all costs should be fully attributed to the relevant cost centre.
Ofcom directed the Regulatory Accounting Principles in its Regulatory Financial Reporting Final Statement dated 20 May 2014 including the requirement for consistency with regulatory decisions, and that these changes would be applicable for the Current Cost Financial Statements 2015.
2.1.3 Documentation and Application of the Regulatory Accounting Framework
In adhering to the Regulatory Accounting Principles, we prepare and update annually our methodology documentation. For 2014/15 we have combined our methodology documentation into the Accounting Methodology Document. This document covers:
Attribution Methods – we explain how we attribute revenue, transfer charges, costs,
assets and liabilities to activities.
Transfer Charge System Methodology – we explain our approach within our regulatory
costing system (“REFINE”) on transfer charges.
Non-discrimination - we demonstrate how we ensure an equivalent treatment for
internal and external CPs. For each reported market, we disclose the average price of
services sold to external CPs and the average price sold to internal CPs. Where a reported
market is required to buy input services from an upstream reported market, the cost is
shown in Current Cost Financial Statements as an Equivalence of Input (“EOI”) charge.
This applies for WBA (Market A).
Accounting Policies - the way we apply the requirements of the Companies Act 2006,
Article 4 of the International Accounting Standards (“IAS”) Regulation, and our
accounting policies, whenever not superseded by the Regulatory Accounting Principles,
in each of the Current Cost Financial Statements. The Accounting Methodology
Document (“AMD”) details the accounting policies adopted in preparing the underlying
financial information.
Long Run Incremental Cost (“LRIC”) Methodology - the long run incremental cost
principles, procedures and processes form the framework we use to calculate long run
incremental costs and stand alone costs.
Current Cost Accounting (“CCA”) - we prepare the Current Cost Financial Statements
under the Financial Capital Maintenance (“FCM”) convention in accordance with the
principles set out in the handbook “Accounting for the Effects of Changing Prices”,
published in 1986 by the Accounting Standards Committee. Under the FCM convention
we include changes in asset values in our income statement as unrealised holding gains
or losses. The CCA section also includes the Regulatory Asset Valuation (RAV) where
Ofcom has directed an alternative methodology for valuing parts of the local access
network.
Usage Factors - we use usage factors in our costing methodology to reflect when the
services have a different relative usage of network components.
In addition to this Accounting Methodology Document, we also publish a Wholesale Catalogue, which separately identifies and describes services which are internally, externally, or internally and externally supplied, and those which are used in the course of supplying other wholesale services.
The economic markets defined by Ofcom’s Final Statements and Notifications do not correspond to how the Group is organised for management and accounting purposes. The Current Cost Financial Statements are therefore produced by overlaying the requirements of the regulatory reporting framework on the management and accounting structure of the Group.

Section 2 – Basis of Preparation
Page 12
We reconcile the Current Cost Financial Statements to BT’s statutory accounts and we explain any differences.
Due to the complex nature of the RFS, figures in this report are individually rounded to the nearest relevant unit (e.g. £m). Totals and sub-totals are calculated based on these rounded figures. Where required by the Directions and Notifications rounding differences are shown on each individual schedule. Where rounding differences are not shown minor summation inconsistencies may arise between schedules.
2.1.4 Changes to BT’s Financial Reporting Obligations
Ofcom’s “Directions for Regulatory Financial Reporting” dated 30 March 2015 has had an impact on the disclosure requirements and regulatory accounting methodologies within the Current Cost Financial Statements for the year ended 31 March 2015. This Direction gives effect to recommendations from market reviews.
These do not represent all changes directed by Ofcom, only those which have required us to change the definitions of various markets and restate the Regulatory Financial Statements.
(a) Implementation of the Fixed Access Market Review (FAMR) published 26 June 2014
Ofcom imposed SMP services conditions with respect to regulatory accounting in relation to the following markets:
o The supply of copper loop-based, cable-based and fibre-based wholesale local access at a fixed location in the United Kingdom excluding the Hull Area.
o Wholesale fixed analogue exchange line services in the United Kingdom excluding the Hull Area.
o Wholesale ISDN30 exchange line services in the United Kingdom excluding the Hull Area.
o Wholesale ISDN2 exchange line services in the United Kingdom excluding the Hull Area.
We are required to separately identify in the Regulatory Financial Statements:
o Each of the internal and external Network Services used in the Wholesale Local Access Market and separately attribute the costs, revenues and volumes of each of the internal and external Network Services used in the Wholesale Local Access Market.
o Each of WLR + SMPF Simultaneous Connections and WLR + SMPF Simultaneous Migrations; and separately attribute the costs of each of WLR + SMPF Simultaneous Connections and WLR + SMPF Simultaneous Migrations.
We are required to disclose the revenue, volume, average price and FAC of VULA Migrations.
We are required to disclose all network components and FAC of VULA Migrations (calculation of FAC based on component costs and usage factors for the WLA market in the Regulatory Financial Statements).
We are required to prepare the Regulatory Financial Statements, explanations and other required information on a Regulatory Asset Value adjusted current costs basis. We are required to value the Access Ducts capitalised prior to 1 August 1997 on the basis of the closing historical cost on 31 March 2005 which is indexed by the Retail Price Index from 31 March 2005.
(b) Implementation of the Wholesale Broadband Access Market Review (“WBAMR”) published 26 June 2014
Ofcom imposed SMP services conditions with respect to regulatory accounting in relation to the following market:
o WBA (Market A).
We are required to not attribute the costs of 21CN in accordance with the Future Benefits Principle to the Network Services considered in the WBA Statement. This principle attributed 21CN costs to services that could use 21CN in the future but do not currently use this platform.
The changes described have been made in accordance with Ofcom’s direction. Where the changes impact the methodology in the Current Cost Financial Statements we have disclosed them in section 2.1.5. There are several changes which impact the structure of the regulated markets. These are not included in the list in section 2.1.5 but have been made to reflect the above changes. A list of these changes is available in our “Change Control Notification” Report published on 31 March 2015 (“Change Control Notification in accordance with SMP Condition 21 of Ofcom’s Regulatory Financial Reporting Final Statement published on 20 May 2014”) and are identifiable as ‘Changes to Market Definitions’.
2.1.5 Comparability of current and prior year results
Ofcom’s Regulatory Financial Reporting Final Statement published 20 May 2014 directed BT to make certain additional disclosures. BT has a new obligation under SMP Condition 21 to publish by 31 March 2015 all methodology changes that were implemented between the 2014 Current Cost Financial Statements and the 2015 Current Cost Financial Statements. This obligation was met by the publication of the “Change Control Notification” on 31 March 2015.
There were a number of changes to our methodologies made after 31 March 2015:

Section 2 – Basis of Preparation
Page 13
It was not possible to update our methodologies by 31 March 2015 to reflect the final Ofcom decisions on regulatory accounting methodologies in “Directions for Regulatory Financial Reporting” issued on 30 March 2015. We had made changes in line with Ofcom’s consultation on changes to our methodologies but these were not exactly in line with Ofcom’s final requirements. In these circumstances, we are required to make certain methodology changes to ensure compliance with the Final Statements and Notifications.
We have notified Ofcom, via an exchange of letters, of certain methodology changes made after 31 March 2015 which are to be considered as if they were included in the Change Control Notification of 31 March 2015.
Further changes to our methodologies were made as a result of notifications from our auditors to make sure that errors would not be introduced into the Current Cost Financial Statements.
Each of these post 31 March 2015 methodology changes is described in Section 2.1.6 below.
Certain of these methodology changes have had an impact on the comparability of the current and prior year results and the comparatives for the year ended 31 March 2014 has been restated accordingly. The impacts quoted below are based upon our estimates of the impact of the changes on 2013/14 costs:
(a) Changes to BT’s financial reporting obligations as set out in the Current Cost Financial Statements and Notifications which is explained in section 2.1.4.
(b) The prior year comparatives have been restated to reflect the following methodology changes implemented in the current year. Changes identified with an asterisk (*) are those methodology changes implemented as a result of Ofcom’s Directions for Regulatory Financial Reporting dated 30 March 2015 which have a material market impact. Changes required under this Direction are discussed in section 2.1.4.
(i) Cumulo rebate attribution*
We have changed the data we use to calculate the Profit Weighted Net Replacement Costs (“PWNRCs”) used in applying our Cumulo rebate methodology, to use the most up to date available information for Profit Weights (the market regulatory costs of capital) and Net Replacement Costs (“NRC”). Our previous methodology had been to use the NRCs and profit weightings that were agreed with the Valuation Office for the current rateable asset valuation. This change moves costs from WFAEL (£39m) and WLA (£16m), to the Business Connectivity (£22m), Narrowband (£11m), WBA (£6m) and Residual markets (£16m).
(ii) Regulatory Asset Valuation (RAV)*
We now use RAV for the access duct network instead of CCA in the Current Cost Financial Statements. We apply this only to ‘access duct’. We value the Access Ducts capitalised prior to 1 August 1997 on the basis of the closing historical cost on 31 March 2005 which is indexed by the Retail Price Index from 31 March 2005. This change decreases costs across all markets, most significantly WFAEL (£46m), WLA (£20m) and AISBO non WECLA (£11m).
(iii) 21CN Future Benefits attribution*
We had attributed 21CN platform costs to services that could use 21CN in the future but do not currently use this platform. We had called this the “future benefits” principle. Ofcom has directed us not to use this approach. Accordingly, 21CN costs previously attributed to IPstream and Datastream on a “future benefits” basis are instead attributed to Wholesale Broadband Connect (“WBC”) and Residual WBA services such as Superfast Broadband and TV Connect. Similarly, the 21CN costs attributed to Wholesale Extension Services (“WES”), Backhaul Extension Services (“BES”) and Ethernet Access Direct (“EAD”) services on a “future benefits” basis are now attributed to Wholesale Residual Ethernet services. The most significant impact of this change is to moves cost from WBA (Market A) (£40m) and AISBO non WECLA (£30m) into Residual markets.
(iv) Classification of 64kbit/s Trunk from Low Bandwidth TISBO into TI Regional Trunk
We now apportion costs between distribution, regional trunk and national trunk services based on billing data to align with Ofcom’s Business Connectivity Market Review. Historically we have reported 64kbit/s circuits in the TISBO low bandwidth market because these circuits are carried over a network of pre-provided 2Mbit/s circuits so there is no physical distinction between distribution and trunk. This change moves costs from Low Bandwidth TISBO (£3m) and into TI Regional Trunk (£2m) and Residual markets (£1m).
(v) Allocation of DSLAM costs between Markets A & B*
We had apportioned DSLAM costs between WBA markets based on an analysis of which costs are driven by the number of DSLAMs at each site and which costs are driven by the number of broadband subscribers connected at each site. We now apportion the costs only by the number of DSLAMs at each site. This change moves costs from WBA (Market A) (£6m) to Residual markets.
(vi) Classification of Featurenet from Low Bandwidth TISBO into Network Residual
We have reclassified circuits used by our Featurenet products so that they are reported in Network Residual instead of being treated as a downstream user of Low Bandwidth

Section 2 – Basis of Preparation
Page 14
TISBO circuits. This change moves costs from Low Bandwidth TISBO (£7m) and TI Regional Trunk (£1m) into Residual markets.
(vii) Renaming of sectors and F8 code repointing
We have made several changes to the mapping of the regulatory chart of accounts in order to improve the cost category descriptions in the Current Cost Financial Statements. The changes impact the calculation for the apportionment of BT TSO Managed Assets to other activity groups, plant groups and Residual markets in proportion to core assets (see AG102 in the Accounting Methodology Document). The largest impacts of this change are to move costs from Residual markets (£4m),WFAEL (£1m) and WLA(£1m) to Low Bandwidth TISBO (£3m) and WBA (Market A) (£3m).
(viii) Duct and Fibre allocations to 21CN
We have improved our attribution process so that costs for duct are apportioned to 21CN fibre plant groups (previously they were not) and so that backhaul fibre is allocated wholly to backhaul fibre plant groups and core fibre is allocated wholly to core fibre plant groups (previously backhaul and core cable plant groups were apportioned as a single cost category to all 21CN fibre plant groups). The most significant impact of this change is to move Mean Capital Employed (“MCE”) from AISBO Non WECLA (£16m), Low Bandwidth TISBO (£12m) and WBA (Market A) (£7m) into Residual markets.
(ix) Current Cost Financial Statements goodwill
We have changed our reporting of goodwill so that it is within the Retail Residual market MCE, and not in the MCE reconciliation to the statutory accounts section of the RFS. The change is presentational and does not impact market costs.
(c) The prior year comparatives have been restated to reflect the correction of the following errors identified in the Current Cost Financial Statements 2014:
(i) Classification of Non-geographic call termination
We have removed non-geographic fixed call terminations from the Fixed geographic call termination market and reallocated the costs, assets and volumes to Residual markets in line with Ofcom’s Narrowband Market Review (September 2013). The change moves costs from Fixed geographic call termination (£4m) into Residual markets.
(ii) Classification of Siteconnect
Siteconnect 155Mbit will be reported in the High Bandwidth TISBO market, not Wholesale Residual. The most significant impact of this change is to move revenue from the Wholesale residual market (£1m) into High Bandwidth TISBO. As Siteconnect is now separately disclosed, we have ensured that the prices reflect the BT Wholesale Carrier
Price List (“CPL”) and the volume of circuits reflect the updated 2013/14 data taken from PCNBS (billing data).
(iii) Access fibre – fibres per bearer
As noted in the 2013/14 Current Cost Financial Statements, access fibre is apportioned to Ethernet products as well as older Time Division Multiplexing (“TDM”) products that consume it. The number of fibres is derived from the number of TDM bearers from Core Transmission Costing System (“CTCS”) and the number of fibres per bearer which is obtained from Integrated Network System (“INS”). We identified that the way we retrieved data from INS was incorrect and instead retrieved this data using CTCS. This change mainly moves costs from AISBO Non WECLA (£3m) into ISDN30 services.
(iv) Excess Construction Charge (“ECC”) cost component rationalisation
We have reduced the number of specific components used for ECCs. This change maps ECC credits to all services using fibre and duct whereas the previous approach did not. This change primarily moves MCE from Wholesale Residual (£8m), MISBO Non WECLA (£4m), Point of Handover (£3m) into AISBO WECLA (£10m) and AISBO Non WECLA (£4m).
(v) SDH plant group to component mapping
We corrected a formula error in our SDH plant group to component model. This change moves costs from Low Bandwidth TISBO (£2m) and other bandwidth TISBO markets (£1m) into AISBO Non WECLA (£4m).
(vi) Call Origination volumes
Non-geographic call origination volumes were, in 2013/14, sourced from a system called Powerhouse (a system which sources data from our Call Statistics Centralisation System (CSCS)). The Powerhouse system volumes for 2013/14 have been found to be overstated due to an error in a Powerhouse query used to extract data from CSCS. This change moves costs from the Call origination market (£5m) into Residual markets.
(vii) BT Wholesale cost of sales transfer charges
Costs relating to BT Wholesale cost of sale transfer charges were in 2013/14 treated as an overhead of BT Wholesale activities. These costs of sale are incurred by BT Wholesale in providing non-regulated services. This change moves costs from Low Bandwidth TISBO (£6m), WBA Market A (£2m), Fixed geographic call termination (£2m) and Call origination (£2m) into Residual markets.
(viii) PPC volumes
In 2013/14 certain formula errors were made and some assumptions (e.g. we assume that Megastream internal circuits have two local ends, not one) were not applied when collating the volumes for Low, Medium and High TISBO, Regional Trunk and Point of

Section 2 – Basis of Preparation
Page 15
Handover (POH) markets. This change primarily moves costs from Wholesale Residual (£1m) and into the High Bandwidth TISBO and Regional Trunk Segments markets.
(ix) WBC internal and external volumes
The volumes of Wholesale Broadband Connect (WBC) that are used as in input to Wholesale Broadband Managed Connect (WBMC) should be reported as internal WBC volumes, however in 2013/14 they were reported as internal or external depending on the final user of the WBMC service. The WBC volumes that are used within WBMC are themselves not sold externally as WBC therefore they should always be reported as internal. This impact changes the presentation of WBC internal and external volumes in Wholesale Broadband Market A but has no overall impact on the market.
(d) The prior year comparatives were also restated for minor errata that were corrected and published on our website in “Errata Report 2014”. We restated for ISDN2 Transfer Price and Access Cards component usage factor from our published “Errata report“.
(e) Ofcom requested a further change to correct an insignificant error. This was to correct an error in relation to the attribution of electronic costs to EBD services in the MISBO Non WECLA market. The impact of this change upon the market was less than £1m.
There were no other restatements or re-presentations. However our ongoing review of cost attribution and valuation methodologies resulted in a number of additional improvements and updates to reflect changes in Group structure. In these instances the restatement of comparative information for the year ended 31 March 2014 was either not practicable or was not required as the impact was not material. These methodology changes are described in the Change Control Notification report and in Section 2.1.6.
As required by Ofcom’s Regulatory Financial Reporting: Final Statement dated 20 May 2014 we will be providing a separate audited report which sets out changes made to our Regulatory Accounting Methodology and the impact of such changes on the Regulatory Financial Statements, and Material Errors (using Ofcom’s definition of material) corrected in the Regulatory Financial Statements and the impact of such Material Errors on the Regulatory Financial Statements. This report will be published during August 2015.
2.1.6 Change Control Notification – amendments and additional methodologies
Our Change Control Notification report contained all the methodology changes we had made up to 31 March 2015. We have made certain changes to our methodologies after 31 March 2015 which we have grouped into three categories:
Changes made to comply with Ofcom’s 30 March 2015 Direction:
Regulatory Asset Valuation (RAV): We proposed in the Change Control Notification to apply RAV in full to copper cables. We have changed this to comply with Ofcom’s
Direction, which set out that the RAV adjustment should not be applied to Copper and only to Access Duct. [Change Control Notification – section 3.7].
Cumulo rebate allocation: We proposed in the Change Control Notification to use data from the 2013/14 RFS to derive the weighting element of the Profit Weighted Net Replacement Costs for Cumulo. We have changed this to use component weighted average cost of capital for the profit weighting element, as set out in Ofcom’s Direction. [Change Control Notification – section 3.12].
BDUK: We made a minor change to create a new plant group and component which covers all government grants and not BDUK areas only. This plant group and component only includes the grants received. [Change Control Notification – Section 3.23].
Time Related Charges, ISDN30, PSTN Transfers, BES 1000MB Rentals Internal WECLA, splitting co-mingling rentals between basket and non-basket services (and implementing associated revenue changes to the WLA/WAELS markets): Ofcom directed in its Directions for Regulatory Reporting (30 March 2015) that these services be reported in the WAELS/WLA market. We had not made this change but in order to comply with the direction are doing so in the 2014/15 RFS.
Changes notified to Ofcom to be considered as within the 31 March 2015 Change Control Notification report:
NGA tie cables: We have changed how we attribute duct costs to NGA tie cables so that it is attributed on the basis of the cumulative capital expenditure on duct associated with NGA. It was previously attributed to NGA tie cables based upon the depreciation on the NGA capital expenditure on duct in the year.
NGA Development: We have changed how we attribute development spend for NGA between Fibre to the Cabinet (FTTC) and Fibre to the Premises (FTTP) so that it is on the basis of NGA development spend (it was previously based on volumes). There is no impact upon figures reported in the RFS.
We have decided to withdraw the proposed change BT Technology, Service & Operations Electricity – new methodology for Public Switched Telephone Network. [Change Control Notification – section 3.20]. In the Change Control Notification we identified that we would implement a new methodology for Public Switched Telephone Network power cost attribution.
Following notification from our auditors to avoid the introduction of errors into the RFS:
PPC volumes: Internal and external Partial and Private Circuit volumes are sourced from the Core Transmission costing system (CTCS). We have identified that in 2014/15 local end and main link volumes are overstated in CTCS due to a number of circuits recorded as live in the system which are actually ceased and hence not

Section 2 – Basis of Preparation
Page 16
billable. We have therefore used Geneva Genius (billing system) data to produce the 2014/15 RFS.
Call origination volumes: Non-geographic call origination volumes have historically been retrieved via a system called Powerhouse which queries an underlying call data system called CSCS. We have identified that Call origination volumes, sourced directly from CSCS, which we submit to Ofcom on a quarterly basis are more accurate and lower than those from Powerhouse. We have therefore used CSCS data to populate the 2014/15 RFS.
2.1.7 Revision of the 2014/15 RFS including comparative information
Subsequent to the original publication of the RFS on 31 July 2015 (the “31 July 2015 RFS”), certain errors in the 31 July 2015 RFS have been identified. Following discussions with Ofcom we have corrected for these errors within this Revised RFS. A description of these errors and revisions is given below:
1. 2015 RFS Presentation of Residual Market Results and Eliminations
In the 31 July 2015 RFS on page 25 and page 26, we correctly presented the results for all individual SMP Markets, Total SMP markets and Total Markets. However, the treatment of the eliminations of inter-market charges incorrectly reported the results for residual markets as we did not present the elimination of trading between wholesale markets within the results for Total Wholesale Markets. We have corrected for this in this Revised RFS. We show the impact of the change on the 2014/15 results in Table 1 (Extract from Section 5.1 Performance Summary by Market 2015 of the 31 July 2015 RFS (page 25)) and Table 2 (Amended Presentation of Residual Market results and eliminations included in the Revised RFS) below.
The 31 July 2015 RFS treats inter-market charges as follows in Table 1 below:
Charges between all markets of £5,347m are eliminated against total operating costs
as shown on the “Eliminations” row.
Charges of £49.7m to WBA Market A from other markets (as disclosed in section
10.2.1 on page 101 of the 31 July RFS) are balanced by an equal credit within
Wholesale Residual (as disclosed in section 6.1.1 on page 29 of the 31 July RFS).
As the “Eliminations” figure includes charges from other Markets of £909m that
relate to inputs in services provided in WBA Market A and Wholesale Residual, the
operating costs of Retail Residual have been increased by this amount to ensure that
the total markets figure is correct.
We adopted the above treatment of inter-market charges in the 31 July 2015 RFS following the changes to market reporting (as described in section 2.1.4 (a) on page 12 of the 31 July
RFS). Whilst the treatment appropriately presents the results for all individual SMP Markets, Total SMP markets and Total Markets, it is not an appropriate presentation of the results for Wholesale Residual, Total Wholesale Markets and Retail Residual.
Accordingly, we have amended the presentation of the results of those residual and aggregated disclosures and of the eliminations, which we consider more appropriately present the results of these residual markets.
In this amended presentation in Table 2 below:
Charges from other Markets of £909m that relate to inputs in services provided by
WBA Market A and Wholesale Residual are eliminated before the “Total Wholesale
Markets”. The “Eliminations” line relates only to charges from Wholesale Markets to
Retail Residual.
Charges of £49.7m to WBA Market A from other markets (as disclosed in section
10.2.1 on page 101 of the 31 July 2015 RFS) are shown within the £148m operating
costs below and charges of £859m to Wholesale Residual from other Markets are
shown within the £2,253m operating cost below.
The operating costs of Retail Residual include the charges from Wholesale Markets
to Retail Residual.
In this amended presentation, the reported results of all individual SMP markets (including all supplementary schedules), Total SMP Markets and Total Markets are unchanged from those shown in the RFS. This amended presentation affects certain schedules in the RFS which are listed below:
Section 5.1 and 5.2 – Performance Summary by Market for 2015 and 2014 (restated).
Section 6.1.1 and 6.1.2 – Attribution of Wholesale Current Costs 2015 and 2014
(restated). In the amended schedules a new “EOI eliminations” column has been
added.
Separately to this, since publication of the 31 July 2015 RFS, Ofcom has clarified that the “Adjustment for EOI and Internal” line included in the pro-forma financial statements for WBA Market A (Sections 10.2.1 and 10.2.4) was intended to show the impact of removing internal EOI based charges from the fully allocated costs of this market and also the impact of reducing both internal and external revenues by the same amount. We have also made this change within the Revised RFS.

Section 2 – Basis of Preparation
Page 17
Table 1 - Extract from Section 5.1 Performance Summary by Market 2015 of the 31 July 2015 RFS (page 25)
Total SMP Markets 3,192 2,506 5,698 2,453 1,383 (54) 177 (24) (2) 3,933 1,765 12,485 14.2 %
Wholesale Residual 2,154 784 2,938 1,344 454 (14) (34) (29) 1 1,722 1,216 2,140 56.8 %
Total Wholesale Markets 5,346 3,290 8,636 3,797 1,837 (68) 143 (53) (1) 5,655 2,981 14,625 20.4 %
Retail Residual - 14,691 14,691 13,437 794 - - - 1 14,232 459 4,377 10.5 %
Eliminations (5,347) - (5,347) (5,347) - - - - - (5,347) - -
Roundings 1 (2) (1) - (1)
Total Markets - 17,979 17,979 11,887 2,631 (68) 143 (53) - 14,540 3,439 19,002 18.1 %
Table 2 - Amended Presentation of Residual Market results and eliminations included in the Revised RFS
Total SMP Markets 3,192 2,506 5,698 2,453 1,383 (54) 177 (24) (2) 3,933 1,765 12,485 14.2%
Wholesale Residual 2,154 784 2,938 2,253 454 (14) (34) (29) 1 2,631 307 2,140 14.3%
EOI Eliminations (909) - (909) (909) - - - - - (909) - -
Total Wholesale Markets 4,437 3,290 7,727 3,797 1,837 (68) 143 (53) (1) 5,655 2,072 14,625 14.2%
Retail Residual - 14,691 14,691 12,528 794 - - - 1 13,323 1,368 4,377 31.3 %
Eliminations (4,438) - (4,438) (4,438) - - - - - (4,438) - -
Roundings 1 (2) (1) - - - - - - - (1) -
Total Markets - 17,979 17,979 11,887 2,631 (68) 143 (53) - 14,540 3,439 19,002 18.1 %
Internal
Revenue
External
Revenue
Total
Revenue Operating Costs Depreciation
Holding
(gain)/loss
Supp.
Dep.
Other CCA
Adjs. Roundings
Total CCA
Operating
Costs Return
Mean Capital
Employed
Return on
MCE

Section 2 – Basis of Preparation
Page 18
2. Ethernet Electronics component attribution in 2013/14 comparatives
At the time of publication of the 31 July 2015 RFS, we had identified an historical error in relation to the attribution of the Ethernet Electronics component to services in relation to Optical Spectrum Rental services’ usage factor. This error was corrected in the preparation of the results for the year ended 31 March 2015 in the 31 July 2015 RFS. At the time of publishing the 31 July 2015 RFS we estimated that this error had understated the 2013/14 costs in the MISBO Non-WECLA market by £1m which is not material and did not warrant restating the 2013/14 comparative information presented within the 31 July 2015 RFS. Subsequent to publication of the 31 July 2015 RFS, we have included the correction of this known error in the preparation of the Reconciliation Report and a more accurate estimate of the impact amounts to £7m cost and £11m MCE, which is material to the MISBO non-WECLA market. The Revised RFS incorporates this additional restatement of the comparative information for the 2013/14 MISBO non-WECLA market. The Revised RFS also corrects corresponding restatements of:
The AISBO non-WECLA market, which was overstated by £7m cost and £12m MCE;
The AISBO WECLA market, which was overstated by £1m cost and £2m MCE; and
The residual markets which were understated by £2m cost and £3m MCE.
3. Excess construction costs in 2014/15 results
Section 3.28 of the Change Control Notification published on 31 March 2015 proposed several methodology changes to ECCs. One of these ECC methodology changes allocated “£548 of fibre and duct capital investment from the fibre and duct components to AISBO and MISBO connection services”.
This element of the ECC methodology changes was not implemented in the 31 July 2015 RFS. Instead, the explanatory ECC note in the detailed service analysis for the AISBO WECLA and non WECLA markets was amended but the attribution of the costs was not. Whilst the total fully allocated costs (FAC) for each market was correct, the reported fully allocated costs for individual services was understated compared with the stated methodology change. The impact of this change is immaterial amounting to less than £1m on the fully allocated cost of any individual service. The total fully allocated costs on AISBO Non WECLA published service increased by £1.3m and on total AISBO WECLA published services by £0.2m. In isolation this error would not require revision to the 31 July 2015 RFS and it does not fall within Ofcom’s definition of a material error for the purposes of the preparation of any future Reconciliation Report. However, as requested by Ofcom, as the RFS are being re-issued, this matter is corrected in the Revised RFS.
4. Time Related Charges (TRC) and Special Fault Investigation (SFI) costs
Appendix 4 of the 31 July 2015 RFS reported the hours for TRC services and certain costs for SFI services. Post publication, it was confirmed that the disclosure of the TRC hours was incorrect and the cost per module was incorrect. The underlying data within the remainder of the 31 July RFS was correct; the error was isolated to this unaudited disclosure. The updated schedule is incorporated into the Revised RFS.
5. Update to Section 2.1.5(c)
In the 31 July 2015 RFS, we estimated the effect of the errors in the Current Cost Financial Statements 2014 in section 2.1.5(c). Subsequent to that date we have completed the Reconciliation Report and quantified the errors more accurately. Accordingly we have revised the effect of the errors in this section.

Section 3 – Statement of Responsibility
Page 19
Section 3 Statement of Responsibility

Section 3 – Statement of Responsibility
Page 20
3.1 Statement of Responsibility
British Telecommunications plc (the “Company”) is required to prepare Current Cost Financial Statements in accordance with the Final Statements and Notifications as described in Section 1.2.
The Revised Current Cost Financial Statements include comparative information for the year ended 31 March 2014 first published on 15 August 2014 subject to certain restatements and re-presentations detailed in Sections 2.1.5 and 2.1.7.
The directors confirm to the best of their knowledge that the Revised Current Cost Financial Statements for the year ended 31 March 2015 have been prepared in accordance with the requirements of the Final Statements and Notifications, the Accounting Methodology Document and Wholesale Catalogue dated 31 July 2015 and in accordance with the Regulatory Accounting Principles as published in Ofcom’s “Regulatory Financial Reporting” Statement (20 May 2014).
The directors confirm to the best of their knowledge that the comparative information for the year ended 31 March 2014 included in the Revised Current Cost Financial Statements has been prepared in accordance with the requirements of the Final Statements and Notifications and the Primary and Secondary Accounting Documents (these are the Detailed Attribution Methods; the Detailed Valuation Methodology; the Long Run Incremental Cost Model: Relationships and Parameters and the Wholesale Catalogue) dated 15 August 2014 subject to certain restatements and re-presentations as detailed in Sections 2.1.5 and 2.1.7.
The directors are responsible for the maintenance and integrity of the corporate and financial information included on the Company’s website. Legislation in the United Kingdom governing the preparation and dissemination of financial statements may differ from legislation in other jurisdictions.
Openreach
The Company is also required in accordance with the Undertakings to separately report the financial results of Openreach within the Revised Current Cost Financial Statements as explained in Sections 1.1 and 1.2. The Undertakings are attached to Annex A of Part 2 of Ofcom’s “Final Statements on the Strategic Review of Telecommunications, and undertakings in lieu of a reference under the Enterprise Act 2002”, issued on the 22 September 2005.
The Undertakings require the Company to report the financial results of Openreach, including the following:
Openreach financial information such as headline revenue, cost of sales (or gross margin), SG&A, EBITDA, depreciation, operating profit and capital expenditure,
revenues broken down into the broad product groups that Openreach provides and further split between internal and external revenues, separately identified payments to other parts of the Company for products that form inputs to Openreach products (e.g. electronics); and
Reconciliation of Openreach’s revenue and operating profit (and other such items as may be agreed between the Company and Ofcom) with financial information about Openreach shown in BT’s statutory accounts.
The Revised Openreach Financial Statements can be found in Section 12 and include comparative information for the year ended 31 March 2014. These comparatives were subject to certain restatements and representations detailed in Sections 2.1.5 and 2.1.7.
The form, content and basis of preparation of the financial results of Openreach follow those used in the preparation of the Revised Current Cost Financial Statements as described above, except where differences are agreed with Ofcom.
The directors confirm to the best of their knowledge that the Revised Openreach Financial Statements for the year ended 31 March 2015, which have been prepared in accordance with the Accounting Methodology Document and Wholesale Catalogue dated 31 July 2015, comply with the requirements of the Undertakings dated 22 September 2005.
The directors confirm to the best of their knowledge that the comparative information for the Revised Openreach Financial Statements for the year ended 31 March 2014 included in the Revised Current Cost Financial Statements, which have been prepared in accordance with the requirements of the Final Statements and Notifications and the Primary and Secondary Accounting Documents dated 15 August 2014, subject to certain restatements and re-presentations as detailed in Sections 2.1.5 and 2.1.7, comply with the requirements of the Undertakings dated 22 September 2005.
Approved by the Board of Directors and signed on its behalf by:
Glyn Parry
Director, British Telecommunications plc
2 December 2015

Section 4 – Audit Report
Page 21
Section 4 Audit Report

Section 4 – Audit Report
Page 22
4.1 Report of Independent Auditors
Report of the Independent Auditors to British Telecommunications plc and Ofcom issued in accordance with the Final Statement and Notification entitled “The regulatory financial reporting obligations on BT and Kingston Communications” issued by Ofcom on 22 July 2004 as amended by the subsequent notifications and directions issued by Ofcom following consultation as set out below. 1. We have examined the Revised Current Cost Financial Statements for the year ended 31 March 2015 (the “Revised Financial Statements”) which include information in respect of economic markets (the “Revised Market Financial Statements”) and Openreach (the “Revised Openreach Information”). 2. The Revised Market Financial Statements are prepared by British Telecommunications plc (the “Company”) under the current cost convention in accordance with:
the Final Statement and Notification entitled “The regulatory financial reporting obligations on BT and Kingston Communications” issued by Ofcom on 22 July 2004 as amended by the Statements and Notifications entitled “Changes to BT’s regulatory financial reporting framework” issued by Ofcom on 31 August 2005, “Changes to BT’s regulatory financial reporting and audit requirements” issued by Ofcom on 16 August 2006, “Changes to BT’s regulatory financial reporting and audit requirements” issued by Ofcom on 30 May 2007, “Changes to BT’s 2007/08 regulatory financial statements” issued by Ofcom on 26 June 2008, “Changes to BT and KCOM’s regulatory financial reporting 2008/09 update” issued by Ofcom on 15 June 2009, “Changes to BT and KCOM’s regulatory and financial reporting 2009/10 update” issued by Ofcom on 4 June 2010, “Changes to BT and KCOM’s regulatory financial reporting 2010/11 update” issued by Ofcom on 2 June 2011, “Changes to BT and KCOM’s regulatory financial reporting 2011/12 update” issued by Ofcom on 17 April 2012 , “Changes to BT and KCOM’s regulatory and financial reporting 2012/13 update” issued by Ofcom on 25 April 2013, “Changes to BT and KCOM’s regulatory and financial reporting 2013/14 update” issued by Ofcom on 3 April 2014, “Regulatory Financial Reporting” issued by Ofcom on 20 May 2014 and “Directions for Regulatory Financial Reporting” issued by Ofcom on 30 March 2015 (together the “Final Statements and Notifications”); and
the Accounting Methodology Documents and the Wholesale Catalogue dated 31 July 2015.
3. The Revised Openreach Information is prepared by the Company under the current cost convention in accordance with:
the undertakings given to Ofcom by the Company pursuant to the Enterprise Act 2002 on 22 September 2005 (the “Undertakings”);
the Statements and Notifications entitled “Changes to BT’s regulatory financial reporting and audit requirements” issued by Ofcom on 30 May 2007 , “Changes to BT’s 2007/08 regulatory financial statements” issued by Ofcom on 26 June 2008, “Changes to BT and KCOM’s regulatory financial reporting 2008/9 update” issued by Ofcom on 15 June 2009, “Changes to BT and KCOM’s regulatory and financial reporting 2009/10 update” issued by Ofcom on 4 June 2010, “Changes to BT and KCOM’s regulatory financial reporting 2010/11 update” issued by Ofcom on 2 June 2011, “Changes to BT and KCOM’s regulatory financial reporting 2011/12 update” issued by Ofcom on 17 April 2012 , “Changes to BT and KCOM’s regulatory and financial reporting 2012/13 update” issued by Ofcom on 25 April 2013, “Changes to BT and KCOM’s regulatory financial reporting 2013/14 update” issued by Ofcom on 3 April 2014, “Regulatory Financial Reporting” issued by Ofcom on 20 May 2014 and “Directions for Regulatory Financial Reporting” issued by Ofcom on 30 March 2015 respectively (together the “Openreach Final Statement and Notifications”); and
the Accounting Methodology Documents and the Wholesale Catalogue dated 31 July 2015.
4. The Revised Market Financial Statements comprise the following statements for the year ended 31 March 2015 for the Markets and Technical Areas listed on pages 7 and 8:
the Summary of Market Performance on pages 27 and 28; and
the related notes comprising the Basis of Preparation on pages 10 to 18, the statements of Attribution of Wholesale Current Costs and Mean Capital Employed on pages 31, 32, 34 and 35, the individual market summaries and individual market calculations of FAC based on component costs and usage factors on pages 38 to 51, 55 to 92, 95 to 100 and 103 to 110, the Reconciliation Statements on pages 112 and 113; and Appendix 1 on pages 122 to 127.

Section 4 – Audit Report
Page 23
5. The Revised Openreach Information comprises the following information for the year ended 31 March 2015 on pages 116 to 120:
the Revised Openreach Income Statement;
the Revised Openreach MCE Statement; and
the Reconciliation of Revised Openreach Income Statements.
6. The Revised Market Financial Statements and the Revised Openreach Information include comparative information for the year ended 31 March 2014 first published on 15 August 2014 which has been restated and re-presented as described in “Comparability of current and prior year results” on pages 12 to 15 and “Revision of the 2014/15 RFS including comparative information” on pages 16 to 18. All comparative information for the year ended 31 March 2014 is prepared by the Company to comply with the Final Statements and Notifications, and in accordance with the Primary Accounting Documents dated 15 August 2014, the Secondary Accounting Documents, namely; the Detailed Attribution Methods; the Detailed Valuation Methodology and the Wholesale Catalogue each dated 15 August 2014 as amended, where applicable, in accordance with “Comparability of current and prior year results” on pages 12 to 15 and “Revision of the 2014/15 RFS including comparative information” on pages 16 to 18.
7. These Revised Financial Statements replace the original financial statements approved by the directors on 31 July 2015. The Revised Financial Statements have been prepared following the principles of the Companies (Revision of Defective Accounts and Reports) Regulations 2008 and accordingly do not take account of events which have taken place after the date on which the original financial statements were approved. Management’s responsibility for the Revised Financial Statements 8. As described on page 20 of the Revised Financial Statements, management is responsible for preparing and approving the Revised Financial Statements. Auditor’s Responsibility 9. Our responsibilities, as independent auditors, are established in the United Kingdom by the Final Statements and Notifications, the Undertakings, the Financial Reporting Council/Auditing Practices Board and our profession's ethical guidance. 10. Our responsibility is to examine the Revised Financial Statements in accordance with relevant legal and regulatory requirements and International Standards on Auditing (UK and Ireland) issued by the Auditing Practices Board. This report, including the opinions, has been prepared for and only for the Company and Ofcom and for no other purpose. We do not, in giving this opinion, accept or assume responsibility for any other purpose or to any
other person to whom this report is shown or into whose hands it may come save where expressly agreed by our prior consent in writing. 11. We report our opinions as to whether:
the Revised Market Financial Statements as a whole;
each of the Revised Market Group Statements comprising the statement of financial performance in Fixed Access Markets, Business Connectivity Markets, Narrowband Markets and Wholesale Broadband Access Market A for the year ended 31 March 2015 shown within the Performance Summary by Market on page 27 (the “Revised Market Group Statements”).
the statements of financial performance for each of the following markets and technical areas (the “Revised PPIA Market Statements”) for the year ended 31 March 2015 shown within the Performance Summary by Market on page 27:
o Wholesale analogue exchange line services;
o Wholesale local access services;
o Wholesale business ISDN30 exchange line services;
o Traditional interface symmetric broadband origination (up to and
including 8Mbit/s);
o Alternative interface symmetric broadband origination excluding the
WECLA (up to and including 1 Gbit/s);
o Alternative interface symmetric broadband origination in the WECLA
(up to and including 1 Gbit/s);
o Multiple interface symmetric broadband origination excluding the
WECLA (above 1 Gbit/s);
o Call Origination on fixed public narrowband networks;
o Fixed call termination;
o Technical Areas (interconnection circuits); and
o Wholesale Broadband Access (Market A).
Revised Openreach Information for the year ended 31 March 2015 on pages 116, 118 and 120
are properly prepared in accordance with the procedures defined in the Accounting Methodology Documents dated 31 July 2015 and comply with the requirements of the Final Statements and Notifications and, in respect of the Revised Openreach Information, the Undertakings.
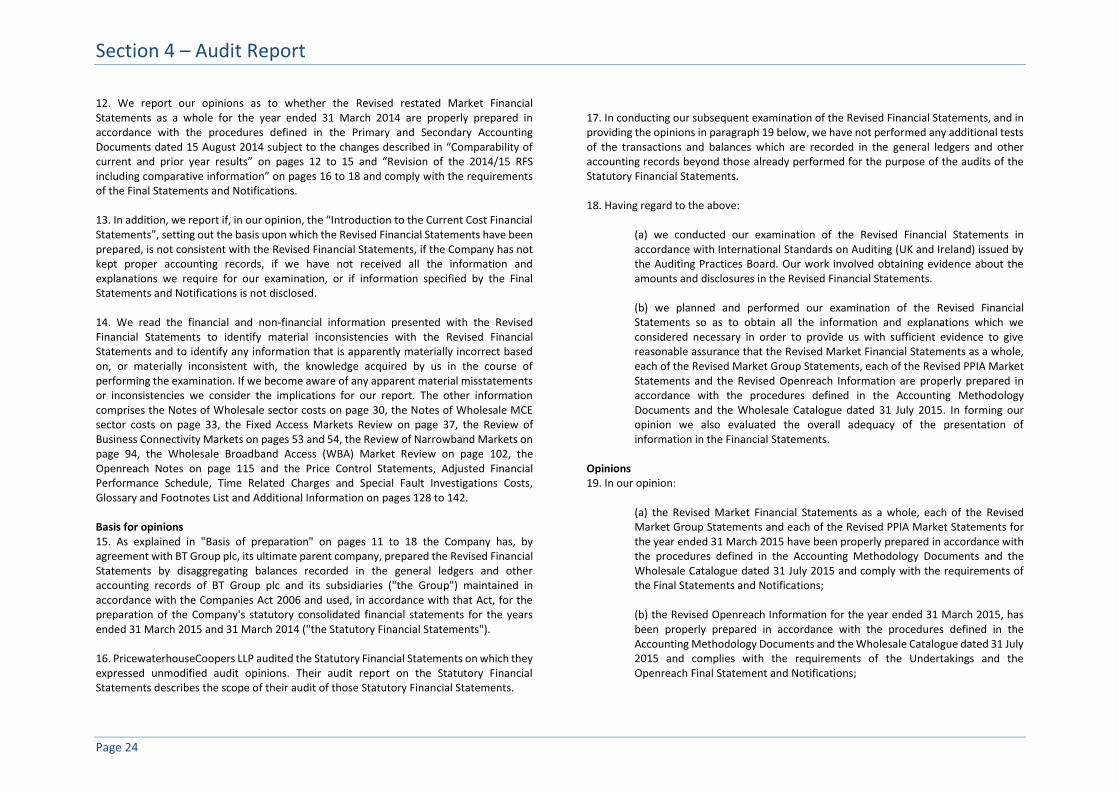
Section 4 – Audit Report
Page 24
12. We report our opinions as to whether the Revised restated Market Financial Statements as a whole for the year ended 31 March 2014 are properly prepared in accordance with the procedures defined in the Primary and Secondary Accounting Documents dated 15 August 2014 subject to the changes described in “Comparability of current and prior year results” on pages 12 to 15 and “Revision of the 2014/15 RFS including comparative information” on pages 16 to 18 and comply with the requirements of the Final Statements and Notifications. 13. In addition, we report if, in our opinion, the “Introduction to the Current Cost Financial Statements”, setting out the basis upon which the Revised Financial Statements have been prepared, is not consistent with the Revised Financial Statements, if the Company has not kept proper accounting records, if we have not received all the information and explanations we require for our examination, or if information specified by the Final Statements and Notifications is not disclosed. 14. We read the financial and non-financial information presented with the Revised Financial Statements to identify material inconsistencies with the Revised Financial Statements and to identify any information that is apparently materially incorrect based on, or materially inconsistent with, the knowledge acquired by us in the course of performing the examination. If we become aware of any apparent material misstatements or inconsistencies we consider the implications for our report. The other information comprises the Notes of Wholesale sector costs on page 30, the Notes of Wholesale MCE sector costs on page 33, the Fixed Access Markets Review on page 37, the Review of Business Connectivity Markets on pages 53 and 54, the Review of Narrowband Markets on page 94, the Wholesale Broadband Access (WBA) Market Review on page 102, the Openreach Notes on page 115 and the Price Control Statements, Adjusted Financial Performance Schedule, Time Related Charges and Special Fault Investigations Costs, Glossary and Footnotes List and Additional Information on pages 128 to 142. Basis for opinions 15. As explained in "Basis of preparation" on pages 11 to 18 the Company has, by agreement with BT Group plc, its ultimate parent company, prepared the Revised Financial Statements by disaggregating balances recorded in the general ledgers and other accounting records of BT Group plc and its subsidiaries ("the Group") maintained in accordance with the Companies Act 2006 and used, in accordance with that Act, for the preparation of the Company's statutory consolidated financial statements for the years ended 31 March 2015 and 31 March 2014 ("the Statutory Financial Statements"). 16. PricewaterhouseCoopers LLP audited the Statutory Financial Statements on which they expressed unmodified audit opinions. Their audit report on the Statutory Financial Statements describes the scope of their audit of those Statutory Financial Statements.
17. In conducting our subsequent examination of the Revised Financial Statements, and in providing the opinions in paragraph 19 below, we have not performed any additional tests of the transactions and balances which are recorded in the general ledgers and other accounting records beyond those already performed for the purpose of the audits of the Statutory Financial Statements. 18. Having regard to the above:
(a) we conducted our examination of the Revised Financial Statements in accordance with International Standards on Auditing (UK and Ireland) issued by the Auditing Practices Board. Our work involved obtaining evidence about the amounts and disclosures in the Revised Financial Statements. (b) we planned and performed our examination of the Revised Financial Statements so as to obtain all the information and explanations which we considered necessary in order to provide us with sufficient evidence to give reasonable assurance that the Revised Market Financial Statements as a whole, each of the Revised Market Group Statements, each of the Revised PPIA Market Statements and the Revised Openreach Information are properly prepared in accordance with the procedures defined in the Accounting Methodology Documents and the Wholesale Catalogue dated 31 July 2015. In forming our opinion we also evaluated the overall adequacy of the presentation of information in the Financial Statements.
Opinions 19. In our opinion:
(a) the Revised Market Financial Statements as a whole, each of the Revised Market Group Statements and each of the Revised PPIA Market Statements for the year ended 31 March 2015 have been properly prepared in accordance with the procedures defined in the Accounting Methodology Documents and the Wholesale Catalogue dated 31 July 2015 and comply with the requirements of the Final Statements and Notifications; (b) the Revised Openreach Information for the year ended 31 March 2015, has been properly prepared in accordance with the procedures defined in the Accounting Methodology Documents and the Wholesale Catalogue dated 31 July 2015 and complies with the requirements of the Undertakings and the Openreach Final Statement and Notifications;

Section 4 – Audit Report
Page 25
(c) the revised restated Market Financial Statements as a whole for the year ended 31 March 2014 have been properly prepared in accordance with the procedures defined in the Primary and Secondary Accounting Documents all dated 15 August 2014, and comply with the requirements of the Final Statements and Notifications as amended, where applicable, in accordance with “Comparability of current and prior year results” on pages 12 to 15 and “Revision of the 2014/15 RFS including comparative information” on pages 16 to 18.
Emphasis of matter – revision of financial statements
20. In forming our opinions on the Revised Financial Statements, which are not modified, we have considered the adequacy of the disclosures made in “Revision of the 2014/15 RFS including comparative information” on pages 16 to 18 concerning the need for revision of the disclosure of the elimination of inter-market trading, the correction of an error in the allocation of ethernet electronics costs in 2013/14 and other immaterial corrections. The original financial statements were approved on 31 July 2015. We have not performed a subsequent events review for the period from the date the original financial statements were approved to the date of this report. PricewaterhouseCoopers LLP Chartered Accountants and Registered Auditors London,
2 December 2015

Section 5 – Summary of Market Performance
Page 26
Section 5 Summary of Market Performance

Section 5 – Summary of Market Performance
Page 27
5.1 Performance Summary by Market 2015
For the year ended 31 March 2015

Section 5 – Summary of Market Performance
Page 28
5.2 Performance Summary by Market 2014
Restated for the year ended 31 March 2014 (h)

Section 6 – Attribution of Wholesale Current Costs and Mean Capital Employed
Page 29
Section 6 Attribution of Wholesale Current Costs and Mean Capital Employed

Section 6 – Attribution of Wholesale Current Costs and Mean Capital Employed
Page 30
6.1 Wholesale sector costs
The notes below are intended to provide a brief description of the sectors reported in the Attribution of Wholesale Current Cost Statement and the key drivers of these sectors to aid the user of the Current Cost Financial Statements. Further details of these sectors can be found in the Accounting Methodology Document (“AMD”).
Provision/Maintenance
Includes engineering pay and non-pay costs relating to provision and maintenance. The most material cost relates to distribution side copper maintenance which is apportioned to services on the basis of the number of lines, relative fault rates and service levels.
Network Support
Network Support contains costs of activities necessary to support the running of BT’s network including time booked by engineers to non-operational activities. Most of these costs are apportioned using previously allocated engineers’ pay.
General Support
General Support includes planning, development, supplies, transport, computing, customer service, personnel and administration, and other general support costs. The key drivers for the apportionment of General Support include previously allocated pay costs and activity surveys.
General Management
General Management includes operator services, costs of general management activities and other general expenses. The key drivers are activity surveys, pay costs and asset values.
Finance and Billing
Finance and Billing includes the non-pay costs associated with activities of a financial nature, including consulting work and audit fees. The key drivers for the apportionment of Finance and Billing are previously allocated pay costs and asset values.
Accommodation
Accommodation includes building rents, business rates, facilities management and utility bills. Accommodation costs are mainly apportioned based on the use of floor space and power consumption.
Bad Debts
Bad debts include costs associated with writing off amounts that cannot be collected from customers. The key driver is revenue.
Other Costs
Other Costs includes payments to other UK communications providers, which are allocated to Wholesale Residual.
Depreciation
Depreciation is analysed between land and buildings, access, switch, duct and transmission and other (including network power, computers and software). The key drivers are engineering models and direct mapping of BT classes of work to network components and then onto the appropriate service, based on usage factors and service volumes.

Section 6 – Attribution of Wholesale Current Costs and Mean Capital Employed
Page 31
6.1.1 Attribution of Wholesale Current Costs 2015
For the year ended 31 March 2015

Section 6 – Attribution of Wholesale Current Costs and Mean Capital Employed
Page 32
6.1.2 Attribution of Wholesale Current Costs 2014
Restated for the year ended 31 March 2014 (h)

Section 6 – Attribution of Wholesale Current Costs and Mean Capital Employed
Page 33
6.2 Wholesale MCE sector costs
The notes below are intended to provide a brief description of the non-current assets sectors and Working Capital reported in the Attribution of Wholesale Current Cost Mean Capital Employed Statement and the key drivers of the sector to aid the user of the Financial Statements. Further details of these sectors can be found in the AMD.
Land & Buildings
This sector contains the asset values that are booked to BT Classes of Work for land and buildings, including freehold, long leases and short leases. The sector includes corporate office and network buildings owned by BT. Asset values are mainly apportioned based on the use of floor space and utilities.
Access - Copper
This sector contains the asset values for access copper (all the copper cables in the access network and all other necessary equipment required to carry signals between the user and the exchange). The key driver is direct mapping of Class of Work (“CoW”) to network components and then onto the appropriate service based on usage factors and actual service volumes.
Access - Fibre
This sector contains the asset values for access fibre. The key driver is the mapping of CoW to network components and then onto the appropriate service based on usage factors and actual service volumes.
Access - Duct
This sector contains the asset values for duct. Duct is a pipe, tube or conduit through which underground cables are passed. The key driver is a duct occupancy model that allocates CoW to network cable components and then onto the appropriate service based on usage factors and actual service volumes.
Switch
This sector contains the asset values for switching equipment. This equipment is located in BT exchanges. The key drivers are engineering models that allocate CoW to network components and then onto the appropriate service based on usage factors and actual service volumes.
Transmission
This sector contains the asset values for transmission. Transmission includes core transmission Synchronous Digital Hierarchy (“SDH”), Plesiochronous Digital Hierarchy
(“PDH”), Asynchronous Transfer Mode (“ATM”), cables and repeaters. The core transmission is used to link exchanges. The key drivers are engineering inventories and models that allocate CoW to network components and then onto the appropriate service based on usage factors and service volumes.
Other
This sector contains the asset values for a range of assets used by BT businesses including categories such as Software, Motor Transport and 21CN. The key drivers are surveys, engineering models and direct mapping of CoW to network components and then onto the appropriate service based on usage factors and actual service volumes.
Working Capital
The figures for debtors and creditors include an approximation of the internal “notional” receivables and payables that would be incurred if trades between BT’s lines of business were undertaken to a third party and at arm’s length. They are based upon the average trading terms of BT Group’s external trades. External receivables reflect BT’s external debts being allocated to services and products.

Section 6 – Attribution of Wholesale Current Costs and Mean Capital Employed
Page 34
6.2.1 Attribution of Wholesale Current Cost Mean Capital Employed 2015
For the year ended 31 March 2015

Section 6 – Attribution of Wholesale Current Costs and Mean Capital Employed
Page 35
6.2.2 Attribution of Wholesale Current Cost Mean Capital Employed 2014
Restated for the year ended 31 March 2014 (h)

Section 7 – Review of Fixed Access Markets
Page 36
Section 7 Review of Fixed Access Markets

Section 7 – Review of Fixed Access Markets
Page 37
7.1 Fixed Access Markets Review
Market Definition
Wholesale Fixed Analogue Exchange Lines (“WFAEL”)
Wholesale fixed analogue exchange lines are a narrowband access service supporting standard analogue telephony services (such as voice and, historically, facsimile and dial-up internet services).
We have been found to have SMP in the WFAEL market in UK excluding the Hull area.
Wholesale Local Access
WLA refers to the fixed connection from the local exchange/access node to the end-user. That connection is an input into a variety of retail services – narrowband telephony, broadband (both standard and superfast).
We have been found to have SMP for the supply of loop-based and fibre-based wholesale local access at a fixed location in the UK excluding the Hull area.
Wholesale ISDN2 Exchange Line Services (“ISDN2”)
ISDN2 is a narrowband access service designed to cater for smaller business sites with single line ISDN2 services providing 2 channels (each 64kbit/s).
We have been found to have SMP in ISDN2 at the wholesale level in the UK excluding the Hull area.
Wholesale ISDN30 Exchange Line Services (“ISDN30”)
ISDN30 is an access service supporting up to 30 narrowband 64kbit/s channels and is used most commonly to provide multiple telephone lines to larger business sites.
We have been found to have SMP in ISDN30 at the wholesale level in the UK excluding the Hull area.
Key Regulatory Changes
Following review by the Competition Appeal Tribunal (“CAT”) and Competition Commission (“CC”) some specific prices were changed with effect from 1 May 2013.
As part of the FAMR for which the final statement was published on 26 June 2014, Ofcom set a new charge control on WLR and LLU services which covers the period from 1 July 2014 to 31 March 2017.
The key findings from the market review were that:
Charge controls would apply to certain services within each of the markets. New charge controls were set on WLR and LLU services with effect from 1 July 2014. The detail of the CPI-based charge controls can be found in Ofcom’s FAMR Statement. Due to the number of controls, these are not repeated here.
A “margin squeeze” test has been imposed upon wholesale Next Generation Access (NGA) virtual unbundled local access services from 1 April 2015. We and TalkTalk have each appealed certain aspects of this decision, contained in a statement issued on 19 March 2015, to the Competition Appeal Tribunal.
Cost orientation will no longer apply to most services.
Key Market Changes
The overall markets are impacted by the continued growth in fibre based broadband services.
There has been continued growth of MPF lines and a consequential decrease in the volume of WLR PSTN lines as CPs continue to invest in LLU services.
ISDN2 rental volumes have continued to decline as alternatives including SIP Trunking, broadband and fibre based (NGA) services, along with further broadband penetration, provide opportunities for substitution. Broadband continues to supersede ISDN2 in the residential segment and, where internet access is the primary requirement, broadband is replacing ISDN2 in the business segment.
ISDN30 rental volumes have also continued to decline as customers migrate to alternatives such as SIP Trunking, Hosted VoIP and Centrex. This market still has considerable competitive activity with CPs promoting a switch from ISDN30 to IP Voice services as a way to reduce costs.
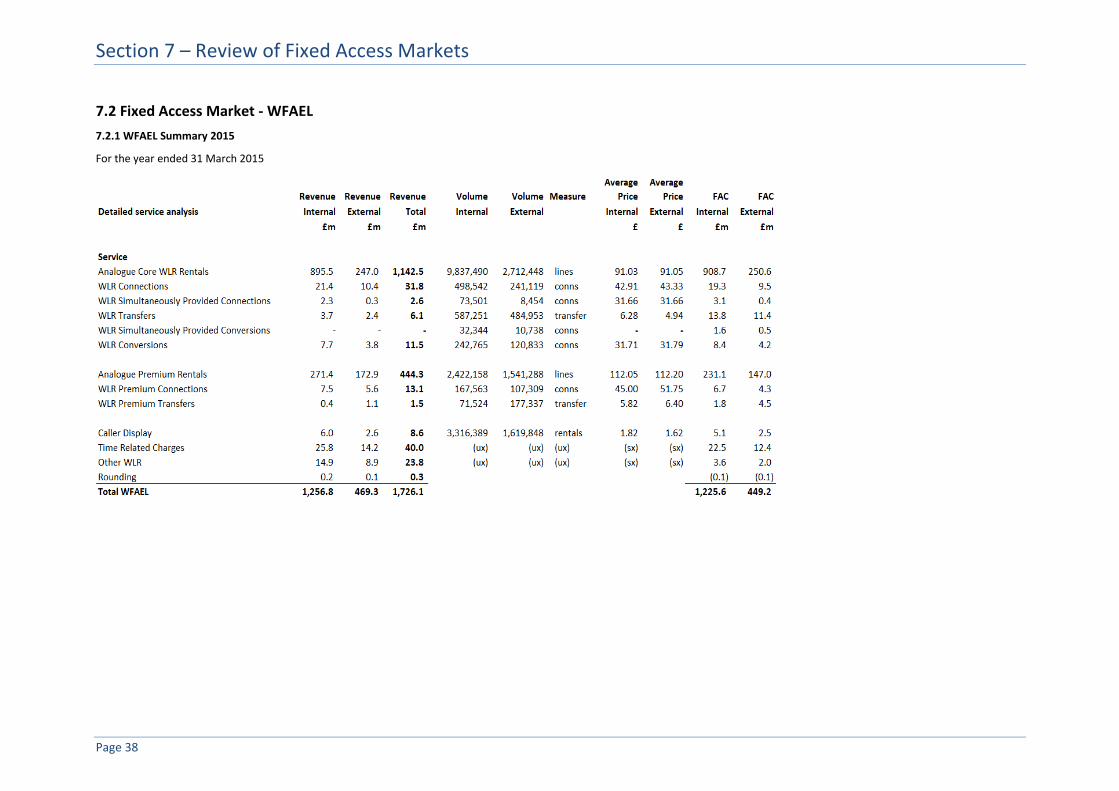
Section 7 – Review of Fixed Access Markets
Page 38
7.2 Fixed Access Market - WFAEL
7.2.1 WFAEL Summary 2015
For the year ended 31 March 2015

Section 7 – Review of Fixed Access Markets
Page 39
7.2.2 WFAEL calculation of FAC based on component costs and usage factors 2015
For the year ended 31 March 2015

Section 7 – Review of Fixed Access Markets
Page 40
7.2.3 WFAEL Summary 2014
Restated for the year ended 31 March 2014 (h)

Section 7 – Review of Fixed Access Markets
Page 41
7.2.4 WFAEL calculation of FAC based on component costs and usage factors 2014
Restated for the year ended 31 March 2014 (h)
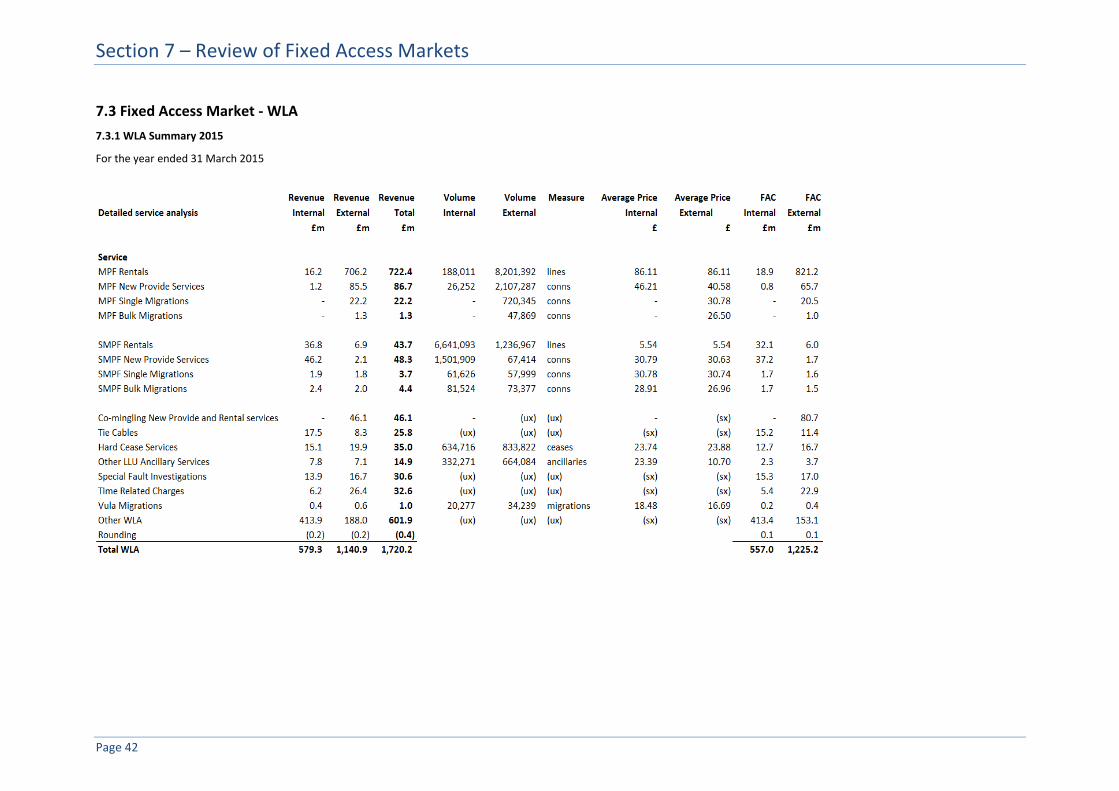
Section 7 – Review of Fixed Access Markets
Page 42
7.3 Fixed Access Market - WLA
7.3.1 WLA Summary 2015
For the year ended 31 March 2015

Section 7 – Review of Fixed Access Markets
Page 43
7.3.2 WLA calculation of FAC based on component costs and usage factors 2015
For the year ended 31 March 2015

Section 7 – Review of Fixed Access Markets
Page 44
7.3.2 WLA calculation of FAC based on component costs and usage factors 2015 (Continued)
For the year ended 31 March 2015

Section 7 – Review of Fixed Access Markets
Page 45
7.3.3 WLA Summary 2014
Restated for the year ended 31 March 2014 (h)

Section 7 – Review of Fixed Access Markets
Page 46
7.3.4 WLA calculation of FAC based on component costs and usage factors 2014
Restated for the year ended 31 March 2014 (h)

Section 7 – Review of Fixed Access Markets
Page 47
7.3.4 WLA calculation of FAC based on component costs and usage factors 2014 (Continued)
Restated for the year ended 31 March 2014 (h)

Section 7 – Review of Fixed Access Markets
Page 48
7.4 Fixed Access Market – ISDN2
7.4.1 ISDN2 Summary 2015
For the year ended 31 March 2015

Section 7 – Review of Fixed Access Markets
Page 49
7.4.2 ISDN2 Summary 2014
Restated for the year ended 31 March 2014 (h)

Section 7 – Review of Fixed Access Markets
Page 50
7.5 Fixed Access Market – ISDN30
7.5.1 ISDN30 Summary 2015
For the year ended 31 March 2015

Section 7 – Review of Fixed Access Markets
Page 51
7.5.2 ISDN30 Summary 2014
Restated for the year ended 31 March 2014 (h)

Section 8 – Review of Business Connectivity Markets
Page 52
Section 8 Review of Business Connectivity Markets

Section 8 – Review of Business Connectivity Markets
Page 53
8.1 Review of Business Connectivity Markets
Market Definitions
Traditional Interface Symmetric Broadband Origination (“TISBO”)
Traditional Interface (“TI”) leased lines includes services which use legacy analogue and digital interfaces. In this category there are two broad types of circuit:
Analogue interface leased lines: These are commonly used for voice transmission e.g. external extension circuits between business sites. They are also used for low-bandwidth data transmission.
Digital interface leased lines based on legacy TDM technical transmission standards, including PDH and SDH, and which use the ITU G.703 interface.
TISBO is the term used to describe TI terminating segments. TISBO markets are split by bandwidth as follows:
Low Bandwidth (up to and including 8Mbit/s).
Medium Bandwidth (above 8Mbit/s up to and including 45Mbit/s).
High Bandwidth (above 45Mbit/s up to and including 155Mbit/s).
Very High Bandwidth (above 155Mbit/s).
Separate geographic markets were identified in:
the Hull area for all wholesale leased lines; and
a defined area of London (the Western, Eastern and Central London Area including Slough, the WECLA) for Medium Bandwidth and High Bandwidth lines.
We were found to have SMP in:
Low Bandwidth TISBO in the UK excluding the Hull area;
Medium Bandwidth TISBO in the UK excluding the Hull area and the WECLA; and
High Bandwidth TISBO in the UK excluding the Hull area and the WECLA.
Alternative Interface Symmetric Broadband Origination (“AISBO”)
Alternative Interface (“AI”) leased lines: use modern interfaces that are generally more suitable for transmission of Internet protocol (“IP”) data, and are often more cost-effective in delivering high bandwidth services than legacy technologies. Ethernet is the most common AI leased lines technology. Ethernet services are currently available in a range of bandwidths from 10Mbit/s to 100Gbit/s with the most common being 100Mbit/s.
AISBO is the term used to describe AI terminating segments at bandwidths up to and including 1Gbit/s. Separate geographic markets were identified in:
the Hull area; and
the WECLA.
We were found to have SMP in AISBO in:
the UK excluding the Hull area and the WECLA (AISBO Non WECLA); and
the WECLA (AISBO WECLA).
Multiple Interface Symmetric Broadband Origination (“MISBO”)
Ofcom has defined the MISBO market as containing leased line terminating services with a bandwidth in excess of 1Gbit/s irrespective of interface and services of any bandwidth delivered using Wave Division Multiplexing (“WDM”) equipment at the end-user’s premises.
Separate geographic markets were identified in:
the Hull area; and
the WECLA.
We were found to have SMP in MISBO in the UK excluding the Hull area and the WECLA (MISBO Non WECLA).
Regional TI Trunk Segments
Trunk or core networks are used to transfer data over long distance national routes and between the major urban centres where businesses are concentrated. Data transported over trunk (or core) networks is combined with other traffic streams (using multiplexors), which allows CPs to transport traffic on their networks more efficiently.
Ofcom concluded that separate wholesale markets exist for regional and national trunk traditional interface services and that BT has SMP in the regional TI trunk market at all bandwidths.
Technical areas (Point of Handover)
Technical areas (Point of Handover) is associated with TISBO market, rather than a market in itself. It is a necessary technical function to enable network interconnection, in order to allow the provision of wholesale products in the TISBO market.
In all TISBO markets where BT has SMP, we are required to provide Technical areas (Point of Handover) services in two varieties: Customer Sited Handover (“CSH”) and In-Span Handover (“ISH”), including ISH Extension. When providing CSH, BT delivers TISBO services

Section 8 – Review of Business Connectivity Markets
Page 54
to the premises of its wholesale customers. When providing ISH, BT and the wholesale customer connect their networks at a notional mid-point.
Key Regulatory Changes
There were no changes in the regulation of the Business Connectivity Markets during 2013-14 and 2014-15.
Ofcom is currently reviewing the Business Connectivity Market and issued “Business Connectivity Market Review: Review of competition in the provision of leased lines” consultation documents on 15 May 2015 and “Business Connectivity Market Review: Leased lines charge controls and dark fibre pricing” on 12 June 2015. Any changes arising from this review are currently expected to take effect from the 2016-17 financial year.
Key Market Changes
Within the TISBO markets there continues to be a fall in demand for traditional TDM circuits as customers migrate to AISBO services and other services like Broadband. Overall competition and customer demand for alternative technologies is resulting in falling volumes in this market.
There was strong growth in the supply of EAD products, while volumes of WES products decreased. The main drivers of growth were mobile operators, customers’ requirements to migrate from TDM products, and growing demand for high speed Ethernet connectivity from corporate and CPs. This growth offset price reductions in the AISBO markets.
Charge controls are in place as follows:
Basket & services Value of X
TISBO – Low Bandwidth TISBO inside and outside the WECLA, Medium and High Bandwidth TISBO outside the WECLA and TI Regional Trunk services.
RPI+2.25%
AISBO and MISBO - Ethernet at all bandwidths outside the WECLA.
RPI-11.5%
AISBO inside the WECLA RPI-RPI on each service
Excess construction charges GBCI-0% on each charge

Section 8 – Review of Business Connectivity Markets
Page 55
8.2 Business Connectivity Market – Low Bandwidth TISBO
8.2.1 Low Bandwidth TISBO Summary 2015
For the year ended 31 March 2015

Section 8 – Review of Business Connectivity Markets
Page 56
8.2.2 Low Bandwidth TISBO calculation of FAC based on component costs and usage factors 2015
For the year ended 31 March 2015

Section 8 – Review of Business Connectivity Markets
Page 57
8.2.2 Low Bandwidth TISBO calculation of FAC based on component costs and usage factors 2015 (Continued)
For the year ended 31 March 2015
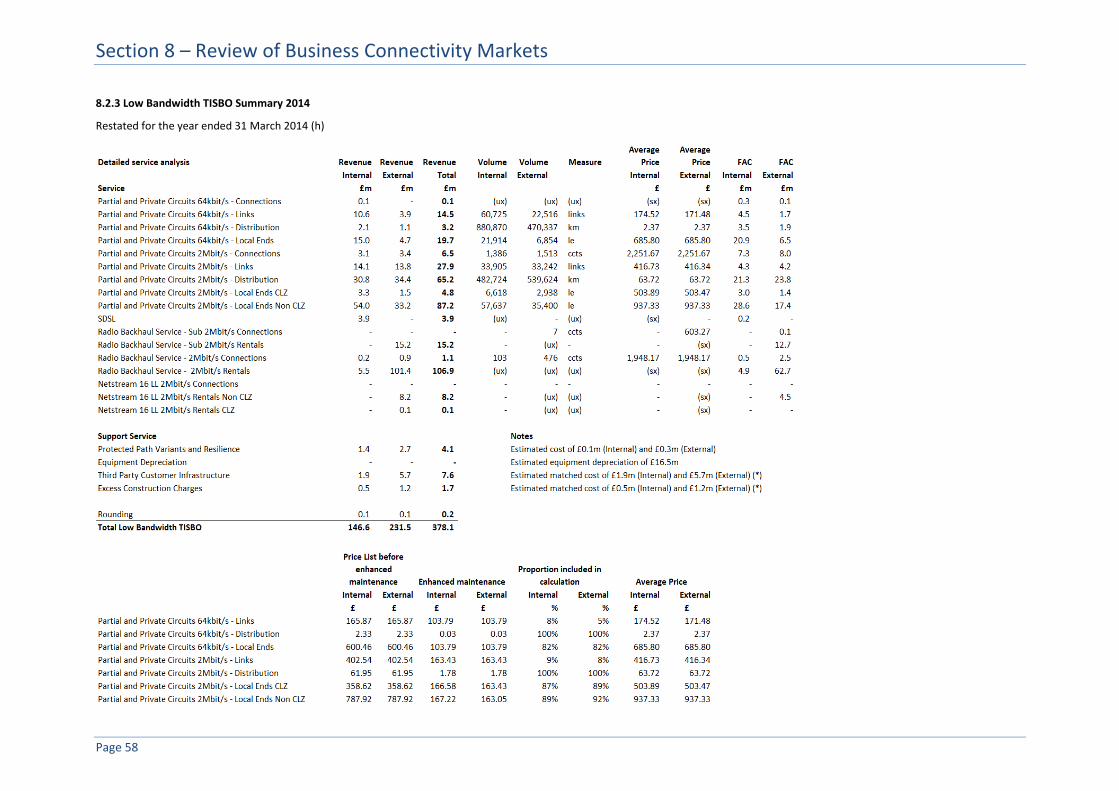
Section 8 – Review of Business Connectivity Markets
Page 58
8.2.3 Low Bandwidth TISBO Summary 2014
Restated for the year ended 31 March 2014 (h)

Section 8 – Review of Business Connectivity Markets
Page 59
8.2.4 Low Bandwidth calculation of FAC based on component costs and usage factors 2014
Restated for the year ended 31 March 2014 (h)

Section 8 – Review of Business Connectivity Markets
Page 60
8.2.4 Low Bandwidth calculation of FAC based on component costs and usage factors 2014 (Continued)
Restated for the year ended 31 March 2014 (h)

Section 8 – Review of Business Connectivity Markets
Page 61
8.3 Business Connectivity Market – Medium Bandwidth TISBO
8.3.1 Medium Bandwidth TISBO Summary 2015
For the year ended 31 March 2015

Section 8 – Review of Business Connectivity Markets
Page 62
8.3.2 Medium Bandwidth TISBO calculation of FAC based on component costs and usage factors 2015
For the year ended 31 March 2015

Section 8 – Review of Business Connectivity Markets
Page 63
8.3.3 Medium Bandwidth TISBO Summary 2014
Restated for the year ended 31 March 2014 (h)

Section 8 – Review of Business Connectivity Markets
Page 64
8.3.4 Medium Bandwidth TISBO calculation of FAC based on component costs and usage factors 2014
Restated for the year ended 31 March 2014 (h)

Section 8 – Review of Business Connectivity Markets
Page 65
8.4 Business Connectivity Market – High Bandwidth TISBO
8.4.1 High Bandwidth TISBO Summary 2015
For the year ended 31 March 2015

Section 8 – Review of Business Connectivity Markets
Page 66
8.4.2 High Bandwidth TISBO calculation of FAC based on component costs and usage factors 2015
For the year ended 31 March 2015

Section 8 – Review of Business Connectivity Markets
Page 67
8.4.3 High Bandwidth TISBO Summary 2014
Restated for the year ended 31 March 2014 (h)

Section 8 – Review of Business Connectivity Markets
Page 68
8.4.4 High Bandwidth TISBO calculation of FAC based on component costs and usage factors 2014
Restated for the year ended 31 March 2014 (h)

Section 8 – Review of Business Connectivity Markets
Page 69
8.5 Business Connectivity Market – TI Regional Trunk
8.5.1 TI Regional Trunk Summary 2015
For the year ended 31 March 2015
Average price = Price list + Enhanced maintenance

Section 8 – Review of Business Connectivity Markets
Page 70
8.5.2 TI Regional Trunk calculation of FAC based on component costs and usage factors 2015
For the year ended 31 March 2015

Section 8 – Review of Business Connectivity Markets
Page 71
8.5.3 TI Regional Trunk Summary 2014
Restated for the year ended 31 March 2014 (h)
Average price = Price list + Enhanced maintenance

Section 8 – Review of Business Connectivity Markets
Page 72
8.5.4 TI Regional Trunk calculation of FAC based on component costs and usage factors 2014
Restated for the year ended 31 March 2014 (h)

Section 8 – Review of Business Connectivity Markets
Page 73
8.6 Business Connectivity Market – Technical Areas (Point of Handover)
8.6.1 Technical Areas (Point of Handover) Summary 2015
For the year ended 31 March 2015

Section 8 – Review of Business Connectivity Markets
Page 74
8.6.2 Technical Areas (Point of Handover) calculation of FAC based on component costs and usage factors 2015
For the year ended 31 March 2015

Section 8 – Review of Business Connectivity Markets
Page 75
8.6.3 Technical Areas (Point of Handover) Summary 2014
Restated for the year ended 31 March 2014 (h)

Section 8 – Review of Business Connectivity Markets
Page 76
8.6.4 Technical Areas (Point of Handover) calculation of FAC based on component costs and usage factors 2014
Restated for the year ended 31 March 2014 (h)

Section 8 – Review of Business Connectivity Markets
Page 77
8.7 Business Connectivity Market – AISBO Non WECLA
8.7.1 AISBO Non WECLA Summary 2015
For the year ended 31 March 2015

Section 8 – Review of Business Connectivity Markets
Page 78
8.7.2 AISBO Non WECLA calculation of FAC based on component costs and usage factors 2015
For the year ended 31 March 2015

Section 8 – Review of Business Connectivity Markets
Page 79
8.7.2 AISBO Non WECLA calculation of FAC based on component costs and usage factors 2015 (Continued)
For the year ended 31 March 2015
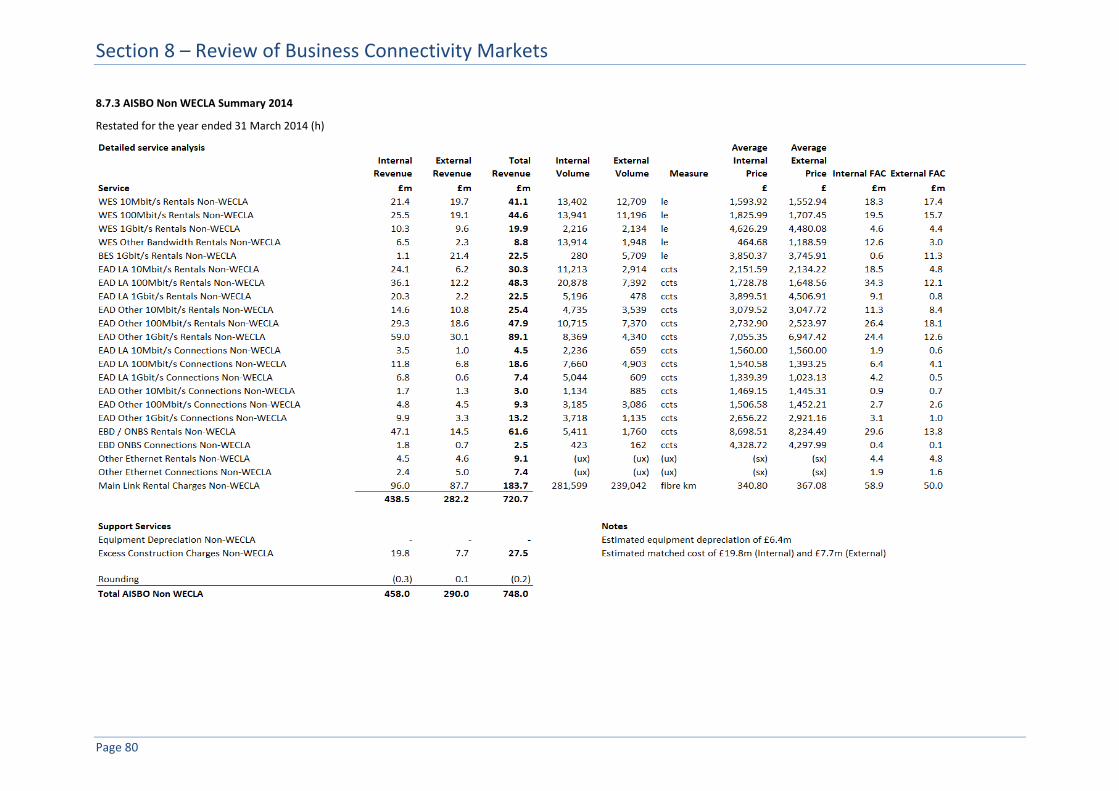
Section 8 – Review of Business Connectivity Markets
Page 80
8.7.3 AISBO Non WECLA Summary 2014
Restated for the year ended 31 March 2014 (h)

Section 8 – Review of Business Connectivity Markets
Page 81
8.7.4 AISBO Non WECLA calculation of FAC based on component costs and usage factors 2014
Restated for the year ended 31 March 2014 (h)

Section 8 – Review of Business Connectivity Markets
Page 82
8.7.4 AISBO Non WECLA calculation of FAC based on component costs and usage factors 2014 (Continued)
Restated for the year ended 31 March 2014 (h)

Section 8 – Review of Business Connectivity Markets
Page 83
8.8 Business Connectivity Market – AISBO WECLA
8.8.1 AISBO WECLA Summary 2015
For the year ended 31 March 2015

Section 8 – Review of Business Connectivity Markets
Page 84
8.8.2 AISBO WECLA calculation of FAC based on component costs and usage factors 2015
For the year ended 31 March 2015
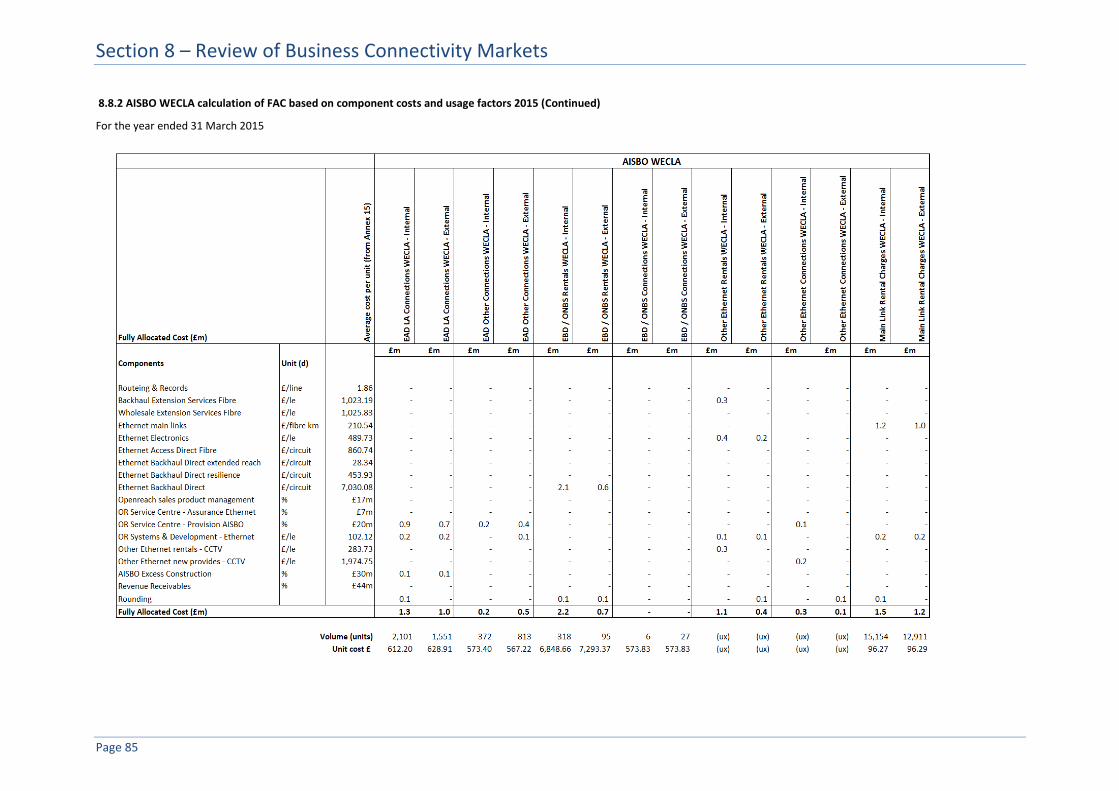
Section 8 – Review of Business Connectivity Markets
Page 85
8.8.2 AISBO WECLA calculation of FAC based on component costs and usage factors 2015 (Continued)
For the year ended 31 March 2015

Section 8 – Review of Business Connectivity Markets
Page 86
8.8.3 AISBO WECLA Summary 2014
Restated for the year ended 31 March 2014 (h)

Section 8 – Review of Business Connectivity Markets
Page 87
8.8.4 AISBO WECLA calculation of FAC based on component costs and usage factors 2014
Restated for the year ended 31 March 2014 (h)

Section 8 – Review of Business Connectivity Markets
Page 88
8.8.4 AISBO WECLA calculation of FAC based on component costs and usage factors 2014 (Continued)
Restated for the year ended 31 March 2014 (h)

Section 8 – Review of Business Connectivity Markets
Page 89
8.9 Business Connectivity Market – MISBO Non WECLA
8.9.1 MISBO Non WECLA Summary 2015
For the year ended 31 March 2015

Section 8 – Review of Business Connectivity Markets
Page 90
8.9.2 MISBO Non WECLA calculation of FAC based on component costs and usage factors 2015
For the year ended 31 March 2015

Section 8 – Review of Business Connectivity Markets
Page 91
8.9.3 MISBO Non WECLA Summary 2014
Restated for the year ended 31 March 2014 (h)

Section 8 – Review of Business Connectivity Markets
Page 92
8.9.4 MISBO Non WECLA calculation of FAC based on component costs and usage factors 2014
Restated for the year ended 31 March 2014 (h)

Section 9 – Review of Narrowband Markets
Page 93
Section 9 Review of Narrowband Markets

Section 9 – Review of Narrowband Markets
Page 94
9.1 Review of Narrowband Markets
Market Definitions
Wholesale Call Origination on a Fixed Narrowband Network
Fixed Call Origination relates to the conveyance of all signals (including relevant control signals) required to originate calls on a customer’s exchange line to the first point in the network where these signals can be accessed by another communication provider.
Wholesale Fixed Geographic Call Termination
Fixed Geographic Call termination refers to the conveyance of all signals (including relevant control signals) required to terminate calls on a customer’s exchange line from the first point in the network where those signals can be accessed by another communications provider.
The market is termination services that we provide to other communications providers, for the termination of voice calls to UK geographic numbers in the UK excluding Hull area.
Technical areas (Interconnect Circuits)
Technical areas (Interconnect Circuits) provide the physical infrastructure to connect the exchanges of two communications provides in order to enable traffic to pass between their networks.
We provide the following types of Interconnect Circuits:
Customer-Sited Interconnect (“CSI”): We provide a point of interconnection at the site of the interconnecting CP by extending its network using a 2Mbit/s circuit;
Intra-Building Circuit (“IBC”): We provide a 2Mbit/s connection between the transmission infrastructure and the switch. An IBC is not ordered separately by customers; it will be included with a CSI or ISI circuit ordered;
In-Span Interconnect (“ISI”): We and the other CP build out our networks to a handover point located between our switches. The handover point is normally close to our exchange; and
Interconnection Extension Circuit (“IEC”): IECs allow an interconnecting CP with an existing ISI to extend this point of interconnection to a new building. In order to do this, we provide a 2Mbit/s circuit between the two buildings.
Key Regulatory Changes
Ofcom carried out a review of the Narrowband Markets during 2013-14 and issued its final statement on 26 September 2013. It concluded that we continue to have SMP in the Fixed call origination, Fixed Geographic Call Termination and Single Transit markets in the UK
excluding the Hull area. No ex ante remedies were imposed in the Single Transit market. There were no changes in the regulation of these markets in 2014-15.
Ofcom is currently reviewing the Fixed Call Origination and Termination Markets and issued a call for inputs on 2 May 2015. Any changes arising from this review are expected to take effect from 1 October 2016.
The charge controls for the services in these markets are as follows:
Market 2013/14* 2014/15 2015/16
Fixed Call Origination RPI+71.1% RPI-3.5% RPI-3.6%
Fixed Geographic Call Termination RPI-87.3% RPI-3.0% RPI-3.1%
Technical areas (Interconnect Circuits) 0% 0% 0%
*For 2013/14 the controls above applied from 1 January 2014
Key Market Changes
Overall the markets for calls continue to show reducing volumes although price increases in the fixed call origination market have offset the volume decline. This trend has been driven by several factors:
The on-going migration of call origination and termination minutes from fixed public narrowband networks to mobile networks.
The substitution impact of Voice over Internet Protocol (“VoIP”) calls continues to grow reducing call origination and termination volumes.
Growth in Local Loop Unbundling (“LLU”) lines has eroded call origination and termination volumes with major players marketing double and triple play offerings to their customer base, where voice services are provided alongside high speed data.
As call origination and termination volumes reduce, there is a consequential reduction in the revenue for interconnect circuits. Interconnect circuit volumes have also reduced due to CPs rationalising their existing interconnections with BT, directly interconnecting with other CPs, and moving to IP solutions which do not require interconnect circuits.

Section 9 – Review of Narrowband Markets
Page 95
9.2 Narrowband Market – Fixed Call Origination
9.2.1 Fixed Call Origination Summary 2015
For the year ended 31 March 2015
9.2.2 Fixed Call Origination Summary 2014
Restated for the year ended 31 March 2014 (h)

Section 9 – Review of Narrowband Markets
Page 96
9.3 Narrowband Market – Fixed Geographic Call Termination
9.3.1 Fixed Geographic Call Termination Summary 2015
For the year ended 31 March 2015
Detailed service analysis
For the year ended 31 March 2015
Internal
Revenue
External
Revenue
Total
Revenue
Service £m £m £m Day Evening Weekend 24 hours Day Evening Weekend 24 hours Day Evening Weekend
Weighted
Average Day Evening Weekend
Weighted
Average
Wholesale call termination local exchange segment 3.4 6.9 10.3 8,306 3,685 4,519 16,510 15,664 10,212 8,453 34,329 0.029 0.013 0.011 0.021 0.029 0.013 0.011 0.020
Internal Wholesale call termination local exchange stick (PSTN & ISDN) 1.4 - 1.4 561 310 399 1,270 - - - - 0.167 0.077 0.060 0.111 0.167 0.077 0.060 -
Total Fixed Geographic Call Termination 4.8 6.9 11.7
NCC traffic - millions of minutes (mm)
Internal
NCC traffic - millions of minutes (mm)
External
Average NCC rates - pence per minute
(ppm)
Internal
Average NCC rates - pence per minute
(ppm)
External
9.3.2 Fixed Geographic Call Termination Summary 2014
Restated for the year ended 31 March 2014 (h)

Section 9 – Review of Narrowband Markets
Page 97
9.4 Narrowband Market – Technical areas (Interconnect Circuits)
9.4.1 Technical areas (Interconnect Circuits) Summary 2015
For the year ended 31 March 2015

Section 9 – Review of Narrowband Markets
Page 98
9.4.2 Technical areas (Interconnect Circuits) calculation of FAC based on component costs and usage factors 2015
For the year ended 31 March 2015

Section 9 – Review of Narrowband Markets
Page 99
9.4.3 Technical areas (Interconnect Circuits) Summary 2014
Restated for the year ended 31 March 2014 (h)

Section 9 – Review of Narrowband Markets
Page 100
9.4.4 Technical areas (Interconnect Circuits) calculation of FAC based on component costs and usage factors 2014
Restated for the year ended 31 March 2014 (h)

Section 10 – Review of Wholesale Broadband Access Markets
Page 101
Section 10 Review of Wholesale Broadband Access Markets

Section 10 – Review of Wholesale Broadband Access Markets
Page 102
10.1 Wholesale Broadband Access (“WBA”) Markets Review
Market Definition
WBA is asymmetric broadband access and any backhaul as necessary to allow interconnection with other communications providers, which provides an always on capability, allows both voice and data services to be used simultaneously and provides data at speeds greater than a dial-up connection.
Market A covers exchange areas where no more than two principal operators (i.e. BT, Sky, TalkTalk and Virgin) are, or are forecast to be, present. Market B covers all other exchange areas and Ofcom found Market B to be competitive.
Key Regulatory Changes
Ofcom reviewed the WBA Markets during 2013/14 and issued its final statement on 26 June 2014. Changes took effect from that 1 July 2014.
The key changes are that:
BT has been found to have SMP only in exchanges where no more than two operators are or are forecast to be present (Market A).
Cost orientation requirements were removed.
A price cap of CPI-10.7% per annum applies to a basket of IPstream Connect services within Market A with sub-caps on certain services within the basket.
Key Market Changes
WBA Market A revenue has remained relatively stable, with price reductions offset by increases in bandwidth volumes.

Section 10 – Review of Wholesale Broadband Access Markets
Page 103
10.2 WBA - Market A
10.2.1 WBA (Market A) Summary 2015
For the year ended 31 March 2015

Section 10 – Review of Wholesale Broadband Access Markets
Page 104
10.2.2 WBA (Market A) calculation of FAC based on component costs and usage factors 2015
For the year ended 31 March 2015

Section 10 – Review of Wholesale Broadband Access Markets
Page 105
10.2.2 WBA (Market A) calculation of FAC based on component costs and usage factors 2015 (Continued)
For the year ended 31 March 2015

Section 10 – Review of Wholesale Broadband Access Markets
Page 106
10.2.3 WBA (Market A) EOI 2015
For the year ended 31 March 2015
EOI Charge Avera
ge E
OI
Inp
ut
Pri
ce p
er
un
it
IPstr
eam
Co
nn
ect
Max a
nd
Max P
rem
ium
En
d
User
Access -
Ren
tal
Inte
rnal
IPstr
eam
Co
nn
ect
Max a
nd
Max P
rem
ium
En
d
User
Access -
Ren
tal
Exte
rnal
IPstr
eam
Co
nn
ect
Co
ntr
acte
d B
an
dw
idth
per
Mb
it/s
per
no
de r
en
tal
Inte
rnal
IPstr
eam
Co
nn
ect
Co
ntr
acte
d B
an
dw
idth
per
Mb
it/s
per
no
de r
en
tal
Exte
rnal
IPS
tream
Co
nn
ect
En
d U
ser
Re-g
rad
e I
nte
rnal
IPS
tream
Co
nn
ect
En
d U
ser
Re-g
rad
e E
xte
rnal
IPstr
eam
Co
nn
ect
En
d U
ser
Mig
rati
on
In
tern
al
IPstr
eam
Co
nn
ect
En
d U
ser
Mig
rati
on
Exte
rnal
IPstr
eam
Co
nn
ect
AD
SL
Can
cell
ati
on
In
tern
al
IPstr
eam
Co
nn
ect
AD
SL
Can
cell
ati
on
Exte
rnal
Oth
er
IPstr
eam
Co
nn
ect
Mark
et
Inte
rnal
Oth
er
IPstr
eam
Co
nn
ect
Mark
et
Exte
rnal
Cease B
asket
Inte
rnal
Cease B
asket
Exte
rnal
WB
C C
on
necti
on
s I
nte
rnal
WB
C C
on
necti
on
s E
xte
rnal
WB
C E
nd
User
Access -
Ren
tal
Inte
rnal
WB
C E
nd
User
Access -
Ren
tal
Exte
rnal
WB
C B
an
dw
idth
In
tern
al
WB
C B
an
dw
idth
Exte
rnal
WB
C A
ncil
lary
Ch
arg
es &
oth
er
Inte
rnal
WB
C A
ncil
lary
Ch
arg
es &
oth
er
Exte
rnal
Oth
er
WB
A M
ark
et
A I
nte
rnal
Oth
er
WB
A M
ark
et
A E
xte
rnal
£m £m £m £m £m £m £m £m £m £m £m £m £m £m £m £m £m £m £m £m £m £m £m £m
Part Service Description Units
EBD ONBS Rentals AISBO WECLA Circuits 6,818.86 - - - - - - - - - - - - - - - - - - 0.1 0.0 - - - -
EBD ONBS Connections AISBO WECLA Circuits 3,500.00 - - - - - - - - - - - - - - - - - - 0.0 0.0 - - - -
EBD ONBS Connections MISBO WECLA Circuits 12,250.00 - - - - - - - - - - - - - - - - - - 0.0 0.0 - - - -
EBD ONBS Rentals MISBO WECLA Circuits 17,293.19 - - - - - - - - - - - - - - - - - - 0.1 0.0 - - - -
EBD ONBS Rentals AISBO Non-WECLA Circuits 6,756.18 - - - - - - - - - - - - - - - - - - 0.9 0.0 - - - -
EBD ONBS Connections AISBO Non-WECLA Circuits 3,553.57 - - - - - - - - - - - - - - - - - - 0.0 0.0 - - - -
EBD ONBS Rentals MISBO Non-WECLA Circuits 17,472.67 - - - - - - - - - - - - - - - - - - 1.0 0.0 - - - -
EBD ONBS Connections MISBO Non-WECLA Circuits 11,947.87 - - - - - - - - - - - - - - - - - - 0.2 0.0 - - - -
SMPF New Provides Conns 30.79 - - - - - - - - - - 4.8 1.2 - - 2.7 0.1 - - - - - - - -
SMPF Single Migrations Migrations 8.90 - - - - - - 0.5 0.0 - - - - - - - - - - - - - - - -
SMPF Rentals Rentals 5.54 5.5 1.6 - - - - - - - - 0.1 0.1 - - - - 3.0 0.2 - - - - 0.0 0.0
Other LLU Ancillaries Basket Ancillaries 32.08 - - - - 3.0 0.1 - - - - - - - - - - - - - - - - - -
SMPF Bulk Migrations Migrations 8.35 - - - - - - 0.7 0.0 - - - - - - - - - - - - - - - -
MPF Hard Ceases Ceases 23.87 - - - - - - - - - - - - 0.0 0.0 - - - - - - - - - -
SMPF Hard Ceases Ceases 23.73 - - - - - - - - - - - - 2.1 0.7 - - - - - - - - - -
Other Tie Pair Modifications Ancillaries 58.60 0.1 0.0 - - - - - - - - 0.0 0.0 - - - - - - - - - - 0.0 0.0
Other Tie-cables and Comingling Ancillaries 19.73 1.2 0.4 - - - - - - - - - - - - - - 0.9 0.1 - - - - 0.0 0.0
SMPF Enhanced Care Ancillaries 38.40 - - - - - - - - - - - - - - - - - - - - - - 1.7 0.4
SMPF Expedite Ancillaries 101.50 - - - - - - - - - - - - - - - - - - - - - - 0.8 0.1
WBA Broadband Boost Ancillaries 166.00 - - - - - - - - - - - - - - - - - - - - - - 2.3 -
Other LLU Ancillaries Basket Ancillaries 94.29 0.7 0.2 - - - - - - - - 0.0 0.0 - - - - 0.4 0.0 - - - - 1.1 1.6
ONBS Main Link AISBO WECLA Circuits - - - - - - - - - - - - - - - - - - - - - - - - -
ONBS Main Link MISBO WECLA Circuits 420.00 - - - - - - - - - - - - - - - - - - 0.0 0.0 - - - -
ONBS Main Link AISBO Non-WECLA Circuits 11.39 - - - - - - - - - - - - - - - - - - 0.0 0.0 - - - -
ONBS Main Link MISBO Non-WECLA Circuits 420.00 - - - - - - - - - - - - - - - - - - 0.0 0.0 - - - -
Tie Cables Ancillaries 49.06 1.0 0.3 - - - - - - - - - - - - - - 1.7 0.1 - - - - 0.0 0.0
21CN Backhaul EAD Circuits 3,067.58 - - - - - - - - - - - - - - - - - - 5.2 0.1 - - - -
Time Related Charges Ancillaries 118.72 0.4 0.0 - - - - - - - - 0.0 0.0 - - - - 0.4 0.0 - - - - - -
Roundings (0.2) - - - - - - - - - (0.1) - 0.1 - - - - - - - - - - -
8.7 2.5 - - 3.0 0.1 1.2 0.0 - - 4.8 1.3 2.2 0.7 2.7 0.1 6.4 0.4 7.5 0.1 - - 5.9 2.1
Volumes 986,731 305,191 2,320,854 365,702 186,716 3,763 55,492 1,118 41 23 (ux) (ux) 216,053 68,000 87,539 2,767 539,119 33,555 968,518 10,151 (ux) (ux) (ux) (ux)
Unit Rentals Rentals Bandwidth Bandwidth Re-grades Re-grades Migrations Migrations Cancellations Cancellations Ceases Ceases Conns Conns Rentals Rentals Bandwidth Bandwidth
Unit Cost (£) 8.82 8.23 - - 16.17 16.17 21.71 21.71 - - (ux) (ux) 9.97 9.87 30.79 30.79 11.89 11.53 7.78 7.78 (ux) (ux) (ux) (ux)
Total EOI Charge (£m)

Section 10 – Review of Wholesale Broadband Access Markets
Page 107
10.2.4 WBA (Market A) Summary 2014
Restated for the year ended 31 March 2014 (h)

Section 10 – Review of Wholesale Broadband Access Markets
Page 108
10.2.5 WBA (Market A) calculation of FAC based on component costs and usage factors 2014
Restated for the year ended 31 March 2014 (h)

Section 10 – Review of Wholesale Broadband Access Markets
Page 109
10.2.5 WBA (Market A) calculation of FAC based on component costs and usage factors 2014 (Continued)
Restated for the year ended 31 March 2014 (h)

Section 10 – Review of Wholesale Broadband Access Markets
Page 110
10.2.6 WBA (Market A) EOI 2014
Restated for the year ended 31 March 2014 (h)
EOI Charge Avera
ge E
OI
Inp
ut
Pri
ce p
er
un
it
IPstr
eam
Co
nn
ect
Max a
nd
Max P
rem
ium
En
d
User
Access -
Ren
tal
Inte
rnal
IPstr
eam
Co
nn
ect
Max a
nd
Max P
rem
ium
En
d
User
Access -
Ren
tal
Exte
rnal
IPstr
eam
Co
nn
ect
Co
ntr
acte
d B
an
dw
idth
per
Mb
it/s
per
no
de r
en
tal
Inte
rnal
IPstr
eam
Co
nn
ect
Co
ntr
acte
d B
an
dw
idth
per
Mb
it/s
per
no
de r
en
tal
Exte
rnal
IPstr
eam
Co
nn
ect
En
d U
ser
Re-g
rad
e I
nte
rnal
IPstr
eam
Co
nn
ect
En
d U
ser
Re-g
rad
e E
xte
rnal
IPstr
eam
Co
nn
ect
En
d U
ser
Mig
rati
on
In
tern
al
IPstr
eam
Co
nn
ect
En
d U
ser
Mig
rati
on
Exte
rnal
IPstr
eam
Co
nn
ect
AD
SL
Can
cell
ati
on
In
tern
al
IPstr
eam
Co
nn
ect
AD
SL
Can
cell
ati
on
Exte
rnal
Oth
er
IPstr
eam
Co
nn
ect
Mark
et
Inte
rnal
Oth
er
IPstr
eam
Co
nn
ect
Mark
et
Exte
rnal
Cease B
asket
Inte
rnal
Cease B
asket
EX
tern
al
WB
C C
on
necti
on
s I
nte
rnal
WB
C C
on
necti
on
s E
xte
rnal
WB
C E
nd
User
Access -
Ren
tal
Inte
rnal
WB
C E
nd
User
Access -
Ren
tal
Exte
rnal
WB
C B
an
dw
idth
In
tern
al
WB
C B
an
dw
idth
Exte
rnal
WB
C A
ncil
lary
Ch
arg
es &
oth
er
Inte
rnal
WB
C A
ncil
lary
Ch
arg
es &
oth
er
Exte
rnal
Oth
er
WB
A M
ark
et
A I
nte
rnal
Oth
er
WB
A M
ark
et
A E
xte
rnal
£m £m £m £m £m £m £m £m £m £m £m £m £m £m £m £m £m £m £m £m £m £m £m £m
Part Service Description Units
EBD ONBS Rentals AISBO WECLA Circuits 8,363.71 - - - - - - - - - - - - - - - - - - 0.2 0.0 - - - -
EBD ONBS Connections AISBO WECLA Circuits 4,398.08 - - - - - - - - - - - - - - - - - - 0.0 0.0 - - - -
EBD ONBS Connections MISBO WECLA Circuits 14,000.00 - - - - - - - - - - - - - - - - - - 0.1 0.0 - - - -
EBD ONBS Rentals MISBO WECLA Circuits 25,256.14 - - - - - - - - - - - - - - - - - - 0.2 0.0 - - - -
EBD ONBS Rentals AISBO Non-WECLA Circuits 8,698.51 - - - - - - - - - - - - - - - - - - 3.1 0.1 - - - -
EBD ONBS Connections AISBO Non-WECLA Circuits 4,328.72 - - - - - - - - - - - - - - - - - - 0.1 0.0 - - - -
EBD ONBS Rentals MISBO Non-WECLA Circuits 26,146.84 - - - - - - - - - - - - - - - - - - 1.7 0.0 - - - -
EBD ONBS Connections MISBO Non-WECLA Circuits 14,000.00 - - - - - - - - - - - - - - - - - - 0.9 0.0 - - - -
SMPF New Provides Conns 30.67 - - - - - - - - - - 6.4 2.0 - - 3.2 0.3 - - - - - - - -
SMPF Single Migrations Migrations 17.54 - - - - - - 0.6 0.4 - - - - - - - - - - - - - - - -
SMPF Rentals Rentals 9.83 10.1 4.2 - - - - - - - - 0.1 0.2 - - - - 4.0 0.6 - - - - 0.1 0.1
Other LLU Ancillaries Basket Ancillaries 31.71 - - - - 4.5 2.6 - - - - - - - - - - - - - - - - - -
SMPF Bulk Migrations Migrations 16.01 - - - - - - 0.3 0.2 - - - - - - - - - - - - - - - -
MPF Hard Ceases Ceases 23.32 - - - - - - - - - - - - 0.0 0.0 - - - - - - - - - -
SMPF Hard Ceases Ceases 24.93 - - - - - - - - - - - - 1.8 0.7 - - - - - - - - - -
Other Tie Pair Modifications Ancillaries 58.63 0.2 0.1 - - - - - - - - 0.0 0.0 - - - - - - - - - - 0.0 0.0
Other Tie-cables and Comingling Ancillaries 20.87 0.6 0.3 - - - - - - - - - - - - - - 0.7 0.1 - - - - 0.0 0.0
SMPF Enhanced Care Ancillaries 37.79 - - - - - - - - - - - - - - - - - - - - - - 1.5 0.5
SMPF Expedite Ancillaries 102.60 - - - - - - - - - - - - - - - - - - - - - - 0.8 0.2
WBA Broadband Boost Ancillaries 166.00 - - - - - - - - - - - - - - - - - - - - - - 3.0 -
Other LLU Ancillaries Basket Ancillaries 86.03 0.7 0.3 - - - - - - - - 0.0 0.0 - - - - 0.3 0.0 - - - - 1.2 2.9
ONBS Main Link AISBO WECLA Circuits - - - - - - - - - - - - - - - - - - - - - - - - -
ONBS Main Link MISBO WECLA Circuits 420.00 - - - - - - - - - - - - - - - - - - 0.0 0.0 - - - -
ONBS Main Link AISBO Non-WECLA Circuits 11.07 - - - - - - - - - - - - - - - - - - 0.0 0.0 - - - -
ONBS Main Link MISBO Non-WECLA Circuits 420.00 - - - - - - - - - - - - - - - - - - 0.0 0.0 - - - -
Tie Cables Ancillaries 53.25 1.6 0.7 - - - - - - - - - - - - - - 1.4 0.2 - - - - 0.0 0.0
21CN Backhaul EAD Circuits 3,161.32 - - - - - - - - - - - - - - - - - - 7.9 0.1 - - - -
Time Related Charges Ancillaries 1,140,335.26 0.5 0.1 - - - - - - - - 0.0 0.0 - - - - 0.5 0.1 - - - - - -
Roundings - - - - - - - (0.1) - - 0.1 - - - - - - - - - - - 0.1 -
13.7 5.7 - - 4.5 2.6 0.9 0.5 - - 6.6 2.2 1.8 0.7 3.2 0.3 6.9 1.0 14.2 0.2 - - 6.7 3.7
Volumes 1,023,371 446,921 1,615,874 408,042 287,044 76,114 49,193 14,364 1 150 (ux) (ux) 218,502 43,261 104,019 - 402,980 59,330 870,259 15,197 (ux) (ux) (ux) (ux)
Unit Rentals Rentals Bandwidth Bandwidth Re-grades Re-grades Migrations Migrations Cancellations Cancellations Ceases Ceases Conns Conns Rentals Rentals Bandwidth Bandwidth
Unit Cost (£) 13.42 12.65 - - 15.71 33.71 18.90 36.83 - - (ux) (ux) 8.33 15.06 30.67 - 17.13 16.80 16.34 16.34 (ux) (ux) (ux) (ux)
Total EOI Charge (£m)

Section 11 – Reconciliation Statements
Page 111
Section 11 Reconciliation Statements

Section 11 – Reconciliation Statements
Page 112
11.1 BT Reconciliation Statement 2015
Consolidated profit and loss account
For the year ended 31 March 2015
11.2 BT Reconciliation Statement 2014
Restated consolidated profit and loss account
For the year ended 31 March 2014 (h)

Section 11 – Reconciliation Statements
Page 113
11.3 BT Reconciliation Statement MCE 2015
As at 31 March

Section 12 – Revised Openreach Information
Page 114
Section 12 Revised Openreach Information

Section 12 – Revised Openreach Information
Page 115
12.1 Revised Openreach Information
Openreach Statements
On 22 September 2005, we offered certain undertakings to Ofcom in lieu of a reference under the Enterprise Act 2002 (“the Undertakings”). In accordance with section 5.31 of the Undertakings, our Regulatory Financial Statements need to separately present the financial results of Openreach and include a reconciliation of Openreach’s revenue, operating profit (and other items agreed between us and Ofcom) with the financial information about Openreach as shown in BT Group plc’s Annual Report.
The form, content and basis of preparation of the financial results of Openreach follow, to the fullest extent possible, those used in the preparation of the Current Cost Financial Statements. The reconciliation of that statement to the Openreach segmental financial information as shown in BT Group plc’s Annual Report is shown for the Income Statement below.
Reconciling Differences
The reconciling differences between the Openreach regulatory statement and the Openreach segmental financial information reported in BT Group plc’s Annual Report fall into the following main categories:
a) Basis of preparation under CCA BT Group plc’s Annual Report has been prepared under the Historical Cost Accounting convention, modified for the revaluation of certain financial assets and liabilities at fair value. BT’s Current Cost Financial Statements have been prepared on a CCA basis, in accordance with the Accounting Methodology Documents annually updated. As such, a reconciliation entry has been made to exclude the aggregated CCA adjustments included within the Openreach regulatory statement.
b) Rental charge to Openreach for use of assets owned by BT TSO Within the Openreach segmental financial information reported in BT Group plc’s Annual Report, the results include a charge for an appropriate return on capital where assets are owned by BT TSO (e.g. for line cards, electronics and network features) but are used by Openreach. The Openreach regulatory statements do not include this charge, as the basis for attribution of costs and assets to products in the regulatory accounts is actual costs and assets.
c) Results relating to Northern Ireland’s operations The Current Cost Financial Statements have been prepared in accordance with the Final Statements and Notifications imposed on BT where Ofcom has defined certain markets in which BT is deemed to have SMP in the UK. This definition includes BT’s Northern Ireland operations. The Openreach segmental financial information reported in BT Group plc’s
Annual Report excludes BT’s operations in Northern Ireland. Accordingly, the results of the access network element of BT’s Northern Ireland operations form part of the reconciliation.
d) Other Trading Differences The Openreach segmental financial information reported in BT Group plc's Annual Report reflect the internal charges between BT's lines of business rather than the allocation of actual costs and capital employed as shown in the Current Cost Financial Statements. The other trading differences reflect the total of these timing differences across the year.
e) Non-traded costs Non-traded costs are shown separately from the Openreach segmented results in BT Group plc’s Annual Report. They are included as a separate line to enable reconciliation between the accounts.

Section 12 – Revised Openreach Information
Page 116
12.2 Revised Openreach Income Statement 2015
For the year ended 31 March 2015

Section 12 – Revised Openreach Information
Page 117
12.3 Revised Openreach Income Statement 2014
Restated for the year ended 31 March 2014 (h)

Section 12 – Revised Openreach Information
Page 118
12.4 Revised Openreach MCE Statement 2015
For the year ended 31 March 2015

Section 12 – Revised Openreach Information
Page 119
12.5 Revised Openreach MCE Statement 2014
Restated for the year ended 31 March 2014 (h)

Section 12 – Revised Openreach Information
Page 120
12.6 Reconciliation of Revised Openreach Income Statements
For the year ended 31 March 2015
Restated for the year ended 31 March 2014 (h)

Appendix 1 - Other Information
Page 121
Appendix 1 Other Information

Appendix 1 - Other Information
Page 122
Appendix 1.1 Network Activity Statements Consolidated 2015
For the year ended 31 March 2015

Appendix 1 - Other Information
Page 123
Appendix 1.1 Network Activity Statement Consolidated 2015 (Continued)
For the year ended 31 March 2015

Appendix 1 - Other Information
Page 124
Appendix 1.1 Network Activity Statement Consolidated 2015 (Continued)
For the year ended 31 March 2015

Appendix 1 - Other Information
Page 125
Appendix 1.2 Network Activity Statements Consolidated 2014
Restated for the year ended 31 March 2014 (h)

Appendix 1 - Other Information
Page 126
Appendix 1.2 Network Activity Statements Consolidated 2014 (Continued)
Restated for the year ended 31 March 2014 (h)

Appendix 1 - Other Information
Page 127
Appendix 1.2 Network Activity Statements Consolidated 2014 (Continued)
Restated for the year ended 31 March 2014 (h)

Appendix 2 – Price Control Statement
Page 128
Appendix 2 Price Control Statements

Appendix 2 – Price Control Statement
Page 129
Appendix 2.1 Price Controls in Regulated Markets
This appendix shows an extract from the most recent price control submissions to Ofcom to meet BT’s price control obligations.
Price control summary of calls information submitted to Ofcom.
Basket/sub-basket
RPI between June 2012 and June
2013
Charge Control
Controlling %
Actual Basket Yield
to 30 September
2014
Call Termination 3.2% RPI-87.3% -84.00% £(122.8)m
Call Origination 3.2% RPI+71.7% 75.00% £111.9m
Interconnect 3.2% RPI-3.3% 0.00% £0.04m
Price Control summary of PPC information submitted to Ofcom.
Price control summary of AISBO information submitted to Ofcom.
Submissions for WBA, ISDN2, LLU and WLR were made to Ofcom on 30 June 2015, ahead of the publication of the 2015 RFS. These are shown separately on our website at link http://www.btplc.com/Thegroup/RegulatoryandPublicaffairs/Financialstatements/2015/index.htm
Basket/sub-basket
RPI between
September 2012 and
September 2013 Charge Control Controlling %
Actual Basket Yield 31
March 2015
TI Basket 3.2% RPI+2.25% 1.24% 0.73%
Point of Handover sub-basket 3.2% RPI+0% 3.20% -5.06%
Mobile sub-basket 3.2% RPI+2.25% 5.45% -0.02%
Basket
RPI between
September 2012
and September
2013 Charge Control Controlling %
Price change to 31
March 2015
Price Change to
31 March 2015
Ethernet Services 3.2% RPI-11.5% -8.35% -8.42% £(68.6)m
Ethernet Interconnection Services sub-basket 3.2% RPI-11.5% -8.35% -8.38% £(0.1)m
Ethernet EAD 1Gbit/s Services sub-basket 3.2% RPI-11.5% -8.35% -13.33% £(20.0)m
Sub-cap
GCBI between
September 2012
and September
2013
RPI between
September 2012
and September
2013 Charge Control Controlling % Result
AI WECLA services 3.2% RPI-RPI 0.00% Cap met Cap met
Ethernet All Sub-cap Services 3.2% RPI-RPI 0.00% Cap met Cap met
Accommodation Services 3.2% RPI-RPI 0.00% Cap met Cap met
ECC Services 1.26% GCBI-0% 1.26% Cap met Cap met

Appendix 3 – Adjusted Financial Performance Schedule
Page 130
Appendix 3 Adjusted Financial Performance Schedule

Appendix 3 – Adjusted Financial Performance Schedule
Page 131
Appendix 3.1 Adjusted Financial Performance Schedule
Ofcom’s “Directions for Regulatory Financial Reporting” 30 March 2015 Annex 6 directed BT to prepare the “Adjusted Financial Performance at a market review level” statement in order to show the impact of certain adjustments. Of the adjustments specified, only the following have an impact at a market review (Fixed Access and WBA) level:
Set the NRC of PSTN Line Cards to £715m as from 31 March 2011 and adjusting the NRC for the relevant Asset Volume Elasticity and a 5% cumulative reduction year on year. The impact of this will be within the Fixed Access Markets.
Set the Gross Replacement Cost (“GRC”) of Digital Subscriber Line Access Multiplexer (“DSLAM”) to the current replacement cost of DSLAM and set the NRC:GRC ration at 50% in relation to the following assets:
o Asynchronous Transfer Mode (“ATM”)
o Synchronous Digital Hierarchy (“SDH”)
o DSLAM
And to depreciate the three assets above over a thirteen year period. The impact of this will be within WBA – Market A.
Remove the Other CCA adjustments in the WBA Market.
The purpose of this schedule is to publish BT’s estimate of the impact of Ofcom’s regulatory decisions taken in the Fixed Access and the WBA Market reviews that were not required to be included within the Regulatory Financial Statements.
This schedule does not represent our view of the market returns.

Appendix 3 – Adjusted Financial Performance Schedule
Page 132
Appendix 3.2 Adjusted Financial Performance Schedule 2015
For the year ended 31 March 2015
Revenue HCA Costs
CCA
Adjustments roundings
CCA
Operating
Costs Return MCE
Return on
MCE Revenue
CCA
Operating
Costs Return MCE
Revised
return
Revised
MCE
Impact on
return on
MCE
Revised
Return on
MCE
£m £m £m £m £m £m £m % £m £m £m £m £m £m Δ% %
Fixed Access Markets 3,771 2,715 97 (2) 2,810 961 9,238 10.4 % - - - 465 961 9,703 (0.5) % 9.9 %
Business Connectivity Markets 1,298 716 1 - 717 581 2,452 23.7 % - - - - 581 2,452 - 23.7 %
Narrowband Markets 248 197 7 - 204 44 356 12.0 % - - - - 44 356 - 12.0 %
Wholesale Broadband Markets 381 208 (6) - 202 179 439 40.6 % - 65 (65) 430 114 869 (27.4) % 13.1 %
Total SMP Markets 5,698 3,836 99 (2) 3,933 1,765 12,485 14.2 % - 65 (65) 895 1,700 13,380 (1.5) % 12.7 %
Revenue
CCA
Operating
Costs Return MCE
£m £m £m £m
Adjusted NRC for ATM and ATMW - 12 (12) 97
Adjusted NRC for SDH - 23 (23) 179
Adjusted NRC for DSLAMs - 24 (24) 154
Adjusted NRC for line cards - - - 465
Remove Other CCA Adjustments for WBA - 6 (6) -
- 65 (65) 895
Estimated impacts
Estimated impacts
Revised returnAs reported

Appendix 3 – Adjusted Financial Performance Schedule
Page 133
Appendix 3.3 Adjusted Financial Performance Schedule 2014
Restated for the year ended 31 March 2014 (h)
Revenue HCA Costs
CCA
Adjustments roundings
CCA
Operating
Costs Return MCE
Return
on MCE Revenue
CCA
Operating
Costs Return MCE
Revised
return
Revised
MCE
Impact on
return on
MCE
Revised
Return on
MCE
£m £m £m £m £m £m % £m £m £m £m £m £m Δ% %
Fixed Access Markets 3,784 2,852 (26) (1) 2,825 959 9,415 10.2 % - - - 496 959 9,911 (0.5) % 9.7 %
Business Connectivity Markets 1,404 756 (61) (1) 694 710 2,547 27.9 % - - - - 710 2,547 27.9 %
Narrowband Markets 294 220 10 (2) 228 66 414 15.9 % - - - - 66 414 - 15.9 %
Wholesale Broadband Markets 374 255 (4) (1) 250 124 375 33.2 % - 49 (49) 459 75 834 (24.2) % 9.0 %
Total SMP Markets 5,856 4,083 (81) (5) 3,997 1,859 12,751 14.6 % - 49 (49) 954 1,810 13,705 (1.4) % 13.2 %
Revenue
CCA
Operating
Costs Return MCE
£m £m £m £m
Adjusted NRC for ATM and ATMW - 9 (9) 71
Adjusted NRC for SDH - 15 (15) 125
Adjusted NRC for DSLAMs - 24 (24) 263
Adjusted NRC for line cards - - - 496
Remove Other CCA Adjustments for WBA - 1 (1) -
- 49 (49) 954
Estimated impacts
Estimated impacts
Revised returnAs reported
Appendix 4 – Revised Time Related Charges and Special Fault Investigation Costs
Page 134
Appendix 4 Revised Time Related Charges and Special Fault Investigation Costs

Appendix 4 – Revised Time Related Charges and Special Fault Investigation Costs
Page 135
Appendix 4 Revised Time Related Charges and Special Fault Investigation Costs
Appendix 4.1 Time Related Charges Costs Relating to the Fixed Access Markets 2015 Appendix 4.3 Special Fault Investigation Costs Relating to the Fixed Access Markets 2015For the year ended 31 March 2015 For the year ended 31 March 2015
Volumes (hours) - Billed (exc volume deals) Module Cost per module £m
Normal hours 791,111 Base 27.3
Other hours not available Network 0.9
Sunday/Bank Holiday hours not available Frame 0.1
Total TRC hours 791,111 Internal Wiring 0.4
Internal Equipment 1.5
Co-op 1.4
Total Direct Costs £ per hour 36.60 Frame Direct 0.7
32.3
Appendix 4.2 Time Related Charges Costs Relating to the Fixed Access Markets 2014 Appendix 4.4 Special Fault Investigation Costs Relating to the Fixed Access Markets 2014For the year ended 31 March 2014 For the year ended 31 March 2014
Volumes (hours) - Billed (exc volume deals) Module Cost per module £m
Normal hours 766,310 Base 33.4
Other hours not available Network 1.9
Sunday/Bank Holiday hours not available Frame 0.1
Total TRC hours 766,310 Internal Wiring 0.3
Internal Equipment 1.2
Co-op 1.6
Total Direct Costs £ per hour 37.73 Frame Direct 1.5
40.0
Note - Special Fault Investigation service costs includes all of the cost of the Special Fault Investigation
component and some of the cost of other components e.g. Openreach Sales Product Management and
Revenue Receivables.
Note - Special Fault Investigation service costs includes all of the cost of the Special Fault Investigation
component and some of the cost of other components e.g. Openreach Sales Product Management and
Revenue Receivables.
Note - TRCs are available outside of normal working hours and Sundays and bank holidays. It has not been possible
to split TRC hours into normal, other, and Sunday/Bank holidays for the purposes of this report.
Note - TRCs are available outside of normal working hours and Sundays and bank holidays. It has not been possible
to split TRC hours into normal, other, and Sunday/Bank holidays for the purposes of this report.

Glossary and Footnotes List
Page 136
Glossary and Footnotes List

Glossary and Footnotes List
Page 137
Glossary
21CN 21st Century Network.
Accounting Separation
Accounting Separation provides a systematic disaggregation of costs, revenues and capital employed between disaggregated regulatory entities and services. It ensures that each financial report includes only costs, revenues and capital employed that are relevant to the
regulatory entities and services.
ADSL Asymmetric Digital Subscriber Line.
AI Alternative Interface.
AISBO Alternative Interface Symmetric Broadband Origination.
AMD Accounting Methodology Document. This sets out the detailed processes by which revenues and costs are attributed to the Wholesale markets and services.
Annual Report BT Group plc's Consolidated Group Financial Statements for the year ended 31 March. These are available on the BT website at:
http://www.btplc.com/Sharesandperformance/Annualreportandreview/index.cfm
ATM Asynchronous Transfer Mode.
BES Backhaul Extension Services.
Cct Circuits.
CLZ Central London Zone.
CAT Competition Appeal Tribunal.
Cost accounting A cost accounting system is a set of rules which supports the attribution of costs, revenues and capital employed to individual activities and services.
CC Competition Commission.
CoW Class of Work.
CP Communication Provider.
CPI Consumer Price Index
CPL Carrier Price List.
CSH Customer Sited Handover.
CSI Customer Sited Interconnect.
CTCS Core Transmission Costing System.
Current Cost Accounting
("CCA") adjustments
The change to historical costs arising from the revaluation of assets on a current cost basis. In the statements for individual markets the adjustments comprise the holding gains or losses arising from changes in asset values, together with the effect on asset values and depreciation of the appropriate allocation of current cost asset values between markets and Wholesale services.
(D)LRIC LRIC plus a share of common costs.
DSAC Distributed Stand Alone Costs.
DSLAM Digital Subscriber Line Access Multiplexer.
EAD Ethernet Access Direct.

Glossary and Footnotes List
Page 138
EBD Ethernet Backhaul Direct.
EBITDA Earnings before interest, tax, depreciation and amortisation.
EC European Commission.
ECC Excess Construction Charge.
Eq Equipment units.
EOI Equivalence of Input.
FAC Fully Allocated Cost.
FAMR Fixed Access Market Review.
GBCI General Building Cost Index (GBCI). A national index that measures the costs of construction work including materials and labour
IAS International Accounting Standards.
IBC Intra-Building Circuit.
IEC Interconnection Extension Circuit.
INS Integrated Network System.
IP Internet protocol.
ISH In-Span Handover.
ISI In-Span Interconnect.
Km Kilometres.
Le Local ends.
LLU Local Loop Unbundling.
Line No. of Lines.
m Metres.
Mean capital employed
(“MCE”)
Mean capital employed is defined as total assets less current liabilities, excluding corporate taxes and dividends payable, and provisions other than those for deferred taxation. The mean is computed from the start and end values for the period.
MISBO Multi Interface Symmetric Broadband Origination.
mm Millions of minutes.
MPF Metallic Path Facilities.
n/a Not applicable.
NRC Net Replacement Costs.
NGA Next Generation Access.
Ofcom Office of Communications.
PDH Plesiochronous Digital Hierarchy.
PoH Point of Handover.
PPC Partial Private Circuit.
ppm Pence per Minute.
PWNRCs Profit Weighted Net Replacement Costs.
RAV Regulatory Asset Valuation.

Glossary and Footnotes List
Page 139
RBS Radio Base Station Backhaul.
RFS Regulatory Financial Statements
RPI Retail Price Index
SDH Synchronous Digital Hierarchy.
SMP Significant Market Power.
SMPF Shared Metallic Path Facilities.
TDM Time Division Multiplexing.
TI Traditional Interface.
TISBO Traditional Interface Symmetric Broadband Origination.
Use The proportional bandwidth use of each circuit.
Usage Factors Usage Factors refer to the usage of any network component, including conveyance components.
VoIP Voice over IP.
VULA Virtual Unbundled Local Access.
WBC Wholesale Broadband Connect.
WDM Wave Division Multiplexing.
WECLA Western, Eastern and Central London Area including Slough.
WES Wholesale Extension Services.
WLR Wholesale Line Rental.
0 or - A numerical value of <£0.5m and >£(0.5)m.
<1 A value of below £1m.

Glossary and Footnotes List
Page 140
Footnotes
(a) This component is attributed on a % basis so no volume or unit cost is derivable.
(b) See glossary for volume unit descriptors.
(c) Unit of length is 10 kilometres.
(d) ppm = pence per minute; £/2Mbit cct = £ per 2 Mbit/s circuit; £/km = £ per kilometre; £/100m = £ per 100 metres; £/trans = £ per transaction; £/circuit = £ per circuit; £/ hostel rental = £ per hostel rental; % = % utilisation; £/line = £ per line; £/room = £ per room; £/cable = £ per cable; £/link = £ per link; £/eq = £ per equipment units; £/le = £ per local end; £/conn = £ per connection; £/channel = £ per channel; £/fibre km = £ per fibre km.
(h) See Section 2 - Basis of Preparation for explanation of restatement.
(n) Accounting Separation components require no costs to be disclosed.
(q) This is the total cost, not unit cost, for this component.
(v) Revenues shown are prior to the 'revenue share' between BT and Other Communications Providers.
(y) Unit costs calculated as a weighted average of the 64kbit/s PC link connection circuit provision and 64kbit/s PC link connection circuit rearrangements.
(sx) This service comprises a number of individual prices as indicated by the value of x.
(ux) This service comprises a number of individual volumetrics as indicated by the value of x.
(ao) The price for 64kbit/s enhanced maintenance is weighted to include different 64kbit/s equivalent services.
(ap) Reduction in FAC due to network creditor generated by the EOI charge from Openreach to WBA markets.
(un) This service comprises a large number of volumetrics and prices.
(*) This component is attributed on a % basis so no volume or unit cost is derivable.

Additional Information
Page 141
Additional Information

Additional Information
Page 142
Additional Information
Hard copy versions of the published Current Cost Financial Statements and the Accounting Methodology Documents can be obtained from:
Shareholder helpline
Tel: Freefone 0808 100 4141
Fax: 01903 833371
Textphone: Freefone 0800 169 6907
From outside the UK:
Tel: +44 121 415 7178
Fax: +44 1903 833371
Textphone: +44 121 415 7028
https://help.shareview.co.uk
The Registrar
Equiniti
Aspect House
Spencer Road
Lancing
West Sussex
BN99 6DA
United Kingdom
Website: www.equiniti.com
Electronic copies of the above documents are also available from the following website:
www.btplc.com/Thegroup/RegulatoryandPublicaffairs/Financialstatements/index.htm

![Revised 35% Design Construction Cost Estimate Studies/1 Design Estimate Fish... · Revised 35% Design Construction Cost Estimate ... Ready-To-Advertise [ ] ... SUMMARY REPORTS SUMMARY](https://img.pdfslide.net/doc/110x75/5b31ae777f8b9a2c328cb136/revised-35-design-construction-cost-studies1-design-estimate-fish-revised.jpg)
![Auditors’ report on financial statements prepared in ... 11 (Revised 2016)[1].pdf · RECOMMENDED PRACTICE GUIDE 11 (REVISED 2016) Auditors’ report on financial statements prepared](https://img.pdfslide.net/doc/110x75/5f0c83657e708231d435c77a/auditorsa-report-on-financial-statements-prepared-in-11-revised-20161pdf.jpg)