Embed Size (px)
Citation preview
Revised Environmental Impact Report (REIR)
for the Campus Pointe Project
located at California State University, Fresno
Prepared for:
THE BOARD OF TRUSTEES OF THE CALIFORNIA STATE UNIVERSITY (CSU)
Prepared by:
Michael Brandman Associates 2444 Main Street, Suite 150
Fresno, CA 93721 559.497.0310
August 12, 2011

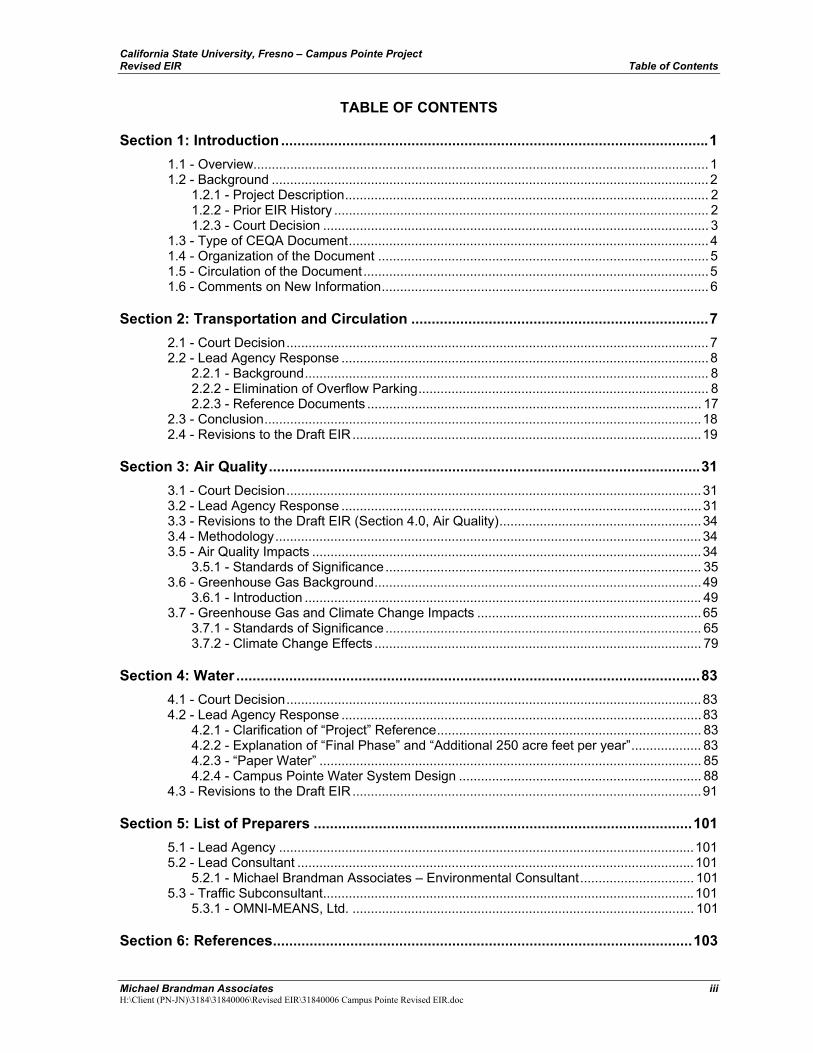
California State University, Fresno – Campus Pointe Project Revised EIR Table of Contents
Michael Brandman Associates iii H:\Client (PN-JN)\3184\31840006\Revised EIR\31840006 Campus Pointe Revised EIR.doc
TABLE OF CONTENTS
Section 1: Introduction .........................................................................................................1 1.1 - Overview............................................................................................................................1 1.2 - Background .......................................................................................................................2
1.2.1 - Project Description................................................................................................... 2 1.2.2 - Prior EIR History ...................................................................................................... 2 1.2.3 - Court Decision ......................................................................................................... 3
1.3 - Type of CEQA Document..................................................................................................4 1.4 - Organization of the Document ..........................................................................................5 1.5 - Circulation of the Document..............................................................................................5 1.6 - Comments on New Information.........................................................................................6
Section 2: Transportation and Circulation .........................................................................7 2.1 - Court Decision...................................................................................................................7 2.2 - Lead Agency Response ....................................................................................................8
2.2.1 - Background.............................................................................................................. 8 2.2.2 - Elimination of Overflow Parking............................................................................... 8 2.2.3 - Reference Documents ........................................................................................... 17
2.3 - Conclusion.......................................................................................................................18 2.4 - Revisions to the Draft EIR...............................................................................................19
Section 3: Air Quality..........................................................................................................31 3.1 - Court Decision.................................................................................................................31 3.2 - Lead Agency Response ..................................................................................................31 3.3 - Revisions to the Draft EIR (Section 4.0, Air Quality).......................................................34 3.4 - Methodology....................................................................................................................34 3.5 - Air Quality Impacts ..........................................................................................................34
3.5.1 - Standards of Significance...................................................................................... 35 3.6 - Greenhouse Gas Background.........................................................................................49
3.6.1 - Introduction ............................................................................................................ 49 3.7 - Greenhouse Gas and Climate Change Impacts .............................................................65
3.7.1 - Standards of Significance...................................................................................... 65 3.7.2 - Climate Change Effects ......................................................................................... 79
Section 4: Water ..................................................................................................................83 4.1 - Court Decision.................................................................................................................83 4.2 - Lead Agency Response ..................................................................................................83
4.2.1 - Clarification of “Project” Reference........................................................................ 83 4.2.2 - Explanation of “Final Phase” and “Additional 250 acre feet per year”................... 83 4.2.3 - “Paper Water” ........................................................................................................ 85 4.2.4 - Campus Pointe Water System Design .................................................................. 88
4.3 - Revisions to the Draft EIR...............................................................................................91
Section 5: List of Preparers .............................................................................................101 5.1 - Lead Agency .................................................................................................................101 5.2 - Lead Consultant ............................................................................................................101
5.2.1 - Michael Brandman Associates – Environmental Consultant............................... 101 5.3 - Traffic Subconsultant.....................................................................................................101
5.3.1 - OMNI-MEANS, Ltd. ............................................................................................. 101
Section 6: References.......................................................................................................103
California State University, Fresno – Campus Pointe Project Table of Contents Revised EIR
iv Michael Brandman Associates
H:\Client (PN-JN)\3184\31840006\Revised DEIR\31840006 Campus Pointe Revised EIR.doc
Appendix A: Traffic and Parking Supporting Information A-1 - Campus Parking Plan A-2 - Mitigation Monitoring Plan from Campus Pointe Final EIR A-3 - Omni-Means Letter – Campus Pointe Traffic Analysis A-4 - 2003 Save Mart Center Traffic Control Plan A-5 - Save Mart Center Event-Specific Traffic Operations Plan
Appendix B: Supporting Air Quality Information Campus Pointe Project
Appendix C: Water Supply C-1 - U.S. Bureau of Reclamation Central Valley Project Water Contract C-2 - Fresno Irrigation District Water Contract C-3 - Additional Water Supply Supporting Information C-4 - Settlement Agreement with the City of Fresno
California State University, Fresno – Campus Pointe Project Revised EIR Table of Contents
Michael Brandman Associates v H:\Client (PN-JN)\3184\31840006\Revised EIR\31840006 Campus Pointe Revised EIR.doc
LIST OF TABLES
Table 1: Weekday Event Parking Statistics 2004–2011 (During Academic Semesters) .......................9 Table 2: Save Mart Center Parking Strategy........................................................................................13 Table 3: SJVAPCD Regional Thresholds.............................................................................................37 Table 4: Construction Emissions (2008) ..............................................................................................39 Table 5: Operational Emissions (Unmitigated).....................................................................................43 Table 6: Rule 9510 On-Site Measures .................................................................................................44 Table 7: Mitigated Operational Emissions (2012) ................................................................................46 Table 8: Local Roadway Air Quality Segment Analysis - Future Plus Project (1 hour and 8 hour
CO concentration) ................................................................................................................47 Table 9: California Greenhouse Gas Emissions Inventory 2000–2006 ...............................................52 Table 10: Greenhouse Gases ..............................................................................................................53 Table 11: Construction Greenhouse Gas Estimates ............................................................................69 Table 12: 2020 Operational Business as Usual Greenhouse Gas Estimates......................................70 Table 13: Project Design Features that Reduce Emissions.................................................................71 Table 14: Greenhouse Gas Emissions (in 2020 with Project Reductions and Regulations) ...............77
LIST OF EXHIBITS
Exhibit 1: Campus Map ........................................................................................................................11

California State University, Fresno – Campus Pointe Project Revised EIR Introduction
Michael Brandman Associates 1 H:\Client (PN-JN)\3184\31840006\Revised EIR\31840006 Campus Pointe Revised EIR.doc
SECTION 1: INTRODUCTION
1.1 - Overview
This document is a Revised Environmental Impact Report (REIR) for the Campus Pointe Project (project). This document is being circulated for public and agency review in order to provide additional information and to comply with an order of the Fresno County Superior Court and the 5th District Court of Appeal in the matter of LandValue 77, LLC, LandValue Management, LLC, and James Huelskamp [collectively, LandValue] v. the Trustees of California State University, Fresno, et al. The Court upheld the adequacy of the project’s Final EIR in all but three discrete areas related to (1) traffic and overflow parking for the Save Mart Center, (2) water, and (3) air quality.
The discussion in this REIR is limited to the environmental impacts of the proposed project in the three areas noted above. In addition, it contains a new section regarding greenhouse gases and climate change impacts due to new CEQA Guidelines (15064.4). The REIR also clarifies information from the Draft EIR (DEIR) and contains additional discussion and analysis based on new information that was not available at the time the Final EIR was prepared.
In preparing the REIR, additional analyses have been performed which are contained in the accompanying appendices. Those studies include an updated analysis of parking needs for Save Mart Center events prepared by Omni-Means in February 2010 as part of the Campus Master Plan (Appendix A-1) and an updated air quality analysis prepared by Michael Brandman Associates in December 2009 and February 2010 using the latest air quality modeling tools and emission factors recommended for use in the San Joaquin Valley by the San Joaquin Valley Air Pollution Control District (Appendix B-2). The REIR also includes other information available regarding the current environmental background and potential impacts of the project, including the City of Fresno 2008 Urban Water Management Plan (UWMP).
The CEQA consultant has performed a comprehensive review of the DEIR and Final EIR and the results of their analysis indicate that there are no other sections outside of those noted above that need to be updated or modified as part of this REIR. None of the information reviewed by the CEQA consultant showed that any new significant environmental impacts would result from the project or from a new mitigation measure proposed to be implemented as part of the project; that no substantial increases in the severity of environmental impacts would result; or that a feasible project alternative or mitigation measure considerably different from others previously analyzed would clearly lessen the environmental impacts of the project.
California State University, Fresno – Campus Pointe Project Introduction Revised EIR
2 Michael Brandman Associates
H:\Client (PN-JN)\3184\31840006\Revised DEIR\31840006 Campus Pointe Revised EIR.doc
1.2 - Background
1.2.1 - Project Description No changes have been made to the project description contained in the DEIR. The proposed project is located adjacent to the southeastern corner of the main Fresno State campus, northeast of the intersection of Shaw Avenue and Chestnut Avenue. The project is a mixed-use commercial development that will include 180,000 square feet of retail and live/work lofts, a 200-room hotel with 10,000 square feet of meeting room space; a 50,000-square-foot, 14-screen theatre; 388 units of multi-family housing; 180 units of senior housing; and required parking facilities. The project scope also includes two future office parcels (160,000 square feet) located west of Chestnut Avenue.
The 144 units of workforce, multi-family rental housing opened for occupancy in July 2009, and the 244 units of student-friendly (basic), multi-family housing units opened for occupancy in June 2010. Construction of the retail and live/work lofts will begin in spring 2012, and construction of the senior housing units will commence in fall 2011. All of the common roads and infrastructure improvements have been completed. Construction of the hotel will begin in 2013. Completion of the entire project (excluding the future office buildings) is projected for 2014–2015. Project components are summarized below.
Retail 150,000 square feet Movie Theater 55,000 square feet; 2,700 seats Offices 190,000 square feet Hotel 145,000 square feet; 240 rooms Senior Housing 180 units Multi-Family Housing (Workforce) 144 units Multi-Family Housing (Basic) 216 units
In addition, the project will provide adequate parking facilities to serve the proposed development. The project will provide approximately 956,000 square feet of floor space and will accommodate an estimated 1,382 residents.
1.2.2 - Prior EIR History A Notice of Preparation (NOP) of the Draft Environmental Impact Report (DEIR) was mailed to state and local agencies, and comments were received between December 22, 2005 and January 24, 2006. The campus held a public scoping meeting on January 12, 2006 to discuss the NOP and the EIR process and to provide the public an opportunity to identify environmental issues that should be addressed. Notices regarding the meeting were mailed to the required state and local agencies and e-mailed to the campus community.
The DEIR was released for public and agency review on September 15, 2006 (State Clearinghouse Number 2005121164). At this time, copies of the DEIR document and technical appendices were
California State University, Fresno – Campus Pointe Project Revised EIR Introduction
Michael Brandman Associates 3 H:\Client (PN-JN)\3184\31840006\Revised EIR\31840006 Campus Pointe Revised EIR.doc
made available to the campus community and the public. The campus held a public hearing on October 12, 2006 to receive comments on the DEIR. The meeting was announced in the Notice of Availability that was included with each copy of the DEIR and was also advertised in the Fresno Bee. The public review period ended on October 30, 2006. Comments were received from 11 public agencies, and three private citizens and organizations.
On May 16, 2007, The Board of Trustees of the California State University certified and approved the Final Environmental Impact Report for the Campus Pointe Project at California State University, Fresno. The Final EIR was then challenged in the Superior Court of the State of California, County of Fresno, on June 14, 2007 by LandValue 77, LLC, LandValue Management, LLC, and James Huelskamp (collectively, LandValue), Superior Court Case Number 07CECG02872. The Court issued a Statement of Decision and Judgment on July 1, 2009. The Fifth District Court of Appeal issued its opinion on the appeal filed by the Plaintiffs and Appellants, as summarized below.
1.2.3 - Court Decision With respect to LandValue’s California Environmental Quality Act (CEQA) challenge, the Court of Appeal and the Superior Court affirmed the adequacy of the project’s Final EIR in all but three discrete areas related to (1) traffic and overflow parking for the Save Mart Center, (2) water, and (3) air quality. The Court of Appeal directed the Superior Court to direct the respondent to:
(1) Set aside the certification of the final EIR
(2) Set aside the approval of the project
(3) Set aside its adoption of findings of fact and statement of overriding considerations to permit the revisions of findings as they relate to the additional review that will be conducted pursuant to the judgment and writ of mandate
(4) Take the action necessary to bring the water supply assessment in the EIR into compliance with CEQA
(5) Take the action necessary to bring the air quality section in the EIR into compliance with CEQA, which action shall include a discussion of the applicability of the San Joaquin Valley Unified Air Pollution Control District Indirect Source Rule (Rule 9510)
The Superior Court Judgment, issued on June 20, 2011 in response to the Court of Appeals ruling, directed the respondent to do the following:
a.) Respondents are to respond to comments made by the City of Fresno concerning the project’s impact on traffic caused by the elimination of overflow parking for the Save Mart Center.
b.) Respondents are to revise their responses to the public’s comments in its water supply analysis to address the inadequacies discussed in the court’s statement of decision and to take
California State University, Fresno – Campus Pointe Project Introduction Revised EIR
4 Michael Brandman Associates
H:\Client (PN-JN)\3184\31840006\Revised DEIR\31840006 Campus Pointe Revised EIR.doc
action necessary to bring the water resources section of the environmental impact report into compliance with CEQA.
c.) Respondents are to discuss the applicability of the San Joaquin Valley Unified Air Pollution Control District Rule 9510 to the project to address the inadequacies discussed in the court’s statement of decision and to take the action necessary to bring the air quality section analysis of the environmental impact report into compliance with CEQA.
1.3 - Type of CEQA Document
The Board of Trustees of the California State University (CSU) has determined that the appropriate response document to address deficiencies identified by the Court of Appeal and the Superior Court is a Revised Environmental Impact Report (REIR). The recirculation of the REIR will address only aspects and phases of this specific development project (CEQA Guidelines Section 15161) and will include information supporting responses to the Court’s specific concerns. The document represents a revision to the May 2007 Final EIR. The REIR will be circulated for public and agency review and will provide additional information to comply with an order of the Fresno County Superior Court.
The CSU will only respond to comments submitted in response to the revised chapters or portions of the REIR in accordance with CEQA Guidelines 15088.5(f)(2). This section states:
When the EIR is revised only in part and the lead agency is recirculating only the revised chapters or portions of the EIR, the lead agency may request that reviewers limit their comments to the revised chapters or portions of the recirculated EIR. The lead agency need only respond to (i) comments received during the initial circulation period that relate to chapters or portions of the document that were not revised and recirculated, and (ii) comments received during the recirculation period that relate to the chapters or portions of the earlier EIR that were revised and recirculated. The lead agency’s request that reviewers limit the scope of their comments shall be included either within the text of the revised EIR or by an attachment to the revised EIR.
After the public comment period, a Final EIR will be compiled and presented to The Board of Trustees of the California State University for certification. The Final EIR will consist of (1) responses to comments received on the REIR, (2) responses to comments on the Draft EIR, and (3)any final revisions and corrections based on comments received. If necessary, revisions to the mitigation monitoring program will also be prepared and included.
California State University, Fresno – Campus Pointe Project Revised EIR Introduction
Michael Brandman Associates 5 H:\Client (PN-JN)\3184\31840006\Revised EIR\31840006 Campus Pointe Revised EIR.doc
1.4 - Organization of the Document
This REIR is organized into the sections listed below.
• Section 1: Introduction. An explanation of project history and type of CEQA document being prepared
• Section 2: Traffic and Circulation. Revisions and updates to portions of the original EIR’s Section 3.0 Traffic and Circulation and associated technical memorandum (updated event parking analysis)
• Section 3: Air Quality. Revisions and updates to portions of the original EIR’s Section 4.0 Air Quality and an additional climate change analysis
• Section 4: Water Supply. Revisions, updates and additional information pertaining to the water analysis portions of the original EIR’s Section 7.0 Public Facilities and Services
1.5 - Circulation of the Document
Under the CEQA Guidelines Section 15088.5(c), if a revision to an EIR is limited to a few chapters or portions of the EIR, the lead agency need only circulate the chapters or portions that have been modified. Additionally, the lead agency requests that, pursuant to the CEQA Guidelines Section 15088.5(f)(2), reviewers of this document limit their comments to the new material that has been included in this recirculation document and not make new comments on matters not included in this document, such as any of the material included in the Final EIR dated May 2007.
Copies of this REIR and the Draft EIR dated September 2006 and the Final EIR dated February 2007 are available for public review at the same locations where the original EIR was made available for public review, including:
California State University, Fresno Auxiliary Corporations 2771 East Shaw Avenue Fresno, California 93710; or
California State University, Fresno, Madden Library (Reference Desk) 5200 North Barton Avenue Fresno, California 93740; or
Website: http://www.auxiliary.com/Assoc/Auxiliary-publicdocs.shtml
Notification that the document is available for review has also been sent to the same parties that received and/or commented on the original EIR.
California State University, Fresno – Campus Pointe Project Introduction Revised EIR
6 Michael Brandman Associates
H:\Client (PN-JN)\3184\31840006\Revised DEIR\31840006 Campus Pointe Revised EIR.doc
1.6 - Comments on New Information
Written comments regarding this recirculated document should be provided no later than September 26, 2011 to the attention of:
Deborah S. Adishian-Astone, Associate Vice President for Auxiliary Operations California State University, Fresno 2771 East Shaw Avenue Fresno, California 93710 Phone: (559) 278-0800 Fax: (559) 278-0989 Email: [email protected]
California State University, Fresno – Campus Pointe Project Revised EIR Transportation and Circulation
Michael Brandman Associates 7 H:\Client (PN-JN)\3184\31840006\Revised EIR\31840006 Campus Pointe Revised EIR.doc
SECTION 2: TRANSPORTATION AND CIRCULATION
2.1 - Court Decision
The Superior Court decision concluded the Draft EIR’s traffic and parking analysis was inadequate in the following areas:
1) Elimination of Overflow Parking In particular, the Superior Court expressed concern that “the elimination of overflow parking, while operating as an immediate, direct positive impact in the form of giving the project the parking that it will require, still might cause an indirect negative impact to transportation in the area surrounding the project if people attending Save Mart Center events were to lose 2,000 spaces of overflow parking to the project.” (Statement of Decision (SOD) at p. 43)
The Superior Court focused on the Lead Agency’s responses to the following two specific comments submitted by the City of Fresno (Comment #8 in the Final EIR) regarding the project’s loss of overflow parking for the Save Mart Center:
The Draft EIR does not explain why the loss of overflow parking will not significantly impact the existing uses and future uses on the Save Mart center site and [the Project] site.
In section 2.0 it states that ‘approximately 11 acres of the project site is used for overflow parking for the adjacent Save Mart Center and provides approximately 2,000 spaces.’ Where will these 2,000 spaces be relocated? It cannot be assumed that all the people using the Campus Pointe will also be attending the major functions at Save Mart. (SOD p. 41)
2) Parking Sharing Arrangement
The Superior Court noted that California State University, Fresno had indicated it had a parking ‘sharing’ arrangement that would address the problem, but that “no explanation could be found in the record detailing the ‘sharing’ arrangement.” (SOD at p. 43)
The Court of Appeal upheld the ruling of the Superior Court on traffic and parking. On June 20, 2011, the Superior Court issued a Judgment and Peremptory Writ of Mandamus directing The Board of Trustees of the California State University to respond to comments made by the City of Fresno concerning the project’s impact on traffic caused by the elimination of overflow parking for the Save Mart Center. Each aspect of the Superior Court’s concerns is addressed in Section 2.2.
California State University, Fresno – Campus Pointe Project Transportation and Circulation Revised EIR
8 Michael Brandman Associates
H:\Client (PN-JN)\3184\31840006\Revised DEIR\31840006 Campus Pointe Revised EIR.doc
2.2 - Lead Agency Response
2.2.1 - Background The Save Mart Center, which opened in 2003, has been very successful in attracting a variety of concerts and sporting events. The Save Mart Center has a dedicated parking lot (North Lot) that is located just north of the building and can accommodate 2,467 vehicles. A portion of the Campus Pointe Project site (approximately 11 acres) has been used for overflow parking (Overflow East Lot). At the beginning of its use, the Overflow East Lot had 1,920 parking stalls, all of which will be eliminated with the full build-out of the Campus Pointe project.
Although the Overflow East Lot will be eliminated, there will be no impact, as it is no longer required for Save Mart Center events. The University and Save Mart Center have made arrangements for accommodating overflow parking needs in other existing campus parking lots. The construction completed to date on the Campus Pointe site has already eliminated most of the Overflow East Lot (approximately 700 parking stalls remain).
Since the issuance of the DEIR, the widening of Chestnut Avenue from Shaw Avenue to Bullard Avenue has been completed, including installation of turn lanes and traffic signal upgrades.
2.2.2 - Elimination of Overflow Parking The specific concerns raised by the City of Fresno regarding the elimination of overflow parking for the Save Mart Center were resolved and agreed upon with the City of Fresno after approval and certification of the Final EIR by The Board of Trustees of the California State University. As stated in the Settlement Agreement with the City of Fresno , “CSU agrees to develop an alternative parking plan for loss of the overflow parking lot on the Campus Pointe building site.” The alternative parking plan has been completed as part of the updated Campus Parking Plan and is included in Appendix A-1.
The overflow parking issue can be synthesized in two basic questions:
(1) Where will people park during large events at the Save Mart Center once the Overflow East Lot is no longer available?
(2) Will the relocation of event parking from the Overflow East Lot to other lots on campus result in new traffic impacts that were not addressed in the Draft EIR?
The basic answers to these questions are that (1) sufficient parking is currently available in existing campus lots to absorb the loss in overflow parking, as described later in this document, and (2) the Traffic Study prepared for the Draft EIR included an analysis of the impact on adjacent roadways and intersections resulting from the relocation of parking from the Overflow East Lot to existing campus lots and this impact was addressed with the application of mitigation measures included in the Draft EIR.
California State University, Fresno – Campus Pointe Project Revised EIR Transportation and Circulation
Michael Brandman Associates 9 H:\Client (PN-JN)\3184\31840006\Revised EIR\31840006 Campus Pointe Revised EIR.doc
Event Parking Needs
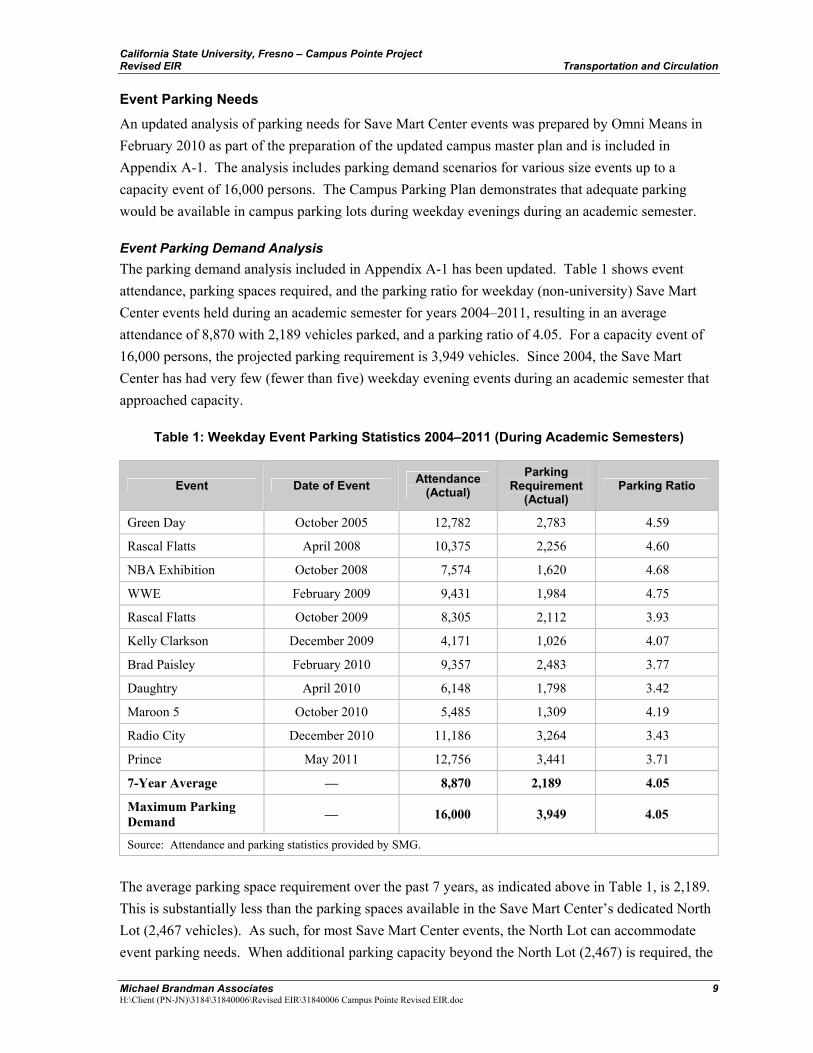
An updated analysis of parking needs for Save Mart Center events was prepared by Omni Means in February 2010 as part of the preparation of the updated campus master plan and is included in Appendix A-1. The analysis includes parking demand scenarios for various size events up to a capacity event of 16,000 persons. The Campus Parking Plan demonstrates that adequate parking would be available in campus parking lots during weekday evenings during an academic semester.
Event Parking Demand Analysis The parking demand analysis included in Appendix A-1 has been updated. Table 1 shows event attendance, parking spaces required, and the parking ratio for weekday (non-university) Save Mart Center events held during an academic semester for years 2004–2011, resulting in an average attendance of 8,870 with 2,189 vehicles parked, and a parking ratio of 4.05. For a capacity event of 16,000 persons, the projected parking requirement is 3,949 vehicles. Since 2004, the Save Mart Center has had very few (fewer than five) weekday evening events during an academic semester that approached capacity.
Table 1: Weekday Event Parking Statistics 2004–2011 (During Academic Semesters)
Event Date of Event Attendance (Actual)
Parking Requirement
(Actual) Parking Ratio
Green Day October 2005 12,782 2,783 4.59
Rascal Flatts April 2008 10,375 2,256 4.60
NBA Exhibition October 2008 7,574 1,620 4.68
WWE February 2009 9,431 1,984 4.75
Rascal Flatts October 2009 8,305 2,112 3.93
Kelly Clarkson December 2009 4,171 1,026 4.07
Brad Paisley February 2010 9,357 2,483 3.77
Daughtry April 2010 6,148 1,798 3.42
Maroon 5 October 2010 5,485 1,309 4.19
Radio City December 2010 11,186 3,264 3.43
Prince May 2011 12,756 3,441 3.71
7-Year Average — 8,870 2,189 4.05
Maximum Parking Demand — 16,000 3,949 4.05
Source: Attendance and parking statistics provided by SMG.
The average parking space requirement over the past 7 years, as indicated above in Table 1, is 2,189. This is substantially less than the parking spaces available in the Save Mart Center’s dedicated North Lot (2,467 vehicles). As such, for most Save Mart Center events, the North Lot can accommodate event parking needs. When additional parking capacity beyond the North Lot (2,467) is required, the
California State University, Fresno – Campus Pointe Project Transportation and Circulation Revised EIR
10 Michael Brandman Associates
H:\Client (PN-JN)\3184\31840006\Revised DEIR\31840006 Campus Pointe Revised EIR.doc
Save Mart Center can use campus Parking Lots A, B, C, J, and V, located just west of the Save Mart Center off Woodrow Avenue.
The University allows the Save Mart Center to share the use of campus parking lots for Save Mart Center events (similar to the arrangement for other campus athletic events), and the Save Mart Center remits a portion of the parking fee collected back to the University in accordance with CSU policy. A reciprocal arrangement exists for the campus to utilize the Save Mart Center North Lot during the weekdays for student general parking at no charge. This arrangement has been in place since the opening of the Save Mart Center in 2003 and will continue into the future.
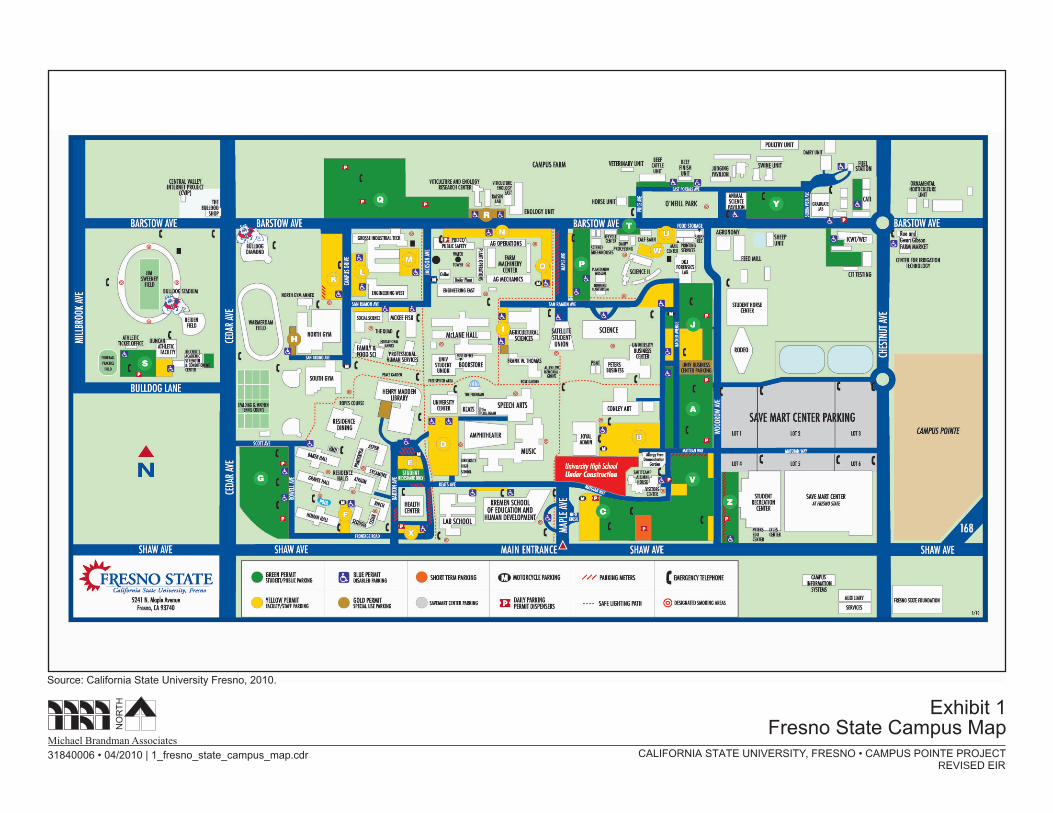
Table 3 below shows how the parking capacity within the various parking lots can be allocated to accommodate a range of event sizes. The total number of available parking spaces in campus Lots A, B, C, J and V is 2,984 spaces, which is significantly more than the original number of parking spaces available in the Overflow East Lot (1,920). The location of these lots is shown on Exhibit 1.
In conclusion, the loss of the Overflow East Lot would not result in a significant impact to existing campus parking facilities or to the surrounding neighborhood community.
Impacts on Student, Staff, and Faculty Access and Parking The University ultimately decides whether or not to host weekday events during an academic semester to avoid conflict with the priority parking needs for academic classes. The Campus Parking Plan in Appendix A-1 includes an analysis of evening parking demand including projected enrollment growth and compares that demand with the parking demand required for Save Mart Center events that may be held at the same time. The results of the analysis indicate that the parking capacity exceeds the parking demand, assuming a capacity Save Mart Center event occurs at the same time as evening classes.
For most weekday (Monday through Thursday) evening events held at the Save Mart Center during an academic semester, the majority of vehicles are parked in the North Lot and, if necessary, Lot V without negatively impacting parking availability for students, faculty, and staff who attend evening classes.
The Traffic Control Plan (Appendix A-4) prepared in 2003 has two different ingress traffic plans to ensure academic traffic access during a large weekday evening event. In addition, an event-specific traffic operational plan (Appendix A-5) is developed for each event, which forecasts traffic and parking requirements based on expected ticket sales, audience demographics, day of the week, and starting time of the event. This event-specific information enables the University to more accurately predict events that will need to implement extra traffic control measures and to match parking needs to the event requirements, maximizing parking utilization and minimizing impacts on student, staff, and faculty access and parking.
31840006 • 04/2010 | 1_fresno_state_campus_map.cdr
Exhibit 1Fresno State Campus Map
Michael Brandman Associates
HN
OR
T
CALIFORNIA STATE UNIVERSITY, FRESNO • CAMPUS POINTE PROJECT REVISED EIR
Source: California State University Fresno, 2010.

California State University, Fresno – Campus Pointe Project Revised EIR Transportation and Circulation
Michael Brandman Associates 13 H:\Client (PN-JN)\3184\31840006\Revised EIR\31840006 Campus Pointe Revised EIR.doc
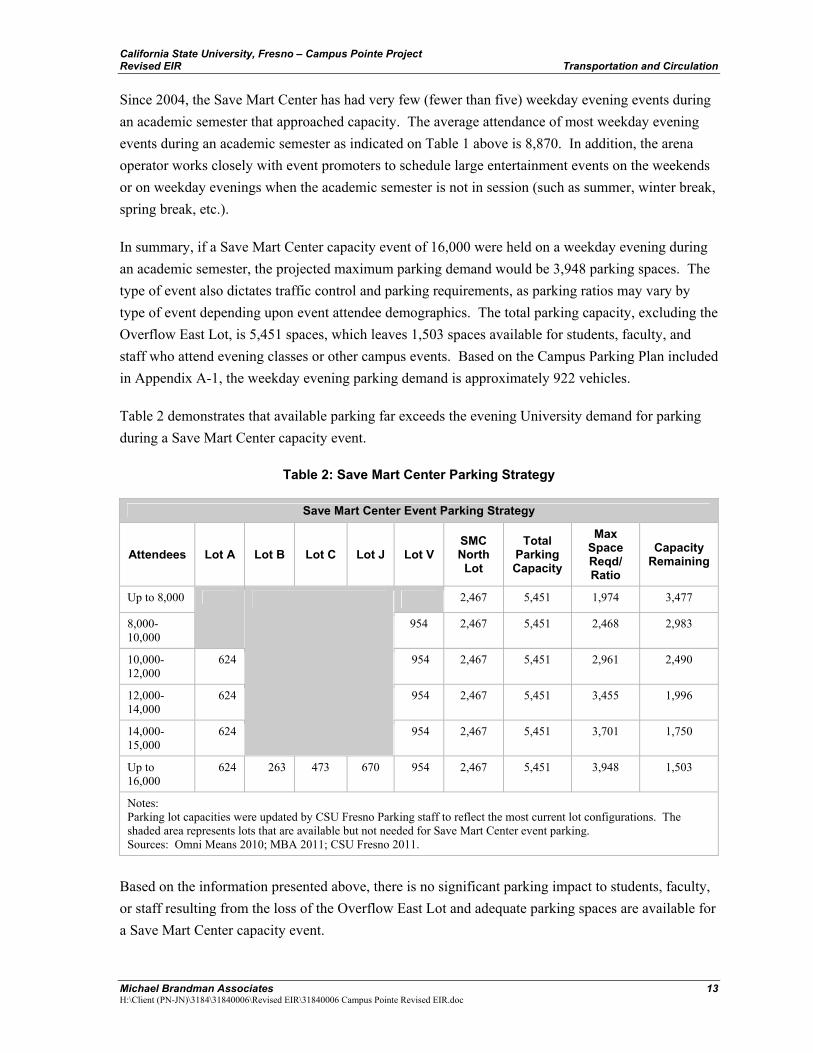
Since 2004, the Save Mart Center has had very few (fewer than five) weekday evening events during an academic semester that approached capacity. The average attendance of most weekday evening events during an academic semester as indicated on Table 1 above is 8,870. In addition, the arena operator works closely with event promoters to schedule large entertainment events on the weekends or on weekday evenings when the academic semester is not in session (such as summer, winter break, spring break, etc.).
In summary, if a Save Mart Center capacity event of 16,000 were held on a weekday evening during an academic semester, the projected maximum parking demand would be 3,948 parking spaces. The type of event also dictates traffic control and parking requirements, as parking ratios may vary by type of event depending upon event attendee demographics. The total parking capacity, excluding the Overflow East Lot, is 5,451 spaces, which leaves 1,503 spaces available for students, faculty, and staff who attend evening classes or other campus events. Based on the Campus Parking Plan included in Appendix A-1, the weekday evening parking demand is approximately 922 vehicles.
Table 2 demonstrates that available parking far exceeds the evening University demand for parking during a Save Mart Center capacity event.
Table 2: Save Mart Center Parking Strategy
Save Mart Center Event Parking Strategy
Attendees Lot A Lot B Lot C Lot J Lot V SMC North Lot
Total Parking Capacity
Max Space Reqd/ Ratio
Capacity Remaining
Up to 8,000 2,467 5,451 1,974 3,477
8,000-10,000
954 2,467 5,451 2,468 2,983
10,000-12,000
624 954 2,467 5,451 2,961 2,490
12,000-14,000
624 954 2,467 5,451 3,455 1,996
14,000-15,000
624
954 2,467 5,451 3,701 1,750
Up to 16,000
624 263 473 670 954 2,467 5,451 3,948 1,503
Notes: Parking lot capacities were updated by CSU Fresno Parking staff to reflect the most current lot configurations. The shaded area represents lots that are available but not needed for Save Mart Center event parking. Sources: Omni Means 2010; MBA 2011; CSU Fresno 2011.
Based on the information presented above, there is no significant parking impact to students, faculty, or staff resulting from the loss of the Overflow East Lot and adequate parking spaces are available for a Save Mart Center capacity event.
California State University, Fresno – Campus Pointe Project Transportation and Circulation Revised EIR
14 Michael Brandman Associates
H:\Client (PN-JN)\3184\31840006\Revised EIR\31840006 Campus Pointe Revised EIR.doc
Impacts on Adjacent Neighborhoods and Commercial Development The Trial Court at page 41 quotes a portion of an internal memo from Darrell Unruh, the planning manager to Nick Yovino, the director of planning for the City of Fresno. The memo stated that “Failure to study the interim scenario and how the project impacts the transportation infrastructure could result in significant unmitigated impacts to adjacent neighborhoods and commercial developments.” As described above, the Save Mart Center parking plan accommodates event parking needs by utilizing capacity available in campus parking lots instead of the Overflow East Lot that will be eliminated with full build-out of the Campus Pointe project. Therefore, no additional impacts on adjacent neighborhoods and commercial development would occur due to the development of the project. The impact is less than significant on neighborhoods and adjacent commercial development from overflow parking.
Roadway Circulation During Events The Court found that based on comments by the City of Fresno, the traffic study did not address the change in roadway circulation with the loss of overflow parking at the Campus Pointe site.
The traffic study included in the DEIR did analyze the shift of traffic with the assumption that vehicles that would have parked in the Overflow East Lot would now park in existing campus lots (Lots A, B, C, J and V) that are located west of the Save Mart Center. The access to these parking lots is off of Woodrow Avenue.
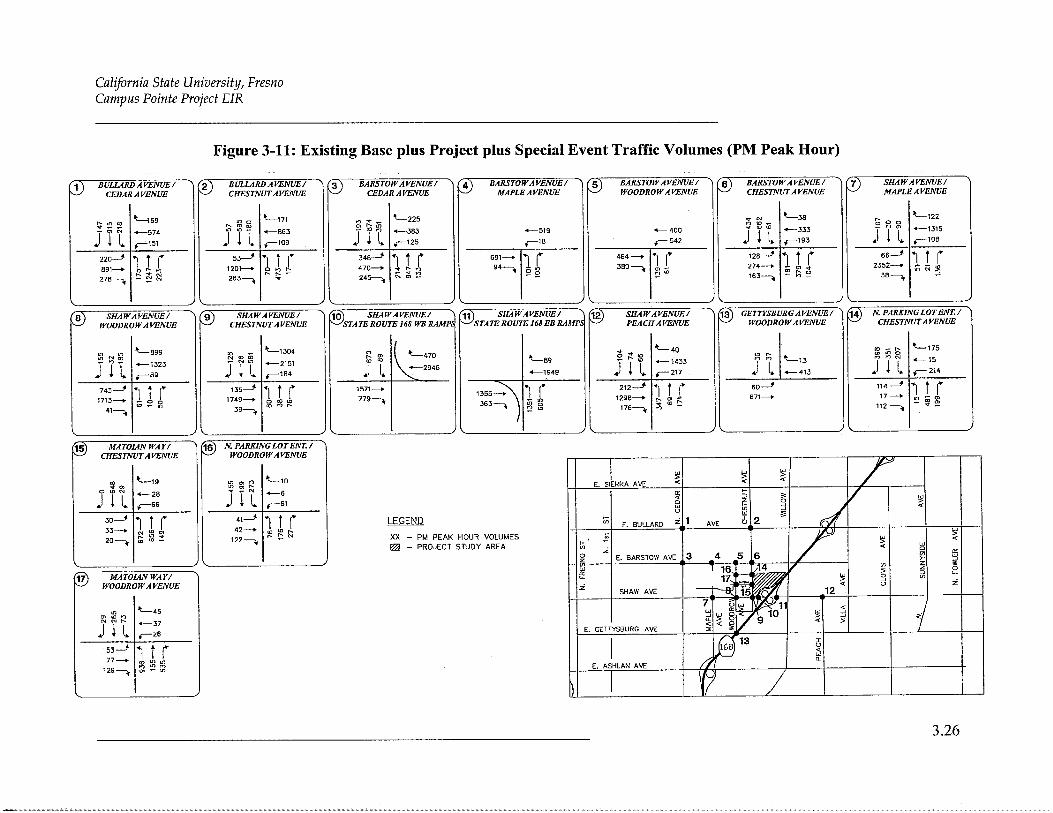
The traffic study also analyzed the addition of 18,000 new vehicle trips anticipated with the completion of the Campus Pointe project along with event traffic. The traffic analysis also assumed a shift in traffic circulation to Woodrow Avenue from Chestnut Avenue. As stated in the traffic study included in the DEIR, there is adequate roadway infrastructure to handle the Campus Pointe project and a capacity Save Mart Center event. The DEIR included a special event traffic study for the Save Mart Center that was derived from PM peak-hour traffic counts taken at intersections studied during the Green Day concert on October 1, 2005. Traffic information was collected at several key intersections in and around the Save Mart Center. From this information, the magnitude of use for the primary access routes to the Save Mart Center was determined. A complete traffic study, including roadway circulation around the Save Mart Center was provided in the Omni Means Traffic Operations Analysis included in the Draft EIR Technical Appendices.
The shift of traffic and parking from Chestnut Avenue as a result of losing the Overflow East Lot to existing campus parking lots off of Woodrow Avenue (campus internal road) was studied and analyzed in the Draft EIR. On page 3.25 of the Draft EIR, “Special Event Traffic Operations,” the traffic consultant stated the following:
The elimination of the entire East lot, and the replacement of this parking in various areas, most likely along Woodrow Avenue, will result in access changes. Most notably will be a shifting of traffic from Chestnut Avenue to Woodrow Avenue, both
California State University, Fresno – Campus Pointe Project Revised EIR Transportation and Circulation
Michael Brandman Associates 15 H:\Client (PN-JN)\3184\31840006\Revised EIR\31840006 Campus Pointe Revised EIR.doc
from the south from Shaw Avenue and from the north to Barstow Avenue. Currently about 33% of the traffic entering the Save Mart Center parking fields is entering through Woodrow Avenue to the North Lot, Lot V and in some cases Lots A and J. The remaining 67% is arriving via driveways along Chestnut Avenue. With the ultimate loss of the East lot (2,000 spaces, 1,700 patrons), 41% of the parking accessible from Chestnut Avenue will be removed which will likely result in a similar shift in access to Woodrow Avenue. Existing Base plus Project plus Special Event peak hour traffic conditions were simulated by superimposing special event trips generated over Existing Base plus Project traffic. The resulting Existing Base plus Project plus Special Event peak hour intersection traffic volumes are shown on Figure 3-11 and the lane geometrics and control shown previously on Figure 3-6. This analysis is worst case and assumes that a sold-out event would start concurrently with the PM peak hour during typical weekday conditions.
As referenced in the DEIR, the widening of Chestnut Avenue was required as a mitigation measure in the Save Mart Center EIR to accommodate the increased volume of daily trips on Chestnut Avenue. The widening of Chestnut Avenue has been completed since the completion of the DEIR (at no cost to the City of Fresno). Chestnut Avenue was widened from two lanes to four lanes, including traffic signal upgrades and intersection improvements from Shaw to Bullard Avenues in coordination with the City of Fresno. Chestnut Avenue is the main access road to the Campus Pointe site.
No additional roadway or intersection mitigation is required other than what was included in the Final Mitigation Monitoring Plan. A copy of the Mitigation Monitoring Plan from the Final EIR that reflects an updated timeframe for each project is included in Appendix A-2. The original Traffic Study analyzed Existing conditions, Existing plus approved/pending Projects Conditions, and Existing plus Project Conditions. Future conditions were also analyzed at Year 2025 Base, Year 2025 Base plus Project, and Year 2025 Base plus Project plus Special Event (worst-case scenario with Save Mart Center traffic and development of the project).
In a March 19, 2010 letter to the University (Appendix A-3), Omni-Means concluded that the traffic counts in and around Campus Pointe site had remained relatively stable and in several locations actually decreased. This confirms the conclusions of the DEIR that traffic impacts during special events will be less than significant with the application of the mitigation measures required of the project.
All roadway and intersection mitigation requirements were included in the Final EIR and have been settled and agreed to with all agencies including the City of Fresno, the City of Clovis, and the California Department of Transportation.
California State University, Fresno – Campus Pointe Project Transportation and Circulation Revised EIR
16 Michael Brandman Associates
H:\Client (PN-JN)\3184\31840006\Revised EIR\31840006 Campus Pointe Revised EIR.doc
Revisions to the Save Mart Center Traffic Control Plan and Parking Plan
A letter dated October 30, 2006 to Mr. Nick Yovino from Mr. Scott Mozier and Mr. Bryan Jones (not from Mr. John Ruiz as stated in the SOD), which was included in the Final EIR and which is cited on page 41 of the SOD, stated the following:
The current Traffic Control Plan for the Save Mart Center will be impacted by this project and will need to be revised by Fresno State or the proposed project and approved by the City of Fresno Traffic Engineering Division prior to occupancy of any buildings. Where will Fresno State be relocating 2,000 parking spaces? How will access be impacted with the project adding approximately 18,000 vehicles per day to the roadway circulation around the Save Mart Center?
In addition, the Superior Court at page 43 indicated that the City of Fresno had identified a traffic/parking problem at a concert that was caused in part by failure to follow through with an existing parking/traffic plan implemented as a mitigation measure for the Save Mart Center. Since opening, the Save Mart Center has made operational improvements to address problems encountered during events held in previous years including increasing traffic control staff, improving traffic routing, and streamlining parking payment collection procedures. In addition, improvements to Chestnut Avenue were completed including the installation of roundabouts at the intersections of Barstow Avenue and Chestnut Avenue and Bulldog Lane and Chestnut Avenue that greatly enhanced traffic flow entering and exiting the Save Mart Center.
In 2003, a comprehensive Traffic Control Plan for the Save Mart Center was prepared by Omni-Means. This document includes diagrams for various event traffic and parking plans depending upon size and day of the week in an effort to mitigate traffic congestion at key intersections for efficient ingress and egress of vehicles (Appendix A-4). The development of the plan included consultation with local law enforcement agencies, city council representatives, and neighboring residential/homeowners associations to ensure event parking did not impact the residential areas south of Shaw Avenue. This is a dynamic plan and the University recognizes that traffic patterns and parking availability will change as the Campus Pointe project develops.
As such, prior to every Save Mart Center event, an event-specific traffic operations plan is developed by the Save Mart Center operator and is reviewed and approved by University Police, who then coordinates with applicable law enforcement agencies. This plan includes estimated attendance, estimated number of vehicles, available parking lots, beginning and ending times of the event, and number of officers needed to control traffic and signalization on city streets and roadways, including the adjacent State Route 168 off-ramp. A sample event-specific plan for the Prince concert that was held on May 18, 2011 has been included in Appendix A-5.
California State University, Fresno – Campus Pointe Project Revised EIR Transportation and Circulation
Michael Brandman Associates 17 H:\Client (PN-JN)\3184\31840006\Revised EIR\31840006 Campus Pointe Revised EIR.doc
With development of the Campus Pointe project and the change of available parking lots, the event-specific plan has been adjusted as necessary to reflect the shift in traffic circulation and access to parking areas depending upon the estimated attendance for each event.
The CSU responded to this specific comment on page 121 of the Final EIR (Comment #9) as follows:
The Traffic Management Plan (TMP) will be continually updated as the campus master plan is implemented and new events are planned at the Save Mart Center and other campus venues. The City of Fresno will continue to be involved in the amendment, monitoring, and enforcement of the TMP. The City would request that an agreement be made between Fresno State, Save Mart Center operators, and the City of Fresno that the future Traffic Control Plan be followed during major events. Failure to prepare and have an approved new traffic control plan prior to occupancy of Campus Pointe buildings and closure of 2,000 parking space overflow will result in significant unmitigated impacts.
In accordance with the Settlement Agreement with the City of Fresno and the CSU (Appendix C-4), the University will continue to convene the Traffic Management Committee to address any traffic related issues. The Agreement stated that “The CSU agrees to continue to invite representatives from the City of Fresno, the City of Clovis, Cal Trans, the California Highway Patrol, and other local agencies to meetings of the Traffic Management Committee. The Committee will continue to meet regularly for the purpose of ensuring coordination and mitigation of vehicular and pedestrian traffic and parking impacts caused by Campus Pointe and Save Mart Center events. Each agency represented will appoint designees with sufficient authority to make decisions on behalf of the entity he or she represents.” This fully complies with the City of Fresno’s request and provides a forum to handle any traffic and parking issues that may arise in the future.
Based on the clarification and supplemental information provided herein, the project would not result in significant traffic and parking impacts because of the relocation of parking from the Overflow East Lot.
2.2.3 - Reference Documents The REIR makes reference to several plans and agreements.
The Settlement Agreement refers to an agreement reached between The Board of Trustees of the California State University, John D. Welty, California State University Association, Inc., Kashian Enterprises, L.P. (collectively the “Respondents”) and the City of Fresno to settle an action filed by the City of Fresno in the Fresno County Superior Court (Case No. 07 CE CG 01148, entitled City of Fresno v. Board of Trustees of the California State University.) The City filed an Amended Petition for Writ of Mandate and Complaint for Declaratory, Injunctive Relief and Attorney’s Fees in the Action on August 17, 2007. The provisions related to parking in the Settlement Agreement require
California State University, Fresno – Campus Pointe Project Transportation and Circulation Revised EIR
18 Michael Brandman Associates
H:\Client (PN-JN)\3184\31840006\Revised EIR\31840006 Campus Pointe Revised EIR.doc
CSU to develop an alternative parking plan for the loss of the Overflow East Lot on the Campus Pointe building site. The provision related to traffic management requires CSU to continue operating the Traffic Management Committee that will meet regularly, with the purpose of mitigating the vehicular and pedestrian traffic and parking impacts caused by Campus Pointe and Save Mart Center events.
The original Traffic Control Plan was developed by Omni Means in 2003 and provides general guidance for addressing traffic and parking impacts from Save Mart Center Events (Appendix A-4). Utilizing this plan, University Police - in consultation with the arena operator - prepare an event specific traffic operations plan for each event held at the Save Mart Center (Appendix A-5). This event-specific Traffic Operations Plan was referred to as the Traffic Control Plan in the SOD at page 41.
The Campus Parking Plan (Appendix A-1) refers to a document prepared to provide long-term planning for future parking requirements for the entire campus.
2.3 - Conclusion
The traffic and overflow parking information included earlier in this section provides further clarification to the analysis. No new or changed circumstances have occurred within the project traffic study area that have resulted in or are likely to result in significant new traffic and parking impacts, or impacts greater than those identified in the EIR.
California State University, Fresno – Campus Pointe Project Revised EIR Transportation and Circulation
Michael Brandman Associates 19 H:\Client (PN-JN)\3184\31840006\Revised EIR\31840006 Campus Pointe Revised EIR.doc
2.4 - Revisions to the Draft EIR
Revisions and additions to portions of Section 3.0 (Traffic and Transportation) from the Draft EIR have been made to reflect existing conditions and to provide clarifications. All additions to the text are underlined (underlined) and all deletions from the text have been stricken (stricken). Footnotes have been added to provide additional explanation and clarification.

California State University, Fresno – Campus Pointe Project Revised EIR Transportation and Circulation
Michael Brandman Associates 21 H:\Client (PN-JN)\3184\31840006\Revised EIR\31840006 Campus Pointe Revised EIR.doc
Section 3.0 Pages 3-1 - 3-3
Existing Conditions Roadways that provide primary access to/from the project site include State Route 168, Shaw Avenue, Chestnut Avenue, Cedar Avenue, Maple Avenue, Woodrow Avenue, Willow Avenue, Bullard Avenue, and Barstow Avenue.
State Route 168 is generally a north-south freeway offering connections between the Cities of Clovis and Fresno. Near the project site State Route 168 has a concrete median that separates the roadway section into 3 travel lanes per direction. Primary access to and from the project site is at the Shaw Avenue northbound and southbound on- and off-ramps. Shaw Avenue is a 6-lane divided arterial that travels in an east-west direction and acts as the primary corridor between Clovis and Fresno. Near the frontage of the project, on-street parking is not allowed. As a result of Save Mart Center traffic mitigation, funding has been approved for improvements at the Shaw Avenue/Woodrow Avenue intersection; specifically, a dedicated westbound right turn lane on Shaw Avenue will be constructed. Chestnut Avenue is a 2 4-lane roadway that travels in a north-south direction near the project site. On-street parking is not permitted within the project study area. Chestnut Avenue will serve as one of the primary access routes to the project site from the North, providing direct access to the project for traffic approaching from all directions. As a result of Save Mart Center traffic mitigation, funding has been was approved for improvements along Chestnut Avenue between Shaw Avenue and Bullard Avenue. Specifically, Chestnut Avenue will be was widened to 4-lanes and will include now includes roundabouts at Barstow Avenue, and at the Save Mart Center North Parking Lot Entrance at Bulldog Lane. The proposed roundabout at Matoian Avenue and Chestnut Avenue was not constructed as it was too close to the Shaw/Chestnut interchange. Because these improvement projects were constructed prior to the Campus Pointe development, all the Existing plus Project and future condition scenarios each assumed that the Chestnut Avenue improvements was were in place. Cedar Avenue is a 4-lane divided arterial that travels in a north-south direction. This roadway contains bicycle lanes and curbed shoulders. Primary intersections along Cedar Avenue are controlled by traffic signals with single and dual left turn lanes. Maple Avenue is a 2-lane roadway that runs in north-south direction. Maple Avenue serves the University with access at both Shaw Avenue and Barstow Avenue. Woodrow Avenue is basically a 2-lane roadway that runs in north-south direction. Through the entire length of Woodrow Avenue specialized turn lanes are provided to increase accessibility and capacity at the intersections with Shaw and Barstow Avenues as well as at internal campus intersections. Woodrow Avenue also servesd as an important route to the University via providing an alternative connection
California State University, Fresno – Campus Pointe Project Transportation and Circulation Revised EIR
22 Michael Brandman Associates H:\Client (PN-JN)\3184\31840006\Revised EIR\31840006 Campus Pointe Revised EIR.doc
between Shaw Avenue and Barstow Avenue serving to alleviateing traffic congestion during the re-construction of Chestnut Avenue and Shaw Avenue intersection. Bullard Avenue is a 4-lane east-west arterial that is located 1 mile north of Shaw Avenue. The primary intersections are controlled by traffic signals with single or dual left turning movements. Barstow Avenue is a 2-lane roadway that travels in an east-west direction. Barstow Avenue is located 2 mile north of Shaw Avenue. Barstow Avenue provides east-west circulation for the University and accesses several parking lots. Willow Avenue is a multi-lane north-south arterial roadway that traverses through the City of Clovis, the County of Fresno, and the City of Fresno. Near Shaw Avenue, Willow Avenue has three northbound lanes and two southbound lanes. Willow Avenue primarily serves commercial business near Shaw Avenue. The Save Mart Center mitigation plan included funding for major intersection improvements at Willow Avenue and Bullard Avenue, these improvements are now under design under the direction of the City of Fresno. The Save Mart Center mitigation plan included funding for major intersection improvements at Willow Avenue and Bullard Avenue, these improvements are now under design under the direction of the City of Fresno.
In addition, all tables should have the following footnote: Roundabout at Chestnut and Matoian not All-Way Stop Control (AWSC)
Section 3.0 Pages 3-30 - 3-36
Special Event Traffic Operations Analysis (With Chestnut Avenue Improvements) Special event traffic for the Save Mart Center was derived from PM peak hour traffic counts taken at study intersections during the Green Day concert on October 1, 2005. Traffic information was collected at several key intersections in and around the Save Mart Center. From this information, the magnitude of use for the primary access routes to the Save Mart Center was determined. The Green Day concert was well short of capacity (12,782 attendees, with capacity of approximately 16,000) and the parking statistics verified this. The total occupancy of all event center parking lots was 2,723 parking stalls, compared to the available 5,244 parking stalls. In order to obtain the traffic impacts anticipated at a sold-out event, the special event traffic was adjusted. In June 2003, Shania Twain drew a near capacity crowd of 15,301. While actual count data was not available for that event, aerial surveys were available, and the Save Mart operator reports that there were 4,681 vehicles parked on campus (plus an additional 300 for employees). The ratio of event patrons to parked vehicles was 3.3 (15,301/4,681) which is close to original estimate of 3.0. 1It is possible that some patrons are parking 1 For most weekday (Mon-Thurs) evening events held at the Save Mart Center (during the academic semester) the majority of vehicles are parked in the North Lot and, if necessary, Lot V without negatively impacting parking availability for students, faculty, and staff who attend evening classes. The Traffic Control Plan has two different ingress traffic plans to ensure academic traffic access during a large weekday evening events. In 2008, there were only two (2) weekday evening events that occurred during the academic semester: Rascal Flatts on April 9, 2008 (10,375 attendees; 2,256 vehicles parked) and an NBA Exhibition Basketball game on October 9, 2008 (7,574 attendees; 1,620 vehicles parked). The capacity of the Save Mart Center North Lot was
California State University, Fresno – Campus Pointe Project Revised EIR Transportation and Circulation
Michael Brandman Associates 23 H:\Client (PN-JN)\3184\31840006\Revised EIR\31840006 Campus Pointe Revised EIR.doc
outside the university, and while not included within the parking statistics, would be found in the collected Green Day traffic counts, particularly at Shaw Avenue and Chestnut Avenue, and the State Route 168 interchange ramps. Because the Shania Twain event was near capacity, data from the Green Day concert was factored to the capacity capability of approximately 16,000, which resulted in an anticipated total vehicle load of 5,155. Typically for concert events, 60% of the arrivals occur in the hour preceding the event start.
The Campus Pointe project will result in the displacement of the entire East Lot; although, this displacement will occur in two phases. The first phase will remove all parking from the extension of Matoian Way to the north (approximately 1,200 spaces). The result of phase one will be the availability of around 800 spaces in the East lot, potentially 300 for employees). Phase one is expected to begin in summer 2006. Phase two will occur at a yet undetermined time. The elimination of the entire East lot, and the replacement of this parking in various areas, most likely along Woodrow Avenue, will result in access changes. Most notably will be a shifting of traffic from Chestnut Avenue to Woodrow Avenue, both from the south from Shaw Avenue and from the north to Barstow Avenue. Currently about 33% of the traffic entering the Save Mart Center parking fields is entering through Woodrow Avenue to the North Lot, Lot V and in some cases Lots A and J. The remaining 67% is arriving via driveways along Chestnut Avenue. With the ultimate loss of the East lot (2,000 spaces, 1,700 patrons), 41% of the parking accessible from Chestnut Avenue will be removed which will likely result in a similar shift in access to Woodrow Avenue. “Existing Base plus Project plus Special Event” peak hour traffic conditions were simulated by superimposing special event trips generated over “Existing Base plus Project” traffic. The resulting ”Existing Base plus Project plus Special Event” peak hour intersection traffic volumes are shown on Figure 3-11 and the lane geometrics and control shown previously on Figure 3-6. This analysis is worst case and assumes that a sold-out event would start concurrently with the PM peak hour during typical weekday conditions.
adequate to handle both events and no overflow parking was required. In addition, the operator of the Save Mart Center works closely with promoters to schedule large concert events on the weekends or on weekday evenings when the academic semester is not in session (i.e. summer, winter break, spring break, etc.).
California State University, Fresno – Campus Pointe Project Revised EIR Transportation and Circulation
Michael Brandman Associates 25 H:\Client (PN-JN)\3184\31840006\Revised EIR\31840006 Campus Pointe Revised EIR.doc
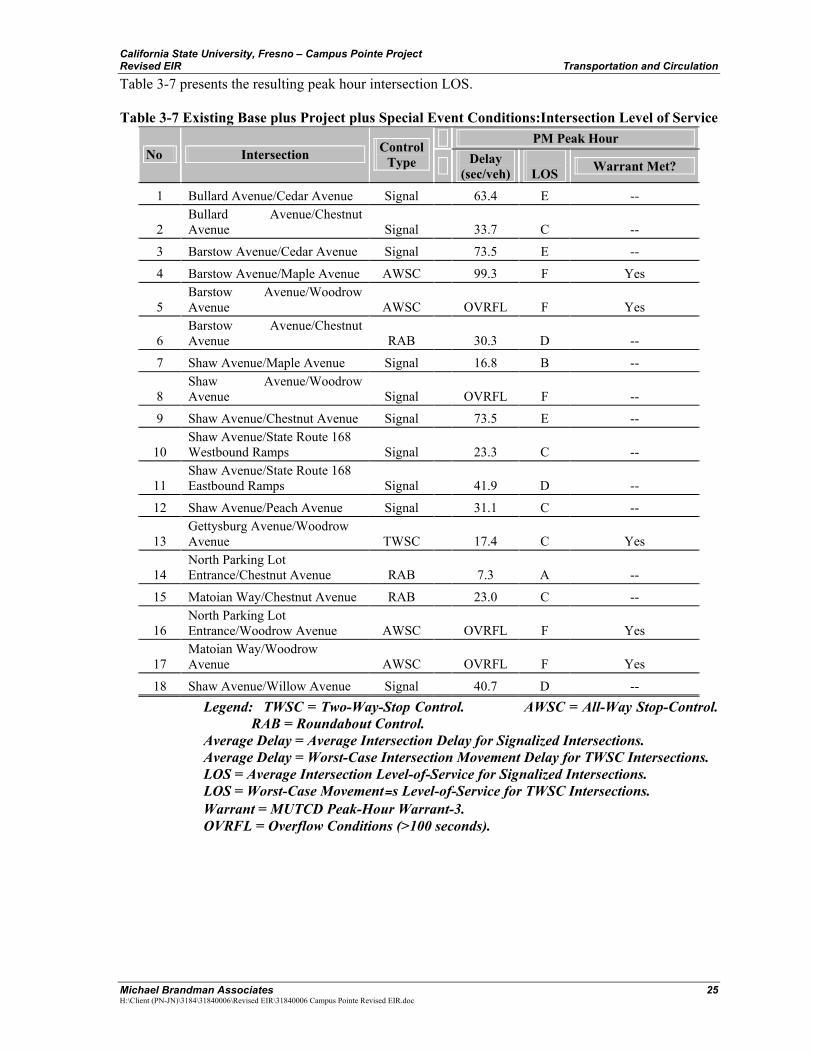
Table 3-7 presents the resulting peak hour intersection LOS. Table 3-7 Existing Base plus Project plus Special Event Conditions:Intersection Level of Service
PM Peak Hour No Intersection Control
Type Delay (sec/veh)
LOS Warrant Met?
1 Bullard Avenue/Cedar Avenue Signal 63.4 E --
2 Bullard Avenue/Chestnut Avenue Signal 33.7 C --
3 Barstow Avenue/Cedar Avenue Signal 73.5 E --
4 Barstow Avenue/Maple Avenue AWSC 99.3 F Yes
5 Barstow Avenue/Woodrow Avenue AWSC OVRFL F Yes
6 Barstow Avenue/Chestnut Avenue RAB 30.3 D --
7 Shaw Avenue/Maple Avenue Signal 16.8 B --
8 Shaw Avenue/Woodrow Avenue Signal OVRFL F --
9 Shaw Avenue/Chestnut Avenue Signal 73.5 E --
10 Shaw Avenue/State Route 168 Westbound Ramps Signal 23.3 C --
11 Shaw Avenue/State Route 168 Eastbound Ramps Signal 41.9 D --
12 Shaw Avenue/Peach Avenue Signal 31.1 C --
13 Gettysburg Avenue/Woodrow Avenue TWSC 17.4 C Yes
14 North Parking Lot Entrance/Chestnut Avenue RAB 7.3 A --
15 Matoian Way/Chestnut Avenue RAB 23.0 C --
16 North Parking Lot Entrance/Woodrow Avenue AWSC OVRFL F Yes
17 Matoian Way/Woodrow Avenue AWSC OVRFL F Yes
18 Shaw Avenue/Willow Avenue Signal 40.7 D -- Legend: TWSC = Two-Way-Stop Control. AWSC = All-Way Stop-Control.
RAB = Roundabout Control. Average Delay = Average Intersection Delay for Signalized Intersections. Average Delay = Worst-Case Intersection Movement Delay for TWSC Intersections. LOS = Average Intersection Level-of-Service for Signalized Intersections. LOS = Worst-Case Movement=s Level-of-Service for TWSC Intersections. Warrant = MUTCD Peak-Hour Warrant-3. OVRFL = Overflow Conditions (>100 seconds).
California State University, Fresno – Campus Pointe Project Transportation and Circulation Revised EIR
26 Michael Brandman Associates H:\Client (PN-JN)\3184\31840006\Revised EIR\31840006 Campus Pointe Revised EIR.doc
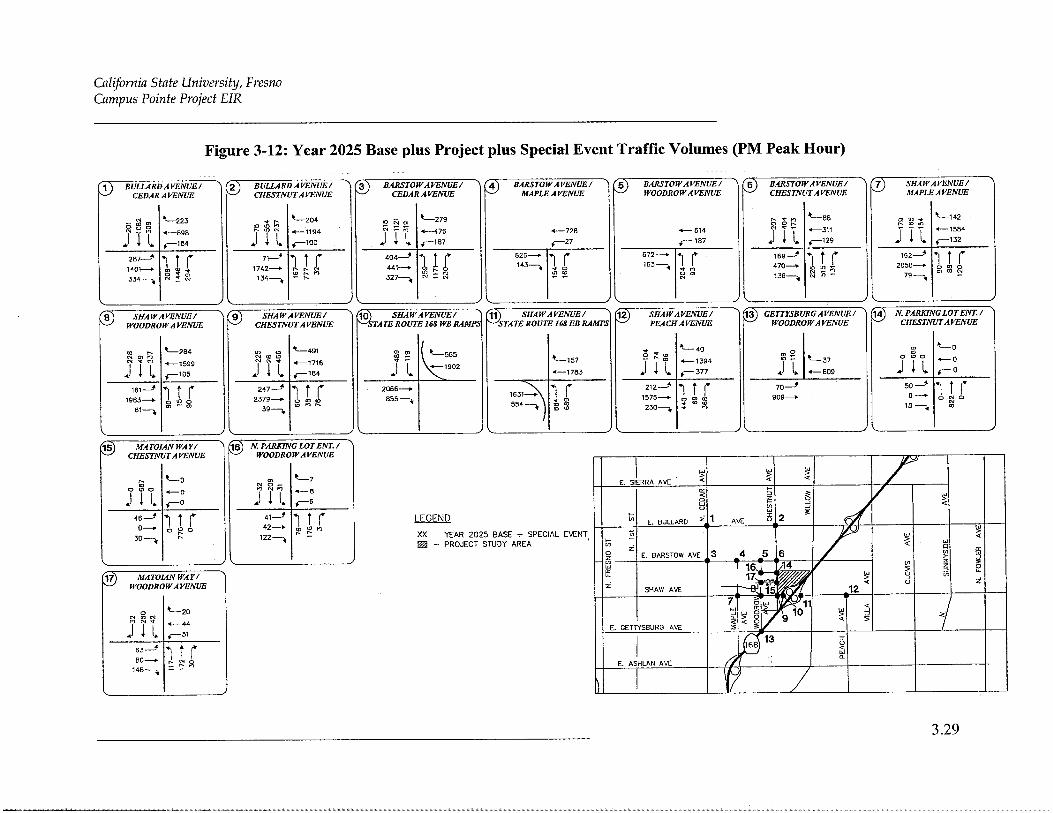
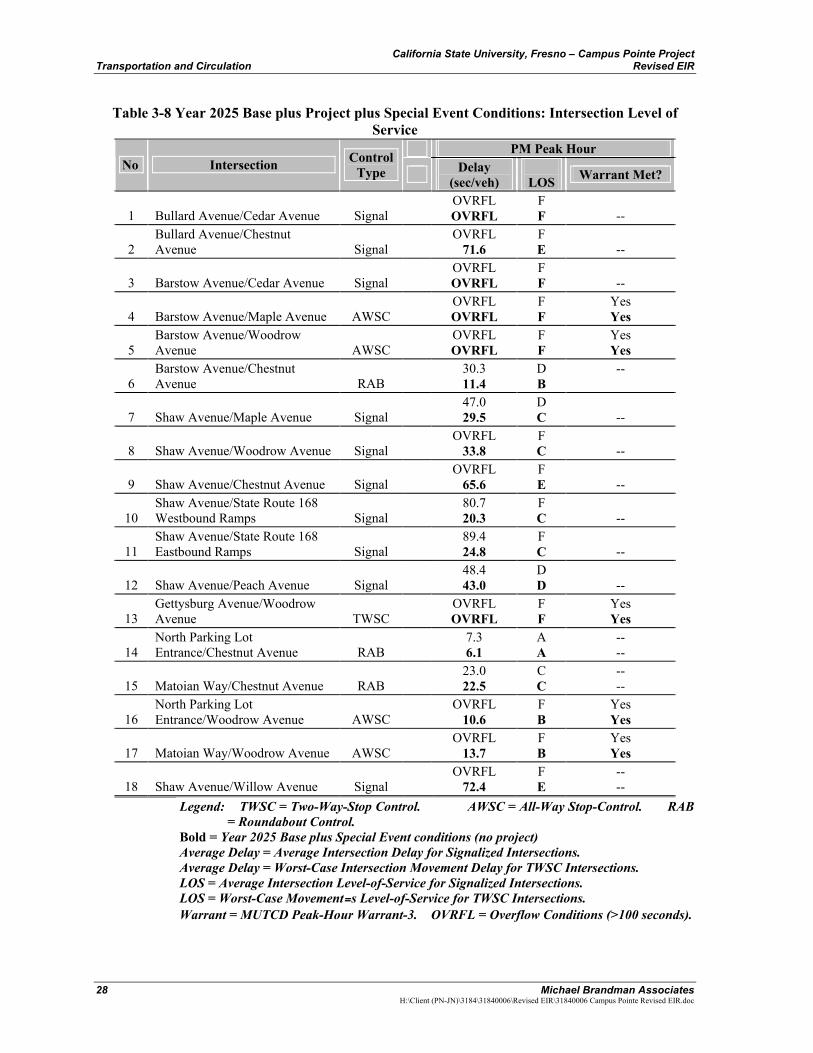
As shown in Table 3-7, eight study intersections are projected to operate at a LOS “E” or worse conditions during the PM peak hour period under AExisting Base plus Project plus Special Event@ scenario. The intersections located at Barstow Avenue/Maple Avenue, Barstow Avenue/Woodrow Avenue, Gettysburg Avenue/Woodrow Avenue, North Parking Lot Entrance/Woodrow Avenue, and Matoian Way/Woodrow Avenue are projected to meet the MUTCD Peak-Hour Volume Warrant 3 (Urban Areas) under “Existing Base plus Project plus Special Event” PM peak hour conditions. Year 2025 Base plus Project plus Special Event Conditions “Year 2025 Base plus Project plus Special Event” peak hour traffic conditions were simulated by superimposing special event trips generated over ”Year 2025 Base plus Project” traffic at the study intersections. The resulting ”Year 2025 Base plus Project plus Special Event” peak hour intersection traffic volumes are shown on Figure 3-12. As with ”Existing plus Project plus Special Event” conditions, this scenario assumes a worst case scenario by assuming a sold-out event would start during the PM peak hour. In addition, an analysis without the proposed project was also included for comparative purposes. Table 3-8 presents the resulting peak hour intersection LOS. As shown in Table 3-8, 13 study intersections are projected to operate at a LOS ”F” conditions during the PM peak hour period under ”Year 2025 Base plus Project plus Special Event” scenario. In addition, the intersections located at Barstow Avenue/Maple Avenue, Barstow Avenue/Woodrow Avenue, Gettysburg Avenue/Woodrow Avenue, North Parking Lot Entrance/Woodrow Avenue, and Matoian Way/Woodrow Avenue are projected to meet the MUTCD Peak-Hour Volume Warrant 3 (Urban Areas) under ”Year 2025 Base plus Project plus Special Event” PM peak hour conditions. Without the impacts associated with the project, eight study intersections are projected to operate at LOS ”E” or worse under ”Year 2025 Base plus Special Event” conditions. In addition, the intersections located at Barstow Avenue/Maple Avenue, Barstow Avenue/Woodrow Avenue, Gettysburg Avenue/Woodrow Avenue, North Parking Lot Entrance/Woodrow Avenue, and Matoian Way/Woodrow Avenue are projected to meet the MUTCD Peak-Hour Volume Warrant 3 (Urban Areas) under AYear 2025 Base plus Special Event@ PM peak hour conditions. All mitigation measures are identified in a subsequent sub-section. It should be noted, however, that mitigation measures for special event traffic have not been developed. Mitigation measures for special event traffic are not feasible; only mitigation for ”normal” anticipated peak hour traffic has been developed.2
2 As referenced in the Draft EIR, widening of Chestnut Avenue was required as a mitigation measure in the Save Mart Center EIR to accommodate the increased volume of daily trips on Chestnut Avenue. The widening of Chestnut Avenue was recently completed, increasing its width from two lanes to four lanes including traffic signal upgrades and intersection improvements from Shaw to Bullard Avenues in coordination with the City of Fresno. Chestnut Avenue is the main access to the Campus Pointe site and the Save Mart Center’s Traffic Control Plan has been updated to reflect the recent improvements to Chestnut Avenue.
California State University, Fresno – Campus Pointe Project Transportation and Circulation Revised EIR
28 Michael Brandman Associates H:\Client (PN-JN)\3184\31840006\Revised EIR\31840006 Campus Pointe Revised EIR.doc
Table 3-8 Year 2025 Base plus Project plus Special Event Conditions: Intersection Level of
Service PM Peak Hour
No Intersection Control Type Delay
(sec/veh)
LOS Warrant Met?
1 Bullard Avenue/Cedar Avenue Signal OVRFL OVRFL
F F --
2 Bullard Avenue/Chestnut Avenue Signal
OVRFL 71.6
F E --
3 Barstow Avenue/Cedar Avenue Signal OVRFL OVRFL
F F --
4 Barstow Avenue/Maple Avenue AWSC OVRFL OVRFL
F F
Yes Yes
5 Barstow Avenue/Woodrow Avenue AWSC
OVRFL OVRFL
F F
Yes Yes
6 Barstow Avenue/Chestnut Avenue RAB
30.3 11.4
D B
--
7 Shaw Avenue/Maple Avenue Signal 47.0 29.5
D C --
8 Shaw Avenue/Woodrow Avenue Signal OVRFL
33.8 F C --
9 Shaw Avenue/Chestnut Avenue Signal OVRFL
65.6 F E --
10 Shaw Avenue/State Route 168 Westbound Ramps Signal
80.7 20.3
F C --
11 Shaw Avenue/State Route 168 Eastbound Ramps Signal
89.4 24.8
F C --
12 Shaw Avenue/Peach Avenue Signal 48.4 43.0
D D --
13 Gettysburg Avenue/Woodrow Avenue TWSC
OVRFL OVRFL
F F
Yes Yes
14 North Parking Lot Entrance/Chestnut Avenue RAB
7.3 6.1
A A
-- --
15 Matoian Way/Chestnut Avenue RAB 23.0 22.5
C C
-- --
16 North Parking Lot Entrance/Woodrow Avenue AWSC
OVRFL 10.6
F B
Yes Yes
17 Matoian Way/Woodrow Avenue AWSC OVRFL
13.7 F B
Yes Yes
18 Shaw Avenue/Willow Avenue Signal OVRFL
72.4 F E
-- --
Legend: TWSC = Two-Way-Stop Control. AWSC = All-Way Stop-Control. RAB = Roundabout Control.
Bold = Year 2025 Base plus Special Event conditions (no project) Average Delay = Average Intersection Delay for Signalized Intersections. Average Delay = Worst-Case Intersection Movement Delay for TWSC Intersections. LOS = Average Intersection Level-of-Service for Signalized Intersections. LOS = Worst-Case Movement=s Level-of-Service for TWSC Intersections. Warrant = MUTCD Peak-Hour Warrant-3. OVRFL = Overflow Conditions (>100 seconds).
California State University, Fresno – Campus Pointe Project Revised EIR Transportation and Circulation
Michael Brandman Associates 29 H:\Client (PN-JN)\3184\31840006\Revised EIR\31840006 Campus Pointe Revised EIR.doc
Special Event Conditions With the development of the Campus Pointe project, a large portion of the Save Mart Center Parking will be shifted to existing parking lots located west of Woodrow Avenue adjacent to the Save Mart Center. A traffic control plan was prepared with the opening of the Save Mart Center to minimize traffic congestion at key intersections prior to the start of an event. With development of the Campus Pointe development, it is recommended the traffic control plan be revised to reflect the shift in parking that will occur.

California State University, Fresno – Campus Pointe Project Revised EIR Air Quality
Michael Brandman Associates 31 H:\Client (PN-JN)\3184\31840006\Revised EIR\31840006 Campus Pointe Revised EIR.doc
SECTION 3: AIR QUALITY
3.1 - Court Decision
The Superior Court ruled that the air impact section of the EIR was inadequate because there was no discussion or analysis of the San Joaquin Valley Air Pollution Control District’s Rule 9510 - Indirect Source Review (ISR). The ISR requirement became effective on March 1, 2006 and applies to projects that meet certain thresholds based on the size and use of the project and that received final discretionary approval on or after the ISR’s effective date. “In particular, 5.3 of the rule says that the District will give each applicant an onsite checklist that includes quantifiable onsite measures that reduce operational NOx and/or PM10 emissions, and requires the applicant to identify the measures it has voluntarily selected and how they will be enforced, as well as to include justification for measures not selected.” The Court of Appeal held that the Trustees should take action necessary to bring the air quality sections of the Final EIR into compliance with CEQA, and that such action shall include a discussion of the applicability of ISR. On June 20, 2011, the Superior Court issued a Judgment and Peremptory Writ of Mandamus directing the Trustees to discuss the applicability of the San Joaquin Valley Unified Air Pollution Control District Rule 9510 to the project to address the inadequacies discussed in the court’s statement of decision and to take the action necessary to bring the air quality section analysis of the EIR into compliance with CEQA.
3.2 - Lead Agency Response
3.2.1 - Summary The SOD (p. 79) states the following:
Section 4 of the DEIR discusses air issues, coming to the conclusion that the project will exceed the air district’s threshold for ROG and NOx, but the section failed to identify the air district rules and regulations, such as the indirect source rule (“ISR”).
The DEIR did not discuss the then new regulation. The DEIR addressed the project’s air quality impacts and included design features and mitigation consistent with those used for the Rule 9510 Air Impact Assessment (AIA) application.
The timing of the submittal of applications to comply with Rule 9510 was somewhat unclear in the period following rule implementation. The ISR rule became effective March 1, 2006. The SJVAPCD comment letter for the DEIR dated October 30, 2006 did not indicate that Rule 9510 was required in the DEIR nor did it indicate that Rule 9510 compliance was required as a mitigation measure. After rule adoption, the SJVAPCD conducted outreach and attempted to identify projects that were subject to the rule but had not yet submitted an AIA application. Once notified of the requirement, the University fulfilled the requirements of the rule.
California State University, Fresno – Campus Pointe Project Air Quality Revised EIR
32 Michael Brandman Associates
H:\Client (PN-JN)\3184\31840006\Revised EIR\31840006 Campus Pointe Revised EIR.doc
In accordance with Rule 9510, a completed Air Impact Assessment Application is included in Appendix B-1. These measures are not mandatory; however, projects that are unable to meet the required rule reductions with the onsite measures are subject to offsite mitigation fees to achieve an equivalent emission reduction.
On February 12, 2009, the Campus Pointe project obtained approval of its Air Impact Assessment (AIA) in compliance with Rule 9510 and an approval letter has been issued by the SJVAPCD for the overall site plan. A fee deferral schedule is on file for the projects that have not yet been completed.
All required project applications have been approved by the San Joaquin Valley Air Pollution Control District (SJVAPCD) in compliance with Indirect Source Review, Rule 9510 including payment of mitigation fees for projects in construction. Refer to Appendix B-1 for copies of the SJVAPCD approval letters documenting compliance and agency approval dates.
Rule 9510 Requirements
The court ruling indicated that because the project was subject to Rule 9510, the EIR should have discussed the Rule and its requirements. Rule 9510 requires projects to reduce project operational NOx emissions by 33 percent and PM10 emissions by 50 percent from the unmitigated baseline for 10 years. It also requires projects to reduce emissions of NOx and PM10 from construction equipment by 20 percent and 45 percent, respectively. The reductions can be achieved through any combination of onsite and project design measures and payment of an offsite mitigation fee. For this reason, it is common to refer to the total reduction achieved by rule compliance and not the specific amounts from onsite or offsite measures. The percentage reductions can also be applied to unmitigated project emissions to determine if project emissions will exceed SJVAPCD thresholds of significance after compliance with the Rule. If emissions exceed the threshold of significance after application of the Rule, the project would have significant air quality impacts. For Campus Pointe, the project would exceed the SJVAPCD thresholds of significance for NOx of 10 tons per year after considering reductions that would be achieved through compliance with Rule 9510. Unmitigated NOx operational emissions are 25.23 tons per year. Mitigation measures and compliance with Rule 9510 would achieve a NOx reduction of approximately 5.05 tons per year and remaining mitigated emissions of 20.18 tons per year. This amount is well over the 10-ton-per-year NOx threshold, so the project impacts remains significant after application of Rule 9510. This accounts for the benefits of mitigation measures 18 through 21 because Rule 9510 emission reduction requirements are achieved with both onsite mitigation measures and the payment of offsite mitigation fees.
Rule 9510 Compliance
The Campus Pointe project has complied with Rule 9510 by implementing applicable SJVAPCD suggested measures from the Final EIR and as specified in the Air Impact Assessment (AIA).
The Draft EIR and Technical Appendices dated September 2006 included a detailed Air Quality Impact Assessment prepared by VRPA Technologies, Inc. Page 4.11 of the Draft EIR states that “the
California State University, Fresno – Campus Pointe Project Revised EIR Air Quality
Michael Brandman Associates 33 H:\Client (PN-JN)\3184\31840006\Revised EIR\31840006 Campus Pointe Revised EIR.doc
annual emissions from construction of the project will be less than the applicable SJVAPCD emission thresholds and therefore were considered less than significant with the implementation of Regulation VIII.” The total emissions from the proposed project will exceed the District’s threshold for ROG or NOx. However, the project contains many features that will reduce emissions as stated on p. 4.16 of the Draft EIR. Pages 4.16-4.17 of the Draft EIR list the District’s Construction Related Mitigation Measures that are required for all projects, and these mitigation measures have been included in the general conditions for all construction contracts.
The On-Site Emission Reduction Checklist assists applicants in identifying measures that should be considered for their project to reduce emissions onsite and would reduce the amount the applicants would pay in offsite mitigation fees. The SJVAPCD has indicated its preference for onsite measures as opposed to receiving fees that are used to fund projects that reduce the same amount of emissions offsite. The requirement to provide justification for not selecting onsite measures listed on the On-Site Emission Reduction Checklist was included to ensure that applicants seriously considered the measures. The SJVAPCD has incorporated the Checklist into the AIA Application forms. A copy of the form is provided in Appendix B-1. The Checklist incorporates the benefits of EIR mitigation measures 18 through 21 into the emission reduction estimates for Rule 9510 compliance.
Campus Pointe fully complies with the requirements of Rule 9510 as evidenced by the approval of the Air Impact Assessment Applications by the SJVAPCD. The mitigation checklist has been completed and is provided in Appendix B-1. No changes in mitigation measures and the conclusions of the EIR are required. The air quality section as revised complies with CEQA. New CEQA requirements related to greenhouse gases are described below.
Greenhouse Gas Assessment
The Draft EIR did not include an assessment of the project’s impacts on climate change. The California Natural Resources Agency approved amendments to the CEQA Guidelines required by Senate Bill 97 on December 31, 2009, effective March 18, 2010, that include climate change as an impact that should be addressed in EIRs. Therefore, an analysis of the project’s climate change impacts with this REIR.
Since the Final EIR was certified and approved by the Board of Trustees, new emission factors and air quality model versions have been introduced and recommended for use in the San Joaquin Valley by the SJVAPCD. The University obtained an updated air quality analysis using the latest modeling tools and emission factors and provided the revised results herein. These models and emission factors were used in preparing applications to comply with Rule 9510. The analysis confirms that there are no new significant air quality impacts that were not addressed in the original EIR.
The analysis also includes an assessment of the project’s greenhouse gas emissions to comply with amendments to the CEQA Guidelines required by Senate Bill 97 that became effective on March 18,
California State University, Fresno – Campus Pointe Project Air Quality Revised EIR
34 Michael Brandman Associates
H:\Client (PN-JN)\3184\31840006\Revised EIR\31840006 Campus Pointe Revised EIR.doc
2010. The Governor’s Office of Planning and Research’s (OPR) recommended steps for analysis of climate change impacts including the following: identify and quantify greenhouse gas emissions; assess the significance of impact; and if the impact is significant, identify alternatives and/or mitigation measures to reduce the impacts. The San Joaquin Valley Air Pollution Control District has approved guidance on this topic on December 17, 2009 with its document, Guidance for Valley Land-use Agencies in Addressing GHG Emission Impacts for New Projects under CEQA (SJVAPCD 2009). An analysis based on the OPR and SJVAPCD guidance is included in this section.
3.3 - Revisions to the Draft EIR (Section 4.0, Air Quality)
The following section replaces the analysis portion of Section 4.0 commencing with page 4.10 of the Campus Pointe Draft EIR. No changes to the environmental and regulatory setting for air quality that would result in significant new information were identified. Only the impact section has been updated to include a complete discussion of Rule 9510 and to update the emission estimates based on the latest modeling. The entire impact section was included to provide context for the new discussion of Rule 9510 and the updated modeling. For this section, the revisions constitute the entire subsection, so underline formatting was not used to aid in readability. An analysis of greenhouse gas emissions and potential climate change impacts is also included in this section.
3.4 - Methodology
The analysis that follows was prepared using a variety of data sources and air quality models. The Traffic Impact Study for the project prepared by Omni Means was used to generate average daily trip generation to model operational motor vehicle emissions. Additional trip generation data prepared for the Rule 9510 Air Impact Assessment Application for the residential component by transportation consulting firm TJKM was used to supplement the Omni Means data for the residential components of the project. The Carbon Monoxide (CO) Hotspot Analysis prepared by VRPA Technologies was used for determining potential CO impacts at intersections meeting SJVAPCD screening criteria. Annual increases in vehicular and area emissions associated with the project were estimated using the URBEMIS computer program. Construction emissions for the project were also modeled using URBEMIS. Carbon dioxide emissions were estimated using URBEMIS. Methane and nitrous oxide emissions were estimated using emission factors as described in Appendix B-4. This analysis also follows guidance presented by the SJVAPCD in its 2002 Guide for Assessing and Mitigating Air Quality Impacts (GAMAQI).
3.5 - Air Quality Impacts
This analysis calculates the expected emissions from the construction and operation of the project as a necessary pre-requisite for assessing the regulatory significance of project emissions on a regional and local level.
California State University, Fresno – Campus Pointe Project Revised EIR Air Quality
Michael Brandman Associates 35 H:\Client (PN-JN)\3184\31840006\Revised EIR\31840006 Campus Pointe Revised EIR.doc
3.5.1 - Standards of Significance The EIR uses significance thresholds suggested by the SJVAPCD GAMAQI and the CEQA Guidelines. Air quality impacts resulting from the implementation of the proposed project would be considered significant if the project would:
a.) Conflict with or obstruct implementation of the applicable air quality plan
b) Exceed thresholds of the San Joaquin Valley Air Pollution Control District for criteria pollutants
c.) Exceed State or federal standards for carbon monoxide levels at intersections
d.) Substantially contribute to an existing or projected air quality violation; or
e.) Expose sensitive receptors to substantial pollutant concentrations.
f.) Create objectionable odors affecting a substantial number of people?
Impact: Air Quality Attainment Plan Consistency The proposed project would conflict with or obstruct implementation of the applicable air quality plan.
Threshold
The CEQA Guidelines indicate that a significant impact would occur if the proposed project would conflict with or obstruct implementation of the applicable air quality plan. The GAMAQI does not provide specific guidance on analyzing conformity with the Air Quality Plan (AQP). Therefore, this document proposes the following criteria for determining project consistency with the current AQPs:
1. Will the project result in an increase in the frequency or severity of existing air quality violations or cause or contribute to new violations, or delay timely attainment of air quality standards or the interim emission reductions specified in the AQPs? This measure is determined by comparison with the regional and localized thresholds identified by the SJVAPCD for Regional and Local Air Pollutants.
2. Will the project conform to the assumptions in the AQPs?
3. Will the project comply with applicable control measures in the AQPs?
Impact Analysis
AQPs are plans for reaching attainment of air quality standards. The assumptions, inputs, and control measures are analyzed to determine if the Air Basin can attain the ambient air quality standards. The California Clean Air Act requires implementation of all feasible control measures and progress toward attainment of state standards. To demonstrate attainment of the standards, SJVAPCD analyzes the growth projections in the valley, contributing factors in air pollutant emissions and
California State University, Fresno – Campus Pointe Project Air Quality Revised EIR
36 Michael Brandman Associates
H:\Client (PN-JN)\3184\31840006\Revised EIR\31840006 Campus Pointe Revised EIR.doc
formations and existing and future emissions controls. The SJVAPCD then formulates a control strategy to reach attainment or to demonstrate adequate progress toward attaining state standards.
Project’s Contribution to Air Quality Violations
A measure for determining if the project is consistent with the AQP is if the project will not result in an increase in the frequency or severity of existing air quality violations or cause or contribute to new violations, or delay timely attainment of air quality standards or the interim emission reductions specified in the AQPs. The project will comply with the regulations stemming from control measures contained in the SJVAPCD attainment plans that are designed to meet state and federal requirements. The project includes design features and mitigation measures to further reduce project air quality impacts. The air quality analysis prepared for the project indicated that the project would not cause a violation of the CO standard. Based on these factors, the project would not result in significant contributions to air quality violations.
Consistency with Assumptions in AQPs
The primary way of determining consistency with the AQP’s assumptions is determining consistency with the growth assumptions used in the AQPs for the air basin. The largest sources of emissions from development are mobile source emissions from increases in vehicle trips and miles traveled. The Council of Fresno County Governments (Fresno COG) uses the growth projections and land use information in adopted general plans to estimate future average daily trips and then vehicle miles traveled (VMT), which are then provided to SJVAPCD to estimate future emissions in the AQPs. Fresno COG is required to adopt emission budgets that demonstrate conformity with the AQPs that include the latest planning assumptions. The Fresno COG regional model used to demonstrate conformity includes growth assumptions for Fresno State, including the Campus Pointe project. Therefore, the project meets the criteria for consistency with the AQP.
Control Measures
The AQP contains a number of control measures intended to reduce emissions by amounts that would enable the San Joaquin Valley to attain air quality standards. Control measures are implemented with rules, regulations, and programs adopted by the SJVAPCD. The control measures in the AQP are enforceable requirements. The project will comply with all applicable SJVAPCD rules and regulations. Therefore, the project complies with this criterion.
Level of Significance Before Mitigation Less than significant impact.
Mitigation Measures No mitigation is necessary.
Level of Significance After Mitigation Less than significant impact.
California State University, Fresno – Campus Pointe Project Revised EIR Air Quality
Michael Brandman Associates 37 H:\Client (PN-JN)\3184\31840006\Revised EIR\31840006 Campus Pointe Revised EIR.doc
Impact: Exceed thresholds of the San Joaquin Valley Air Pollution Control District for criteria pollutants
Thresholds
Ozone is a regional air pollutant that is not emitted directly but forms from a chemical reaction between the ozone precursors NOx and ROG in the presence of sunlight. According to the GAMAQI, the SJVAPCD based the ozone precursor thresholds’ “significant contribution” definition on the California Clean Air Act’s offset requirements for NOx and ROG. The ROG and NOx offset thresholds are described in SJVAPCD Rule 2201 (New and Modified Stationary Source Review). In addition, this analysis will use a PM10 threshold based on the SJVAPCD’s offset thresholds for PM10 in Rule 2201. The SJVAPCD does not have a threshold of significance for PM2.5; however, since PM2.5 is a subset of PM10, the PM10 offset threshold will also be applied to PM2.5.
Projects within the Air Basin with operational or construction-related emissions in excess of any of the thresholds presented in Table 3 will be considered significant.
Sulfur dioxide is not included in this analysis because the SJVAPCD is in attainment for this pollutant and it is not considered a significant localized or regional problem. Additionally, only minor amounts of sulfur dioxide are emitted during construction and operation, as shown in the output files contained in Appendix B-2. CO emissions would not be significant during construction because construction equipment does not emit large amounts of CO and the background concentration of CO is low (see Table 4-4 of Campus Pointe Project EIR). The San Joaquin Valley Air Basin has attained state and federal CO standards. CO disperses rapidly and would not be at a concentration to evoke negative health effects to nearby receptors. Heavy traffic congestion can result in CO hotspots. Operational CO impacts from the motor vehicles are assessed later in this section.
Table 3: SJVAPCD Regional Thresholds
Pollutant Tons per Year
NOx 10
ROG 10
PM10 15
PM2.5 15
Source: San Joaquin Valley Air Pollution Control District, 2002
Short-Term Emissions
Short-term impacts are related to the construction phase of a project and are recognized to be short in duration and temporary. Construction air quality impacts are generally attributable to dust generated by equipment and vehicles. Fugitive dust is emitted both during construction activity and as a result of wind erosion over exposed earth surfaces. Clearing and earth moving activities do comprise major sources of construction dust emissions, but traffic and general disturbances of soil surfaces also
California State University, Fresno – Campus Pointe Project Air Quality Revised EIR
38 Michael Brandman Associates
H:\Client (PN-JN)\3184\31840006\Revised EIR\31840006 Campus Pointe Revised EIR.doc
generate significant dust emissions. Further, dust generation is dependent on soil type and soil moisture.
Adverse effects of construction activities cause increased dust-fall and locally elevated levels of total suspended particulate. Dust-fall can be a nuisance to neighboring properties or previously completed developments surrounding or within the project area and may require frequent washing during the construction period. Further, asphalt paving materials used during construction will present temporary, minor sources of hydrocarbons that are precursors of ozone.
PM10 emissions can result from construction activities of the project. The SJVAPCD requires implementation of effective and comprehensive control measures, rather than a detailed quantification of fugitive emissions. The SJVAPCD has determined that compliance with Regulation VIII for all sites and other control measures will constitute sufficient mitigation to reduce PM10 impacts to a level considered less-than significant.
Ozone precursor emissions and PM10 emissions from diesel powered construction equipment are also an impact of construction activities and can be quantified through modeling. Variables factored into estimating total construction emission include: level of activity, length of construction period, number of pieces and types of equipment in use, site characteristics, weather conditions, number of construction personnel, and amount of materials to be transported onsite or offsite. Additional exhaust emissions would be associated with the transport of workers and materials. Construction emissions from equipment were estimated using the URBEMIS 2007 model. Results of the analysis are shown in Table 4.
The project is required to comply with the construction mitigation requirements of SJVAPCD Rule 9510 intended to reduce emissions of NOx and PM10 from the operation of construction equipment. Rule 9510 does not apply to the fugitive PM10 emissions from construction activities that are subject to Regulation VIII described above. Rule 9510 requires a 20-percent reduction in NOx emissions and a 45-percent reduction in PM10 emissions compared with statewide average emission rates for construction equipment for the year construction is scheduled to take place. The Rule 9510 reductions are reflected in Table 4. Under the SJVAPCD threshold approach, significance for large projects with construction phased over several years would be considered significant if emissions exceeded the threshold during any year. The highest annual emissions for the project are predicted for 2008 but would not exceed the SJVAPCD thresholds.
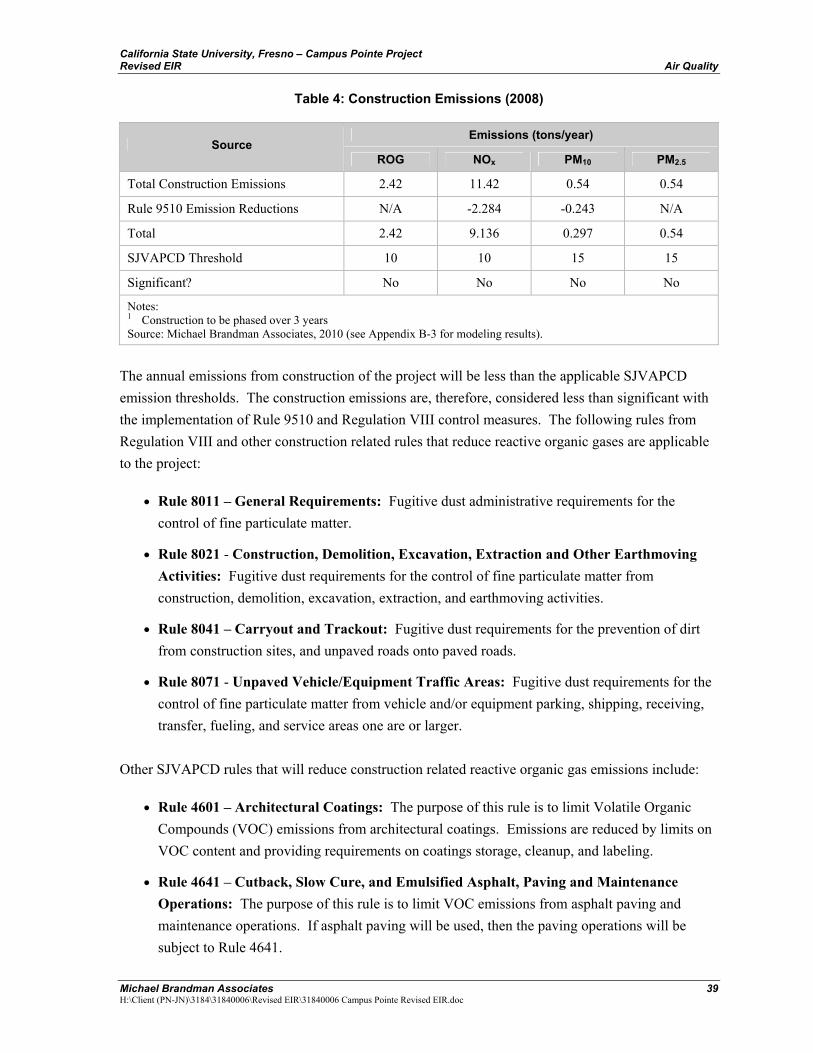
California State University, Fresno – Campus Pointe Project Revised EIR Air Quality
Michael Brandman Associates 39 H:\Client (PN-JN)\3184\31840006\Revised EIR\31840006 Campus Pointe Revised EIR.doc
Table 4: Construction Emissions (2008)
Emissions (tons/year) Source
ROG NOx PM10 PM2.5
Total Construction Emissions 2.42 11.42 0.54 0.54
Rule 9510 Emission Reductions N/A -2.284 -0.243 N/A
Total 2.42 9.136 0.297 0.54
SJVAPCD Threshold 10 10 15 15
Significant? No No No No
Notes: 1 Construction to be phased over 3 years Source: Michael Brandman Associates, 2010 (see Appendix B-3 for modeling results).
The annual emissions from construction of the project will be less than the applicable SJVAPCD emission thresholds. The construction emissions are, therefore, considered less than significant with the implementation of Rule 9510 and Regulation VIII control measures. The following rules from Regulation VIII and other construction related rules that reduce reactive organic gases are applicable to the project:
• Rule 8011 – General Requirements: Fugitive dust administrative requirements for the control of fine particulate matter.
• Rule 8021 - Construction, Demolition, Excavation, Extraction and Other Earthmoving Activities: Fugitive dust requirements for the control of fine particulate matter from construction, demolition, excavation, extraction, and earthmoving activities.
• Rule 8041 – Carryout and Trackout: Fugitive dust requirements for the prevention of dirt from construction sites, and unpaved roads onto paved roads.
• Rule 8071 - Unpaved Vehicle/Equipment Traffic Areas: Fugitive dust requirements for the control of fine particulate matter from vehicle and/or equipment parking, shipping, receiving, transfer, fueling, and service areas one are or larger.
Other SJVAPCD rules that will reduce construction related reactive organic gas emissions include:
• Rule 4601 – Architectural Coatings: The purpose of this rule is to limit Volatile Organic Compounds (VOC) emissions from architectural coatings. Emissions are reduced by limits on VOC content and providing requirements on coatings storage, cleanup, and labeling.
• Rule 4641 – Cutback, Slow Cure, and Emulsified Asphalt, Paving and Maintenance Operations: The purpose of this rule is to limit VOC emissions from asphalt paving and maintenance operations. If asphalt paving will be used, then the paving operations will be subject to Rule 4641.
California State University, Fresno – Campus Pointe Project Air Quality Revised EIR
40 Michael Brandman Associates
H:\Client (PN-JN)\3184\31840006\Revised EIR\31840006 Campus Pointe Revised EIR.doc
Construction-Related Mitigation Measures
1. Compliance with Regulation VIII under the San Joaquin Valley Air District for all construction sites will constitute sufficient mitigation to reduce PM10 impacts to a level considered less-than significant.
Regulation VIII includes performance standards, mandatory measures, and measure options that must be implemented at construction sites to minimize fugitive dust. Environmental factors such as soil type, soil moisture, temperature, humidity, and wind speed create wide variation in PM10 emissions. The SJVAPCD expects projects to implement all measures required to meet the opacity limits of the rule. The GAMAQI includes additional measures that may be implemented if required to avoid excessive PM10 emissions. Many of these measures would be required for rule compliance, but they are listed here to provide additional assurance that Regulation VIII compliance will be achieved.
The following mitigation measures from the GAMAQI are required to be implemented at all construction sites:
1. Compliance with Regulation VIII under the San Joaquin Valley Air District for all construction sites will constitute sufficient mitigation to reduce PM10 impacts to a level considered less-than significant.
2. All disturbed areas, including storage piles, which are not being actively utilized for construction purposes, shall be effectively stabilized of dust emissions using water, chemical stabilizer/suppressant, covered with a tarp or other suitable cover or vegetative ground cover.
3. All on-site unpaved roads and off-site unpaved access roads shall be effectively stabilized of dust emissions using water or chemical stabilizer/suppressant.
4. All land clearing, grubbing, scraping, excavation, land leveling, grading, cut & fill, and demolition activities shall be effectively controlled of fugitive dust emissions utilizing application of water or by presoaking.
5. When materials are transported off-site, all material shall be covered, or effectively wetted to limit visible dust emissions, and at least six inches of freeboard space from the top of the container shall be maintained.
6. All operations shall limit or expeditiously remove the accumulation of mud or dirt from adjacent public streets at the end of each workday. The use of dry rotary brushes is expressly prohibited except where preceded or accompanied by sufficient wetting to limit the visible dust emissions. Use of blower devices is expressly forbidden.
7. Following the addition of materials to, or the removal of materials from, the surface of outdoor storage piles, said piles shall be effectively stabilized of fugitive dust emissions utilizing sufficient water or chemical stabilizer/suppressant.
California State University, Fresno – Campus Pointe Project Revised EIR Air Quality
Michael Brandman Associates 41 H:\Client (PN-JN)\3184\31840006\Revised EIR\31840006 Campus Pointe Revised EIR.doc
8. Within urban areas, track out shall be immediately removed when it extends 50 or more feet from the site and at the end of each workday.
Additional enhanced control measures are desirable where feasible and include:
9. Traffic speeds on unpaved roads shall be limited to 15 mph.
10. Sandbags or other erosion control measures shall be installed to prevent silt runoff to public roadways from sites with a slope greater than one percent.
Additional mitigation measures should be considered for reducing emissions from construction emissions. The District’s GAMAQI suggests the following measures:
11. Use of alternative fueled or catalyst equipped diesel construction equipment.
12. Minimize idling time (e.g., 10-minute maximum).
13. Limit the hours of operation of heavy-duty equipment and/or the amount of equipment in use.
14. Replace fossil-fueled equipment with electrically driven equivalents (provided they are not run via a portable generator set).
15. Curtail construction during periods of high ambient pollutant concentrations; this may include ceasing of construction activity during the peak-hour of vehicular traffic on adjacent roadways.
16. Implement activity management (e.g. rescheduling activities to reduce short-term impacts).
17. A heavily vegetated, no spray buffer zone will be implemented between the project and adjacent agricultural lands to the north. The width of this buffer zone will be determined based on the chemicals used for spraying and the frequency of application.
Long-Term Emissions
Long-term emissions from the project are generated by mobile source (vehicle) emissions from the project site and area sources such as water heaters and landscape maintenance equipment. Long-term emissions are also referred to as operational emissions because they result from the ongoing operation of the project.
Project Mobile and Area Source Emissions – Ozone and Particulate Matter The San Joaquin Valley Air Basin, which includes the Fresno area, is classified extreme non-attainment for federal air quality standards for ozone and non-attainment for fine particulates. The SJVAPCD GAMAQI established guidelines for evaluating land use changes and the potential impact on air quality for these pollutants. Nitrogen oxides and reactive organic gases are regulated as ozone precursors. The SJVAPCD established significance criteria for ROG and NOx at 10 tons per year
California State University, Fresno – Campus Pointe Project Air Quality Revised EIR
42 Michael Brandman Associates
H:\Client (PN-JN)\3184\31840006\Revised EIR\31840006 Campus Pointe Revised EIR.doc
each. As discussed earlier, significance criteria for PM10 and PM2.5 have been set at 15 tons per year each for this analysis.
Rules Applicable to the Project The SJVAPCD rules and regulations that will reduce long-term operational emissions include but are not limited to the following:
• SJVAPCD Rule 3180 – Administrative Fees for Indirect Source Review (ISR): The purpose of this rule is to recover the SJVAPCD’s costs for administering the requirements of Rule 9510 (Indirect Source Review).
• SJVAPCD Rule 9410 – Employer Based Trip Reduction: The purpose of this rule is reduce vehicle miles traveled (VMT) from private vehicles used by employees to commute to and from their worksites to reduce emissions of NOx, VOCs and PM. The rule would require larger employers (those with 100 or more eligible employees) to establish employee trip reduction programs to reduce VMT, reducing emissions associated with work commutes. The rule uses a menu-based Employer Trip Reduction Implementation Plan (ETRIP) and periodic reporting requirements to evaluate performance on a phased-in compliance schedule.
• SJVAPCD Rule 9510 – Indirect Source Review: This rule reduces the impact of NOx and PM10 emissions from growth on the Air Basin. The rule places application and emission reduction requirements on development projects meeting applicability criteria in order to reduce emissions through onsite mitigation, offsite SJVAPCD-administered projects, or a combination of the two. This project has submitted Air Impact Assessment applications in accordance with Rule 9510’s requirements. Copies of SJVAPCD letters approving the applications are provided in Appendix B-1.
Compliance with Rule 9510 (ISR) Compliance with SJVAPCD Rule 9510 reduces the emissions impact of the project through incorporation of onsite measures as well as payment of an offsite fee that funds emission reduction projects in the Air Basin. The emissions analysis for Rule 9510 is highly detailed and is dependent on the project design that is expected to be constructed or installed. Minor changes to project components between the CEQA analysis and project construction often occur. An example of such a change is a change the footprint of individual buildings as designs are finalized. No increase in overall square footage or change in land use is allowed that would result in increased project trip generation and emissions compared to that analyzed in the EIR. The required amounts of emission reductions required by Rule 9510 are as follows:
Construction Exhaust: 20% of the total NOx emissions, and 45% of the total PM10 emissions.
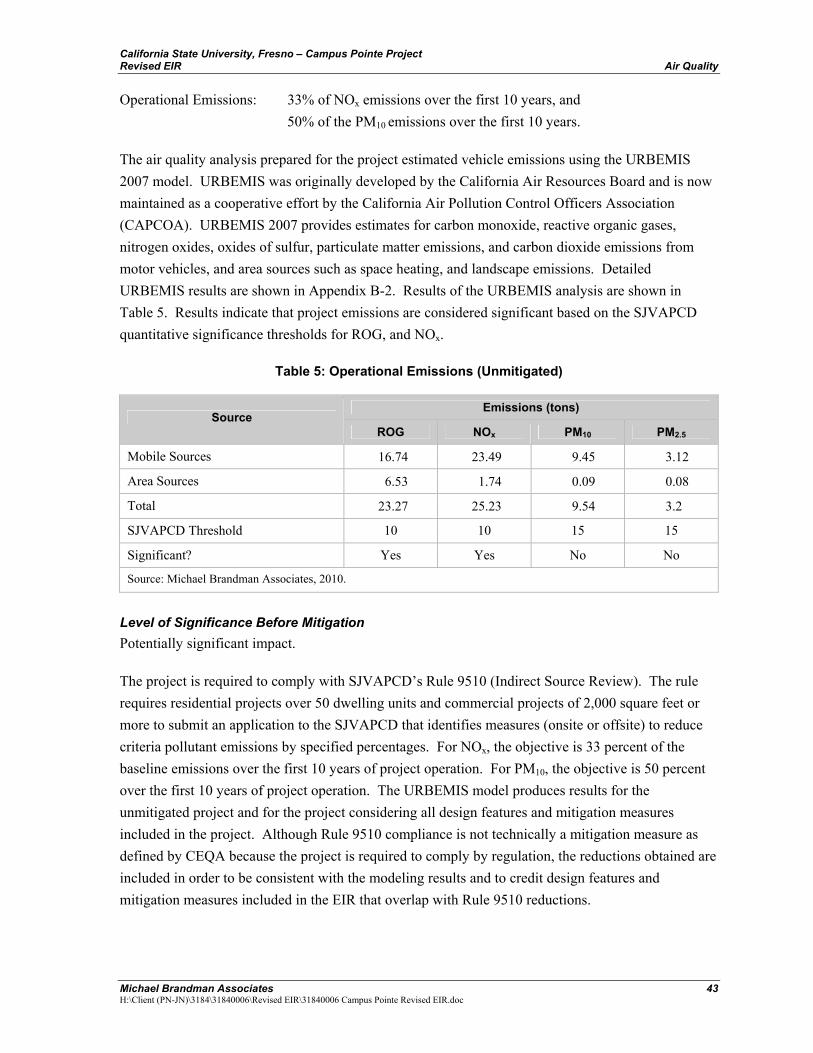
California State University, Fresno – Campus Pointe Project Revised EIR Air Quality
Michael Brandman Associates 43 H:\Client (PN-JN)\3184\31840006\Revised EIR\31840006 Campus Pointe Revised EIR.doc
Operational Emissions: 33% of NOx emissions over the first 10 years, and 50% of the PM10 emissions over the first 10 years.
The air quality analysis prepared for the project estimated vehicle emissions using the URBEMIS 2007 model. URBEMIS was originally developed by the California Air Resources Board and is now maintained as a cooperative effort by the California Air Pollution Control Officers Association (CAPCOA). URBEMIS 2007 provides estimates for carbon monoxide, reactive organic gases, nitrogen oxides, oxides of sulfur, particulate matter emissions, and carbon dioxide emissions from motor vehicles, and area sources such as space heating, and landscape emissions. Detailed URBEMIS results are shown in Appendix B-2. Results of the URBEMIS analysis are shown in Table 5. Results indicate that project emissions are considered significant based on the SJVAPCD quantitative significance thresholds for ROG, and NOx.
Table 5: Operational Emissions (Unmitigated)
Emissions (tons) Source
ROG NOx PM10 PM2.5
Mobile Sources 16.74 23.49 9.45 3.12
Area Sources 6.53 1.74 0.09 0.08
Total 23.27 25.23 9.54 3.2
SJVAPCD Threshold 10 10 15 15
Significant? Yes Yes No No
Source: Michael Brandman Associates, 2010.
Level of Significance Before Mitigation Potentially significant impact.
The project is required to comply with SJVAPCD’s Rule 9510 (Indirect Source Review). The rule requires residential projects over 50 dwelling units and commercial projects of 2,000 square feet or more to submit an application to the SJVAPCD that identifies measures (onsite or offsite) to reduce criteria pollutant emissions by specified percentages. For NOx, the objective is 33 percent of the baseline emissions over the first 10 years of project operation. For PM10, the objective is 50 percent over the first 10 years of project operation. The URBEMIS model produces results for the unmitigated project and for the project considering all design features and mitigation measures included in the project. Although Rule 9510 compliance is not technically a mitigation measure as defined by CEQA because the project is required to comply by regulation, the reductions obtained are included in order to be consistent with the modeling results and to credit design features and mitigation measures included in the EIR that overlap with Rule 9510 reductions.
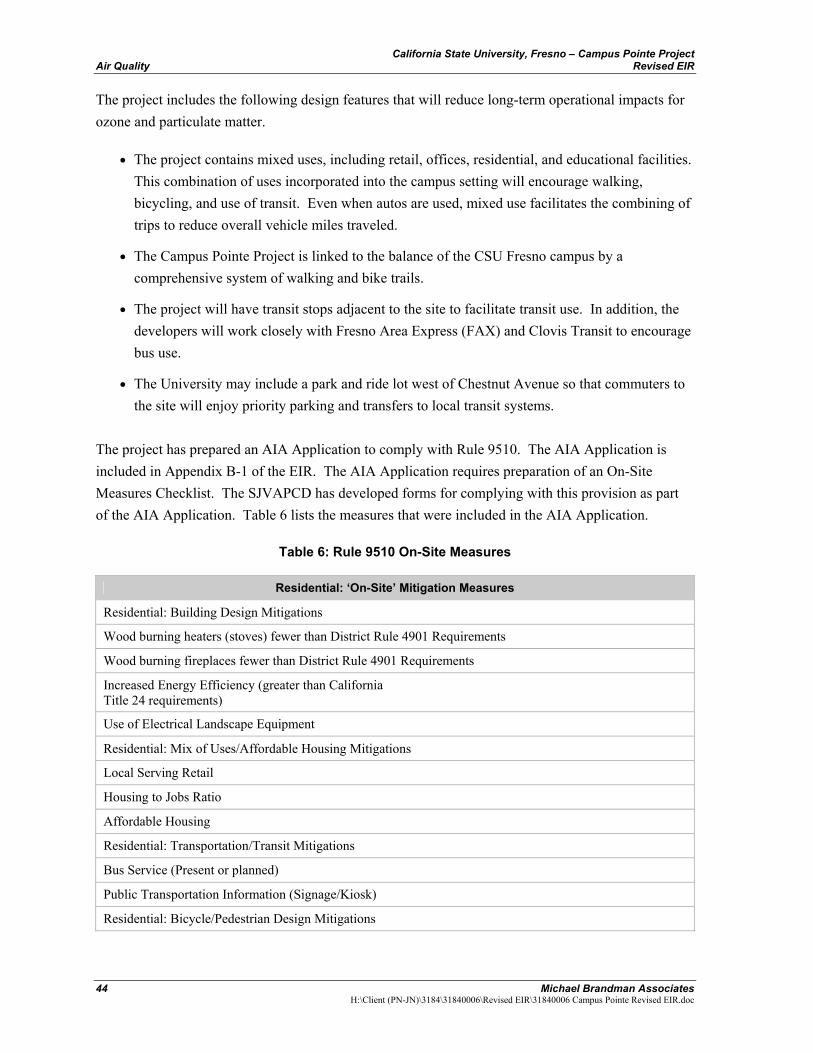
California State University, Fresno – Campus Pointe Project Air Quality Revised EIR
44 Michael Brandman Associates
H:\Client (PN-JN)\3184\31840006\Revised EIR\31840006 Campus Pointe Revised EIR.doc
The project includes the following design features that will reduce long-term operational impacts for ozone and particulate matter.
• The project contains mixed uses, including retail, offices, residential, and educational facilities. This combination of uses incorporated into the campus setting will encourage walking, bicycling, and use of transit. Even when autos are used, mixed use facilitates the combining of trips to reduce overall vehicle miles traveled.
• The Campus Pointe Project is linked to the balance of the CSU Fresno campus by a comprehensive system of walking and bike trails.
• The project will have transit stops adjacent to the site to facilitate transit use. In addition, the developers will work closely with Fresno Area Express (FAX) and Clovis Transit to encourage bus use.
• The University may include a park and ride lot west of Chestnut Avenue so that commuters to the site will enjoy priority parking and transfers to local transit systems.
The project has prepared an AIA Application to comply with Rule 9510. The AIA Application is included in Appendix B-1 of the EIR. The AIA Application requires preparation of an On-Site Measures Checklist. The SJVAPCD has developed forms for complying with this provision as part of the AIA Application. Table 6 lists the measures that were included in the AIA Application.
Table 6: Rule 9510 On-Site Measures
Residential: ‘On-Site’ Mitigation Measures
Residential: Building Design Mitigations
Wood burning heaters (stoves) fewer than District Rule 4901 Requirements
Wood burning fireplaces fewer than District Rule 4901 Requirements
Increased Energy Efficiency (greater than California Title 24 requirements)
Use of Electrical Landscape Equipment
Residential: Mix of Uses/Affordable Housing Mitigations
Local Serving Retail
Housing to Jobs Ratio
Affordable Housing
Residential: Transportation/Transit Mitigations
Bus Service (Present or planned)
Public Transportation Information (Signage/Kiosk)
Residential: Bicycle/Pedestrian Design Mitigations
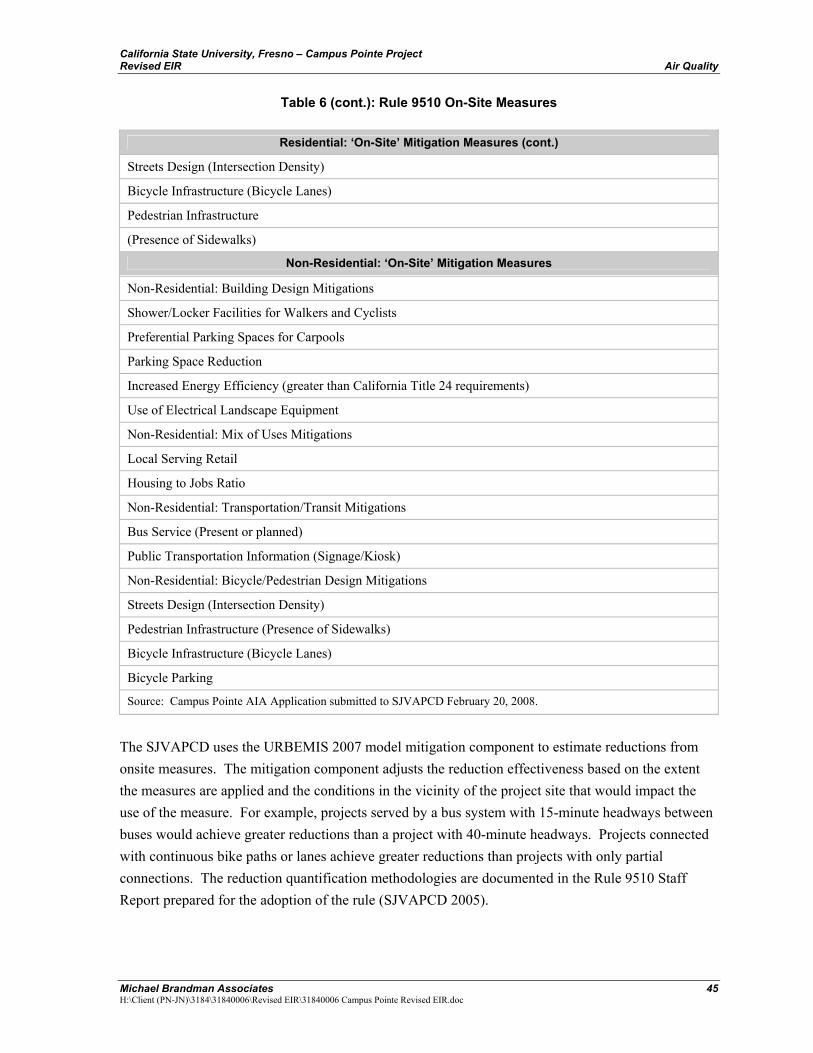
California State University, Fresno – Campus Pointe Project Revised EIR Air Quality
Michael Brandman Associates 45 H:\Client (PN-JN)\3184\31840006\Revised EIR\31840006 Campus Pointe Revised EIR.doc
Table 6 (cont.): Rule 9510 On-Site Measures
Residential: ‘On-Site’ Mitigation Measures (cont.)
Streets Design (Intersection Density)
Bicycle Infrastructure (Bicycle Lanes)
Pedestrian Infrastructure
(Presence of Sidewalks)
Non-Residential: ‘On-Site’ Mitigation Measures
Non-Residential: Building Design Mitigations
Shower/Locker Facilities for Walkers and Cyclists
Preferential Parking Spaces for Carpools
Parking Space Reduction
Increased Energy Efficiency (greater than California Title 24 requirements)
Use of Electrical Landscape Equipment
Non-Residential: Mix of Uses Mitigations
Local Serving Retail
Housing to Jobs Ratio
Non-Residential: Transportation/Transit Mitigations
Bus Service (Present or planned)
Public Transportation Information (Signage/Kiosk)
Non-Residential: Bicycle/Pedestrian Design Mitigations
Streets Design (Intersection Density)
Pedestrian Infrastructure (Presence of Sidewalks)
Bicycle Infrastructure (Bicycle Lanes)
Bicycle Parking
Source: Campus Pointe AIA Application submitted to SJVAPCD February 20, 2008.
The SJVAPCD uses the URBEMIS 2007 model mitigation component to estimate reductions from onsite measures. The mitigation component adjusts the reduction effectiveness based on the extent the measures are applied and the conditions in the vicinity of the project site that would impact the use of the measure. For example, projects served by a bus system with 15-minute headways between buses would achieve greater reductions than a project with 40-minute headways. Projects connected with continuous bike paths or lanes achieve greater reductions than projects with only partial connections. The reduction quantification methodologies are documented in the Rule 9510 Staff Report prepared for the adoption of the rule (SJVAPCD 2005).
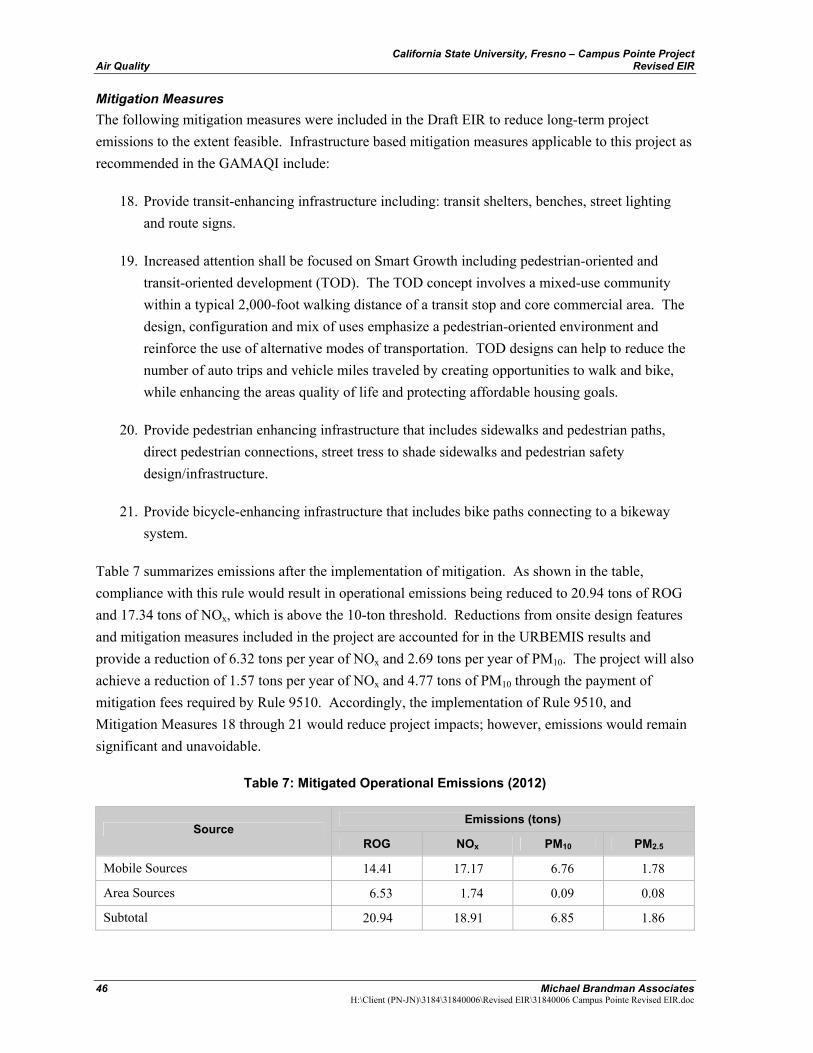
California State University, Fresno – Campus Pointe Project Air Quality Revised EIR
46 Michael Brandman Associates
H:\Client (PN-JN)\3184\31840006\Revised EIR\31840006 Campus Pointe Revised EIR.doc
Mitigation Measures The following mitigation measures were included in the Draft EIR to reduce long-term project emissions to the extent feasible. Infrastructure based mitigation measures applicable to this project as recommended in the GAMAQI include:
18. Provide transit-enhancing infrastructure including: transit shelters, benches, street lighting and route signs.
19. Increased attention shall be focused on Smart Growth including pedestrian-oriented and transit-oriented development (TOD). The TOD concept involves a mixed-use community within a typical 2,000-foot walking distance of a transit stop and core commercial area. The design, configuration and mix of uses emphasize a pedestrian-oriented environment and reinforce the use of alternative modes of transportation. TOD designs can help to reduce the number of auto trips and vehicle miles traveled by creating opportunities to walk and bike, while enhancing the areas quality of life and protecting affordable housing goals.
20. Provide pedestrian enhancing infrastructure that includes sidewalks and pedestrian paths, direct pedestrian connections, street tress to shade sidewalks and pedestrian safety design/infrastructure.
21. Provide bicycle-enhancing infrastructure that includes bike paths connecting to a bikeway system.
Table 7 summarizes emissions after the implementation of mitigation. As shown in the table, compliance with this rule would result in operational emissions being reduced to 20.94 tons of ROG and 17.34 tons of NOx, which is above the 10-ton threshold. Reductions from onsite design features and mitigation measures included in the project are accounted for in the URBEMIS results and provide a reduction of 6.32 tons per year of NOx and 2.69 tons per year of PM10. The project will also achieve a reduction of 1.57 tons per year of NOx and 4.77 tons of PM10 through the payment of mitigation fees required by Rule 9510. Accordingly, the implementation of Rule 9510, and Mitigation Measures 18 through 21 would reduce project impacts; however, emissions would remain significant and unavoidable.
Table 7: Mitigated Operational Emissions (2012)
Emissions (tons) Source
ROG NOx PM10 PM2.5
Mobile Sources 14.41 17.17 6.76 1.78
Area Sources 6.53 1.74 0.09 0.08
Subtotal 20.94 18.91 6.85 1.86
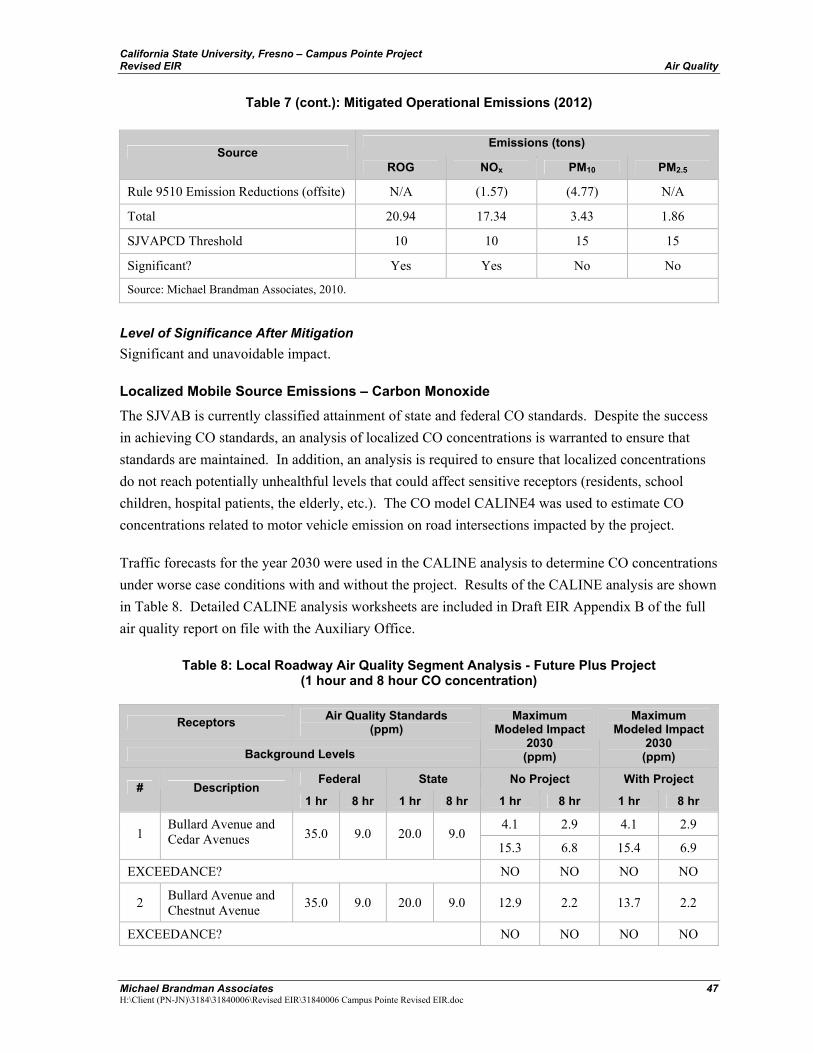
California State University, Fresno – Campus Pointe Project Revised EIR Air Quality
Michael Brandman Associates 47 H:\Client (PN-JN)\3184\31840006\Revised EIR\31840006 Campus Pointe Revised EIR.doc
Table 7 (cont.): Mitigated Operational Emissions (2012)
Emissions (tons) Source
ROG NOx PM10 PM2.5
Rule 9510 Emission Reductions (offsite) N/A (1.57) (4.77) N/A
Total 20.94 17.34 3.43 1.86
SJVAPCD Threshold 10 10 15 15
Significant? Yes Yes No No
Source: Michael Brandman Associates, 2010.
Level of Significance After Mitigation Significant and unavoidable impact.
Localized Mobile Source Emissions – Carbon Monoxide
The SJVAB is currently classified attainment of state and federal CO standards. Despite the success in achieving CO standards, an analysis of localized CO concentrations is warranted to ensure that standards are maintained. In addition, an analysis is required to ensure that localized concentrations do not reach potentially unhealthful levels that could affect sensitive receptors (residents, school children, hospital patients, the elderly, etc.). The CO model CALINE4 was used to estimate CO concentrations related to motor vehicle emission on road intersections impacted by the project.
Traffic forecasts for the year 2030 were used in the CALINE analysis to determine CO concentrations under worse case conditions with and without the project. Results of the CALINE analysis are shown in Table 8. Detailed CALINE analysis worksheets are included in Draft EIR Appendix B of the full air quality report on file with the Auxiliary Office.
Table 8: Local Roadway Air Quality Segment Analysis - Future Plus Project (1 hour and 8 hour CO concentration)
Receptors Air Quality Standards (ppm)
Background Levels
Maximum Modeled Impact
2030 (ppm)
Maximum Modeled Impact
2030 (ppm)
Federal State No Project With Project # Description
1 hr 8 hr 1 hr 8 hr 1 hr 8 hr 1 hr 8 hr
4.1 2.9 4.1 2.9 1
Bullard Avenue and Cedar Avenues 35.0 9.0 20.0 9.0
15.3 6.8 15.4 6.9
EXCEEDANCE? NO NO NO NO
2 Bullard Avenue and Chestnut Avenue 35.0 9.0 20.0 9.0 12.9 2.2 13.7 2.2
EXCEEDANCE? NO NO NO NO
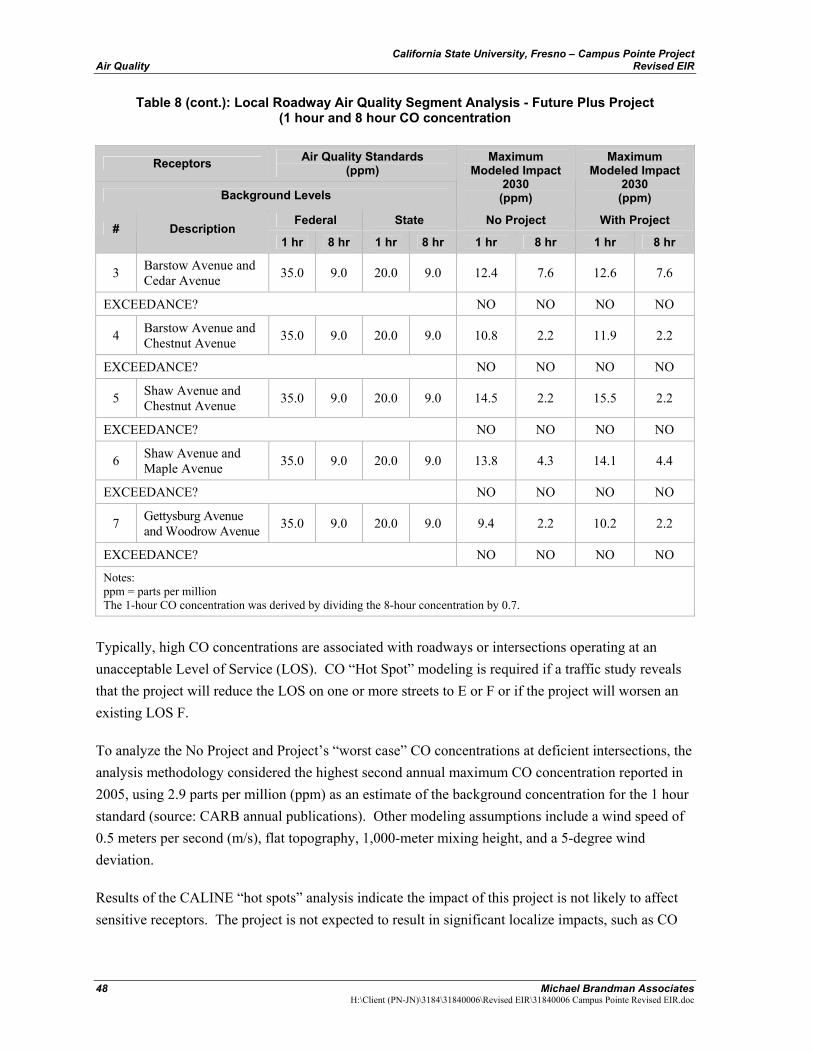
California State University, Fresno – Campus Pointe Project Air Quality Revised EIR
48 Michael Brandman Associates
H:\Client (PN-JN)\3184\31840006\Revised EIR\31840006 Campus Pointe Revised EIR.doc
Table 8 (cont.): Local Roadway Air Quality Segment Analysis - Future Plus Project (1 hour and 8 hour CO concentration
Receptors Air Quality Standards (ppm)
Background Levels
Maximum Modeled Impact
2030 (ppm)
Maximum Modeled Impact
2030 (ppm)
Federal State No Project With Project # Description
1 hr 8 hr 1 hr 8 hr 1 hr 8 hr 1 hr 8 hr
3 Barstow Avenue and Cedar Avenue 35.0 9.0 20.0 9.0 12.4 7.6 12.6 7.6
EXCEEDANCE? NO NO NO NO
4 Barstow Avenue and Chestnut Avenue 35.0 9.0 20.0 9.0 10.8 2.2 11.9 2.2
EXCEEDANCE? NO NO NO NO
5 Shaw Avenue and Chestnut Avenue 35.0 9.0 20.0 9.0 14.5 2.2 15.5 2.2
EXCEEDANCE? NO NO NO NO
6 Shaw Avenue and Maple Avenue 35.0 9.0 20.0 9.0 13.8 4.3 14.1 4.4
EXCEEDANCE? NO NO NO NO
7 Gettysburg Avenue and Woodrow Avenue 35.0 9.0 20.0 9.0 9.4 2.2 10.2 2.2
EXCEEDANCE? NO NO NO NO
Notes: ppm = parts per million The 1-hour CO concentration was derived by dividing the 8-hour concentration by 0.7.
Typically, high CO concentrations are associated with roadways or intersections operating at an unacceptable Level of Service (LOS). CO “Hot Spot” modeling is required if a traffic study reveals that the project will reduce the LOS on one or more streets to E or F or if the project will worsen an existing LOS F.
To analyze the No Project and Project’s “worst case” CO concentrations at deficient intersections, the analysis methodology considered the highest second annual maximum CO concentration reported in 2005, using 2.9 parts per million (ppm) as an estimate of the background concentration for the 1 hour standard (source: CARB annual publications). Other modeling assumptions include a wind speed of 0.5 meters per second (m/s), flat topography, 1,000-meter mixing height, and a 5-degree wind deviation.
Results of the CALINE “hot spots” analysis indicate the impact of this project is not likely to affect sensitive receptors. The project is not expected to result in significant localize impacts, such as CO
California State University, Fresno – Campus Pointe Project Revised EIR Air Quality
Michael Brandman Associates 49 H:\Client (PN-JN)\3184\31840006\Revised EIR\31840006 Campus Pointe Revised EIR.doc
“Hot Spots,” and is not expected to impact nearby sensitive receptors. Therefore, the impact to sensitive receptors is considered less than significant.
Level of Significance Before Mitigation Less than significant impact.
Mitigation Measures No mitigation is necessary.
Level of Significance After Mitigation Less than significant impact.Potential Impacts from Odors and Hazardous Air Pollutants
The proposed project is composed of residential and commercial land uses. The commercial land uses are not anticipated to require substantial numbers of heavy-duty truck deliveries that would result in significant emissions of diesel particulates. Odor generation and hazardous air pollutants are typically associated with certain types of industrial and agricultural activities. Because the project is mixed use in nature, it is not expected to result in the generation of significant odors or hazardous air pollutants.
Level of Significance Before Mitigation Less than significant impact.
Mitigation Measures No mitigation is necessary.
Level of Significance After Mitigation Less than significant impact.
3.6 - Greenhouse Gas Background
3.6.1 - Introduction This section is included in the REIR to address an issue that was not included in the EIR when it was first certified and approved in 2007. The California Air Resources Board (CARB) adopted a Scoping Plan in December 2008 to implement AB 32 – Global Warming Solutions Act of 2006. The Scoping Plan contains emission reduction targets and measures that are designed to achieve the targets. The Scoping Plan anticipates that state and local agencies would help to achieve the Scoping Plan targets.
The Office of Planning and Research prepared amendments to the CEQA Guidelines to address greenhouse gas and climate change impacts as required by Senate Bill (SB) 97. The Office of Planning and Research transmitted proposed SB 97 CEQA Guidelines Amendments to the California Natural Resources Agency on April 13, 2009. On July 3, 2009, the Natural Resources Agency commenced the Administrative Procedure Act rulemaking process for certifying and adopting these amendments pursuant to Public Resources Code section 21083.05. On December 31, 2009, the
California State University, Fresno – Campus Pointe Project Air Quality Revised EIR
50 Michael Brandman Associates
H:\Client (PN-JN)\3184\31840006\Revised EIR\31840006 Campus Pointe Revised EIR.doc
Natural Resources Agency delivered its rulemaking package to the Office of Administrative Law for their review pursuant to the Administrative Procedure Act. The Office of Administrative Law approved the adopted amendments and rulemaking file on February 16, 2010 and transmitted the adopted amendments to the Secretary of State for inclusion in the California Code of Regulations. The adopted amendments became effective on March 18, 2010. The following discussion has been added to the REIR to show consistency with AB 32 and compliance with the amended CEQA Guidelines.
This section describes the existing environmental and regulatory setting and potential effects from project implementation on greenhouse gases and climate change. The University retained the consulting firm, Michael Brandman Associates (MBA) to perform an analysis of greenhouse gases and climate change impacts of the proposed project. The analysis quantifies project construction and operational greenhouse gas emissions modeling using URBEMIS 2007 Version 9.2 and other emission factors approved by the CARB and United States Environmental Protection Agency (EPA). The modeling output is provided in Appendix B-3.
Environmental Setting for Greenhouse Gas Emissions and Climate Change Greenhouse Gas Emissions and Climate Change Constituent gases of the earth’s atmosphere called greenhouse gases play a critical role in the earth’s radiation budget by trapping infrared radiation emitted from the earth’s surface, which would otherwise have escaped into space. This phenomenon, known as the “Greenhouse Effect,” is responsible for maintaining a habitable climate. However, it is believed that emissions from human activities, such as electricity production and vehicle use, have elevated the concentration of these gases in the atmosphere beyond the level of naturally occurring concentrations, leading to a trend of unnatural changes to the earth’s natural climate, known as global warming or climate change.
Greenhouse gases are global pollutants, unlike ozone, carbon monoxide, particulate matter, and toxic air contaminants, which are pollutants of regional and local concern.
Potential Environmental Effects The United Nations Intergovernmental Panel on Climate Change (IPCC) has declared that worldwide, average temperatures are likely to increase by approximately 3 degrees Fahrenheit (°F) to 7°F by the end of the 21st century. However, a global temperature increase does not translate to a uniform increase in temperature in all locations on the earth. Regional climate changes are dependent on multiple variables, such as topography. One region of the earth may experience increased temperature, increased incidents of drought, and similar warming effects, whereas another region may experience a relative cooling. According to the IPCC’s Working Group II Report website, climate change impacts to North America may include diminishing snowpack, increasing evaporation, exacerbated shoreline erosion, exacerbated inundation from sea level rising, increased risk and frequency of wildfire, increased risk of insect outbreaks, increased experiences of heat waves, and
California State University, Fresno – Campus Pointe Project Revised EIR Air Quality
Michael Brandman Associates 51 H:\Client (PN-JN)\3184\31840006\Revised EIR\31840006 Campus Pointe Revised EIR.doc
rearrangement of ecosystems, as species and ecosystem zones shift northward and to higher elevations.
In California, as discussed in a report prepared by the California Climate Change Center in 2006 and a report by Moser et al (2009), climate change may result in the following consequences:
• A reduction in the quality and supply of water to the State from the Sierra snowpack. If heat-trapping emissions continue unabated, more precipitation will fall as rain instead of snow, and the snow that does fall will melt earlier, reducing the Sierra Nevada spring snowpack by as much as 70 to 90 percent. This can lead to challenges in securing adequate water supplies. It can also lead to a potential reduction in hydropower.
• Increased risk of large wildfires. If precipitation increases as temperatures rise, wildfires in the grasslands and chaparral ecosystems of southern California are expected to increase by approximately 30 percent toward the end of the century because more winter rain will stimulate the growth of more plant “fuel” available to burn in the fall. In contrast, a hotter, drier climate could promote up to 90 percent more northern California fires by the end of the century by drying out and increasing the flammability of forest vegetation.
• Reductions in the quality and quantity of certain agricultural products. Crops that are likely to be hard hit include wine grapes, fruit, nuts, and milk.
• Exacerbation of air quality problems. If temperatures rise to the medium warming range, there could be 75 to 85 percent more days with weather conducive to ozone formation in Los Angeles and the San Joaquin Valley, relative to today’s conditions. This is more than twice the increase expected if temperature rises are kept in the lower warming range.
• A rise in sea levels resulting in the displacement of coastal businesses and residences. During the past century, sea levels along California’s coast have risen about seven inches. If heat-trapping emissions continue unabated and temperatures rise into the higher warming range, sea level is expected to rise an additional 22 to 35 inches by the end of the century. Elevations of this magnitude would inundate coastal areas with salt water, accelerate coastal erosion, threaten vital levees and inland water systems, and disrupt wetlands and natural habitats.
• Damage to marine ecosystems and the natural environment.
• An increase in infections, disease, asthma, heat stroke/exhaustion, heart attack, stroke, and other health-related problems.
• A decrease in the health and productivity of California’s forests. Although certain environmental effects are widely accepted to be a potential hazard to certain locations, such as rising sea level for low-laying coastal areas, it is currently infeasible to predict all environmental effects of climate change on any one location.
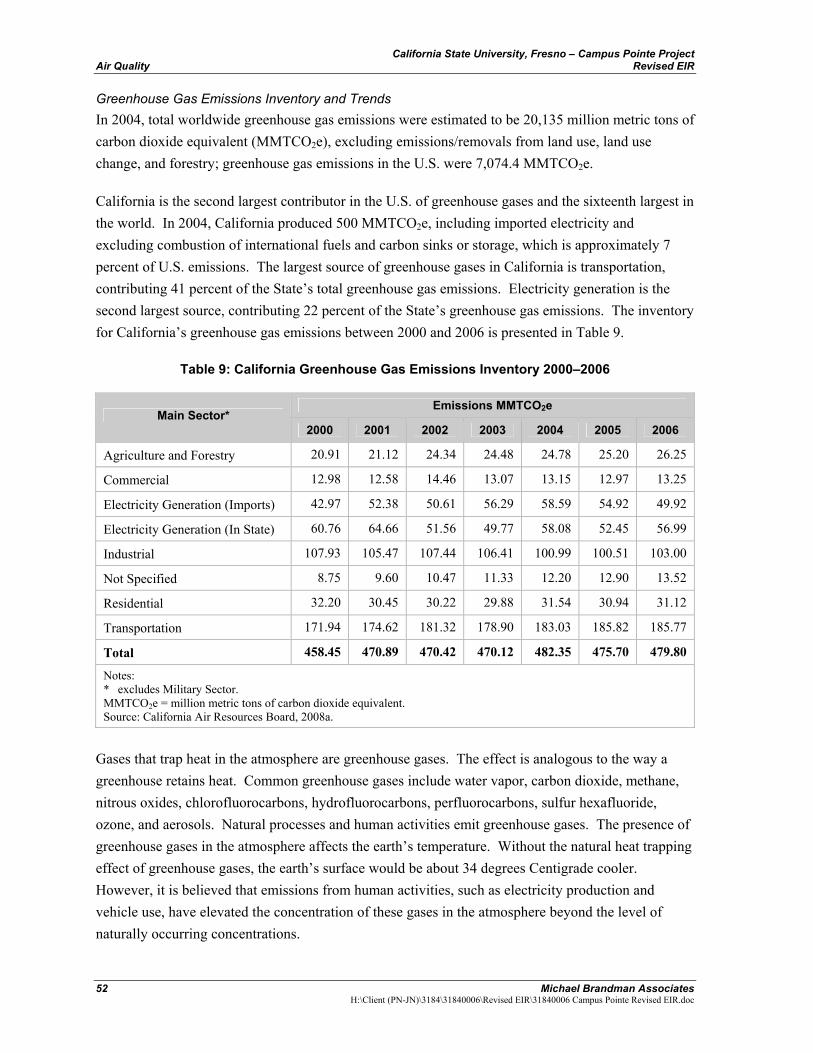
California State University, Fresno – Campus Pointe Project Air Quality Revised EIR
52 Michael Brandman Associates
H:\Client (PN-JN)\3184\31840006\Revised EIR\31840006 Campus Pointe Revised EIR.doc
Greenhouse Gas Emissions Inventory and Trends In 2004, total worldwide greenhouse gas emissions were estimated to be 20,135 million metric tons of carbon dioxide equivalent (MMTCO2e), excluding emissions/removals from land use, land use change, and forestry; greenhouse gas emissions in the U.S. were 7,074.4 MMTCO2e.
California is the second largest contributor in the U.S. of greenhouse gases and the sixteenth largest in the world. In 2004, California produced 500 MMTCO2e, including imported electricity and excluding combustion of international fuels and carbon sinks or storage, which is approximately 7 percent of U.S. emissions. The largest source of greenhouse gases in California is transportation, contributing 41 percent of the State’s total greenhouse gas emissions. Electricity generation is the second largest source, contributing 22 percent of the State’s greenhouse gas emissions. The inventory for California’s greenhouse gas emissions between 2000 and 2006 is presented in Table 9.
Table 9: California Greenhouse Gas Emissions Inventory 2000–2006
Emissions MMTCO2e Main Sector*
2000 2001 2002 2003 2004 2005 2006
Agriculture and Forestry 20.91 21.12 24.34 24.48 24.78 25.20 26.25
Commercial 12.98 12.58 14.46 13.07 13.15 12.97 13.25
Electricity Generation (Imports) 42.97 52.38 50.61 56.29 58.59 54.92 49.92
Electricity Generation (In State) 60.76 64.66 51.56 49.77 58.08 52.45 56.99
Industrial 107.93 105.47 107.44 106.41 100.99 100.51 103.00
Not Specified 8.75 9.60 10.47 11.33 12.20 12.90 13.52
Residential 32.20 30.45 30.22 29.88 31.54 30.94 31.12
Transportation 171.94 174.62 181.32 178.90 183.03 185.82 185.77
Total 458.45 470.89 470.42 470.12 482.35 475.70 479.80
Notes: * excludes Military Sector. MMTCO2e = million metric tons of carbon dioxide equivalent. Source: California Air Resources Board, 2008a.
Gases that trap heat in the atmosphere are greenhouse gases. The effect is analogous to the way a greenhouse retains heat. Common greenhouse gases include water vapor, carbon dioxide, methane, nitrous oxides, chlorofluorocarbons, hydrofluorocarbons, perfluorocarbons, sulfur hexafluoride, ozone, and aerosols. Natural processes and human activities emit greenhouse gases. The presence of greenhouse gases in the atmosphere affects the earth’s temperature. Without the natural heat trapping effect of greenhouse gases, the earth’s surface would be about 34 degrees Centigrade cooler. However, it is believed that emissions from human activities, such as electricity production and vehicle use, have elevated the concentration of these gases in the atmosphere beyond the level of naturally occurring concentrations.
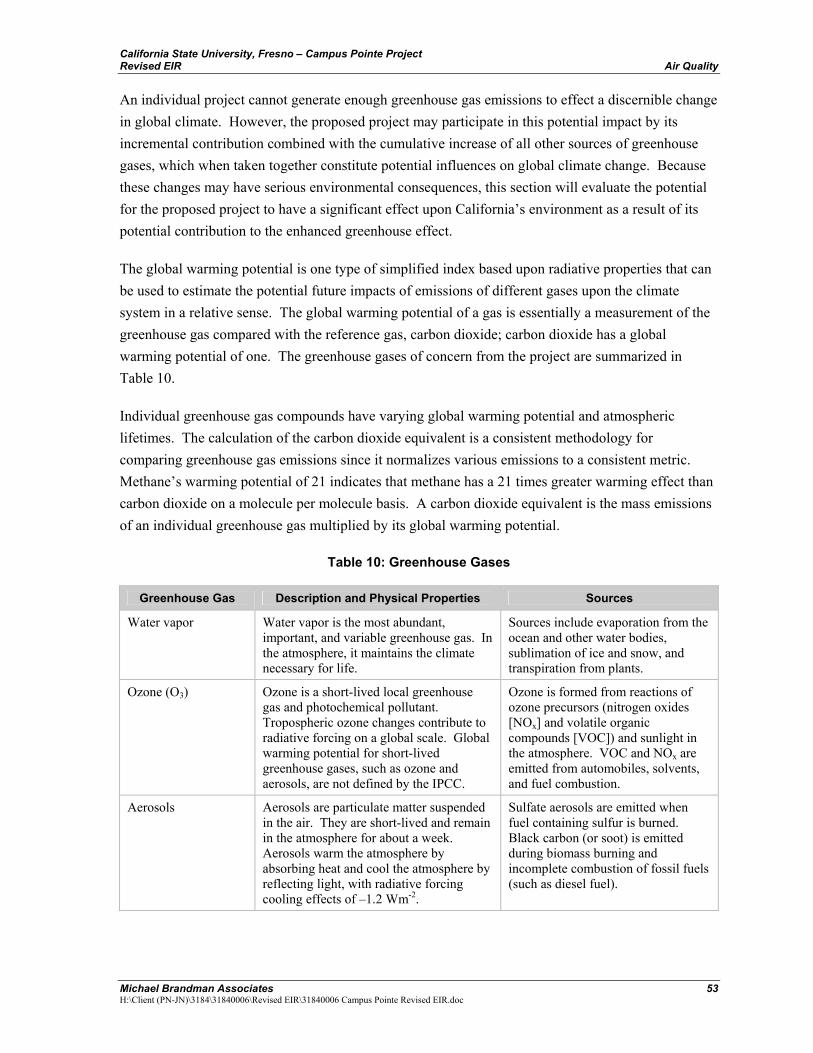
California State University, Fresno – Campus Pointe Project Revised EIR Air Quality
Michael Brandman Associates 53 H:\Client (PN-JN)\3184\31840006\Revised EIR\31840006 Campus Pointe Revised EIR.doc
An individual project cannot generate enough greenhouse gas emissions to effect a discernible change in global climate. However, the proposed project may participate in this potential impact by its incremental contribution combined with the cumulative increase of all other sources of greenhouse gases, which when taken together constitute potential influences on global climate change. Because these changes may have serious environmental consequences, this section will evaluate the potential for the proposed project to have a significant effect upon California’s environment as a result of its potential contribution to the enhanced greenhouse effect.
The global warming potential is one type of simplified index based upon radiative properties that can be used to estimate the potential future impacts of emissions of different gases upon the climate system in a relative sense. The global warming potential of a gas is essentially a measurement of the greenhouse gas compared with the reference gas, carbon dioxide; carbon dioxide has a global warming potential of one. The greenhouse gases of concern from the project are summarized in Table 10.
Individual greenhouse gas compounds have varying global warming potential and atmospheric lifetimes. The calculation of the carbon dioxide equivalent is a consistent methodology for comparing greenhouse gas emissions since it normalizes various emissions to a consistent metric. Methane’s warming potential of 21 indicates that methane has a 21 times greater warming effect than carbon dioxide on a molecule per molecule basis. A carbon dioxide equivalent is the mass emissions of an individual greenhouse gas multiplied by its global warming potential.
Table 10: Greenhouse Gases
Greenhouse Gas Description and Physical Properties Sources
Water vapor Water vapor is the most abundant, important, and variable greenhouse gas. In the atmosphere, it maintains the climate necessary for life.
Sources include evaporation from the ocean and other water bodies, sublimation of ice and snow, and transpiration from plants.
Ozone (O3) Ozone is a short-lived local greenhouse gas and photochemical pollutant. Tropospheric ozone changes contribute to radiative forcing on a global scale. Global warming potential for short-lived greenhouse gases, such as ozone and aerosols, are not defined by the IPCC.
Ozone is formed from reactions of ozone precursors (nitrogen oxides [NOx] and volatile organic compounds [VOC]) and sunlight in the atmosphere. VOC and NOx are emitted from automobiles, solvents, and fuel combustion.
Aerosols Aerosols are particulate matter suspended in the air. They are short-lived and remain in the atmosphere for about a week. Aerosols warm the atmosphere by absorbing heat and cool the atmosphere by reflecting light, with radiative forcing cooling effects of –1.2 Wm-2.
Sulfate aerosols are emitted when fuel containing sulfur is burned. Black carbon (or soot) is emitted during biomass burning and incomplete combustion of fossil fuels (such as diesel fuel).
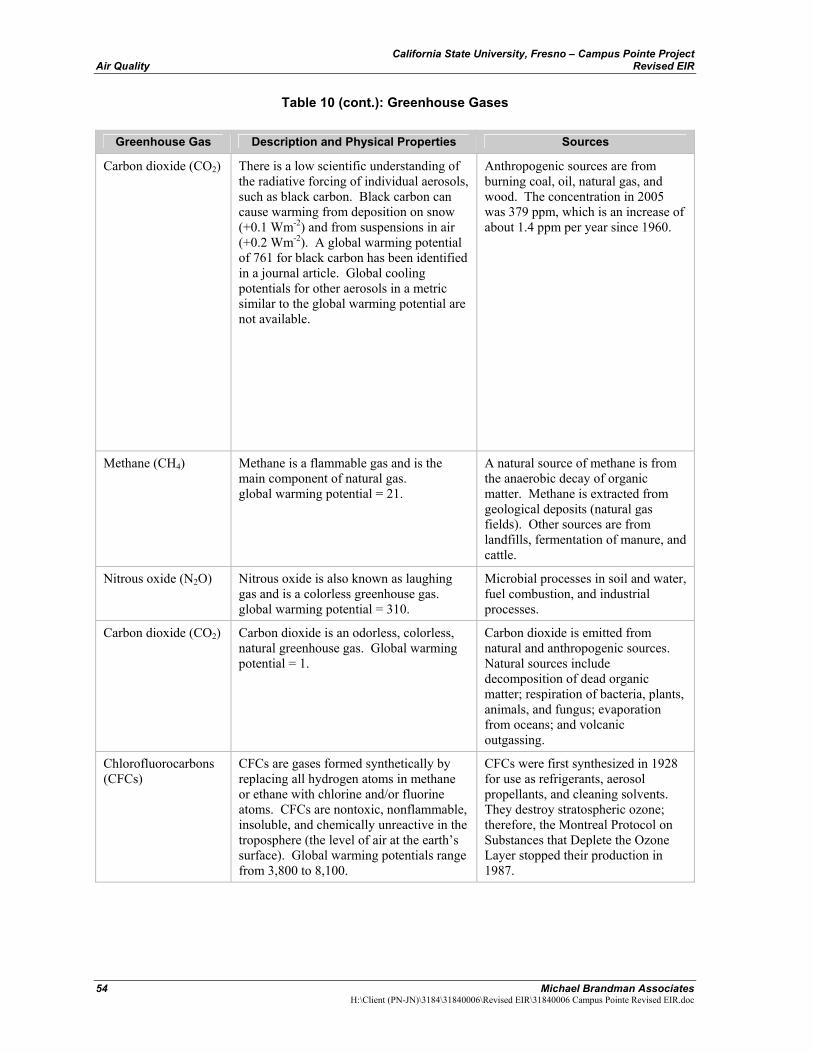
California State University, Fresno – Campus Pointe Project Air Quality Revised EIR
54 Michael Brandman Associates
H:\Client (PN-JN)\3184\31840006\Revised EIR\31840006 Campus Pointe Revised EIR.doc
Table 10 (cont.): Greenhouse Gases
Greenhouse Gas Description and Physical Properties Sources
Carbon dioxide (CO2) There is a low scientific understanding of the radiative forcing of individual aerosols, such as black carbon. Black carbon can cause warming from deposition on snow (+0.1 Wm-2) and from suspensions in air (+0.2 Wm-2). A global warming potential of 761 for black carbon has been identified in a journal article. Global cooling potentials for other aerosols in a metric similar to the global warming potential are not available.
Anthropogenic sources are from burning coal, oil, natural gas, and wood. The concentration in 2005 was 379 ppm, which is an increase of about 1.4 ppm per year since 1960.
Methane (CH4) Methane is a flammable gas and is the main component of natural gas. global warming potential = 21.
A natural source of methane is from the anaerobic decay of organic matter. Methane is extracted from geological deposits (natural gas fields). Other sources are from landfills, fermentation of manure, and cattle.
Nitrous oxide (N2O) Nitrous oxide is also known as laughing gas and is a colorless greenhouse gas. global warming potential = 310.
Microbial processes in soil and water, fuel combustion, and industrial processes.
Carbon dioxide (CO2) Carbon dioxide is an odorless, colorless, natural greenhouse gas. Global warming potential = 1.
Carbon dioxide is emitted from natural and anthropogenic sources. Natural sources include decomposition of dead organic matter; respiration of bacteria, plants, animals, and fungus; evaporation from oceans; and volcanic outgassing.
Chlorofluorocarbons (CFCs)
CFCs are gases formed synthetically by replacing all hydrogen atoms in methane or ethane with chlorine and/or fluorine atoms. CFCs are nontoxic, nonflammable, insoluble, and chemically unreactive in the troposphere (the level of air at the earth’s surface). Global warming potentials range from 3,800 to 8,100.
CFCs were first synthesized in 1928 for use as refrigerants, aerosol propellants, and cleaning solvents. They destroy stratospheric ozone; therefore, the Montreal Protocol on Substances that Deplete the Ozone Layer stopped their production in 1987.
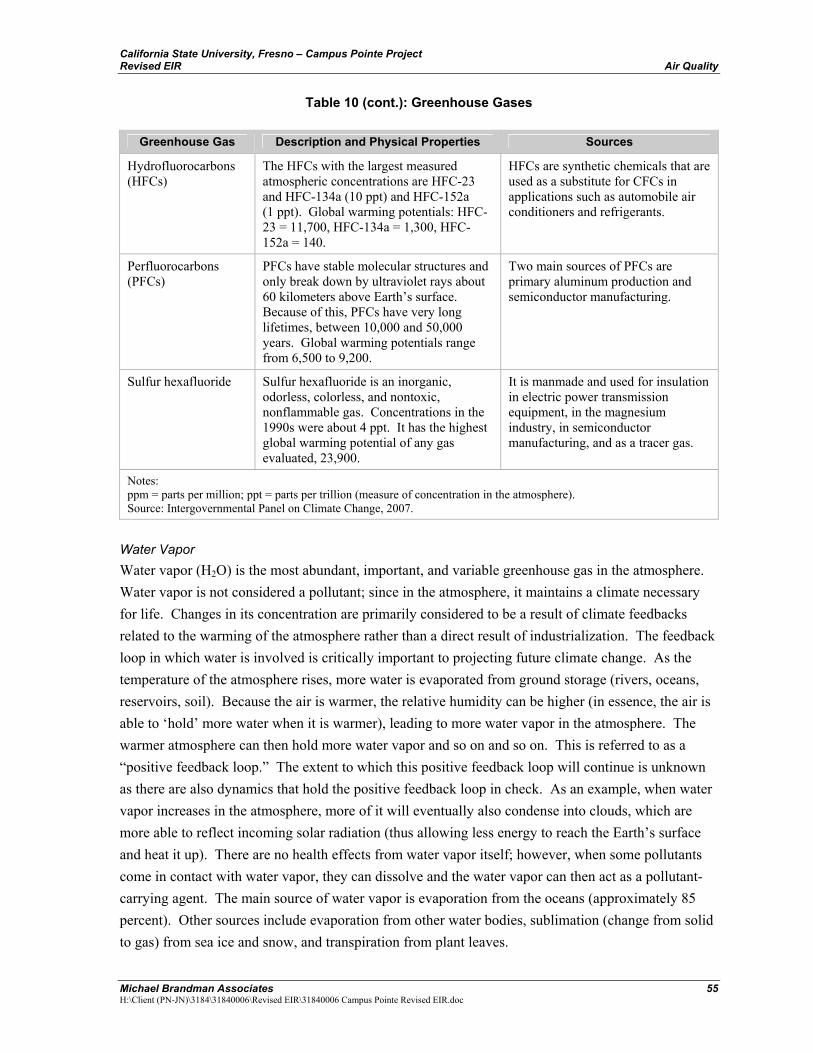
California State University, Fresno – Campus Pointe Project Revised EIR Air Quality
Michael Brandman Associates 55 H:\Client (PN-JN)\3184\31840006\Revised EIR\31840006 Campus Pointe Revised EIR.doc
Table 10 (cont.): Greenhouse Gases
Greenhouse Gas Description and Physical Properties Sources
Hydrofluorocarbons (HFCs)
The HFCs with the largest measured atmospheric concentrations are HFC-23 and HFC-134a (10 ppt) and HFC-152a (1 ppt). Global warming potentials: HFC-23 = 11,700, HFC-134a = 1,300, HFC-152a = 140.
HFCs are synthetic chemicals that are used as a substitute for CFCs in applications such as automobile air conditioners and refrigerants.
Perfluorocarbons (PFCs)
PFCs have stable molecular structures and only break down by ultraviolet rays about 60 kilometers above Earth’s surface. Because of this, PFCs have very long lifetimes, between 10,000 and 50,000 years. Global warming potentials range from 6,500 to 9,200.
Two main sources of PFCs are primary aluminum production and semiconductor manufacturing.
Sulfur hexafluoride Sulfur hexafluoride is an inorganic, odorless, colorless, and nontoxic, nonflammable gas. Concentrations in the 1990s were about 4 ppt. It has the highest global warming potential of any gas evaluated, 23,900.
It is manmade and used for insulation in electric power transmission equipment, in the magnesium industry, in semiconductor manufacturing, and as a tracer gas.
Notes: ppm = parts per million; ppt = parts per trillion (measure of concentration in the atmosphere). Source: Intergovernmental Panel on Climate Change, 2007.
Water Vapor Water vapor (H2O) is the most abundant, important, and variable greenhouse gas in the atmosphere. Water vapor is not considered a pollutant; since in the atmosphere, it maintains a climate necessary for life. Changes in its concentration are primarily considered to be a result of climate feedbacks related to the warming of the atmosphere rather than a direct result of industrialization. The feedback loop in which water is involved is critically important to projecting future climate change. As the temperature of the atmosphere rises, more water is evaporated from ground storage (rivers, oceans, reservoirs, soil). Because the air is warmer, the relative humidity can be higher (in essence, the air is able to ‘hold’ more water when it is warmer), leading to more water vapor in the atmosphere. The warmer atmosphere can then hold more water vapor and so on and so on. This is referred to as a “positive feedback loop.” The extent to which this positive feedback loop will continue is unknown as there are also dynamics that hold the positive feedback loop in check. As an example, when water vapor increases in the atmosphere, more of it will eventually also condense into clouds, which are more able to reflect incoming solar radiation (thus allowing less energy to reach the Earth’s surface and heat it up). There are no health effects from water vapor itself; however, when some pollutants come in contact with water vapor, they can dissolve and the water vapor can then act as a pollutant-carrying agent. The main source of water vapor is evaporation from the oceans (approximately 85 percent). Other sources include evaporation from other water bodies, sublimation (change from solid to gas) from sea ice and snow, and transpiration from plant leaves.
California State University, Fresno – Campus Pointe Project Air Quality Revised EIR
56 Michael Brandman Associates
H:\Client (PN-JN)\3184\31840006\Revised EIR\31840006 Campus Pointe Revised EIR.doc
Carbon Dioxide Carbon dioxide (CO2) is an odorless and colorless greenhouse gas. Outdoor levels of carbon dioxide are not high enough to result in negative health effects. Carbon dioxide is emitted from natural and manmade sources. Natural sources include the decomposition of dead organic matter; respiration of bacteria, plants, animals, and fungus; evaporation from oceans; and volcanic outgassing. Anthropogenic sources include the burning of coal, oil, natural gas, and wood. Carbon dioxide is naturally removed from the air by photosynthesis, dissolution into ocean water, transfer to soils and ice caps, and chemical weathering of carbonate rocks. Since the industrial revolution began in the mid-1700s, the sort of human activity that increases greenhouse gas emissions has increased dramatically in scale and distribution. Data from the past 50 years suggests a corollary increase in levels and concentrations. As an example, prior to the industrial revolution, CO concentrations were fairly stable at 280 ppm. Today, they are around 370 ppm, an increase of more than 30 percent. Left unchecked, the concentration of carbon dioxide in the atmosphere is projected to increase to a minimum of 540 ppm by 2100 as a direct result of anthropogenic emission sources.
Methane Methane (CH4) is an extremely effective absorber of radiation, though its atmospheric concentration is less than carbon dioxide and its lifetime in the atmosphere is brief (10-12 years), compared to other greenhouse gases. No health effects are known to occur from exposure to methane. Methane has both natural and anthropogenic sources. It is released as part of the biological processes in low oxygen environments, such as in swamplands or in rice production (at the roots of the plants). Over the last 50 years, human activities such as growing rice, raising cattle, using natural gas, and mining coal have added to the atmospheric concentration of methane. Other anthropocentric sources include fossil fuel combustion and biomass burning.
Nitrous Oxide Nitrous oxide (N2O), also known as laughing gas, is a colorless greenhouse gas. Nitrous oxide can cause dizziness, euphoria, and sometimes slight hallucinations. In small doses, it is considered harmless. However, in some cases, heavy and extended use can cause Olney’s Lesions (brain damage). Concentrations of nitrous oxide also began to rise at the beginning of the industrial revolution. In 1998, the global concentration was 314 parts per billion (ppb). Nitrous oxide is produced by microbial processes in soil and water, including those reactions that occur in fertilizer containing nitrogen. In addition, to agricultural sources, some industrial processes (fossil fuel-fired power plants, nylon production, nitric acid production, and vehicle emissions) also contribute to its atmospheric load. It is used as an aerosol spray propellant, i.e., in whipped cream bottles. It is also used in potato chip bags to keep chips fresh. It is used in rocket engines and in race cars. Nitrous oxide can be transported into the stratosphere, be deposited on the earth’s surface, and be converted to other compounds by chemical reaction.
California State University, Fresno – Campus Pointe Project Revised EIR Air Quality
Michael Brandman Associates 57 H:\Client (PN-JN)\3184\31840006\Revised EIR\31840006 Campus Pointe Revised EIR.doc
Chlorofluorocarbons Chlorofluorocarbons (CFCs) are gases formed synthetically by replacing all hydrogen atoms in methane or ethane (C2H6) with chlorine and/or fluorine atoms. CFCs are nontoxic, nonflammable, insoluble, and chemically unreactive in the troposphere (the level of air at the earth’s surface). CFCs are no longer being used; therefore, it is not likely that health effects would be experienced. Nonetheless, in confined indoor locations, working with CFC-113 or other CFCs is thought to result in death by cardiac arrhythmia (heart frequency too high or too low) or asphyxiation. CFCs have no natural source. They were first synthesized in 1928 for use as refrigerants, aerosol propellants, and cleaning solvents. Due to the discovery that they are able to destroy stratospheric ozone, a global effort to halt their production was undertaken and was extremely successful, so much so that levels of the major CFCs are now remaining steady or declining. However, their long atmospheric lifetimes mean that some of the CFCs will remain in the atmosphere for over 100 years.
Hydrofluorocarbons Hydrofluorocarbons (HFCs) are synthetic, man-made chemicals that are used as a substitute for CFCs. Out of all the greenhouse gases, they are one of the three groups with the highest global warming potential. The HFCs with the largest measured atmospheric abundances are (in order), HFC-23 (CHF3), HFC-134a (CF3CH2F), and HFC-152a (CH3CHF2). Prior to 1990, the only significant emissions were of HFC-23. HFC-134a emissions are increasing due to its use as a refrigerant. The U.S. EPA estimates that concentrations are increasing due to its use as a refrigerant. The U.S. EPA estimates that concentrations of HFC-23 and HFC-134a are now about 10 parts per trillion (ppt) each; and that concentrations of HFC-152a are about 1 ppt. No health effects are known to result from exposure to HFCs, which are manmade for applications such as automobile air conditioners and refrigerants.
Perfluorocarbons Perfluorocarbons (PFCs) have stable molecular structures and do not break down though chemical processes in the lower atmosphere. High-energy ultraviolet rays, which occur approximately 60 kilometers (37.5 miles) above Earth’s surface, are able to destroy the compounds. Because of this, PFCs have very long lifetimes, between 10,000 and 50,000 years. Two common PFCs are tetrafluoromethane (CF4) and hexafluoroethane (C2F6). The U.S. EPA estimates that concentrations of CF4 in the atmosphere are over 70 ppt. No health effects are known to result from exposure to PFCs. The two main sources of PFCs are primary aluminum production and semiconductor manufacture.
Sulfur Hexafluoride Sulfur hexafluoride (SF6) is an inorganic, odorless, colorless, nontoxic, nonflammable gas. It also has the highest global warming potential of any gas evaluated (23,900). The U.S. EPA indicates that concentrations in the 1990s were about 4 ppt. In high concentrations in confined areas, the gas presents the hazard of suffocation because it displaces the oxygen needed for breathing. Sulfur
California State University, Fresno – Campus Pointe Project Air Quality Revised EIR
58 Michael Brandman Associates
H:\Client (PN-JN)\3184\31840006\Revised EIR\31840006 Campus Pointe Revised EIR.doc
hexafluoride is used for insulation in electric power transmission and distribution equipment, in the magnesium industry, in semiconductor manufacturing, and as a tracer gas for leak detection.
Climate Change/Greenhouse Gas Regulation International and Federal In 1988, the United Nations and the World Meteorological Organization established the Intergovernmental Panel on Climate Change to assess “the scientific, technical and socio economic information relevant to understanding the scientific basis of risk of human-induced climate change, its potential impacts, and options for adaptation and mitigation.”
On March 21, 1994, the United States joined a number of countries around the world in signing the United Nations Framework Convention on Climate Change. Under the Convention, governments gather and share information on greenhouse gas emissions, national policies, and best practices; launch national strategies for addressing greenhouse gas emissions and adapting to expected impacts, including the provision of financial and technological support to developing countries; and cooperate in preparing for adaptation to the impacts of climate change.
A particularly notable result of the United Nations Framework Convention on Climate Change efforts is a treaty known as the Kyoto Protocol, which went into effect on February 16, 2005. When countries sign the Protocol, they demonstrate their commitment to reduce their emissions of greenhouse gases or engage in emissions trading. More than 170 countries are currently participating in the Protocol. Industrialized countries are required to reduce their greenhouse gas emissions by an average of 5 percent below their 1990 levels by 2012. In 1998, United States Vice President Al Gore symbolically signed the Protocol; however, in anticipation of the signing, the U.S. Senate approved a non-binding “Sense of the Senate” resolution in July 1997 by a margin of 95-0 that expressed opposition to the treaty’s provisions, most notably the disparity in greenhouse gas emissions reduction obligations between industrialized nations and developing nations. In 2001, President, George W. Bush, indicated that he would not submit the treaty to the U.S. Senate for ratification, which effectively ended American involvement in the Kyoto Protocol. In December 2009, international leaders met in Copenhagen to address the future of international climate change commitments post-Kyoto. A future conference is scheduled for Mexico City in 2010.
EPA currently does not regulate greenhouse gas emissions from motor vehicles. Massachusetts v. EPA (Supreme Court Case 05-1120) was argued before the United States Supreme Court on November 29, 2006, in which it was petitioned that EPA regulate four greenhouse gases, including carbon dioxide, under Section 202(a)(1) of the Clean Air Act. A decision was made on April 2, 2007, in which the Court held that petitioners have a standing to challenge the EPA and that the EPA has statutory authority to regulate emissions of greenhouse gases from new motor vehicles.
In April 2009, the EPA published a Proposed Endangerment and Cause or Contribute Findings for Greenhouse Gases under the Clean Air Act. EPA is proposing to find that the current and projected
California State University, Fresno – Campus Pointe Project Revised EIR Air Quality
Michael Brandman Associates 59 H:\Client (PN-JN)\3184\31840006\Revised EIR\31840006 Campus Pointe Revised EIR.doc
concentrations of the mix of six key greenhouse gases—carbon dioxide (CO2), methane (CH4), nitrous oxide (N2O), hydrofluorocarbons (HFCs), perfluorocarbons (PFCs), and sulfur hexafluoride (SF6)—in the atmosphere threaten the public health and welfare of current and future generations. EPA is further proposing to find that the combined emissions of CO2, CH4, N2O, and HFCs from new motor vehicles and motor vehicle engines contribute to the atmospheric concentrations of these key greenhouse gases and hence to the threat of climate change. The proposed action does not itself impose any requirements on industry or other entities. However, the finding, if finalized by the EPA, is a key step in regulating greenhouse gases under the Clean Air Act.
However, federal regulation of greenhouse gases can occur through other means, such as fuel efficiency standards. President Barack Obama put into motion a new national policy to increase fuel economy for all new cars and trucks sold in the United States. The new standards would cover model years 2012 through 2016 and would require an average fuel economy standard of 35.5 miles per gallon in 2016. A new Corporate Average Fuel Economy (CAFE) law was passed by Congress in 2007, which required an average fuel economy of 35 miles per gallon in 2020. The EPA and the National Highway Traffic Safety Administration, on behalf of the U.S. Department of Transportation, released a notice of intent to conduct joint rulemaking to establish vehicle greenhouse gas emissions and fuel economy standards in May 2009. It should be noted, however, that the EPA’s involvement in the joint rulemaking is dependent upon finalizing the endangerment finding discussed above, thereby providing regulatory authority over greenhouse gas emissions to the EPA.
State There have been significant legislative and regulatory activities that affect climate change and greenhouse gases in California. Relevant legislation is discussed below.
Title 24. Although it was not originally intended to reduce greenhouse gas emissions, California Code of Regulations Title 24 Part 6: California’s Energy Efficiency Standards for Residential and Nonresidential Buildings, was first adopted in 1978 in response to a legislative mandate to reduce California’s energy consumption. The standards are updated periodically to allow consideration and possible incorporation of new energy efficient technologies and methods. The 2008 Standards went into effect January 1, 2010, and supersede the 2005 Standards. Projects that apply for a building permit on or after this date must comply with the 2008 Standards. Energy-efficient buildings require less electricity; therefore, increased energy efficiency reduces fossil fuel consumption and decreases greenhouse gas emissions.
AB 1493. California Assembly Bill 1493 (Pavley), enacted on July 22, 2002, required the CARB to develop and adopt regulations that reduce greenhouse gases emitted by passenger vehicles and light-duty trucks. Regulations adopted by the CARB would apply to 2009 and later-model-year vehicles. The CARB estimates that the regulation would reduce climate change emissions from the light-duty passenger vehicle fleet by an estimated 18 percent in 2020 and by 27 percent in 2030. However, the regulation was stalled by automaker lawsuits and by EPA’s refusal to grant California an
California State University, Fresno – Campus Pointe Project Air Quality Revised EIR
60 Michael Brandman Associates
H:\Client (PN-JN)\3184\31840006\Revised EIR\31840006 Campus Pointe Revised EIR.doc
implementation waiver. However, President Obama asked the EPA to review its denial of the waiver. EPA granted California’s waiver June 30, 2009, enabling California to enforce AB 1493.
Executive Order S-3-05. California Governor Arnold Schwarzenegger signed Executive Order S 3-05 on June 1, 2005, which established the following reduction targets for greenhouse gas emissions:
• By 2010, reduce greenhouse gas emissions to 2000 levels; • By 2020, reduce greenhouse gas emissions to 1990 levels; and • By 2050, reduce greenhouse gas emissions to 80 percent below 1990 levels.
The 2050 reduction goal represents what scientists believe is necessary to reach levels that will stabilize the climate. The 2020 goal was established to be an aggressive, but achievable, mid-term target. To meet these targets, the Governor directed the Secretary of the California EPA to lead a Climate Action Team (CAT) made up of representatives from the Business, Transportation, and Housing Agency; the Department of Food and Agriculture; the Resources Agency; the CARB; the Energy Commission; and the Public Utilities Commission. The CAT’s Report to the Governor in 2006 contains recommendations and strategies to help ensure the targets in Executive Order S-3-05 are met (CAT 2006).
Executive Order S-01-07 was signed by the Governor on January 18, 2007. The order mandates that a statewide goal shall be established to reduce the carbon intensity of California’s transportation fuels by at least 10 percent by 2020. It also requires that a Low Carbon Fuel Standard for transportation fuels be established for California.
SB 97 was passed in August 2007 and added Section 21083.05 to the Public Resources Code. The code states “(a) On or before July 1, 2009, the Office of Planning and Research shall prepare, develop, and transmit to the Resources Agency guidelines for the mitigation of greenhouse gas emissions or the effects of greenhouse gas emissions as required by this division, including, but not limited to, effects associated with transportation or energy consumption. (b) On or before January 1, 2010, the Resources Agency shall certify and adopt guidelines prepared and developed by the Office of Planning and Research pursuant to subdivision (a).” The Office of Planning and Research met this deadline and submitted the guidelines to the Office of Administrative Law for review
AB 32. In 2006, the California State Legislature enacted AB 32, the California Global Warming Solutions Act of 2006. AB 32 focuses on reducing greenhouse gas emissions in California. Greenhouse gases, as defined under AB 32, include carbon dioxide, methane, nitrous oxide, hydrofluorocarbons, perfluorocarbons, and sulfur hexafluoride. AB 32 requires that greenhouse gases emitted in California be reduced to 1990 levels by the year 2020. CARB is the state agency charged with monitoring and regulating sources of emissions of greenhouse gases that cause global warming in order to reduce emissions of greenhouse gases. AB 32 states the following:
California State University, Fresno – Campus Pointe Project Revised EIR Air Quality
Michael Brandman Associates 61 H:\Client (PN-JN)\3184\31840006\Revised EIR\31840006 Campus Pointe Revised EIR.doc
Global warming poses a serious threat to the economic well-being, public health, natural resources, and the environment of California. The potential adverse impacts of global warming include the exacerbation of air quality problems, a reduction in the quality and supply of water to the state from the Sierra snowpack, a rise in sea levels resulting in the displacement of thousands of coastal businesses and residences, damage to marine ecosystems and the natural environment, and an increase in the incidences of infectious diseases, asthma, and other human health-related problems.
The CARB approved the 1990 greenhouse gas emissions level of 427 MMTCO2e on December 6, 2007. Therefore, emissions generated in California in 2020 are required to be equal to or less than 427 MMTCO2e.
Under the current “business as usual” scenario, statewide emissions are increasing at a rate of approximately 1 percent per year as noted below. Also shown are the average reductions needed from all statewide sources (including all existing sources) to reduce greenhouse gas emissions back to 1990 levels.
• 1990: 427 MMTCO2e • 2004: 480 MMTCO2e (an average 11 percent reduction needed to achieve 1990 base) • 2008: 495 MMTCO2e (an average 14 percent reduction needed to achieve 1990 base) • 2020: 596 MMTCO2e Business As Usual (an average 28 percent reduction needed to achieve
1990 base) Under AB 32, the CARB published its Final Expanded List of Early Action Measures to Reduce Greenhouse Gas Emissions in California in 2007. Discrete early action measures are currently underway or are enforceable by January 1, 2010. Early action measures are regulatory or non-regulatory and are currently in progress or to be initiated by the CARB in the 2007 to 2012 timeframe. The CARB has 44 early action measures that apply to the transportation, commercial, forestry, agriculture, cement, oil and gas, fire suppression, fuels, education, energy efficiency, electricity, and waste sectors. Of those early action measures, nine are considered discrete early action measures, as they are regulatory and enforceable by January 1, 2010. The CARB estimates that the 44 recommendations are expected to result in reductions of at least 42 MMTCO2e by 2020, representing approximately 25 percent of the 2020 target.
The CARB Board approved the Climate Change Scoping Plan (Scoping Plan) in December 2008. The Scoping Plan outlines actions to obtain the goal set out in AB 32 of reducing emissions to 1990 levels by the year 2020. The Scoping Plan “proposes a comprehensive set of actions designed to reduce overall greenhouse gas emissions in California, improve our environment, reduce our dependence on oil, diversify our energy sources, save energy, create new jobs, and enhance public health” (California Air Resources Board, 2008). The measures in the Scoping Plan will be in place by 2012. The Scoping Plan’s recommendations for reducing greenhouse gas emissions to 1990 levels by 2020 providing for emission reduction measures, including a cap-and-trade program linked to
California State University, Fresno – Campus Pointe Project Air Quality Revised EIR
62 Michael Brandman Associates
H:\Client (PN-JN)\3184\31840006\Revised EIR\31840006 Campus Pointe Revised EIR.doc
Western Climate Initiative partner jurisdictions, green building strategies, recycling and waste-related measures, and Voluntary Early Actions and Reductions. AB 32 did not amend CEQA or establish regulatory standards to be applied to new development or environmental review of projects within the State.
The Scoping Plan calls for an “ambitious but achievable” reduction in California’s greenhouse gas emissions, cutting approximately 30 percent from business-as-usual emission levels projected for 2020, or about 10 percent from today’s levels. On a per-capita basis, that means reducing annual emissions of 14 tons of carbon dioxide for every man, woman and child in California down to about 10 tons per person by 2020.
The Scoping Plan states that “The 2020 goal was established to be an aggressive, but achievable, mid-term target, and the 2050 greenhouse gas emissions reduction goal represents the level scientists believe is necessary to reach levels that will stabilize climate” (California Air Resources Board, 2008a, page 4). The year 2020 goal of AB 32 corresponds with the mid-term target established by S-3-05, which aims to reduce California’s fair-share contribution of greenhouse gases in 2050 to levels that will stabilize the climate.
Emission reductions in California would not be able to stabilize the concentration of greenhouse gases in the atmosphere. However, California’s actions set an example and drive progress towards a reduction in greenhouse gases. If other countries were to follow California’s emission reduction targets, this could avoid medium or higher ranges of global temperature increases. Thus, severe consequences of climate change could also be avoided.
SB 375 passed the Senate on August 30, 2008 and was signed by the Governor on September 30, 2008. According to SB 375, the transportation sector is the largest contributor of greenhouse gas emissions, which emits over 40 percent of the total greenhouse gas emissions in California. SB 375 states that “Without improved land use and transportation policy, California will not be able to achieve the goals of AB 32.” SB 375 does the following: (1) requires metropolitan planning organizations to include sustainable community strategies in their regional transportation plans for reducing greenhouse gas emissions, (2) aligns planning for transportation and housing, and (3) creates specified incentives for the implementation of the strategies. Concerning CEQA, SB 375, Section 21159.28 states that CEQA findings determinations for certain projects are not required to reference, describe, or discuss (1) growth inducing impacts or (2) any project-specific or cumulative impacts from cars and light-duty truck trips generated by the project on global warming or the regional transportation network if the project:
1. Is in an area with an approved sustainable communities strategy or an alternative planning strategy that the ARB accepts as achieving the greenhouse gas emission reduction targets;
2. Is consistent with that strategy (in designation, density, building intensity, and applicable policies); and
California State University, Fresno – Campus Pointe Project Revised EIR Air Quality
Michael Brandman Associates 63 H:\Client (PN-JN)\3184\31840006\Revised EIR\31840006 Campus Pointe Revised EIR.doc
3. Incorporates the mitigation measures required by an applicable prior environmental document.
Executive Order S-13-08. Executive Order S-13-08 indicates that “climate change in California during the next century is expected to shift precipitation patterns, accelerate sea level rise and increase temperatures, thereby posing a serious threat to California’s economy, to the health and welfare of its population and to its natural resources.” Pursuant to the requirements in the order, in December 2009, the California Natural Resources Agency released its 2009 California Climate Adaptation Strategy. The Strategy is the “ . . . first statewide, multi-sector, region-specific, and information-based climate change adaptation strategy in the United States.” Objectives include analyzing risks of climate change in California, identifying and exploring strategies to adapt to climate change, and specifying a direction for future research.
Global Climate Change and CEQA There are several unique challenges to analyzing global warming under CEQA, largely because of its “global” nature. Typical CEQA analyses address local actions that have local—or, at most, regional—impacts, whereas global warming presents the considerable challenge of analyzing the relationship between local and global activities and the resulting potential, if any, for local or global environmental impacts. Most environmental analyses examine the “project-specific” impacts that a particular project is likely to generate. With regard to global warming, however, it is generally accepted that the magnitude of global warming effects is so significant and the contribution of an individual project to global warming is so small that direct significant adverse impacts (albeit not necessarily cumulative significant adverse impacts) would be highly unlikely. The issue of global climate change is also fundamentally different from any other areas of air quality impact analysis, which are all linked to some region or area in which the impact is significant. Instead, a global climate change analysis must be conducted on a global level, rather than the typical local or regional setting, and requires consideration not only of emissions from the project under consideration but also the extent of the displacement, translocation, and redistribution of emissions. In usual context, where air quality is linked to a particular location or area, it is appropriate to consider the creation of new emissions in that specific area to be an environmental impact whether or not the emissions are truly “new” emissions to the overall global inventory. In fact, the approval of a new developmental plan or project does not necessarily create new automobile drivers—the primary source of a land use project’s emissions. Rather, new land use projects merely redistribute existing mobile emissions; accordingly, the use of models that measure overall emissions increases without accounting for existing emissions will substantially overstate the impact of the development project on global warming. This makes an accurate analysis of greenhouse gas emissions substantially different from other air quality impacts, where the “addition” of redistributed emissions to a new locale can make a substantial difference to overall air quality.
California State University, Fresno – Campus Pointe Project Air Quality Revised EIR
64 Michael Brandman Associates
H:\Client (PN-JN)\3184\31840006\Revised EIR\31840006 Campus Pointe Revised EIR.doc
SJVAPCD CEQA Greenhouse Gas Guidance On December 17, 2009, the SJVAPCD Governing Board adopted “Guidance for Valley Land-use Agencies in Addressing GHG Emission Impacts for New Projects under CEQA,” and the policy, “District Policy – Addressing GHG Emission Impacts for Stationary Source Projects Under CEQA When Serving as the Lead Agency.” The SJVAPCD concluded that the existing science is inadequate to support quantification of the impacts that project-specific greenhouse gas emissions have on global climatic change. The SJVAPCD found the effects of project-specific emissions to be cumulative, and without mitigation, their incremental contribution to global climatic change could be considered cumulatively considerable. The SJVAPCD found that this cumulative impact is best addressed by requiring all projects to reduce their greenhouse gas emissions, whether through project design elements or mitigation.
Best Performance Standards would be established according to performance-based determinations. Projects complying with Best Performance Standards would not require specific quantification of greenhouse gas emissions and would be determined to have a less than significant cumulative impact for greenhouse gas emissions. Projects not complying with Best Performance Standards would require quantification of greenhouse gas emissions and demonstration that greenhouse gas emissions have been reduced or mitigated by 29 percent, as targeted by CARB’s AB 32 Scoping Plan. Furthermore, quantification of greenhouse gas emissions would be required for all projects for which the lead agency has determined that an Environmental Impact Report is required, regardless of whether the project incorporates Best Performance Standards.
For development projects, Best Performance Standards means “Any combination of identified greenhouse gas emission reduction measures, including project design elements and land use decisions that reduce project specific greenhouse gas emission reductions by at least 29 percent as compared to business as usual.” The SJVAPCD proposes to create a list of all approved Best Performance Standards to help in the determination as to whether a proposed project has reduced its greenhouse gas emissions by at least 29 percent. The process of developing Best Performance Standards is currently underway, but no timeline has been established for the completion of the list. In the interim, this analysis follows the provisions for addressing greenhouse gases in the CEQA Guidelines.
CEQA Guidelines The CEQA Guidelines amendments for greenhouse gas emissions state that a lead agency may take into account the following three considerations in assessing the significance of impacts from greenhouse gas emissions.
• Consideration #1: The extent to which the project may increase or reduce greenhouse gas emissions as compared to the existing environmental setting. This discussion could involve a quantification of greenhouse gas emissions to the extent feasible.
California State University, Fresno – Campus Pointe Project Revised EIR Air Quality
Michael Brandman Associates 65 H:\Client (PN-JN)\3184\31840006\Revised EIR\31840006 Campus Pointe Revised EIR.doc
• Consideration #2: Whether the project emissions exceed a threshold of significance that the lead agency determines applies to the project.
• Consideration #3: The extent to which the project complies with regulations or requirements adopted to implement a statewide, regional, or local plan for the reduction or mitigation of greenhouse gas emissions. Such regulations or requirements must be adopted by the relevant public agency through a public review process and must include specific requirements that reduce or mitigate the project’s incremental contribution of greenhouse gas emissions. If there is substantial evidence that the possible effects of a particular project are still cumulatively considerable notwithstanding compliance with the adopted regulations or requirements, an EIR must be prepared for the project.
The CEQA Guidelines amendments pertaining to greenhouse gas emissions include two new checklist questions pertaining to greenhouse gas emissions, listed below:
Would the project: a. Generate greenhouse gas emissions, either directly or indirectly, that may have a
significant impact on the environment?
b. Conflict with any applicable plan, policy or regulation of an agency adopted for the purpose of reducing the emissions of greenhouse gases?
This analysis will take into account the three considerations listed above to address these two questions. Quantitative and qualitative air pollution thresholds are used to determine the significance of project emissions. These thresholds are discussed under each impact section below.
3.7 - Greenhouse Gas and Climate Change Impacts
Development of the project would generate air pollutant emissions from a wide variety of stationary and mobile sources. Stationary source emissions, such as PM10, would be generated by onsite construction activities. Once the proposed project is complete and occupied, emissions would be generated by stationary sources such as water and space heaters. Mobile source emissions would be generated by motor vehicle travel associated with construction activities and occupancy of the proposed development. This section of the Air Quality Impact Assessment addresses and analyzes the regional (areawide) and localized air quality impacts associated with the project.
3.7.1 - Standards of Significance Threshold
For the purposes of this EIR, impacts are considered significant if implementation of the proposed project would:
California State University, Fresno – Campus Pointe Project Air Quality Revised EIR
66 Michael Brandman Associates
H:\Client (PN-JN)\3184\31840006\Revised EIR\31840006 Campus Pointe Revised EIR.doc
• Generate greenhouse gas emissions, either directly or indirectly, that may have a significant impact on the environment
• Conflict with any applicable plan, policy or regulation of an agency adopted for the purpose of reducing the emissions of greenhouse gases
Threshold Discussion
Generally, the evaluation of an impact under CEQA requires measuring data from a project against a “threshold of significance.” The Office of Planning and Research’s proposed amendments to the CEQA Guidelines state that “[w]hen adopting thresholds of significance, a lead agency may consider thresholds of significance previously adopted or recommended by other public agencies, or recommended by experts, provided the decision of the lead agency to adopt such thresholds is supported by substantial evidence.”
The Office of Planning and Research transmitted proposed SB 97 CEQA Guidelines Amendments to the Natural Resources Agency on April 13, 2009. On July 3, 2009, the Natural Resources Agency commenced the Administrative Procedure Act rulemaking process for certifying and adopting these amendments pursuant to Public Resources Code Section 21083.05. On December 31, 2009, the Natural Resources Agency delivered its rulemaking package to the Office of Administrative Law for their review pursuant to the Administrative Procedure Act. The adopted amendments will be effective on March 18, 2010 (CNRA 2009).
The amended Guidelines Section 15064.4(a) states, “ . . . A lead agency shall have discretion to determine, in the context of a particular project, whether to: (1) Use a model or methodology to quantify greenhouse gas emissions resulting from a project, and which model or methodology to use . . . ; or (2) Rely on a qualitative analysis or performance based standards.”
The proposed CEQA Guidelines amendments do not identify a threshold of significance for greenhouse gas emissions, nor do they prescribe assessment methodologies or specific mitigation measures. Instead, they call for a “good faith effort, based on available information, to describe, calculate, or estimate the amount of greenhouse gas emissions resulting from a project.”
As stated previously, the SJVAPCD adopted the guidance document, “Addressing Greenhouse Gas Emissions Impacts Under the California Environmental Quality Act.” The guidance document does not propose a specific numeric threshold, but requires all new projects with increased greenhouse gas emissions to implement performance based standards, or otherwise demonstrate the project-specific greenhouse gas emissions have been mitigated by at least 29 percent, compared with business as usual. For development projects (residential, commercial or industrial), business as usual are the total baseline emissions for all emissions sources within the development type, projected for the year 2020, assuming no change in greenhouse gas emissions per unit of activity as established for the baseline period. The 29-percent emission reductions in greenhouse gases would be a combination of the
California State University, Fresno – Campus Pointe Project Revised EIR Air Quality
Michael Brandman Associates 67 H:\Client (PN-JN)\3184\31840006\Revised EIR\31840006 Campus Pointe Revised EIR.doc
emission reduction achieved through implementation of Best Performance Standards and greenhouse gas emission reductions achieved since the 2002–2004 baseline period through efficiencies such as improved energy standards, increased vehicle fuel standards, etc. This analysis demonstrates that project emissions will be at least 29 percent less in 2020 compared with the baseline period.
The California State Legislature adopted AB 32 in 2006. AB 32 states that “global warming poses a serious threat to the economic well-being, public health, natural resources, and the environment of California.” AB 32 focuses on reducing greenhouse gases (carbon dioxide, methane, nitrous oxide, hydrofluorocarbons, perfluorocarbons, and sulfur hexafluoride) to 1990 levels by the year 2020. Pursuant to the requirements in AB 32, a Scoping Plan was adopted. The Scoping Plan outlines actions recommended to obtain that goal.
The Scoping Plan states that “The 2020 goal was established to be an aggressive, but achievable, mid-term target, and the 2050 greenhouse gas emissions reduction goal represents the level scientists believe is necessary to reach levels that will stabilize climate.” The 2050 goal is in Executive Order S-3-05. The year 2020 greenhouse gas emission reduction goal of AB 32 corresponds with the mid-term target established by S-3-05, which aims to reduce California’s fair-share contribution of greenhouse gases in 2050 to levels that will stabilize the climate.
In summary, two criteria are used in this analysis to determine significance: the significance thresholds recommended by the SJVAPCD requiring best performance standards and a determination of whether the project would conflict with any applicable plan, policy, or regulation of an agency adopted to reduce emissions of greenhouse gases. No applicable greenhouse gas reduction plan is available. The SJVAPCD greenhouse gas guidance document recommends approaches to determining potential significance under CEQA; it is not a plan, policy, or regulation adopted for the purpose of reducing emissions of greenhouses gases. Therefore, consistency with the reduction targets of the CARB’s approved Scoping Plan will be used to determine significance for this criterion. The Scoping Plan provides a strategy that reduces greenhouse gas emissions in the year 2020 by 28 percent compared with business as usual. This would reduce California’s greenhouse gas emissions to 1990 levels. A project that has implemented measures consistent with the Scoping Plan strategies and that has projected 2020 emissions that are at least 28 percent lower than business as usual would be considered consistent with the Scoping Plan and would have a less than significant impact on climate change.
Impact Analysis Project Inventory – Business as Usual This analysis is restricted to greenhouse gases identified by AB 32, which include carbon dioxide, methane, nitrous oxide, hydrofluorocarbons, perfluorocarbons, and sulfur hexafluoride. The project would generate a variety of greenhouse gases during construction and operation, including several defined by AB 32 such as carbon dioxide, methane, nitrous oxide, and hydrofluorocarbons.
California State University, Fresno – Campus Pointe Project Air Quality Revised EIR
68 Michael Brandman Associates
H:\Client (PN-JN)\3184\31840006\Revised EIR\31840006 Campus Pointe Revised EIR.doc
The project may emit greenhouse gases that are not defined by AB 32. For example, the project may generate aerosols. Aerosols are suspensions of fine solid particles or liquid droplets in a gas that act similarly to greenhouse gases. They are short-lived and remain in the atmosphere for about one week. Black carbon is a component of aerosol. A few studies have indicated that black carbon has a high global warming potential; however, the Intergovernmental Panel on Climate Change (2007) states that it has a low level of scientific certainty. Water vapor, another greenhouse gas, could be emitted from evaporated water used for landscaping, but this is not a significant impact because water vapor concentrations in the upper atmosphere are primarily due to climate feedbacks such as evaporation and condensation effects rather than emissions from project-related activities. The project would emit nitrogen oxides and volatile organic compounds, which are ozone precursors. Ozone is a greenhouse gas; however, unlike the other greenhouse gases, ozone in the troposphere is relatively short-lived and can be reduced in the troposphere on a daily basis.
Certain greenhouse gases defined by AB 32 would not be emitted by the project. Perfluorocarbons and sulfur hexafluoride are typically used in industrial applications, none of which would be used by the project. Therefore, it is not anticipated that the project would emit perfluorocarbons or sulfur hexafluoride.
For this analysis, business as usual refers to emissions before reductions from project design features and future regulations.
Construction The project would emit greenhouse gases from upstream emission sources and direct sources (combustion of fuels from worker vehicles and construction equipment).
An upstream emission source (also known as life cycle emissions) refers to emissions that were generated during the manufacture of products to be used for construction of the project. Upstream emission sources for the project include but are not limited to the following: emissions from the manufacture of cement, emissions from the manufacture of steel, and/or emissions from the transportation of building materials. The upstream emissions were not estimated because they are not within the control of the project and to do so would be speculative at this time. Additionally, the California Air Pollution Control Officer’s Association White Paper on CEQA & Climate Change supports this conclusion by stating, “The full life-cycle of GHG [greenhouse gas] emissions from construction activities is not accounted for . . . and the information needed to characterize [life-cycle emissions] would be speculative at the CEQA analysis level.” Therefore, pursuant to CEQA Guidelines Sections 15144 and 15145, upstream/life cycle, emissions are speculative and no further discussion is necessary.
Construction equipment such as cranes, bulldozers, forklifts, backhoes, and water trucks are expected to be used on the project site and would result in exhaust emissions consisting of carbon dioxide, methane, and nitrous oxide.
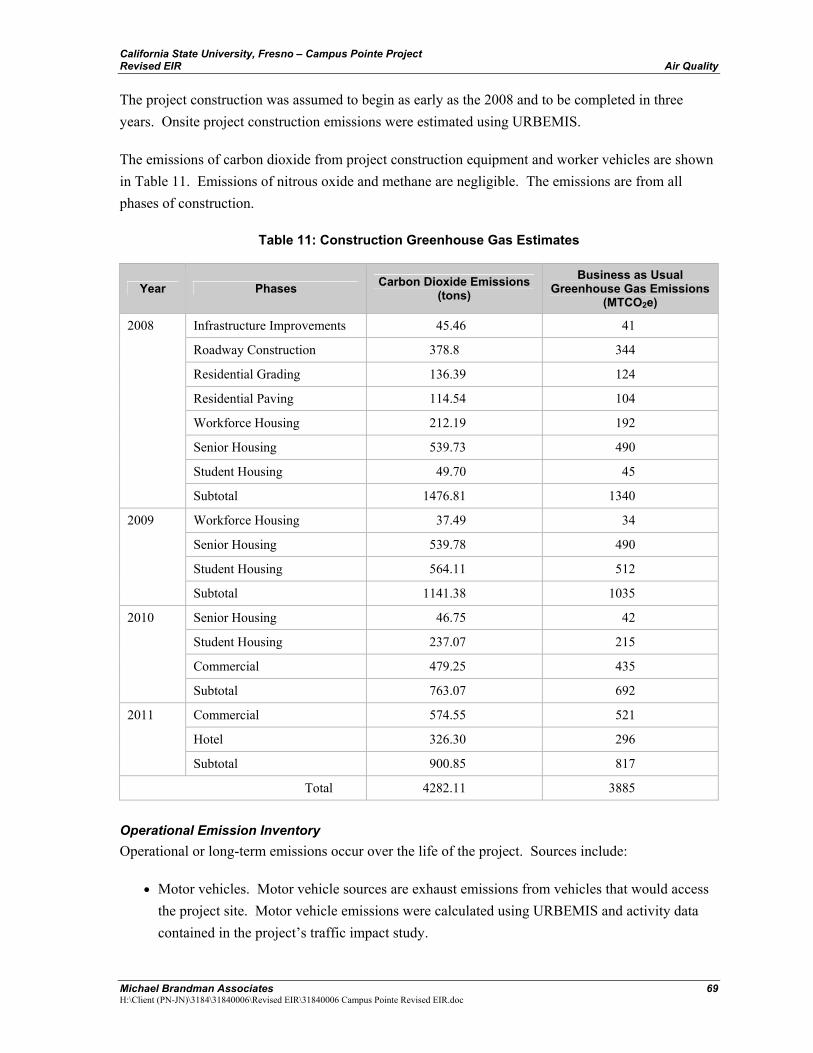
California State University, Fresno – Campus Pointe Project Revised EIR Air Quality
Michael Brandman Associates 69 H:\Client (PN-JN)\3184\31840006\Revised EIR\31840006 Campus Pointe Revised EIR.doc
The project construction was assumed to begin as early as the 2008 and to be completed in three years. Onsite project construction emissions were estimated using URBEMIS.
The emissions of carbon dioxide from project construction equipment and worker vehicles are shown in Table 11. Emissions of nitrous oxide and methane are negligible. The emissions are from all phases of construction.
Table 11: Construction Greenhouse Gas Estimates
Year Phases Carbon Dioxide Emissions(tons)
Business as Usual Greenhouse Gas Emissions
(MTCO2e)
Infrastructure Improvements 45.46 41
Roadway Construction 378.8 344
Residential Grading 136.39 124
Residential Paving 114.54 104
Workforce Housing 212.19 192
Senior Housing 539.73 490
Student Housing 49.70 45
2008
Subtotal 1476.81 1340
Workforce Housing 37.49 34
Senior Housing 539.78 490
Student Housing 564.11 512
2009
Subtotal 1141.38 1035
Senior Housing 46.75 42
Student Housing 237.07 215
Commercial 479.25 435
2010
Subtotal 763.07 692
Commercial 574.55 521
Hotel 326.30 296
2011
Subtotal 900.85 817
Total 4282.11 3885 Operational Emission Inventory Operational or long-term emissions occur over the life of the project. Sources include:
• Motor vehicles. Motor vehicle sources are exhaust emissions from vehicles that would access the project site. Motor vehicle emissions were calculated using URBEMIS and activity data contained in the project’s traffic impact study.
California State University, Fresno – Campus Pointe Project Air Quality Revised EIR
70 Michael Brandman Associates
H:\Client (PN-JN)\3184\31840006\Revised EIR\31840006 Campus Pointe Revised EIR.doc
• Natural gas. Natural gas refers to exhaust from natural gas usage. Carbon dioxide emissions were estimated using URBEMIS. Methane and nitrous oxide emissions were estimated based on emission factors as described in Appendix B-4.
• Offsite electricity generation refers to the emissions generated from offsite power plants for the electricity required for the project.
• Water transport refers to the electricity required to transport and treat the water that would be used for the project.
• Waste refers to the emissions from the waste generated by the project taken to a landfill and decomposing. To estimate these emissions, first, the waste to be generated from the project is estimated. Then the different percentages of the waste stream (i.e., food scraps, plastics, paper, etc.) are estimated. Then the waste to be generated is input into the EPA Waste Reduction Model (WARM), which outputs the annual emissions. See Appendix B-4 for the modeling results from the WARM model.
• Refrigerants refer to fugitive hydrofluorocarbons emissions from normal operation of refrigeration systems and the heating and ventilation systems. Potential tenants are unknown; therefore, refrigeration systems were not included in the emission estimates. However, air conditioning emissions were included based on experience with commercial and residential projects.
The unmitigated emissions estimations from operating the proposed project in 2020 are presented in Table 12. This list is not exhaustive and does not contain all greenhouse gas emissions associated with the project, such as emissions from landscaping; however, it does attempt to present the major sources of greenhouse gas emissions.
Table 12: 2020 Operational Business as Usual Greenhouse Gas Estimates
Source Emissions (MTCO2e per year)
Motor vehicles 16,245
Natural gas 1,850
Electricity 3,760
Water transport 162
Waste 950
Refrigerants (HVAC) 4,936
Total 27,903
Notes: MTCO2e = metric tons of carbon dioxide equivalents (includes carbon dioxide, methane, nitrous oxide, and hydrofluorocarbons). Source: Michael Brandman Associates, 2010.
California State University, Fresno – Campus Pointe Project Revised EIR Air Quality
Michael Brandman Associates 71 H:\Client (PN-JN)\3184\31840006\Revised EIR\31840006 Campus Pointe Revised EIR.doc
As shown in Table 12, emissions would be approximately 27,903 MTCO2e per year. The main sources emissions are from motor vehicles 16,245 MTCO2e (58 percent).
Project Design Features that Reduce Greenhouse Gas Emissions Future development projects are expected to result in increased greenhouse gas emissions if they substantially increase electricity and natural gas consumption, vehicle miles traveled, and solid waste generation and subsequent disposal into landfills.
The proposed project would incorporate a variety of features that would reduce its energy and water demand, promote waste reduction, and create opportunities for reductions in vehicle miles traveled, which will have the effect of helping reduce greenhouse gases either directly onsite, indirectly by reducing the need for electricity generation, or offsite in materials production and materials disposal. Table 13 describes the project design features, how the design feature reduces emissions and its consistency with strategies recommended by the California Attorney General’s office, the California Air Pollution Control Officers Association, and the CARB Scoping Plan.
Table 13: Project Design Features that Reduce Emissions
Category Project Design Feature Reductions in Emissions Strategy
Consistency
Efficient Delivery of Services: The proposed project would develop a mixed-use center in an area with a large employee and student population nearby that could walk, bicycle, or use transit to take advantage of housing, services and activities on the project site.
The proposed project would reduce trip lengths for employees and students who will be provided with a broad array of retail offering and housing availability. As such, it would be expected to reduce tailpipe emissions for these trips.
AG
Mixed Uses: The proposed project includes housing, shopping, and restaurants, which would provide opportunities for employees and customers to stay onsite for meals instead of traveling to offsite locations.
This would reduce motor vehicle emissions, which is accounted for in the internal trip reductions. CAPCOA indicates that Measure D-3 is associated with a 0.5 to 5 percent reduction. The reduction from this feature is included in the business as usual emissions; the traffic study identifies the trip reduction as pass-by trips and internal capture trips.
AG, CAPCOA Measure D-3
Reduction in Travel Lengths
Mixed Uses: The proposed project would locate a retail center with multiple uses within 0.25 miles of onsite residential development. This would provide nearby residents with the opportunity to walk for services or reduce travel lengths.
This would reduce motor vehicles emissions. CAPCOA indicates that Measure D-10 is associated with a 3 percent reduction. The reduction from this feature is not included in the business as usual emissions.
AG, CAPCOA Measure D-10
California State University, Fresno – Campus Pointe Project Air Quality Revised EIR
72 Michael Brandman Associates
H:\Client (PN-JN)\3184\31840006\Revised EIR\31840006 Campus Pointe Revised EIR.doc
Table 13 (cont.): Project Design Features that Reduce Emissions
Category Project Design Feature Reductions in Emissions Strategy
Consistency
Reduction in Travel Lengths (cont.)
Pedestrian Connections: Direct pedestrian connections would be provided to link Campus Pointe with the University and other nearby commercial uses. These connections would also be linked to the proposed sidewalks along the project site frontage.
This feature may encourage people to walk from one use to the other, thereby reducing vehicle trips. In addition, it would make the proposed project conveniently accessible to surrounding residential areas, which would allow residents to walk to the project site instead of drive.
CAPCOA indicates that Measure T-5 and T-6 are associated with a 1 to 10 percent reduction. Measure T-12 is associated with a 1 to 4 percent reduction.
AG, CAPCOA Measure T-5, T-6, and T-12
AG, CAPCOA Measure T-1
End of Trip Facilities
Bicycle Parking: The proposed project would provide safe and convenient bicycle parking.
These measures would make the project conveniently accessible to bicycles and encourage alternatives to driving. The CAPCOA measures are associated with a reduction of 1 to 5 percent. No reduction was taken for these measures.
CAPCOA Measure T-2
Energy Efficiency
The project would be designed to meet Title 24 standards.
This feature would promote efficient energy use.
AG, CARB Scoping Plan Measure 3 (Energy Efficiency).
Water Conservation
The project would comply with CSU water conservation measures.
This feature would conserve water.
AG, CARB Scoping Plan Measure 17 (Water).
Solid Waste Reduction
The project would comply with CSU recycling measures.
This measure would reduce waste generation emissions and from upstream emission sources, such as material extraction, processing, and manufacturing.
AG, CARB Scoping Plan Measure 15 (Recycling and Waste), CAPCOA Measure D-14
Notes: AG = Attorney General’s Office CARB = California Air Resources Board Scoping Plan CAPCOA = California Air Pollution Control Officers Associates White Paper Source: Michael Brandman Associates, 2010.
As discussed in the regulatory section, the SJVAPCD will establish a list of greenhouse gas emission reduction measures with pre-quantified greenhouse gas emission reduction effectiveness that they refer to as best performance standards (BPS). The BPS have not yet been finalized however, the SJVAPCD Staff Report “Addressing Greenhouse Gas Emissions Impacts Under the California
California State University, Fresno – Campus Pointe Project Revised EIR Air Quality
Michael Brandman Associates 73 H:\Client (PN-JN)\3184\31840006\Revised EIR\31840006 Campus Pointe Revised EIR.doc
Environmental Quality Act” provides preliminary reduction estimates based on best available studies and methodologies. Emissions from development projects primarily occur indirectly through energy consumption and VMT generated by residents and customers accessing the project site. The SJVAPCD notes that projects can reduce greenhouse gas emissions from energy consumption through building designs that increase energy efficiency, water conservation, and the use of energy efficient appliances. Projects can further reduce greenhouse gas emissions through project designs that reduce VMT through features that promote pedestrian access and use of public transportation. Land use planning decisions, such as creating mixed-use development, discouraging leapfrog development, and creating favorable jobs to housing ratios can significantly reduce VMT and the associated greenhouse gas emissions. The project design features described above, project location and transportation infrastructure are consistent with the SJVAPCD BPS approach to reducing greenhouse gas emissions.
Under the SJVAPCD proposed approach, projects implementing best performance standards and reducing greenhouse gas emissions by 29 percent compared with business as usual emissions for the year 2020 would be considered to have a less than significant individual and cumulative impact on global climate change. The 29-percent emission reductions may be achieved through any combination of greenhouse gas emission reduction measures, including greenhouse gas emission reductions achieved as a result of changes in building and appliance standards occurring since the 2002-2004 baseline period. It is appropriate to include standards and regulations that reduce emissions by the Scoping Plan’s 2020 target year because the energy used by the project purchased from the grid will result in much lower emissions as the renewable energy portfolio standard is implemented over time. Motor vehicle greenhouse gas emissions associated with the project will also decline over time as state and federal fuel efficiency standards are implemented. The CARB adopted regulation to control emissions of refrigerants in commercial refrigeration systems (Regulation for the Management of High Global Warming Potential Refrigerants for Stationary Sources) that CARB estimates will reduce emissions from this source by 50 percent by 2020. Refrigerants are the second-largest source of emissions estimated for the project. Finally, the project’s emissions related to electricity consumption are expected to be substantially lower than the forecasted amounts due to meeting 2005 and 2008 Title 24 Building Energy Efficiency Standards.
Reductions from State Regulations and AB 32 Measures and Project Design Features The following describes the emission reductions that CARB predicts for state regulations that implement AB 32 along with the reductions that these regulations will provide for emission sources from the proposed project. Also provided are estimates for the emission reductions from project design features that reduce energy consumption and motor vehicle use.
State Regulations and AB 32 Emission Reductions The operational emissions after incorporation of state regulations are shown in Table 14. As shown in the table, adopted regulations reduce project emissions by 6,843 MTCO2e, or approximately 24.5 percent.
California State University, Fresno – Campus Pointe Project Air Quality Revised EIR
74 Michael Brandman Associates
H:\Client (PN-JN)\3184\31840006\Revised EIR\31840006 Campus Pointe Revised EIR.doc
Project Emission Reductions The project benefited from various URBEMIS trip reduction measures from the project design and locational features. The project was able to benefit from trip reductions as a result of the following URBEMIS mitigation measures:
• Jobs/Housing Balance – The project is an infill development and is surrounded by jobs and residences.
• Bicycle/Pedestrian Friendliness - The project will provide pedestrian-friendly measures such as sidewalks and pedestrian access from nearby development.
• Bicycle/Pedestrian Friendliness - The project will provide a dedicated bicycle route to the development.
• Transit - The project is served by existing transit.
• Transportation Demand Measures – The project will provide information to employees on alternative transportation, the project will provide bicycle parking.
These measures resulted in a 28.11-percent reduction in operational CO2 emissions from motor vehicles.
Emissions with Project Design Features and Regulations The operational emissions after incorporation of project design features, mitigation measures in other impact areas, and future regulations are shown in Table 14. Project reductions and future regulations reduce emissions by 10,355 MTCO2e, approximately 37.1 percent. After application of reductions from the project and regulations, the main source of emissions is from motor vehicles, contributing 54 percent of the emissions.
The project is expected to achieve solid waste recycling and diversion percentages similar to those of the City of Fresno, which has been ranked the number one city of its size for recycling in California. The WARM model used for this analysis uses a life-cycle analysis approach that includes emission savings from recycling and waste diversion that result from reductions in mining, manufacturing, processing, and transport of raw materials and finished products. Since life-cycle emissions are not available, or are considered speculative for other source categories, it would not allow a valid comparison with this source category. For this reason, only the unmitigated emissions are presented in the table. Based on the size of the waste emissions category and programs in place to reduce emissions from this source, waste should be considered to make an insignificant contribution of greenhouse gas emissions.
California State University, Fresno – Campus Pointe Project Revised EIR Air Quality
Michael Brandman Associates 75 H:\Client (PN-JN)\3184\31840006\Revised EIR\31840006 Campus Pointe Revised EIR.doc
Reduction Assumptions A description of the reduction assumptions for the measures shown in Table 14 is provided below:
• Motor Vehicles, Project Design Features: Emissions from passenger motor vehicles are reduced by 28.11 percent as detailed in the URBEMIS mitigation measures.
• Motor Vehicles, Pavley I Standards: The EPA recently granted the waiver for California for its greenhouse gas emission standards for motor vehicles. The Pavley I (AB 1493) regulation, which has already been adopted by CARB, requires GHG emission reductions from passenger cars and light trucks up to the 2016 model year. This regulation is expected to provide 27.7 MMTCO2e of emission reductions in 2020. The Pavley I standards are expected to reduce total emissions for automobiles and light trucks by 17.2 percent relative to the scenario without Pavley or corporate average fuel economy by the year 2020. A 17.2-percent reduction from business as usual emissions is taken for this regulation. The CARB is currently developing standards for passenger vehicles model year 2017 and later that is being referred to as Pavley II. That regulation will also provide reductions by 2020, but are not counted in this analysis.
• Motor Vehicles, Low Carbon Fuel Standard (LCFS): CARB adopted a new regulation in December 2009 to implement the California Low Carbon Fuel Standard (LCFS). The regulation is a discrete early action measure under AB 32 and effectuates Governor Schwarzenegger’s Executive Order S-01-07. The regulation will reduce greenhouse gas emissions by reducing the carbon intensity of transportation fuels used in California by an average of 10 percent by the year 2020. The CARB Scoping Plan estimates this regulation will provide 15 MMTCO2e of emission reductions in 2020. The LCFS is expected to reduce total emissions from passenger vehicles and heavy-duty trucks by 7.2 percent. A 7.2-percent-reduction from business as usual emissions for passenger vehicles and heavy-duty trucks is taken for this regulation.
• Motor Vehicles, Passenger Vehicle Efficiency: CARB identified several measures that would further reduce tailpipe greenhouse gas emissions from passenger vehicles, by increasing vehicle efficiency. These measures include ensuring proper tire inflation and solar-reflective automotive paint and window glazing (cool car standards). The CARB Scoping Plan estimates these regulations will provide 1.44 MMTCO2e of emission reductions in 2020. These measures are expected to reduce total emissions from passenger vehicles by 0.9 percent. A 0.9-percent reduction from business as usual emissions for passenger vehicles is taken for these regulations.
- CARB approved the regulation that requires California’s automotive maintenance industry to check the tire pressure of every vehicle they service in March 2009. A properly inflated tire helps to reduce fuel greenhouse gas emissions by reducing tire rolling resistance.
- In June 2009, CARB approved the cool car standards, which cut greenhouse gases by reducing heat gain in automobile interiors. The cool car standards begin phasing in with the 2012 model year. The regulation requires that passenger cars, pickup trucks and
California State University, Fresno – Campus Pointe Project Air Quality Revised EIR
76 Michael Brandman Associates
H:\Client (PN-JN)\3184\31840006\Revised EIR\31840006 Campus Pointe Revised EIR.doc
sport utility vehicles be equipped with windows that reduce the amount of heat that enters the vehicle from solar radiation. Less heat inside the vehicle will allow air conditioning units to be downsized or used less, thereby increasing fuel economy and reducing the amount of greenhouse gases emitted by the vehicle when it is in use.
• Motor Vehicles, Heavy Duty Truck Vehicle Efficiency (Aerodynamic Efficiency): CARB approved this regulation in December 2008. This measure requires existing trucks/trailers to be retrofitted with the best available technology and/or CARB approved technology. Technologies that reduce GHG emissions and improve the fuel efficiency of trucks may include devices that reduce aerodynamic drag and rolling resistance. The requirements apply to California and out-of-state registered trucks that travel to California. The 2020 estimated greenhouse gas emission reductions could be up to 6.4 MMTCO2e nationwide, of which about 0.93 MMTCO2e would occur within California. This regulation is expected to reduce total emissions from heavy-duty trucks by 1.9 percent. A 1.9- percent reduction from business as usual emissions for heavy-duty trucks is taken for this regulation.
• Natural Gas, Regulations: A 9.2-percent reduction is from the CARB Scoping Plan Measure 3, Energy Efficiency, as referenced in Appendix B-5.
• Electricity Generation, Regulations: A 26.2 percent reduction is from the CARB Scoping Plan Measure 3, Energy Efficiency, and Measure 4, Renewables Portfolio Standard, as referenced in Appendix B-5.
• Refrigerants, Regulations: On December 9, 2009, the CARB adopted the Management of High Global Warming Potential Refrigerants for Stationary Sources in the California Code of Regulations. Beginning in 2011, the rule will require leak inspection, repairs, required service practices, and recordkeeping for large commercial and industrial systems that use more than 50 pounds of refrigerant for a single unit, about the equivalent of the refrigerant found in 100 household refrigerators. Therefore, the rule would apply to the project. Leak inspections will vary from continuous leak monitoring to quarterly or annual leak inspections, depending on the type and size of refrigeration systems. Potential emission reductions from facilities with applicable refrigeration and air conditioning equipment include HFC emission reductions of approximately 7.2 MMTCO2e by 2020, with another 0.9 MMTCO2e additional emission reductions from ozone depleting substances (above the expected transitional decreases), for a total of 8.1 MMTCO2e GHG emission reductions. Additional potential emission reductions from AC equipment are 0.5 MMTCO2e (0.4 from HFC and 0.1 from ozone depleting substances), for total projected emissions reductions of 8.6 MMTCO2e. CARB estimates that this regulation would reduce refrigerant emissions by approximately 50 percent. This analysis assumes a 50-percent reduction from business as usual emissions for compliance with this refrigerant regulation.
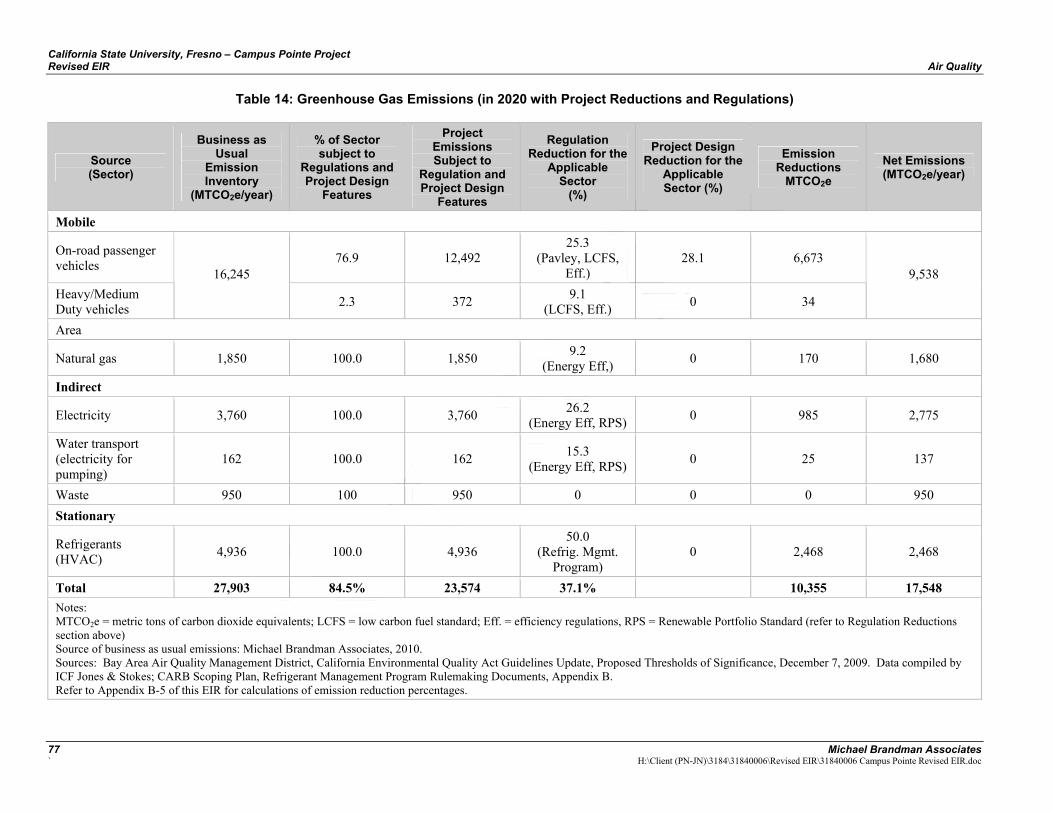
California State University, Fresno – Campus Pointe Project Revised EIR Air Quality
77 Michael Brandman Associates ` H:\Client (PN-JN)\3184\31840006\Revised EIR\31840006 Campus Pointe Revised EIR.doc
Table 14: Greenhouse Gas Emissions (in 2020 with Project Reductions and Regulations)
Source (Sector)
Business as Usual
Emission Inventory
(MTCO2e/year)
% of Sector subject to
Regulations and Project Design
Features
Project Emissions Subject to
Regulation and Project Design
Features
Regulation Reduction for the
Applicable Sector
(%)
Project Design Reduction for the
Applicable Sector (%)
Emission Reductions
MTCO2e Net Emissions (MTCO2e/year)
Mobile
On-road passenger vehicles 76.9 12,492
25.3 (Pavley, LCFS,
Eff.) 28.1 6,673
Heavy/Medium Duty vehicles
16,245
2.3 372 9.1 (LCFS, Eff.) 0 34
9,538
Area
Natural gas 1,850 100.0 1,850 9.2 (Energy Eff,) 0 170 1,680
Indirect
Electricity 3,760 100.0 3,760 26.2 (Energy Eff, RPS) 0 985 2,775
Water transport (electricity for pumping)
162 100.0 162 15.3 (Energy Eff, RPS) 0 25 137
Waste 950 100 950 0 0 0 950 Stationary
Refrigerants (HVAC) 4,936 100.0 4,936
50.0 (Refrig. Mgmt.
Program) 0 2,468 2,468
Total 27,903 84.5% 23,574 37.1% 10,355 17,548 Notes: MTCO2e = metric tons of carbon dioxide equivalents; LCFS = low carbon fuel standard; Eff. = efficiency regulations, RPS = Renewable Portfolio Standard (refer to Regulation Reductions section above) Source of business as usual emissions: Michael Brandman Associates, 2010. Sources: Bay Area Air Quality Management District, California Environmental Quality Act Guidelines Update, Proposed Thresholds of Significance, December 7, 2009. Data compiled by ICF Jones & Stokes; CARB Scoping Plan, Refrigerant Management Program Rulemaking Documents, Appendix B. Refer to Appendix B-5 of this EIR for calculations of emission reduction percentages.
California State University, Fresno – Campus Pointe Project Air Quality Revised EIR
78 Michael Brandman Associates
H:\Client (PN-JN)\3184\31840006\Revised EIR\31840006 Campus Pointe Revised EIR.doc
Additional Emission Reductions from Future Regulations The regulations that have already been adopted represent significant reductions in greenhouse gas emissions from the 2020 business as usual emissions inventory. The CARB Scoping Plan included other regulations with estimated adoption dates prior to 2012 that will provide further reductions. Below is a list of future regulations that are nearing adoption or under development. These measures are anticipated to be in place by the year 2020.
• Motor Vehicles, Pavley II Standards: In addition to Pavley I, CARB proposes to further strengthen the vehicle tailpipe emission standards beginning with the 2017 model year. The new standards will follow up on the existing standards that reach maximum stringency in 2016. It is anticipated that the Pavley II standards will achieve additional emission reductions of 4.1 MMTCO2e in 2020. The Pavley I and II standards are expected to reduce total emissions for automobiles and light trucks by 19.7 percent relative to the scenario without Pavley or corporate average fuel economy by the year 2020.
• Motor Vehicles, Passenger Vehicle Efficiency: Additional measures that would further reduce tailpipe greenhouse gas emissions from passenger vehicles by increasing vehicle efficiency include low friction oil and a tire tread program. The CARB Scoping Plan estimates these regulations will provide 3.1 MMTCO2e of emission reductions in 2020. These measures are expected to reduce total emissions from passenger vehicles by 1.9 percent.
Conclusion The project incorporates a number of features that would minimize greenhouse gas emissions. These features are consistent with project-level strategies identified by the CARB’s Scoping Plan, the Office of Planning and Research Technical Advisory, the California Air Pollution Control Officers Association white paper, and the California Office of the Attorney General list of measures. Additionally, the project provides housing, retail and entertainment opportunities to the students, workers and residents in the project vicinity. With implementation of project design features and regulations, greenhouse gas emissions are reduced by 37.1 percent, to approximately 17,548 MTCO2e per year. These reductions comply with the SJVAPCD threshold of a 29-percent reduction in emissions and the CARB Scoping Plan 28 percent target for 2020. Therefore, impacts would be less than significant.
Level of Significance Before Mitigation Less than significant impact.
Mitigation Measures No mitigation is necessary.
Level of Significance After Mitigation Less than significant impact.
California State University, Fresno – Campus Pointe Project Revised EIR Air Quality
Michael Brandman Associates 79 H:\Client (PN-JN)\3184\31840006\Revised EIR\31840006 Campus Pointe Revised EIR.doc
3.7.2 - Climate Change Effects The analysis provided above describes the projects potential impacts on climate change. The following analysis examines the potential effects of climate change on the project. The State of California has identified a number of potential effects that could occur due to changes in climate such as reduced precipitation, reduced snowfall, increased temperatures, increased sea level, and others.
Executive Order S-13-08 indicates that “climate change in California during the next century is expected to shift precipitation patterns, accelerate sea level rise and increase temperatures, thereby posing a serious threat to California’s economy, to the health and welfare of its population and to its natural resources.” Pursuant to the requirements in the order, in December 2009, the California Natural Resources Agency released its 2009 California Climate Adaptation Strategy (CNRA 2009). The Strategy is the “ . . . first Statewide, multi-sector, region-specific, and information-based climate change adaptation strategy in the United States.” Objectives include analyzing risks of climate change in California, identifying and exploring strategies to adapt to climate change, and specifying a direction for future research. The following analysis is based primarily on the information contained in the 2009 California Climate Adaptation Strategy.
Impact: The proposed project would not be subject to significant adverse effects as a result of global climate change.
Impact Analysis
Climate change could result in the following environmental impacts in California:
• Reduced precipitation; • Changes to precipitation and runoff
patterns; • Reduced snowfall (precipitation occurring
as rain instead of snow); • Earlier snowmelt; • Decreased snowpack; • Increased agricultural demand for water; • Intrusion of seawater into coastal aquifers;
• Increased agricultural growing season; • Increased growth rates of weeds, insect
pests and pathogens; • Inundation of low-lying coastal areas by
sea level rise; • Increased incidents and severity of
wildfire events; and, • Expansion of the range and increased
frequency of pest outbreaks. Although certain environmental effects are widely accepted to be a potential hazard to certain locations, such as rising sea level for low-laying coastal areas, it is currently infeasible to predict all environmental effects of climate change on any one location. Therefore, this analysis examines only the following potential impacts:
• Inundation of low-lying coastal areas by sea level rise; • Increased incidents and severity of wildfire events. • Reduced water availability
California State University, Fresno – Campus Pointe Project Air Quality Revised EIR
80 Michael Brandman Associates
H:\Client (PN-JN)\3184\31840006\Revised EIR\31840006 Campus Pointe Revised EIR.doc
Rise in Sea Levels The project site is located more than 90 miles inland from the Pacific Ocean and is approximately 216 feet above mean sea level. Therefore, the proposed project would not be susceptible to flooding from sea level rise.
Wildfires The project site is surrounded by urban development and cultivated cropland. As such, wildland fire risks are extremely low. The project site lies in an urbanized developed area outside of wildland fire hazard zones. Therefore, the proposed project would not be at risk of wildfires.
Reduced Water Availability Harmsen et al (2008) working for the California State University Fresno, Institute of Climate Change, Oceans and Atmosphere (ICOA) prepared a report where they evaluated the potential effects of climate change on the greater Fresno area and presented mitigation measures and adaptation strategies for reducing the impacts of climate change. One of the key areas discussed was reduced water availability as result of the global climatic changes resulting in the following environmental impacts:
• Early snowmelt and reduced storms resulting in longer dry periods
• Change in rainfall intensity resulting in greater run-off with reduced potential to capture and store freshwater for future use
Mitigation measures and adaptation strategies presented included:
• Water conservation
• Expansion of water recharge and water storage
• Expansion of storm drainage infrastructure to capture urban run-off from projected storms with greater intensity
• Greater emphasis on water quality by reducing runoff pollutants (salts, road oils, fertilizers, pesticides, etc.)
• Assessment of new projects’ water impacts The project will be provided with water by the City of Fresno water system. The City of Fresno 2008 Urban Water Management Plan (City of Fresno 2008) indicated that the City has sufficient water supply is available to accommodate projected growth under various hydrologic year types with the incorporation of a variety of water conservation, reuse, and recycling measures. The University constructed a recharge basin as a mitigation measure for the Save Mart Center that is operated in cooperation with the City of Fresno and Fresno Irrigation District for groundwater recharge, flood control, and irrigation of the campus farm. In addition, the project includes water conserving landscaping and irrigation systems, and low-water-use fixtures to help reduce water consumption.
California State University, Fresno – Campus Pointe Project Revised EIR Air Quality
Michael Brandman Associates 81 H:\Client (PN-JN)\3184\31840006\Revised EIR\31840006 Campus Pointe Revised EIR.doc
The proposed project also is subject to regulations to protect short-term and long-term water quality from water drainage during construction and operational activities. See Section 2, Water for additional information on water supply for the project.
It can be reasonably concluded that compliance with regulatory measures the project would be consistent with adaptation strategies to reduce the effects of climate change impacts from reduced water availability.
Level of Significance Before Mitigation Less than significant impact.
Mitigation Measures No mitigation is necessary.
Level of Significance After Mitigation Less than significant impact.

California State University, Fresno – Campus Pointe Project Revised EIR Water
Michael Brandman Associates 83 H:\Client (PN-JN)\3184\31840006\Revised EIR\31840006 Campus Pointe Revised EIR.doc
SECTION 4: WATER
4.1 - Court Decision
The Superior Court concluded that in the water analysis contained in the project’s EIR (Section 7: Public Facilities and Services), the following statement was unclear:
To avoid any negative impact on the overall groundwater balance (as compared to historical conditions) it is anticipated that implementation of the final phase of the Project will be conditioned on dedication to the City of an additional 250-acre feet per year of surface water entitlement. This additional supplemental water supply may be provided through suitable arrangements for additional groundwater recharge/banking, additional recycled water use, City’s renewal of its CVP supply contract, banked flood waters or water purchases (SOD page 50 quoting Draft EIR pages 7-8).
Specifically, the Superior Court found it unclear which “Project” the quoted language was referring to and what “final phase” of the project was referred to. The Superior Court also stated that it appeared that Respondents were relying on the future dedication to the City of Fresno of 250 acre feet per year of “paper water,” and concluded that the EIR failed to adequately analyze the project’s water issues.
1. Clarification of “Project” Reference 2. Explanation of “Final Phase” and “Additional 250 acre feet per year” 3. Reliability of water supply (“real” versus “paper water”)
The Court of Appeal ruled that the Trustees should take the actions necessary to bring the water analysis into compliance with CEQA. On June 20, 2011, the Superior Court issued a Judgment and Peremptory Writ of Mandamus directing the Trustees to revise the responses to the public’s comments in the water supply analysis to address the inadequacies in the court’s statement of decision and to take the action necessary to bring the water resources section of the EIR into compliance with CEQA. Each aspect is described in greater detail below along with the Lead Agency’s responses.
4.2 - Lead Agency Response
4.2.1 - Clarification of “Project” Reference The “Project” is referring to the Campus Pointe Project, which is described in the Project Description section of the DEIR.
4.2.2 - Explanation of “Final Phase” and “Additional 250 acre feet per year” The Court was concerned that the “EIR makes it appear that some future phase, the ‘final phase of the Project’ will require an additional 250 acre feet per year of surface water entitlement that had not
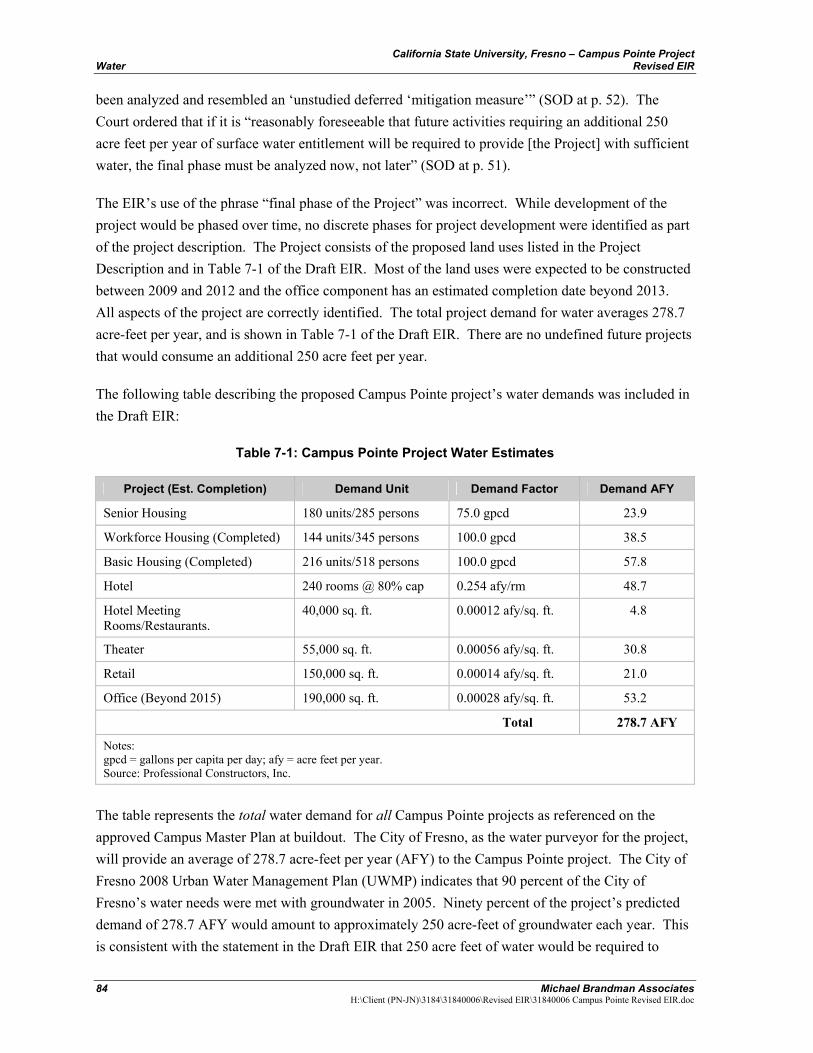
California State University, Fresno – Campus Pointe Project Water Revised EIR
84 Michael Brandman Associates
H:\Client (PN-JN)\3184\31840006\Revised EIR\31840006 Campus Pointe Revised EIR.doc
been analyzed and resembled an ‘unstudied deferred ‘mitigation measure’” (SOD at p. 52). The Court ordered that if it is “reasonably foreseeable that future activities requiring an additional 250 acre feet per year of surface water entitlement will be required to provide [the Project] with sufficient water, the final phase must be analyzed now, not later” (SOD at p. 51).
The EIR’s use of the phrase “final phase of the Project” was incorrect. While development of the project would be phased over time, no discrete phases for project development were identified as part of the project description. The Project consists of the proposed land uses listed in the Project Description and in Table 7-1 of the Draft EIR. Most of the land uses were expected to be constructed between 2009 and 2012 and the office component has an estimated completion date beyond 2013. All aspects of the project are correctly identified. The total project demand for water averages 278.7 acre-feet per year, and is shown in Table 7-1 of the Draft EIR. There are no undefined future projects that would consume an additional 250 acre feet per year.
The following table describing the proposed Campus Pointe project’s water demands was included in the Draft EIR:
Table 7-1: Campus Pointe Project Water Estimates
Project (Est. Completion) Demand Unit Demand Factor Demand AFY
Senior Housing 180 units/285 persons 75.0 gpcd 23.9
Workforce Housing (Completed) 144 units/345 persons 100.0 gpcd 38.5
Basic Housing (Completed) 216 units/518 persons 100.0 gpcd 57.8
Hotel 240 rooms @ 80% cap 0.254 afy/rm 48.7
Hotel Meeting Rooms/Restaurants.
40,000 sq. ft. 0.00012 afy/sq. ft. 4.8
Theater 55,000 sq. ft. 0.00056 afy/sq. ft. 30.8
Retail 150,000 sq. ft. 0.00014 afy/sq. ft. 21.0
Office (Beyond 2015) 190,000 sq. ft. 0.00028 afy/sq. ft. 53.2
Total 278.7 AFY
Notes: gpcd = gallons per capita per day; afy = acre feet per year. Source: Professional Constructors, Inc.
The table represents the total water demand for all Campus Pointe projects as referenced on the approved Campus Master Plan at buildout. The City of Fresno, as the water purveyor for the project, will provide an average of 278.7 acre-feet per year (AFY) to the Campus Pointe project. The City of Fresno 2008 Urban Water Management Plan (UWMP) indicates that 90 percent of the City of Fresno’s water needs were met with groundwater in 2005. Ninety percent of the project’s predicted demand of 278.7 AFY would amount to approximately 250 acre-feet of groundwater each year. This is consistent with the statement in the Draft EIR that 250 acre feet of water would be required to
California State University, Fresno – Campus Pointe Project Revised EIR Water
Michael Brandman Associates 85 H:\Client (PN-JN)\3184\31840006\Revised EIR\31840006 Campus Pointe Revised EIR.doc
avoid any impact on overall groundwater balance. The UWMP projects the percentage of water obtained from groundwater will decline as more surface water and recycled water are used in the City. This, along with the City’s recharge and conservation efforts, means that impacts on groundwater would decline over time and come into balance by 2025. Table 4-11 of the UWMP estimates groundwater will comprise 36 percent of the total water supply by 2025. Therefore, by 2025 the project’s share of groundwater usage from the City system would be approximately 100 acre-feet per year.
4.2.3 - “Paper Water” The Court expressed concern that the water that CSU relied upon in concluding there was sufficient water for the proposed project could be “paper water”—that is, water that an agency may have a contractual right to, but that does not necessarily have a direct correlation to the amount of water that will actually be available (SOD page 50). The Court’s concern that CSU might be relying on paper water in its water supply analysis was based on the Court’s determination that there had been “no discussion” in the EIR of “what the suitable arrangements are for the additional groundwater recharging or groundwater banking, additional recycled water use, whether or not the City of Fresno can renew its Central Valley Project supply contract (and no analysis of whether other entities may draw on that same CVP water as well, and in doing so may affect CSU’s entitlement to the 250 acre-feet of water), banked flood waters, and who will bank them, or water purchases and from whom” (SOD at pp. 50-51).
The court concluded that CSU was not required to prepare a water supply assessment pursuant to SB 610 because the requirement only applies to cities and counties. However, the Court did order CSU to revise its comments regarding the water supply analysis as discussed above. The following additional information is provided to address water supply.
The City of Fresno has adequate capacity to serve this project and accommodate growth anticipated in its service area without adversely impacting groundwater. The City of Fresno’s 2008 UWMP demonstrates that it has adequate water supplies through 2025. The UWMP includes plans that reverse historical groundwater overdraft through additional groundwater recharge/banking, additional recycled water use, and increased water conservation from existing and new water customers. The City has made suitable arrangements for these purposes to ensure that groundwater overdraft is addressed as described below.
Surface Water Contracts
The court expressed concern regarding the reliability of surface water deliveries from FID and the California Water Project. The UWMP identifies all sources of supply and describes the reliability of the supply during normal and dry years. The City of Fresno has a contractual right to obtain 60,000 acre-feet of water per year from the Friant Unit of the Central Valley Project. Water delivered from the Friant Unit is classified as either Class 1 water or Class 2 water. Contracts to serve Class 1 water
California State University, Fresno – Campus Pointe Project Water Revised EIR
86 Michael Brandman Associates
H:\Client (PN-JN)\3184\31840006\Revised EIR\31840006 Campus Pointe Revised EIR.doc
take priority, and all Class 1 water is allocated before any Class 2 water supplies are allocated. The total amount of water subject to Class 1 contracts is 800,000 acre-feet. In comparison, the average annual flow of the San Joaquin River, which is the source of inflow for water delivered by the Friant Unit, is 1,670,000 acre-feet (Decision No. 935 of the State Water Resources Control Board, p. 24). Thus, in Decision No. 935, the State Water Resources Control Board described the Friant Unit’s Class 1 contractual supplies as very reliable (City of Fresno, 2008). The CVP contract was renewed on April 6, 2007. A copy of the contract is included in Appendix C-1.
Fresno Irrigation District Water
The City has a permanent right to receive a portion of the water supplies available to the FID. The FID holds high-priority vested rights to receive approximately 470,000 AFY of water from the Kings River, as well as a Class 2 Central Valley Project water supply contract, with an average annual yield of about 30,000 acre-feet for the City. Within the FID, water entitlements run with the land. When lands are converted from agricultural to urban uses, the FID water entitlements are transferred to the new land use, so the City’s entitlement will increase as development occurs. A copy of the FID contract is included in Appendix C-2. Although the amount will vary depending on the total amount of precipitation received in the watershed each year, the City will receive its proportionate share of FID water each year in accordance with the terms of the contract. The UWMP includes an analysis of the amount of water received by FID from the Kings River between 1964 and 2002 to demonstrate the reliability of the supply. The City only uses a fraction of its allocation because of capacity limitations at its Northeast Fresno surface water treatment plant. The City plans to construct a second surface water treatment plant in Southeast Fresno with a 60 million gallons per day (mgd) capacity and to increase the capacity of the Northeast Fresno plant from 30 mgd to 60 mgd that will enable them to purchase substantially more water. The UWMP indicates that in 2005 the City obtained 92,200 acre-feet from its FID Kings River entitlement. By 2025, the City expects to obtain 126,500 acre-feet from its FID Kings River entitlement. (City of Fresno, 2008)
Overall Groundwater Balance
The Draft EIR included the following statement attributed to the City of Fresno: “To avoid any negative impact on the overall groundwater balance (as compared to historical conditions) it is anticipated that implementation of the…[proposed project]…will be conditioned on dedication to the City of an additional 250-acre feet per year of surface water entitlement. This additional supplemental water supply may be provided through suitable arrangements for additional groundwater recharge/banking, additional recycled water use, City’s renewal of its CVP supply contract, banked flood waters or water purchases.” At the time the statement was made, the City had not yet reached agreement on its CVP supply contract. The CVP contract has now been renewed. The 2008 UWMP, which was approved by the City after the Final EIR was certified, indicates that the City of Fresno has the capacity to meet projected growth without adversely impacting groundwater. Therefore, no additional water is required to comply with City’s proposed condition.
California State University, Fresno – Campus Pointe Project Revised EIR Water
Michael Brandman Associates 87 H:\Client (PN-JN)\3184\31840006\Revised EIR\31840006 Campus Pointe Revised EIR.doc
The estimated groundwater yield for the City is 88,800 AFY based on natural recharge, subsurface recharge, and intentional groundwater recharge. Since 1985, the City has recharged an average of 44,200 AFY with the majority of the recharge occurring at Leaky Acres and the Fresno Metropolitan Flood Control District (FMFCD) facilities. The FID and FMFCD play a critical role in the City’s water supply through their partnership with the City. During the summer and fall, the City’s surface water entitlement is delivered via canals by FID to the FMFCD recharge basins located throughout the urban area where it percolates through the soil to replenish groundwater. The City plans to significantly expand intentional groundwater recharge facilities to balance future groundwater operations and is working with its regional partners to fully utilize the sites already developed and is developing new sites such as a recharge basin in southeast Fresno (City of Fresno, 2008). With regard to the issue of additional groundwater recharge/banking, the University is providing recharge facilities that will help the City achieve its recharge targets as described below.
Campus Recharge Facilities
The University has constructed a recharge basin that implemented a mitigation measure in the Save Mart Center EIR. The basin is operated in partnership between the University, the City of Fresno, and FID. The recharge basin is located at Bullard and Chestnut Avenues and is capable of annually recharging up to 140 AFY according to FID engineers. This estimate is based on full capacity and a recharge rate of 0.15 foot per day. The basin receives surface stormwater runoff from the campus farm and is available to recharge FID surface water, and excess floodwater. FID indicates that the amount of water sent to the recharge basin is not currently measured. The maximum water demand for the completed Campus Pointe project would be an estimated 279 AFY. The estimated water demand of the Save Mart Center, as stated in that project’s EIR, was 60.17 AFY. Based on maintaining the recharge basin at an average of 50 percent capacity throughout the year, it would recharge approximately 100 acre-feet of water, which offsets 40 acre-feet beyond that required by the Save Mart Center. See Appendix C-3 for additional information regarding the operation of the basin and recharge estimates.
With the construction of the basin, the University has provided the capacity for recharge. It is the responsibility of the City of Fresno to identify those waters from its entire water supplies that are appropriate for diversion to the Bullard and Chestnut recharge basin. The University coordinates closely with the City and FID to maximize the beneficial use of the basin for both irrigation of the campus farm and recharge. However, since the City has overall management responsibility for operating the system, the City can determine the most effective use of water and the best place to recharge water at any given time. Campus Pointe will pay water connection fees and monthly water bills that are intended to defray the cost of providing water to the project, including costs for purchasing water, and for maintaining its proportional share the entire water system. The City does not require its water customers to find their own water supplies as could be inferred by the erroneous statement in the Draft EIR.
California State University, Fresno – Campus Pointe Project Water Revised EIR
88 Michael Brandman Associates
H:\Client (PN-JN)\3184\31840006\Revised EIR\31840006 Campus Pointe Revised EIR.doc
Expanded Use of Surface Water
The primary source of water for the project is from the City’s North Fresno surface water treatment plant. The City of Fresno approved a settlement agreement for the project that requires the developer to pay all sewer and water development/connection fees, in accordance with established or City policies to be established that are in effect when the development is connected to City water. A copy of the settlement agreement is provided in Appendix C-4. The developer constructed a 14-inch water line that is oversized and can be used by other city customers. The portion of the project that has completed construction is now being served by this water line. The significance of this information is that it demonstrates that the City has agreed to provide water to the project with the extension of the water line and payment of City fees and is not directly using groundwater for the project.
Relation to the Campus Water System
As Campus Pointe will be served by the City of Fresno water system and not the University’s existing water system, the project does not impact groundwater from the University’s wells and does not require expansion or upgrade of the system. See Appendix C-3 for additional information regarding the Campus water system.
4.2.4 - Campus Pointe Water System Design The Court indicated on page 53 of the SOD that “Water service to the project will be provided by the City of Fresno. City water mains will be upgraded within Chestnut Avenue and looped in order to provide service to the Campus Pointe project. Respondents don’t provide any factual analysis on how this mitigation measure would ‘provide adequate flows [and] pressure’ to the project that was a perceived inadequacy in the baseline.”
The developer has constructed a 14-inch water main along Chestnut Avenue that allows connection to the City of Fresno’s North Fresno surface water treatment plant. The water main was included as a mitigation measure in the Draft EIR to allow connection to the City system and to allow the City to expand the area served with treated surface water. This is an important part of the City’s overall plan to move away from reliance on groundwater as described earlier. The pipeline was oversized in order to provide adequate water flows and pressure to serve the project and for other areas to receive surface water in the future.
The project is connected to the new water main by a looped system. Looped systems help to mitigate several concerns. First, they provide connection redundancy so that if a break occurs anywhere in the system, the break can be isolated and the water users on the other side of the break will continue to receive water from the other side of the loop. Second, projects that are located on dead ends tend to lose pressure towards the end of the line as users at the beginning of the line draw water from the system. A looped system provides consistent pressure to all users along the line. Third, a looped system’s stable water pressure provides more reliable water flows for fire protection purposes. Finally, water quality tends to be better in looped systems than in dead-end systems. In dead-end
California State University, Fresno – Campus Pointe Project Revised EIR Water
Michael Brandman Associates 89 H:\Client (PN-JN)\3184\31840006\Revised EIR\31840006 Campus Pointe Revised EIR.doc
systems, various chemicals can build up in the line, impacting the quality and taste of the water. Looped systems provide better circulation that prevents the buildup of these chemicals.
In summary, the water main constructed as a mitigation measure for the project and the looped system designed to serve the project ensure adequate water flows and pressure to meet all water quality and safety considerations. The conclusion of the Draft EIR regarding the project’s impacts to groundwater and water flows remain less than significant with the application of this mitigation measure.

California State University, Fresno – Campus Pointe Project Revised EIR Water
Michael Brandman Associates 91 H:\Client (PN-JN)\3184\31840006\Revised EIR\31840006 Campus Pointe Revised EIR.doc
4.3 - Revisions to the Draft EIR
The following section provides the original Draft EIR water discussion with revisions and explanatory footnotes to provide additional description and context. New material is identified with underlined text. Deleted material is identified with strike through text. The pages replace Section 7.0 pages 7-1 through 7-7 of the Draft EIR.

California State University, Fresno – Campus Pointe Project Revised EIR Water
Michael Brandman Associates 93 H:\Client (PN-JN)\3184\31840006\Revised EIR\31840006 Campus Pointe Revised EIR.doc
7.0 PUBLIC FACILITIES AND SERVICES This section evaluates the project specific impacts on the Fresno State and City of Fresno domestic water supply, wastewater disposal systems, and solid waste generation due to the development of the proposed Campus Pointe Project (the ‘Project’). Analysis of the responses to the NOP and discussions with university staff have determined that existing power, natural gas, and communications infrastructure and supply would be sufficient to serve the project, so these issues will not be addressed in this EIR. WATER ENVIRONMENTAL SETTING The University is located within the City of Fresno and covers an area of approximately 1,400 acres, including agricultural fields and grazing areas. The campus has its own water supply and distribution system; however, due to system limitations, the Campus Pointe project will be served by the City of Fresno water system. The water system supplies water to the campus, which consists of approximately 50 buildings, eight dormitories, three food service facilities, a student health center, 10 animal barns, a veterinary clinic, the Save Mart Event Center, and football, softball and baseball stadiums. The water system also is used for ornamental landscape irrigation throughout the campus. City of Fresno Water System Domestic water service to the project is provided by the City of Fresno, which provides water to its service area through a system of wells and interconnected water mains located in major streets. In 2007, the City supplied 165,798 acre-feet (AF) of domestic water to 130,167 urban residential, commercial, and industrial customers in the City of Fresno water service area, which encompasses over 110 square miles. The City currently operates 250 municipal groundwater wells and until late 2004, relied solely on pumped ground water to meet the water demands within its service area. The opening of the City’s first surface water treatment facility (SWTF) in 2004, allowed the City to gradually reduce its need for groundwater as its primary source of domestic water. Since opening, groundwater extraction by the City has decreased from 165,117 AF in 2003 to 145,150 AF in 2007. A second SWTF, with a design capacity of 60 mgd, is planned for the City’s Southeast Growth Area by 2015 and the existing SWTF is planned for expansion to 60 mgd by 2020 (City of Fresno, Urban Water Management Plan, 2008). The City delivers water to the end users by means of transmission mains and water mains that are interconnected to the water storage facilities and supply wells. The City of Fresno water delivery system is designed to provide a minimum pressure within the system of between 35 to 40 pounds per square inch (psi). Domestic Water Well Facilities The campus operates five domestic water wells which are connected to its water distribution system. Each of the wells was brought into compliance with the regulatory standards of the California Department of Health Services in 1994. Chlorination facilities were constructed at each of the water well heads for injection of liquid chlorine into the water supply. Periodically the campus has each of the wells tested by Pacific Gas & Electric Company to determine their pumping capacity. Information received from the campus indicates that the capacity of each of the domestic water wells and their locations are as follows:
California State University, Fresno – Campus Pointe Project Revised EIR Water
Michael Brandman Associates 94 H:\Client (PN-JN)\3184\31840006\Revised EIR\31840006 Campus Pointe Revised EIR.doc
1. Well No.2: The well's capacity is 505 gallons per minute (gpm). The well is located on the
east side of Woodrow Avenue, south of Barstow Avenue. 2. Well No.3: The well's capacity is 585 gpm. The well is located on the north side of Barstow
Avenue, between Campus Drive and Jackson Avenue in Parking Lot Q. 3. Well No.4: The well's capacity is 529 gpm. The well is located on the north side of Scott
Avenue, east of Cedar Avenue. 4. Well No.5: The well's capacity is 361 gpm. The well is located southwest of the Bulldog
Football Stadium at the westerly end of the campus. 5. Well No.6: The well's capacity is 802 gpm. This newest well is located on the east side of
Jackson A venue, south of Barstow Avenue. The total pumping capacity of the existing domestic water wells on campus is 2,782 gallons per minute, or 4 million gallons per day (mgd). The Agricultural program on campus also operates sixteen other wells used to irrigate crop land and grazing areas. These wells are not connected to the domestic water system, are not constructed to public water supply standards and are protected from siphoning of the agricultural water by use of air gaps. Water Storage Capacity Water storage is required to accommodate the fluctuations of the water demand when peak hour demands exceed the maximum rate of pumping which can be supplied by the wells, and for the capacity needed for fire protection purposes. The campus' domestic water wells discharge directly into a "single pressure zone" distribution system which has a water storage tank that "floats" on the system. The water storage tank is a 150,000 gallon elevated steel storage tank located in the campus' Corporation Yard. Water Distribution System The campus' water distribution system consists of a single pressure zone with five active domestic water wells, one elevated storage tank, and approximately seven miles of water mains which range in size from 4-inches to 12-inches in diameter. The distribution system consists primarily of asbestos cement pipe (ACP), with some cast iron, ductile iron and polyvinyl chloride (PVC) pipe. In addition, the campus' water system is connected to a to a 12 inch water main in the City of Fresno Water system at the intersection of Maple and Shaw Avenues. The City's system is isolated from the campus water system by use of a reduced pressure backflow preventer and a shutoff valve. The connection is to be used for emergency purposes only. The campus currently pumps a yearly average of approximately 0.8 mgd to meet the various water needs of the campus. The demand rate varies throughout the year from a low of approximately 0.4 mgd in winter to 1.6 mgd in summer. The increase during the summer months is primarily due to the increased demand for air conditioning in the buildings and landscape irrigation. Each of the well sites is metered.
California State University, Fresno – Campus Pointe Project Revised EIR Water
Michael Brandman Associates 95 H:\Client (PN-JN)\3184\31840006\Revised EIR\31840006 Campus Pointe Revised EIR.doc
Domestic water for campus facilities is provided by an onsite, independent domestic water system, owned and operated by Fresno State. A gated connection to the City of Fresno Water system exists as an emergency supply of water for such times as failure of the campus water supply, power outages or other emergency condition. Fresno State presently, and historically, depends totally upon untreated, disinfected groundwater as the source of its domestic water supply. The groundwater reservoir beneath the campus is tapped by numerous water wells located primarily along the west and north sides of the main academic core of the campus. This same groundwater reservoir is also tapped by numerous water wells located throughout the Cities of Fresno and Clovis. It is pumped, on demand, to meet Fresno State's water consumption needs. The groundwater reservoir is resupplied by the natural recharge from streams, rivers and ground infiltration, as well as from an extensive artificial groundwater recharge program administered by the City of Fresno and the City of Clovis. REGULATORY CONTEXT California Water Code In accordance with Urban Water Management Planning Act, as included in the California Water Code, Division 6, Part 2.6, every urban water supplier in California providing water for municipal purposes either directly or indirectly to more than 3,000 customers, or supplying more than 3,000 acre-feet of water annually, is required to prepare and adopt an Urban Water Management Plan (UWMP). The City of Fresno’s UWMP was adopted in August 2008 and provides information on the City’s water supply planning. California Department of Health Services The campus' domestic water system is under the regulatory jurisdiction of the California Department of Health Services (DOHS), Division of Drinking Water and Environmental Management. The campus is operating under the DOHS Water Permit No. 03-93-056.2. Fire Flow Requirements The quantities of water needed to be stored and the water flow needed for combating a fire varies depending on whether or not the building(s) are constructed with overhead sprinklers. The criteria to be used are as follows: Sprinklered Buildings: 1,500 gallons per minute for a period of two (2) hours.
Un-Sprinklered Buildings: 2,500 gallons per minute for a period of two (2) hours.
IMPACTS Standards of Significance For the purposes of this EIR, impacts are considered significant if implementation of the proposed project would: Substantially increase the demand for domestic and landscape irrigation water in excess
of existing and planned supply or distribution capacity.
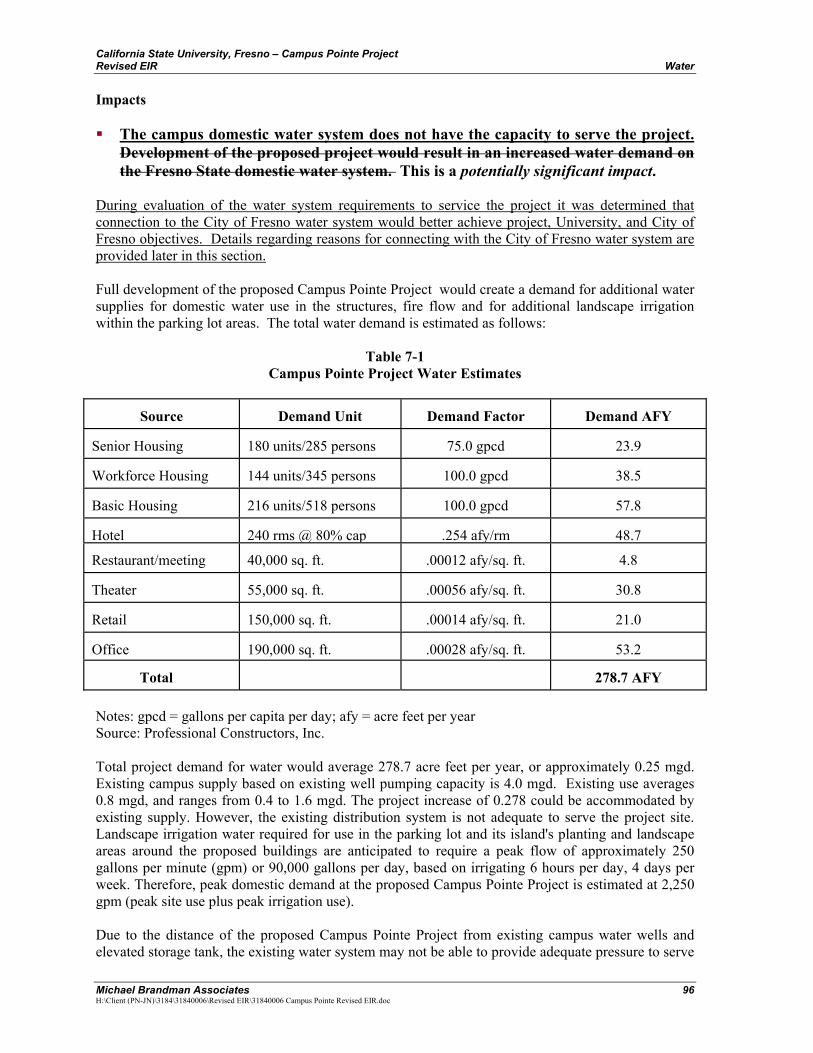
California State University, Fresno – Campus Pointe Project Revised EIR Water
Michael Brandman Associates 96 H:\Client (PN-JN)\3184\31840006\Revised EIR\31840006 Campus Pointe Revised EIR.doc
Impacts The campus domestic water system does not have the capacity to serve the project.
Development of the proposed project would result in an increased water demand on the Fresno State domestic water system. This is a potentially significant impact.
During evaluation of the water system requirements to service the project it was determined that connection to the City of Fresno water system would better achieve project, University, and City of Fresno objectives. Details regarding reasons for connecting with the City of Fresno water system are provided later in this section. Full development of the proposed Campus Pointe Project would create a demand for additional water supplies for domestic water use in the structures, fire flow and for additional landscape irrigation within the parking lot areas. The total water demand is estimated as follows:
Table 7-1 Campus Pointe Project Water Estimates
Source
Demand Unit
Demand Factor
Demand AFY Senior Housing
180 units/285 persons
75.0 gpcd
23.9
Workforce Housing
144 units/345 persons
100.0 gpcd
38.5
Basic Housing
216 units/518 persons
100.0 gpcd
57.8
Hotel
240 rms @ 80% cap .254 afy/rm 48.7
Restaurant/meeting
40,000 sq. ft.
.00012 afy/sq. ft.
4.8
Theater
55,000 sq. ft.
.00056 afy/sq. ft.
30.8
Retail
150,000 sq. ft.
.00014 afy/sq. ft.
21.0
Office
190,000 sq. ft. .00028 afy/sq. ft. 53.2
Total
278.7 AFY
Notes: gpcd = gallons per capita per day; afy = acre feet per year Source: Professional Constructors, Inc. Total project demand for water would average 278.7 acre feet per year, or approximately 0.25 mgd. Existing campus supply based on existing well pumping capacity is 4.0 mgd. Existing use averages 0.8 mgd, and ranges from 0.4 to 1.6 mgd. The project increase of 0.278 could be accommodated by existing supply. However, the existing distribution system is not adequate to serve the project site. Landscape irrigation water required for use in the parking lot and its island's planting and landscape areas around the proposed buildings are anticipated to require a peak flow of approximately 250 gallons per minute (gpm) or 90,000 gallons per day, based on irrigating 6 hours per day, 4 days per week. Therefore, peak domestic demand at the proposed Campus Pointe Project is estimated at 2,250 gpm (peak site use plus peak irrigation use). Due to the distance of the proposed Campus Pointe Project from existing campus water wells and elevated storage tank, the existing water system may not be able to provide adequate pressure to serve
California State University, Fresno – Campus Pointe Project Revised EIR Water
Michael Brandman Associates 97 H:\Client (PN-JN)\3184\31840006\Revised EIR\31840006 Campus Pointe Revised EIR.doc
the domestic and fire flow water needs. The existing Fresno State water system has the well capacity and storage capabilities to accommodate the additional demand on the system. Several pipelines extending into this portion of the campus, however, are dead-end pipelines which, individually, are not capable of meeting the demands of the facility. Also, two water sources should be made available to serve the site for the purposes of assuring adequate flow for fire protection. To mitigate these concerns, the project has reached an agreement with the City of Fresno to extend an existing water main in Chestnut Avenue into the site, including a looped system within the development. This water line is part of the planned improvements in Chestnut Avenue to serve portions of the City of Fresno north of the campus. This water connection will reduce impacts to the campus system and allow more adequate flow and pressure to the proposed Campus Pointe Project, as well as provide a multiple source of water to accommodate fire protection needs. While there is adequate water supply to serve the proposed project, the existing infrastructure would need to be expanded to provide adequate flows to the project site. 1 The City has constructed a new 30 mgd surface water treatment plant on a 38-acre site located at the northeast corner of Behymer and Chestnut Avenues. The surface water treatment plant is completed and on-line. The purposes of the surface water treatment plant are to supply domestic water for the City of Fresno and to provide in-lieu groundwater recharge by reducing dependence on water wells for municipal supply. In-lieu recharge, which is the use of treated surface water for direct municipal supply, will reduce withdrawals from water wells and put a much grater volume of surface water to beneficial use than could otherwise be accommodated by direct recharge via percolation at the ponding basins in the area. SB 610. SB 610 requires that a jurisdiction consider a water supply assessment prepared for that development to determine whether projected water supplies available to the proposed project are sufficient to meet the project’s anticipated demand. The Campus Pointe Project meets the threshold requiring analysis under SB 610. The project site will be served by the City of Fresno water supply facilities. The groundwater underlying the Fresno area is hydrologically and geologically linked, and has previously been described by the State Water Resources Control Board as the "Fresno Ground Water Unit." This Unit covers a 258,560-acre area bounded on the east by the low-lying foothills of the Sierras, on the north by the San Joaquin River, on the south by the Kings River and the Consolidated Irrigation District boundary, and on the west generally parallel to and several miles east of the Fresno Slough. Hydrologically and geologically, the Unit comprises a single groundwater basin. The Fresno Hydrologic Unit entirely underlies the City of Fresno and Fresno Irrigation District service areas. 1 Note: Since publication of the Draft EIR in September 2006, this water main extension and looped system has been constructed, enabling connection to the City of Fresno’s North Fresno surface water treatment plant. The pipeline was sized to provide adequate water flows and pressure to serve the Project and allow other areas to receive surface water in the future. First, looped systems provide connection redundancy so that if a break occurs anywhere in the system, the break can be isolated and the water users on the other side of the break will continue to receive water from the other side of the loop. Second, projects that are located on dead ends tend to lose pressure towards the end of the line as users at the beginning of the line draw water from the system. A looped system provides consistent pressure to all users along the line. Third, looped system’s stable water pressure provides more reliable water flows for fire protection purposes. Finally, water quality tends to be better in looped systems compared to dead end systems. In dead in systems various chemicals can build up in the line, impacting the quality and taste of the water. Looped systems provide better circulation that prevents the buildup of these chemicals.
California State University, Fresno – Campus Pointe Project Revised EIR Water
Michael Brandman Associates 98 H:\Client (PN-JN)\3184\31840006\Revised EIR\31840006 Campus Pointe Revised EIR.doc
The Fresno Groundwater Unit is a very productive aquifer characterized by highly permeable alluvial geology with significant deposition of porous, coarse-grained materials, providing a high water storage coefficient. Draft Bulletin No. 118 characterizes the native safe yield of the Kings River Basin as being over drafted. However, as noted in the Fresno Metropolitan Water Resources Management Plan (Water Plan), several water supply agencies, including the City, have implemented, and have plans for further water management programs within the Fresno Groundwater Unit to augment the native yield of the basin. These projects include the use of developed water sources obtained from Friant and Pine Flat dams, along with recycled water and storm water recharge. These supplemental water sources are used Aconjunctively@ with local groundwater to meet the area’s agricultural and urban water demands.2 The Water Plan describes in more detail the hydrologic conditions of the Fresno Unit. In summary, the Fresno Unit is in near equilibrium. Overdraft is conservatively estimated at less than 20,000 acre feet (as reflected in net annual reduction in stored groundwater) out of an annual water budget of almost 1,000,000 acre feet. Conservative estimates of useable groundwater in storage well exceed 10,000,000 acre feet. Although this minimal overdraft has only nominal impact on the areas long term water supply viability, the City and other water management agencies have planned enhancement and expansion of conjunctive use programs. With full implementation of current and planned programs, the Fresno Groundwater Unit will remain in long-term equilibrium beyond 2025, even with anticipated urban growth. It should also be noted that the Kings River Basin is not adjudicated, nor are there any legal limitations on the use of groundwater. Therefore, there are no court orders or judgments specifying the amount of groundwater to which the City or the Project applicant is entitled. The City of Fresno has a contractual right to obtain 60,000 acre-feet of water per year from the Friant Unit of the Central Valley Project.3 Water delivered from the Friant Unit is classified as either Class 1 water or Class 2 water. Contracts to serve Class 1 water take priority and all Class 1 water is allocated before any Class 2 water supplies are allocated. The total amount of water subject to Class 1 contracts is 800,000 acre-feet. In comparison, the average annual flow of the San Joaquin River, which is the source of inflow for water delivered by the Friant Unit, is 1,670,000 acre-feet. (Decision No. 935 of the State Water Resources Control Board, p. 24.) Thus, in Decision No. 935, the State Water Resources Control Board described the Friant Unit's Class 1 contractual supplies as very reliable. The City has a permanent right to receive a portion of the water supplies available to the Fresno Irrigation District (FID). The FID holds high priority vested rights to receive approximately 470,000 acre-feet per year of water from the Kings River, as well as a Class 2 Central Valley Project water supply contract, with an average annual yield of about 30,000 acre feet. Within the FID, water entitlements “run with the land.” When lands are converted from agricultural to urban uses, the FID water entitlements are transferred to the new land use.
2 The Fresno Metropolitan Water Resources Management Plan (1995) is superseded by the City of Fresno 2008 Urban Water Management Plan (UWMP), which indicates that while 90 percent of the City of Fresno’s water needs were met with groundwater in 2005, the percentage of water supplies obtained from groundwater sources will decline as more surface water and recycled water are used in the City. This trend along with the City’s expanding recharge and conservation efforts indicate that impacts on groundwater would decline over time and come into balance by 2025. The proposed Campus Pointe Project is served by the City’s system and the City’s UWMP indicates it has adequate water supplies through 2025. 3 On April 6, 2007 the City of Fresno’s Central Valley Project supply contract was renewed.
California State University, Fresno – Campus Pointe Project Revised EIR Water
Michael Brandman Associates 99 H:\Client (PN-JN)\3184\31840006\Revised EIR\31840006 Campus Pointe Revised EIR.doc
Currently, the City represents approximately 19% of the area within the FID and enjoys a proportionate allocation of the FID water entitlements B roughly 95,000 acre-feet per year. As more property within FID urbanizes and receives potable water supply from the City, the City’s pro rata share of FID’s entitlement increases. Given the current land use patterns and associated water demands, the consumptive use of the average urban development is slightly lower than the consumptive use of associated agricultural lands. Thus, the urbanization of agricultural land within FID results in a net increase in availability (reliability) of water. The City accesses its portion of the FID entitlement through a set of water sharing agreements with FID. These agreements create an institutional framework through which the City and FID conjunctively use various surface water, groundwater and recycled water supplies available to each entity. This arrangement ensures that the full portfolio of water supplies available to each entity is used directly, or recharged into the local groundwater basin so that the long-term regional water supply/demand equilibrium is maintained. The City of Fresno, the City of Clovis, FID and the Fresno Metropolitan Flood Control District are collaborating an a new water supply project that will capture intermittent regional stream flows to enhance recharge of the local groundwater basin. The four entities have submitted a water rights application to the State Water Resources Control Board to establish their priority right to capture these surface water flows. The average annual yield from this water supply is estimated between 40,000-50,000 acre-feet. The cities of Fresno and Clovis will have priority rights to use the water developed from this project. The recharge basin at Bullard and Chestnut Avenues is another example of agency collaboration. Constructed by CSUF as a mitigation measure identified in the Save Mart Center EIR (1999), the basin is operated in partnership between the University, the City of Fresno and FID. Following primary allocations to the University’s campus farm, the residual recharge capacity provided by the basin is available to offset water demands from multiple sources, including Save Mart Center and ostensibly, the Campus Pointe Project. According to the FID engineering estimates, the recharge rate for the basin is 0.15 foot per day. Based on the capacity of the basin, recharge could range from 100 to 140 acre-feet per year depending on the average depth of the basin throughout the course of the year. The City reclaims the municipal wastewater generated through the City’s consumptive water use. Currently, approximately 70,000 acre ft. per year of treated wastewater is used directly for agricultural irrigation or banked in the groundwater basin, generally augmenting the availability of groundwater to the City. For example, about 30,000 acre feet per year is provided to the FID is made available by the City in exchange for additional surface water supplies beyond that which the City is otherwise entitled from FID. The City intends to take delivery of this exchange water once it has completed the development of additional facilities. Additional recycled water exchange capacity is conservatively estimated at 30,000 acre ft over the life of the 2025 General Plan. During wet years, significant amounts of unallocated surface water is available for capture for groundwater recharge. More efficient use of these “flood waters” from the Kings and San Joaquin rivers could be made with the development of additional groundwater recharge and banking facilities. FID has plans to add additional dedicated spreading basins to increase the ability to capture and bank flood waters from the Kings and San Joaquin Rivers for later use. The City and FID plan to further develop these water resources.

California State University, Fresno – Campus Pointe Project Revised EIR List of Preparers
Michael Brandman Associates 101 H:\Client (PN-JN)\3184\31840006\Revised EIR\31840006 Campus Pointe Revised EIR.doc
SECTION 5: LIST OF PREPARERS
5.1 - Lead Agency
The Board of Trustees of the California State University
5.2 - Lead Consultant
5.2.1 - Michael Brandman Associates – Environmental Consultant Principal...................................................................................................................................Tom Holm Senior Project Manager ..................................................................................................... Dave Mitchell Assistant Project Manager...................................................................................... Kathryn Longabaugh Air Quality Specialist ............................................................................................................ Elena Nuño Editor ................................................................................................................................. Ed Livingston GIS/Graphics ..............................................................................................................Karlee McCracken Administrative Assistant ...........................................................................................................Ann Berg
5.3 - Traffic Subconsultant
5.3.1 - OMNI-MEANS, Ltd. Project Manager/President......................................................................................Ross Ainsworth, P.E.

California State University, Fresno – Campus Pointe Project Revised EIR References
Michael Brandman Associates 103 H:\Client (PN-JN)\3184\31840006\Revised EIR\31840006 Campus Pointe Revised EIR.doc
SECTION 6: REFERENCES
BAAQMD 2009. Bay Area Air Quality Management District. California Environmental Quality Act Guidelines Update, Proposed Thresholds of Significance. December 7.
CAPCOA 2008. California Air Pollution Control Officer’s Association. CEQA & Climate Change Evaluating and Addressing Greenhouse Gas Emissions from Projects Subject to the California Environmental Quality Act.
CARB 2008. California Air Resources Board. Climate Change Scoping Plan, a framework for change. December 2008. Accessed January 7, 2010. Website: www.arb.ca.gov/cc /scopingplan/document/scopingplandocument.htm.
CAT 2006. State of California, Environmental Protection Agency, Climate Action Team. March 2006. Climate Action Team Report to Governor Schwarzenegger and the California Legislature. Website: www.climatechange.ca.gov/climate_action_team/reports/index.html. Accessed January 7, 2010.
City of Fresno 2008. City of Fresno, Water Division. Urban Water Management Plan Website: http://www.fresno.gov/Government/DepartmentDirectory/PublicUtilities/Watermanagement/WaterInformation/Default.htm. Accessed February 25, 2010.
CNRA 2009. California Natural Resources Agency. 2009 California Climate Adaptation Strategy. Website: www.climatechange.ca.gov/adaptation/.
CNRA 2009. California Natural Resources Agency. CEQA Guidelines Amendments. Website: http://ceres.ca.gov/ceqa/guidelines/. Accessed February 25, 2010.
Land Use Associates. 2007. California State University, Fresno – Campus Pointe Project Final Environmental Impact Report. State Clearinghouse Number 2005121164
Martin, Lon, P.E. Assistant Director, City of Fresno Department of Public Utilities. 2010. Personal communication: telephone call. February 4.
Mosinski, Michael L. Agricultural Operations. California State University, Fresno. 2009. Personal communication: email. December 17.
SJVAPCD 2009. San Joaquin Valley Air Pollution Control District. Final Staff Report, Addressing Greenhouse Gas Impacts Under the California Environmental Quality Act. December 17, 2009. Website: www.valleyair.org/programs/CCAP/CCAP_idx.htm. Accessed January 9, 2010.
SJVAPCD 2005. San Joaquin Valley Air Pollution Control District. Final Draft Staff Report. Rule 9510 – Indirect Source Review and Rule 3180 Administrative Fees for Indirect Source Review. December 15,.
SJVAPCD 2002. San Joaquin Valley Air Pollution Control District Guide for Assessing and Mitigating Air Quality Impacts.