Embed Size (px)
Citation preview
PHARMACEUTICAL CHEMISTRY
Preliminary Introduction of Spectroscopy
Dr. Hinna Hamid Lecturer
Dept. of Chemistry Faculty of Science
Jamia Hamdard Hamdard Nagar
New Delhi- 110062
(12.07.2007)
CONTENTS Spectroscopic TechniquesSpectrophotometryUltraviolet and Visible SpectroscopyIR SpectroscopyNuclear Magnetic Resonance spectroscopy
Keywords Spectrometry, Absorption, Emission, Spectrum, absorbance, nuclear spin, magnetic field.

Spectroscopic Techniques Among the most dynamic challenges in the analytical laboratory is the quest to determine the chemical structure of an unknown compound. The process of structure elucidation can serve a variety of purposes, such as the identification and classification of drug metabolites or products being investigated as drug candidates, quantify compounds, process impurities, etc. Structure elucidation of chemical compounds can be done by many different methods. Chemical methods: 1 Functional group testing 2 Chemical transformations Physical measurements: 1 Physical properties 2 Spectroscopy What is spectroscopy? Spectroscopy is the study of interaction of quantized energy with matter. Spectroscopy comes from the Latin root ‘spect’ and Greek suffix ‘scope’ which mean ‘to look at’, or ‘behold’. Mechanistically it is the use of electromagnetic radiations to perform chemical analysis and to study the complex micro world, which constitutes this universe. Advantages of using spectroscopic methods over other methods are that they are 1 Fast 2 Sensitive 3 Precise 4 Need very little sample amounts 5 Often non-destructive 6 Can be selective Electromagnetic radiations can interact with matter in various ways. Each interaction can disclose certain properties of that matter and use of electromagnetic radiations of different energies can give different information about the matter under study.

Fig. 2: The electromagnetic spectrum
Different regions of electromagnetic spectrum have different kinds of spectroscopic techniques associated with them.
Radiowaves : ESR and NMR spectroscopy Microwaves : Rotational spectroscopy. Infrared waves : IR spectroscopy Ultraviolet/ Visible waves : Ultraviolet/ Visible spectroscopy
NMR spectroscopy - is used to determine the carbon-hydrogen framework of a molecule and works with even the most complex molecules. Infra-red spectroscopy - is used to determine the presence of distinct functional groups in organic molecules. IR radiation causes them to vibrate at various frequencies, allowing us to identify them. Ultra-violet/Visible spectroscopy- is used primarily to identify the extent of conjugation in a molecule; it can also be used to identify how much (quantitative analysis) of a substance is present, usually in a solution. The color absorbances are used with the Beer-Lambert Law.
Principle
Molecules absorb energy and this energy can bring about translational, rotational or vibrational motion or ionization of the molecules depending upon the frequency of the electromagnetic radiation they receive. Excited molecules are unstable and quickly drop down to ground state again giving off the energy they have received as electromagnetic radiation. The wavelength and intensity of the electromagnetic radiation absorbed or emitted can be recorded to get a spectrum. Spectral analysis yields qualitative and quantitative information about the matter under study. Spectrum Spectrum is the display of the energy level of an e.m.r. as a function of wave number of electromagnetic radiation energy. The energy level of an e.m.r. may be expressed in any
of the following terms:
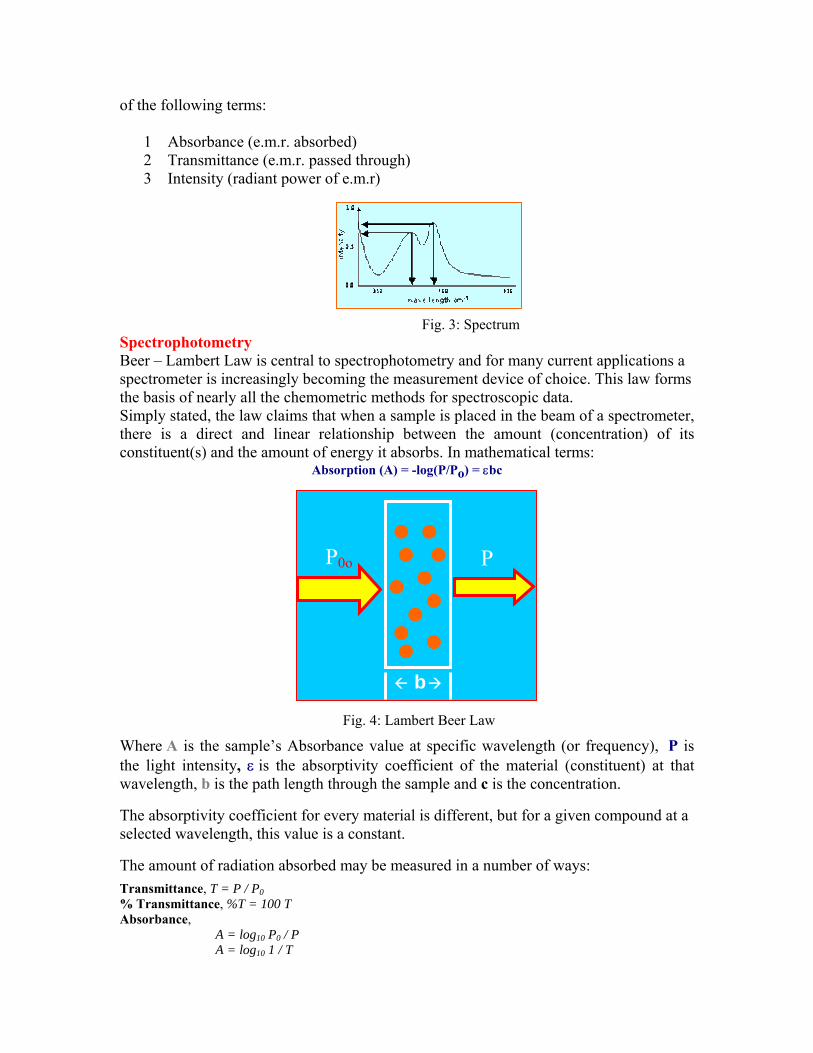
1 Absorbance (e.m.r. absorbed) 2 Transmittance (e.m.r. passed through) 3 Intensity (radiant power of e.m.r)
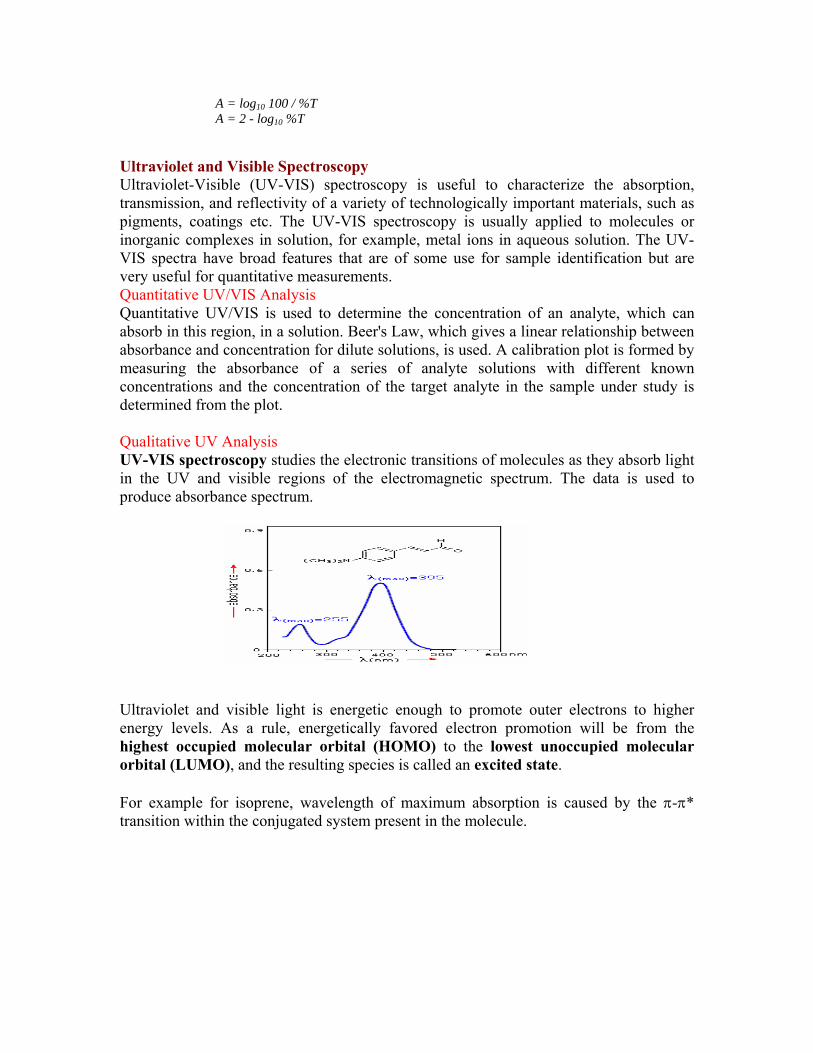
Fig. 3: Spectrum Spectrophotometry Beer – Lambert Law is central to spectrophotometry and for many current applications a spectrometer is increasingly becoming the measurement device of choice. This law forms the basis of nearly all the chemometric methods for spectroscopic data. Simply stated, the law claims that when a sample is placed in the beam of a spectrometer, there is a direct and linear relationship between the amount (concentration) of its constituent(s) and the amount of energy it absorbs. In mathematical terms:
Absorption (A) = -log(P/Po) = εbc
PP0o
b Fig. 4: Lambert Beer Law
Where A is the sample’s Absorbance value at specific wavelength (or frequency), P is the light intensity, ε is the absorptivity coefficient of the material (constituent) at that wavelength, b is the path length through the sample and c is the concentration.
The absorptivity coefficient for every material is different, but for a given compound at a selected wavelength, this value is a constant.
The amount of radiation absorbed may be measured in a number of ways: Transmittance, T = P / P0 % Transmittance, %T = 100 T Absorbance,
A = log10 P0 / P A = log10 1 / T
A = log10 100 / %T A = 2 - log10 %T
Ultraviolet and Visible Spectroscopy Ultraviolet-Visible (UV-VIS) spectroscopy is useful to characterize the absorption, transmission, and reflectivity of a variety of technologically important materials, such as pigments, coatings etc. The UV-VIS spectroscopy is usually applied to molecules or inorganic complexes in solution, for example, metal ions in aqueous solution. The UV-VIS spectra have broad features that are of some use for sample identification but are very useful for quantitative measurements. Quantitative UV/VIS Analysis Quantitative UV/VIS is used to determine the concentration of an analyte, which can absorb in this region, in a solution. Beer's Law, which gives a linear relationship between absorbance and concentration for dilute solutions, is used. A calibration plot is formed by measuring the absorbance of a series of analyte solutions with different known concentrations and the concentration of the target analyte in the sample under study is determined from the plot.
Qualitative UV Analysis UV-VIS spectroscopy studies the electronic transitions of molecules as they absorb light in the UV and visible regions of the electromagnetic spectrum. The data is used to produce absorbance spectrum.
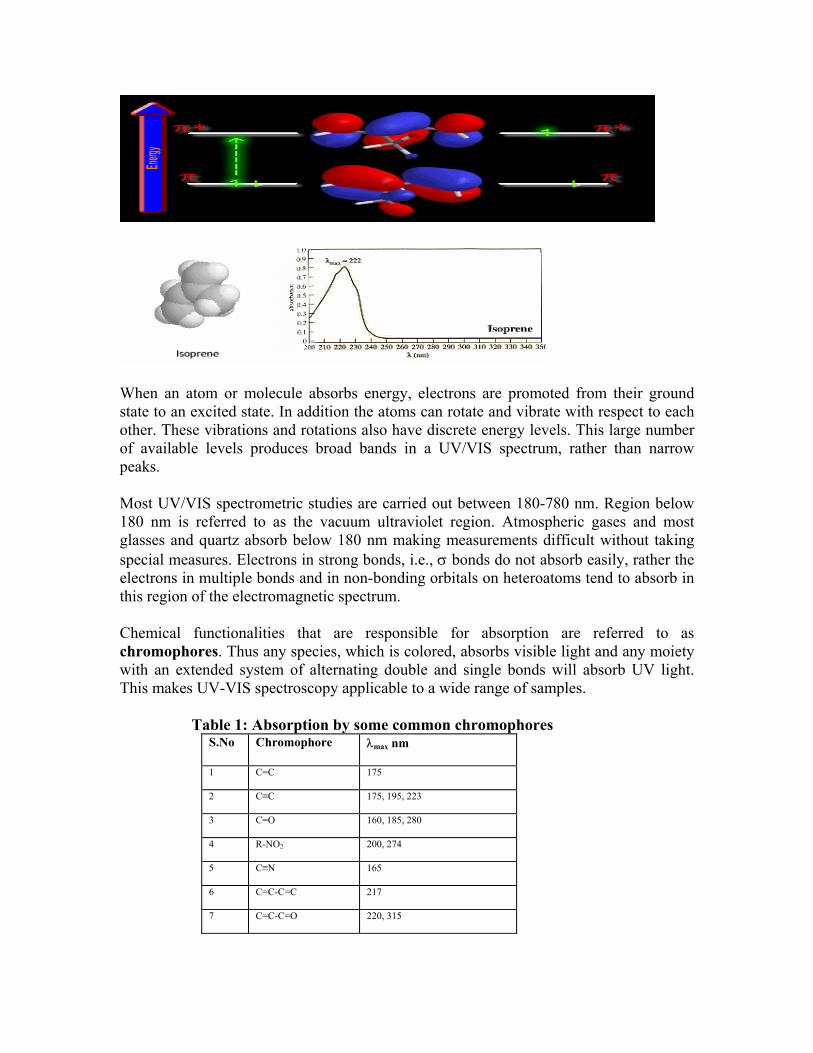
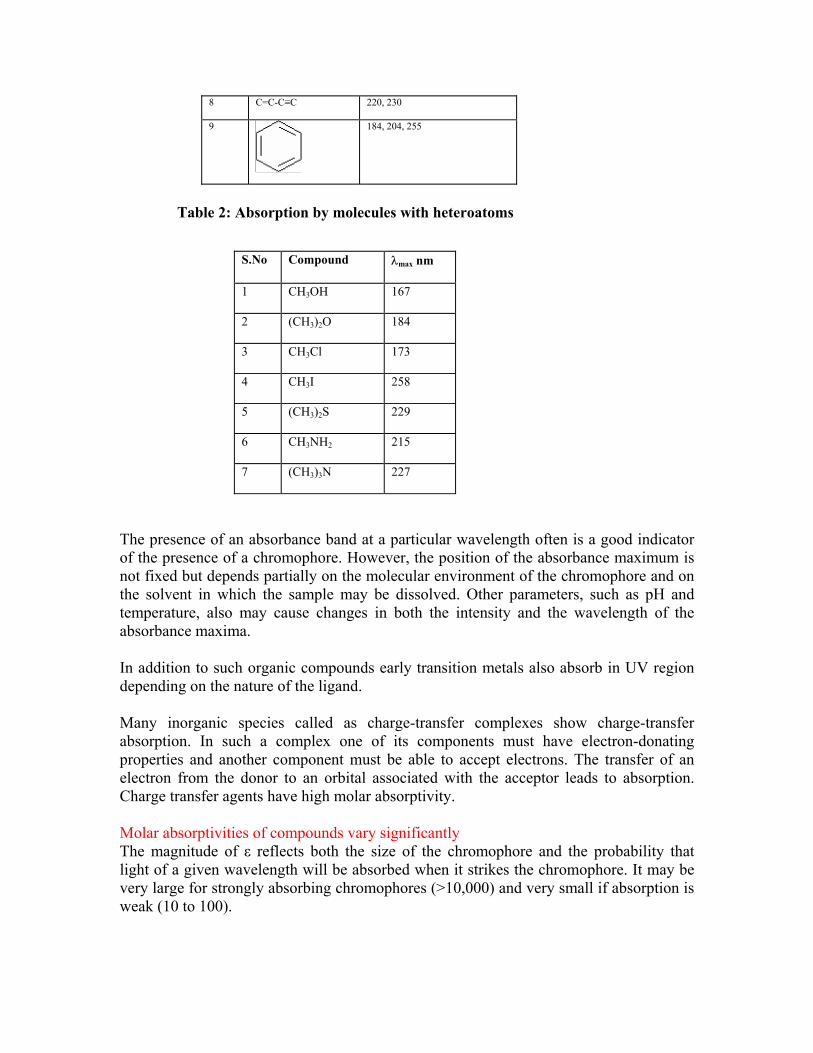
Ultraviolet and visible light is energetic enough to promote outer electrons to higher energy levels. As a rule, energetically favored electron promotion will be from the highest occupied molecular orbital (HOMO) to the lowest unoccupied molecular orbital (LUMO), and the resulting species is called an excited state. For example for isoprene, wavelength of maximum absorption is caused by the π-π* transition within the conjugated system present in the molecule.
When an atom or molecule absorbs energy, electrons are promoted from their ground state to an excited state. In addition the atoms can rotate and vibrate with respect to each other. These vibrations and rotations also have discrete energy levels. This large number of available levels produces broad bands in a UV/VIS spectrum, rather than narrow peaks. Most UV/VIS spectrometric studies are carried out between 180-780 nm. Region below 180 nm is referred to as the vacuum ultraviolet region. Atmospheric gases and most glasses and quartz absorb below 180 nm making measurements difficult without taking special measures. Electrons in strong bonds, i.e., σ bonds do not absorb easily, rather the electrons in multiple bonds and in non-bonding orbitals on heteroatoms tend to absorb in this region of the electromagnetic spectrum. Chemical functionalities that are responsible for absorption are referred to as chromophores. Thus any species, which is colored, absorbs visible light and any moiety with an extended system of alternating double and single bonds will absorb UV light. This makes UV-VIS spectroscopy applicable to a wide range of samples. Table 1: Absorption by some common chromophores
S.No Chromophore λmax nm
1 C=C 175
2 C≡C 175, 195, 223
3 C=O 160, 185, 280
4 R-NO2 200, 274
5 C≡N 165
6 C=C-C=C 217
7 C=C-C=O 220, 315
8 C=C-C≡C 220, 230
9
184, 204, 255
Table 2: Absorption by molecules with heteroatoms
S.No Compound λmax nm
1 CH3OH 167
2 (CH3)2O 184
3 CH3Cl 173
4 CH3I 258
5 (CH3)2S 229
6 CH3NH2 215
7 (CH3)3N 227
The presence of an absorbance band at a particular wavelength often is a good indicator of the presence of a chromophore. However, the position of the absorbance maximum is not fixed but depends partially on the molecular environment of the chromophore and on the solvent in which the sample may be dissolved. Other parameters, such as pH and temperature, also may cause changes in both the intensity and the wavelength of the absorbance maxima. In addition to such organic compounds early transition metals also absorb in UV region depending on the nature of the ligand. Many inorganic species called as charge-transfer complexes show charge-transfer absorption. In such a complex one of its components must have electron-donating properties and another component must be able to accept electrons. The transfer of an electron from the donor to an orbital associated with the acceptor leads to absorption. Charge transfer agents have high molar absorptivity. Molar absorptivities of compounds vary significantly The magnitude of ε reflects both the size of the chromophore and the probability that light of a given wavelength will be absorbed when it strikes the chromophore. It may be very large for strongly absorbing chromophores (>10,000) and very small if absorption is weak (10 to 100).

Electronic transitions The absorption of UV or visible radiation corresponds to the three types of electronic transition
1. Transitions involving π, σ, and n electrons 2. Transitions involving charge-transfer electrons 3. Transitions involving d and f electrons
Possible electronic transitions of π, σ, and n electrons are;
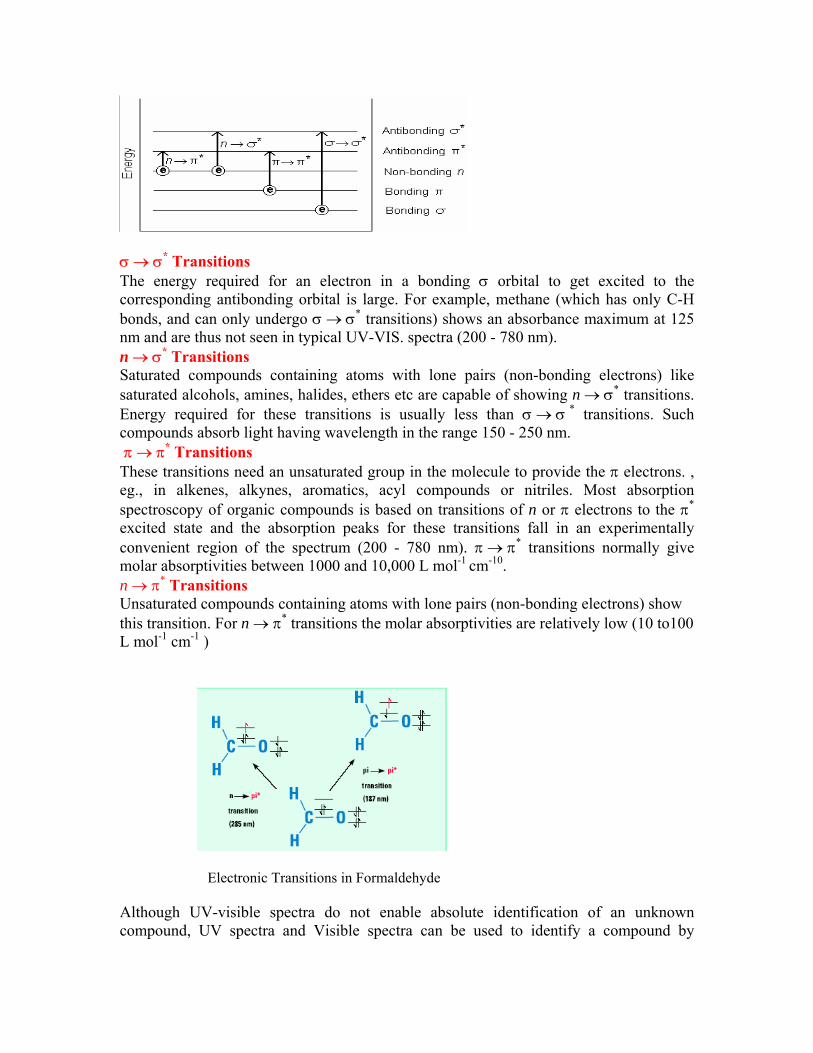
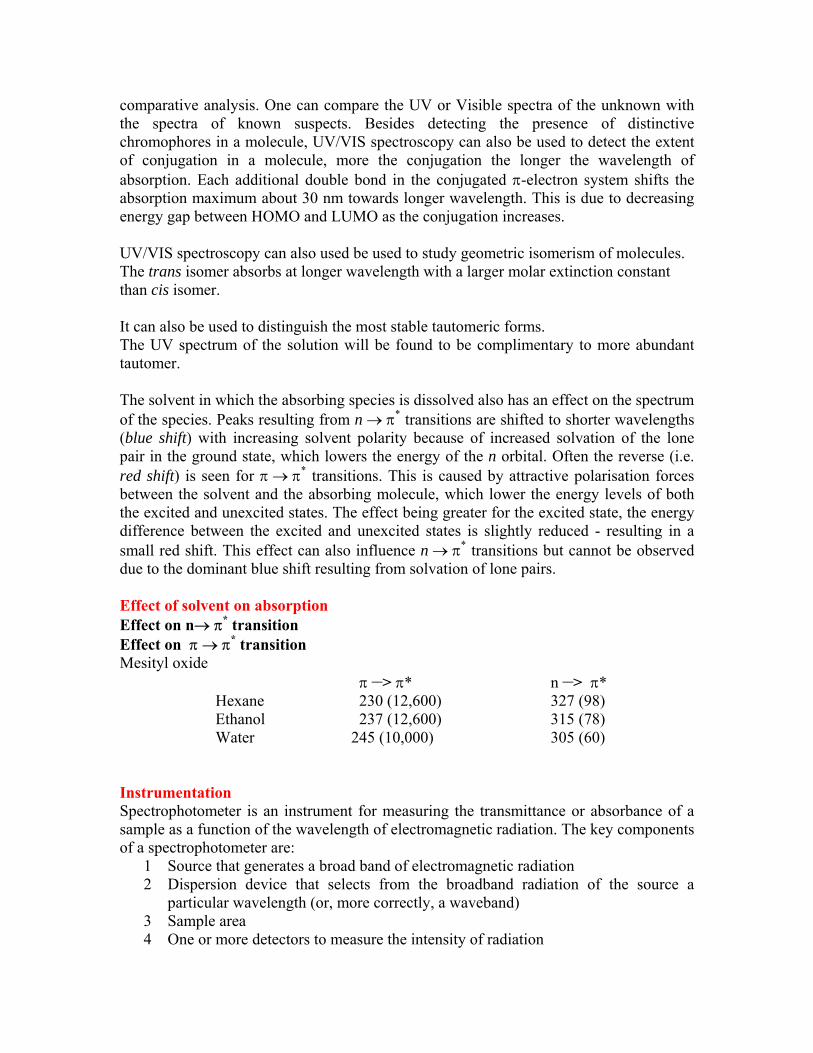
σ → σ* Transitions The energy required for an electron in a bonding σ orbital to get excited to the corresponding antibonding orbital is large. For example, methane (which has only C-H bonds, and can only undergo σ → σ* transitions) shows an absorbance maximum at 125 nm and are thus not seen in typical UV-VIS. spectra (200 - 780 nm). n → σ* Transitions Saturated compounds containing atoms with lone pairs (non-bonding electrons) like saturated alcohols, amines, halides, ethers etc are capable of showing n → σ* transitions. Energy required for these transitions is usually less than σ → σ * transitions. Such compounds absorb light having wavelength in the range 150 - 250 nm. π → π* Transitions These transitions need an unsaturated group in the molecule to provide the π electrons. , eg., in alkenes, alkynes, aromatics, acyl compounds or nitriles. Most absorption spectroscopy of organic compounds is based on transitions of n or π electrons to the π* excited state and the absorption peaks for these transitions fall in an experimentally convenient region of the spectrum (200 - 780 nm). π → π* transitions normally give molar absorptivities between 1000 and 10,000 L mol-1 cm-10. n → π* Transitions Unsaturated compounds containing atoms with lone pairs (non-bonding electrons) show this transition. For n → π* transitions the molar absorptivities are relatively low (10 to100 L mol-1 cm-1 )
Electronic Transitions in Formaldehyde
Although UV-visible spectra do not enable absolute identification of an unknown compound, UV spectra and Visible spectra can be used to identify a compound by
comparative analysis. One can compare the UV or Visible spectra of the unknown with the spectra of known suspects. Besides detecting the presence of distinctive chromophores in a molecule, UV/VIS spectroscopy can also be used to detect the extent of conjugation in a molecule, more the conjugation the longer the wavelength of absorption. Each additional double bond in the conjugated π-electron system shifts the absorption maximum about 30 nm towards longer wavelength. This is due to decreasing energy gap between HOMO and LUMO as the conjugation increases.
UV/VIS spectroscopy can also used be used to study geometric isomerism of molecules. The trans isomer absorbs at longer wavelength with a larger molar extinction constant than cis isomer.
It can also be used to distinguish the most stable tautomeric forms. The UV spectrum of the solution will be found to be complimentary to more abundant tautomer. The solvent in which the absorbing species is dissolved also has an effect on the spectrum of the species. Peaks resulting from n → π* transitions are shifted to shorter wavelengths (blue shift) with increasing solvent polarity because of increased solvation of the lone pair in the ground state, which lowers the energy of the n orbital. Often the reverse (i.e. red shift) is seen for π → π* transitions. This is caused by attractive polarisation forces between the solvent and the absorbing molecule, which lower the energy levels of both the excited and unexcited states. The effect being greater for the excited state, the energy difference between the excited and unexcited states is slightly reduced - resulting in a small red shift. This effect can also influence n → π* transitions but cannot be observed due to the dominant blue shift resulting from solvation of lone pairs. Effect of solvent on absorption Effect on n→ π* transition Effect on π → π* transition Mesityl oxide
π __> π* n __> π* Hexane 230 (12,600) 327 (98) Ethanol 237 (12,600) 315 (78) Water 245 (10,000) 305 (60)
Instrumentation Spectrophotometer is an instrument for measuring the transmittance or absorbance of a sample as a function of the wavelength of electromagnetic radiation. The key components of a spectrophotometer are:
1 Source that generates a broad band of electromagnetic radiation 2 Dispersion device that selects from the broadband radiation of the source a
particular wavelength (or, more correctly, a waveband) 3 Sample area 4 One or more detectors to measure the intensity of radiation

Other optical components, such as lenses or mirrors, relay light through the instrument. A schematic representation of a UV/VIS spectrophotometer is shown below. Normal working range for a spectrometer is 190 – 900 nm, working beyond 180 nm requires special arrangements.
The Light Source • A deuterium discharge lamp for UV region (160-375 nm) • A tungsten filament lamp or tungsten-halogen lamp for visible and NIR
regions (350 -2500 nm) • The instruments automatically swap lamps when scanning between the UV
and VIS-NIR regions
The Monochromator All monochromators contain the following components:
• An entrance slit • A collimating lens • A dispersing device • A focusing lens • An exit slit
Ideally, the output from a monochromator is monochromatic light. In practice, however, the output is always a band, optimally symmetrical in shape. Dispersion devices Dispersion devices cause different wavelengths of light to be dispersed at different angles. When combined with an appropriate exit slit, these devices can be used to select a particular wavelength (or, more precisely, a narrow waveband) of light from a continuous source. Two types of dispersion devices, prisms and holographic gratings, are commonly used in UV-VIS spectrophotometers. Light falling on the grating is reflected at different angles, depending on the wavelength. Holographic gratings yield a linear angular dispersion with wavelength and are temperature insensitive. However, they reflect light in different orders, which may overlap. As a result, filters must be used to ensure that only the light from the desired reflection order reaches the detector.
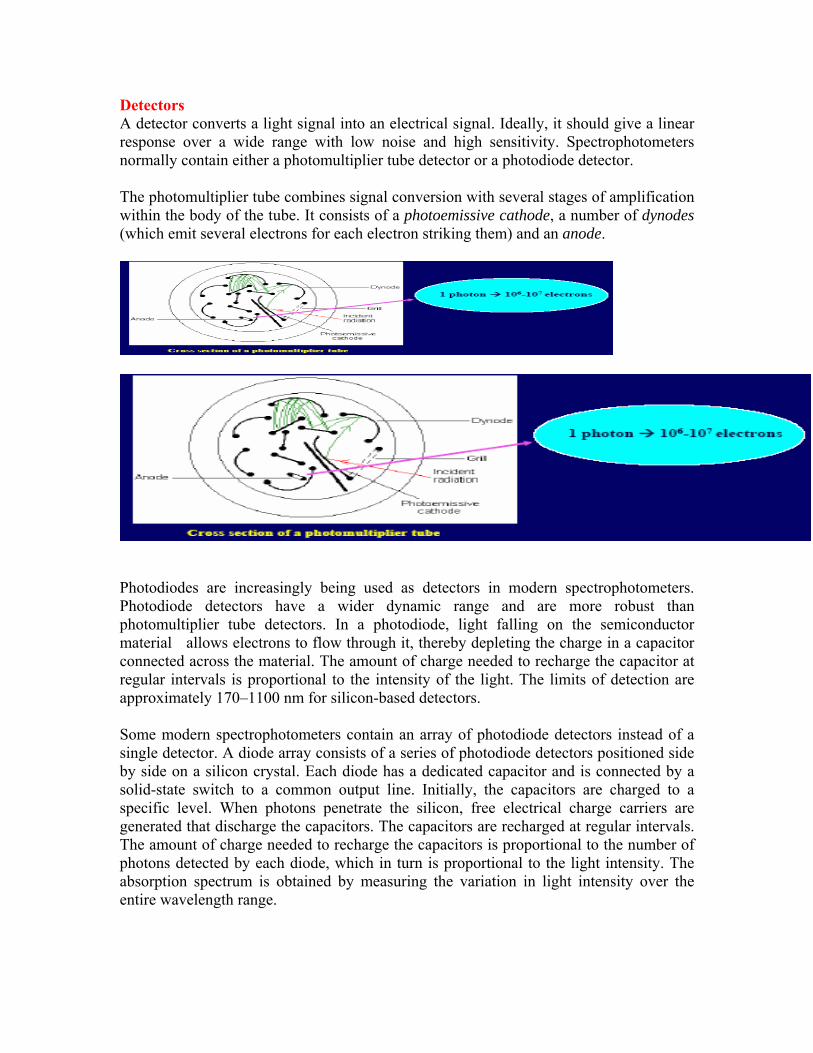
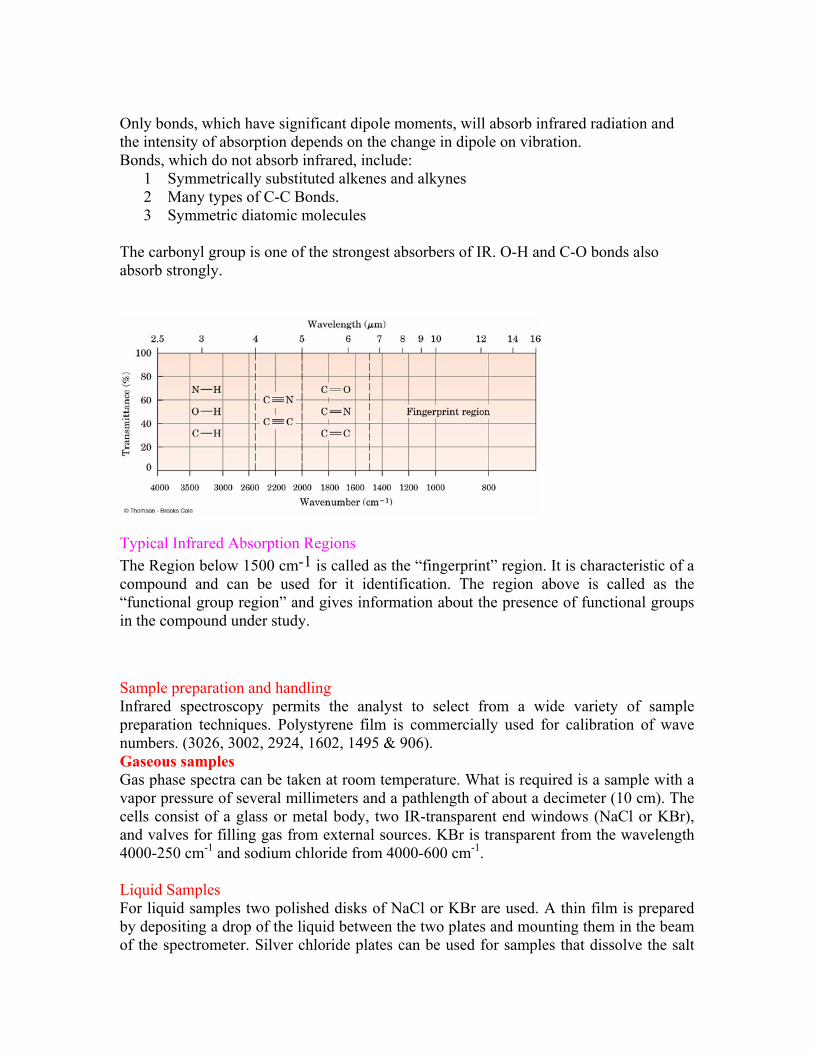
Detectors A detector converts a light signal into an electrical signal. Ideally, it should give a linear response over a wide range with low noise and high sensitivity. Spectrophotometers normally contain either a photomultiplier tube detector or a photodiode detector. The photomultiplier tube combines signal conversion with several stages of amplification within the body of the tube. It consists of a photoemissive cathode, a number of dynodes (which emit several electrons for each electron striking them) and an anode.
Photodiodes are increasingly being used as detectors in modern spectrophotometers. Photodiode detectors have a wider dynamic range and are more robust than photomultiplier tube detectors. In a photodiode, light falling on the semiconductor material allows electrons to flow through it, thereby depleting the charge in a capacitor connected across the material. The amount of charge needed to recharge the capacitor at regular intervals is proportional to the intensity of the light. The limits of detection are approximately 170–1100 nm for silicon-based detectors. Some modern spectrophotometers contain an array of photodiode detectors instead of a single detector. A diode array consists of a series of photodiode detectors positioned side by side on a silicon crystal. Each diode has a dedicated capacitor and is connected by a solid-state switch to a common output line. Initially, the capacitors are charged to a specific level. When photons penetrate the silicon, free electrical charge carriers are generated that discharge the capacitors. The capacitors are recharged at regular intervals. The amount of charge needed to recharge the capacitors is proportional to the number of photons detected by each diode, which in turn is proportional to the light intensity. The absorption spectrum is obtained by measuring the variation in light intensity over the entire wavelength range.

Configuration Various configurations of spectrophotometers are commercially available. Each has its advantages and disadvantages.
1 Single-beam design 2 Dual-beam design 3 Split-beam design 4 Dual-wavelength design
Cells These are containers for the sample and reference solutions. They must be transparent to the radiation passing through. For UV region : Quartz or fused silica cuvettes are usually used. VIS/NIR regions : Silicate glass or plastic cuvettes (350-2000 nm) can also be used. Choice of solvent
Ideally solvent should be transparent at all wavelengths. Table 4: Properties of some common solvents

IR Spectroscopy For organic molecules, molecular vibrations have energies that correspond to that of the infrared region of the electromagnetic spectrum. These molecular vibrations are typically measured using infrared spectroscopy. For organic chemistry, the most useful range of the infrared spectrum encompasses approximately 2.5 to 15 µm. Functional groups present in the molecules have characteristic vibrational frequencies, and the presence of an absorption band in the infrared spectrum is strong suggestive evidence that the molecule contains that functional group. Likewise, for many “reliable” bands, the absence of an absorbance is also strong suggestive evidence that a particular functional group is absent in the molecule. Infrared spectroscopy can be used for
1 Chemical analysis: Spectra can be matched to known databases for identification of an unknown compound.
2 Monitoring of chemical reactions in situ. 3 To determine which chemical groups are present in a specific compound. 4 Identification of reaction components and kinetic studies of reactions 5 Identification of compounds, polymers, plastics, and resins. 6 Detection of molecular impurities or additives present in amounts of 1% and in
some cases as low as 0.01% 7 Analysis of formulations such as insecticides and copolymers.
Principle
Picture molecules as two (or more) nuclei held together by ‘non-totally rigid’ bonds (i.e. like springs). Using Hooke’s Law and the Simple Harmonic Oscillator approximation, the following equation can be derived to describe the motion of a bond. Vibrational energy levels of a harmonic oscillator: Ev = (v + ½) hν Vibrational quantum number, v = 0, 1, 2, ..
1
2πc K
µ = ν Larger K, higher the frequency.
Larger atomic masses, lower the frequency
Where
ν = Frequency in cm –1
C = Velocity of light K = Force constant µ = Reduced mass

Factors influencing absorption frequency Masses of attached atoms: As masses increase, wavenumber decreases.
C-H C-C C-O C-Cl C-Br C-I
3000 1
1200 1
1100 1
750 1
600 1
500 1
Strength of chemical bond: As bond strength increases, wavenumber increases.
2150 cm-1
= C=C triple bond C=C C-C
1650 cm-1 1200 cm-1
Hybridization. Bonds are stronger in the order sp > sp2 > sp3.
C-H (sp2) C-H (sp3) C-H (sp)
3300 cm-1
3100 cm-1 2900 cm-1
Resonance: Conjugation lowers the energy to vibrate bond.
α,β-unsaturated ketone
α,β,γ,δ-unsaturated ketone
isolated ketones
1715 cm-1
1690 cm-1
1675 cm-1
Molecular vibrations There are two major types of vibrations
1 Stretching: Involve change in bond length 2 Bending: Involve change in bond angle
Stretching vibrations are of two types: symmetrical and asymmetrical stretching, with asymmetric vibration taking place at a higher frequency than the stretching frequency. Bending vibrations include scissoring, rocking, wagging and twisting. Bending vibrations usually occur at lower frequencies in comparison to stretching.
Only bonds, which have significant dipole moments, will absorb infrared radiation and the intensity of absorption depends on the change in dipole on vibration. Bonds, which do not absorb infrared, include:
1 Symmetrically substituted alkenes and alkynes 2 Many types of C-C Bonds. 3 Symmetric diatomic molecules
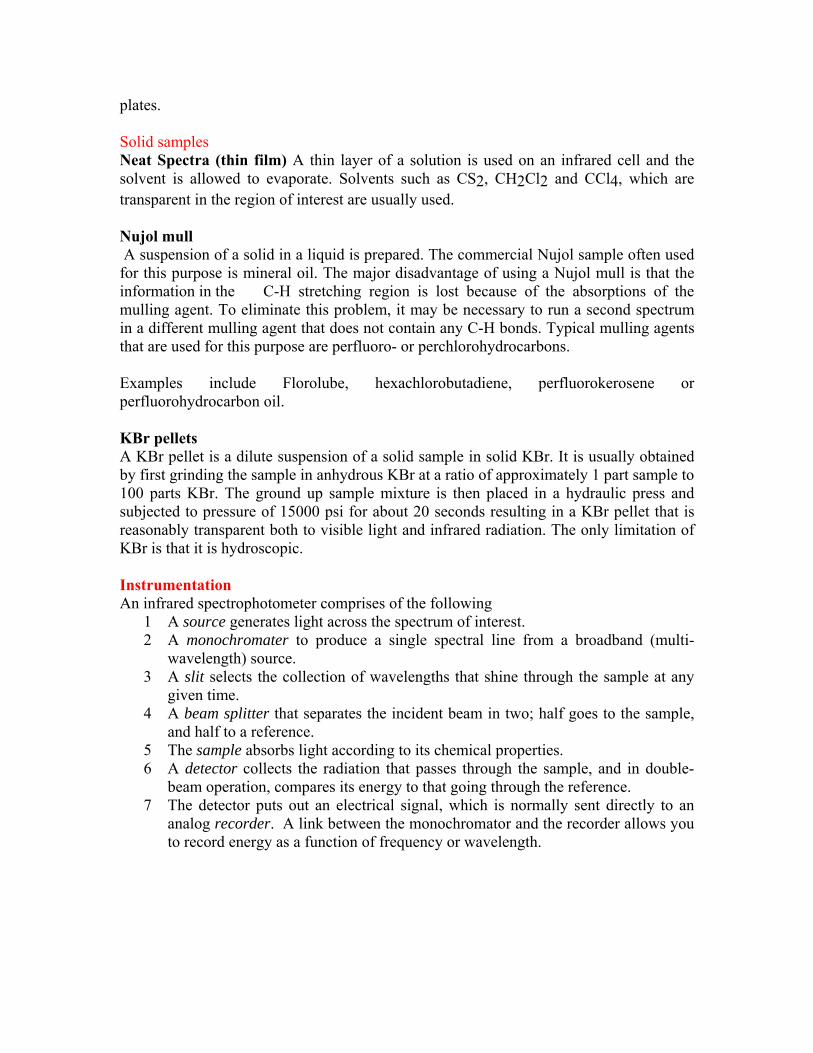
The carbonyl group is one of the strongest absorbers of IR. O-H and C-O bonds also absorb strongly.
Typical Infrared Absorption Regions The Region below 1500 cm-1 is called as the “fingerprint” region. It is characteristic of a compound and can be used for it identification. The region above is called as the “functional group region” and gives information about the presence of functional groups in the compound under study.
Sample preparation and handling Infrared spectroscopy permits the analyst to select from a wide variety of sample preparation techniques. Polystyrene film is commercially used for calibration of wave numbers. (3026, 3002, 2924, 1602, 1495 & 906). Gaseous samples Gas phase spectra can be taken at room temperature. What is required is a sample with a vapor pressure of several millimeters and a pathlength of about a decimeter (10 cm). The cells consist of a glass or metal body, two IR-transparent end windows (NaCl or KBr), and valves for filling gas from external sources. KBr is transparent from the wavelength 4000-250 cm-1 and sodium chloride from 4000-600 cm-1. Liquid Samples For liquid samples two polished disks of NaCl or KBr are used. A thin film is prepared by depositing a drop of the liquid between the two plates and mounting them in the beam of the spectrometer. Silver chloride plates can be used for samples that dissolve the salt
plates. Solid samples Neat Spectra (thin film) A thin layer of a solution is used on an infrared cell and the solvent is allowed to evaporate. Solvents such as CS2, CH2Cl2 and CCl4, which are transparent in the region of interest are usually used. Nujol mull A suspension of a solid in a liquid is prepared. The commercial Nujol sample often used for this purpose is mineral oil. The major disadvantage of using a Nujol mull is that the information in the C-H stretching region is lost because of the absorptions of the mulling agent. To eliminate this problem, it may be necessary to run a second spectrum in a different mulling agent that does not contain any C-H bonds. Typical mulling agents that are used for this purpose are perfluoro- or perchlorohydrocarbons. Examples include Florolube, hexachlorobutadiene, perfluorokerosene or perfluorohydrocarbon oil. KBr pellets A KBr pellet is a dilute suspension of a solid sample in solid KBr. It is usually obtained by first grinding the sample in anhydrous KBr at a ratio of approximately 1 part sample to 100 parts KBr. The ground up sample mixture is then placed in a hydraulic press and subjected to pressure of 15000 psi for about 20 seconds resulting in a KBr pellet that is reasonably transparent both to visible light and infrared radiation. The only limitation of KBr is that it is hydroscopic. Instrumentation An infrared spectrophotometer comprises of the following
1 A source generates light across the spectrum of interest. 2 A monochromater to produce a single spectral line from a broadband (multi-
wavelength) source. 3 A slit selects the collection of wavelengths that shine through the sample at any
given time. 4 A beam splitter that separates the incident beam in two; half goes to the sample,
and half to a reference. 5 The sample absorbs light according to its chemical properties. 6 A detector collects the radiation that passes through the sample, and in double-
beam operation, compares its energy to that going through the reference. 7 The detector puts out an electrical signal, which is normally sent directly to an
analog recorder. A link between the monochromator and the recorder allows you to record energy as a function of frequency or wavelength.
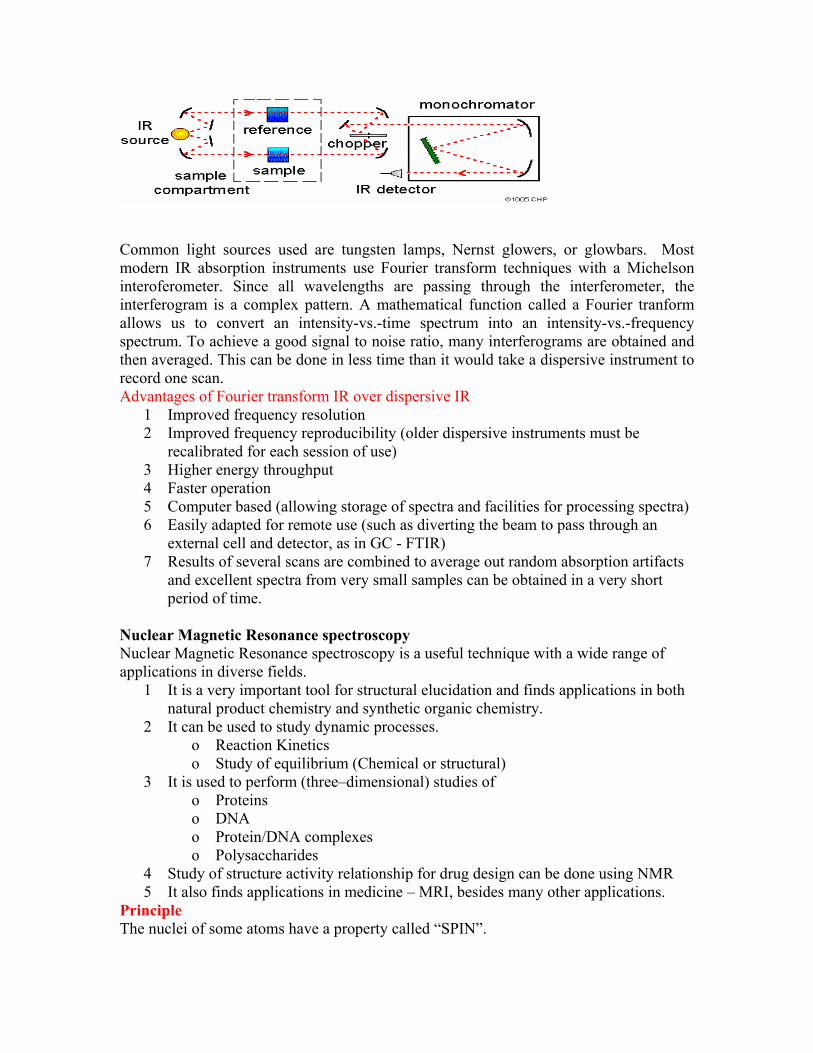
Common light sources used are tungsten lamps, Nernst glowers, or glowbars. Most modern IR absorption instruments use Fourier transform techniques with a Michelson interoferometer. Since all wavelengths are passing through the interferometer, the interferogram is a complex pattern. A mathematical function called a Fourier tranform allows us to convert an intensity-vs.-time spectrum into an intensity-vs.-frequency spectrum. To achieve a good signal to noise ratio, many interferograms are obtained and then averaged. This can be done in less time than it would take a dispersive instrument to record one scan. Advantages of Fourier transform IR over dispersive IR
1 Improved frequency resolution 2 Improved frequency reproducibility (older dispersive instruments must be
recalibrated for each session of use) 3 Higher energy throughput 4 Faster operation 5 Computer based (allowing storage of spectra and facilities for processing spectra) 6 Easily adapted for remote use (such as diverting the beam to pass through an
external cell and detector, as in GC - FTIR) 7 Results of several scans are combined to average out random absorption artifacts
and excellent spectra from very small samples can be obtained in a very short period of time.
Nuclear Magnetic Resonance spectroscopy Nuclear Magnetic Resonance spectroscopy is a useful technique with a wide range of applications in diverse fields.
1 It is a very important tool for structural elucidation and finds applications in both natural product chemistry and synthetic organic chemistry.
2 It can be used to study dynamic processes. o Reaction Kinetics o Study of equilibrium (Chemical or structural)
3 It is used to perform (three–dimensional) studies of o Proteins o DNA o Protein/DNA complexes o Polysaccharides
4 Study of structure activity relationship for drug design can be done using NMR 5 It also finds applications in medicine – MRI, besides many other applications.
Principle The nuclei of some atoms have a property called “SPIN”.
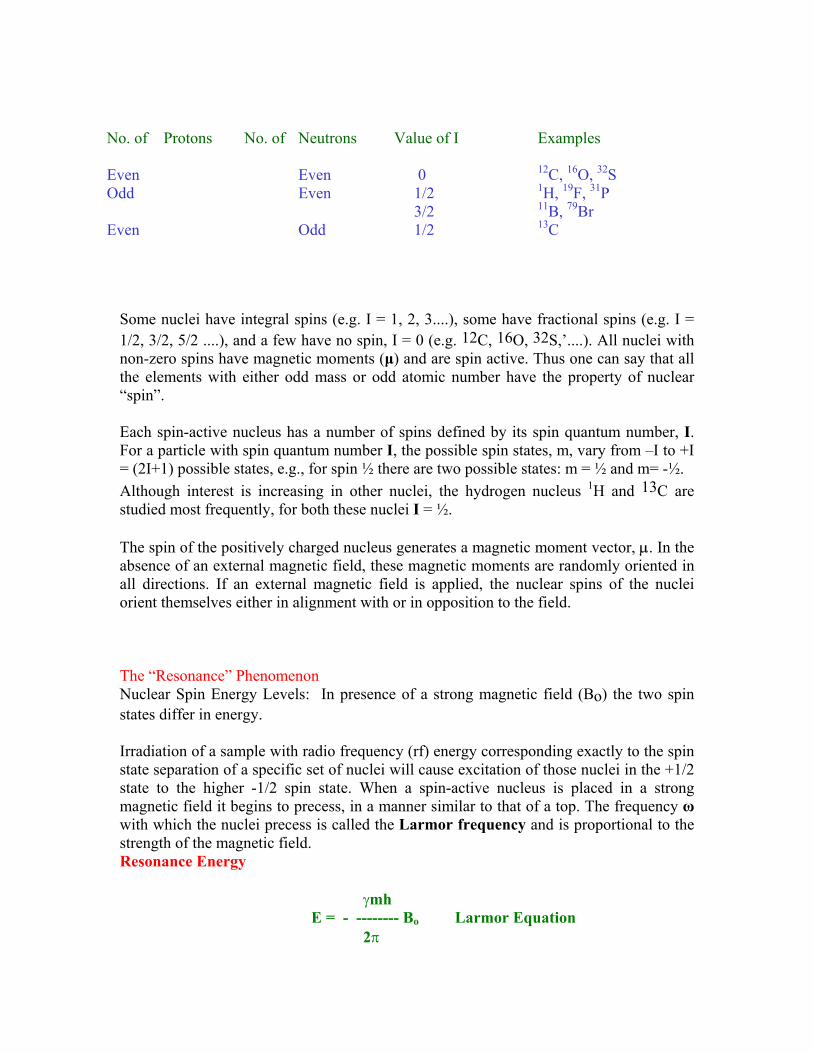
No. of Protons No. of Neutrons Value of I Examples Even Even 0 12C, 16O, 32S Odd Even 1/2 1H, 19F, 31P 3/2 11B, 79Br Even Odd 1/2 13C
Some nuclei have integral spins (e.g. I = 1, 2, 3....), some have fractional spins (e.g. I = 1/2, 3/2, 5/2 ....), and a few have no spin, I = 0 (e.g. 12C, 16O, 32S,’....). All nuclei with non-zero spins have magnetic moments (µ) and are spin active. Thus one can say that all the elements with either odd mass or odd atomic number have the property of nuclear “spin”. Each spin-active nucleus has a number of spins defined by its spin quantum number, I. For a particle with spin quantum number I, the possible spin states, m, vary from –I to +I = (2I+1) possible states, e.g., for spin ½ there are two possible states: m = ½ and m= -½. Although interest is increasing in other nuclei, the hydrogen nucleus 1H and 13C are studied most frequently, for both these nuclei I = ½.
The spin of the positively charged nucleus generates a magnetic moment vector, µ. In the absence of an external magnetic field, these magnetic moments are randomly oriented in all directions. If an external magnetic field is applied, the nuclear spins of the nuclei orient themselves either in alignment with or in opposition to the field.
The “Resonance” Phenomenon Nuclear Spin Energy Levels: In presence of a strong magnetic field (Bo) the two spin states differ in energy. Irradiation of a sample with radio frequency (rf) energy corresponding exactly to the spin state separation of a specific set of nuclei will cause excitation of those nuclei in the +1/2 state to the higher -1/2 spin state. When a spin-active nucleus is placed in a strong magnetic field it begins to precess, in a manner similar to that of a top. The frequency ω with which the nuclei precess is called the Larmor frequency and is proportional to the strength of the magnetic field. Resonance Energy
γmh E = - -------- Bo Larmor Equation
2π

where γ => magnetogyro ratio m => magnetic quantum number h => Planck's constant B => strength of external field when m = +1/2 ∆E = Ehigher stste - Elower state = E-1/2 - E+1/2
E-1/2 = - ------------ Bo = ----- Bo
2π 4π
E+1/2 = - ------------ Bo = - ----- Bo
2π 4π
γ(+1/2)h γh γh γ(-1/2)h
∆E = (γhBo/ 4π) - (- γh Bo/ 4π)
∆E = h ν = γh Bo/ 2π
γ ν = Β0 2π
γ is a constant, which is different for each atomic nucleus (H, C, N, etc)
The energy separation and thus the frequency absorbed depends on B0 Population and signal strength The strength of the NMR signal depends on the population difference of the two spin states. The Boltzmann equation tells us the population of a state if we know its energy.
TkEE
BeNN αβ
β
α
−
=
A slight excess of +1/2 spin states precess randomly in alignment with the external field and a smaller population of -1/2 spin states precess randomly in an opposite alignment. An overall net magnetization therefore lies along the z-axis.
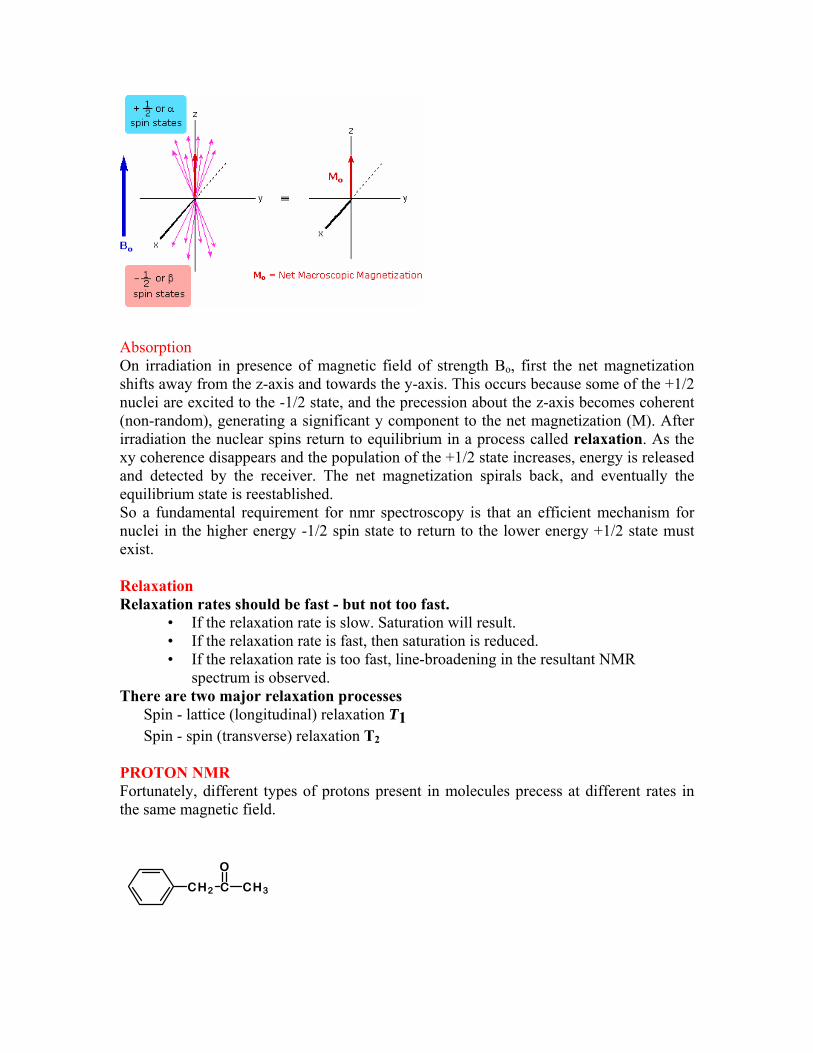
Absorption On irradiation in presence of magnetic field of strength Bo, first the net magnetization shifts away from the z-axis and towards the y-axis. This occurs because some of the +1/2 nuclei are excited to the -1/2 state, and the precession about the z-axis becomes coherent (non-random), generating a significant y component to the net magnetization (M). After irradiation the nuclear spins return to equilibrium in a process called relaxation. As the xy coherence disappears and the population of the +1/2 state increases, energy is released and detected by the receiver. The net magnetization spirals back, and eventually the equilibrium state is reestablished. So a fundamental requirement for nmr spectroscopy is that an efficient mechanism for nuclei in the higher energy -1/2 spin state to return to the lower energy +1/2 state must exist. Relaxation Relaxation rates should be fast - but not too fast.
• If the relaxation rate is slow. Saturation will result. • If the relaxation rate is fast, then saturation is reduced. • If the relaxation rate is too fast, line-broadening in the resultant NMR
spectrum is observed. There are two major relaxation processes
Spin - lattice (longitudinal) relaxation T1 Spin - spin (transverse) relaxation T2
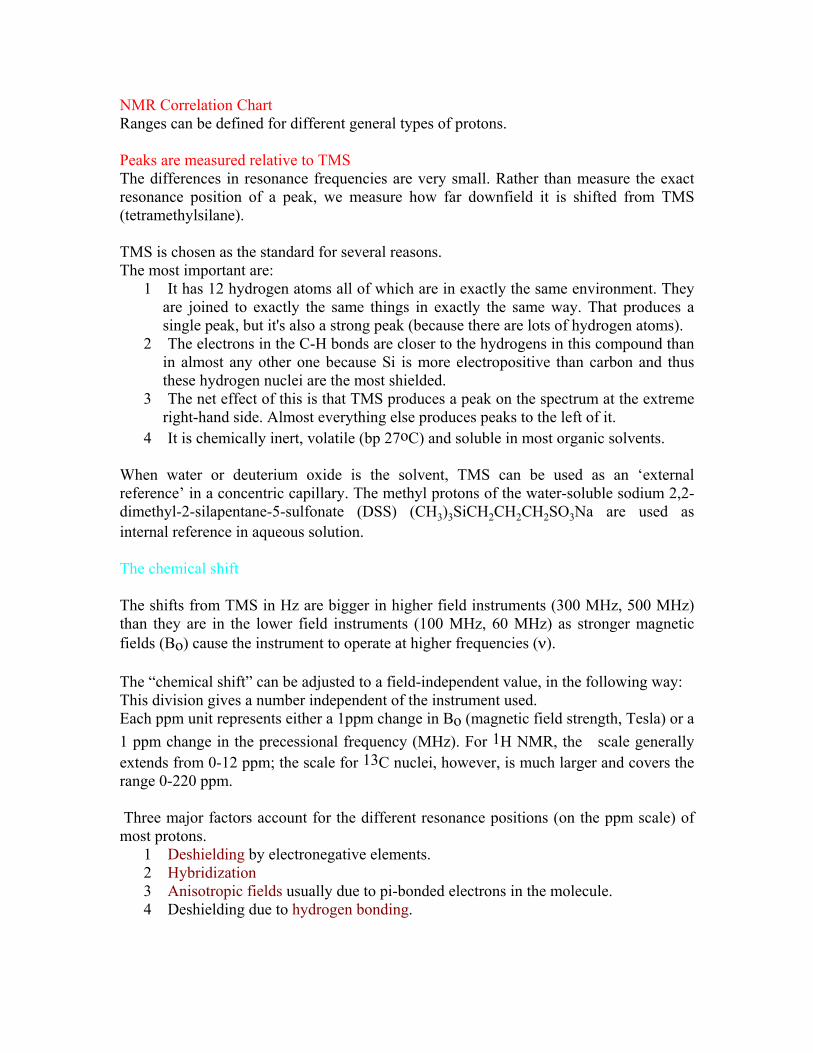
PROTON NMR Fortunately, different types of protons present in molecules precess at different rates in the same magnetic field.
CH2 C
O
CH3
NMR Correlation Chart Ranges can be defined for different general types of protons. Peaks are measured relative to TMS The differences in resonance frequencies are very small. Rather than measure the exact resonance position of a peak, we measure how far downfield it is shifted from TMS (tetramethylsilane). TMS is chosen as the standard for several reasons. The most important are:
1 It has 12 hydrogen atoms all of which are in exactly the same environment. They are joined to exactly the same things in exactly the same way. That produces a single peak, but it's also a strong peak (because there are lots of hydrogen atoms).
2 The electrons in the C-H bonds are closer to the hydrogens in this compound than in almost any other one because Si is more electropositive than carbon and thus these hydrogen nuclei are the most shielded.
3 The net effect of this is that TMS produces a peak on the spectrum at the extreme right-hand side. Almost everything else produces peaks to the left of it.
4 It is chemically inert, volatile (bp 27oC) and soluble in most organic solvents. When water or deuterium oxide is the solvent, TMS can be used as an ‘external reference’ in a concentric capillary. The methyl protons of the water-soluble sodium 2,2-dimethyl-2-silapentane-5-sulfonate (DSS) (CH3)3SiCH2CH2CH2SO3Na are used as internal reference in aqueous solution. The chemical shift The shifts from TMS in Hz are bigger in higher field instruments (300 MHz, 500 MHz) than they are in the lower field instruments (100 MHz, 60 MHz) as stronger magnetic fields (Bo) cause the instrument to operate at higher frequencies (ν). The “chemical shift” can be adjusted to a field-independent value, in the following way: This division gives a number independent of the instrument used. Each ppm unit represents either a 1ppm change in Bo (magnetic field strength, Tesla) or a 1 ppm change in the precessional frequency (MHz). For 1H NMR, the scale generally extends from 0-12 ppm; the scale for 13C nuclei, however, is much larger and covers the range 0-220 ppm. Three major factors account for the different resonance positions (on the ppm scale) of most protons.
1 Deshielding by electronegative elements. 2 Hybridization 3 Anisotropic fields usually due to pi-bonded electrons in the molecule. 4 Deshielding due to hydrogen bonding.
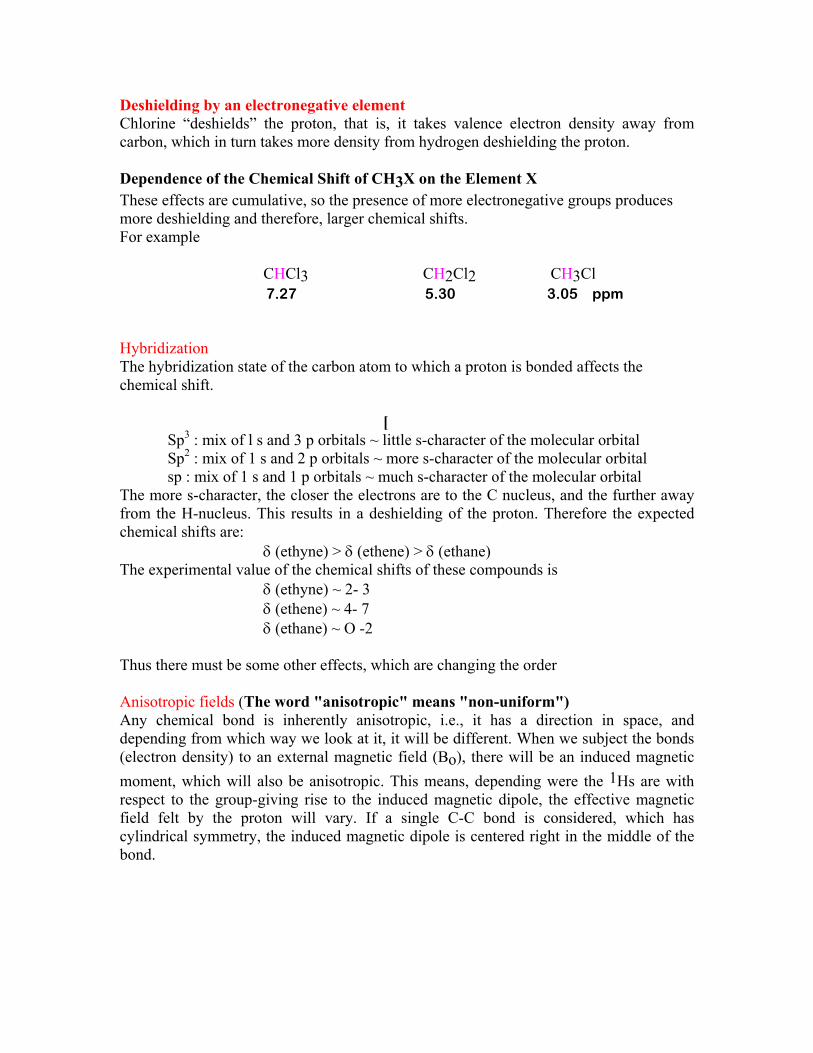
Deshielding by an electronegative element Chlorine “deshields” the proton, that is, it takes valence electron density away from carbon, which in turn takes more density from hydrogen deshielding the proton. Dependence of the Chemical Shift of CH3X on the Element X These effects are cumulative, so the presence of more electronegative groups produces more deshielding and therefore, larger chemical shifts. For example
CHCl3 CH2Cl2 CH3Cl 7.27 5.30 3.05 ppm
Hybridization The hybridization state of the carbon atom to which a proton is bonded affects the chemical shift.
[
Sp3 : mix of l s and 3 p orbitals ~ little s-character of the molecular orbital Sp2 : mix of 1 s and 2 p orbitals ~ more s-character of the molecular orbital sp : mix of 1 s and 1 p orbitals ~ much s-character of the molecular orbital
The more s-character, the closer the electrons are to the C nucleus, and the further away from the H-nucleus. This results in a deshielding of the proton. Therefore the expected chemical shifts are:
δ (ethyne) > δ (ethene) > δ (ethane) The experimental value of the chemical shifts of these compounds is
δ (ethyne) ~ 2- 3 δ (ethene) ~ 4- 7 δ (ethane) ~ O -2
Thus there must be some other effects, which are changing the order Anisotropic fields (The word "anisotropic" means "non-uniform") Any chemical bond is inherently anisotropic, i.e., it has a direction in space, and depending from which way we look at it, it will be different. When we subject the bonds (electron density) to an external magnetic field (Bo), there will be an induced magnetic moment, which will also be anisotropic. This means, depending were the 1Hs are with respect to the group-giving rise to the induced magnetic dipole, the effective magnetic field felt by the proton will vary. If a single C-C bond is considered, which has cylindrical symmetry, the induced magnetic dipole is centered right in the middle of the bond.
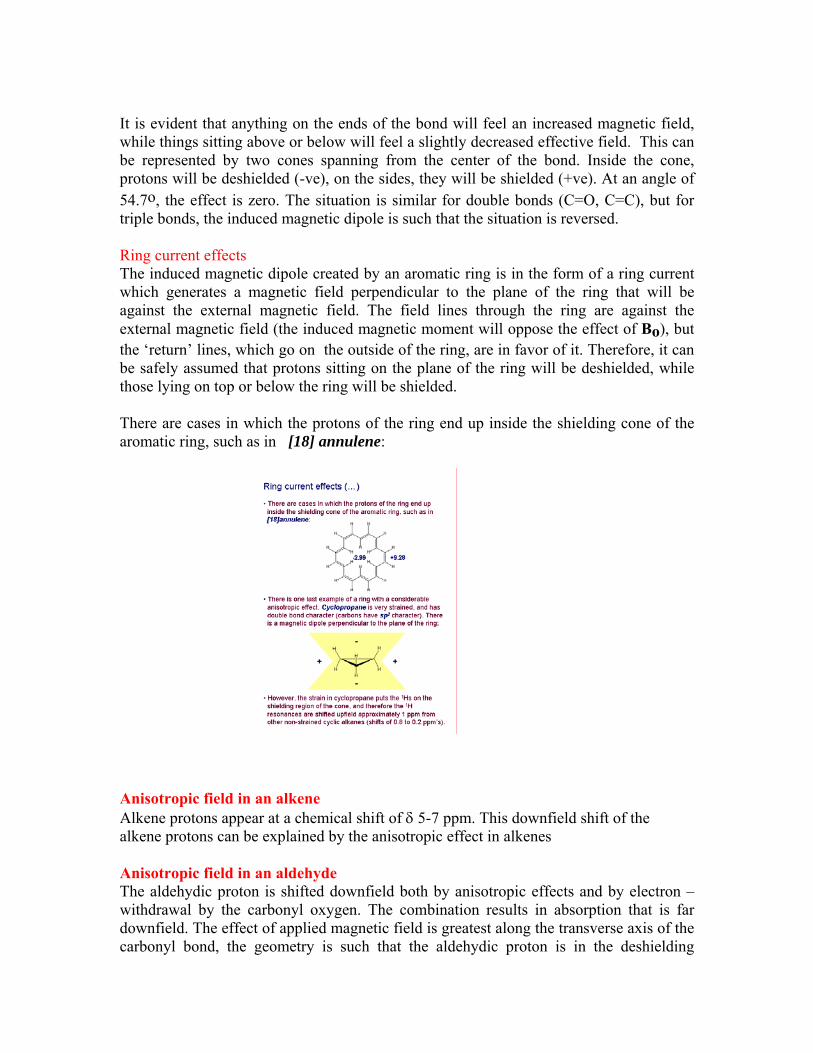
It is evident that anything on the ends of the bond will feel an increased magnetic field, while things sitting above or below will feel a slightly decreased effective field. This can be represented by two cones spanning from the center of the bond. Inside the cone, protons will be deshielded (-ve), on the sides, they will be shielded (+ve). At an angle of 54.7o, the effect is zero. The situation is similar for double bonds (C=O, C=C), but for triple bonds, the induced magnetic dipole is such that the situation is reversed. Ring current effects The induced magnetic dipole created by an aromatic ring is in the form of a ring current which generates a magnetic field perpendicular to the plane of the ring that will be against the external magnetic field. The field lines through the ring are against the external magnetic field (the induced magnetic moment will oppose the effect of Bo), but the ‘return’ lines, which go on the outside of the ring, are in favor of it. Therefore, it can be safely assumed that protons sitting on the plane of the ring will be deshielded, while those lying on top or below the ring will be shielded. There are cases in which the protons of the ring end up inside the shielding cone of the aromatic ring, such as in [18] annulene:
Anisotropic field in an alkene Alkene protons appear at a chemical shift of δ 5-7 ppm. This downfield shift of the alkene protons can be explained by the anisotropic effect in alkenes Anisotropic field in an aldehyde The aldehydic proton is shifted downfield both by anisotropic effects and by electron –withdrawal by the carbonyl oxygen. The combination results in absorption that is far downfield. The effect of applied magnetic field is greatest along the transverse axis of the carbonyl bond, the geometry is such that the aldehydic proton is in the deshielding
portion of the induced magnetic field. Anisotropic field for an alkyne. Electrons in alkynes are most free to circulate around the symmetry axis. If the molecule is aligned perpendicular to the applied field, the protons will be deshielded. However the deshielding component is very small as the e-s are not free to move in this direction. Hydrogen Bonding and Acidity In general, hydrogen bonding results in deshielding of the proton and the resonance moves downfield. When a proton is directly bonded to a strongly electronegative atom, such as N or O, its chemical shift is very sensitive to:
1 nature of the solvent
2 temperature
3 concentration
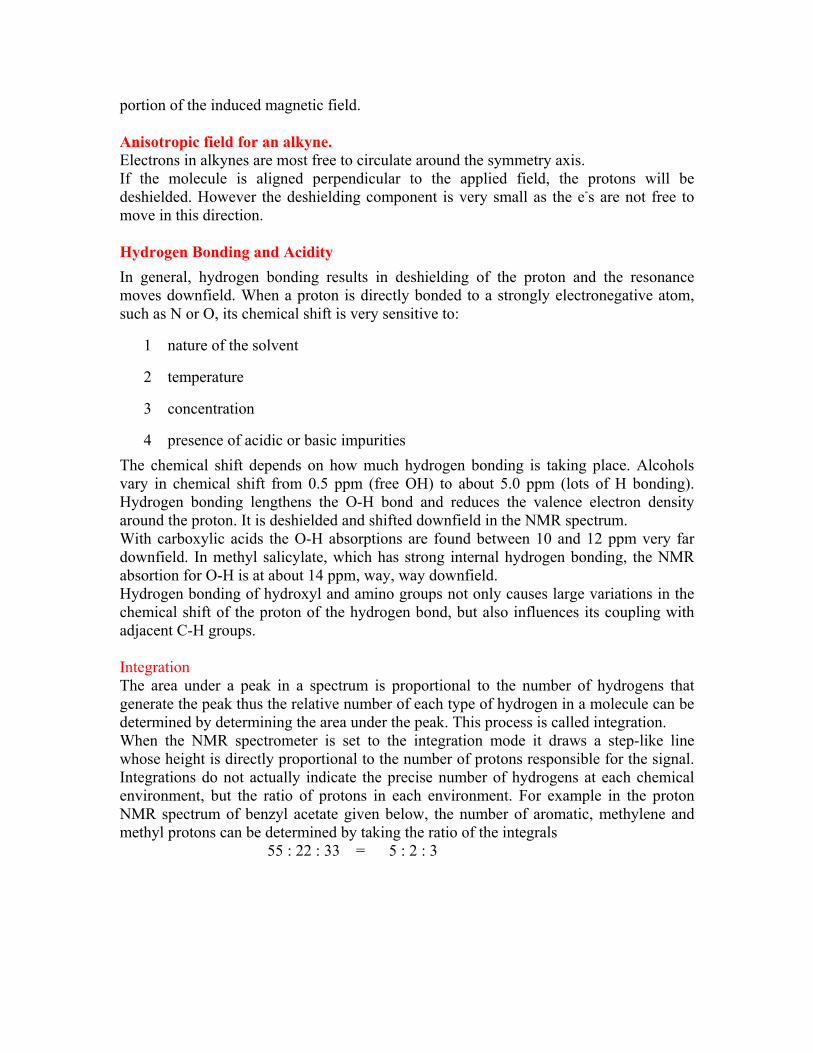
4 presence of acidic or basic impurities The chemical shift depends on how much hydrogen bonding is taking place. Alcohols vary in chemical shift from 0.5 ppm (free OH) to about 5.0 ppm (lots of H bonding). Hydrogen bonding lengthens the O-H bond and reduces the valence electron density around the proton. It is deshielded and shifted downfield in the NMR spectrum. With carboxylic acids the O-H absorptions are found between 10 and 12 ppm very far downfield. In methyl salicylate, which has strong internal hydrogen bonding, the NMR absortion for O-H is at about 14 ppm, way, way downfield. Hydrogen bonding of hydroxyl and amino groups not only causes large variations in the chemical shift of the proton of the hydrogen bond, but also influences its coupling with adjacent C-H groups. IIntegration The area under a peak in a spectrum is proportional to the number of hydrogens that generate the peak thus the relative number of each type of hydrogen in a molecule can be determined by determining the area under the peak. This process is called integration. When the NMR spectrometer is set to the integration mode it draws a step-like line whose height is directly proportional to the number of protons responsible for the signal. Integrations do not actually indicate the precise number of hydrogens at each chemical environment, but the ratio of protons in each environment. For example in the proton NMR spectrum of benzyl acetate given below, the number of aromatic, methylene and methyl protons can be determined by taking the ratio of the integrals 55 : 22 : 33 = 5 : 2 : 3
Modern instruments report the integral as a number at the bottom of the spectrum and the Integrals are good to about 10% accuracy. Spin-spin splitting Often a group of hydrogens will appear as a multiplet rather than as a single peak. This happens because coupling of nuclear spins of neighboring nuclei can split signals. Multiplets are named as follows: Singlet Quintet Doublet Septet Triplet Octet Quartet Nonet n + 1 rule can be used to predict the splitting of peaks due to interactions with neighboring nuclei. Protons that are equivalent by symmetry usually do not split one another and also the protons in the same group, where rotation about the bonds is not restricted usually do not split one another. IIntensities of multiplet peaks A simple way of estimating the relative intensities of the lines in a first-order coupling pattern is by making use of Pascal’s triangle. The coupling constant The coupling constant J is a measure of the amount of interaction between the two sets of hydrogens creating the multiplet. It is the distance measured in Hz between the peaks in a multiplet. Coupling constants are constant and are field independent for each set of protons. Coupling constants may vary from a fraction of a Hz to nearly 20 Hz. Important factors being the nature and spatial orientation of the bonds joining the coupled nuclei. The influence of the dihedral orientation of the coupled hydrogens is important.

C
H
H
C H
H
H
Carbon-13 NMR 13C signals are 6000 times weaker than 1H because:
1 Natural abundance of 13C is small (1.08% of all C) 2 Magnetic moment of 13C is small
The chemical shift range is larger than for protons - 0 - 200 ppm The magnetogyric ratio of the 13C nucleus is smaller than that of the hydrogen nucleus so for a given field strength 13C has its resonance at a different (lower) frequency than 1H. Because of its low natural abundance (0.0108) there is a low probability of finding two 13C atoms next to each other in a single molecule. Therefore 13C - 13C coupling is not observed. Spectra are determined by many molecules, contributing to the spectrum. However, 13C does couple to hydrogen atoms (I = 1/2) and splitting is observed. Coupling to attached protons n+1 rule applies to coupling and the coupling constants (J) are large ~ 100 - 200 Hz. Decoupling the proton spins Coupling constants for 13C-H coupling are frequently larger than the chemical shift differences of the carbons in the spectrum and because of this the multiplets from different carbons overlap, thus making the proton-coupled spectra for large organic molecules often difficult to interpret. A common method used in determining a carbon-13 NMR spectrum is to irradiate all of the hydrogen nuclei in the molecule at the same time the carbon resonances are being measured. This requires a second radiofrequency (RF) source (the decoupler) tuned to the frequency of the hydrogen nuclei, while the primary RF source is tuned to the 13C frequency. The hydrogen nuclei are thus “saturated”, a situation where there are as many downward asthere are upward transitions, all occuring rapidly. During the time the carbon-13 spectrum is being determined, the hydrogen nuclei cycle rapidly between their two spin states (+1/2 and -1/2) and the carbon nuclei see an average coupling (i.e., zero) to the hydrogens. The hydrogens decouple from the carbon-13 nucleiand each carbon gives a singlet in the spectrum.
Off-resonance proton decoupling In order to retain the information about the attached hydrogens that a proton-coupled spectrum provides, a compromise technique called off-resonance proton decoupling is used. In this technique, the sample is swept by a radio frequency generator which is either

slightly upfield or downfield of normal proton resonances (i.e., off resonance). When off-resonance decoupling is used, the apparent coupling constant is greatly reduced, and peak overlap is minimized. Integration In a carbon-13 experiment, a large number of scans is required in order to observe the signals from these relatively rare nuclei. These multiple scans are added together to give the final spectrum. One problem experienced in carbon-13 spectroscopy is that the time taken by carbon-13 nuclei to “relax”, back to the ground state before the next scan is variable. Highly substituted carbon nuclei (tertiary and quaternary carbon atoms) relax very slowly (on the order of several minutes). This problem can be overcome by setting quite a long delay time between scans. However, this procedure will usually make the acquisition of a carbon-13 spectrum take several hours. If the delay time between scans is too short, not all of these nuclei will relax, and therefore will not be detected. Thus integration of the carbon-13 peaks will not always provide an accurate count of each type of carbon atom in the structure. A compromise is usually made: the delay time is set to about 30 seconds (this will allow most nuclei to relax), and the spectroscopist understands that integration of the peaks will not be possible. Another factor that makes integration of carbon-13 spectra difficult is that the intensities of the carbon resonances are enhanced due to Nuclear overhauser effect. In a proton-decoupled spectrum when the hydrogen nuclei are irradiated simultaneously with carbon nuclei, the number of hydrogen nuclei in the higher energy "spin-opposed" state is increased. The carbon atoms to which these protons are attached adjust their equilibrium distribution to increase the population of carbon atoms in the lower energy "spin-aligned" state due to the interaction of spin dipoles and this larger population of carbon atoms in the lower spin state results in a larger number of nuclei that can be detected, and therefore an increased signal. The NOE effect is related to the inverse sixth power of r (distance between the two nuclei). NOE decays very fast as the two nuclei are pulled away from each other.
To obtain integrated carbon -13 spectra special techniques are used. Although off-resonance proton-decoupled spectra contain a great deal of information, the technique has been supplanted by the DEPT (Distortionless Enhancement by Polarization Transfer) experiment. In a DEPT experiment, methyl, methylene, and methyne protons can be discriminated. Several 2D NMR techniques are used to arrive at the final skeleton of a compound. These techniques are highly useful and provide a comprehensive correlation guide of the nuclei in a molecule. One simple 2-D experiment is 1H - 1H COSY which gives information about all the proton couplings in a molecule, i.e., which proton is coupling with which proton in the molecule. 1H – 13C HETCOR (Heteronuclear chemical shift correlation) experiments correlate 13C nuclei with directly attached protons. INADEQUATE
(Incredible Natural Abundance Double Quantum Transfer Experiments) gives directly attached carbon carbon couplings. No spectroscopic technique is used alone to analyze and characterize the analytes but all these techniques give complementary information, which can be used to arrive at the final exact structure of an analyte. Spectroscopic methods of analysis have become indispensable and find applications in diverse fields like in devices used for inspection and security, forensics, safety and quality, pharmaceuticals, food, beverages, and agriculture; environmental analysis, authentication, and medicine. For high throughput analysis spectroscopic methods can be used directly in conjunction with separation techniques to further speed up the process of analysis.
Suggested Readings 1. Introduction to spectroscopy: Pavia; Lampman, Kriz, Books/cole. 2. Spectrometric identification of organic compounds, R. M. Silverstein, John Wiley and Sons
publication. 3. Spectroscopic methods in organic chemistry; H. Williams; I. Fleminig, Tata Mc Grawhills 4. Organic spectroscopy, W. Kemp, Palgrave publications.